Embed Size (px)
Citation preview
“Affordability: Balancing
College, Employment, and
Finances – Policy Issues
Center for Analysis of Postsecondary Education and
Employment
Washington, D.C.
September 19, 2014
Richard D. Kahlenberg
Senior Fellow, The Century Foundation
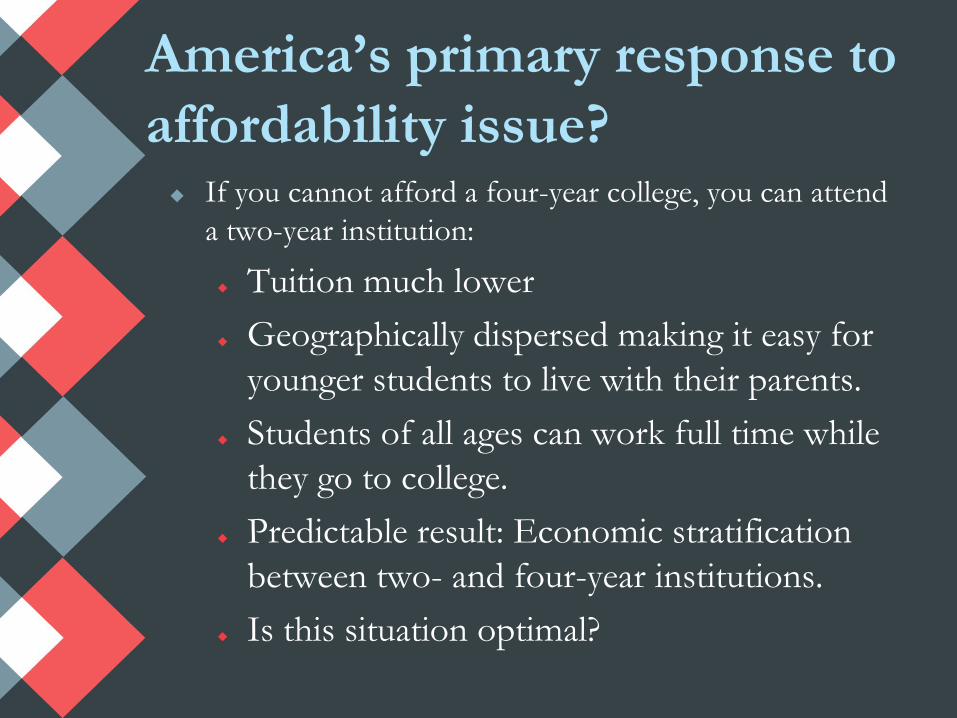
America’s primary response to
affordability issue? If you cannot afford a four-year college, you can attend
a two-year institution:
Tuition much lower
Geographically dispersed making it easy for
younger students to live with their parents.
Students of all ages can work full time while
they go to college.
Predictable result: Economic stratification
between two- and four-year institutions.
Is this situation optimal?
Century Foundation Task Force
With the support of the Ford Foundation, assembled a
22-member group including representatives from two-
year and four-year colleges, scholars of higher
education and representatives of the business,
philanthropic and civil rights communities.
Chaired by Eduardo Padrón and Anthony Marx.
Buttressed by three background papers from
distinguished researchers – including one by Sandy
Baum.
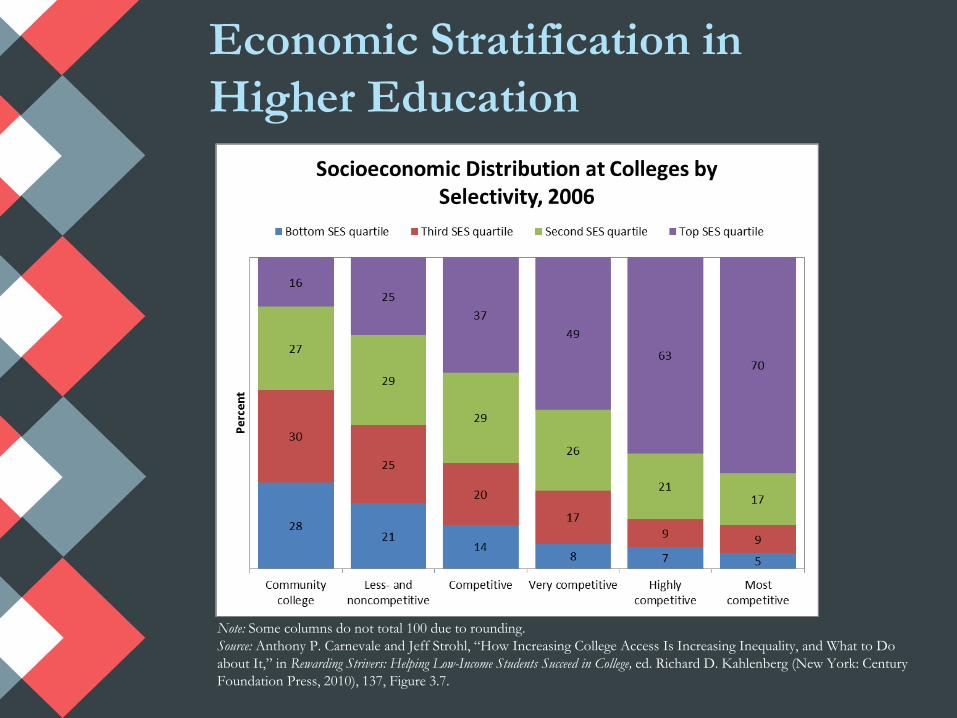
Economic Stratification in
Higher Education
Note: Some columns do not total 100 due to rounding.
Source: Anthony P. Carnevale and Jeff Strohl, “How Increasing College Access Is Increasing Inequality, and What to Do
about It,” in Rewarding Strivers: Helping Low-Income Students Succeed in College, ed. Richard D. Kahlenberg (New York: Century
Foundation Press, 2010), 137, Figure 3.7.
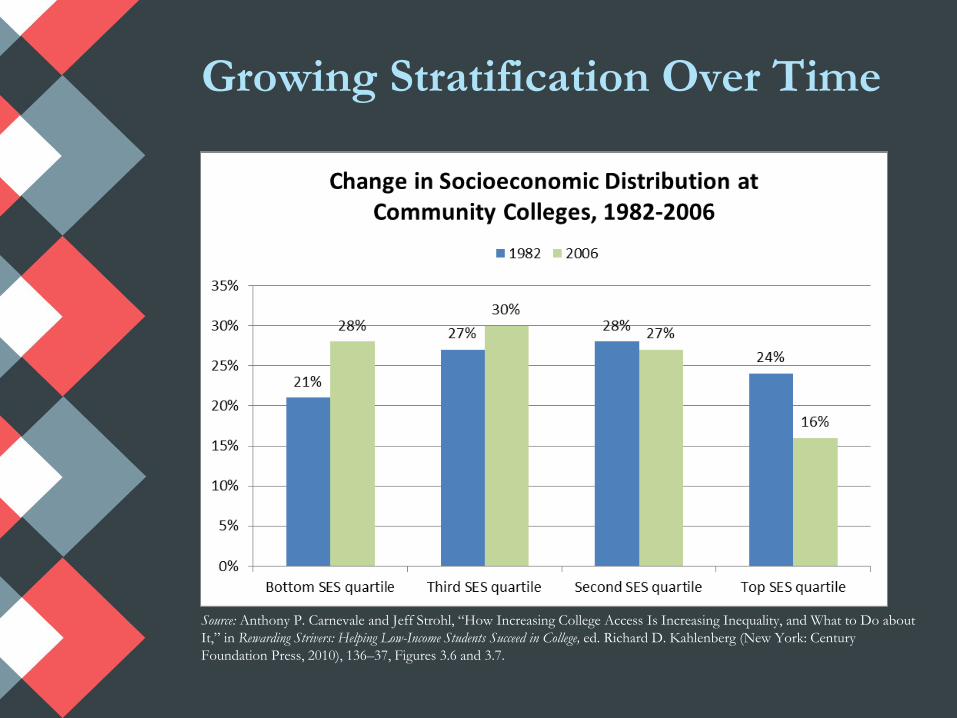
Growing Stratification Over Time
Source: Anthony P. Carnevale and Jeff Strohl, “How Increasing College Access Is Increasing Inequality, and What to Do about
It,” in Rewarding Strivers: Helping Low-Income Students Succeed in College, ed. Richard D. Kahlenberg (New York: Century
Foundation Press, 2010), 136–37, Figures 3.6 and 3.7.
Reaction to Stratification
Crowning Glory of Community College System.
Yet Concerns Rooted in Brown v. Board of Education.
Lack of Political Capital Impedes Funding so
that students with the greatest needs receive
the fewest resources
Relatively Disadvantaged Population Affects
Curriculum, Expectations, and School
Culture
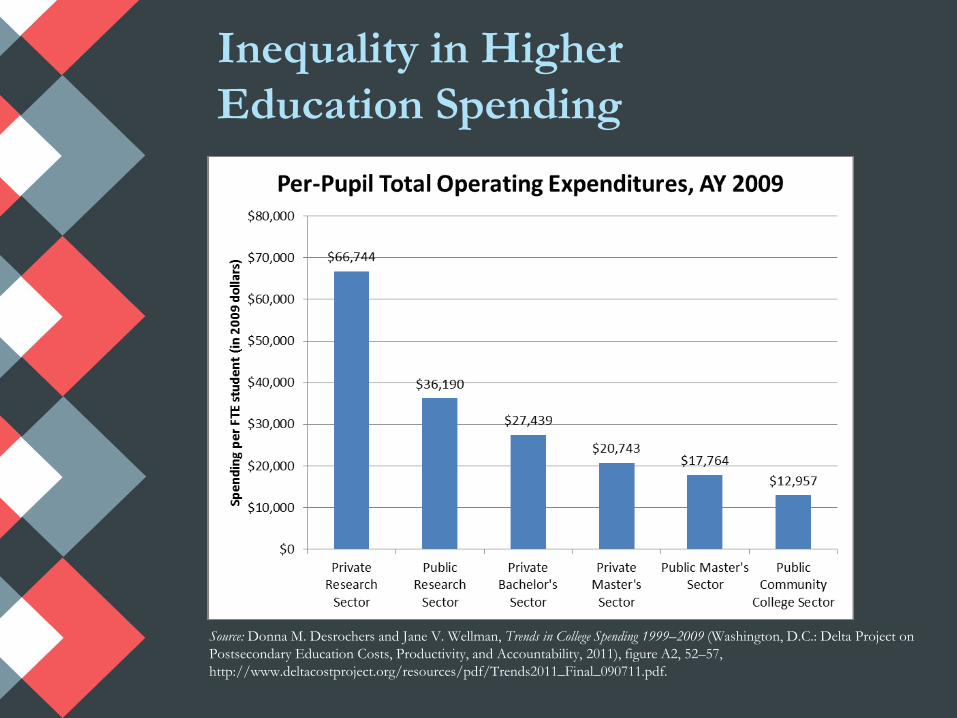
Inequality in Higher
Education Spending
Source: Donna M. Desrochers and Jane V. Wellman, Trends in College Spending 1999–2009 (Washington, D.C.: Delta Project on
Postsecondary Education Costs, Productivity, and Accountability, 2011), figure A2, 52–57,
http://www.deltacostproject.org/resources/pdf/Trends2011_Final_090711.pdf.
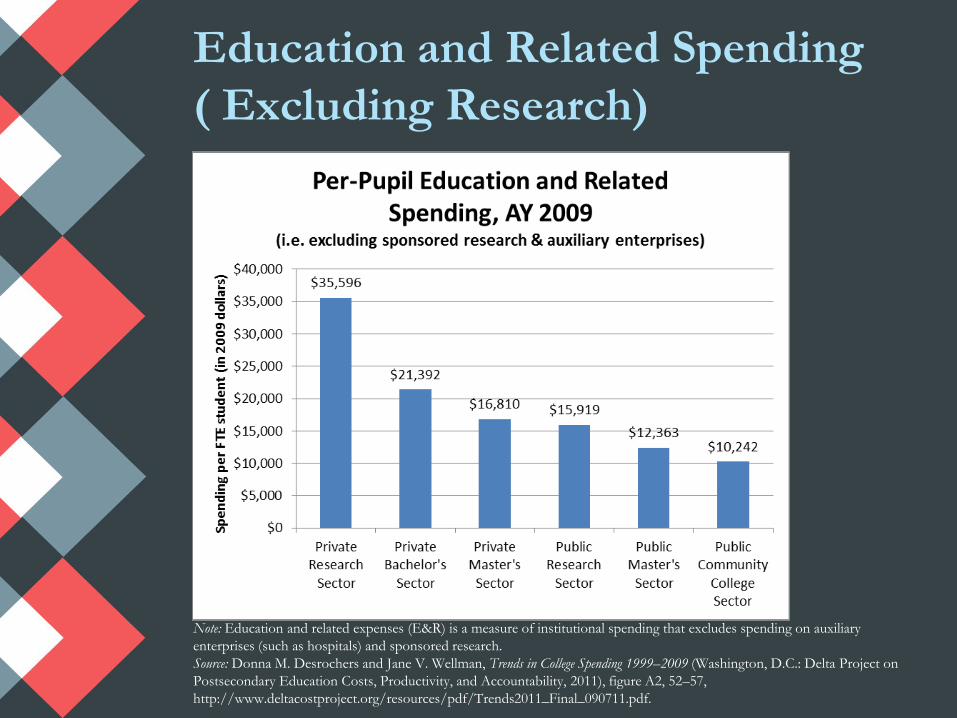
Education and Related Spending
( Excluding Research)
Note: Education and related expenses (E&R) is a measure of institutional spending that excludes spending on auxiliary
enterprises (such as hospitals) and sponsored research.
Source: Donna M. Desrochers and Jane V. Wellman, Trends in College Spending 1999–2009 (Washington, D.C.: Delta Project on
Postsecondary Education Costs, Productivity, and Accountability, 2011), figure A2, 52–57,
http://www.deltacostproject.org/resources/pdf/Trends2011_Final_090711.pdf.
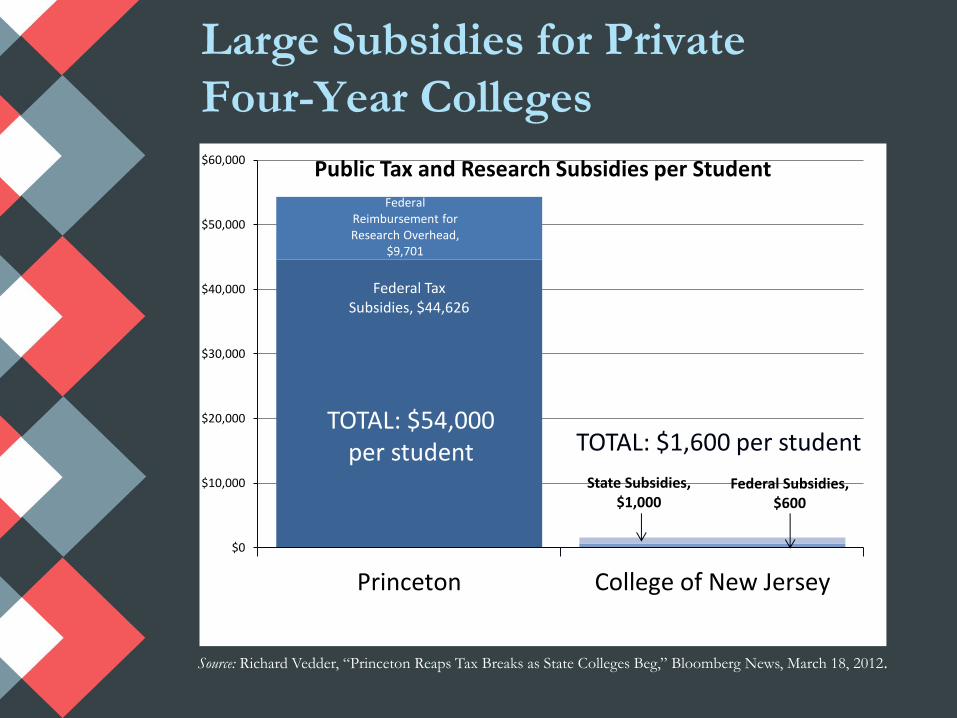
Large Subsidies for Private
Four-Year Colleges
Federal Tax Subsidies, $44,626
Federal Reimbursement for Research Overhead,
$9,701
Federal Subsidies, $600
State Subsidies, $1,000
$0
$10,000
$20,000
$30,000
$40,000
$50,000
$60,000
Princeton College of New Jersey
Public Tax and Research Subsidies per Student
TOTAL: $54,000 per student TOTAL: $1,600 per student
Source: Richard Vedder, “Princeton Reaps Tax Breaks as State Colleges Beg,” Bloomberg News, March 18, 2012.
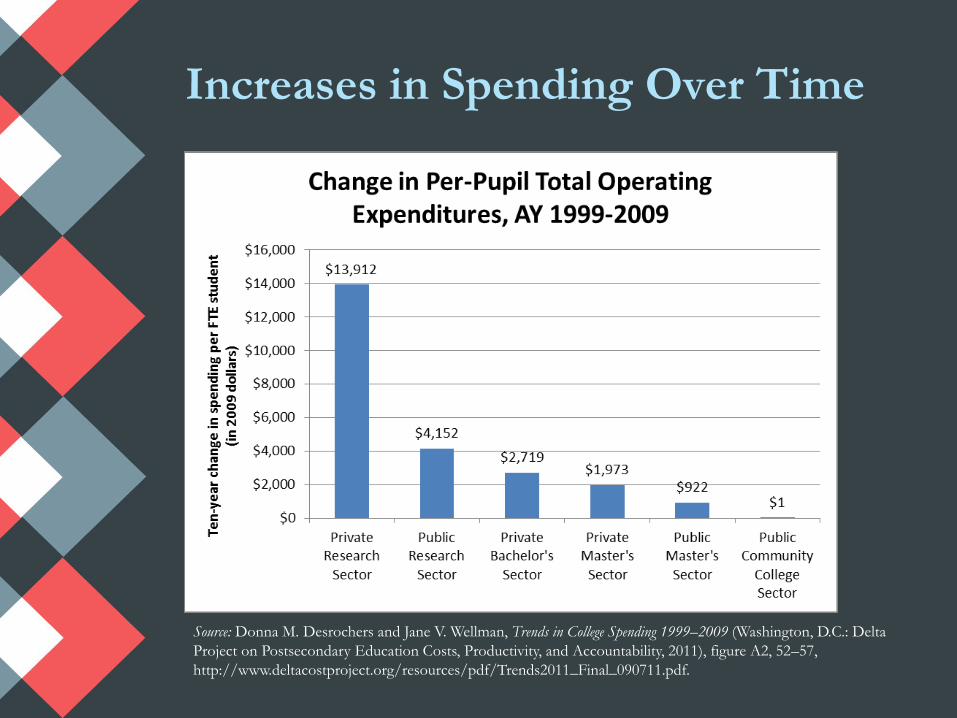
Increases in Spending Over Time
Source: Donna M. Desrochers and Jane V. Wellman, Trends in College Spending 1999–2009 (Washington, D.C.: Delta
Project on Postsecondary Education Costs, Productivity, and Accountability, 2011), figure A2, 52–57,
http://www.deltacostproject.org/resources/pdf/Trends2011_Final_090711.pdf.
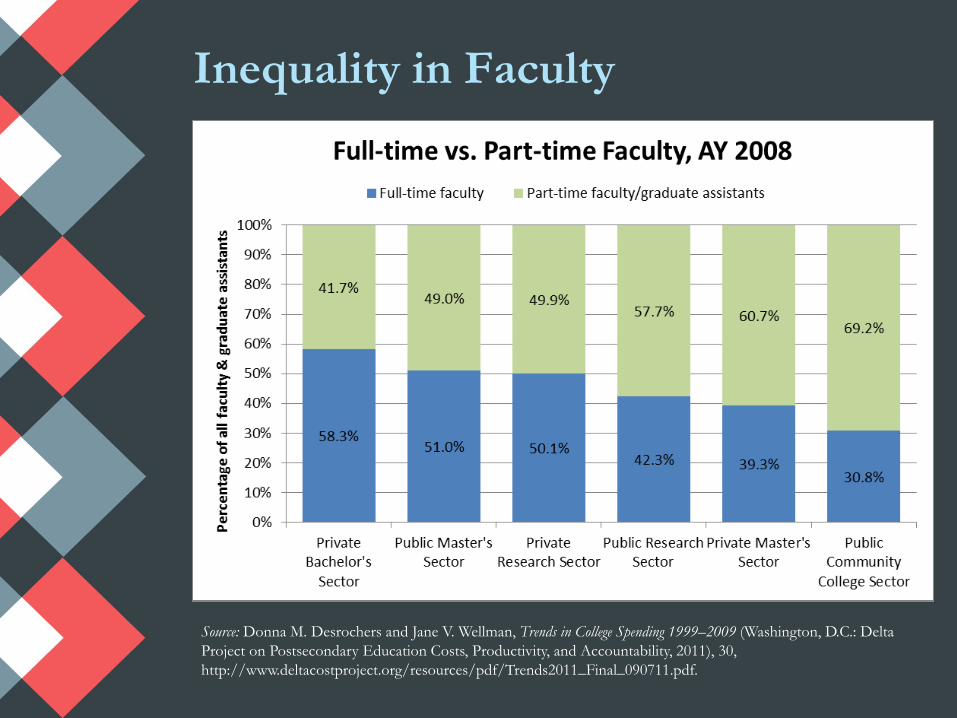
Inequality in Faculty
Source: Donna M. Desrochers and Jane V. Wellman, Trends in College Spending 1999–2009 (Washington, D.C.: Delta
Project on Postsecondary Education Costs, Productivity, and Accountability, 2011), 30,
http://www.deltacostproject.org/resources/pdf/Trends2011_Final_090711.pdf.
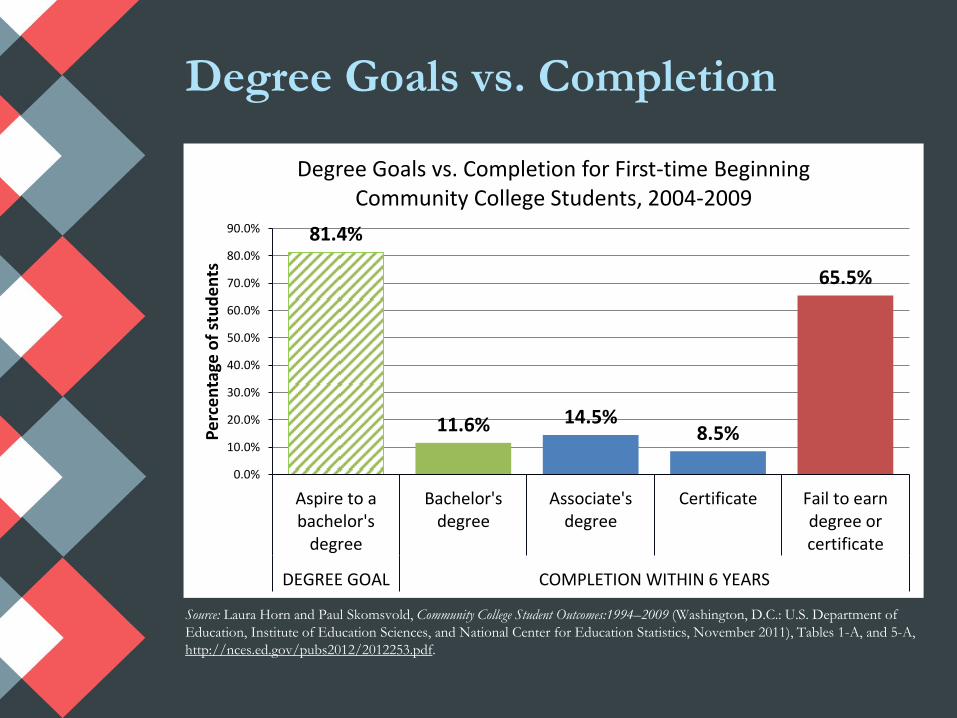
Degree Goals vs. Completion
81.4%
11.6% 14.5% 8.5%
65.5%
0.0%
10.0%
20.0%
30.0%
40.0%
50.0%
60.0%
70.0%
80.0%
90.0%
Aspire to abachelor's
degree
Bachelor'sdegree
Associate'sdegree
Certificate Fail to earndegree orcertificate
DEGREE GOAL COMPLETION WITHIN 6 YEARS
Pe
rce
nta
ge o
f st
ud
en
ts
Degree Goals vs. Completion for First-time Beginning Community College Students, 2004-2009
Source: Laura Horn and Paul Skomsvold, Community College Student Outcomes:1994–2009 (Washington, D.C.: U.S. Department of
Education, Institute of Education Sciences, and National Center for Education Statistics, November 2011), Tables 1-A, and 5-A,
http://nces.ed.gov/pubs2012/2012253.pdf.
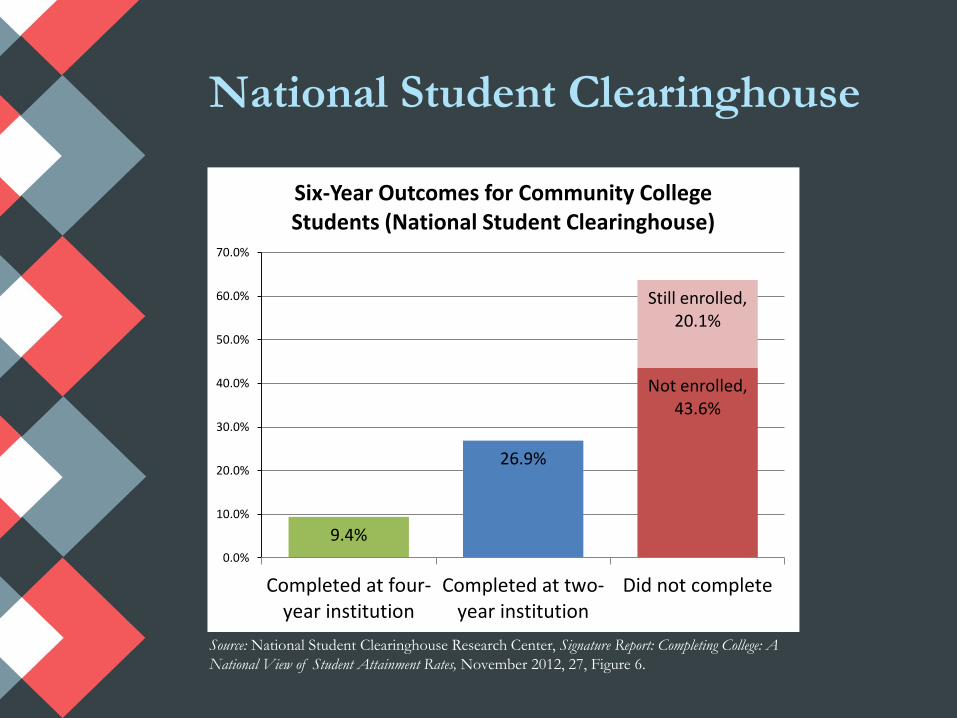
National Student Clearinghouse
Source: National Student Clearinghouse Research Center, Signature Report: Completing College: A
National View of Student Attainment Rates, November 2012, 27, Figure 6.
9.4%
26.9%
Not enrolled, 43.6%
Still enrolled, 20.1%
0.0%
10.0%
20.0%
30.0%
40.0%
50.0%
60.0%
70.0%
Completed at four-year institution
Completed at two-year institution
Did not complete
Six-Year Outcomes for Community College Students (National Student Clearinghouse)
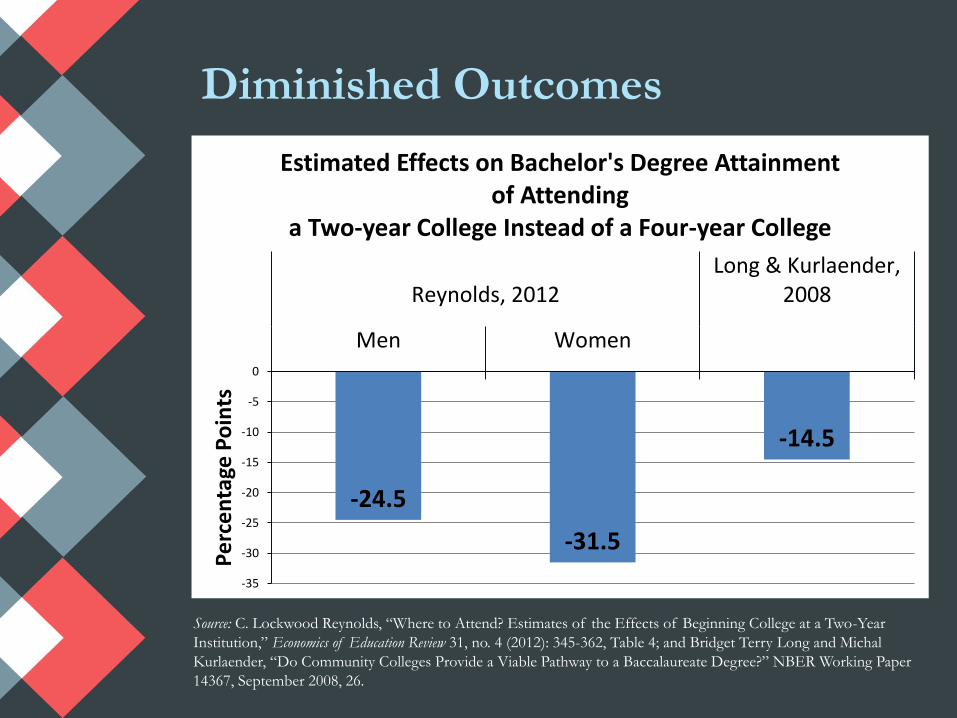
Diminished Outcomes
Source: C. Lockwood Reynolds, “Where to Attend? Estimates of the Effects of Beginning College at a Two-Year
Institution,” Economics of Education Review 31, no. 4 (2012): 345-362, Table 4; and Bridget Terry Long and Michal
Kurlaender, “Do Community Colleges Provide a Viable Pathway to a Baccalaureate Degree?” NBER Working Paper
14367, September 2008, 26.
-24.5
-31.5
-14.5
-35
-30
-25
-20
-15
-10
-5
0
Men Women
Reynolds, 2012Long & Kurlaender,
2008
Pe
rce
nta
ge P
oin
ts
Estimated Effects on Bachelor's Degree Attainment of Attending
a Two-year College Instead of a Four-year College
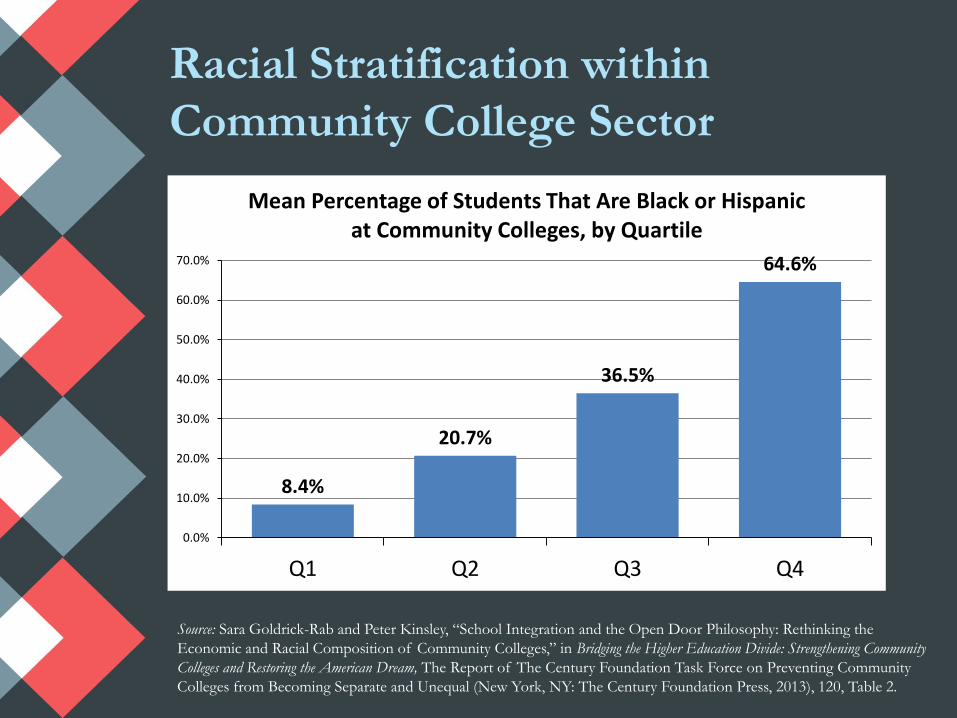
Racial Stratification within
Community College Sector
8.4%
20.7%
36.5%
64.6%
0.0%
10.0%
20.0%
30.0%
40.0%
50.0%
60.0%
70.0%
Q1 Q2 Q3 Q4
Mean Percentage of Students That Are Black or Hispanic at Community Colleges, by Quartile
Source: Sara Goldrick-Rab and Peter Kinsley, “School Integration and the Open Door Philosophy: Rethinking the
Economic and Racial Composition of Community Colleges,” in Bridging the Higher Education Divide: Strengthening Community
Colleges and Restoring the American Dream, The Report of The Century Foundation Task Force on Preventing Community
Colleges from Becoming Separate and Unequal (New York, NY: The Century Foundation Press, 2013), 120, Table 2.
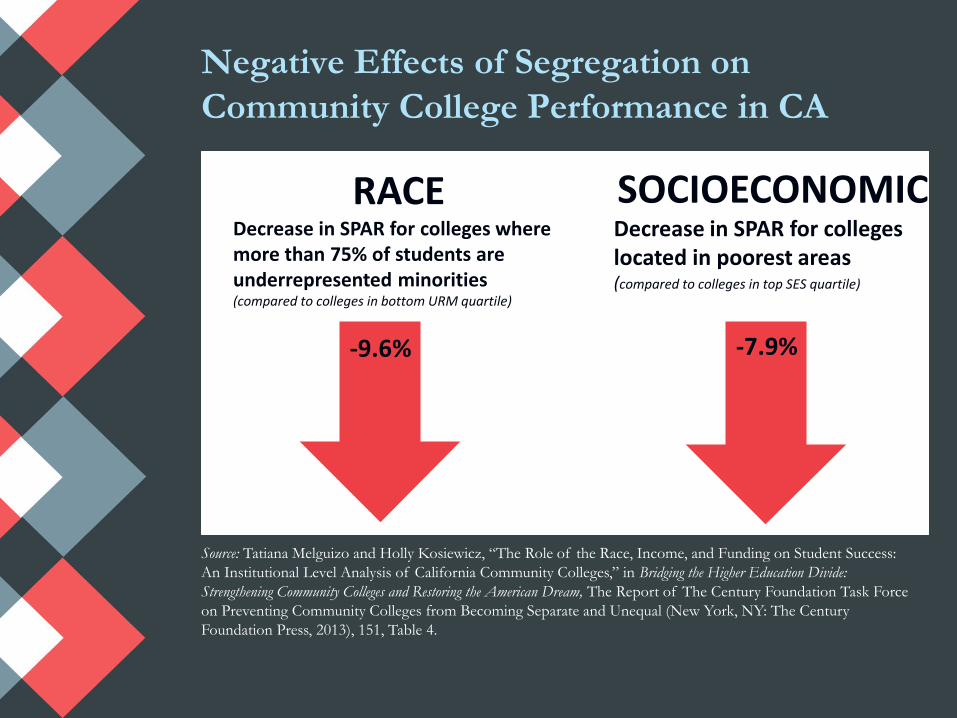
Negative Effects of Segregation on
Community College Performance in CA
Source: Tatiana Melguizo and Holly Kosiewicz, “The Role of the Race, Income, and Funding on Student Success:
An Institutional Level Analysis of California Community Colleges,” in Bridging the Higher Education Divide:
Strengthening Community Colleges and Restoring the American Dream, The Report of The Century Foundation Task Force
on Preventing Community Colleges from Becoming Separate and Unequal (New York, NY: The Century
Foundation Press, 2013), 151, Table 4.
-9.6%
RACE Decrease in SPAR for colleges where more than 75% of students are underrepresented minorities (compared to colleges in bottom URM quartile)
SOCIOECONOMIC Decrease in SPAR for colleges located in poorest areas (compared to colleges in top SES quartile)
-7.9%
Are There Lessons
from K-12 Schooling?
Federal and state programs to provide greater
funding for students with greatest needs.
Programs to allow low-income students to attend
middle-class schools and attract middle-class
students to urban magnet schools.
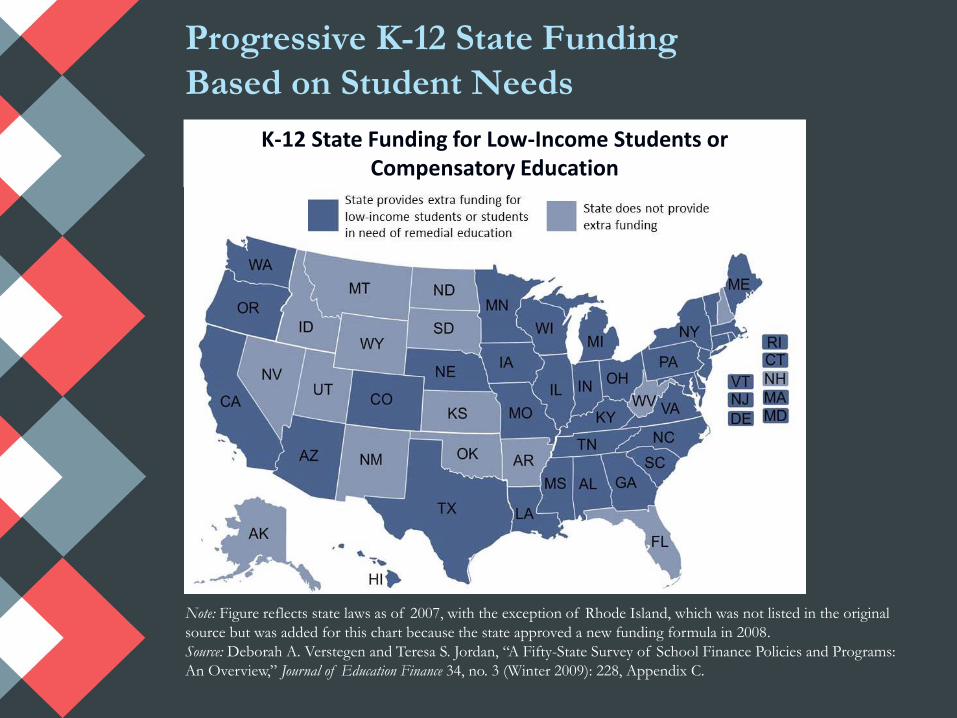
Progressive K-12 State Funding
Based on Student Needs
Note: Figure reflects state laws as of 2007, with the exception of Rhode Island, which was not listed in the original
source but was added for this chart because the state approved a new funding formula in 2008.
Source: Deborah A. Verstegen and Teresa S. Jordan, “A Fifty-State Survey of School Finance Policies and Programs:
An Overview,” Journal of Education Finance 34, no. 3 (Winter 2009): 228, Appendix C.
K-12 State Funding for Low-Income Students or Compensatory Education
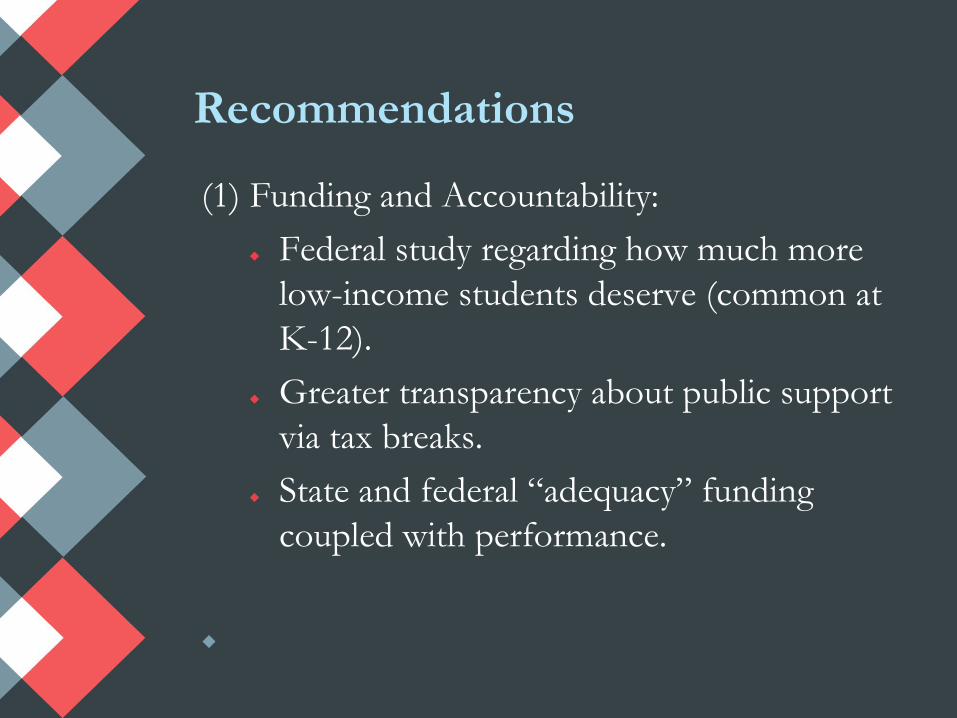
Recommendations
(1) Funding and Accountability:
Federal study regarding how much more
low-income students deserve (common at
K-12).
Greater transparency about public support
via tax breaks.
State and federal “adequacy” funding
coupled with performance.
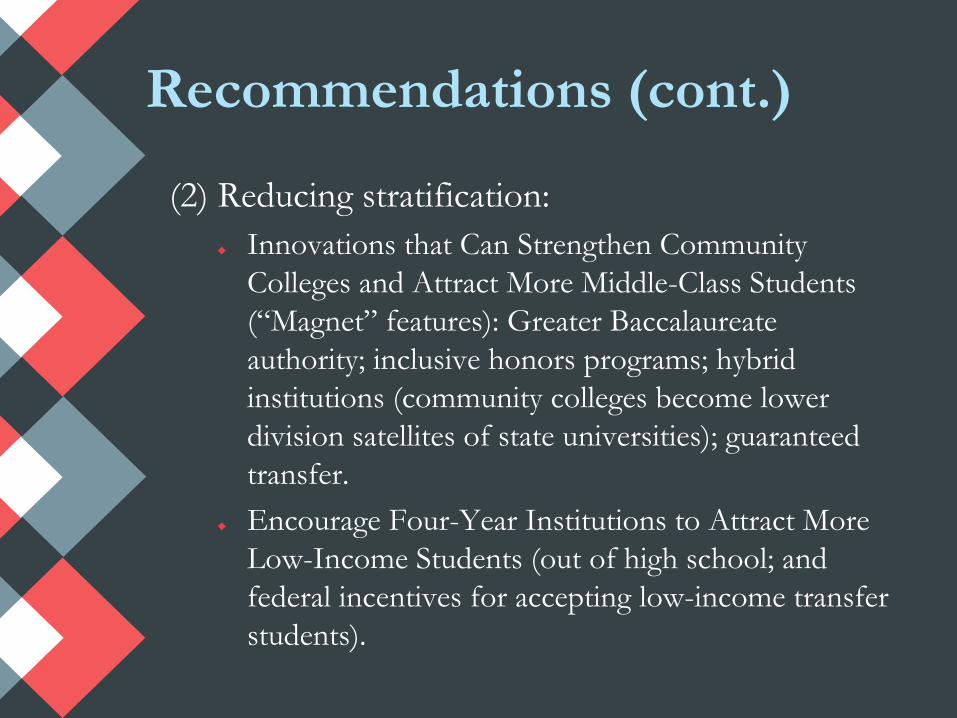
Recommendations (cont.)
(2) Reducing stratification:
Innovations that Can Strengthen Community
Colleges and Attract More Middle-Class Students
(“Magnet” features): Greater Baccalaureate
authority; inclusive honors programs; hybrid
institutions (community colleges become lower
division satellites of state universities); guaranteed
transfer.
Encourage Four-Year Institutions to Attract More
Low-Income Students (out of high school; and
federal incentives for accepting low-income transfer
students).
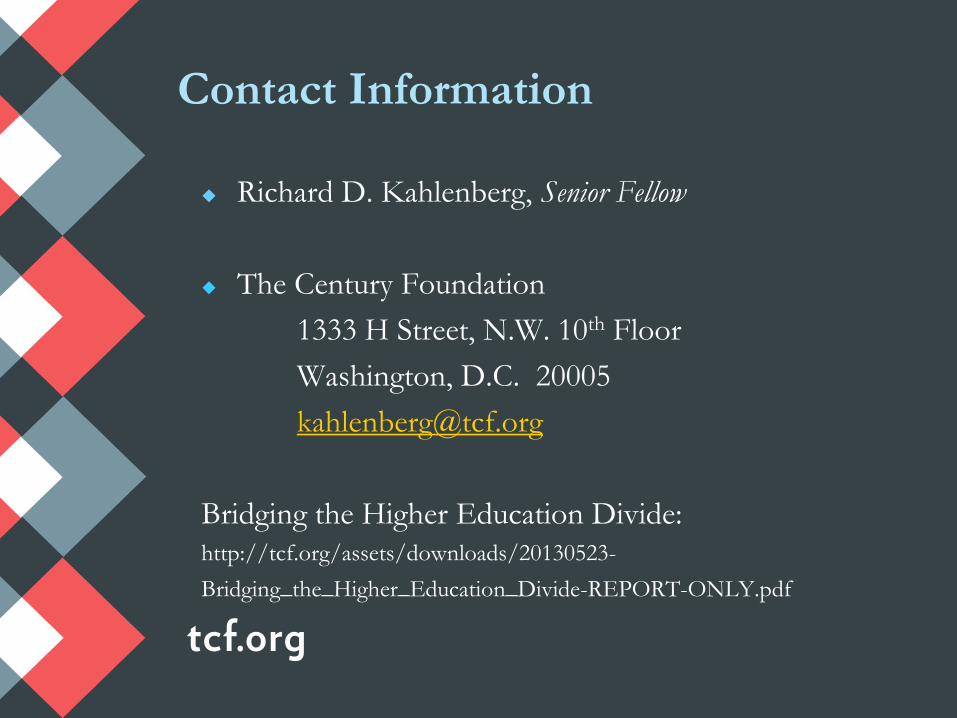
Contact Information
Richard D. Kahlenberg, Senior Fellow
The Century Foundation
1333 H Street, N.W. 10th Floor
Washington, D.C. 20005
Bridging the Higher Education Divide:
http://tcf.org/assets/downloads/20130523-
Bridging_the_Higher_Education_Divide-REPORT-ONLY.pdf
Addendum: Justifications for
Current Spending Patterns
Simple Comparisons Across Sectors Miss
Importance Nuances:
Research Function of Research
Universities
Higher Tuition Expenses at Four-Year
Institutions
Relative Expense of Educating Students
in the First Two Years vs. Third and
Fourth Years of College
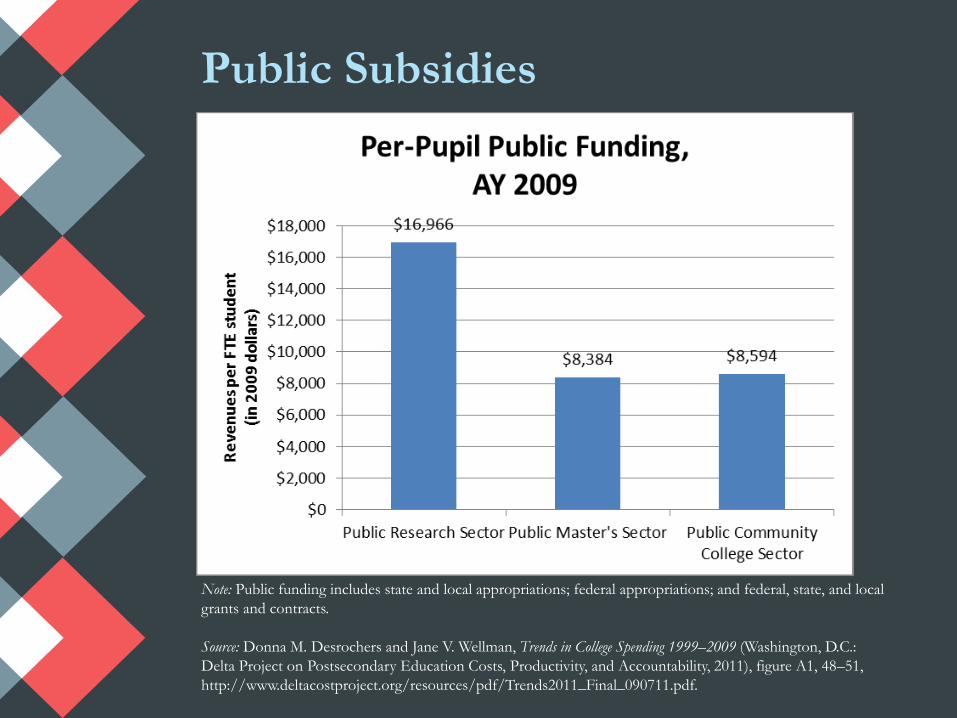
Public Subsidies
Note: Public funding includes state and local appropriations; federal appropriations; and federal, state, and local
grants and contracts.
Source: Donna M. Desrochers and Jane V. Wellman, Trends in College Spending 1999–2009 (Washington, D.C.:
Delta Project on Postsecondary Education Costs, Productivity, and Accountability, 2011), figure A1, 48–51,
http://www.deltacostproject.org/resources/pdf/Trends2011_Final_090711.pdf.
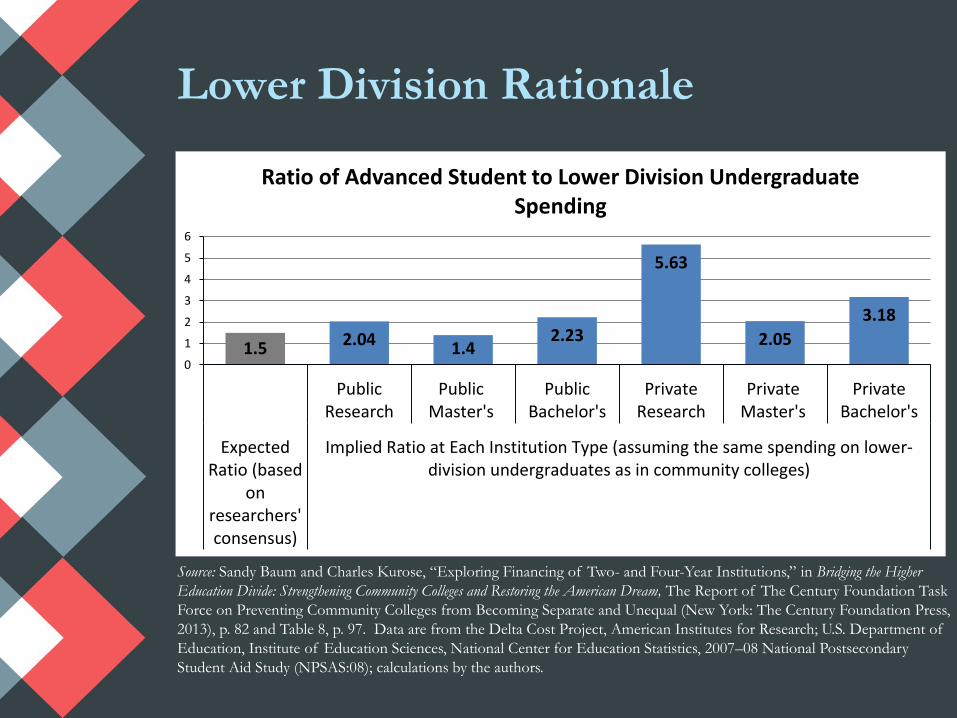
Lower Division Rationale
Source: Sandy Baum and Charles Kurose, “Exploring Financing of Two- and Four-Year Institutions,” in Bridging the Higher
Education Divide: Strengthening Community Colleges and Restoring the American Dream, The Report of The Century Foundation Task
Force on Preventing Community Colleges from Becoming Separate and Unequal (New York: The Century Foundation Press,
2013), p. 82 and Table 8, p. 97. Data are from the Delta Cost Project, American Institutes for Research; U.S. Department of
Education, Institute of Education Sciences, National Center for Education Statistics, 2007–08 National Postsecondary
Student Aid Study (NPSAS:08); calculations by the authors.
1.5 2.04 1.4 2.23
5.63
2.05
3.18
0
1
2
3
4
5
6
PublicResearch
PublicMaster's
PublicBachelor's
PrivateResearch
PrivateMaster's
PrivateBachelor's
ExpectedRatio (based
onresearchers'consensus)
Implied Ratio at Each Institution Type (assuming the same spending on lower-division undergraduates as in community colleges)
Ratio of Advanced Student to Lower Division Undergraduate Spending
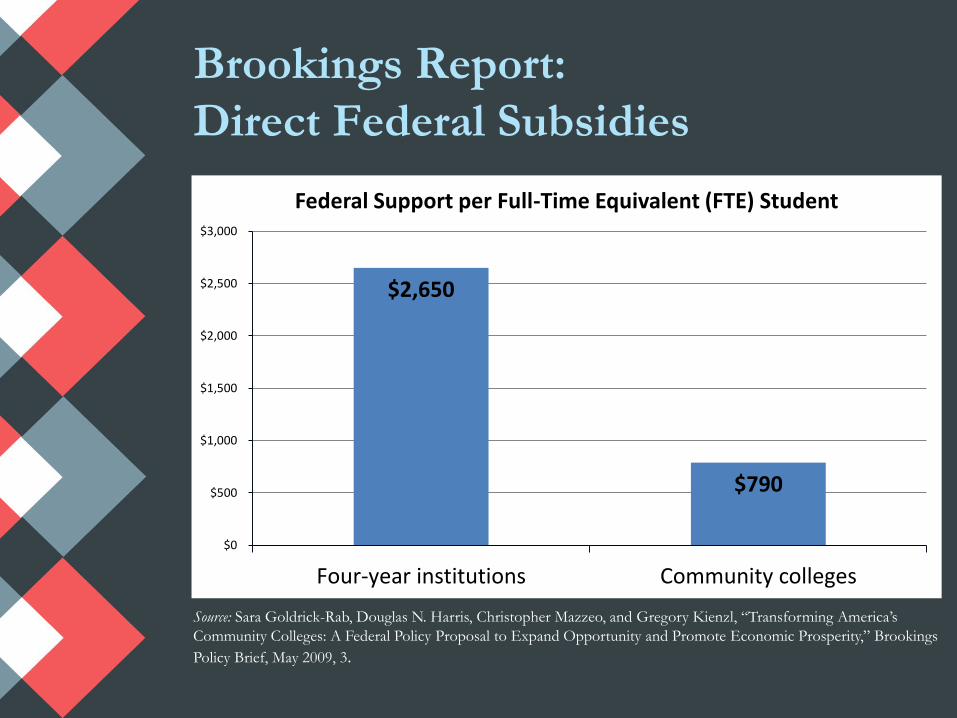
Brookings Report:
Direct Federal Subsidies
Source: Sara Goldrick-Rab, Douglas N. Harris, Christopher Mazzeo, and Gregory Kienzl, “Transforming America’s
Community Colleges: A Federal Policy Proposal to Expand Opportunity and Promote Economic Prosperity,” Brookings
Policy Brief, May 2009, 3.
$2,650
$790
$0
$500
$1,000
$1,500
$2,000
$2,500
$3,000
Four-year institutions Community colleges
Federal Support per Full-Time Equivalent (FTE) Student