Embed Size (px)
Citation preview

Colorectal cancer screening From raising awareness and overcoming taboos to program design and cost effective program implementation
Thursday, November 3, 2016 13:50-15:20, Room 353
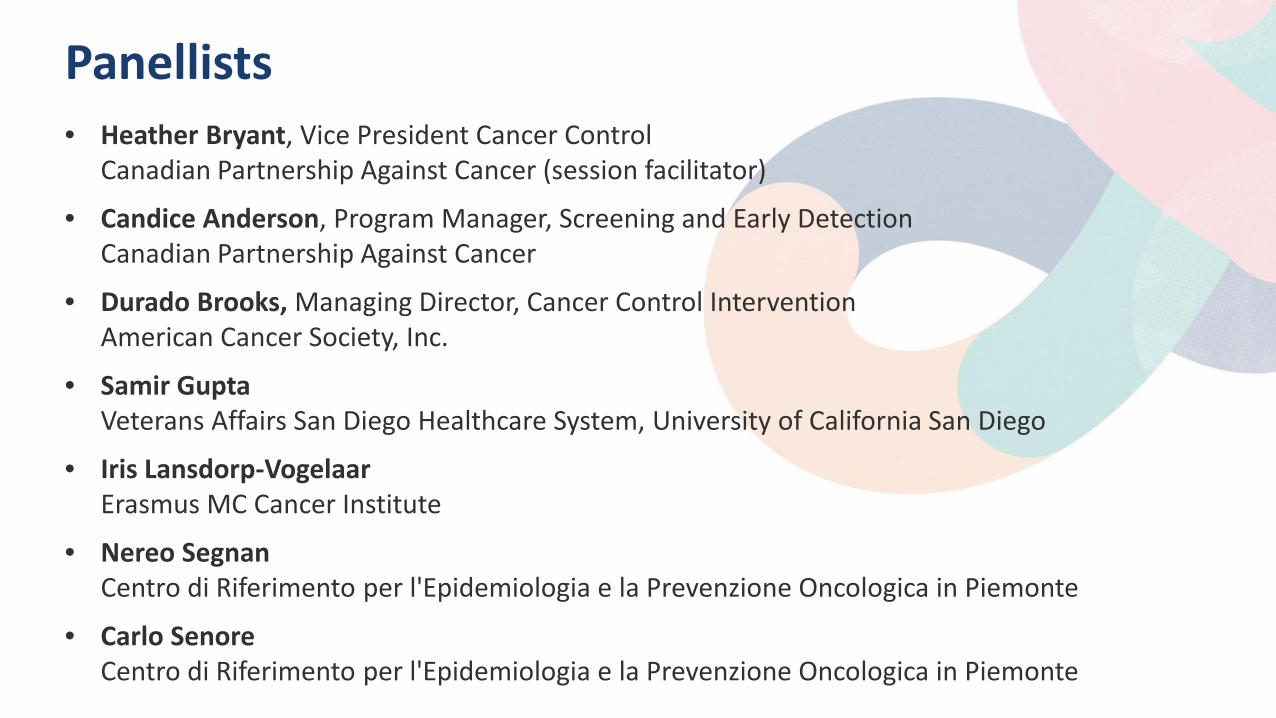
Panellists • Heather Bryant, Vice President Cancer Control
Canadian Partnership Against Cancer (session facilitator)
• Candice Anderson, Program Manager, Screening and Early Detection Canadian Partnership Against Cancer
• Durado Brooks, Managing Director, Cancer Control Intervention American Cancer Society, Inc.
• Samir Gupta Veterans Affairs San Diego Healthcare System, University of California San Diego
• Iris Lansdorp-Vogelaar Erasmus MC Cancer Institute
• Nereo Segnan Centro di Riferimento per l'Epidemiologia e la Prevenzione Oncologica in Piemonte
• Carlo Senore Centro di Riferimento per l'Epidemiologia e la Prevenzione Oncologica in Piemonte
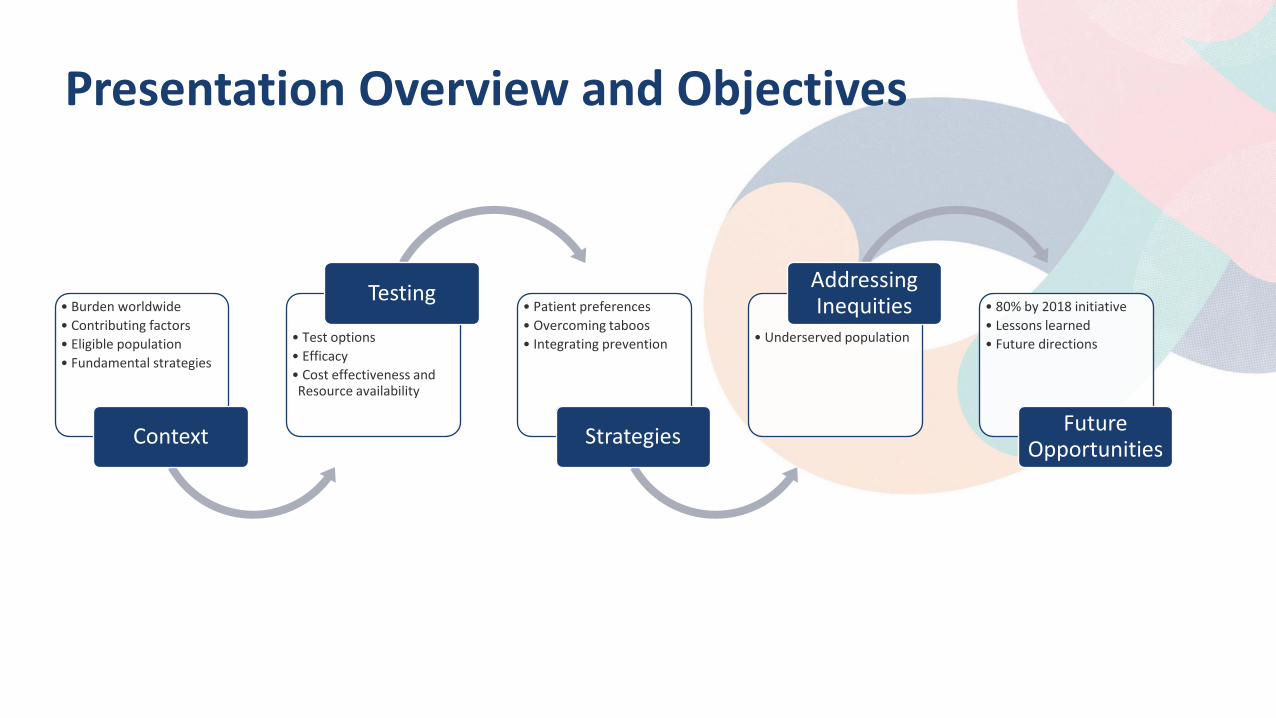
Presentation Overview and Objectives
• Burden worldwide • Contributing factors • Eligible population • Fundamental strategies
Context
• Test options • Efficacy • Cost effectiveness and Resource availability
Testing • Patient preferences • Overcoming taboos • Integrating prevention
Strategies
• Underserved population
Addressing Inequities • 80% by 2018 initiative
• Lessons learned • Future directions
Future Opportunities

Colorectal Cancer and Screening Setting the Context
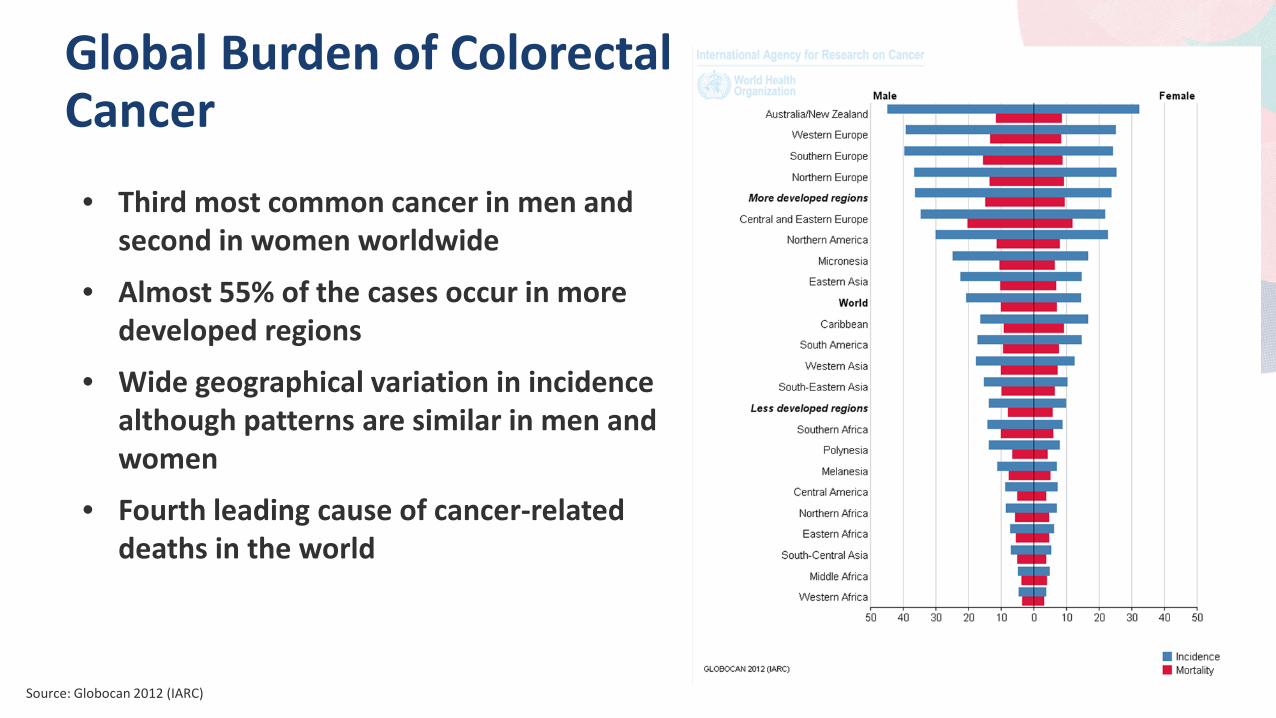
Global Burden of Colorectal Cancer
• Third most common cancer in men and second in women worldwide
• Almost 55% of the cases occur in more developed regions
• Wide geographical variation in incidence although patterns are similar in men and women
• Fourth leading cause of cancer-related deaths in the world
Source: Globocan 2012 (IARC)
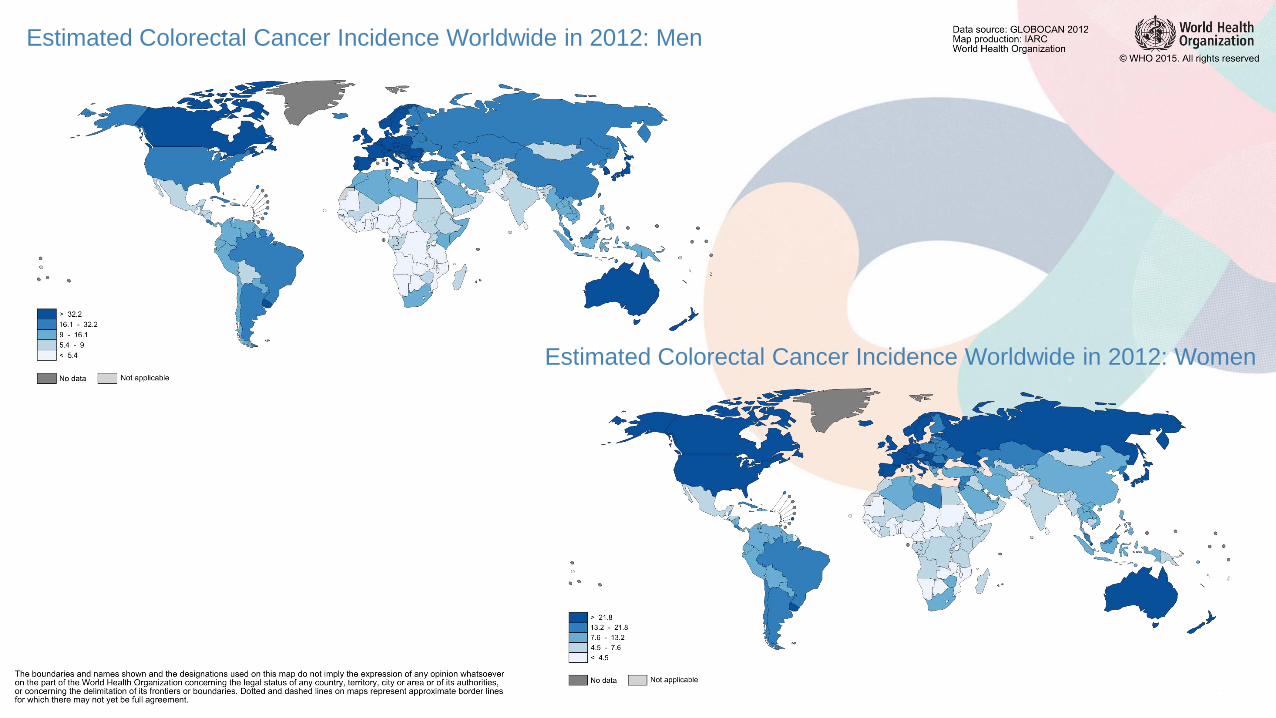
Estimated Colorectal Cancer Incidence Worldwide in 2012: Men
Estimated Colorectal Cancer Incidence Worldwide in 2012: Women
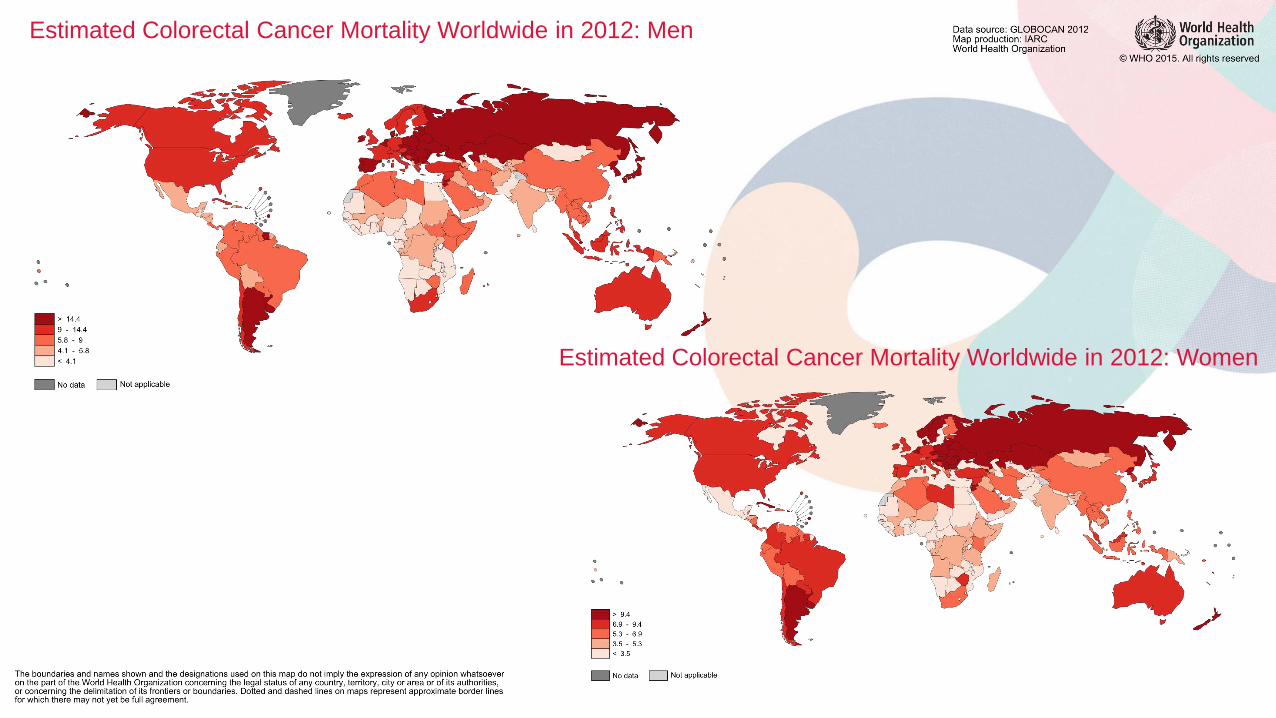
Estimated Colorectal Cancer Mortality Worldwide in 2012: Men
Estimated Colorectal Cancer Mortality Worldwide in 2012: Women
Global Trends of Colorectal Cancer
• Burden expected to increase by 60% by 2030
• Clear marker of cancer transition – Countries undergoing rapid societal/ economic changes show rapid increases in cancers
more frequent in high-income countries
• Incidence and mortality rates are still rising in many low-income and middle-income countries
• Stabilising or decreasing trends seen only in highly developed countries where rates remain among the highest in the world
Source: Arnold M, et al. Gut 2016;0:1–9. doi:10.1136/gutjnl-2015-310912
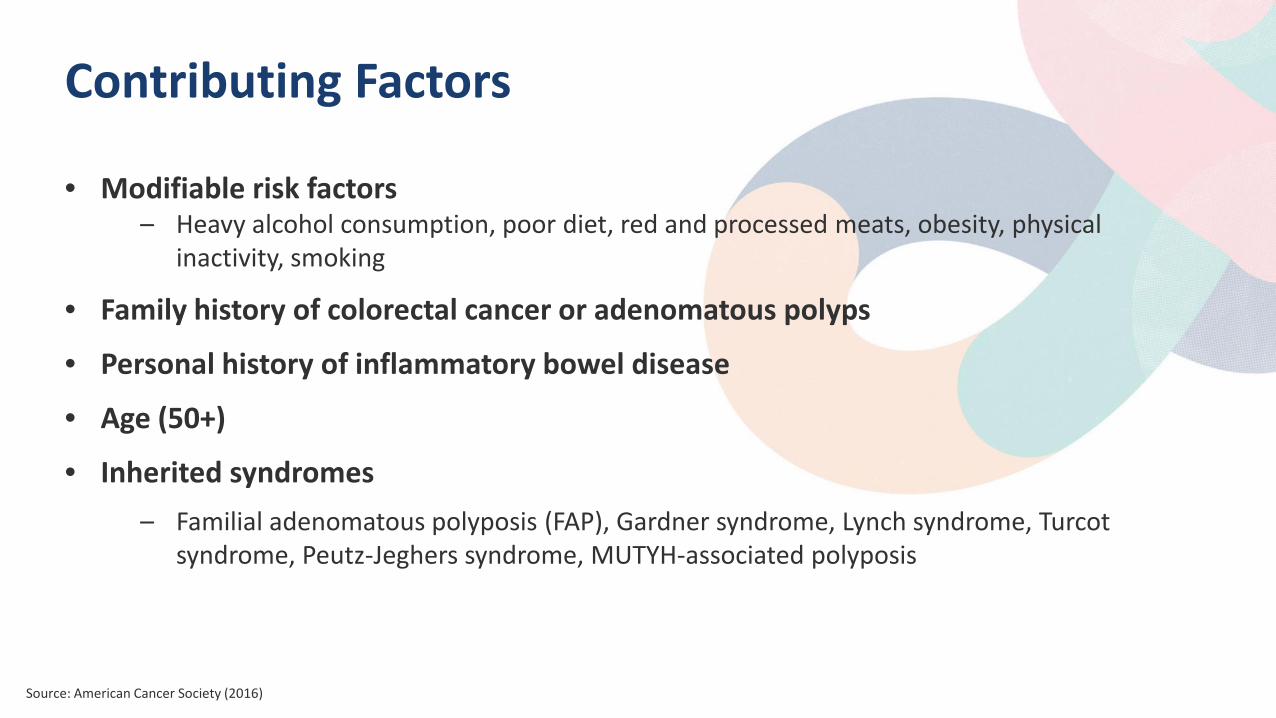
Contributing Factors
• Modifiable risk factors – Heavy alcohol consumption, poor diet, red and processed meats, obesity, physical
inactivity, smoking
• Family history of colorectal cancer or adenomatous polyps
• Personal history of inflammatory bowel disease
• Age (50+)
• Inherited syndromes – Familial adenomatous polyposis (FAP), Gardner syndrome, Lynch syndrome, Turcot
syndrome, Peutz-Jeghers syndrome, MUTYH-associated polyposis
Source: American Cancer Society (2016)
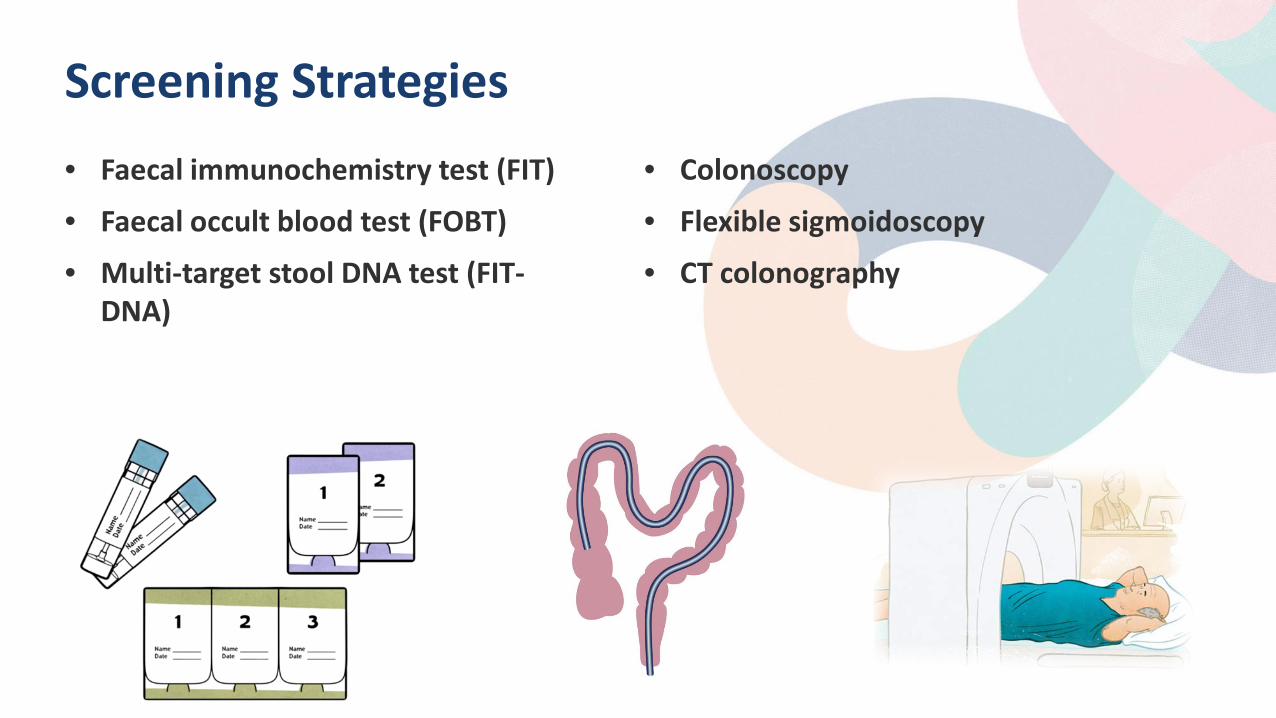
Screening Strategies • Faecal immunochemistry test (FIT)
• Faecal occult blood test (FOBT)
• Multi-target stool DNA test (FIT- DNA)
• Colonoscopy
• Flexible sigmoidoscopy
• CT colonography
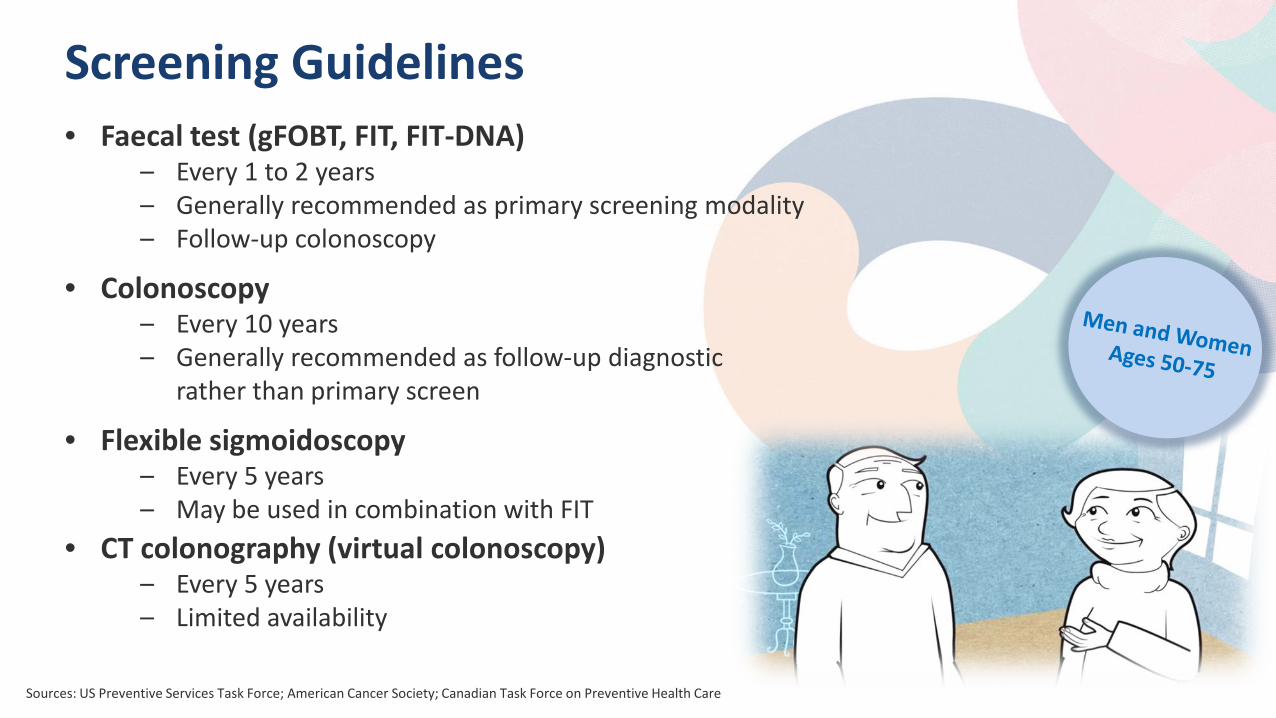
Screening Guidelines • Faecal test (gFOBT, FIT, FIT-DNA)
– Every 1 to 2 years – Generally recommended as primary screening modality – Follow-up colonoscopy
• Colonoscopy – Every 10 years – Generally recommended as follow-up diagnostic
rather than primary screen
• Flexible sigmoidoscopy – Every 5 years – May be used in combination with FIT
• CT colonography (virtual colonoscopy) – Every 5 years – Limited availability
Sources: US Preventive Services Task Force; American Cancer Society; Canadian Task Force on Preventive Health Care

Colorectal Cancer Screening The Tests – Efficacy, Cost, Resource Availability
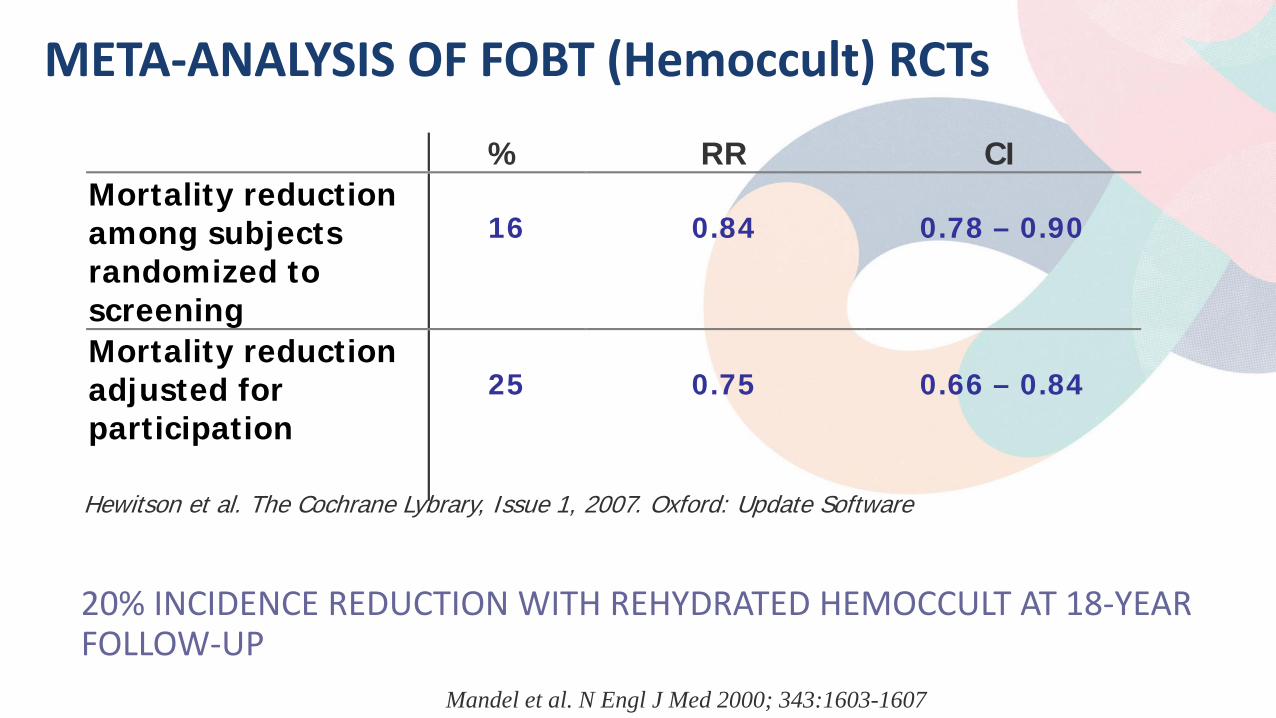
META-ANALYSIS OF FOBT (Hemoccult) RCTs
% RR CI Mortality reduction among subjects randomized to screening
16
0.84
0.78 – 0.90
Mortality reduction adjusted for participation
25
0.75
0.66 – 0.84
Hewitson et al. The Cochrane Lybrary, Issue 1, 2007. Oxford: Update Software
20% INCIDENCE REDUCTION WITH REHYDRATED HEMOCCULT AT 18-YEAR FOLLOW-UP
Mandel et al. N Engl J Med 2000; 343:1603-1607
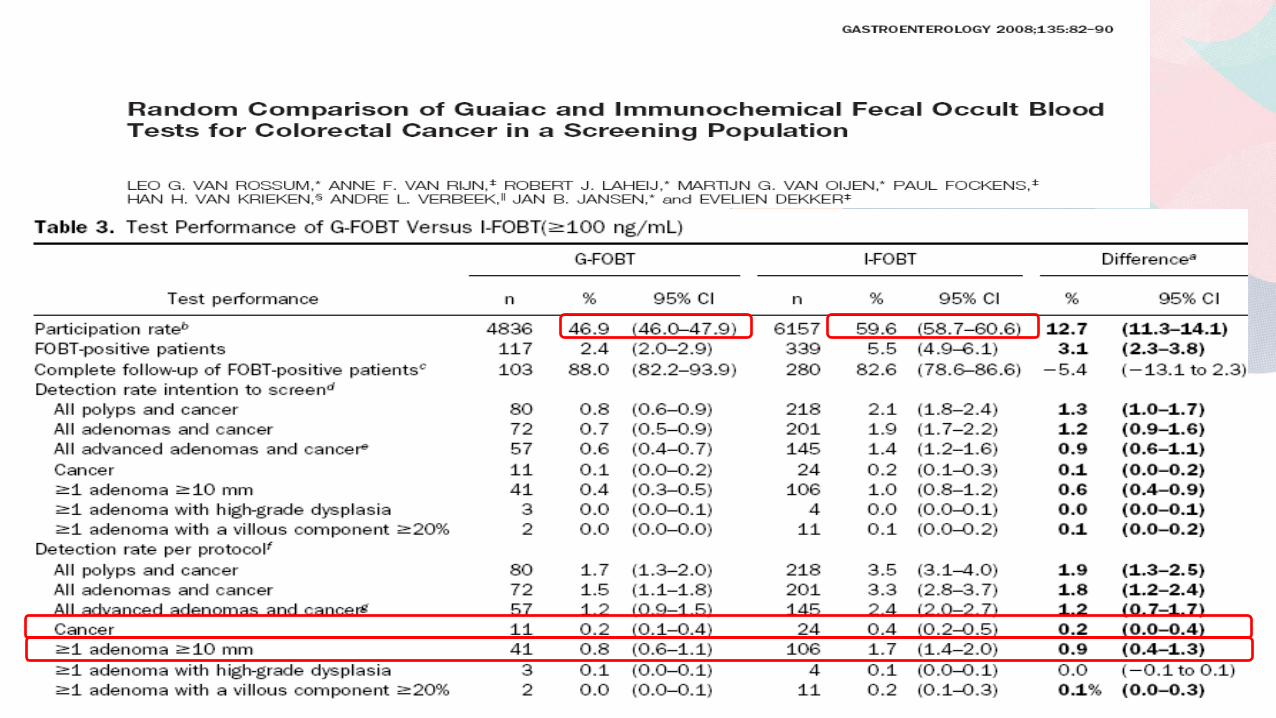
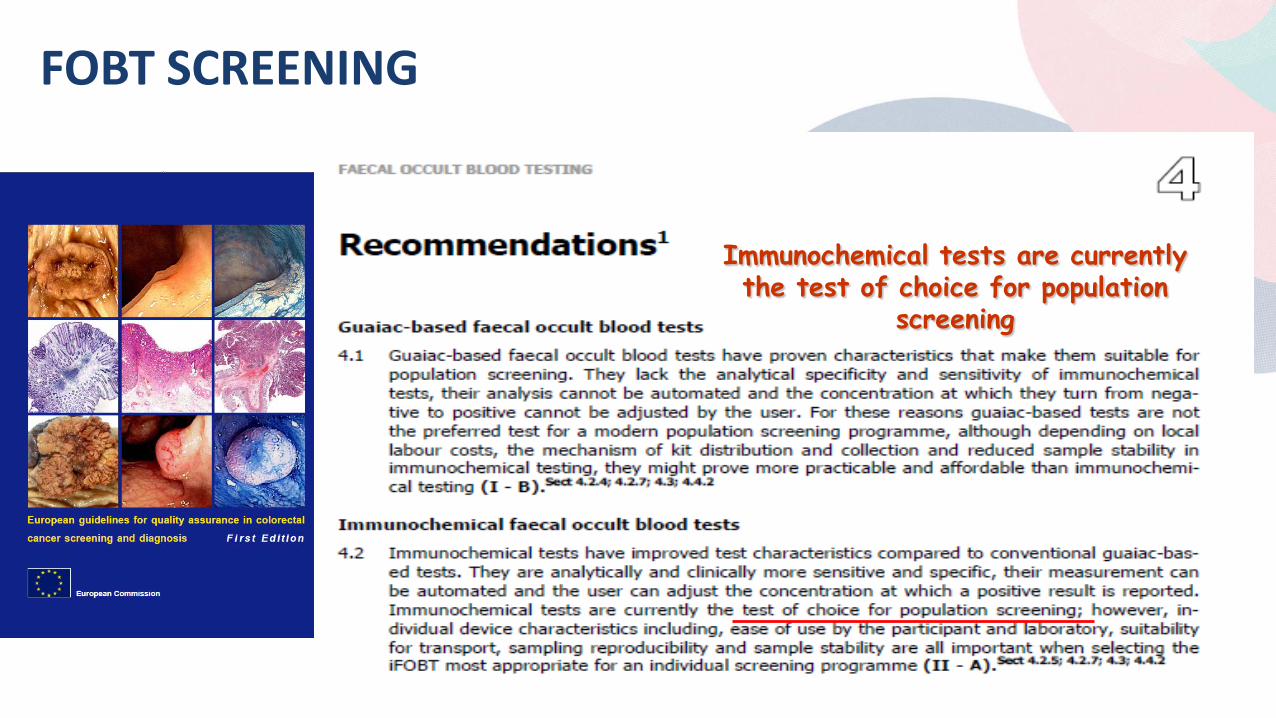
FOBT SCREENING
Immunochemical tests are currently the test of choice for population
screening
INCIDENCE REDUCTION
18%
MORTALITY REDUCTION
28%
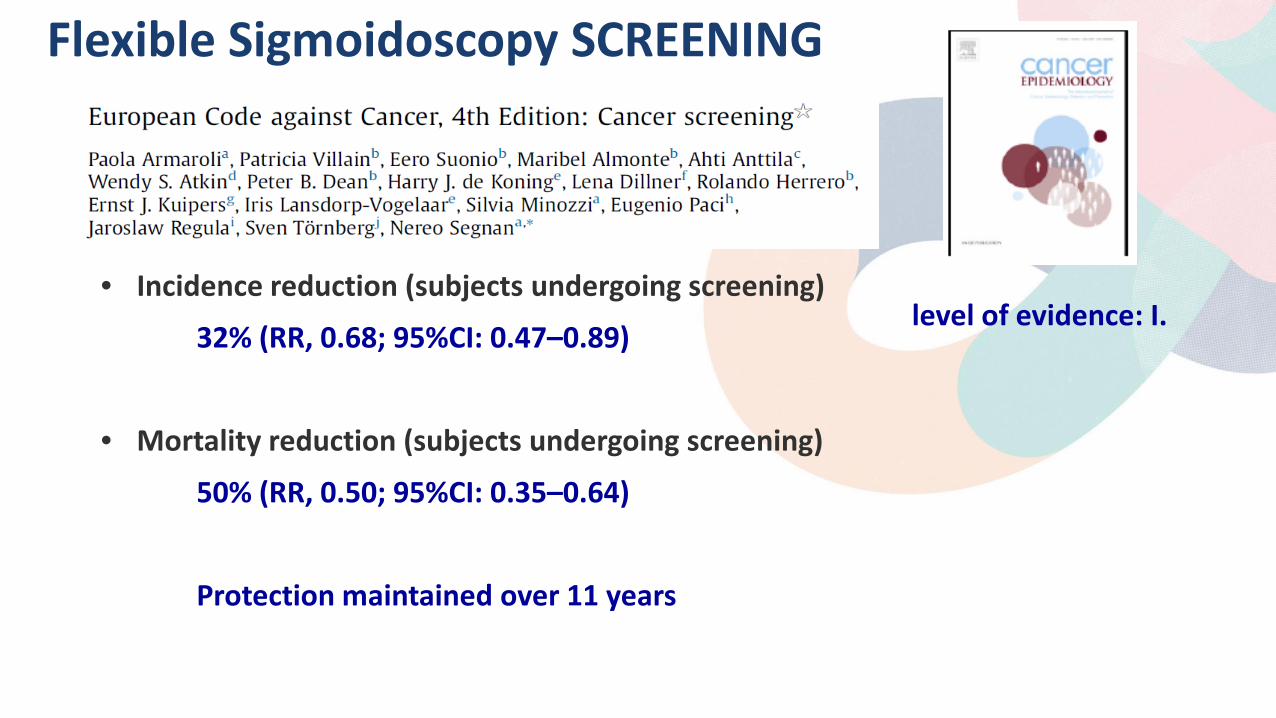
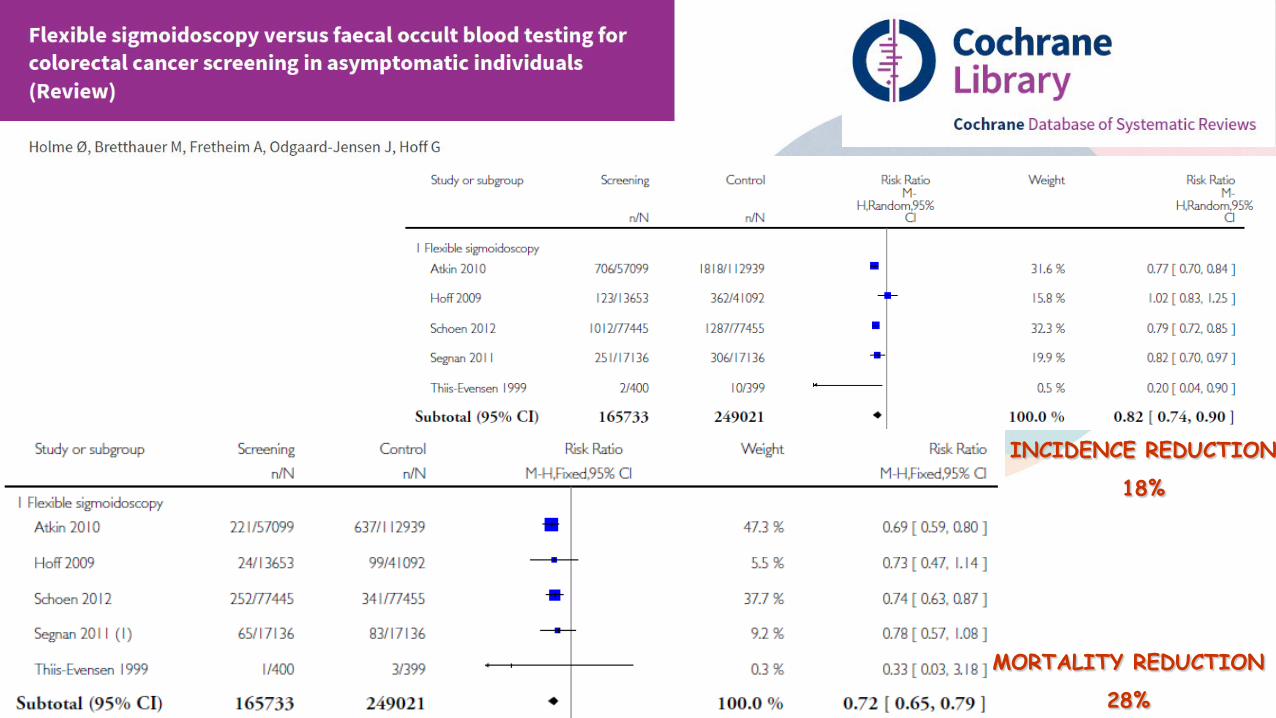
Flexible Sigmoidoscopy SCREENING
• Incidence reduction (subjects undergoing screening)
32% (RR, 0.68; 95%CI: 0.47–0.89)
• Mortality reduction (subjects undergoing screening)
50% (RR, 0.50; 95%CI: 0.35–0.64)
Protection maintained over 11 years
level of evidence: I.
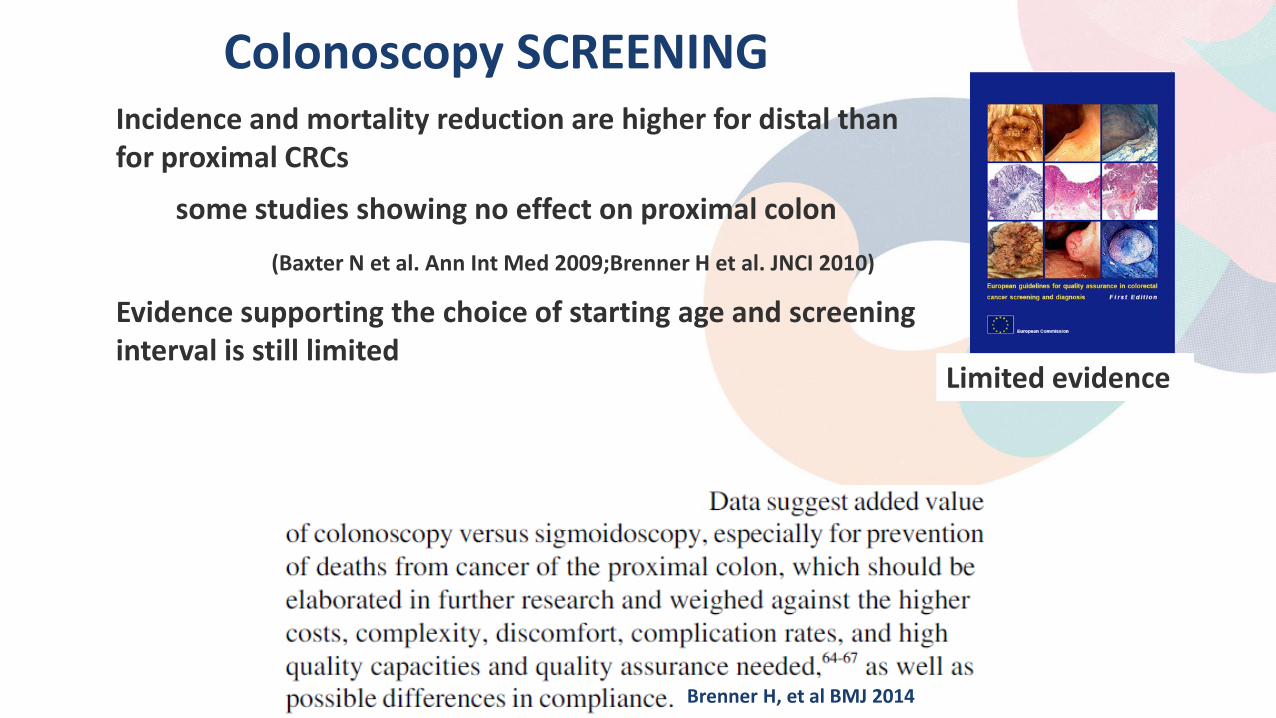
Colonoscopy SCREENING Incidence and mortality reduction are higher for distal than
for proximal CRCs
some studies showing no effect on proximal colon
(Baxter N et al. Ann Int Med 2009;Brenner H et al. JNCI 2010)
Evidence supporting the choice of starting age and screening interval is still limited
Limited evidence
Brenner H, et al BMJ 2014
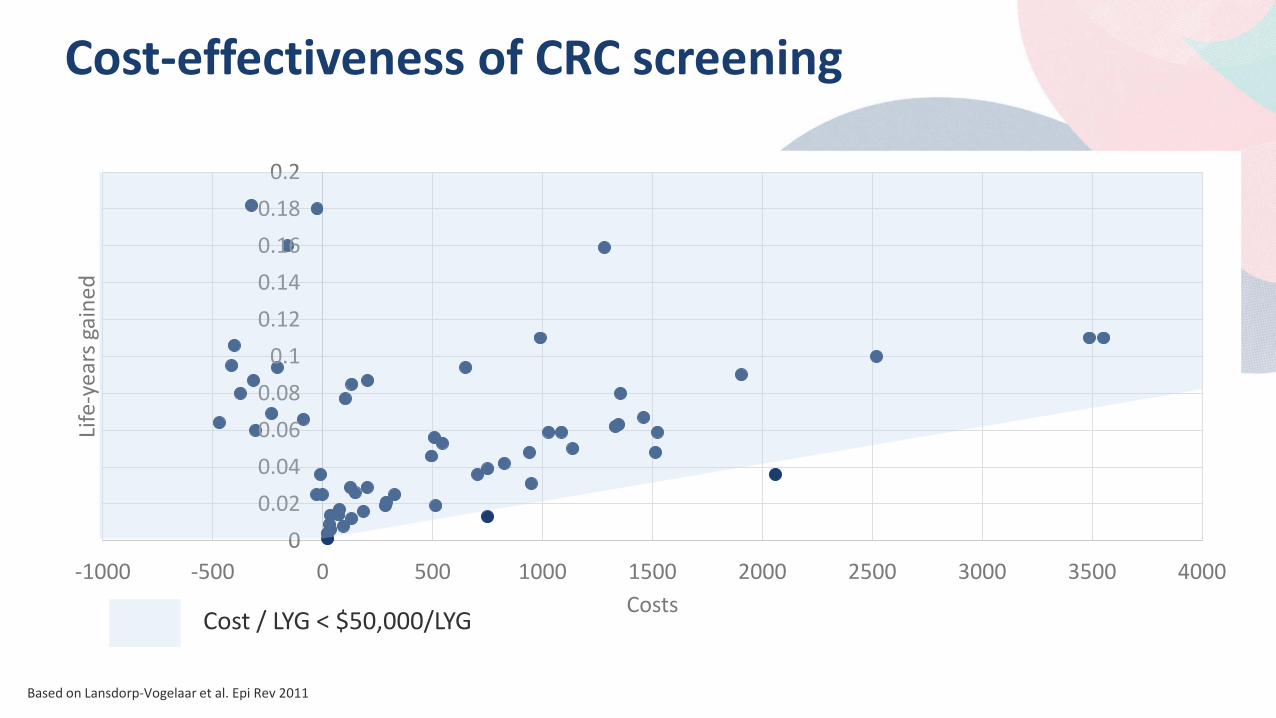
Cost-effectiveness of CRC screening
0 0.02 0.04 0.06 0.08
0.1 0.12 0.14 0.16 0.18
0.2
-1000 -500 0 500 1000 1500 2000 2500 3000 3500 4000
Life
-yea
rs g
aine
d
Costs Cost / LYG < $50,000/LYG
Based on Lansdorp-Vogelaar et al. Epi Rev 2011
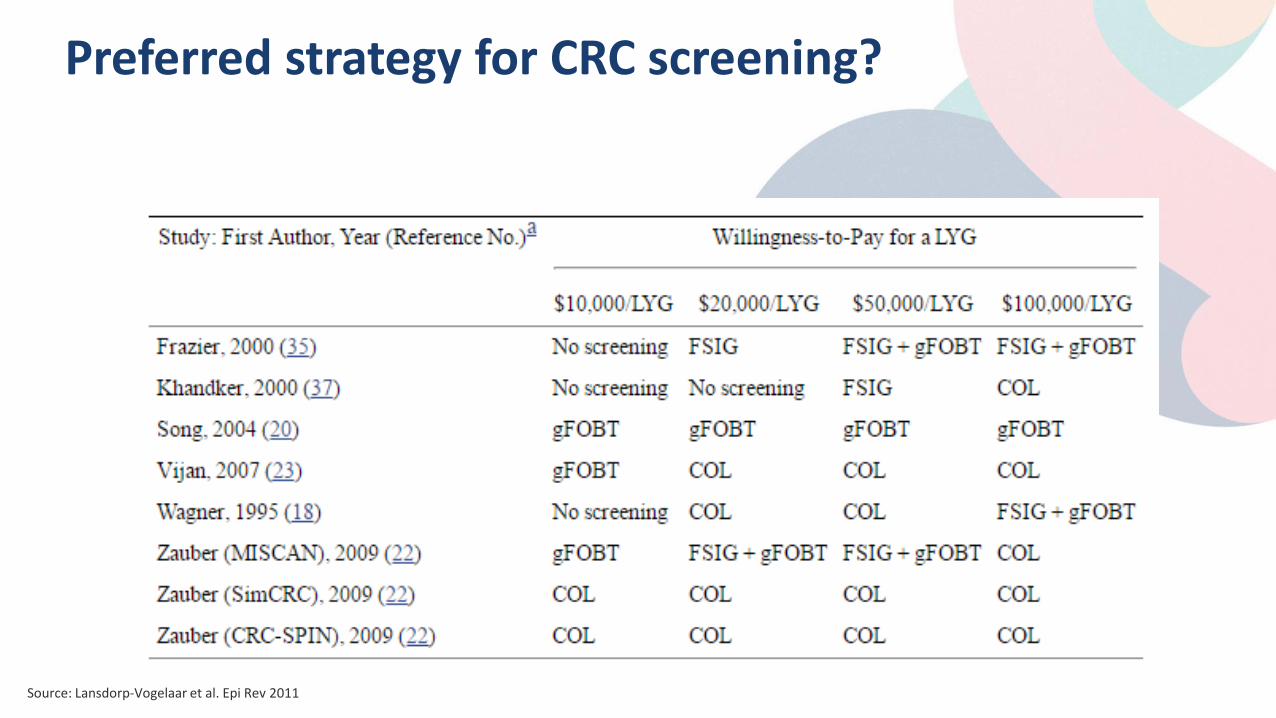
Preferred strategy for CRC screening?
Source: Lansdorp-Vogelaar et al. Epi Rev 2011
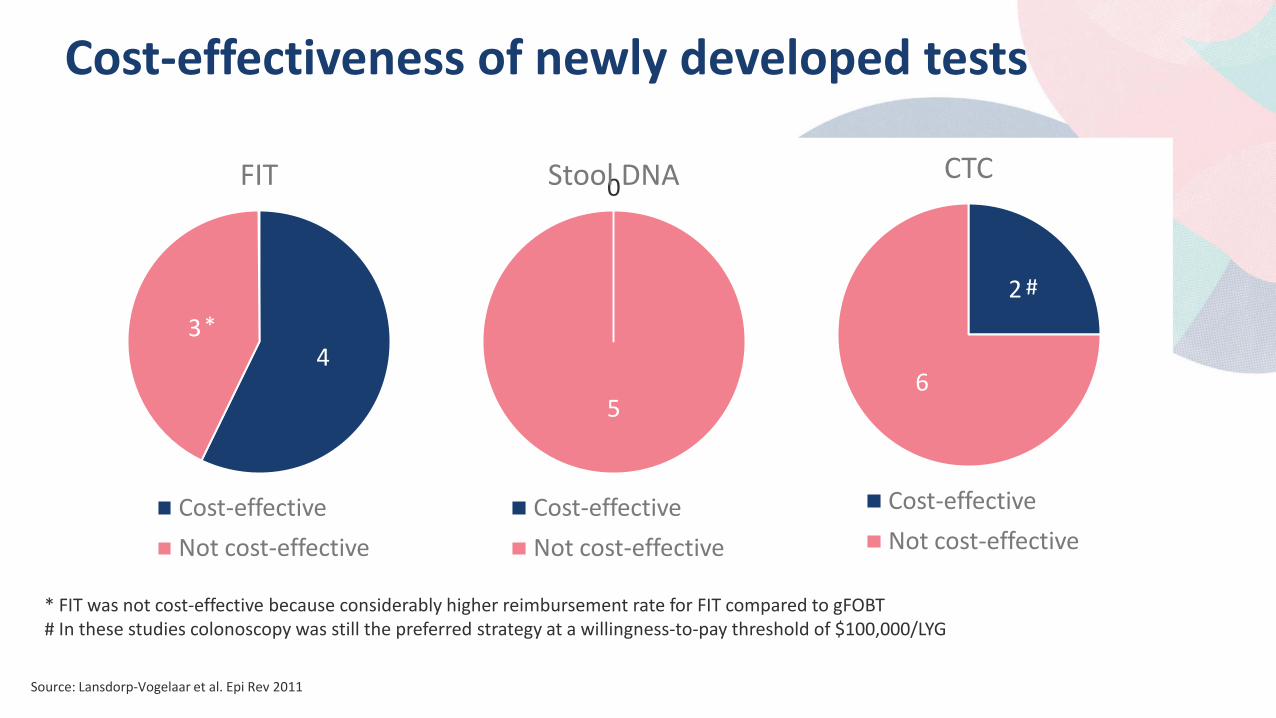
Cost-effectiveness of newly developed tests
4 3
FIT
Cost-effective Not cost-effective
0
5
Stool DNA
Cost-effective Not cost-effective
2
6
CTC
Cost-effective Not cost-effective
* FIT was not cost-effective because considerably higher reimbursement rate for FIT compared to gFOBT # In these studies colonoscopy was still the preferred strategy at a willingness-to-pay threshold of $100,000/LYG
*
#
Source: Lansdorp-Vogelaar et al. Epi Rev 2011
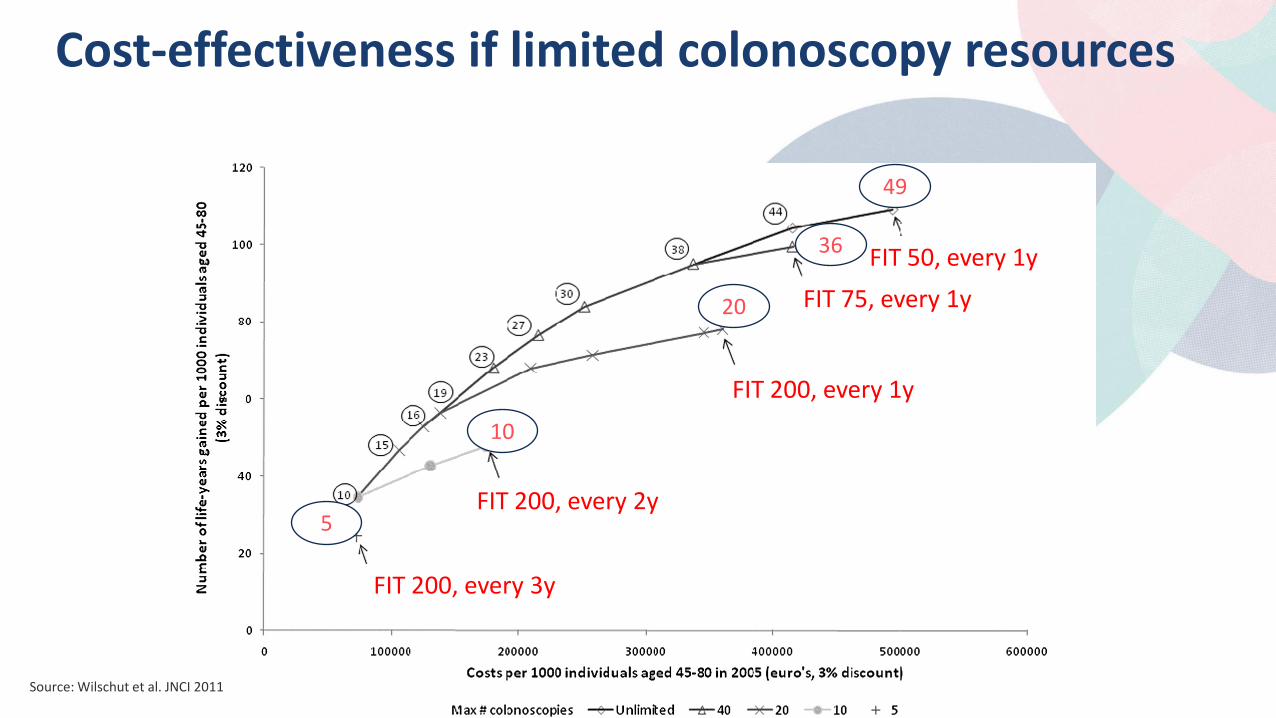
Cost-effectiveness if limited colonoscopy resources
*
#
FIT 200, every 3y
FIT 50, every 1y FIT 75, every 1y
FIT 200, every 1y
FIT 200, every 2y
49
36
20
10
5
Source: Wilschut et al. JNCI 2011
• CRC screening cost-effective compared with no screening, but no screening method can be identified as the preferred strategy
• Factors other than cost-effectiveness, such as population preferences and colonoscopy resources, should be used for screening decisions
• FIT with a high cut-off good option in case of limited colonoscopy resources
• Newly developed screening tests of stool DNA testing, CTC, and capsule endoscopy are not yet cost-effective
Conclusions: Cost-effectiveness of CRC screening
*
Discussion Questions
USPSTF recommendation: – “there is convincing evidence that screening for colorectal cancer provides substantial
benefit for adults aged 50 to 75 years” – “the USPSTF acknowledges that there is no “one size fits all” approach to colorectal
cancer screening and seeks to provide clinicians and patients with the best possible evidence about the various screening methods”
Question: CT colonography and stool DNA screening are included in the recommendation and therefore need to be reimbursed according to Affordable Care Act. Is this a good or a bad development?
Colorectal Cancer Screening The Strategies – Patient Preferences, Overcoming Taboos, Integrating Prevention
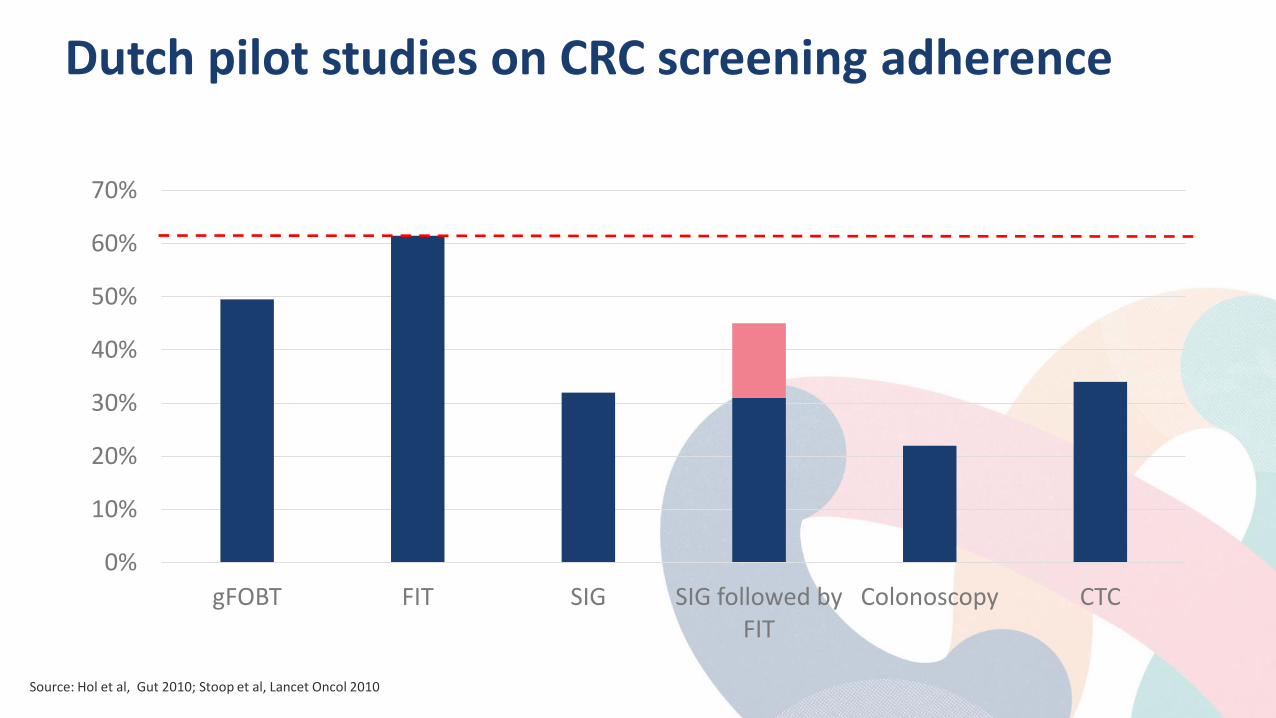
Dutch pilot studies on CRC screening adherence
0%
10%
20%
30%
40%
50%
60%
70%
gFOBT FIT SIG SIG followed by FIT
Colonoscopy CTC
Source: Hol et al, Gut 2010; Stoop et al, Lancet Oncol 2010
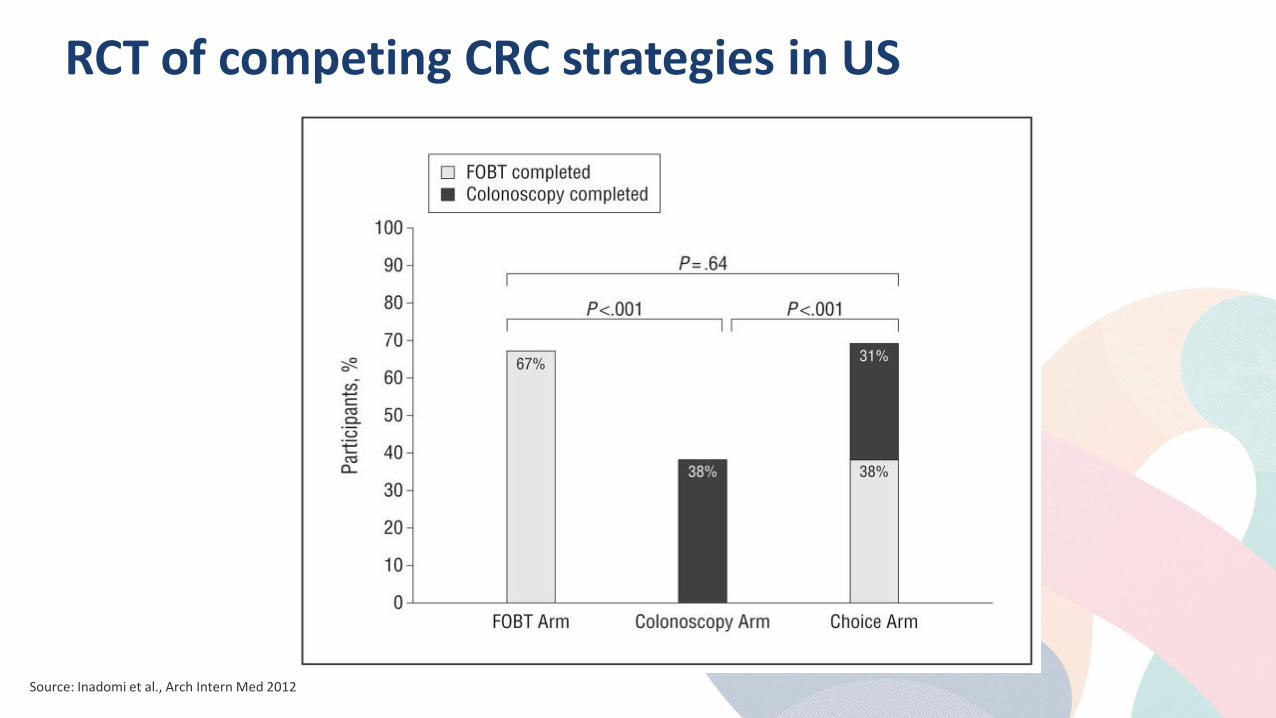
RCT of competing CRC strategies in US
Source: Inadomi et al., Arch Intern Med 2012
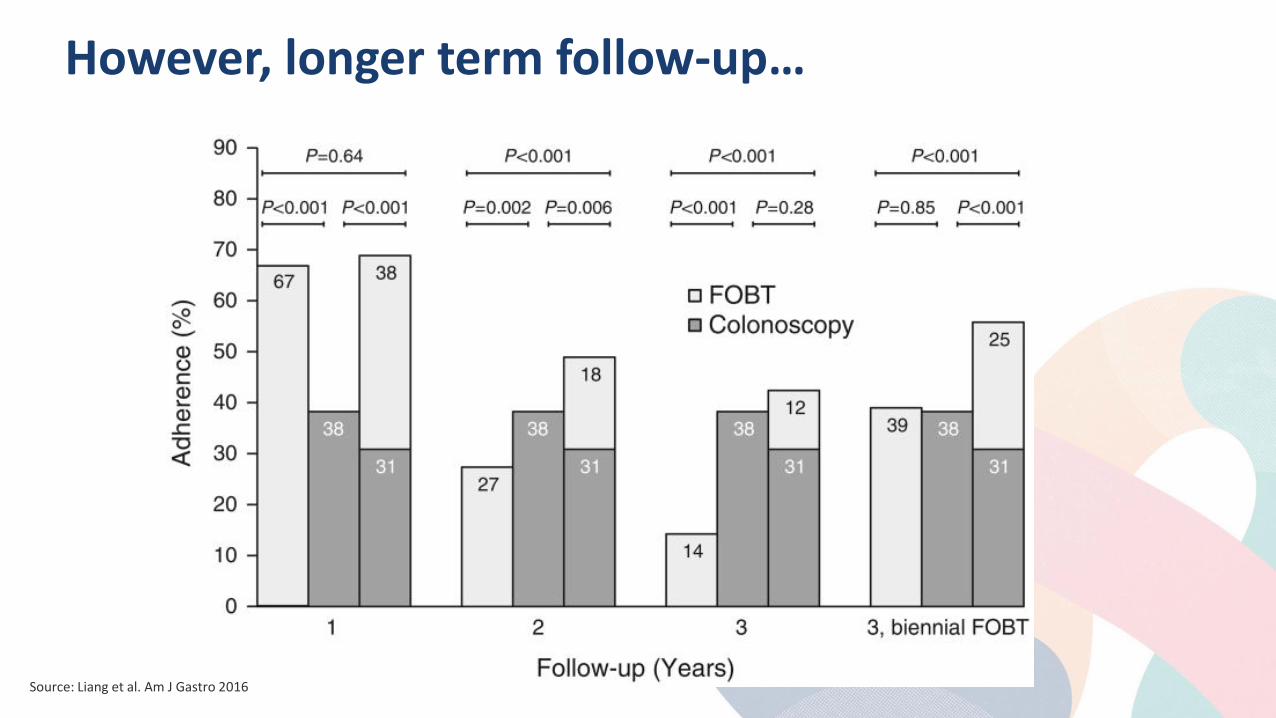
However, longer term follow-up…
Source: Liang et al. Am J Gastro 2016
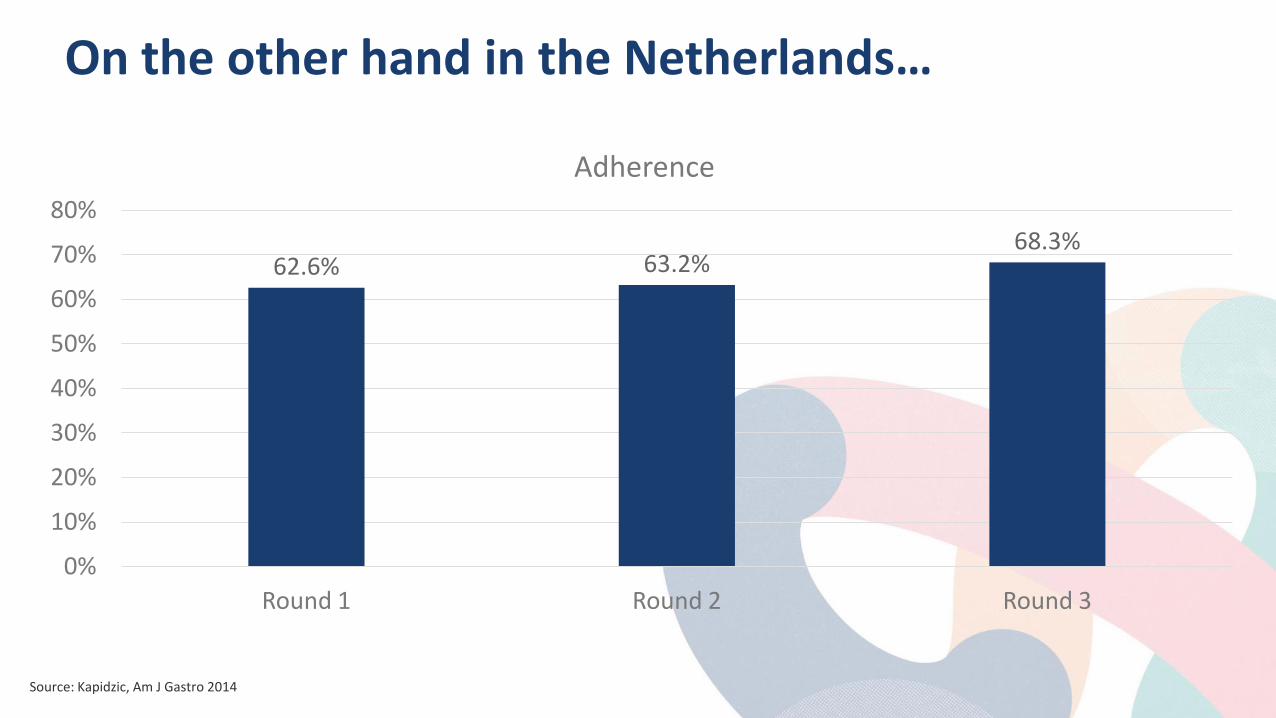
On the other hand in the Netherlands…
62.6% 63.2% 68.3%
0%
10%
20%
30%
40%
50%
60%
70%
80%
Round 1 Round 2 Round 3
Adherence
Source: Kapidzic, Am J Gastro 2014
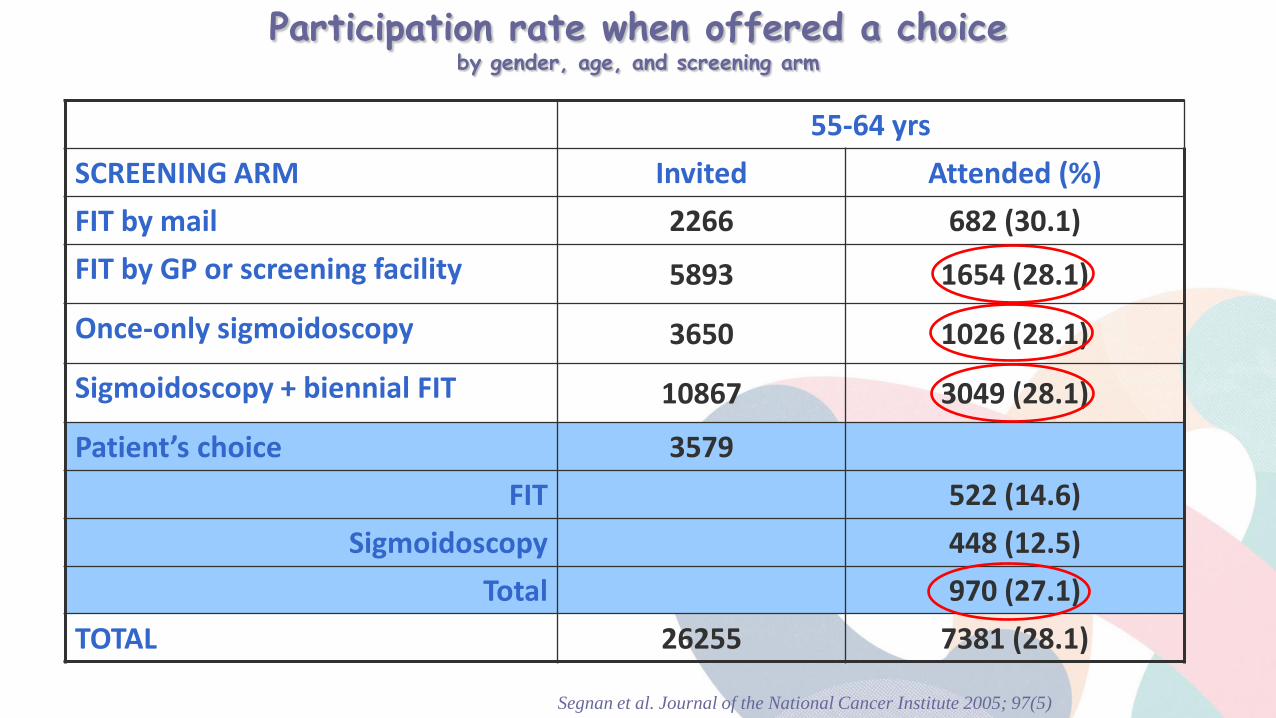
55-64 yrs SCREENING ARM Invited Attended (%) FIT by mail 2266 682 (30.1) FIT by GP or screening facility 5893 1654 (28.1)
Once-only sigmoidoscopy 3650 1026 (28.1)
Sigmoidoscopy + biennial FIT 10867 3049 (28.1)
Patient’s choice 3579 FIT 522 (14.6)
Sigmoidoscopy 448 (12.5) Total 970 (27.1)
TOTAL 26255 7381 (28.1)
Participation rate when offered a choice by gender, age, and screening arm
Segnan et al. Journal of the National Cancer Institute 2005; 97(5)
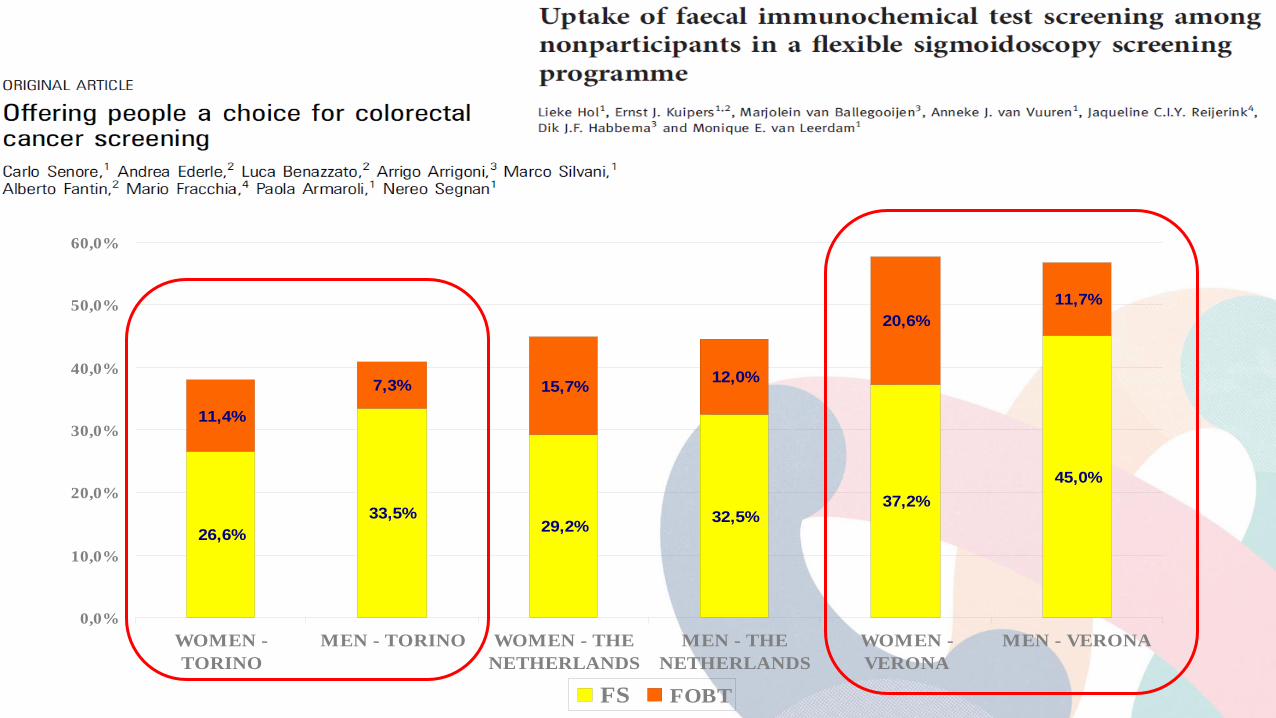
26,6%33,5%
29,2% 32,5%37,2%
45,0%
11,4%
7,3% 15,7% 12,0%
20,6%11,7%
0,0%
10,0%
20,0%
30,0%
40,0%
50,0%
60,0%
WOMEN -TORINO
MEN - TORINO WOMEN - THENETHERLANDS
MEN - THENETHERLANDS
WOMEN -VERONA
MEN - VERONA
FS FOBT
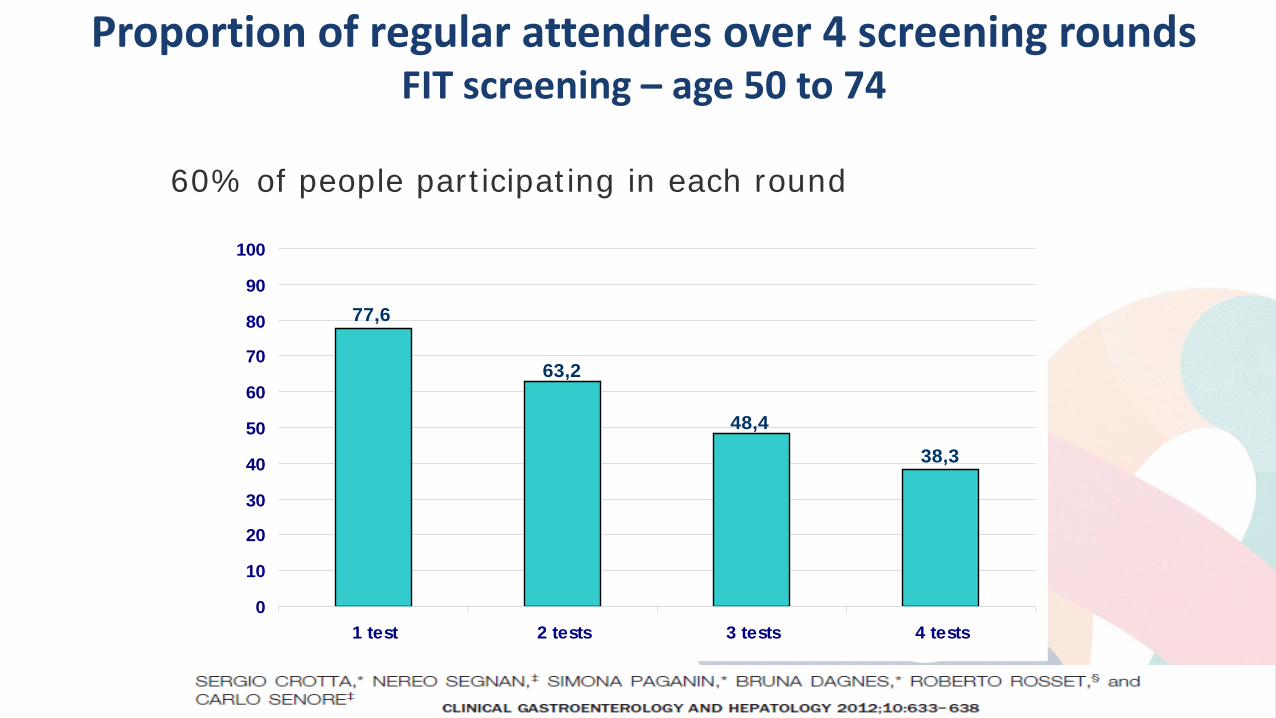
Proportion of regular attendres over 4 screening rounds FIT screening – age 50 to 74
77,6
63,2
48,438,3
0
10
20
30
40
50
60
70
80
90
100
1 test 2 tests 3 tests 4 tests
Crotta et al. CGH 2012
60% of people participating in each round
Conventional Wisdom: Colon Screening 2007
They’ll never do it. It’s just too gross.
Physician versus patient perception
• Survey of primary care providers (PCP’s) in US, 1999/2000, and National Health Interview Survey, 2000, in US (Klabunde et al, 2005)
– Of PCP’s, 56% identified patient embarrassment or anxiety as a barrier
– Fewer than 1% of adults identified this as their reason for not being current with screening
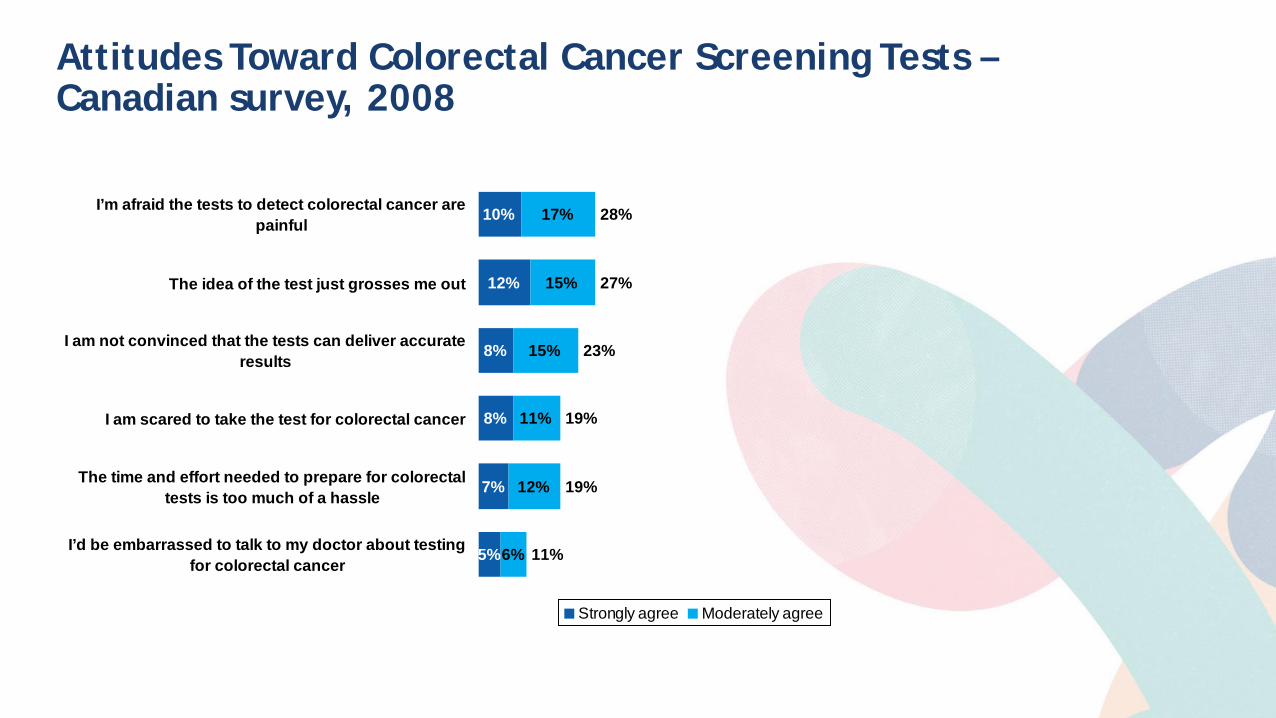
Attitudes Toward Colorectal Cancer Screening Tests – Canadian survey, 2008
10%
12%
8%
8%
7%
5%
17%
15%
15%
11%
12%
6%
28%
27%
23%
19%
19%
11%
I’m afraid the tests to detect colorectal cancer arepainful
The idea of the test just grosses me out
I am not convinced that the tests can deliver accurateresults
I am scared to take the test for colorectal cancer
The time and effort needed to prepare for colorectaltests is too much of a hassle
I’d be embarrassed to talk to my doctor about testingfor colorectal cancer
Strongly agree Moderately agree
Launch of Colonversation
Five Feet of Fabulous!
www.colonversation.ca
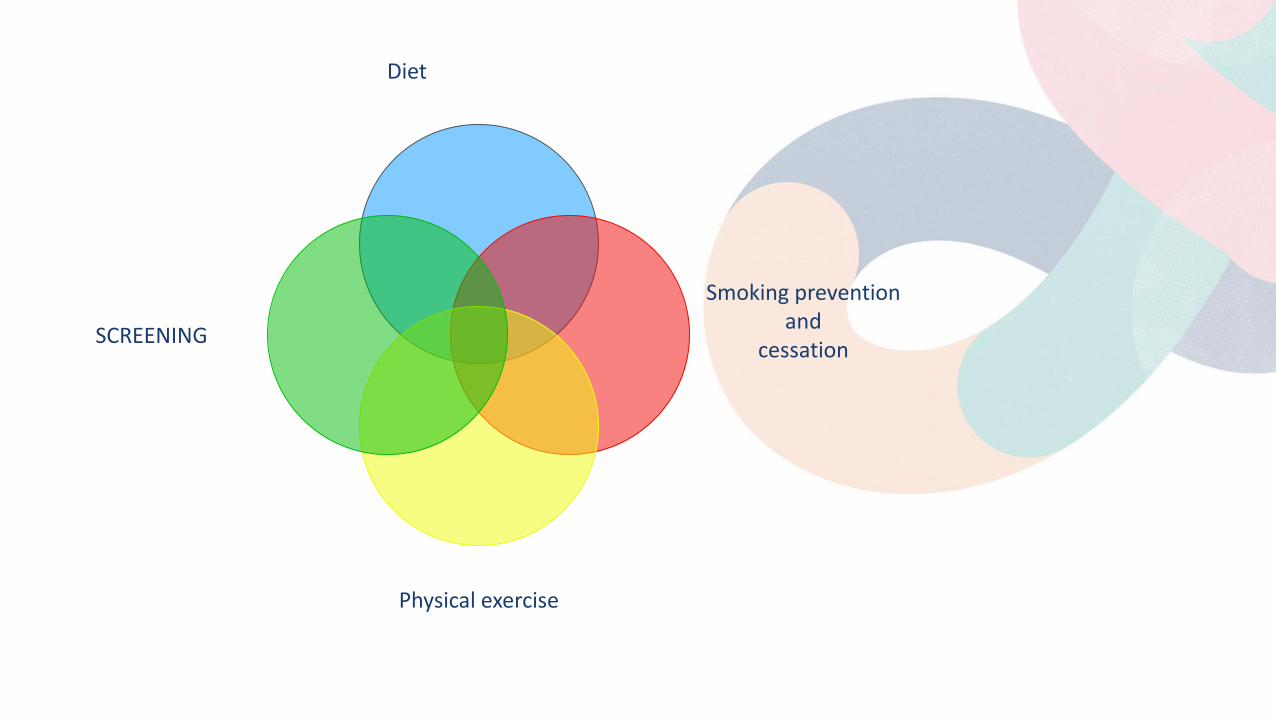
Diet
Smoking prevention and
cessation
Physical exercise
SCREENING

Multiple outcomes
Cancer
……… CVD
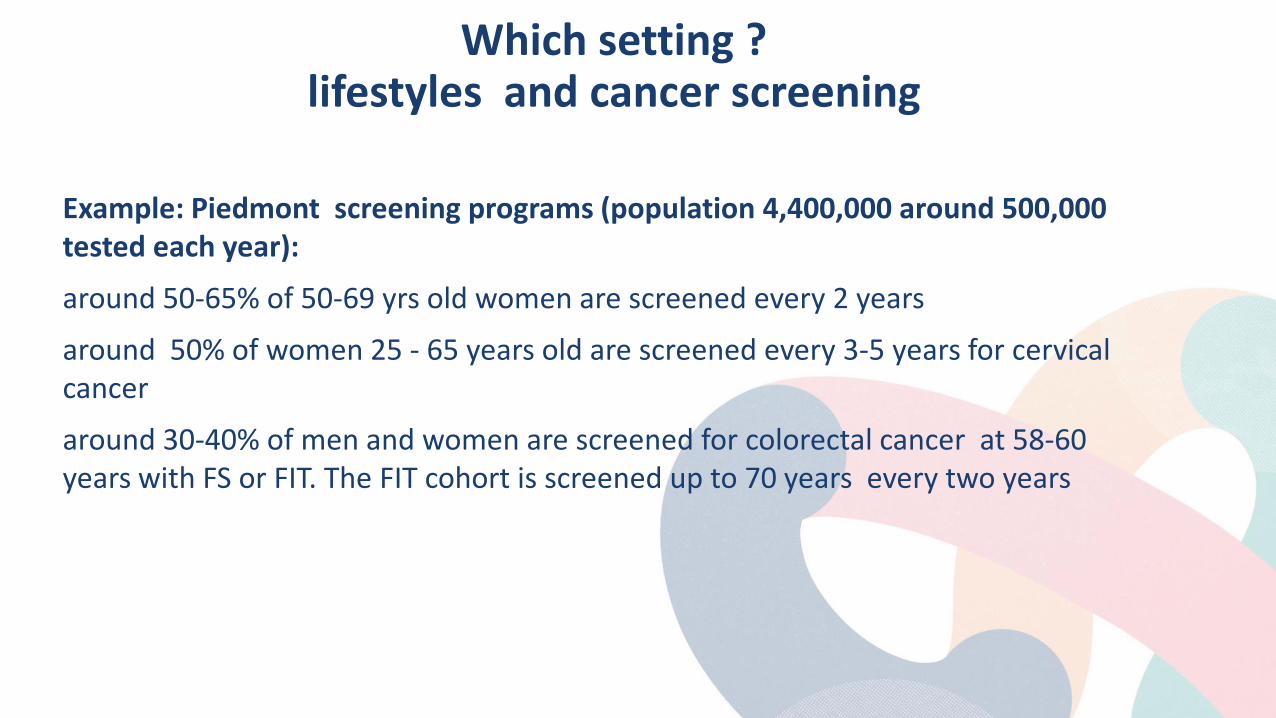
Which setting ? lifestyles and cancer screening
Example: Piedmont screening programs (population 4,400,000 around 500,000 tested each year):
around 50-65% of 50-69 yrs old women are screened every 2 years
around 50% of women 25 - 65 years old are screened every 3-5 years for cervical cancer
around 30-40% of men and women are screened for colorectal cancer at 58-60 years with FS or FIT. The FIT cohort is screened up to 70 years every two years
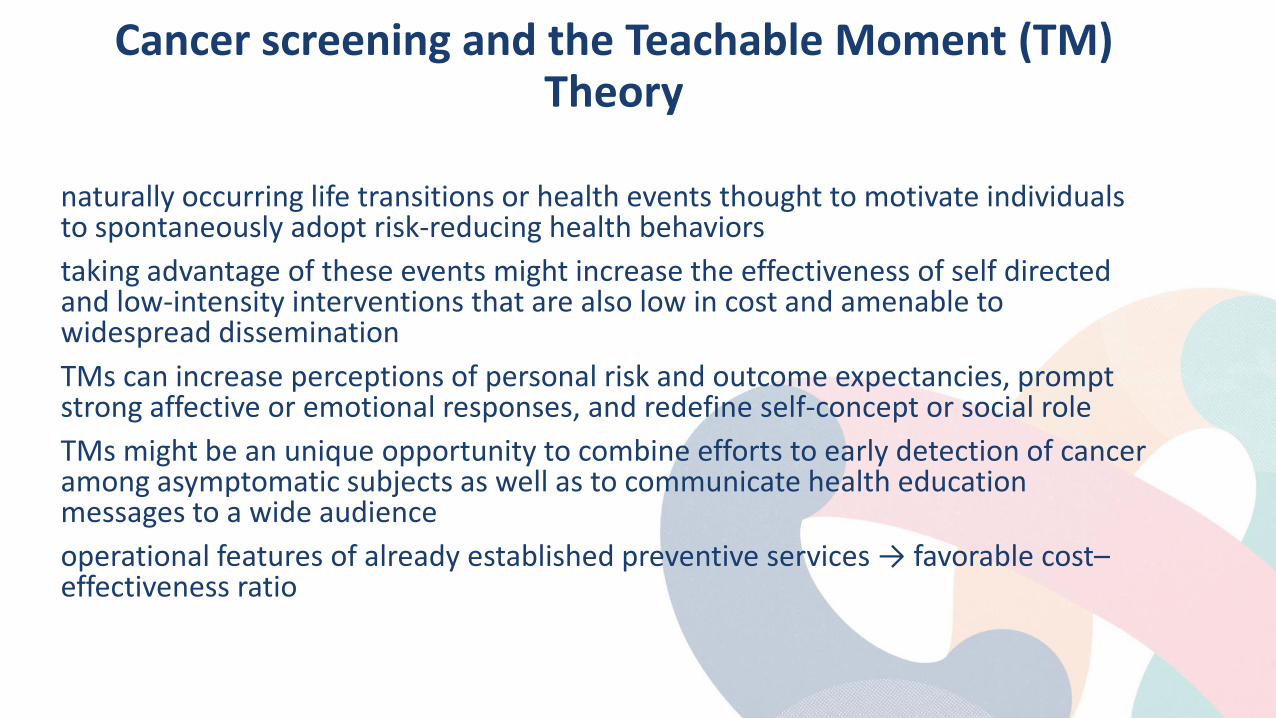
Cancer screening and the Teachable Moment (TM) Theory
naturally occurring life transitions or health events thought to motivate individuals to spontaneously adopt risk-reducing health behaviors taking advantage of these events might increase the effectiveness of self directed and low-intensity interventions that are also low in cost and amenable to widespread dissemination TMs can increase perceptions of personal risk and outcome expectancies, prompt strong affective or emotional responses, and redefine self-concept or social role TMs might be an unique opportunity to combine efforts to early detection of cancer among asymptomatic subjects as well as to communicate health education messages to a wide audience operational features of already established preventive services → favorable cost–effectiveness ratio
Aims and Methods
Review available evidence concerning interventions combining cancer screening and primary prevention interventions, aimed at promoting the adoption of healthy lifestyles. Studies of primary prevention interventions, focused on lifestyle associated risks, were included if: (1) they had been implemented in the context of established screening programs or of pilot screening projects; (2) the study design included a comparison group; (3) the intervention aimed at promoting change of single or multiple behavioral risk factors. MEDLINE and Cochrane library electronic data-bases were searched using broad search criteria, including PubMed “related articles” for the papers meeting the selection criteria. 10 articles included (8 retrieved in the first review).
Findings Tailored interventions were shown to be effective in prompting the adoption of healthier dietary patterns in the short term (+17% after 6 weeks and +7% after 6 months for brief counselling; 34% after 3 months, 8% after 8 months and 22% after 12 months for intensive counselling) but they did not increase smoking quitting rates and showed a limited impact on physical activity Endoscopic CRC screening might pose specific challenges: patients detected with an adenoma tended to feel no need to modify their lifestyle, as if the test result, indicating a clean colon, together with the reassurance offered by professionals during the process, could be interpreted as a validation of the current lifestyle → importance of the assessment of effectiveness of strategies aimed at promoting behavioral change by making explicit the connection between lifestyle and CRC or adenoma incidence and recurrence
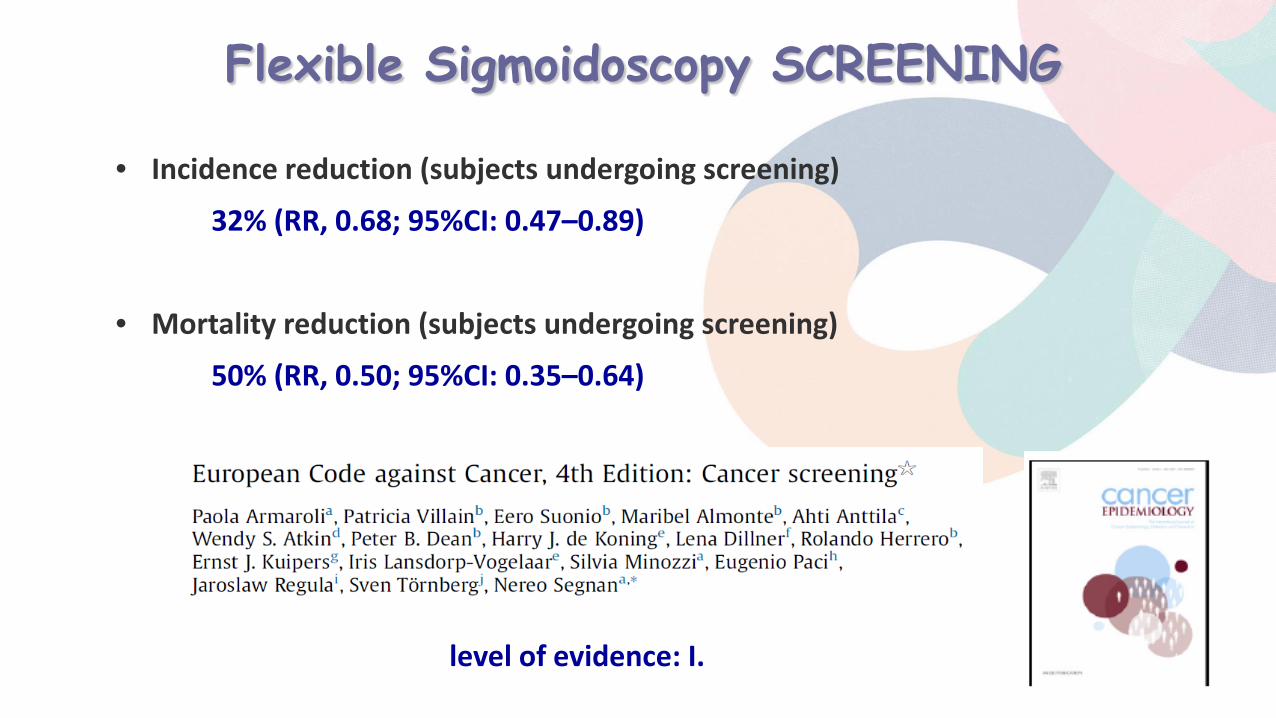
Flexible Sigmoidoscopy SCREENING
• Incidence reduction (subjects undergoing screening)
32% (RR, 0.68; 95%CI: 0.47–0.89)
• Mortality reduction (subjects undergoing screening)
50% (RR, 0.50; 95%CI: 0.35–0.64)
level of evidence: I.
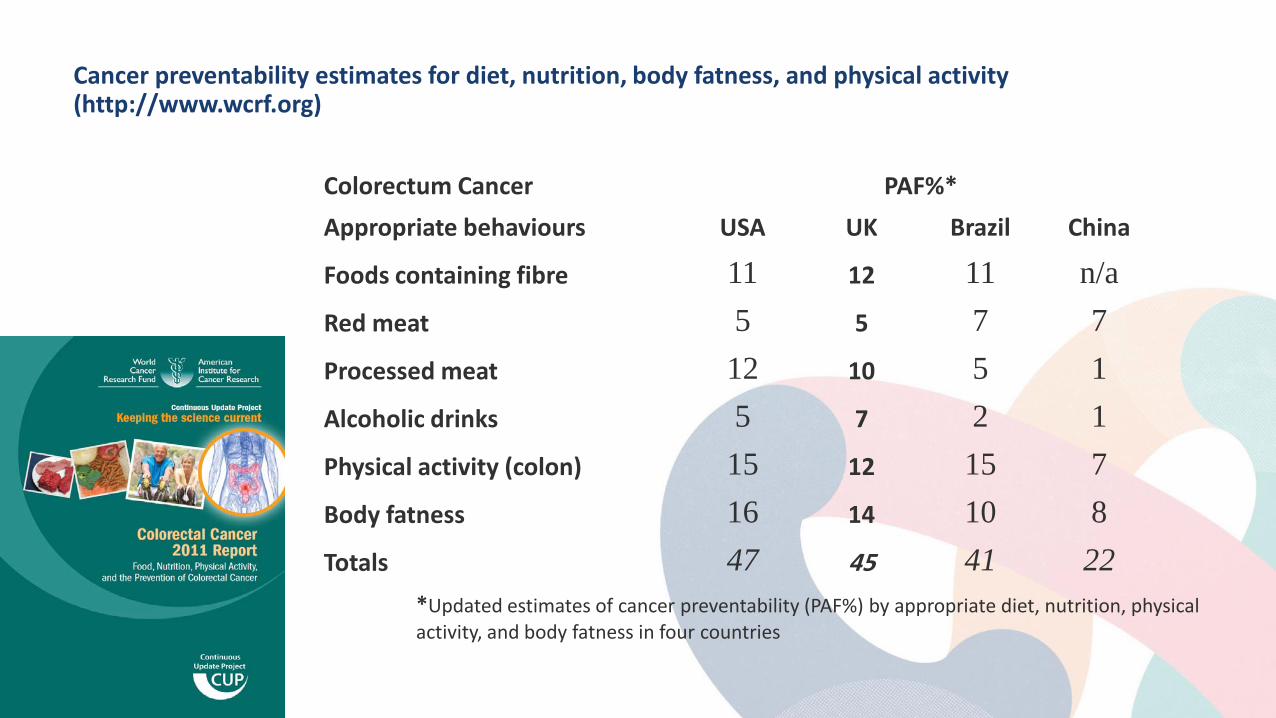
Cancer preventability estimates for diet, nutrition, body fatness, and physical activity (http://www.wcrf.org)
Colorectum Cancer PAF%* Appropriate behaviours USA UK Brazil China
Foods containing fibre 11 12 11 n/a Red meat 5 5 7 7 Processed meat 12 10 5 1 Alcoholic drinks 5 7 2 1 Physical activity (colon) 15 12 15 7 Body fatness 16 14 10 8 Totals 47 45 41 22
*Updated estimates of cancer preventability (PAF%) by appropriate diet, nutrition, physical activity, and body fatness in four countries
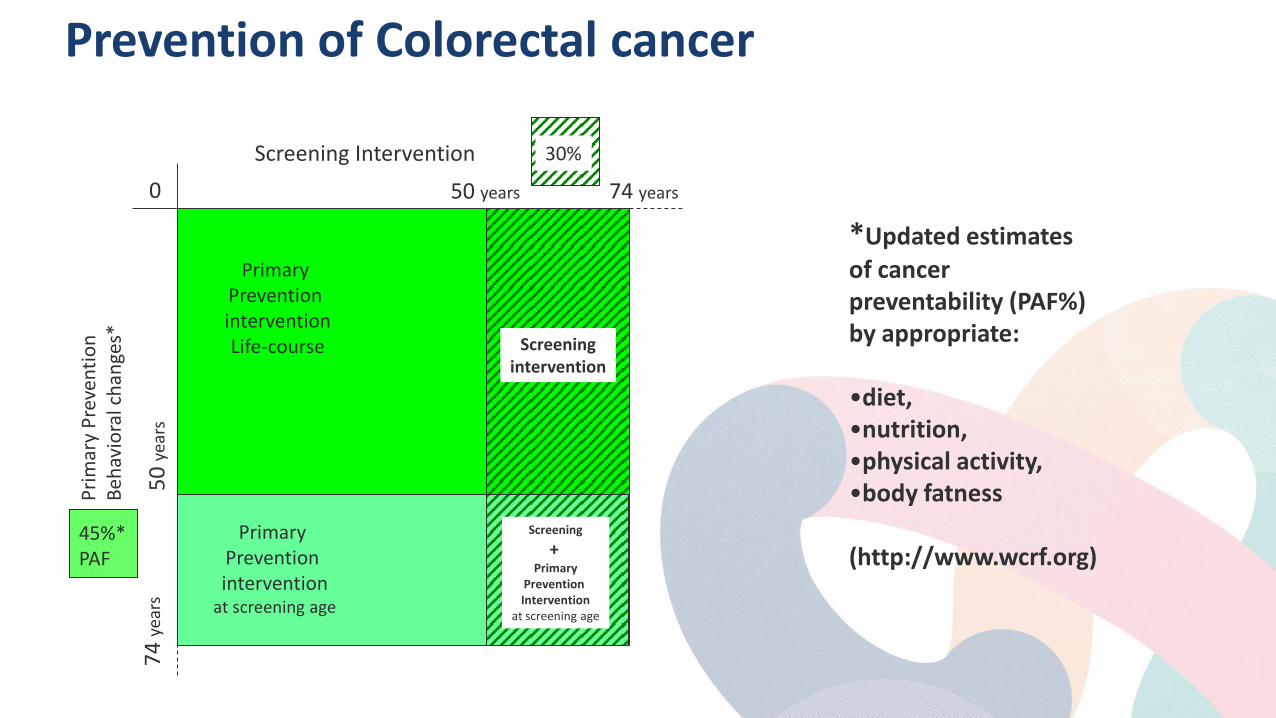
Prevention of Colorectal cancer
Screening Intervention
Prim
ary
Prev
entio
n Be
havi
oral
cha
nges
*
0 74 years
74 ye
ars
50 years
45%* PAF
30% 50
year
s
Primary Prevention intervention
at screening age
Primary Prevention intervention Life-course Screening
intervention
Screening +
Primary Prevention Intervention
at screening age
*Updated estimates of cancer preventability (PAF%) by appropriate: •diet, •nutrition, •physical activity, •body fatness (http://www.wcrf.org)
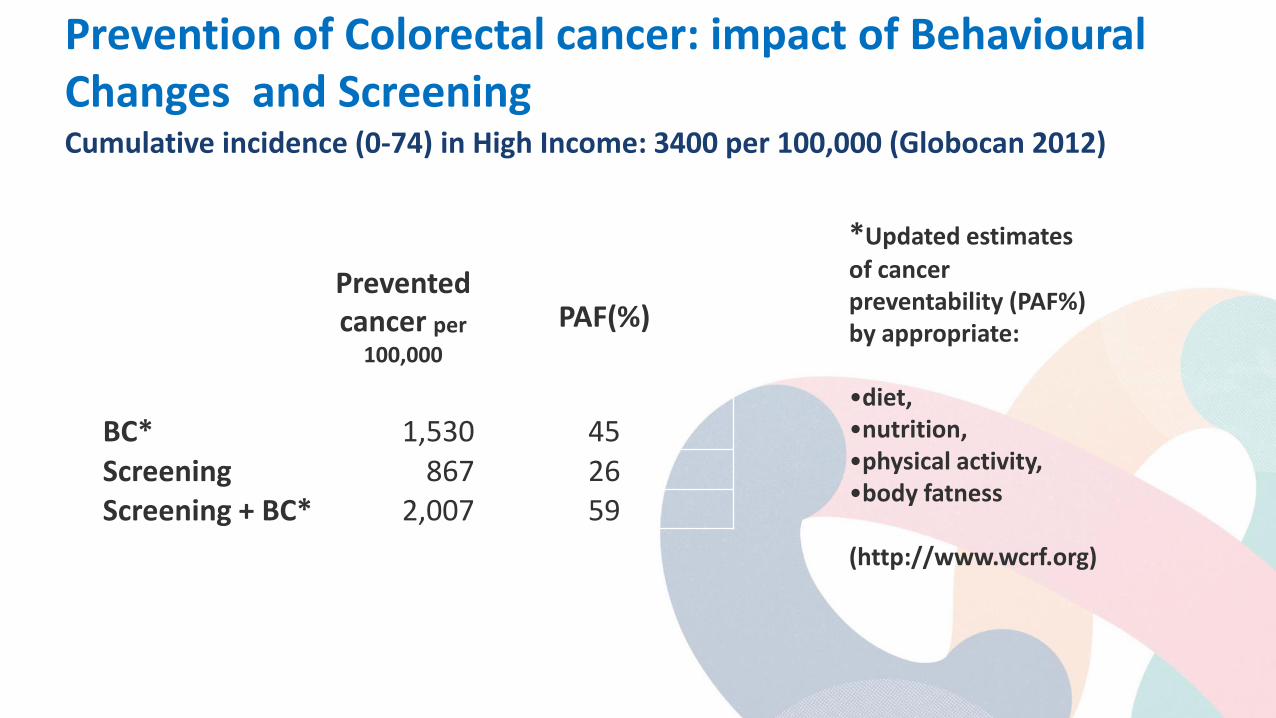
Prevented cancer per
100,000 PAF(%)
BC* 1,530 45 Screening 867 26 Screening + BC* 2,007 59
Cumulative incidence (0-74) in High Income: 3400 per 100,000 (Globocan 2012)
*Updated estimates of cancer preventability (PAF%) by appropriate: •diet, •nutrition, •physical activity, •body fatness (http://www.wcrf.org)
Prevention of Colorectal cancer: impact of Behavioural Changes and Screening
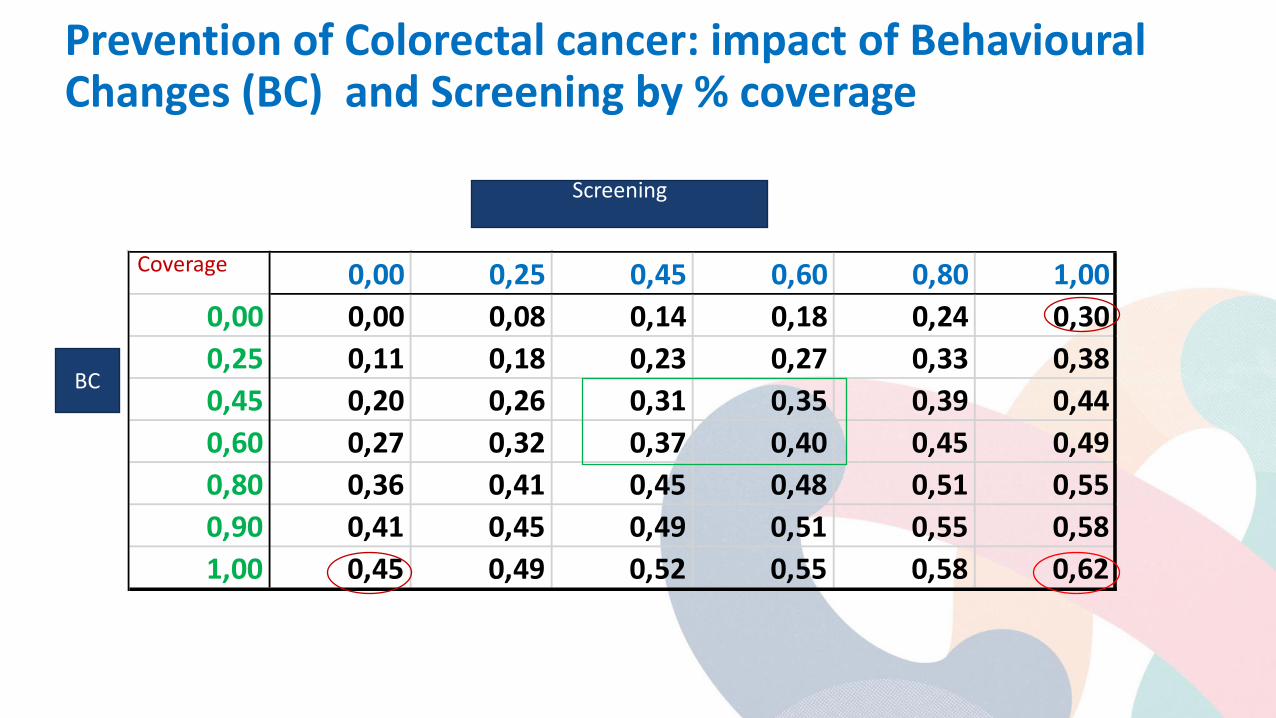
Prevention of Colorectal cancer: impact of Behavioural Changes (BC) and Screening by % coverage
0,00 0,25 0,45 0,60 0,80 1,000,00 0,00 0,08 0,14 0,18 0,24 0,300,25 0,11 0,18 0,23 0,27 0,33 0,380,45 0,20 0,26 0,31 0,35 0,39 0,440,60 0,27 0,32 0,37 0,40 0,45 0,490,80 0,36 0,41 0,45 0,48 0,51 0,550,90 0,41 0,45 0,49 0,51 0,55 0,581,00 0,45 0,49 0,52 0,55 0,58 0,62
Screening
BC
Coverage
Insights from focus groups on primary prevention interventions in the setting of organised breast cancer screening
there is still a need for robust public health communications before the messages based on the epidemiology of breast cancer risk are incorporated as every day, ‘common sense’ aspects of people’s understanding of cancer risk the provision of clear information that illustrates the scientific evidence about the link between lifestyle factors and breast cancer risk has the potential to increase credibility of advice
Conway et al, BMC Public Health, 2016
Discussion
Few studies are available assessing the interaction between primary and secondary prevention It is important to evaluate the effectiveness of strategies aimed at promoting behavioral change by making explicit the connection between lifestyle and CRC or adenoma incidence and recurrence Interventions focused on the cognitive components of behaviors may not be sufficient to induce and sustain the adoption of new habits A broader view taking into account context related factors might enhance the impact of these interventions

Colorectal Cancer Screening Addressing Inequities
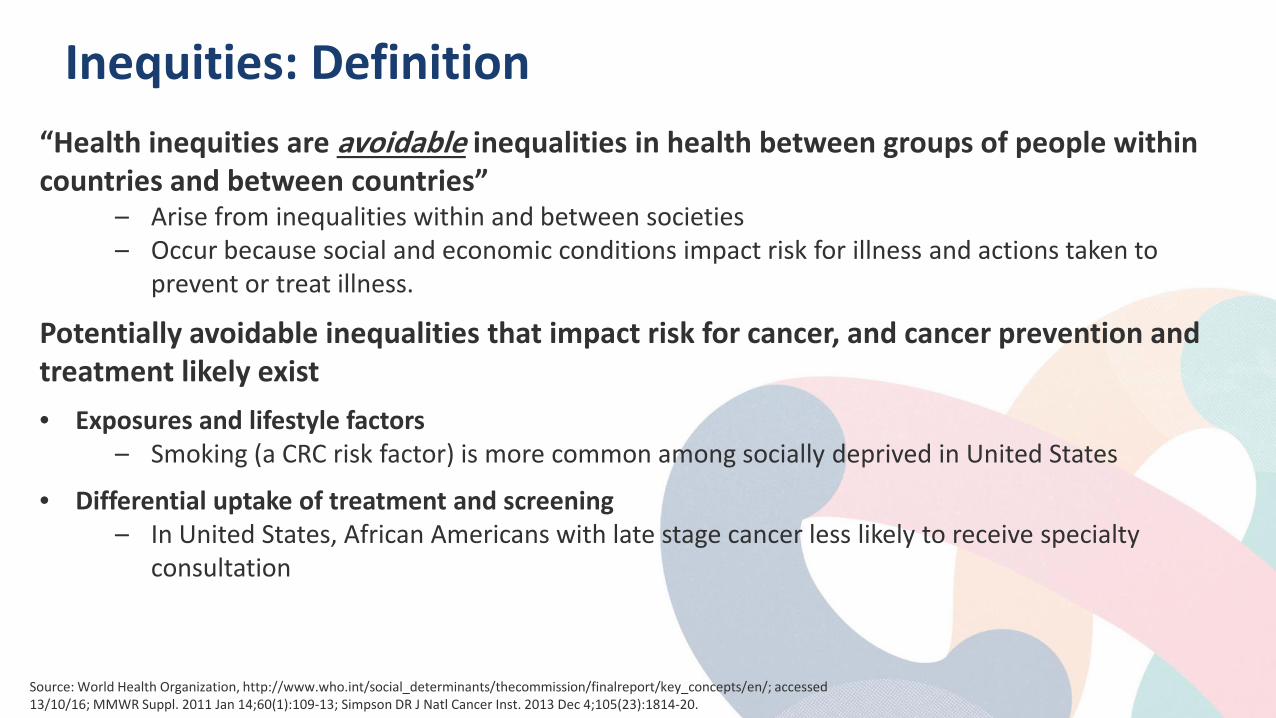
Inequities: Definition “Health inequities are avoidable inequalities in health between groups of people within countries and between countries”
– Arise from inequalities within and between societies – Occur because social and economic conditions impact risk for illness and actions taken to
prevent or treat illness.
Potentially avoidable inequalities that impact risk for cancer, and cancer prevention and treatment likely exist • Exposures and lifestyle factors
– Smoking (a CRC risk factor) is more common among socially deprived in United States
• Differential uptake of treatment and screening – In United States, African Americans with late stage cancer less likely to receive specialty
consultation
Source: World Health Organization, http://www.who.int/social_determinants/thecommission/finalreport/key_concepts/en/; accessed 13/10/16; MMWR Suppl. 2011 Jan 14;60(1):109-13; Simpson DR J Natl Cancer Inst. 2013 Dec 4;105(23):1814-20.
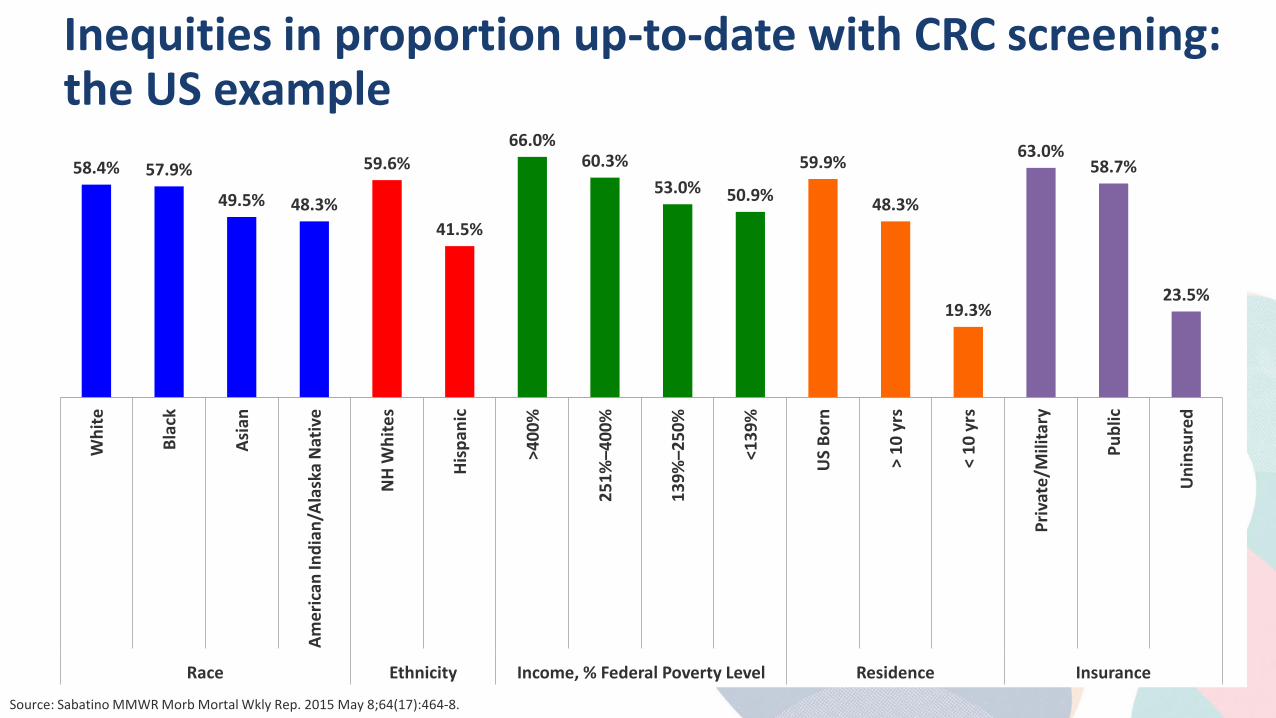
Inequities in proportion up-to-date with CRC screening: the US example
58.4% 57.9%
49.5% 48.3%
59.6%
41.5%
66.0% 60.3%
53.0% 50.9%
59.9%
48.3%
19.3%
63.0% 58.7%
23.5%
Whi
te
Blac
k
Asia
n
Amer
ican
Indi
an/A
lask
a N
ativ
e
NH
Whi
tes
Hisp
anic
>400
%
251%
–400
%
139%
–250
%
<139
%
US
Born
> 10
yrs
< 10
yrs
Priv
ate/
Mili
tary
Publ
ic
Uni
nsur
ed
Race Ethnicity Income, % Federal Poverty Level Residence Insurance
Source: Sabatino MMWR Morb Mortal Wkly Rep. 2015 May 8;64(17):464-8.
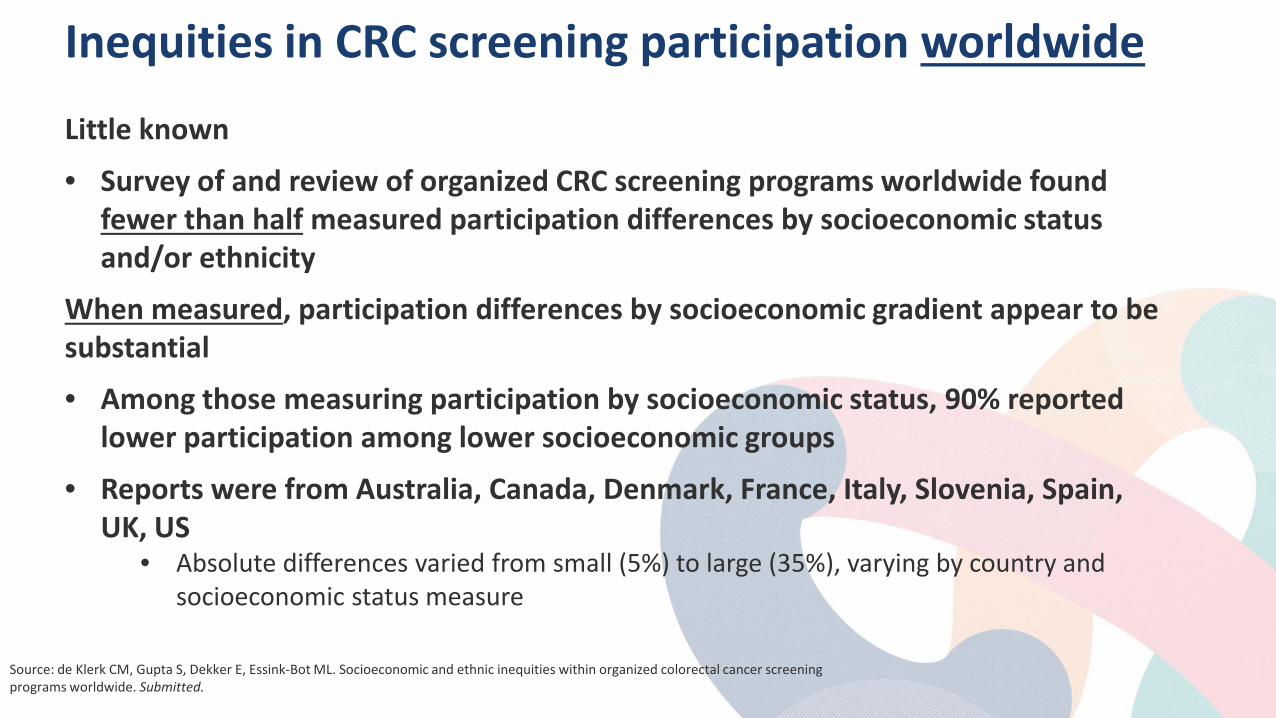
Inequities in CRC screening participation worldwide
Little known
• Survey of and review of organized CRC screening programs worldwide found fewer than half measured participation differences by socioeconomic status and/or ethnicity
When measured, participation differences by socioeconomic gradient appear to be substantial
• Among those measuring participation by socioeconomic status, 90% reported lower participation among lower socioeconomic groups
• Reports were from Australia, Canada, Denmark, France, Italy, Slovenia, Spain, UK, US
• Absolute differences varied from small (5%) to large (35%), varying by country and socioeconomic status measure
Source: de Klerk CM, Gupta S, Dekker E, Essink-Bot ML. Socioeconomic and ethnic inequities within organized colorectal cancer screening programs worldwide. Submitted.
Mechanisms of inequities
Unequal access
• In US, screening rates lower for individuals with no health coverage or non-private health coverage
Equal access, but unequal chance of completion secondary to:
• Health literacy
• Language
• Knowledge regarding screening
• Variation in fear and fatalism towards cancer
• Test acceptability
Source: Sabatino MMWR Morb Mortal Wkly Rep. 2015 May 8;64(17):464-8; Honein-AbouHaider GN Cancer Epidemiol Biomarkers Prev. 2016 Jun;25(6):907-17
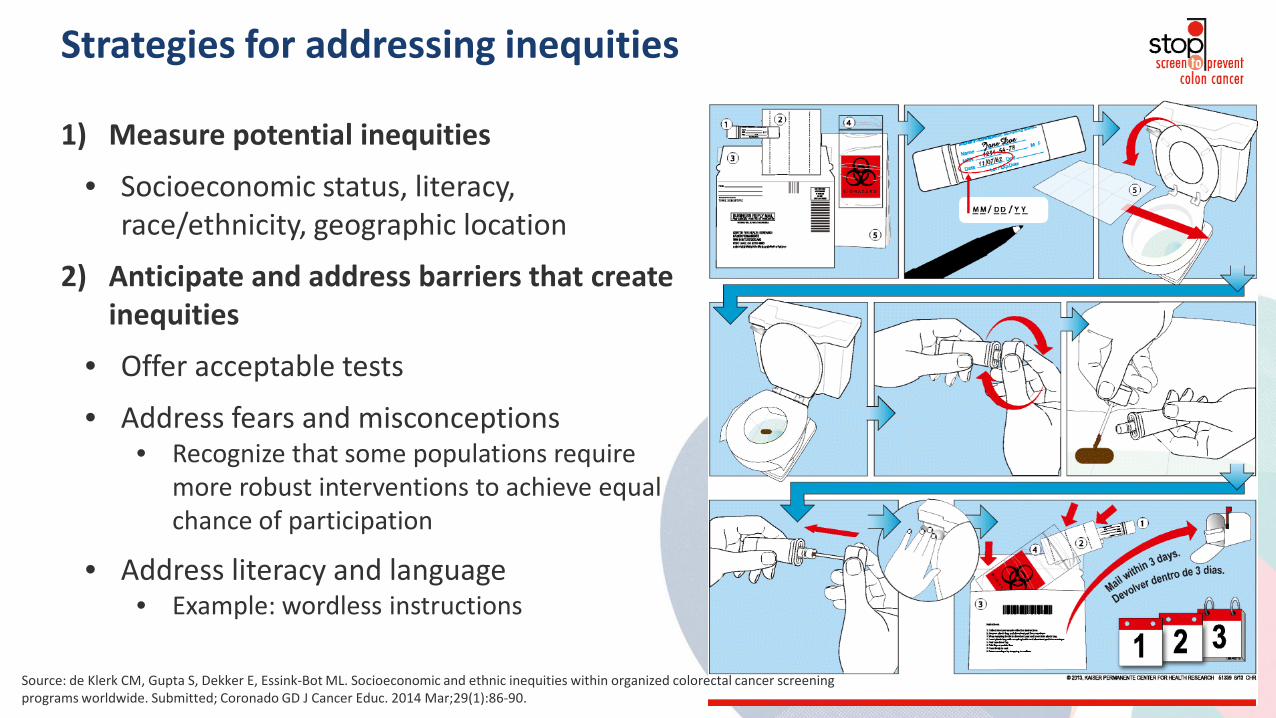
Strategies for addressing inequities
1) Measure potential inequities
• Socioeconomic status, literacy, race/ethnicity, geographic location
2) Anticipate and address barriers that create inequities
• Offer acceptable tests
• Address fears and misconceptions • Recognize that some populations require
more robust interventions to achieve equal chance of participation
• Address literacy and language • Example: wordless instructions
Source: de Klerk CM, Gupta S, Dekker E, Essink-Bot ML. Socioeconomic and ethnic inequities within organized colorectal cancer screening programs worldwide. Submitted; Coronado GD J Cancer Educ. 2014 Mar;29(1):86-90.
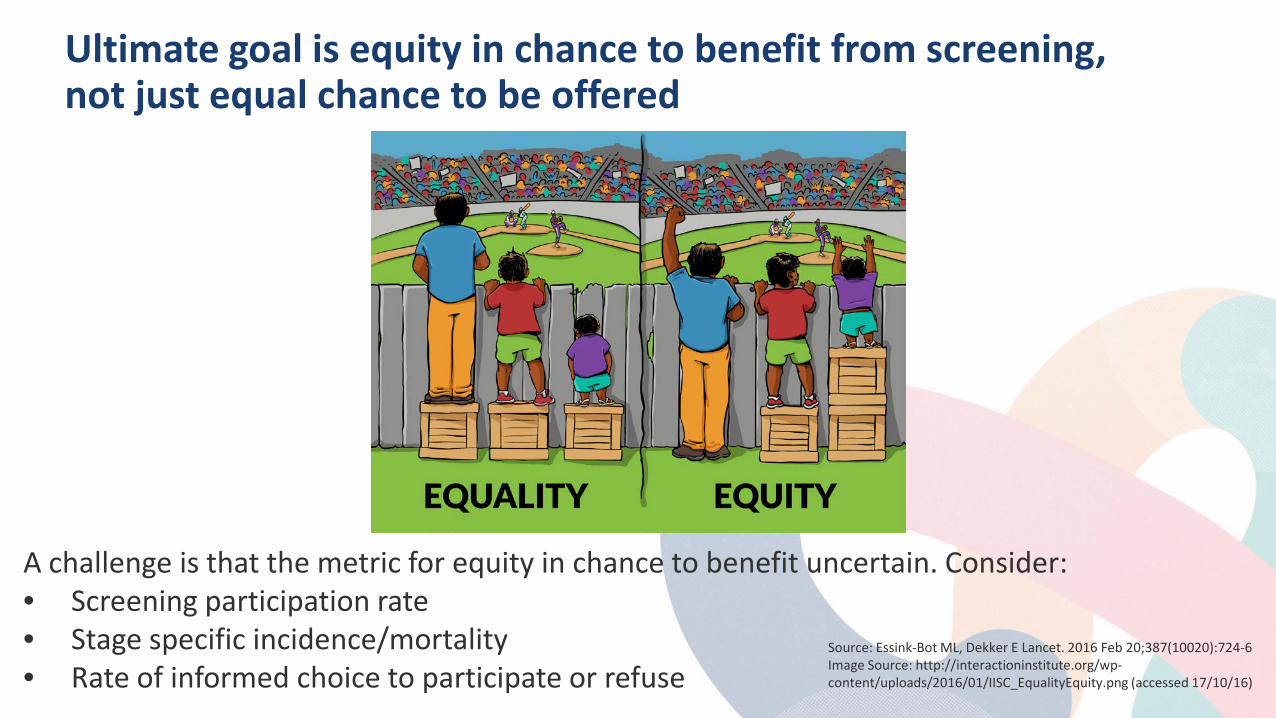
Ultimate goal is equity in chance to benefit from screening, not just equal chance to be offered
A challenge is that the metric for equity in chance to benefit uncertain. Consider: • Screening participation rate • Stage specific incidence/mortality • Rate of informed choice to participate or refuse
Source: Essink-Bot ML, Dekker E Lancet. 2016 Feb 20;387(10020):724-6 Image Source: http://interactioninstitute.org/wp-content/uploads/2016/01/IISC_EqualityEquity.png (accessed 17/10/16)
Discussion Questions The Strategies
• What is the optimal strategy? – One-size-fits-all? Sequential offering of tests? Choice of tests?
• Is colorectal cancer screening still considered taboo?
Anticipating and Addressing Challenges to Screening Underserved Populations
• For those with established programs, are you measuring inequities, and are inequities being observed and addressed?
• What are the challenges in measuring and addressing inequities?
• What are the political and social challenges associated with targeting specific populations for special interventions to address inequities?

Colorectal Cancer Screening Where do we go from here? Lessons Learned and Future Considerations
Where do we go from here? 80% by 2018: A Public Health Initiative for the 21st Century
What is 80% by 2018?
Goal: Increase US CRC screening rate from 65% in 2012 (baseline year) to 80% by the end of 2018.
• Goal was established by the National Colorectal Cancer Roundtable – a consortium of more than 100 organizations funded by the American Cancer Society (ACS) and the US Centers for Disease Control and Prevention (CDC).
• 80% = screening by any recommended test within appropriate interval (FIT in past 1 year, colonoscopy in past 10 years,…). Test use differs by system, resources,..
• Estimated that reaching 80% by 2018 will result in 277,000 cases prevented and 203,000 lives saved by 2030
80% by 2018: Why Now?
• CRC screening has prevented 550,000 CRC deaths in the US over past 2 decades – but after years of rapid rise, screening rates reaching a plateau
• Increased attention on CRC screening in Quality Improvement programs in many sectors (private insurance, Medicare, Veterans Admin, safety net clinics,…) – but lack of a visible national goal or public attention to the issue
• Changes in US healthcare system, including Affordable Care Act
• Engagement and endorsement of US Assistant Secretary of Health (Dr. Howard Koh)
• CDC funding for state-based screening programs
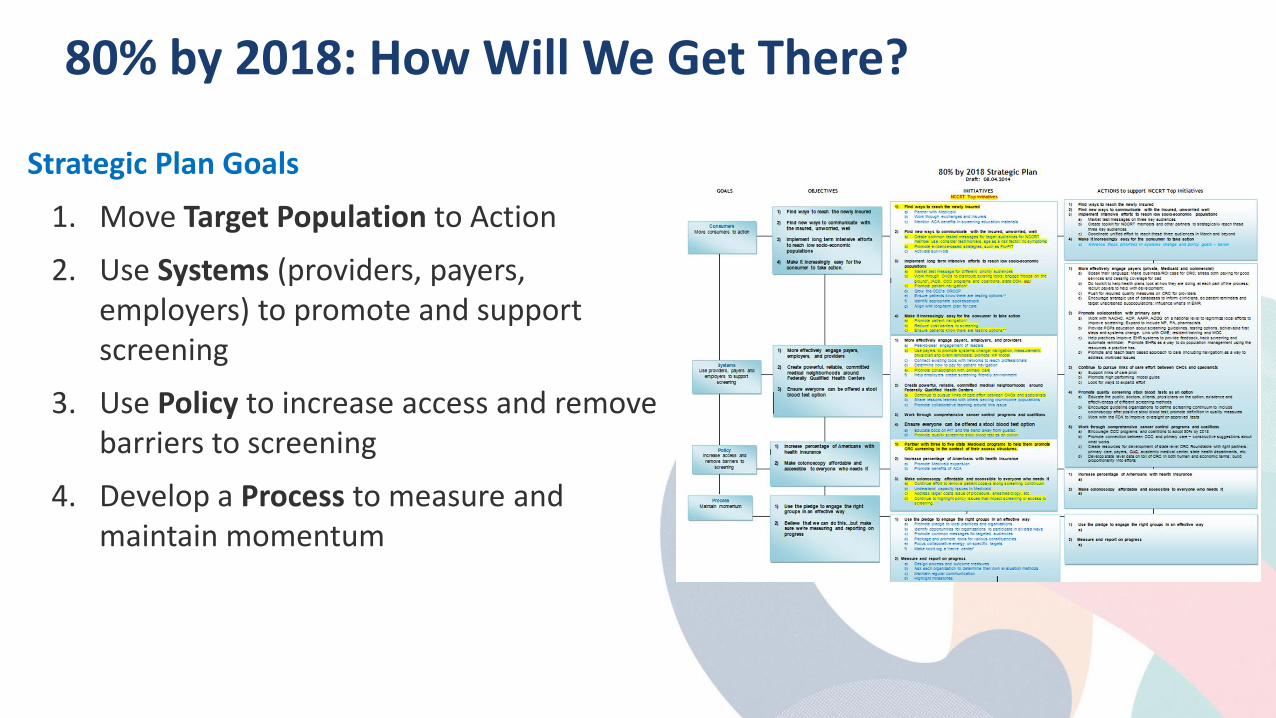
80% by 2018: How Will We Get There?
Strategic Plan Goals
1. Move Target Population to Action
2. Use Systems (providers, payers, employers) to promote and support screening
3. Use Policy to increase access and remove barriers to screening
4. Develop a Process to measure and maintain momentum
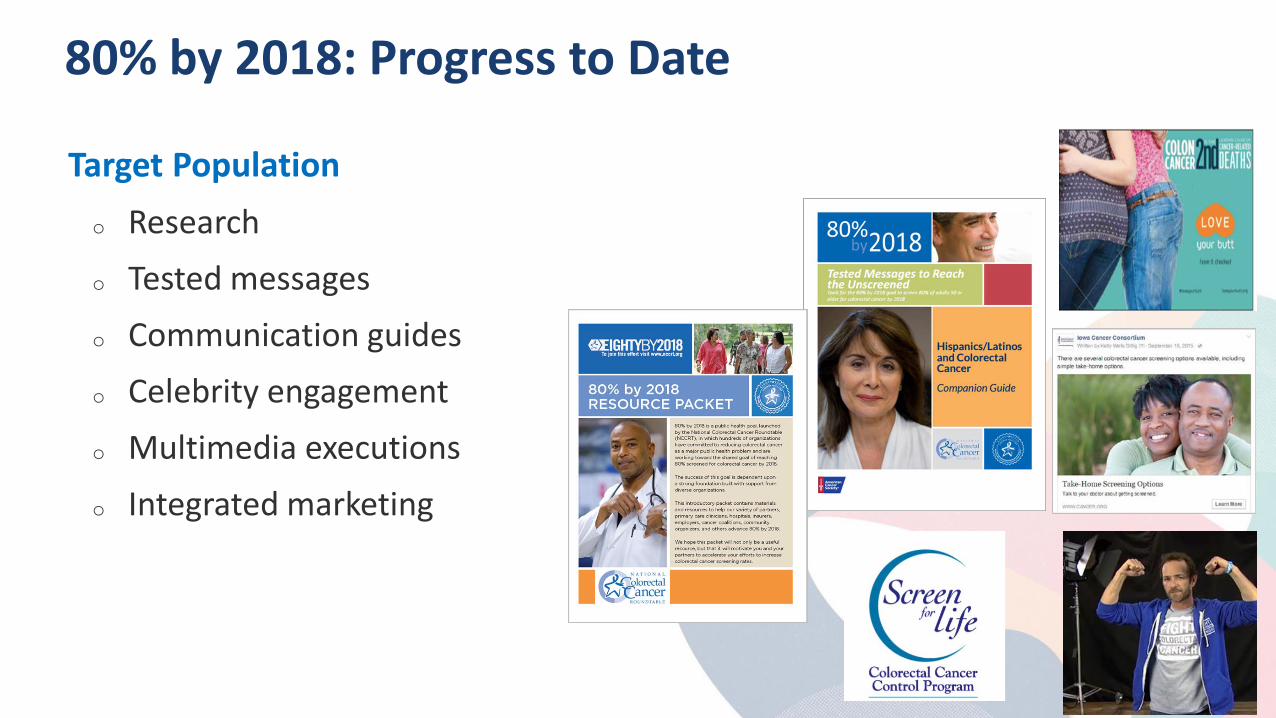
80% by 2018: Progress to Date
Target Population o Research o Tested messages o Communication guides o Celebrity engagement o Multimedia executions o Integrated marketing
Where do we go from here?
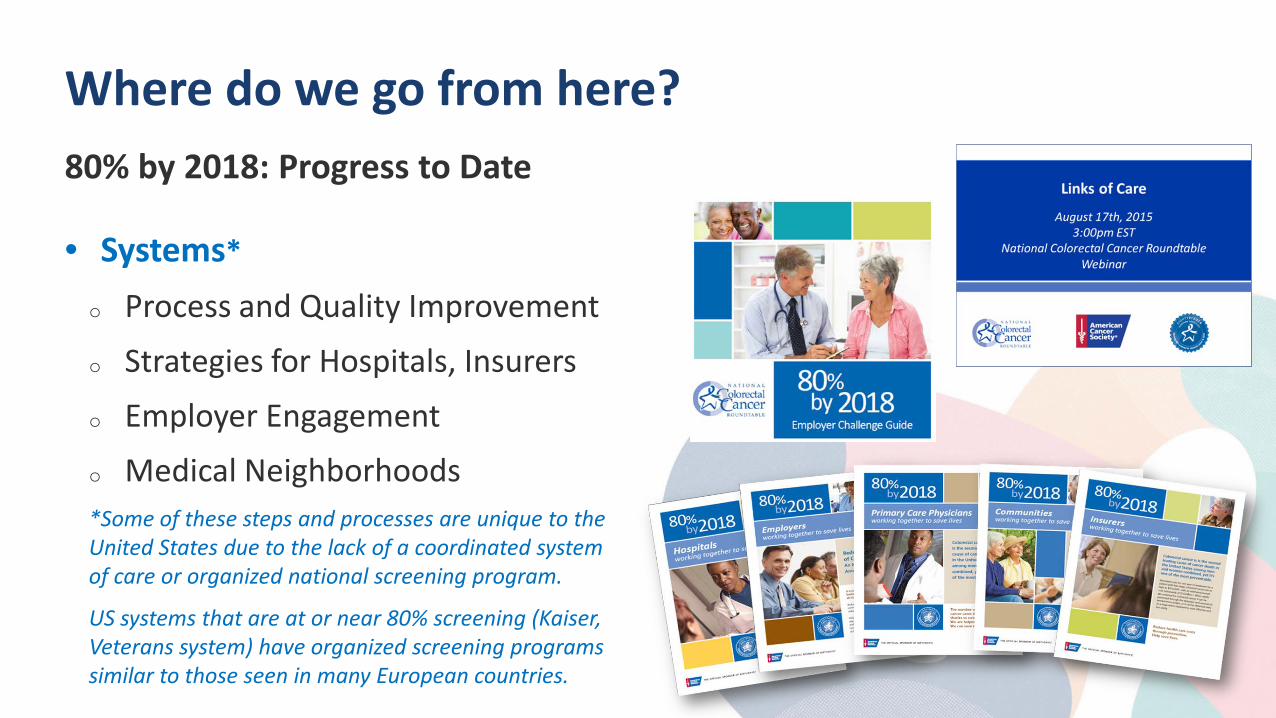
• Systems* o Process and Quality Improvement
o Strategies for Hospitals, Insurers
o Employer Engagement
o Medical Neighborhoods *Some of these steps and processes are unique to the United States due to the lack of a coordinated system of care or organized national screening program.
US systems that are at or near 80% screening (Kaiser, Veterans system) have organized screening programs similar to those seen in many European countries.
80% by 2018: Progress to Date
80% by 2018: Progress to Date
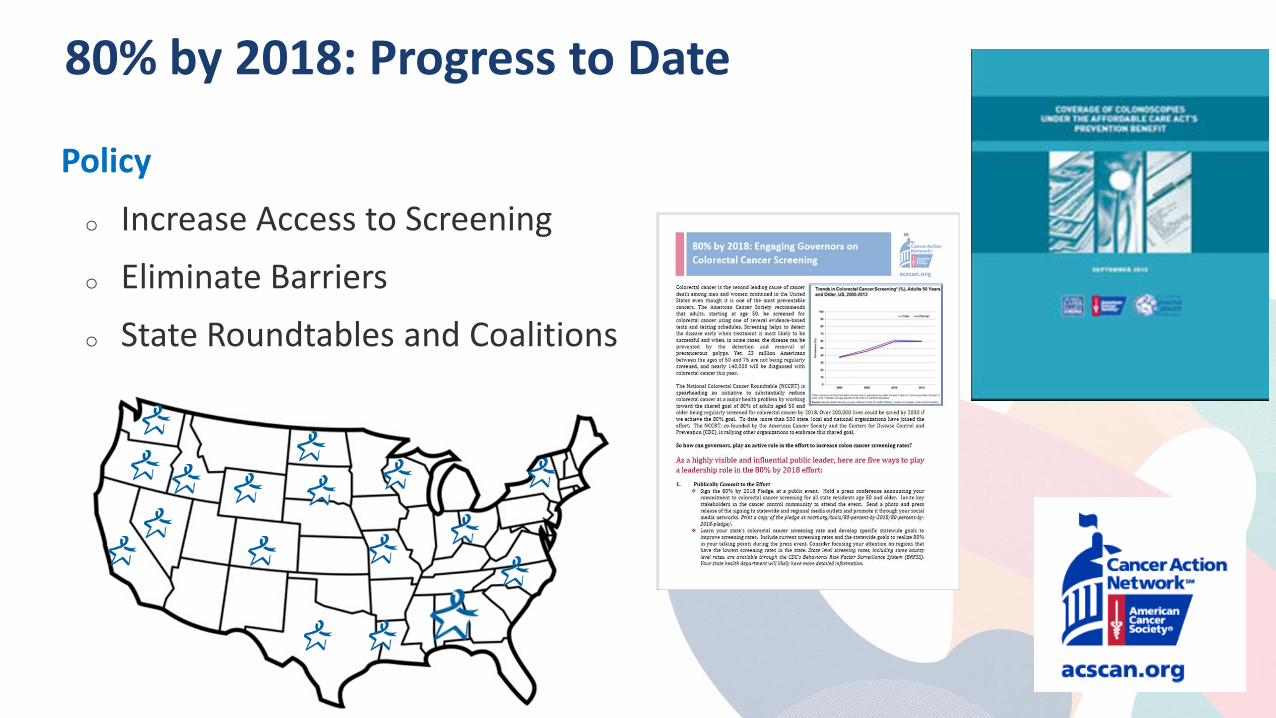
Policy o Increase Access to Screening o Eliminate Barriers o State Roundtables and Coalitions
80% by 2018: Progress to Date
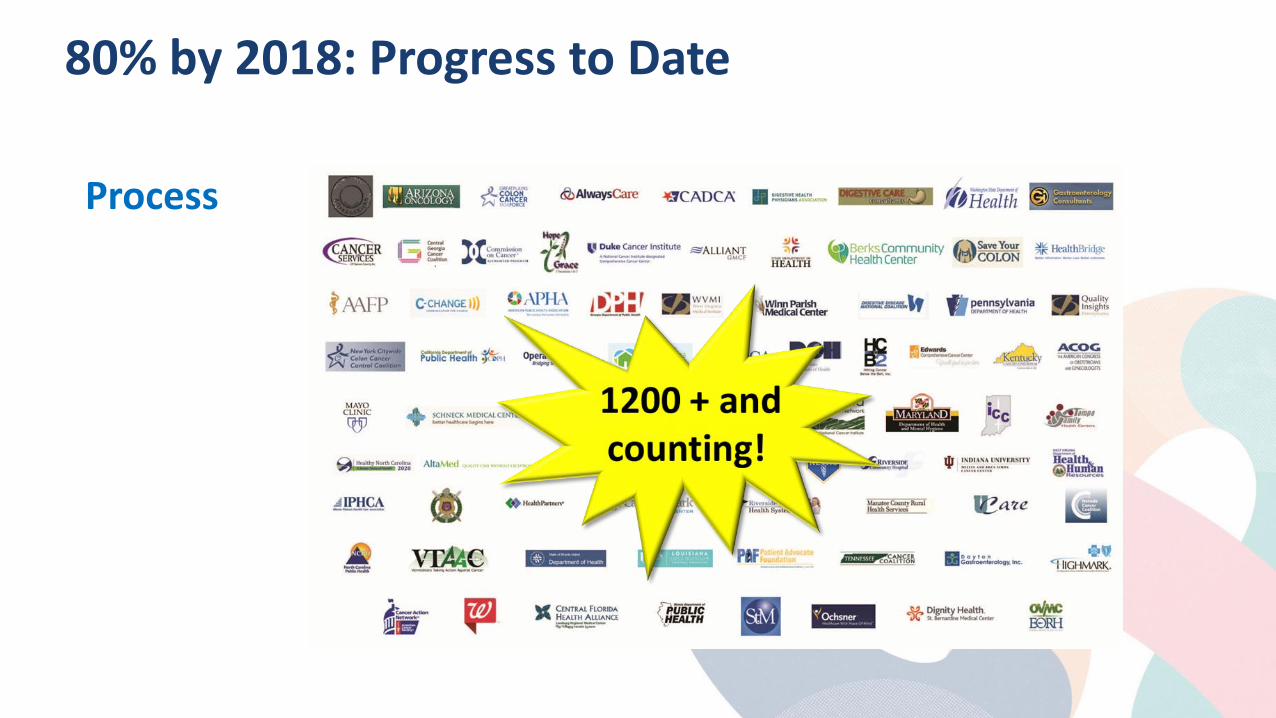
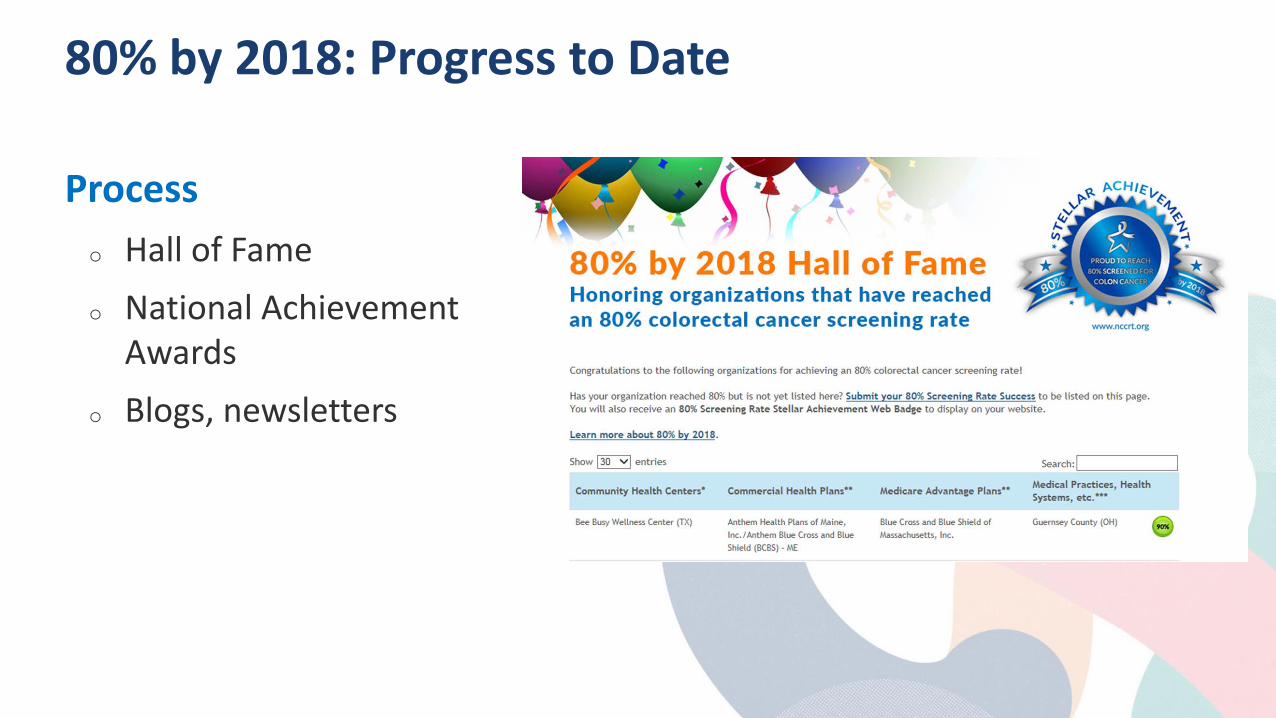
Process
80% by 2018: Progress to Date
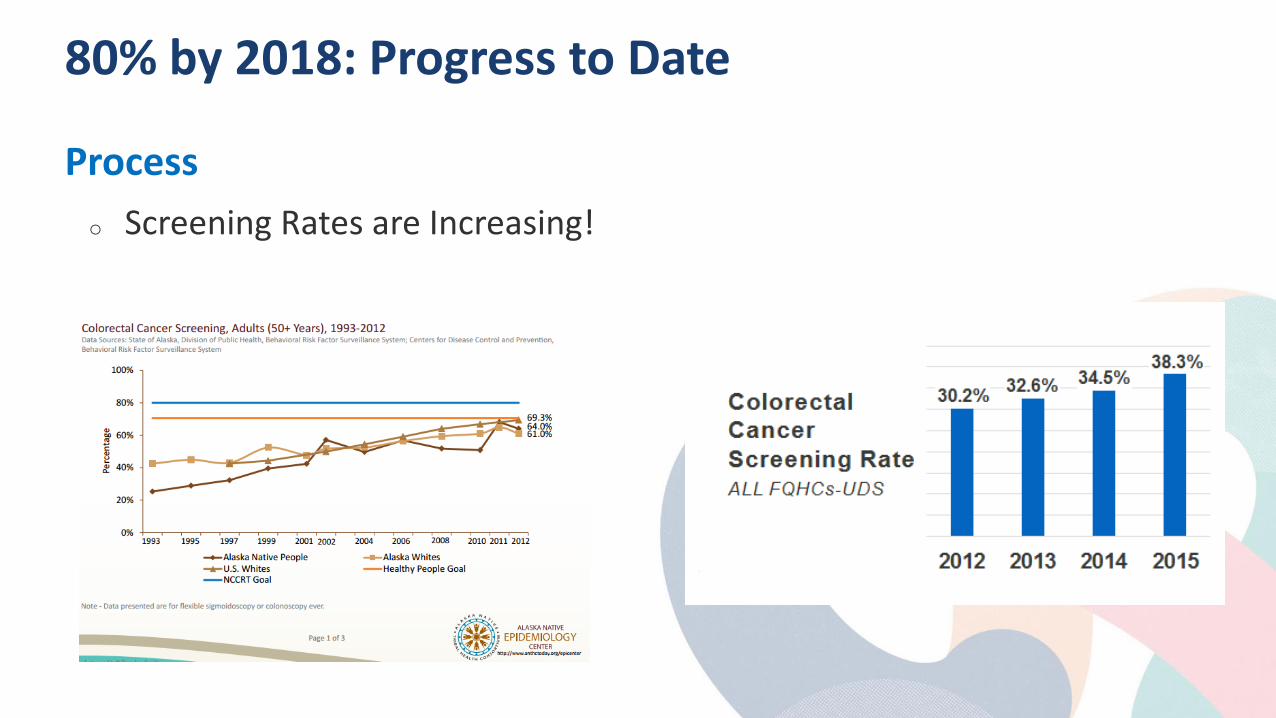
Process
o Screening Rates are Increasing!
80% by 2018: Progress to Date
Process
o Hall of Fame o National Achievement
Awards o Blogs, newsletters
80% by 2018: Next Steps
Process
o Pursuing financial support o Continue partner recruitment o New tools and resources for hospitals,
insurers, state coalitions, evaluation o Celebrate successes o Planning for 2019 and beyond –
maintaining the momentum

Colorectal Cancer Screening Panel Reflection – Key Learnings, Future Directions
Discussion Questions • What are the future directions in some of the regions not discussed?
• What steps need to be taken by a region/nation to plan and implement an effective screening initiative for their population?