Embed Size (px)
Citation preview
J. Hydrol. Hydromech., 61, 2013, 1, 50–63 DOI: 10.2478/johh-2013-0007
50
Combined proton NMR wideline and NMR relaxometry to study SOM-water interactions of cation-treated soils Gabriele E. Schaumann 1 *, Dörte Diehl 1, Marko Bertmer 2, Alexander Jaeger 2, Pellegrino Conte 3, Giuseppe Alonzo 3, Jörg Bachmann 4 1 University of Koblenz-Landau, Institute for Environmental Sciences, Department of Environmental and Soil Chemistry, Fortstr. 7, D-76829 Landau, Germany. 2 University of Leipzig, Faculty of Physics and Earth Sciences, Institute of Experimental Physics II, Linnéstr. 5, 04103 Leipzig, Germany. 3 Dipartimento dei Sistemi Agro-Ambientali, Università degli Studi di Palermo, v.le delle Scienze 13, ed. 4, 90128 Palermo, Italy. 4 Leibniz University Hannover, Institute of Soil Science, Herrenhaeuser Str. 2, D-30419 Hannover, Germany. * Corresponding author: Tel. +49-6341-280-31571. Fax +49-6341-280-31576. E-mail: [email protected]
Abstract: Focusing on the idea that multivalent cations affect SOM matrix and surface, we treated peat and soil samples by solutions of NaCl, CaCl2 or AlCl3. Water binding was characterized with low field 1H-NMR-relaxometry (20 MHz) and 1H wideline NMR spectroscopy (400 MHz) and compared to contact angles.
From 1H wideline, we distinguished mobile water and water involved in water molecule bridges (WaMB). Large part of cation bridges (CaB) between SOM functional groups are associated with WaMB. Unexpectedly, 1H NMR-relaxometry relaxation rates suggest that cross-linking in the Al-containing peat is not stronger than that by Ca.
The relation between percentage of mobile water and WaMB water in the context of wettability and 1H NMR relaxa-tion times confirms that wettability controls the water film surrounding soil particles. Wettability is controlled by WaMB-CaB associations fixing hydrophilic functional groups in the SOM interior. This can lead to severe water repel-lency. Wettability decreases with increasing involvement of functional groups in CaB-WaMB associations. The results demonstrate the relevance of CaB and WaMB for the dynamics of biogeochemical and hydrological processes under field conditions, as only a few percent of organic matter can affect the physical, chemical, and biological functioning of the entire 3-phase ecosystem.
Keywords: Soil organic matter (SOM); Low field 1H NMR relaxometry; 1H wideline NMR spectroscopy; Contact angle; Cation bridges; Water molecule bridges.
INTRODUCTION
In addition to soil physical characteristics based on pore space topology, the soil water contact angle controls further soil hydrological properties. In this context, numerous research activities have focused on the wettability of soils and the physi-cal and chemical reasons for the occurrence of soil water repel-lency. Soil water repellency is a world-wide phenomenon and significantly affects transport of water, nutrients and pollutants (Doerr et al., 2000). Reduced wettability is often linked with dryness of soil (Doerr and Thomas, 2000), pH effects (Diehl et al., 2010) and surface active compounds (Graber et al., 2007) and other factors (Doerr et al., 2000). Numerous studies have been carried out to unravel the relation between water content and soil water repellency in order to develop the conceptions of critical water content, actual and potential water repellency (Ritsema and Dekker, 1994). On the other hand, repellency showed one, sometimes even two repellency maxima at inter-mediate to small water contents between air-dried states and wilting points (King, 1981). De Jonge et al. showed significant influence of soil texture on soil water repellency (De Jonge et al., 1999).
Sample history was found to have additional impact on soil water repellency (Diehl and Schaumann, 2007; Hurraß and Schaumann, 2006), and changes in repellency are not fully reversible after rewetting (Bayer and Schaumann, 2007; Doerr and Thomas, 2000). The observation that equilibration time significantly affects the soil water contact (Diehl et al., 2009; Hurraß and Schaumann, 2007), showed that water content alone cannot explain changes in soil wettability.
Soil organic matter (SOM) contributes in considerable way to the biogeochemical interfaces in soil as it has been formed mainly by biological processes. It was identified as one of the most relevant factors affecting wettability of soil (Doerr et al., 2000). Although organic coatings on mineral particles or par-ticulate organic material are considered to be responsible for water repellency (Doerr et al., 2000), it has become evident that soil water repellency cannot be caused by single substances (Ma'shum et al., 1988). The amount of polar and non-polar functional groups in amphiphilic organic substances appears to be of great importance (Doerr et al., 2006). Microbial biofilms, for example, can affect the soil-water contact angle depending on the surface hydrophobicity of the bacterial cells (Schaumann et al., 2007). Furthermore, mechanisms inducing water repel-lency can vary between different soils and locations (Diehl and Schaumann, 2007; Diehl et al., 2010). In order to explain time- and history-dependent changes in surface characteristics, among others, conformational re-arrangement of amphiphilic molecules or molecule sections has been proposed (Diehl et al., 2009; Graber et al., 2009).
Although there is a consensus that the changes in surface properties are closely linked to SOM characteristics, the sug-gested processes do currently not form a model capable to predict changes in soil water contact angle. Deeper understand-ing on the functioning of SOM with respect to surface proper-ties is required. This deeper understanding requires knowledge of SOM structure. SOM has to be considered as a highly he-terogeneous and polydisperse mixture of organic compounds from different origins and various states of degradation (Schaumann, 2006a, b). Current models of SOM can neither
Soil organic matter – water interactions in cation-treated soils
51
predict nor fully explain the role SOM is playing with respect to soil water repellency. More research has been done on the relation between SOM structure, surface properties and sorption of organic chemicals. Ideas and models developed in this field of research can help to unravel the unknown relation between SOM structure and SOM surface characteristics in general. Polymer models (Leboeuf and Weber, 1997) were the first models suggested, which account for slow changes in SOM and their effect on sorption of organic chemicals and predict a con-nection between matrix aging and contaminant aging (Leboeuf and Weber, 1997). Although they do not explain yet changes in SOM surface characteristics, the polymer models are thus the first models implying that the SOM matrix is subjected to slow, continuous changes. They furthermore suggest a well-defined process in polymer chemistry, namely physical aging of poly-mers, to account for the slow changes observed in SOM.
Based on this model, relations between polymer characteris-tics (e.g., glass transition behavior) and sorption characteristics (e.g., sorption nonlinearity and hysteresis) have been searched, but direct relations to classical glass transition behavior and sorption remained rare especially for organic matter in soils (Schaumann, 2006a). This discrepancy may be explained by additional processes contributing to supramolecular structure and overbalancing the classical glass transitions (Schaumann, 2006a) or by the assumption that SOM does not consist of macromolecules but represents supramolecular associations of relatively small molecules (Conte and Piccolo, 1999; Wershaw, 1986). A review on models of SOM (Schaumann, 2006b) sug-gests that the combination of the apparently contradictory poly-meric and supramolecular views may help to improve our un-derstanding of structure and functioning of soil organic matter.
A supramolecular assembly is a multi-component system of ions and molecules which are held together by non-covalent interactions like hydrogen bonds, van der Waals forces, π-π interactions, or electrostatic effects. Supramolecular assemblies are usually far less stable than molecular compounds and could, therefore, be involved in slow, partially irreversible changes following changes in environmental conditions. Both supramo-lecular and polymer models are based on inter- and intra-molecular interactions and supramolecular structures rather than the individual molecular structure. They predict a signifi-cant flexibility of SOM in reaction on environmental condi-tions, which is much larger than that of any homogeneous ma-terial, resulting in an ecologically relevant power of SOM quality. The most relevant characteristics of SOM from this point of view are its polydispersivity and heterogeneity. Fur-thermore, large parts of SOM are amorphous, their structure is not in equilibrium, but changeable and dynamic, which in-volves SOM matrix aging, and dynamics are controlled by matrix rigidity and environmental conditions (moisture, tem-perature, physicochemical environment). Matrix rigidity is not only controlled by structural factors (e.g. aromaticity, chemical cross-links), but also by physical and physicochemical interac-tions between segments of OM molecules (Schaumann, 2006a, b).
A significant factor for matrix rigidity are cross-links between SOM molecule sections mediated by water molecules (Aquino et al., 2009; Schaumann and Leboeuf, 2005; Schau-mann and Bertmer, 2008), which currently is the only explana-tion accounting for the unexpected thermal and aging behavior of peat and numerous soil samples, or by mono- and multiva-lent cations (Kunhi Mouvenchery et al., 2012; Lu and Pignatel-lo, 2004; Schaumann, 2000). Formation and disruption of water molecule bridges or cation bridges may close or open sorption sites in soil organic matter and immobilize certain otherwise
unstable molecular arrangements at the surface. Numerous studies have concluded to this cross-linking effect (e.g., Simp-son et al., 2002; Lu and Pignatello, 2004). While increasing evidence has been gained supporting the water molecule bridge model (WaMB) on the molecular scale (Aquino et al., 2009; Schaumann and Bertmer, 2008), only lately, new findings about the nature of cation bridges (CaB) in SOM have been obtained. The CaB model is currently under discussion as summarized in the review paper of Kunhi Mouvenchery et al. (2012). The current research confirms that multivalent cations can form coordinative cross-links in SOM, but the status of these CaB is determined not only by the interaction between cations and functional groups, but also by the spatial arrangement of the functional groups in the OM matrix (Kunhi Mouvenchery et al., 2012). The observation that the cation effects on matrix rigidity increase with aging time over several months (Schneckenburger et al., 2012) suggests that the initial associations between CaB and WaMB increase in stability due to re-organisation of water molecules in the WaMB cluster, i.e., via physicochemical aging (Schaumann, 2005).
The existence of these supramolecular CaB-WaMB associa-tions still needs further verification by additional methods, which are capable to characterize soil-water interactions. 1H NMR relaxometry and 1H NMR wideline analysis, which have been introduced into soil science only recently (Jaeger et al., 2011; Jaeger et al., 2010; Schaumann et al., 2005), are among the most promising techniques regarding these ques-tions. A review on the potential and current applications of NMR relaxometry in soil science applications can be found in Bayer et al. (2010). NMR relaxometry is a sensitive method to study many kinds of physicochemical soil interactions, among which are wetting, swelling or changes in macromolecular status (Bayer et al., 2010). It is further a very helpful method to study interactions between molecules in soil organic matter and can serve to study the state of binding of water or organic chemicals to soil organic matter (Jaeger et al., 2010). 1H NMR relaxometry also may be a very helpful means to investigate the proposed WaMB and CaB models. By the method of 1H NMR relaxometry, the proton spins are manipulated and the recovery of equilibrium magnetization is observed, where the relaxation time is the time constant of this first order relaxation process. 1H NMR relaxometry, therefore, addresses water molecules or H-containing organic molecules. In this context, it can, among others, serve as a tool to study mobility of molecular segments in biopolymers as well as humic substances and soil organic matter (Bayer et al., 2010).
The relaxation times assessed in NMR relaxometry depend on numerous parameters like surface relaxivity, diffusion and interactions between nuclei as well as between nuclei and the environment. The longitudinal relaxation time (T1) describes the buildup of equilibrium magnetization in the direction of the external magnetic field due to energy exchange between the magnetic spins and the surrounding matrix. T1 can be either increased or decreased by a reduction in mobility, depending on the Larmor frequency and the correlation time for the relaxa-tion-relevant interaction (Dunn, 2002). In the solid state, a reduction in mobility increases T1 values.
Most solid-state NMR analyses of whole soil or SOM use 13C CPMAS (cross-polarization, magic-angle spinning (Schaefer and Stejskal, 1976)) or DPMAS (direct polarization) spectroscopy. Both techniques reveal differences among car-bon-containing functional groups that can be characterized (Conte et al., 2004; Smernik and Oades, 2001) and with precau-tions also carboxylic groups (Conte et al., 2002; Mao and Schmidt-Rohr, 2004).
Gabriele E. Schaumann et al.
52
Due to the effect of the homonuclear dipolar interaction, sol-id-state 1H NMR spectroscopy suffers from lower resolution compared to 13C NMR investigations. In fact, the strong proton-proton dipolar interactions in solids together with the small chemical shift range of 1H compared to 13C result in broad lines with limited resolution even at higher spinning speeds which prevent any detailed signal assignment. However, since our interest is mainly on the water, its mobility, and network ability in soils, 1H wideline NMR spectroscopy offers to be a good method for the analysis of soil water dynamics. In this case, there is no chemical shift resolution, but more importantly there is a clear differentiation of mobile and rigid protons because of their differences in homonuclear dipolar coupling. This offers for us the possibility to quantify the amount of mobile and rigid protons and to observe changes based on different external influences such as heat, varying conditioning steps, and differ-ent cations.
The objective of the study presented in this publication was to obtain deeper insights into the interactions between organic matter, cations and water molecules in order to understand the processes controlling SOM matrix properties on the supramo-lecular scale and relate them with effects on the soil water contact angle. Based on a joint experiment in the context of the German research priority program on biogeochemical interfaces in soils (SPP1315), this contribution is one of a larger series which has the objective to elucidate the role of multivalent cations in soils, gain mechanistic insights in the SOM-cation interactions and demonstrate the relation between processes occurring in the interior of SOM with the phenomena observed at the surface. In this study, we applied techniques of NMR relaxometry and NMR wideline spectroscopy to specifically investigate the hypothesis that water binding in SOM is con-trolled by CaB, WaMB and CaB-WaMB associations between individual SOM segments and that these supramolecular struc-tures control hydrophobicity at the surface. MATERIAL AND METHODS Site description and soil samples
For this methodical study, we chose a sapric peat sample and a sandy soil sample to have two samples with contrasting con-tents of organic matter. The sapric peat (SP) sample was taken from Totes Moor and revealed an organic carbon content of 53% and a cation exchange capacity of 123 mmolc kg-1. ”Totes Moor“ is located ~30 km north-west of Hannover and consists of peat bog areas and fen areas. The samples were taken from a profile above a drainage channel from a stronger decomposed sapric peat (SP) layer (> 30 cm) underlying an upper fibric peat layer (0–30 cm) with a lower degree of humification.
The sandy soil sample was taken from the Ah of a gleyic podzol from the Fuhrberger Feld, Lakwiese (LW), Fuhrberg, Lower Saxony, Germany. This sample contained 1.3% organic carbon and revealed a cation exchange capacity of 36 mmolc kg-1. “Fuhrberger Feld” is located ~30 km north of Hannover in a valley sand plain. The samples were taken from the top 20 cm. For further information please refer to Jaeger et al. (2011).
Samples were air-dried, homogenized whereby crusts and aggregates were gently destroyed using a spatula of stainless steel, sieved to < 2 mm, and stored for at least two weeks at 31% RH and 19°C to obtain a comparable water potential in all samples prior to cation treatment. Cation treatment was in this special study carried out without further adjustment of pH, because adjusting the pH would have affected the ion composi-tion, especially with regard to the monovalent cations. We,
therefore, expect to observe combined pH and cation effects in this study. In another upcoming study, we will investigate the cation effect at defined pH, expecting combined effects of monovalent and multivalent cations. Cation treatment
For cation treatment in this study, the samples were shaken for 3 hours with a solution to soil rate of 25 mL g-1 for SP and 10 mL g-1 for LW samples. The following solutions were used: Control: H2O demineralized, “H”: H2O dest. + 30 g Amber-lite®IR hydrogen form in gaze bags (PP-149/34) per 600 mL solution, “Na”: 0.01 M NaCl, “Ca”: 0.01 M CaCl2, “Al”: 0.01 M AlCl3. After shaking, samples were filtered with a Büchner funnel over filter paper circles (589/2, VWR) and dried at 25°C for 4 days. Aggregates and crusts developed during drying were gently destroyed with a spatula of stainless steel and samples thoroughly homogenized. Subsamples were subjected to an additional temperature treatment at 60°C (2*12 h) in 250 mL glass bottles with PP screw caps (DURAN, Germany). Thus, we obtained samples with no temperature pre-treatment (“25°C”) and samples additionally pre-treated at 60°C (“60°C” samples). After the sample treatment, all samples were stored isothermally at 20°C and 31% relative humidity for at least 8 weeks prior to measurement. Sample characteristics are sum-marized in Table 1.
The amount of NH4Cl exchangeable cations was determined by Tatjana Schneckenburger and Sören Thiele-Bruhn modify-ing the method of Trüby Aldinger (1989) by shaking 0.5–1.0 g of air-dry soil with 40 mL of 1 M NH4Cl for 2 h. The extracts were analyzed for Na, K, Mg, Ca, Fe, and Al using atomic absorption spectroscopy (AAS; Varian AA 240 FS, Darmstadt, Germany).
1H NMR relaxometry
NMR Relaxometry was conducted for all samples pretreated at 25°C. 1H relaxation times, T1, and their reciprocals, the re-laxation rate, R1, were acquired on a Stelar Spinmaster-FFC-2000 Fast-Field-Cycling Relaxometer (Stelar s.r.l., Mede, PV – Italy) at a constant temperature of 298 K. A non-prepolarizing sequence (De Pasquale et al., 2012; Kimmich and Anoardo, 2004) was applied for recording the evolution of the longitudi-nal magnetization at a value of the relaxation magnetic field (BRLX) corresponding to a larmour frequency (ωL) of 20 MHz for a period of time (τ) arrayed with 128 values, chosen in an exponential progression from 2.3 to 233 ms. The minimum measurable T1 is 3 ms. The exponential progression ensured the covering of the entire relaxation curve of interest. Finally, a 1H 90° pulse was used at the starting of the acquisition period contemporarily to an acquisition magnetic field (BACQ) corre-sponding to a ωL of 16.2 MHz. The observable magnetization was revealed as free induction decay (FID) with a time domain of 100 µs sampled with 512 points. 64 scans were accumulated. The Upen algorithm (UpenWin 1.03 (Borgia et al., 1998, 2000)) has been applied to obtain the T1 distribution curves at the 1H Larmor frequency of 20 MHz. The T1 distribution curves were exported to OriginPro 7.5 SR6 (Version 7.5885, OriginLab Corporation, Northampton, MA, USA) in order to perform deconvolution with Gaussian functions and to recover the different components giving rise to the longitudinal relaxa-tion time distributions. The number of Gaussian functions which were included in the deconvolution process without unreasonably increasing the number of parameters, were deter-mined by applying the Merit function analysis (Halle et al.
Soil organic matter – water interactions in cation-treated soils
53
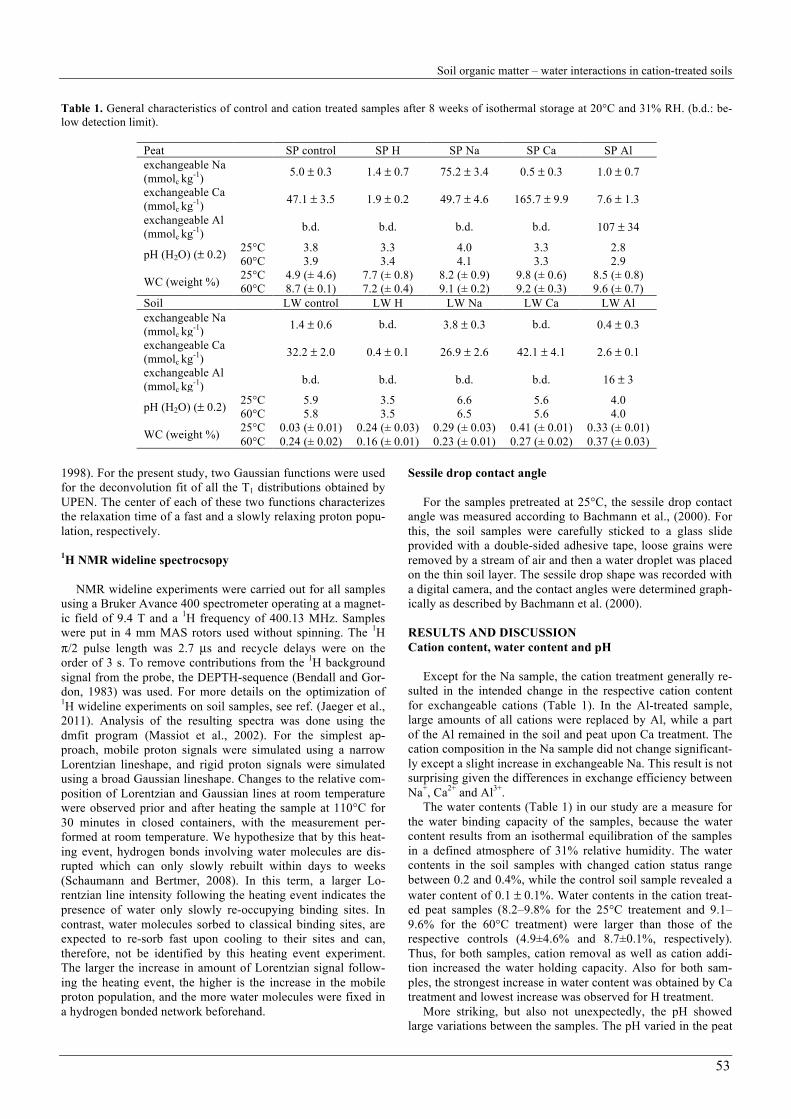
Table 1. General characteristics of control and cation treated samples after 8 weeks of isothermal storage at 20°C and 31% RH. (b.d.: be-low detection limit).
Peat SP control SP H SP Na SP Ca SP Al exchangeable Na (mmolc kg-1) 5.0 ± 0.3 1.4 ± 0.7 75.2 ± 3.4 0.5 ± 0.3 1.0 ± 0.7
exchangeable Ca (mmolc kg-1) 47.1 ± 3.5 1.9 ± 0.2 49.7 ± 4.6 165.7 ± 9.9 7.6 ± 1.3
exchangeable Al (mmolc kg-1) b.d. b.d. b.d. b.d. 107 ± 34
pH (H2O) (± 0.2) 25°C 3.8 3.3 4.0 3.3 2.8 60°C 3.9 3.4 4.1 3.3 2.9
WC (weight %) 25°C 4.9 (± 4.6) 7.7 (± 0.8) 8.2 (± 0.9) 9.8 (± 0.6) 8.5 (± 0.8) 60°C 8.7 (± 0.1) 7.2 (± 0.4) 9.1 (± 0.2) 9.2 (± 0.3) 9.6 (± 0.7)
Soil LW control LW H LW Na LW Ca LW Al exchangeable Na (mmolc kg-1) 1.4 ± 0.6 b.d. 3.8 ± 0.3 b.d. 0.4 ± 0.3
exchangeable Ca (mmolc kg-1) 32.2 ± 2.0 0.4 ± 0.1 26.9 ± 2.6 42.1 ± 4.1 2.6 ± 0.1
exchangeable Al (mmolc kg-1) b.d. b.d. b.d. b.d. 16 ± 3
pH (H2O) (± 0.2) 25°C 5.9 3.5 6.6 5.6 4.0 60°C 5.8 3.5 6.5 5.6 4.0
WC (weight %) 25°C 0.03 (± 0.01) 0.24 (± 0.03) 0.29 (± 0.03) 0.41 (± 0.01) 0.33 (± 0.01) 60°C 0.24 (± 0.02) 0.16 (± 0.01) 0.23 (± 0.01) 0.27 (± 0.02) 0.37 (± 0.03)
1998). For the present study, two Gaussian functions were used for the deconvolution fit of all the T1 distributions obtained by UPEN. The center of each of these two functions characterizes the relaxation time of a fast and a slowly relaxing proton popu-lation, respectively. 1H NMR wideline spectrocsopy
NMR wideline experiments were carried out for all samples using a Bruker Avance 400 spectrometer operating at a magnet-ic field of 9.4 T and a 1H frequency of 400.13 MHz. Samples were put in 4 mm MAS rotors used without spinning. The 1H π/2 pulse length was 2.7 µs and recycle delays were on the order of 3 s. To remove contributions from the 1H background signal from the probe, the DEPTH-sequence (Bendall and Gor-don, 1983) was used. For more details on the optimization of 1H wideline experiments on soil samples, see ref. (Jaeger et al., 2011). Analysis of the resulting spectra was done using the dmfit program (Massiot et al., 2002). For the simplest ap-proach, mobile proton signals were simulated using a narrow Lorentzian lineshape, and rigid proton signals were simulated using a broad Gaussian lineshape. Changes to the relative com-position of Lorentzian and Gaussian lines at room temperature were observed prior and after heating the sample at 110°C for 30 minutes in closed containers, with the measurement per-formed at room temperature. We hypothesize that by this heat-ing event, hydrogen bonds involving water molecules are dis-rupted which can only slowly rebuilt within days to weeks (Schaumann and Bertmer, 2008). In this term, a larger Lo-rentzian line intensity following the heating event indicates the presence of water only slowly re-occupying binding sites. In contrast, water molecules sorbed to classical binding sites, are expected to re-sorb fast upon cooling to their sites and can, therefore, not be identified by this heating event experiment. The larger the increase in amount of Lorentzian signal follow-ing the heating event, the higher is the increase in the mobile proton population, and the more water molecules were fixed in a hydrogen bonded network beforehand.
Sessile drop contact angle
For the samples pretreated at 25°C, the sessile drop contact angle was measured according to Bachmann et al., (2000). For this, the soil samples were carefully sticked to a glass slide provided with a double-sided adhesive tape, loose grains were removed by a stream of air and then a water droplet was placed on the thin soil layer. The sessile drop shape was recorded with a digital camera, and the contact angles were determined graph-ically as described by Bachmann et al. (2000). RESULTS AND DISCUSSION Cation content, water content and pH
Except for the Na sample, the cation treatment generally re-sulted in the intended change in the respective cation content for exchangeable cations (Table 1). In the Al-treated sample, large amounts of all cations were replaced by Al, while a part of the Al remained in the soil and peat upon Ca treatment. The cation composition in the Na sample did not change significant-ly except a slight increase in exchangeable Na. This result is not surprising given the differences in exchange efficiency between Na+, Ca2+ and Al3+.
The water contents (Table 1) in our study are a measure for the water binding capacity of the samples, because the water content results from an isothermal equilibration of the samples in a defined atmosphere of 31% relative humidity. The water contents in the soil samples with changed cation status range between 0.2 and 0.4%, while the control soil sample revealed a water content of 0.1 ± 0.1%. Water contents in the cation treat-ed peat samples (8.2–9.8% for the 25°C treatement and 9.1–9.6% for the 60°C treatment) were larger than those of the respective controls (4.9±4.6% and 8.7±0.1%, respectively). Thus, for both samples, cation removal as well as cation addi-tion increased the water holding capacity. Also for both sam-ples, the strongest increase in water content was obtained by Ca treatment and lowest increase was observed for H treatment.
More striking, but also not unexpectedly, the pH showed large variations between the samples. The pH varied in the peat
Gabriele E. Schaumann et al.
54
between 2.8 (Al sample) and 4.0 (Na sample), whereas in the soil, it ranged from 3.5 (H sample) to 6.6 (Na sample). In the pH range relevant for our samples, the phenolic groups re-mained predominantly protonated. The carboxylic groups, however, span a wide range in deprotonation status between the samples, from 6% (Al) to 50% (Na) in the peat samples and from 24% (H) to 100% (Na) in the soil sample (Fig. 1), assum-ing an average pKa of 4.0. In addition to interactions of metal cations with uncharged hydroxylic and phenolic groups, we, therefore, expect interactions involving both protonated and deprotonated carboxylic groups in different ratios, depending on the deprotonation status. Most strikingly the Al peat sample does not reveal significant amounts of carboxylate groups. In the soil samples, however, even the Al sample reveals 50% carboxylate groups. Relaxation time distributions and relaxation rates
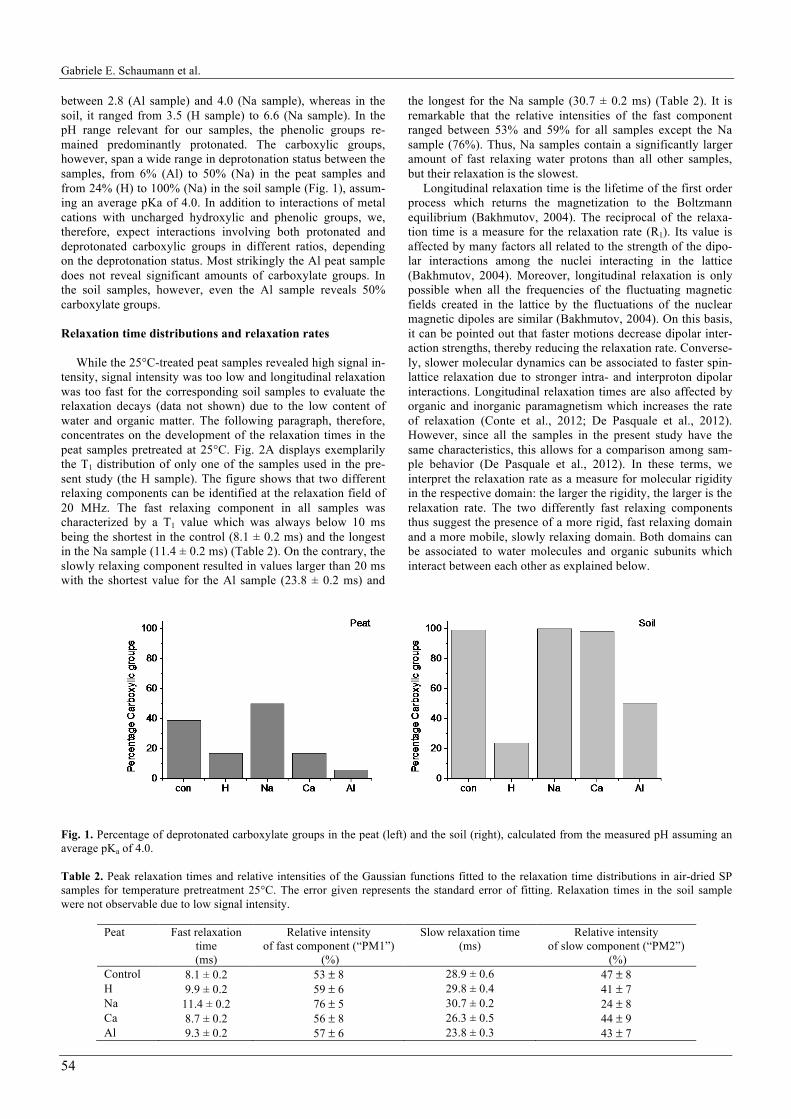
While the 25°C-treated peat samples revealed high signal in-tensity, signal intensity was too low and longitudinal relaxation was too fast for the corresponding soil samples to evaluate the relaxation decays (data not shown) due to the low content of water and organic matter. The following paragraph, therefore, concentrates on the development of the relaxation times in the peat samples pretreated at 25°C. Fig. 2A displays exemplarily the T1 distribution of only one of the samples used in the pre-sent study (the H sample). The figure shows that two different relaxing components can be identified at the relaxation field of 20 MHz. The fast relaxing component in all samples was characterized by a T1 value which was always below 10 ms being the shortest in the control (8.1 ± 0.2 ms) and the longest in the Na sample (11.4 ± 0.2 ms) (Table 2). On the contrary, the slowly relaxing component resulted in values larger than 20 ms with the shortest value for the Al sample (23.8 ± 0.2 ms) and
the longest for the Na sample (30.7 ± 0.2 ms) (Table 2). It is remarkable that the relative intensities of the fast component ranged between 53% and 59% for all samples except the Na sample (76%). Thus, Na samples contain a significantly larger amount of fast relaxing water protons than all other samples, but their relaxation is the slowest.
Longitudinal relaxation time is the lifetime of the first order process which returns the magnetization to the Boltzmann equilibrium (Bakhmutov, 2004). The reciprocal of the relaxa-tion time is a measure for the relaxation rate (R1). Its value is affected by many factors all related to the strength of the dipo-lar interactions among the nuclei interacting in the lattice (Bakhmutov, 2004). Moreover, longitudinal relaxation is only possible when all the frequencies of the fluctuating magnetic fields created in the lattice by the fluctuations of the nuclear magnetic dipoles are similar (Bakhmutov, 2004). On this basis, it can be pointed out that faster motions decrease dipolar inter-action strengths, thereby reducing the relaxation rate. Converse-ly, slower molecular dynamics can be associated to faster spin-lattice relaxation due to stronger intra- and interproton dipolar interactions. Longitudinal relaxation times are also affected by organic and inorganic paramagnetism which increases the rate of relaxation (Conte et al., 2012; De Pasquale et al., 2012). However, since all the samples in the present study have the same characteristics, this allows for a comparison among sam-ple behavior (De Pasquale et al., 2012). In these terms, we interpret the relaxation rate as a measure for molecular rigidity in the respective domain: the larger the rigidity, the larger is the relaxation rate. The two differently fast relaxing components thus suggest the presence of a more rigid, fast relaxing domain and a more mobile, slowly relaxing domain. Both domains can be associated to water molecules and organic subunits which interact between each other as explained below.
Fig. 1. Percentage of deprotonated carboxylate groups in the peat (left) and the soil (right), calculated from the measured pH assuming an average pKa of 4.0. Table 2. Peak relaxation times and relative intensities of the Gaussian functions fitted to the relaxation time distributions in air-dried SP samples for temperature pretreatment 25°C. The error given represents the standard error of fitting. Relaxation times in the soil sample were not observable due to low signal intensity.
Peat Fast relaxation time (ms)
Relative intensity of fast component (“PM1”)
(%)
Slow relaxation time (ms)
Relative intensity of slow component (“PM2”)
(%) Control 8.1 ± 0.2 53 ± 8 28.9 ± 0.6 47 ± 8 H 9.9 ± 0.2 59 ± 6 29.8 ± 0.4 41 ± 7 Na 11.4 ± 0.2 76 ± 5 30.7 ± 0.2 24 ± 8 Ca 8.7 ± 0.2 56 ± 8 26.3 ± 0.5 44 ± 9 Al 9.3 ± 0.2 57 ± 6 23.8 ± 0.3 43 ± 7
Soil organic matter – water interactions in cation-treated soils
55
Fig. 2. A Relaxation time distribution (T1) in peat, exemplarily for the 25°C-treated H sample, derived from Upen fitting of the relaxa-tion decay curve. The solid line demonstrates fitting with two Gaussian functions. Dashed lines indicate individual Gaussian functions. B Relaxation rates calculated from the peak position of the Gaussian fits (Table 2) for two Gaussian functions. Grey bars indicate the fast relaxing component and black bars indicate the slowly relaxing component. The error bars were calculated from the respective standard errors of fitting.
Fig. 2B visualizes the relaxation rate, R1, versus sample treatment for both the slowly and the fast relaxing components, respectively, of the 25°C treated samples. The rigidity associ-ated with the slowly relaxing component is lowest for the H and Na sample. Within the cation treatments, rigidity increases with increasing cation valency. Similarly, the fast relaxing compo-nent is higher for Al and Ca treatment than for Na treatment, but here, the cation free H sample also reveals considerably high rigidity. Thus, the two populations of water molecules react differently on cation removal, but comparably on cation addition.
1H wideline NMR
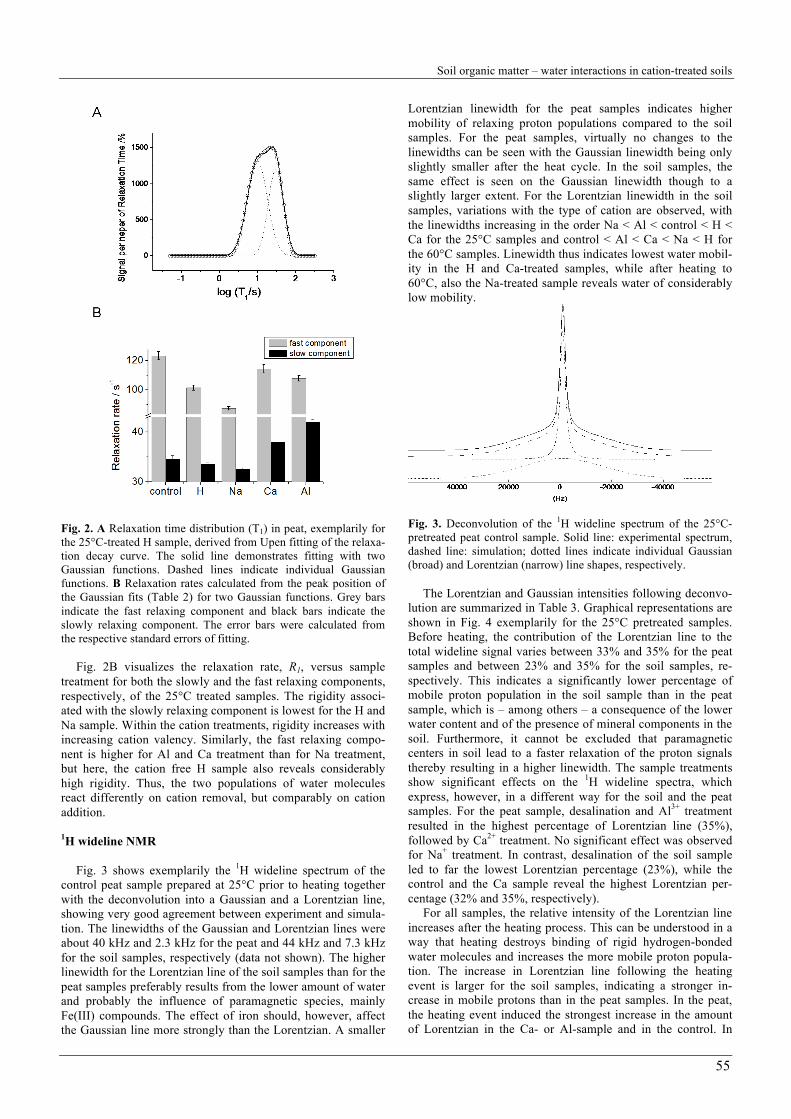
Fig. 3 shows exemplarily the 1H wideline spectrum of the control peat sample prepared at 25°C prior to heating together with the deconvolution into a Gaussian and a Lorentzian line, showing very good agreement between experiment and simula-tion. The linewidths of the Gaussian and Lorentzian lines were about 40 kHz and 2.3 kHz for the peat and 44 kHz and 7.3 kHz for the soil samples, respectively (data not shown). The higher linewidth for the Lorentzian line of the soil samples than for the peat samples preferably results from the lower amount of water and probably the influence of paramagnetic species, mainly Fe(III) compounds. The effect of iron should, however, affect the Gaussian line more strongly than the Lorentzian. A smaller
Lorentzian linewidth for the peat samples indicates higher mobility of relaxing proton populations compared to the soil samples. For the peat samples, virtually no changes to the linewidths can be seen with the Gaussian linewidth being only slightly smaller after the heat cycle. In the soil samples, the same effect is seen on the Gaussian linewidth though to a slightly larger extent. For the Lorentzian linewidth in the soil samples, variations with the type of cation are observed, with the linewidths increasing in the order Na < Al < control < H < Ca for the 25°C samples and control < Al < Ca < Na < H for the 60°C samples. Linewidth thus indicates lowest water mobil-ity in the H and Ca-treated samples, while after heating to 60°C, also the Na-treated sample reveals water of considerably low mobility.
Fig. 3. Deconvolution of the 1H wideline spectrum of the 25°C-pretreated peat control sample. Solid line: experimental spectrum, dashed line: simulation; dotted lines indicate individual Gaussian (broad) and Lorentzian (narrow) line shapes, respectively.
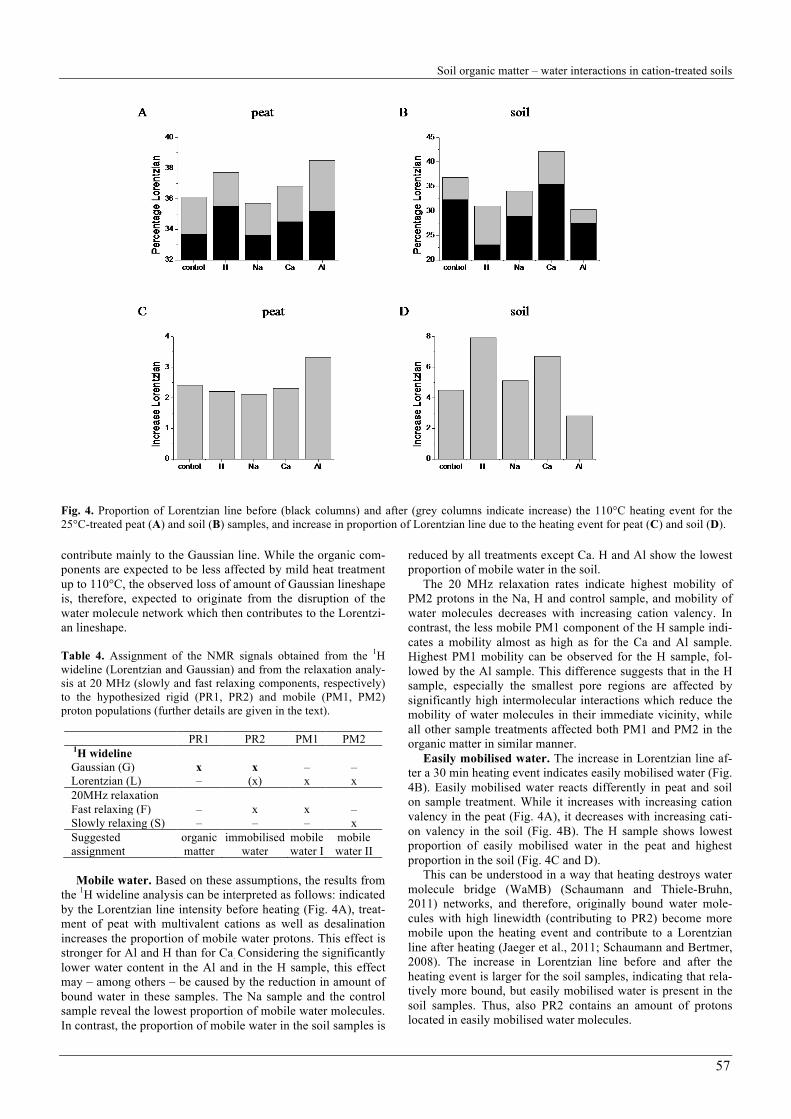
The Lorentzian and Gaussian intensities following deconvo-lution are summarized in Table 3. Graphical representations are shown in Fig. 4 exemplarily for the 25°C pretreated samples. Before heating, the contribution of the Lorentzian line to the total wideline signal varies between 33% and 35% for the peat samples and between 23% and 35% for the soil samples, re-spectively. This indicates a significantly lower percentage of mobile proton population in the soil sample than in the peat sample, which is – among others – a consequence of the lower water content and of the presence of mineral components in the soil. Furthermore, it cannot be excluded that paramagnetic centers in soil lead to a faster relaxation of the proton signals thereby resulting in a higher linewidth. The sample treatments show significant effects on the 1H wideline spectra, which express, however, in a different way for the soil and the peat samples. For the peat sample, desalination and Al3+ treatment resulted in the highest percentage of Lorentzian line (35%), followed by Ca2+ treatment. No significant effect was observed for Na+ treatment. In contrast, desalination of the soil sample led to far the lowest Lorentzian percentage (23%), while the control and the Ca sample reveal the highest Lorentzian per-centage (32% and 35%, respectively).
For all samples, the relative intensity of the Lorentzian line increases after the heating process. This can be understood in a way that heating destroys binding of rigid hydrogen-bonded water molecules and increases the more mobile proton popula-tion. The increase in Lorentzian line following the heating event is larger for the soil samples, indicating a stronger in-crease in mobile protons than in the peat samples. In the peat, the heating event induced the strongest increase in the amount of Lorentzian in the Ca- or Al-sample and in the control. In
Gabriele E. Schaumann et al.
56
contrast, the Al- treated soil and its control revealed the lowest increase in Lorentzian line among all cation treatments. Heat pretreatment at 60°C has almost no effect on the intensity of the Lorentzian line, except for the control and Ca soil sample where the intensity drops significantly by more than 4%. In this case, the heating event-induced increase in Lorentzian signal is strongest in the Ca-, Al- treated samples and the control (Table 3).
The deconvolution of 1H wideline spectra of peat and soil samples into just two lines is clearly an oversimplified strategy given the complicated composition of soil organic matter and is primarily based on the fact, that lineshapes in solids are by theory Gaussian and in liquids Lorentzian. A fit with more lines can be done, but it does not improve the quality of the fit (data not shown). Nevertheless, the clear differentiation of mobilities with strongly differing linewidths is striking by just looking at the spectra. Assignment of structural features to the NMR signals
It would be obvious that both the mobile proton population represented by the Lorentzian line in the 1H wideline spectra on the one hand, and the proton population contributing to the slowly relaxing component at 20 MHz on the other hand, are identical. If this assumption would match, the percentages of these two proton populations would correlate positively to each other. This is, however, not the case (data not shown). The reason is, that 1H wideline spectra at high field and low-field relaxation measurements probe different structures in soil or-ganic matter. While high-field spectra sample all protons (or at least most of them disregarding ultra-wideline 1H signals due to the deadtime problem), low-field relaxometry is less sensitive to rigid structures due to larger deadtime (> 150 µs, depending
on the instrumentation). Therefore, the two components present in the 20 MHz relaxometry measurements represent the popula-tion of the Lorentzian lineshape in the wideline spectra, alt-hough it cannot be excluded that relaxometry detects part of the protons from the Gaussian line. Assuming that each of the four signals Lorentzian (L), Gaussian (G), slowly relaxing pro-tons (S), fast relaxing protons (F) originate from the contribu-tion of proton populations with different mobility characteris-tics, we hypothesize the contribution of mobile proton popula-tions (PM) and rigid proton populations (PR) as shown in Table 4 and discussed below.
The Lorentzian line is strongly dominated by mobile proton populations with a degree of freedom comparable to liquids. We suggest interpreting these mobile proton populations (PM) as mobile (‘free’) water molecules. Additionally, from the organic matter – in principle – small molecule fragments or mobile sidechains such as methyl groups could also contribute to the Lorentzian line. However, 1H wideline and MAS spectra indicate only very small amounts of methyl groups (Jaeger et al., 2011). Although we cannot finally exclude additional con-tribution by mobile organic matter protons in PM to the 20 MHz relaxation process (Conte et al., 2009), we can reasonably assume that protons of mobile water molecules are mainly observed at 20 MHz due to the water content (from around 8 to 10% w/w, see Table 1). From the lineshape of the 20 MHz relaxation time distribution, we assume that two mobile proton populations contribute to the relaxation signals (PM1 and PM2, respectively). All other components in soil are too rigid to be observed at 20 MHz due to the dead time of the instrument allowing for smallest relaxation times of 3 ms. This means that the organic components of soil (PR1) and very rigid water molecules in hydrogen-bonded networks (PR2), are expected to
Table 3. Relative amounts of Gaussian and Lorentzian line from 1H wideline analysis for peat samples (± 0.1%) for the peat and for the soil.
Peat Before heating
After heating
Increase Lorentzian
(%) Gaussian
(%) Lorentzian
(%) Gaussian
(%) Lorentzian
(%)
Control 25 °C 66.3 33.7 63.9 36.1 2.4 60 °C 66.6 33.4 64.5 35.5 1.1
H 25C° 64.5 35.5 62.3 37.7 2.2 60 °C 64.8 35.2 62.8 37.2 2.0
Na 25 °C 66.4 33.6 64.3 35.7 2.1 60 °C 66.3 33.7 64.5 35.5 1.8
Ca 25 °C 65.5 34.5 63.2 36.8 2.3 60 °C 65.7 34.3 63.6 36.4 2.1
Al 25 °C 64.8 35.2 61.5 38.5 3.3 60 °C 65.1 34.9 62.4 37.6 2.7
Soil before heating after heating Increase Lorentzian
(%) Gaussian
(%) Lorentzian
(%) Gaussian
(%) Lorentzian
(%)
Control 25 °C 67.7 32.3 63.2 36.8 4.5 60 °C 71.8 28.2 67.5 32.5 4.3
H 25 °C 76.9 23.1 69.0 31.0 7.9 60 °C 75.4 24.6 71.5 28.5 3.9
Na 25 °C 71.1 28.9 66.0 34.0 5.1 60 °C 70.3 29.7 66.0 34.0 4.3
Ca 25 °C 64.6 35.4 57.9 42.1 6.7 60 °C 70.5 29.5 65.2 34.8 5.3
Al 25 °C 72.5 27.5 69.7 30.3 2.8 60 °C 73.1 26.9 68.5 31.5 4.6
Soil organic matter – water interactions in cation-treated soils
57
Fig. 4. Proportion of Lorentzian line before (black columns) and after (grey columns indicate increase) the 110°C heating event for the 25°C-treated peat (A) and soil (B) samples, and increase in proportion of Lorentzian line due to the heating event for peat (C) and soil (D). contribute mainly to the Gaussian line. While the organic com-ponents are expected to be less affected by mild heat treatment up to 110°C, the observed loss of amount of Gaussian lineshape is, therefore, expected to originate from the disruption of the water molecule network which then contributes to the Lorentzi-an lineshape. Table 4. Assignment of the NMR signals obtained from the 1H wideline (Lorentzian and Gaussian) and from the relaxation analy-sis at 20 MHz (slowly and fast relaxing components, respectively) to the hypothesized rigid (PR1, PR2) and mobile (PM1, PM2) proton populations (further details are given in the text).
PR1 PR2 PM1 PM2 1H wideline Gaussian (G) x x – – Lorentzian (L) – (x) x x 20MHz relaxation Fast relaxing (F) – x x – Slowly relaxing (S) – – – x Suggested assignment
organic matter
immobilised water
mobile water I
mobile water II
Mobile water. Based on these assumptions, the results from
the 1H wideline analysis can be interpreted as follows: indicated by the Lorentzian line intensity before heating (Fig. 4A), treat-ment of peat with multivalent cations as well as desalination increases the proportion of mobile water protons. This effect is stronger for Al and H than for Ca. Considering the significantly lower water content in the Al and in the H sample, this effect may – among others – be caused by the reduction in amount of bound water in these samples. The Na sample and the control sample reveal the lowest proportion of mobile water molecules. In contrast, the proportion of mobile water in the soil samples is
reduced by all treatments except Ca. H and Al show the lowest proportion of mobile water in the soil.
The 20 MHz relaxation rates indicate highest mobility of PM2 protons in the Na, H and control sample, and mobility of water molecules decreases with increasing cation valency. In contrast, the less mobile PM1 component of the H sample indi-cates a mobility almost as high as for the Ca and Al sample. Highest PM1 mobility can be observed for the H sample, fol-lowed by the Al sample. This difference suggests that in the H sample, especially the smallest pore regions are affected by significantly high intermolecular interactions which reduce the mobility of water molecules in their immediate vicinity, while all other sample treatments affected both PM1 and PM2 in the organic matter in similar manner.
Easily mobilised water. The increase in Lorentzian line af-ter a 30 min heating event indicates easily mobilised water (Fig. 4B). Easily mobilised water reacts differently in peat and soil on sample treatment. While it increases with increasing cation valency in the peat (Fig. 4A), it decreases with increasing cati-on valency in the soil (Fig. 4B). The H sample shows lowest proportion of easily mobilised water in the peat and highest proportion in the soil (Fig. 4C and D).
This can be understood in a way that heating destroys water molecule bridge (WaMB) (Schaumann and Thiele-Bruhn, 2011) networks, and therefore, originally bound water mole-cules with high linewidth (contributing to PR2) become more mobile upon the heating event and contribute to a Lorentzian line after heating (Jaeger et al., 2011; Schaumann and Bertmer, 2008). The increase in Lorentzian line before and after the heating event is larger for the soil samples, indicating that rela-tively more bound, but easily mobilised water is present in the soil samples. Thus, also PR2 contains an amount of protons located in easily mobilised water molecules.
Gabriele E. Schaumann et al.
58
PM1 and PM2 belong to water molecules with slightly dif-fering mobility as indicated by the slight differences in relaxa-tion rates. Such slight differences in mobility may arise from a differing degree in immobilization by hydrophilic functional groups or metal cations. We suggest that water molecules expe-riencing immobilization from more than one side, belong to PM1, while water molecules experiencing immobilization only from one side, belong to PM2. Water in the outer hydration shell of cations or of the outer WaMB region, which is not additionally linked to organic matter, therefore, is expected to contribute to PM2. For this water, we would expect a signifi-cant influence of hydration enthalpy of the metal cation or the functional groups. The higher the valence of the cation, the higher is the hydration enthalpy, the lower the mobility and the higher the relaxation rate. Relaxation rate is, further, expected to be lowest in the absence of cations. The results for the slow component shown in Fig. 2B match these expectations. The relaxation time of PM2 is, thus, not necessarily a measure for the rigidity of a system, but could also describe the classical behavior of water binding.
In contrast, water involved in bridging between organic mat-ter and cations or between two organic matter segments reveals two or more limits of freedom. It is, therefore, expected to be less mobile and to contribute to PM1, although not strongly bound to the binding centers or being located in some distance from them. This is nevertheless expected to result in higher relaxation rates due to the lower mobility. The mobility of such water molecules is expected to decrease with increasing spatial restriction from both sides and, the relaxation times could, therefore be interpreted as a measure for the rigidity of the microenvironment of the water molecules. Consequences for ion-organic matter interactions
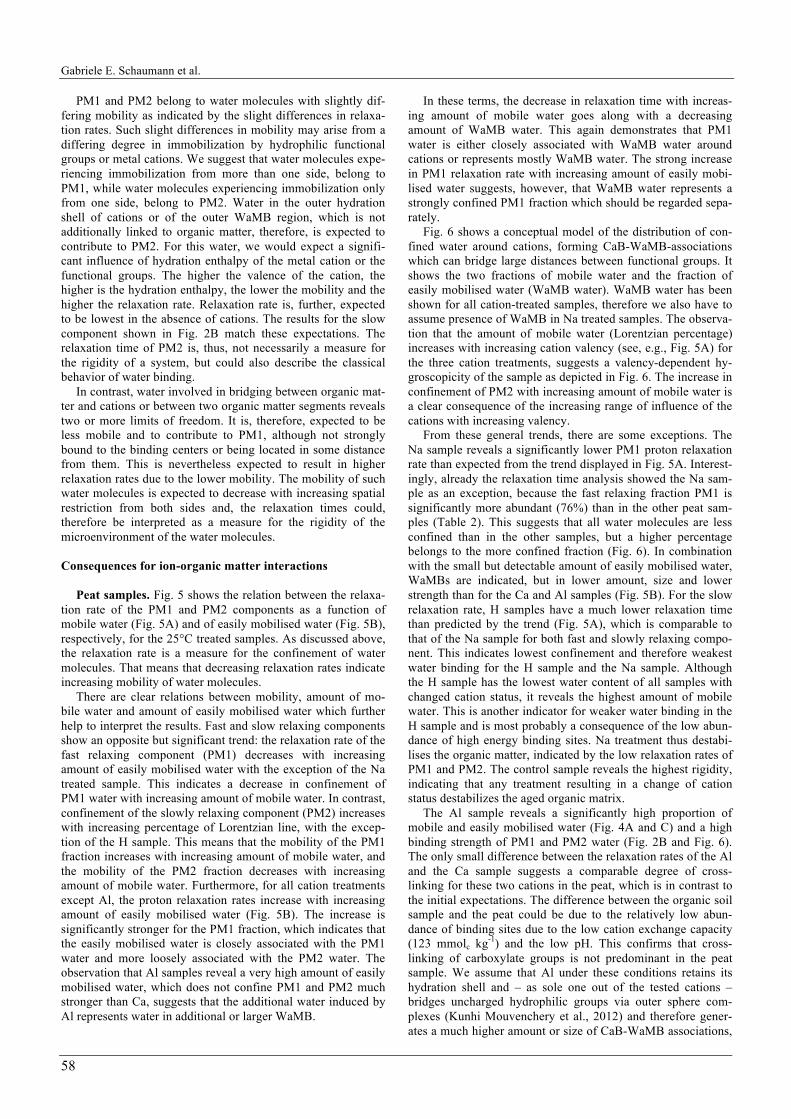
Peat samples. Fig. 5 shows the relation between the relaxa-tion rate of the PM1 and PM2 components as a function of mobile water (Fig. 5A) and of easily mobilised water (Fig. 5B), respectively, for the 25°C treated samples. As discussed above, the relaxation rate is a measure for the confinement of water molecules. That means that decreasing relaxation rates indicate increasing mobility of water molecules.
There are clear relations between mobility, amount of mo-bile water and amount of easily mobilised water which further help to interpret the results. Fast and slow relaxing components show an opposite but significant trend: the relaxation rate of the fast relaxing component (PM1) decreases with increasing amount of easily mobilised water with the exception of the Na treated sample. This indicates a decrease in confinement of PM1 water with increasing amount of mobile water. In contrast, confinement of the slowly relaxing component (PM2) increases with increasing percentage of Lorentzian line, with the excep-tion of the H sample. This means that the mobility of the PM1 fraction increases with increasing amount of mobile water, and the mobility of the PM2 fraction decreases with increasing amount of mobile water. Furthermore, for all cation treatments except Al, the proton relaxation rates increase with increasing amount of easily mobilised water (Fig. 5B). The increase is significantly stronger for the PM1 fraction, which indicates that the easily mobilised water is closely associated with the PM1 water and more loosely associated with the PM2 water. The observation that Al samples reveal a very high amount of easily mobilised water, which does not confine PM1 and PM2 much stronger than Ca, suggests that the additional water induced by Al represents water in additional or larger WaMB.
In these terms, the decrease in relaxation time with increas-ing amount of mobile water goes along with a decreasing amount of WaMB water. This again demonstrates that PM1 water is either closely associated with WaMB water around cations or represents mostly WaMB water. The strong increase in PM1 relaxation rate with increasing amount of easily mobi-lised water suggests, however, that WaMB water represents a strongly confined PM1 fraction which should be regarded sepa-rately.
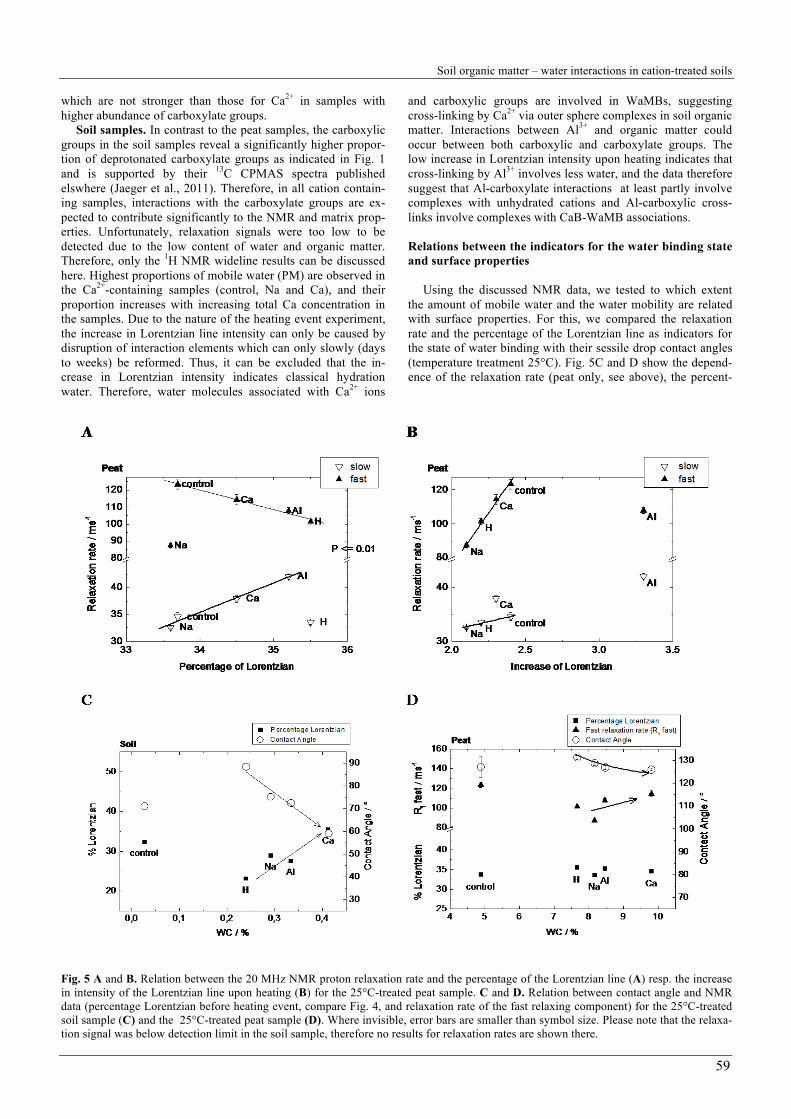
Fig. 6 shows a conceptual model of the distribution of con-fined water around cations, forming CaB-WaMB-associations which can bridge large distances between functional groups. It shows the two fractions of mobile water and the fraction of easily mobilised water (WaMB water). WaMB water has been shown for all cation-treated samples, therefore we also have to assume presence of WaMB in Na treated samples. The observa-tion that the amount of mobile water (Lorentzian percentage) increases with increasing cation valency (see, e.g., Fig. 5A) for the three cation treatments, suggests a valency-dependent hy-groscopicity of the sample as depicted in Fig. 6. The increase in confinement of PM2 with increasing amount of mobile water is a clear consequence of the increasing range of influence of the cations with increasing valency.
From these general trends, there are some exceptions. The Na sample reveals a significantly lower PM1 proton relaxation rate than expected from the trend displayed in Fig. 5A. Interest-ingly, already the relaxation time analysis showed the Na sam-ple as an exception, because the fast relaxing fraction PM1 is significantly more abundant (76%) than in the other peat sam-ples (Table 2). This suggests that all water molecules are less confined than in the other samples, but a higher percentage belongs to the more confined fraction (Fig. 6). In combination with the small but detectable amount of easily mobilised water, WaMBs are indicated, but in lower amount, size and lower strength than for the Ca and Al samples (Fig. 5B). For the slow relaxation rate, H samples have a much lower relaxation time than predicted by the trend (Fig. 5A), which is comparable to that of the Na sample for both fast and slowly relaxing compo-nent. This indicates lowest confinement and therefore weakest water binding for the H sample and the Na sample. Although the H sample has the lowest water content of all samples with changed cation status, it reveals the highest amount of mobile water. This is another indicator for weaker water binding in the H sample and is most probably a consequence of the low abun-dance of high energy binding sites. Na treatment thus destabi-lises the organic matter, indicated by the low relaxation rates of PM1 and PM2. The control sample reveals the highest rigidity, indicating that any treatment resulting in a change of cation status destabilizes the aged organic matrix.
The Al sample reveals a significantly high proportion of mobile and easily mobilised water (Fig. 4A and C) and a high binding strength of PM1 and PM2 water (Fig. 2B and Fig. 6). The only small difference between the relaxation rates of the Al and the Ca sample suggests a comparable degree of cross-linking for these two cations in the peat, which is in contrast to the initial expectations. The difference between the organic soil sample and the peat could be due to the relatively low abun-dance of binding sites due to the low cation exchange capacity (123 mmolc kg-1) and the low pH. This confirms that cross-linking of carboxylate groups is not predominant in the peat sample. We assume that Al under these conditions retains its hydration shell and – as sole one out of the tested cations – bridges uncharged hydrophilic groups via outer sphere com-plexes (Kunhi Mouvenchery et al., 2012) and therefore gener-ates a much higher amount or size of CaB-WaMB associations,
Soil organic matter – water interactions in cation-treated soils
59
which are not stronger than those for Ca2+ in samples with higher abundance of carboxylate groups.
Soil samples. In contrast to the peat samples, the carboxylic groups in the soil samples reveal a significantly higher propor-tion of deprotonated carboxylate groups as indicated in Fig. 1 and is supported by their 13C CPMAS spectra published elswhere (Jaeger et al., 2011). Therefore, in all cation contain-ing samples, interactions with the carboxylate groups are ex-pected to contribute significantly to the NMR and matrix prop-erties. Unfortunately, relaxation signals were too low to be detected due to the low content of water and organic matter. Therefore, only the 1H NMR wideline results can be discussed here. Highest proportions of mobile water (PM) are observed in the Ca2+-containing samples (control, Na and Ca), and their proportion increases with increasing total Ca concentration in the samples. Due to the nature of the heating event experiment, the increase in Lorentzian line intensity can only be caused by disruption of interaction elements which can only slowly (days to weeks) be reformed. Thus, it can be excluded that the in-crease in Lorentzian intensity indicates classical hydration water. Therefore, water molecules associated with Ca2+ ions
and carboxylic groups are involved in WaMBs, suggesting cross-linking by Ca2+ via outer sphere complexes in soil organic matter. Interactions between Al3+ and organic matter could occur between both carboxylic and carboxylate groups. The low increase in Lorentzian intensity upon heating indicates that cross-linking by Al3+ involves less water, and the data therefore suggest that Al-carboxylate interactions at least partly involve complexes with unhydrated cations and Al-carboxylic cross-links involve complexes with CaB-WaMB associations. Relations between the indicators for the water binding state and surface properties
Using the discussed NMR data, we tested to which extent the amount of mobile water and the water mobility are related with surface properties. For this, we compared the relaxation rate and the percentage of the Lorentzian line as indicators for the state of water binding with their sessile drop contact angles (temperature treatment 25°C). Fig. 5C and D show the depend-ence of the relaxation rate (peat only, see above), the percent-
Fig. 5 A and B. Relation between the 20 MHz NMR proton relaxation rate and the percentage of the Lorentzian line (A) resp. the increase in intensity of the Lorentzian line upon heating (B) for the 25°C-treated peat sample. C and D. Relation between contact angle and NMR data (percentage Lorentzian before heating event, compare Fig. 4, and relaxation rate of the fast relaxing component) for the 25°C-treated soil sample (C) and the 25°C-treated peat sample (D). Where invisible, error bars are smaller than symbol size. Please note that the relaxa-tion signal was below detection limit in the soil sample, therefore no results for relaxation rates are shown there.
Gabriele E. Schaumann et al.
60
Fig. 6. Conceptual model for the distribution of the three types of confined water in peat for the three cation treatments (Na+, Ca2+ and Al3+) derived from the relation between the proton NMR wideline spectroscopy, 1H-NMR-relaxometry and their dependence on the cation treat-ment. The different degrees of blue visualize different degrees of confinement. Direct WaMB water is the most confined water and occurs in the Gaussian line prior to heating and in the Lorentzian line after a heating event. PM1 water is water closely associated to WaMB water and still involved in the WaMB, while PM2 water acts as loosely bound hydration water. Amount of WaMB water decreases with increas-ing cation valency and the differentiation between PM1 and PM2 decreases with decreasing cation valency.
Fig. 7. Conceptual model of the different wetting situations and their relation with the situation in the inside of the organic matter. In the left cartoon, the blue ovals represent CaB-WaMB associations as described in Fig. 6, red lines mark hydrophobic regions of SOM and dark blue circles represent hydrophilic functional groups. CaB-WaMB associations fix hydrophilic functional groups in the interior of soil or-ganic matter and result in stronger exposure of hydrophobic regions to the outside of the organic matter. The situations in peat and soil differ with respect to the abundance of functional groups. A: In peat (hydrophobic surface), the low amount of functional groups are nearly completely involved in CaB-WaMB associations. B: In the soil sample, the degree of involvement of functional groups in such associa-tions, the size of WaMB and the degree of water binding depends on the amount and type of cation involved. Differences in contact angle can be due to either difference in the thickness of the surface water film (right) or due to the degree of coverage of the surface by water (left). Three situations are outlined in the left column: (a) cations binding strongly much water, resulting in large CaB-WaMB but low amount of mobile water (e.g., Al); (b) cations with small and weak CaB-WaMB (e.g., Na); (c) cations with only intermediately strongly water binding, but significantly large CaB-WaMB (e.g., Ca) contributing partly the water film. age of Lorentzian line before heating and the contact angle as a function of the actual water content for the soil sample and the peat sample, respectively. The initial soil-water contact angles, which were measured immediately after placing the droplet onto the surface, range from 60° to 90° for the soil samples and
from 127° to 131° for the peat sample. Wetting behavior of the soil samples can thus be classified as moderately water repel-lent to the transition to hydrophobicity at 90°, while the peat sample is severely water repellent.
Soil organic matter – water interactions in cation-treated soils
61
In the soil samples with changed cation status, the contact angle decreases significantly with increasing water content (P < 0.02), while the percentage of Lorentzian increases (P = 0.06). The relation between contact angle and percentage of Lorentzi-an is therefore also significant (P = 0.014). Thus, the wettability of the soil samples increases with increasing water content and increasing percentage of mobile water.
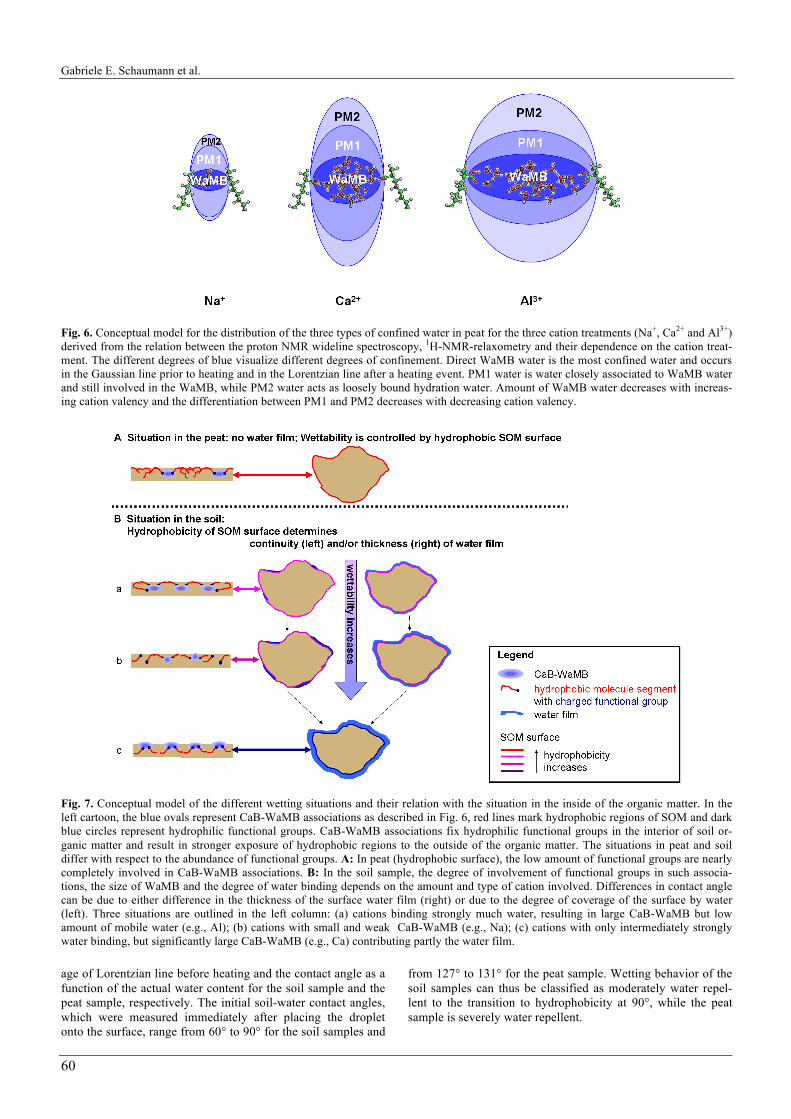
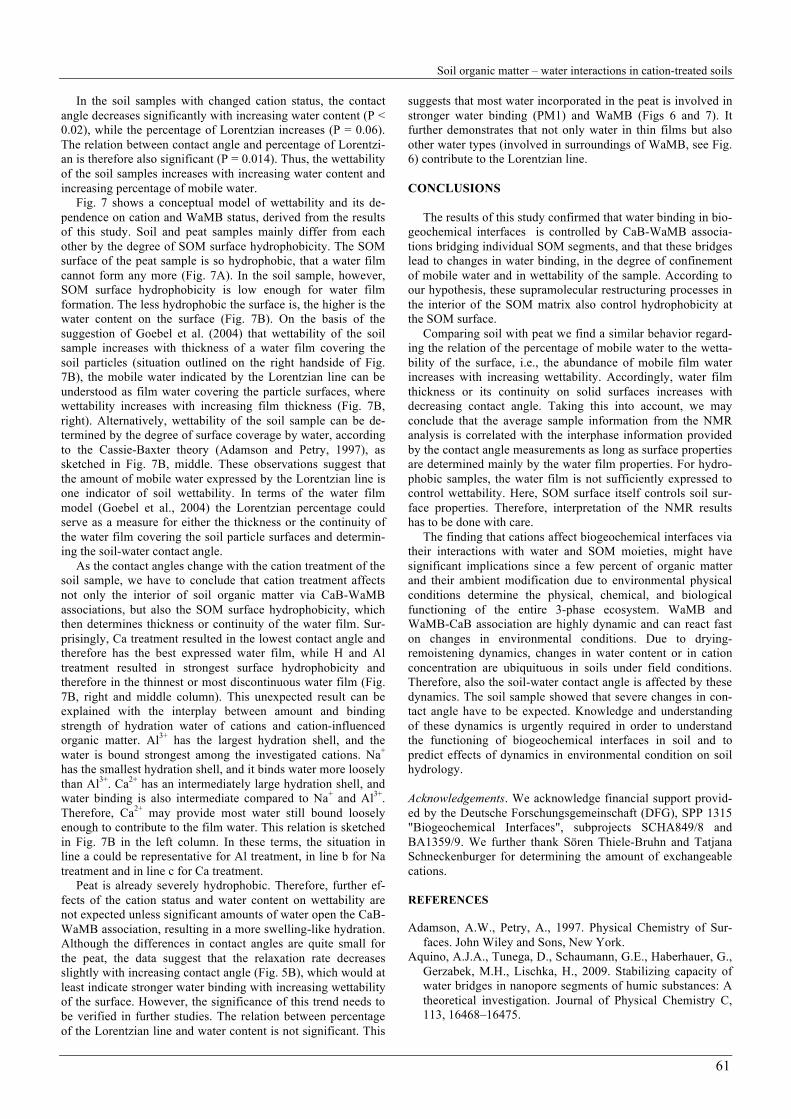
Fig. 7 shows a conceptual model of wettability and its de-pendence on cation and WaMB status, derived from the results of this study. Soil and peat samples mainly differ from each other by the degree of SOM surface hydrophobicity. The SOM surface of the peat sample is so hydrophobic, that a water film cannot form any more (Fig. 7A). In the soil sample, however, SOM surface hydrophobicity is low enough for water film formation. The less hydrophobic the surface is, the higher is the water content on the surface (Fig. 7B). On the basis of the suggestion of Goebel et al. (2004) that wettability of the soil sample increases with thickness of a water film covering the soil particles (situation outlined on the right handside of Fig. 7B), the mobile water indicated by the Lorentzian line can be understood as film water covering the particle surfaces, where wettability increases with increasing film thickness (Fig. 7B, right). Alternatively, wettability of the soil sample can be de-termined by the degree of surface coverage by water, according to the Cassie-Baxter theory (Adamson and Petry, 1997), as sketched in Fig. 7B, middle. These observations suggest that the amount of mobile water expressed by the Lorentzian line is one indicator of soil wettability. In terms of the water film model (Goebel et al., 2004) the Lorentzian percentage could serve as a measure for either the thickness or the continuity of the water film covering the soil particle surfaces and determin-ing the soil-water contact angle.
As the contact angles change with the cation treatment of the soil sample, we have to conclude that cation treatment affects not only the interior of soil organic matter via CaB-WaMB associations, but also the SOM surface hydrophobicity, which then determines thickness or continuity of the water film. Sur-prisingly, Ca treatment resulted in the lowest contact angle and therefore has the best expressed water film, while H and Al treatment resulted in strongest surface hydrophobicity and therefore in the thinnest or most discontinuous water film (Fig. 7B, right and middle column). This unexpected result can be explained with the interplay between amount and binding strength of hydration water of cations and cation-influenced organic matter. Al3+ has the largest hydration shell, and the water is bound strongest among the investigated cations. Na+ has the smallest hydration shell, and it binds water more loosely than Al3+. Ca2+ has an intermediately large hydration shell, and water binding is also intermediate compared to Na+ and Al3+. Therefore, Ca2+ may provide most water still bound loosely enough to contribute to the film water. This relation is sketched in Fig. 7B in the left column. In these terms, the situation in line a could be representative for Al treatment, in line b for Na treatment and in line c for Ca treatment.
Peat is already severely hydrophobic. Therefore, further ef-fects of the cation status and water content on wettability are not expected unless significant amounts of water open the CaB-WaMB association, resulting in a more swelling-like hydration. Although the differences in contact angles are quite small for the peat, the data suggest that the relaxation rate decreases slightly with increasing contact angle (Fig. 5B), which would at least indicate stronger water binding with increasing wettability of the surface. However, the significance of this trend needs to be verified in further studies. The relation between percentage of the Lorentzian line and water content is not significant. This
suggests that most water incorporated in the peat is involved in stronger water binding (PM1) and WaMB (Figs 6 and 7). It further demonstrates that not only water in thin films but also other water types (involved in surroundings of WaMB, see Fig. 6) contribute to the Lorentzian line. CONCLUSIONS
The results of this study confirmed that water binding in bio-geochemical interfaces is controlled by CaB-WaMB associa-tions bridging individual SOM segments, and that these bridges lead to changes in water binding, in the degree of confinement of mobile water and in wettability of the sample. According to our hypothesis, these supramolecular restructuring processes in the interior of the SOM matrix also control hydrophobicity at the SOM surface.
Comparing soil with peat we find a similar behavior regard-ing the relation of the percentage of mobile water to the wetta-bility of the surface, i.e., the abundance of mobile film water increases with increasing wettability. Accordingly, water film thickness or its continuity on solid surfaces increases with decreasing contact angle. Taking this into account, we may conclude that the average sample information from the NMR analysis is correlated with the interphase information provided by the contact angle measurements as long as surface properties are determined mainly by the water film properties. For hydro-phobic samples, the water film is not sufficiently expressed to control wettability. Here, SOM surface itself controls soil sur-face properties. Therefore, interpretation of the NMR results has to be done with care.
The finding that cations affect biogeochemical interfaces via their interactions with water and SOM moieties, might have significant implications since a few percent of organic matter and their ambient modification due to environmental physical conditions determine the physical, chemical, and biological functioning of the entire 3-phase ecosystem. WaMB and WaMB-CaB association are highly dynamic and can react fast on changes in environmental conditions. Due to drying-remoistening dynamics, changes in water content or in cation concentration are ubiquituous in soils under field conditions. Therefore, also the soil-water contact angle is affected by these dynamics. The soil sample showed that severe changes in con-tact angle have to be expected. Knowledge and understanding of these dynamics is urgently required in order to understand the functioning of biogeochemical interfaces in soil and to predict effects of dynamics in environmental condition on soil hydrology. Acknowledgements. We acknowledge financial support provid-ed by the Deutsche Forschungsgemeinschaft (DFG), SPP 1315 "Biogeochemical Interfaces", subprojects SCHA849/8 and BA1359/9. We further thank Sören Thiele-Bruhn and Tatjana Schneckenburger for determining the amount of exchangeable cations. REFERENCES Adamson, A.W., Petry, A., 1997. Physical Chemistry of Sur-
faces. John Wiley and Sons, New York. Aquino, A.J.A., Tunega, D., Schaumann, G.E., Haberhauer, G.,
Gerzabek, M.H., Lischka, H., 2009. Stabilizing capacity of water bridges in nanopore segments of humic substances: A theoretical investigation. Journal of Physical Chemistry C, 113, 16468–16475.
Gabriele E. Schaumann et al.
62
Bachmann, J., Horton, R., Van Der Ploeg, R.R. and Woche, S. 2000. Modified sessile drop method for assessing initial soil-water contact angle of sandy soil. Soil Science Society of America Journal, 64, 564–567.
Bakhmutov, V.I., 2004. Pratical NMR Relaxation for Chemists. John Wiley & Sons Ltd, Chichester, West Sussex, UK.
Bayer, J.V., Schaumann, G.E., 2007. Development of soil water repellency in the course of isothermal drying and upon pH changes in two urban soils. Hydrological Processes, 21, 2266–2275.
Bayer, J.V., Jaeger, F., Schaumann, G.E., 2010. Proton nuclear magnetic resonance (NMR) relaxometry in soil science ap-plications. The Open Magnetic Resonance Journal, 3, 15–26.
Bendall, M.R., Gordon, R.E., 1983. Depth and refocusing Puls-es Designed For Multipulse NMR with Surface Coils. Jour-nal of Magnetic Resonance, 53, 365–385.
Borgia, G.C., Brown, R.J.S., Fantazzini, P., 1998. Uniform-penalty inversion of multiexponential decay data. Journal of Magnetic Resonance, 132, 65–77.
Borgia, G.C., Brown, R.J.S., Fantazzini, P., 2000. Uniform-penalty inversion of multiexponential decay data: II. Data spacing, T2 data, systematic data errors, and diagnostics. Journal of Magnetic Resonance, 147, 273–285.
Conte, P., Piccolo, A., 1999. Conformational arrangement of dissolved humic substances. Influence of solution composi-tion on association of humic molecules. Environmental Sci-ence and Technology, 33, 1682–1690.
Conte, P., Spaccini, R., Piccolo, A., 2004. State of the art of CPMAS 13C-NMR spectroscopy applied to natural organic matter. Progress in Nuclear Magnetic Resonance Spectros-copy, 44, 215–223.
Conte, P., Bubici, S., Palazzolo, E., Alonzo, G., 2009. Solid-State H-1-NMR Relaxation Properties of the Fruit of a Wild Relative of Eggplant at Different Proton Larmor Frequen-cies. Spectroscopy Letters, 42, 235–239.
Conte, P., Piccolo, A., Van Lagen, B., Buurman, P., Hem-minga, M.A., 2002. Elemental quantitation of natural or-ganic matter by CPMAS 13C NMR Spectroscopy. Solid State Nuclear Magnetic Resonance, 21, 158–170.
Conte, P., Marsala, V., De Pasquale, C., Bubici, S., Valagussa, M., Pozzi, A., Alonzo, G., 2012. Nature of water-biochar in-terface interactions. GCB Bioenergy, online first, 10.1111/gcbb.12009.
De Jonge, L.W., Jacobsen, O.H., Moldrup, P. 1999. Soil water repellency: Effects of water content, temperature, and parti-cle size. Soil Science Society of America Journal, 63, 437– –442.
De Pasquale, C., Marsala, V., Berns, A.E., Valagussa, M., Pozzi, A., Alonzo, G., Conte, P., 2012. Fast field cycling NMR relaxometry characterization of biochars obtained from an industrial thermochemical process. Journal of Soils and Sediments, 12, 1211–1221.
Diehl, D., Schaumann, G.E., 2007. The nature of wetting on urban soil samples: wetting kinetics and evaporation as-sessed from sessile drop shape. Hydrological Processes, 21, 2255–2265.
Diehl, D., Ellerbrock, R.H., Schaumann, G.E., 2009. DRIFT-Spectroscopy of untreated and dried soil samples of different wettability. European Journal of Soil Science, 60, 557–566.
Diehl, D., Bayer, J.V., Woche, S.K., Bryant, R., Doerr, S.H., Schaumann, G.E., 2010. Reaction of soil water repellency on artificially induced changes in soil pH. Geoderma, 158, 375––384.
Doerr, S.H., Thomas, A.D., 2000. The role of soil moisture in controlling water repellency: new evidence from forest soils in Portugal. Journal of Hydrology, 231-232, 134–147.
Doerr, S.H., Shakesby, S.H., Walsh, R.P.D., 2000. Soil water repellency: its causes, characteristics and hydro-geomorphological significance. Earth-Science Reviews, 51, 33–65.
Doerr, S.H., Shakesby, R.A., Dekker, L.W., Ritsema, C.J., 2006. Occurrence, prediction and hydrological effects of wa-ter repellency amongst major soil and land-use types in a humid temperate climate. European Journal of Soil Science, 57, 741–754.
Dunn, K.J. 2002. Enhanced transverse relaxation in porous media due to internal field gradients. Journal of Magnetic Resonance, 156, 171–180.
Goebel, M.-O., Bachmann, J., Woche, S.K., Fischer, W.R., Horton, R., 2004. Water potential and aggregate size effects on contact angle and surface energy. Soil Science Society of America Journal, 68, 383–393.
Graber, E.R., Tagger, S., Wallach, R., 2007. Do surface active substances from water repellent soils aid wetting? European Journal of Soil Science, 58, 1393–1399.
Graber, E.R., Tagger, S., Wallach, R., 2009. Role of divalent fatty acid salts in soil water repellency. Soil Science Society of America Journal, 73, 541–549.
Halle, B., Johannesson, H., Venu, K., 1998. Model-Free Analy-sis of stretched relaxation dispersions. Journal of Magnetic Resonance, 135, 1–13.
Hurraß, J., Schaumann, G.E., 2006. Properties of soil organic matter and aqueous extracts of actually water repellent and wettable soil samples. Geoderma, 132, 222–239.
Hurraß, J. Schaumann, G.E., 2007. Influence of the sample history and the moisture status on the thermal behavior of soil organic matter. Geochimica et Cosmochimica Acta, 71, 691–702.
Jaeger, A., Schaumann, G.E., Bertmer, M., 2011. Optimized NMR spectroscopic strategy to characterize water dynamics in soil samples. Organic Geochemistry, 42, 917–925.
Jaeger, F., Shchegolikhina, A., Vanas, H., Schaumann, G.E., 2010. Proton NMR relaxometry as a useful tool to evaluate swelling processes in peat soils. The Open Magnetic Reso-nance Journal, 3, 27–45.
Kimmich, R., Anoardo, E., 2004. Field-cycling NMR relaxo-metry. Progress in Nuclear Magnetic Resonance Spectrosco-py, 44, 257–320.
King, P.M., 1981. Comparison of methods for measuring sever-ity of water repellence of sandy soils and assessment of some factors that affect its measurement. Australian Journal of Soil Research, 19, 275–285.
Kunhi Mouvenchery, Y., Kučerík, J., Diehl, D., Schaumann, G.E., 2012. Cation-mediated cross-linking in natural organic matter – a review. Reviews in Environmental Science and Bio/technology, 11, 41–54.
Leboeuf, E.J., Weber, W.J., 1997. A distributed reactivity mod-el for sorption by soils and sediments. 8. Sorbent organic domains: discovery of a humic acid glass transition and an argument for a polymer-based model. Environmental Sci-ence and Technology, 31, 1697–1702.
Lu, Y., Pignatello, J.J., 2004. Sorption of apolar aromatic com-pounds to soil humic acid particles affected by aluminum (III) ion cross-linking. Journal of Environmental Quality, 33, 1314–1321.
Ma'shum, M., Tate, M.E., Jones, G.P., Oades, J.M. 1988. Ex-traction and characterization of water-repellent material
Soil organic matter – water interactions in cation-treated soils
63
from Australian soils. European Journal of Soil Science, 39, 99–110.
Mao, J.D., Schmidt-Rohr, K. 2004. Accurate quantification of aromaticity and nonprotonated aromatic carbon fraction in natural organic matter by 13C solid-state nuclear magnetic resonance. Environmental Science and Technology, 38, 2680–2684.
Massiot, D., Fayon, F., Capron, M., King, I., Le Calve, S., Alonso, B., Durand, J.O., Bujoli, B., Gan, Z.H., Hoatson, G., 2002. Modelling one- and two-dimensional solid-state NMR spectra. Magnetic Resonance in Chemistry, 40, 70–76.
Ritsema, C.J., Dekker, L.W., 1994. Soil moisture and dry bulk density patterns in bare dune sands. Journal of Hydrology, 154, 107–131.
Schaefer, J., Stejskal, E.O., 1976. Carbon-13 nuclear magnetic-resonance of polymers spinning at magic angle. Journal of the American Chemical Society, 98, 1031–1032.
Schaumann, G.E., 2000. Effect of CaCl2 on the kinetics of the release of dissolved organic matter (DOM). Journal of Plant Nutrition and Soil Science, 163, 523–529.
Schaumann, G.E., 2005. Matrix relaxation and change of water state during hydration of peat. Colloids and Surfaces A: Physicochemical and Engineering Aspects, 265, 163–170.
Schaumann, G.E., 2006a. Soil organic matter beyond molecular structure. 2. Amorphous nature and physical aging. Journal of Plant Nutrition and Soil Science, 169, 157–167.
Schaumann, G.E. 2006b. Soil organic matter beyond molecular structure. 1. Macromolecular and supramolecular character-istics. Journal of Plant Nutrition and Soil Science, 169, 145––156.
Schaumann, G.E., Leboeuf, E.J., 2005. Glass transitions in peat – their relevance and the impact of water. Environmental Science and Technology, 39, 800–806.
Schaumann, G.E., Bertmer, M., 2008. Do water molecules bridge soil organic matter molecule segments? European Journal of Soil Science, 59, 423–429.
Schaumann, G.E., Thiele-Bruhn, S., 2011. Molecular modelling of soil organic matter: Squaring the circle? Geoderma, 169, 55–68.
Schaumann, G.E., Hobley, E., Hurraß, J., Rotard, W., 2005. H-NMR relaxometry to monitor wetting and swelling kinetics in high organic matter soils. Plant and Soil, 275, 1–20.
Schaumann, G.E., Braun, B., Kirchner, D., Rotard, W., Szewzyk, U., Grohmann, E., 2007. Influence of biofilms on the water repellency of urban soil samples. Hydrological processes, 21, 2276–2284.
Schneckenburger, T., Schaumann, G.E., Woche, S.K., Thiele-Bruhn, S., 2012. Short-term evolution of hydration effects on soil organic matter properties and resulting implications for sorption of naphthalene-2-ol. Journal of Soils and Sedi-ments, 12, 1269–1279.
Simpson, A.J., Kingery, W.L., Hayes, M.H.B., Spraul, M., Humpfer, E., Dvortsak, P., Kerssebaum, R., Godejohann, M., Hofmann, M., 2002. Molecular structures and associa-tions of humic substances in the terrestrial environment. Naturwissenschaften, 89, 84–88.
Smernik, R.J., Oades, J.M., 2001. Background signal in solid state C-13 NMR spectra of soil organic matter (SOM) – Quantification and minimization. Solid State Nuclear Mag-netic Resonance, 20, 74–84.
Trüby, P., Aldinger, E., 1989. Eine Methode zur Bestimmung austauschbarer Kationen in Waldböden. Zeitschrift für Pflanzenernährung und Bodenkunde, 152, 301–306.
Wershaw, R.L. 1986. A new model for humic materials and their interactions with hydrophobic organic chemicals in soil-water or sediment-water systems. Journal of Contami-nant Hydrology, 1, 29–45.
Received 5 November 2012
Accepted 10 January 2013
Note: Colour version of Figures 6 and 7 can be found in the web version of this article.