Embed Size (px)
Citation preview
COMBINED STRESS BEHAVIOR OF STRUCTURAL
GLAZING JOINTS
By L. Bogue Sandberg,1 Member, ASCE, and Theresa M. Ahlborn2
ABSTRACT: Specimens simulating silicone bonded structural glazing joints were tested to failure under combinations of tensile and shear displacement. Tension, shear, and moment resultants in the joint specimens were monitored throughout each test. To account for glass edge rotation effects, joints were also tested in the same manner with the addition of a relatively large preset rotation. Tests were conducted at three joint depth-to-width ratios, spanning the range typically encountered in practice. The results of these tests were used to develop interaction relationships for ultimate strength and displacement. The interaction between nominal tensile and shear stresses at failure is elliptical. Differences between the three depth-to-width ratios, on a stress basis, were minor. The corresponding interaction for ultimate displacements is approximately linear. Glass edge rotation effects, within typical practical limits, are negligible. Measured bending moments remained small during all testing, apparently as a result of a moment balance between the tension and shear forces acting on the deformed specimen geometry.
INTRODUCTION
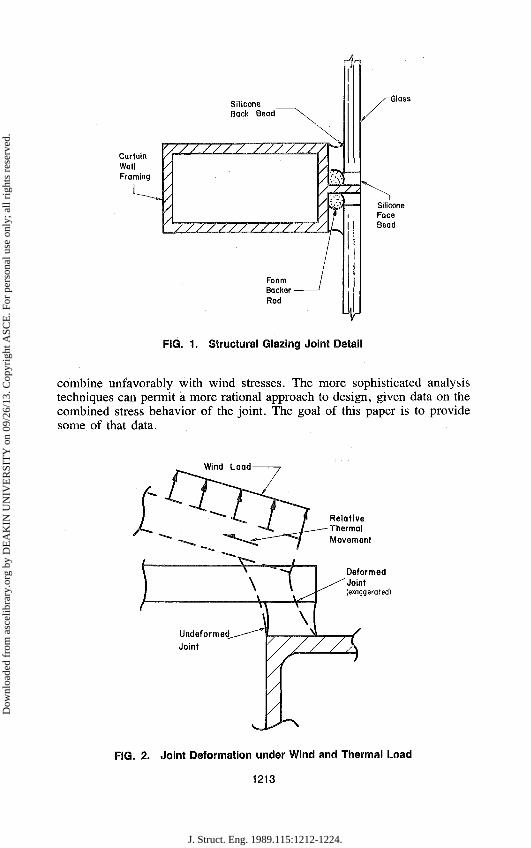
Structural glazing is a method of attaching panels of glass (and occasionally other materials) to the curtain walls of a building. The glass is held in place by a silicone elastomeric adhesive/sealant. The adhesive joint must resist the loads acting on the glass, with negative wind load being the most critical. Since the joint must also absorb differential thermal movements, it is designed to be quite flexible. Fig. 1 shows a typical joint detail. Here the back bead is the primary structural joint. Because of its much lower relative stiffness, the face bead contributes relatively little to resisting wind (Sandberg and Klosowski 1986).
Negative wind loads cause a combination of tension, shear, and bending in the back bead. The glass typically behaves in a geometrically nonlinear manner (Vallabhan 1983). This causes significant shearing of the joint near the middle of the panel's side. Shears from thermal movement may also be present. The resulting deformed shape of the joint cross section is as shown in Fig. 2.
Current analysis procedures for the joint range from very rudimentary tributary area approaches to geometrically nonlinear finite difference analyses (Vallabhan et al. 1985). The focus is on tensile stresses from negative wind load. Wind-induced shear, thermal stresses, and any dead load stresses are either treated separately or ignored. While this has resulted in successful designs, it is probably due, at least in part, to the low allowable stresses assigned to the silicone. Sandberg and Larson (1985), using a nonlinear finite element analysis, showed that wind-induced shear and bending stresses in the joint may be significant. In at least some cases, thermal stresses can
'Assoc. Prof, of Civ. Engrg., Michigan Tech. Univ., Houghton, MI 49931. 2Struct. Engr., Warzyn Engrs., Minneapolis, MN 55426; formerly, Grad. Res.
Asst., Michigan Tech. Univ., Houghton, MI. Note. Discussion open until October 1, 1989. To extend the closing date one month,
a written request must be filed with the ASCE Manager of Journals. The manuscript for this paper was submitted for review and possible publication on May 6, 1988. This paper is part of the Journal of Structural Engineering, Vol. 115, No. 5, May, 1989. ©ASCE, ISSN 0733-9445/89/0005-1212/$!.00 + $.15 per page. Paper No.
i 2 i 'd
J. Struct. Eng. 1989.115:1212-1224.
Dow
nloa
ded
from
asc
elib
rary
.org
by
DE
AK
IN U
NIV
ER
SIT
Y o
n 09
/26/
13. C
opyr
ight
ASC
E. F
or p
erso
nal u
se o
nly;
all
righ
ts r
eser
ved.
A-
Silicone Back Bead
-T7-7-V 7 7 7 7 7 7
ryy^Yjyyyy^^
FIG. 1. Structural Glazing Joint Detail
combine unfavorably with wind stresses. The more sophisticated analysis techniques can permit a more rational approach to design, given data on the combined stress behavior of the joint. The goal of this paper is to provide some of that data.
Wind Load
FIG. 2. Joint Deformation under Wind and Thermal Load
1213
J. Struct. Eng. 1989.115:1212-1224.
Dow
nloa
ded
from
asc
elib
rary
.org
by
DE
AK
IN U
NIV
ER
SIT
Y o
n 09
/26/
13. C
opyr
ight
ASC
E. F
or p
erso
nal u
se o
nly;
all
righ
ts r
eser
ved.
EXPERIMENTAL APPROACH
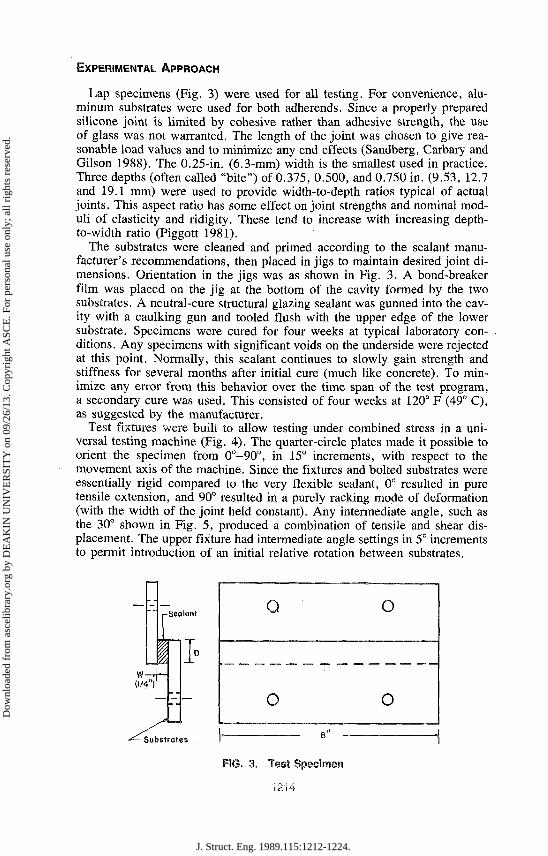
Lap specimens (Fig. 3) were used for all testing. For convenience, aluminum substrates were used for both adherends. Since a properly prepared silicone joint is limited by cohesive rather than adhesive strength, the use of glass was not warranted. The length of the joint was chosen to give reasonable load values and to minimize any end effects (Sandberg, Carbary and Gilson 1988). The 0.25-in. (6.3-mm) width is the smallest used in practice. Three depths (often called "bite") of 0.375, 0.500, and 0.750 in. (9.53, 12.7 and 19.1 mm) were used to provide width-to-depth ratios typical of actual joints. This aspect ratio has some effect on joint strengths and nominal moduli of elasticity and ridigity. These tend to increase with increasing depth-to-width ratio (Piggott 1981).
The substrates were cleaned and primed according to the sealant manufacturer's recommendations, then placed in jigs to maintain desired joint dimensions. Orientation in the jigs was as shown in Fig. 3. A bond-breaker film was placed on the jig at the bottom of the cavity formed by the two substrates. A neutral-cure structural glazing sealant was gunned into the cavity with a caulking gun and tooled flush with the upper edge of the lower substrate. Specimens were cured for four weeks at typical laboratory conditions. Any specimens with significant voids on the underside were rejected at this point. Normally, this sealant continues to slowly gain strength and stiffness for several months after initial cure (much like concrete). To minimize any error from this behavior over the time span of the test program, a secondary cure was used. This consisted of four weeks at 120° F (49° C), as suggested by the manufacturer.
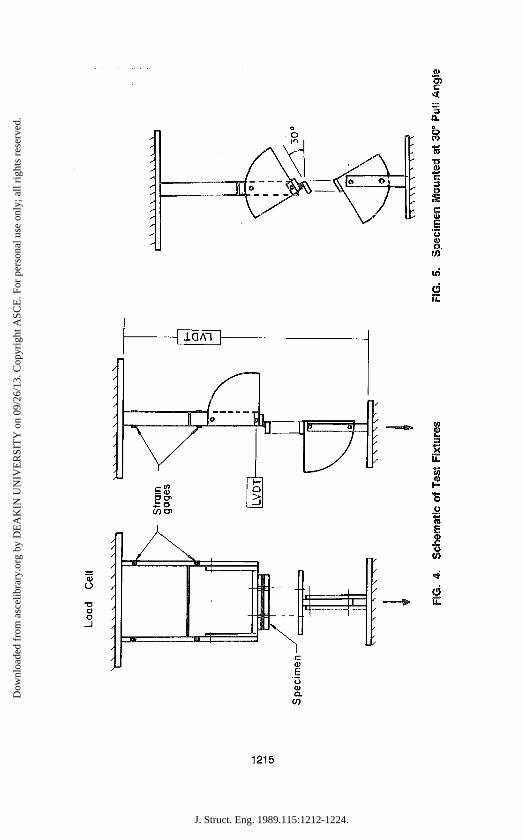
Test fixtures were built to allow testing under combined stress in a universal testing machine (Fig. 4). The quarter-circle plates made it possible to orient the specimen from 0°-90°, in 15° increments, with respect to the movement axis of the machine. Since the fixtures and bolted substrates were essentially rigid compared to the very flexible sealant, 0° resulted in pure tensile extension, and 90° resulted in a purely racking mode of deformation (with the width of the joint held constant). Any intermediate angle, such as the 30° shown in Fig. 5, produced a combination of tensile and shear displacement. The upper fixture had intermediate angle settings in 5° increments to permit introduction of an initial relative rotation between substrates.
w — • • 0/4")
Sealant
1 1°
Substrates
Q
0
. g"
o
o ,
FIG. 3. Test Specimen
J. Struct. Eng. 1989.115:1212-1224.
Dow
nloa
ded
from
asc
elib
rary
.org
by
DE
AK
IN U
NIV
ER
SIT
Y o
n 09
/26/
13. C
opyr
ight
ASC
E. F
or p
erso
nal u
se o
nly;
all
righ
ts r
eser
ved.
Lo
od
Cel
l
SS
NK
NS
N\
\N
S
SS
NS
SV
\V
X\
l\3
Sp
ecim
en
FIG
. 4
. S
che
ma
tic o
f T
est
Fix
ture
s
\ \
\w
\\
\\
\w
\\
i- Q >
FIG
. 5
. S
pe
cim
en
Mo
un
ted
at
30°
Pu
ll A
ng
li
J. Struct. Eng. 1989.115:1212-1224.
Dow
nloa
ded
from
asc
elib
rary
.org
by
DE
AK
IN U
NIV
ER
SIT
Y o
n 09
/26/
13. C
opyr
ight
ASC
E. F
or p
erso
nal u
se o
nly;
all
righ
ts r
eser
ved.
Instrumentation included strain gages and displacement transducers (LVDTs), as shown in Fig. 4, and the load cell of the testing machine. From the strain gages, moments at two elevations on the upper fixture could be determined. These moments and the vertical load from the load cell made it possible to calculate the tension, shear, and moment resultants at, for example, the upper sealant/substrate interface. The horizontal LVDT monitored horizontal displacement at the bottom of the upper fixture. This movement was due primarily to a slight rotation of the upper head of the testing machine. Although small, this movement was included in the data reduction. Horizontal movement of the lower fixture was negligible. Thus, the displacement of the joint was equal to the vertical movement of the lower machine crosshead, measured by the vertical LVDT of Fig. 4, combined with the small horizontal movement at the upper fixture.
Calibration of the system was done with weights. A triangular boom converted gravity load to horizontal force. Experimentally determined signal-to-moment constants for the strain gage sets were used in actual testing. (These constants compared very closely with beam theory predictions.) The LVDTs were checked against dial gages and the load cell against the known weights. Calibration loadings were done horizontally, vertically, and in combinations to ensure that no unexpected signal interactions were occurring. All signals were fed to, and processed by, a microcomputer-based data-acquisition system. The final calibrations were done using the entire system to make sure that all components and the software were functioning properly.
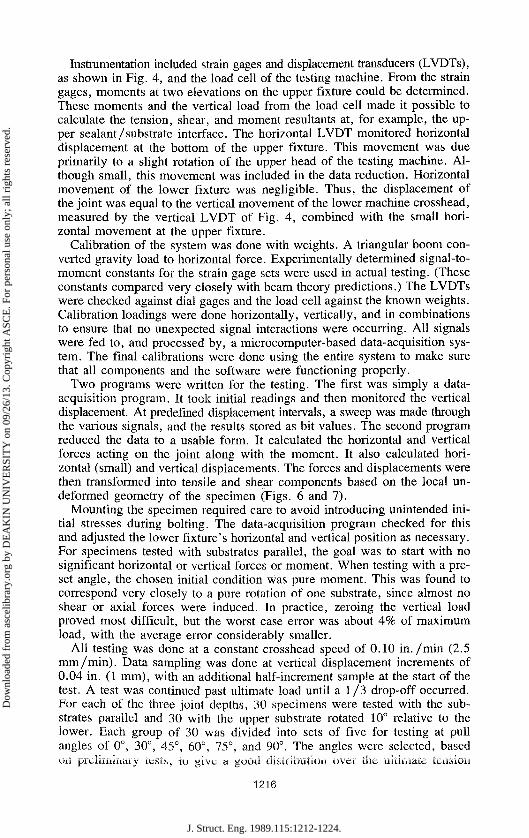
Two programs were written for the testing. The first was simply a data-acquisition program. It took initial readings and then monitored the vertical displacement. At predefined displacement intervals, a sweep was made through the various signals, and the results stored as bit values. The second program reduced the data to a usable form. It calculated the horizontal and vertical forces acting on the joint along with the moment. It also calculated horizontal (small) and vertical displacements. The forces and displacements were then transformed into tensile and shear components based on the local un-deformed geometry of the specimen (Figs. 6 and 7).
Mounting the specimen required care to avoid introducing unintended initial stresses during bolting. The data-acquisition program checked for this and adjusted the lower fixture's horizontal and vertical position as necessary. For specimens tested with substrates parallel, the goal was to start with no significant horizontal or vertical forces or moment. When testing with a preset angle, the chosen initial condition was pure moment. This was found to correspond very closely to a pure rotation of one substrate, since almost no shear or axial forces were induced. In practice, zeroing the vertical load proved most difficult, but the worst case error was about 4% of maximum load, with the average error considerably smaller.
All testing was done at a constant crosshead speed of 0.10 in. /min (2.5 mm/min). Data sampling was done at vertical displacement increments of 0.04 in. (1 mm), with an additional half-increment sample at the start of the test. A test was continued past ultimate load until a 1/3 drop-off occurred. For each of the three joint depths, 30 specimens were tested with the substrates parallel and 30 with the upper substrate rotated 10° relative to the lower. Each group of 30 was divided into sets of five for testing at pull angles of 0°, 30°, 45°, 60°, 75°, and 90°. The angles were selected, based on prciiOiiaary i.esi.s, to give u guou uiSuioutiOii over tiic uitiuiatt; tCiiSiOii
1216
J. Struct. Eng. 1989.115:1212-1224.
Dow
nloa
ded
from
asc
elib
rary
.org
by
DE
AK
IN U
NIV
ER
SIT
Y o
n 09
/26/
13. C
opyr
ight
ASC
E. F
or p
erso
nal u
se o
nly;
all
righ
ts r
eser
ved.
to
FIG
. 6.
S
tress
Res
ulta
nts
and
Dis
plac
emen
ts, a
= 0
° FI
G.
7.
Stre
ss R
esul
tant
s an
d D
ispl
acem
ents
, a
=
J. Struct. Eng. 1989.115:1212-1224.
Dow
nloa
ded
from
asc
elib
rary
.org
by
DE
AK
IN U
NIV
ER
SIT
Y o
n 09
/26/
13. C
opyr
ight
ASC
E. F
or p
erso
nal u
se o
nly;
all
righ
ts r
eser
ved.
and shear force interaction range. For the specimens with the 10° preset, the orientation of the lower substrate was the same as without the preset angle. The preset rotation was applied so as to cause tensile bending stress on the tooled joint face, simulating the negative wind effect on a detail as shown in Figs. 1 and 2.
RESULTS
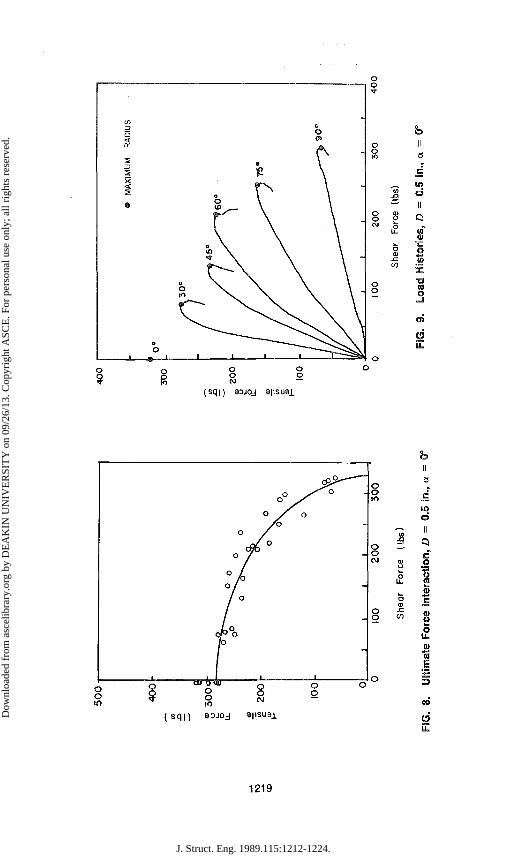
The tension versus shear force interaction results for a typical group of specimens are shown in Fig. 8. This is typical of the pattern and scatter seen in all groups. Corresponding load histories for typical specimens from Fig. 8 are plotted in Fig. 9. These show shear force continuing to increase after tensile force reaches a maximum, raising a question as to where the ultimate condition is reached. The definition chosen was the maximum radius achieved in the tension-shear space. Thus, the points on Fig. 8 and for similar groups of data are maximum radius values. Fig. 9 also shows tension being generated in the 90° test. This is due to the fact that the substrates were held at the same joint width throughout the test, as well as the large displacements involved.
For simplicity, an ellipse was used to fit the data in Fig. 8. The resulting equation and those for the other five test groups are shown in a stress format in Table 1. The form of the equation is
where Fv and F, = the strengths in pure shear and tension, respectively. The stresses are expressed as nominal stresses, i.e., the force divided by the undeformed cross-sectional area. The if2-values in the table give an indication of the goodness of fit to the data. They were computed as a by-product of the linear regression of/? versus/J. Plots of the equations are shown in Fig. 10. In examining these curves, it is helpful to recall conditions in current practice. Allowable tensile stress is usually set at 20 psi (0.14 MPa). Since shear stress is seldom considered, an allowable value is less clearly defined, but it typically does exceed the tensile value. This indicates that the average strengths in pure tension and shear are about four times the allowable values in current usage. The 10° preset angle is extreme. Values measured in full-scale mockup testing seldom exceed 5° prior to glass failure. Even with a metal panel, rotations of more than 5° would be quite large.
Given these considerations, the effects of varying the depth-to-width ratio and the effects of edge rotation can probably be ignored for design purposes, within the typical depth-to-width ratio range investigated. As with any generalization, caution is in order. The writers have heard of designs involving ratios of four or five to one. While this may actually improve apparent material strength, it will also magnify the effects of a given edge rotation on the joint.
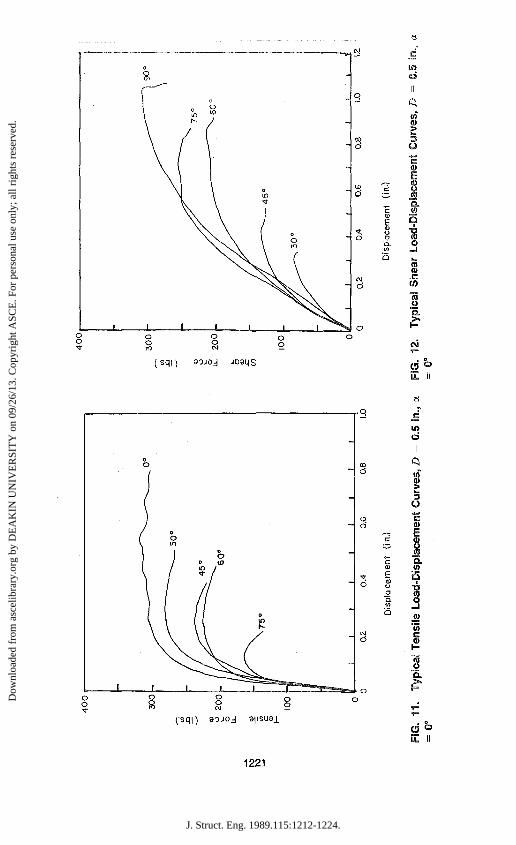
Plots of typical tensile and shear load-displacement curves for the various test angles are shown in Figs. 11 and 12, respectively. These give an indication of the apparent ductility available in the joints and may help guide development of improved analytical joint models. Again, horizontal displacements at the upper fixture cause a slight deviation from the path ex-
1218
J. Struct. Eng. 1989.115:1212-1224.
Dow
nloa
ded
from
asc
elib
rary
.org
by
DE
AK
IN U
NIV
ER
SIT
Y o
n 09
/26/
13. C
opyr
ight
ASC
E. F
or p
erso
nal u
se o
nly;
all
righ
ts r
eser
ved.
61-31-
P Tensile Force (lbs)
1 B> <-*•
<D °n e •^
o
3 F4>
fl» -̂ u o © 3
to II o tn
3'
$ o> o -1
™
2 ^ o (D
f ^
001
ro o o
300
Tensile Force (lbs)
o o
o o o s
o
p (O
o 0)
I to II
^ 1
• \ o
1
~1
T' ' I
\ * \ 01
\ °
— o> o 0
o 0
T—®— O o
—1
@ S A
XIM
UM
R
>
DIU
S
J. Struct. Eng. 1989.115:1212-1224.
Dow
nloa
ded
from
asc
elib
rary
.org
by
DE
AK
IN U
NIV
ER
SIT
Y o
n 09
/26/
13. C
opyr
ight
ASC
E. F
or p
erso
nal u
se o
nly;
all
righ
ts r
eser
ved.
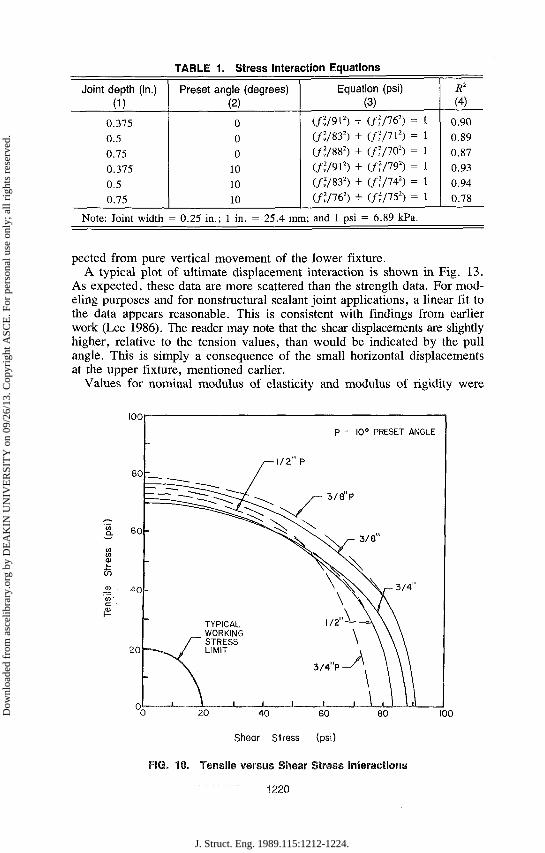
TABLE 1. Stress Interaction Equations
Joint depth (in.) (1)
0.375
0.5
0.75 0.375
0.5
0.75
Preset angle (degrees) (2)
0
0
0
10
10
10
Equation (psi) (3)
(/»7912) + (/?/762) = 1
(/,2/832) + (/?/712) = 1
(/2/882) + (/2/702) = 1
(/2/912) + (/?/792) = 1
(/v2/832) + (/2/742) = 1
(/2/762) + (/2/752) = 1
R2
(4)
0.90
0.89
0.87
0.93
0.94
0.78
Note: Joint width = 0.25 in.; 1 in. = 25.4 mm; and 1 psi = 6.89 kPa.
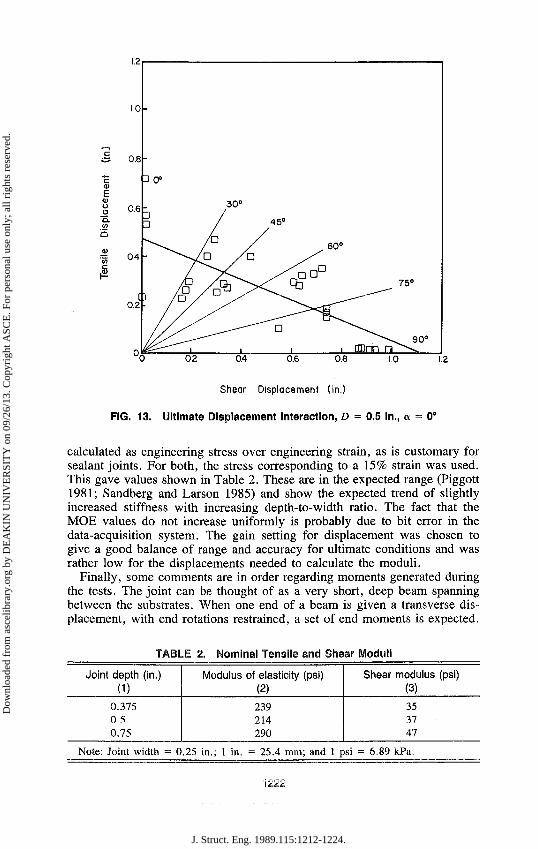
pected from pure vertical movement of the lower fixture. A typical plot of ultimate displacement interaction is shown in Fig. 13.
As expected, these data are more scattered than the strength data. For modeling purposes and for nonstructural sealant joint applications, a linear fit to the data appears reasonable. This is consistent with findings from earlier work (Lee 1986). The reader may note that the shear displacements are slightly higher, relative to the tension values, than would be indicated by the pull angle. This is simply a consequence of the small horizontal displacements at the upper fixture, mentioned earlier.
Values for nominal modulus of elasticity and modulus of rigidity were
100
P - 10° PRESET ANGLE
40 60 80
Shear Stress (psi)
FIG. 10. Tensile versus Shear Stress Interactions
1220
I00
J. Struct. Eng. 1989.115:1212-1224.
Dow
nloa
ded
from
asc
elib
rary
.org
by
DE
AK
IN U
NIV
ER
SIT
Y o
n 09
/26/
13. C
opyr
ight
ASC
E. F
or p
erso
nal u
se o
nly;
all
righ
ts r
eser
ved.
40
0
N>
l\3
02
0.4
0.
6
Dis
plac
emen
t (in
.)
40
0
30
0
il
20
0 -
10
0
- - - _ - /.6
?
^ s
30
°
I I
I
45
°
i I
I
75
°
~~
\-6
0°
i 1
i
~\
90
° 1 'i
0.6
0.2
0.4
Dis
plac
emen
t (i
n
1.0
FIG
. 11
. T
ypic
al T
ensi
le L
oad-
Dis
plac
emen
t C
urve
s, D
= 0
.5 in
., a
FIG
. 12
. T
ypic
a! S
hear
Loa
d-D
ispl
acem
ent
Cyr
ves,
D =
0.5
in.
, a
= 0
° =
0°
J. Struct. Eng. 1989.115:1212-1224.
Dow
nloa
ded
from
asc
elib
rary
.org
by
DE
AK
IN U
NIV
ER
SIT
Y o
n 09
/26/
13. C
opyr
ight
ASC
E. F
or p
erso
nal u
se o
nly;
all
righ
ts r
eser
ved.
» 0.8-
0 0 2 0.4 0.6 0.8 1.0
Shear Displacement (in.)
FIG. 13. Ultimate Displacement Interaction, D = 0.5 in., a = 0°
I.2
calculated as engineering stress over engineering strain, as is customary for sealant joints. For both, the stress corresponding to a 15% strain was used. This gave values shown in Table 2. These are in the expected range (Piggott 1981; Sandberg and Larson 1985) and show the expected trend of slightly increased stiffness with increasing depth-to-width ratio. The fact that the MOE values do not increase uniformly is probably due to bit error in the data-acquisition system. The gain setting for displacement was chosen to give a good balance of range and accuracy for ultimate conditions and was rather low for the displacements needed to calculate the moduli.
Finally, some comments are in order regarding moments generated during the tests. The joint can be thought of as a very short, deep beam spanning between the substrates. When one end of a beam is given a transverse displacement, with end rotations restrained, a set of end moments is expected.
TABLE 2. Nominal Tensile and Shear Moduli
Joint depth (in.) (1)
0.375 0.5 0.75
Modulus of elasticity (psi) (2)
239 214 290
Shear modulus (psi) (3)
35 37 47
Note: Joint width = 0.25 in.; 1 in. = 25.4 mm; and 1 psi = 6.89 kPa.
J. Struct. Eng. 1989.115:1212-1224.
Dow
nloa
ded
from
asc
elib
rary
.org
by
DE
AK
IN U
NIV
ER
SIT
Y o
n 09
/26/
13. C
opyr
ight
ASC
E. F
or p
erso
nal u
se o
nly;
all
righ
ts r
eser
ved.
The data indicated no significant moments, only "noise" within the bit-error range of the data-acquisition system. The explanation seems to be as follows. As the specimen is racked in shear (and extended in tension for angles 30°-75°), both tension and shear forces are created. In all cases and at all load levels, the moment from the tension force times the shear displacement very nearly counteracts the moment from shear force times the specimen width. Also, it must be noted that reverse curvature moments are inherent in the nature of the shear displacement mode. Any effect of these moments is reflected in the nominal shear strength from the 90° specimens.
CONCLUSIONS
This study indicates that the ultimate strength interaction for silicone structural glazing joints under combined tension and shear can be described as an ellipse. Thus only tensile strength and shear strengths, determined separately, are needed to define the interaction.
Depth-to-width ratios from 1.5-3.0 and joint rotations of less than 10° have little effect on combined stress behavior. Outside of these ranges, additional testing may be required.
The tension-shear interaction for ultimate displacement can be approximated with a linear fit.
It is hoped that the results presented will aid in the development of improved analysis and design procedures for structurally glazed curtain wall systems.
ACKNOWLEDGMENTS
This study was supported by a grant from Dow Corning Corp.
APPENDIX I. REFERENCES
Lee, T. J. (1986). "A parameter study of structural glazing joints," thesis presented to Michigan Technological University, at Houghton, Mich., in partial fulfillment of the requirement for the degree of Master of Science.
Piggott, R. R. (1981). "A screening program for determination of allowable design stresses for elastomeric adhesives," thesis presented to Michigan Technological University, Houghton, Mich., in partial fulfillment of the requirements for the degree of Master of Science.
Sandberg, L. B., Carbary, T. M., and Gilson, A. E. (1989). "Specimen length effects on mechanical properties of a silicone elastomeric sealant." Science and technology of glazing systems, ASTM, Philadelphia, Pa. (in press).
Sandberg, L. B., and Klosowski, J. M. (1986). "Structural glazing: behavior details of double-bead installations." Adhesives Age, 29(5), 26-29.
Sandberg, L. B., and Larson, A. P. (1985). "Stress analysis of structural glazing joints under wind load." Designing with today's engineering adhesives and sealants. Adhesive and Sealant Council, Arlington, Va., 110-118.
Vallabhan, C. V. G. (1983). "Iterative analysis of nonlinear glass plates." J. Struct. Engrg., ASCE, 109(2), 489-502.
Vallabhan, C. V. G., et al. (1985). "Thin glass plates on elastic supports." J. Struct. Engrg., ASCE, 111(11), 2416-2426.
APPENDIX II. NOTATION
The following symbols are used in this paper:
1223
J. Struct. Eng. 1989.115:1212-1224.
Dow
nloa
ded
from
asc
elib
rary
.org
by
DE
AK
IN U
NIV
ER
SIT
Y o
n 09
/26/
13. C
opyr
ight
ASC
E. F
or p
erso
nal u
se o
nly;
all
righ
ts r
eser
ved.
D F, Fv
f, f, M M,
T V W At Av a
= = = = = = = _ = = = = =
joint depth; nominal ultimate tensile stress, pure tension; nominal ultimate shear stress, pure shear; applied tensile stress; applied shear stress; moment on joint due to vertical displacement; moment on joint due to preset rotation; tensile force on joint; shear force on joint; joint width; tensile displacement of joint; shear displacement of joint; and preset angle.
rddq
J. Struct. Eng. 1989.115:1212-1224.
Dow
nloa
ded
from
asc
elib
rary
.org
by
DE
AK
IN U
NIV
ER
SIT
Y o
n 09
/26/
13. C
opyr
ight
ASC
E. F
or p
erso
nal u
se o
nly;
all
righ
ts r
eser
ved.

![[XLS]sagga.co.zasagga.co.za/images/Copy of Arch Spec Combined Matrix May... · Web view832065560 SAGGA - South African Glass & Glazing Association (Continue) GAUTENG (Cont.) Glazier](https://img.pdfslide.net/doc/110x75/5af3fdb47f8b9a74448c3ff9/xlssaggaco-of-arch-spec-combined-matrix-mayweb-view832065560-sagga-south.jpg)