Embed Size (px)
Citation preview
Comment: A Re-evaluation of Black Voting in MississippiAuthor(s): Sam KernellSource: The American Political Science Review, Vol. 67, No. 4 (Dec., 1973), pp. 1307-1318Published by: American Political Science AssociationStable URL: http://www.jstor.org/stable/1956550 .
Accessed: 16/08/2013 12:07
Your use of the JSTOR archive indicates your acceptance of the Terms & Conditions of Use, available at .http://www.jstor.org/page/info/about/policies/terms.jsp
.JSTOR is a not-for-profit service that helps scholars, researchers, and students discover, use, and build upon a wide range ofcontent in a trusted digital archive. We use information technology and tools to increase productivity and facilitate new formsof scholarship. For more information about JSTOR, please contact [email protected].
.
American Political Science Association is collaborating with JSTOR to digitize, preserve and extend access toThe American Political Science Review.
http://www.jstor.org
This content downloaded from 137.110.37.11 on Fri, 16 Aug 2013 12:07:04 PMAll use subject to JSTOR Terms and Conditions

Comment: A Re-evaluation of Black Voting in Mississippi*
SAM KERNELL University of Minnesota
Lester Salamon and Steve Van Evera have undertaken a difficult task. To choose among competing explanations of individual political behavior which for the most part make similar predictions-as do their "apathy" and "fear" models-should be difficult enough, but to do so with aggregate, county level data would seem nearly impossible. Yet the authors make the effort and are rewarded with some unex- pected and interesting findings. Most surprising and central to their "fear model" of black vot- ing in Mississippi is the discovery that indices of economic vulnerability (or dependence), and not poverty or education per se, most closely relate to black voter turnout. On the ba- sis of this finding they recommend a federally administered welfare program such as Presi- dent Nixon's Family Assistance Plan. Not only would it increase the number of beneficiaries and raise the level of income for many impov- erished blacks, but more importantly it would liberate them from the coercion of "welfare serfdom,"-as the authors put it-at the hands of local white welfare administrators. A second unexpected finding, and it seems to me under- appreciated by the authors, is the strong posi- tive relationship between the percentage of the voting age population that is black and black voter turnout. This discovery is especially curi- ous and noteworthy since earlier research (to be described below) agrees in reporting a nega- tive relationship between the percentage of blacks in a community and the level of black voting registration.'
* I would like to express appreciation to Professor John Quincy Adams for generous assistance in promptly locating answers to a multitude of questions. I would also like to thank Dianne Kernell, Byron Shafer, and Harry Williams for their helpful com- ments on an earlier draft and Judy Sampson for assistance in preparation of the data and manuscript. I Donald R. Matthews and James W. Prothro, Negroes and New Southern Politics (New York: Har- court, Brace and World, 1966), pp. 115-120. Don- ald S. Strong, "The Future of the Negro Voter in the South," Journal of Negro Education, 26 (1957), 400-407. Johnnie Daniel, "Negro Political Behavior and Community Political and Socioeconomic Structural Factors," Social Forces, 47 (March, 1969), 274-280. A weaker relationship between these two variables is reported by John H. Fenton and Kenneth N. Vines in "Negro Registration in Louisiana," American Po- litical Science Review, 51 (1957), 704-713.
Before embracing the authors' policy recom- mendations or revising conventional wisdom on the subject, several questions should be con- sidered about their analysis and conclusions:
(1) Is the fear model adequately discrete? In its "simple" form, the fear model posits that economic vulnerability and not socioeconomic status best explains nonvoting. At this stage the model presents a test which may either con- firm or deny its hypothesis, and may, therefore, be useful. When it is "expanded," however, to include standard organizational explanations of participation, serious problems surface. For one, the model no longer provides a test to demonstrate that fear is operating. Although the authors provide a fascinating and plausible account of how organization may increase black participation by displacing fear, organiza- tion may also operate to "displace" apathy re- sulting from generations of poverty, poor schooling, and a heritage of nonparticipation enforced by law. Even without systematic eco- nomic intimidation extensive political organi- zation would be necessary to stimulate mass po- litical participation among Mississippi's black citizenry. American history is replete with in- stances of political oranizations successfully enfranchising and mobilizing large and other- wise nonparticipant segments of the population for whom fear as economic coercion was not a primary restraint from participation. The point is that "fear" is not necessary to our under- standing why organized counties record higher levels of black voting than unorganized counties.
A second problem with the "expanded fear model" is that it is too versatile. For example, with respect to the important variable, percent- age of the county's voting age population that is black, fear can account for either a positive or negative relationship with black participa- tion. The authors find a positive correlation and argue that percentage black is an important or- ganizational resource and as such helps to dis- place fear. The earlier studies mentioned above, however, found a negative correlation and proffered an explanation equally congenial to the authors' fear model. Whites threatened by
2The most notable example is the growth and op- eration of urban political machines during the 19th and early 20th centuries.
1307
This content downloaded from 137.110.37.11 on Fri, 16 Aug 2013 12:07:04 PMAll use subject to JSTOR Terms and Conditions
1308 The American Political Science Review Vol. 67
black influence and control in local elections more thoroughly exercise social and economic sanctions against participation in communities where blacks constitute a large portion of the population.3 Thus, as the percentage of the vot- ing age population that is black increases, vot- ing becomes a more dramatic and forboding act and vulnerability becomes a powerful in- ducement to stay home. Stated and tested sim- ply then, either finding can be rather easily in- corporated into their model. Later in the paper, I shall suggest a framework for reconciling the earlier research with the authors' present find- ing. But in its current condition the "expanded fear model" subsumes relationships which may have little to do with fear and permits post hoc confirmation by opposite findings.
(2) Are the findings accurate? The depen- dent variable, black voter turnout, is measured during the 1968 presidential election, while the data for independent variables are obtained from the 1960 census, some nine years earlier. During the 1960s many Mississippi counties ex- perienced considerable change in the relative size and demographic features of their black populations. For example, by the 1970 census five of the twenty-nine counties with black pop- ulation majorities in the 1960 census no longer had black majorities. Moreover, there were substantial changes in their collective social and economic characteristics. During these ten years the percentage of the black population with a high school education doubled-despite the fact that outward migration appears to be very high among young, educated adults.4 The percentage of the black population with a yearly income under 2,000 dollars declined from two-thirds in 1960 to less than one-third in 1970, and the percentage with less than a 4,000 dollar yearly income dropped from ninety-one to sixty per cent. Perhaps the most dramatic changes occurred in agriculture. With widespread mechanization, tenant farming and sharecropping became an uneconomical sys- tem of agricultural production, and, as Table 1 shows, tenancy experienced a precipitous de- cline during the 1960s. What was at one time the primary means of livelihood for blacks, to- day has virtually disappeared in many counties. There is also a slight but steady decline in the number of black farmowners.
Although for many counties throughout the nation 1960 census data may adequately ap- proximate the characteristics of its 1968 popu- lation, in Mississippi when looking at the black
3Matthews and Prothro, 115-117. John P. Thames, "Population Migration Effects on
Mississippi Poverty," Mississippi Law Journal, 39 (May, 1968), 423-450.
Table 1. Drop in the Number of Black Mississippi Tenant Farmers during the 1960s
1959 1964 1969
Number of Black Farmers 54,927 37,715 17,184 Number of Tenants 32,243 18,580 2,657 Percentage of Farmers Who
Are Tenants 58.7 49.3 15.4
Source: 1969 U.S. Census of Agriculture, Mississippi (Part 33, Section 1, Volume 1) Table 3, p. 3.
population which is undergoing rapid social change this may not be the case. Thus, any judgment of the relative effects of income lev- els, education, racial composition, and farm tenancy (a primary component of Salamon and Van Evera's economic vulnerability index) on black political participation must be tentative until supported by the more accurate data available in the 1970 census.
(3) Are the findings generalizable? Salamon and Van Evera begin by asking why black can- didates have failed to win many elections in counties where they appear to constitute a vot- ing majority. This naturally led to an analysis of twenty-nine counties which had black popu- lation majorities (although not all of these, even by 1960 figures, actually had voting age majorities). Their findings support certain hy- pothesized causes of low participation in the important black belt counties of Mississippi, yet they may be wholly inappropriate for explain- ing participation in other countries with smaller proportions of black population. Because the proportion black in a community (the dimen- sion on which the twenty-nine counties were se- lected for examination) may itself be related to the independent and dependent variables, we cannot simply assume that the reported rela- tionships are pervasive throughout the state. Given the provocative nature of the findings, the authors are naturally prompted to state gen- eral conclusions and make policy recommenda- tions. Before this becomes acceptable, however, the general applicability of their findings must be ascertained.
With these questions in mind, the analysis will be replicated with some important modifi- cations. First, 1970 census data will be used to measure the independent variables. As indi- cated above, there is reason to suspect that the figures for the various social and economic in- dices are significantly different from those re- ported in the 1960 census. (For a description of index construction and intercorrelations among selected independent variables see Ap- pendix A.) Second, the investigation will be ex- panded to include all eighty-two of Mississippi's counties, providing an opportunity to test the
This content downloaded from 137.110.37.11 on Fri, 16 Aug 2013 12:07:04 PMAll use subject to JSTOR Terms and Conditions
1973 Comment: A Re-evaluation of Black Voting in Mississippi 1309
reported findings in counties with varying racial composition. In order to do this the dependent variable, black voter turnout, must be opera- tionally redefined. The previous study averaged the Humphrey vote and the vote for local black candidates (when available) to arrive at a "mo- bilization index." In this analysis only the Humphrey vote will be employed, since in 1968 only a relatively small number of counties had black candidates running for office.5 Sala- mon and Van Evera report that the Humphrey vote correlates with the vote for the local black candidate at .92; therefore, the difference in the two indices should have little effect on the re- sults. (For a discussion of the validity of using the Humphrey vote as a measure of turnout for the other Mississippi counties, see Appendix B.) Third, the stability of the findings over time will be checked by examining black turnout during the 1971 election in which Charles Evers, the black Mayor of Fayette, Mississippi, ran an unsuccessful statewide campaign for governor against the regular Democratic nomi- nee, William Waller.6 By using more accurate census figures, expanding the scope. of the study, and extending it over time we obtain a richer and more reliable set of data for examin- ing the effects of fear, apathy, and politics on black political participation.
Replicating the Analysis Three principal explanations of variations in
black turnout have been described in the previ-
I The county level voting returns for the 1968 presi- dential election are taken from F. Glenn Abney, com- piler, Mississippi Election Statistics (University, Miss.: Bureau of Governmental Research, 1968), supplement, no pages given.
"The general election was held in November, 1971. Charles Evers, running as an Independent, as did many other black candidates for local office, received 23 per cent of the total vote. County level returns are taken from . . . In the Public Interest (Millsaps Col- lege: Institute of Politics in Mississippi) Vol. 2 (June, 1972), 3.
ous paper. They are apathy, presented as the conventional social science model and mea- sured by the standard socioeconomic measures; fear as measured by occupational vulnerability; and political organization which in this analysis can only be indirectly indexed by percentage black of the voting age population. The last two were combined to form the "expanded fear model" of participation. Because of the objec- tions to this merger raised earlier, however, each explanation will be evaluated as separate and distinct. This does not, of course, preclude the possibility that two or indeed all three ex- planations may be operating simultaneously and in a complementary manner.
In Table 2 the multiple correlations for the variables central to the several explanations are displayed.7 In some respects the results are sim- ilar to those discovered by Salamon and Van Evera. The indices of occupational vulnerabil- ity consistently correlate with black voting par- ticipation at about the same levels as the joint correlation of median education and family in- come. The important point here is that the coefficients for the vulnerability variables re- ported in Table 2 are not nearly so large as those reported by Salamon and Van Evera in their Table 3. It is curious that 1960 data would produce stronger correlations with voter
The reader is cautioned to remember that the relationships are for ecological variables and that the danger of unjustifiably inferring individual-level associations from correlation coefficients is great. Because individual cases have not been grouped (into counties) according to their scores on the dependent variables (black voter turnout in 1968 and 1971) unstandardized regression coefficients should be more revealing about individual level "effects." Where op- portune, regression slopes based on b scores will be used. For a lucid discussion on this point see W. Phillips Shively. "'Ecological' Inference: The Use of Aggregate Data to Study Individuals," Ameri- can Political Science Review, 63 (December, 1969), 1183-1196. See also Hubert M. Blalock, Jr., Causal Inferences in Nonexperimental Research (Chapel Hill: Univ. of North Carolina Press, 1964), chapter 4.
Table 2. Correlations of Selected Socioeconomic Variables with Black Voting Participation in Mississippi
1968 1971
All 29 Selected All 29 Selected Counties Counties Counties Counties
(Multiple Correlation Coefficients) Vulnerability Indices
% Vulnerable .12 .25 .37 .42 % Invulnerable, Revised
Socioeconomic Indices Med. Education .26 .27 .44 .59 Med. Family Income
% of Voting Age Population, Black -.04 .41 .19 .40
This content downloaded from 137.110.37.11 on Fri, 16 Aug 2013 12:07:04 PMAll use subject to JSTOR Terms and Conditions
1310 The American Political Science Review Vol. 67
turnout in 1968 than the more accurate, up- dated figures. Some of the difference could con- ceivably lie in the slightly modified indices (refer to Appendix A and Table 2 of the pre- ceding paper). A more probable reason for such a pronounced discrepancy, however, is that vulnerability as measured in 1960 com- pared with 1970 represents essentially a differ- ent variable. The size of the tenant population given in Table 1 heavily contributes to the total percentage of the labor force in dependent oc- cupations in 1960, especially in the black belt counties of the Delta, the last stronghold of the southern-style plantation system. (Almost all of the Delta counties are included among the au- thors' twenty-nine predominantly black coun- ties.) Reflecting the massive decline of farm tenancy recorded by the 1969 agricultural cen- sus, this occupational category no longer con- tributes so heavily to the percentage of depen- dent workers. By late 1968 the 1960 census fig- ures of the percentage in vulnerable occupa- tions in a county may reveal less about the indi- vidual features of the county's black labor force than it does about a general rural profile of the county. Perhaps it is this contextual ele- ment which adds to the explanatory power of Salamon and Van Evera's measureA
As with Salamon and Van Evera's finding, the percentage of the voting age population that is black (percentage V.A.P., Black) closely correlates with participation in the twenty-nine counties with a large black popula- tion for both the 1968 and 1971 elections. If the same causal relationship exists throughout the state, then the statewide correlations should be even larger, given the increased variation. Table 2, however, reveals no relationship at the statewide level in 1968 and only a weak one for
For a brief review of the literature and discussion of the employment of ecological data to measure con- textual or structural variables see Tapani Valkonen, "Individual and Structural, Effects in Ecological Re- search" in Quantitative Analysis in the Social Sciences, ed. Mattei Dogan and Stein Rokkan (Cambridge, Mass.: The M.I.T. Press, 1969), pp. 53-68.
the 1971 election. This finding suggests that the percentage V.A.P., Black should be more closely scrutinized within ranges of black-white population ratios; in areas where there is a small black proportion this variable may oper- ate differently.
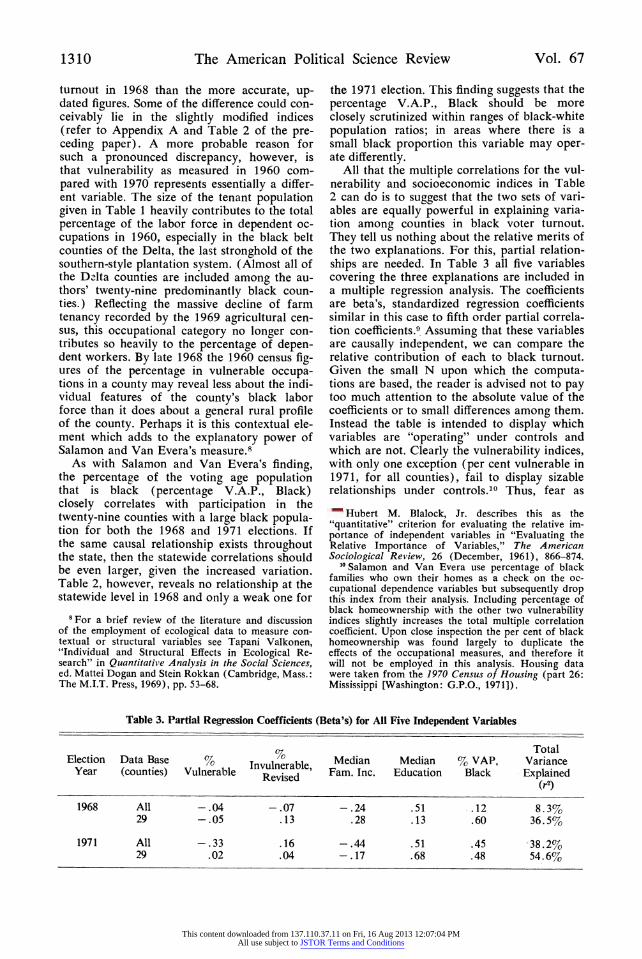
All that the multiple correlations for the vul- nerability and socioeconomic indices in Table 2 can do is to suggest that the two sets of vari- ables are equally powerful in explaining varia- tion among counties in black voter turnout. They tell us nothing about the relative merits of the two explanations. For this, partial relation- ships are needed. In Table 3 all five variables covering the three explanations are included in a multiple regression analysis. The coefficients are beta's, standardized regression coefficients similar in this case to fifth order partial correla- tion coefficients.9 Assuming that these variables are causally independent, we can compare the relative contribution of each to black turnout. Given the small N upon which the computa- tions are based, the reader is advised not to pay too much attention to the absolute value of the coefficients or to small differences among them. Instead the table is intended to display which variables are "operating" under controls and which are not. Clearly the vulnerability indices, with only one exception (per cent vulnerable in 1971, for all counties), fail to display sizable relationships under controls.10 Thus, fear as
9 Hubert M. Blalock, Jr. describes this as the "quantitative" criterion for evaluating the relative im- portance of independent variables in "Evaluating the Relative Importance of Variables," The American Sociological Review, 26 (December, 1961), 866-874.
10 Salamon and Van Evera use percentage of black families who own their homes as a check on the oc- cupational dependence variables but subsequently drop this index from their analysis. Including percentage of black homeownership with the other two vulnerability indices slightly increases the total multiple correlation coefficient. Upon close inspection the per cent of black homeownership was found largely to duplicate the effects of the occupational measures, and therefore it will not be employed in this analysis. Housing data were taken from the 1970 Census of Housing (part 26: Mississippi [Washington: G.P.O., 1971]).
Table 3. Partial Regression Coefficients (Beta's) for All Five Independent Variables
Total Election Data Base % Invulnerable Median Median % VAP, Variance
Year (counties) Vulnerable Revised ' Fam. Inc. Education Black Explained (r2)
1968 All -.04 -.07 - .24 .51 .12 8.3% 29 -.05 .13 .28 .13 .60 36.5%
1971 All - .33 .16 -.44 .51 .45 -38.2% 29 .02 .04 -.17 .68 .48 54.6%
This content downloaded from 137.110.37.11 on Fri, 16 Aug 2013 12:07:04 PMAll use subject to JSTOR Terms and Conditions
1973 Comment: A Re-evaluation of Black Voting in Mississippi 1311
economic intimidation is seriously weakened as the primary model of black voting. Median family income does retain some correlation, but in three of four instances the direction switches from positive to negative. Although this does not necessarily mean that among individuals in- creasing income will produce nonvoting it does suggest what Salamon and Van Evera concluded from their findings, that the impoverished con- dition of the black community does not have any independent depressant effects on county- to-county variations in black turnout."
Education emerges from the regression anal- ysis as the single most important independent variable. With the exception of the twenty-nine heavily black counties in the 1968 election, me- dian educational level of black adults has a pro- nounced independent effect on turnout. This finding is certainly consonant with a massive amount of research which shows that for in- dividuals education is closely tied with various forms of political participation. Salamon and Van Evera also found that median education is a powerful predictor of voting, and after a cur- sory analysis of the correlations of various lev- els of education with turnout (see their Table 8) concluded that education reflects fear more than apathy. They argue that since the percent- age of the black population with little or no schooling correlates more closely with turnout (r = -.41) than does the percentage with some college (r = .33), then illiteracy must be the main reason for nonparticipation. Because il- literates often require assistance in voting, usu- ally from white election officials and poll watch- ers, they are more susceptible to intimidation.'2 Undoubtedly such incidents of intimidation have occurred and do occur, but with the data available it is impossible to determine whether illiteracy primarily reflects fear or apathy. We can only speculate on the cause. Even with fear absent we should expect to find- illiteracy highly correlated with nonparticipation. Yet the authors conclude, "Education, we found, affects partici- pation mainly to the extent that it relieves feel- ings of insecurity and vulnerability." The man- ner by which education affects voting among blacks in Mississippi is more problematic than Salamon and Van Evera acknowledge.
In Table 5 of Appendix A, the percentage of
"1Median family income is closely related to com- munity poverty levels, correlating -.93 with percent- age of black families listed in poverty by the 1970 census, and .88 with the percentage having less than a 2,000 dollar yearly income.
2 Recent cases of white election officials either mis- directing or not assisting black illiterate voters is documented in The Shameful Blight prepared by the Washington Research Project (Washington, October 1972), pp. 82-87.
the voting age population that is black is shown to correlate strongly with the main independent variables representing the fear and apathy mod- els. Thus, the possibility exists that the effects of percentage V.A.P. Black are spurious and will be eliminated with the introduction of ap- propriate controls. The regression coefficients in Table 3 refute this hypothesis completely. In each instance the percentage V.A.P. Black in- creases in its relative importance over its zero- order relationship, and for three of the four re- gressions, it is among the most powerful vari- ables present. To conclude, median education and the percentage of the voting age population that is black emerge under controls as the most influential variables in producing county-to- county variations in black turnout.
A Closer Look at the Racial Composition of the Electorate
Black voting is rather curiously related to the proportion black of a county's voting age popu- lation. At the statewide level weak zero-order correlations between these two variables are shown in Table 2, yet for the twenty-nine heav- ily black counties, there is a strong positive re- lationship between percentage V.A.P. Black and turnout during both elections, even under multiple controls. Apparently the effects of this variable on turnout are shaped by the racial composition of the sampled counties. In Fig- ure 1 this suspicion is confirmed. For both elec- tions the relationship is similarly curvilinear and nonmonotonic.
The means of percentage voting in Figure 1 plot the strong positive relationships first identi- fied in Table 2 between percentage V.A.P. Black and turnout in the heavily black coun- ties. A closer examination of the means across the range of percentage black reveals that this association occurs only after the black propor- tion of the voting age population reaches the sixty per cent level. This finding fits neatly into Salamon and Van Evera's discussion of this variable as an organizational resource. Only in settings where black candidates have a good chance of winning do increases in proportion black have a positive effect on black turnout. Apparently when the potential black majority is between 50 and 60 per cent the practical chances are too slim to stimulate much activity, and below 50 per cent the likelihood of win- ning is remote indeed.
In counties where the black citizenry consti- tutes only a small proportion of the total electorate an inverse relationship appears; among counties with less than 30 per cent of the eligible voters black, the correlations be- tween percentage V.A.P., Black and turnout are
This content downloaded from 137.110.37.11 on Fri, 16 Aug 2013 12:07:04 PMAll use subject to JSTOR Terms and Conditions

1312 The American Political Science Review Vol. 67
70
60
50
Average Per cent 40 --- y / ~ %_ - Voting
30
--- 1968
20 1971
10
0
0-10 10-20 20-30 30-40 40-50 50-60 60+
% Black of V.A.P.
Figure 1. The relative size of the Black electorate is related in a curvilinear and nonmonotonic manner with Black voting turnout.
-.56 for 1968 and with only two cases in the lowest population range in 1971 a positive .09. Among counties in the intermediate range of 30 to 44 per cent black,13 increases in the percent- age V.A.P. Black appear to produce little change in voting turnout with correlations at .00 and -.06 for the 1968 and 1971 elections, respec- tively.
Thus far, a reason has been offered for the upturn in participation at the 60 per cent level of Black V.A.P., but none has been suggested for the inverse relationship in 1968 at the lower ranges. In some respects these counties display a pattern similar to that reported by earlier studies in which black registration throughout the Deep South decreased as the black propor-
13 Forty-five rather than 50 per cent is used as the cut off for several reasons: (1) Because of differential outward migration some of these counties which in 1970 had less than a black voting age majority, may well have had a black majority in 1968. (2) In 1968 with the most recent census nine years old ambiguity probably existed as to the actual size of the potential black electorate and thus the same incentives to organize politically may have operated. (3) Since a 50 per cent cutoff produces only minor and in- consequential changes in the slopes given in Figure 1, and the 45 per cent provides a more desirable dis- tribution of cases, the lower percentage figure is used here and in subsequent figures.
tion of the county's population increased. Don- ald Matthews and James Prothro in their defin- itive study on black participation prior to the civil rights movement find that the rate of de- cline in percentage registered accelerated as the percentage black of the county's population ap- proached majority status, presumably reflecting stricter social control on the part of the white community as black enfranchisement threat- ened white dominance in local politics.14 In contrast, Figure 1 depicts a decelerating rate of decline which levels off in the 20-40 per cent range. Thus, whether the decline in turnout for 1968 reflects decreasing white tolerance or some other phenomenon is questionable. It may be that threat perception among whites begins at a lower threshold in Mississippi than in the other southern states. We know that before the civil rights movement, black registration in Mis- sissippi was by far the lowest in the South, hovering around the three per cent mark.15 Per- haps, because of the increasing social and legal constraints on some forms of intimidation and the unavailability of various methods of disen- franchisement common before the civil rights
14 Matthews and Prothro, Negroes and New Southern Politics, Figure 5-1, p. 116.
"5Ibid., p. 151.
This content downloaded from 137.110.37.11 on Fri, 16 Aug 2013 12:07:04 PMAll use subject to JSTOR Terms and Conditions

1973 Comment: A Re-evaluation of Black Voting in Mississippi 1313
movement, black participation on the average cannot be lowered much below the forty per cent figure. Thus, participation drops sharply to this plateau and then flattens out. Also to be considered is the likelihood that as the propor- tion black increases, black voters will constitute voting majorities for certain subcounty offices. Because of highly segregated residential pat- terns there are many "beats" which contain black majorities even though the county as a whole has a white electoral majority. Black candidates have since 1968 done fairly well in elections for such subcounty offices as con- stable and justice of the peace. Perhaps this electoral situation which naturally occurs with greater frequency as the proportion black in- creases operates to increase voting and offsets to some extent pressures against participation. Admittedly this argument is highly speculative and ad hoc, but it does serve to identify addi- tional variables that may be important to par- ticipation but cannot be easily tapped in a study of this nature.'6
In sum, what is being suggested is that the relationship between participation and percent- age black may be a modified version of the re- lationship found before the civil rights move- ment. As a result of federal laws and voting rights activity, the potential black electorate in heavily black counties has been liberated and has become an incentive and a resource for po- litical organization. In the other counties where blacks do not constitute large voting majorities, the effects of the voting rights activities have been less pronounced, and the more traditional pattern of a negative relationship emerges, al- though even among these counties there has been some impact with mean turnout register- ing above the 30 per cent figure. By this rea- soning, the effects of the civil rights movement have been greatest in counties where the black citizenry constitutes a potentially large electoral majority. To this point the argument has been somewhat conjectural, tailored to fit the curves in Figure 1. We can do more, however, than merely debate its merits; there exists other evi- dence which can be brought to bear on its ade- quacy.
Some Mississippi counties experienced
"I There is some chance that this early negative slope may to some degree be an artifact of the composition of the counties' populations. In counties with very small black populations an even small white defec- tion may greatly affect the percentage of black turnout, since the number of whites who defect may represent a relatively large percentage of the potential black electorate. Thus, the mean turnout percentage for the counties at the extreme left end of Figure 1 may be less accurate than for counties with larger black populations.
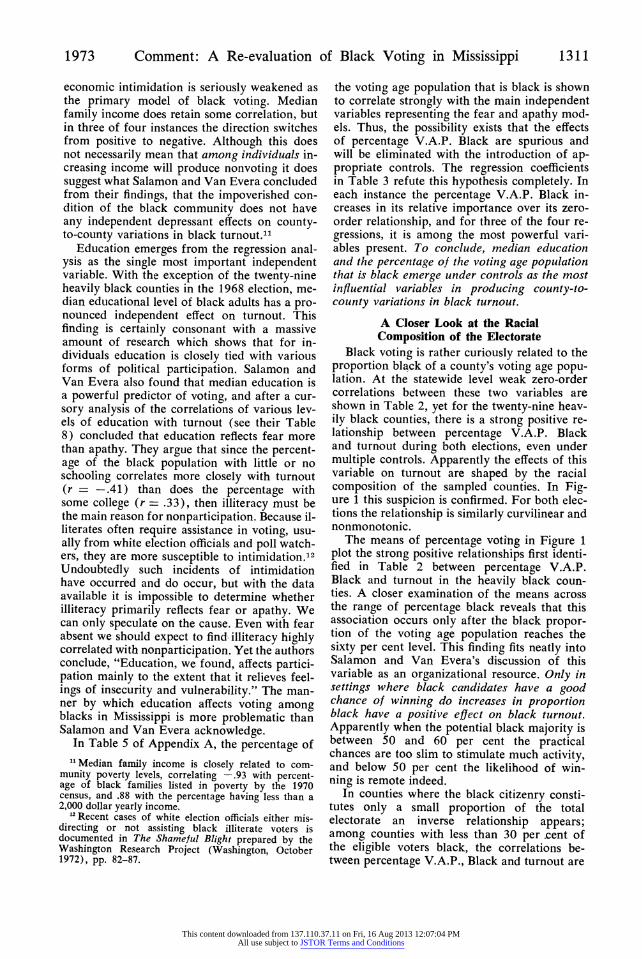
greater civil rights activity than others. For ex- ample, prior to passage of the major voting rights legislation some counties witnessed ex- tensive civil rights campaigns from outside or- ganizations such as, the NAACP, the Voter Ed- ucation Project, and in 1964 the umbrella orga- nization COFO, while others remained appar- ently untouched.17 And subsequently, although all Mississippi counties were required by the Voting Rights Act of 1965 to end de jure disen- franchisement, by 1968 less than half received federal registrars and overseers.18 In comparing counties which experienced greater and lesser degrees of civil rights activity, the explanation presented above makes several important pre- dictions: (1) Counties with potential black ma- jorities which experienced the civil rights move- ment should display a substantially larger turn- out than the overall average. (2) Counties in which this movement was largely absent should follow the pre-civil rights pattern of a negative relationship, with the turnout being lowest among counties with a large percentage of the V.A.P. Black. (3) Therefore, exposure to voting rights activity should produce its largest differ- ences (effects) among counties with potential electoral majorities.
Without in depth, county-by-county infor- mation it is impossible fully to assess the degree to which the civil rights movement "entered" and affected a given county. If we assume, however, that the presence of federal registrars in a county represents an adequate surrogate measure for more comprehensive but unavail- able data on civil rights activity we can further test the conclusion made above that the voting rights activity had its greatest effects in heavily black populated counties.19
1" Pat Watters and Reese Cleghorn, Climbing Jacob's Ladder (New York: Harcourt, Brace and World, 1967).
18 The counties which had received federal examiners by late 1967 are identified in Political Participation compiled by the United States Commission on Civil Rights (Washington: G.P.O., 1968), Table 9, pp. 244- 247.
9 There is good reason to believe that the presence of registrars is an important ingredient in black po- litical mobilization. For example, by 1968, in Missis- sippi counties with federal examiners present, 71 per cent of the black eligible voters were registered as compared to only 50 per cent registered in non- examiner counties. Harrell R. Rodgers, Jr. and Charles S. Bullock, III, Law and Social Change (New York: McGraw-Hill Book Co., 1972), p. 32. Close observers of the civil rights movement in Mississippi have often asserted that the Child Development Group of Mississippi, the umbrella agency sponsoring Head Start projects in twenty-nine counties, created in its citizen advisory councils the core of political leader- ship in these counties. This variable was found to add little explanatory power to the effects of federal registrars, however.
This content downloaded from 137.110.37.11 on Fri, 16 Aug 2013 12:07:04 PMAll use subject to JSTOR Terms and Conditions
1314 The American Political Science Review Vol. 67
60
50
40
Average Percentage Voting 30 (1968)
20
--Registrars present
10 ----No Registrars
0-29 30-44 45+
Percentage Black of V.A.P
Figure 2. The Direction of the Relationship between Black Voting Participation and Per cent of the V.A.P. that is Black is Conditioned by the Presence or Absence of Federal Registrars.
In Figure 2 we can compare voter turnout in 1968 for counties with and without federal reg- istrars. Just as predicted, voting turnout is high- est for counties where the black citizenry con- stitutes a voting age majority and federal regis- trars were present. The second prediction is also confirmed; in counties less affected by the civil rights movement (i.e., no federal regis- trars) the relationship between percentage V.A.P. Black and voting closely corresponds with the pre-civil rights movement pattern re- ported by Matthews and Prothro among others. In these counties as the percentage V.A.P. Black increases, the per cent voting decreases, especially as the proportion black reaches a po- tential electoral majority. (It should be noted that although the pattern is similar the range of variation in turnout is much smaller.) Thus the differences between counties with and without federal registrars present are greatest among those counties where the black V.A.P. is in the majority. As speculated above, one of the most important consequences of the civil rights movement appears to be the mobilization of black electoral majorities.
From the viewpoint of assessing the civil rights movement in the Deep South, we can conclude that private and governmental efforts during the mid-1960s had their greatest impact
in communities where the return should be greatest whether measured in terms of sheer numbers of new voters or in the acquisition of political power. Of course, if only a small num- ber of predominantly black counties were af- fected by the movement, then although the im- pact on them may be great, its overall signifi- cance for the extension of political equality would be minor. We can see from Table 4 that this is not the case. In fact, federal registrars went disproportionately into the predominantly black counties and as a result optimally concen- trated their energies and resources. Moreover, indications are that during the early stages of the movement when the burden was carried pri- marily by private groups the focus was similarly
Table 4. Relation Between Presence of Federal Registrars and Percentage V.A.P. Black
Registrars Present in County
Yes No
Percentage V.A.P. Black in Under 45 20 42 County
45+ I1 9
N=82 r =.40 (based on continuous percentaging)
This content downloaded from 137.110.37.11 on Fri, 16 Aug 2013 12:07:04 PMAll use subject to JSTOR Terms and Conditions

1973 Comment: A Re-evaluation of Black Voting in Mississippi 1315
on the black majority counties.20 Judged by a cost-benefit perspective, the civil rights move- ment fares well; resources and attention were focused on areas which yielded the highest re- turn.
Why Black Candidates Fail to Win Elections For those of us who value the expansion of
voting rights the preceding paragraph reports good news. Yet although the civil rights move- ment appears to have effectuated greatest change in communities containing a sizable black electorate with some chance of electoral success, expectations of frequent black victories in county elections are not being fulfilled. Even when the black electorate contains a large ma- jority the elections are usually close, and often the black candidate loses. Why is this so?
First, black voting certainly needs to expand further. Realizing that black voting early in the 1960s was virtually nonexistent, one finds it hard to gainsay the successes of the civil rights movement. Both in 1968 and 1971 forty-two per cent of the eligible black voters were vot- ing, and according to the most conservative es- timate about three-quarters of those registered voted in 1971 .21 Mass black political participa- tion is a reality; in 1971 more than 170,000 voted. Given the dire social and economic con- ditions of this subpopulation, it may be expect- ing too much to look for a substantially higher turnout in the near future. Many black citi- zens have yet to enter the system as partici- pants, and until more do so the chances for vic- tory in marginal counties are small.
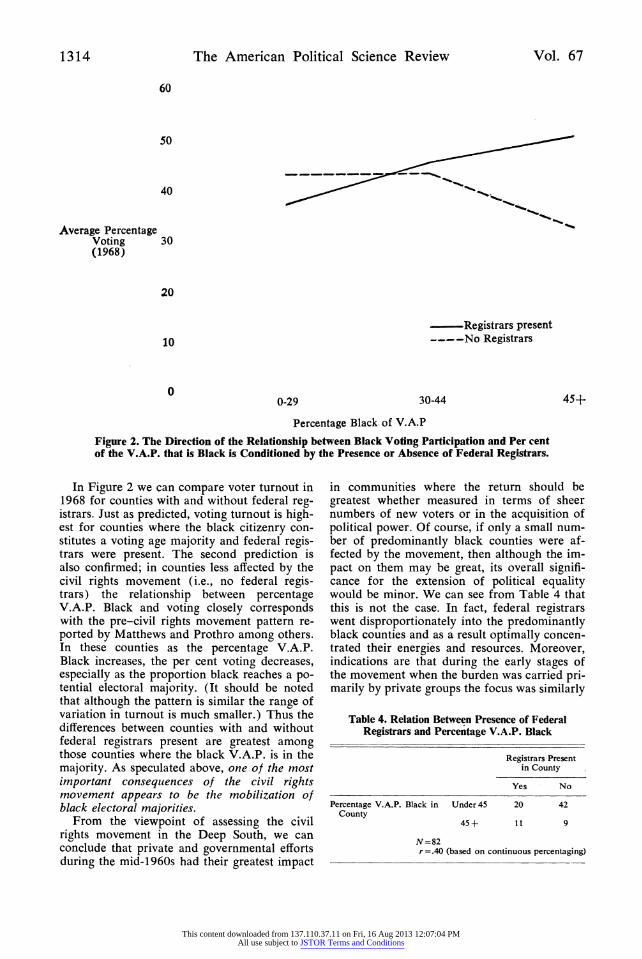
A second important variable which affects the chances of a black victory is so obvious that it is generally ignored; it is the white vote. Per- haps white turnout is intuitively viewed as a constant and for this reason is overlooked. White voter turnout, however, largely repre- sents a response to the potential and actual black turnout. White voting correlates with percentage V.A.P. Black .42 in 1968 and .46 in 1971, and it correlates with the black turnout .10 and .40 for the 1968 and 1971 elections re- spectively. The slopes of these relationships, which are plotted in Figure 3, represent the effect of the given independent variable on white turnout, the steeper the slope the greater the effect. It is interesting that in 1968 and 1971 the independent contribution of percentage V.A.P. Black is the same. This variable repre- sents in a sense the potential threat of black voting to white control. As the relative size of the black electorate (percentage V.A.P. Black)
20 Watters and Cleghorn. 21. . . In the Public Interest, p. 3.
increases, so does white turnout. This strongly suggests an important reason why black candi- dates frequently lose elections they should win. In counties where black candidates have some chance of winning, white voters are going to the polls at a very high rate and often an otherwise decent black showing is insufficient.
The second variable, the actual percentage of blacks voting probably reflects the mobilization of black voters in registration drives and election campaigns and as an index of this mo- bilization correlates highly with white turnout. Its increased impact on white turnout (com- pare the regression slopes of Figure 3A with 3B and the partial coefficients in 3C) dur- ing the 1971 election may have been due to the presence of a black candidate running for the state's highest office. Charles Evers began his gubernatorial campaign as an attempt to create a coattail to assist black candidates running for county and state legislative offices. The possibil- ity of actually winning was initially acknowl- edged as unlikely. As election day neared, how- ever, the campaign changed. Evers began solici- ting hitherto nonexistent white liberal support as well as the vote of newly enfranchised youth. Purchasing local television time, he be- gan to appeal for support from a larger constit- uency which may have diverted attention from getting out the black vote for local candidates.22 When the vote was in, his candi- dacy was rewarded with only 23 per cent of the total votes cast and spot checks of a number of all white precincts show almost total opposi- tion. The extent to which his campaigns simply increased the white turnout against him and other black candidates can only be guessed, but given the evidence that black voter mobiliza- tion has the side-effect of also increasing the white turnout, the adverse consequence may have been large. More generally, this finding suggests that black mobilization in Mississippi should proceed as quietly and inconspicuously as possible. Any effort to appeal for white sup- port will probably just make the black candi- dacy more salient to whites and result in a net loss of votes.23
Summary and Conclusion The central thesis of Salamon and Van Ev-
era's ambitious effort is that fear as measured
22. . In the Public Interest, pp. 4, 6. 23 Fred Wirt in his important study of integration
in Panola County, Mississippi, reports that this con- sideration is appreciated by candidates of both races. "A candidate active among the other race stood to gain very few votes but more likely would mobilize even more voters against him because of the adverse racial reaction." (Politics of Southern Equality [Chi- cago: Aldine, 1970], p. 161).
This content downloaded from 137.110.37.11 on Fri, 16 Aug 2013 12:07:04 PMAll use subject to JSTOR Terms and Conditions
1316 The American Political Science Review Vol. 67
A. 1968 Election
% White % White Voting Voting
I I I % V.A.P., Black % Black Voting
B. 1971 Election
% White % White Voting Voting
1- - I I , ., % V.A.P., Black % Black Voting
C. Partial regression coefficients (b's).
% V.A.P., Black % Black Voting Explained Variance (r')
1968 .28 .06 20.7%
1971 .26 .39 30.1%
Figure 3. White Voter Turnout Reflects the Level of Black Voter Mobilization.
by occupational vulnerability is the primary ex- planation of black voting. On re-examination of this explanation using an expanded data base, fear as measured does not appear to have much independent importance in explaining county- to-county variations in black turnout. This is not to say that at the individual level there are no effects, but simply that the ecological data fail to suggest it. Education, on the other hand, is found in both studies to be a powerful and stable factor in black political participation. Whether education primarily reflects the level of vulnerability to intimidation and manipula- tion or instead represents the standard political interest and awareness concomitants so fre- quently found for other populations, can with
the evidence presented here only be argued. Surely individual cases of both fear and apathy resulting from poor education could be found. It is persuasive support for the standard "apa- thy" model, however, that the level of college education among the blacks in a county is al- most as important as the county's level of black illiteracy in explaining black voting turnout.
Both studies have discovered that among heavily black populated counties, variations in the percentage black of the voting age popula- tion is an important factor in black turnout. This strong positive relationship was present for both the 1968 presidential and the 1971 gu- bernatorial elections. Salamon and Van Evera and I agree that this variable is probably indic-
This content downloaded from 137.110.37.11 on Fri, 16 Aug 2013 12:07:04 PMAll use subject to JSTOR Terms and Conditions

1973 Comment: A Re-evaluation of Black Voting in Mississippi 1317
ative of the level of organizational activity on the part of aspiring candidates as well as con- tinuing political groups within a county, but whether these organizations operate primarily to displace "fear" or "apathy" remains in doubt. By expanding the analysis to include counties with smaller black populations we find that the percentage black of the electorate changes dramatically in its relationship with turnout. At the intermediate population range (30 to 44 per cent black of V.A.P.) there is virtually no relationship with voting turnout, and among counties with a comparatively small black population the relationship actually changes direction. Additional evidence suggests that the conversion from a strongly negative to a strongly positive relationship among counties with potential black voting majorities may be one of the chief successes of the voting rights campaigns and federal voting laws of the 1960s.
Winning elections and sharing political power is not simply the result of getting out the black vote. First, in counties with a potentially large black electorate, white turnout normally is high. Second, as black organizations mobilize their own constituency with registration drives and election campaigns, they unintentionally mobilize the white vote in opposition. Conse- quently, as their turnout increases, the threshold vote necessary for winning is also raised.
Salamon and Van Evera and I agree that black voting in Mississippi is in some sense sub- ject to peculiar influences. Despite our apparent disagreement over the relative merits of certain explanations of black voting, we concur in pay- ing close attention to contextual factors not commonly found in voting research, the most important being the size of the potential black electorate. Moreover, the study of black politi- cal participation in the Deep South produces a unique confluence of several fields of inquiry in political science. Research and theory in such diverse areas as voting behavior, law and social change, and political development can all in- form and be informed by the study of black voting in this region. Thus, research into black political participation represents an opportunity not only to describe and understand the process of mass enfranchisement of the last major pop- ulation group in the country, but also may pro- vide in its uniqueness a rich field for testing the breadth and adequacy of theories of political participation and political development.
Appendix A. Index Construction All of the social and economic data have
been taken from three sources: General Popu-
nation Characteristics: Mississippi (no. 26, 1971); General Social and Economic Charac- teristics: Mississippi (no. 26, 1972), 1969 Census of Agriculture: Vol. 1 Area Reports (section 2, County Data, part 33: Mississippi).
Occupational Vulnerability. This index of eco- nomic dependency and vulnerability to white economic coercion closely follows Salamon and Van Evera's index of "most vulnerable" occu- pations given in Table 2 of their paper. This index is composed of the percentage of the county's black labor force (age 16 and over) which is either unemployed or employed as farm tenants, household workers, farm laborers and foremen; although unmentioned in their Table 2 it must be assumed that foremen were included in their count since the 1960 census also lists laborers and foremen under a single heading.24
A revised index was constructed by adding to the above occupations all black salaried agri- cultural workers and local governmental em- ployees (including school teachers). Compris- ing a somewhat larger proportion of the black labor force, this new measure correlates with the original index at .91. Since the two mea- sures are so highly correlated, the revised oc- cupational vulnerability will be dropped from the analysis, and only the measure employed by Salamon and Van Evera will be retained.
Occupational Invulnerability, Revised. It was not possible nor desirable to duplicate com- pletely the authors' "least vulnerable" cate- gory. The number of workers employed out- side their county of residence-included in their index-is not indicated in the 1970 cen- sus reports. Also, in the 1960 census, as the authors acknowledge, the "professionals" cate- gory included highly vulnerable school teach- ers. Comprising the "least vulnerable" or "in- vulnerable" occupations are farm owners, non- local government workers, nonagriculture self- employed, mining, and manufacturing.
Median Education. Unfortunately the census reports median education for the sexes sepa- rately. After an inspection of statistical rela- tionships between median education for each sex and the dependent variables confirmed that
24 Salamon and Van Evera note that schoolteachers are highly vulnerable, but because the 1960 census included teachers in the category of "professionals" they could not be included among the highly vulner- able occupations. The 1970 census which lists teachers separately permits their inclusion among the highly vulnerable. The presence of this relatively small group, however, had almost no effect on the relationships.
This content downloaded from 137.110.37.11 on Fri, 16 Aug 2013 12:07:04 PMAll use subject to JSTOR Terms and Conditions
1318 The American Political Science Review Vol. 67
% Vulnerable (1) -.59 -.74 -.41 .16
% Invulnerable (2) -.43 .73 .25 -.33
Median School (3) -.73 .23.50 -.25
Median Family Inc. (4) -.55 .02 .76 -.37
% VAP(21+) Black (5) .51 -.24 -.66 -.61
(1) (2) (3) (4) (5)
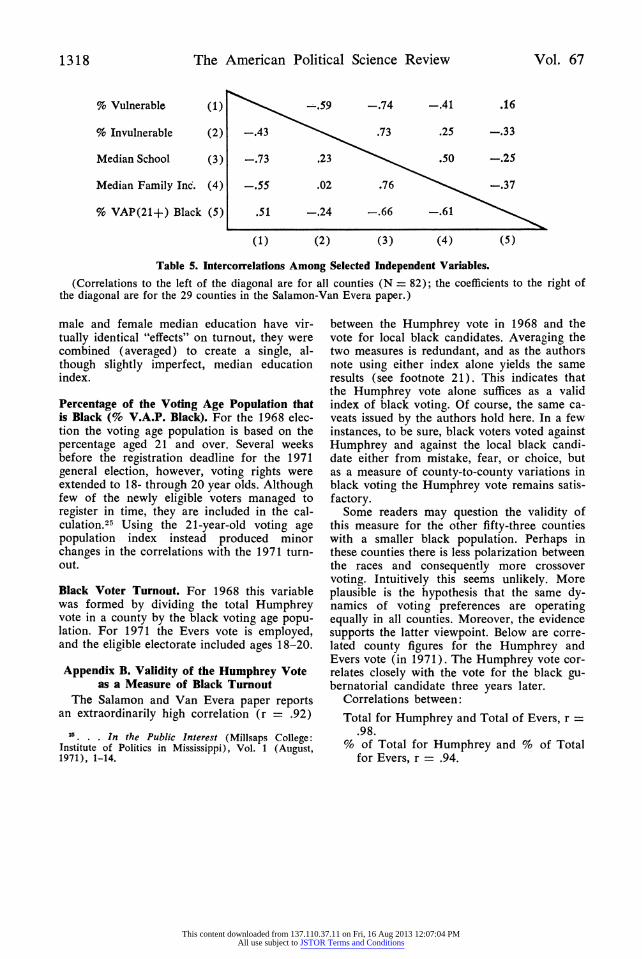
Table 5. Intercorrelations Among Selected Independent Variables.
(Correlations to the left of the diagonal are for all counties (N = 82); the coefficients to the right of the diagonal are for the 29 counties in the Salamon-Van Evera paper.)
male and female median education have vir- tually identical "effects" on turnout, they were combined (averaged) to create a single, al- though slightly imperfect, median education index.
Percentage of the Voting Age Population that is Black (% V.A.P. Black). For the 1968 elec- tion the voting age population is based on the percentage aged 21 and over. Several weeks before the registration deadline for the 1971 general election, however, voting rights were extended to 18- through 20 year olds. Although few of the newly eligible voters managed to register in time, they are included in the cal- culation.25 Using the 21-year-old voting age population index instead produced minor changes in the correlations with the 1971 turn- out.
Black Voter Turnout. For 1968 this variable was formed by dividing the total Humphrey vote in a county by the black voting age popu- lation. For 1971 the Evers vote is employed, and the eligible electorate included ages 18-20.
Appendix B. Validity of the Humphrey Vote as a Measure of Black Turnout
The Salamon and Van Evera paper reports an extraordinarily high correlation (r = .92)
25. . .In the Public Interest (Millsaps College: Institute of Politics in Mississippi), Vol. 1 (August, 1971), 1-14.
between the Humphrey vote in 1968 and the vote for local black candidates. Averaging the two measures is redundant, and as the authors note using either index alone yields the same results (see footnote 21). This indicates that the Humphrey vote alone suffices as a valid index of black voting. Of course, the same ca- veats issued by the authors hold here. In a few instances, to be sure, black voters voted against Humphrey and against the local black candi- date either from mistake, fear, or choice, but as a measure of county-to-county variations in black voting the Humphrey vote remains satis- factory.
Some readers may question the validity of this measure for the other fifty-three counties with a smaller black population. Perhaps in these counties there is less polarization between the races and consequently more crossover voting. Intuitively this seems unlikely. More plausible is the hypothesis that the same dy- namics of voting preferences are operating equally in all counties. Moreover, the evidence supports the latter viewpoint. Below are corre- lated county figures for the Humphrey and Evers vote (in 1971). The Humphrey vote cor- relates closely with the vote for the black gu- bernatorial candidate three years later.
Correlations between:
Total for Humphrey and Total of Evers, r = .98.
% of Total for Humphrey and % of Total for Evers, r = .94.
This content downloaded from 137.110.37.11 on Fri, 16 Aug 2013 12:07:04 PMAll use subject to JSTOR Terms and Conditions

![THE QUEST FOR BLACK VOTING RIGHTS IN NEW YORK STATE › centers › government-law... · 2018] THE QUEST FOR BLACK VOTING RIGHTS IN NEW YORK STATE 389 POST-INDEPENDENCE DEVELOPMENTS](https://img.pdfslide.net/doc/110x75/5f1411a58426f9390031442f/the-quest-for-black-voting-rights-in-new-york-state-a-centers-a-government-law.jpg)