Embed Size (px)
Citation preview
COMMISSION ON SALARIES
REPORT AND RECOMMENDATIONS TO THE 2013 LEGISLATURE
March 18, 2013
Members:
Michael P. Irish, Chairperson Mark R. Fox, Vice Chairperson
Chad R. Buck Lyn Flanigan
Lynn Heirakuji Stephanie N. Iona
Robert T. Wu
ii
TABLE OF CONTENTS
Executive Summary .............................................................................................. 1 Overview ................................................................................................................ 4 Process ................................................................................................................ 7 Rationales and Recommendations:..................................................................... 9 General Rationale ........................................................................................... 9 Executive Branch ............................................................................................ 10 Judicial Branch................................................................................................ 13 Legislative Branch........................................................................................... 15 Conclusion............................................................................................................. 18 Tables ................................................................................................................ 20 Table 1 - Executive Salaries and Costs........................................................... 21 Table 2 - Judicial Salaries and Costs .............................................................. 22 Table 3 - Legislative Salaries and Costs ......................................................... 22 Appendices............................................................................................................ 23
Appendix A – Appendices for Material Reviewed by the 2013 Commission on Salaries ........................................................................... 23
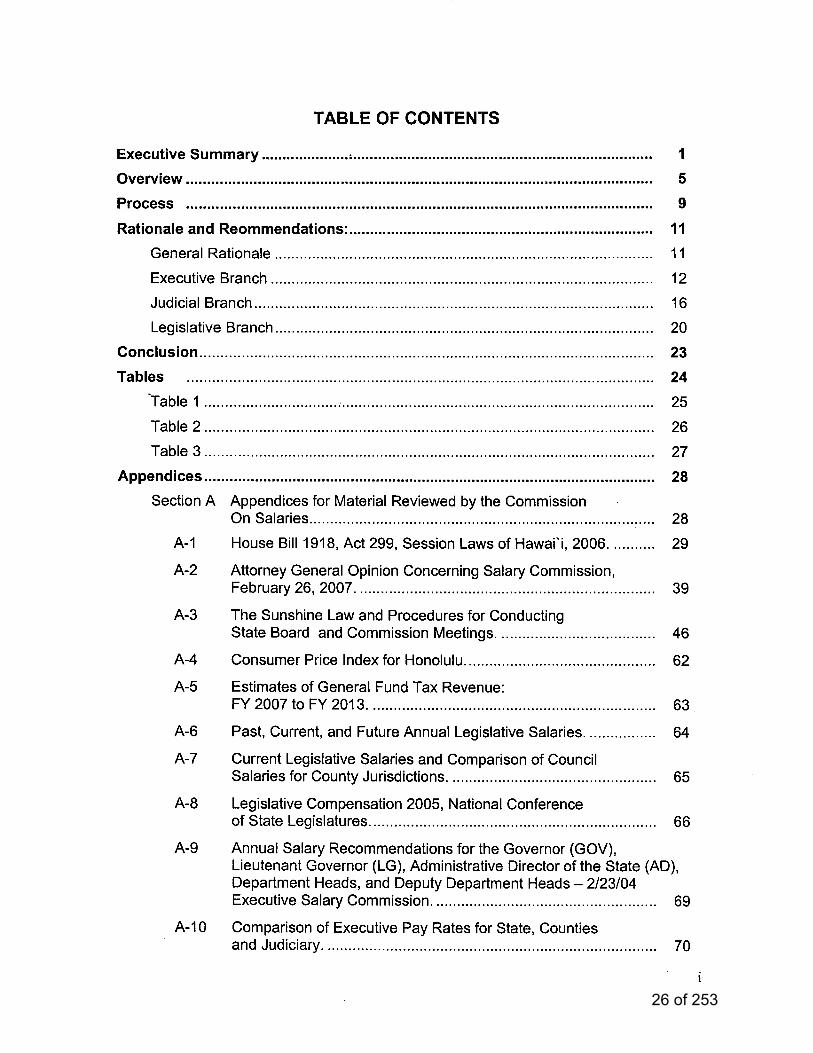
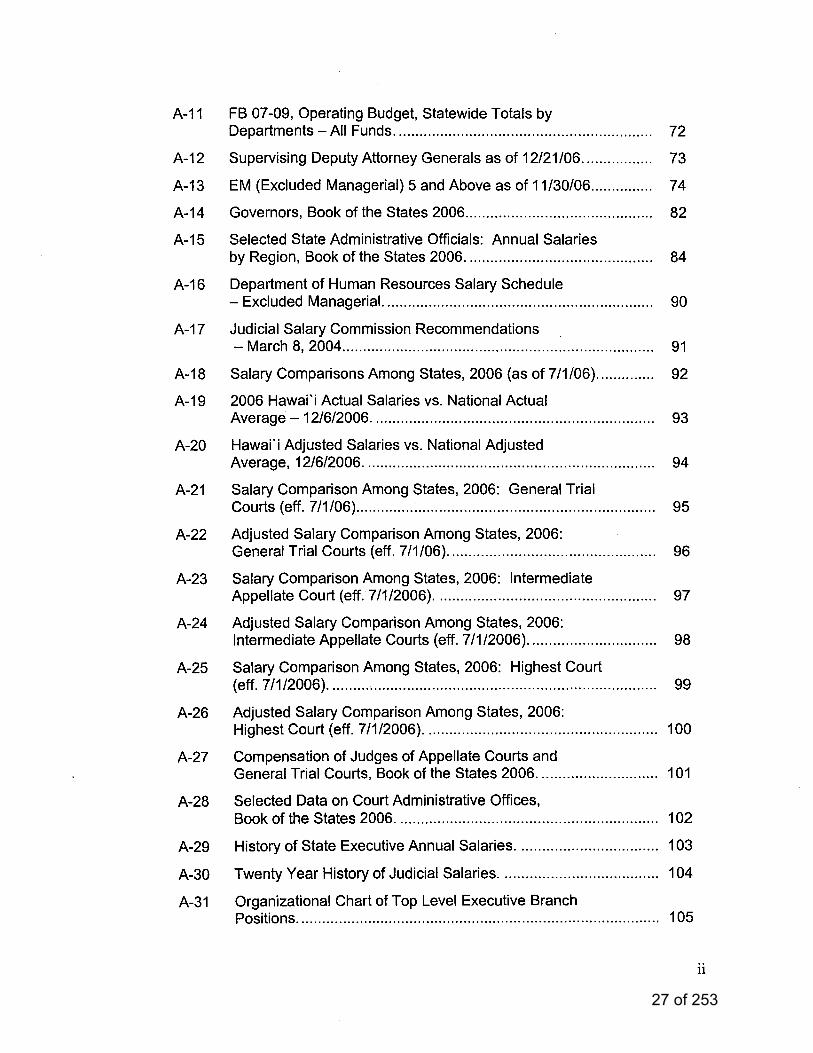
A-1 Commission on Salaries Report and Recommendations to the 2007 Legislature, March 14, 2007......................................... 24
A-2 Article XVI of the Constitution of the State of Hawai‘i...................... 56 A-3 House Bill 1744, Act 48, Session Laws of Hawai‘i 2012 ................ 57 A-4 Hawai‘i Revised Statutes, §26-56 Commission on Salaries ............ 66 A-5 Attorney General Opinion Regarding Act 299, Session
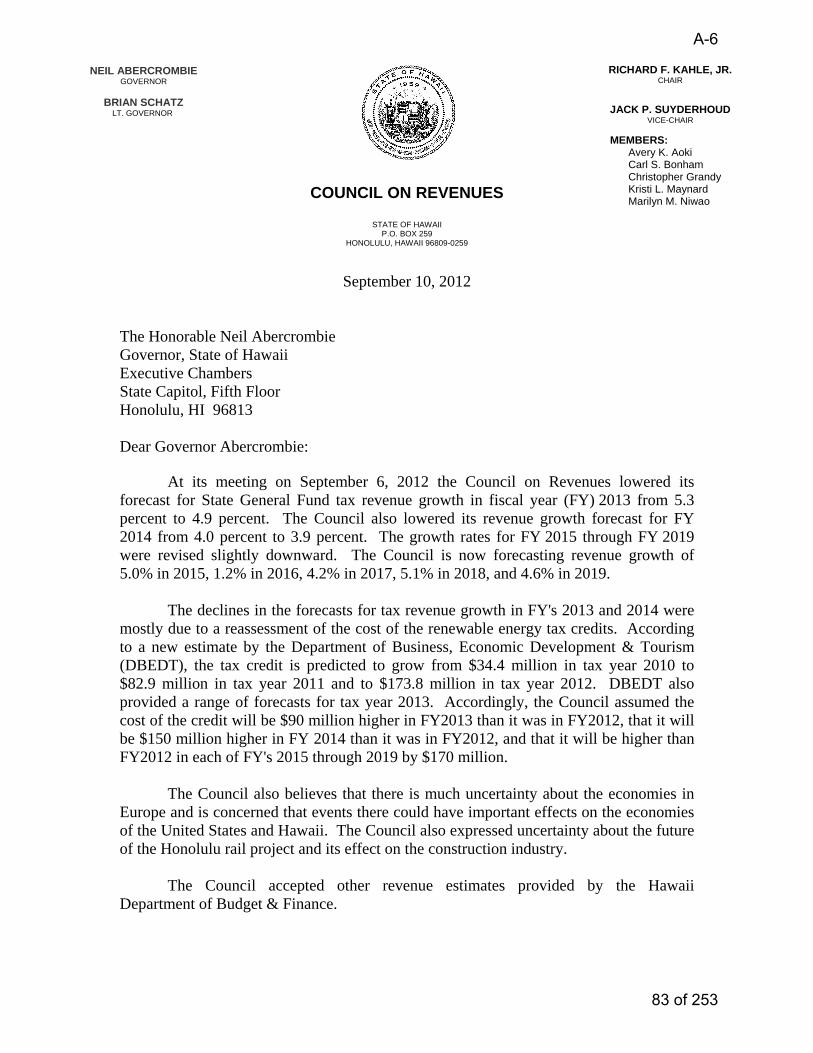
Laws of Hawai‘i 2006, February 26, 2007 ...................................... 79 A-6 Council on Revenues Report, September 10, 2012 ....................... 83 A-7 Consumer Price Index for Honolulu ............................................... 93 A-8 Overview of the State’s General Fund Fiscal Condition,
December 11, 2012........................................................................ 94 A-9 Attorney General Opinion Regarding Section §26-56,
Hawai‘i Revised Statutes; December 24, 2012 ..............................111 A-10 Occupational Pay Comparison Among Metropolitan Areas,
2010, Bureau of Labor Statistics ....................................................118 A-11 Written Testimony Submitted to the Commission on Salaries........124 A-12 Council on Revenues Report, January 7, 2013..............................126
iii
A-13 2007 Commission on Salaries Recommendations vs. Actual Salary Increases Received..................................................137
A-14 Difference between 2007 Commission on Salaries Recommendations and Actual Salaries Received..........................138
A-15 Costing Scenarios ..........................................................................142 A-16 Council on Revenues Report, March 15, 2013...............................145 Appendix B – Executive Branch Appendices .................................................155 B-1 Executive Branch Salaries from 1990 ............................................156 B-2 Executive Salaries Adjusted by Act 57, Session Laws
of Hawai‘i 2011...............................................................................157 B-3 Pay Relationships Between Executive Branch Positions ...............158 B-4 FB 11-13 Operating Budget by Department ...................................159 B-5 Collective Bargaining Adjustments from 1990 to 2013...................160 B-6 Comparison of Executive Pay Rates for the State, Counties,
and Judiciary ..................................................................................170 B-7 The Governors, The Book of the States 2010................................172 B-8 Selected State Administrative Officials: Annual Salaries,
The Book of the States 2011..........................................................174 B-9 Excluded Managerial Compensation Plan Employees
vs. Director Salaries .......................................................................180 B-10 Department of Human Resources Salary Schedule
- Excluded Managerial ...................................................................181 B-11 No. of Deputy Director Positions per Department and
Cabinet Turnover ...........................................................................182 B-12 Department of Defense Pay Schedules .........................................183 Appendix C – Judicial Branch Appendices.....................................................190 C-1 Judicial Branch Salaries from 1990................................................191 C-2 Survey of Judicial Salaries, National Center for State
Courts, January 1, 2012.................................................................192 C-3 Salary Comparison Among States, National Center for
State Courts, January 1, 2012........................................................196 C-4 The Judiciary, State of Hawai‘i, Presentation to the
Commission on Salaries ...............................................................201 C-5 2007 Commission on Salaries Recommendation vs.
National Data for Judicial Salaries. ................................................240
iv
Appendix D – Legislative Branch Appendices...............................................248 D-1 Legislative Branch Salaries from 1990...........................................249 D-2 Comparison of Legislative Pay Rates for State and
Counties in Hawai‘i.........................................................................250 D-3 2012 State Legislator Compensation and Per Diem
Table, National Conference of State Legislatures .........................251
Page 1
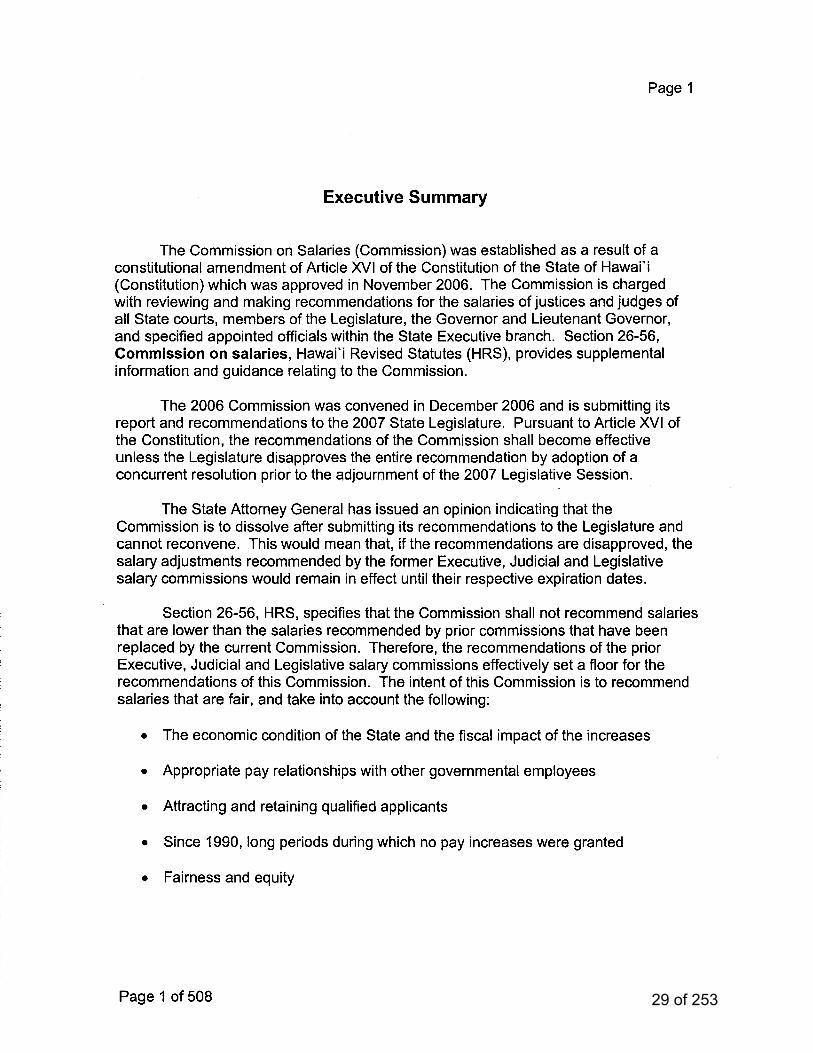
Executive Summary The Commission on Salaries (Commission) was established as a result of a constitutional amendment of Article XVI of the Constitution of the State of Hawai‘i (Constitution) which was approved in November 2006. The Commission, which is appointed every six years, is charged with reviewing and making recommendations for the salaries of justices and judges of all State courts, members of the Legislature, the Governor and Lieutenant Governor, and specified appointed officials within the State Executive branch (collectively, “Officials”). Section 26-56, Commission on salaries, Hawai‘i Revised Statutes (HRS), provides supplemental information and guidance relating to the Commission.
Pursuant to Article XVI of the Constitution, the recommendations of the Commission shall become effective unless the Legislature disapproves the entire recommendation by adoption of a concurrent resolution prior to the adjournment of the legislative session.
The Commission which was formed in 2006 (the “2007 Commission”) submitted recommendations in March of 2007 for staggered annual salary increases for the Officials from 2007 until 2013 for the Executive and Judicial branches and from 2009 to 2014 for the Legislative branch. These recommendations were forwarded by the Governor to the Legislature and were not disapproved by the Legislature and were implemented. In 2009, due to the downturn in the economy, the Legislature passed Act 85 which changed the salaries recommended by the 2007 Commission by reducing the June 30, 2009 salaries by 5% effective July 1, 2009 and freezing said salaries until June 30, 2011.
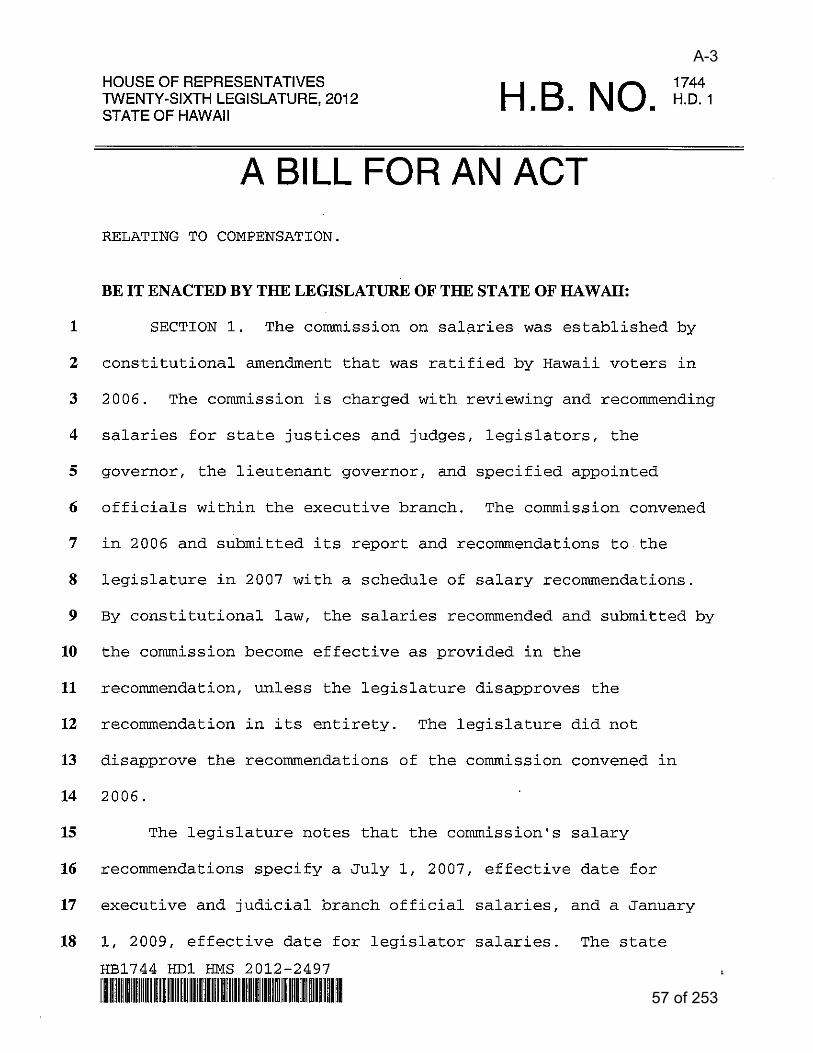
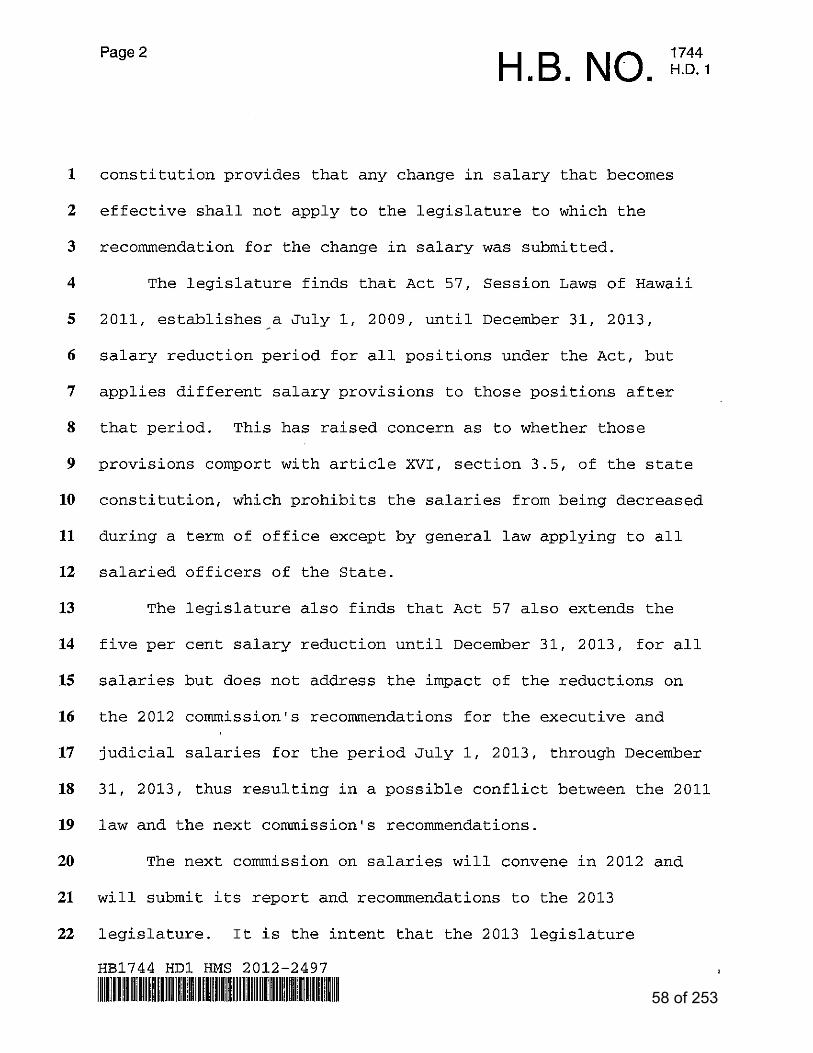
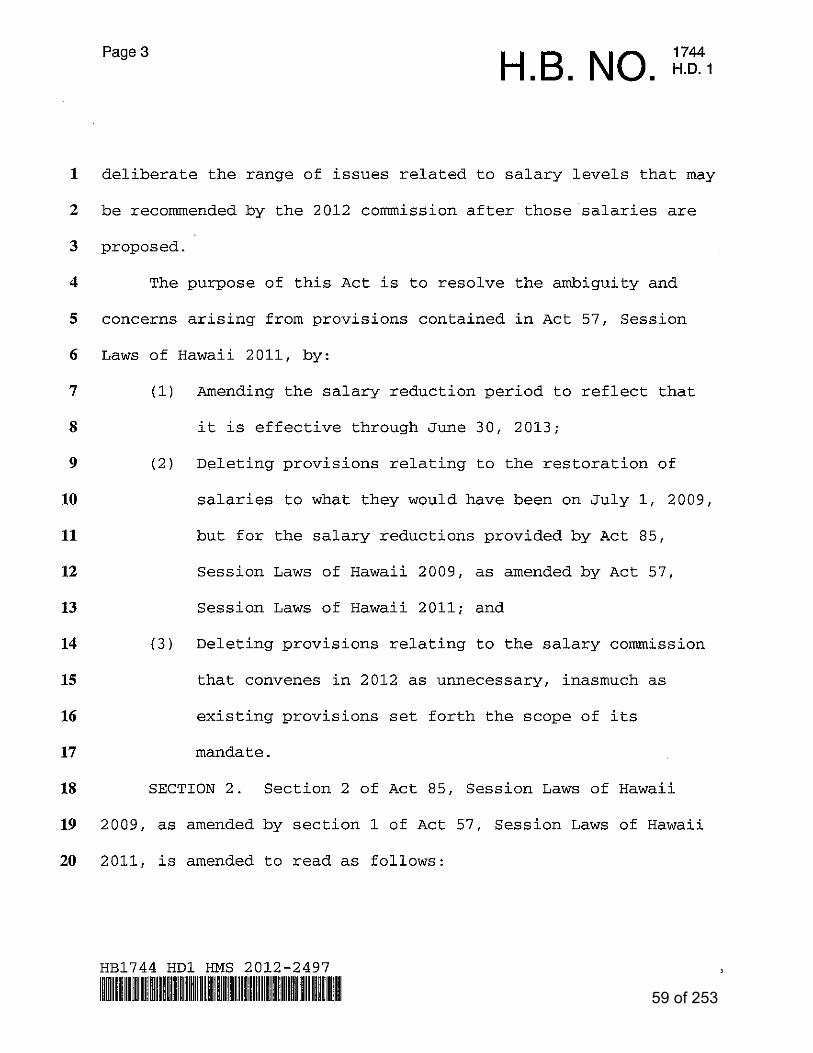
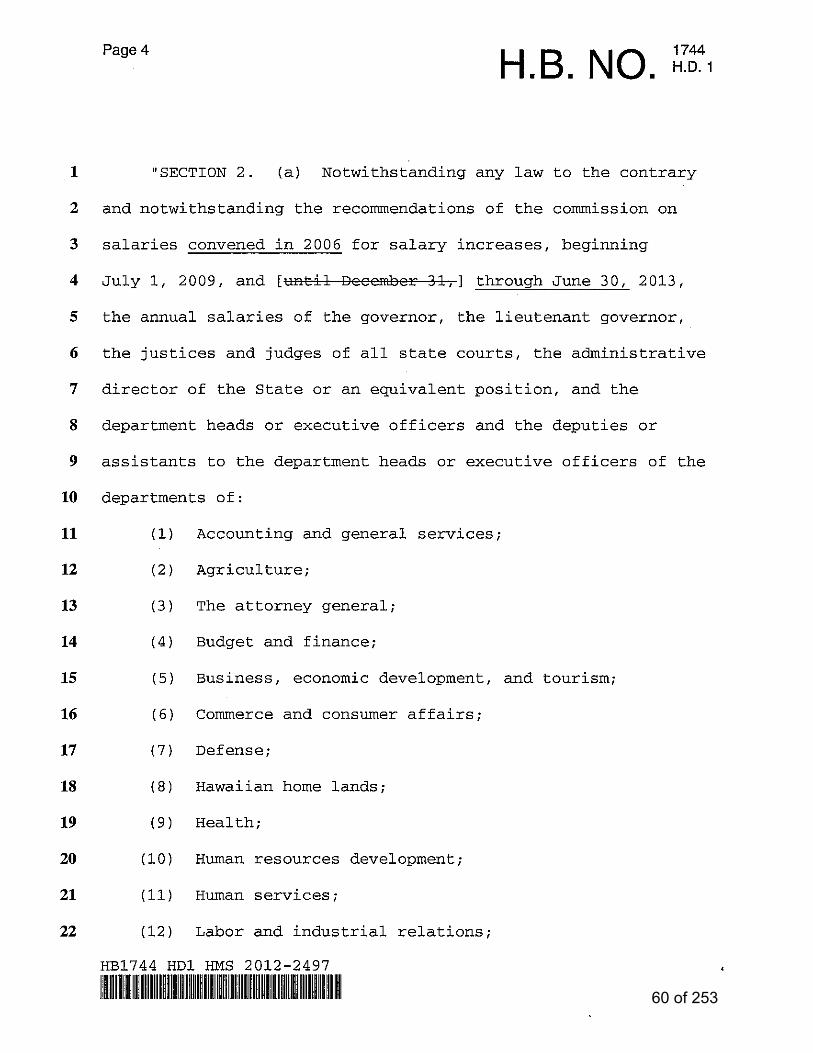
In 2011, Act 57 extended the 5% reduction and froze the reduced salaries through December 31, 2013. In 2012, Act 48 repealed Act 85, Session Laws of Hawai‘i (SLH) 2009, which changed the end date of the 5% reduction and salary freeze from December 31, 2013 to June 30, 2013. This avoids the conflict in dates between the start of the 2013 Commission1 recommendations effective July 1, 2013 for the Executive and Judicial branches and the 5% reduction and salary freeze that would continue to December 31, 2013 under Act 57, SLH 2011. In addition, Act 48 provided that the salaries recommended by the 2007 Commission be effective July 1, 2013, if the recommendations of the 2013 Commission are disapproved during the 2013 legislative session by the adoption of a concurrent resolution.
1 The 2013 Commission on Salaries was appointed in November 2012 and will make recommendations effective July 1, 2013 for the Executive and Judicial Branches and January 1, 2015 for the Legislative Branch.
1 of 253
Page 2
The 2013 Commission was convened on November 27, 2012 and is submitting its report and recommendations to the Governor for submission to the 2013 State Legislature.
In response to a request by the 2013 Commission, the State Attorney General issued an opinion regarding language in section 26-56(b), HRS that the Commission shall not establish "salaries lower than salary amounts recommended by prior commissions replaced by this section." The Attorney General opined that "prior commissions replaced by this section" refers to the abolished Executive, Judicial and Legislative salary commissions (the “2006 Commissions”) replaced by the Commission on Salaries established by Act 299, SLH 2006. Therefore, the recommendations of the 2006 Salary Commissions effectively set a floor for the recommendations of this Commission. However, the 2013 Commission could recommend salaries lower than that recommended by the 2007 Commission.
The intent of the 2013 Commission is to recommend salaries that are fair, and take into account the following:
• The economic condition of the State and the fiscal impact of the increases. • Appropriate pay relationships with other governmental employees.
• Attracting and retaining qualified employees to be the leaders of the State of
Hawai‘i.
Unless disapproved by the Legislature, the recommendations of the 2013 Commission will go into effect on July 1, 2013 for the Executive and Judicial branch officials. The recommendations for the Legislative branch officials will go into effect on January 1, 2015, because Article XVI of the Constitution states that any salary change shall not apply to the Legislature to which the recommendations were submitted. The following recommendations were unanimously adopted by the 2013 Commission: A. EXECUTIVE BRANCH RECOMMENDATIONS
• Effective July 1, 2013, continue the restoration of what would have been the June 30, 2013 salaries recommended by the 2007 Commission.
• No further increase from July 1, 2013 to June 30, 2014.
• Effective July 1, 2014; July 1, 2015; July 1, 2016; July 1, 2017; July 1, 2018 increase the salaries and salary ranges of all positions by 2% each year.
• Effective July 1, 2013, place the Budget and Finance Director and Deputy in Tier 1 and continue the recommendation of the 2007 Commission to collapse the three tiers into two: Tier 1 would then include the Attorney General, the Administrative Director of the State, and the Director of Budget and Finance.
2 of 253
Page 3
The Lieutenant Governor, while not in Tier 1, would receive a salary equal to the Tier 1 officials; Tier 2 includes all other department directors and their deputies.
• The salaries and future salary increases for the Adjutant General and Deputy
Adjutant General be set by the pay and allowance tables of the regular army or air force of the United States for officers of comparable rank and time in service over the period covered by this Commission’s recommendation.
B. JUDICIAL BRANCH RECOMMENDATIONS
• Effective July 1, 2013, continue the restoration of what would have been the June 30, 2013 salaries recommended by the 2007 Commission.
• No further increase from July 1, 2013 to June 30, 2014.
• Effective July 1, 2014; July 1, 2015; July 1, 2016; July 1, 2017; July 1, 2018 increase the salaries of justices and judges by 2% each year.
C. LEGISLATIVE BRANCH RECOMMENDATIONS
Per Act 48, SLH 2012, the Legislative branch salaries, "notwithstanding section 26-56(d), Hawai‘i Revised Statues, shall be at the rates provided for by the recommendations, dated March 14, 2007, of the commission on salaries convened in 2006." Therefore, the Legislative branch will receive the January 1, 2013 salaries recommended by the Commission convened in 2006, effective July 1, 2013; and the January 1, 2014 recommended salaries effective January 1, 2014. By HRS 26-56(d), the 2013 Commission can only make recommendations for the House and Senate from 2015 until the next commission is appointed in 2018.
• Effective January 1, 2015, January 1, 2016; January 1, 2017; and January 1,
2018 increase the salaries of senators and representatives by 2% each year.
• The President of the Senate and Speaker of the House of Representatives will continue to receive $7,500 more per year than senators and representatives.
3 of 253
Page 4
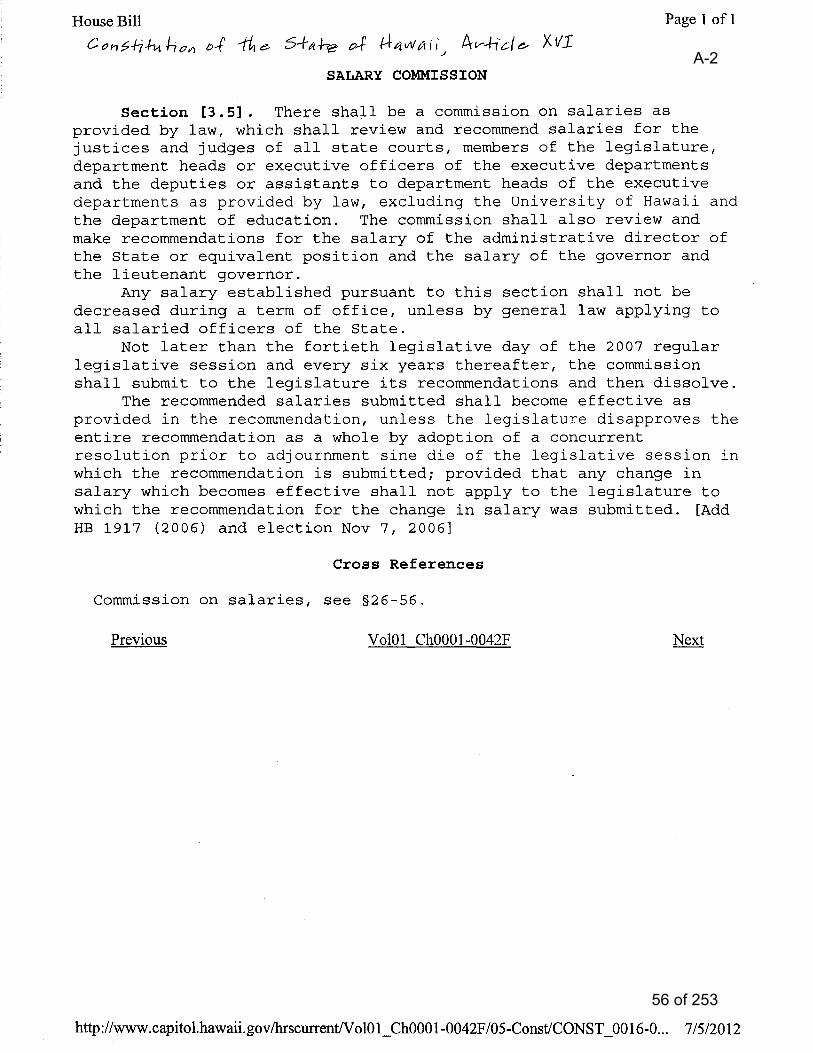
Overview Legal Framework A. Constitution and State Statutes This report fulfills Article XVI, section 3.5 of the Constitution which reads as
follows:
“SALARY COMMISSION
Section [3.5]. There shall be a commission on salaries as provided by law, which shall review and recommend salaries for the justices and judges of all state courts, members of the legislature, department heads or executive officers of the executive departments and the deputies or assistants to department heads of the executive departments as provided by law, excluding the University of Hawai‘i and the department of education. The commission shall also review and make recommendations for the salary of the administrative director of the state or equivalent position and the salary of the governor and the lieutenant governor.
Any salary established pursuant to this section shall not be decreased during a
term of office, unless by general law applying to all salaried officers of the state. Not later than the fortieth legislative day of the 2007 regular legislative session
and every six years thereafter, the commission shall submit to the legislature its recommendations and then dissolve.
The recommended salaries submitted shall become effective as provided in the
recommendation, unless the legislature disapproves the entire recommendation as a whole by adoption of a concurrent resolution prior to adjournment sine die of the legislative session in which the recommendation is submitted; provided that any change in salary which becomes effective shall not apply to the legislature to which the recommendation for the change in salary was submitted.”
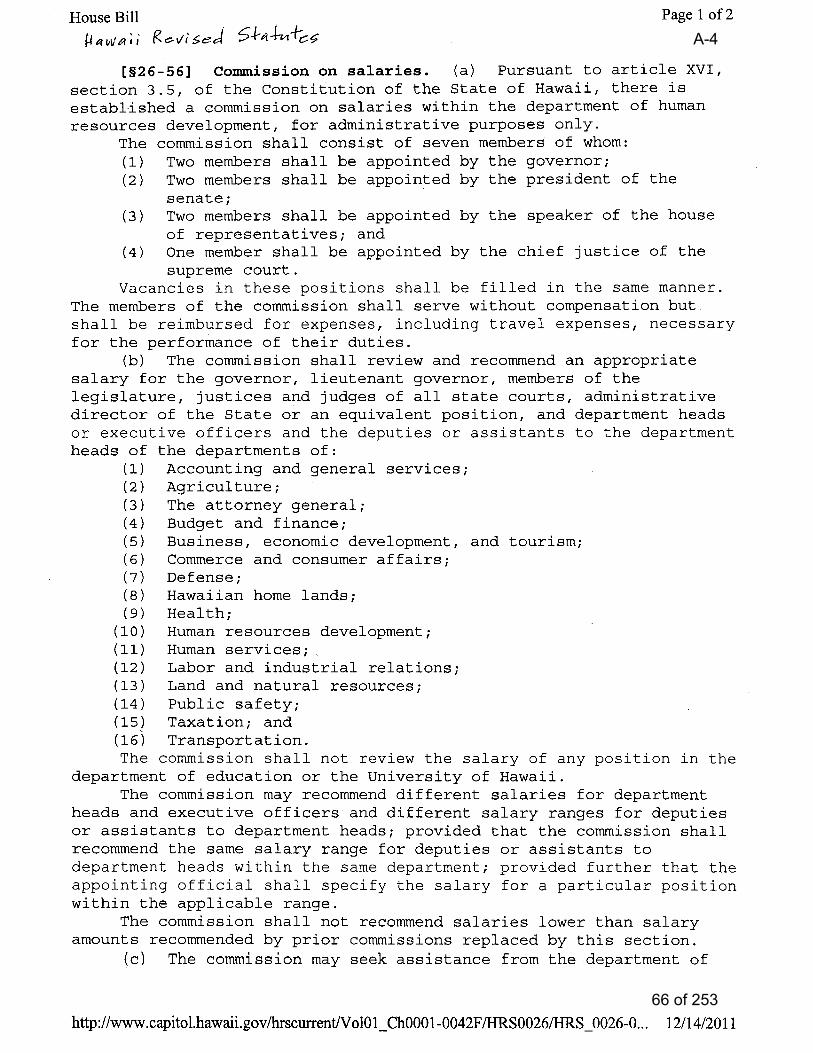
In addition, section 26-56, HRS, indicates that:
1. The Commission shall consist of seven members of whom: two members shall be appointed by the Governor, two by the President of the Senate, two by the Speaker of the House of Representatives, and one by the Chief Justice of the Supreme Court.
2. The Commission may recommend different salaries for department heads
and executive officers and different salary ranges for deputies or assistants to department heads; provided that the Commission shall recommend the same salary range for deputies or assistants to
4 of 253
Page 5
department heads within the same department; provided further that the appointing official shall specify the salary for a particular position within the applicable range.
3. The Commission shall not recommend salaries lower than salary amounts
recommended by prior Commissions replaced by this section, however, may recommend salaries lower than the recommendations of the 2007 Commission.
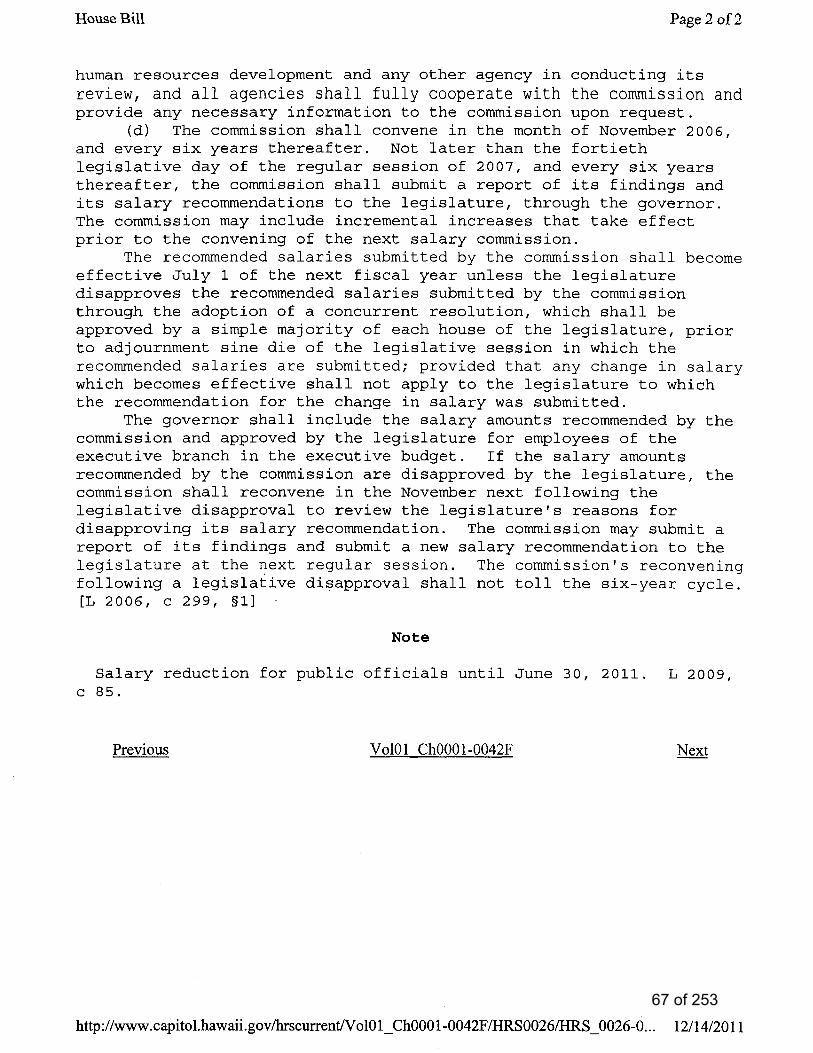
4. Not later than the fortieth legislative day of the regular session of 2007, and every six years thereafter, the Commission shall submit a report of its findings and its salary recommendations to the Legislature, through the Governor. The Commission may include incremental increases that take effect prior to the convening of the next salary Commission, which will be in November 2018.
5. The recommended salaries submitted by the Commission shall become effective July 1 of the next fiscal year unless the Legislature disapproves the recommended salaries submitted by the Commission through the adoption of a concurrent resolution, which shall be approved by a simple majority of each house of the Legislature, prior to adjournment sine die of the legislative session in which the recommended salaries are submitted; provided that any change in salary which becomes effective shall not apply to the Legislature to which the recommendation for the change in salary was submitted.
6. Effective July 1, 2007, and every six years thereafter, the salary of the Adjutant General shall be as last recommended by the Commission, pursuant to Section 26-56, HRS, unless rejected by the Legislature, except that if the State salary is in conflict with the pay and allowance fixed by the tables of the regular army or air force of the United States, the latter shall prevail.
7. The Governor shall include the salary amounts recommended by the Commission and approved by the Legislature for employees of the Executive branch in the Executive budget.
In 2009, due to the downturn in the economy, the Legislature passed Act 85 which changed the salaries recommended by the 2007 Commission by reducing the June 30, 2009 salaries by 5% and freezing said salaries effective July 1, 2009 to June 30, 2011.
In 2011, Act 57 extended the 5% reduction and freeze of salaries to December
31, 2013.
5 of 253
Page 6
In 2012, Act 48 repealed Act 85, SLH 2009 as amended by Act 57, SLH 2011; resulting in a change to the end date of the 5% reduction and freeze from December 31, 2013 to June 30, 2013. This avoids the conflict in dates between the start of the 2013 Commission recommendations effective July 1, 2013 for the Executive and Judicial branches and the 5% reduction and freeze that would continue to December 31, 2013 under Act 57, SLH 2011. In addition, Act 48 provided that the salaries recommended by the 2007 Commission be effective July 1, 2013, if the recommendations of the 2013 Commission are disapproved during the 2013 legislative session by the adoption of a concurrent resolution.
B. Attorney General Opinion
An Attorney General Opinion dated December 24, 2012, opines that section 26-56, HRS which states "[t]he commission shall not recommend salaries lower than salary amounts recommended by prior commissions replaced by this section." refers to the 2006 Commissions that were abolished and replaced by the single Commission on Salaries established by Act 299, SLH 2006.
Therefore, the Commission may recommend salaries that are lower than the 2007 Commission's recommendations but, not lower than the separate salary commissions that were abolished in 2006. Furthermore, section 26-56(d), HRS sets limits for "incremental increases that take effect prior to the convening of the next salary commission." The 2007 Commission recommended increases effective January 1, 2013 and January 1, 2014, which is contrary to the statute since the 2013 Commission convened in November 2012. However, Act 48, SLH 2012 trumped section 26-56(d) by the statement, "notwithstanding section 26-56(d), Hawai‘i Revised Statutes, [salary increases] shall be at the rates provided for by the recommendations dated March 14, 2007, of the commission on salaries convened in 2006." Therefore, based on Act 48, SLH 2012, the January 1, 2013 and January 1, 2014, recommendations of the 2007 Commission are valid salaries for the Legislative branch.
The Commission notes the March 13, 2013 filing of House Resolution No. 191 and House Concurrent Resolution No. 236 at the Legislature urging that the Commission “suspend the automatic salary increase and extend the salary reduction for members of the Legislature until Hawaii’s economic forecast reflects greater growth and vitality.” The Commission notes, however, that the provisions of Act 48 precludes such actions and only allow the Commission to make salary recommendations for the Legislature beginning January 1, 2015 as stated above.
2013 Commission on Salaries
This is the report and recommendations of the 2013 Commission, which covers the Executive, Judicial and Legislative branches.
6 of 253
Page 7
Process
The Commission was convened on November 27, 2012. At that time, Commissioner Michael Irish was elected as Chairperson and Commissioner Mark Fox was elected as Vice-Chairperson. A brief orientation was provided by staff of the Department of Human Resources Development (DHRD) and there was agreement on a tentative meeting schedule. Commissioners were provided with a folder of documents to review. They decided to set up investigatory meetings, following the guidelines of the Sunshine Law, to gather information from each of the branches. Selected as point person to coordinate for the respective branches were Lynn Heirakuji for the Executive branch, Mark Fox for the House, Robert Wu for the Senate, and Michael Irish for the Judiciary. The Commission also expressed their interest in scheduling the State Budget and Finance Director and a representative from the Council on Revenues to make presentations on the fiscal outlook for the State.
Oral testimony from the public was solicited at all meetings, but none was received.
The second meeting of the Commission was held on December 11, 2012. Kalbert Young, Director of the Department of Budget and Finance made a presentation regarding the fiscal condition of the State. Dr. Jack Suyderhoud, Vice-Chair of the Council on Revenues spoke about the process of how the Council on Revenues makes their projections. Follow up reports were also made by Commission members on their investigatory outreach with the Executive and Legislative branches.
The third meeting of the Commission was held on December 18, 2012. Tom Mick and Dan Seto from the Judiciary made a presentation regarding the salaries of judges. Commissioners also shared information gathered from their investigatory outreach with members of the Executive and Legislative branches. Requested information regarding salaries and costing was reviewed by the Commission.
The fourth meeting of the Commission was held on January 8, 2013. There was discussion regarding the outcome of the Attorney General opinion which generally concluded that the salaries for each branch cannot be lower than the recommendations made by the three separate commissions (Executive Salary Commission, Judicial Salary Commission, and Legislative Salary Commission) that were abolished in 2006. In addition, the Legislative branch will receive the salary increases recommended by the 2007 Commission for January 1, 2013, to be effective July 1, 2013; and for January 1, 2014, to be effective on that date. After review of data and materials before the Commission, a motion was made and passed to follow the recommendations of the 2007 Commission and to collapse the tiers for the directors and deputies from three down to two.
The fifth meeting of the Commission was held on January 22, 2013. Written testimony from the Director of the DHRD and the Chief Negotiator for the Office of
7 of 253

Page 8
Collective Bargaining was distributed. In their written testimony, they requested that the Commission consider the State's budget challenges and the fiscal constraints on public employee bargaining when making their decisions. The Commission requested that an invitation be extended to the Director and Chief Negotiator to attend the next Commission meeting. The Council on Revenues January 7, 2013 report, as well as reports on the difference between the 2007 Commission salary recommendation versus the actual salaries received, and various costing scenarios, were reviewed. The 2013 Commission reaffirmed its decision to continue the salary recommendations of the 2007 Commission, with increases in subsequent years.
The sixth meeting of the Commission was held on February 12, 2013. Barbara Krieg, DHRD Director and Neil Dietz, Chief Negotiator for the Office of Collective Bargaining spoke to the Commission regarding their written testimony that was distributed at the last Commission meeting. The Commissioners then discussed rationales for various scenarios and agreed to come to the next meeting prepared with their recommendation and supporting rationale for their decision.
Meetings were held on February 26, March 5, March 12, and March 18 for the purpose of conducting a page by page review of the draft report.
8 of 253
Page 9
Rationales and Recommendations
General Rationale The Commission’s general rationale is that, in the context of public and private sector salaries at both the local and national level, the compensation of the elected and appointed officials should be fair and equitable and sufficient to attract and retain highly qualified individuals, while at the same time being prudent in the expenditure of public funds.
9 of 253
Page 10
Executive Branch
In reaching its recommendations for the “executive salaries,” the Commission
reviewed the compensation of State of Hawai‘i managers covered by the Excluded Managerial Compensation Plan (EMCP).
Additionally, salaries of county executives were reviewed, i.e., mayors, deputy managing directors, department directors, deputy department directors, prosecuting attorneys, etc., for the City and County of Honolulu, Hawai‘i County, Maui County and Kauai County.
The Book of the States 2011 edition was reviewed to determine how other jurisdictions compensated their respective governors, lieutenant governors, and comparable department directors.
After reviewing the materials cited above and additional information, the Commission determined that pay equity and compensation levels need to be addressed for executive salaries if the State is to recruit and retain qualified executives to the Executive branch of government. It is important to remember that the Governor, Lieutenant Governor, Administrative Director, department directors, deputy directors, etc., administer programs that affect the health and welfare of our residents, and which have annual budgets that collectively exceed $7.9 billion per year. The State needs to recruit and retain the “best and brightest” for these positions because of the daily impact these positions have on our State.
Executives in the public service are expected to work extended hours; participate
in community service events, forums and meetings; be accessible on a 24-hour, 7-day-a-week basis for emergency situations; and exercise effective leadership in addressing emergency and crisis situations. Many could easily secure higher paying jobs in the private sector but instead chose to take on these high impact, high profile, demanding and time limited jobs because of their commitment to public service. It was also noted by the Commission that directors and deputy directors are generally at the top of their professions, often with graduate degrees (including JDs, MDs, Masters’, Ph,D.s, in various fields) and several years of specialized experience qualifying them for the positions.
Internally within the State, the pay equity issue needs to be addressed because several department directors and deputies earn less than the civil service managers that they supervise. There are currently 20 excluded (from collective bargaining coverage) managerial employees in the Excluded Managerial Compensation Plan (EMCP) who are being paid more than the Attorney General at the Tier 1 level. At the Tier 2 level, there are 40 excluded managerial employees in the EMCP who are paid more than department directors at Tier 2; and 56 excluded managerial employees (19%) being paid more than the department directors in the Tier 3 level. The salaries of excluded
10 of 253
Page 11
managerial employees not only exceed the salaries of the department directors, but also the salaries of the deputy directors who in many cases directly supervise them.
Furthermore, in the past, EMCP managers served as an excellent pool from
which to recruit directors or deputy directors. As long term employees, many have extensive backgrounds and the technical expertise to lead the department, and could have an immediate positive impact since they're already knowledgeable about departmental operations. However, in recent years, the salaries of the directors and deputies are close to, and sometimes below the salaries of EMCP managers, therefore there is little financial incentive for these employees to be interested in these positions.
Externally, there are no comparable positions in the other jurisdictions in Hawai‘i to match the Governor, Lieutenant Governor, and Attorney General positions since they are unique with their statewide scope and responsibility. However, comparison with the City and County of Honolulu Mayor, Managing Director, and Prosecuting Attorney show all three State positions are paid below these three City jobs.
The general fund tax revenue projections from the January 3, 2013 meeting of
the Council on Revenues show projected increases of 6.8%, 6.2%, 1.4%, 4.2%, 5.0%, and 4.7% for the FY 2014, FY 2015, FY 2016, FY 2017, FY 2018 and FY 2019; respectively. The general fund tax projections from the March 13, 2013 meeting of the Council on Revenues show projected increases of 7.3%, 6.8%, 1.4%, 4.2%, 5.0%, and 4.7% for the FY 2014, FY 2015, FY 2016, FY 2017, FY 2018 and FY 2019; respectively.
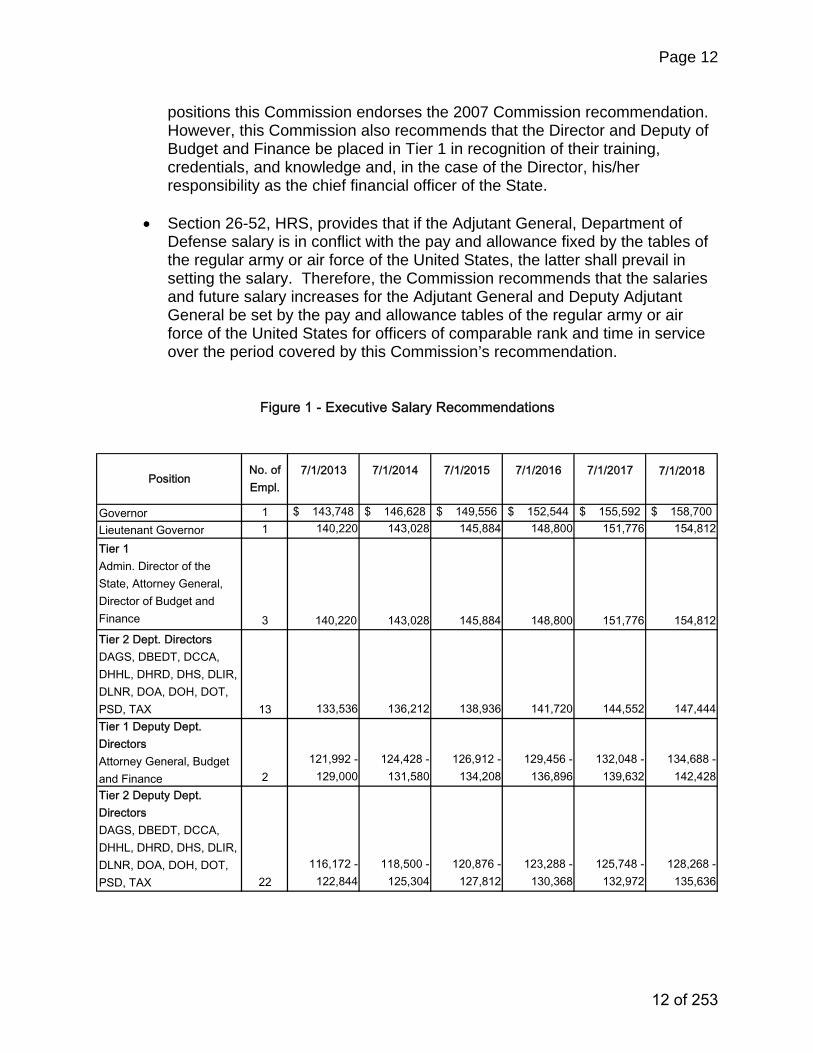
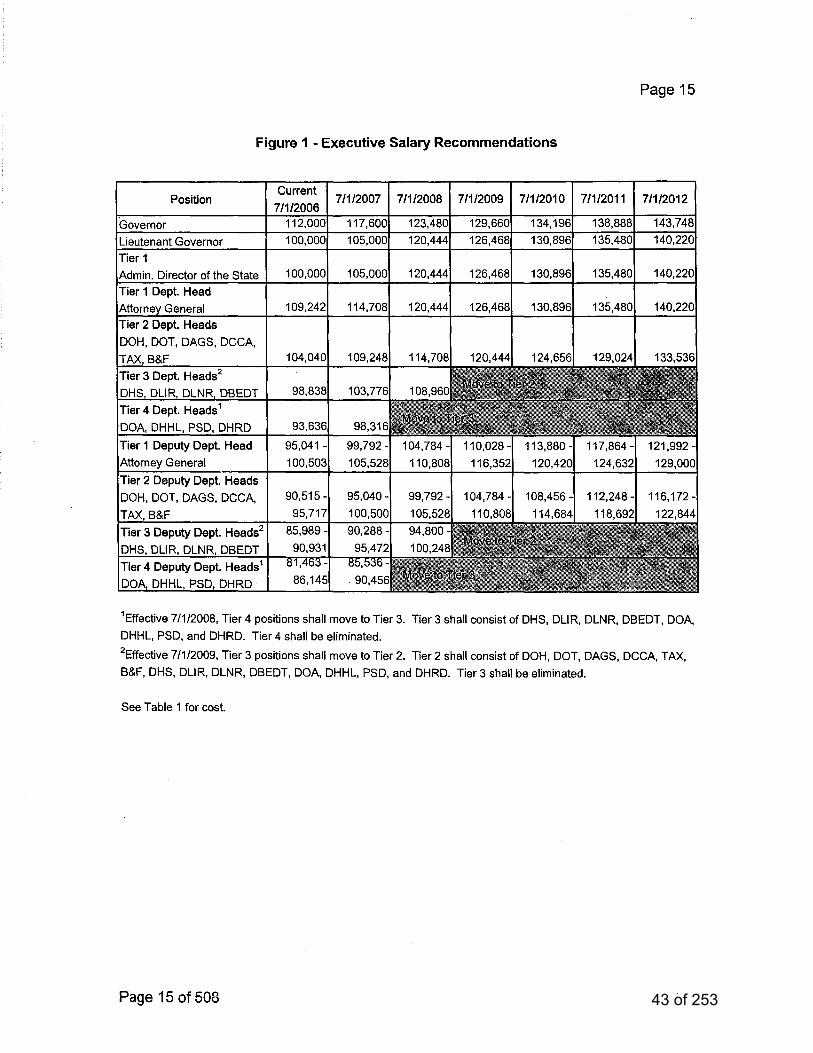
To address the issue of pay equity and compensation level, the following recommendations are made by the Commission (see Figure 1).
• Effective July 1, 2013, continue the restoration of what would have been the June 30, 2013 salaries recommended by the 2007 Commission.
• No further increase from July 1, 2013 to June 30, 2014.
• Effective July 1, 2014; July 1, 2015; July 1, 2016; July 1, 2017; July 1, 2018 increase the salaries and salary ranges of all positions, and for deputies the ranges, by 2% each year.
• Effective July 1, 2013, place the Budget and Finance Director and Deputy in Tier 1 and continue the recommendation of the 2007 Commission to collapse the three “tiers” into two: Tier 1 includes the Attorney General and the Administrative Director of the State. The Lieutenant Governor, while not in Tier 1, would receive a salary equal to the Tier 1 officials; Tier 2 includes all other department directors and their deputies.
The 2007 Commission recommended that the four tiered salary structure for department directors and deputies be collapsed to two tiers. In recognition of the comparable complexity and demands inherent to each of these executive
11 of 253
Page 12
positions this Commission endorses the 2007 Commission recommendation. However, this Commission also recommends that the Director and Deputy of Budget and Finance be placed in Tier 1 in recognition of their training, credentials, and knowledge and, in the case of the Director, his/her responsibility as the chief financial officer of the State.
• Section 26-52, HRS, provides that if the Adjutant General, Department of Defense salary is in conflict with the pay and allowance fixed by the tables of the regular army or air force of the United States, the latter shall prevail in setting the salary. Therefore, the Commission recommends that the salaries and future salary increases for the Adjutant General and Deputy Adjutant General be set by the pay and allowance tables of the regular army or air force of the United States for officers of comparable rank and time in service over the period covered by this Commission’s recommendation.
7/1/2018
Governor 1 $ 143,748 $ 146,628 $ 149,556 $ 152,544 $ 155,592 $ 158,700 Lieutenant Governor 1 140,220 143,028 145,884 148,800 151,776 154,812
Tier 2 Dept. DirectorsDAGS, DBEDT, DCCA, DHHL, DHRD, DHS, DLIR, DLNR, DOA, DOH, DOT, PSD, TAX 13 133,536 136,212 138,936 141,720 144,552 147,444Tier 1 Deputy Dept. DirectorsAttorney General, Budget and Finance 2
121,992 - 129,000
124,428 - 131,580
126,912 - 134,208
129,456 - 136,896
132,048 - 139,632
134,688 - 142,428
Tier 2 Deputy Dept. DirectorsDAGS, DBEDT, DCCA, DHHL, DHRD, DHS, DLIR, DLNR, DOA, DOH, DOT, PSD, TAX 22
116,172 - 122,844
118,500 - 125,304
120,876 - 127,812
123,288 - 130,368
125,748 - 132,972
128,268 - 135,636
7/1/20177/1/2013 7/1/2014 7/1/2015 7/1/2016Position
No. of Empl.
Figure 1 - Executive Salary Recommendations
Tier 1Admin. Director of the State, Attorney General, Director of Budget and Finance 3 140,220 143,028 145,884 148,800 151,776 154,812
12 of 253
Page 13
Judicial Branch
The objectives in setting salaries for the Judicial branch are to create the most qualified judicial applicant pool, and to retain an experienced judiciary by providing fair and just compensation for Hawai‘i's justices and judges.
In order to achieve this, the Commission considered the following:
1) The academic training, skill and experience required for judicial positions.
Judges must be licensed attorneys (among other qualifications, have earned a Juris Doctor from an accredited institution of higher learning); and must have a minimum 5 years as a licensed attorney to qualify for the District Court judge position and minimum 10 years to qualify for the Circuit Court judge position.
2) The lack of opportunity for judges to earn other income. Judges are constitutionally prohibited from practicing law, running for, or holding any other office or position of profit, including paid service on for-profit boards.
3) Turnover was 10% in 2009 when 9 judges voluntarily retired during the year in which the salary cuts and freeze were implemented. This number of voluntary retirements is high compared to the 1 in 2007, 2 in 2008, 2 in 2010 and 4 in 2011 (these figures do not include constitutionally mandated retirements due to reaching age 70).
4) The general fund tax revenue projections from the January 3, 2013 meeting of the Council on Revenues show projected increases of 6.8%, 6.2%, 1.4%, 4.2%, 5.0%, and 4.7% for the FY 2014, FY 2015, FY 2016, FY 2017, FY 2018 and FY 2019; respectively. The general fund tax projections from the March 13, 2013 meeting of the Council on Revenues show projected increases of 7.3%, 6.8%, 1.4%, 4.2%, 5.0%, and 4.7% for the FY 2014, FY 2015, FY 2016, FY 2017, FY 2018 and FY 2019; respectively.
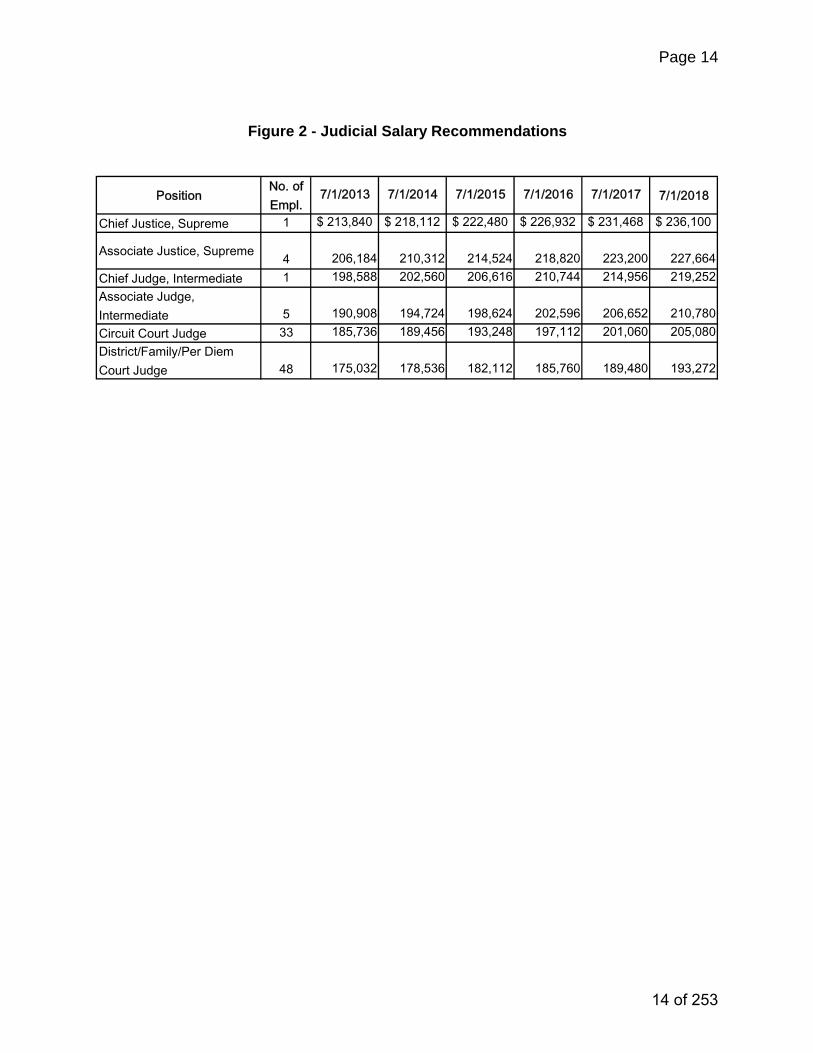
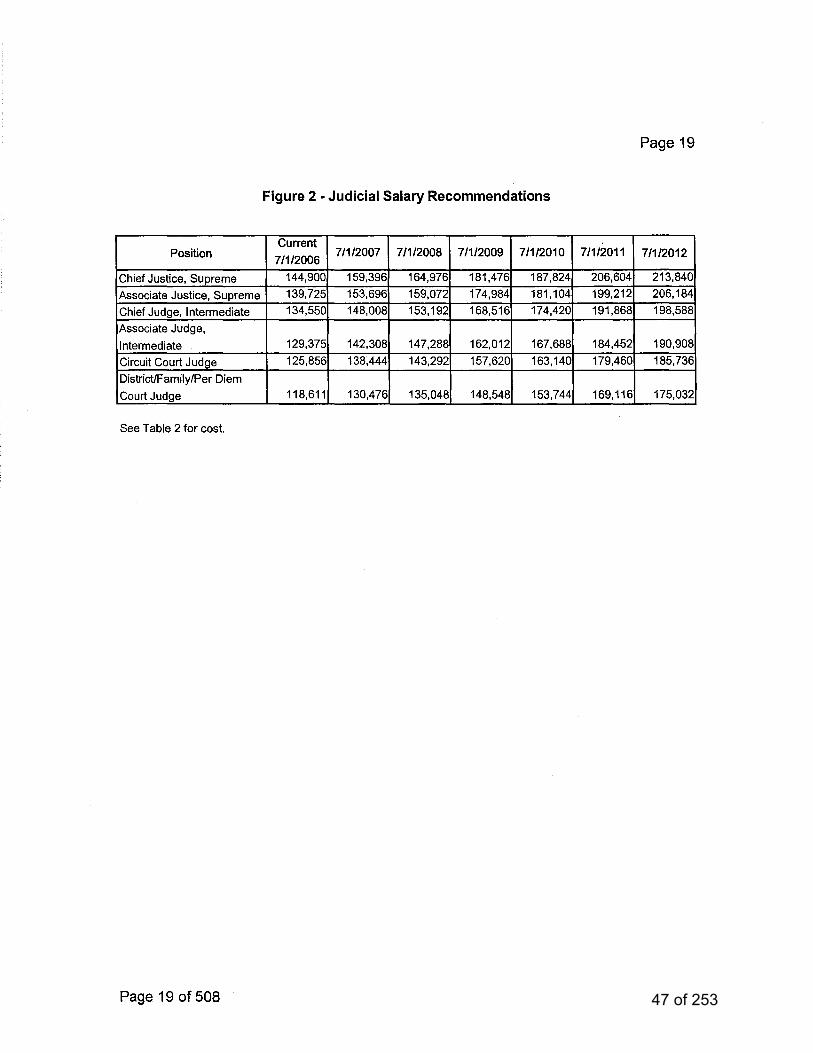
The Commission’s recommendations for the Judicial branch are as follows (see Figure 2):
• Effective July 1, 2013, continue the restoration of what would have been the June 30, 2013 salaries recommended by the 2007 Commission.
• No further increase from July 1, 2013 to June 30, 2014.
• Effective July 1, 2014; July 1, 2015; July 1, 2016; July 1, 2017; July 1, 2018 increase the salaries of justices and judges by 2% each year.
13 of 253
Page 14
PositionNo. of Empl.
7/1/2018
Chief Justice, Supreme 1 $ 213,840 $ 218,112 $ 222,480 $ 226,932 $ 231,468 $ 236,100
Associate Justice, Supreme 4 206,184 210,312 214,524 218,820 223,200 227,664Chief Judge, Intermediate 1 198,588 202,560 206,616 210,744 214,956 219,252Associate Judge, Intermediate 5 190,908 194,724 198,624 202,596 206,652 210,780Circuit Court Judge 33 185,736 189,456 193,248 197,112 201,060 205,080District/Family/Per Diem Court Judge 48 175,032 178,536 182,112 185,760 189,480 193,272
7/1/20177/1/2015 7/1/2016
Figure 2 - Judicial Salary Recommendations
7/1/2013 7/1/2014
14 of 253
Page 15
Legislative Branch
In formulating recommendations on salary adjustments for members of the State Legislature, the Commission sought to provide recommendations that were fair and equitable given the duties, time commitment, responsibilities, and historical and comparative pay of legislators. In order to achieve this, the Commission considered the following:
1) State legislators’ policy making, budgetary, fact finding, community and
constituent service responsibilities require much more than full-time attention during the four-month legislative session and considerable time and attention when the Legislature is out of session.
2) The demands on State legislators, the time required to fulfill their duties, and real and perceived conflicts of interest limit legislators’ ability to supplement their income through outside employment.
3) Legislator salaries remained unchanged from 1993 to 2005 at $32,000 ($37,000 for Senate President and House Speaker). Small incremental increases were achieved in 2005 and 2007 to move legislator pay to $35,900 ($43,400 for Senate President and House Speaker).
4) Following recommendations of the 2007 Salary Commission to achieve salary levels more commensurate with duties and responsibilities, legislators received a significant increase in pay on January 1, 2009 to $48,708 ($56,208 for President and Speaker),
5) Legislator salaries were then reduced by 5% on July 1, 2009 (Act 85, Session Laws of Hawai‘i 2009) to $46,272 ($53,400 for President and Speaker), where they stand as of the date of this report.
6) The annual salary for State legislators is currently between $1,500 and $20,000 below the salaries of Council members from each of the four Counties. Annual salary for the Senate President and House Speaker is currently approximately the same as the Council Chair from Hawai‘i County, but is between $5,200 and $18,000 less than the Council Chairs from the other three Counties.
7) All legislators receive $5000 for miscellaneous legislative expenses and neighbor island legislators receive $150 per diem while the Legislature is in session.
8) The general fund tax revenue projections from the January 3, 2013 meeting of the Council on Revenues show projected increases of 6.8%, 6.2%, 1.4%, 4.2%, 5.0%, and 4.7% for the FY 2014, FY 2015, FY 2016,
15 of 253
Page 16
FY 2017, FY 2018 and FY 2019; respectively. The general fund tax projections from the March 13, 2013 meeting of the Council on Revenues show projected increases of 7.3%, 6.8%, 1.4%, 4.2%, 5.0%, and 4.7% for the FY 2014, FY 2015, FY 2016, FY 2017, FY 2018 and FY 2019; respectively.
9) Act 48, SLH 2012 provides that the salaries recommended by the 2007 Commission be restored effective July 1, 2013, for the Legislative branch. The effect of this restored salary schedule for legislators is as follows:
a. Effective July 1, 2013, the salary for legislators will be $55,896 ($63,396 for Senate President and House Speaker); and
b. Effective January 1, 2014, the salary for legislators will be $57,852 ($65,352 for Senate President and House Speaker).
10) Any salary recommendation offered by the 2013 Commission will not go
into effect until January 1, 2015. In addition, HRS 26-56 allows the Commission to include incremental increases that take effect prior to the convening of the next salary commission. The next commission is expected to convene in November 2018.
11) Consideration was given to provide regular salary increases between
January 1, 2015 and November 2018. Consideration was also given to past, current and projected cost of living increases; and the fact that pursuant to Act 48 (SLH 2012) the Legislative branch will receive the 2007 Salary Commission’s recommended increases on July 1, 2013 and January 1, 2014 as noted above.
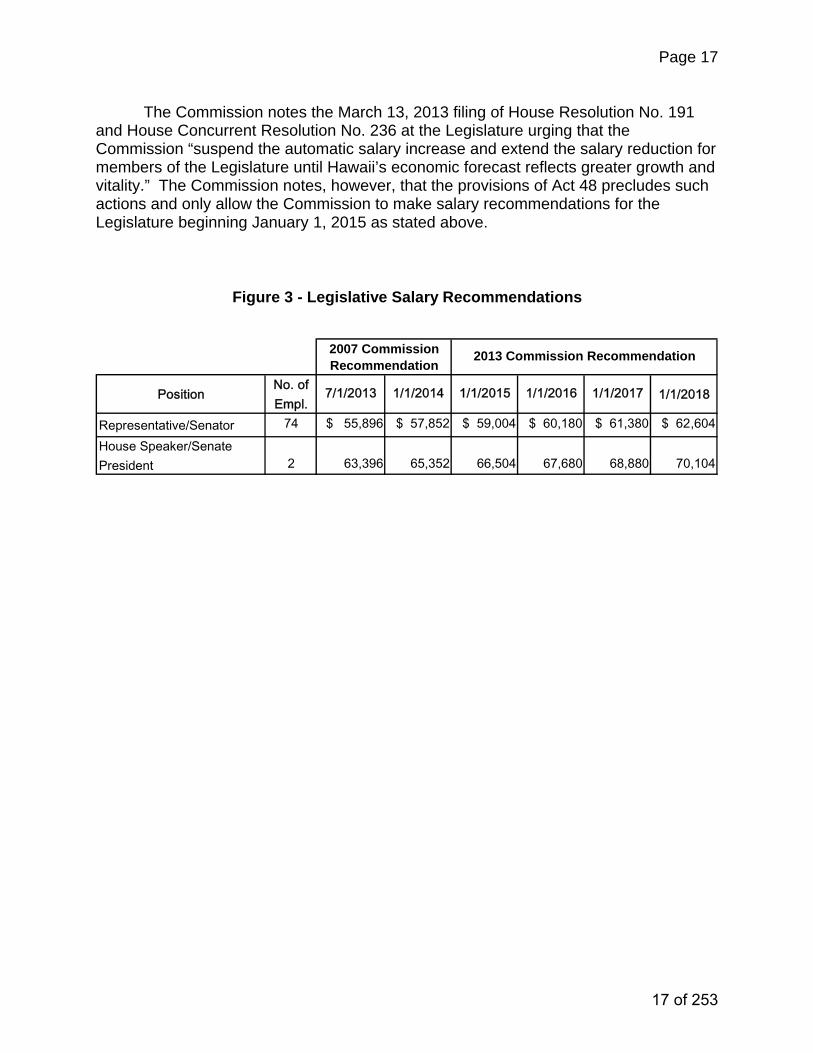
The Commission’s recommendations for the Legislative branch are as follows (see Figure 3):
• Effective January 1, 2015, January 1, 2016; January 1, 2017; and January 1, 2018 increase the salaries of senators and representatives by 2% each year.
• The President of the Senate and Speaker of the House of Representatives will continue to receive $7,500 more per year than senators and representatives.
Per Act 48, SLH 2012, the Legislative branch salaries, "notwithstanding section
26-56(d), Hawai‘i Revised Statues, shall be at the rates provided for by the recommendations, dated March 14, 2007, of the commission on salaries convened in 2006." Therefore, the Legislative branch will receive the January 1, 2013 salaries recommended by the `Commission convened in 2006, effective July 1, 2013; and the January 1, 2014 recommended salaries effective January 1, 2014. By HRS 26-56(d), the 2013 Commission can only make recommendations for the House and Senate from 2015 until the next commission is appointed in 2018.
16 of 253
Page 17
The Commission notes the March 13, 2013 filing of House Resolution No. 191 and House Concurrent Resolution No. 236 at the Legislature urging that the Commission “suspend the automatic salary increase and extend the salary reduction for members of the Legislature until Hawaii’s economic forecast reflects greater growth and vitality.” The Commission notes, however, that the provisions of Act 48 precludes such actions and only allow the Commission to make salary recommendations for the Legislature beginning January 1, 2015 as stated above.
PositionNo. of Empl.
1/1/2018
Representative/Senator 74 $ 55,896 $ 57,852 $ 59,004 $ 60,180 $ 61,380 $ 62,604
House Speaker/Senate President 2 63,396 65,352 66,504 67,680 68,880 70,104
7/1/2013 1/1/2014
Figure 3 - Legislative Salary Recommendations
2007 Commission Recommendation
2013 Commission Recommendation
1/1/20171/1/20161/1/2015
17 of 253
Page 18
Conclusion
In addition to the above salary recommendations, the Commission offers the following recommendations and comments for consideration:
The Commission is charged with making salary recommendations covering a six-year period. While we are relying on the 2013 general fund tax revenue projections, the Commission recognizes that the future status of the State’s economy is difficult to predict, as evidenced by the 2009 downturn in the economy and the on-going effects of the Federal sequester. Therefore, the Commission recommends that provisions for adjustments during the six-year salary period should be considered to accommodate the uncertainties of the future.
Furthermore, the Commission would like to bring attention to the fact that the time period that incremental increases can be made for the Legislative branch is shorter than the time period that is allowed for the Executive and Judicial branches. This is because, pursuant to HRS 26-56(d), the Commission convenes in November of every sixth year and the recommended salaries submitted by the Commission become effective the next fiscal year for the Executive and Judicial branches, and over two years later for the Legislative branch since changes in salaries cannot apply to the Legislature in which the salary recommendation was made. The 2013 Commission recommends that there should be equity in the time period allowed for incremental salary adjustments for all three branches of Officials.
18 of 253
19 of 253

Page 20
TABLES
20 of 253
Page 21
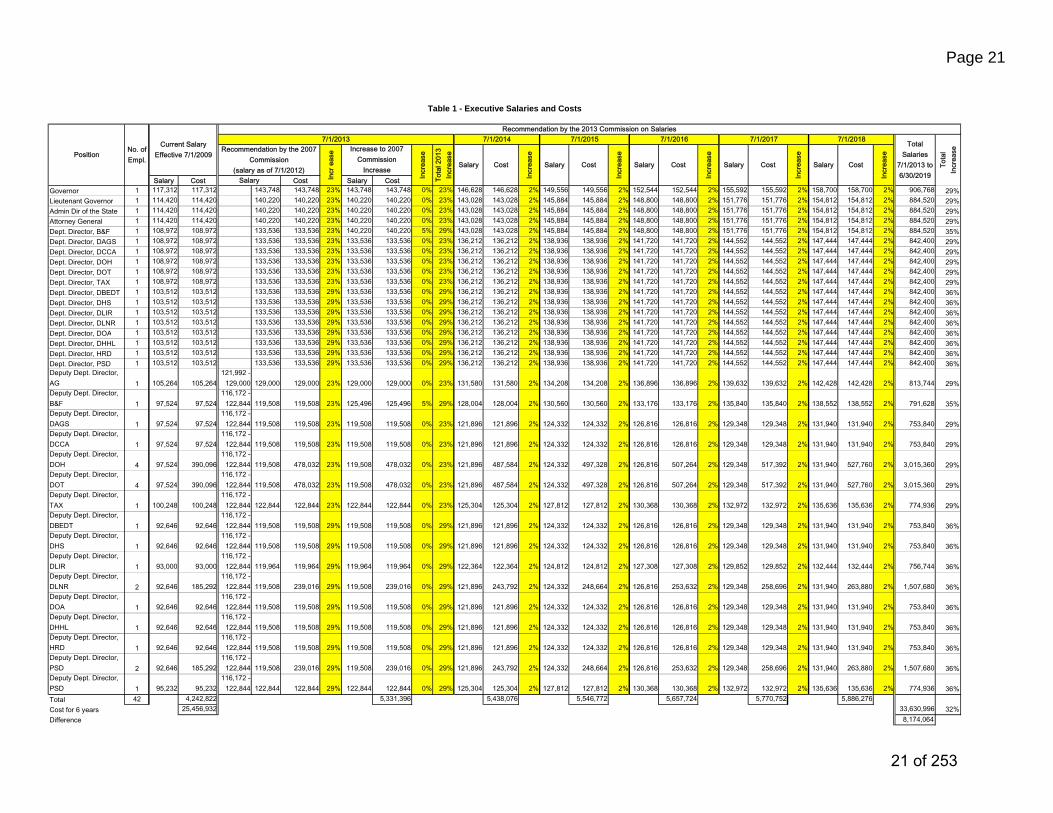
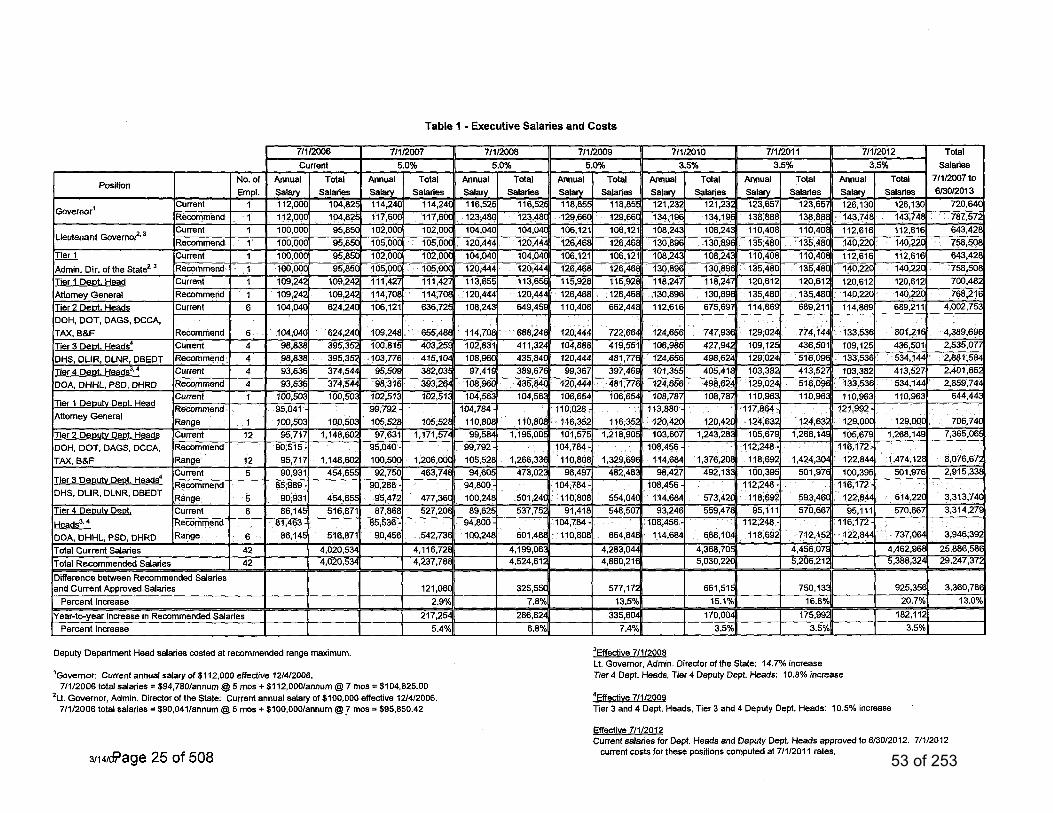
Salary Cost Cost Salary CostGovernor 1 117,312 117,312 143,748 143,748 23% 143,748 143,748 0% 23% 146,628 146,628 2% 149,556 149,556 2% 152,544 152,544 2% 155,592 155,592 2% 158,700 158,700 2% 906,768 29%Lieutenant Governor 1 114,420 114,420 140,220 140,220 23% 140,220 140,220 0% 23% 143,028 143,028 2% 145,884 145,884 2% 148,800 148,800 2% 151,776 151,776 2% 154,812 154,812 2% 884,520 29%Admin Dir of the State 1 114,420 114,420 140,220 140,220 23% 140,220 140,220 0% 23% 143,028 143,028 2% 145,884 145,884 2% 148,800 148,800 2% 151,776 151,776 2% 154,812 154,812 2% 884,520 29%Attorney General 1 114,420 114,420 140,220 140,220 23% 140,220 140,220 0% 23% 143,028 143,028 2% 145,884 145,884 2% 148,800 148,800 2% 151,776 151,776 2% 154,812 154,812 2% 884,520 29%Dept. Director, B&F 1 108,972 108,972 133,536 133,536 23% 140,220 140,220 5% 29% 143,028 143,028 2% 145,884 145,884 2% 148,800 148,800 2% 151,776 151,776 2% 154,812 154,812 2% 884,520 35%Dept. Director, DAGS 1 108,972 108,972 133,536 133,536 23% 133,536 133,536 0% 23% 136,212 136,212 2% 138,936 138,936 2% 141,720 141,720 2% 144,552 144,552 2% 147,444 147,444 2% 842,400 29%Dept. Director, DCCA 1 108,972 108,972 133,536 133,536 23% 133,536 133,536 0% 23% 136,212 136,212 2% 138,936 138,936 2% 141,720 141,720 2% 144,552 144,552 2% 147,444 147,444 2% 842,400 29%Dept. Director, DOH 1 108,972 108,972 133,536 133,536 23% 133,536 133,536 0% 23% 136,212 136,212 2% 138,936 138,936 2% 141,720 141,720 2% 144,552 144,552 2% 147,444 147,444 2% 842,400 29%Dept. Director, DOT 1 108,972 108,972 133,536 133,536 23% 133,536 133,536 0% 23% 136,212 136,212 2% 138,936 138,936 2% 141,720 141,720 2% 144,552 144,552 2% 147,444 147,444 2% 842,400 29%Dept. Director, TAX 1 108,972 108,972 133,536 133,536 23% 133,536 133,536 0% 23% 136,212 136,212 2% 138,936 138,936 2% 141,720 141,720 2% 144,552 144,552 2% 147,444 147,444 2% 842,400 29%Dept. Director, DBEDT 1 103,512 103,512 133,536 133,536 29% 133,536 133,536 0% 29% 136,212 136,212 2% 138,936 138,936 2% 141,720 141,720 2% 144,552 144,552 2% 147,444 147,444 2% 842,400 36%Dept. Director, DHS 1 103,512 103,512 133,536 133,536 29% 133,536 133,536 0% 29% 136,212 136,212 2% 138,936 138,936 2% 141,720 141,720 2% 144,552 144,552 2% 147,444 147,444 2% 842,400 36%Dept. Director, DLIR 1 103,512 103,512 133,536 133,536 29% 133,536 133,536 0% 29% 136,212 136,212 2% 138,936 138,936 2% 141,720 141,720 2% 144,552 144,552 2% 147,444 147,444 2% 842,400 36%Dept. Director, DLNR 1 103,512 103,512 133,536 133,536 29% 133,536 133,536 0% 29% 136,212 136,212 2% 138,936 138,936 2% 141,720 141,720 2% 144,552 144,552 2% 147,444 147,444 2% 842,400 36%Dept. Director, DOA 1 103,512 103,512 133,536 133,536 29% 133,536 133,536 0% 29% 136,212 136,212 2% 138,936 138,936 2% 141,720 141,720 2% 144,552 144,552 2% 147,444 147,444 2% 842,400 36%Dept. Director, DHHL 1 103,512 103,512 133,536 133,536 29% 133,536 133,536 0% 29% 136,212 136,212 2% 138,936 138,936 2% 141,720 141,720 2% 144,552 144,552 2% 147,444 147,444 2% 842,400 36%Dept. Director, HRD 1 103,512 103,512 133,536 133,536 29% 133,536 133,536 0% 29% 136,212 136,212 2% 138,936 138,936 2% 141,720 141,720 2% 144,552 144,552 2% 147,444 147,444 2% 842,400 36%Dept. Director, PSD 1 103,512 103,512 133,536 133,536 29% 133,536 133,536 0% 29% 136,212 136,212 2% 138,936 138,936 2% 141,720 141,720 2% 144,552 144,552 2% 147,444 147,444 2% 842,400 36%Deputy Dept. Director, AG 1 105,264 105,264
121,992 - 129,000 129,000 129,000 23% 129,000 129,000 0% 23% 131,580 131,580 2% 134,208 134,208 2% 136,896 136,896 2% 139,632 139,632 2% 142,428 142,428 2% 813,744 29%
Deputy Dept. Director, B&F 1 97,524 97,524
116,172 - 122,844 119,508 119,508 23% 125,496 125,496 5% 29% 128,004 128,004 2% 130,560 130,560 2% 133,176 133,176 2% 135,840 135,840 2% 138,552 138,552 2% 791,628 35%
Deputy Dept. Director, DAGS 1 97,524 97,524
116,172 - 122,844 119,508 119,508 23% 119,508 119,508 0% 23% 121,896 121,896 2% 124,332 124,332 2% 126,816 126,816 2% 129,348 129,348 2% 131,940 131,940 2% 753,840 29%
Deputy Dept. Director, DCCA 1 97,524 97,524
116,172 - 122,844 119,508 119,508 23% 119,508 119,508 0% 23% 121,896 121,896 2% 124,332 124,332 2% 126,816 126,816 2% 129,348 129,348 2% 131,940 131,940 2% 753,840 29%
Deputy Dept. Director, DOH 4 97,524 390,096
116,172 - 122,844 119,508 478,032 23% 119,508 478,032 0% 23% 121,896 487,584 2% 124,332 497,328 2% 126,816 507,264 2% 129,348 517,392 2% 131,940 527,760 2% 3,015,360 29%
Deputy Dept. Director, DOT 4 97,524 390,096
116,172 - 122,844 119,508 478,032 23% 119,508 478,032 0% 23% 121,896 487,584 2% 124,332 497,328 2% 126,816 507,264 2% 129,348 517,392 2% 131,940 527,760 2% 3,015,360 29%
Deputy Dept. Director, TAX 1 100,248 100,248
116,172 - 122,844 122,844 122,844 23% 122,844 122,844 0% 23% 125,304 125,304 2% 127,812 127,812 2% 130,368 130,368 2% 132,972 132,972 2% 135,636 135,636 2% 774,936 29%
Deputy Dept. Director, DBEDT 1 92,646 92,646
116,172 - 122,844 119,508 119,508 29% 119,508 119,508 0% 29% 121,896 121,896 2% 124,332 124,332 2% 126,816 126,816 2% 129,348 129,348 2% 131,940 131,940 2% 753,840 36%
Deputy Dept. Director, DHS 1 92,646 92,646
116,172 - 122,844 119,508 119,508 29% 119,508 119,508 0% 29% 121,896 121,896 2% 124,332 124,332 2% 126,816 126,816 2% 129,348 129,348 2% 131,940 131,940 2% 753,840 36%
Deputy Dept. Director, DLIR 1 93,000 93,000
116,172 - 122,844 119,964 119,964 29% 119,964 119,964 0% 29% 122,364 122,364 2% 124,812 124,812 2% 127,308 127,308 2% 129,852 129,852 2% 132,444 132,444 2% 756,744 36%
Deputy Dept. Director, DLNR 2 92,646 185,292
116,172 - 122,844 119,508 239,016 29% 119,508 239,016 0% 29% 121,896 243,792 2% 124,332 248,664 2% 126,816 253,632 2% 129,348 258,696 2% 131,940 263,880 2% 1,507,680 36%
Deputy Dept. Director, DOA 1 92,646 92,646
116,172 - 122,844 119,508 119,508 29% 119,508 119,508 0% 29% 121,896 121,896 2% 124,332 124,332 2% 126,816 126,816 2% 129,348 129,348 2% 131,940 131,940 2% 753,840 36%
Deputy Dept. Director, DHHL 1 92,646 92,646
116,172 - 122,844 119,508 119,508 29% 119,508 119,508 0% 29% 121,896 121,896 2% 124,332 124,332 2% 126,816 126,816 2% 129,348 129,348 2% 131,940 131,940 2% 753,840 36%
Deputy Dept. Director, HRD 1 92,646 92,646
116,172 - 122,844 119,508 119,508 29% 119,508 119,508 0% 29% 121,896 121,896 2% 124,332 124,332 2% 126,816 126,816 2% 129,348 129,348 2% 131,940 131,940 2% 753,840 36%
Deputy Dept. Director, PSD 2 92,646 185,292
116,172 - 122,844 119,508 239,016 29% 119,508 239,016 0% 29% 121,896 243,792 2% 124,332 248,664 2% 126,816 253,632 2% 129,348 258,696 2% 131,940 263,880 2% 1,507,680 36%
Deputy Dept. Director, PSD 1 95,232 95,232
116,172 - 122,844 122,844 122,844 29% 122,844 122,844 0% 29% 125,304 125,304 2% 127,812 127,812 2% 130,368 130,368 2% 132,972 132,972 2% 135,636 135,636 2% 774,936 36%
Total 42 4,242,822 5,331,396 5,438,076 5,546,772 5,657,724 5,770,752 5,886,276Cost for 6 years 25,456,932 33,630,996 32%Difference 8,174,064
Cost
Table 1 - Executive Salaries and Costs
Incr
ease
Incr
ease
7/1/2016 7/1/2017 7/1/2018
Salary Cost Salary SalaryCost
Recommendation by the 2007 Commission
(salary as of 7/1/2012)Cost
Incr
ease
7/1/2014
Incr
ease
Salary Cost Tota
lIn
crea
se
7/1/2015
Salary
Total Salaries
7/1/2013 to 6/30/2019
Current SalaryEffective 7/1/2009
Incr
ease
Recommendation by the 2013 Commission on Salaries
Increase to 2007 Commission
Increase
Incr
easePosition
No. of Empl.
Salary Tota
l 201
3 In
crea
se
7/1/2013
Incr
eas
e
21 of 253
Page 22
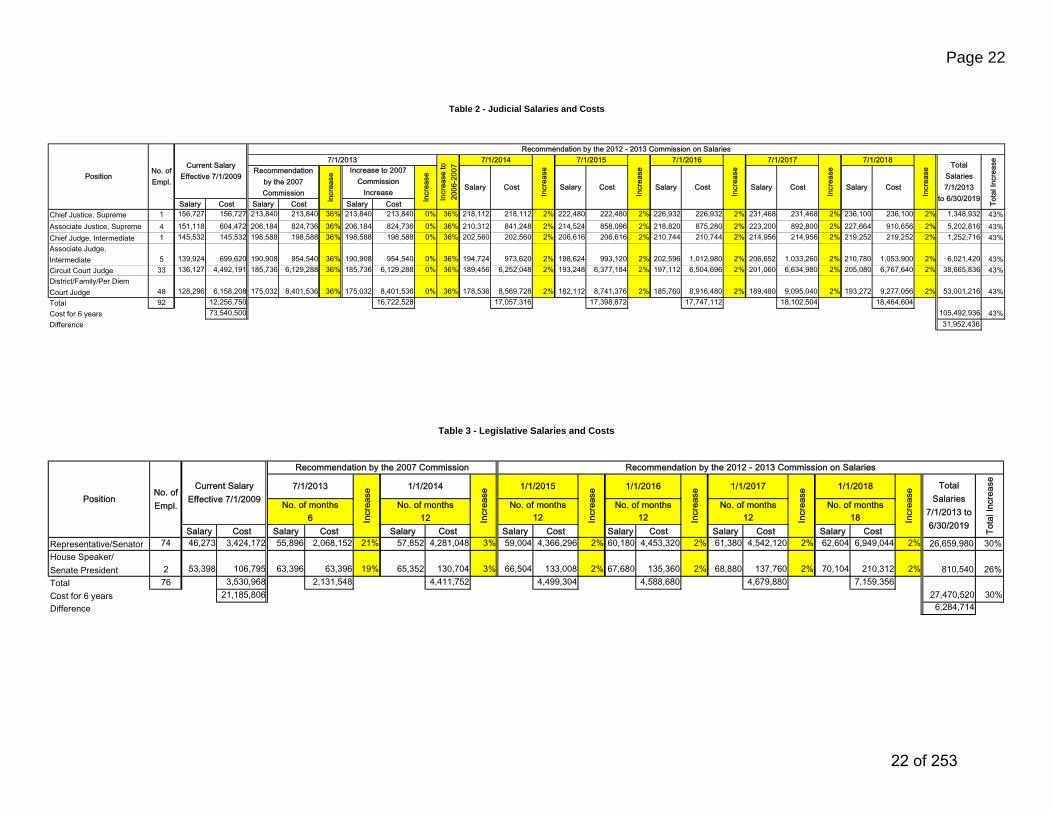
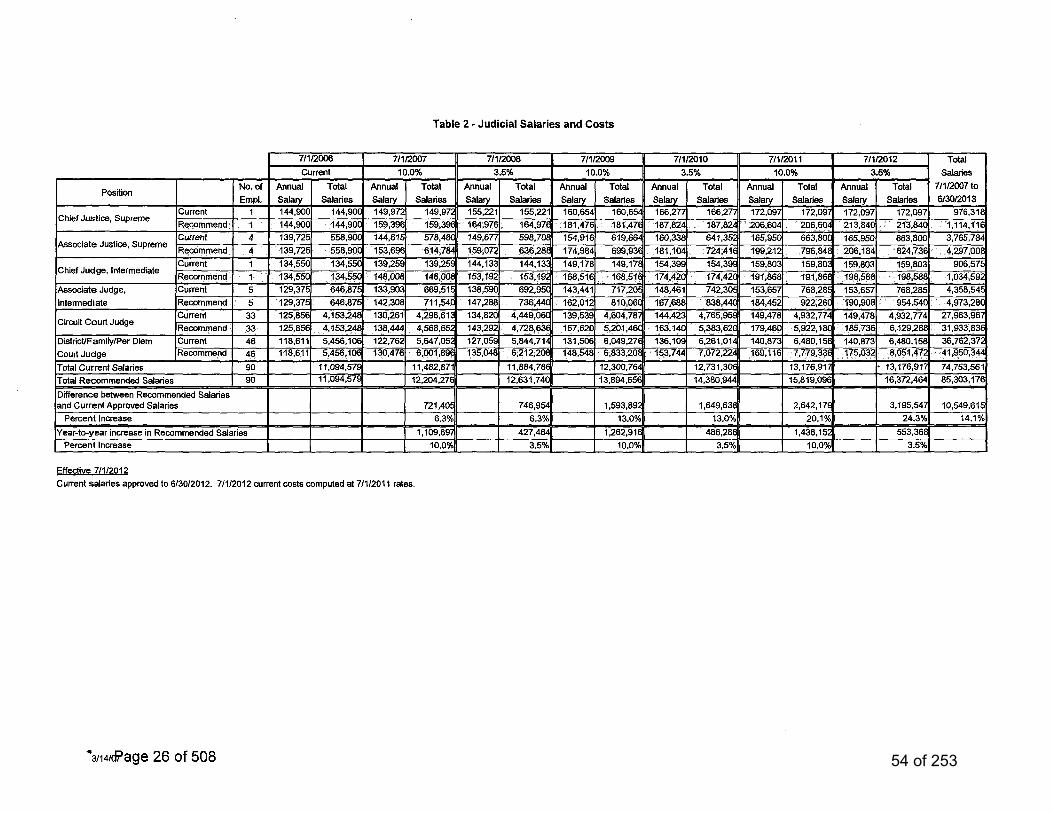
Salary Cost Salary Cost Salary CostChief Justice, Supreme 1 156,727 156,727 213,840 213,840 36% 213,840 213,840 0% 36% 218,112 218,112 2% 222,480 222,480 2% 226,932 226,932 2% 231,468 231,468 2% 236,100 236,100 2% 1,348,932 43%Associate Justice, Supreme 4 151,118 604,472 206,184 824,736 36% 206,184 824,736 0% 36% 210,312 841,248 2% 214,524 858,096 2% 218,820 875,280 2% 223,200 892,800 2% 227,664 910,656 2% 5,202,816 43%Chief Judge, Intermediate 1 145,532 145,532 198,588 198,588 36% 198,588 198,588 0% 36% 202,560 202,560 2% 206,616 206,616 2% 210,744 210,744 2% 214,956 214,956 2% 219,252 219,252 2% 1,252,716 43%Associate Judge, Intermediate 5 139,924 699,620 190,908 954,540 36% 190,908 954,540 0% 36% 194,724 973,620 2% 198,624 993,120 2% 202,596 1,012,980 2% 206,652 1,033,260 2% 210,780 1,053,900 2% 6,021,420 43%Circuit Court Judge 33 136,127 4,492,191 185,736 6,129,288 36% 185,736 6,129,288 0% 36% 189,456 6,252,048 2% 193,248 6,377,184 2% 197,112 6,504,696 2% 201,060 6,634,980 2% 205,080 6,767,640 2% 38,665,836 43%District/Family/Per Diem Court Judge 48 128,296 6,158,208 175,032 8,401,536 36% 175,032 8,401,536 0% 36% 178,536 8,569,728 2% 182,112 8,741,376 2% 185,760 8,916,480 2% 189,480 9,095,040 2% 193,272 9,277,056 2% 53,001,216 43%Total 92 12,256,750 16,722,528 17,057,316 17,398,872 17,747,112 18,102,504 18,464,604Cost for 6 years 73,540,500 105,492,936 43%Difference 31,952,436
Table 2 - Judicial Salaries and Costs
CostCost Salary Cost Salary
Increase to 2007 Commission
IncreaseSalary
Tota
l Inc
reas
e
Cost Salary Cost Salary
Incr
ease
Incr
ease
Incr
ease
Incr
ease
Recommendation by the 2012 - 2013 Commission on Salaries
Recommendation by the 2007 Commission
Incr
ease
Current Salary Effective 7/1/2009
Incr
ease
7/1/2013 Total Salaries 7/1/2013
to 6/30/2019Incr
ease
to
2006
-200
7
7/1/2014 7/1/2015
Incr
ease
7/1/2016 7/1/2018
PositionNo. of Empl.
7/1/2017
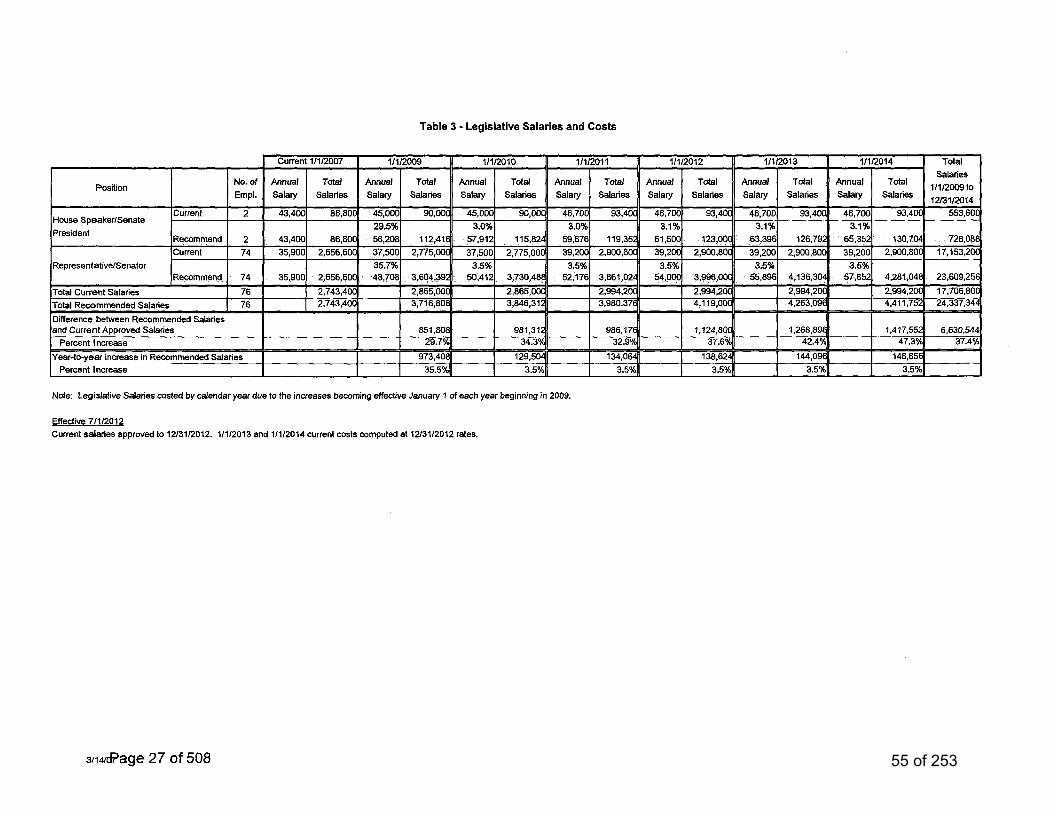
Salary Cost Salary Cost Salary Cost Salary Cost Salary Cost Salary Cost Salary CostRepresentative/Senator 74 46,273 3,424,172 55,896 2,068,152 21% 57,852 4,281,048 3% 59,004 4,366,296 2% 60,180 4,453,320 2% 61,380 4,542,120 2% 62,604 6,949,044 2% 26,659,980 30%House Speaker/Senate President 2 53,398 106,795 63,396 63,396 19% 65,352 130,704 3% 66,504 133,008 2% 67,680 135,360 2% 68,880 137,760 2% 70,104 210,312 2% 810,540 26%Total 76 3,530,968 2,131,548 4,411,752 4,499,304 4,588,680 4,679,880 7,159,356Cost for 6 years 21,185,806 27,470,520 30%Difference 6,284,714
Total Salaries
7/1/2013 to 6/30/2019 To
tal I
ncre
ase
Incr
ease
1/1/2017Position
No. of Empl.
Current SalaryEffective 7/1/2009 No. of months
Incr
ease
1/1/2018
12
1/1/2014
No. of months No. of months
1/1/2015 1/1/2016
No. of months1212 In
crea
se
12Incr
ease
Table 3 - Legislative Salaries and Costs
Recommendation by the 2007 Commission Recommendation by the 2012 - 2013 Commission on Salaries
Incr
ease
No. of months6
7/1/2013In
crea
se
No. of months18
22 of 253

APPENDICES
Appendices for Material Reviewed by the Commission
23 of 253
A-1
24 of 253
25 of 253
26 of 253
27 of 253
28 of 253
29 of 253
30 of 253
31 of 253
32 of 253
33 of 253
34 of 253
35 of 253
36 of 253
37 of 253
38 of 253
39 of 253
40 of 253
41 of 253
42 of 253
43 of 253
44 of 253
45 of 253
46 of 253
47 of 253
48 of 253
49 of 253
50 of 253
51 of 253

52 of 253
53 of 253
54 of 253
55 of 253
A-2
56 of 253
HOUSE OF REPRESENTATIVES 1744TWENTY-SIXTH LEGISLATURE, 2012 H B NC) RD. 1STATEOFHAWAII
A BILL FOR AN ACTRELATING TO COMPENSATION.
BE IT ENACTED BY THE LEGISLATURE OF THE STATE OF HAWAII:
1 SECTION 1. The commission on salaries was established by
2 constitutional amendment that was ratified by Hawaii voters in
3 2006. The commission is charged with reviewing and recommending
4 salaries for state justices and judges, legislators, the
5 governor, the lieutenant governor, and specified appointed
6 officials within the executive branch. The commission convened
7 in 2006 and submitted its report and recommendations to the
8 legislature in 2007 with a schedule of salary recommendations.
9 By constitutional law, the salaries recommended and submitted by
10 the commission become effective as provided in the
11 recommendation, unless the legislature disapproves the
12 recommendation in its entirety. The legislature did not
13 disapprove the recommendations of the commission convened in
14 2006.
15 The legislature notes that the commission’s salary
16 recommendations specify a July 1, 2007, effective date for
17 executive and judicial branch official salaries, and a January
18 1, 2009, effective date for legislator salaries. The state
HB1744 HD1 HMS 2012—2497
A-3
57 of 253
H.B. NO. ~
1 constitution provides that any change in salary that becomes
2 effective shall not apply to the legislature to which the
3 recommendation for the change in salary was submitted.
4 The legislature finds that Act 57, Session Laws of Hawaii
5 2011, establishes a July 1, 2009, until December 31, 2013,
6 salary reduction period for all positions under the Act, but
7 applies different salary provisions to those positions after
8 that period. This has raised concern as to whether those
9 provisions comport with article XVI, section 3.5, of the state
10 constitution, which prohibits the salaries from being decreased
11 during a term of office except by general law applying to all
12 salaried officers of the State.
13 The legislature also finds that Act 57 also extends the
14 five per cent salary reduction until December 31, 2013, for all
15 salaries but does not address the impact of the reductions on
16 the 2012 commission’s recommendations for the executive and
17 judicial salaries for the period July 1, 2013, through December
18 31, 2013, thus resulting in a possible conflict between the 2011
19 law and the next commission’s recommendations.
20 The next commission on salaries will convene in 2012 and
21 will submit its report and recommendations to the 2013
22 legislature. It is the intent that the 2013 legislature
HB1744 HUh HNS 2012—2497
58 of 253
H.B. NO. ~
1 deliberate the range of issues related to salary levels that may
2 be recommended by the 2012 commission after those salaries are
3 proposed.
4 The purpose of this Act is to resolve the ambiguity and
5 concerns arising from provisions contained in Act 57, Session
6 Laws of Hawaii 2011, by:
7 (1) z\mending the salary reduction period to reflect that
8 it is effective through June 30, 2013;
9 (2) Deleting provisions relating to the restoration of
10 salaries to what they would have been on July 1, 2009,
11 but for the salary reductions provided by Act 85,
12 Session Laws of Hawaii 2009, as amended by Act 57,
13 Session Laws of Hawaii 2011; and
14 (3) Deleting provisions relating to the salary commission
15 that convenes in 2012 as unnecessary, inasmuch as
16 existing provisions set forth the scope of its
17 mandate.
18 SECTION 2. Section 2 of Act 85, Session Laws of Hawaii
19 2009, as amended by section 1 of Act 57, Session Laws of Hawaii
20 2011, is amended to read as follows:
H31744 HD1 HMS 2012—2497
59 of 253
H.B. NO. ;!7~ff1
1 “SECTION 2. (a) Notwithstanding any law to the contrary
2 and notwithstanding the recommendations of the commission on
3 salaries convened in 2006 for salary increases, beginning
4 July 1, 2009, and [until Dcccnibcr 31,1 through June 30, 2013,
5 the annual salaries of the governor, the lieutenant governor,
6 the justices and judges of all state courts, the administrative
7 director of the State or an equivalent position, and the
8 department heads or executive officers and the deputies or
9 assistants to the department heads or executive officers of the
10 departments of:
11 (1) Accounting and general services;
12 (2) Agriculture;
13 (3) The attorney general;
14 (4) Budget and finance;
15 (5) Business, economic development, and tourism;
16 (6) Commerce and consumer affairs;
17 (7) Defense;
18 (8) Hawaiian home lands;
19 (9) Health;
20 (10) Human resources development;
21 (11) Human services;
22 (12) Labor and industrial relations;
HB1744 HD1 HNS 2012—2497
60 of 253
1
Page 5
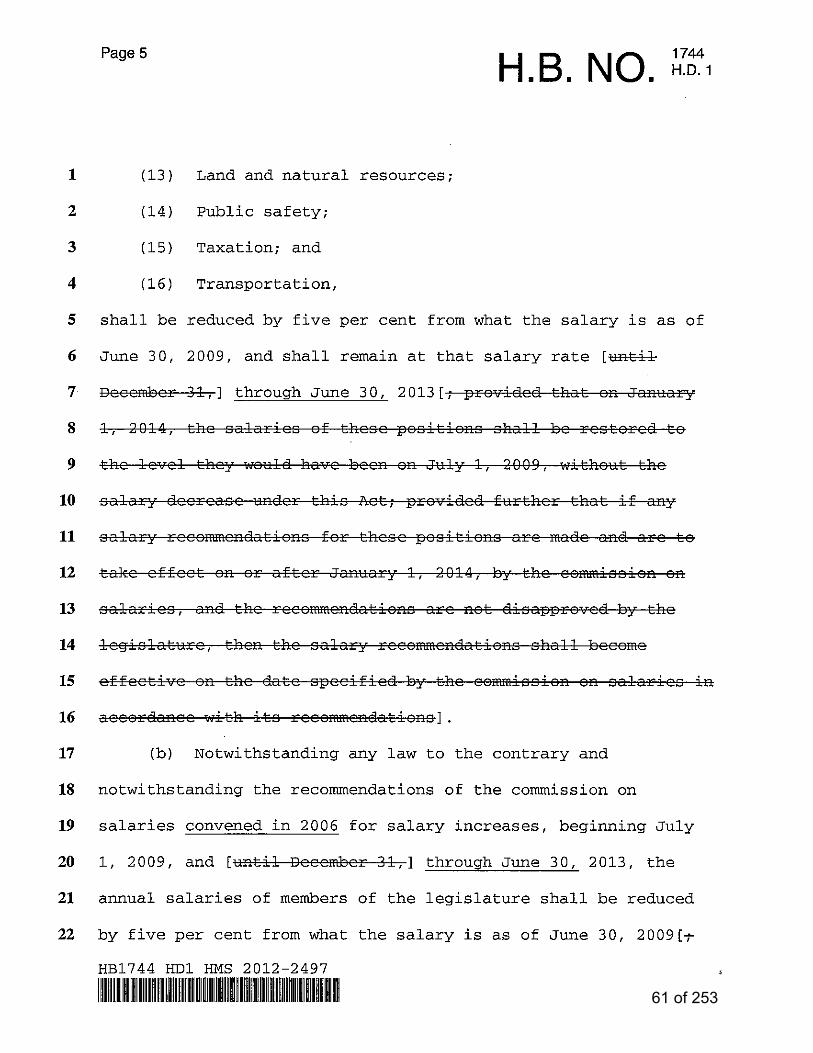
(13) Land and natural resources;
1744H.B. NO.
2
3
4
(14) Public safety;
(15) Taxation; and
(16) Transportation,
5 shall be reduced by five per cent from what the salary is as of
6 June 30, 2009, and shall remain at that salary rate [until
7 December 31,] through June 30, 20l3[; provided that on January
8 1, 2014, the salaries of these positions shall bc rcstored to
9 the level they would have becn on July 1, 2009, without the
10 salary decrease under this Act; provided further that if any
11
12
salary recommendations for these positions are made and are to
take effect on or after January 1, 2014, by the commission on
13 salaries, and the recommendations are not disapproved by the
14 legislature, then the salary recommendations shall become
15 effective on the data specified by the commission on salaries in
16 accordance with its recommendations].
17 (b) Notwithstanding any law to the contrary and
18 notwithstanding the recommendations of the commission on
19 salaries convened in 2006 for salary increases, beginning July
20 1, 2009, and Euntil December 31,] through June 30, 2013, the
21 annual salaries of members of the legislature shall be reduced
22 by five per cent from what the salary is as of June 30, 2009[t
HB1744 P101 I-INS 2012—2497
61 of 253
H.B. NC). ~‘i
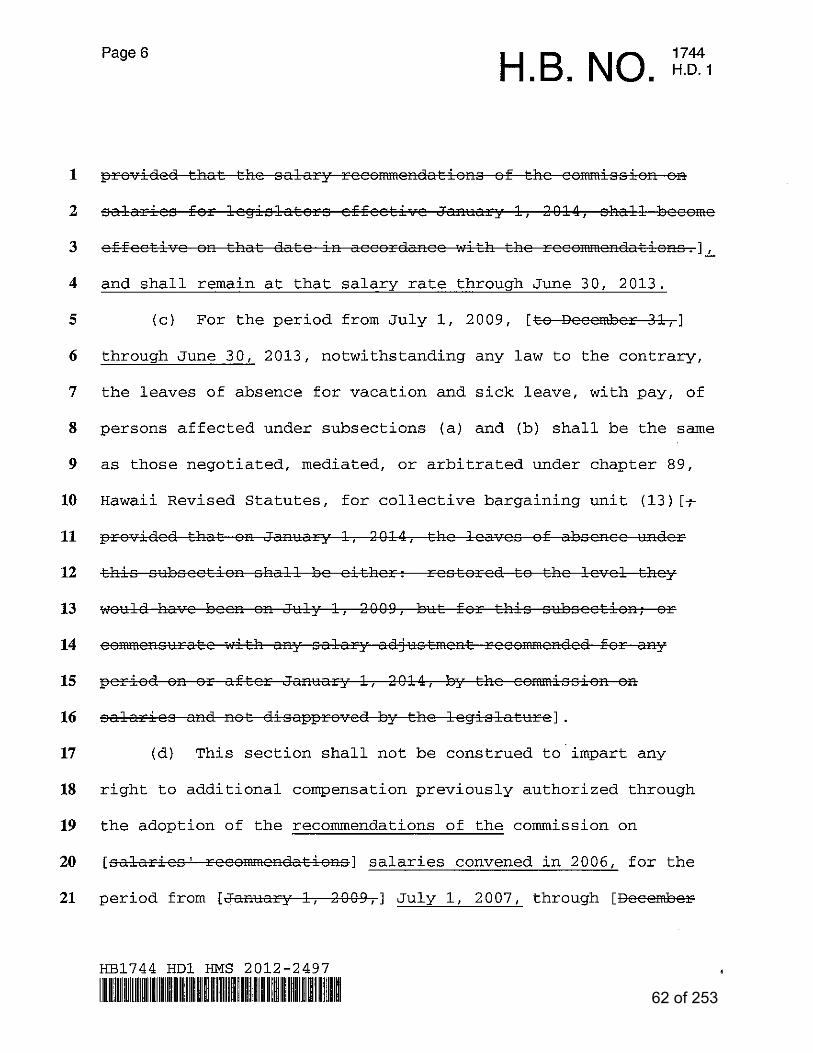
1 providcd that thc salary rcco~cndations of thc co~ission on
2 salarics for lcgislators cffcctivc January 1, 2014, shall bccomc
3 cffcctivc on that datc in accordancc with thc rcco~cndations.],
4 and shall remain at that salary rate through June 30, 2013.
S (c) For the period from July 1, 2009, [to Dcccxribcr 31,]
6 through June 30, 2013, notwithstanding any law to the contrary,
7 the leaves of absence for vacation and sick leave, with pay, of
S persons affected under subsections (a) and (b) shall be the same
9 as those negotiated, mediated, or arbitrated under chapter 89,
10 Hawaii Revised Statutes, for collective bargaining unit (13) [t
11 providcd that on January 1, 2014, thc lcavcs of abscncc undcr
12 this subscction shall bc cithcr: rcstorcd to thc lcvcl thcy
13 would havc bccn on July 1, 2009, but for this subscction; or
14 co~cnsuratc with any salary adjustmcnt rcco~cndcd for any
15 pcriod on or aftcr January 1, 2014, by thc coission on
16 salarics and not disapprovcd by thc lcgiglaturc].
17 (d) This section shall not be construed to impart any
18 right to additional compensation previously authorized through
19 the adoption of the recommendations of the commission on
20 [salarics’ rcooinmcndations] salaries convened in 2006, for the
21 period from [January 1, 2009,] July 1, 2007, through [Dcccmbcr
HB1744 HD1 EMS 2012—2497
62 of 253
H.B. NO. ~
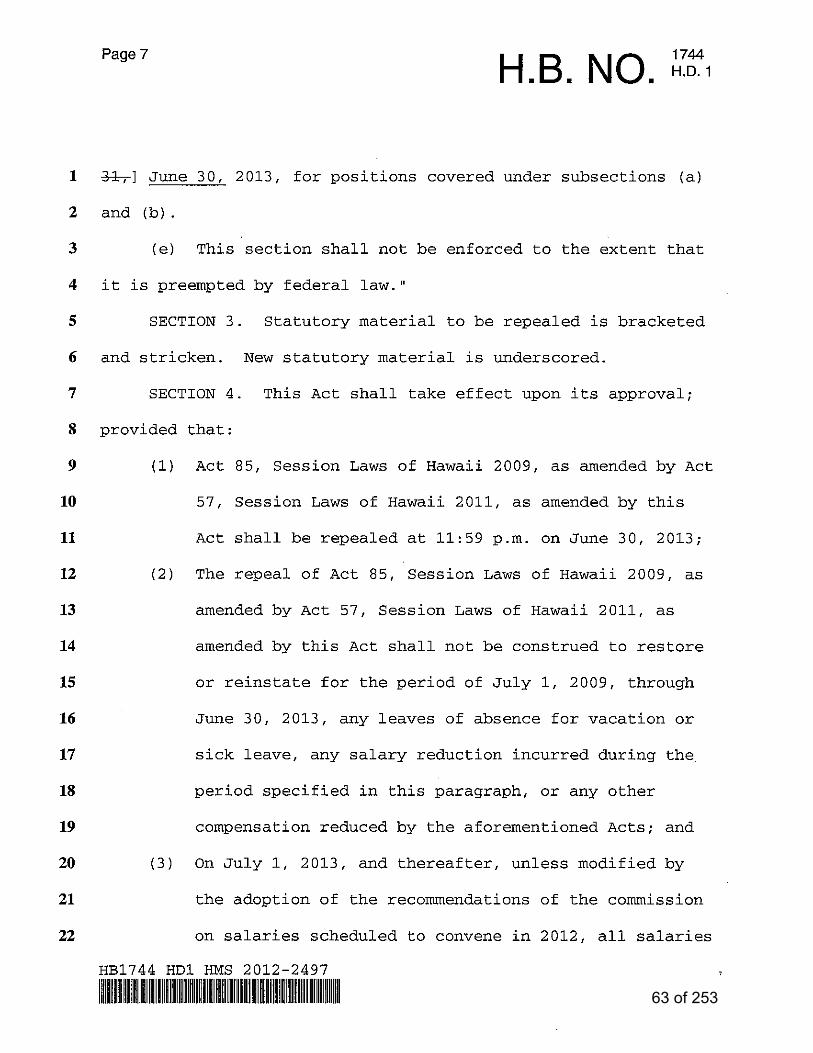
1 3-15-j June 30, 2013, for positions covered under subsections (a)
2 and (b).
3 (e) This section shall not be enforced to the extent that
4 it is preempted by federal law.”
5 SECTION 3. Statutory material to be repealed is bracketed
6 and stricken. New statutory material is underscored.
7 SECTION 4. This Act shall take effect upon its approval;
S provided that:
9 (1) Act 85, Session Laws of Hawaii 2009, as amended by Act
10 57, Session Laws of Hawaii 2011, as amended by this
11 Act shall be repealed at 11:59 p.m. on June 30, 2013;
12 (2) The repeal of Act 85, Session Laws of Hawaii 2009, as
13 amended by Act 57, Session Laws of Hawaii 2011, as
14 amended by this Act shall not be construed to restore
15 or reinstate for the period of July 1, 2009, through
16 June 30, 2013, any leaves of absence for vacation or
17 sick leave, any salary reduction incurred during the
18 period specified in this paragraph, or any other
19 compensation reduced by the aforementioned Acts; and
20 (3) On July 1, 2013, and thereafter, unless modified by
21 the adoption of the recommendations of the commission
22 on salaries scheduled to convene in 2012, all salaries
HB1744 HD1 HMS 2012—2497
63 of 253
H.B. NcJ. 1~i
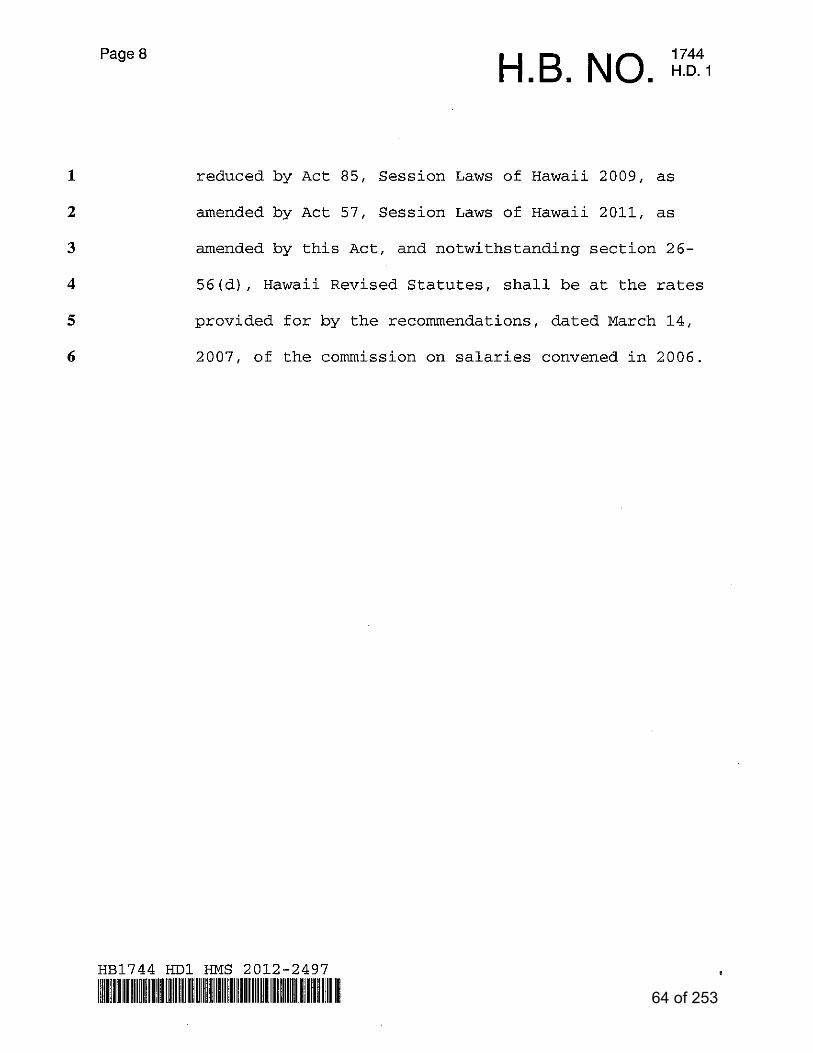
1 reduced by Act 85, Session Laws of Hawaii 2009, as
2 amended by Act 57, Session Laws of Hawaii 2011, as
3 amended by this Act, and notwithstanding section 26-
4 56(d), Hawaii Revised Statutes, shall be at the rates
5 provided for by the recommendations, dated March 14,
6 2007, of the commission on salaries convened in 2006.
HB1744 IW1 H1’~tS 2012—2497
64 of 253
H.B. NcD. i7’.~ff1
Report Title:Salaries; Legislature; Judiciary; Executive
Description:Stipulates that the five per cent decrease to the legislative,executive, and judicial salaries applies to what the respectivesalaries were as of June 30, 2009, and remains at the specifiedsalary rate until June 30, 2013. Repeals Act 85, Session Lawsof Hawaii (SLH) 2009, as amended by Act 57, SLH 2011, as amendedby this Act, at 11:59 p.m. on June 30, 2013. Provides that therepeal of the aforementioned Acts for the period of July 1,2009, through June 30, 2013, shall not be construed to restoreor reinstate any leaves for vacation or sick leave, any salaryreduction, or any other compensation reduced by the Acts.(HB1744 HD1)
The summary description of legislation appearing on this page is for informational purposes only and isnot legislation or evidence of legislative intent.
HB1744 HD1 HMS 2012—2497
65 of 253
A-4
66 of 253
67 of 253
68 of 253
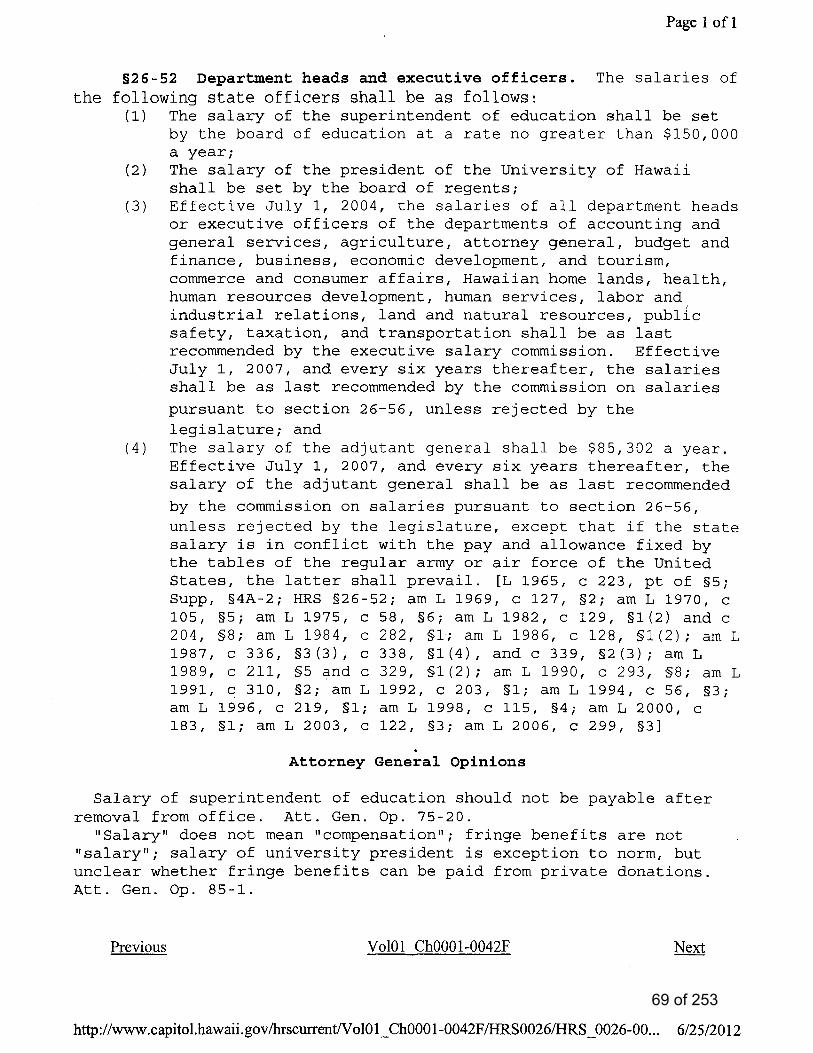
69 of 253
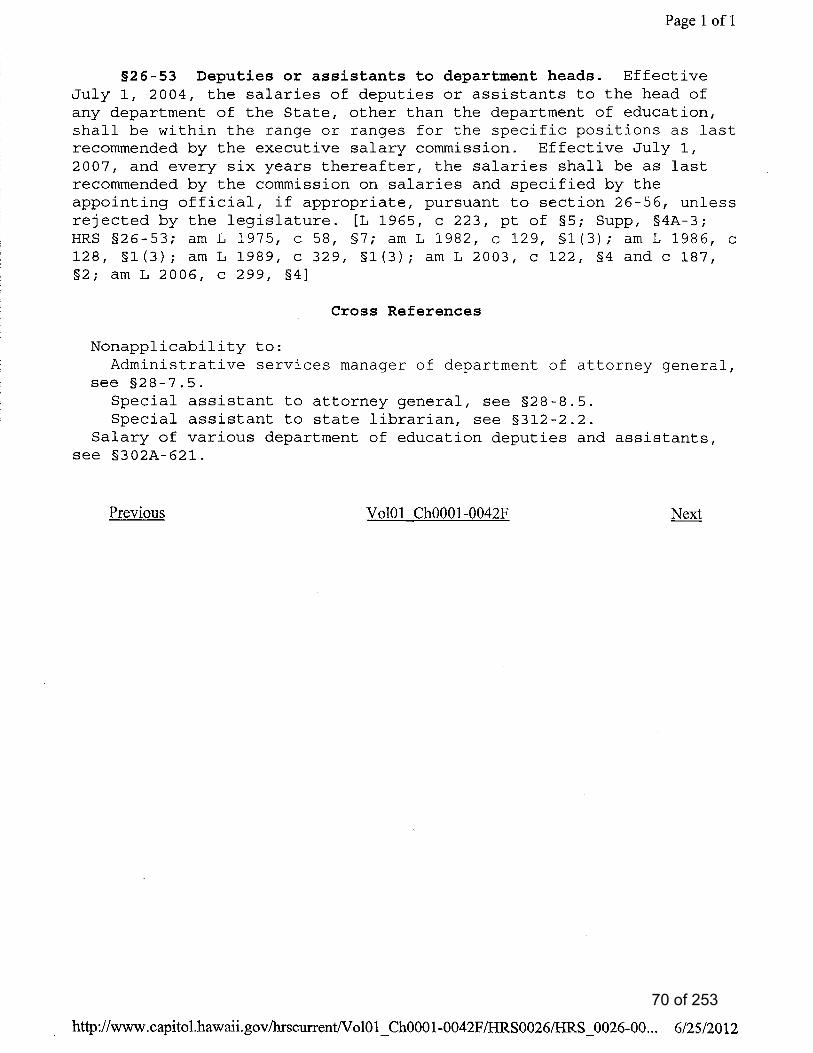
70 of 253
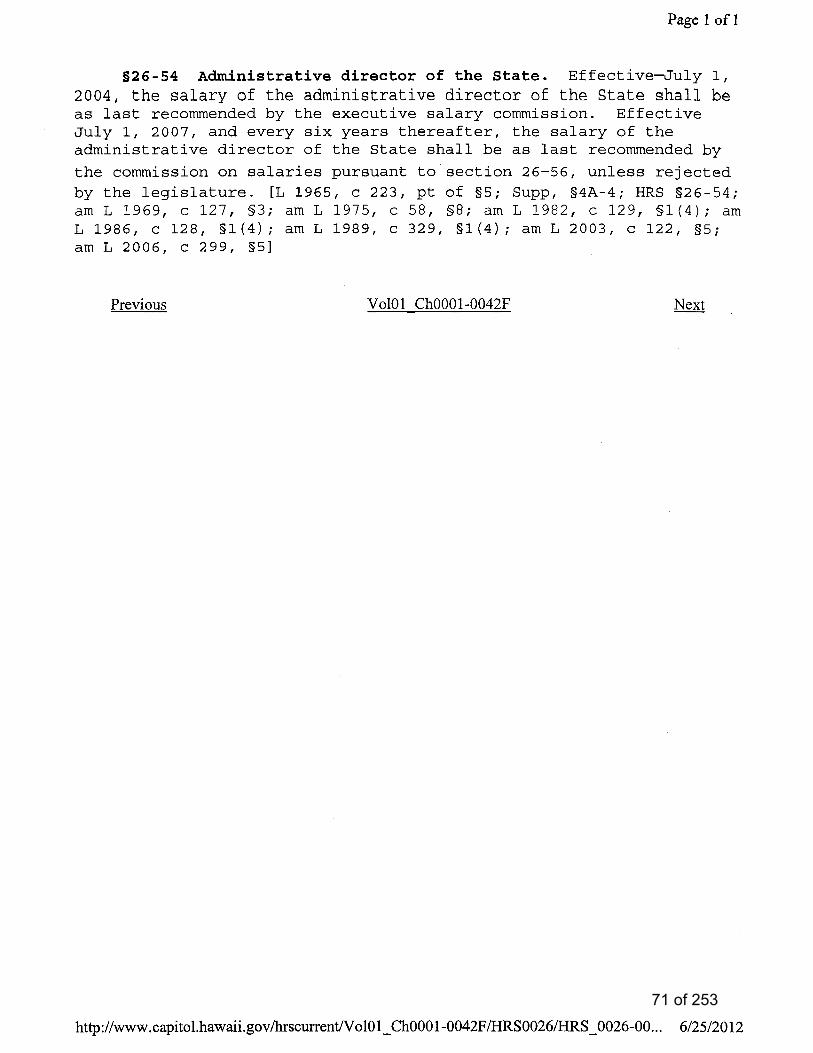
71 of 253
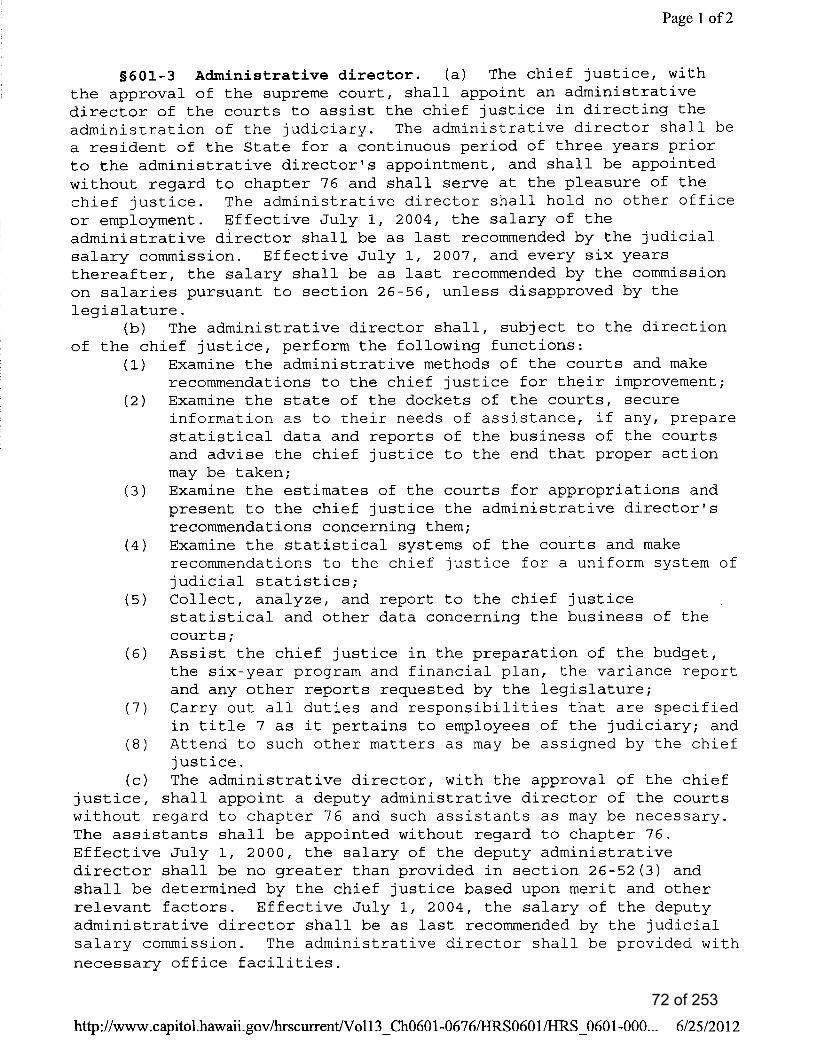
72 of 253
73 of 253
74 of 253
75 of 253
76 of 253
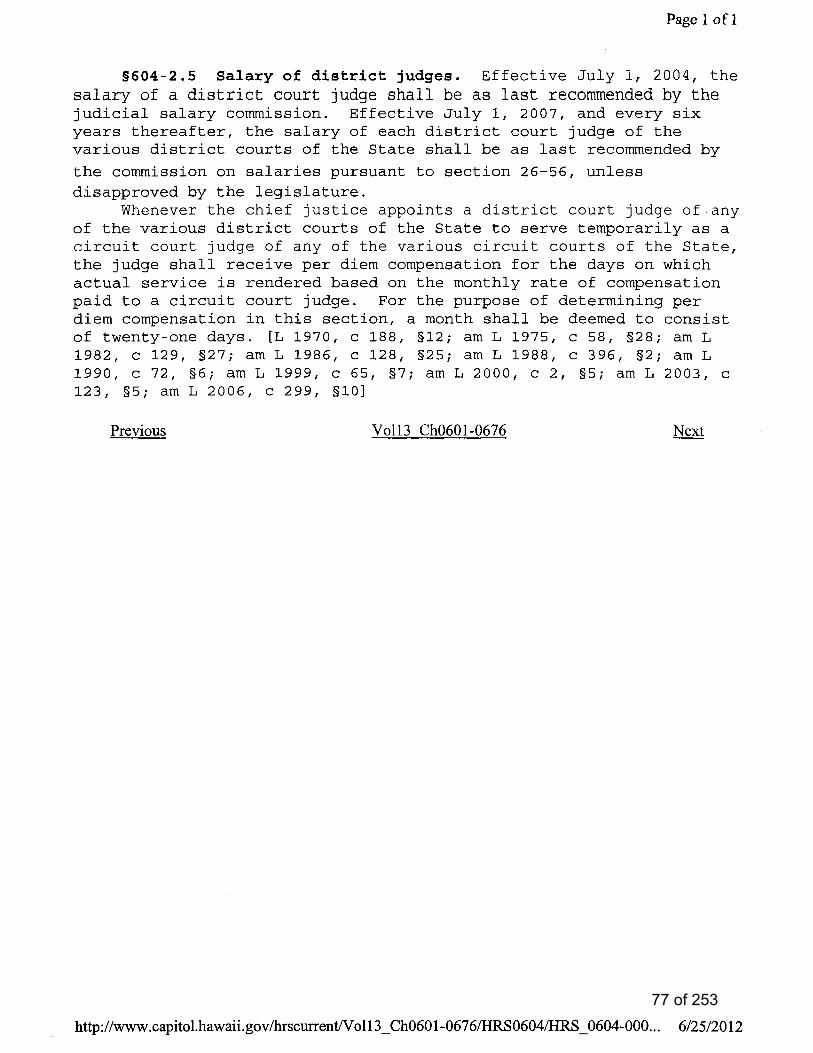
77 of 253
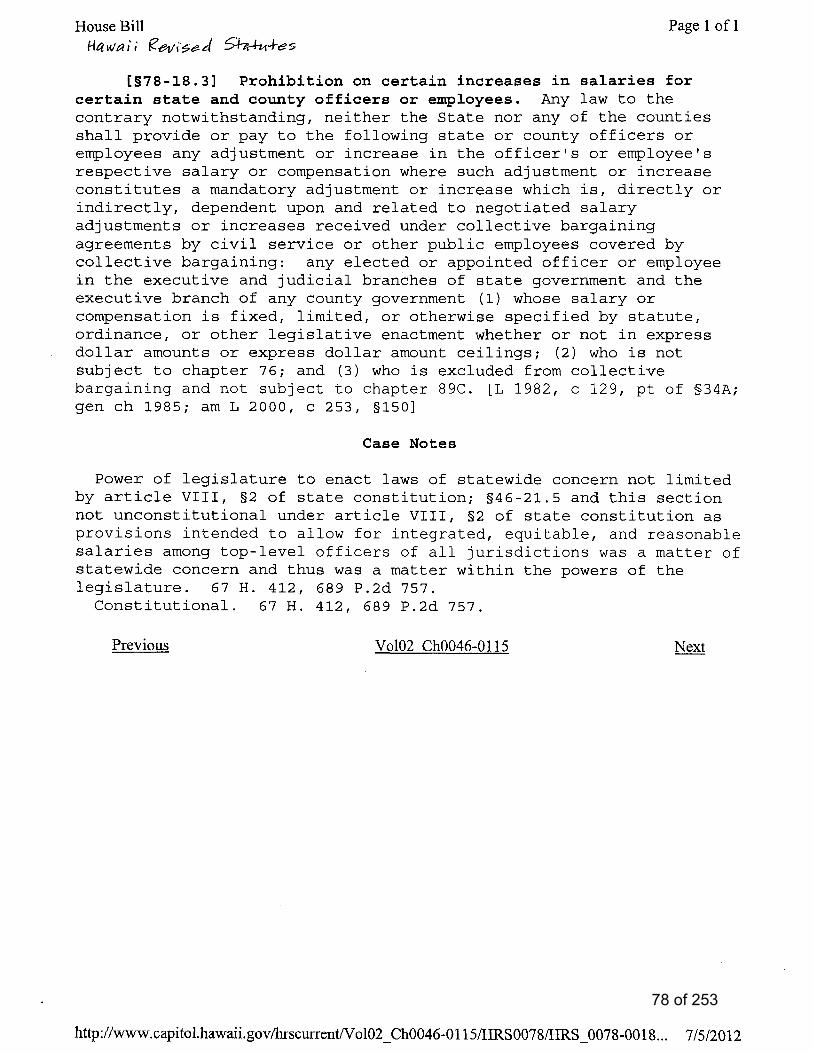
78 of 253
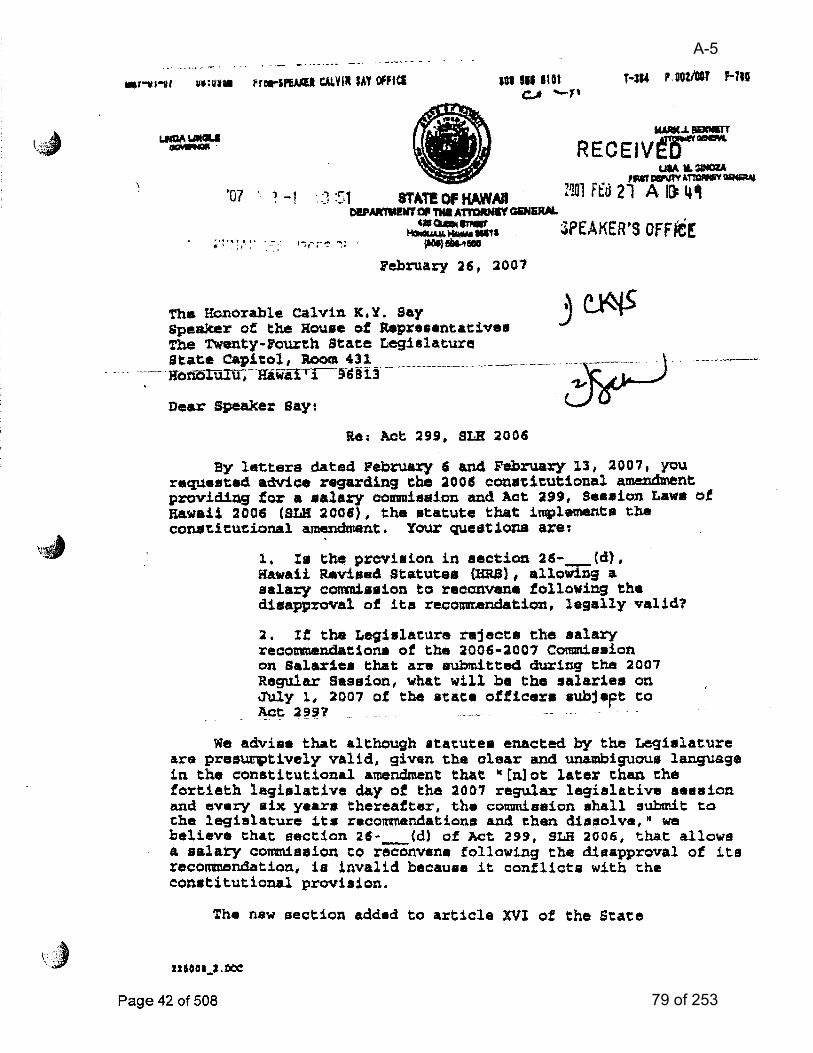
A-5
79 of 253
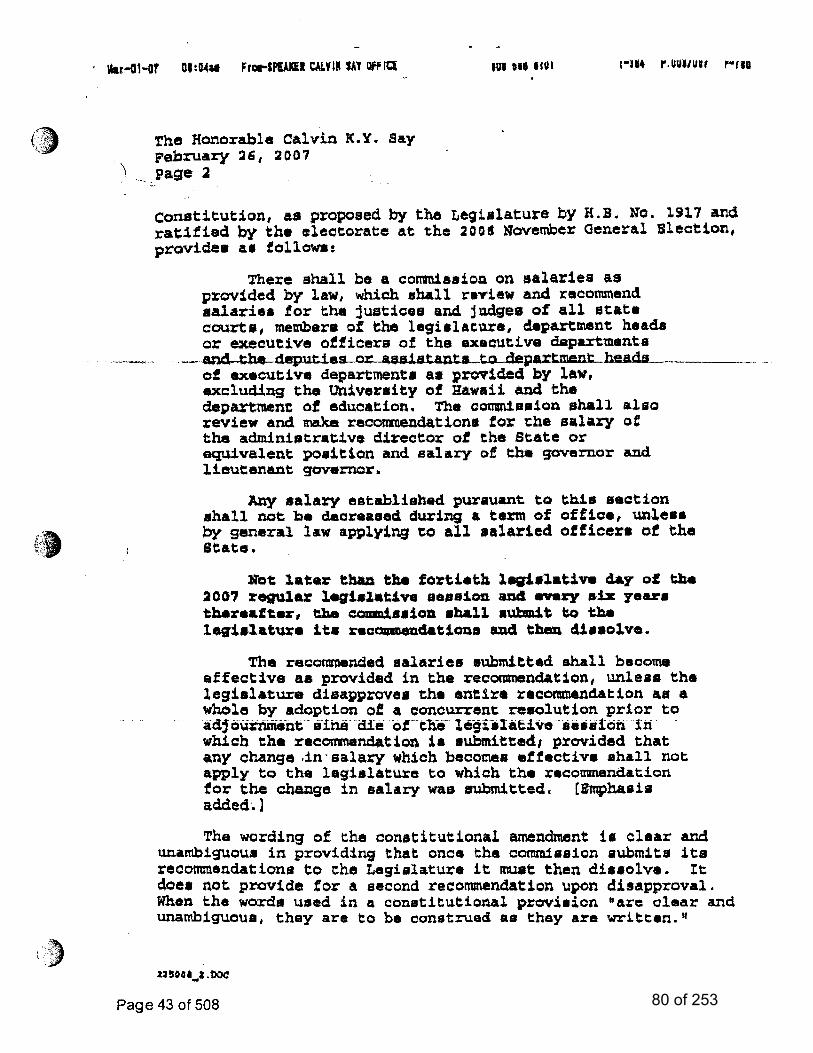
80 of 253
81 of 253
82 of 253
NEIL ABERCROMBIE GOVERNOR
BRIAN SCHATZ LT. GOVERNOR
COUNCIL ON REVENUES
STATE OF HAWAII P.O. BOX 259
HONOLULU, HAWAII 96809-0259
RICHARD F. KAHLE, JR. CHAIR
JACK P. SUYDERHOUD VICE-CHAIR
MEMBERS: Avery K. Aoki Carl S. Bonham
Christopher Grandy Kristi L. Maynard
Marilyn M. Niwao
September 10, 2012
The Honorable Neil Abercrombie Governor, State of Hawaii Executive Chambers State Capitol, Fifth Floor Honolulu, HI 96813 Dear Governor Abercrombie:
At its meeting on September 6, 2012 the Council on Revenues lowered its forecast for State General Fund tax revenue growth in fiscal year (FY) 2013 from 5.3 percent to 4.9 percent. The Council also lowered its revenue growth forecast for FY 2014 from 4.0 percent to 3.9 percent. The growth rates for FY 2015 through FY 2019 were revised slightly downward. The Council is now forecasting revenue growth of 5.0% in 2015, 1.2% in 2016, 4.2% in 2017, 5.1% in 2018, and 4.6% in 2019.
The declines in the forecasts for tax revenue growth in FY's 2013 and 2014 were mostly due to a reassessment of the cost of the renewable energy tax credits. According to a new estimate by the Department of Business, Economic Development & Tourism (DBEDT), the tax credit is predicted to grow from $34.4 million in tax year 2010 to $82.9 million in tax year 2011 and to $173.8 million in tax year 2012. DBEDT also provided a range of forecasts for tax year 2013. Accordingly, the Council assumed the cost of the credit will be $90 million higher in FY2013 than it was in FY2012, that it will be $150 million higher in FY 2014 than it was in FY2012, and that it will be higher than FY2012 in each of FY's 2015 through 2019 by $170 million.
The Council also believes that there is much uncertainty about the economies in
Europe and is concerned that events there could have important effects on the economies of the United States and Hawaii. The Council also expressed uncertainty about the future of the Honolulu rail project and its effect on the construction industry. The Council accepted other revenue estimates provided by the Hawaii Department of Budget & Finance.
A-6
83 of 253
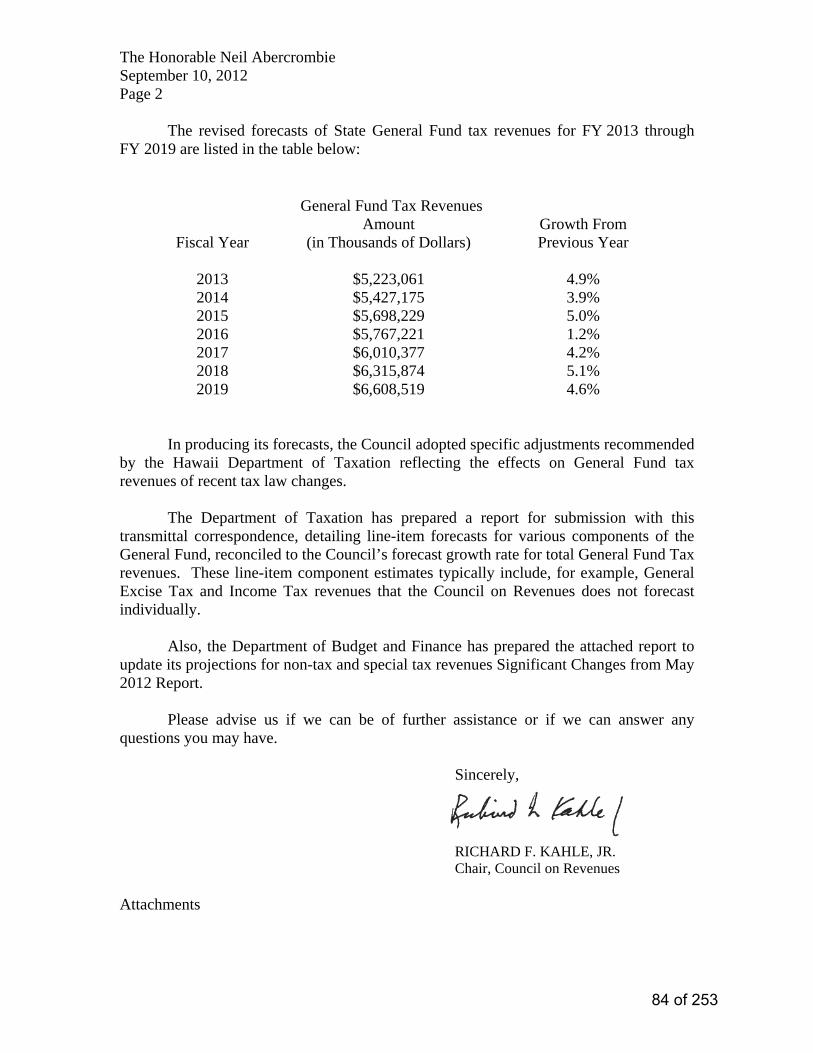
The Honorable Neil Abercrombie September 10, 2012 Page 2 The revised forecasts of State General Fund tax revenues for FY 2013 through FY 2019 are listed in the table below:
General Fund Tax Revenues
Fiscal Year Amount
(in Thousands of Dollars) Growth From Previous Year
2013 $5,223,061 4.9% 2014 $5,427,175 3.9% 2015 $5,698,229 5.0% 2016 $5,767,221 1.2% 2017 $6,010,377 4.2% 2018 $6,315,874 5.1% 2019 $6,608,519 4.6%
In producing its forecasts, the Council adopted specific adjustments recommended by the Hawaii Department of Taxation reflecting the effects on General Fund tax revenues of recent tax law changes. The Department of Taxation has prepared a report for submission with this transmittal correspondence, detailing line-item forecasts for various components of the General Fund, reconciled to the Council’s forecast growth rate for total General Fund Tax revenues. These line-item component estimates typically include, for example, General Excise Tax and Income Tax revenues that the Council on Revenues does not forecast individually.
Also, the Department of Budget and Finance has prepared the attached report to update its projections for non-tax and special tax revenues Significant Changes from May 2012 Report. Please advise us if we can be of further assistance or if we can answer any questions you may have. Sincerely,
RICHARD F. KAHLE, JR. Chair, Council on Revenues Attachments
84 of 253
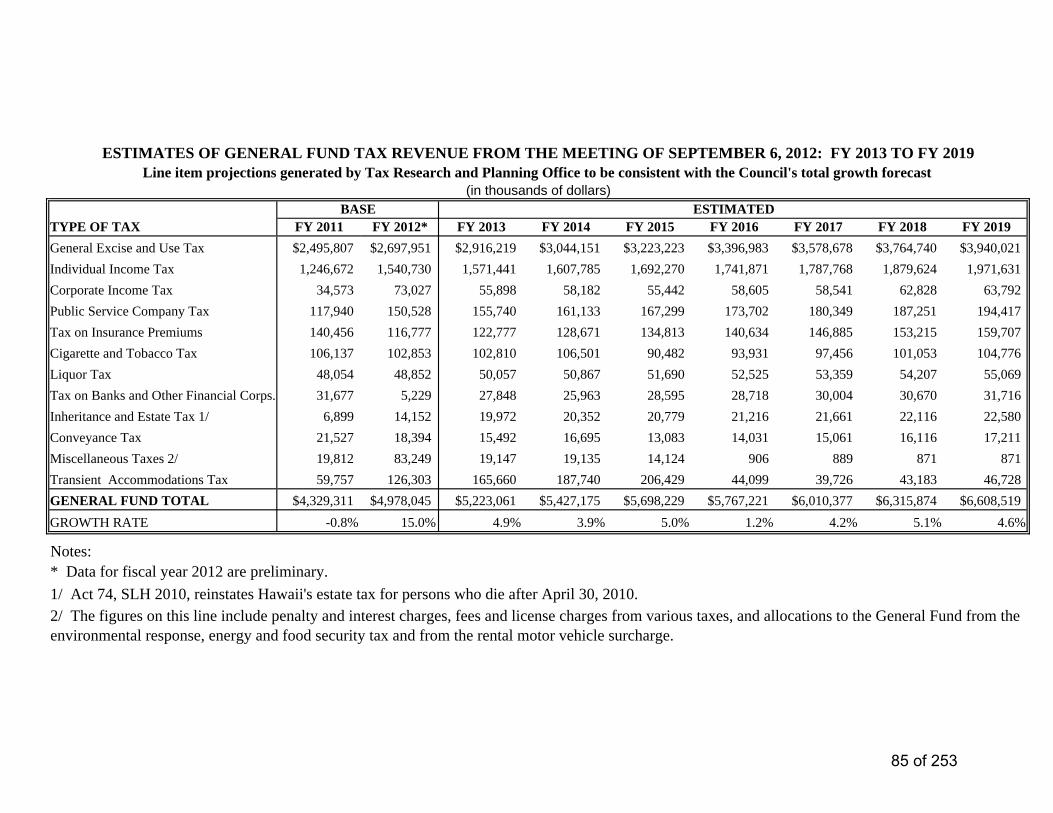
TYPE OF TAX FY 2011 FY 2012* FY 2013 FY 2014 FY 2015 FY 2016 FY 2017 FY 2018 FY 2019General Excise and Use Tax $2,495,807 $2,697,951 $2,916,219 $3,044,151 $3,223,223 $3,396,983 $3,578,678 $3,764,740 $3,940,021Individual Income Tax 1,246,672 1,540,730 1,571,441 1,607,785 1,692,270 1,741,871 1,787,768 1,879,624 1,971,631Corporate Income Tax 34,573 73,027 55,898 58,182 55,442 58,605 58,541 62,828 63,792Public Service Company Tax 117,940 150,528 155,740 161,133 167,299 173,702 180,349 187,251 194,417Tax on Insurance Premiums 140,456 116,777 122,777 128,671 134,813 140,634 146,885 153,215 159,707Cigarette and Tobacco Tax 106,137 102,853 102,810 106,501 90,482 93,931 97,456 101,053 104,776Liquor Tax 48,054 48,852 50,057 50,867 51,690 52,525 53,359 54,207 55,069Tax on Banks and Other Financial Corps. 31,677 5,229 27,848 25,963 28,595 28,718 30,004 30,670 31,716Inheritance and Estate Tax 1/ 6,899 14,152 19,972 20,352 20,779 21,216 21,661 22,116 22,580Conveyance Tax 21,527 18,394 15,492 16,695 13,083 14,031 15,061 16,116 17,211Miscellaneous Taxes 2/ 19,812 83,249 19,147 19,135 14,124 906 889 871 871Transient Accommodations Tax 59,757 126,303 165,660 187,740 206,429 44,099 39,726 43,183 46,728GENERAL FUND TOTAL $4,329,311 $4,978,045 $5,223,061 $5,427,175 $5,698,229 $5,767,221 $6,010,377 $6,315,874 $6,608,519GROWTH RATE -0.8% 15.0% 4.9% 3.9% 5.0% 1.2% 4.2% 5.1% 4.6%
Notes:* Data for fiscal year 2012 are preliminary.
2/ The figures on this line include penalty and interest charges, fees and license charges from various taxes, and allocations to the General Fund from the environmental response, energy and food security tax and from the rental motor vehicle surcharge.
1/ Act 74, SLH 2010, reinstates Hawaii's estate tax for persons who die after April 30, 2010.
ESTIMATES OF GENERAL FUND TAX REVENUE FROM THE MEETING OF SEPTEMBER 6, 2012: FY 2013 TO FY 2019
ESTIMATEDBASE
Line item projections generated by Tax Research and Planning Office to be consistent with the Council's total growth forecast(in thousands of dollars)
85 of 253
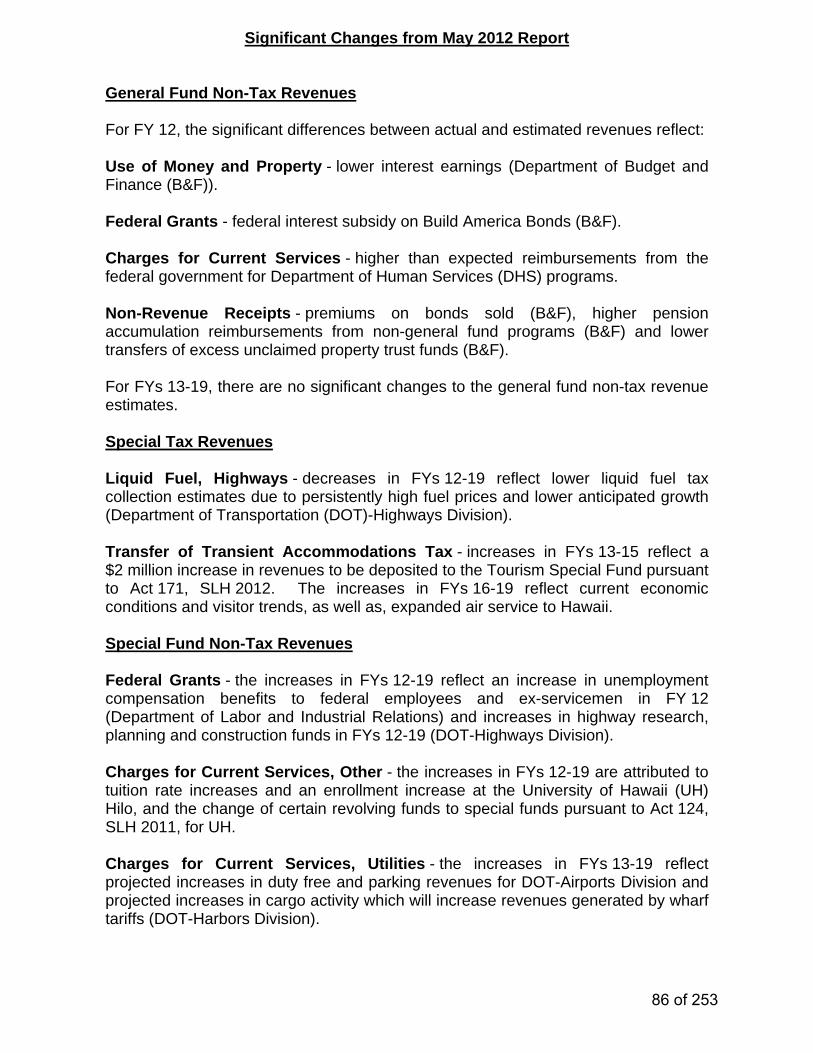
Significant Changes from May 2012 Report General Fund Non-Tax Revenues For FY 12, the significant differences between actual and estimated revenues reflect: Use of Money and Property - lower interest earnings (Department of Budget and Finance (B&F)). Federal Grants - federal interest subsidy on Build America Bonds (B&F). Charges for Current Services - higher than expected reimbursements from the federal government for Department of Human Services (DHS) programs. Non-Revenue Receipts - premiums on bonds sold (B&F), higher pension accumulation reimbursements from non-general fund programs (B&F) and lower transfers of excess unclaimed property trust funds (B&F). For FYs 13-19, there are no significant changes to the general fund non-tax revenue estimates. Special Tax Revenues Liquid Fuel, Highways - decreases in FYs 12-19 reflect lower liquid fuel tax collection estimates due to persistently high fuel prices and lower anticipated growth (Department of Transportation (DOT)-Highways Division). Transfer of Transient Accommodations Tax - increases in FYs 13-15 reflect a $2 million increase in revenues to be deposited to the Tourism Special Fund pursuant to Act 171, SLH 2012. The increases in FYs 16-19 reflect current economic conditions and visitor trends, as well as, expanded air service to Hawaii. Special Fund Non-Tax Revenues Federal Grants - the increases in FYs 12-19 reflect an increase in unemployment compensation benefits to federal employees and ex-servicemen in FY 12 (Department of Labor and Industrial Relations) and increases in highway research, planning and construction funds in FYs 12-19 (DOT-Highways Division). Charges for Current Services, Other - the increases in FYs 12-19 are attributed to tuition rate increases and an enrollment increase at the University of Hawaii (UH) Hilo, and the change of certain revolving funds to special funds pursuant to Act 124, SLH 2011, for UH. Charges for Current Services, Utilities - the increases in FYs 13-19 reflect projected increases in duty free and parking revenues for DOT-Airports Division and projected increases in cargo activity which will increase revenues generated by wharf tariffs (DOT-Harbors Division).
86 of 253

- 2 -
Non-Revenue Receipts - the increase in FY 12 reflects the actual transfers that were made to the Department of Education’s State Educational Facilities Improvement Special Fund. Other than Special Fund Non-Tax Revenues Federal Grants - the net decreases in FYs 12-19 reflect decreases in federal funds for the lower income housing assistance program (DHS), the Defense Center for Research in Ocean Science (Department of Business, Economic Development and Tourism) and revision of estimated Pell Grant expenditures (UH). American Reinvestment and Recovery Funds - the decrease in FY 12 reflects the lower than projected actual expenditures for funds for Hawaii State Highway projects (DOT-Highways Division); and the Drinking Water Treatment Program (Department of Health). Charges for Current Services - the net increases in FY 12 and FY 13 reflect increases in projected revenue collections in drug rebates for Medicaid managed care organization clients in the Medical Assistance Program (DHS). The net decreases in FY 14 and FY 15 reflect the change of certain revolving funds to special funds in accordance with Act 124, SLH 2011, for UH. Repayments of Loans and Advances - the net decreases in FY 12, FY 15 and FY 17 and net increases in FY 13, FY 16 and FY 18 are attributed to anticipated delays in loan repayments for several projects under development for affordable housing (Hawaii Housing Finance and Development Corporation (HHFDC)). Transfers - the decrease in FY 12 and increase in FY 13 is attributed to a delay in the project bond issuances for projects under development for affordable housing (HHFDC).
87 of 253
88 of 253
89 of 253
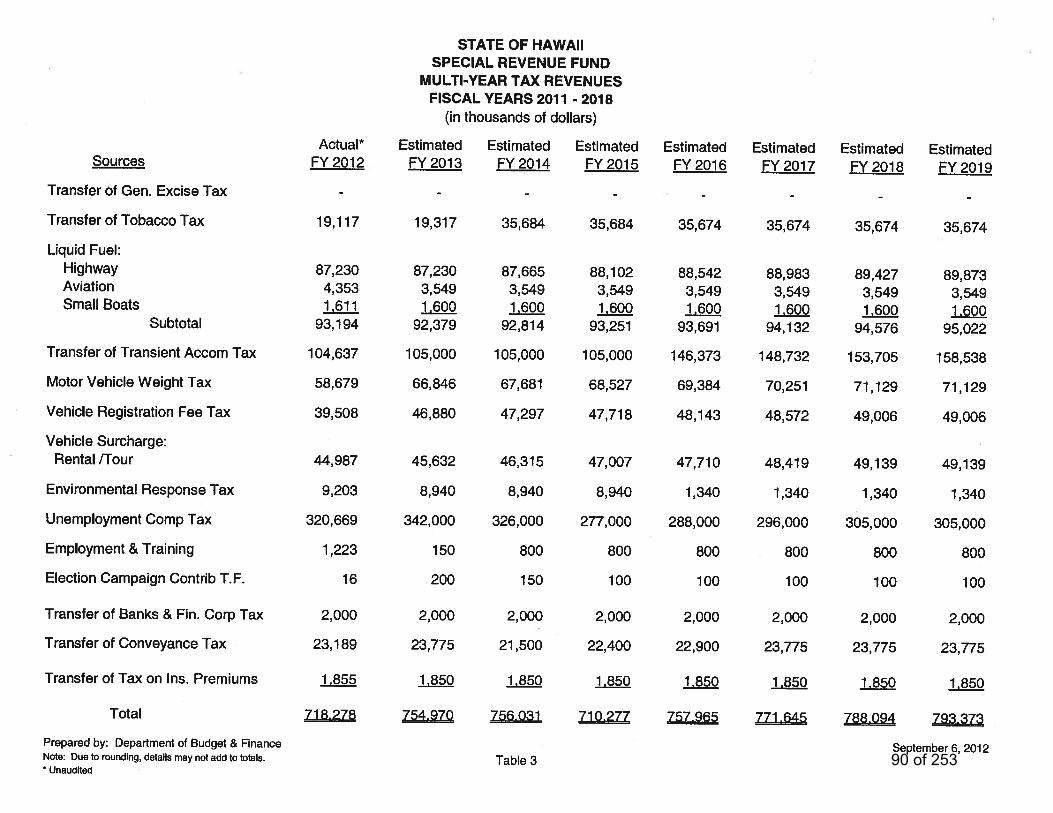
90 of 253
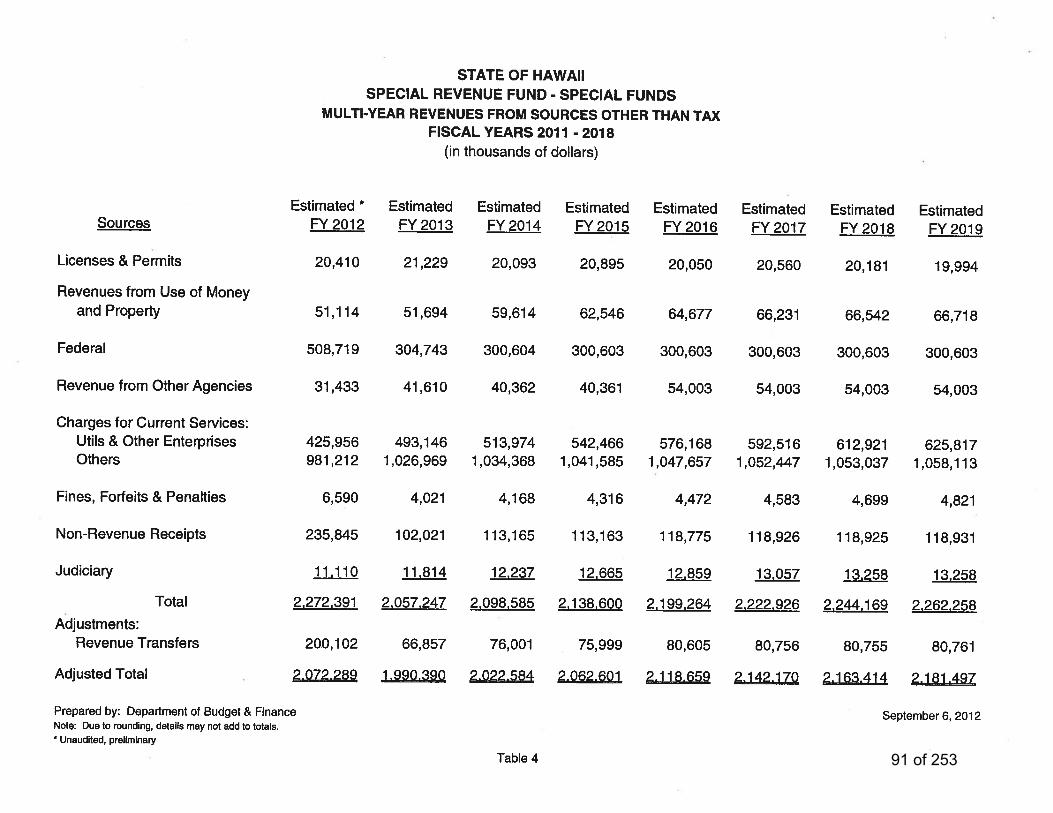
91 of 253
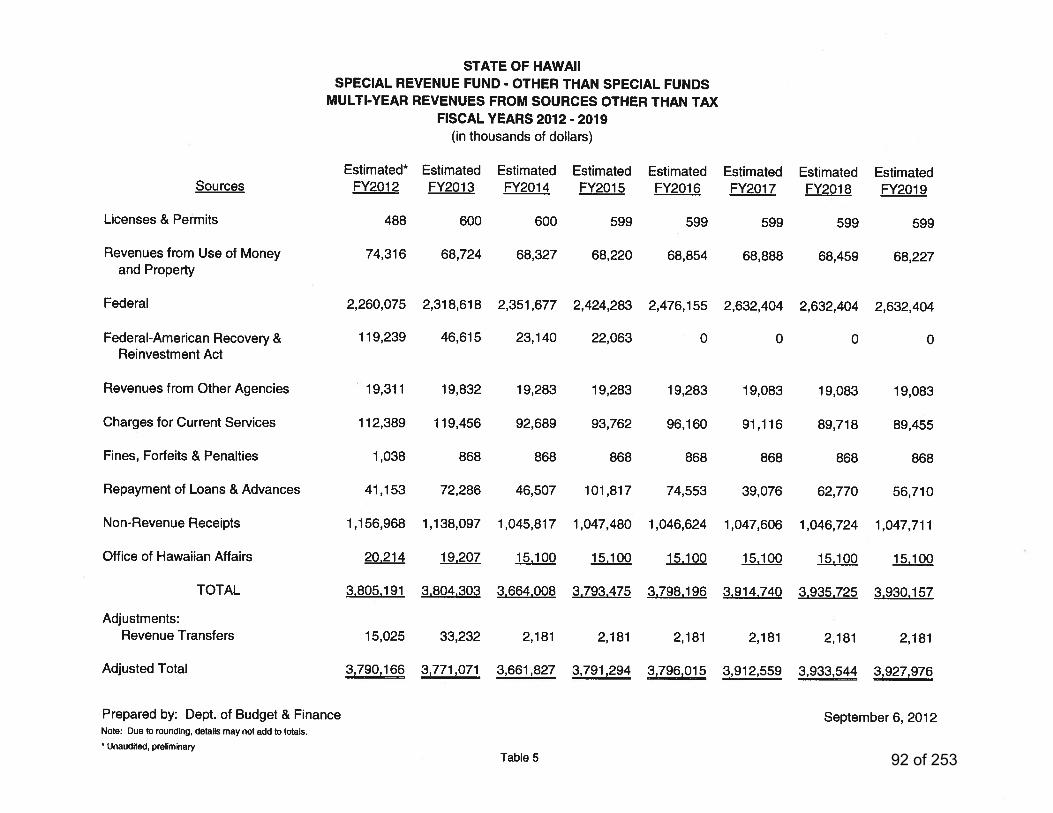
92 of 253
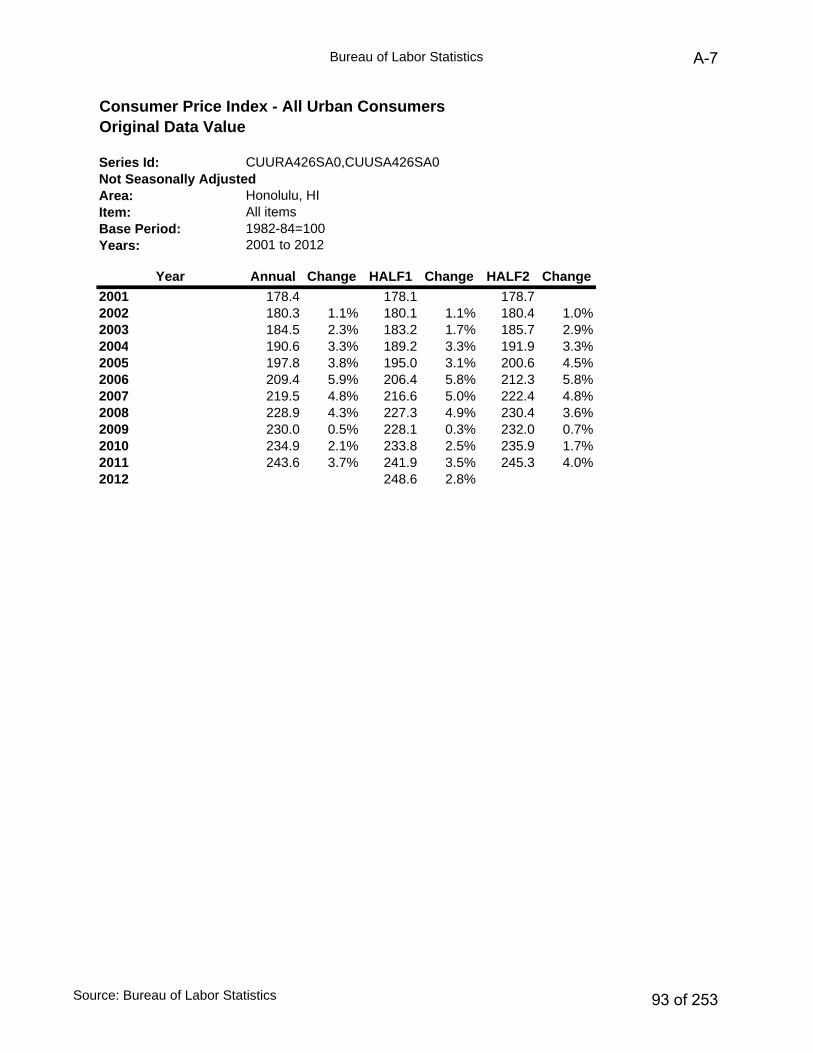
Bureau of Labor Statistics
Series Id:
Area:Item:Base Period:Years:
Year Annual Change HALF1 Change HALF2 Change2001 178.4 178.1 178.72002 180.3 1.1% 180.1 1.1% 180.4 1.0%2003 184.5 2.3% 183.2 1.7% 185.7 2.9%2004 190.6 3.3% 189.2 3.3% 191.9 3.3%2005 197.8 3.8% 195.0 3.1% 200.6 4.5%2006 209.4 5.9% 206.4 5.8% 212.3 5.8%2007 219.5 4.8% 216.6 5.0% 222.4 4.8%2008 228.9 4.3% 227.3 4.9% 230.4 3.6%2009 230.0 0.5% 228.1 0.3% 232.0 0.7%2010 234.9 2.1% 233.8 2.5% 235.9 1.7%2011 243.6 3.7% 241.9 3.5% 245.3 4.0%2012 248.6 2.8%
Consumer Price Index - All Urban ConsumersOriginal Data Value
CUURA426SA0,CUUSA426SA0
2001 to 2012
Not Seasonally AdjustedHonolulu, HIAll items1982-84=100
Source: Bureau of Labor Statistics
A-7
93 of 253

Chart 1
State of Hawaii Department of Budget and Finance
OVERVIEW
OF THE
STATE’S GENERAL FUND
FISCAL CONDITION
A-8
94 of 253
Chart 2
State of Hawaii Department of Budget and Finance
1. Council on Revenue
2. Financial Plan A. FYB 14-15 Budget
B. Risks & Issues
3. Unfunded Liabilities
95 of 253
Chart 3
State of Hawaii Department of Budget and Finance
Council on Revenues’
Projections
96 of 253
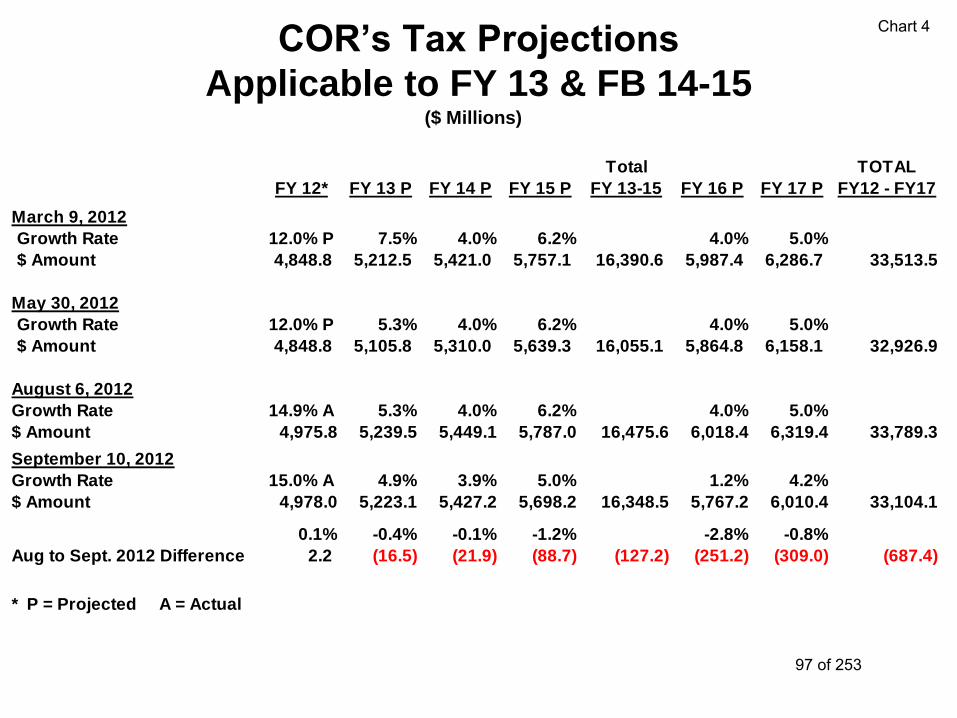
Chart 4 COR’s Tax Projections
Applicable to FY 13 & FB 14-15 ($ Millions)
Total TOTAL
FY 12* FY 13 P FY 14 P FY 15 P FY 13-15 FY 16 P FY 17 P FY12 - FY17
March 9, 2012
Growth Rate 12.0% P 7.5% 4.0% 6.2% 4.0% 5.0%
$ Amount 4,848.8 5,212.5 5,421.0 5,757.1 16,390.6 5,987.4 6,286.7 33,513.5
May 30, 2012
Growth Rate 12.0% P 5.3% 4.0% 6.2% 4.0% 5.0%
$ Amount 4,848.8 5,105.8 5,310.0 5,639.3 16,055.1 5,864.8 6,158.1 32,926.9
August 6, 2012
Growth Rate 14.9% A 5.3% 4.0% 6.2% 4.0% 5.0%
$ Amount 4,975.8 5,239.5 5,449.1 5,787.0 16,475.6 6,018.4 6,319.4 33,789.3
September 10, 2012
Growth Rate 15.0% A 4.9% 3.9% 5.0% 1.2% 4.2%
$ Amount 4,978.0 5,223.1 5,427.2 5,698.2 16,348.5 5,767.2 6,010.4 33,104.1
0.1% -0.4% -0.1% -1.2% -2.8% -0.8%
Aug to Sept. 2012 Difference 2.2 (16.5) (21.9) (88.7) (127.2) (251.2) (309.0) (687.4)
* P = Projected A = Actual
97 of 253

Chart 5
State of Hawaii Department of Budget and Finance
General Fund
Financial Plan
98 of 253
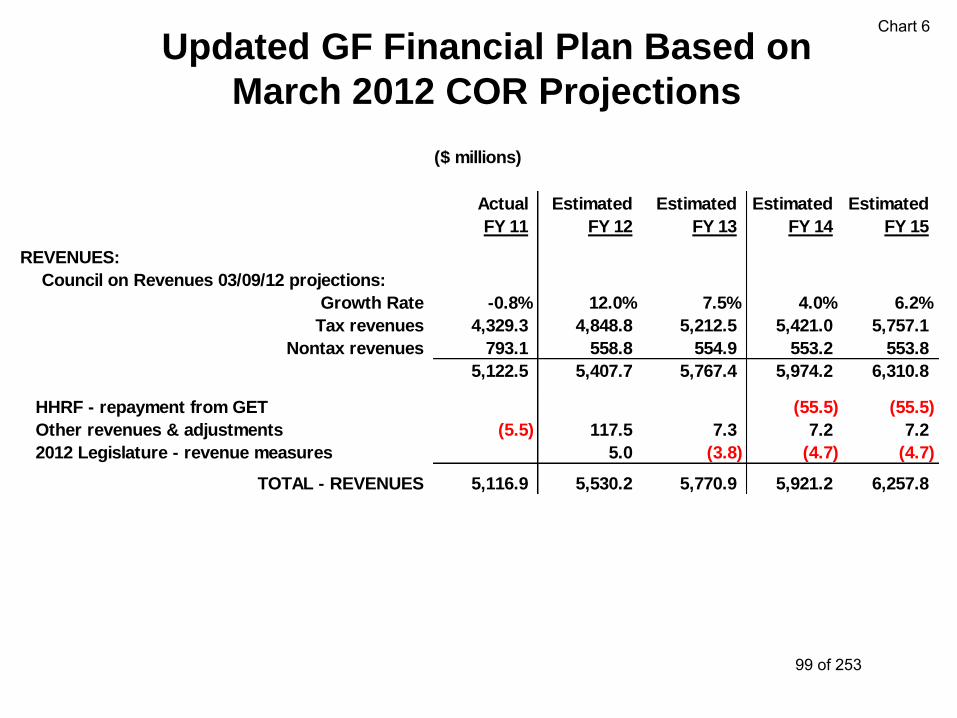
Chart 6
Updated GF Financial Plan Based on
March 2012 COR Projections
Actual Estimated Estimated Estimated Estimated
FY 11 FY 12 FY 13 FY 14 FY 15
REVENUES:
Council on Revenues 03/09/12 projections:
Growth Rate -0.8% 12.0% 7.5% 4.0% 6.2%
Tax revenues 4,329.3 4,848.8 5,212.5 5,421.0 5,757.1
Nontax revenues 793.1 558.8 554.9 553.2 553.8
5,122.5 5,407.7 5,767.4 5,974.2 6,310.8
HHRF - repayment from GET (55.5) (55.5)
Other revenues & adjustments (5.5) 117.5 7.3 7.2 7.2
2012 Legislature - revenue measures 5.0 (3.8) (4.7) (4.7)
TOTAL - REVENUES 5,116.9 5,530.2 5,770.9 5,921.2 6,257.8
($ millions)
99 of 253
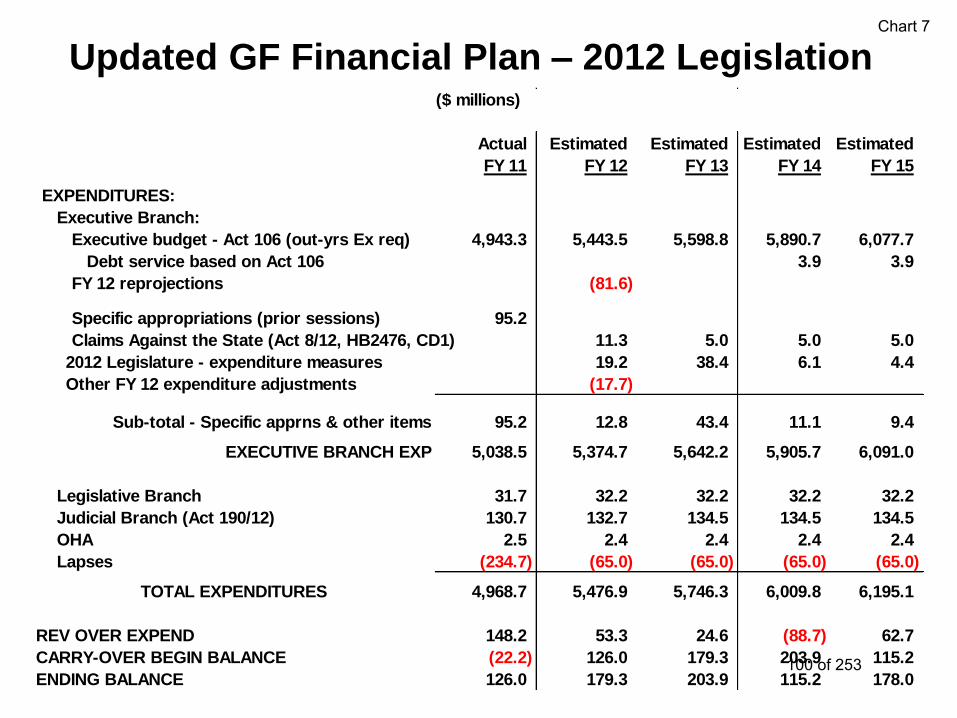
Chart 7
Updated GF Financial Plan – 2012 Legislation
Actual Estimated Estimated Estimated Estimated
FY 11 FY 12 FY 13 FY 14 FY 15
EXPENDITURES:
Executive Branch:
Executive budget - Act 106 (out-yrs Ex req) 4,943.3 5,443.5 5,598.8 5,890.7 6,077.7
Debt service based on Act 106 3.9 3.9
FY 12 reprojections (81.6)
Specific appropriations (prior sessions) 95.2
Claims Against the State (Act 8/12, HB2476, CD1) 11.3 5.0 5.0 5.0
2012 Legislature - expenditure measures 19.2 38.4 6.1 4.4
Other FY 12 expenditure adjustments (17.7)
Sub-total - Specific apprns & other items 95.2 12.8 43.4 11.1 9.4
EXECUTIVE BRANCH EXP 5,038.5 5,374.7 5,642.2 5,905.7 6,091.0
Legislative Branch 31.7 32.2 32.2 32.2 32.2
Judicial Branch (Act 190/12) 130.7 132.7 134.5 134.5 134.5
OHA 2.5 2.4 2.4 2.4 2.4
Lapses (234.7) (65.0) (65.0) (65.0) (65.0)
TOTAL EXPENDITURES 4,968.7 5,476.9 5,746.3 6,009.8 6,195.1
REV OVER EXPEND 148.2 53.3 24.6 (88.7) 62.7
CARRY-OVER BEGIN BALANCE (22.2) 126.0 179.3 203.9 115.2
ENDING BALANCE 126.0 179.3 203.9 115.2 178.0
($ millions)
100 of 253
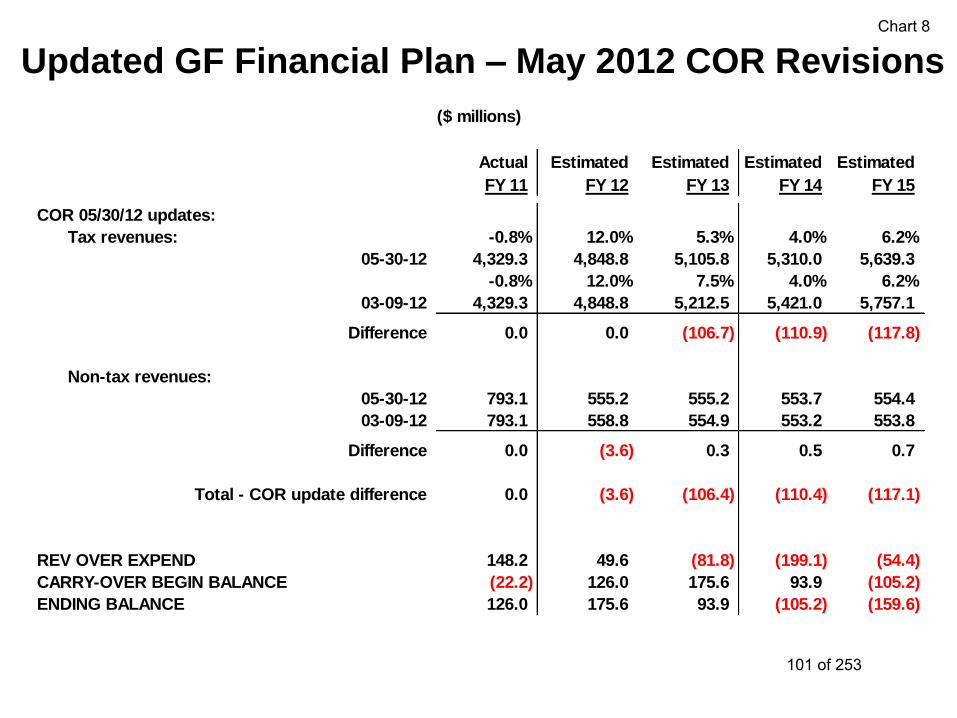
Chart 8
Updated GF Financial Plan – May 2012 COR Revisions
Actual Estimated Estimated Estimated Estimated
FY 11 FY 12 FY 13 FY 14 FY 15
COR 05/30/12 updates:
Tax revenues: -0.8% 12.0% 5.3% 4.0% 6.2%
05-30-12 4,329.3 4,848.8 5,105.8 5,310.0 5,639.3
-0.8% 12.0% 7.5% 4.0% 6.2%
03-09-12 4,329.3 4,848.8 5,212.5 5,421.0 5,757.1
Difference 0.0 0.0 (106.7) (110.9) (117.8)
Non-tax revenues:
05-30-12 793.1 555.2 555.2 553.7 554.4
03-09-12 793.1 558.8 554.9 553.2 553.8
Difference 0.0 (3.6) 0.3 0.5 0.7
Total - COR update difference 0.0 (3.6) (106.4) (110.4) (117.1)
REV OVER EXPEND 148.2 49.6 (81.8) (199.1) (54.4)
CARRY-OVER BEGIN BALANCE (22.2) 126.0 175.6 93.9 (105.2)
ENDING BALANCE 126.0 175.6 93.9 (105.2) (159.6)
($ millions)
101 of 253
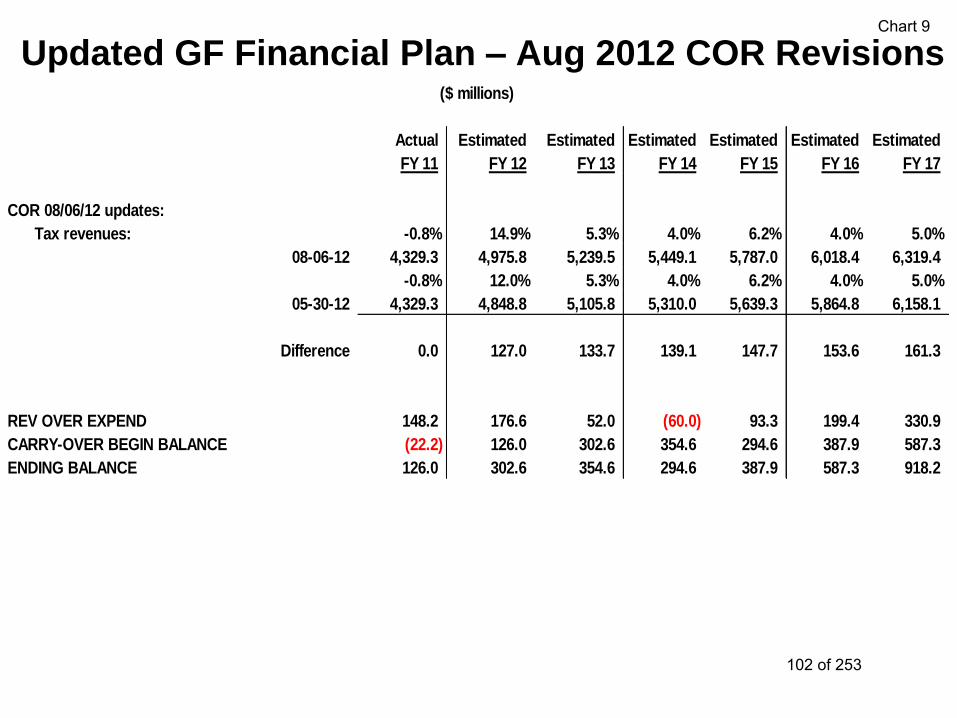
Chart 9
Updated GF Financial Plan – Aug 2012 COR Revisions
Actual Estimated Estimated Estimated Estimated Estimated Estimated
FY 11 FY 12 FY 13 FY 14 FY 15 FY 16 FY 17
COR 08/06/12 updates:
Tax revenues: -0.8% 14.9% 5.3% 4.0% 6.2% 4.0% 5.0%
08-06-12 4,329.3 4,975.8 5,239.5 5,449.1 5,787.0 6,018.4 6,319.4
-0.8% 12.0% 5.3% 4.0% 6.2% 4.0% 5.0%
05-30-12 4,329.3 4,848.8 5,105.8 5,310.0 5,639.3 5,864.8 6,158.1
Difference 0.0 127.0 133.7 139.1 147.7 153.6 161.3
REV OVER EXPEND 148.2 176.6 52.0 (60.0) 93.3 199.4 330.9
CARRY-OVER BEGIN BALANCE (22.2) 126.0 302.6 354.6 294.6 387.9 587.3
ENDING BALANCE 126.0 302.6 354.6 294.6 387.9 587.3 918.2
($ millions)
102 of 253
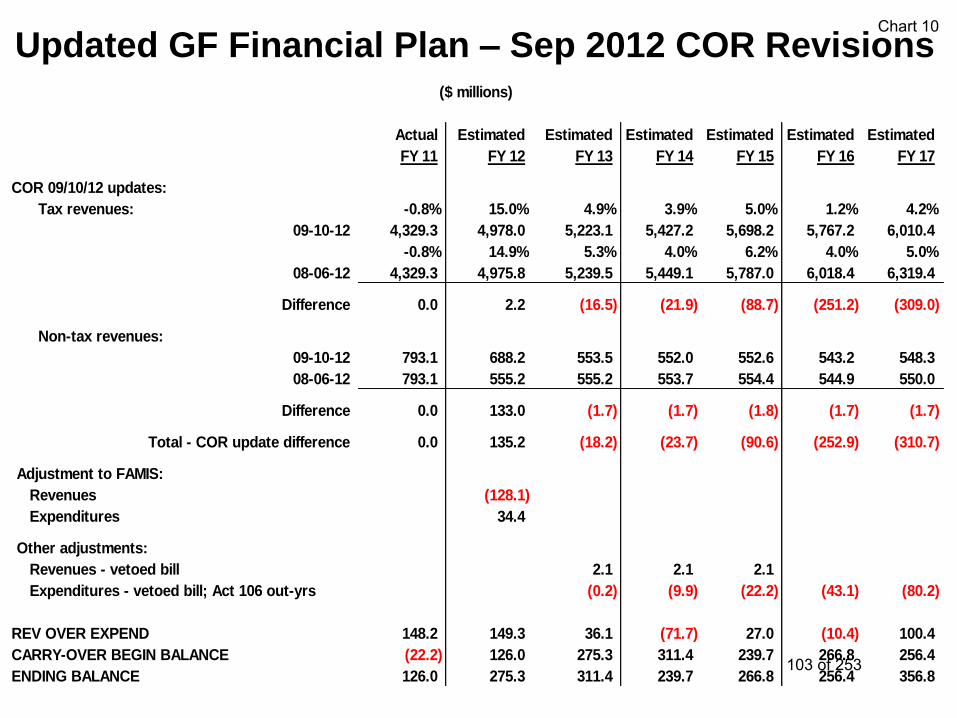
Chart 10 Updated GF Financial Plan – Sep 2012 COR Revisions
Actual Estimated Estimated Estimated Estimated Estimated Estimated
FY 11 FY 12 FY 13 FY 14 FY 15 FY 16 FY 17
COR 09/10/12 updates:
Tax revenues: -0.8% 15.0% 4.9% 3.9% 5.0% 1.2% 4.2%
09-10-12 4,329.3 4,978.0 5,223.1 5,427.2 5,698.2 5,767.2 6,010.4
-0.8% 14.9% 5.3% 4.0% 6.2% 4.0% 5.0%
08-06-12 4,329.3 4,975.8 5,239.5 5,449.1 5,787.0 6,018.4 6,319.4
Difference 0.0 2.2 (16.5) (21.9) (88.7) (251.2) (309.0)
Non-tax revenues:
09-10-12 793.1 688.2 553.5 552.0 552.6 543.2 548.3
08-06-12 793.1 555.2 555.2 553.7 554.4 544.9 550.0
Difference 0.0 133.0 (1.7) (1.7) (1.8) (1.7) (1.7)
Total - COR update difference 0.0 135.2 (18.2) (23.7) (90.6) (252.9) (310.7)
Adjustment to FAMIS:
Revenues (128.1)
Expenditures 34.4
Other adjustments:
Revenues - vetoed bill 2.1 2.1 2.1
Expenditures - vetoed bill; Act 106 out-yrs (0.2) (9.9) (22.2) (43.1) (80.2)
REV OVER EXPEND 148.2 149.3 36.1 (71.7) 27.0 (10.4) 100.4
CARRY-OVER BEGIN BALANCE (22.2) 126.0 275.3 311.4 239.7 266.8 256.4
ENDING BALANCE 126.0 275.3 311.4 239.7 266.8 256.4 356.8
($ millions)
103 of 253
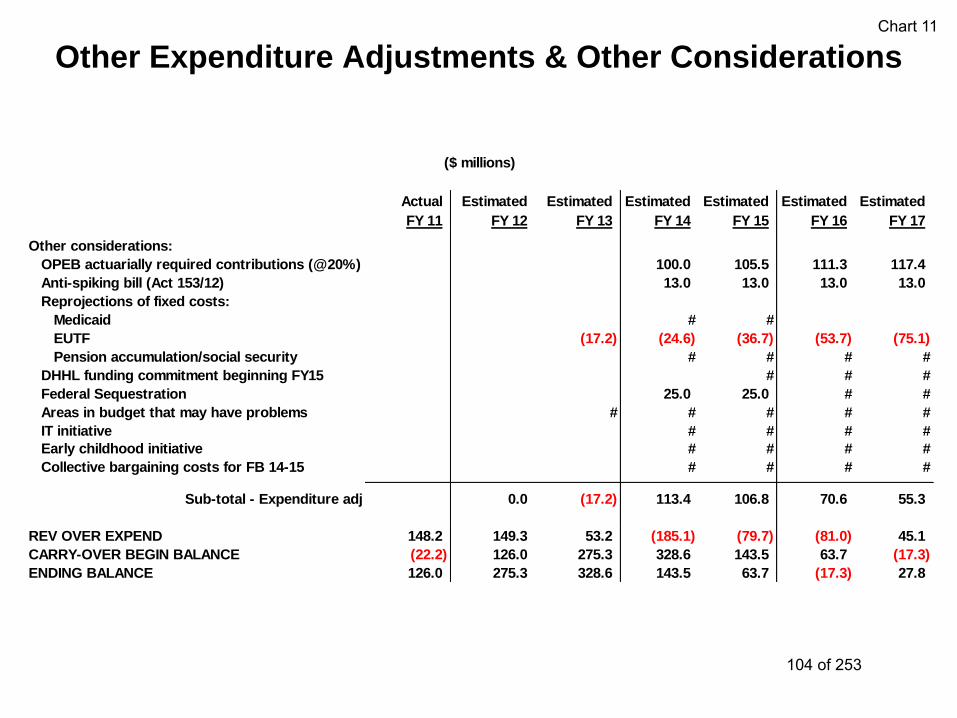
Chart 11
Other Expenditure Adjustments & Other Considerations
Actual Estimated Estimated Estimated Estimated Estimated Estimated
FY 11 FY 12 FY 13 FY 14 FY 15 FY 16 FY 17
Other considerations:
OPEB actuarially required contributions (@20%) 100.0 105.5 111.3 117.4
Anti-spiking bill (Act 153/12) 13.0 13.0 13.0 13.0
Reprojections of fixed costs:
Medicaid # #
EUTF (17.2) (24.6) (36.7) (53.7) (75.1)
Pension accumulation/social security # # # #
DHHL funding commitment beginning FY15 # # #
Federal Sequestration 25.0 25.0 # #
Areas in budget that may have problems # # # # #
IT initiative # # # #
Early childhood initiative # # # #
Collective bargaining costs for FB 14-15 # # # #
Sub-total - Expenditure adj 0.0 (17.2) 113.4 106.8 70.6 55.3
REV OVER EXPEND 148.2 149.3 53.2 (185.1) (79.7) (81.0) 45.1
CARRY-OVER BEGIN BALANCE (22.2) 126.0 275.3 328.6 143.5 63.7 (17.3)
ENDING BALANCE 126.0 275.3 328.6 143.5 63.7 (17.3) 27.8
($ millions)
104 of 253

Chart 12
External Risk Factors
• Europe’s economic uncertainty
• Uncertain impact of cuts in federal spending on Hawaii’s
economy & funding of State programs
• Possibility of high oil prices due to continuing tensions in the
Middle East
• Tourism at near record levels – limited carrying capacity for
continuous expansion
• Future years sustainability – are near term funding increases
sustainable over long term?
105 of 253

Chart 13 Budget Issues for
Next Biennium & Beyond
• Collective bargaining in FB 14-15
• Federal fund cutbacks
• OPEB pre-funding
• DHHL funding commitment beginning FY 15
• Trouble areas in budget (e.g., school bus, etc.)
• Information technology initiative
• Early childhood initiative
106 of 253

Chart 14
State of Hawaii Department of Budget and Finance
Unfunded
Liabilities
107 of 253
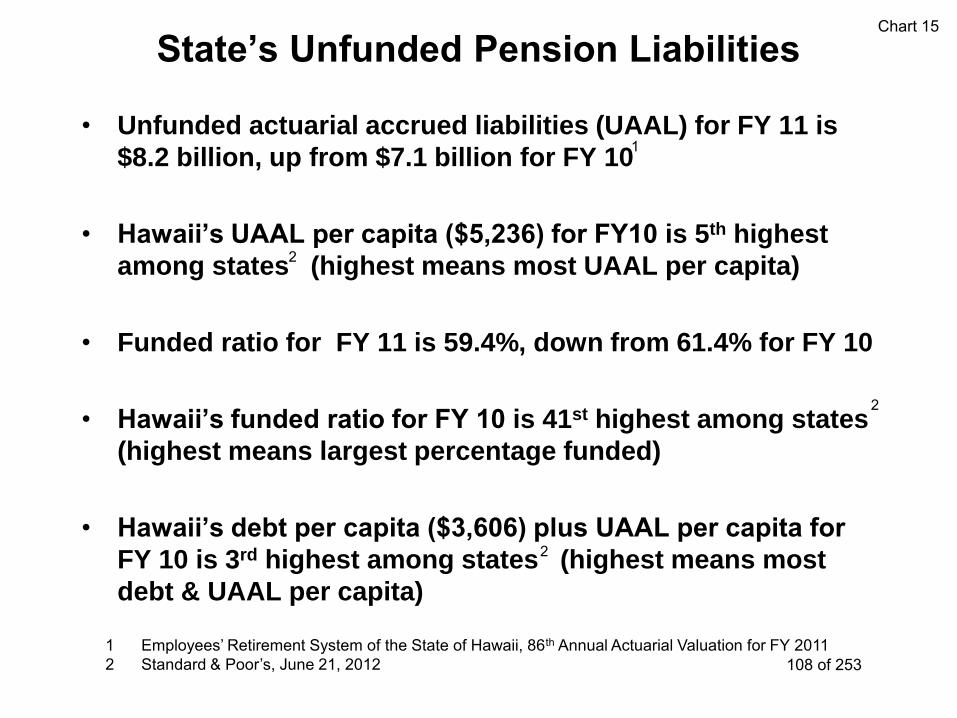
Chart 15
State’s Unfunded Pension Liabilities
• Unfunded actuarial accrued liabilities (UAAL) for FY 11 is
$8.2 billion, up from $7.1 billion for FY 10
• Hawaii’s UAAL per capita ($5,236) for FY10 is 5th highest
among states (highest means most UAAL per capita)
• Funded ratio for FY 11 is 59.4%, down from 61.4% for FY 10
• Hawaii’s funded ratio for FY 10 is 41st highest among states
(highest means largest percentage funded)
• Hawaii’s debt per capita ($3,606) plus UAAL per capita for
FY 10 is 3rd highest among states (highest means most
debt & UAAL per capita)
2
2
2
1 Employees’ Retirement System of the State of Hawaii, 86th Annual Actuarial Valuation for FY 2011 2 Standard & Poor’s, June 21, 2012
1
108 of 253
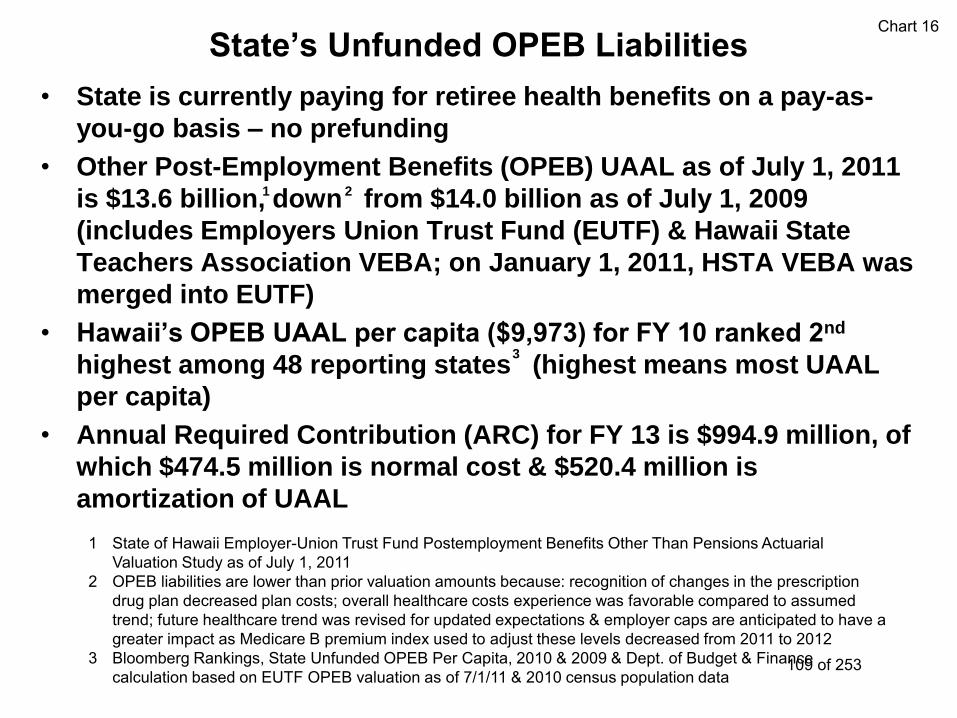
Chart 16 State’s Unfunded OPEB Liabilities
• State is currently paying for retiree health benefits on a pay-as-
you-go basis – no prefunding
• Other Post-Employment Benefits (OPEB) UAAL as of July 1, 2011
is $13.6 billion, down from $14.0 billion as of July 1, 2009
(includes Employers Union Trust Fund (EUTF) & Hawaii State
Teachers Association VEBA; on January 1, 2011, HSTA VEBA was
merged into EUTF)
• Hawaii’s OPEB UAAL per capita ($9,973) for FY 10 ranked 2nd
highest among 48 reporting states (highest means most UAAL
per capita)
• Annual Required Contribution (ARC) for FY 13 is $994.9 million, of
which $474.5 million is normal cost & $520.4 million is
amortization of UAAL
1 State of Hawaii Employer-Union Trust Fund Postemployment Benefits Other Than Pensions Actuarial Valuation Study as of July 1, 2011
2 OPEB liabilities are lower than prior valuation amounts because: recognition of changes in the prescription drug plan decreased plan costs; overall healthcare costs experience was favorable compared to assumed trend; future healthcare trend was revised for updated expectations & employer caps are anticipated to have a greater impact as Medicare B premium index used to adjust these levels decreased from 2011 to 2012
3 Bloomberg Rankings, State Unfunded OPEB Per Capita, 2010 & 2009 & Dept. of Budget & Finance calculation based on EUTF OPEB valuation as of 7/1/11 & 2010 census population data
1 2
3
109 of 253
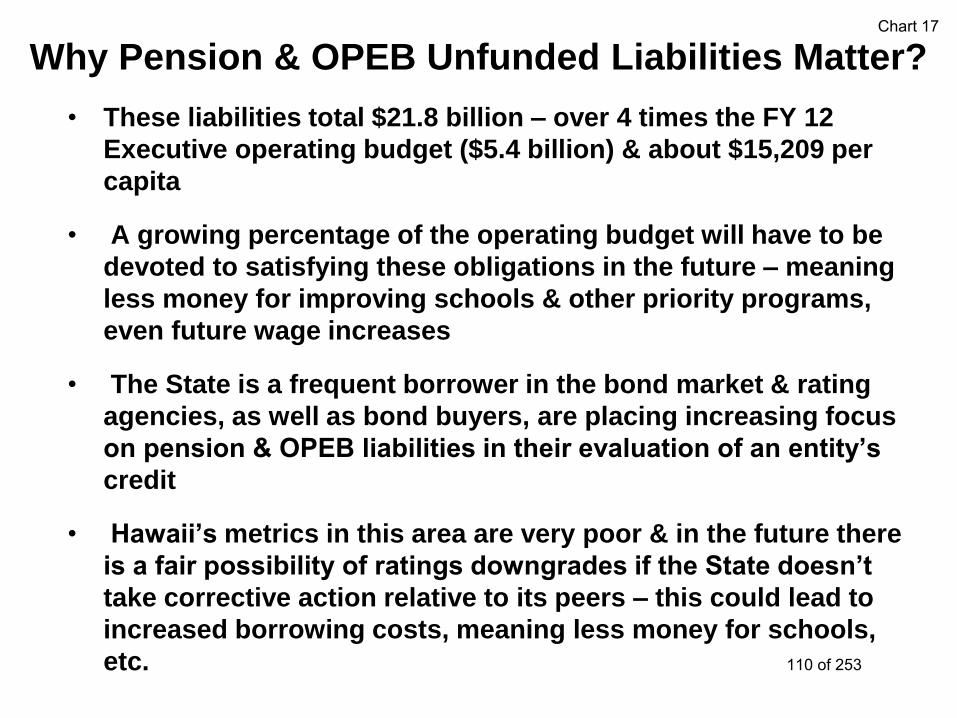
Chart 17
Why Pension & OPEB Unfunded Liabilities Matter?
• These liabilities total $21.8 billion – over 4 times the FY 12
Executive operating budget ($5.4 billion) & about $15,209 per
capita
• A growing percentage of the operating budget will have to be
devoted to satisfying these obligations in the future – meaning
less money for improving schools & other priority programs,
even future wage increases
• The State is a frequent borrower in the bond market & rating
agencies, as well as bond buyers, are placing increasing focus
on pension & OPEB liabilities in their evaluation of an entity’s
credit
• Hawaii’s metrics in this area are very poor & in the future there
is a fair possibility of ratings downgrades if the State doesn’t
take corrective action relative to its peers – this could lead to
increased borrowing costs, meaning less money for schools,
etc.
110 of 253
A-9
111 of 253
112 of 253
113 of 253
114 of 253
115 of 253
116 of 253
117 of 253
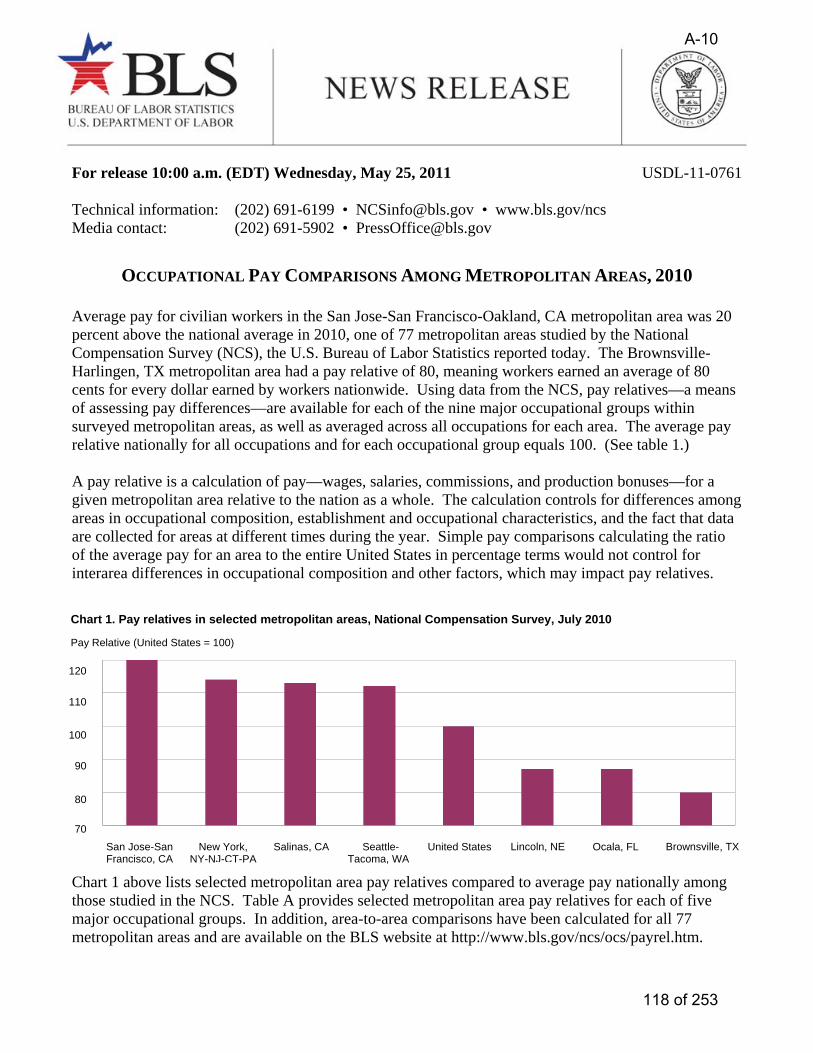
For release 10:00 a.m. (EDT) Wednesday, May 25, 2011 USDL-11-0761 Technical information: (202) 691-6199 • [email protected] • www.bls.gov/ncs Media contact: (202) 691-5902 • [email protected]
OCCUPATIONAL PAY COMPARISONS AMONG METROPOLITAN AREAS, 2010
Average pay for civilian workers in the San Jose-San Francisco-Oakland, CA metropolitan area was 20 percent above the national average in 2010, one of 77 metropolitan areas studied by the National Compensation Survey (NCS), the U.S. Bureau of Labor Statistics reported today. The Brownsville-Harlingen, TX metropolitan area had a pay relative of 80, meaning workers earned an average of 80 cents for every dollar earned by workers nationwide. Using data from the NCS, pay relatives—a means of assessing pay differences—are available for each of the nine major occupational groups within surveyed metropolitan areas, as well as averaged across all occupations for each area. The average pay relative nationally for all occupations and for each occupational group equals 100. (See table 1.) A pay relative is a calculation of pay—wages, salaries, commissions, and production bonuses—for a given metropolitan area relative to the nation as a whole. The calculation controls for differences among areas in occupational composition, establishment and occupational characteristics, and the fact that data are collected for areas at different times during the year. Simple pay comparisons calculating the ratio of the average pay for an area to the entire United States in percentage terms would not control for interarea differences in occupational composition and other factors, which may impact pay relatives.
Chart 1 above lists selected metropolitan area pay relatives compared to average pay nationally among those studied in the NCS. Table A provides selected metropolitan area pay relatives for each of five major occupational groups. In addition, area-to-area comparisons have been calculated for all 77 metropolitan areas and are available on the BLS website at http://www.bls.gov/ncs/ocs/payrel.htm.
Pay Relative (United States = 100)
Chart 1. Pay relatives in selected metropolitan areas, National Compensation Survey, July 2010
120
110
100
80
70
San Jose-San Francisco, CA
New York, NY-NJ-CT-PA
Salinas, CA Seattle-Tacoma, WA
United States Lincoln, NE Ocala, FL Brownsville, TX
90
A-10
118 of 253
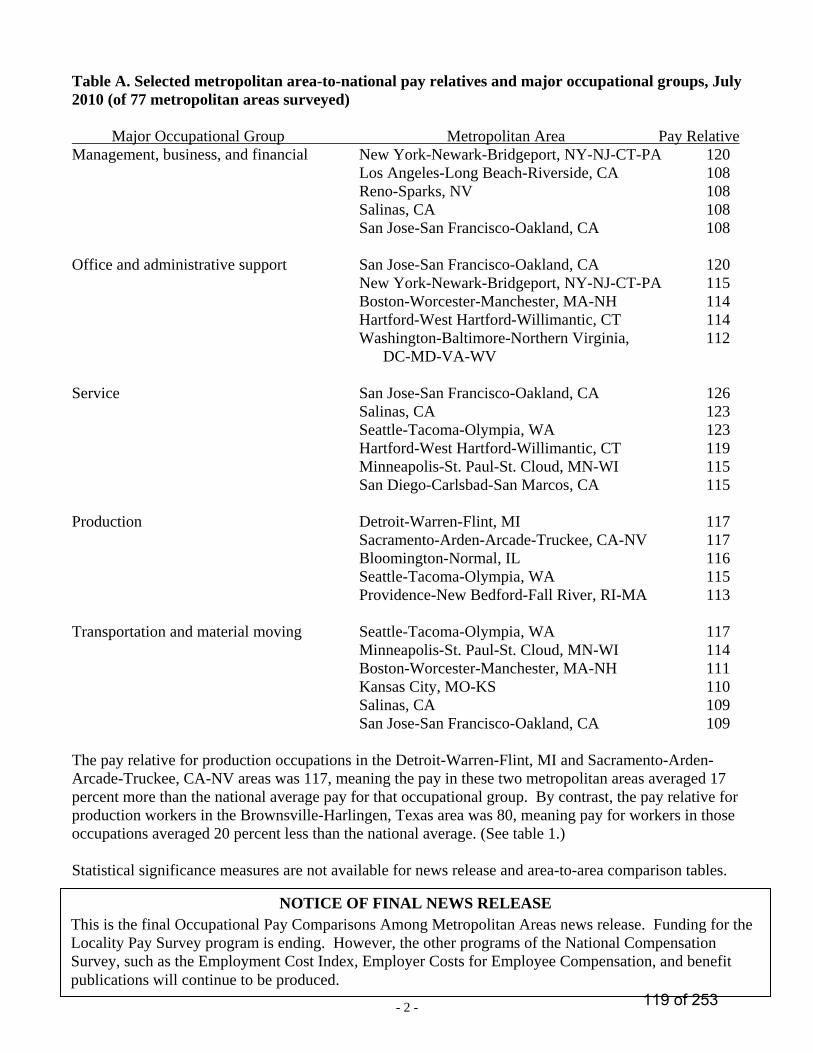
- 2 -
Table A. Selected metropolitan area-to-national pay relatives and major occupational groups, July 2010 (of 77 metropolitan areas surveyed) Major Occupational Group Metropolitan Area Pay Relative Management, business, and financial New York-Newark-Bridgeport, NY-NJ-CT-PA 120 Los Angeles-Long Beach-Riverside, CA 108 Reno-Sparks, NV 108 Salinas, CA 108 San Jose-San Francisco-Oakland, CA 108 Office and administrative support San Jose-San Francisco-Oakland, CA 120 New York-Newark-Bridgeport, NY-NJ-CT-PA 115 Boston-Worcester-Manchester, MA-NH 114 Hartford-West Hartford-Willimantic, CT 114 Washington-Baltimore-Northern Virginia, 112 DC-MD-VA-WV Service San Jose-San Francisco-Oakland, CA 126
Salinas, CA 123 Seattle-Tacoma-Olympia, WA 123
Hartford-West Hartford-Willimantic, CT 119 Minneapolis-St. Paul-St. Cloud, MN-WI 115 San Diego-Carlsbad-San Marcos, CA 115
Production Detroit-Warren-Flint, MI 117
Sacramento-Arden-Arcade-Truckee, CA-NV 117 Bloomington-Normal, IL 116 Seattle-Tacoma-Olympia, WA 115 Providence-New Bedford-Fall River, RI-MA 113
Transportation and material moving Seattle-Tacoma-Olympia, WA 117
Minneapolis-St. Paul-St. Cloud, MN-WI 114 Boston-Worcester-Manchester, MA-NH 111 Kansas City, MO-KS 110 Salinas, CA 109 San Jose-San Francisco-Oakland, CA 109
The pay relative for production occupations in the Detroit-Warren-Flint, MI and Sacramento-Arden-Arcade-Truckee, CA-NV areas was 117, meaning the pay in these two metropolitan areas averaged 17 percent more than the national average pay for that occupational group. By contrast, the pay relative for production workers in the Brownsville-Harlingen, Texas area was 80, meaning pay for workers in those occupations averaged 20 percent less than the national average. (See table 1.)
Statistical significance measures are not available for news release and area-to-area comparison tables.
TECHNICAL NOTE
NOTICE OF FINAL NEWS RELEASE
This is the final Occupational Pay Comparisons Among Metropolitan Areas news release. Funding for the Locality Pay Survey program is ending. However, the other programs of the National Compensation Survey, such as the Employment Cost Index, Employer Costs for Employee Compensation, and benefit publications will continue to be produced.
119 of 253
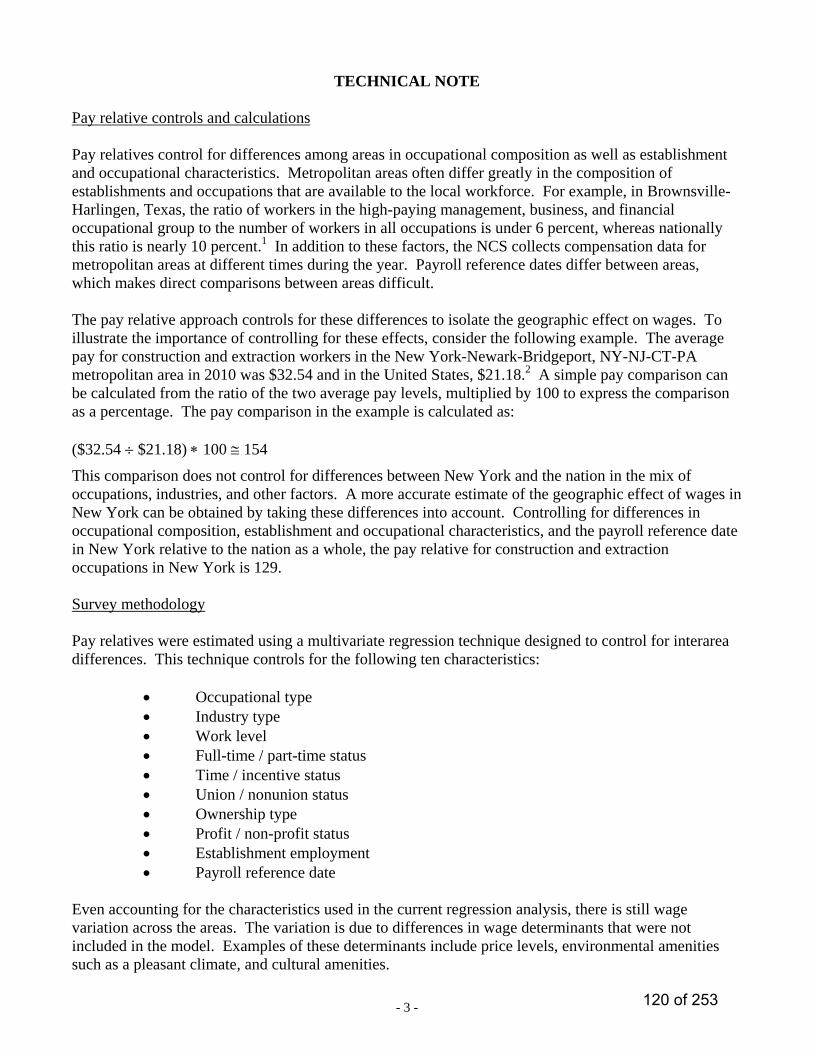
- 3 -
TECHNICAL NOTE
Pay relative controls and calculations Pay relatives control for differences among areas in occupational composition as well as establishment and occupational characteristics. Metropolitan areas often differ greatly in the composition of establishments and occupations that are available to the local workforce. For example, in Brownsville-Harlingen, Texas, the ratio of workers in the high-paying management, business, and financial occupational group to the number of workers in all occupations is under 6 percent, whereas nationally this ratio is nearly 10 percent.1 In addition to these factors, the NCS collects compensation data for metropolitan areas at different times during the year. Payroll reference dates differ between areas, which makes direct comparisons between areas difficult.
The pay relative approach controls for these differences to isolate the geographic effect on wages. To illustrate the importance of controlling for these effects, consider the following example. The average pay for construction and extraction workers in the New York-Newark-Bridgeport, NY-NJ-CT-PA metropolitan area in 2010 was $32.54 and in the United States, $21.18.2 A simple pay comparison can be calculated from the ratio of the two average pay levels, multiplied by 100 to express the comparison as a percentage. The pay comparison in the example is calculated as: ($32.54 $21.18) 100 154
This comparison does not control for differences between New York and the nation in the mix of occupations, industries, and other factors. A more accurate estimate of the geographic effect of wages in New York can be obtained by taking these differences into account. Controlling for differences in occupational composition, establishment and occupational characteristics, and the payroll reference date in New York relative to the nation as a whole, the pay relative for construction and extraction occupations in New York is 129.
Survey methodology Pay relatives were estimated using a multivariate regression technique designed to control for interarea differences. This technique controls for the following ten characteristics:
Occupational type Industry type Work level Full-time / part-time status Time / incentive status Union / nonunion status Ownership type Profit / non-profit status Establishment employment Payroll reference date
Even accounting for the characteristics used in the current regression analysis, there is still wage variation across the areas. The variation is due to differences in wage determinants that were not included in the model. Examples of these determinants include price levels, environmental amenities such as a pleasant climate, and cultural amenities.
120 of 253

- 4 -
Historical pay relatives data are available for the survey years 1992-1996, 1998, 2002, 2004-2009. There are several differences between the recent pay relatives and the pay relatives for earlier years, including different industry and occupation classification systems, varying methodology, and different survey designs. These differences limit comparability. The pay relatives since 2004 have been calculated using the same industry and occupation classification systems, methodology, and survey design. Nonetheless, comparisons between the estimates for these years should be made only with caution. For more details on survey design, methodology, classification systems, recent changes in the survey, and appropriate uses and limitations of the data, see BLS Handbook of Methods, Chapter 8, “National Compensation Measures,” available on the Internet at http://www.bls.gov/opub/hom/homch8_a.htm, especially the major section “Area-to-Nation and Area-to-Area Pay Comparisons.” Obtaining information Articles, bulletins, and other information from the National Compensation Survey may be obtained by calling (202) 691-6199, sending email to [email protected], or visiting the Internet site http://www.bls.gov/ncs. Information in this release will be made available to sensory impaired individuals upon request. Voice phone: (202) 691-5200; Federal Relay Service Number: 1-800-877-8339. 1Data for this example are based on the May 2010 Metropolitan and Nonmetropolitan Area Occupational Employment and Wage Estimates, on the Internet at http://www.bls.gov/oes/current/oessrcma.htm. 2 Average pay for construction and extraction workers in New York and for the United States are based on wage estimates published in New York-Newark-Bridgeport, NY-NJ-CT-PA National Compensation Survey, May 2010 and National Compensation Survey: Occupational Earnings in the United States, 2010, on the Internet at http://www.bls.gov/ncs/ocs/compub.htm.
121 of 253
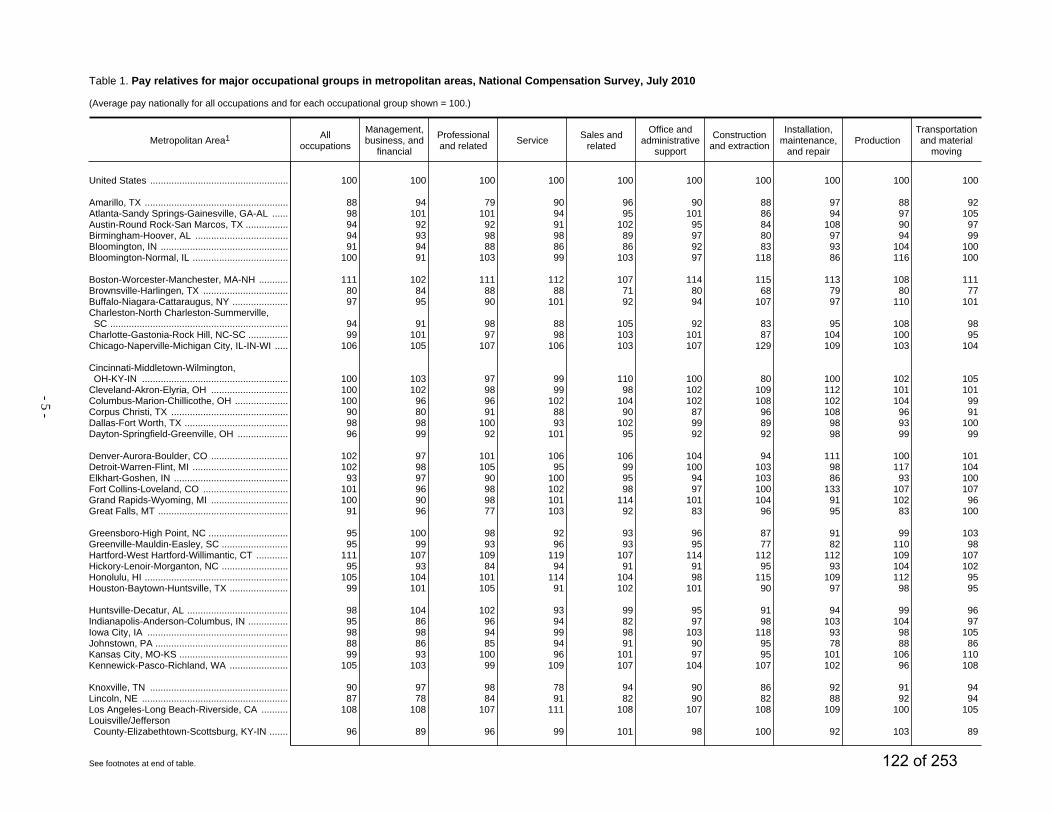
- 5 -
Table 1. Pay relatives for major occupational groups in metropolitan areas, National Compensation Survey, July 2010
(Average pay nationally for all occupations and for each occupational group shown = 100.)
Metropolitan Area1 Alloccupations
Management,business, and
financial
Professionaland related Service Sales and
related
Office andadministrative
support
Constructionand extraction
Installation,maintenance,
and repairProduction
Transportationand material
moving
United States .................................................... 100 100 100 100 100 100 100 100 100 100
Amarillo, TX ...................................................... 88 94 79 90 96 90 88 97 88 92Atlanta-Sandy Springs-Gainesville, GA-AL ...... 98 101 101 94 95 101 86 94 97 105Austin-Round Rock-San Marcos, TX ................ 94 92 92 91 102 95 84 108 90 97Birmingham-Hoover, AL ................................... 94 93 98 98 89 97 80 97 94 99Bloomington, IN ................................................ 91 94 88 86 86 92 83 93 104 100Bloomington-Normal, IL .................................... 100 91 103 99 103 97 118 86 116 100
Boston-Worcester-Manchester, MA-NH ........... 111 102 111 112 107 114 115 113 108 111Brownsville-Harlingen, TX ................................ 80 84 88 88 71 80 68 79 80 77Buffalo-Niagara-Cattaraugus, NY ..................... 97 95 90 101 92 94 107 97 110 101Charleston-North Charleston-Summerville,SC ................................................................... 94 91 98 88 105 92 83 95 108 98
Charlotte-Gastonia-Rock Hill, NC-SC ............... 99 101 97 98 103 101 87 104 100 95Chicago-Naperville-Michigan City, IL-IN-WI ..... 106 105 107 106 103 107 129 109 103 104
Cincinnati-Middletown-Wilmington,OH-KY-IN ....................................................... 100 103 97 99 110 100 80 100 102 105
Cleveland-Akron-Elyria, OH ............................. 100 102 98 99 98 102 109 112 101 101Columbus-Marion-Chillicothe, OH .................... 100 96 96 102 104 102 108 102 104 99Corpus Christi, TX ............................................ 90 80 91 88 90 87 96 108 96 91Dallas-Fort Worth, TX ....................................... 98 98 100 93 102 99 89 98 93 100Dayton-Springfield-Greenville, OH ................... 96 99 92 101 95 92 92 98 99 99
Denver-Aurora-Boulder, CO ............................. 102 97 101 106 106 104 94 111 100 101Detroit-Warren-Flint, MI .................................... 102 98 105 95 99 100 103 98 117 104Elkhart-Goshen, IN ........................................... 93 97 90 100 95 94 103 86 93 100Fort Collins-Loveland, CO ................................ 101 96 98 102 98 97 100 133 107 107Grand Rapids-Wyoming, MI ............................. 100 90 98 101 114 101 104 91 102 96Great Falls, MT ................................................. 91 96 77 103 92 83 96 95 83 100
Greensboro-High Point, NC .............................. 95 100 98 92 93 96 87 91 99 103Greenville-Mauldin-Easley, SC ......................... 95 99 93 96 93 95 77 82 110 98Hartford-West Hartford-Willimantic, CT ............ 111 107 109 119 107 114 112 112 109 107Hickory-Lenoir-Morganton, NC ......................... 95 93 84 94 91 91 95 93 104 102Honolulu, HI ...................................................... 105 104 101 114 104 98 115 109 112 95Houston-Baytown-Huntsville, TX ...................... 99 101 105 91 102 101 90 97 98 95
Huntsville-Decatur, AL ...................................... 98 104 102 93 99 95 91 94 99 96Indianapolis-Anderson-Columbus, IN ............... 95 86 96 94 82 97 98 103 104 97Iowa City, IA ..................................................... 98 98 94 99 98 103 118 93 98 105Johnstown, PA .................................................. 88 86 85 94 91 90 95 78 88 86Kansas City, MO-KS ......................................... 99 93 100 96 101 97 95 101 106 110Kennewick-Pasco-Richland, WA ...................... 105 103 99 109 107 104 107 102 96 108
Knoxville, TN .................................................... 90 97 98 78 94 90 86 92 91 94Lincoln, NE ....................................................... 87 78 84 91 82 90 82 88 92 94Los Angeles-Long Beach-Riverside, CA .......... 108 108 107 111 108 107 108 109 100 105Louisville/JeffersonCounty-Elizabethtown-Scottsburg, KY-IN ....... 96 89 96 99 101 98 100 92 103 89
See footnotes at end of table. 122 of 253
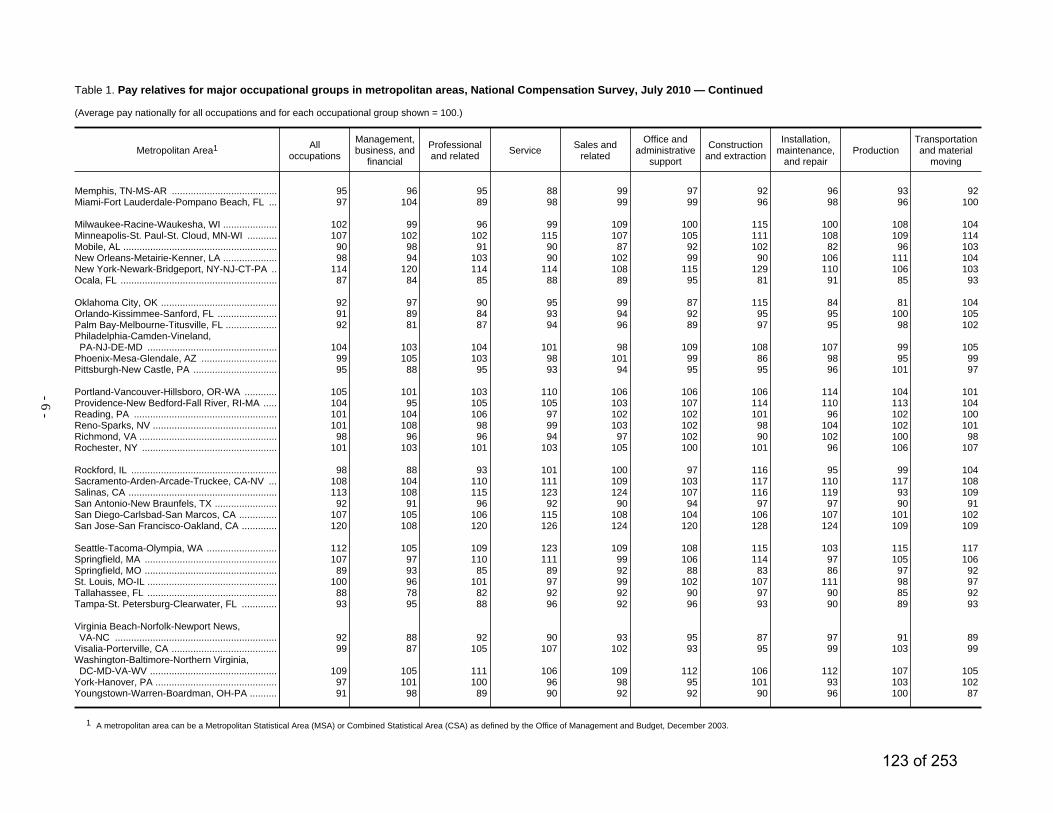
- 6 -
Table 1. Pay relatives for major occupational groups in metropolitan areas, National Compensation Survey, July 2010 — Continued
(Average pay nationally for all occupations and for each occupational group shown = 100.)
Metropolitan Area1 Alloccupations
Management,business, and
financial
Professionaland related Service Sales and
related
Office andadministrative
support
Constructionand extraction
Installation,maintenance,
and repairProduction
Transportationand material
moving
Memphis, TN-MS-AR ....................................... 95 96 95 88 99 97 92 96 93 92Miami-Fort Lauderdale-Pompano Beach, FL ... 97 104 89 98 99 99 96 98 96 100
Milwaukee-Racine-Waukesha, WI .................... 102 99 96 99 109 100 115 100 108 104Minneapolis-St. Paul-St. Cloud, MN-WI ........... 107 102 102 115 107 105 111 108 109 114Mobile, AL ......................................................... 90 98 91 90 87 92 102 82 96 103New Orleans-Metairie-Kenner, LA .................... 98 94 103 90 102 99 90 106 111 104New York-Newark-Bridgeport, NY-NJ-CT-PA .. 114 120 114 114 108 115 129 110 106 103Ocala, FL .......................................................... 87 84 85 88 89 95 81 91 85 93
Oklahoma City, OK ........................................... 92 97 90 95 99 87 115 84 81 104Orlando-Kissimmee-Sanford, FL ...................... 91 89 84 93 94 92 95 95 100 105Palm Bay-Melbourne-Titusville, FL ................... 92 81 87 94 96 89 97 95 98 102Philadelphia-Camden-Vineland,PA-NJ-DE-MD ................................................ 104 103 104 101 98 109 108 107 99 105
Phoenix-Mesa-Glendale, AZ ............................ 99 105 103 98 101 99 86 98 95 99Pittsburgh-New Castle, PA ............................... 95 88 95 93 94 95 95 96 101 97
Portland-Vancouver-Hillsboro, OR-WA ............ 105 101 103 110 106 106 106 114 104 101Providence-New Bedford-Fall River, RI-MA ..... 104 95 105 105 103 107 114 110 113 104Reading, PA ..................................................... 101 104 106 97 102 102 101 96 102 100Reno-Sparks, NV .............................................. 101 108 98 99 103 102 98 104 102 101Richmond, VA ................................................... 98 96 96 94 97 102 90 102 100 98Rochester, NY .................................................. 101 103 101 103 105 100 101 96 106 107
Rockford, IL ...................................................... 98 88 93 101 100 97 116 95 99 104Sacramento-Arden-Arcade-Truckee, CA-NV ... 108 104 110 111 109 103 117 110 117 108Salinas, CA ....................................................... 113 108 115 123 124 107 116 119 93 109San Antonio-New Braunfels, TX ....................... 92 91 96 92 90 94 97 97 90 91San Diego-Carlsbad-San Marcos, CA .............. 107 105 106 115 108 104 106 107 101 102San Jose-San Francisco-Oakland, CA ............. 120 108 120 126 124 120 128 124 109 109
Seattle-Tacoma-Olympia, WA .......................... 112 105 109 123 109 108 115 103 115 117Springfield, MA ................................................. 107 97 110 111 99 106 114 97 105 106Springfield, MO ................................................. 89 93 85 89 92 88 83 86 97 92St. Louis, MO-IL ................................................ 100 96 101 97 99 102 107 111 98 97Tallahassee, FL ................................................ 88 78 82 92 92 90 97 90 85 92Tampa-St. Petersburg-Clearwater, FL ............. 93 95 88 96 92 96 93 90 89 93
Virginia Beach-Norfolk-Newport News,VA-NC ............................................................ 92 88 92 90 93 95 87 97 91 89
Visalia-Porterville, CA ....................................... 99 87 105 107 102 93 95 99 103 99Washington-Baltimore-Northern Virginia,DC-MD-VA-WV ............................................... 109 105 111 106 109 112 106 112 107 105
York-Hanover, PA ............................................. 97 101 100 96 98 95 101 93 103 102Youngstown-Warren-Boardman, OH-PA .......... 91 98 89 90 92 92 90 96 100 87
1 A metropolitan area can be a Metropolitan Statistical Area (MSA) or Combined Statistical Area (CSA) as defined by the Office of Management and Budget, December 2003.
123 of 253
A-11
124 of 253
125 of 253
NEIL ABERCROMBIE GOVERNOR
SHAN TSUTSUI LT. GOVERNOR
COUNCIL ON REVENUES
STATE OF HAWAII P.O. BOX 259
HONOLULU, HAWAII 96809-0259
RICHARD F. KAHLE, JR. CHAIR
JACK P. SUYDERHOUD VICE-CHAIR
MEMBERS: Avery K. Aoki Carl S. Bonham
Christopher Grandy Kristi L. Maynard Marilyn M. Niwao
January 7, 2013 The Honorable Neil Abercrombie Governor, State of Hawaii Executive Chambers State Capitol, Fifth Floor Honolulu, HI 96813 Dear Governor Abercrombie: At its meeting on January 3, 2013, the Council on Revenues increased its forecast for growth in General Fund tax revenues in fiscal year 2013 slightly, from 4.9% to 5.1%. The Council cited a strong visitor industry along with expected expansion in the rest of the economy for the fiscal year 2013 revision. The growth forecast for fiscal year 2014 was increased from 3.9% to 6.8%. The 2014 revision reflected the reduction in the cost of the renewable energy income tax credit that is expected to result from the new Administrative Rules recently issued by the Department of Taxation, and stronger economic growth compared with expectations in the Council’s earlier forecast. Revisions for later years also came partly as a result of a reduction in the estimated future revenue costs of the renewable energy credit. The following are important sources of uncertainty over the future growth path of tax collections. Firstly, the Council is uncertain about the size of future claims for the renewable energy credit. The credit has grown rapidly in recent years. Preliminary data from Department of Taxation indicate that the credit grew from $3.1 million in tax year 2004 to $30.9 million in tax year 2010, and there are indications that the growth in claims for the credit have accelerated in recent years. The Department of Business, Economic Development and Tourism estimated that claims for the credit in tax year 2012 may reach $173.8 million, which would show up mostly in reduced net income tax collections in fiscal year 2013. The Department of Taxation has issued new Administrative Rules that may curb the revenue cost of the credit, but the new rules are not expected to have much influence on tax collections before fiscal year 2014. Secondly, the Council is also still uncertain about the revenue that will be provided by the tax changes made by the Legislature in 2011, particularly the revenue gains that will come from Act 105, Session Laws of Hawaii 2011. An important question is the extent to which the revenue gains from the Act may be changing over time. The Act eliminated certain exemptions from the General Excise Tax (GET), but allowed the
A-12
126 of 253
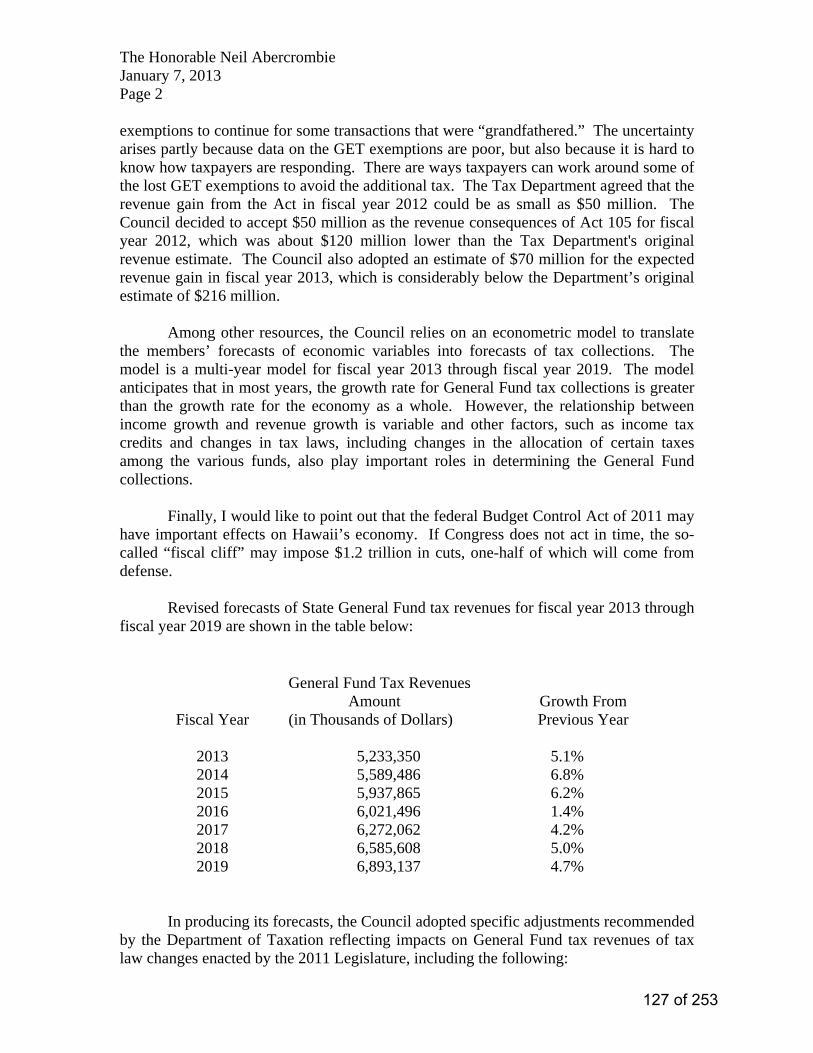
The Honorable Neil Abercrombie January 7, 2013 Page 2 exemptions to continue for some transactions that were “grandfathered.” The uncertainty arises partly because data on the GET exemptions are poor, but also because it is hard to know how taxpayers are responding. There are ways taxpayers can work around some of the lost GET exemptions to avoid the additional tax. The Tax Department agreed that the revenue gain from the Act in fiscal year 2012 could be as small as $50 million. The Council decided to accept $50 million as the revenue consequences of Act 105 for fiscal year 2012, which was about $120 million lower than the Tax Department's original revenue estimate. The Council also adopted an estimate of $70 million for the expected revenue gain in fiscal year 2013, which is considerably below the Department’s original estimate of $216 million. Among other resources, the Council relies on an econometric model to translate the members’ forecasts of economic variables into forecasts of tax collections. The model is a multi-year model for fiscal year 2013 through fiscal year 2019. The model anticipates that in most years, the growth rate for General Fund tax collections is greater than the growth rate for the economy as a whole. However, the relationship between income growth and revenue growth is variable and other factors, such as income tax credits and changes in tax laws, including changes in the allocation of certain taxes among the various funds, also play important roles in determining the General Fund collections. Finally, I would like to point out that the federal Budget Control Act of 2011 may have important effects on Hawaii’s economy. If Congress does not act in time, the so-called “fiscal cliff” may impose $1.2 trillion in cuts, one-half of which will come from defense. Revised forecasts of State General Fund tax revenues for fiscal year 2013 through fiscal year 2019 are shown in the table below:
General Fund Tax Revenues
Fiscal Year Amount (in Thousands of Dollars)
Growth From Previous Year
2013 5,233,350 5.1% 2014 5,589,486 6.8% 2015 5,937,865 6.2% 2016 6,021,496 1.4% 2017 6,272,062 4.2% 2018 6,585,608 5.0% 2019 6,893,137 4.7%
In producing its forecasts, the Council adopted specific adjustments recommended by the Department of Taxation reflecting impacts on General Fund tax revenues of tax law changes enacted by the 2011 Legislature, including the following:
127 of 253
The Honorable Neil Abercrombie January 7, 2013 Page 3
• Act 97 (SB 570 SD2 HD1 CD1). Part II repeals state tax deduction for taxpayers with Federal AGI above $100,000 (for single taxpayers), $200,000 (for joint filers), and $150,000 (for heads of households). Part III caps itemized deductions at $25,000 for a single taxpayer with Federal AGI of $100,000 and above; $50,000 for a joint filer with Federal AGI of $200,000 and above; and $37,500 for a head of household with Federal AGI of $150,000 and above. Parts II and III sunset on January 1, 2016. Part IV delays the 10% increase in the standard deduction and the personal exemption by 2 years and makes them permanent.
• Act 103 (SB 1186 SD2 HD1 CD1) establishes a temporary $10 minimum
daily tax on each transient accommodation furnished at no charge. The act also temporarily limits the TAT revenue distribution to the counties to $93 million per year, and limits the distribution to the Tourism Special Fund to $69 million per year.
• Act 105 (SB 754 SD1 HD1 CD1) suspends certain GET exemptions and
imposes tax at 4 percent on the previously exempt amounts for the period from July 1, 2011 to June 30, 2013.
The Department of Taxation has prepared a report for submission with this transmittal correspondence, detailing line-item forecasts for various components of the General Fund, reconciled to the Council’s forecast growth rate for total General Fund Tax revenues. These line-item component estimates typically include, for example, General Excise Tax and Income Tax revenues that the Council on Revenues does not forecast individually. Also, the Department of Budget and Finance has prepared the attached report to update its projections for non-tax and special tax revenues Significant Changes from September 2012 Report. Please advise us if we can be of further assistance or if we can answer any questions you may have. Sincerely,
RICHARD F. KAHLE, JR. Chair, Council on Revenues Attachments
128 of 253
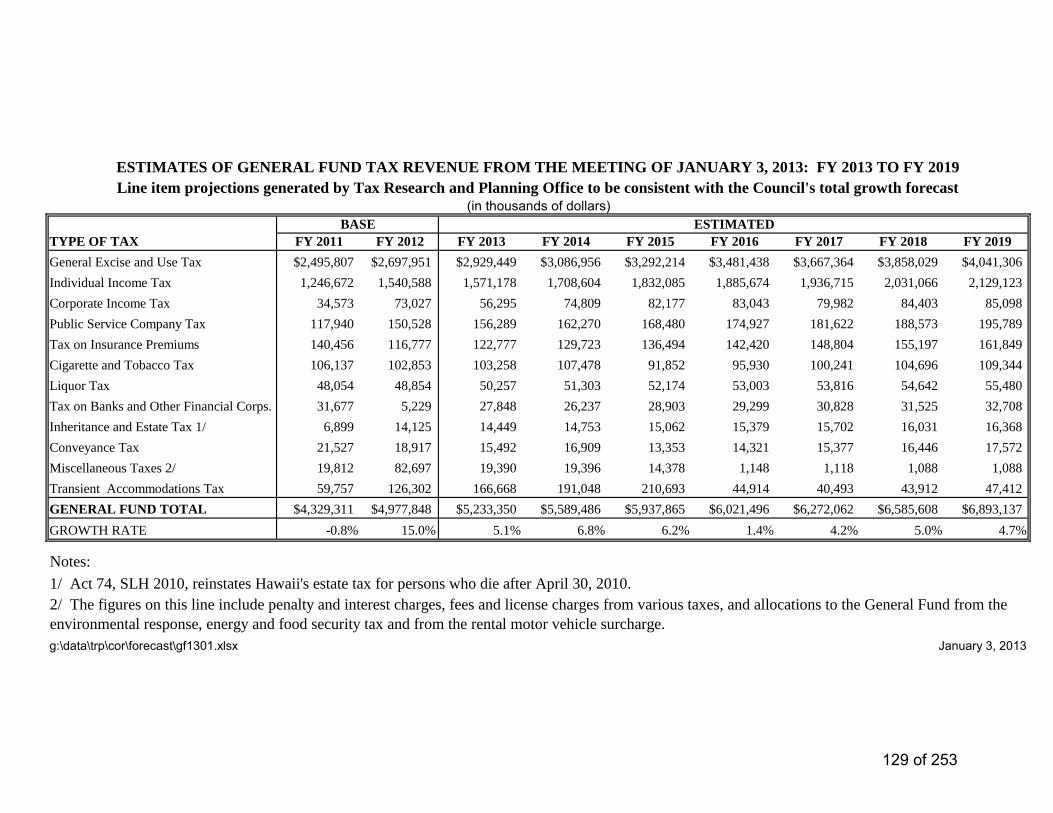
TYPE OF TAX FY 2011 FY 2012 FY 2013 FY 2014 FY 2015 FY 2016 FY 2017 FY 2018 FY 2019
General Excise and Use Tax $2,495,807 $2,697,951 $2,929,449 $3,086,956 $3,292,214 $3,481,438 $3,667,364 $3,858,029 $4,041,306
Individual Income Tax 1,246,672 1,540,588 1,571,178 1,708,604 1,832,085 1,885,674 1,936,715 2,031,066 2,129,123
Corporate Income Tax 34,573 73,027 56,295 74,809 82,177 83,043 79,982 84,403 85,098
Public Service Company Tax 117,940 150,528 156,289 162,270 168,480 174,927 181,622 188,573 195,789
Tax on Insurance Premiums 140,456 116,777 122,777 129,723 136,494 142,420 148,804 155,197 161,849
Cigarette and Tobacco Tax 106,137 102,853 103,258 107,478 91,852 95,930 100,241 104,696 109,344
Liquor Tax 48,054 48,854 50,257 51,303 52,174 53,003 53,816 54,642 55,480
Tax on Banks and Other Financial Corps. 31,677 5,229 27,848 26,237 28,903 29,299 30,828 31,525 32,708
Inheritance and Estate Tax 1/ 6,899 14,125 14,449 14,753 15,062 15,379 15,702 16,031 16,368
Conveyance Tax 21,527 18,917 15,492 16,909 13,353 14,321 15,377 16,446 17,572
Miscellaneous Taxes 2/ 19,812 82,697 19,390 19,396 14,378 1,148 1,118 1,088 1,088
Transient Accommodations Tax 59,757 126,302 166,668 191,048 210,693 44,914 40,493 43,912 47,412
GENERAL FUND TOTAL $4,329,311 $4,977,848 $5,233,350 $5,589,486 $5,937,865 $6,021,496 $6,272,062 $6,585,608 $6,893,137
GROWTH RATE -0.8% 15.0% 5.1% 6.8% 6.2% 1.4% 4.2% 5.0% 4.7%
Notes:
g:\data\trp\cor\forecast\gf1301.xlsx January 3, 2013
2/ The figures on this line include penalty and interest charges, fees and license charges from various taxes, and allocations to the General Fund from the
environmental response, energy and food security tax and from the rental motor vehicle surcharge.
1/ Act 74, SLH 2010, reinstates Hawaii's estate tax for persons who die after April 30, 2010.
ESTIMATES OF GENERAL FUND TAX REVENUE FROM THE MEETING OF JANUARY 3, 2013: FY 2013 TO FY 2019
ESTIMATEDBASE
Line item projections generated by Tax Research and Planning Office to be consistent with the Council's total growth forecast
(in thousands of dollars)
129 of 253
Significant Changes from September 2012 Report General Fund Non-Tax Revenues Federal Grants - increases in FYs 13-19 reflect estimates for the federal interest subsidy on Build America Bonds (Department of Budget and Finance (B&F)) that were not previously reported. Non-Revenue Receipts - increase in FY 13 reflects the premiums on bonds that were sold in November 2012 (B&F). The increases in FYs 16-19 reflect increases in the estimates for the reimbursement of pension accumulation payments from non-general funds (B&F). Special Tax Revenues Liquid Fuel, Aviation - increase in FY 12 reflects unaudited actual revenues collected. FYs 13-19 have been adjusted according to FY 12 actual collections (Department of Transportation (DOT) - Airports Division). Environmental Response Tax - increases in FYs 14-19 reflect an increase in a proposed increase to the barrel tax. The increases reported are for the Energy Security Fund (Department of Business, Economic Development and Tourism (DBEDT)). Conveyance Tax - increases in FYs 13-19 reflect revised revenue projections that were previously not updated. The revised projections are more consistent with actual FY 12 revenue collections that are deposited to the Land Conservation Fund (Department of Land and Natural Resources). Special Fund Non-Tax Revenues Federal Grants - the increase in FY 12 reflects an increase in federal grants for airport construction (DOT-Airports Division). Revenues from Other Agencies - the changes in FYs 13 and 14 reflect revisions to the University of Hawaii’s (UH) Kapolei land sale strategy. Charges for Current Services - the net increases in FYs 12-19 are reflective of increases in HMSA (Hawaii Medical Service Association) reimbursement rates and Medicaid payment rates for the Hawaii Health Systems Corporation. Charges for Current Services, Utilities - the decreases in FYs 12-16 reflect projected decreases in airline terminal rental and landing fees for DOT-Airports Division. Fines - the increase in FY 13 is attributed to the multi-state pharmaceutical settlement (Department of Commerce and Consumer Affairs). 130 of 253

-2-
Other than Special Fund Non-Tax Revenues Federal Grants - the net decrease in FY 12 reflects decreases in federal funds for the Temporary Assistance to Needy Families program (Department of Human Services (DHS)) and lower than projected reimbursements for the Childcare and Development Fund (DHS) and the First to Work Program (DHS). The net increases in FYs 14-16 are due to increases in federal funds for the Hawaii Electric Vehicle Demonstration Project (DBEDT). Charges for Current Services - the net increase in FY 12 is attributed to an increase in rebates received from InformedRx. The net increase in FY 13 is reflective of the return of deposits made on self-funded plans with HMSA, HMA, and InformedRx (B&F). Non-Revenue Receipts - net increases in FYs 12 and 13 are reflective of increases in employer/employee contributions for Other Post Employment Benefit Plans from the County of Kauai, Honolulu Board of Water Supply, Hawaii Department of Water, Kauai Department of Water, and City and County of Honolulu. The net decreases in FYs 14-19 are reflective of recalculated projections in employer/employee contributions into the Employer-Union Health Benefits Trust Fund health benefits plan based on actual contributions made in FY 13. Repayments of Loans and Advances - the net decreases in FY 15 and FY 16 and net increase in FY 17 are attributed to anticipated delays in loan repayments for several projects under development for affordable housing (Hawaii Housing Finance and Development Corporation).
131 of 253

132 of 253

133 of 253
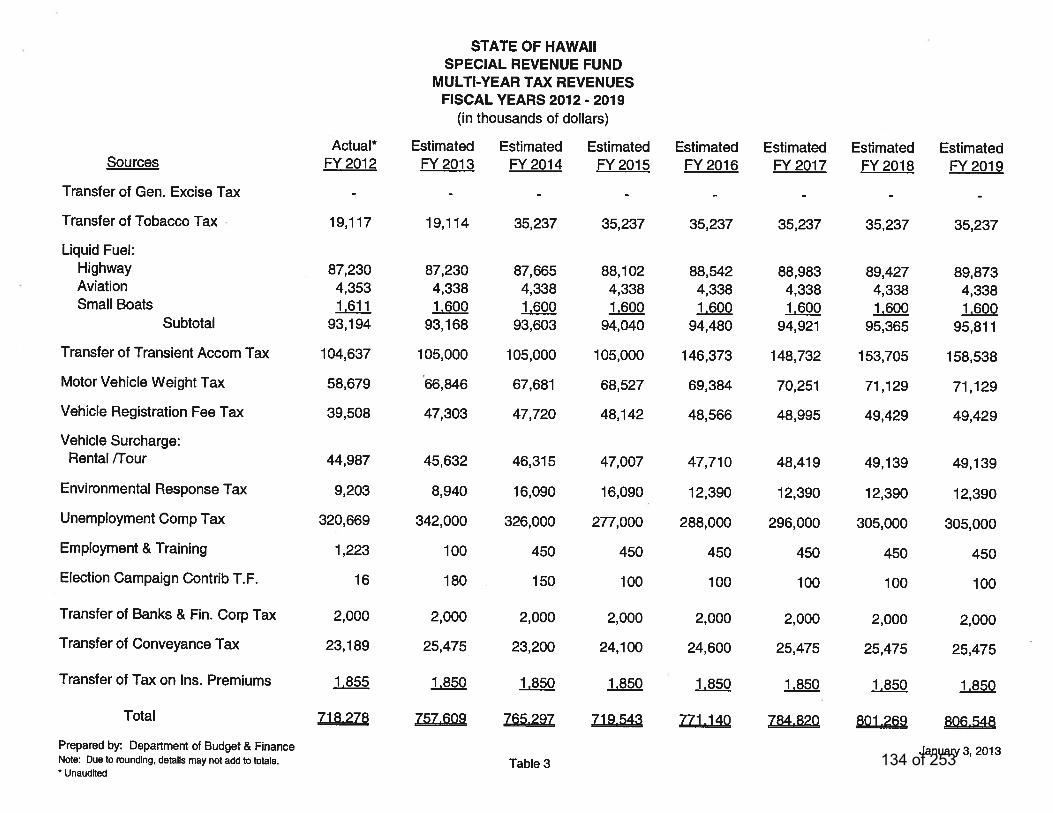
134 of 253
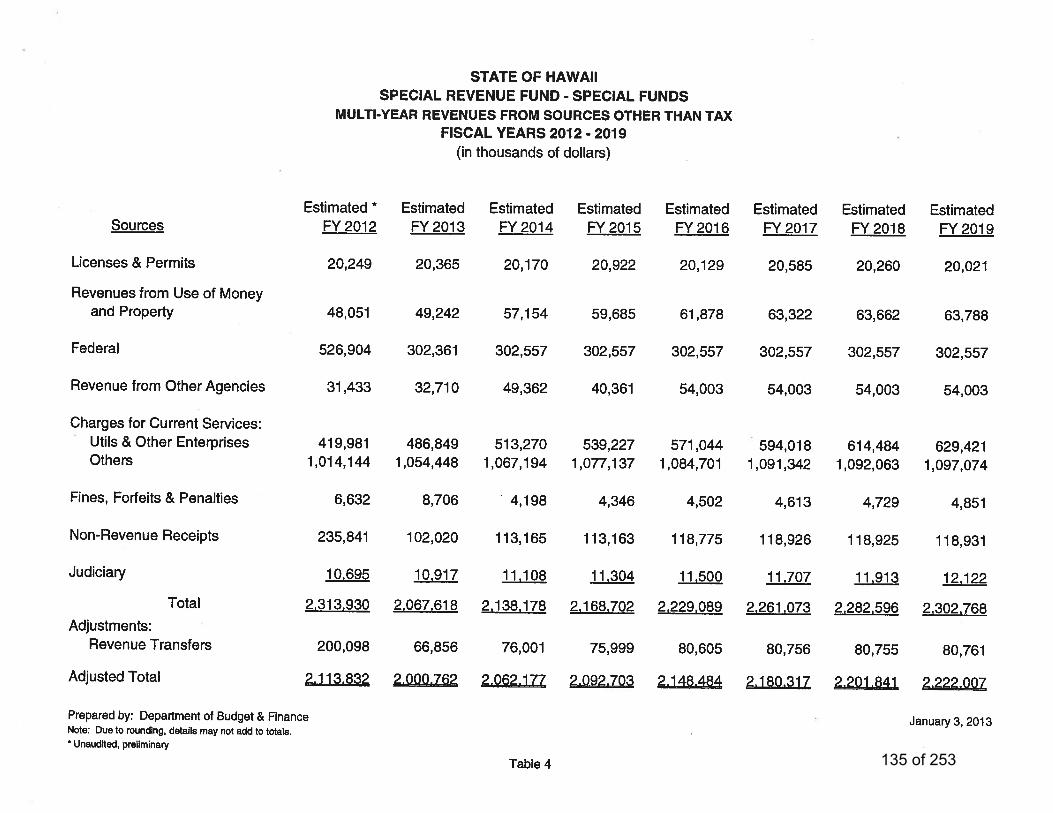
135 of 253
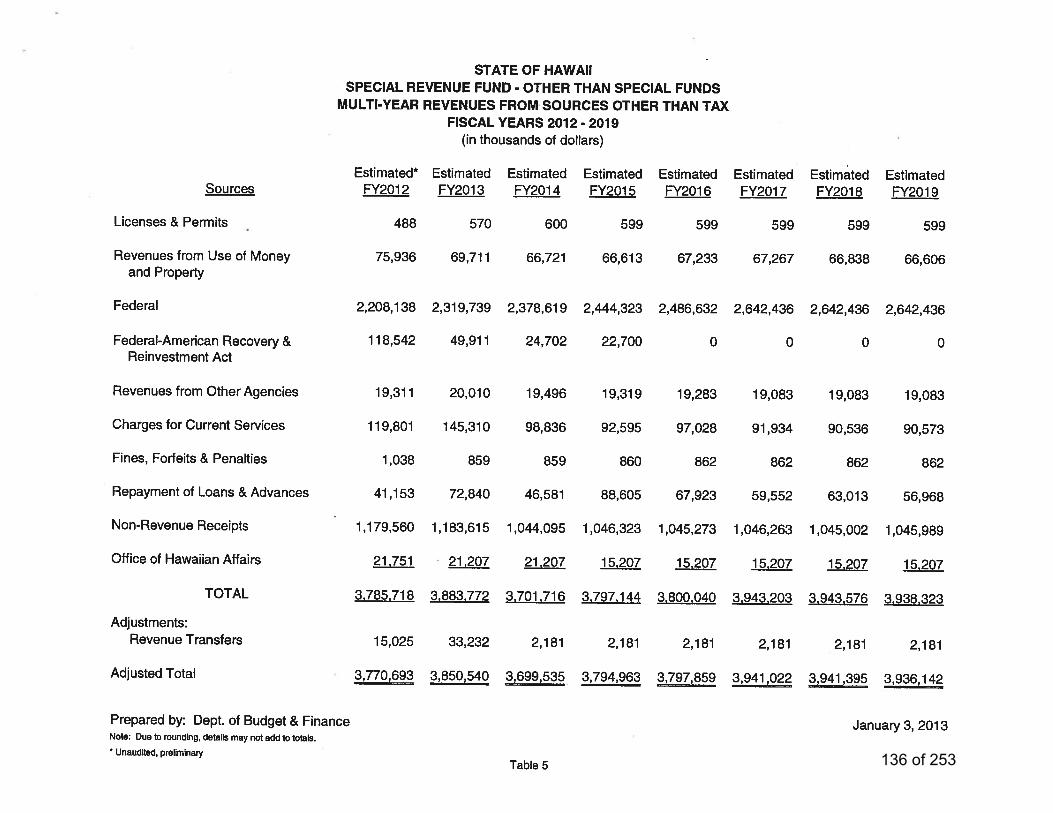
136 of 253
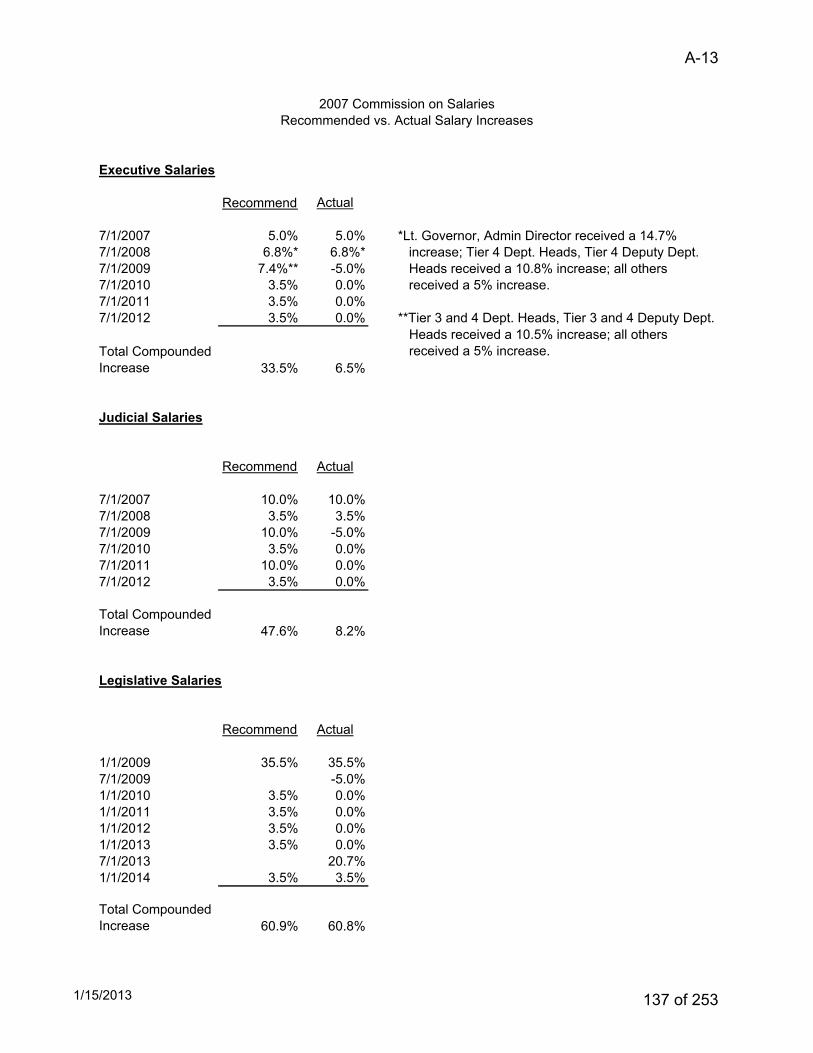
Executive Salaries
Recommend Actual
7/1/2007 5.0% 5.0% *Lt. Governor, Admin Director received a 14.7%
7/1/2008 6.8%* 6.8%* increase; Tier 4 Dept. Heads, Tier 4 Deputy Dept.
7/1/2009 7.4%** -5.0% Heads received a 10.8% increase; all others
7/1/2010 3.5% 0.0% received a 5% increase.
7/1/2011 3.5% 0.0%
7/1/2012 3.5% 0.0% **Tier 3 and 4 Dept. Heads, Tier 3 and 4 Deputy Dept.
Total Compounded
Increase 33.5% 6.5%
Judicial Salaries
Recommend Actual
7/1/2007 10.0% 10.0%
7/1/2008 3.5% 3.5%
7/1/2009 10.0% -5.0%
7/1/2010 3.5% 0.0%
7/1/2011 10.0% 0.0%
7/1/2012 3.5% 0.0%
Total Compounded
Increase 47.6% 8.2%
Legislative Salaries
Recommend Actual
1/1/2009 35.5% 35.5%
7/1/2009 -5.0%
1/1/2010 3.5% 0.0%
1/1/2011 3.5% 0.0%
1/1/2012 3.5% 0.0%
1/1/2013 3.5% 0.0%
7/1/2013 20.7%
1/1/2014 3.5% 3.5%
Total Compounded
Increase 60.9% 60.8%
Heads received a 10.5% increase; all others
received a 5% increase.
2007 Commission on Salaries
Recommended vs. Actual Salary Increases
1/15/2013
A-13
137 of 253
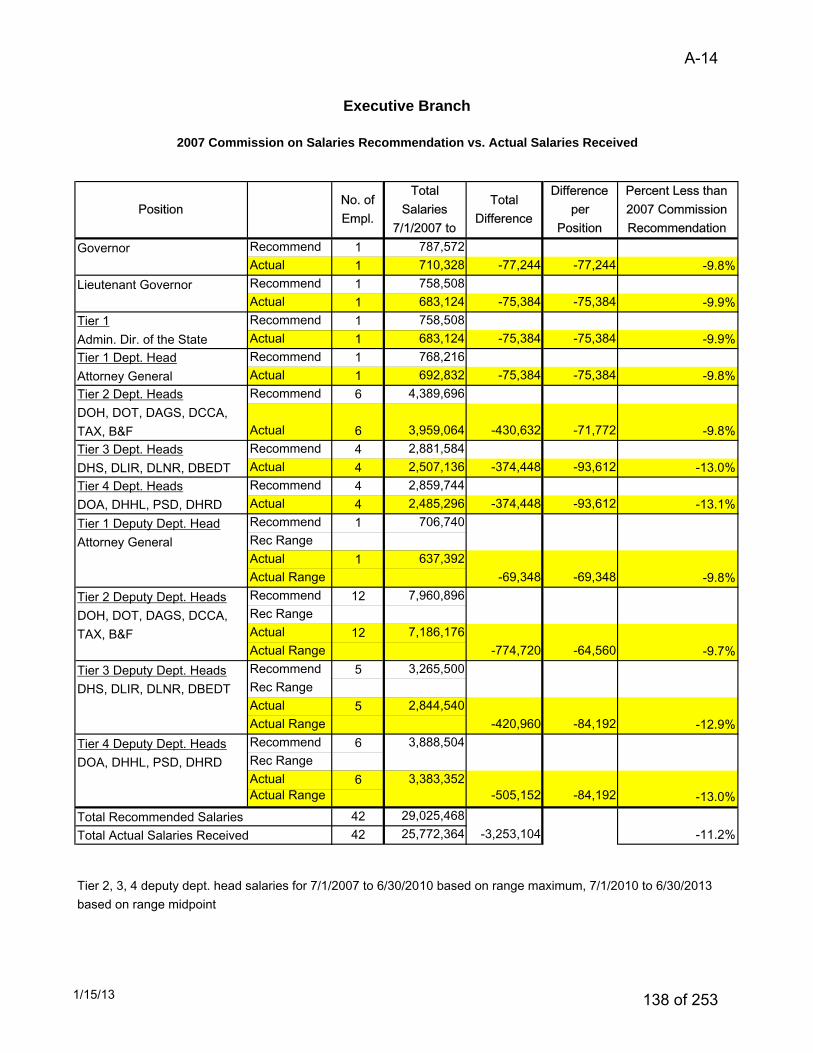
Governor Recommend 1 787,572Actual 1 710,328 -77,244 -77,244 -9.8%
Lieutenant Governor Recommend 1 758,508Actual 1 683,124 -75,384 -75,384 -9.9%Recommend 1 758,508Actual 1 683,124 -75,384 -75,384 -9.9%Recommend 1 768,216Actual 1 692,832 -75,384 -75,384 -9.8%Recommend 6 4,389,696
Actual 6 3,959,064 -430,632 -71,772 -9.8%Recommend 4 2,881,584Actual 4 2,507,136 -374,448 -93,612 -13.0%Recommend 4 2,859,744Actual 4 2,485,296 -374,448 -93,612 -13.1%Recommend 1 706,740Rec RangeActual 1 637,392Actual Range -69,348 -69,348 -9.8%Recommend 12 7,960,896Rec RangeActual 12 7,186,176Actual Range -774,720 -64,560 -9.7%Recommend 5 3,265,500Rec RangeActual 5 2,844,540Actual Range -420,960 -84,192 -12.9%Recommend 6 3,888,504Rec RangeActual 6 3,383,352Actual Range -505,152 -84,192 -13.0%
Total Recommended Salaries 42 29,025,468Total Actual Salaries Received 42 25,772,364 -3,253,104 -11.2%
Tier 4 Deputy Dept. HeadsDOA, DHHL, PSD, DHRD
Tier 2 Deputy Dept. HeadsDOH, DOT, DAGS, DCCA, TAX, B&F
Tier 3 Deputy Dept. HeadsDHS, DLIR, DLNR, DBEDT
Percent Less than 2007 Commission Recommendation
Total Difference
Total Salaries
7/1/2007 to
Tier 3 Dept. HeadsDHS, DLIR, DLNR, DBEDTTier 4 Dept. HeadsDOA, DHHL, PSD, DHRDTier 1 Deputy Dept. HeadAttorney General
2007 Commission on Salaries Recommendation vs. Actual Salaries Received
Executive Branch
Tier 2, 3, 4 deputy dept. head salaries for 7/1/2007 to 6/30/2010 based on range maximum, 7/1/2010 to 6/30/2013 based on range midpoint
Difference per
Position
No. of Empl.
Position
Tier 1Admin. Dir. of the StateTier 1 Dept. HeadAttorney GeneralTier 2 Dept. HeadsDOH, DOT, DAGS, DCCA, TAX, B&F
1/15/13
A-14
138 of 253
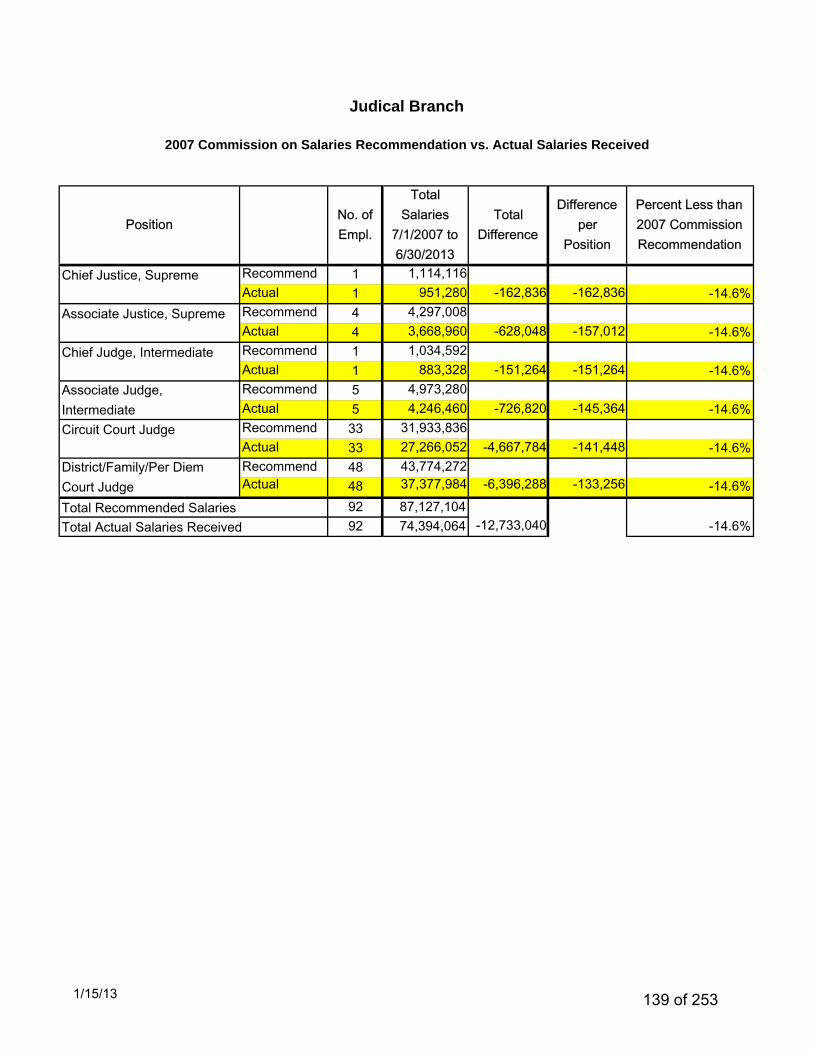
Chief Justice, Supreme Recommend 1 1,114,116Actual 1 951,280 -162,836 -162,836 -14.6%
Associate Justice, Supreme Recommend 4 4,297,008Actual 4 3,668,960 -628,048 -157,012 -14.6%
Chief Judge, Intermediate Recommend 1 1,034,592Actual 1 883,328 -151,264 -151,264 -14.6%Recommend 5 4,973,280Actual 5 4,246,460 -726,820 -145,364 -14.6%
Circuit Court Judge Recommend 33 31,933,836Actual 33 27,266,052 -4,667,784 -141,448 -14.6%Recommend 48 43,774,272Actual 48 37,377,984 -6,396,288 -133,256 -14.6%
Total Recommended Salaries 92 87,127,104Total Actual Salaries Received 92 74,394,064 -12,733,040 -14.6%
District/Family/Per Diem Court Judge
Associate Judge, Intermediate
Difference per
Position
Total Salaries
7/1/2007 to 6/30/2013
Total Difference
2007 Commission on Salaries Recommendation vs. Actual Salaries Received
Judical Branch
No. of Empl.
PositionPercent Less than 2007 Commission Recommendation
1/15/13 139 of 253
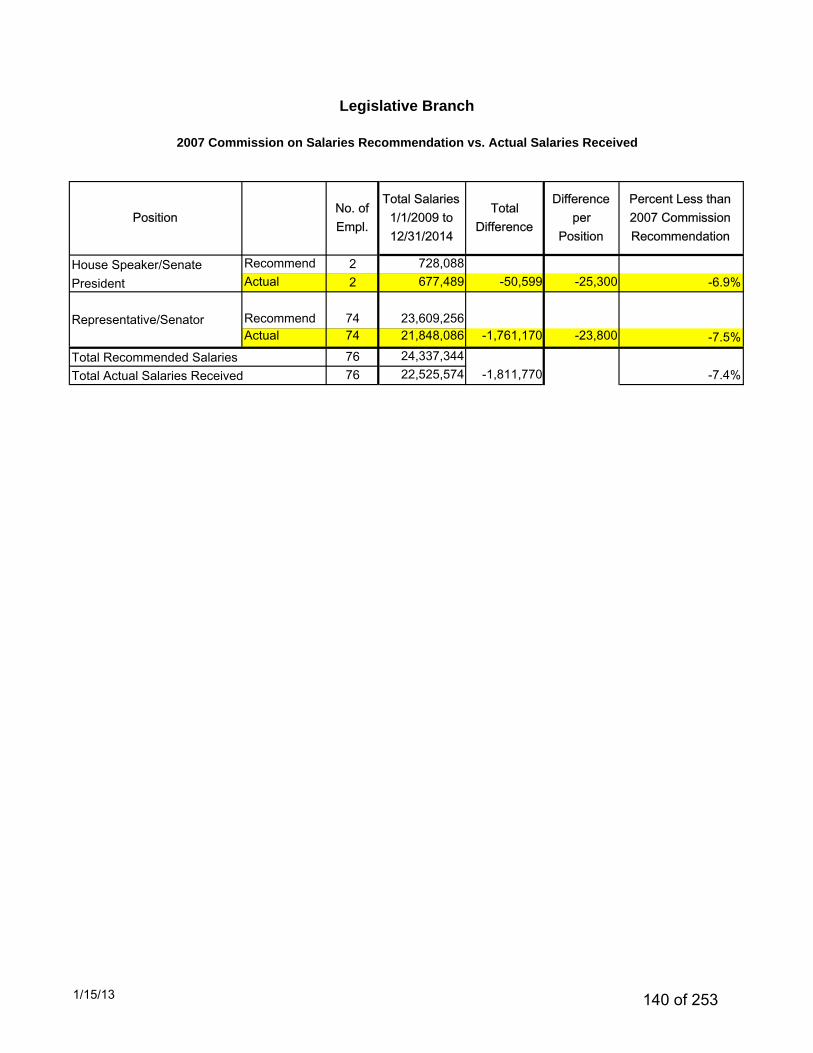
Recommend 2 728,088Actual 2 677,489 -50,599 -25,300 -6.9%
Representative/Senator Recommend 74 23,609,256Actual 74 21,848,086 -1,761,170 -23,800 -7.5%
Total Recommended Salaries 76 24,337,344Total Actual Salaries Received 76 22,525,574 -1,811,770 -7.4%
Percent Less than 2007 Commission Recommendation
Difference per
Position
Total Salaries 1/1/2009 to 12/31/2014
Total Difference
House Speaker/Senate President
2007 Commission on Salaries Recommendation vs. Actual Salaries Received
Legislative Branch
No. of Empl.
Position
1/15/13 140 of 253
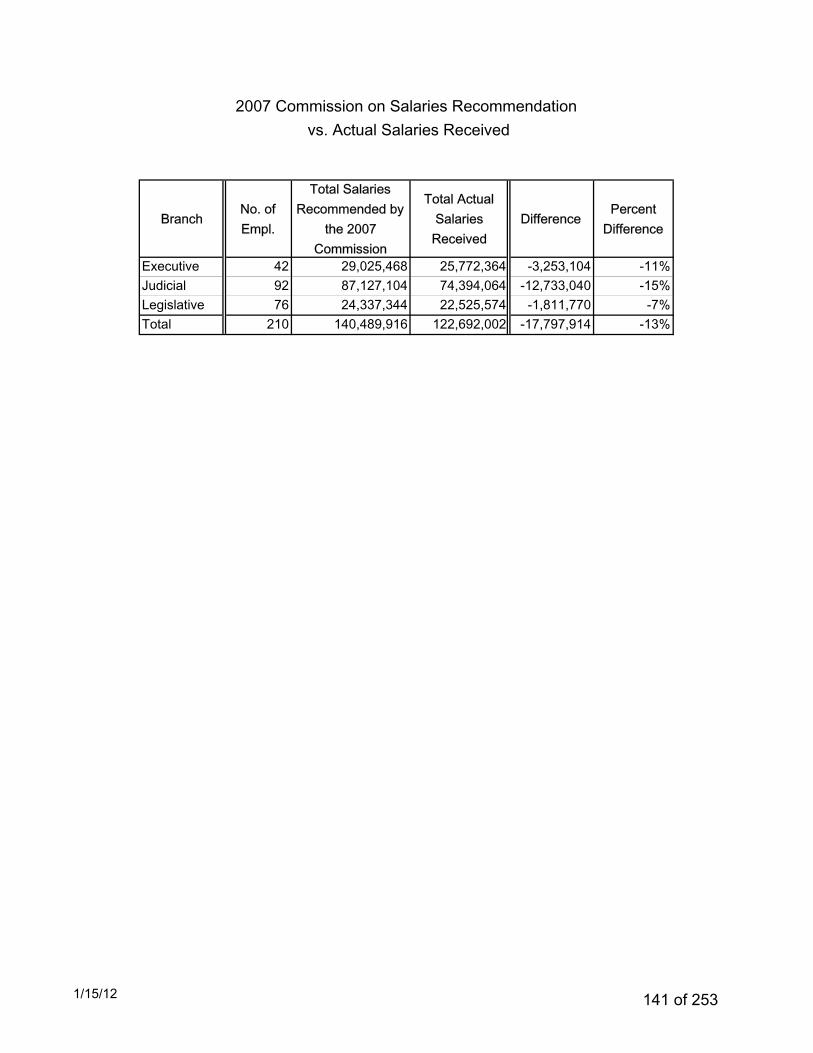
BranchNo. of Empl.
Total Salaries Recommended by
the 2007 Commission
Total Actual Salaries
ReceivedDifference
Percent Difference
Executive 42 29,025,468 25,772,364 -3,253,104 -11%Judicial 92 87,127,104 74,394,064 -12,733,040 -15%Legislative 76 24,337,344 22,525,574 -1,811,770 -7%Total 210 140,489,916 122,692,002 -17,797,914 -13%
2007 Commission on Salaries Recommendation vs. Actual Salaries Received
1/15/12 141 of 253
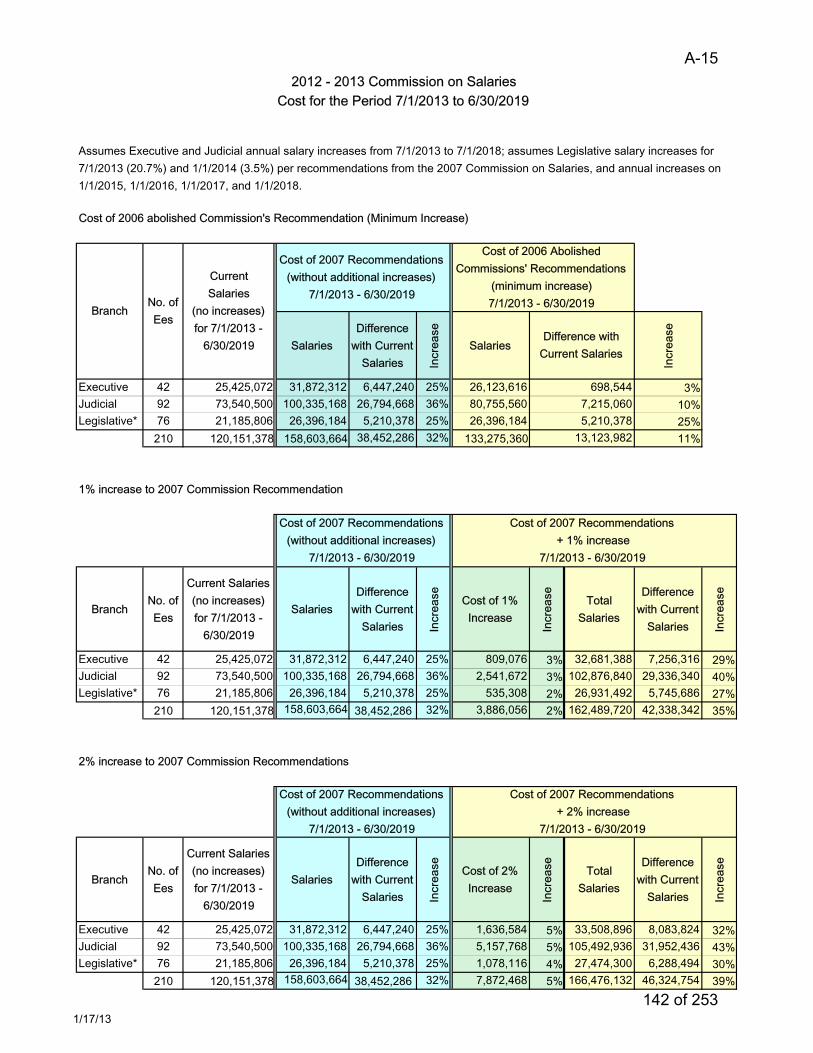
Cost of 2006 abolished Commission's Recommendation (Minimum Increase)
SalariesDifference
with Current Salaries In
crea
se
Salaries
Incr
ease
Executive 42 25,425,072 31,872,312 6,447,240 25% 26,123,616 3%Judicial 92 73,540,500 100,335,168 26,794,668 36% 80,755,560 10%Legislative* 76 21,185,806 26,396,184 5,210,378 25% 26,396,184 25%
210 120,151,378 158,603,664 38,452,286 32% 133,275,360 11%
1% increase to 2007 Commission Recommendation
BranchNo. of Ees
Current Salaries (no increases) for 7/1/2013 -
6/30/2019
SalariesDifference
with Current Salaries In
crea
se Cost of 1% Increase
Incr
ease Total
Salaries
Difference with Current
Salaries Incr
ease
Executive 42 25,425,072 31,872,312 6,447,240 25% 809,076 3% 32,681,388 7,256,316 29%Judicial 92 73,540,500 100,335,168 26,794,668 36% 2,541,672 3% 102,876,840 29,336,340 40%Legislative* 76 21,185,806 26,396,184 5,210,378 25% 535,308 2% 26,931,492 5,745,686 27%
210 120,151,378 158,603,664 38,452,286 32% 3,886,056 2% 162,489,720 42,338,342 35%
2% increase to 2007 Commission Recommendations
BranchNo. of Ees
Current Salaries (no increases) for 7/1/2013 -
6/30/2019
SalariesDifference
with Current Salaries In
crea
se Cost of 2% Increase
Incr
ease Total
Salaries
Difference with Current
Salaries Incr
ease
Executive 42 25,425,072 31,872,312 6,447,240 25% 1,636,584 5% 33,508,896 8,083,824 32%Judicial 92 73,540,500 100,335,168 26,794,668 36% 5,157,768 5% 105,492,936 31,952,436 43%Legislative* 76 21,185,806 26,396,184 5,210,378 25% 1,078,116 4% 27,474,300 6,288,494 30%
210 120,151,378 158,603,664 38,452,286 32% 7,872,468 5% 166,476,132 46,324,754 39%
Cost of 2007 Recommendations + 1% increase
7/1/2013 - 6/30/2019
Cost of 2007 Recommendations (without additional increases)
7/1/2013 - 6/30/2019
Cost of 2006 AbolishedCommissions' Recommendations
(minimum increase)7/1/2013 - 6/30/2019
Cost of 2007 Recommendations (without additional increases)
7/1/2013 - 6/30/2019
698,5447,215,0605,210,378
13,123,982
2012 - 2013 Commission on SalariesCost for the Period 7/1/2013 to 6/30/2019
Assumes Executive and Judicial annual salary increases from 7/1/2013 to 7/1/2018; assumes Legislative salary increases for 7/1/2013 (20.7%) and 1/1/2014 (3.5%) per recommendations from the 2007 Commission on Salaries, and annual increases on 1/1/2015, 1/1/2016, 1/1/2017, and 1/1/2018.
Difference with Current Salaries
CurrentSalaries
(no increases) for 7/1/2013 -
6/30/2019
No. of Ees
Branch
Cost of 2007 Recommendations (without additional increases)
7/1/2013 - 6/30/2019
Cost of 2007 Recommendations + 2% increase
7/1/2013 - 6/30/2019
1/17/13
A-15
142 of 253
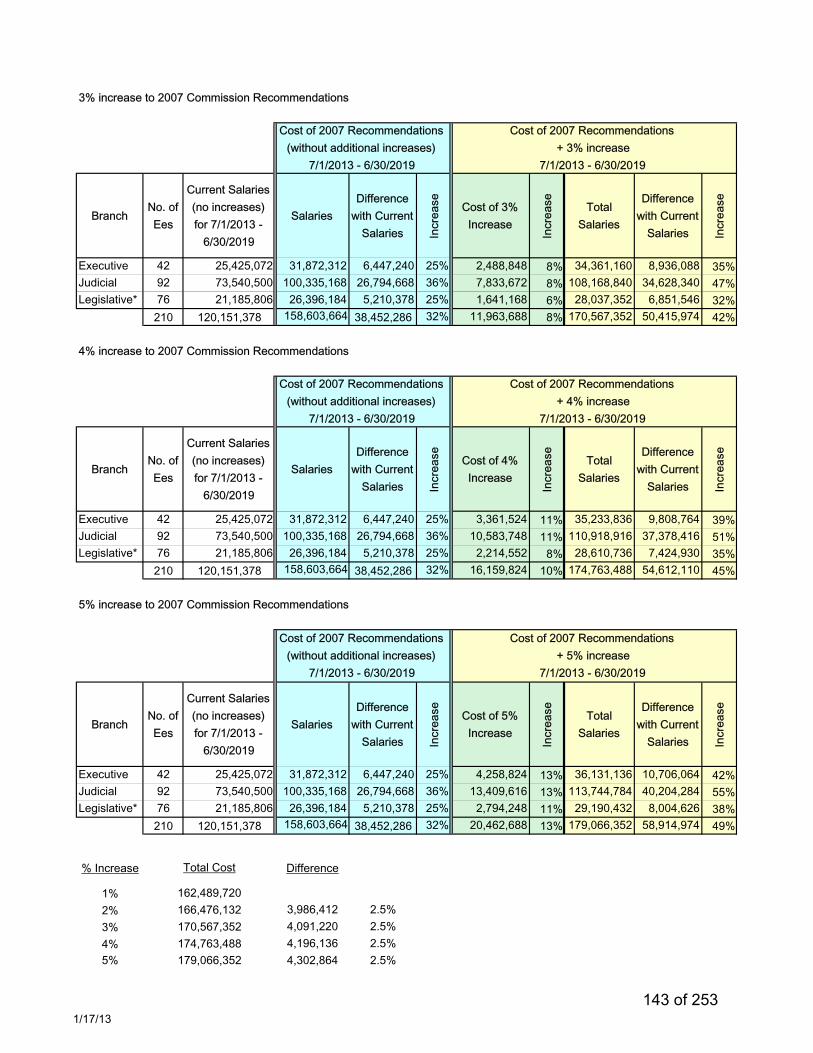
3% increase to 2007 Commission Recommendations
BranchNo. of Ees
Current Salaries (no increases) for 7/1/2013 -
6/30/2019
SalariesDifference
with Current Salaries In
crea
se Cost of 3% Increase
Incr
ease Total
Salaries
Difference with Current
Salaries Incr
ease
Executive 42 25,425,072 31,872,312 6,447,240 25% 2,488,848 8% 34,361,160 8,936,088 35%Judicial 92 73,540,500 100,335,168 26,794,668 36% 7,833,672 8% 108,168,840 34,628,340 47%Legislative* 76 21,185,806 26,396,184 5,210,378 25% 1,641,168 6% 28,037,352 6,851,546 32%
210 120,151,378 158,603,664 38,452,286 32% 11,963,688 8% 170,567,352 50,415,974 42%
4% increase to 2007 Commission Recommendations
BranchNo. of Ees
Current Salaries (no increases) for 7/1/2013 -
6/30/2019
SalariesDifference
with Current Salaries In
crea
se Cost of 4% Increase
Incr
ease Total
Salaries
Difference with Current
Salaries Incr
ease
Executive 42 25,425,072 31,872,312 6,447,240 25% 3,361,524 11% 35,233,836 9,808,764 39%Judicial 92 73,540,500 100,335,168 26,794,668 36% 10,583,748 11% 110,918,916 37,378,416 51%Legislative* 76 21,185,806 26,396,184 5,210,378 25% 2,214,552 8% 28,610,736 7,424,930 35%
210 120,151,378 158,603,664 38,452,286 32% 16,159,824 10% 174,763,488 54,612,110 45%
5% increase to 2007 Commission Recommendations
BranchNo. of Ees
Current Salaries (no increases) for 7/1/2013 -
6/30/2019
SalariesDifference
with Current Salaries In
crea
se Cost of 5% Increase
Incr
ease Total
Salaries
Difference with Current
Salaries Incr
ease
Executive 42 25,425,072 31,872,312 6,447,240 25% 4,258,824 13% 36,131,136 10,706,064 42%Judicial 92 73,540,500 100,335,168 26,794,668 36% 13,409,616 13% 113,744,784 40,204,284 55%Legislative* 76 21,185,806 26,396,184 5,210,378 25% 2,794,248 11% 29,190,432 8,004,626 38%
210 120,151,378 158,603,664 38,452,286 32% 20,462,688 13% 179,066,352 58,914,974 49%
% Increase Difference
1%2% 3,986,412 2.5%3% 4,091,220 2.5%4% 4,196,136 2.5%5% 4,302,864 2.5%
174,763,488179,066,352
Cost of 2007 Recommendations (without additional increases)
7/1/2013 - 6/30/2019
Cost of 2007 Recommendations + 5% increase
7/1/2013 - 6/30/2019
Cost of 2007 Recommendations (without additional increases)
7/1/2013 - 6/30/2019
Cost of 2007 Recommendations + 4% increase
7/1/2013 - 6/30/2019
Cost of 2007 Recommendations (without additional increases)
7/1/2013 - 6/30/2019
Cost of 2007 Recommendations + 3% increase
7/1/2013 - 6/30/2019
Total Cost
162,489,720166,476,132170,567,352
1/17/13143 of 253
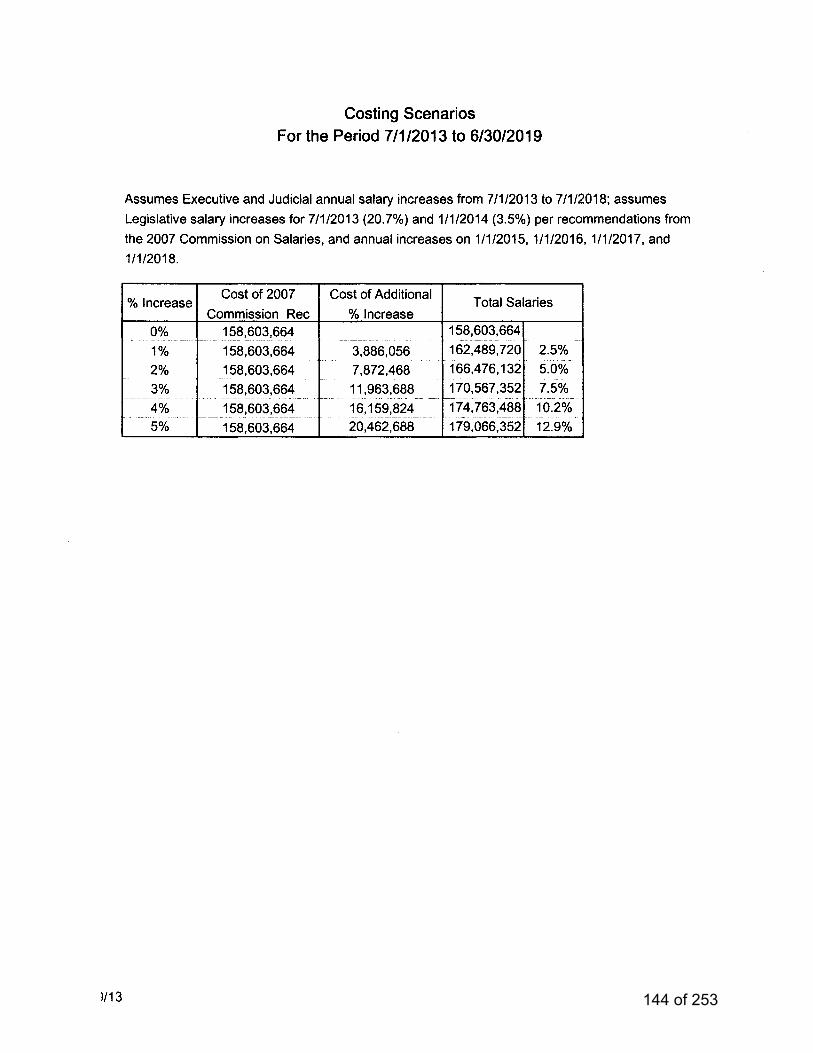
144 of 253
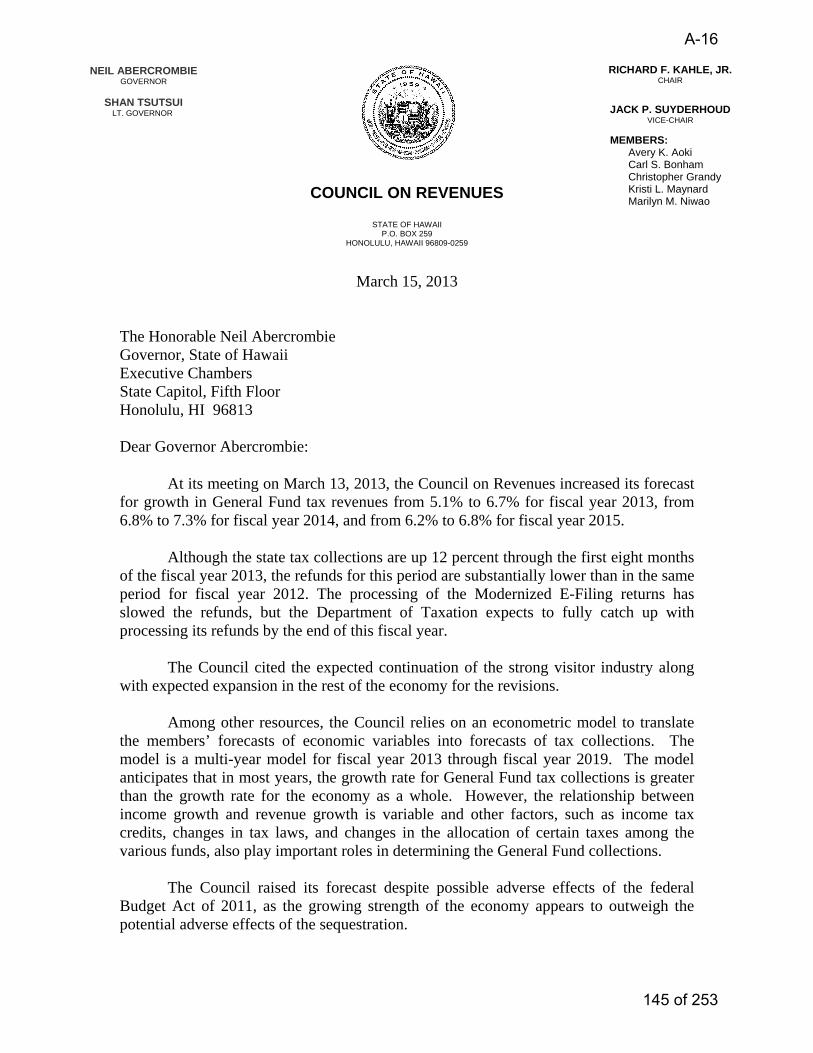
NEIL ABERCROMBIE GOVERNOR
SHAN TSUTSUI LT. GOVERNOR
COUNCIL ON REVENUES
STATE OF HAWAII P.O. BOX 259
HONOLULU, HAWAII 96809-0259
RICHARD F. KAHLE, JR. CHAIR
JACK P. SUYDERHOUD VICE-CHAIR
MEMBERS: Avery K. Aoki Carl S. Bonham
Christopher Grandy Kristi L. Maynard Marilyn M. Niwao
March 15, 2013
The Honorable Neil Abercrombie Governor, State of Hawaii Executive Chambers State Capitol, Fifth Floor Honolulu, HI 96813 Dear Governor Abercrombie:
At its meeting on March 13, 2013, the Council on Revenues increased its forecast for growth in General Fund tax revenues from 5.1% to 6.7% for fiscal year 2013, from 6.8% to 7.3% for fiscal year 2014, and from 6.2% to 6.8% for fiscal year 2015.
Although the state tax collections are up 12 percent through the first eight months of the fiscal year 2013, the refunds for this period are substantially lower than in the same period for fiscal year 2012. The processing of the Modernized E-Filing returns has slowed the refunds, but the Department of Taxation expects to fully catch up with processing its refunds by the end of this fiscal year.
The Council cited the expected continuation of the strong visitor industry along with expected expansion in the rest of the economy for the revisions.
Among other resources, the Council relies on an econometric model to translate the members’ forecasts of economic variables into forecasts of tax collections. The model is a multi-year model for fiscal year 2013 through fiscal year 2019. The model anticipates that in most years, the growth rate for General Fund tax collections is greater than the growth rate for the economy as a whole. However, the relationship between income growth and revenue growth is variable and other factors, such as income tax credits, changes in tax laws, and changes in the allocation of certain taxes among the various funds, also play important roles in determining the General Fund collections. The Council raised its forecast despite possible adverse effects of the federal Budget Act of 2011, as the growing strength of the economy appears to outweigh the potential adverse effects of the sequestration.
A-16
145 of 253
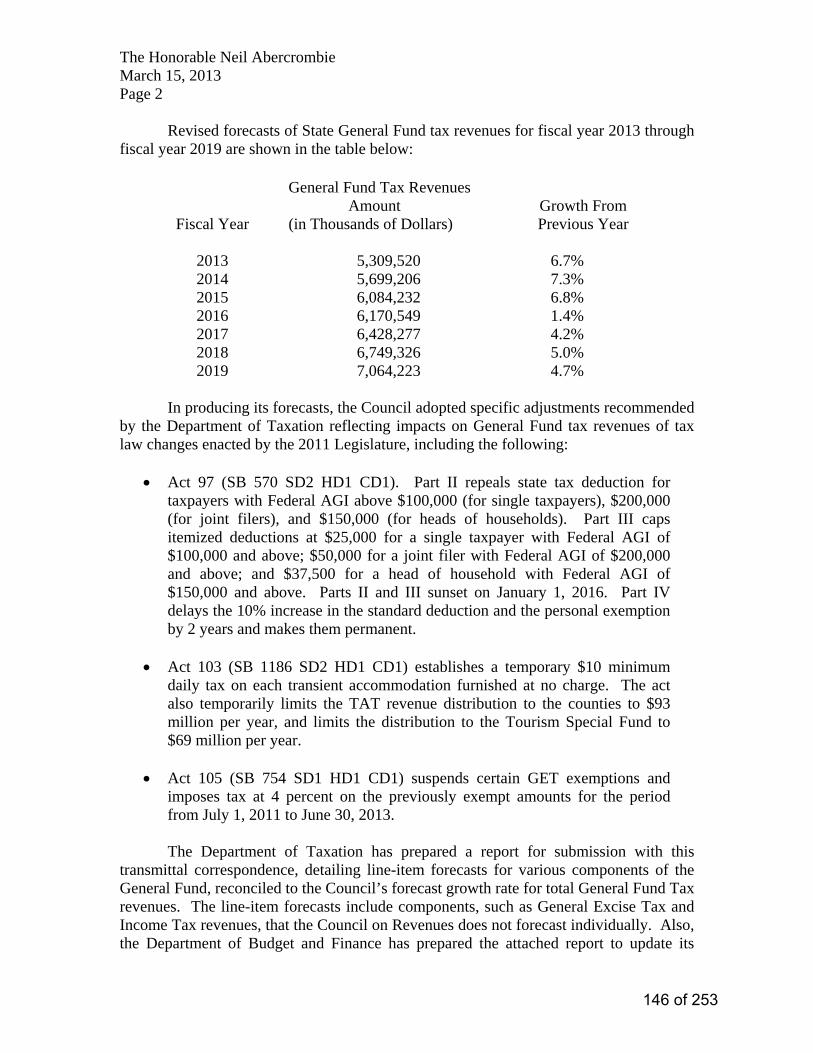
The Honorable Neil Abercrombie March 15, 2013 Page 2 Revised forecasts of State General Fund tax revenues for fiscal year 2013 through fiscal year 2019 are shown in the table below:
General Fund Tax Revenues
Fiscal Year Amount (in Thousands of Dollars)
Growth From Previous Year
2013 5,309,520 6.7% 2014 5,699,206 7.3% 2015 6,084,232 6.8% 2016 6,170,549 1.4% 2017 6,428,277 4.2% 2018 6,749,326 5.0% 2019 7,064,223 4.7%
In producing its forecasts, the Council adopted specific adjustments recommended by the Department of Taxation reflecting impacts on General Fund tax revenues of tax law changes enacted by the 2011 Legislature, including the following:
• Act 97 (SB 570 SD2 HD1 CD1). Part II repeals state tax deduction for taxpayers with Federal AGI above $100,000 (for single taxpayers), $200,000 (for joint filers), and $150,000 (for heads of households). Part III caps itemized deductions at $25,000 for a single taxpayer with Federal AGI of $100,000 and above; $50,000 for a joint filer with Federal AGI of $200,000 and above; and $37,500 for a head of household with Federal AGI of $150,000 and above. Parts II and III sunset on January 1, 2016. Part IV delays the 10% increase in the standard deduction and the personal exemption by 2 years and makes them permanent.
• Act 103 (SB 1186 SD2 HD1 CD1) establishes a temporary $10 minimum
daily tax on each transient accommodation furnished at no charge. The act also temporarily limits the TAT revenue distribution to the counties to $93 million per year, and limits the distribution to the Tourism Special Fund to $69 million per year.
• Act 105 (SB 754 SD1 HD1 CD1) suspends certain GET exemptions and
imposes tax at 4 percent on the previously exempt amounts for the period from July 1, 2011 to June 30, 2013.
The Department of Taxation has prepared a report for submission with this transmittal correspondence, detailing line-item forecasts for various components of the General Fund, reconciled to the Council’s forecast growth rate for total General Fund Tax revenues. The line-item forecasts include components, such as General Excise Tax and Income Tax revenues, that the Council on Revenues does not forecast individually. Also, the Department of Budget and Finance has prepared the attached report to update its
146 of 253
The Honorable Neil Abercrombie March 15, 2013 Page 3 projections for non-tax and special tax revenues Significant Changes from January 2013 Report. Please advise us if we can be of further assistance or if we can answer any questions you may have. Sincerely,
RICHARD F. KAHLE, JR. Chair, Council on Revenues Attachments
147 of 253
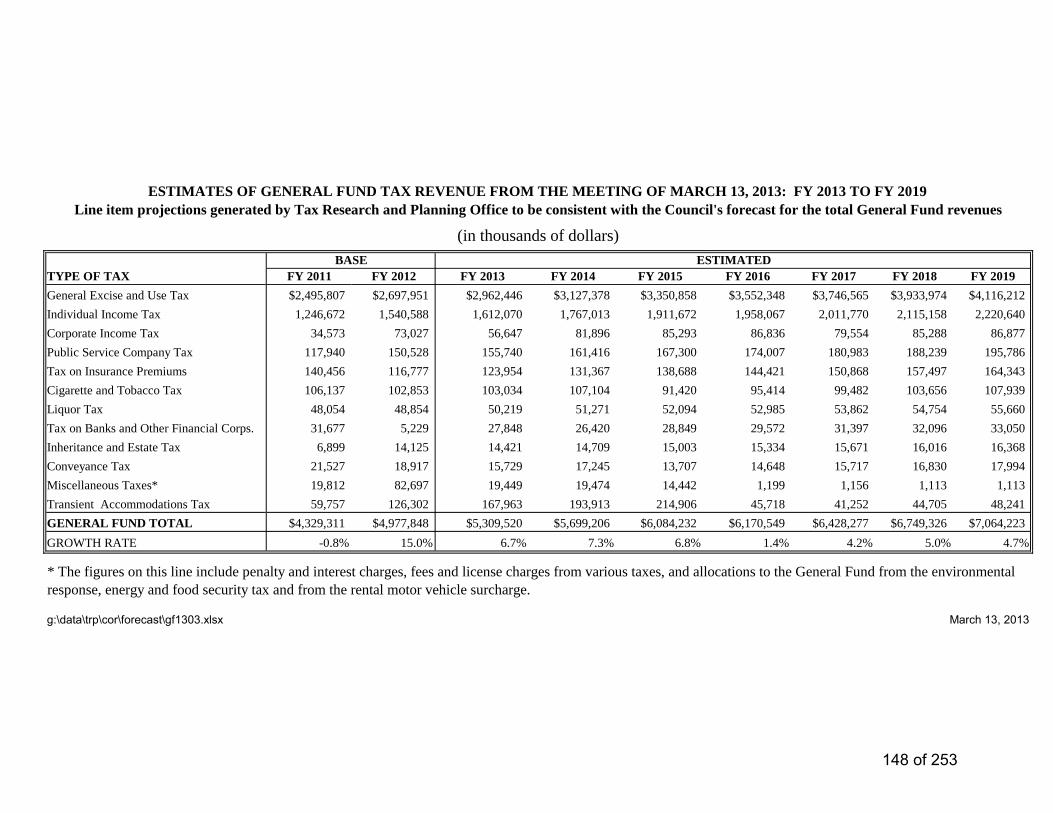
TYPE OF TAX FY 2011 FY 2012 FY 2013 FY 2014 FY 2015 FY 2016 FY 2017 FY 2018 FY 2019
General Excise and Use Tax $2,495,807 $2,697,951 $2,962,446 $3,127,378 $3,350,858 $3,552,348 $3,746,565 $3,933,974 $4,116,212
Individual Income Tax 1,246,672 1,540,588 1,612,070 1,767,013 1,911,672 1,958,067 2,011,770 2,115,158 2,220,640
Corporate Income Tax 34,573 73,027 56,647 81,896 85,293 86,836 79,554 85,288 86,877
Public Service Company Tax 117,940 150,528 155,740 161,416 167,300 174,007 180,983 188,239 195,786
Tax on Insurance Premiums 140,456 116,777 123,954 131,367 138,688 144,421 150,868 157,497 164,343
Cigarette and Tobacco Tax 106,137 102,853 103,034 107,104 91,420 95,414 99,482 103,656 107,939
Liquor Tax 48,054 48,854 50,219 51,271 52,094 52,985 53,862 54,754 55,660
Tax on Banks and Other Financial Corps. 31,677 5,229 27,848 26,420 28,849 29,572 31,397 32,096 33,050
Inheritance and Estate Tax 6,899 14,125 14,421 14,709 15,003 15,334 15,671 16,016 16,368
Conveyance Tax 21,527 18,917 15,729 17,245 13,707 14,648 15,717 16,830 17,994
Miscellaneous Taxes* 19,812 82,697 19,449 19,474 14,442 1,199 1,156 1,113 1,113
Transient Accommodations Tax 59,757 126,302 167,963 193,913 214,906 45,718 41,252 44,705 48,241
GENERAL FUND TOTAL $4,329,311 $4,977,848 $5,309,520 $5,699,206 $6,084,232 $6,170,549 $6,428,277 $6,749,326 $7,064,223
GROWTH RATE -0.8% 15.0% 6.7% 7.3% 6.8% 1.4% 4.2% 5.0% 4.7%
g:\data\trp\cor\forecast\gf1303.xlsx March 13, 2013
* The figures on this line include penalty and interest charges, fees and license charges from various taxes, and allocations to the General Fund from the environmental
response, energy and food security tax and from the rental motor vehicle surcharge.
ESTIMATES OF GENERAL FUND TAX REVENUE FROM THE MEETING OF MARCH 13, 2013: FY 2013 TO FY 2019
ESTIMATEDBASE
(in thousands of dollars)
Line item projections generated by Tax Research and Planning Office to be consistent with the Council's forecast for the total General Fund revenues
148 of 253
Significant Changes from January 2013 Report General Fund Non-Tax Revenues The only significant change is due to moving the reporting of the estimates for the tobacco settlement moneys that are allocated to the general fund from the category, “Revenues from Other Agencies” to the category, “Non-Revenue Receipts” where it is being reported as a transfer from the Hawaii tobacco settlement special fund. Special Tax Revenues There are no significant changes to the special fund tax revenue estimates. Special Fund Non-Tax Revenues Federal Grants - the increase in FY 12 actuals reflect higher than anticipated amount in federal grants for Medicare payments (Hawaii Health Systems Corporation). Revenues from Other Agencies - the changes in FYs 13-19 reflect revisions to the method in which Department of Health records the receipt of the Tobacco Settlement revenues from the Master Settlement Agreement, as well as revised projections of the anticipated distribution. Charges for Current Services - the net decreases in FYs 12-19 are attributed to a correction in the revenue projections for the University of Hawaii tuition fees for resident and non-resident students. Adjustments included correction of a computational error and utilizing updated student enrollment projections. Revenue Transfers - the increases in FYs 13-15 are attributed to increased transfers to the Department of Education (DOE) State Educational Facilities Improvement Special Fund to meet construction project funding needs. Other than Special Fund Non-Tax Revenues Federal Grants - the net decreases in FYs 14 and 15 reflect decreases in federal funds for the Temporary Assistance to Needy Families program (Department of Human Services) and lower than projected reimbursements for the School Lunch Program (DOE). Charges for Current Services - the decrease in FY 15 is attributed to a correction in the revenue projections for the Medicaid Investigations Fund (Department of the Attorney General). Non-Revenue Receipts - the net increase in FY 13 is reflective of increases in contributions for Other Post Employment Benefit Plans from the City and County of Honolulu, County of Kauai, Honolulu Board of Water Supply, and Kauai Department of Water. The net increases in FYs 14-19 are reflective of recalculated projections for employer/employee contributions into the Employer-Union Health Benefits Trust Fund health benefits plan based on actual contributions made in FY 13 (Department of Budget and Finance). 149 of 253
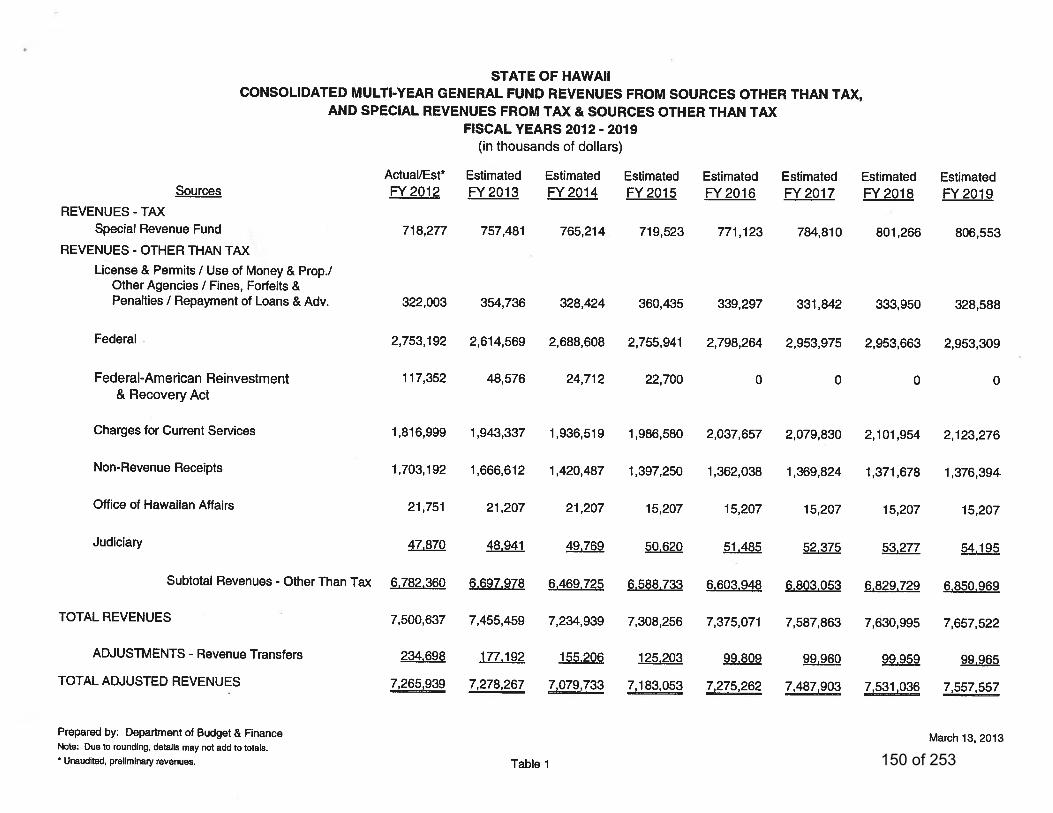
150 of 253
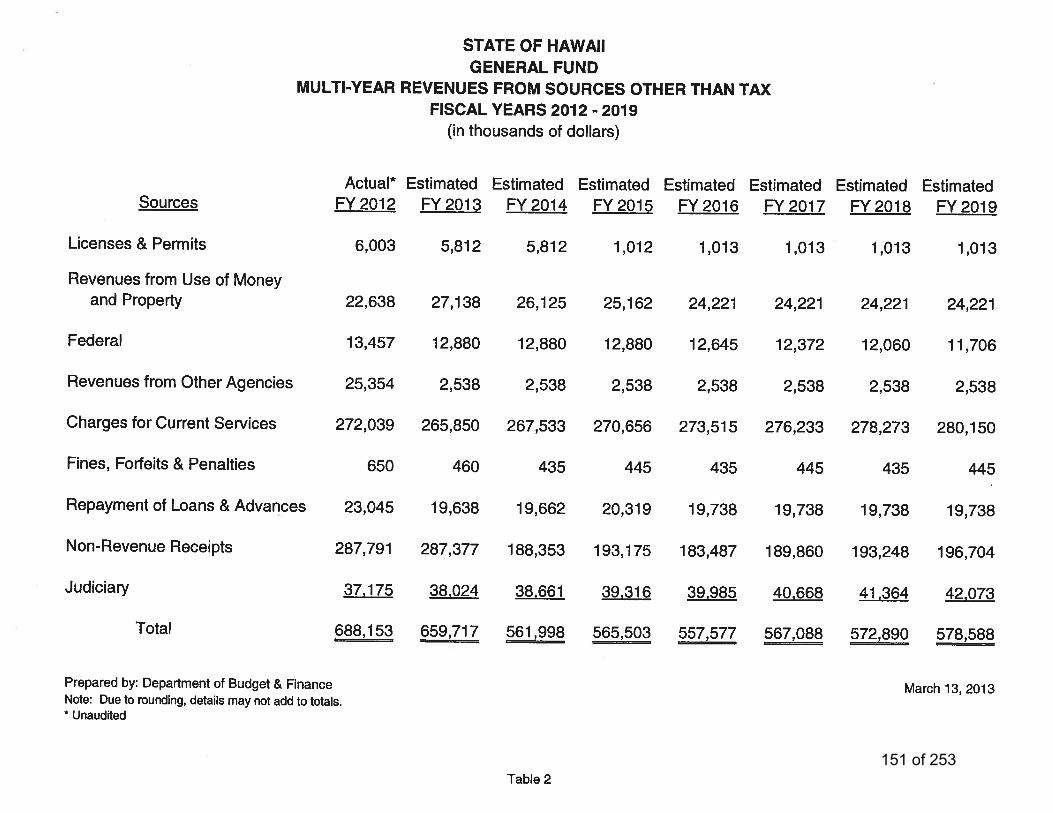
151 of 253
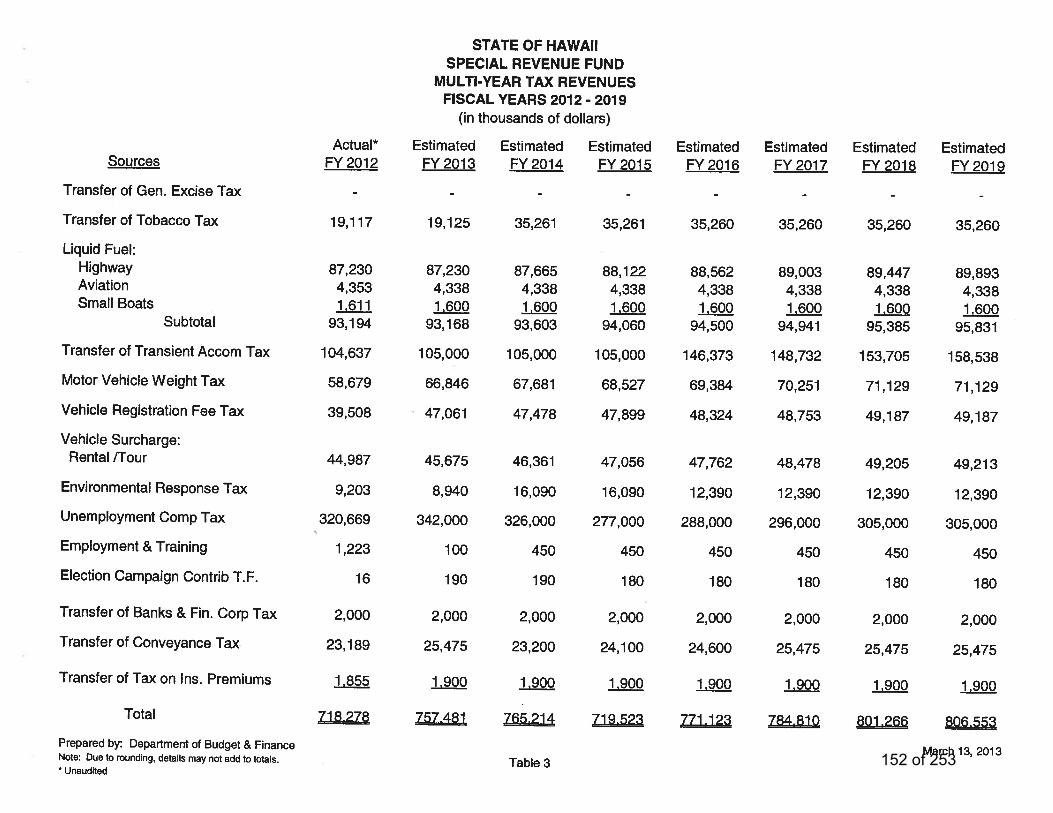
152 of 253
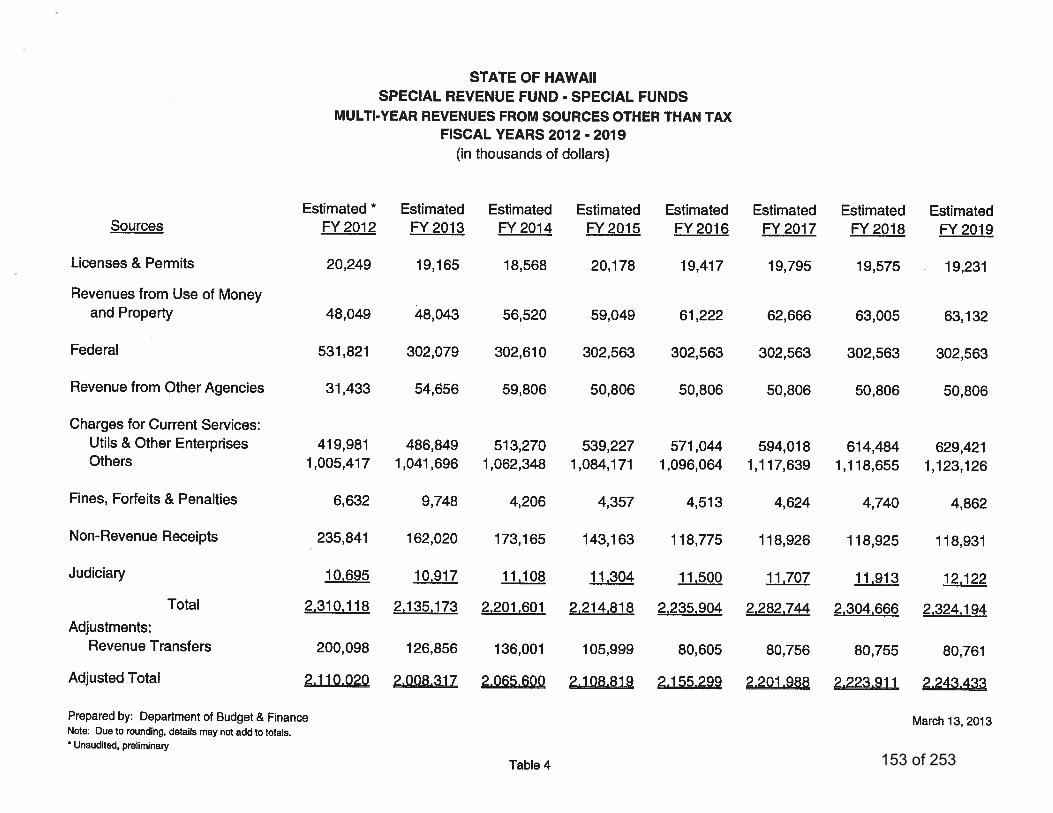
153 of 253
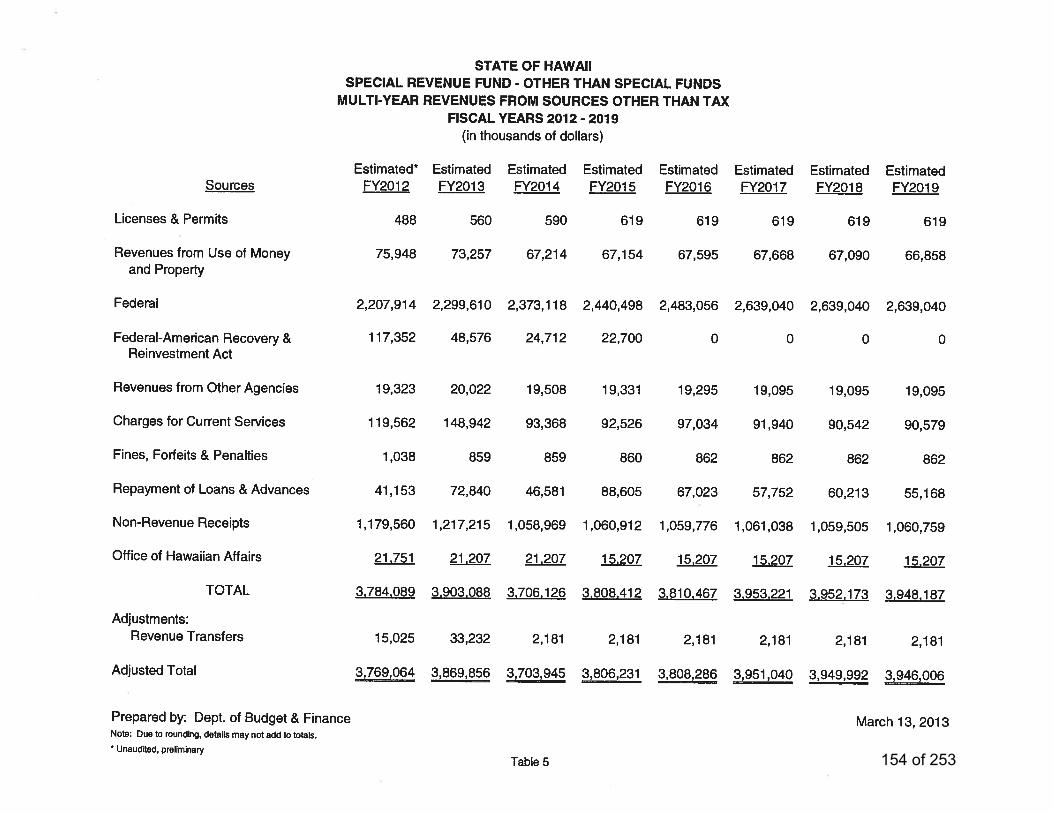
154 of 253

Appendix B
Executive Branch
Appendices
155 of 253
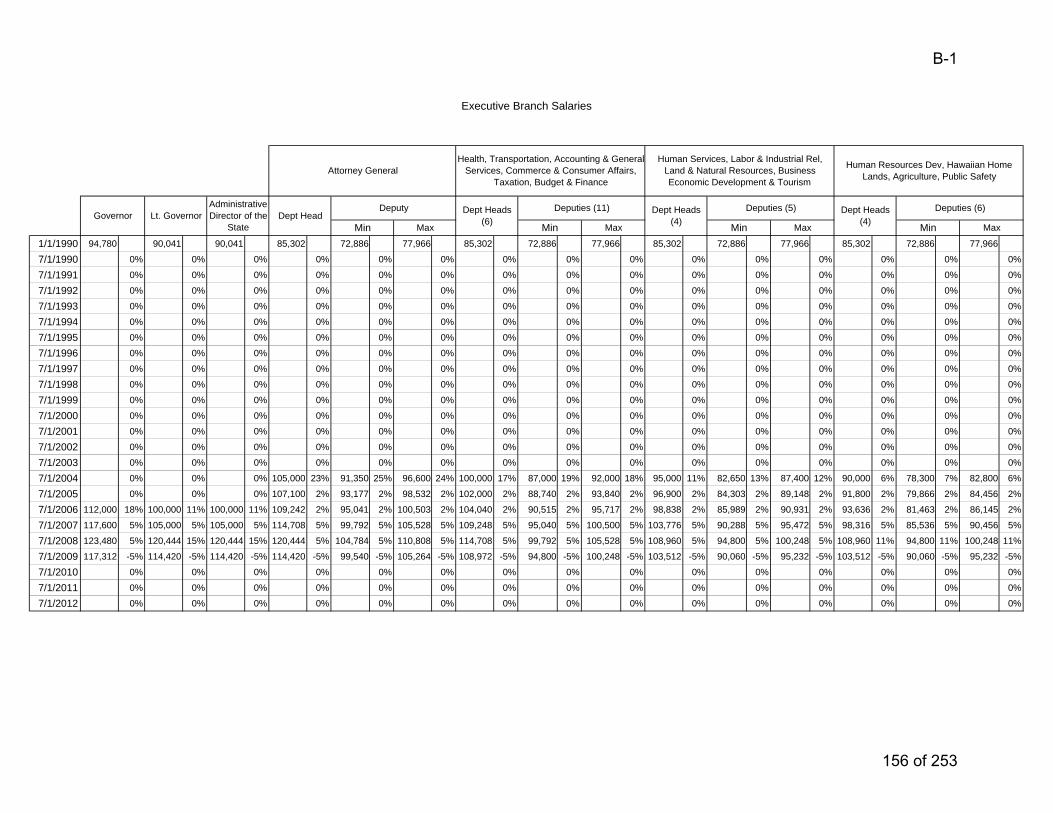
1/1/1990 94,780 90,041 90,041 85,302 72,886 77,966 85,302 72,886 77,966 85,302 72,886 77,966 85,302 72,886 77,966
7/1/1990 0% 0% 0% 0% 0% 0% 0% 0% 0% 0% 0% 0% 0% 0% 0%
7/1/1991 0% 0% 0% 0% 0% 0% 0% 0% 0% 0% 0% 0% 0% 0% 0%
7/1/1992 0% 0% 0% 0% 0% 0% 0% 0% 0% 0% 0% 0% 0% 0% 0%
7/1/1993 0% 0% 0% 0% 0% 0% 0% 0% 0% 0% 0% 0% 0% 0% 0%
7/1/1994 0% 0% 0% 0% 0% 0% 0% 0% 0% 0% 0% 0% 0% 0% 0%
7/1/1995 0% 0% 0% 0% 0% 0% 0% 0% 0% 0% 0% 0% 0% 0% 0%
7/1/1996 0% 0% 0% 0% 0% 0% 0% 0% 0% 0% 0% 0% 0% 0% 0%
7/1/1997 0% 0% 0% 0% 0% 0% 0% 0% 0% 0% 0% 0% 0% 0% 0%
7/1/1998 0% 0% 0% 0% 0% 0% 0% 0% 0% 0% 0% 0% 0% 0% 0%
7/1/1999 0% 0% 0% 0% 0% 0% 0% 0% 0% 0% 0% 0% 0% 0% 0%
7/1/2000 0% 0% 0% 0% 0% 0% 0% 0% 0% 0% 0% 0% 0% 0% 0%
7/1/2001 0% 0% 0% 0% 0% 0% 0% 0% 0% 0% 0% 0% 0% 0% 0%
7/1/2002 0% 0% 0% 0% 0% 0% 0% 0% 0% 0% 0% 0% 0% 0% 0%
7/1/2003 0% 0% 0% 0% 0% 0% 0% 0% 0% 0% 0% 0% 0% 0% 0%
7/1/2004 0% 0% 0% 105,000 23% 91,350 25% 96,600 24% 100,000 17% 87,000 19% 92,000 18% 95,000 11% 82,650 13% 87,400 12% 90,000 6% 78,300 7% 82,800 6%
7/1/2005 0% 0% 0% 107,100 2% 93,177 2% 98,532 2% 102,000 2% 88,740 2% 93,840 2% 96,900 2% 84,303 2% 89,148 2% 91,800 2% 79,866 2% 84,456 2%
7/1/2006 112,000 18% 100,000 11% 100,000 11% 109,242 2% 95,041 2% 100,503 2% 104,040 2% 90,515 2% 95,717 2% 98,838 2% 85,989 2% 90,931 2% 93,636 2% 81,463 2% 86,145 2%
7/1/2007 117,600 5% 105,000 5% 105,000 5% 114,708 5% 99,792 5% 105,528 5% 109,248 5% 95,040 5% 100,500 5% 103,776 5% 90,288 5% 95,472 5% 98,316 5% 85,536 5% 90,456 5%
7/1/2008 123,480 5% 120,444 15% 120,444 15% 120,444 5% 104,784 5% 110,808 5% 114,708 5% 99,792 5% 105,528 5% 108,960 5% 94,800 5% 100,248 5% 108,960 11% 94,800 11% 100,248 11%
7/1/2009 117,312 -5% 114,420 -5% 114,420 -5% 114,420 -5% 99,540 -5% 105,264 -5% 108,972 -5% 94,800 -5% 100,248 -5% 103,512 -5% 90,060 -5% 95,232 -5% 103,512 -5% 90,060 -5% 95,232 -5%
7/1/2010 0% 0% 0% 0% 0% 0% 0% 0% 0% 0% 0% 0% 0% 0% 0%
7/1/2011 0% 0% 0% 0% 0% 0% 0% 0% 0% 0% 0% 0% 0% 0% 0%
7/1/2012 0% 0% 0% 0% 0% 0% 0% 0% 0% 0% 0% 0% 0% 0% 0%
Executive Branch Salaries
Attorney General
Min Max
Deputies (11) Dept Heads (4) Min Max
Deputies (5) Dept Heads (4)
Max
Deputy Dept Heads (6)Governor Lt. Governor
Administrative Director of the
StateDept Head
Min
Human Services, Labor & Industrial Rel, Land & Natural Resources, Business Economic Development & Tourism
Health, Transportation, Accounting & General Services, Commerce & Consumer Affairs,
Taxation, Budget & Finance
Min Max
Human Resources Dev, Hawaiian Home Lands, Agriculture, Public Safety
Deputies (6)
B-1
156 of 253
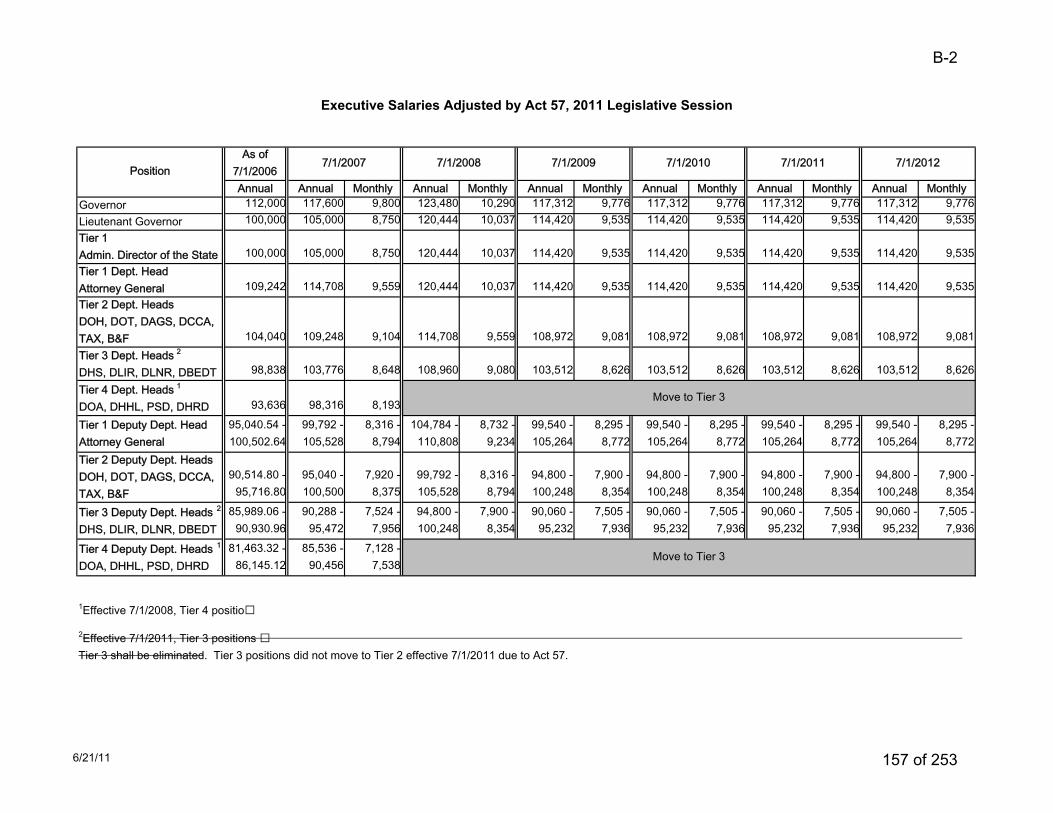
Annual Annual Monthly Annual Monthly Annual Monthly Annual Monthly Annual Monthly Annual MonthlyGovernor 112,000 117,600 9,800 123,480 10,290 117,312 9,776 117,312 9,776 117,312 9,776 117,312 9,776Lieutenant Governor 100,000 105,000 8,750 120,444 10,037 114,420 9,535 114,420 9,535 114,420 9,535 114,420 9,535Tier 1Admin. Director of the State 100,000 105,000 8,750 120,444 10,037 114,420 9,535 114,420 9,535 114,420 9,535 114,420 9,535Tier 1 Dept. HeadAttorney General 109,242 114,708 9,559 120,444 10,037 114,420 9,535 114,420 9,535 114,420 9,535 114,420 9,535Tier 2 Dept. HeadsDOH, DOT, DAGS, DCCA,TAX, B&F 104,040 109,248 9,104 114,708 9,559 108,972 9,081 108,972 9,081 108,972 9,081 108,972 9,081Tier 3 Dept. Heads 2
DHS, DLIR, DLNR, DBEDT 98,838 103,776 8,648 108,960 9,080 103,512 8,626 103,512 8,626 103,512 8,626 103,512 8,626
Tier 4 Dept. Heads 1
DOA, DHHL, PSD, DHRD 93,636 98,316 8,193
Tier 1 Deputy Dept. HeadAttorney General
95,040.54 -100,502.64
99,792 -105,528
8,316 -8,794
104,784 -110,808
8,732 -9,234
99,540 -105,264
8,295 -8,772
99,540 -105,264
8,295 -8,772
99,540 -105,264
8,295 -8,772
99,540 -105,264
8,295 -8,772
Tier 2 Deputy Dept. HeadsDOH, DOT, DAGS, DCCA,TAX, B&F
90,514.80 -95,716.80
95,040 -100,500
7,920 -8,375
99,792 -105,528
8,316 -8,794
94,800 -100,248
7,900 -8,354
94,800 -100,248
7,900 -8,354
94,800 -100,248
7,900 -8,354
94,800 -100,248
7,900 -8,354
Tier 3 Deputy Dept. Heads 2
DHS, DLIR, DLNR, DBEDT85,989.06 -
90,930.9690,288 -
95,4727,524 -
7,95694,800 -100,248
7,900 -8,354
90,060 -95,232
7,505 -7,936
90,060 -95,232
7,505 -7,936
90,060 -95,232
7,505 -7,936
90,060 -95,232
7,505 -7,936
Tier 4 Deputy Dept. Heads 1
DOA, DHHL, PSD, DHRD81,463.32 -
86,145.1285,536 -
90,4567,128 -
7,538
1Effective 7/1/2008, Tier 4 positio�
As of7/1/2006
7/1/2007 7/1/2008 7/1/2009
Move to Tier 3
7/1/2010 7/1/2011
Executive Salaries Adjusted by Act 57, 2011 Legislative Session
2Effective 7/1/2011, Tier 3 positions �Tier 3 shall be eliminated. Tier 3 positions did not move to Tier 2 effective 7/1/2011 due to Act 57.
Position7/1/2012
Move to Tier 3
6/21/11
B-2
157 of 253
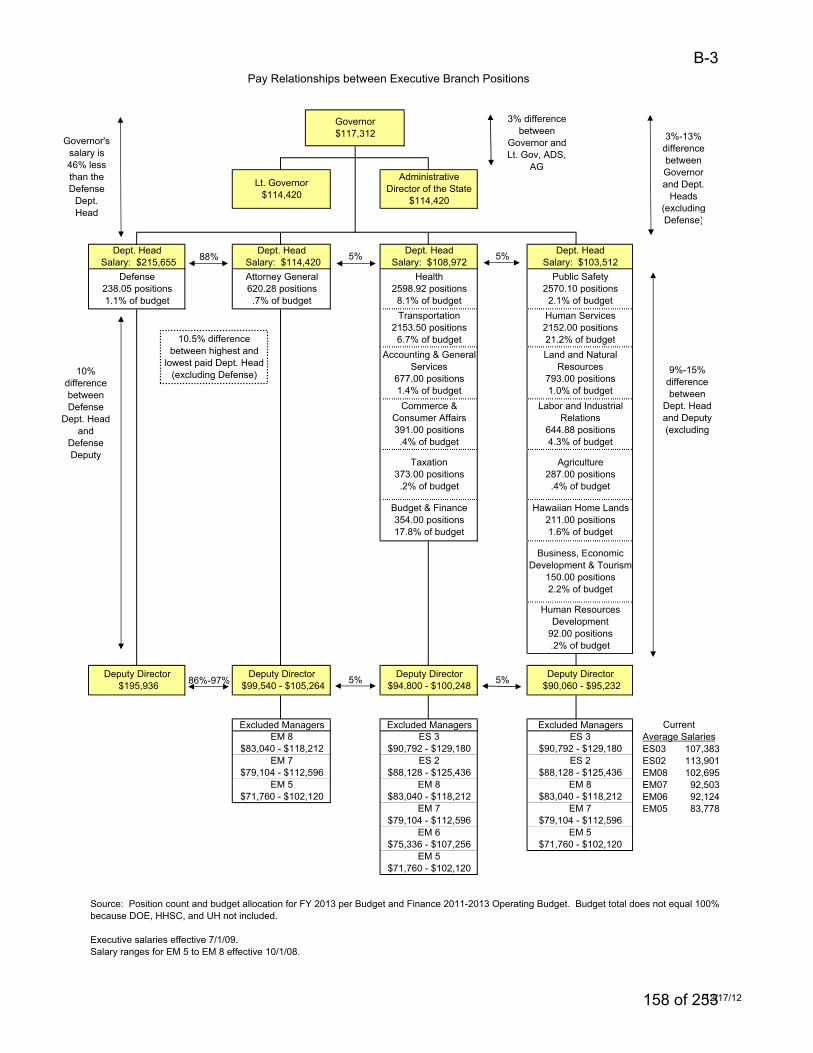
88%
86%-97%
ES03 107,383
ES02 113,901
EM08 102,695
EM07 92,503
EM06 92,124
EM05 83,778
Executive salaries effective 7/1/09.
Salary ranges for EM 5 to EM 8 effective 10/1/08.
$71,760 - $102,120
Pay Relationships between Executive Branch Positions
Source: Position count and budget allocation for FY 2013 per Budget and Finance 2011-2013 Operating Budget. Budget total does not equal 100%
because DOE, HHSC, and UH not included.
5%
Excluded ManagersEM 8
$83,040 - $118,212
EM 7
Lt. Governor
$114,420
Administrative
Director of the State
$114,420
5%Dept. Head
Salary: $114,420
Deputy Director
$99,540 - $105,264
$79,104 - $112,596
EM 5
Attorney General
620.28 positions
.7% of budget
Dept. Head
Salary: $215,655
Defense
238.05 positions
1.1% of budget
Deputy Director
$195,936
Current
Average Salaries
EM 5
$71,760 - $102,120
$83,040 - $118,212
EM 7
$79,104 - $112,596
EM 5
$71,760 - $102,120
EM 7
Taxation
373.00 positions
.2% of budget
$75,336 - $107,256
$88,128 - $125,436
EM 8
$79,104 - $112,596
EM 6
Health
2598.92 positions
8.1% of budget
Human Services
2152.00 positions
21.2% of budget
Accounting & General
Services
677.00 positions
1.4% of budget
Public Safety
2570.10 positions
2.1% of budget
Transportation
2153.50 positions
6.7% of budget
Land and Natural
Resources
793.00 positions
1.0% of budget
Deputy Director
$94,800 - $100,248
Dept. Head
Salary: $108,972
Business, Economic
Development & Tourism
150.00 positions
2.2% of budget
5%
Agriculture
287.00 positions
.4% of budget
Commerce &
Consumer Affairs
391.00 positions
.4% of budget
Labor and Industrial
Relations
644.88 positions
4.3% of budget
Hawaiian Home Lands
211.00 positions
1.6% of budget
Dept. Head
Salary: $103,512
Budget & Finance
354.00 positions
17.8% of budget
5%
Excluded ManagersES 3
ES 2
Deputy Director
$90,060 - $95,232
Human Resources
Development
92.00 positions
.2% of budget
Governor
$117,312
Excluded ManagersES 3
$88,128 - $125,436
ES 2
$83,040 - $118,212
$90,792 - $129,180$90,792 - $129,180
EM 8
10.5% difference
between highest and
lowest paid Dept. Head
(excluding Defense)9%-15%
difference
between
Dept. Head
and Deputy
(excluding
Defense)
3% difference
between
Governor and
Lt. Gov, ADS,
AG
3%-13%
difference
between
Governor
and Dept.
Heads
(excluding
Defense)
10%
difference
between
Defense
Dept. Head
and
Defense
Deputy
Governor's
salary is
46% less
than the
Defense
Dept.
Head
12/17/12
B-3
158 of 253
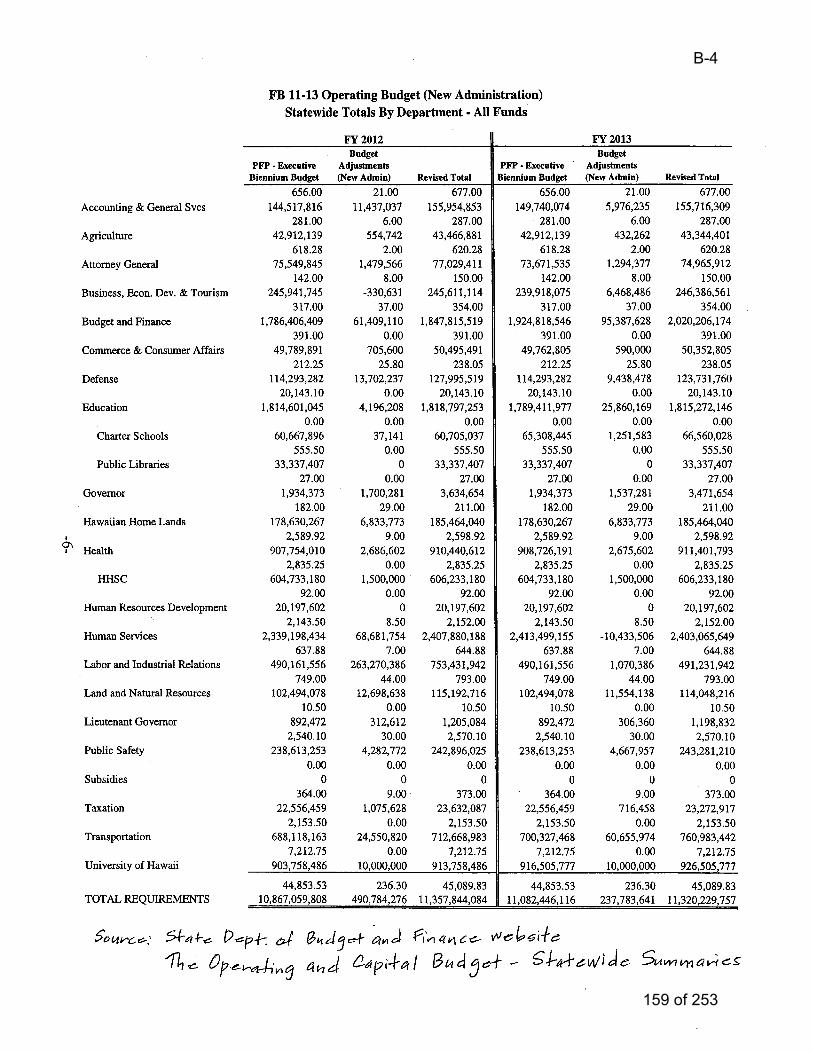
B-4
159 of 253
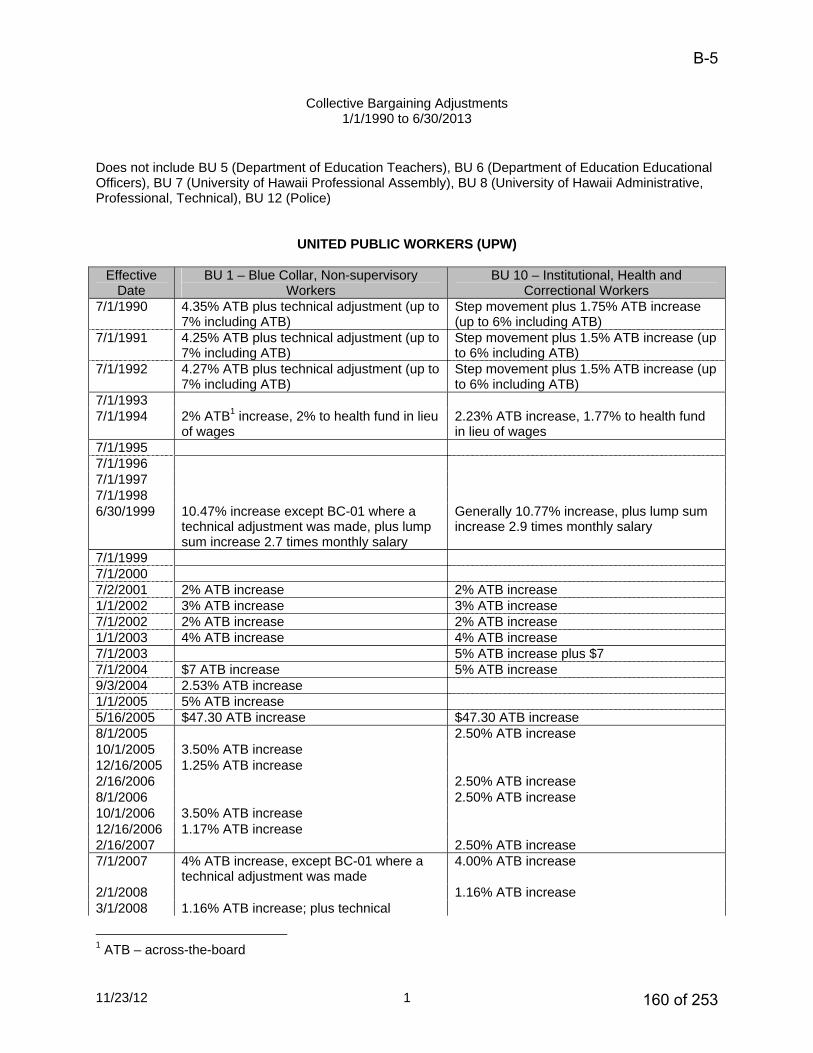
11/23/12 1
Collective Bargaining Adjustments 1/1/1990 to 6/30/2013
Does not include BU 5 (Department of Education Teachers), BU 6 (Department of Education Educational Officers), BU 7 (University of Hawaii Professional Assembly), BU 8 (University of Hawaii Administrative, Professional, Technical), BU 12 (Police)
UNITED PUBLIC WORKERS (UPW)
Effective
Date BU 1 – Blue Collar, Non-supervisory
Workers BU 10 – Institutional, Health and
Correctional Workers 7/1/1990 4.35% ATB plus technical adjustment (up to
7% including ATB) Step movement plus 1.75% ATB increase (up to 6% including ATB)
7/1/1991 4.25% ATB plus technical adjustment (up to 7% including ATB)
Step movement plus 1.5% ATB increase (up to 6% including ATB)
7/1/1992 4.27% ATB plus technical adjustment (up to 7% including ATB)
Step movement plus 1.5% ATB increase (up to 6% including ATB)
7/1/1993 7/1/1994 2% ATB1 increase, 2% to health fund in lieu
of wages 2.23% ATB increase, 1.77% to health fund in lieu of wages
7/1/1995 7/1/1996 7/1/1997 7/1/1998 6/30/1999 10.47% increase except BC-01 where a
technical adjustment was made, plus lump sum increase 2.7 times monthly salary
Generally 10.77% increase, plus lump sum increase 2.9 times monthly salary
7/1/1999 7/1/2000 7/2/2001 2% ATB increase 2% ATB increase 1/1/2002 3% ATB increase 3% ATB increase 7/1/2002 2% ATB increase 2% ATB increase 1/1/2003 4% ATB increase 4% ATB increase 7/1/2003 5% ATB increase plus $7 7/1/2004 $7 ATB increase 5% ATB increase 9/3/2004 2.53% ATB increase 1/1/2005 5% ATB increase 5/16/2005 $47.30 ATB increase $47.30 ATB increase 8/1/2005 2.50% ATB increase 10/1/2005 3.50% ATB increase 12/16/2005 1.25% ATB increase 2/16/2006 2.50% ATB increase 8/1/2006 2.50% ATB increase 10/1/2006 3.50% ATB increase 12/16/2006 1.17% ATB increase 2/16/2007 2.50% ATB increase 7/1/2007 4% ATB increase, except BC-01 where a
technical adjustment was made 4.00% ATB increase
2/1/2008 1.16% ATB increase 3/1/2008 1.16% ATB increase; plus technical
1 ATB – across-the-board
B-5
160 of 253
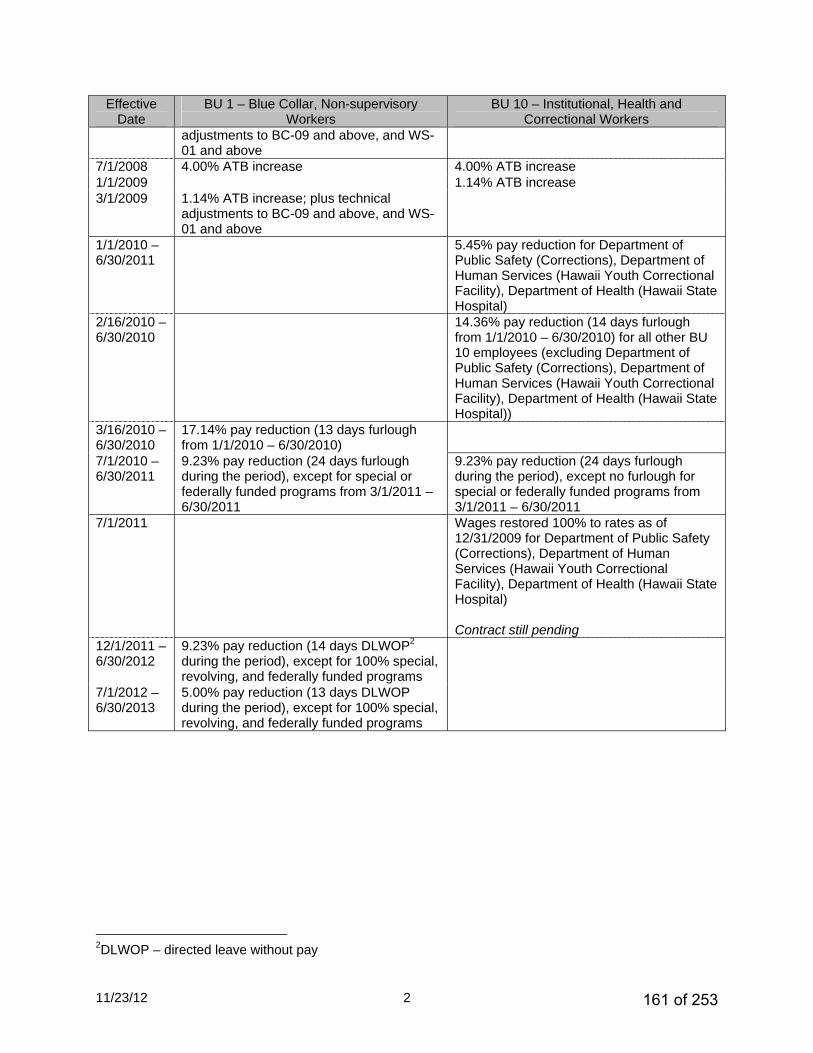
11/23/12 2
Effective Date
BU 1 – Blue Collar, Non-supervisory Workers
BU 10 – Institutional, Health and Correctional Workers
adjustments to BC-09 and above, and WS-01 and above
7/1/2008 4.00% ATB increase 4.00% ATB increase 1/1/2009 1.14% ATB increase 3/1/2009 1.14% ATB increase; plus technical
adjustments to BC-09 and above, and WS-01 and above
1/1/2010 – 6/30/2011
5.45% pay reduction for Department of Public Safety (Corrections), Department of Human Services (Hawaii Youth Correctional Facility), Department of Health (Hawaii State Hospital)
2/16/2010 – 6/30/2010
14.36% pay reduction (14 days furlough from 1/1/2010 – 6/30/2010) for all other BU 10 employees (excluding Department of Public Safety (Corrections), Department of Human Services (Hawaii Youth Correctional Facility), Department of Health (Hawaii State Hospital))
3/16/2010 – 6/30/2010
17.14% pay reduction (13 days furlough from 1/1/2010 – 6/30/2010)
7/1/2010 – 6/30/2011
9.23% pay reduction (24 days furlough during the period), except for special or federally funded programs from 3/1/2011 – 6/30/2011
9.23% pay reduction (24 days furlough during the period), except no furlough for special or federally funded programs from 3/1/2011 – 6/30/2011
7/1/2011 Wages restored 100% to rates as of 12/31/2009 for Department of Public Safety (Corrections), Department of Human Services (Hawaii Youth Correctional Facility), Department of Health (Hawaii State Hospital) Contract still pending
12/1/2011 – 6/30/2012
9.23% pay reduction (14 days DLWOP2 during the period), except for 100% special, revolving, and federally funded programs
7/1/2012 – 6/30/2013
5.00% pay reduction (13 days DLWOP during the period), except for 100% special, revolving, and federally funded programs
2DLWOP – directed leave without pay
161 of 253
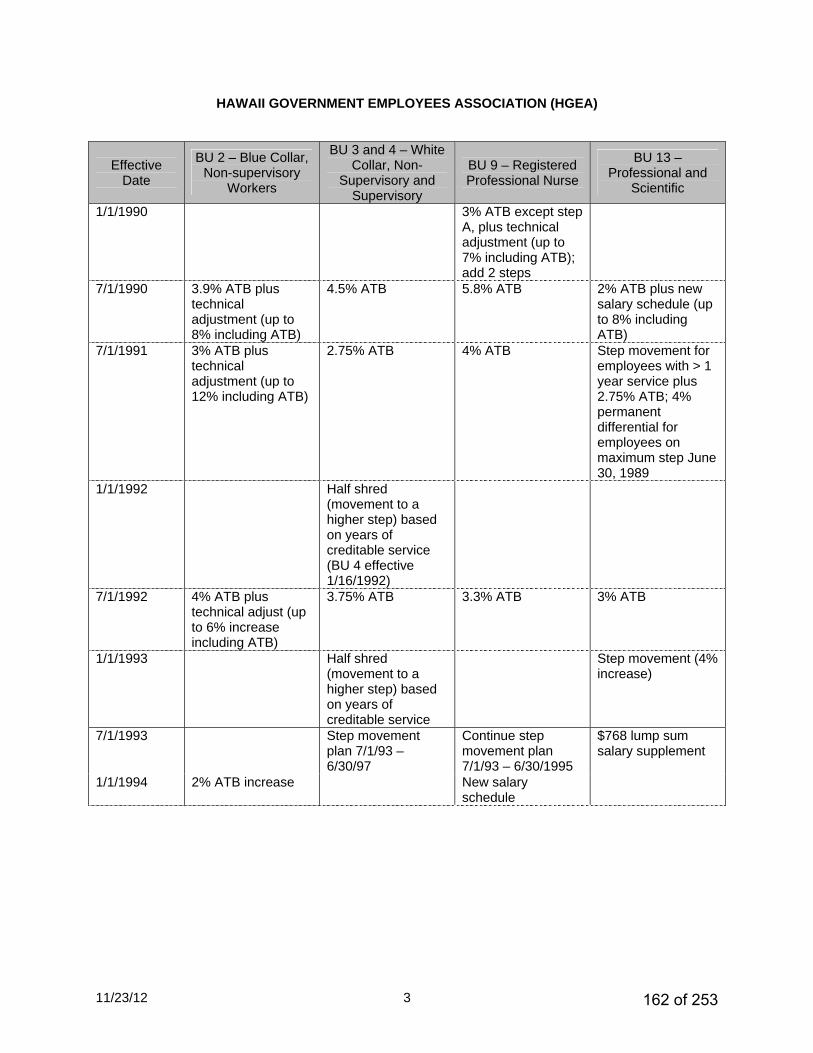
11/23/12 3
HAWAII GOVERNMENT EMPLOYEES ASSOCIATION (HGEA)
Effective Date
BU 2 – Blue Collar, Non-supervisory
Workers
BU 3 and 4 – White Collar, Non-
Supervisory and Supervisory
BU 9 – Registered Professional Nurse
BU 13 – Professional and
Scientific
1/1/1990 3% ATB except step A, plus technical adjustment (up to 7% including ATB); add 2 steps
7/1/1990 3.9% ATB plus technical adjustment (up to 8% including ATB)
4.5% ATB 5.8% ATB 2% ATB plus new salary schedule (up to 8% including ATB)
7/1/1991 3% ATB plus technical adjustment (up to 12% including ATB)
2.75% ATB 4% ATB Step movement for employees with > 1 year service plus 2.75% ATB; 4% permanent differential for employees on maximum step June 30, 1989
1/1/1992 Half shred (movement to a higher step) based on years of creditable service (BU 4 effective 1/16/1992)
7/1/1992 4% ATB plus technical adjust (up to 6% increase including ATB)
3.75% ATB 3.3% ATB 3% ATB
1/1/1993 Half shred (movement to a higher step) based on years of creditable service
Step movement (4% increase)
7/1/1993 Step movement plan 7/1/93 – 6/30/97
Continue step movement plan 7/1/93 – 6/30/1995
$768 lump sum salary supplement
1/1/1994 2% ATB increase New salary schedule
162 of 253
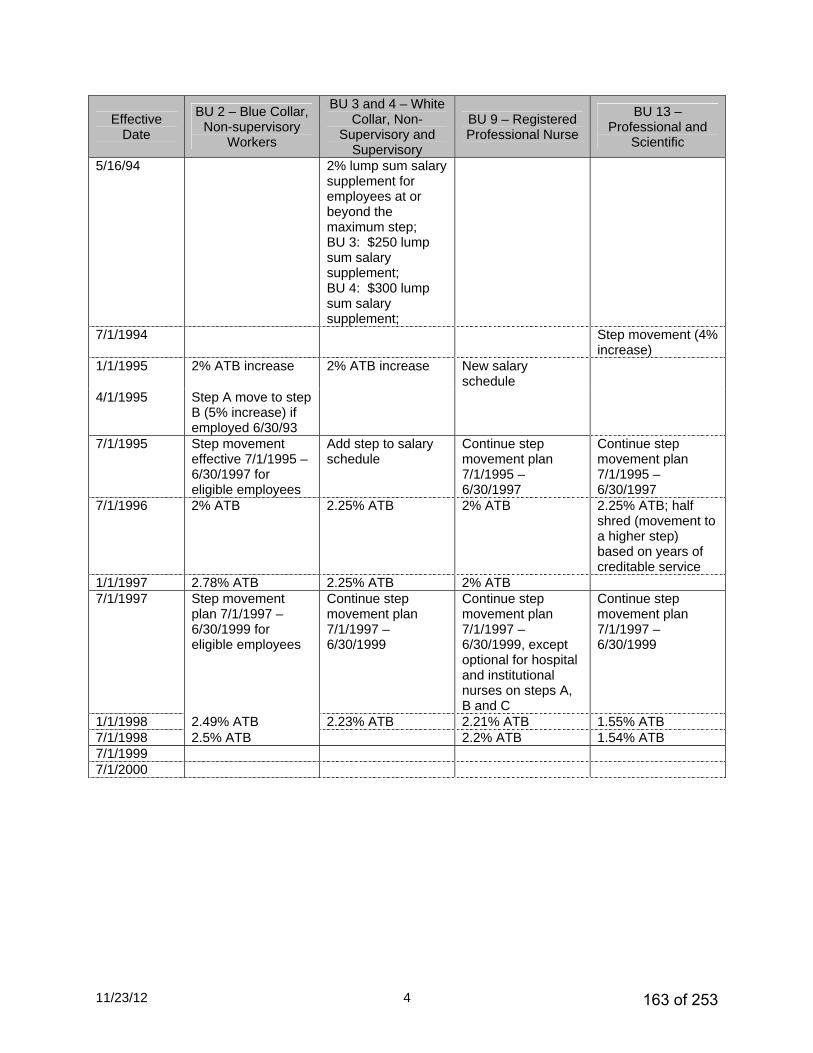
11/23/12 4
Effective Date
BU 2 – Blue Collar, Non-supervisory
Workers
BU 3 and 4 – White Collar, Non-
Supervisory and Supervisory
BU 9 – Registered Professional Nurse
BU 13 – Professional and
Scientific
5/16/94
2% lump sum salary supplement for employees at or beyond the maximum step; BU 3: $250 lump sum salary supplement; BU 4: $300 lump sum salary supplement;
7/1/1994 Step movement (4% increase)
1/1/1995 2% ATB increase 2% ATB increase New salary schedule
4/1/1995 Step A move to step B (5% increase) if employed 6/30/93
7/1/1995 Step movement effective 7/1/1995 – 6/30/1997 for eligible employees
Add step to salary schedule
Continue step movement plan 7/1/1995 – 6/30/1997
Continue step movement plan 7/1/1995 – 6/30/1997
7/1/1996 2% ATB 2.25% ATB 2% ATB 2.25% ATB; half shred (movement to a higher step) based on years of creditable service
1/1/1997 2.78% ATB 2.25% ATB 2% ATB 7/1/1997 Step movement
plan 7/1/1997 – 6/30/1999 for eligible employees
Continue step movement plan 7/1/1997 – 6/30/1999
Continue step movement plan 7/1/1997 – 6/30/1999, except optional for hospital and institutional nurses on steps A, B and C
Continue step movement plan 7/1/1997 – 6/30/1999
1/1/1998 2.49% ATB 2.23% ATB 2.21% ATB 1.55% ATB 7/1/1998 2.5% ATB 2.2% ATB 1.54% ATB 7/1/1999 7/1/2000
163 of 253
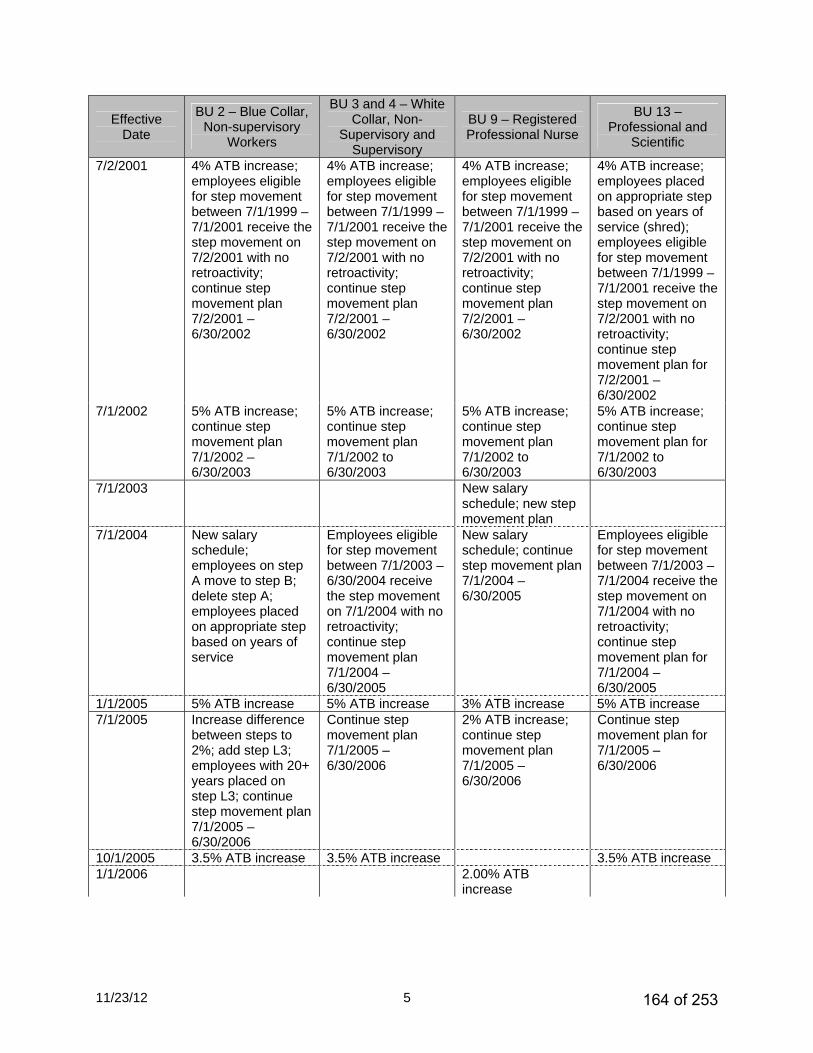
11/23/12 5
Effective Date
BU 2 – Blue Collar, Non-supervisory
Workers
BU 3 and 4 – White Collar, Non-
Supervisory and Supervisory
BU 9 – Registered Professional Nurse
BU 13 – Professional and
Scientific
7/2/2001 4% ATB increase; employees eligible for step movement between 7/1/1999 – 7/1/2001 receive the step movement on 7/2/2001 with no retroactivity; continue step movement plan 7/2/2001 – 6/30/2002
4% ATB increase; employees eligible for step movement between 7/1/1999 – 7/1/2001 receive the step movement on 7/2/2001 with no retroactivity; continue step movement plan 7/2/2001 – 6/30/2002
4% ATB increase; employees eligible for step movement between 7/1/1999 – 7/1/2001 receive the step movement on 7/2/2001 with no retroactivity; continue step movement plan 7/2/2001 – 6/30/2002
4% ATB increase; employees placed on appropriate step based on years of service (shred); employees eligible for step movement between 7/1/1999 – 7/1/2001 receive the step movement on 7/2/2001 with no retroactivity; continue step movement plan for 7/2/2001 – 6/30/2002
7/1/2002 5% ATB increase; continue step movement plan 7/1/2002 – 6/30/2003
5% ATB increase; continue step movement plan 7/1/2002 to 6/30/2003
5% ATB increase; continue step movement plan 7/1/2002 to 6/30/2003
5% ATB increase; continue step movement plan for 7/1/2002 to 6/30/2003
7/1/2003 New salary schedule; new step movement plan
7/1/2004 New salary schedule; employees on step A move to step B; delete step A; employees placed on appropriate step based on years of service
Employees eligible for step movement between 7/1/2003 – 6/30/2004 receive the step movement on 7/1/2004 with no retroactivity; continue step movement plan 7/1/2004 – 6/30/2005
New salary schedule; continue step movement plan 7/1/2004 – 6/30/2005
Employees eligible for step movement between 7/1/2003 – 7/1/2004 receive the step movement on 7/1/2004 with no retroactivity; continue step movement plan for 7/1/2004 – 6/30/2005
1/1/2005 5% ATB increase 5% ATB increase 3% ATB increase 5% ATB increase 7/1/2005 Increase difference
between steps to 2%; add step L3; employees with 20+ years placed on step L3; continue step movement plan 7/1/2005 – 6/30/2006
Continue step movement plan 7/1/2005 – 6/30/2006
2% ATB increase; continue step movement plan 7/1/2005 – 6/30/2006
Continue step movement plan for 7/1/2005 – 6/30/2006
10/1/2005 3.5% ATB increase 3.5% ATB increase 3.5% ATB increase 1/1/2006 2.00% ATB
increase
164 of 253
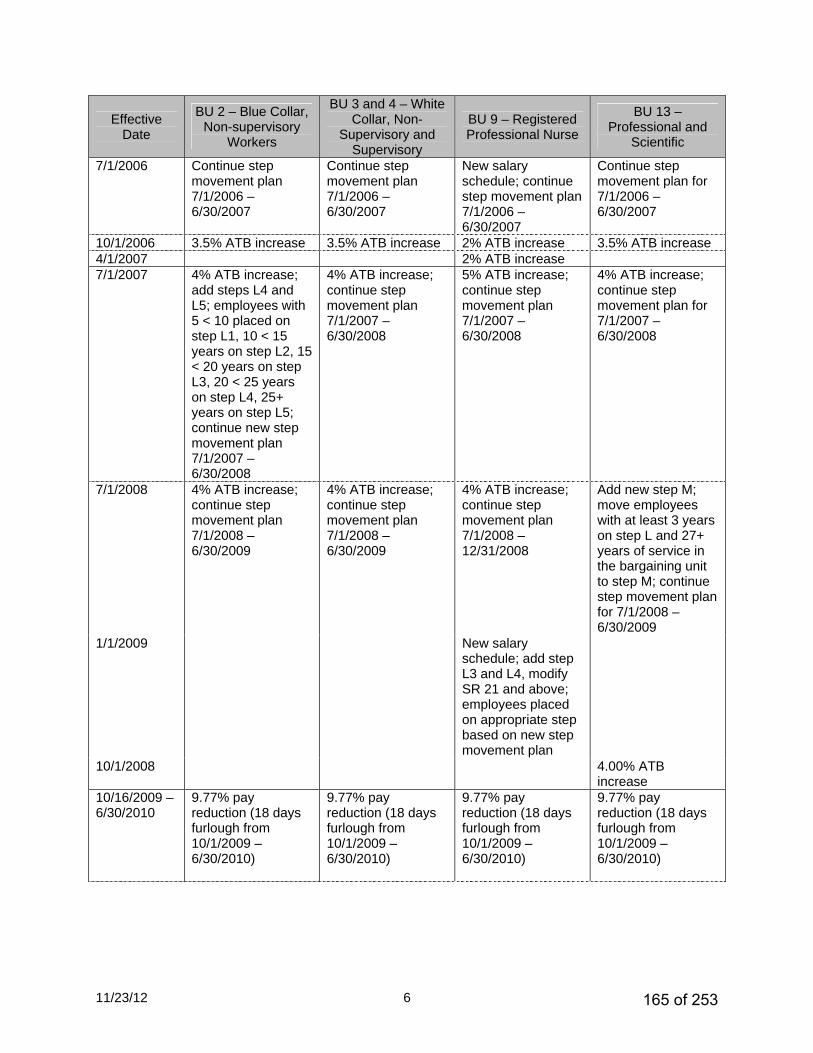
11/23/12 6
Effective Date
BU 2 – Blue Collar, Non-supervisory
Workers
BU 3 and 4 – White Collar, Non-
Supervisory and Supervisory
BU 9 – Registered Professional Nurse
BU 13 – Professional and
Scientific
7/1/2006 Continue step movement plan 7/1/2006 – 6/30/2007
Continue step movement plan 7/1/2006 – 6/30/2007
New salary schedule; continue step movement plan 7/1/2006 – 6/30/2007
Continue step movement plan for 7/1/2006 – 6/30/2007
10/1/2006 3.5% ATB increase 3.5% ATB increase 2% ATB increase 3.5% ATB increase 4/1/2007 2% ATB increase 7/1/2007 4% ATB increase;
add steps L4 and L5; employees with 5 < 10 placed on step L1, 10 < 15 years on step L2, 15 < 20 years on step L3, 20 < 25 years on step L4, 25+ years on step L5; continue new step movement plan 7/1/2007 – 6/30/2008
4% ATB increase; continue step movement plan 7/1/2007 – 6/30/2008
5% ATB increase; continue step movement plan 7/1/2007 –6/30/2008
4% ATB increase; continue step movement plan for 7/1/2007 –6/30/2008
7/1/2008 4% ATB increase; continue step movement plan 7/1/2008 – 6/30/2009
4% ATB increase; continue step movement plan 7/1/2008 –6/30/2009
4% ATB increase; continue step movement plan 7/1/2008 –12/31/2008
Add new step M; move employees with at least 3 years on step L and 27+ years of service in the bargaining unit to step M; continue step movement plan for 7/1/2008 – 6/30/2009
1/1/2009 New salary schedule; add step L3 and L4, modify SR 21 and above; employees placed on appropriate step based on new step movement plan
10/1/2008 4.00% ATB increase
10/16/2009 – 6/30/2010
9.77% pay reduction (18 days furlough from 10/1/2009 – 6/30/2010)
9.77% pay reduction (18 days furlough from 10/1/2009 – 6/30/2010)
9.77% pay reduction (18 days furlough from 10/1/2009 – 6/30/2010)
9.77% pay reduction (18 days furlough from 10/1/2009 – 6/30/2010)
165 of 253
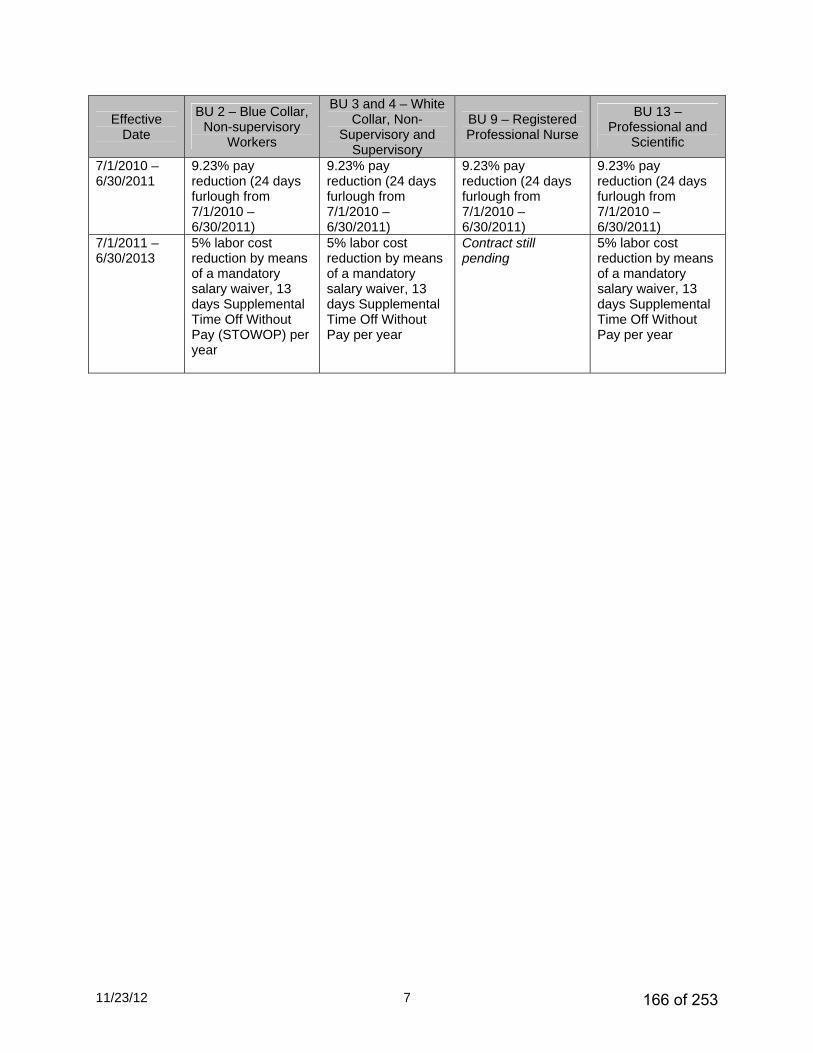
11/23/12 7
Effective Date
BU 2 – Blue Collar, Non-supervisory
Workers
BU 3 and 4 – White Collar, Non-
Supervisory and Supervisory
BU 9 – Registered Professional Nurse
BU 13 – Professional and
Scientific
7/1/2010 –6/30/2011
9.23% pay reduction (24 days furlough from 7/1/2010 – 6/30/2011)
9.23% pay reduction (24 days furlough from 7/1/2010 – 6/30/2011)
9.23% pay reduction (24 days furlough from 7/1/2010 – 6/30/2011)
9.23% pay reduction (24 days furlough from 7/1/2010 – 6/30/2011)
7/1/2011 – 6/30/2013
5% labor cost reduction by means of a mandatory salary waiver, 13 days Supplemental Time Off Without Pay (STOWOP) per year
5% labor cost reduction by means of a mandatory salary waiver, 13 days Supplemental Time Off Without Pay per year
Contract still pending
5% labor cost reduction by means of a mandatory salary waiver, 13 days Supplemental Time Off Without Pay per year
166 of 253
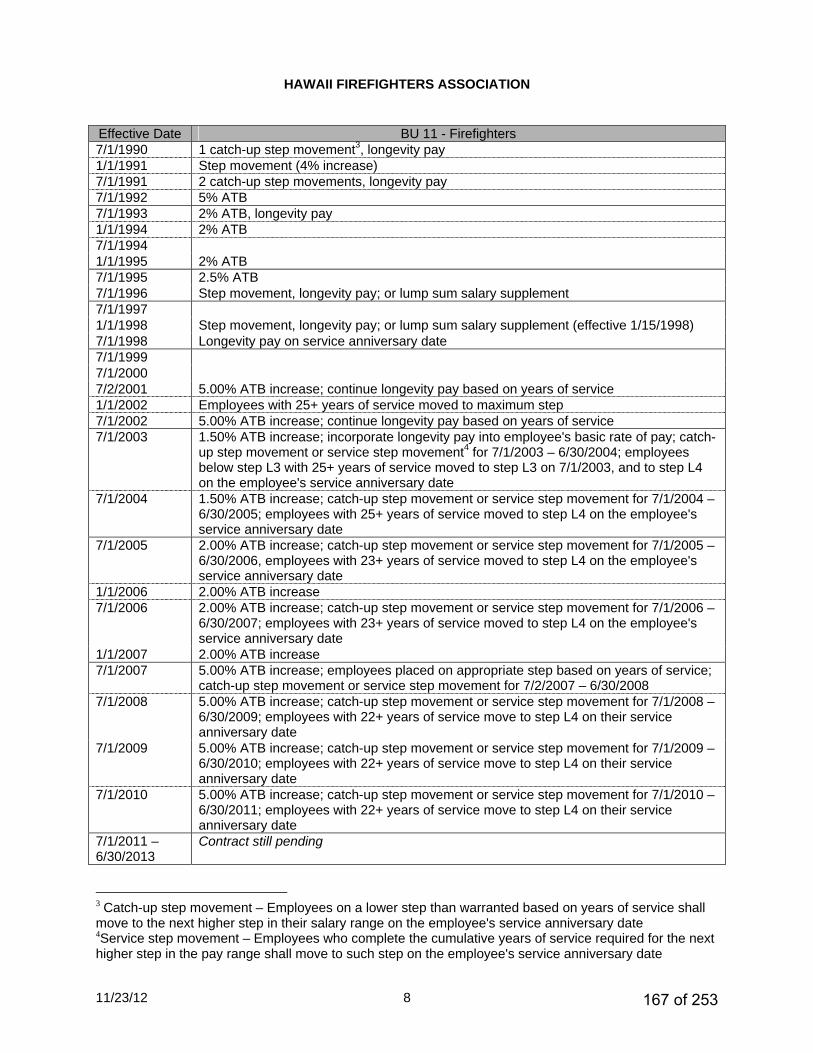
11/23/12 8
HAWAII FIREFIGHTERS ASSOCIATION
Effective Date BU 11 - Firefighters 7/1/1990 1 catch-up step movement3, longevity pay 1/1/1991 Step movement (4% increase) 7/1/1991 2 catch-up step movements, longevity pay 7/1/1992 5% ATB 7/1/1993 2% ATB, longevity pay 1/1/1994 2% ATB 7/1/1994 1/1/1995 2% ATB 7/1/1995 2.5% ATB 7/1/1996 Step movement, longevity pay; or lump sum salary supplement 7/1/1997 1/1/1998 Step movement, longevity pay; or lump sum salary supplement (effective 1/15/1998) 7/1/1998 Longevity pay on service anniversary date 7/1/1999 7/1/2000 7/2/2001 5.00% ATB increase; continue longevity pay based on years of service 1/1/2002 Employees with 25+ years of service moved to maximum step 7/1/2002 5.00% ATB increase; continue longevity pay based on years of service 7/1/2003 1.50% ATB increase; incorporate longevity pay into employee's basic rate of pay; catch-
up step movement or service step movement4 for 7/1/2003 – 6/30/2004; employees below step L3 with 25+ years of service moved to step L3 on 7/1/2003, and to step L4 on the employee's service anniversary date
7/1/2004 1.50% ATB increase; catch-up step movement or service step movement for 7/1/2004 – 6/30/2005; employees with 25+ years of service moved to step L4 on the employee's service anniversary date
7/1/2005 2.00% ATB increase; catch-up step movement or service step movement for 7/1/2005 – 6/30/2006, employees with 23+ years of service moved to step L4 on the employee's service anniversary date
1/1/2006 2.00% ATB increase 7/1/2006 2.00% ATB increase; catch-up step movement or service step movement for 7/1/2006 –
6/30/2007; employees with 23+ years of service moved to step L4 on the employee's service anniversary date
1/1/2007 2.00% ATB increase 7/1/2007 5.00% ATB increase; employees placed on appropriate step based on years of service;
catch-up step movement or service step movement for 7/2/2007 – 6/30/2008 7/1/2008 5.00% ATB increase; catch-up step movement or service step movement for 7/1/2008 –
6/30/2009; employees with 22+ years of service move to step L4 on their service anniversary date
7/1/2009 5.00% ATB increase; catch-up step movement or service step movement for 7/1/2009 – 6/30/2010; employees with 22+ years of service move to step L4 on their service anniversary date
7/1/2010 5.00% ATB increase; catch-up step movement or service step movement for 7/1/2010 – 6/30/2011; employees with 22+ years of service move to step L4 on their service anniversary date
7/1/2011 – 6/30/2013
Contract still pending
3 Catch-up step movement – Employees on a lower step than warranted based on years of service shall move to the next higher step in their salary range on the employee's service anniversary date 4Service step movement – Employees who complete the cumulative years of service required for the next higher step in the pay range shall move to such step on the employee's service anniversary date
167 of 253
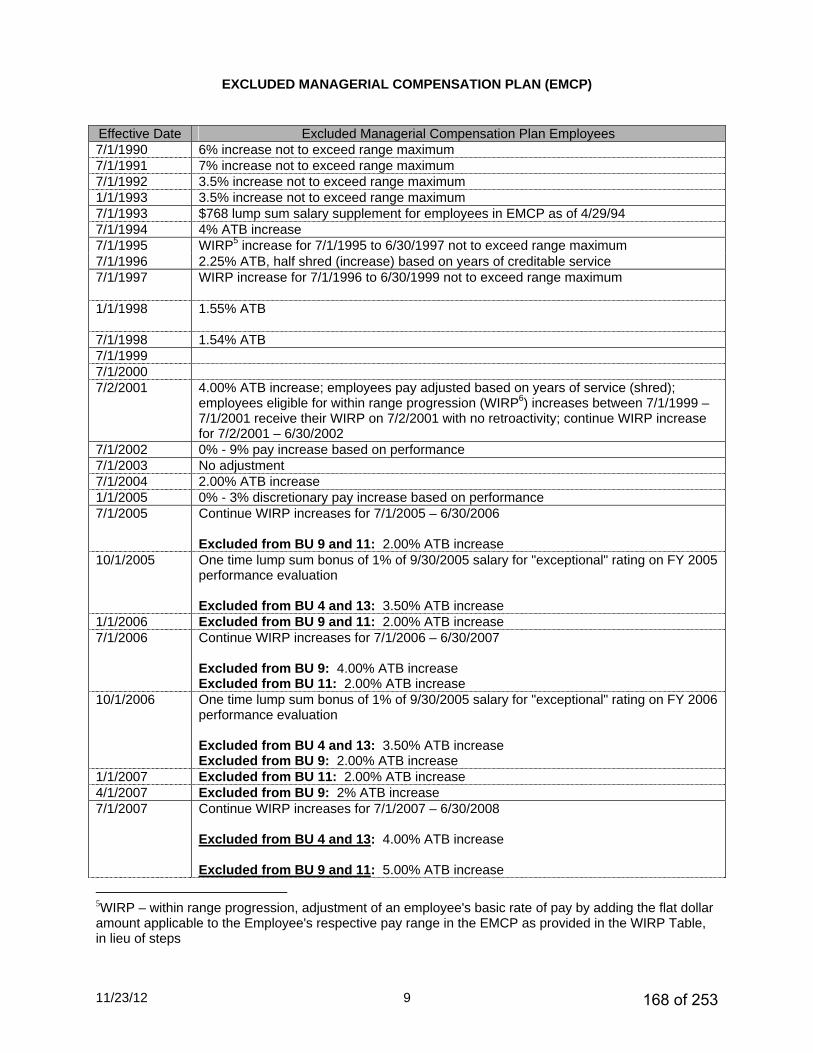
11/23/12 9
EXCLUDED MANAGERIAL COMPENSATION PLAN (EMCP)
Effective Date Excluded Managerial Compensation Plan Employees 7/1/1990 6% increase not to exceed range maximum 7/1/1991 7% increase not to exceed range maximum 7/1/1992 3.5% increase not to exceed range maximum 1/1/1993 3.5% increase not to exceed range maximum 7/1/1993 $768 lump sum salary supplement for employees in EMCP as of 4/29/94 7/1/1994 4% ATB increase 7/1/1995 WIRP5 increase for 7/1/1995 to 6/30/1997 not to exceed range maximum 7/1/1996 2.25% ATB, half shred (increase) based on years of creditable service 7/1/1997
WIRP increase for 7/1/1996 to 6/30/1999 not to exceed range maximum
1/1/1998
1.55% ATB
7/1/1998 1.54% ATB 7/1/1999 7/1/2000 7/2/2001 4.00% ATB increase; employees pay adjusted based on years of service (shred);
employees eligible for within range progression (WIRP6) increases between 7/1/1999 – 7/1/2001 receive their WIRP on 7/2/2001 with no retroactivity; continue WIRP increase for 7/2/2001 – 6/30/2002
7/1/2002 0% - 9% pay increase based on performance 7/1/2003 No adjustment 7/1/2004 2.00% ATB increase 1/1/2005 0% - 3% discretionary pay increase based on performance 7/1/2005 Continue WIRP increases for 7/1/2005 – 6/30/2006
Excluded from BU 9 and 11: 2.00% ATB increase
10/1/2005 One time lump sum bonus of 1% of 9/30/2005 salary for "exceptional" rating on FY 2005 performance evaluation Excluded from BU 4 and 13: 3.50% ATB increase
1/1/2006 Excluded from BU 9 and 11: 2.00% ATB increase 7/1/2006 Continue WIRP increases for 7/1/2006 – 6/30/2007
Excluded from BU 9: 4.00% ATB increase Excluded from BU 11: 2.00% ATB increase
10/1/2006 One time lump sum bonus of 1% of 9/30/2005 salary for "exceptional" rating on FY 2006 performance evaluation Excluded from BU 4 and 13: 3.50% ATB increase Excluded from BU 9: 2.00% ATB increase
1/1/2007 Excluded from BU 11: 2.00% ATB increase 4/1/2007 Excluded from BU 9: 2% ATB increase 7/1/2007 Continue WIRP increases for 7/1/2007 – 6/30/2008
Excluded from BU 4 and 13: 4.00% ATB increase Excluded from BU 9 and 11: 5.00% ATB increase
5WIRP – within range progression, adjustment of an employee's basic rate of pay by adding the flat dollar amount applicable to the Employee's respective pay range in the EMCP as provided in the WIRP Table, in lieu of steps
168 of 253
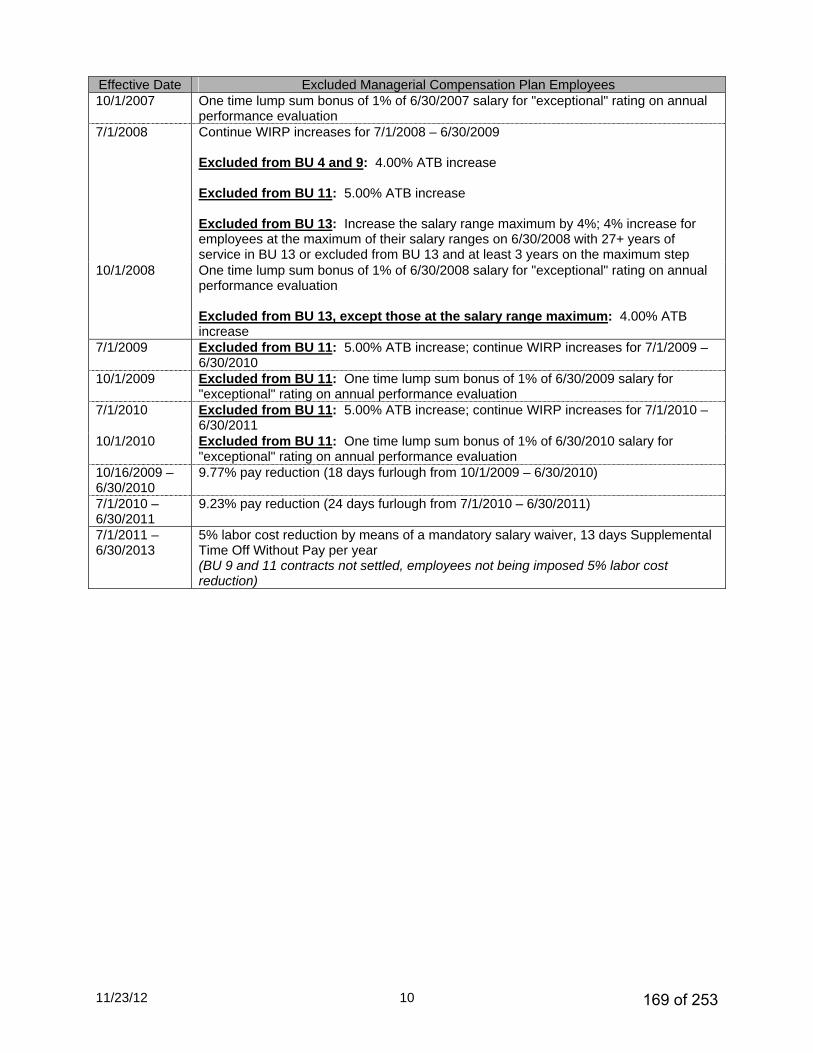
11/23/12 10
Effective Date Excluded Managerial Compensation Plan Employees 10/1/2007 One time lump sum bonus of 1% of 6/30/2007 salary for "exceptional" rating on annual
performance evaluation 7/1/2008 Continue WIRP increases for 7/1/2008 – 6/30/2009
Excluded from BU 4 and 9: 4.00% ATB increase Excluded from BU 11: 5.00% ATB increase Excluded from BU 13: Increase the salary range maximum by 4%; 4% increase for employees at the maximum of their salary ranges on 6/30/2008 with 27+ years of service in BU 13 or excluded from BU 13 and at least 3 years on the maximum step
10/1/2008 One time lump sum bonus of 1% of 6/30/2008 salary for "exceptional" rating on annual performance evaluation Excluded from BU 13, except those at the salary range maximum: 4.00% ATB increase
7/1/2009 Excluded from BU 11: 5.00% ATB increase; continue WIRP increases for 7/1/2009 – 6/30/2010
10/1/2009 Excluded from BU 11: One time lump sum bonus of 1% of 6/30/2009 salary for "exceptional" rating on annual performance evaluation
7/1/2010 Excluded from BU 11: 5.00% ATB increase; continue WIRP increases for 7/1/2010 – 6/30/2011
10/1/2010 Excluded from BU 11: One time lump sum bonus of 1% of 6/30/2010 salary for "exceptional" rating on annual performance evaluation
10/16/2009 – 6/30/2010
9.77% pay reduction (18 days furlough from 10/1/2009 – 6/30/2010)
7/1/2010 –6/30/2011
9.23% pay reduction (24 days furlough from 7/1/2010 – 6/30/2011)
7/1/2011 – 6/30/2013
5% labor cost reduction by means of a mandatory salary waiver, 13 days Supplemental Time Off Without Pay per year (BU 9 and 11 contracts not settled, employees not being imposed 5% labor cost reduction)
169 of 253
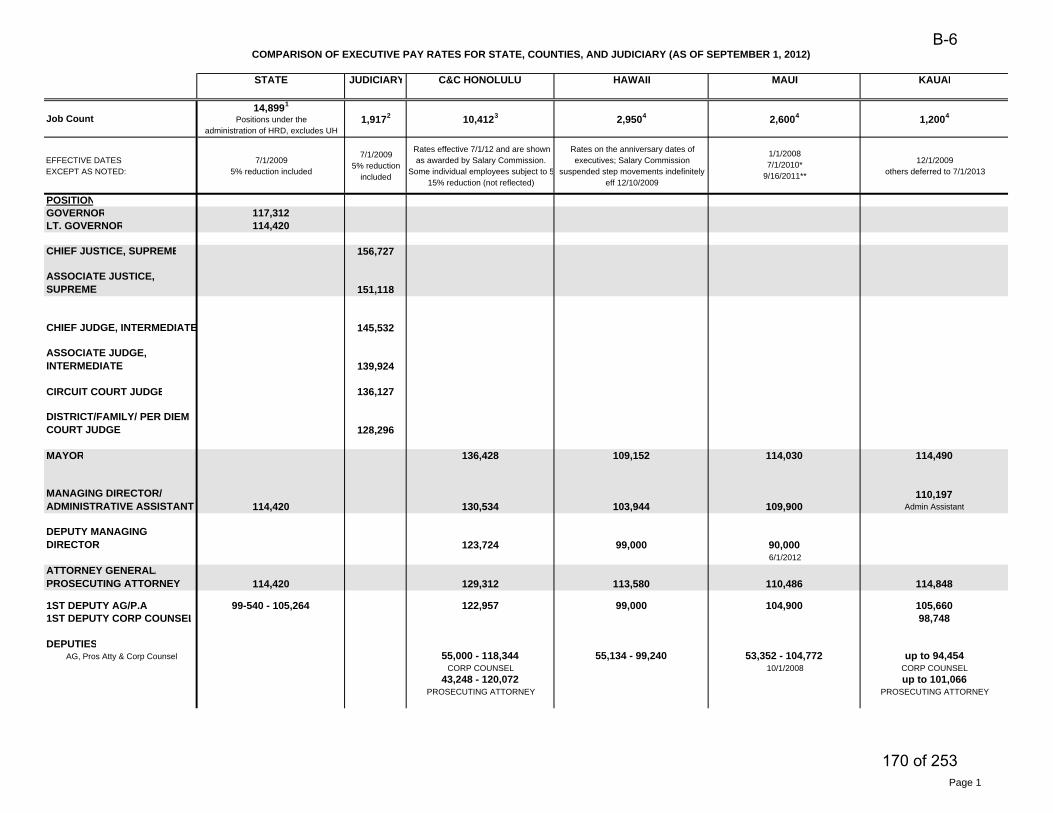
STATE JUDICIARY C&C HONOLULU HAWAII KAUAI
14,8991
Positions under the administration of HRD, excludes UH
EFFECTIVE DATES EXCEPT AS NOTED:
7/1/20095% reduction included
7/1/20095% reduction
included
Rates effective 7/1/12 and are shown as awarded by Salary Commission.
Some individual employees subject to 515% reduction (not reflected)
Rates on the anniversary dates of executives; Salary Commission
suspended step movements indefinitely eff 12/10/2009
12/1/2009others deferred to 7/1/2013
POSITIONGOVERNOR 117,312LT. GOVERNOR 114,420
CHIEF JUSTICE, SUPREME 156,727
ASSOCIATE JUSTICE, SUPREME 151,118
CHIEF JUDGE, INTERMEDIATE 145,532
ASSOCIATE JUDGE, INTERMEDIATE 139,924
CIRCUIT COURT JUDGE 136,127
DISTRICT/FAMILY/ PER DIEM COURT JUDGE 128,296
MAYOR 136,428 109,152 114,490
MANAGING DIRECTOR/ADMINISTRATIVE ASSISTANT 114,420 130,534 103,944
110,197Admin Assistant
DEPUTY MANAGING DIRECTOR 123,724 99,000
ATTORNEY GENERAL/PROSECUTING ATTORNEY 114,420 129,312 113,580 114,848
1ST DEPUTY AG/P.A. 99-540 - 105,264 122,957 99,000 105,6601ST DEPUTY CORP COUNSEL 98,748
DEPUTIESAG, Pros Atty & Corp Counsel 55,000 - 118,344 55,134 - 99,240 up to 94,454
CORP COUNSEL CORP COUNSEL43,248 - 120,072 up to 101,066
PROSECUTING ATTORNEY PROSECUTING ATTORNEY
COMPARISON OF EXECUTIVE PAY RATES FOR STATE, COUNTIES, AND JUDICIARY (AS OF SEPTEMBER 1, 2012)
Job Count 10,4123 2,9504 2,6004 1,2004
MAUI
1/1/20087/1/2010*
9/16/2011**
90,0006/1/2012
1,9172
10/1/200853,352 - 104,772
109,900
110,486
104,900
114,030
Page 1
B-6
170 of 253
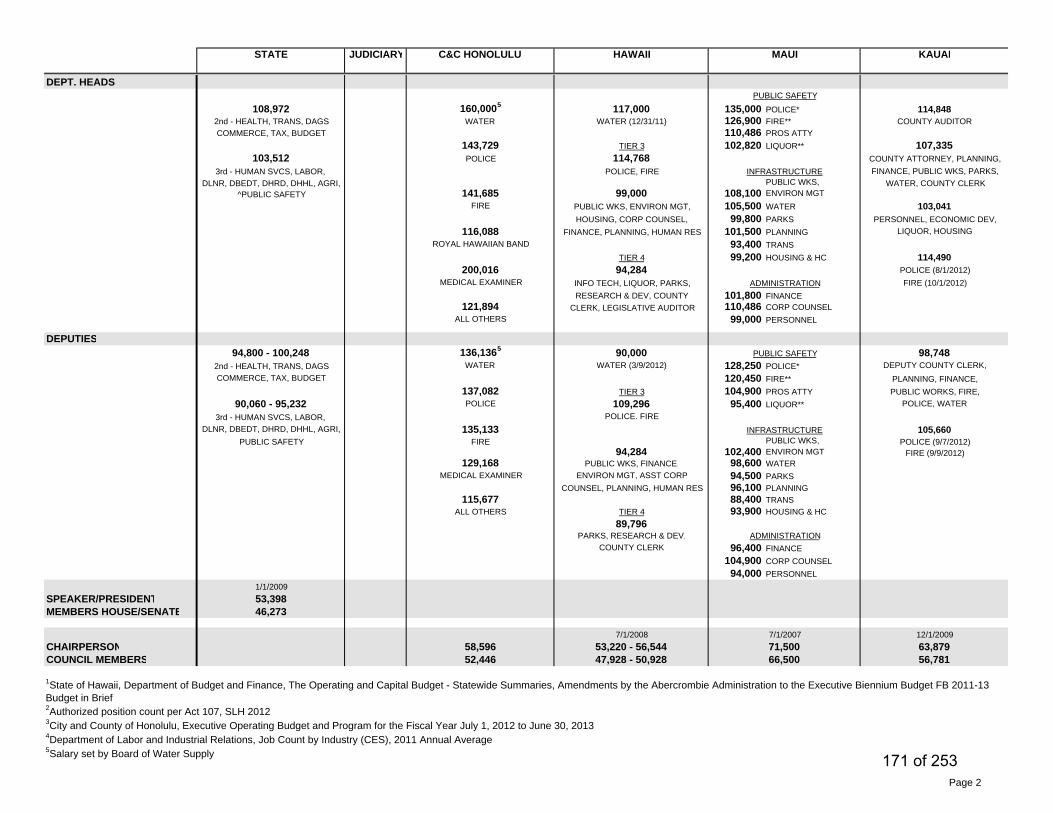
STATE JUDICIARY C&C HONOLULU HAWAII KAUAIMAUI
DEPT. HEADS
108,972 160,0005 117,000 135,000 POLICE* 114,8482nd - HEALTH, TRANS, DAGS WATER WATER (12/31/11) 126,900 FIRE** COUNTY AUDITORCOMMERCE, TAX, BUDGET 110,486 PROS ATTY
143,729 TIER 3 102,820 LIQUOR** 107,335103,512 POLICE 114,768 COUNTY ATTORNEY, PLANNING,
3rd - HUMAN SVCS, LABOR, POLICE, FIRE FINANCE, PUBLIC WKS, PARKS,DLNR, DBEDT, DHRD, DHHL, AGRI,
^PUBLIC SAFETY 141,685 99,000 108,100PUBLIC WKS,ENVIRON MGT
WATER, COUNTY CLERK
FIRE PUBLIC WKS, ENVIRON MGT, 105,500 WATER 103,041HOUSING, CORP COUNSEL, 99,800 PARKS PERSONNEL, ECONOMIC DEV,
116,088 FINANCE, PLANNING, HUMAN RES 101,500 PLANNING LIQUOR, HOUSINGROYAL HAWAIIAN BAND 93,400 TRANS
TIER 4 99,200 HOUSING & HC 114,490200,016 94,284 POLICE (8/1/2012)
MEDICAL EXAMINER INFO TECH, LIQUOR, PARKS, FIRE (10/1/2012)RESEARCH & DEV, COUNTY 101,800 FINANCE
121,894 CLERK, LEGISLATIVE AUDITOR 110,486 CORP COUNSELALL OTHERS 99,000 PERSONNEL
DEPUTIES94,800 - 100,248 136,1365 90,000 98,748
2nd - HEALTH, TRANS, DAGS WATER WATER (3/9/2012) 128,250 POLICE* DEPUTY COUNTY CLERK, COMMERCE, TAX, BUDGET 120,450 FIRE** PLANNING, FINANCE,
137,082 TIER 3 104,900 PROS ATTY PUBLIC WORKS, FIRE,90,060 - 95,232 POLICE 109,296 95,400 LIQUOR** POLICE, WATER
3rd - HUMAN SVCS, LABOR, POLICE. FIREDLNR, DBEDT, DHRD, DHHL, AGRI, 135,133 105,660
PUBLIC SAFETY FIRE94,284 102,400
PUBLIC WKS,ENVIRON MGT
POLICE (9/7/2012)FIRE (9/9/2012)
129,168 PUBLIC WKS, FINANCE, 98,600 WATERMEDICAL EXAMINER ENVIRON MGT, ASST CORP 94,500 PARKS
COUNSEL, PLANNING, HUMAN RES 96,100 PLANNING115,677 88,400 TRANS
ALL OTHERS TIER 4 93,900 HOUSING & HC89,796
PARKS, RESEARCH & DEV,COUNTY CLERK 96,400 FINANCE
104,900 CORP COUNSEL94,000 PERSONNEL
1/1/2009SPEAKER/PRESIDENT 53,398MEMBERS HOUSE/SENATE 46,273
7/1/2008 12/1/2009CHAIRPERSON 58,596 53,220 - 56,544 63,879COUNCIL MEMBERS 52,446 47,928 - 50,928 56,781
2Authorized position count per Act 107, SLH 20123City and County of Honolulu, Executive Operating Budget and Program for the Fiscal Year July 1, 2012 to June 30, 20134Department of Labor and Industrial Relations, Job Count by Industry (CES), 2011 Annual Average5Salary set by Board of Water Supply
1State of Hawaii, Department of Budget and Finance, The Operating and Capital Budget - Statewide Summaries, Amendments by the Abercrombie Administration to the Executive Biennium Budget FB 2011-13 Budget in Brief
71,50066,500
PUBLIC SAFETY
ADMINISTRATION
INFRASTRUCTURE
7/1/2007
PUBLIC SAFETY
ADMINISTRATION
INFRASTRUCTURE
Page 2
171 of 253
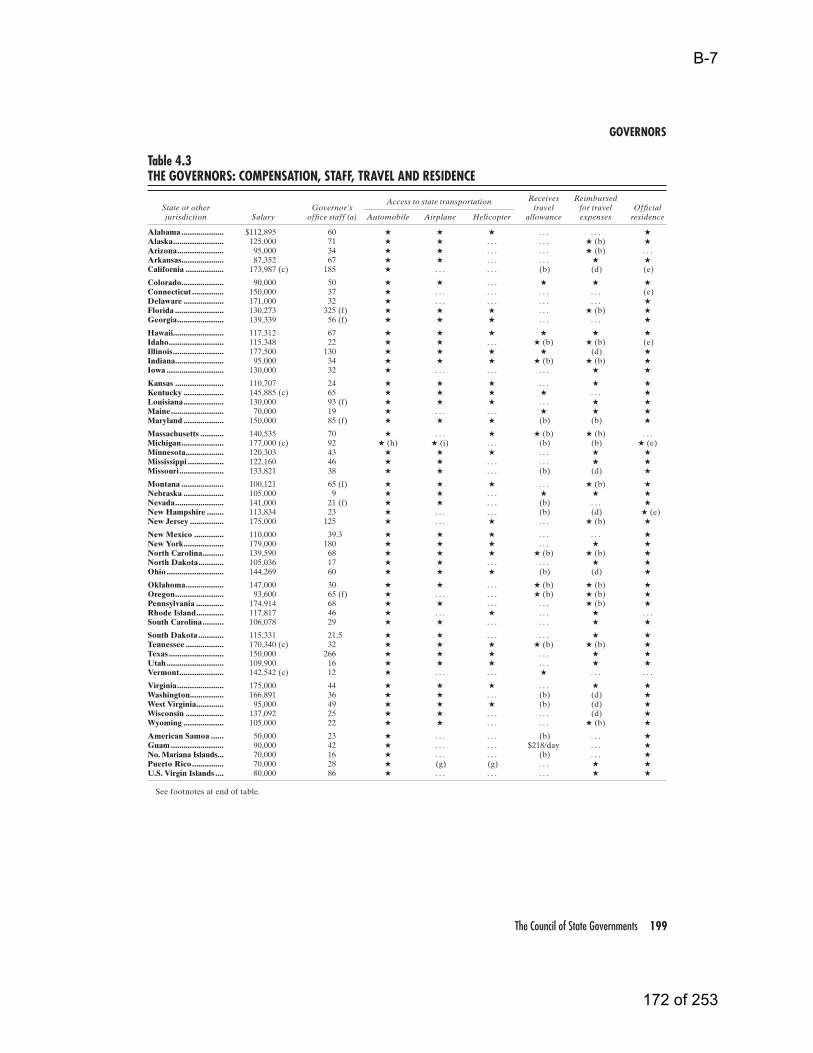
GOVERNORS
The Council of State Governments 199
Table 4.3THE GOVERNORS: COMPENSATION, STAFF, TRAVEL AND RESIDENCE
See footnotes at end of table.
Receives ReimbursedState or other Governor’s travel for travel Officialjurisdiction Salary office staff (a) Automobile Airplane Helicopter allowance expenses residence
Access to state transportation
Alabama .................... $112,895 60 . . . . . .Alaska........................ 125,000 71 . . . . . . (b)Arizona...................... 95,000 34 . . . . . . (b) . . .Arkansas.................... 87,352 67 . . . . . .California .................. 173,987 (c) 185 . . . . . . (b) (d) (e)
Colorado.................... 90,000 50 . . .Connecticut ............... 150,000 37 . . . . . . . . . . . . (e)Delaware ................... 171,000 32 . . . . . . . . . . . .Florida ....................... 130,273 325 (f) . . . (b)Georgia...................... 139,339 56 (f) . . . . . .
Hawaii........................ 117,312 67Idaho.......................... 115,348 22 . . . (b) (b) (e)Illinois........................ 177,500 130 (d)Indiana....................... 95,000 34 (b) (b)Iowa ........................... 130,000 32 . . . . . . . . .
Kansas ....................... 110,707 24 . . .Kentucky ................... 145,885 (c) 65 . . .Louisiana................... 130,000 93 (f) . . .Maine......................... 70,000 19 . . . . . .Maryland ................... 150,000 85 (f) (b) (b)
Massachusetts ........... 140,535 70 . . . (b) (b) . . .Michigan.................... 177,000 (c) 92 (h) (i) . . . (b) (b) (e)Minnesota.................. 120,303 43 . . .Mississippi ................. 122,160 46 . . . . . .Missouri..................... 133,821 38 . . . (b) (d)
Montana .................... 100,121 65 (f) . . . (b)Nebraska ................... 105,000 9 . . .Nevada....................... 141,000 21 (f) . . . (b) . . .New Hampshire ........ 113,834 23 . . . . . . (b) (d) (e)New Jersey ................ 175,000 125 . . . . . . (b)
New Mexico .............. 110,000 39.3 . . . . . .New York................... 179,000 180 . . .North Carolina.......... 139,590 68 (b) (b)North Dakota............ 105,036 17 . . . . . .Ohio ........................... 144,269 60 (b) (d)
Oklahoma.................. 147,000 30 . . . (b) (b)Oregon....................... 93,600 65 (f) . . . . . . (b) (b)Pennsylvania ............. 174,914 68 . . . . . . (b)Rhode Island............. 117,817 46 . . . . . . . . .South Carolina.......... 106,078 29 . . . . . .
South Dakota ............ 115,331 21.5 . . . . . .Tennessee .................. 170,340 (c) 32 (b) (b)Texas .......................... 150,000 266 . . .Utah........................... 109,900 16 . . .Vermont..................... 142,542 (c) 12 . . . . . . . . . . . .
Virginia...................... 175,000 44 . . .Washington................ 166,891 36 . . . (b) (d)West Virginia............. 95,000 49 (b) (d)Wisconsin .................. 137,092 25 . . . . . . (d)Wyoming ................... 105,000 22 . . . . . . (b)
American Samoa ...... 50,000 23 . . . . . . (b) . . .Guam ......................... 90,000 42 . . . . . . $218/day . . . No. Mariana Islands... 70,000 16 . . . . . . (b) . . . Puerto Rico............... 70,000 28 (g) (g) . . .U.S. Virgin Islands .... 80,000 86 . . . . . . . . .
B-7
172 of 253
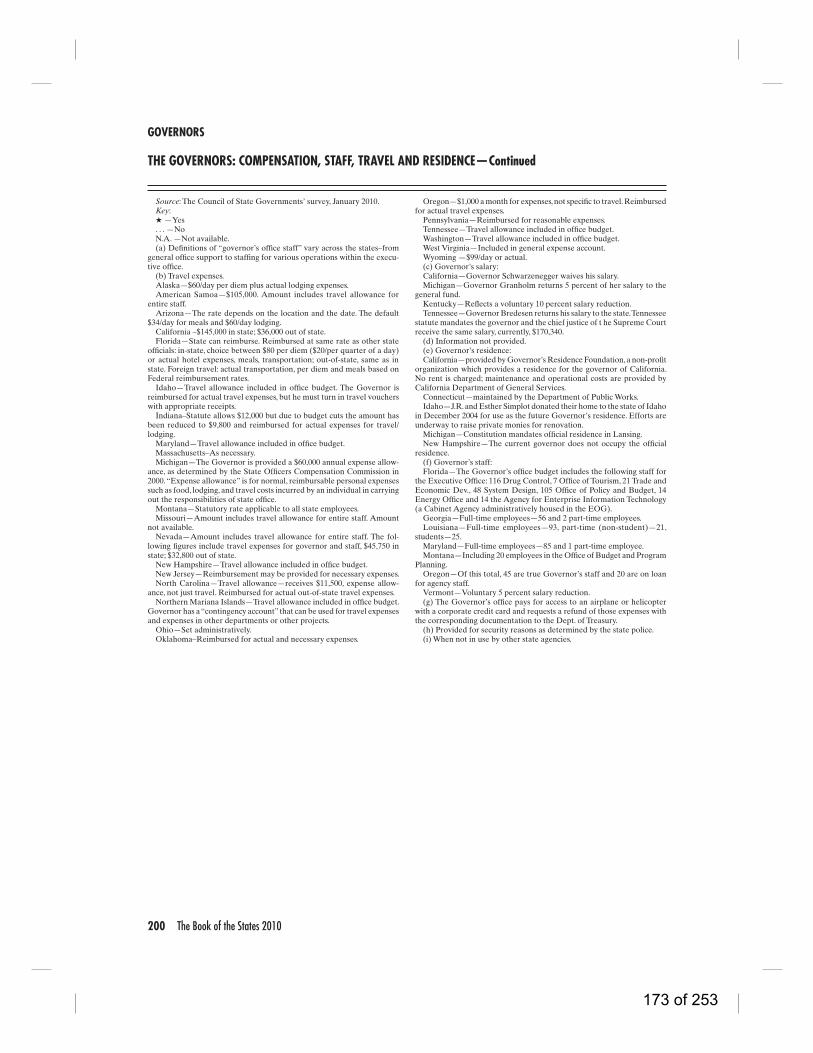
GOVERNORS
200 The Book of the States 2010
THE GOVERNORS: COMPENSATION, STAFF, TRAVEL AND RESIDENCE—Continued
Source: The Council of State Governments’ survey, January 2010. Key:
—Yes. . . —NoN.A. —Not available.(a) Definitions of “governor’s office staff” vary across the states–from
general office support to staffing for various operations within the execu-tive office.
(b) Travel expenses. Alaska—$60/day per diem plus actual lodging expenses. American Samoa—$105,000. Amount includes travel allowance for
entire staff. Arizona—The rate depends on the location and the date. The default
$34/day for meals and $60/day lodging.California –$145,000 in state; $36,000 out of state. Florida—State can reimburse. Reimbursed at same rate as other state
officials: in-state, choice between $80 per diem ($20/per quarter of a day) or actual hotel expenses, meals, transportation; out-of-state, same as in state. Foreign travel: actual transportation, per diem and meals based on Federal reimbursement rates.
Idaho—Travel allowance included in office budget. The Governor is reimbursed for actual travel expenses, but he must turn in travel vouchers with appropriate receipts.
Indiana–Statute allows $12,000 but due to budget cuts the amount has been reduced to $9,800 and reimbursed for actual expenses for travel/lodging.
Maryland—Travel allowance included in office budget. Massachusetts–As necessary. Michigan—The Governor is provided a $60,000 annual expense allow-
ance, as determined by the State Officers Compensation Commission in 2000. “Expense allowance” is for normal, reimbursable personal expenses such as food, lodging, and travel costs incurred by an individual in carrying out the responsibilities of state office.
Montana—Statutory rate applicable to all state employees.Missouri—Amount includes travel allowance for entire staff. Amount
not available. Nevada—Amount includes travel allowance for entire staff. The fol-
lowing figures include travel expenses for governor and staff, $45,750 in state; $32,800 out of state.
New Hampshire—Travel allowance included in office budget. New Jersey—Reimbursement may be provided for necessary expenses. North Carolina—Travel allowance—receives $11,500, expense allow-
ance, not just travel. Reimbursed for actual out-of-state travel expenses.Northern Mariana Islands—Travel allowance included in office budget.
Governor has a “contingency account” that can be used for travel expenses and expenses in other departments or other projects.
Ohio—Set administratively. Oklahoma–Reimbursed for actual and necessary expenses.
Oregon—$1,000 a month for expenses, not specific to travel. Reimbursed for actual travel expenses.
Pennsylvania—Reimbursed for reasonable expenses. Tennessee—Travel allowance included in office budget. Washington—Travel allowance included in office budget. West Virginia—Included in general expense account.Wyoming —$99/day or actual. (c) Governor’s salary: California—Governor Schwarzenegger waives his salary.Michigan—Governor Granholm returns 5 percent of her salary to the
general fund. Kentucky—Reflects a voluntary 10 percent salary reduction. Tennessee—Governor Bredesen returns his salary to the state. Tennessee
statute mandates the governor and the chief justice of t he Supreme Court receive the same salary, currently, $170,340.
(d) Information not provided.(e) Governor’s residence:California—provided by Governor’s Residence Foundation, a non-profit
organization which provides a residence for the governor of California. No rent is charged; maintenance and operational costs are provided by California Department of General Services.
Connecticut—maintained by the Department of Public Works.Idaho—J.R. and Esther Simplot donated their home to the state of Idaho
in December 2004 for use as the future Governor’s residence. Efforts are underway to raise private monies for renovation.
Michigan—Constitution mandates official residence in Lansing.New Hampshire—The current governor does not occupy the official
residence.(f) Governor’s staff:Florida—The Governor’s office budget includes the following staff for
the Executive Office: 116 Drug Control, 7 Office of Tourism, 21 Trade and Economic Dev., 48 System Design, 105 Office of Policy and Budget, 14 Energy Office and 14 the Agency for Enterprise Information Technology (a Cabinet Agency administratively housed in the EOG).
Georgia—Full-time employees—56 and 2 part-time employees.Louisiana—Full-time employees—93, part-time (non-student)—21,
students—25. Maryland—Full-time employees—85 and 1 part-time employee.Montana—Including 20 employees in the Office of Budget and Program
Planning.Oregon—Of this total, 45 are true Governor’s staff and 20 are on loan
for agency staff.Vermont—Voluntary 5 percent salary reduction. (g) The Governor’s office pays for access to an airplane or helicopter
with a corporate credit card and requests a refund of those expenses with the corresponding documentation to the Dept. of Treasury.
(h) Provided for security reasons as determined by the state police.(i) When not in use by other state agencies.
173 of 253
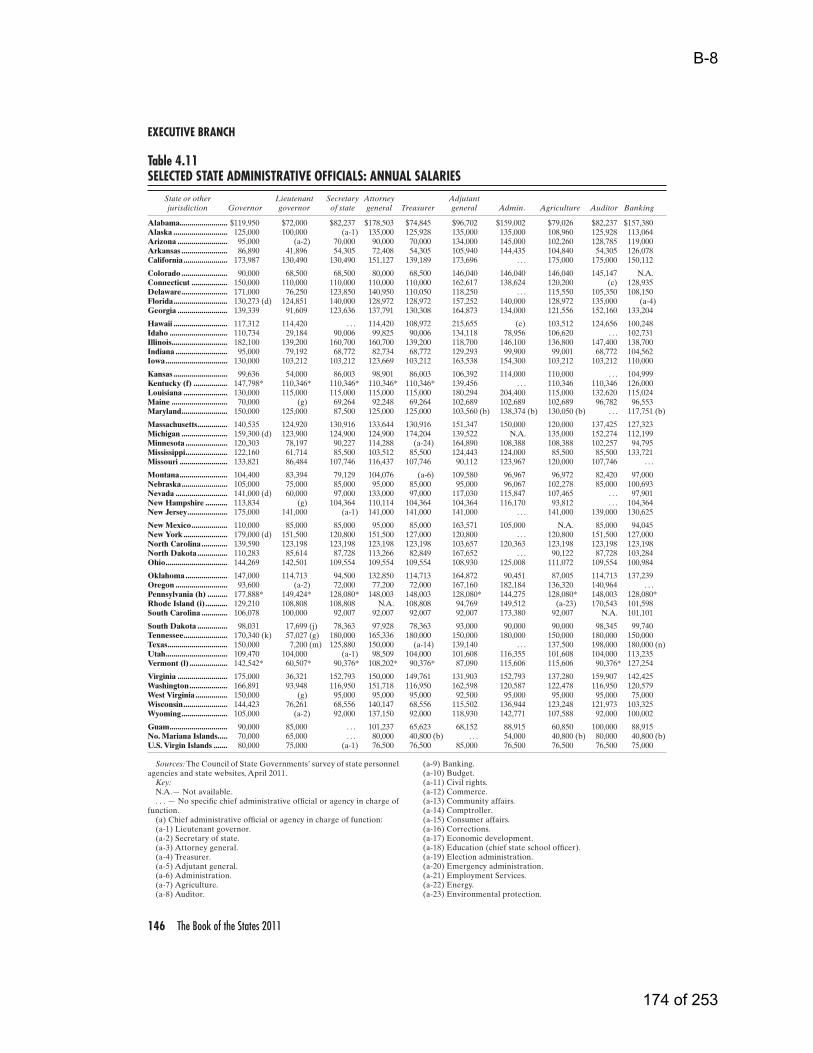
EXECUTIVE BRANCH
146 The Book of the States 2011
Table 4.11SELECTED STATE ADMINISTRATIVE OFFICIALS: ANNUAL SALARIES
Sources: The Council of State Governments’ survey of state personnel agencies and state websites, April 2011.
Key:N.A.— Not available.. . . — No specific chief administrative official or agency in charge of
function.(a) Chief administrative official or agency in charge of function:(a-1) Lieutenant governor.(a-2) Secretary of state.(a-3) Attorney general.(a-4) Treasurer.(a-5) Adjutant general.(a-6) Administration.(a-7) Agriculture.(a-8) Auditor.
(a-9) Banking.(a-10) Budget.(a-11) Civil rights.(a-12) Commerce.(a-13) Community affairs.(a-14) Comptroller.(a-15) Consumer affairs.(a-16) Corrections.(a-17) Economic development.(a-18) Education (chief state school officer).(a-19) Election administration.(a-20) Emergency administration.(a-21) Employment Services.(a-22) Energy.(a-23) Environmental protection.
Alabama........................ $119,950 $72,000 $82,237 $178,503 $74,845 $96,702 $159,002 $79,026 $82,237 $157,380Alaska ........................... 125,000 100,000 (a-1) 135,000 125,928 135,000 135,000 108,960 125,928 113,064Arizona ......................... 95,000 (a-2) 70,000 90,000 70,000 134,000 145,000 102,260 128,785 119,000Arkansas ....................... 86,890 41,896 54,305 72,408 54,305 105,940 144,435 104,840 54,305 126,078California ...................... 173,987 130,490 130,490 151,127 139,189 173,696 . . . 175,000 175,000 150,112
Colorado ....................... 90,000 68,500 68,500 80,000 68,500 146,040 146,040 146,040 145,147 N.A.Connecticut .................. 150,000 110,000 110,000 110,000 110,000 162,617 138,624 120,200 (c) 128,935Delaware ....................... 171,000 76,250 123,850 140,950 110,050 118,250 . . . 115,550 105,350 108,150Florida ........................... 130,273 (d) 124,851 140,000 128,972 128,972 157,252 140,000 128,972 135,000 (a-4)Georgia ......................... 139,339 91,609 123,636 137,791 130,308 164,873 134,000 121,556 152,160 133,204
Hawaii ........................... 117,312 114,420 . . . 114,420 108,972 215,655 (e) 103,512 124,656 100,248Idaho ............................. 110,734 29,184 90,006 99,825 90,006 134,118 78,956 106,620 . . . 102,731Illinois............................ 182,100 139,200 160,700 160,700 139,200 118,700 146,100 136,800 147,400 138,700Indiana .......................... 95,000 79,192 68,772 82,734 68,772 129,293 99,900 99,001 68,772 104,562Iowa ............................... 130,000 103,212 103,212 123,669 103,212 163,538 154,300 103,212 103,212 110,000
Kansas ........................... 99,636 54,000 86,003 98,901 86,003 106,392 114,000 110,000 . . . 104,999Kentucky (f) ................. 147,798* 110,346* 110,346* 110,346* 110,346* 139,456 . . . 110,346 110,346 126,000Louisiana ...................... 130,000 115,000 115,000 115,000 115,000 180,294 204,400 115,000 132,620 115,024Maine ............................ 70,000 (g) 69,264 92,248 69,264 102,689 102,689 102,689 96,782 96,553Maryland ....................... 150,000 125,000 87,500 125,000 125,000 103,560 (b) 138,374 (b) 130,050 (b) . . . 117,751 (b)
Massachusetts ............... 140,535 124,920 130,916 133,644 130,916 151,347 150,000 120,000 137,425 127,323Michigan ....................... 159,300 (d) 123,900 124,900 124,900 174,204 139,522 N.A. 135,000 152,274 112,199Minnesota ..................... 120,303 78,197 90,227 114,288 (a-24) 164,890 108,388 108,388 102,257 94,795Mississippi ..................... 122,160 61,714 85,500 103,512 85,500 124,443 124,000 85,500 85,500 133,721Missouri ........................ 133,821 86,484 107,746 116,437 107,746 90,112 123,967 120,000 107,746 . . .
Montana ........................ 104,400 83,394 79,129 104,076 (a-6) 109,580 96,967 96,972 82,420 97,000Nebraska ....................... 105,000 75,000 85,000 95,000 85,000 95,000 96,067 102,278 85,000 100,693Nevada .......................... 141,000 (d) 60,000 97,000 133,000 97,000 117,030 115,847 107,465 . . . 97,901New Hampshire ........... 113,834 (g) 104,364 110,114 104,364 104,364 116,170 93,812 . . . 104,364New Jersey .................... 175,000 141,000 (a-1) 141,000 141,000 141,000 . . . 141,000 139,000 130,625
New Mexico .................. 110,000 85,000 85,000 95,000 85,000 163,571 105,000 N.A. 85,000 94,045New York ...................... 179,000 (d) 151,500 120,800 151,500 127,000 120,800 . . . 120,800 151,500 127,000North Carolina ............. 139,590 123,198 123,198 123,198 123,198 103,657 120,363 123,198 123,198 123,198North Dakota ............... 110,283 85,614 87,728 113,266 82,849 167,652 . . . 90,122 87,728 103,284Ohio ............................... 144,269 142,501 109,554 109,554 109,554 108,930 125,008 111,072 109,554 100,984
Oklahoma ..................... 147,000 114,713 94,500 132,850 114,713 164,872 90,451 87,005 114,713 137,239Oregon .......................... 93,600 (a-2) 72,000 77,200 72,000 167,160 182,184 136,320 140,964 . . .Pennsylvania (h) .......... 177,888* 149,424* 128,080* 148,003 148,003 128,080* 144,275 128,080* 148,003 128,080*Rhode Island (i) ........... 129,210 108,808 108,808 N.A. 108,808 94,769 149,512 (a-23) 170,543 101,598South Carolina ............. 106,078 100,000 92,007 92,007 92,007 92,007 173,380 92,007 N.A. 101,101
South Dakota ............... 98,031 17,699 (j) 78,363 97,928 78,363 93,000 90,000 90,000 98,345 99,740Tennessee ...................... 170,340 (k) 57,027 (g) 180,000 165,336 180,000 150,000 180,000 150,000 180,000 150,000Texas .............................. 150,000 7,200 (m) 125,880 150,000 (a-14) 139,140 . . . 137,500 198,000 180,000 (n)Utah ............................... 109,470 104,000 (a-1) 98,509 104,000 101,608 116,355 101,608 104,000 113,235Vermont (l) ................... 142,542* 60,507* 90,376* 108,202* 90,376* 87,090 115,606 115,606 90,376* 127,254
Virginia ......................... 175,000 36,321 152,793 150,000 149,761 131,903 152,793 137,280 159,907 142,425Washington ................... 166,891 93,948 116,950 151,718 116,950 162,598 120,587 122,478 116,950 120,579West Virginia ................ 150,000 (g) 95,000 95,000 95,000 92,500 95,000 95,000 95,000 75,000Wisconsin ...................... 144,423 76,261 68,556 140,147 68,556 115,502 136,944 123,248 121,973 103,325Wyoming ....................... 105,000 (a-2) 92,000 137,150 92,000 118,930 142,771 107,588 92,000 100,002
Guam ............................. 90,000 85,000 . . . 101,237 65,623 68,152 88,915 60,850 100,000 88,915No. Mariana Islands..... 70,000 65,000 . . . 80,000 40,800 (b) . . . 54,000 40,800 (b) 80,000 40,800 (b)U.S. Virgin Islands ....... 80,000 75,000 (a-1) 76,500 76,500 85,000 76,500 76,500 76,500 75,000
State or other Lieutenant Secretary Attorney Adjutant jurisdiction Governor governor of state general Treasurer general Admin. Agriculture Auditor Banking
B-8
174 of 253
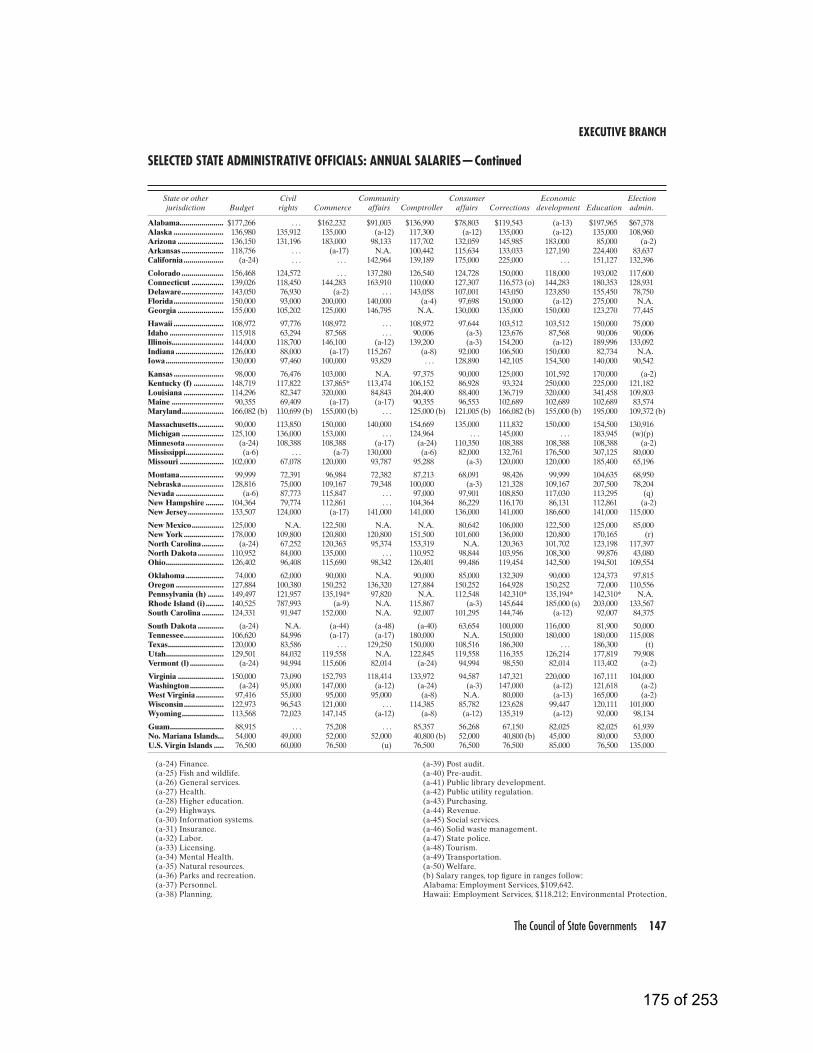
EXECUTIVE BRANCH
The Council of State Governments 147
State or other Civil Community Consumer Economic Election jurisdiction Budget rights Commerce affairs Comptroller affairs Corrections development Education admin.
Alabama...................... $177,266 . . . $162,232 $91,003 $136,990 $78,803 $119,543 (a-13) $197,965 $67,378Alaska ......................... 136,980 135,912 135,000 (a-12) 117,300 (a-12) 135,000 (a-12) 135,000 108,960Arizona ....................... 136,150 131,196 183,000 98,133 117,702 132,059 145,985 183,000 85,000 (a-2)Arkansas ..................... 118,756 . . . (a-17) N.A. 100,442 115,634 133,033 127,190 224,400 83,637California .................... (a-24) . . . . . . 142,964 139,189 175,000 225,000 . . . 151,127 132,396
Colorado ..................... 156,468 124,572 . . . 137,280 126,540 124,728 150,000 118,000 193,002 117,600Connecticut ................ 139,026 118,450 144,283 163,910 110,000 127,307 116,573 (o) 144,283 180,353 128,931Delaware ..................... 143,050 76,930 (a-2) . . . 143,058 107,001 143,050 123,850 155,450 78,750Florida ......................... 150,000 93,000 200,000 140,000 (a-4) 97,698 150,000 (a-12) 275,000 N.A.Georgia ....................... 155,000 105,202 125,000 146,795 N.A. 130,000 135,000 150,000 123,270 77,445
Hawaii ......................... 108,972 97,776 108,972 . . . 108,972 97,644 103,512 103,512 150,000 75,000Idaho ........................... 115,918 63,294 87,568 . . . 90,006 (a-3) 123,676 87,568 90,006 90,006Illinois.......................... 144,000 118,700 146,100 (a-12) 139,200 (a-3) 154,200 (a-12) 189,996 133,092Indiana ........................ 126,000 88,000 (a-17) 115,267 (a-8) 92,000 106,500 150,000 82,734 N.A.Iowa ............................. 130,000 97,460 100,000 93,829 . . . 128,890 142,105 154,300 140,000 90,542
Kansas ......................... 98,000 76,476 103,000 N.A. 97,375 90,000 125,000 101,592 170,000 (a-2)Kentucky (f) ............... 148,719 117,822 137,865* 113,474 106,152 86,928 93,324 250,000 225,000 121,182Louisiana .................... 114,296 82,347 320,000 84,843 204,400 88,400 136,719 320,000 341,458 109,803Maine .......................... 90,355 69,409 (a-17) (a-17) 90,355 96,553 102,689 102,689 102,689 83,574Maryland ..................... 166,082 (b) 110,699 (b) 155,000 (b) . . . 125,000 (b) 121,005 (b) 166,082 (b) 155,000 (b) 195,000 109,372 (b)
Massachusetts ............. 90,000 113,850 150,000 140,000 154,669 135,000 111,832 150,000 154,500 130,916Michigan ..................... 125,100 136,000 153,000 . . . 124,964 . . . 145,000 . . . 183,945 (w)(p)Minnesota ................... (a-24) 108,388 108,388 (a-17) (a-24) 110,350 108,388 108,388 108,388 (a-2)Mississippi ................... (a-6) . . . (a-7) 130,000 (a-6) 82,000 132,761 176,500 307,125 80,000Missouri ...................... 102,000 67,078 120,000 93,787 95,288 (a-3) 120,000 120,000 185,400 65,196
Montana ...................... 99,999 72,391 96,984 72,382 87,213 68,091 98,426 99,999 104,635 68,950Nebraska ..................... 128,816 75,000 109,167 79,348 100,000 (a-3) 121,328 109,167 207,500 78,204Nevada ........................ (a-6) 87,773 115,847 . . . 97,000 97,901 108,850 117,030 113,295 (q)New Hampshire ......... 104,364 79,774 112,861 . . . 104,364 86,229 116,170 86,131 112,861 (a-2)New Jersey .................. 133,507 124,000 (a-17) 141,000 141,000 136,000 141,000 186,600 141,000 115,000
New Mexico ................ 125,000 N.A. 122,500 N.A. N.A. 80,642 106,000 122,500 125,000 85,000New York .................... 178,000 109,800 120,800 120,800 151,500 101,600 136,000 120,800 170,165 (r)North Carolina ........... (a-24) 67,252 120,363 95,374 153,319 N.A. 120,363 101,702 123,198 117,397North Dakota ............. 110,952 84,000 135,000 . . . 110,952 98,844 103,956 108,300 99,876 43,080Ohio ............................. 126,402 96,408 115,690 98,342 126,401 99,486 119,454 142,500 194,501 109,554
Oklahoma ................... 74,000 62,000 90,000 N.A. 90,000 85,000 132,309 90,000 124,373 97,815Oregon ........................ 127,884 100,380 150,252 136,320 127,884 150,252 164,928 150,252 72,000 110,556Pennsylvania (h) ........ 149,497 121,957 135,194* 97,820 N.A. 112,548 142,310* 135,194* 142,310* N.A.Rhode Island (i) ......... 140,525 787,993 (a-9) N.A. 115,867 (a-3) 145,644 185,000 (s) 203,000 133,567South Carolina ........... 124,331 91,947 152,000 N.A. 92,007 101,295 144,746 (a-12) 92,007 84,375
South Dakota ............. (a-24) N.A. (a-44) (a-48) (a-40) 63,654 100,000 116,000 81,900 50,000Tennessee .................... 106,620 84,996 (a-17) (a-17) 180,000 N.A. 150,000 180,000 180,000 115,008Texas ............................ 120,000 83,586 . . . 129,250 150,000 108,516 186,300 . . . 186,300 (t)Utah ............................. 129,501 84,032 119,558 N.A. 122,845 119,558 116,355 126,214 177,819 79,908Vermont (l) ................. (a-24) 94,994 115,606 82,014 (a-24) 94,994 98,550 82,014 113,402 (a-2)
Virginia ....................... 150,000 73,090 152,793 118,414 133,972 94,587 147,321 220,000 167,111 104,000Washington ................. (a-24) 95,000 147,000 (a-12) (a-24) (a-3) 147,000 (a-12) 121,618 (a-2)West Virginia .............. 97,416 55,000 95,000 95,000 (a-8) N.A. 80,000 (a-13) 165,000 (a-2)Wisconsin .................... 122,973 96,543 121,000 . . . 114,385 85,782 123,628 99,447 120,111 101,000Wyoming ..................... 113,568 72,023 147,145 (a-12) (a-8) (a-12) 135,319 (a-12) 92,000 98,134
Guam ........................... 88,915 . . . 75,208 . . . 85,357 56,268 67,150 82,025 82,025 61,939No. Mariana Islands... 54,000 49,000 52,000 52,000 40,800 (b) 52,000 40,800 (b) 45,000 80,000 53,000U.S. Virgin Islands ..... 76,500 60,000 76,500 (u) 76,500 76,500 76,500 85,000 76,500 135,000
(a-24) Finance.(a-25) Fish and wildlife.(a-26) General services.(a-27) Health.(a-28) Higher education.(a-29) Highways.(a-30) Information systems.(a-31) Insurance.(a-32) Labor.(a-33) Licensing.(a-34) Mental Health.(a-35) Natural resources.(a-36) Parks and recreation.(a-37) Personnel.(a-38) Planning.
(a-39) Post audit.(a-40) Pre-audit.(a-41) Public library development.(a-42) Public utility regulation.(a-43) Purchasing.(a-44) Revenue.(a-45) Social services.(a-46) Solid waste management.(a-47) State police.(a-48) Tourism.(a-49) Transportation.(a-50) Welfare.(b) Salary ranges, top figure in ranges follow:Alabama: Employment Services, $109,642.Hawaii: Employment Services, $118,212; Environmental Protection,
SELECTED STATE ADMINISTRATIVE OFFICIALS: ANNUAL SALARIES—Continued
175 of 253
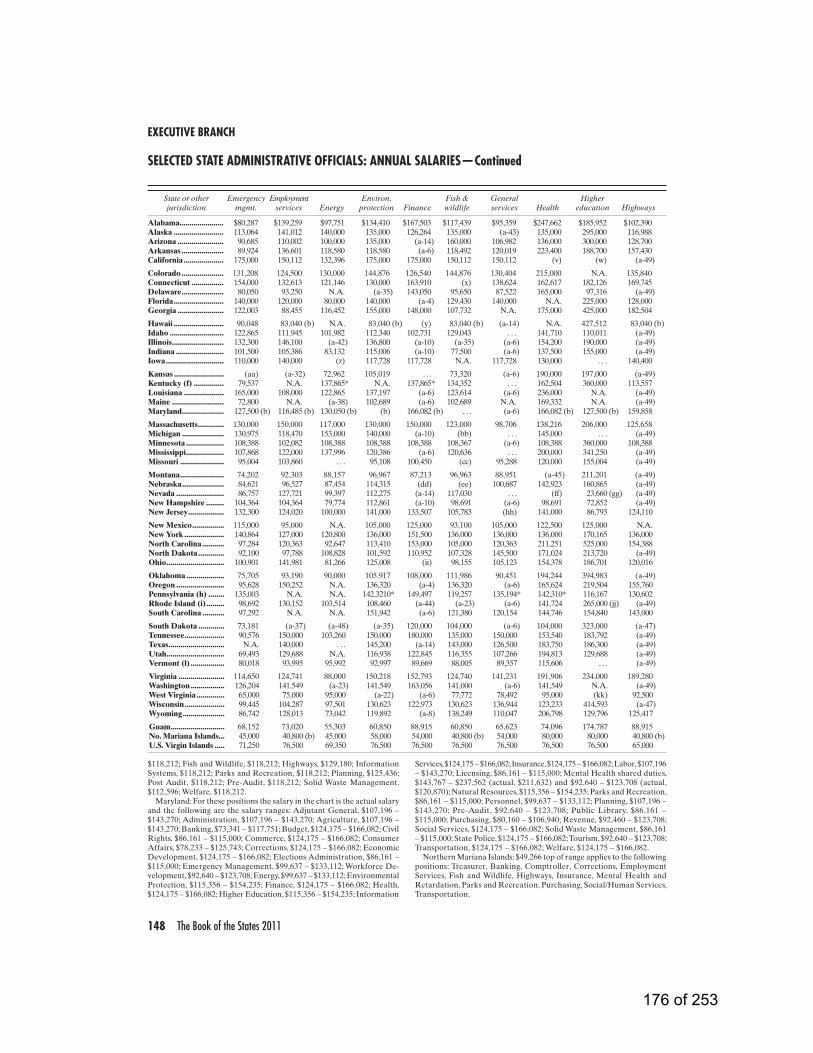
EXECUTIVE BRANCH
148 The Book of the States 2011
State or other Emergency Employment Environ. Fish & General Higher jurisdiction mgmt. services Energy protection Finance wildlife services Health education Highways
Alabama...................... $80,287 $139,259 $97,751 $134,410 $167,503 $117,439 $95,359 $247,662 $185,952 $102,390Alaska ......................... 113,064 141,012 140,000 135,000 126,264 135,000 (a-43) 135,000 295,000 116,988Arizona ....................... 90,685 110,002 100,000 135,000 (a-14) 160,000 106,982 136,000 300,000 128,700Arkansas ..................... 89,924 136,601 118,580 118,580 (a-6) 118,492 120,019 223,400 188,700 157,430California .................... 175,000 150,112 132,396 175,000 175,000 150,112 150,112 (v) (w) (a-49)
Colorado ..................... 131,208 124,500 130,000 144,876 126,540 144,876 130,404 215,000 N.A. 135,840Connecticut ................ 154,000 132,613 121,146 130,000 163,910 (x) 138,624 162,617 182,126 169,745Delaware ..................... 80,050 93,250 N.A. (a-35) 143,050 95,650 87,522 165,000 97,316 (a-49)Florida ......................... 140,000 120,000 80,000 140,000 (a-4) 129,430 140,000 N.A. 225,000 128,000Georgia ....................... 122,003 88,455 116,452 155,000 148,000 107,732 N.A. 175,000 425,000 182,504
Hawaii ......................... 90,048 83,040 (b) N.A. 83,040 (b) (y) 83,040 (b) (a-14) N.A. 427,512 83,040 (b)Idaho ........................... 122,865 111,945 101,982 112,340 102,731 129,043 . . . 141,710 110,011 (a-49)Illinois.......................... 132,300 146,100 (a-42) 136,800 (a-10) (a-35) (a-6) 154,200 190,000 (a-49)Indiana ........................ 101,500 105,386 83,132 115,006 (a-10) 77,500 (a-6) 137,500 155,000 (a-49)Iowa ............................. 110,000 140,000 (z) 117,728 117,728 N.A. 117,728 130,000 . . . 140,400
Kansas ......................... (aa) (a-32) 72,962 105,019 . . . 73,320 (a-6) 190,000 197,000 (a-49)Kentucky (f) ............... 79,537 N.A. 137,865* N.A. 137,865* 134,352 . . . 162,504 360,000 113,557Louisiana .................... 165,000 108,000 122,865 137,197 (a-6) 123,614 (a-6) 236,000 N.A. (a-49)Maine .......................... 72,800 N.A. (a-38) 102,689 (a-6) 102,689 N.A. 169,332 N.A. (a-49)Maryland ..................... 127,500 (b) 116,485 (b) 130,050 (b) (b) 166,082 (b) . . . (a-6) 166,082 (b) 127,500 (b) 159,858
Massachusetts ............. 130,000 150,000 117,000 130,000 150,000 123,000 98,706 138,216 206,000 125,658Michigan ..................... 130,975 118,470 153,000 140,000 (a-10) (bb) . . . 145,000 . . . (a-49)Minnesota ................... 108,388 102,082 108,388 108,388 108,388 108,367 (a-6) 108,388 360,000 108,388Mississippi ................... 107,868 122,000 137,996 120,386 (a-6) 120,636 . . . 200,000 341,250 (a-49)Missouri ...................... 95,004 103,860 . . . 95,108 100,450 (cc) 95,288 120,000 155,004 (a-49)
Montana ...................... 74,202 92,303 88,157 96,967 87,213 96,963 88,951 (a-45) 211,201 (a-49)Nebraska ..................... 84,621 96,527 87,454 114,315 (dd) (ee) 100,687 142,923 160,865 (a-49)Nevada ........................ 86,757 127,721 99,397 112,275 (a-14) 117,030 . . . (ff) 23,660 (gg) (a-49)New Hampshire ......... 104,364 104,364 79,774 112,861 (a-10) 98,691 (a-6) 98,691 72,852 (a-49)New Jersey .................. 132,300 124,020 100,000 141,000 133,507 105,783 (hh) 141,000 86,793 124,110
New Mexico ................ 115,000 95,000 N.A. 105,000 125,000 93,100 105,000 122,500 125,000 N.A.New York .................... 140,864 127,000 120,800 136,000 151,500 136,000 136,000 136,000 170,165 136,000North Carolina ........... 97,284 120,363 92,647 113,410 153,000 105,000 120,363 211,251 525,000 154,388North Dakota ............. 92,100 97,788 108,828 101,592 110,952 107,328 145,500 171,024 213,720 (a-49)Ohio ............................. 100,901 141,981 81,266 125,008 (ii) 98,155 105,123 154,378 186,701 120,016
Oklahoma ................... 75,705 93,190 90,000 105,917 108,000 111,986 90,451 194,244 394,983 (a-49)Oregon ........................ 95,628 150,252 N.A. 136,320 (a-4) 136,320 (a-6) 165,624 219,504 155,760Pennsylvania (h) ........ 135,003 N.A. N.A. 142,3210* 149,497 119,257 135,194* 142,310* 116,167 130,602Rhode Island (i) ......... 98,692 130,152 103,514 108,460 (a-44) (a-23) (a-6) 141,724 265,000 (jj) (a-49)South Carolina ........... 97,292 N.A. N.A. 151,942 (a-6) 121,380 120,154 144,746 154,840 143,000
South Dakota ............. 73,181 (a-37) (a-48) (a-35) 120,000 104,000 (a-6) 104,000 323,000 (a-47)Tennessee .................... 90,576 150,000 103,260 150,000 180,000 135,000 150,000 153,540 183,792 (a-49)Texas ............................ N.A. 140,000 . . . 145,200 (a-14) 143,000 126,500 183,750 186,300 (a-49)Utah ............................. 69,493 129,688 N.A. 116,938 122,845 116,355 107,266 194,813 129,688 (a-49)Vermont (l) ................. 80,018 93,995 95,992 92,997 89,669 88,005 89,357 115,606 . . . (a-49)
Virginia ....................... 114,650 124,741 88,000 150,218 152,793 124,740 141,231 191,906 234,000 189,280Washington ................. 126,204 141,549 (a-23) 141,549 163,056 141,000 (a-6) 141,549 N.A. (a-49)West Virginia .............. 65,000 75,000 95,000 (a-22) (a-6) 77,772 78,492 95,000 (kk) 92,500Wisconsin .................... 99,445 104,287 97,501 130,623 122,973 130,623 136,944 123,233 414,593 (a-47)Wyoming ..................... 86,742 128,013 73,042 119,892 (a-8) 138,249 110,047 206,798 129,796 125,417
Guam ........................... 68,152 73,020 55,303 60,850 88,915 60,850 65,623 74,096 174,787 88,915No. Mariana Islands... 45,000 40,800 (b) 45,000 58,000 54,000 40,800 (b) 54,000 80,000 80,000 40,800 (b)U.S. Virgin Islands ..... 71,250 76,500 69,350 76,500 76,500 76,500 76,500 76,500 76,500 65,000
$118,212; Fish and Wildlife, $118,212; Highways, $129,180; Information Systems, $118,212; Parks and Recreation, $118,212; Planning, $125,436; Post Audit, $118,212; Pre-Audit, $118,212; Solid Waste Management, $112,596; Welfare, $118,212.
Maryland: For these positions the salary in the chart is the actual salary and the following are the salary ranges: Adjutant General, $107,196 – $143,270; Administration, $107,196 – $143,270; Agriculture, $107,196 – $143,270; Banking, $73,341 – $117,751; Budget, $124,175 – $166,082; Civil Rights, $86,161 – $115,000; Commerce, $124,175 – $166,082; Consumer Affairs, $78,233 – $125,743; Corrections, $124,175 – $166,082; Economic Development, $124,175 – $166,082; Elections Administration, $86,161 – $115,000; Emergency Management, $99,637 – $133,112; Workforce De-velopment, $92,640 – $123,708; Energy, $99,637 – $133,112; Environmental Protection, $115,356 – $154,235; Finance, $124,175 – $166,082; Health, $124,175 – $166,082; Higher Education, $115,356 – $154,235; Information
Services, $124,175 – $166,082; Insurance, $124,175 – $166,082; Labor, $107,196 – $143,270; Licensing, $86,161 – $115,000; Mental Health shared duties, $143,767 – $237,562 (actual, $211,632) and $92,640 – $123,708 (actual, $120,870); Natural Resources, $115,356 – $154,235; Parks and Recreation, $86,161 – $115,000; Personnel, $99,637 – $133,112; Planning, $107,196 – $143,270; Pre-Audit, $92,640 – $123,708; Public Library, $86,161 – $115,000; Purchasing, $80,160 – $106,940; Revenue, $92,460 – $123,708; Social Services, $124,175 – $166,082; Solid Waste Management, $86,161 – $115,000; State Police, $124,175 – $166,082; Tourism, $92,640 – $123,708; Transportation, $124,175 – $166,082; Welfare, $124,175 – $166,082.
Northern Mariana Islands: $49,266 top of range applies to the following positions: Treasurer, Banking, Comptroller, Corrections, Employment Services, Fish and Wildlife, Highways, Insurance, Mental Health and Retardation, Parks and Recreation, Purchasing, Social/Human Services, Transportation.
SELECTED STATE ADMINISTRATIVE OFFICIALS: ANNUAL SALARIES—Continued
176 of 253
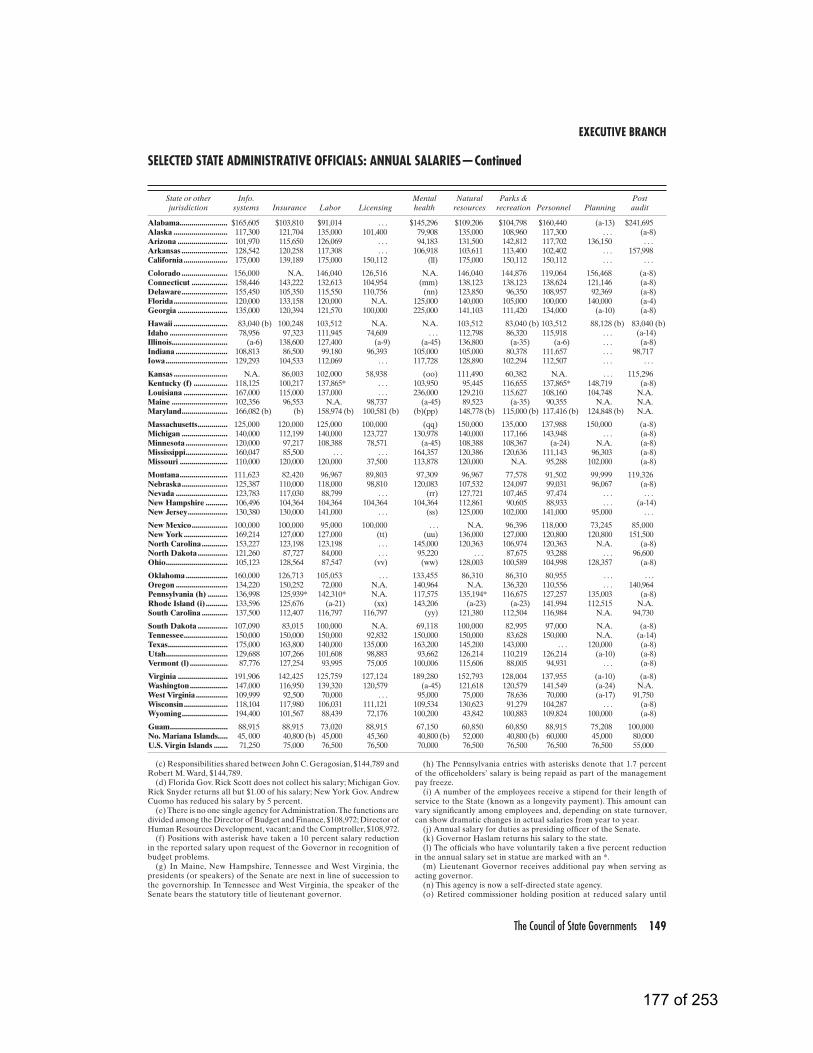
EXECUTIVE BRANCH
The Council of State Governments 149
State or other Info. Mental Natural Parks & Post jurisdiction systems Insurance Labor Licensing health resources recreation Personnel Planning audit
Alabama........................ $165,605 $103,810 $91,014 . . . $145,296 $109,206 $104,798 $160,440 (a-13) $241,695Alaska ........................... 117,300 121,704 135,000 101,400 79,908 135,000 108,960 117,300 . . . (a-8)Arizona ......................... 101,970 115,650 126,069 . . . 94,183 131,500 142,812 117,702 136,150 . . .Arkansas ....................... 128,542 120,258 117,308 . . . 106,918 103,611 113,400 102,402 . . . 157,998California ...................... 175,000 139,189 175,000 150,112 (ll) 175,000 150,112 150,112 . . . . . .
Colorado ....................... 156,000 N.A. 146,040 126,516 N.A. 146,040 144,876 119,064 156,468 (a-8)Connecticut .................. 158,446 143,222 132,613 104,954 (mm) 138,123 138,123 138,624 121,146 (a-8)Delaware ....................... 155,450 105,350 115,550 110,756 (nn) 123,850 96,350 108,957 92,369 (a-8)Florida ........................... 120,000 133,158 120,000 N.A. 125,000 140,000 105,000 100,000 140,000 (a-4)Georgia ......................... 135,000 120,394 121,570 100,000 225,000 141,103 111,420 134,000 (a-10) (a-8)
Hawaii ........................... 83,040 (b) 100,248 103,512 N.A. N.A. 103,512 83,040 (b) 103,512 88,128 (b) 83,040 (b)Idaho ............................. 78,956 97,323 111,945 74,609 . . . 112,798 86,320 115,918 . . . (a-14)Illinois............................ (a-6) 138,600 127,400 (a-9) (a-45) 136,800 (a-35) (a-6) . . . (a-8)Indiana .......................... 108,813 86,500 99,180 96,393 105,000 105,000 80,378 111,657 . . . 98,717Iowa ............................... 129,293 104,533 112,069 . . . 117,728 128,890 102,294 112,507 . . . . . .
Kansas ........................... N.A. 86,003 102,000 58,938 (oo) 111,490 60,382 N.A. . . . 115,296Kentucky (f) ................. 118,125 100,217 137,865* . . . 103,950 95,445 116,655 137,865* 148,719 (a-8)Louisiana ...................... 167,000 115,000 137,000 . . . 236,000 129,210 115,627 108,160 104,748 N.A.Maine ............................ 102,356 96,553 N.A. 98,737 (a-45) 89,523 (a-35) 90,355 N.A. N.A.Maryland ....................... 166,082 (b) (b) 158,974 (b) 100,581 (b) (b)(pp) 148,778 (b) 115,000 (b) 117,416 (b) 124,848 (b) N.A.
Massachusetts ............... 125,000 120,000 125,000 100,000 (qq) 150,000 135,000 137,988 150,000 (a-8)Michigan ....................... 140,000 112,199 140,000 123,727 130,978 140,000 117,166 143,948 . . . (a-8)Minnesota ..................... 120,000 97,217 108,388 78,571 (a-45) 108,388 108,367 (a-24) N.A. (a-8)Mississippi ..................... 160,047 85,500 . . . . . . 164,357 120,386 120,636 111,143 96,303 (a-8)Missouri ........................ 110,000 120,000 120,000 37,500 113,878 120,000 N.A. 95,288 102,000 (a-8)
Montana ........................ 111,623 82,420 96,967 89,803 97,309 96,967 77,578 91,502 99,999 119,326Nebraska ....................... 125,387 110,000 118,000 98,810 120,083 107,532 124,097 99,031 96,067 (a-8)Nevada .......................... 123,783 117,030 88,799 . . . (rr) 127,721 107,465 97,474 . . . . . .New Hampshire ........... 106,496 104,364 104,364 104,364 104,364 112,861 90,605 88,933 . . . (a-14)New Jersey .................... 130,380 130,000 141,000 . . . (ss) 125,000 102,000 141,000 95,000 . . .
New Mexico .................. 100,000 100,000 95,000 100,000 . . . N.A. 96,396 118,000 73,245 85,000New York ...................... 169,214 127,000 127,000 (tt) (uu) 136,000 127,000 120,800 120,800 151,500North Carolina ............. 153,227 123,198 123,198 . . . 145,000 120,363 106,974 120,363 N.A. (a-8)North Dakota ............... 121,260 87,727 84,000 . . . 95,220 . . . 87,675 93,288 . . . 96,600Ohio ............................... 105,123 128,564 87,547 (vv) (ww) 128,003 100,589 104,998 128,357 (a-8)
Oklahoma ..................... 160,000 126,713 105,053 . . . 133,455 86,310 86,310 80,955 . . . . . .Oregon .......................... 134,220 150,252 72,000 N.A. 140,964 N.A. 136,320 110,556 . . . 140,964Pennsylvania (h) .......... 136,998 125,939* 142,310* N.A. 117,575 135,194* 116,675 127,257 135,003 (a-8)Rhode Island (i) ........... 133,596 125,676 (a-21) (xx) 143,206 (a-23) (a-23) 141,994 112,515 N.A.South Carolina ............. 137,500 112,407 116,797 116,797 (yy) 121,380 112,504 116,984 N.A. 94,730
South Dakota ............... 107,090 83,015 100,000 N.A. 69,118 100,000 82,995 97,000 N.A. (a-8)Tennessee ...................... 150,000 150,000 150,000 92,832 150,000 150,000 83,628 150,000 N.A. (a-14)Texas .............................. 175,000 163,800 140,000 135,000 163,200 145,200 143,000 . . . 120,000 (a-8)Utah ............................... 129,688 107,266 101,608 98,883 93,662 126,214 110,219 126,214 (a-10) (a-8)Vermont (l) ................... 87,776 127,254 93,995 75,005 100,006 115,606 88,005 94,931 . . . (a-8)
Virginia ......................... 191,906 142,425 125,759 127,124 189,280 152,793 128,004 137,955 (a-10) (a-8)Washington ................... 147,000 116,950 139,320 120,579 (a-45) 121,618 120,579 141,549 (a-24) N.A.West Virginia ................ 109,999 92,500 70,000 . . . 95,000 75,000 78,636 70,000 (a-17) 91,750Wisconsin ...................... 118,104 117,980 106,031 111,121 109,534 130,623 91,279 104,287 . . . (a-8)Wyoming ....................... 194,400 101,567 88,439 72,176 100,200 43,842 100,883 109,824 100,000 (a-8)
Guam ............................. 88,915 88,915 73,020 88,915 67,150 60,850 60,850 88,915 75,208 100,000No. Mariana Islands..... 45, 000 40,800 (b) 45,000 45,360 40,800 (b) 52,000 40,800 (b) 60,000 45,000 80,000U.S. Virgin Islands ....... 71,250 75,000 76,500 76,500 70,000 76,500 76,500 76,500 76,500 55,000
(c) Responsibilities shared between John C. Geragosian, $144,789 and Robert M. Ward, $144,789.
(d) Florida Gov. Rick Scott does not collect his salary; Michigan Gov. Rick Snyder returns all but $1.00 of his salary; New York Gov. Andrew Cuomo has reduced his salary by 5 percent.
(e) There is no one single agency for Administration. The functions are divided among the Director of Budget and Finance, $108,972; Director of Human Resources Development, vacant; and the Comptroller, $108,972.
(f) Positions with asterisk have taken a 10 percent salary reduction in the reported salary upon request of the Governor in recognition of budget problems.
(g) In Maine, New Hampshire, Tennessee and West Virginia, the presidents (or speakers) of the Senate are next in line of succession to the governorship. In Tennessee and West Virginia, the speaker of the Senate bears the statutory title of lieutenant governor.
(h) The Pennsylvania entries with asterisks denote that 1.7 percent of the officeholders’ salary is being repaid as part of the management pay freeze.
(i) A number of the employees receive a stipend for their length of service to the State (known as a longevity payment). This amount can vary significantly among employees and, depending on state turnover, can show dramatic changes in actual salaries from year to year.
(j) Annual salary for duties as presiding officer of the Senate.(k) Governor Haslam returns his salary to the state.(l) The officials who have voluntarily taken a five percent reduction
in the annual salary set in statue are marked with an *.(m) Lieutenant Governor receives additional pay when serving as
acting governor.(n) This agency is now a self-directed state agency.(o) Retired commissioner holding position at reduced salary until
SELECTED STATE ADMINISTRATIVE OFFICIALS: ANNUAL SALARIES—Continued
177 of 253
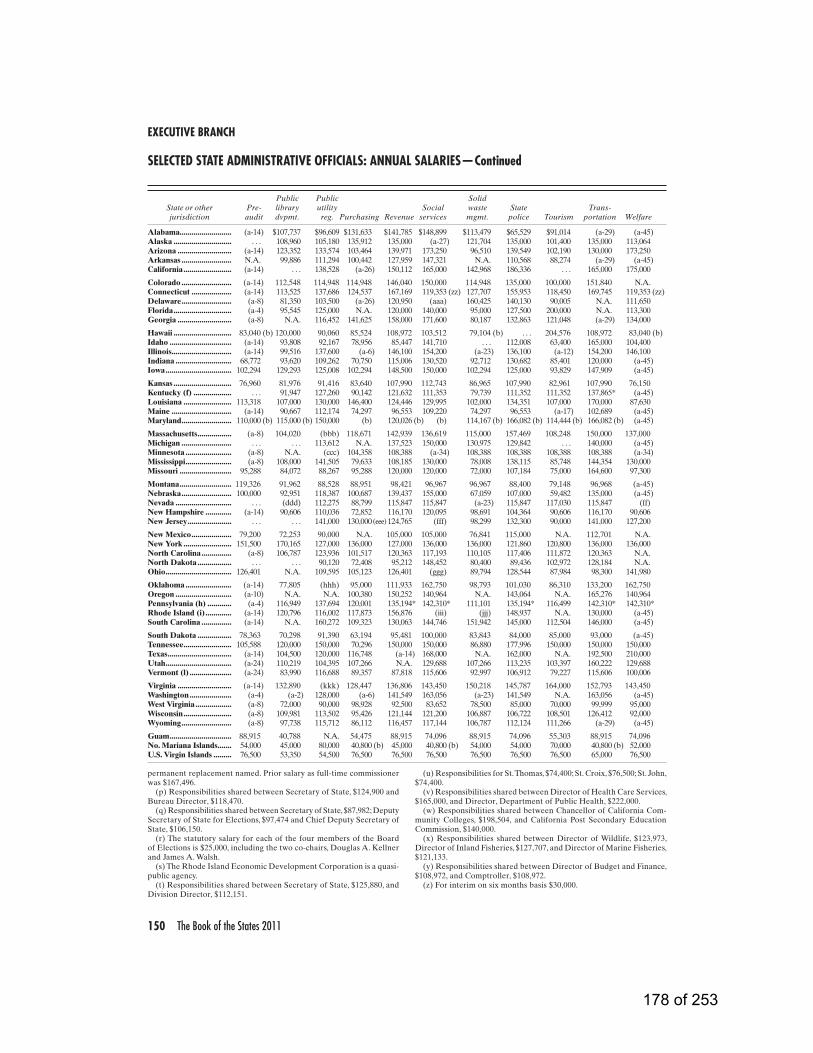
EXECUTIVE BRANCH
150 The Book of the States 2011
Public Public Solid State or other Pre- library utility Social waste State Trans- jurisdiction audit dvpmt. reg. Purchasing Revenue services mgmt. police Tourism portation Welfare
Alabama.......................... (a-14) $107,737 $96,609 $131,633 $141,785 $148,899 $113,479 $65,529 $91,014 (a-29) (a-45)Alaska ............................. . . . 108,960 105,180 135,912 135,000 (a-27) 121,704 135,000 101,400 135,000 113,064Arizona ........................... (a-14) 123,352 133,574 103,464 139,971 173,250 96,510 139,549 102,190 130,000 173,250Arkansas ......................... N.A. 99,886 111,294 100,442 127,959 147,321 N.A. 110,568 88,274 (a-29) (a-45)California ........................ (a-14) . . . 138,528 (a-26) 150,112 165,000 142,968 186,336 . . . 165,000 175,000
Colorado ......................... (a-14) 112,548 114,948 114,948 146,040 150,000 114,948 135,000 100,000 151,840 N.A.Connecticut .................... (a-14) 113,525 137,686 124,537 167,169 119,353 (zz) 127,707 155,953 118,450 169,745 119,353 (zz)Delaware ......................... (a-8) 81,350 103,500 (a-26) 120,950 (aaa) 160,425 140,130 90,005 N.A. 111,650Florida ............................. (a-4) 95,545 125,000 N.A. 120,000 140,000 95,000 127,500 200,000 N.A. 113,300Georgia ........................... (a-8) N.A. 116,452 141,625 158,000 171,600 80,187 132,863 121,048 (a-29) 134,000
Hawaii ............................. 83,040 (b) 120,000 90,060 85,524 108,972 103,512 79,104 (b) . . . 204,576 108,972 83,040 (b)Idaho ............................... (a-14) 93,808 92,167 78,956 85,447 141,710 . . . 112,008 63,400 165,000 104,400Illinois.............................. (a-14) 99,516 137,600 (a-6) 146,100 154,200 (a-23) 136,100 (a-12) 154,200 146,100Indiana ............................ 68,772 93,620 109,262 70,750 115,006 130,520 92,712 130,682 85,401 120,000 (a-45)Iowa ................................. 102,294 129,293 125,008 102,294 148,500 150,000 102,294 125,000 93,829 147,909 (a-45)
Kansas ............................. 76,960 81,976 91,416 83,640 107,990 112,743 86,965 107,990 82,961 107,990 76,150Kentucky (f) ................... . . . 91,947 127,260 90,142 121,632 111,353 79,739 111,352 111,352 137,865* (a-45)Louisiana ........................ 113,318 107,000 130,000 146,400 124,446 129,995 102,000 134,351 107,000 170,000 87,630Maine .............................. (a-14) 90,667 112,174 74,297 96,553 109,220 74,297 96,553 (a-17) 102,689 (a-45)Maryland ......................... 110,000 (b) 115,000 (b) 150,000 (b) 120,026 (b) (b) 114,167 (b) 166,082 (b) 114,444 (b) 166,082 (b) (a-45)
Massachusetts ................. (a-8) 104,020 (bbb) 118,671 142,939 136,619 115,000 157,469 108,248 150,000 137,000Michigan ......................... . . . . . . 113,612 N.A. 137,523 150,000 130,975 129,842 . . . 140,000 (a-45)Minnesota ....................... (a-8) N.A. (ccc) 104,358 108,388 (a-34) 108,388 108,388 108,388 108,388 (a-34)Mississippi ....................... (a-8) 108,000 141,505 79,633 108,185 130,000 78,008 138,115 85,748 144,354 130,000Missouri .......................... 95,288 84,072 88,267 95,288 120,000 120,000 72,000 107,184 75,000 164,600 97,300
Montana .......................... 119,326 91,962 88,528 88,951 98,421 96,967 96,967 88,400 79,148 96,968 (a-45)Nebraska ......................... 100,000 92,951 118,387 100,687 139,437 155,000 67,059 107,000 59,482 135,000 (a-45)Nevada ............................ . . . (ddd) 112,275 88,799 115,847 115,847 (a-23) 115,847 117,030 115,847 (ff)New Hampshire ............. (a-14) 90,606 110,036 72,852 116,170 120,095 98,691 104,364 90,606 116,170 90,606New Jersey ...................... . . . . . . 141,000 130,000 (eee) 124,765 (fff) 98,299 132,300 90,000 141,000 127,200
New Mexico .................... 79,200 72,253 90,000 N.A. 105,000 105,000 76,841 115,000 N.A. 112,701 N.A.New York ........................ 151,500 170,165 127,000 136,000 127,000 136,000 136,000 121,860 120,800 136,000 136,000North Carolina ............... (a-8) 106,787 123,936 101,517 120,363 117,193 110,105 117,406 111,872 120,363 N.A.North Dakota ................. . . . . . . 90,120 72,408 95,212 148,452 80,400 89,436 102,972 128,184 N.A.Ohio ................................. 126,401 N.A. 109,595 105,123 126,401 (ggg) 89,794 128,544 87,984 98,300 141,980
Oklahoma ....................... (a-14) 77,805 (hhh) 95,000 111,933 162,750 98,793 101,030 86,310 133,200 162,750Oregon ............................ (a-10) N.A. N.A. 100,380 150,252 140,964 N.A. 143,064 N.A. 165,276 140,964Pennsylvania (h) ............ (a-4) 116,949 137,694 120,001 135,194* 142,310* 111,101 135,194* 116,499 142,310* 142,310*Rhode Island (i) ............. (a-14) 120,796 116,002 117,873 156,876 (iii) (jjj) 148,937 N.A. 130,000 (a-45)South Carolina ............... (a-14) N.A. 160,272 109,323 130,063 144,746 151,942 145,000 112,504 146,000 (a-45)
South Dakota ................. 78,363 70,298 91,390 63,194 95,481 100,000 83,843 84,000 85,000 93,000 (a-45)Tennessee ........................ 105,588 120,000 150,000 70,296 150,000 150,000 86,880 177,996 150,000 150,000 150,000Texas ................................ (a-14) 104,500 120,000 116,748 (a-14) 168,000 N.A. 162,000 N.A. 192,500 210,000Utah ................................. (a-24) 110,219 104,395 107,266 N.A. 129,688 107,266 113,235 103,397 160,222 129,688Vermont (l) ..................... (a-24) 83,990 116,688 89,357 87,818 115,606 92,997 106,912 79,227 115,606 100,006
Virginia ........................... (a-14) 132,890 (kkk) 128,447 136,806 143,450 150,218 145,787 164,000 152,793 143,450Washington ..................... (a-4) (a-2) 128,000 (a-6) 141,549 163,056 (a-23) 141,549 N.A. 163,056 (a-45)West Virginia .................. (a-8) 72,000 90,000 98,928 92,500 83,652 78,500 85,000 70,000 99,999 95,000Wisconsin ........................ (a-8) 109,981 113,502 95,426 121,144 121,200 106,887 106,722 108,501 126,412 92,000Wyoming ......................... (a-8) 97,738 115,712 86,112 116,457 117,144 106,787 112,124 111,266 (a-29) (a-45)
Guam ............................... 88,915 40,788 N.A. 54,475 88,915 74,096 88,915 74,096 55,303 88,915 74,096No. Mariana Islands....... 54,000 45,000 80,000 40,800 (b) 45,000 40,800 (b) 54,000 54,000 70,000 40,800 (b) 52,000U.S. Virgin Islands ......... 76,500 53,350 54,500 76,500 76,500 76,500 76,500 76,500 76,500 65,000 76,500
permanent replacement named. Prior salary as full-time commissioner was $167,496.
(p) Responsibilities shared between Secretary of State, $124,900 and Bureau Director, $118,470.
(q) Responsibilities shared between Secretary of State, $87,982; Deputy Secretary of State for Elections, $97,474 and Chief Deputy Secretary of State, $106,150.
(r) The statutory salary for each of the four members of the Board of Elections is $25,000, including the two co-chairs, Douglas A. Kellner and James A. Walsh.
(s) The Rhode Island Economic Development Corporation is a quasi-public agency.
(t) Responsibilities shared between Secretary of State, $125,880, and Division Director, $112,151.
(u) Responsibilities for St. Thomas, $74,400; St. Croix, $76,500; St. John, $74,400.
(v) Responsibilities shared between Director of Health Care Services, $165,000, and Director, Department of Public Health, $222,000.
(w) Responsibilities shared between Chancellor of California Com-munity Colleges, $198,504, and California Post Secondary Education Commission, $140,000.
(x) Responsibilities shared between Director of Wildlife, $123,973, Director of Inland Fisheries, $127,707, and Director of Marine Fisheries, $121,133.
(y) Responsibilities shared between Director of Budget and Finance, $108,972, and Comptroller, $108,972.
(z) For interim on six months basis $30,000.
SELECTED STATE ADMINISTRATIVE OFFICIALS: ANNUAL SALARIES—Continued
178 of 253
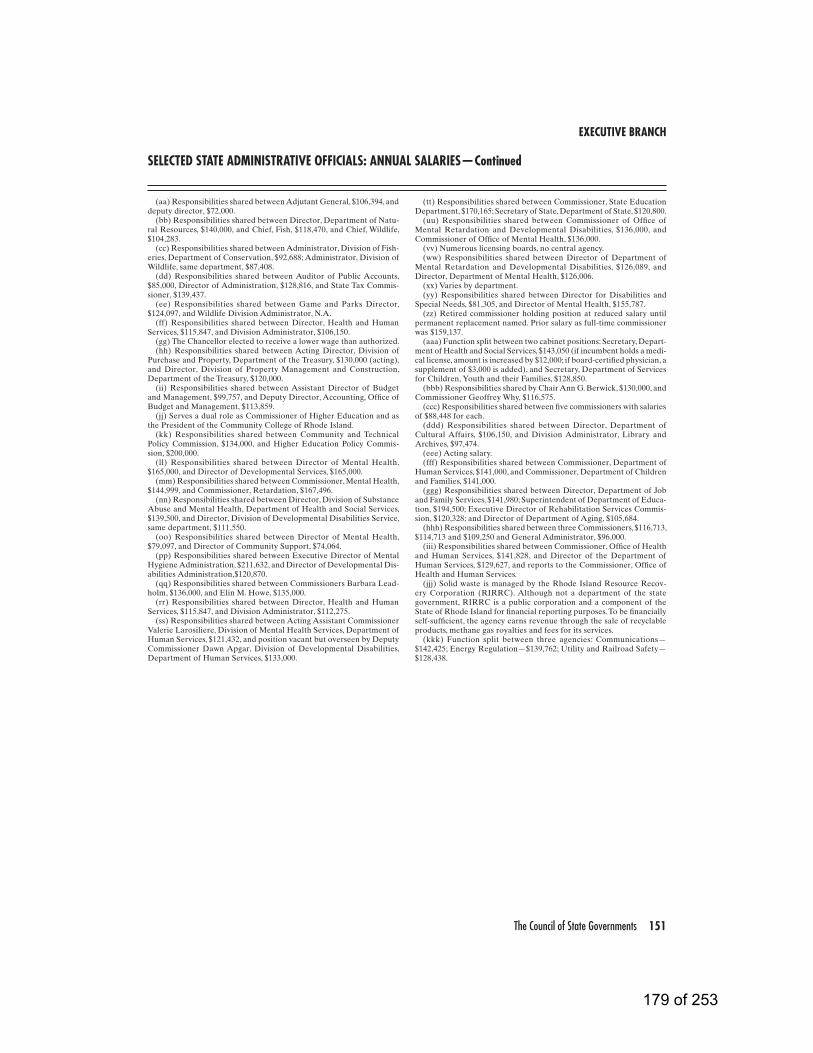
EXECUTIVE BRANCH
The Council of State Governments 151
SELECTED STATE ADMINISTRATIVE OFFICIALS: ANNUAL SALARIES—Continued
(aa) Responsibilities shared between Adjutant General, $106,394, and deputy director, $72,000.
(bb) Responsibilities shared between Director, Department of Natu-ral Resources, $140,000, and Chief, Fish, $118,470, and Chief, Wildlife, $104,283.
(cc) Responsibilities shared between Administrator, Division of Fish-eries, Department of Conservation, $92,688; Administrator, Division of Wildlife, same department, $87,408.
(dd) Responsibilities shared between Auditor of Public Accounts, $85,000, Director of Administration, $128,816, and State Tax Commis-sioner, $139,437.
(ee) Responsibilities shared between Game and Parks Director, $124,097, and Wildlife Division Administrator, N.A.
(ff) Responsibilities shared between Director, Health and Human Services, $115,847, and Division Administrator, $106,150.
(gg) The Chancellor elected to receive a lower wage than authorized.(hh) Responsibilities shared between Acting Director, Division of
Purchase and Property, Department of the Treasury, $130,000 (acting), and Director, Division of Property Management and Construction, Department of the Treasury, $120,000.
(ii) Responsibilities shared between Assistant Director of Budget and Management, $99,757, and Deputy Director, Accounting, Office of Budget and Management, $113,859.
(jj) Serves a dual role as Commissioner of Higher Education and as the President of the Community College of Rhode Island.
(kk) Responsibilities shared between Community and Technical Policy Commission, $134,000, and Higher Education Policy Commis-sion, $200,000.
(ll) Responsibilities shared between Director of Mental Health, $165,000, and Director of Developmental Services, $165,000.
(mm) Responsibilities shared between Commissioner, Mental Health, $144,999, and Commissioner, Retardation, $167,496.
(nn) Responsibilities shared between Director, Division of Substance Abuse and Mental Health, Department of Health and Social Services, $139,500, and Director, Division of Developmental Disabilities Service, same department, $111,550.
(oo) Responsibilities shared between Director of Mental Health, $79,097, and Director of Community Support, $74,064.
(pp) Responsibilities shared between Executive Director of Mental Hygiene Administration, $211,632, and Director of Developmental Dis-abilities Administration,$120,870.
(qq) Responsibilities shared between Commissioners Barbara Lead-holm, $136,000, and Elin M. Howe, $135,000.
(rr) Responsibilities shared between Director, Health and Human Services, $115,847, and Division Administrator, $112,275.
(ss) Responsibilities shared between Acting Assistant Commissioner Valerie Larosiliere, Division of Mental Health Services, Department of Human Services, $121,432, and position vacant but overseen by Deputy Commissioner Dawn Apgar, Division of Developmental Disabilities, Department of Human Services, $133,000.
(tt) Responsibilities shared between Commissioner, State Education Department, $170,165; Secretary of State, Department of State, $120,800.
(uu) Responsibilities shared between Commissioner of Office of Mental Retardation and Developmental Disabilities, $136,000, and Commissioner of Office of Mental Health, $136,000.
(vv) Numerous licensing boards, no central agency.(ww) Responsibilities shared between Director of Department of
Mental Retardation and Developmental Disabilities, $126,089, and Director, Department of Mental Health, $126,006.
(xx) Varies by department.(yy) Responsibilities shared between Director for Disabilities and
Special Needs, $81,305, and Director of Mental Health, $155,787.(zz) Retired commissioner holding position at reduced salary until
permanent replacement named. Prior salary as full-time commissioner was $159,137.
(aaa) Function split between two cabinet positions: Secretary, Depart-ment of Health and Social Services, $143,050 (if incumbent holds a medi-cal license, amount is increased by $12,000; if board-certified physician, a supplement of $3,000 is added), and Secretary, Department of Services for Children, Youth and their Families, $128,850.
(bbb) Responsibilities shared by Chair Ann G. Berwick, $130,000, and Commissioner Geoffrey Why, $116,575.
(ccc) Responsibilities shared between five commissioners with salaries of $88,448 for each.
(ddd) Responsibilities shared between Director, Department of Cultural Affairs, $106,150, and Division Administrator, Library and Archives, $97,474.
(eee) Acting salary.(fff) Responsibilities shared between Commissioner, Department of
Human Services, $141,000, and Commissioner, Department of Children and Families, $141,000.
(ggg) Responsibilities shared between Director, Department of Job and Family Services, $141,980; Superintendent of Department of Educa-tion, $194,500; Executive Director of Rehabilitation Services Commis-sion, $120,328; and Director of Department of Aging, $105,684.
(hhh) Responsibilities shared between three Commissioners, $116,713, $114,713 and $109,250 and General Administrator, $96,000.
(iii) Responsibilities shared between Commissioner, Office of Health and Human Services, $141,828, and Director of the Department of Human Services, $129,627, and reports to the Commissioner, Office of Health and Human Services.
(jjj) Solid waste is managed by the Rhode Island Resource Recov-ery Corporation (RIRRC). Although not a department of the state government, RIRRC is a public corporation and a component of the State of Rhode Island for financial reporting purposes. To be financially self-sufficient, the agency earns revenue through the sale of recyclable products, methane gas royalties and fees for its services.
(kkk) Function split between three agencies: Communications— $142,425; Energy Regulation—$139,762; Utility and Railroad Safety— $128,438.
179 of 253
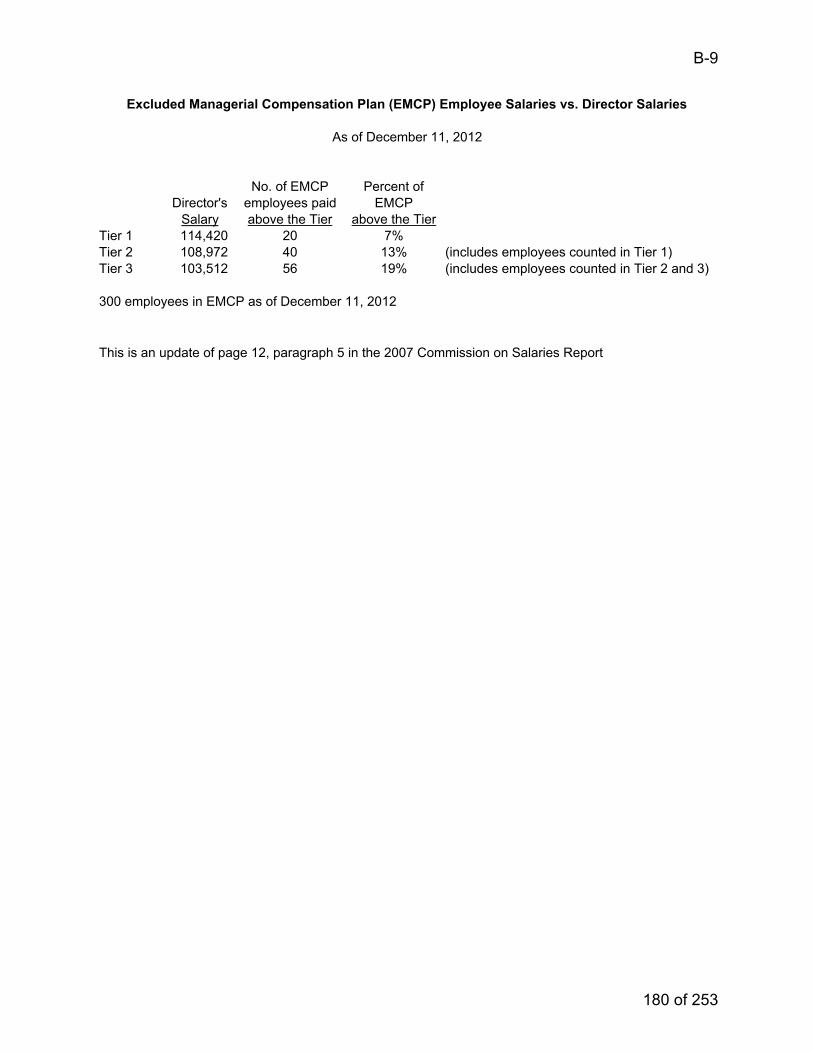
No. of EMCP Percent of
Director's employees paid EMCP
Salary above the Tier above the Tier
Tier 1 114,420 20 7%
Tier 2 108,972 40 13% (includes employees counted in Tier 1)
Tier 3 103,512 56 19% (includes employees counted in Tier 2 and 3)
300 employees in EMCP as of December 11, 2012
This is an update of page 12, paragraph 5 in the 2007 Commission on Salaries Report
Excluded Managerial Compensation Plan (EMCP) Employee Salaries vs. Director Salaries
As of December 11, 2012
B-9
180 of 253
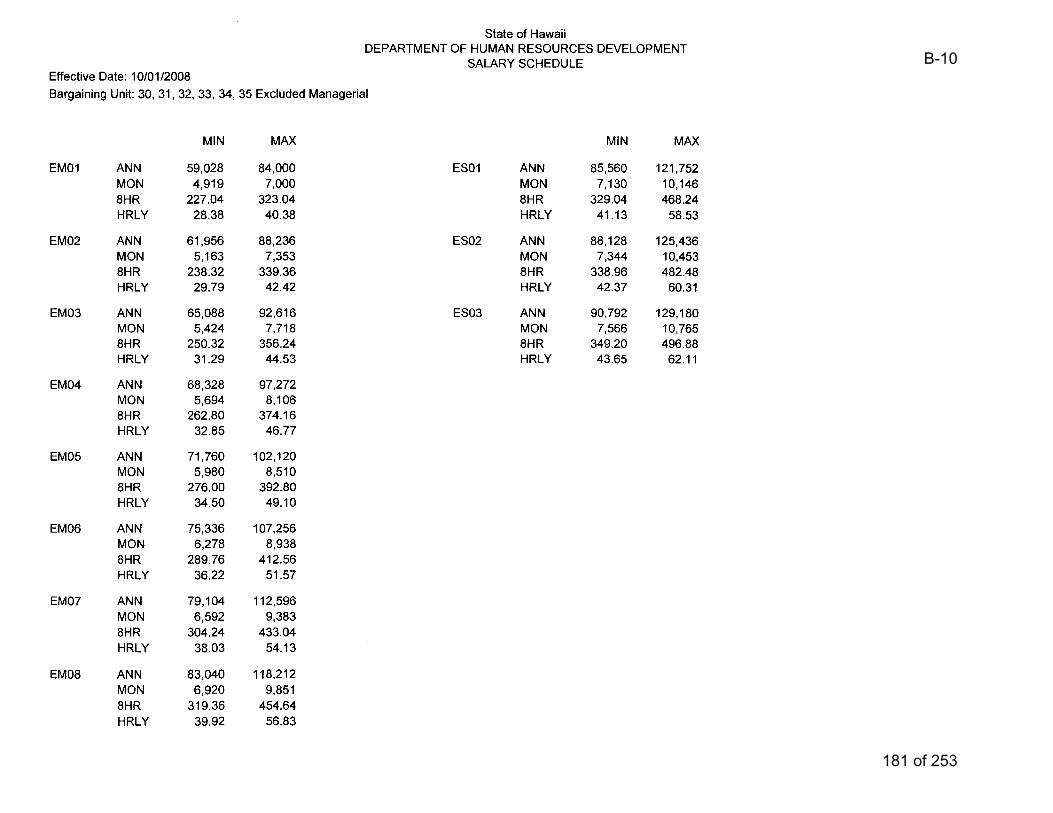
B-10
181 of 253
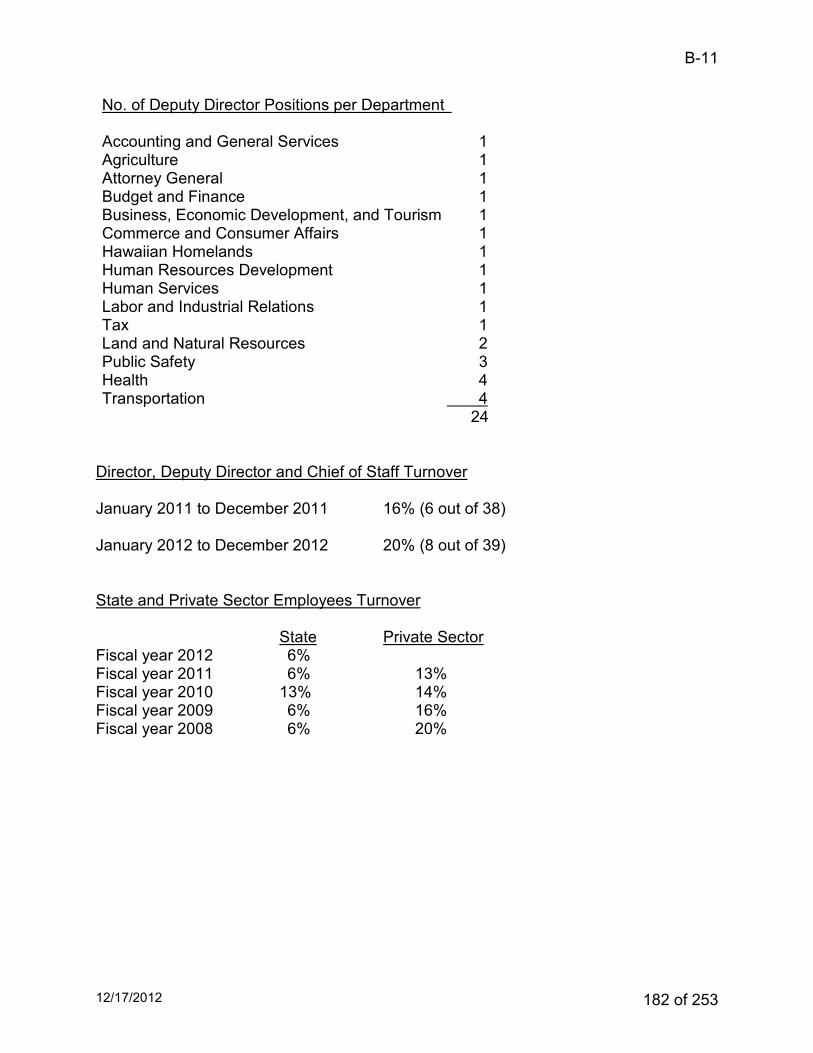
12/17/2012
No. of Deputy Director Positions per Department
Accounting and General Services 1 Agriculture 1
Attorney General 1
Budget and Finance 1
Business, Economic Development, and Tourism 1 Commerce and Consumer Affairs 1 Hawaiian Homelands 1
Human Resources Development 1 Human Services 1
Labor and Industrial Relations 1 Tax 1
Land and Natural Resources 2 Public Safety 3
Health 4
Transportation 4 24
Director, Deputy Director and Chief of Staff Turnover January 2011 to December 2011 16% (6 out of 38) January 2012 to December 2012 20% (8 out of 39) State and Private Sector Employees Turnover State Private Sector Fiscal year 2012 6% Fiscal year 2011 6% 13% Fiscal year 2010 13% 14% Fiscal year 2009 6% 16% Fiscal year 2008 6% 20%
B-11
182 of 253
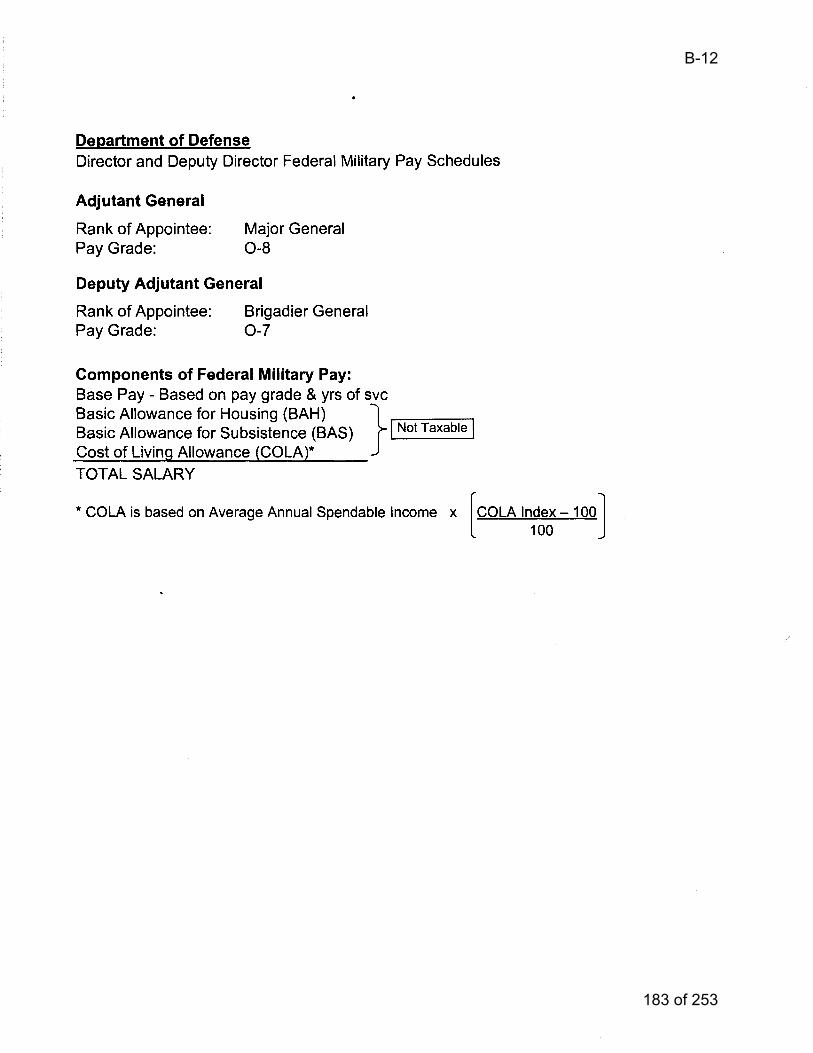
B-12
183 of 253
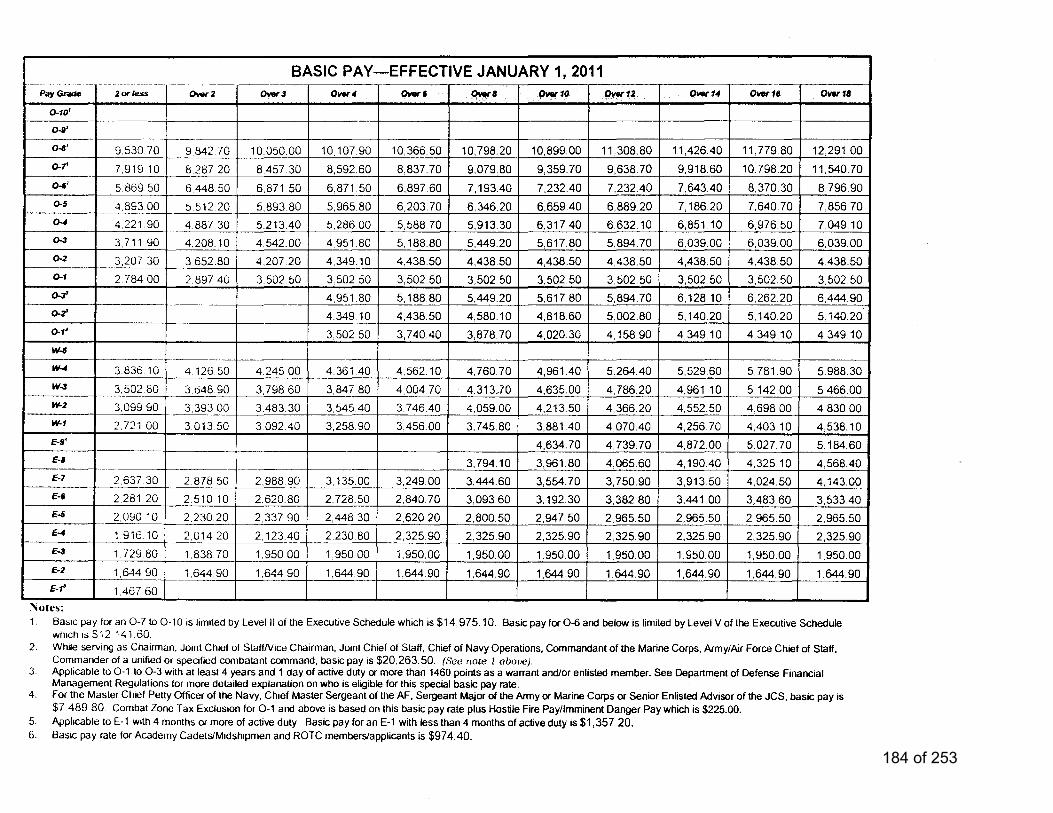
184 of 253
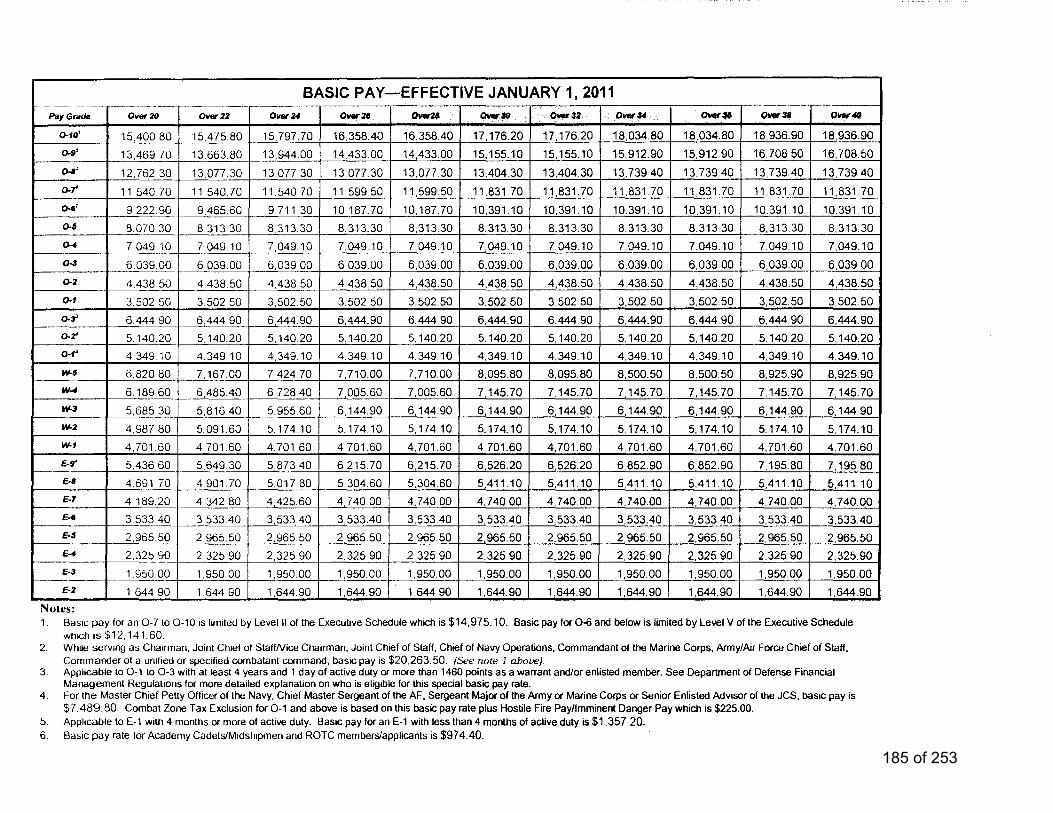
185 of 253
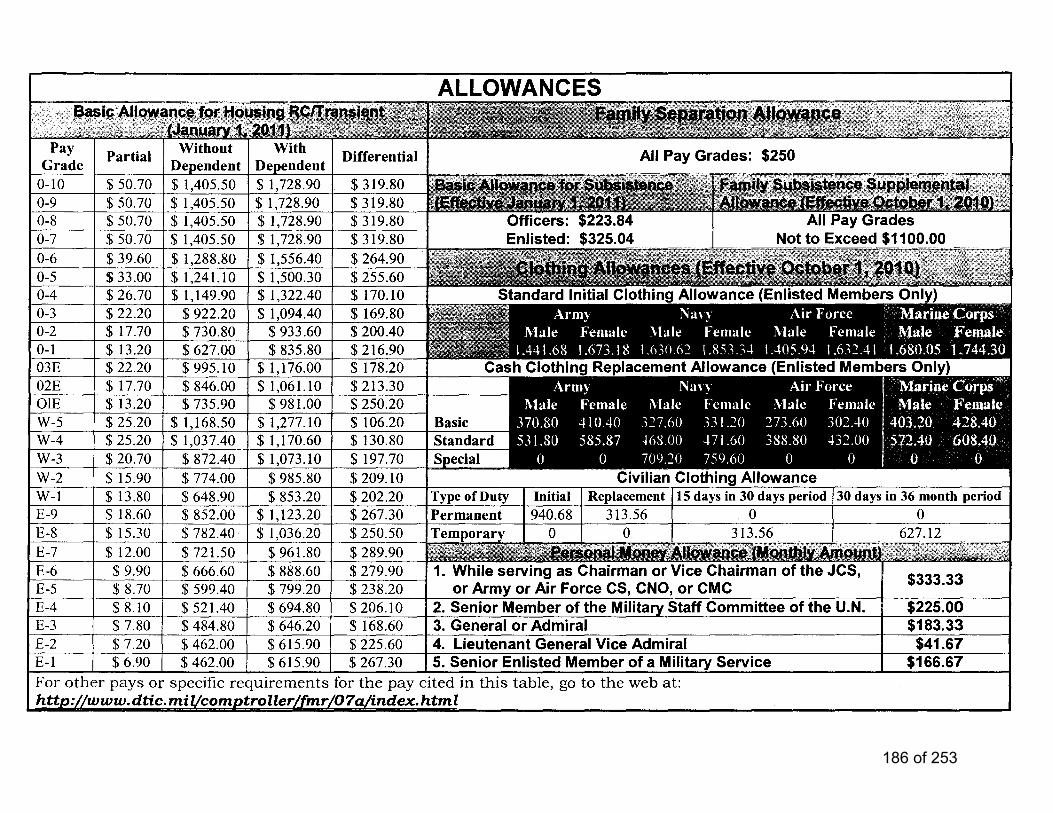
186 of 253
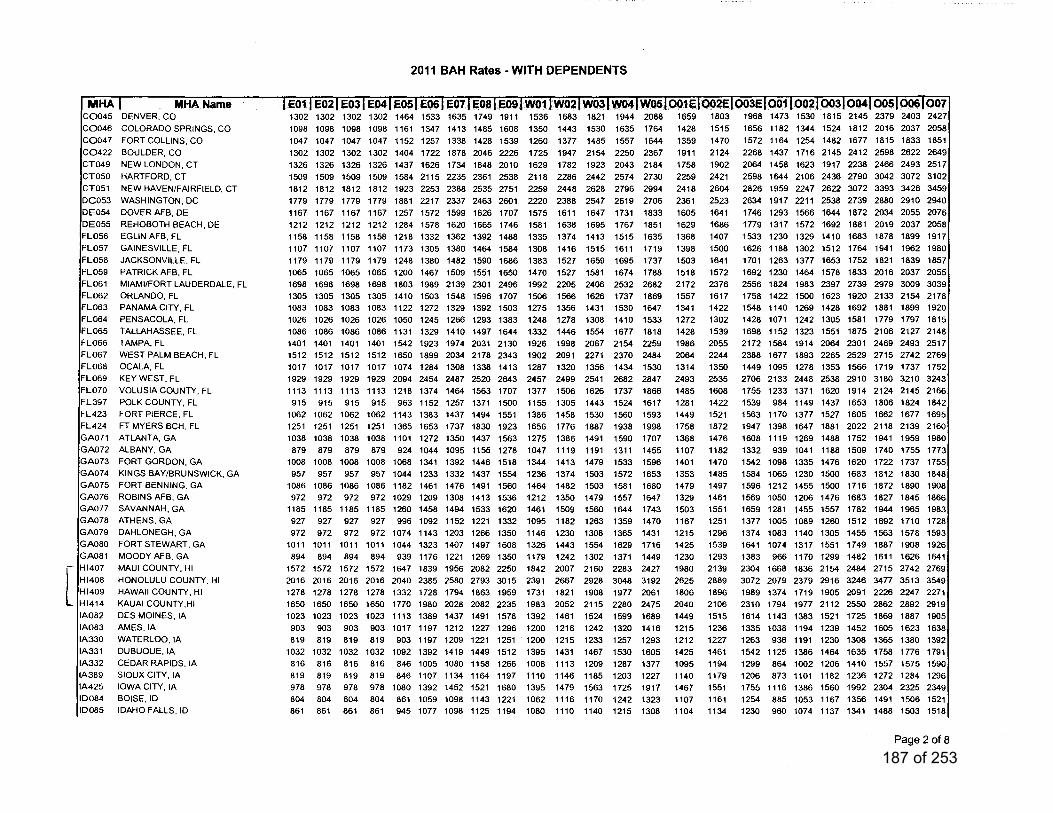
187 of 253
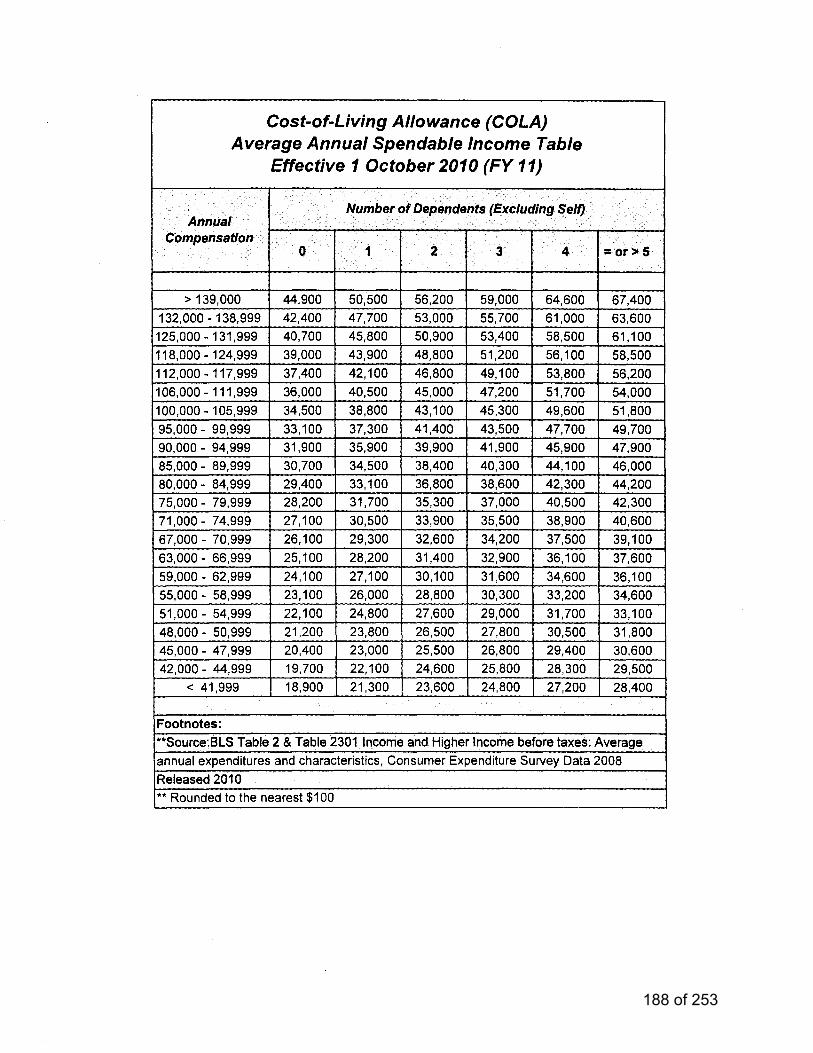
188 of 253
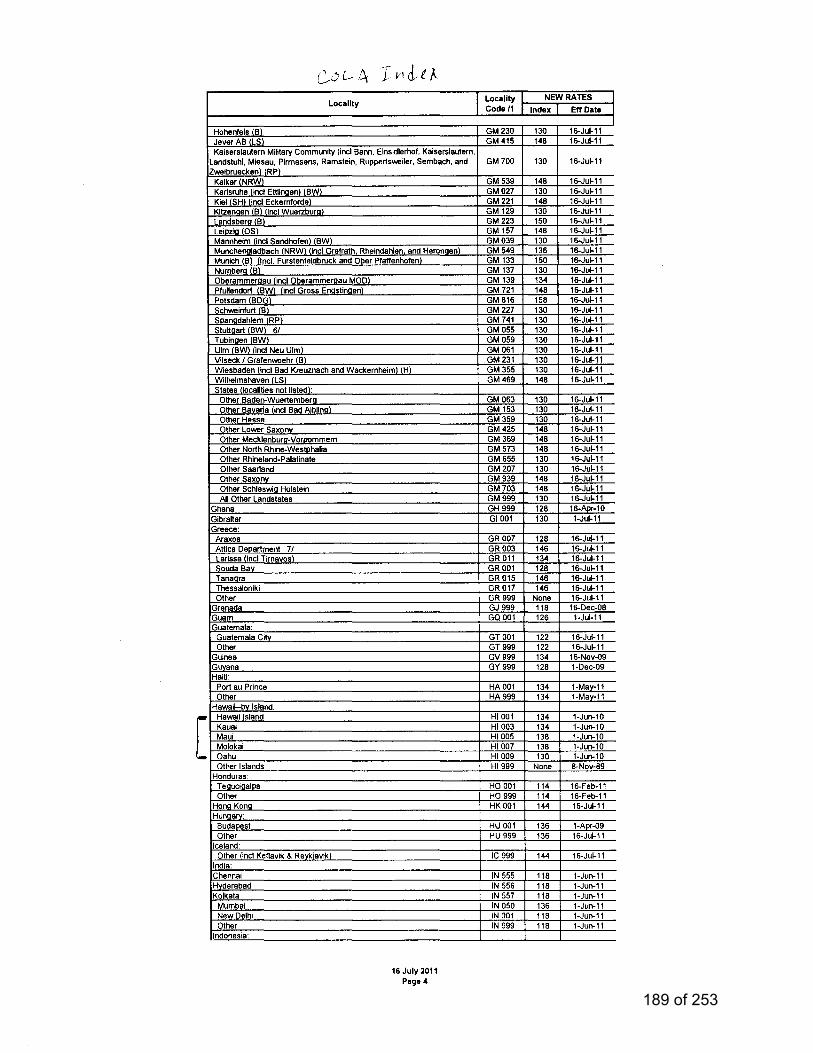
189 of 253

Appendix C
Judicial Branch
Appendices
190 of 253
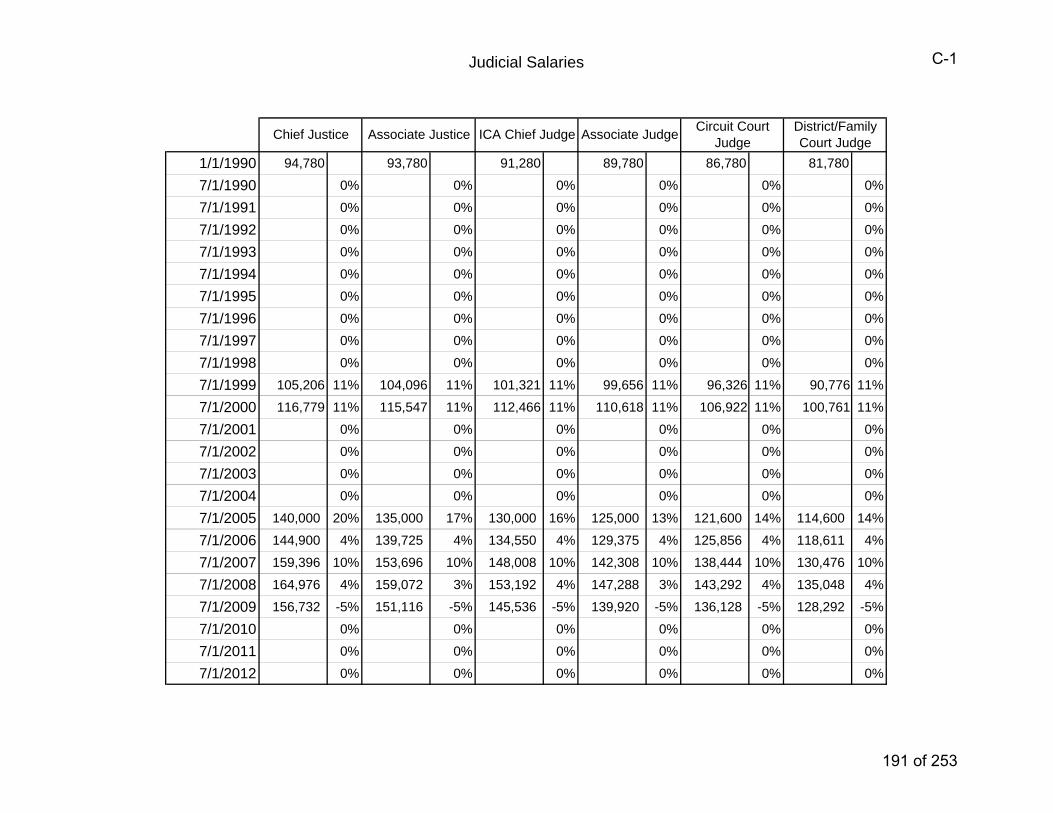
1/1/1990 94,780 93,780 91,280 89,780 86,780 81,780
7/1/1990 0% 0% 0% 0% 0% 0%
7/1/1991 0% 0% 0% 0% 0% 0%
7/1/1992 0% 0% 0% 0% 0% 0%
7/1/1993 0% 0% 0% 0% 0% 0%
7/1/1994 0% 0% 0% 0% 0% 0%
7/1/1995 0% 0% 0% 0% 0% 0%
7/1/1996 0% 0% 0% 0% 0% 0%
7/1/1997 0% 0% 0% 0% 0% 0%
7/1/1998 0% 0% 0% 0% 0% 0%
7/1/1999 105,206 11% 104,096 11% 101,321 11% 99,656 11% 96,326 11% 90,776 11%
7/1/2000 116,779 11% 115,547 11% 112,466 11% 110,618 11% 106,922 11% 100,761 11%
7/1/2001 0% 0% 0% 0% 0% 0%
7/1/2002 0% 0% 0% 0% 0% 0%
7/1/2003 0% 0% 0% 0% 0% 0%
7/1/2004 0% 0% 0% 0% 0% 0%
7/1/2005 140,000 20% 135,000 17% 130,000 16% 125,000 13% 121,600 14% 114,600 14%
7/1/2006 144,900 4% 139,725 4% 134,550 4% 129,375 4% 125,856 4% 118,611 4%
7/1/2007 159,396 10% 153,696 10% 148,008 10% 142,308 10% 138,444 10% 130,476 10%
7/1/2008 164,976 4% 159,072 3% 153,192 4% 147,288 3% 143,292 4% 135,048 4%
7/1/2009 156,732 -5% 151,116 -5% 145,536 -5% 139,920 -5% 136,128 -5% 128,292 -5%
7/1/2010 0% 0% 0% 0% 0% 0%
7/1/2011 0% 0% 0% 0% 0% 0%
7/1/2012 0% 0% 0% 0% 0% 0%
Judicial Salaries
Circuit Court Judge
District/Family Court JudgeChief Justice Associate Justice ICA Chief Judge Associate Judge
C-1
191 of 253
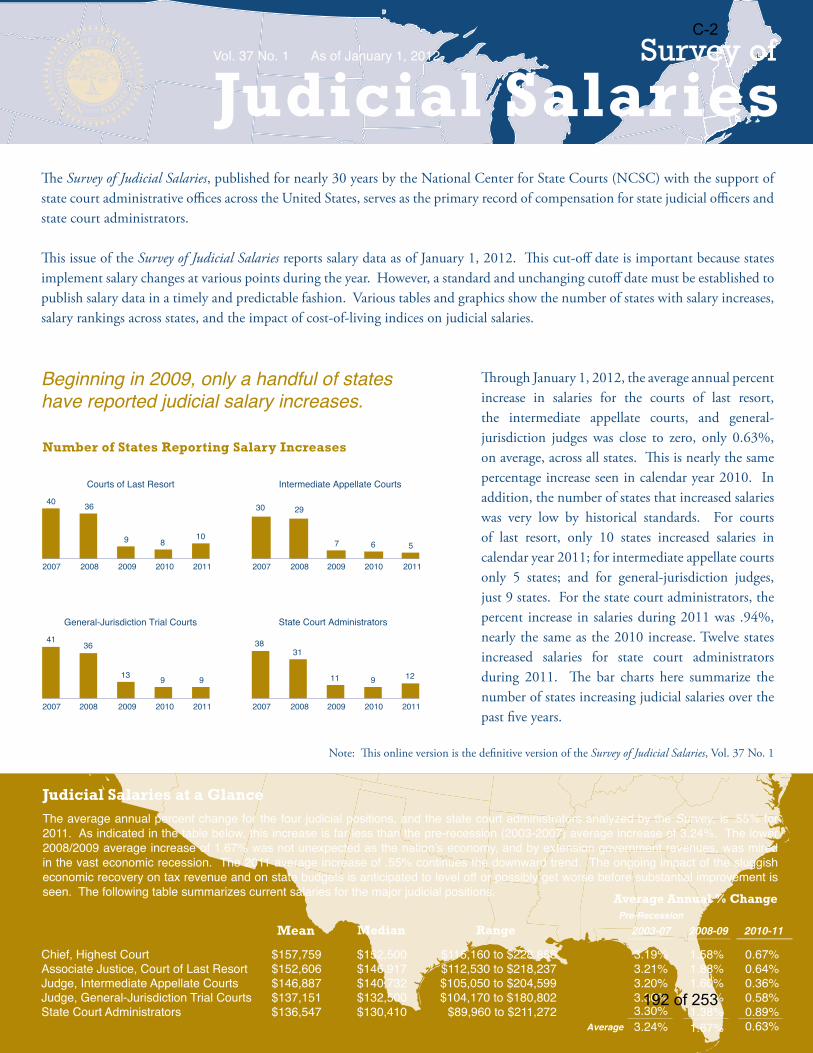
The Survey of Judicial Salaries, published for nearly 30 years by the National Center for State Courts (NCSC) with the support of state court administrative offices across the United States, serves as the primary record of compensation for state judicial officers and state court administrators.
This issue of the Survey of Judicial Salaries reports salary data as of January 1, 2012. This cut-off date is important because states implement salary changes at various points during the year. However, a standard and unchanging cutoff date must be established to publish salary data in a timely and predictable fashion. Various tables and graphics show the number of states with salary increases, salary rankings across states, and the impact of cost-of-living indices on judicial salaries.
Through January 1, 2012, the average annual percent increase in salaries for the courts of last resort, the intermediate appellate courts, and general-jurisdiction judges was close to zero, only 0.63%, on average, across all states. This is nearly the same percentage increase seen in calendar year 2010. In addition, the number of states that increased salaries was very low by historical standards. For courts of last resort, only 10 states increased salaries in calendar year 2011; for intermediate appellate courts only 5 states; and for general-jurisdiction judges, just 9 states. For the state court administrators, the percent increase in salaries during 2011 was .94%, nearly the same as the 2010 increase. Twelve states increased salaries for state court administrators during 2011. The bar charts here summarize the number of states increasing judicial salaries over the past five years.
Note: This online version is the definitive version of the Survey of Judicial Salaries, Vol. 37 No. 1
State Court AdministratorsGeneral-Jurisdiction Trial Courts
Intermediate Appellate CourtsCourts of Last Resort
2007 2008 2009 2010 2011 2007 2008 2009 2010 2011
2007
4136
13 9 9
40 36
9 810
3831
11 9 12
30 29
7 6 5
2008 2009 2010 2011 2007 2008 2009 2010 2011
Survey of
Judicial SalariesVol. 37 No. 1 As of January 1, 2012
Beginning in 2009, only a handful of states have reported judicial salary increases.
Judicial Salaries at a GlanceThe average annual percent change for the four judicial positions, and the state court administrators analyzed by the Survey, is .55% for 2011. As indicated in the table below, this increase is far less than the pre-recession (2003-2007) average increase of 3.24%. The lower 2008/2009 average increase of 1.67% was not unexpected as the nation’s economy, and by extension government revenues, was mired in the vast economic recession. The 2011 average increase of .55% continues the downward trend. The ongoing impact of the sluggish economic recovery on tax revenue and on state budgets is anticipated to level off or possibly get worse before substantial improvement is seen. The following table summarizes current salaries for the major judicial positions.
Chief, Highest CourtAssociate Justice, Court of Last ResortJudge, Intermediate Appellate CourtsJudge, General-Jurisdiction Trial CourtsState Court Administrators
$157,759 $152,606 $146,887 $137,151 $136,547
Mean Median Range 2003-07
Average
Pre-Recession
2008-09 2010-11
Average Annual % Change
$152,500 $146,917 $140,732 $132,500 $130,410
3.19%3.21%3.20%3.30%3.30%3.24%
1.58%1.88%1.60%1.91%1.38%1.67%
0.67%0.64%0.36%0.58%0.89%0.63%
$115,160 to $228,856 $112,530 to $218,237 $105,050 to $204,599 $104,170 to $180,802 $89,960 to $211,272
Number of States Reporting Salary Increases
C-2
192 of 253
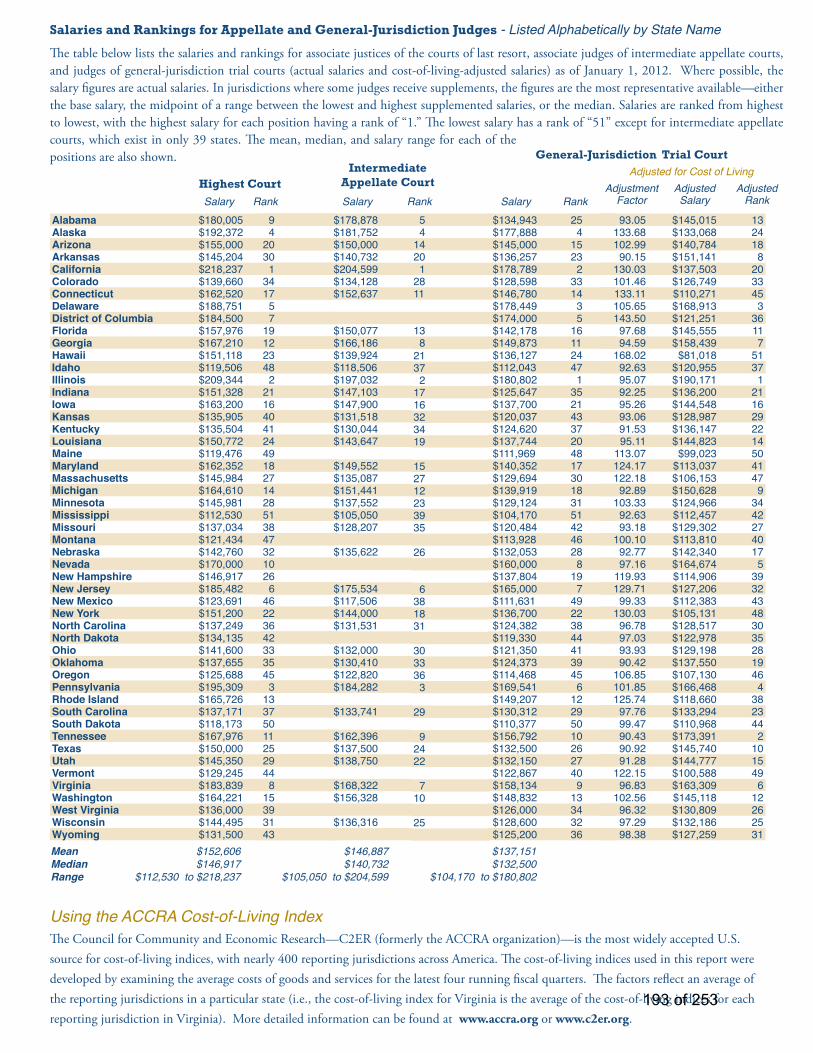
AlabamaAlaskaArizonaArkansasCaliforniaColoradoConnecticutDelawareDistrict of ColumbiaFloridaGeorgiaHawaiiIdahoIllinoisIndianaIowaKansasKentuckyLouisianaMaineMarylandMassachusettsMichiganMinnesotaMississippiMissouriMontanaNebraskaNevadaNew HampshireNew JerseyNew MexicoNew YorkNorth CarolinaNorth DakotaOhioOklahoma OregonPennsylvaniaRhode IslandSouth CarolinaSouth DakotaTennesseeTexasUtahVermontVirginiaWashingtonWest VirginiaWisconsinWyoming
$180,005 $192,372 $155,000 $145,204 $218,237 $139,660 $162,520 $188,751 $184,500 $157,976 $167,210 $151,118 $119,506 $209,344 $151,328 $163,200 $135,905 $135,504 $150,772 $119,476 $162,352 $145,984 $164,610 $145,981 $112,530 $137,034 $121,434 $142,760 $170,000 $146,917 $185,482 $123,691 $151,200 $137,249 $134,135 $141,600 $137,655 $125,688 $195,309 $165,726 $137,171 $118,173 $167,976 $150,000 $145,350 $129,245 $183,839 $164,221 $136,000 $144,495 $131,500
9 4 20 30 1 34 17 5 7 19 12 23 48 2 21 16 40 41 24 49 18 27 14 28 51 38 47 32 10 26 6 46 22 36 42 33 35 45 3 13 37 50 11 25 29 44 8 15 39 31 43
$178,878 $181,752 $150,000 $140,732 $204,599 $134,128 $152,637
$150,077 $166,186 $139,924 $118,506 $197,032 $147,103 $147,900 $131,518 $130,044 $143,647
$149,552 $135,087 $151,441 $137,552 $105,050 $128,207
$135,622
$175,534 $117,506 $144,000 $131,531
$132,000 $130,410 $122,820 $184,282
$133,741
$162,396 $137,500 $138,750
$168,322 $156,328
$136,316
5 4 14 20 1 28 11
13 8 21 37 2 17 16 32 34 19
15 27 12 23 39 35
26
6 38 18 31
30 33 36 3
29
9 24 22
7 10
25
$134,943 $177,888 $145,000 $136,257 $178,789 $128,598 $146,780 $178,449 $174,000 $142,178 $149,873 $136,127 $112,043 $180,802 $125,647 $137,700 $120,037 $124,620 $137,744 $111,969 $140,352 $129,694 $139,919 $129,124 $104,170 $120,484 $113,928 $132,053 $160,000 $137,804 $165,000 $111,631 $136,700 $124,382 $119,330 $121,350 $124,373 $114,468 $169,541 $149,207 $130,312 $110,377 $156,792 $132,500 $132,150 $122,867 $158,134 $148,832 $126,000 $128,600 $125,200
25 4 15 23 2 33 14 3 5 16 11 24 47 1 35 21 43 37 20 48 17 30 18 31 51 42 46 28 8 19 7 49 22 38 44 41 39 45 6 12 29 50 10 26 27 40 9 13 34 32 36
93.05133.68102.99
90.15130.03101.46133.11105.65143.50
97.6894.59
168.0292.6395.0792.2595.2693.0691.5395.11
113.07124.17122.18
92.89103.33
92.6393.18
100.1092.7797.16
119.93129.71
99.33130.03
96.7897.0393.9390.42
106.85101.85125.74
97.7699.4790.4390.9291.28
122.1596.83
102.5696.3297.2998.38
$145,015 $133,068 $140,784 $151,141 $137,503 $126,749 $110,271 $168,913 $121,251 $145,555 $158,439
$81,018 $120,955 $190,171 $136,200 $144,548 $128,987 $136,147 $144,823
$99,023 $113,037 $106,153 $150,628 $124,966 $112,457 $129,302 $113,810 $142,340 $164,674 $114,906 $127,206 $112,383 $105,131 $128,517 $122,978 $129,198 $137,550 $107,130 $166,468 $118,660 $133,294 $110,968 $173,391 $145,740 $144,777 $100,588 $163,309 $145,118 $130,809 $132,186 $127,259
132418
8203345
336117
5137
12116292214504147
93442274017
5393243483035281946
4382344
2101549
612262531
The table below lists the salaries and rankings for associate justices of the courts of last resort, associate judges of intermediate appellate courts, and judges of general-jurisdiction trial courts (actual salaries and cost-of-living-adjusted salaries) as of January 1, 2012. Where possible, the salary figures are actual salaries. In jurisdictions where some judges receive supplements, the figures are the most representative available—either the base salary, the midpoint of a range between the lowest and highest supplemented salaries, or the median. Salaries are ranked from highest to lowest, with the highest salary for each position having a rank of “1.” The lowest salary has a rank of “51” except for intermediate appellate courts, which exist in only 39 states. The mean, median, and salary range for each of the positions are also shown.
Salaries and Rankings for Appellate and General-Jurisdiction Judges - Listed Alphabetically by State Name
Highest CourtSalary Salary Salary
Adjustment FactorRank Rank Rank
Adjusted Salary
Adjusted Rank
Intermediate Appellate Court
Adjusted for Cost of LivingGeneral-Jurisdiction Trial Court
The Council for Community and Economic Research—C2ER (formerly the ACCRA organization)—is the most widely accepted U.S. source for cost-of-living indices, with nearly 400 reporting jurisdictions across America. The cost-of-living indices used in this report were developed by examining the average costs of goods and services for the latest four running fiscal quarters. The factors reflect an average of the reporting jurisdictions in a particular state (i.e., the cost-of-living index for Virginia is the average of the cost-of-living indices for each reporting jurisdiction in Virginia). More detailed information can be found at www.accra.org or www.c2er.org.
Using the ACCRA Cost-of-Living Index
MeanMedianRange
$152,606 $146,917
$112,530 to $218,237
$146,887 $140,732
$105,050 to $204,599
$137,151 $132,500
$104,170 to $180,802
193 of 253
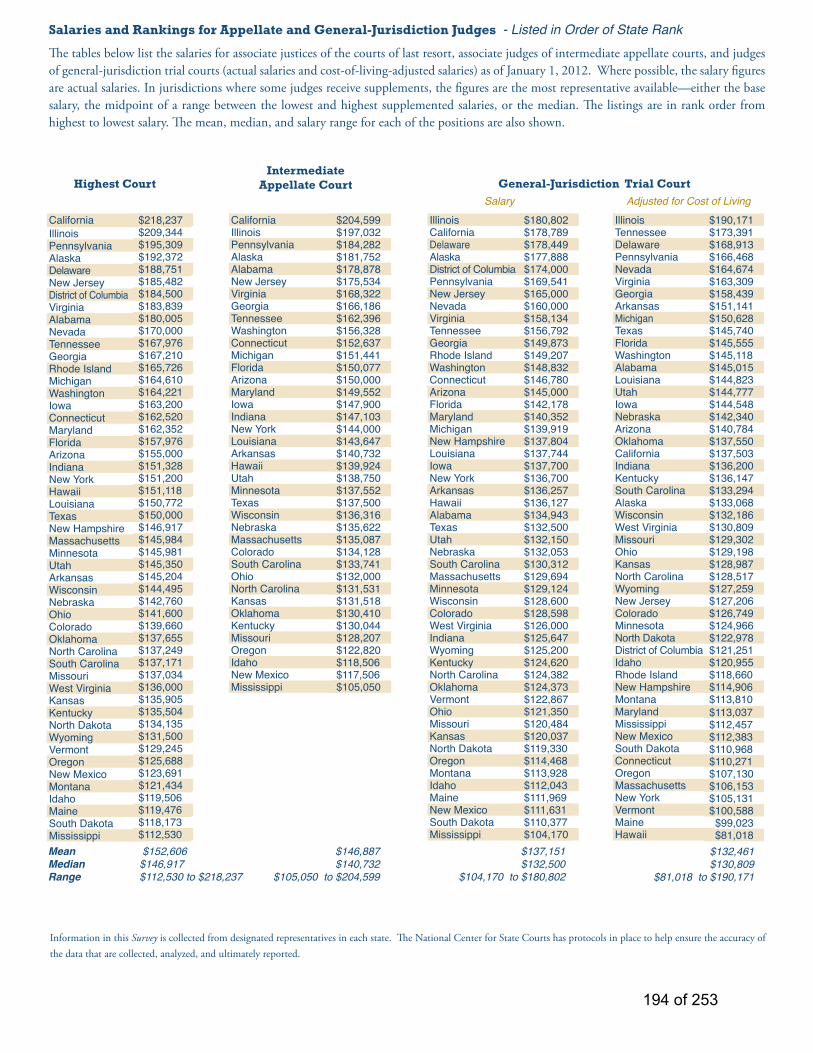
The tables below list the salaries for associate justices of the courts of last resort, associate judges of intermediate appellate courts, and judges of general-jurisdiction trial courts (actual salaries and cost-of-living-adjusted salaries) as of January 1, 2012. Where possible, the salary figures are actual salaries. In jurisdictions where some judges receive supplements, the figures are the most representative available—either the base salary, the midpoint of a range between the lowest and highest supplemented salaries, or the median. The listings are in rank order from highest to lowest salary. The mean, median, and salary range for each of the positions are also shown.
Highest CourtIntermediate
Appellate Court Salary Adjusted for Cost of Living
General-Jurisdiction Trial Court
Salaries and Rankings for Appellate and General-Jurisdiction Judges - Listed in Order of State Rank
Information in this Survey is collected from designated representatives in each state. The National Center for State Courts has protocols in place to help ensure the accuracy of the data that are collected, analyzed, and ultimately reported.
MeanMedianRange
$152,606 $146,917 $112,530 to $218,237
$146,887 $140,732
$105,050 to $204,599
$137,151 $132,500
$104,170 to $180,802
$132,461 $130,809
$81,018 to $190,171
CaliforniaIllinoisPennsylvaniaAlaskaDelawareNew JerseyDistrict of ColumbiaVirginiaAlabamaNevadaTennesseeGeorgiaRhode IslandMichiganWashingtonIowaConnecticutMarylandFloridaArizonaIndianaNew YorkHawaiiLouisianaTexasNew HampshireMassachusettsMinnesotaUtahArkansasWisconsinNebraskaOhioColoradoOklahomaNorth CarolinaSouth CarolinaMissouriWest VirginiaKansasKentuckyNorth DakotaWyomingVermontOregonNew MexicoMontanaIdahoMaineSouth DakotaMississippi
$218,237 $209,344 $195,309 $192,372 $188,751 $185,482 $184,500 $183,839 $180,005 $170,000 $167,976 $167,210 $165,726 $164,610 $164,221 $163,200 $162,520 $162,352 $157,976 $155,000 $151,328 $151,200 $151,118 $150,772 $150,000 $146,917 $145,984 $145,981 $145,350 $145,204 $144,495 $142,760 $141,600 $139,660 $137,655 $137,249 $137,171 $137,034 $136,000 $135,905 $135,504 $134,135 $131,500 $129,245 $125,688 $123,691 $121,434 $119,506 $119,476 $118,173 $112,530
CaliforniaIllinoisPennsylvaniaAlaskaAlabamaNew JerseyVirginiaGeorgiaTennesseeWashingtonConnecticutMichiganFloridaArizonaMarylandIowaIndianaNew YorkLouisianaArkansasHawaiiUtahMinnesotaTexasWisconsinNebraskaMassachusettsColoradoSouth CarolinaOhioNorth CarolinaKansasOklahomaKentuckyMissouriOregonIdahoNew MexicoMississippi
$204,599 $197,032 $184,282 $181,752 $178,878 $175,534 $168,322 $166,186 $162,396 $156,328 $152,637 $151,441 $150,077 $150,000 $149,552 $147,900 $147,103 $144,000 $143,647 $140,732 $139,924 $138,750 $137,552 $137,500 $136,316 $135,622 $135,087 $134,128 $133,741 $132,000 $131,531 $131,518 $130,410 $130,044 $128,207 $122,820 $118,506 $117,506 $105,050
IllinoisCaliforniaDelawareAlaskaDistrict of ColumbiaPennsylvaniaNew JerseyNevadaVirginiaTennesseeGeorgiaRhode IslandWashingtonConnecticutArizonaFloridaMarylandMichiganNew HampshireLouisianaIowaNew YorkArkansasHawaiiAlabamaTexasUtahNebraskaSouth CarolinaMassachusettsMinnesotaWisconsinColoradoWest VirginiaIndianaWyomingKentuckyNorth CarolinaOklahomaVermontOhioMissouriKansasNorth DakotaOregonMontanaIdahoMaineNew MexicoSouth DakotaMississippi
$180,802 $178,789 $178,449 $177,888 $174,000 $169,541 $165,000 $160,000 $158,134 $156,792 $149,873 $149,207 $148,832 $146,780 $145,000 $142,178 $140,352 $139,919 $137,804 $137,744 $137,700 $136,700 $136,257 $136,127 $134,943 $132,500 $132,150 $132,053 $130,312 $129,694 $129,124 $128,600 $128,598 $126,000 $125,647 $125,200 $124,620 $124,382 $124,373 $122,867 $121,350 $120,484 $120,037 $119,330 $114,468 $113,928 $112,043 $111,969 $111,631 $110,377 $104,170
IllinoisTennesseeDelawarePennsylvaniaNevadaVirginiaGeorgiaArkansasMichiganTexasFloridaWashingtonAlabamaLouisianaUtahIowaNebraskaArizonaOklahomaCaliforniaIndianaKentuckySouth CarolinaAlaskaWisconsinWest VirginiaMissouriOhioKansasNorth CarolinaWyomingNew JerseyColoradoMinnesotaNorth DakotaDistrict of ColumbiaIdahoRhode IslandNew HampshireMontanaMarylandMississippiNew MexicoSouth DakotaConnecticutOregonMassachusettsNew YorkVermontMaineHawaii
$190,171 $173,391 $168,913 $166,468 $164,674 $163,309 $158,439 $151,141 $150,628 $145,740 $145,555 $145,118 $145,015 $144,823 $144,777 $144,548 $142,340 $140,784 $137,550 $137,503 $136,200 $136,147 $133,294 $133,068 $132,186 $130,809 $129,302 $129,198 $128,987 $128,517 $127,259 $127,206 $126,749 $124,966 $122,978 $121,251 $120,955 $118,660 $114,906 $113,810 $113,037 $112,457 $112,383 $110,968 $110,271 $107,130 $106,153 $105,131 $100,588 $99,023 $81,018
194 of 253

National Center for State Courts NCSC Officers and Management Staff
The National Center for State Courts is a nonprofit organization dedicated to the modernization of court operations and the improvement of justice at the state and local levels throughout the country. It functions as an extension of the state court systems, working for them at their direction and providing for them an effective voice in matters of national importance.
The National Center acts as a focal point for state judicial reform and provides the means for reinvesting in the all states the profits gained from judicial advances in any state. Funding for this Survey is made possible by assessments from all the states and territories and by individual contributions.
Points of view are those of the authors and do not necessarily represent the official position or policies of the National Center for State Courts. If you have questions or comments regarding this Survey, contact the National Center for State Courts, Knowledge and Information Services, 300 Newport Avenue, Williamsburg, VA 23185, (800) 616-6164, fax (757) 564-2075.
This Survey was prepared by the Knowledge and Information Services (KIS) Office of the National Center for State Courts, with assistance from
JUDICIAL SALARY TRACKERIntroducing an interactive interface that presents judicial salary data in easily understood visual displays.
What salaries are required to keep pace with inflation?
Key Measures for Decision Makers
Headquarters300 Newport AvenueWilliamsburg, VA 23185www.ncsc.org
Mary Campbell McQueenPresident
Robert N. BaldwinExecutive Vice President and General Counsel
Thomas M. Clarke, Vice PresidentResearch and Technology Services
John R. Meeks, Vice PresidentInstitute for Court Management
Jesse Rutledge, Vice PresidentExternal Affairs
Gwen W. Williams, Chief FinancialOfficer and Vice President of Finance and Administration
Denver Office707 Seventeenth Street, Suite 2900Denver, CO 80202-3429
Daniel J. Hall, Vice PresidentCourt Consulting Services
Washington Office2425 Wilson Boulevard, Suite 350Arlington, VA 22201
Jeffrey A. Apperson,Vice PresidentInternational Program Division
© Copyright 2012 National Center for State Courts. Contents of this publication may be copied and reprinted without permission from the National Center for State Courts. Proper attribution is requested.
www.ncsc.org/salarytracker
Dynamic Access!No Waiting for Print Editions
Map-Based Charts to Customize and Print
How do your state’s salaries compare when adjusted for cost of living?
195 of 253
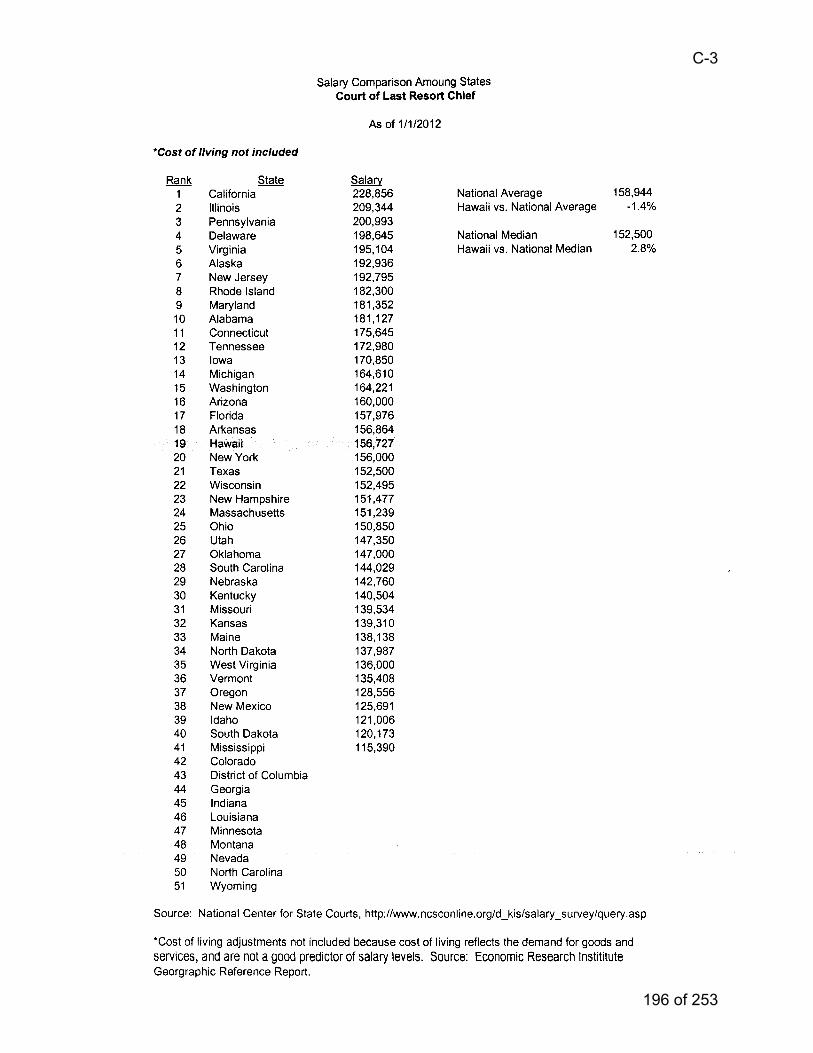
C-3
196 of 253
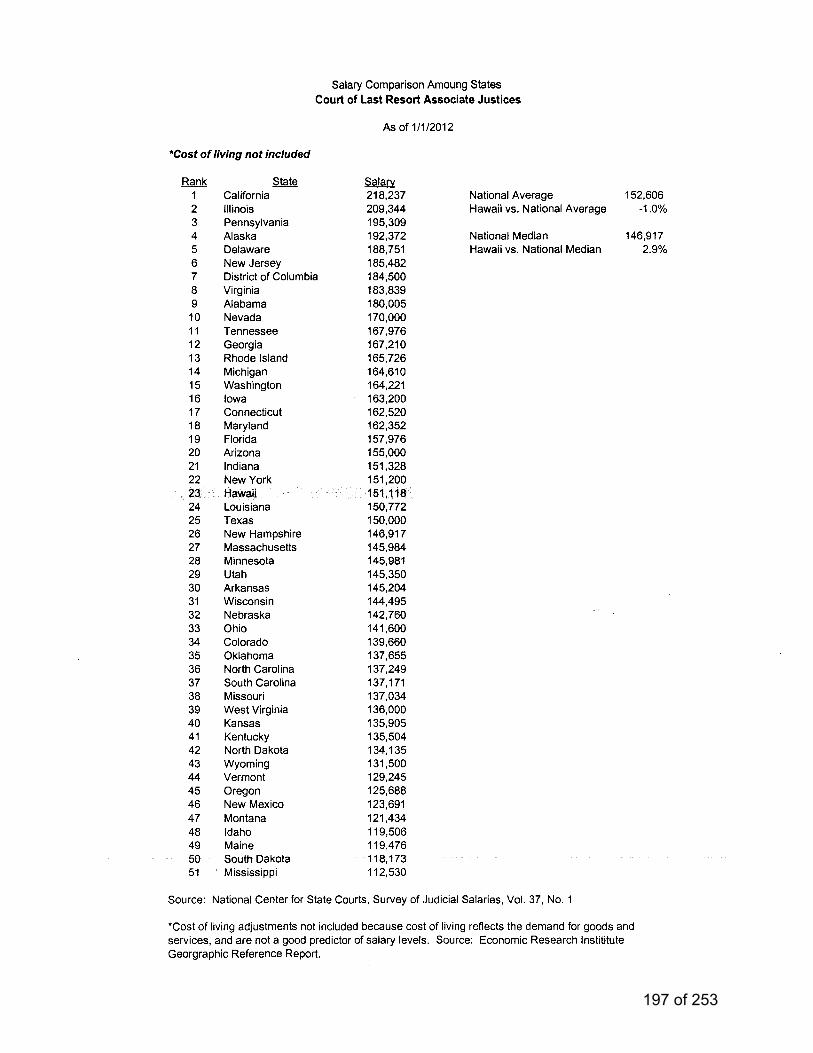
197 of 253
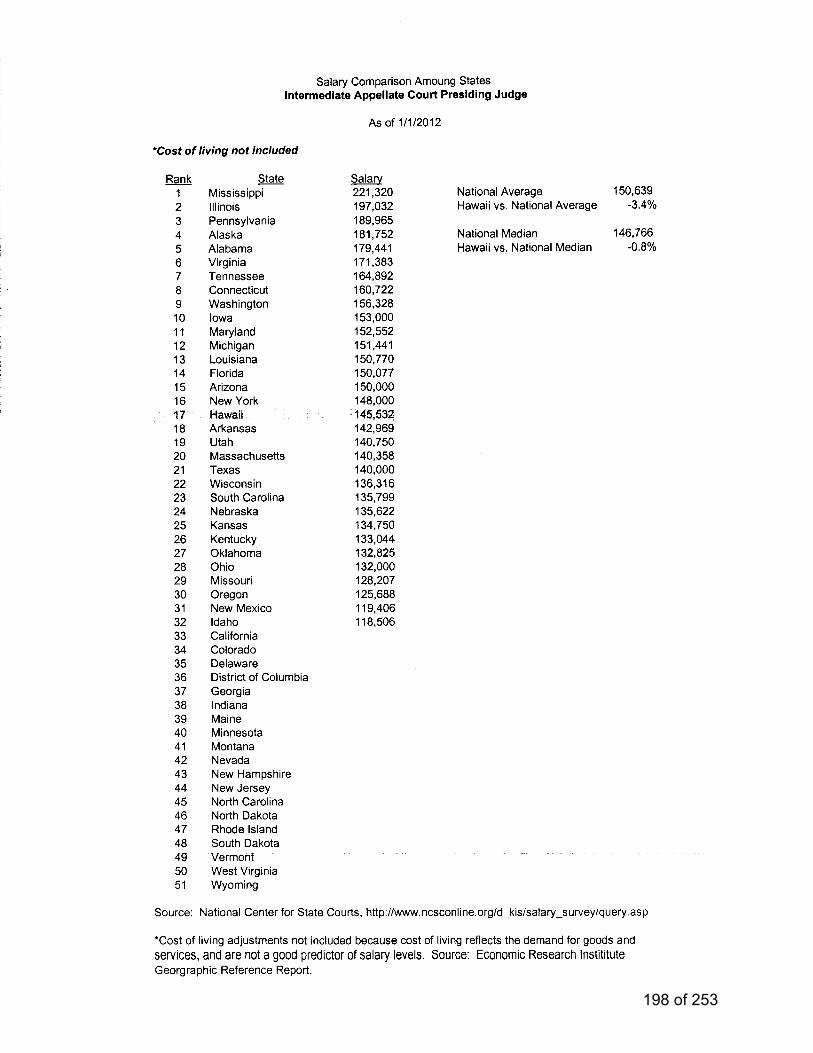
198 of 253
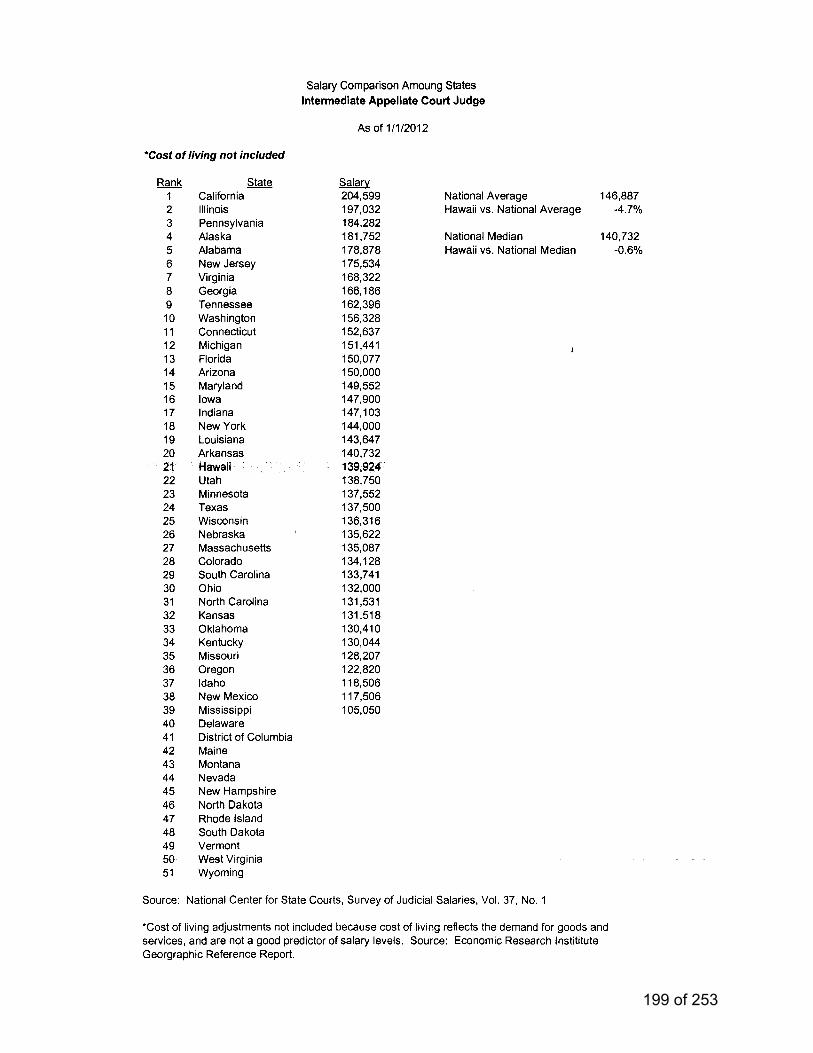
199 of 253
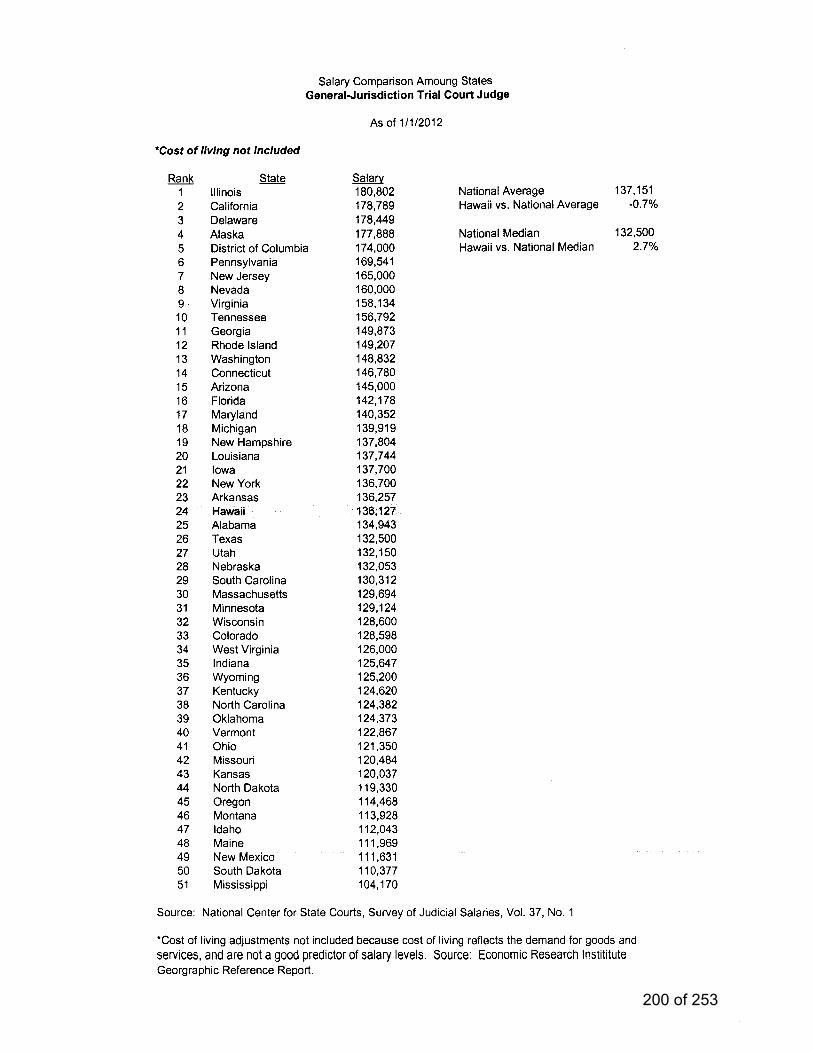
200 of 253

C-4
201 of 253
202 of 253
203 of 253
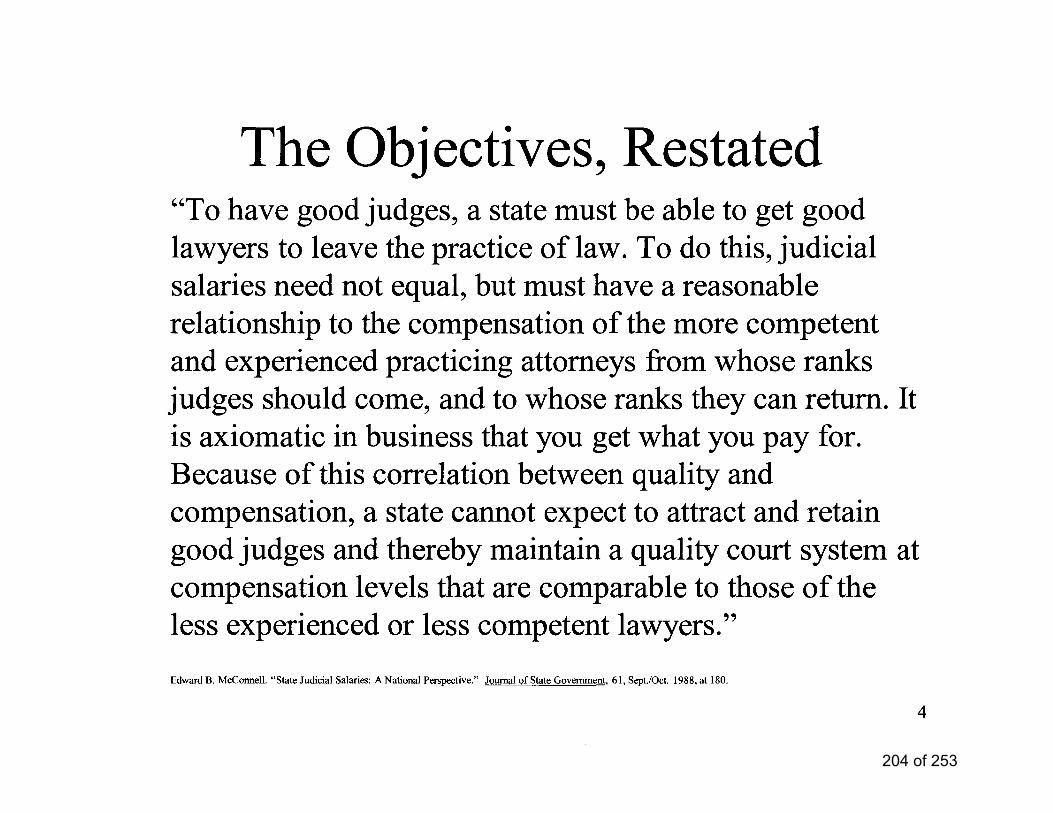
204 of 253
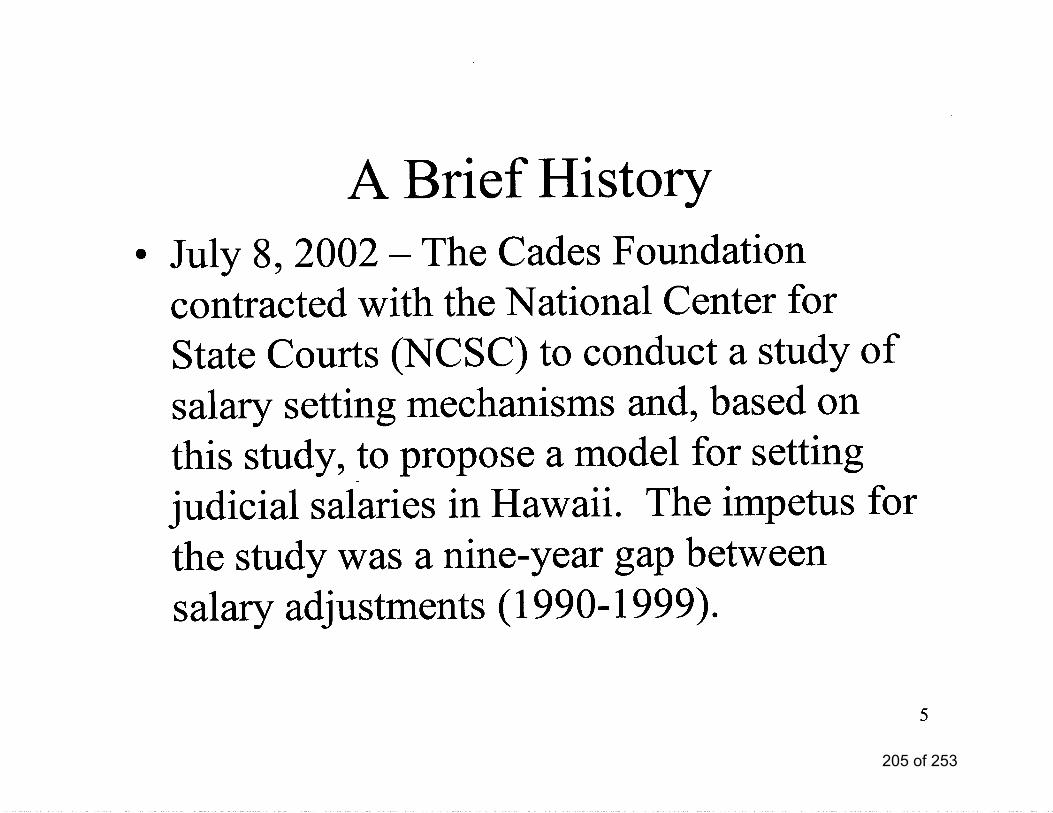
205 of 253
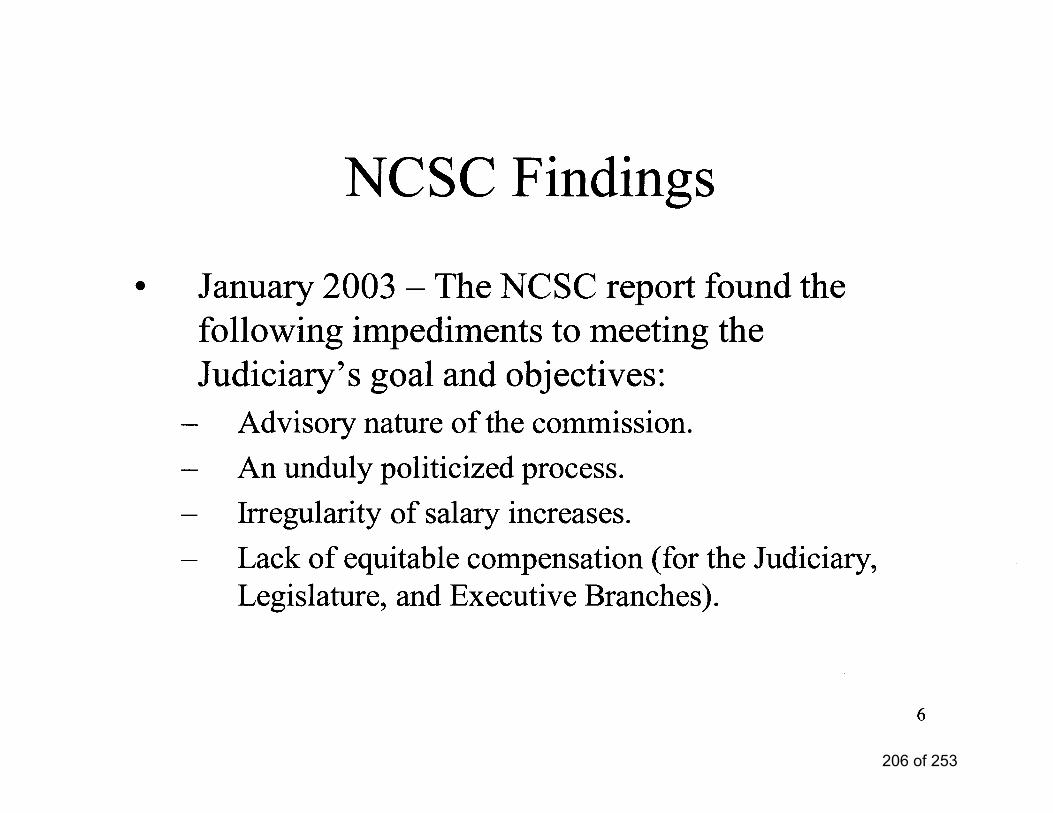
206 of 253
207 of 253

208 of 253

209 of 253
210 of 253
211 of 253
212 of 253
213 of 253
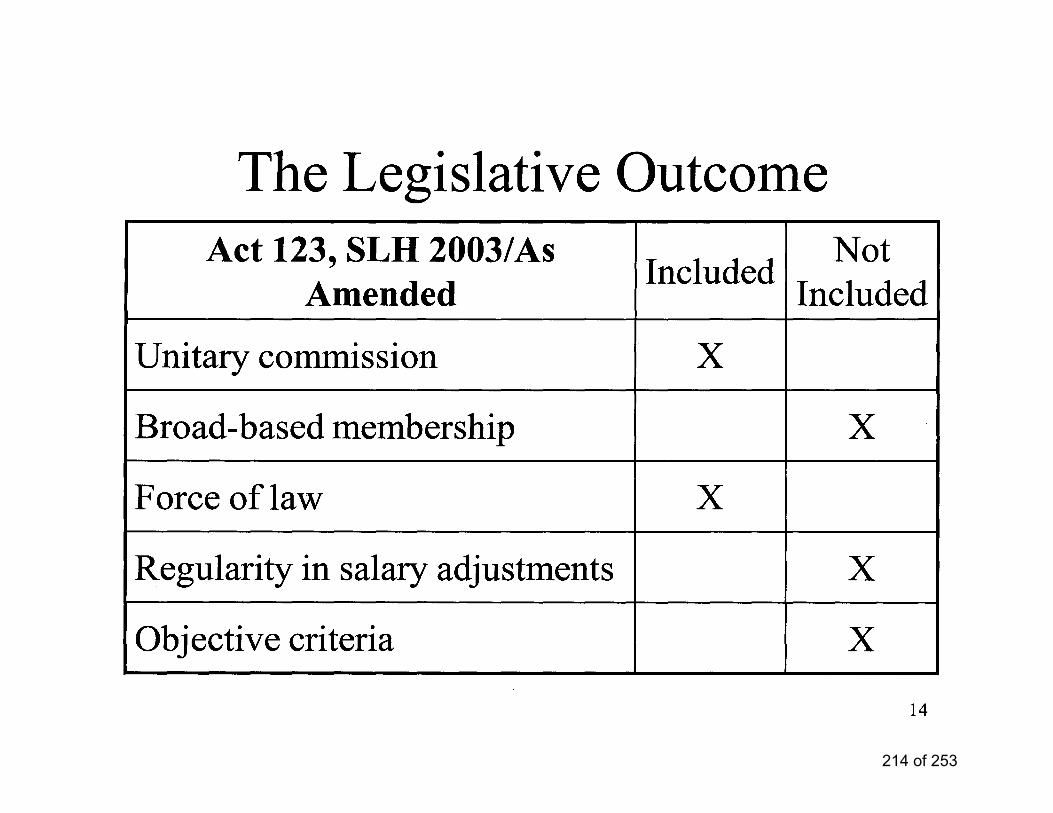
214 of 253
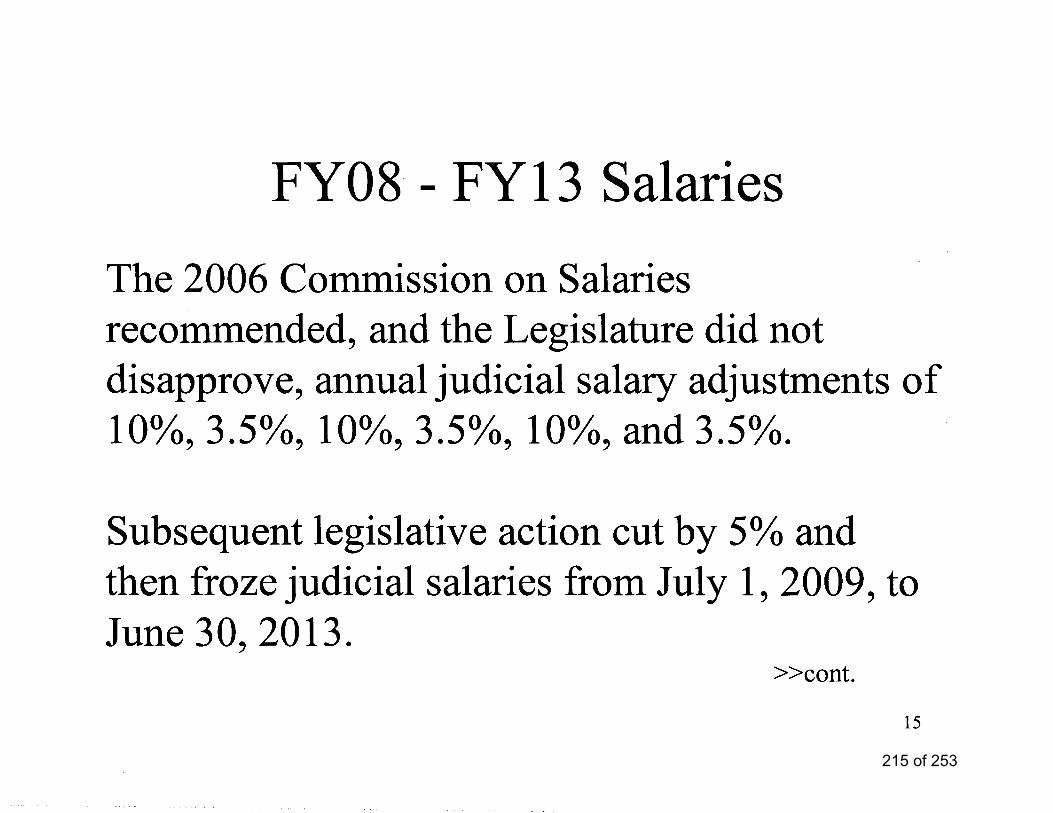
215 of 253
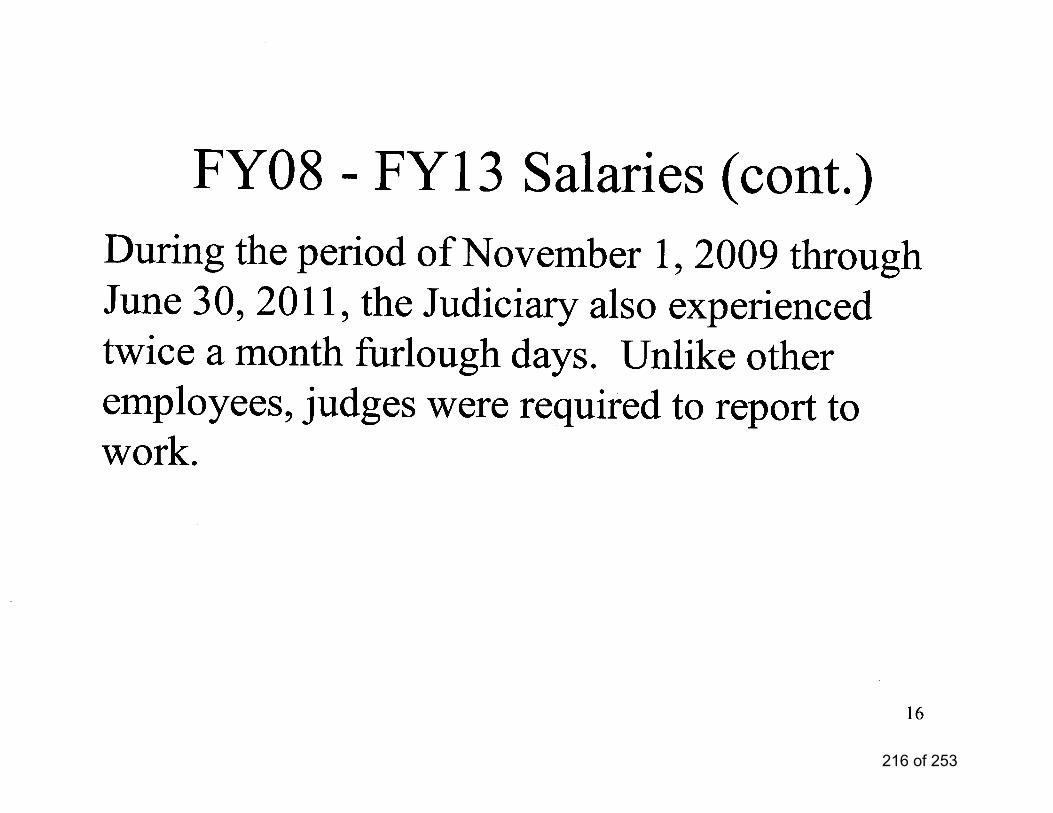
216 of 253
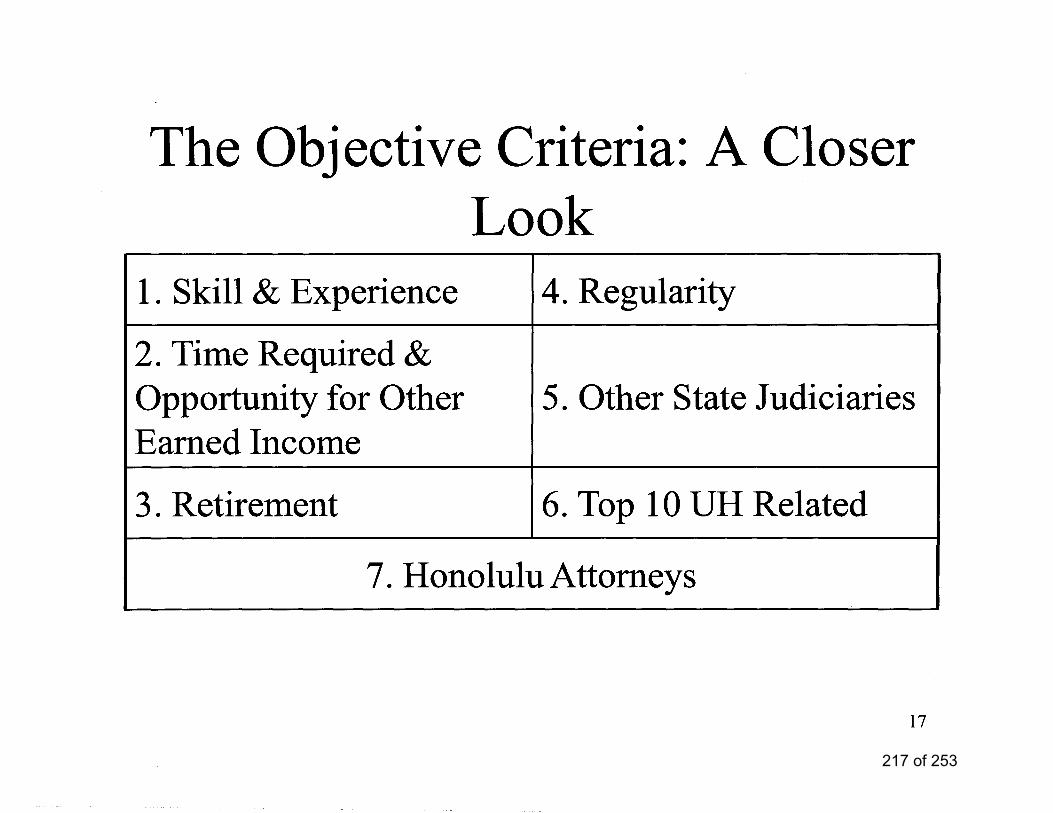
217 of 253
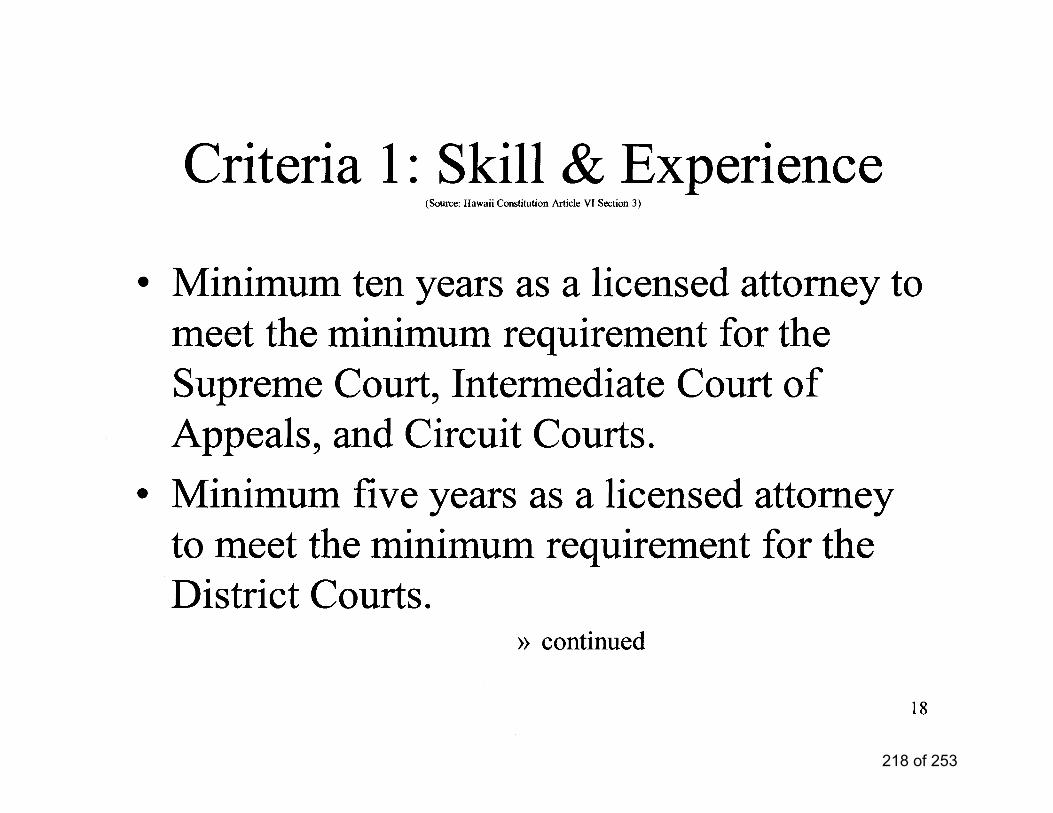
218 of 253
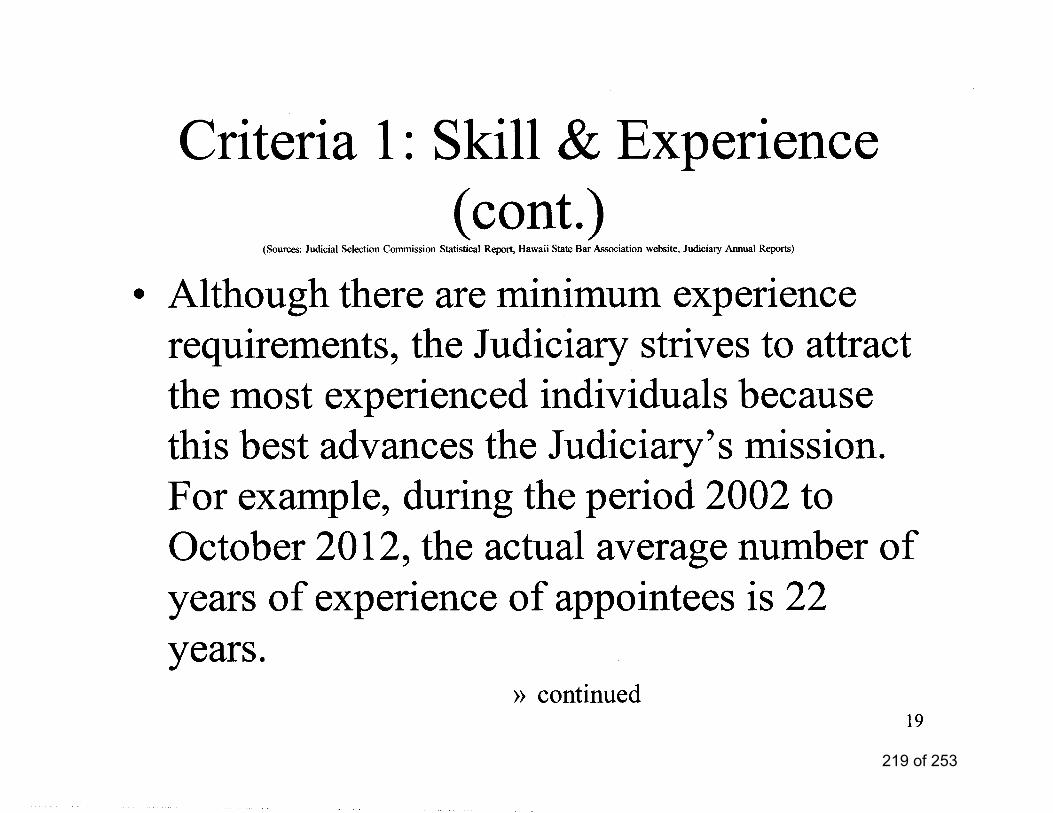
219 of 253
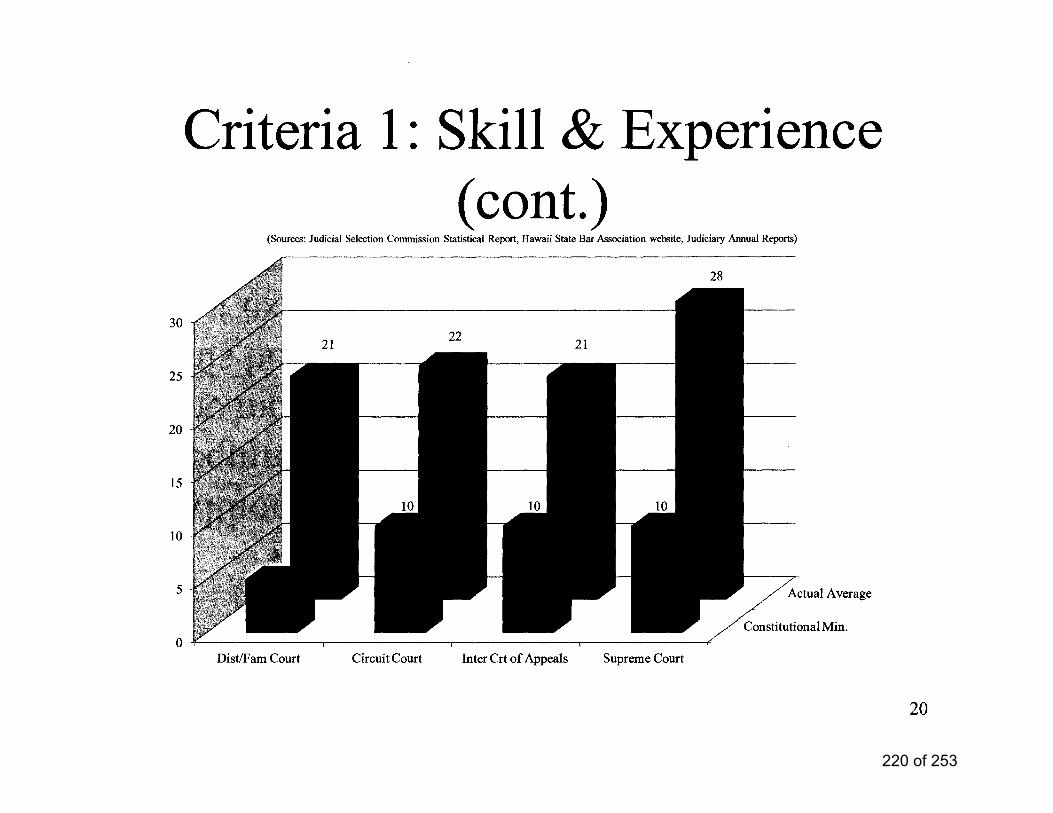
220 of 253
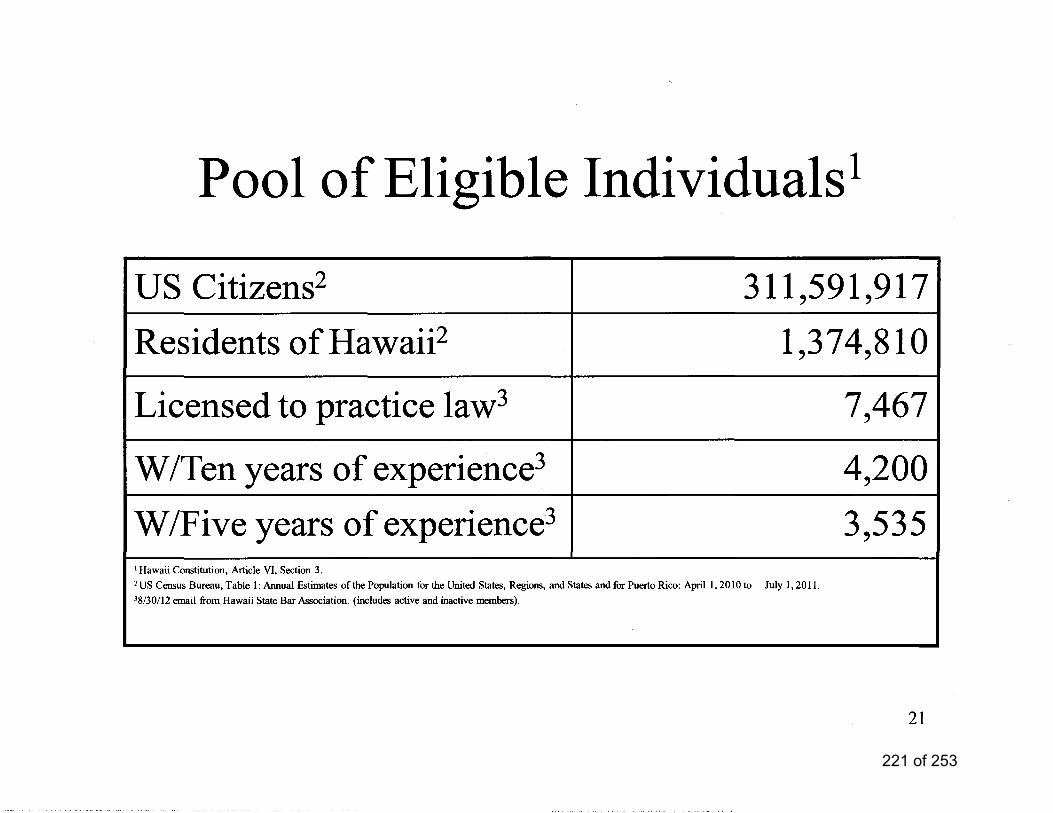
221 of 253
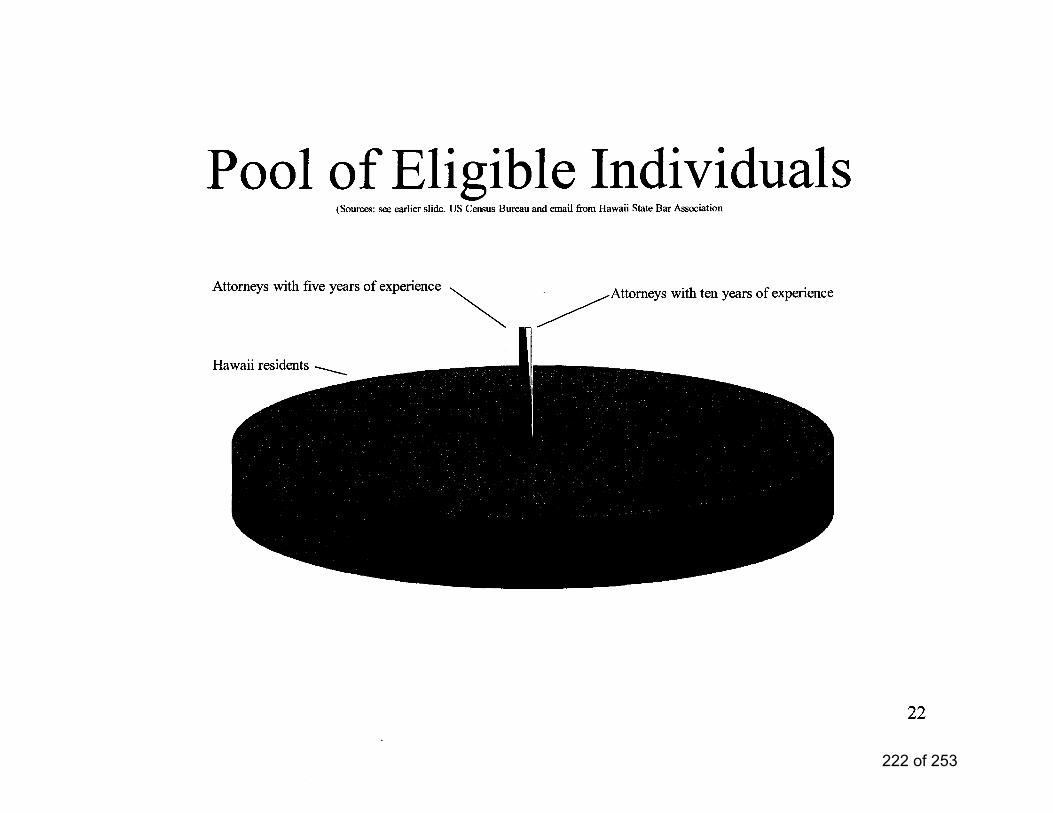
222 of 253
223 of 253
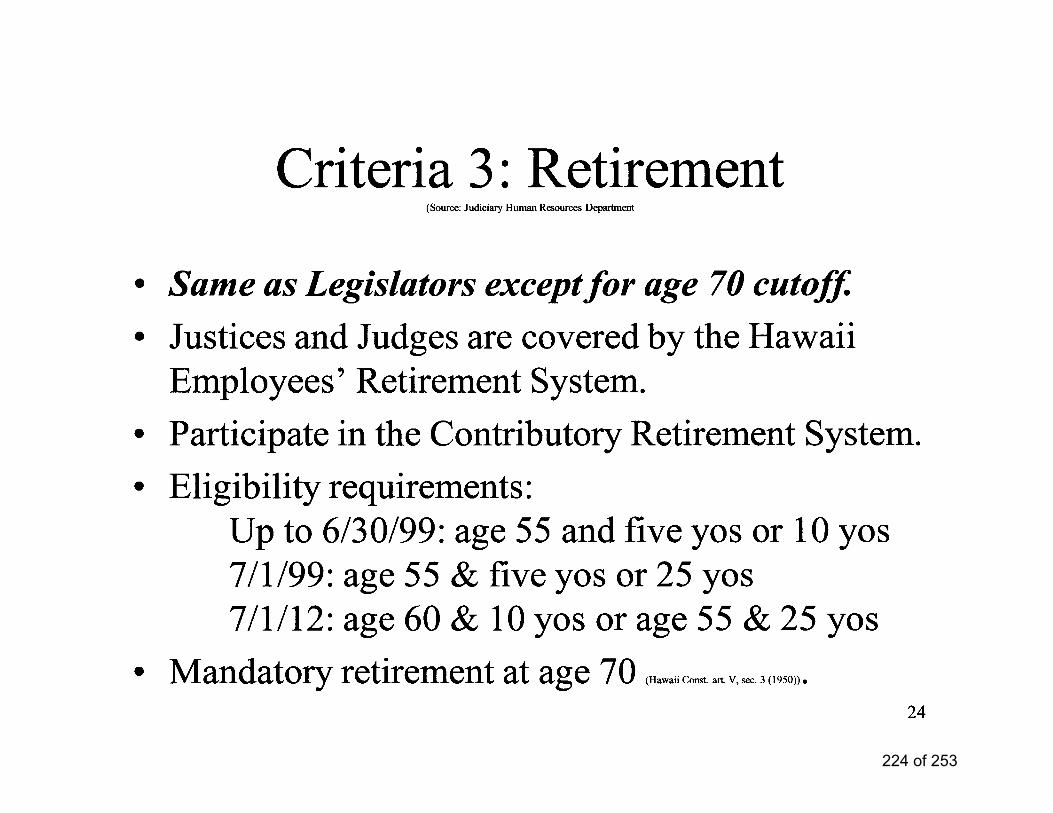
224 of 253
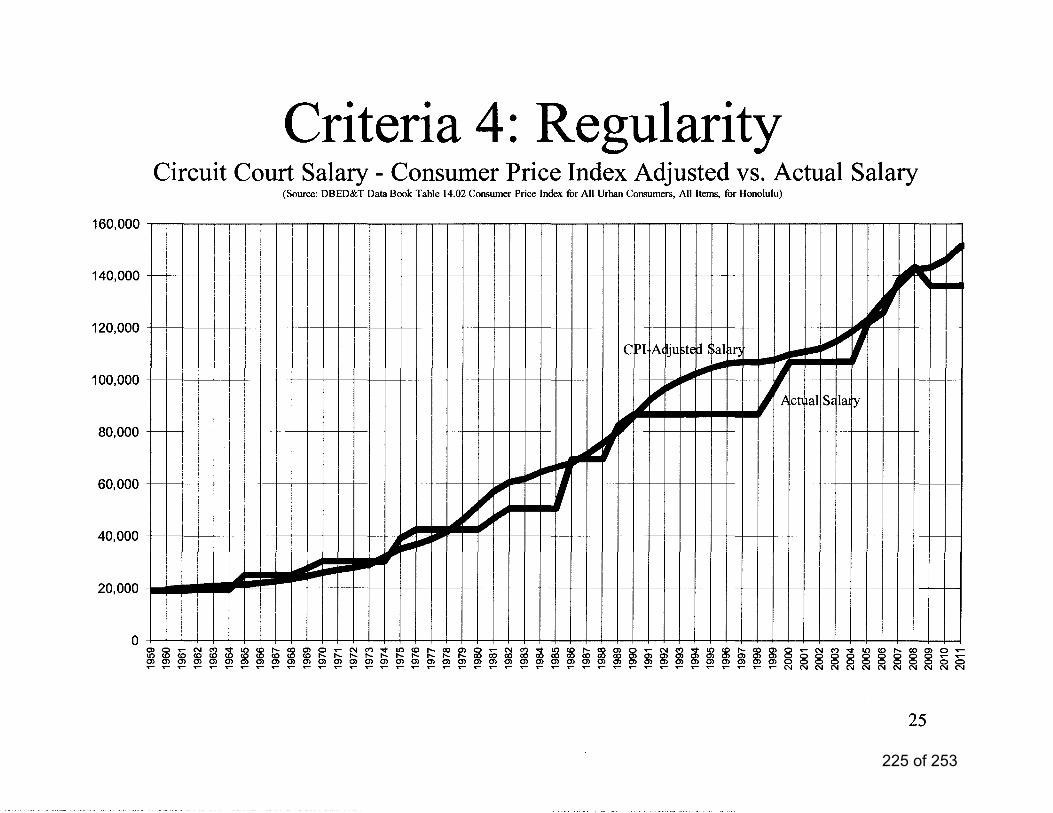
225 of 253
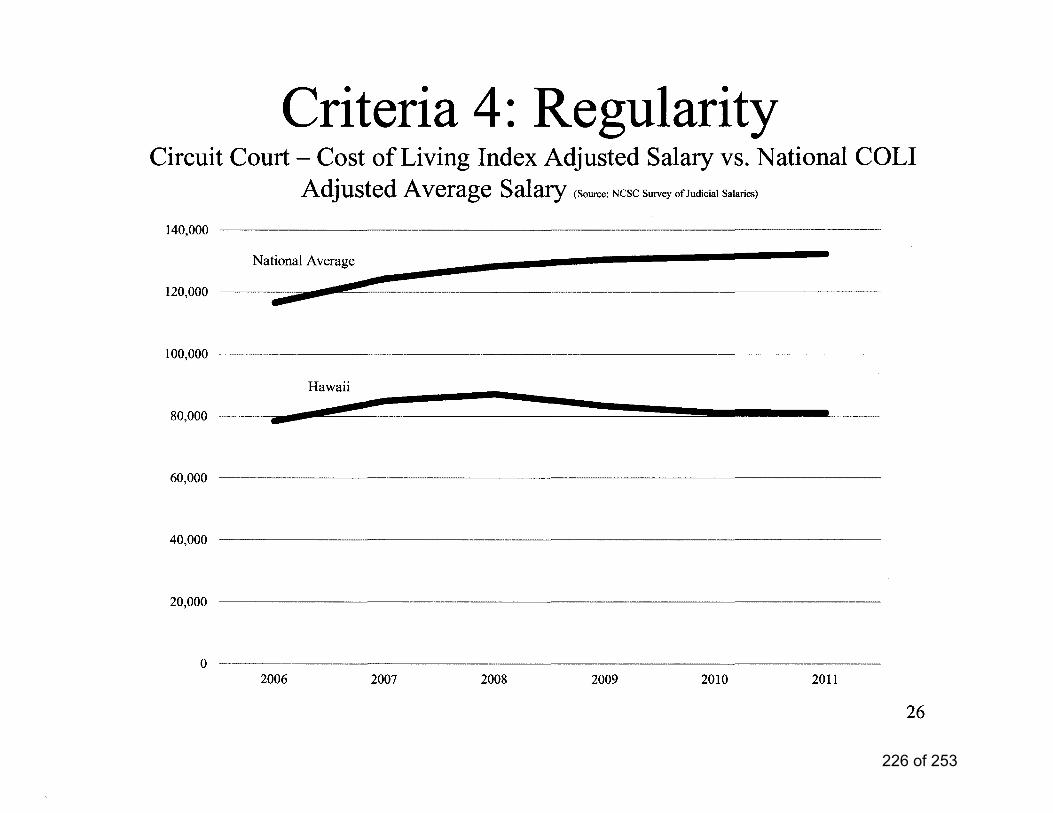
226 of 253
227 of 253
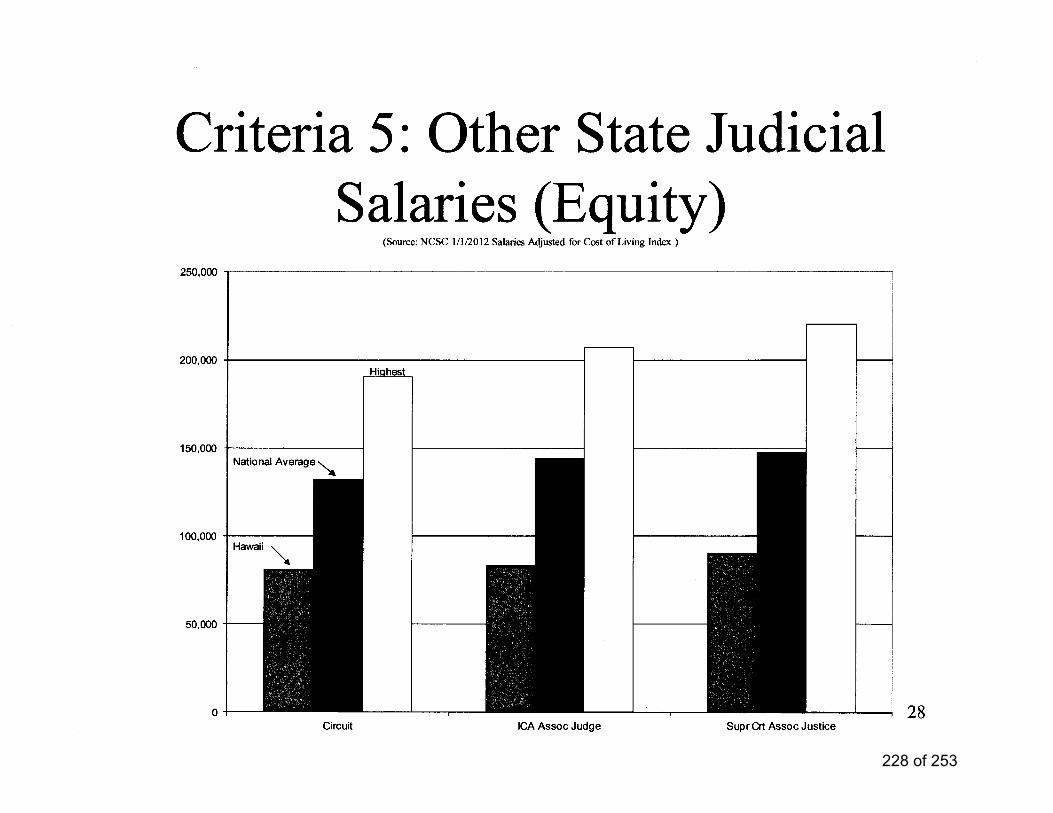
228 of 253
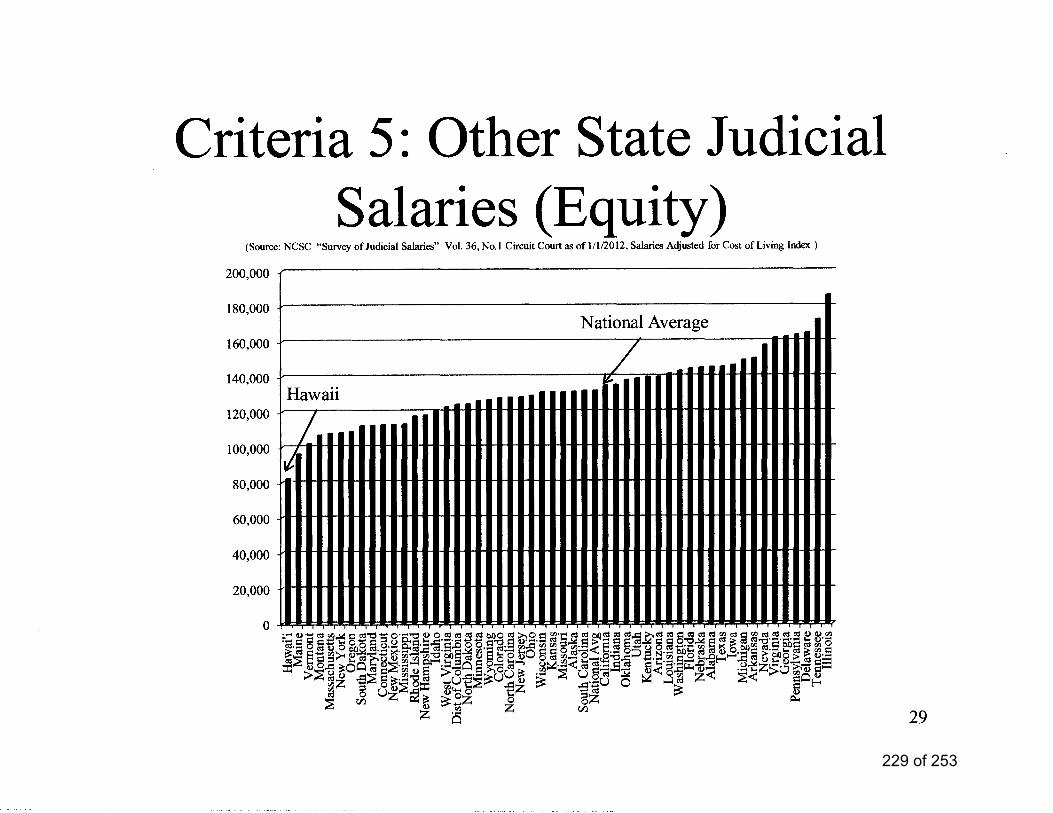
229 of 253
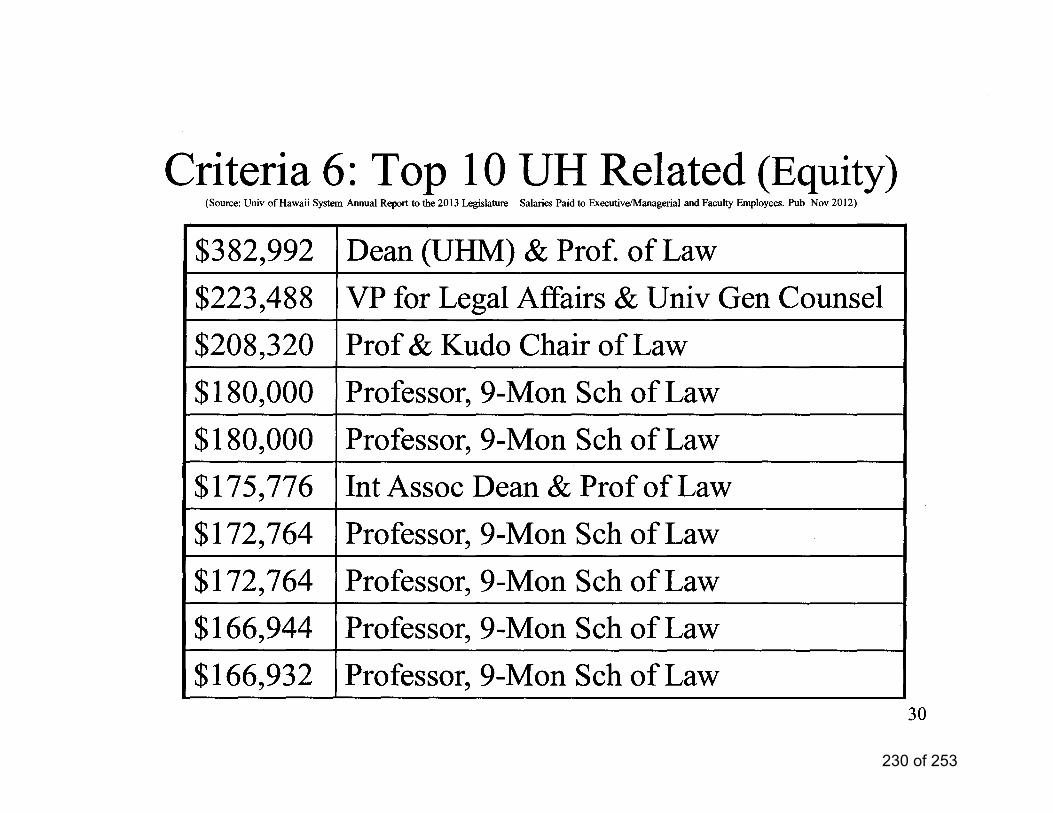
230 of 253
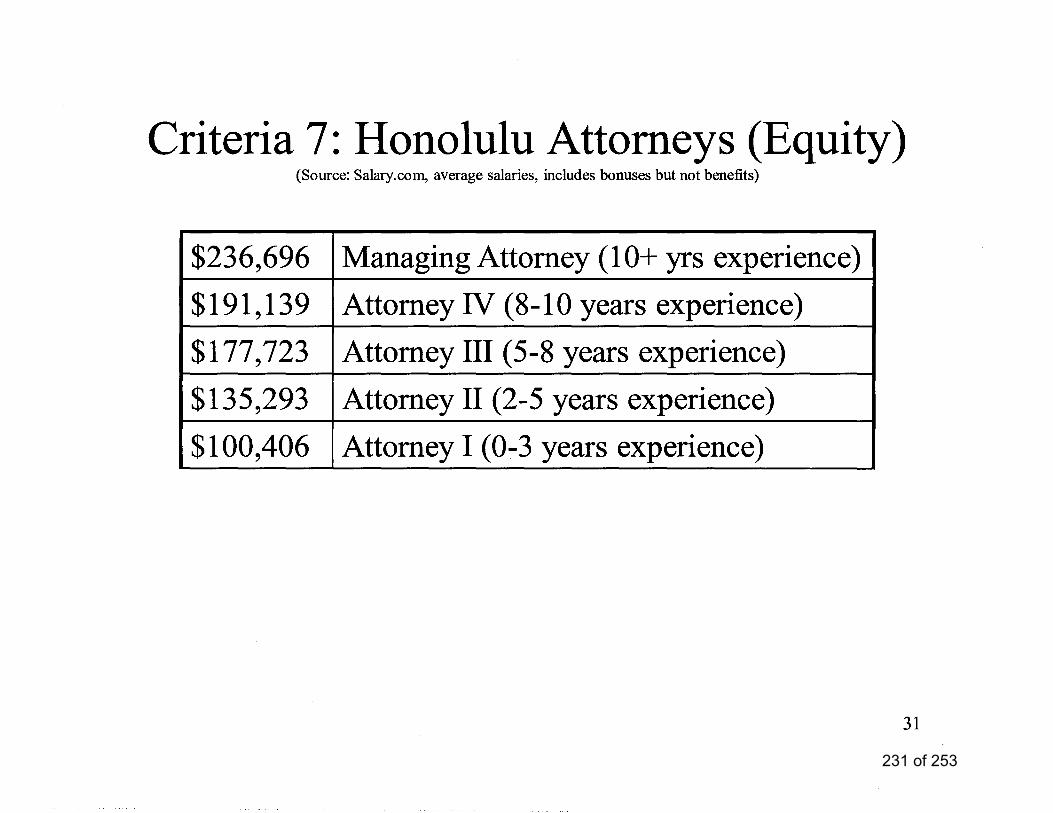
231 of 253

232 of 253
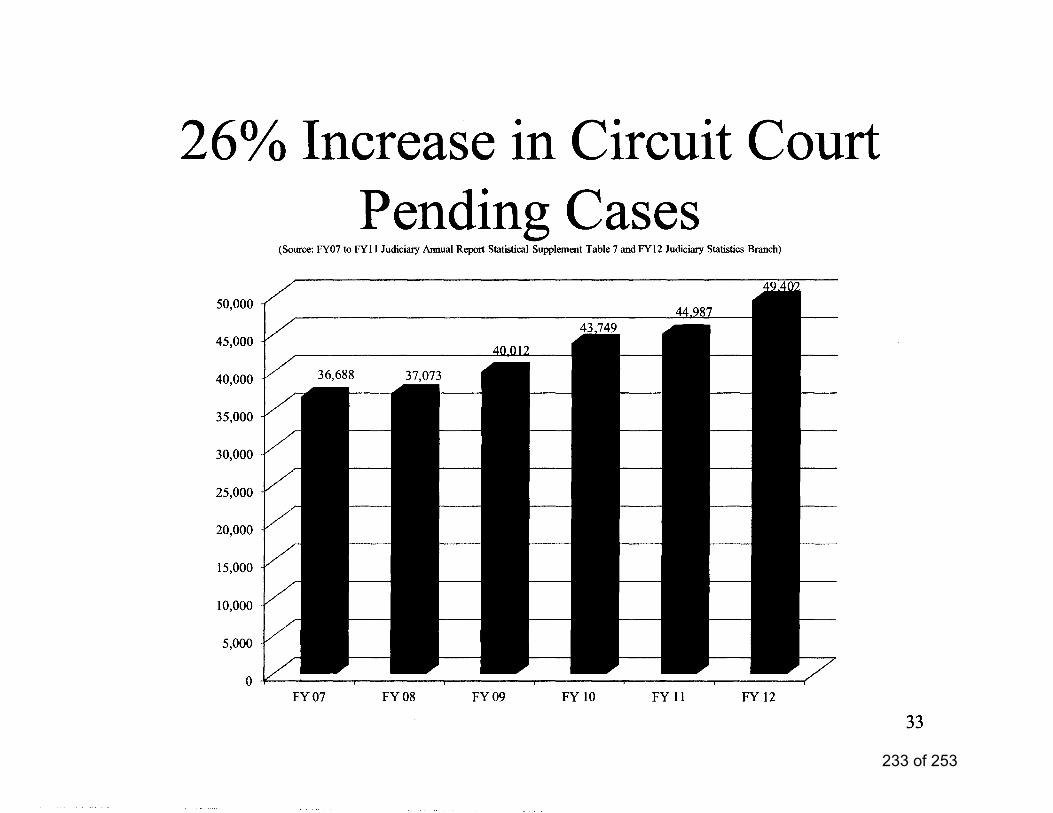
233 of 253
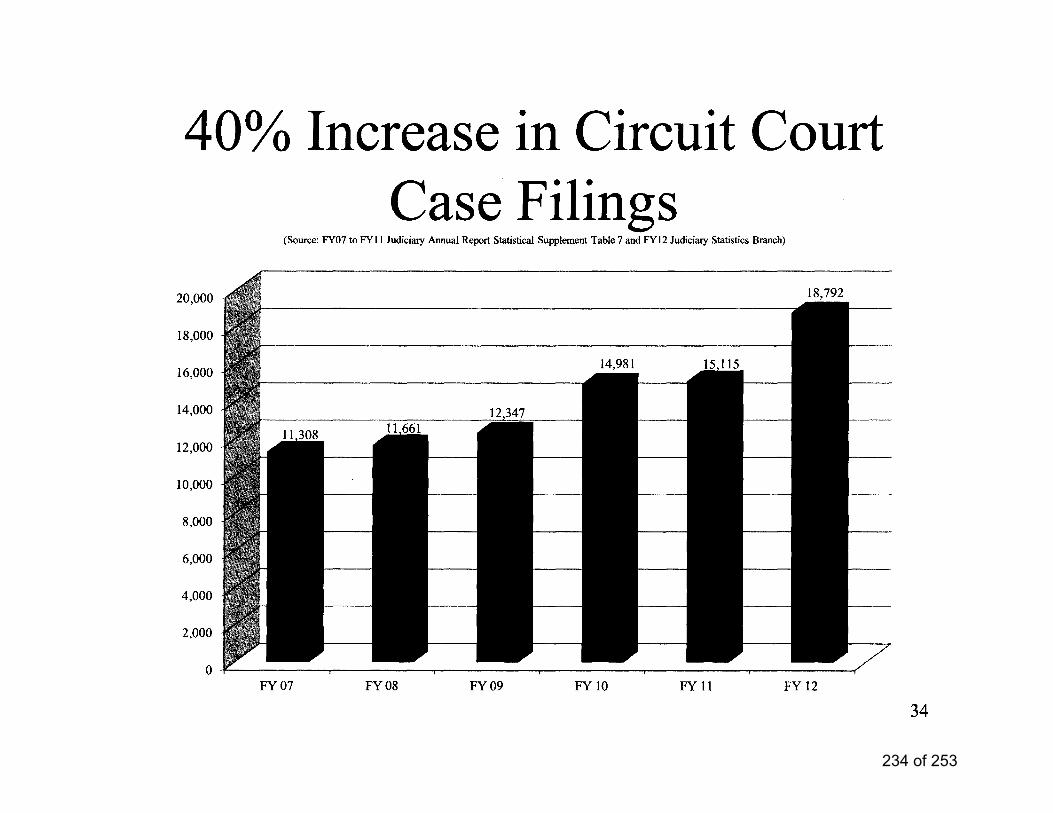
234 of 253
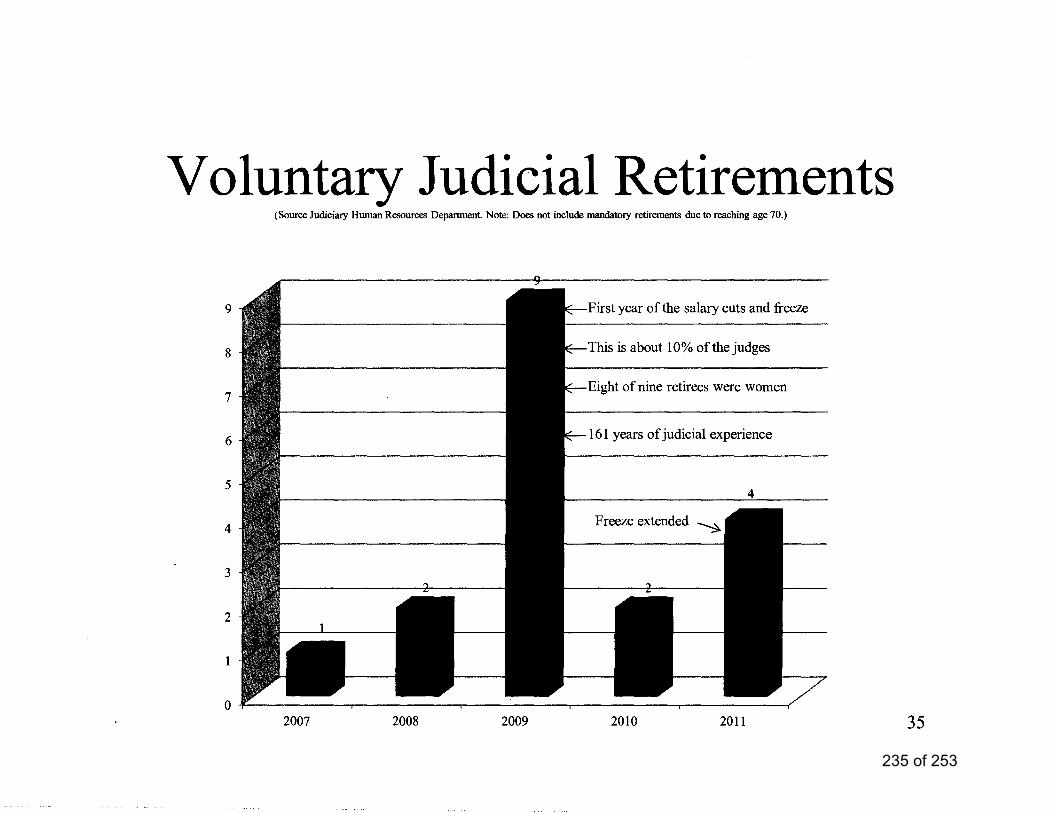
235 of 253
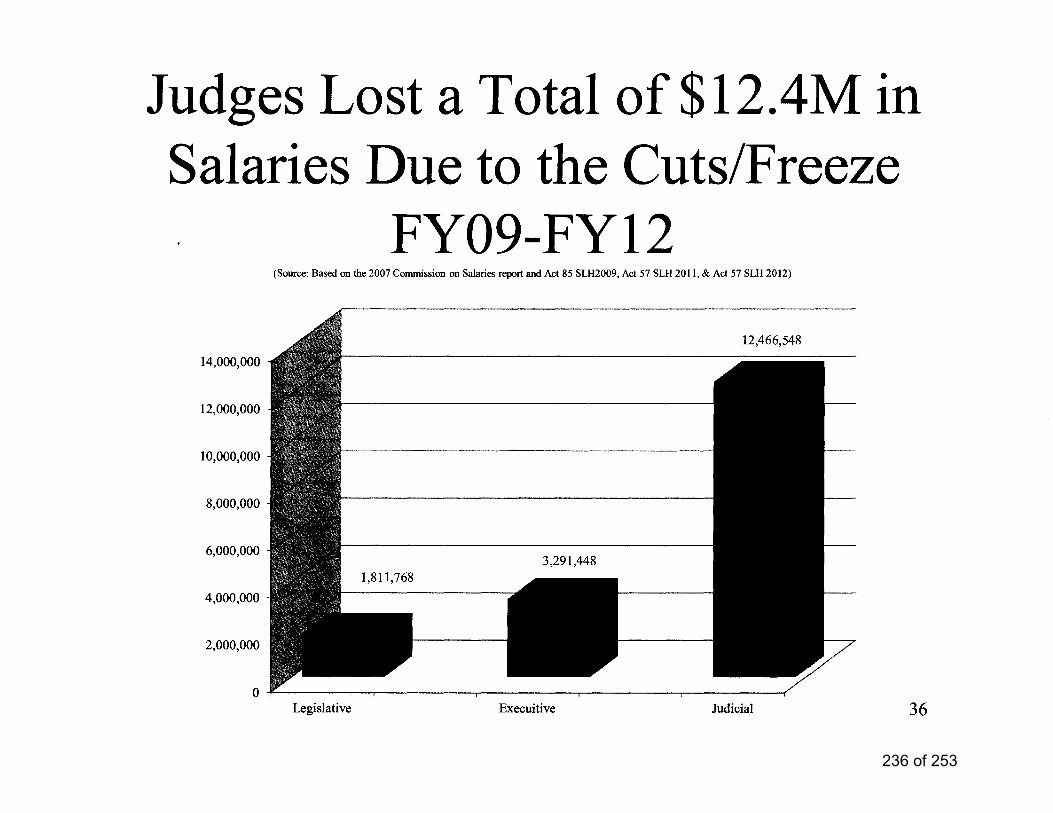
236 of 253
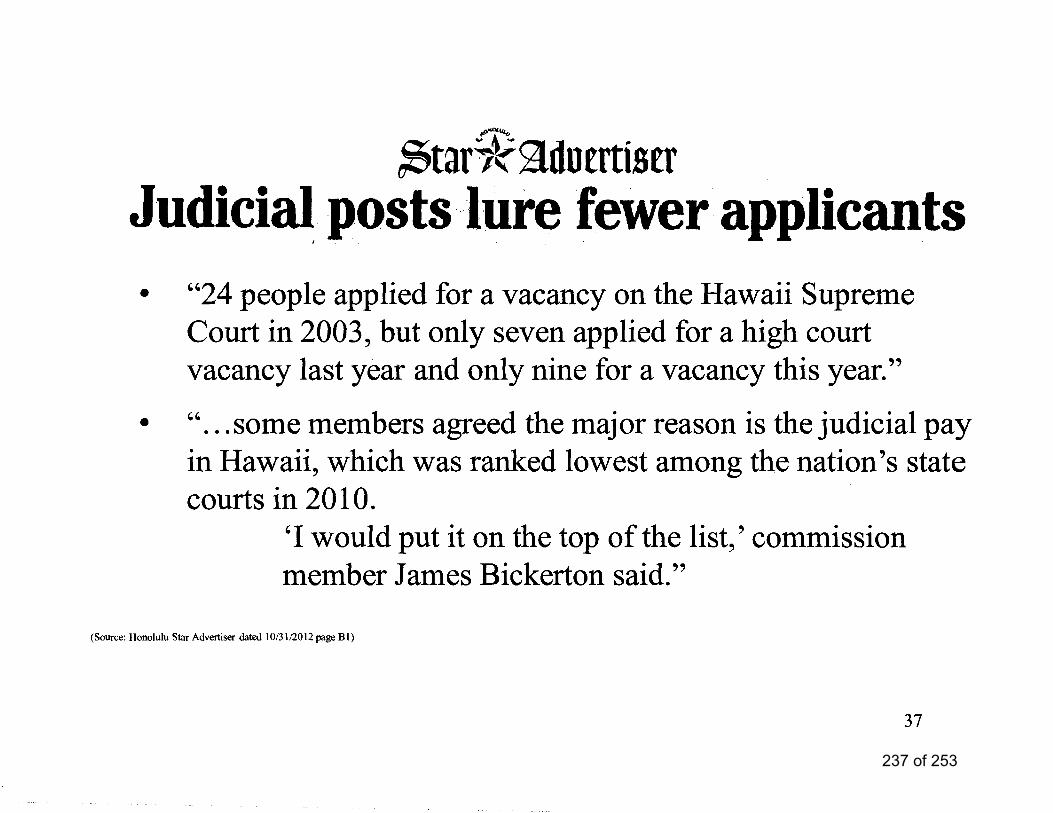
237 of 253
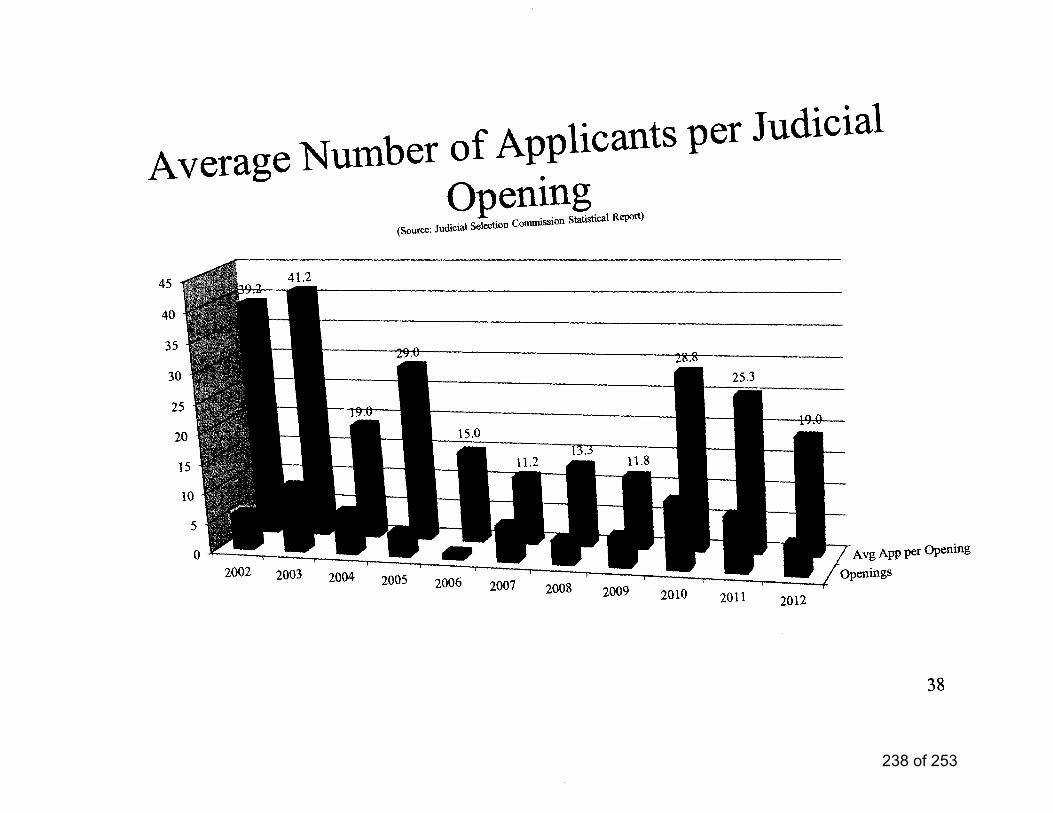
238 of 253
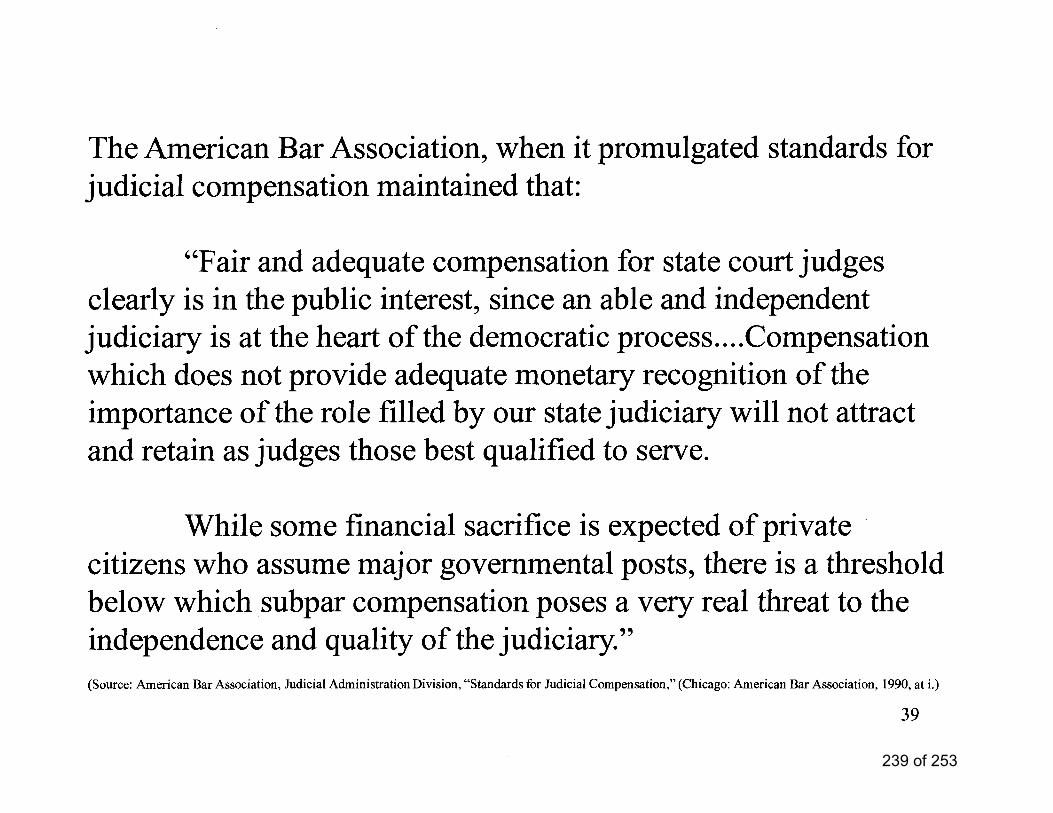
239 of 253
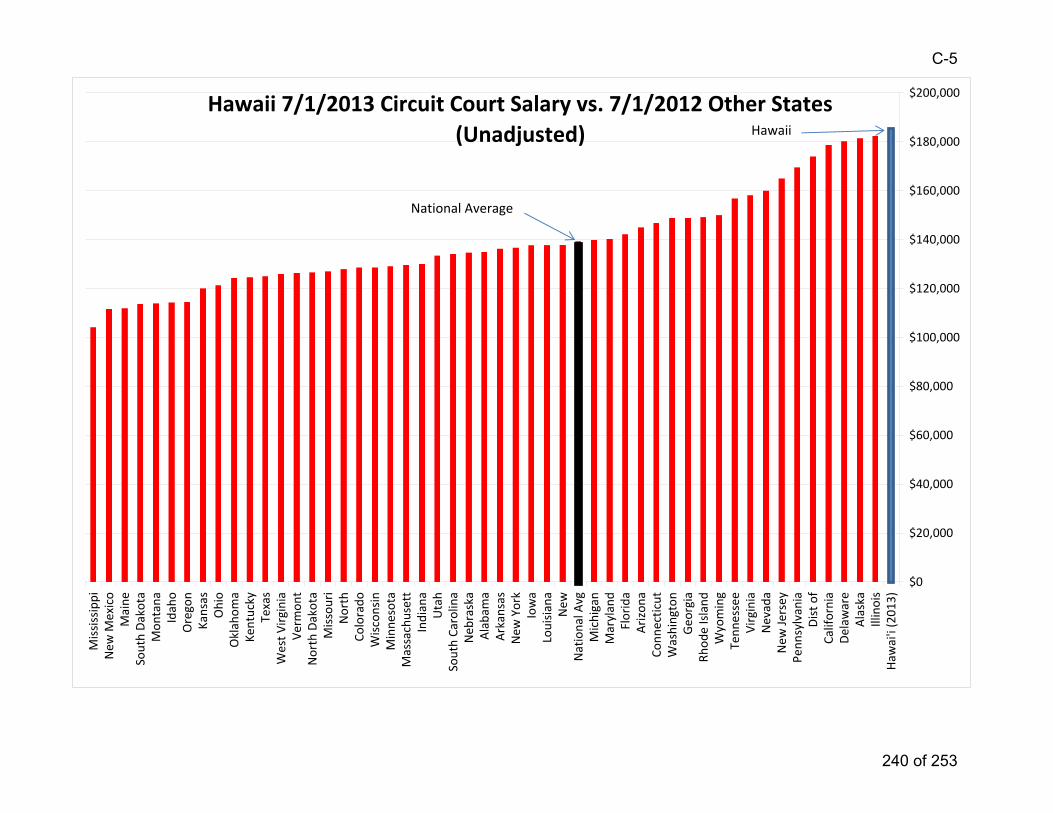
Hawaii 7/1/2013 Circuit Court Salary vs. 7/1/2012 Other States(Unadjusted)
$0
$20,000
$40,000
$60,000
$80,000
$100,000
$120,000
$140,000
$160,000
$180,000
$200,000
Haw
ai'i (201
3)Illinois
Alaska
Delaw
are
California
Dist o
fPe
nnsylvania
New
Jersey
Nevada
Virginia
Tenn
essee
Wyoming
Rhod
e Island
Geo
rgia
Washington
Conn
ecticut
Arizona
Florida
Maryland
Michigan
National A
vgNew
Louisiana
Iowa
New
York
Arkansas
Alabama
Neb
raska
South Carolina
Utah
Indiana
Massachusett
Minne
sota
Wisconsin
Colorado
North
Missouri
North Dakota
Verm
ont
West V
irginia
Texas
Kentucky
Oklahom
aOhio
Kansas
Oregon
Idaho
Mon
tana
South Dakota
Maine
New
Mexico
Mississippi
National Average
Hawaii
C-5
240 of 253
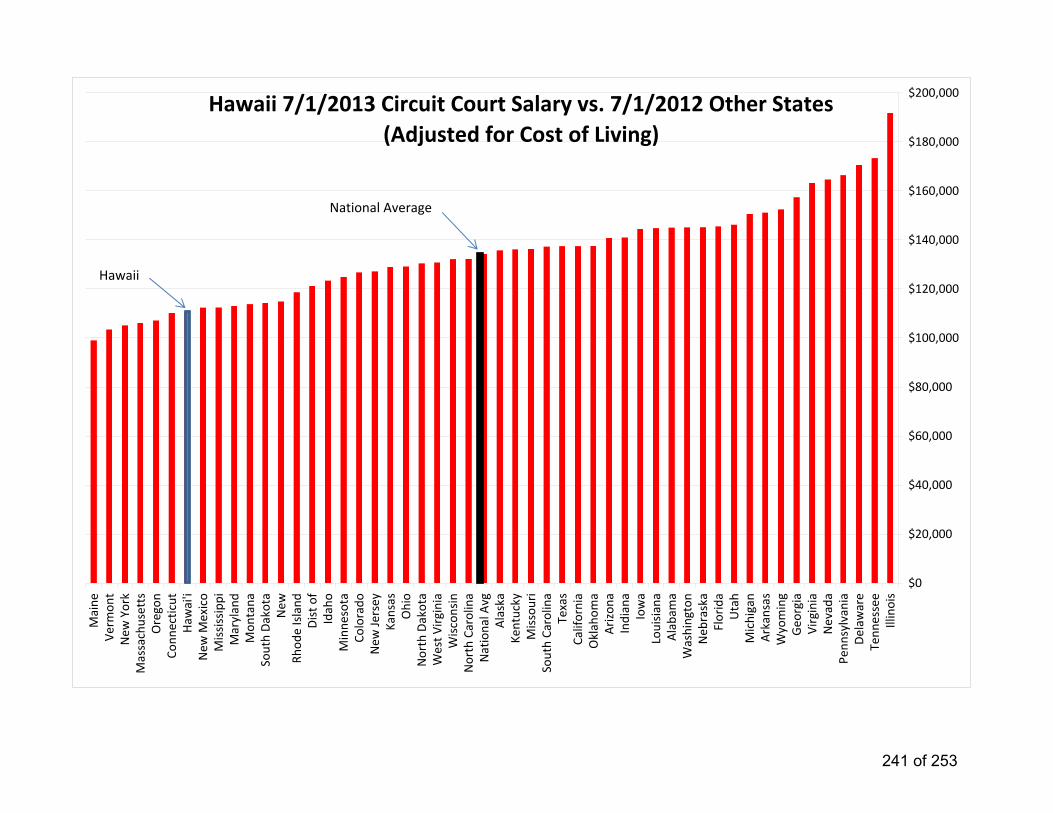
Hawaii 7/1/2013 Circuit Court Salary vs. 7/1/2012 Other States(Adjusted for Cost of Living)
$0
$20,000
$40,000
$60,000
$80,000
$100,000
$120,000
$140,000
$160,000
$180,000
$200,000
Illinois
Tenn
essee
Delaw
are
Penn
sylvania
Nevada
Virginia
Geo
rgia
Wyoming
Arkansas
Michigan
Utah
Florida
Neb
raska
Washington
Alabama
Louisiana
Iowa
Indiana
Arizona
Oklahom
aCalifornia
Texas
South Carolina
Missouri
Kentucky
Alaska
National A
vgNorth Carolina
Wisconsin
West V
irginia
North Dakota
Ohio
Kansas
New
Jersey
Colorado
Minne
sota
Idaho
Dist o
fRh
ode Island
New
South Dakota
Mon
tana
Maryland
Mississippi
New
Mexico
Haw
ai'i
Conn
ecticut
Oregon
Massachusetts
New
York
Verm
ont
Maine
Hawaii
National Average
241 of 253
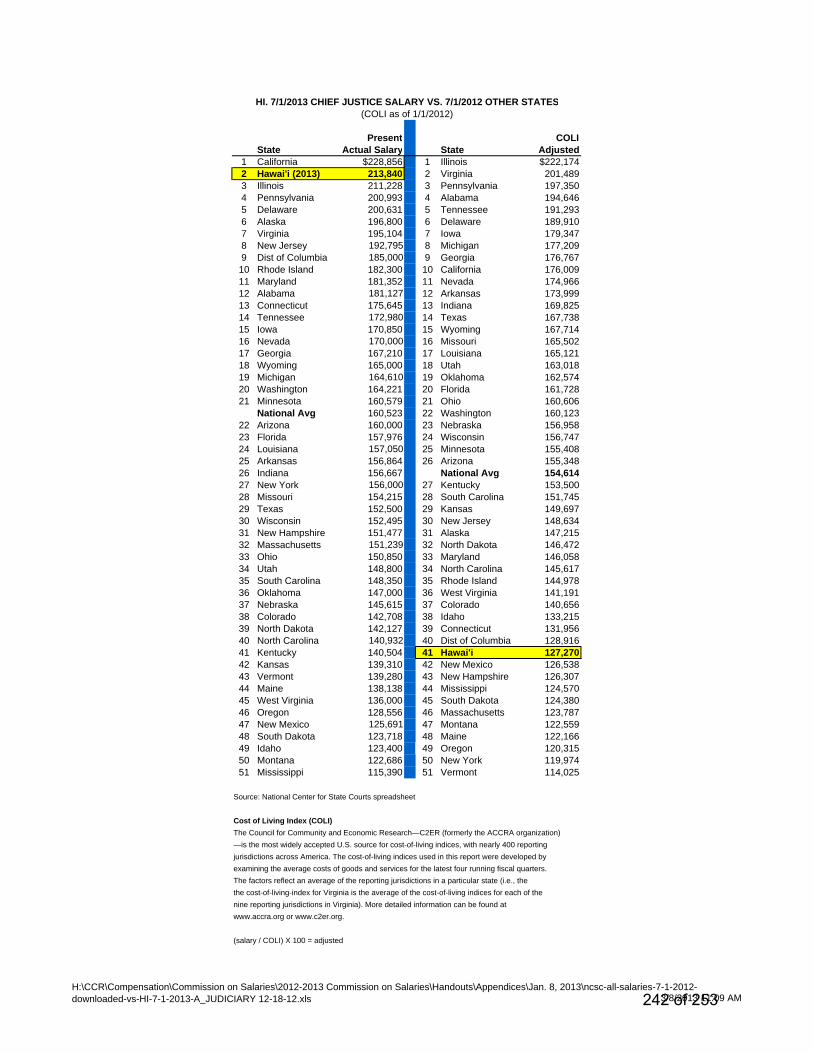
HI. 7/1/2013 CHIEF JUSTICE SALARY VS. 7/1/2012 OTHER STATES(COLI as of 1/1/2012)
Present COLIState Actual Salary State Adjusted
1 California $228,856 1 Illinois $222,1742 Hawai'i (2013) 213,840 2 Virginia 201,4893 Illinois 211,228 3 Pennsylvania 197,3504 Pennsylvania 200,993 4 Alabama 194,6465 Delaware 200,631 5 Tennessee 191,2936 Alaska 196,800 6 Delaware 189,9107 Virginia 195,104 7 Iowa 179,3478 New Jersey 192,795 8 Michigan 177,2099 Dist of Columbia 185,000 9 Georgia 176,76710 Rhode Island 182,300 10 California 176,00911 Maryland 181,352 11 Nevada 174,96612 Alabama 181,127 12 Arkansas 173,99913 Connecticut 175,645 13 Indiana 169,82514 Tennessee 172,980 14 Texas 167,73815 Iowa 170,850 15 Wyoming 167,71416 Nevada 170,000 16 Missouri 165,50217 Georgia 167,210 17 Louisiana 165,12118 Wyoming 165,000 18 Utah 163,01819 Michigan 164,610 19 Oklahoma 162,57420 Washington 164,221 20 Florida 161,72821 Minnesota 160,579 21 Ohio 160,606
National Avg 160,523 22 Washington 160,12322 Arizona 160,000 23 Nebraska 156,95823 Florida 157,976 24 Wisconsin 156,74724 Louisiana 157,050 25 Minnesota 155,40825 Arkansas 156,864 26 Arizona 155,34826 Indiana 156,667 National Avg 154,61427 New York 156,000 27 Kentucky 153,50028 Missouri 154,215 28 South Carolina 151,74529 Texas 152,500 29 Kansas 149,69730 Wisconsin 152,495 30 New Jersey 148,63431 New Hampshire 151,477 31 Alaska 147,21532 Massachusetts 151,239 32 North Dakota 146,47233 Ohio 150,850 33 Maryland 146,05834 Utah 148,800 34 North Carolina 145,61735 South Carolina 148,350 35 Rhode Island 144,97836 Oklahoma 147,000 36 West Virginia 141,19137 Nebraska 145,615 37 Colorado 140,65638 Colorado 142,708 38 Idaho 133,21539 North Dakota 142,127 39 Connecticut 131,95640 North Carolina 140,932 40 Dist of Columbia 128,91641 Kentucky 140,504 41 Hawai'i 127,27042 Kansas 139,310 42 New Mexico 126,53843 Vermont 139,280 43 New Hampshire 126,30744 Maine 138,138 44 Mississippi 124,57045 West Virginia 136,000 45 South Dakota 124,38046 Oregon 128,556 46 Massachusetts 123,78747 New Mexico 125,691 47 Montana 122,55948 South Dakota 123,718 48 Maine 122,16649 Idaho 123,400 49 Oregon 120,31550 Montana 122,686 50 New York 119,97451 Mississippi 115,390 51 Vermont 114,025
Source: National Center for State Courts spreadsheet
Cost of Living Index (COLI)The Council for Community and Economic Research—C2ER (formerly the ACCRA organization)—is the most widely accepted U.S. source for cost-of-living indices, with nearly 400 reportingjurisdictions across America. The cost-of-living indices used in this report were developed byexamining the average costs of goods and services for the latest four running fiscal quarters.The factors reflect an average of the reporting jurisdictions in a particular state (i.e., thethe cost-of-living-index for Virginia is the average of the cost-of-living indices for each of thenine reporting jurisdictions in Virginia). More detailed information can be found atwww.accra.org or www.c2er.org.
(salary / COLI) X 100 = adjusted
H:\CCR\Compensation\Commission on Salaries\2012-2013 Commission on Salaries\Handouts\Appendices\Jan. 8, 2013\ncsc-all-salaries-7-1-2012-downloaded-vs-HI-7-1-2013-A_JUDICIARY 12-18-12.xls 3/8/2013 11:09 AM242 of 253
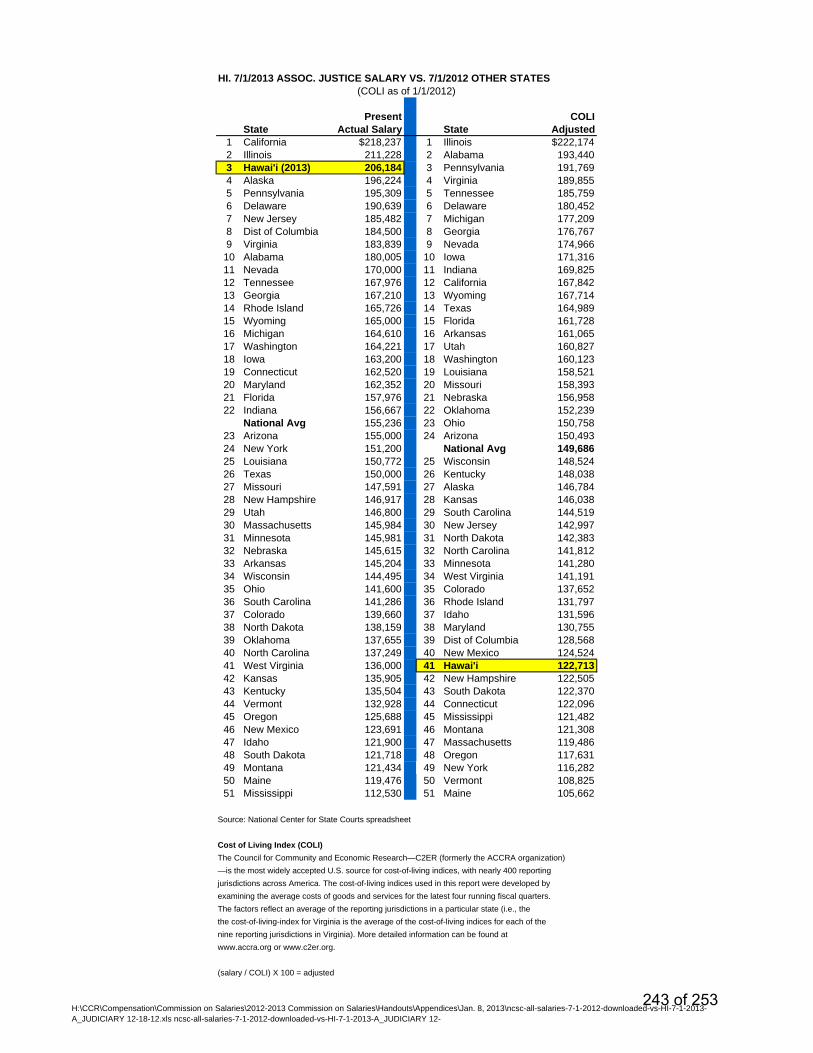
HI. 7/1/2013 ASSOC. JUSTICE SALARY VS. 7/1/2012 OTHER STATES (COLI as of 1/1/2012)
Present COLIState Actual Salary State Adjusted
1 California $218,237 1 Illinois $222,1742 Illinois 211,228 2 Alabama 193,4403 Hawai'i (2013) 206,184 3 Pennsylvania 191,7694 Alaska 196,224 4 Virginia 189,8555 Pennsylvania 195,309 5 Tennessee 185,7596 Delaware 190,639 6 Delaware 180,4527 New Jersey 185,482 7 Michigan 177,2098 Dist of Columbia 184,500 8 Georgia 176,7679 Virginia 183,839 9 Nevada 174,966
10 Alabama 180,005 10 Iowa 171,31611 Nevada 170,000 11 Indiana 169,82512 Tennessee 167,976 12 California 167,84213 Georgia 167,210 13 Wyoming 167,71414 Rhode Island 165,726 14 Texas 164,98915 Wyoming 165,000 15 Florida 161,72816 Michigan 164,610 16 Arkansas 161,06517 Washington 164,221 17 Utah 160,82718 Iowa 163,200 18 Washington 160,12319 Connecticut 162,520 19 Louisiana 158,52120 Maryland 162,352 20 Missouri 158,39321 Florida 157,976 21 Nebraska 156,95822 Indiana 156,667 22 Oklahoma 152,239
National Avg 155,236 23 Ohio 150,75823 Arizona 155,000 24 Arizona 150,49324 New York 151,200 National Avg 149,68625 Louisiana 150,772 25 Wisconsin 148,52426 Texas 150,000 26 Kentucky 148,03827 Missouri 147,591 27 Alaska 146,78428 New Hampshire 146,917 28 Kansas 146,03829 Utah 146,800 29 South Carolina 144,51930 Massachusetts 145,984 30 New Jersey 142,99731 Minnesota 145,981 31 North Dakota 142,38332 Nebraska 145,615 32 North Carolina 141,81233 Arkansas 145,204 33 Minnesota 141,28034 Wisconsin 144,495 34 West Virginia 141,19135 Ohio 141,600 35 Colorado 137,65236 South Carolina 141,286 36 Rhode Island 131,79737 Colorado 139,660 37 Idaho 131,59638 North Dakota 138,159 38 Maryland 130,75539 Oklahoma 137,655 39 Dist of Columbia 128,56840 North Carolina 137,249 40 New Mexico 124,52441 West Virginia 136,000 41 Hawai'i 122,71342 Kansas 135,905 42 New Hampshire 122,50543 Kentucky 135,504 43 South Dakota 122,37044 Vermont 132,928 44 Connecticut 122,09645 Oregon 125,688 45 Mississippi 121,48246 New Mexico 123,691 46 Montana 121,30847 Idaho 121,900 47 Massachusetts 119,48648 South Dakota 121,718 48 Oregon 117,63149 Montana 121,434 49 New York 116,28250 Maine 119,476 50 Vermont 108,82551 Mississippi 112,530 51 Maine 105,662
Source: National Center for State Courts spreadsheet
Cost of Living Index (COLI)The Council for Community and Economic Research—C2ER (formerly the ACCRA organization)—is the most widely accepted U.S. source for cost-of-living indices, with nearly 400 reportingjurisdictions across America. The cost-of-living indices used in this report were developed byexamining the average costs of goods and services for the latest four running fiscal quarters.The factors reflect an average of the reporting jurisdictions in a particular state (i.e., thethe cost-of-living-index for Virginia is the average of the cost-of-living indices for each of thenine reporting jurisdictions in Virginia). More detailed information can be found atwww.accra.org or www.c2er.org.
(salary / COLI) X 100 = adjusted
H:\CCR\Compensation\Commission on Salaries\2012-2013 Commission on Salaries\Handouts\Appendices\Jan. 8, 2013\ncsc-all-salaries-7-1-2012-downloaded-vs-HI-7-1-2013-A_JUDICIARY 12-18-12.xls ncsc-all-salaries-7-1-2012-downloaded-vs-HI-7-1-2013-A_JUDICIARY 12-
243 of 253
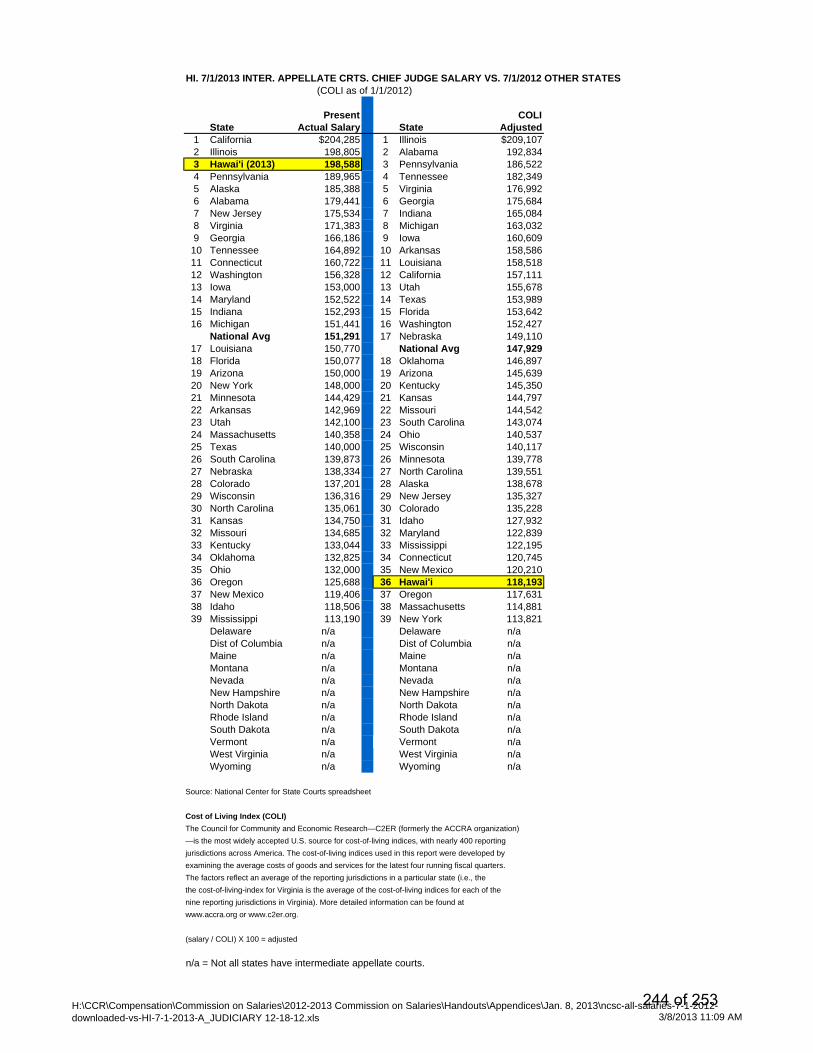
HI. 7/1/2013 INTER. APPELLATE CRTS. CHIEF JUDGE SALARY VS. 7/1/2012 OTHER STATES(COLI as of 1/1/2012)
Present COLIState Actual Salary State Adjusted
1 California $204,285 1 Illinois $209,1072 Illinois 198,805 2 Alabama 192,8343 Hawai'i (2013) 198,588 3 Pennsylvania 186,5224 Pennsylvania 189,965 4 Tennessee 182,3495 Alaska 185,388 5 Virginia 176,9926 Alabama 179,441 6 Georgia 175,6847 New Jersey 175,534 7 Indiana 165,0848 Virginia 171,383 8 Michigan 163,0329 Georgia 166,186 9 Iowa 160,60910 Tennessee 164,892 10 Arkansas 158,58611 Connecticut 160,722 11 Louisiana 158,51812 Washington 156,328 12 California 157,11113 Iowa 153,000 13 Utah 155,67814 Maryland 152,522 14 Texas 153,98915 Indiana 152,293 15 Florida 153,64216 Michigan 151,441 16 Washington 152,427
National Avg 151,291 17 Nebraska 149,11017 Louisiana 150,770 National Avg 147,92918 Florida 150,077 18 Oklahoma 146,89719 Arizona 150,000 19 Arizona 145,63920 New York 148,000 20 Kentucky 145,35021 Minnesota 144,429 21 Kansas 144,79722 Arkansas 142,969 22 Missouri 144,54223 Utah 142,100 23 South Carolina 143,07424 Massachusetts 140,358 24 Ohio 140,53725 Texas 140,000 25 Wisconsin 140,11726 South Carolina 139,873 26 Minnesota 139,77827 Nebraska 138,334 27 North Carolina 139,55128 Colorado 137,201 28 Alaska 138,67829 Wisconsin 136,316 29 New Jersey 135,32730 North Carolina 135,061 30 Colorado 135,22831 Kansas 134,750 31 Idaho 127,93232 Missouri 134,685 32 Maryland 122,83933 Kentucky 133,044 33 Mississippi 122,19534 Oklahoma 132,825 34 Connecticut 120,74535 Ohio 132,000 35 New Mexico 120,21036 Oregon 125,688 36 Hawai'i 118,19337 New Mexico 119,406 37 Oregon 117,63138 Idaho 118,506 38 Massachusetts 114,88139 Mississippi 113,190 39 New York 113,821
Delaware n/a Delaware n/aDist of Columbia n/a Dist of Columbia n/aMaine n/a Maine n/aMontana n/a Montana n/aNevada n/a Nevada n/aNew Hampshire n/a New Hampshire n/aNorth Dakota n/a North Dakota n/aRhode Island n/a Rhode Island n/aSouth Dakota n/a South Dakota n/aVermont n/a Vermont n/aWest Virginia n/a West Virginia n/aWyoming n/a Wyoming n/a
Source: National Center for State Courts spreadsheet
Cost of Living Index (COLI)The Council for Community and Economic Research—C2ER (formerly the ACCRA organization)—is the most widely accepted U.S. source for cost-of-living indices, with nearly 400 reportingjurisdictions across America. The cost-of-living indices used in this report were developed byexamining the average costs of goods and services for the latest four running fiscal quarters.The factors reflect an average of the reporting jurisdictions in a particular state (i.e., thethe cost-of-living-index for Virginia is the average of the cost-of-living indices for each of thenine reporting jurisdictions in Virginia). More detailed information can be found atwww.accra.org or www.c2er.org.
(salary / COLI) X 100 = adjusted
n/a = Not all states have intermediate appellate courts.
H:\CCR\Compensation\Commission on Salaries\2012-2013 Commission on Salaries\Handouts\Appendices\Jan. 8, 2013\ncsc-all-salaries-7-1-2012-downloaded-vs-HI-7-1-2013-A_JUDICIARY 12-18-12.xls 3/8/2013 11:09 AM
244 of 253
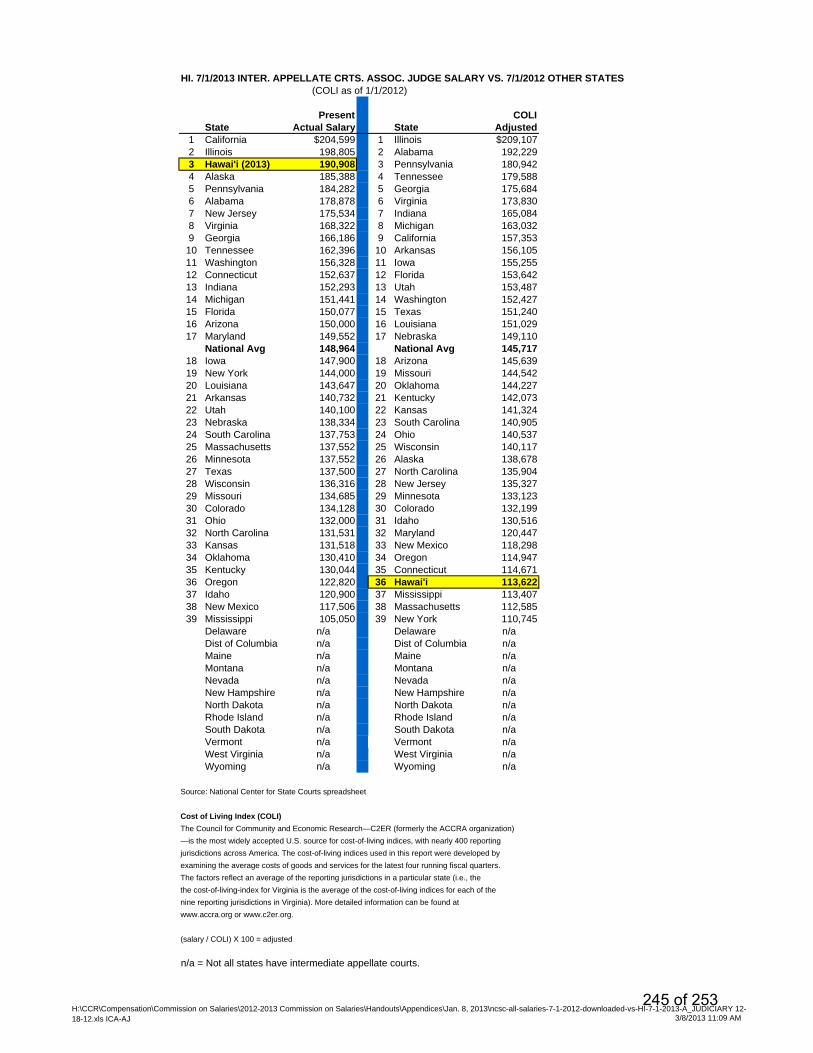
HI. 7/1/2013 INTER. APPELLATE CRTS. ASSOC. JUDGE SALARY VS. 7/1/2012 OTHER STATES(COLI as of 1/1/2012)
Present COLIState Actual Salary State Adjusted
1 California $204,599 1 Illinois $209,1072 Illinois 198,805 2 Alabama 192,2293 Hawai'i (2013) 190,908 3 Pennsylvania 180,9424 Alaska 185,388 4 Tennessee 179,5885 Pennsylvania 184,282 5 Georgia 175,6846 Alabama 178,878 6 Virginia 173,8307 New Jersey 175,534 7 Indiana 165,0848 Virginia 168,322 8 Michigan 163,0329 Georgia 166,186 9 California 157,35310 Tennessee 162,396 10 Arkansas 156,10511 Washington 156,328 11 Iowa 155,25512 Connecticut 152,637 12 Florida 153,64213 Indiana 152,293 13 Utah 153,48714 Michigan 151,441 14 Washington 152,42715 Florida 150,077 15 Texas 151,24016 Arizona 150,000 16 Louisiana 151,02917 Maryland 149,552 17 Nebraska 149,110
National Avg 148,964 National Avg 145,71718 Iowa 147,900 18 Arizona 145,63919 New York 144,000 19 Missouri 144,54220 Louisiana 143,647 20 Oklahoma 144,22721 Arkansas 140,732 21 Kentucky 142,07322 Utah 140,100 22 Kansas 141,32423 Nebraska 138,334 23 South Carolina 140,90524 South Carolina 137,753 24 Ohio 140,53725 Massachusetts 137,552 25 Wisconsin 140,11726 Minnesota 137,552 26 Alaska 138,67827 Texas 137,500 27 North Carolina 135,90428 Wisconsin 136,316 28 New Jersey 135,32729 Missouri 134,685 29 Minnesota 133,12330 Colorado 134,128 30 Colorado 132,19931 Ohio 132,000 31 Idaho 130,51632 North Carolina 131,531 32 Maryland 120,44733 Kansas 131,518 33 New Mexico 118,29834 Oklahoma 130,410 34 Oregon 114,94735 Kentucky 130,044 35 Connecticut 114,67136 Oregon 122,820 36 Hawai'i 113,62237 Idaho 120,900 37 Mississippi 113,40738 New Mexico 117,506 38 Massachusetts 112,58539 Mississippi 105,050 39 New York 110,745
Delaware n/a Delaware n/aDist of Columbia n/a Dist of Columbia n/aMaine n/a Maine n/aMontana n/a Montana n/aNevada n/a Nevada n/aNew Hampshire n/a New Hampshire n/aNorth Dakota n/a North Dakota n/aRhode Island n/a Rhode Island n/aSouth Dakota n/a South Dakota n/aVermont n/a Vermont n/aWest Virginia n/a West Virginia n/aWyoming n/a Wyoming n/a
Source: National Center for State Courts spreadsheet
Cost of Living Index (COLI)The Council for Community and Economic Research—C2ER (formerly the ACCRA organization)—is the most widely accepted U.S. source for cost-of-living indices, with nearly 400 reportingjurisdictions across America. The cost-of-living indices used in this report were developed byexamining the average costs of goods and services for the latest four running fiscal quarters.The factors reflect an average of the reporting jurisdictions in a particular state (i.e., thethe cost-of-living-index for Virginia is the average of the cost-of-living indices for each of thenine reporting jurisdictions in Virginia). More detailed information can be found atwww.accra.org or www.c2er.org.
(salary / COLI) X 100 = adjusted
n/a = Not all states have intermediate appellate courts.
H:\CCR\Compensation\Commission on Salaries\2012-2013 Commission on Salaries\Handouts\Appendices\Jan. 8, 2013\ncsc-all-salaries-7-1-2012-downloaded-vs-HI-7-1-2013-A_JUDICIARY 12-18-12.xls ICA-AJ 3/8/2013 11:09 AM
245 of 253
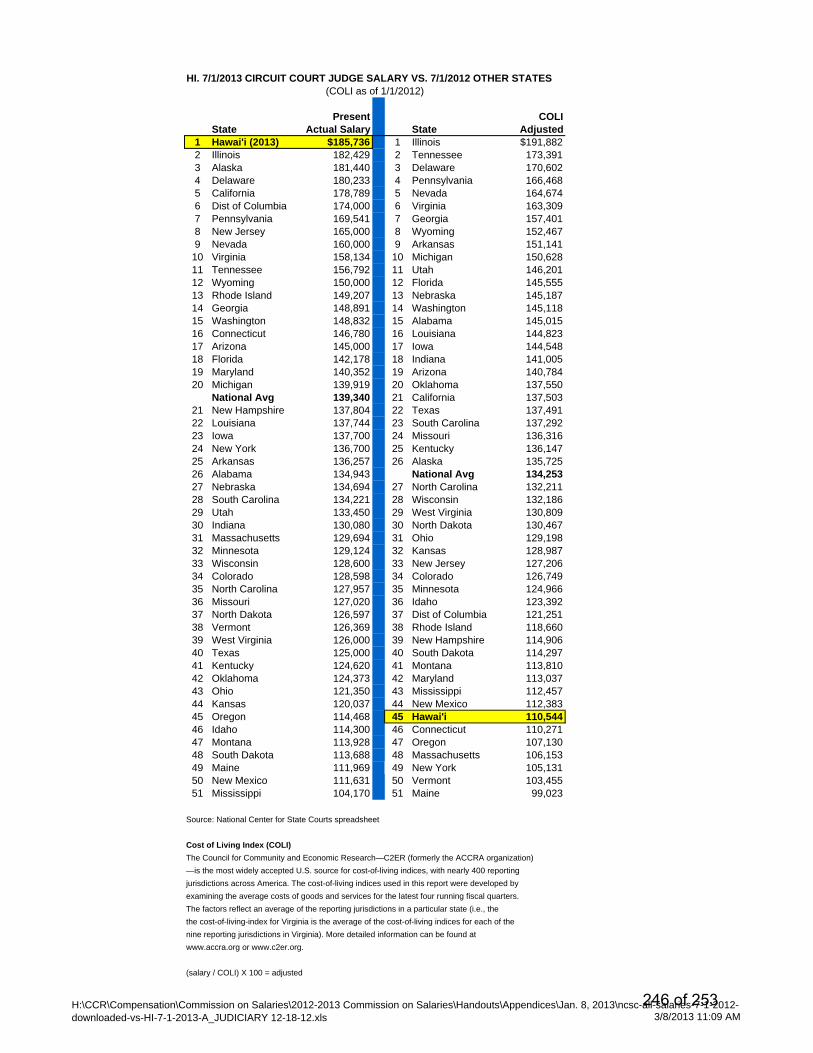
HI. 7/1/2013 CIRCUIT COURT JUDGE SALARY VS. 7/1/2012 OTHER STATES(COLI as of 1/1/2012)
Present COLIState Actual Salary State Adjusted
1 Hawai'i (2013) $185,736 1 Illinois $191,8822 Illinois 182,429 2 Tennessee 173,3913 Alaska 181,440 3 Delaware 170,6024 Delaware 180,233 4 Pennsylvania 166,4685 California 178,789 5 Nevada 164,6746 Dist of Columbia 174,000 6 Virginia 163,3097 Pennsylvania 169,541 7 Georgia 157,4018 New Jersey 165,000 8 Wyoming 152,4679 Nevada 160,000 9 Arkansas 151,141
10 Virginia 158,134 10 Michigan 150,62811 Tennessee 156,792 11 Utah 146,20112 Wyoming 150,000 12 Florida 145,55513 Rhode Island 149,207 13 Nebraska 145,18714 Georgia 148,891 14 Washington 145,11815 Washington 148,832 15 Alabama 145,01516 Connecticut 146,780 16 Louisiana 144,82317 Arizona 145,000 17 Iowa 144,54818 Florida 142,178 18 Indiana 141,00519 Maryland 140,352 19 Arizona 140,78420 Michigan 139,919 20 Oklahoma 137,550
National Avg 139,340 21 California 137,50321 New Hampshire 137,804 22 Texas 137,49122 Louisiana 137,744 23 South Carolina 137,29223 Iowa 137,700 24 Missouri 136,31624 New York 136,700 25 Kentucky 136,14725 Arkansas 136,257 26 Alaska 135,72526 Alabama 134,943 National Avg 134,25327 Nebraska 134,694 27 North Carolina 132,21128 South Carolina 134,221 28 Wisconsin 132,18629 Utah 133,450 29 West Virginia 130,80930 Indiana 130,080 30 North Dakota 130,46731 Massachusetts 129,694 31 Ohio 129,19832 Minnesota 129,124 32 Kansas 128,98733 Wisconsin 128,600 33 New Jersey 127,20634 Colorado 128,598 34 Colorado 126,74935 North Carolina 127,957 35 Minnesota 124,96636 Missouri 127,020 36 Idaho 123,39237 North Dakota 126,597 37 Dist of Columbia 121,25138 Vermont 126,369 38 Rhode Island 118,66039 West Virginia 126,000 39 New Hampshire 114,90640 Texas 125,000 40 South Dakota 114,29741 Kentucky 124,620 41 Montana 113,81042 Oklahoma 124,373 42 Maryland 113,03743 Ohio 121,350 43 Mississippi 112,45744 Kansas 120,037 44 New Mexico 112,38345 Oregon 114,468 45 Hawai'i 110,54446 Idaho 114,300 46 Connecticut 110,27147 Montana 113,928 47 Oregon 107,13048 South Dakota 113,688 48 Massachusetts 106,15349 Maine 111,969 49 New York 105,13150 New Mexico 111,631 50 Vermont 103,45551 Mississippi 104,170 51 Maine 99,023
Source: National Center for State Courts spreadsheet
Cost of Living Index (COLI)The Council for Community and Economic Research—C2ER (formerly the ACCRA organization)—is the most widely accepted U.S. source for cost-of-living indices, with nearly 400 reportingjurisdictions across America. The cost-of-living indices used in this report were developed byexamining the average costs of goods and services for the latest four running fiscal quarters.The factors reflect an average of the reporting jurisdictions in a particular state (i.e., thethe cost-of-living-index for Virginia is the average of the cost-of-living indices for each of thenine reporting jurisdictions in Virginia). More detailed information can be found atwww.accra.org or www.c2er.org.
(salary / COLI) X 100 = adjusted
H:\CCR\Compensation\Commission on Salaries\2012-2013 Commission on Salaries\Handouts\Appendices\Jan. 8, 2013\ncsc-all-salaries-7-1-2012-downloaded-vs-HI-7-1-2013-A_JUDICIARY 12-18-12.xls 3/8/2013 11:09 AM
246 of 253
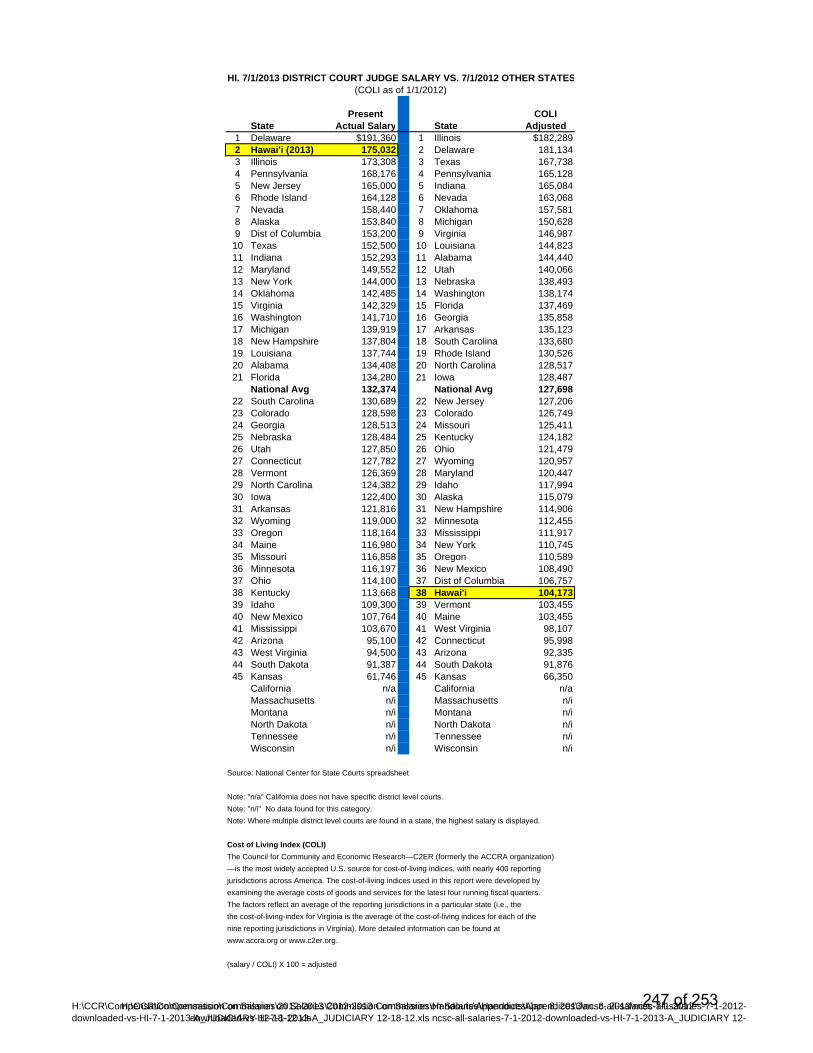
HI. 7/1/2013 DISTRICT COURT JUDGE SALARY VS. 7/1/2012 OTHER STATES(COLI as of 1/1/2012)
Present COLIState Actual Salary State Adjusted
1 Delaware $191,360 1 Illinois $182,2892 Hawai'i (2013) 175,032 2 Delaware 181,1343 Illinois 173,308 3 Texas 167,7384 Pennsylvania 168,176 4 Pennsylvania 165,1285 New Jersey 165,000 5 Indiana 165,0846 Rhode Island 164,128 6 Nevada 163,0687 Nevada 158,440 7 Oklahoma 157,5818 Alaska 153,840 8 Michigan 150,6289 Dist of Columbia 153,200 9 Virginia 146,98710 Texas 152,500 10 Louisiana 144,82311 Indiana 152,293 11 Alabama 144,44012 Maryland 149,552 12 Utah 140,06613 New York 144,000 13 Nebraska 138,49314 Oklahoma 142,485 14 Washington 138,17415 Virginia 142,329 15 Florida 137,46916 Washington 141,710 16 Georgia 135,85817 Michigan 139,919 17 Arkansas 135,12318 New Hampshire 137,804 18 South Carolina 133,68019 Louisiana 137,744 19 Rhode Island 130,52620 Alabama 134,408 20 North Carolina 128,51721 Florida 134,280 21 Iowa 128,487
National Avg 132,374 National Avg 127,69822 South Carolina 130,689 22 New Jersey 127,20623 Colorado 128,598 23 Colorado 126,74924 Georgia 128,513 24 Missouri 125,41125 Nebraska 128,484 25 Kentucky 124,18226 Utah 127,850 26 Ohio 121,47927 Connecticut 127,782 27 Wyoming 120,95728 Vermont 126,369 28 Maryland 120,44729 North Carolina 124,382 29 Idaho 117,99430 Iowa 122,400 30 Alaska 115,07931 Arkansas 121,816 31 New Hampshire 114,90632 Wyoming 119,000 32 Minnesota 112,45533 Oregon 118,164 33 Mississippi 111,91734 Maine 116,980 34 New York 110,74535 Missouri 116,858 35 Oregon 110,58936 Minnesota 116,197 36 New Mexico 108,49037 Ohio 114,100 37 Dist of Columbia 106,75738 Kentucky 113,668 38 Hawai'i 104,17339 Idaho 109,300 39 Vermont 103,45540 New Mexico 107,764 40 Maine 103,45541 Mississippi 103,670 41 West Virginia 98,10742 Arizona 95,100 42 Connecticut 95,99843 West Virginia 94,500 43 Arizona 92,33544 South Dakota 91,387 44 South Dakota 91,87645 Kansas 61,746 45 Kansas 66,350
California n/a California n/aMassachusetts n/i Massachusetts n/iMontana n/i Montana n/iNorth Dakota n/i North Dakota n/iTennessee n/i Tennessee n/iWisconsin n/i Wisconsin n/i
Source: National Center for State Courts spreadsheet
Note: "n/a" California does not have specific district level courts.Note: "n/i" No data found for this category.Note: Where multiple district level courts are found in a state, the highest salary is displayed.
Cost of Living Index (COLI)The Council for Community and Economic Research—C2ER (formerly the ACCRA organization)—is the most widely accepted U.S. source for cost-of-living indices, with nearly 400 reportingjurisdictions across America. The cost-of-living indices used in this report were developed byexamining the average costs of goods and services for the latest four running fiscal quarters.The factors reflect an average of the reporting jurisdictions in a particular state (i.e., thethe cost-of-living-index for Virginia is the average of the cost-of-living indices for each of thenine reporting jurisdictions in Virginia). More detailed information can be found atwww.accra.org or www.c2er.org.
(salary / COLI) X 100 = adjusted
H:\CCR\Compensation\Commission on Salaries\2012-2013 Commission on Salaries\Handouts\Appendices\Jan. 8, 2013\ncsc-all-salaries-7-1-2012-downloaded-vs-HI-7-1-2013-A_JUDICIARY 12-18-12.xls
H:\CCR\Compensation\Commission on Salaries\2012-2013 Commission on Salaries\Handouts\Appendices\Jan. 8, 2013\ncsc-all-salaries-7-1-2012-downloaded-vs-HI-7-1-2013-A_JUDICIARY 12-18-12.xls ncsc-all-salaries-7-1-2012-downloaded-vs-HI-7-1-2013-A_JUDICIARY 12-
247 of 253

Appendix D
Legislative Branch
Appendices
248 of 253
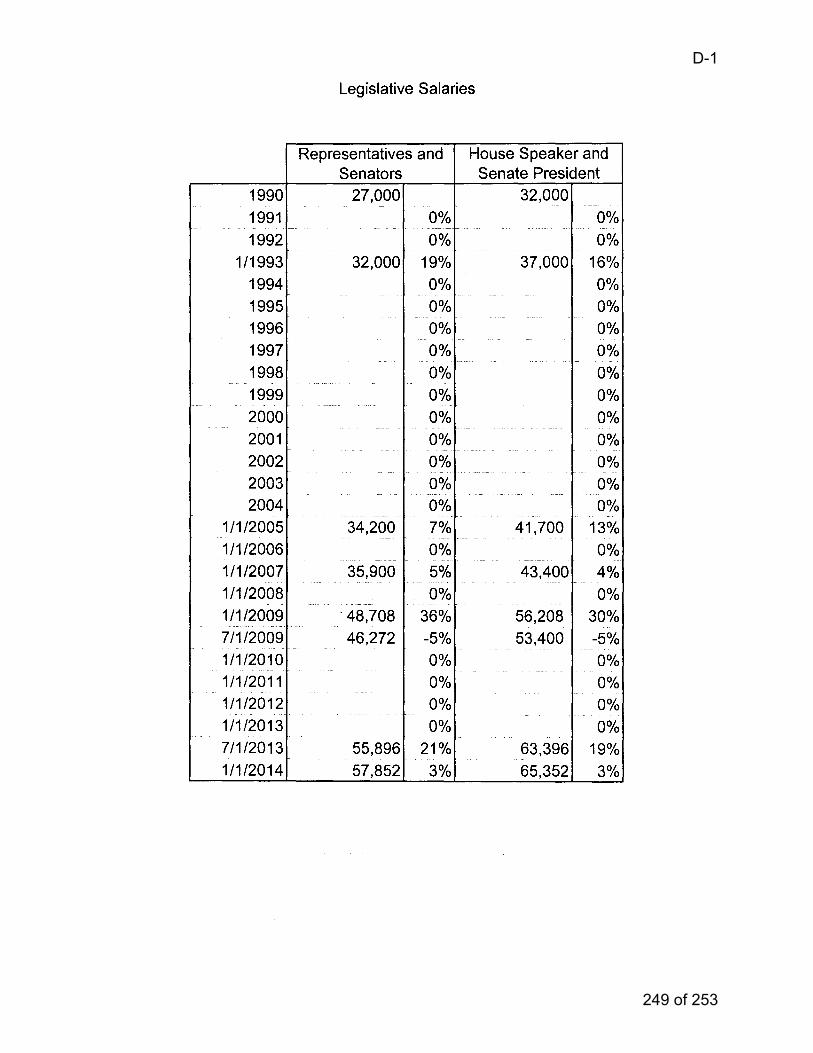
D-1
249 of 253
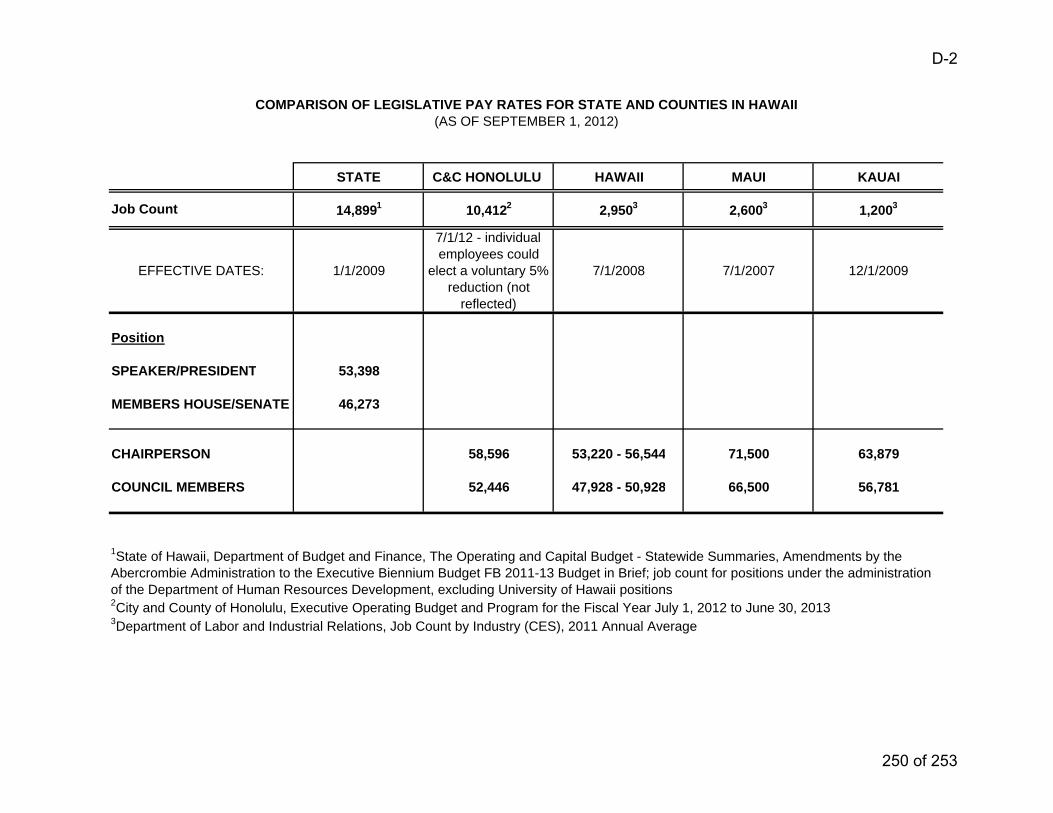
STATE C&C HONOLULU HAWAII MAUI KAUAI
EFFECTIVE DATES: 1/1/2009
7/1/12 - individual employees could
elect a voluntary 5% reduction (not
reflected)
7/1/2008 7/1/2007 12/1/2009
Position
SPEAKER/PRESIDENT 53,398
MEMBERS HOUSE/SENATE 46,273
CHAIRPERSON 58,596 53,220 - 56,544 71,500 63,879
COUNCIL MEMBERS 52,446 47,928 - 50,928 66,500 56,781
2City and County of Honolulu, Executive Operating Budget and Program for the Fiscal Year July 1, 2012 to June 30, 20133Department of Labor and Industrial Relations, Job Count by Industry (CES), 2011 Annual Average
1State of Hawaii, Department of Budget and Finance, The Operating and Capital Budget - Statewide Summaries, Amendments by the Abercrombie Administration to the Executive Biennium Budget FB 2011-13 Budget in Brief; job count for positions under the administration of the Department of Human Resources Development, excluding University of Hawaii positions
COMPARISON OF LEGISLATIVE PAY RATES FOR STATE AND COUNTIES IN HAWAII(AS OF SEPTEMBER 1, 2012)
Job Count 10,4122 2,9503 2,6003 1,200314,8991
D-2
250 of 253
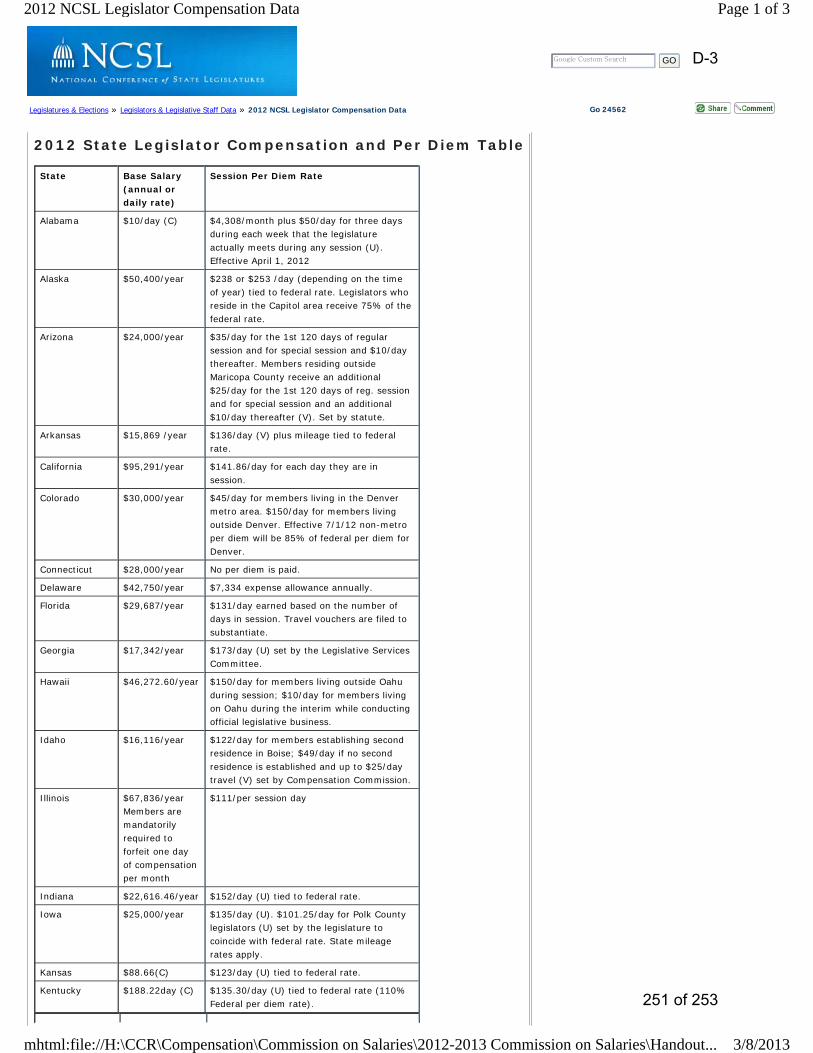
Google Custom Search GO
Legislatures & Elections » Legislators & Legislative Staff Data » 2012 NCSL Legislator Compensation Data Go 24562
2012 State Legislator Compensation and Per Diem Table
State Base Salary (annual or daily rate)
Session Per Diem Rate
Alabama $10/day (C) $4,308/month plus $50/day for three days during each week that the legislature actually meets during any session (U). Effective April 1, 2012
Alaska $50,400/year $238 or $253 /day (depending on the time of year) tied to federal rate. Legislators who reside in the Capitol area receive 75% of the federal rate.
Arizona $24,000/year $35/day for the 1st 120 days of regular session and for special session and $10/day thereafter. Members residing outside Maricopa County receive an additional $25/day for the 1st 120 days of reg. session and for special session and an additional $10/day thereafter (V). Set by statute.
Arkansas $15,869 /year $136/day (V) plus mileage tied to federal rate.
California $95,291/year $141.86/day for each day they are in session.
Colorado $30,000/year $45/day for members living in the Denver metro area. $150/day for members living outside Denver. Effective 7/1/12 non-metro per diem will be 85% of federal per diem for Denver.
Connecticut $28,000/year No per diem is paid.
Delaware $42,750/year $7,334 expense allowance annually.
Florida $29,687/year $131/day earned based on the number of days in session. Travel vouchers are filed to substantiate.
Georgia $17,342/year $173/day (U) set by the Legislative Services Committee.
Hawaii $46,272.60/year $150/day for members living outside Oahu during session; $10/day for members living on Oahu during the interim while conducting official legislative business.
Idaho $16,116/year $122/day for members establishing second residence in Boise; $49/day if no second residence is established and up to $25/day travel (V) set by Compensation Commission.
Illinois $67,836/year Members are mandatorily required to forfeit one day of compensation per month
$111/per session day
Indiana $22,616.46/year $152/day (U) tied to federal rate.
Iowa $25,000/year $135/day (U). $101.25/day for Polk County legislators (U) set by the legislature to coincide with federal rate. State mileage rates apply.
Kansas $88.66(C) $123/day (U) tied to federal rate.
Kentucky $188.22day (C) $135.30/day (U) tied to federal rate (110% Federal per diem rate).
Page 1 of 32012 NCSL Legislator Compensation Data
3/8/2013mhtml:file://H:\CCR\Compensation\Commission on Salaries\2012-2013 Commission on Salaries\Handout...
D-3
251 of 253
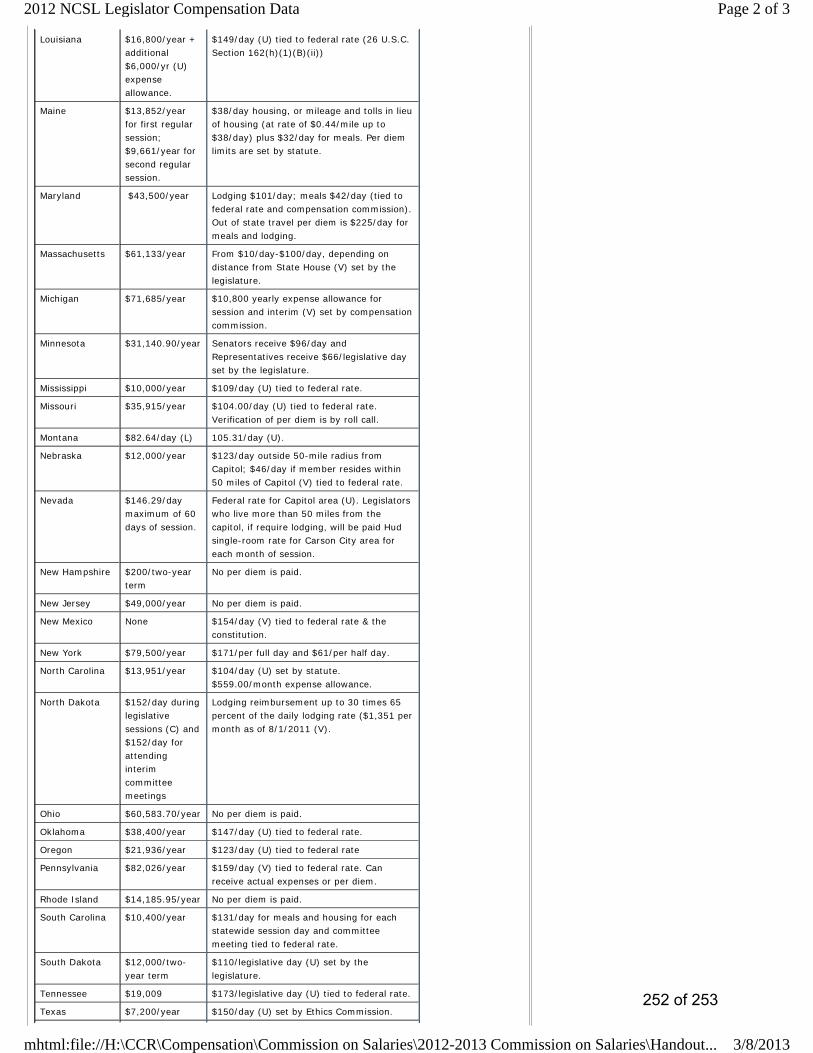
Louisiana $16,800/year + additional $6,000/yr (U) expense allowance.
$149/day (U) tied to federal rate (26 U.S.C. Section 162(h)(1)(B)(ii))
Maine $13,852/year for first regular session; $9,661/year for second regular session.
$38/day housing, or mileage and tolls in lieu of housing (at rate of $0.44/mile up to $38/day) plus $32/day for meals. Per diem limits are set by statute.
Maryland $43,500/year Lodging $101/day; meals $42/day (tied to federal rate and compensation commission). Out of state travel per diem is $225/day for meals and lodging.
Massachusetts $61,133/year From $10/day-$100/day, depending on distance from State House (V) set by the legislature.
Michigan $71,685/year $10,800 yearly expense allowance for session and interim (V) set by compensation commission.
Minnesota $31,140.90/year Senators receive $96/day and Representatives receive $66/legislative day set by the legislature.
Mississippi $10,000/year $109/day (U) tied to federal rate.
Missouri $35,915/year $104.00/day (U) tied to federal rate. Verification of per diem is by roll call.
Montana $82.64/day (L) 105.31/day (U).
Nebraska $12,000/year $123/day outside 50-mile radius from Capitol; $46/day if member resides within 50 miles of Capitol (V) tied to federal rate.
Nevada $146.29/day maximum of 60 days of session.
Federal rate for Capitol area (U). Legislators who live more than 50 miles from the capitol, if require lodging, will be paid Hud single-room rate for Carson City area for each month of session.
New Hampshire $200/two-year term
No per diem is paid.
New Jersey $49,000/year No per diem is paid.
New Mexico None $154/day (V) tied to federal rate & the constitution.
New York $79,500/year $171/per full day and $61/per half day.
North Carolina $13,951/year $104/day (U) set by statute. $559.00/month expense allowance.
North Dakota $152/day during legislative sessions (C) and $152/day for attending interim committee meetings
Lodging reimbursement up to 30 times 65 percent of the daily lodging rate ($1,351 per month as of 8/1/2011 (V).
Ohio $60,583.70/year No per diem is paid.
Oklahoma $38,400/year $147/day (U) tied to federal rate.
Oregon $21,936/year $123/day (U) tied to federal rate
Pennsylvania $82,026/year $159/day (V) tied to federal rate. Can receive actual expenses or per diem.
Rhode Island $14,185.95/year No per diem is paid.
South Carolina $10,400/year $131/day for meals and housing for each statewide session day and committee meeting tied to federal rate.
South Dakota $12,000/two-year term
$110/legislative day (U) set by the legislature.
Tennessee $19,009 $173/legislative day (U) tied to federal rate.
Texas $7,200/year $150/day (U) set by Ethics Commission.
Page 2 of 32012 NCSL Legislator Compensation Data
3/8/2013mhtml:file://H:\CCR\Compensation\Commission on Salaries\2012-2013 Commission on Salaries\Handout...
252 of 253
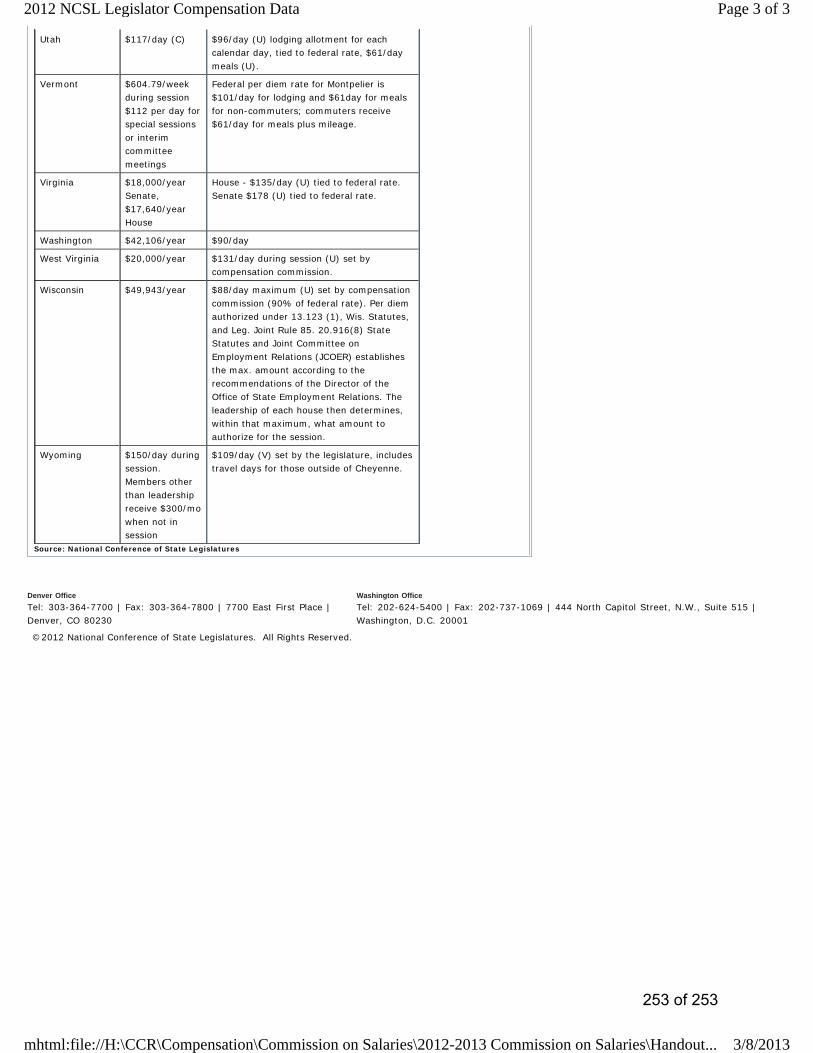
Source: National Conference of State Legislatures
Utah $117/day (C) $96/day (U) lodging allotment for each calendar day, tied to federal rate, $61/day meals (U).
Vermont $604.79/week during session $112 per day for special sessions or interim committee meetings
Federal per diem rate for Montpelier is $101/day for lodging and $61day for meals for non-commuters; commuters receive $61/day for meals plus mileage.
Virginia $18,000/year Senate, $17,640/year House
House - $135/day (U) tied to federal rate. Senate $178 (U) tied to federal rate.
Washington $42,106/year $90/day
West Virginia $20,000/year $131/day during session (U) set by compensation commission.
Wisconsin $49,943/year $88/day maximum (U) set by compensation commission (90% of federal rate). Per diem authorized under 13.123 (1), Wis. Statutes, and Leg. Joint Rule 85. 20.916(8) State Statutes and Joint Committee on Employment Relations (JCOER) establishes the max. amount according to the recommendations of the Director of the Office of State Employment Relations. The leadership of each house then determines, within that maximum, what amount to authorize for the session.
Wyoming $150/day during session. Members other than leadership receive $300/mo when not in session
$109/day (V) set by the legislature, includes travel days for those outside of Cheyenne.
Denver Office Tel: 303-364-7700 | Fax: 303-364-7800 | 7700 East First Place | Denver, CO 80230
Washington Office Tel: 202-624-5400 | Fax: 202-737-1069 | 444 North Capitol Street, N.W., Suite 515 | Washington, D.C. 20001
©2012 National Conference of State Legislatures. All Rights Reserved.
Page 3 of 32012 NCSL Legislator Compensation Data
3/8/2013mhtml:file://H:\CCR\Compensation\Commission on Salaries\2012-2013 Commission on Salaries\Handout...
253 of 253