Embed Size (px)
Citation preview
COMMUNITY COLLEGE SELECTIVE ENROLLMENT AND THE CHALLENGE TO OPEN ACCESS
A dissertation presented to the faculty of the Graduate School of Western Carolina University in partial fulfillment of the
requirements for the degree of Doctor of Education.
By
David Brian Morris
Director: Dr. Mary Jean Ronan Herzog Professor
School of Teaching and Learning
Committee Members: Dr. Meagan Karvonen, Human Services
Dr. Keith Mackie, Catawba Valley Community College
December 2012
ACKNOWLEDGMENTS
A project of this magnitude requires the cooperation of many. I gratefully
acknowledge the support and guidance of my committee members. Many thanks to
committee director Dr. Mary Jean Ronan Herzog for keeping it all together, Dr. Meagan
Karvonen for endless patience, and Dr. Keith Mackie for inspiration and encouragement.
Dr. Ann Alexander, Dr. Jessica Cunningham, and Dr. Casey Hurley also made
meaningful contributions to the process.
My community college colleagues have been particularly supportive. Much of the
success of this project is a result of their cooperation and assistance. The members of my
pilot committee gave their time graciously and generously, and numerous other
colleagues have answered questions, granted interviews, and shared their time during the
many activities leading to this capstone project. I thank you all for sharing selflessly.
During my time at WCU, I developed some close personal friendships. Marvin set
standards I have tried hard to uphold. Emily, James, and Steve were ever present, and I
look forward to continued relationships throughout our careers. Thank you all for the
welcome camaraderie.
I wish to acknowledge my parents for their unfailing belief in my abilities, for
instilling in me patience, persistence, and determination, and for giving me the gifts of
incurable wonder and curiosity. Finally, and most importantly, I acknowledge the loving
support of my wife, Kelly, and our children, Leo and Sophie. This entire process began
for them, and the sacrifices they made kept the fires burning in me to see it through.

DEDICATION
For Kelly, Leo, and Sophie, who have coped and endured.
TABLE OF CONTENTS
Page List of Tables .......................................................................................................................6 Abstract ................................................................................................................................7 Chapter One: Introduction ...................................................................................................9 Conceptual Framework..........................................................................................10 Problem Statement .................................................................................................13 Purpose of the Study ..............................................................................................14 Research Questions................................................................................................14 Research Design.....................................................................................................17 Delimitations, Limitations, and Assumptions........................................................18 Delimitations..............................................................................................18 Limitations .................................................................................................20 Assumptions...............................................................................................21 Definition of Key Terms........................................................................................22 Significance of the Study .......................................................................................24 Summary ................................................................................................................25 Chapter Two: Review of the Literature .............................................................................26 The Open Access Mission .....................................................................................26 Enrollment Management........................................................................................34 Marketing and Recruiting Practices in Higher Education .....................................44 Emergence of Marketing in Higher Education ..........................................46 The Status of Marketing in Higher Education ...........................................48 Recruiting in Higher Education .................................................................51 Marketing, Recruiting, and the Community College.................................53 Summary ................................................................................................................54 Chapter Three: Research Design and Methodology ..........................................................56 Research Problem and Purpose of Study ...............................................................56 Research Questions................................................................................................58 Study Setting, Population, and Sample..................................................................60 Data Sources ..........................................................................................................62 Survey Instrument......................................................................................62 Survey instrument development ....................................................62 Survey instrument contents............................................................63 Reliability and validity of the instrument ......................................65 Archival Data Contents..............................................................................67 Data Collection Procedures....................................................................................68 Survey Data Collection ..............................................................................68 Archival Data Collection ...........................................................................70 Data Analysis Procedures ......................................................................................71 Research Question One..............................................................................71 Research Questions Two and Three ..........................................................73
Research Question Four.............................................................................75 Research Question Five .............................................................................75 Summary ................................................................................................................76 Chapter Four: Findings ......................................................................................................78 Survey Participants ................................................................................................81 Percentage of Colleges with Selective Marketing and Recruiting.........................82 Selective Marketing and Demographic Relationships...........................................85 Nonselective Marketing and Demographic Relationships.....................................88 Demographic Relationships Between Groups .......................................................92 Depth of Implementation and Demographic Composition....................................95 Summary ................................................................................................................98 Chapter Five: Discussion, Recommendations, and Conclusion ......................................100 Summary of the Study .........................................................................................101 Discussion of the Findings...................................................................................102 Research Question One............................................................................102 Research Questions Two and Three ........................................................104 Research Question Four...........................................................................105 Research Question Five ...........................................................................106 Limitations of the Study.......................................................................................108 Implications for Policy and Practice ....................................................................110 Recommendations for Future Research ...............................................................114 Conclusion ...........................................................................................................115 References........................................................................................................................117 Appendices.......................................................................................................................129 Appendix A: Survey Instrument ..........................................................................129 Appendix B: Initial Mail Contact ........................................................................134 Appendix C: Initial Email Contact ......................................................................135 Appendix D: First Email Follow Up....................................................................136 Appendix E: Final Email Follow Up ...................................................................137
6
LIST OF TABLES
Table 1. Job Titles................................................................................................................82 2. Relevant Survey Questions and Responses ...........................................................84 3. Selective Group Descriptive Statistics & One-Sample t-Test ...............................87 4. Nonselective Group Descriptive Statistics & One-Sample t-Test .........................90 5. Independent Samples t-Test Between Selective and Nonselective Colleges.........94 6. Selective Colleges and Depth of Implementation..................................................96
7
ABSTRACT
COMMUNITY COLLEGE SELECTIVE ENROLLMENT AND THE CHALLENGE
TO OPEN ACCESS
David Brian Morris
Western Carolina University (Fall 2012)
Director: Dr. Mary Jean Ronan Herzog
The open access mission is central to the community college role and mission in higher
education. Although initially implemented by four-year colleges and universities,
adoption of formal enrollment management initiatives in community colleges is on the
increase. Admission, matriculation, retention, and persistence are affected by enrollment
management policies. Initiatives designed to control enrollment may alter the open access
commitment of the community college by limiting access to some students. Enrollment
management practices at the community college can include selective marketing and
recruiting practices. This study examined the prevalence of selective marketing and
recruiting practices at North Carolina community colleges and the impact of such
practices on enrollment. Results of the study indicated that about half of the community
colleges in North Carolina practice selective marketing and recruiting practices, although
to date those practices have had no apparent impact on the demographic composition of
the student body. Student demographic representation in enrollment at North Carolina
community colleges was statistically significantly different than the corresponding
demographic composition of college service areas. Organizational depth of marketing
implementation at selective colleges was compared to the demographic composition of
student body enrollment. There was no relationship between organizational depth of
8
marketing implementation at selective colleges and student body demographic
composition. Study results inform decisions affecting the use of selective marketing and
recruiting practices within the context of the open access mission at the community
college. Implications for policy and practice include the recommendation to create an
enrollment management division at each community college, to streamline use of the
marketing dollar, and to increase the use of marketing to influence the decision-making
process of internal stakeholders.
9
CHAPTER ONE: INTRODUCTION
Community college administrators often confront challenges to the multiple
missions of the community college. As the underlying foundation of community college
missions, the open access mission supersedes all other institutional goals (Shannon &
Smith, 2006). Diverse student needs, coupled with multiple mission priorities and limited
resources, force administrators to regularly reevaluate planning strategies. Balancing
academic standards of excellence with expanding services while maintaining physical
plants requires extensive and informed administrative skill. If the community college is to
remain “the people’s college” among institutions of higher education, the open access
mission must remain a priority in the planning strategies of executive administrators.
Selective recruitment practices, coupled with advanced marketing techniques, have the
potential to erode the unbiased execution of the open access mission. These techniques,
derived from enrollment management practices, evolved at four-year universities and
private colleges, institutions traditionally unfettered by the dictates of maintaining open
access to higher education.
Enrollment management is the umbrella term describing marketing, recruiting,
and retention strategies conceived and developed in four-year colleges and universities as
tools to increase, structure, and maintain a desired student body (Hossler, Bean, &
Associates, 1990). While initially a technique to increase enrollment and retention,
enrollment management today is a complex marketing method designed to create the
predictable demographics of a well-crafted student body through the use of traditional
marketing and business tools. Potentially antithetical elements of enrollment management
began to appear in community colleges as administrators sought ways to combat
10
recurrent underfunding and variability in enrollment numbers (Huddleston, 2000).
Vander Schee (2009) identified institutional marketing, admissions/recruitment, retention
programs, planning, and model of coordination as the five components of a
contemporary, comprehensive enrollment management program. This study focused on
one aspect of community college marketing and recruiting strategies, the selective
marketing and recruiting of specific demographic groups through targeted marketing and
recruiting strategies.
I chose the topic for this study after the community college where I work entered
into a relationship with a consulting firm. The consulting firm was hired to improve the
enrollment management processes at our college. At the time, I was fully immersed in a
graduate program in community college administration. Information gathered for my
graduate studies revealed some very specific requirements for the open access mission of
the community college. Many of the suggestions being made by representatives of the
consulting firm seemed to be in direct conflict with the open access mission. Some of the
specific practices recommended by the consulting firm seemed to violate the spirit, if not
the letter, of the open access policies in place at the community college. This study
allowed me to explore my concerns about challenges to the open access mission using
quantitative research methods. My study provides an addition to the academic dialogue
surrounding open access to higher education at the community college.
Conceptual Framework
Matters of college selection, student retention, and student persistence to
graduation gained prominence through the works of Spady (1967), Tinto (1973, 1975),
Astin (1975), and others. Researchers focused on uncovering the motivating factors in
11
student decisions to attend college, which college to attend, and whether or not to drop
out of college before graduation. Research findings in these areas brought attention to the
notion of student profiles and their usefulness to researchers and higher education
administrators for setting planning priorities (Kemerer, Baldridge, & Green, 1982). The
use of student profiles to target specific demographic groups for marketing and recruiting
efforts marked the beginning of the enrollment management era in higher education.
Roman (2007) noted the relative lack of empirical studies referencing enrollment
management issues at the community college. A few studies have provided some insight
into the practice and conditions surrounding enrollment management. Holton (1998)
followed 494 freshmen from Frederick Community College in a three-year longitudinal
study. The results of Holton’s study were a graphic illustration of enrollment and
retention issues typical freshman students faced at one community college. Of the more
significant findings reported by Holton, only about 20% of community college freshmen
completed an Associate of Arts (AA) degree or certificate within three years. Around
one-fourth successfully transferred to a four-year institution. More than a quarter of those
traditional freshmen students received all grades of F, W, or U for at least one semester.
Pennington, McGinty, and Williams (2002) studied community college
enrollment and its relationship to economic trends. The authors reported findings
supporting a sensitive relationship between community college enrollment and the
economy. Namely, when the economy worsens, community college enrollment increases.
According to the authors, community college enrollment increases quickly as the
unemployment rate increases. Incoming students seek to better their personal
employment viability by renewing or increasing skills in a challenging job market. In
12
North Carolina, community colleges are funded based on the previous year’s enrollment
numbers, such that during periods of increasing enrollments, administrators consistently
operate under budgets derived from a smaller enrollment than the currently attending
population of students (G. Hinshaw, personal communication, April 16, 2007). As
college enrollments reach capacity, the influx of new students has implications for how
community college administrators craft recruiting, marketing, and retention programs.
Walters (2003) described the implementation of a one-stop shop registration and
enrollment management plan at Onondaga Community College. The one-stop concept
was designed to enhance the student transition into a community college setting. By
increasing student interaction with the college, administrators hoped to improve lagging
college student retention rates (Tinto, 1987). Walters (2003) reported increased student
satisfaction rates. Actual changes in retention rates were beyond the scope of Walters’
study.
Ritze (2006) completed a case study of enrollment management and attempts to
preserve the open access mission at Bronx Community College. The author noted the
paradoxical challenge to community colleges of being nonselective institutions regarding
student enrollment and yet accountable for retention and persistence rates, and the quality
of graduates. Rather than attempt to craft student body composition, Bronx Community
College administrators were able to use some of the institutional research techniques of
enrollment management to enhance the experience of currently enrolled students.
The Community College Research Center (Dougherty, Marshall, & Soonachan,
2006; Dougherty & Reid, 2006; Dougherty & Reid, 2007; Dougherty, Reid, &
Nienhusser, 2006) completed a major audit of community college open access policies at
13
the state level. Report authors examined legislative policy language with regard to the
open access mission of the community college. Their findings suggested the community
college open access mission was viable and healthy at the state policy level. This study
examined the open access mission at a more focused and local level, seeking to
understand the open access mission through an examination of actual student enrollment
numbers at community colleges in North Carolina.
Problem Statement
To maintain the open access mandate of the community college while attempting
to manage enrollment, some college administrators have chosen to apply selective
marketing and recruiting practices (Ritze, 2006; Thompson, Waterous, & Delaney, 2003).
By selectively choosing which enrollment management techniques to apply, community
college administrators can simulate enrollment management without overtly altering the
open access admissions process. The use of selective practices may raise barriers to
higher education for certain groups. For example, selective use of targeted marketing for
any one specific demographic group will naturally raise awareness of educational
opportunities within the selected group (Goenner & Pauls, 2006). At the first-come, first-
served community college, this single technique alone can potentially alter access for
non-targeted groups in high demand/limited enrollment programs.
Barriers to enrollment already exist at the community college. Cavanaugh (2003)
identified several barriers attributed to inadequate funding. Examples included reduced
class offerings, lack of space, and already-mentioned limited enrollment programs,
among others. Dougherty, Reid, and Nienhusser (2006) discussed student outreach
programs in relation to educational access. Hebel (2004) added several other enrollment
14
barriers to a growing list, including less financial aid, campus mergers, and, ironically,
increased retention due to improved marketing efforts. Selective marketing and recruiting
practices may be adding additional barriers to the existing list of challenges faced by
many students seeking to enroll in higher education.
Purpose of the Study
Due to limited resources and physical constraints, selective marketing and
recruiting practices may have the practical effect of limiting access to certain
demographic groups by increasing access for others. The purpose of this study was to
first determine the presence or absence of selective marketing and recruiting practices in
North Carolina community colleges. Once determined, the relationship between
community college and service area demographics was investigated across community
colleges with and without selective marketing and recruiting practices. Community
college administrators, board members, system office policy makers, and state legislators
could use the results of this study to make policy decisions affecting the open access
priority of the community college.
Research Questions
The community college system is in a phase of institutional maturity. In 1947, the
President’s Commission on Higher Education recommended the creation of the
community college system as an educational system capable of providing higher
education for all those who could benefit (Russell, 1949). Preservation of the access
mission is essential to maintaining the spirit of the community college. Researchers have
focused on policies potentially affecting the access mission of the community college
(Dougherty & Reid, 2007). Lords (2000) found that 500 of the almost 1200 community
15
colleges in the U. S. hired enrollment management consultants during the last three years
of the 20th century. As administrators concentrate resources on attracting and retaining
higher performing students, those students perhaps most in need of education are
marginalized or ignored. Selective marketing and recruiting practices have the potential
to hinder access to certain groups. Lack of awareness of educational opportunities may
potentially marginalize certain groups even further. As noted by the President’s
Commission on Higher Education, marginalized groups are less capable of contributing
meaningfully to society (Bonds, 1948; Cowley, 1948; Russell, 1949).
This study was designed to investigate access to education at North Carolina
community colleges when examined through the lens of selective marketing and
recruiting practices. Conceived as a universal access institution, community college
demographics should reflect a consistent, albeit disproportional, statistical relationship
with the surrounding service area demographics (Bonds, 1948; Cowley, 1948; Russell,
1949). The purpose of this study was to examine enrollment at North Carolina
community colleges with respect to selective marketing and recruiting practices when
compared to the demographics of the college service area. To achieve this purpose,
several research questions were posited. Five research questions were developed to
determine the relationship between enrollment trends at North Carolina community
colleges, selective marketing and recruiting practices, and service area demographics. To
guide the statistical analysis of research questions two, three, and four, null and
alternative hypotheses were developed. The research questions, null, and alternative
hypotheses for this study were:
16
1. What percentage of community colleges in North Carolina practice selective
marketing and recruiting?
2. What is the relationship between student enrollment and service area
demographics at community colleges with selective marketing and recruiting
practices?
H02 = The demographic composition of community college enrollment is the
same as the demographic composition of the college service area population
for colleges with selective marketing and recruiting practices.
H2 = The demographic composition of community college enrollment is
different from the demographic composition of the college service area
population for colleges with selective marketing and recruiting practices.
3. What is the relationship between student enrollment and service area
demographics at community colleges without selective marketing and
recruiting practices?
H03 = The demographic composition of community college enrollment is the
same as the demographic composition of the college service area population
for colleges without selective marketing and recruiting practices.
H3 = The demographic composition of community college enrollment is
different from the demographic composition of the college service area
population for colleges without selective marketing and recruiting practices.
4. How do the demographic relationships of community colleges with selective
marketing and recruiting practices compare to the demographic relationships
of community colleges without selective marketing and recruiting practices?
17
H04 = The relationship between the demographic composition of community
college enrollment and the demographic composition of the college service
area population for colleges with selective marketing and recruiting practices
is the same as the relationship between the demographic composition of
community college enrollment and the demographic composition of the
college service area population for colleges without selective marketing and
recruiting practices.
H4 = The relationship between the demographic composition of community
college enrollment and the demographic composition of the college service
area population for colleges with selective marketing and recruiting practices
is different from the relationship between the demographic composition of
community college enrollment and the demographic composition of the
college service area population for colleges without selective marketing and
recruiting practices.
5. How does depth of implementation of selective marketing and recruiting
practices affect student demographics at North Carolina community colleges
practicing selective marketing and recruiting practices?
Research Design
This study was a causal comparative analysis conducted in two phases. Phase one
of the study involved a survey of community colleges in North Carolina to determine the
presence or absence of selective marketing and recruiting practices. Participants at fifty-
seven colleges in the North Carolina Community College System (NCCCS) were
delivered an electronic survey. Fifty-one participants returned usable surveys. The survey
18
responses were used to divide colleges into two groups, one with selective marketing and
recruiting practices and one without those practices.
Phase two of the study involved a statistical analysis of various demographic data.
Data were gathered for selected demographic groups from each college and from each
college service area. One-sample t-tests were conducted on each demographic category to
determine the relationship between the demographic composition of college enrollment
and the demographic composition of the service area. Once the demographic relationship
was established for both the selective and nonselective groups, independent t-tests were
conducted on each demographic category to determine the statistical relationship between
the two groups. Finally, the degree of administrative oversight, or depth of
implementation, of marketing and recruiting practices at selective colleges was examined
to determine the relationship between depth of implementation and the demographic
composition of enrollment.
Delimitations, Limitations, and Assumptions
Delimitations
According to Sampson (2012), delimitations in research refer to anticipated
constraints of the study, whereas limitations refer to the unanticipated constraints of the
study. Delimitations are boundaries put in place by the researcher and are relevant to the
scope and generalizability of the study. As such, delimitations are predictable and help to
bound the study and to define what will not be examined. Limitations, in contrast, arise
unexpectedly, and can occur in sampling methods, data collection, or data analysis.
This study was delimited to the North Carolina community college system.
Community college systems vary in structure and scope from state to state (Cohen &
19
Brawer, 2003). This study focused on selective marketing and recruiting practices at
colleges in the NCCCS in an attempt to identify college practices within one common,
overarching administrative structure.
Westcott (2005) gave a comprehensive overview of the development of the
community college system in North Carolina. The author’s retrospective account traced
the creation of the community college system in North Carolina from its early inception
as a loosely-organized group of industrial education centers through the present
arrangement of colleges. The NCCCS is composed of 58 colleges spread geographically
across the 100 counties of the state. Each college serves a legislatively mandated service
area, typically a one- to three-county surrounding area (N.C. G. S. 115-D-2, 2012) as
determined by the State Board of Community Colleges.
The State Board of Community Colleges is the governing board created by North
Carolina statute and the state board oversees the NCCCS office. The NCCCS, as the
administrative arm of the state board, is responsible for administering the policies and
procedures of the college system as approved by the state board (N.C. G. S. 115-D-5,
2012). North Carolina General Statute 115-D-12 (2012) specifies the composition of each
community college Board of Trustees. Each community college governing board consists
of four members elected by the local school board or boards of the college service area,
four members elected by local county commissioners of the college service area, four
members appointed by the governor, and the president of the college student governing
body as an ex officio non-voting member.
College Boards of Trustees perform various duties as prescribed by statute,
including the hiring of each respective college president. Board members officially hire
20
each college employee based on recommendations by the college president. As a body
corporate, college boards also own land, lease land, enter into financial agreements, and
institute and defend legal actions on behalf of the college (N.C. G. S. 115-D-14, 2012;
N.C. G. S. 115-D-20, 2012). North Carolina community colleges operate under the
leadership and guidance of the president. Each college is structured according to the
administrative arrangement determined by the president and the Board of Trustees. Given
the unique administrative structure of the NCCCS, this study may not be generalizable to
community college systems in other states.
This study was also delimited to determining the presence or absence of selective
marketing and recruiting practices. Marketing and recruiting practices vary widely from
college to college (Kotler & Fox, 1995). Because of the wide variety of marketing and
recruiting options, this study did not examine the specific types of marketing and
recruiting practices in place at each college.
This study focused on access to higher education. Community colleges in North
Carolina offer traditional classes in curriculum education. Colleges also offer a wide
variety of other educational offerings such as compensatory education, community
service, and fire and rescue training, among others. Because this study was focused only
on access to higher education opportunities, it was delimited to curriculum enrollment
data.
Limitations
Limitations of this study included modifications to the survey instrument and
selection of the participants completing the survey. The survey instrument was modified
from a version developed by Taber (1989) and used by Vander Schee (2009) to examine
21
enrollment management programs at small, private colleges. The survey instrument in
this study was modified to remove references to enrollment management. Because
community colleges are mandated as open access institutions, the term enrollment
management, as used in other higher educational institutions, has negative implications
for the open access mission of the community college. Therefore, the term enrollment
management was replaced with the term marketing or recruiting. Confusion about these
terms may have affected survey participant response.
As outlined further in the methodology section, the chief administrative officer of
student services at each community college was asked to complete the survey. Because of
variations in organizational structure among North Carolina community colleges, the
person holding the position of chief administrative officer was not always readily
identifiable. In some cases, the chief administrative officer referred completion of the
survey to another employee. In some colleges, marketing and recruiting functions were
not coordinated among college employees, thereby introducing the possibility of
confusion surrounding the terms used in the survey instrument. Any of these variations in
the completion of the survey may have contributed to inaccuracies in reporting the
presence or absence of selective marketing and recruiting practices among survey
respondents.
Assumptions
This study compared the demographic makeup of North Carolina community
colleges to the service area demographic makeup of each respective college. The
intention was to determine if selective marketing and recruiting practices affect unbiased
access to education at North Carolina community colleges. The primary assumption of
22
this study was that community colleges, as open access institutions, would have a
demographic makeup that is consistently reflective of service area demographics. While
it is known that demographic groups are disproportionately represented in higher
education (American Association of Community Colleges [AACC], 2011), the
assumption was that disproportionate enrollment would follow from service area to
service area, given no outside influence on enrollment, e.g., selective marketing or
recruiting campaigns.
Definition of Key Terms
Definitions of marketing, recruiting, and enrollment management vary over time
and by author. To maintain consistency, the following definitions were used during the
completion of this study.
Marketing. Kotler and Fox (1995) gave a definition for marketing specifically
focused on marketing as a function of educational institutions. They wrote,
Marketing is the analysis, planning, implementation, and control of carefully
formulated programs designed to bring about voluntary exchanges of values with
target markets to achieve institutional objectives. Marketing involves designing
the institution’s offerings to meet the target markets’ needs and desires, and using
effective pricing, communication, and distribution to inform, motivate, and
service these markets. (Kotler & Fox, 1995, p. 6)
Recruiting. Examples of recruiting practices in higher education are prevalent.
Viewbooks, campus visits, college fairs, and direct mail campaigns are all examples of
recruiting efforts (Haines, 2012; Hossler, 1999). In many cases, some of these same
techniques are considered marketing efforts (Kotler & Fox, 1995). The major distinction
23
between marketing and recruiting efforts involves direct, personalized student interaction
with college representatives as an inherent function of recruiting (Hugo, 2012). While
marketing efforts are designed to raise awareness of the college, recruiting efforts are
designed to translate awareness directly into application for admission to the college and
to matriculation. Therefore, recruiting efforts are defined as programs or activities
designed by college personnel to directly influence the student decision-making process
in favor of application and matriculation.
Enrollment management. Several authors have advanced definitions for
enrollment management (Hossler, Bean, & Associates, 1990; Huddleston, 2000;
Kemerer, Baldridge, & Green, 1982). As a general reference, the term enrollment
management in this study follows the Kurz and Scannell (2006) definition as, “a process
that brings together often disparate functions having to do with recruiting, funding,
tracking, retaining, and replacing students” (p. 81).
Selective marketing and recruiting. Because administrators and admissions
personnel often use marketing and recruiting practices to achieve similar goals (Kotler &
Fox, 1995), the two terms are considered nearly synonymous for the purpose of this
study. Attracting, retaining, and graduating students are common institutional goals
among organizations dedicated to higher learning (Braxton, McKinney, & Reynolds,
2006). To achieve these goals, community college administrators are increasingly turning
to advanced marketing and recruiting techniques, among which selective marketing and
recruiting are included (Absher & Crawford, 1996; Lewison & Hawes, 2007). For this
study, selective marketing and recruiting refers to intentional practices designed to attract
and/or retain a specific segment of the target student market.
24
Depth of implementation. Vander Schee (2009) described methods of
coordination when referring to the administrative structures charged with overseeing
enrollment management practices at small, private colleges. For this study, the term depth
of implementation was derived from Vander Schee’s discussion and refers to the level of
administrative oversight and organizational structure each college devoted to the
management of marketing and recruiting practices (Kemerer, Baldridge, & Green, 1982;
Vander Schee, 2009). Specific levels of administrative oversight examined in this study
ranged from a single staff position to an entire marketing and recruiting division. Labels
used to describe the levels of administrative oversight in this study included Staff
Coordinator, Marketing Committee, Matrix System, and Marketing and Student
Recruiting Division.
Significance of the Study
Little quantitative data has been gathered or presented about selective marketing
and recruiting practices at community colleges. Most literature on enrollment
management has focused on public and private four-year colleges and universities. This
study is significant because it brings focus to selective marketing and recruiting practices
at community colleges. As open access institutions, community college administrators
must maintain a unique awareness of conditions affecting enrollment. This study helps to
guide administrative and legislative decisions related to organizing and financing
marketing and recruiting at the community college. Given the relative lack of quantitative
studies examining selective marketing and recruiting at the community college, this study
answered some fundamental questions about selective marketing and recruiting practices
25
at the community college and supplied research intended to build a foundation for further
exploration of the subject.
Summary
Community colleges have adopted certain aspects of enrollment management by
practicing selective marketing and recruiting practices. Selective marketing and recruiting
practices have the potential to affect the open access mission of the community college
by creating increased awareness of educational opportunities for some groups. Due to a
finite capacity for enrollment, overrepresentation of selected groups of students in a
college’s enrollment can limit access to education for non-selected groups of students.
This study examined enrollment at community colleges in North Carolina. The study was
conducted to determine the prevalence of marketing and recruiting practices and to
determine if selective marketing and recruiting practices have a significant impact on the
demographic composition of college enrollment when compared to the demographic
composition of the college service area.
26
CHAPTER TWO: REVIEW OF THE LITERATURE This chapter gives an overview of the major conceptual areas considered within
the context of this study. The open access mission of the community college is described
historically and from the perspective of social significance. Enrollment management is
also examined in the context of its historical development in higher education and by its
significance to higher education administrators. Marketing and recruiting practices are
discussed as an overview to give context to terminology and to address the status of
marketing and recruiting practices at the community college.
The Open Access Mission
The American community college curriculum exists within a system unique to
American higher education. Successful evolution of the comprehensive curriculum is a
hallmark of the community college. Emerging from the comprehensive curriculum is a
system of opportunity, allowing access to higher education for all individuals.
Emblematic of the American ideal, the community college is democracy’s college,
providing access and making educational resources available for those with the desire to
pursue higher education. Often, the educational focus is on practical skills or transfer
education, in contrast to the research focus of many four-year colleges and universities.
The community college, being antithetical to the notion of proprietary education, is a
provider of information and training at the lowest possible cost. The profit motive is a
lesser motivating factor to administrators at the community college. Of more traditional
importance is access to basic skills, transfer education, workforce development, and
technical education. The unique comprehensive curriculum of the American community
college system is the foundation of a system that provides educational opportunity to all,
27
regardless of individual personal and economic limitations (Bissett, 1995; Cohen &
Brawer, 2003; Roueche & Baker, 1987; Vaughan, 1982).
Though the birth of the community college is traditionally associated with the
Morrill Act of 1890, the genesis of the idea of the community college has been inherent
in the zeitgeist of the United States from its early days as a nation. The spirit of the
community college was embraced by the founders of the nation, and is older than the
nation itself. Benjamin Franklin supported the idea of a “people’s” college as early as
1749, proposing the establishment of an Academy with a curriculum taught in English, as
opposed to the traditional Latin used in classical grammar schools. He emphasized both
traditional education, and hands-on teaching of practical skills in farming and gardening
(Reitano, 1999).
Discussing Franklin’s ideals, Reitano (1999) emphasized Franklin’s proposal to
educate both young men and young women in such practical life skills as accounting.
“Franklin’s objective was to make education meaningful and useful,” Reitano (1999, p.
67) stated. He attempted to expand curriculum with a blend of theory and utility, to
“educate the whole student” (p. 67). The spirit of Franklin’s language resonates
throughout the community college curriculum.
The notion of educating the whole student aids in defining the curriculum of the
community college. No other institution of higher learning places more emphasis on
providing comprehensive education. If a student needs basic skills, community college
educators provide for it; if remedial education is needed, the community college structure
will accommodate. Technical and vocational skills are readily available to those who
seek them. Transfer education is available for students pursuing higher degrees, and is
28
more affordable and accessible than other traditional forms of delivery (Cohen & Brawer,
2003).
Biermann (1996) discussed the community college’s curriculum and the unique
access to increased learning opportunities, stating, “the missions of the community
colleges are to develop the potentials of underprepared students so that they may become
productive members of society, and to provide second chances, or retraining for adults”
(para. two). In contrast, large senior institutions limit the availability of personalized
instruction to the student. Biermann (1996) cited a study by Boyer (1991) in which 35%
of senior institution faculty listed pressure to publish as a reason for a reduction in
teaching quality at their institutions. Large, impersonal class settings reduce
teacher/student interaction time. Biermann (1996) used a federal survey of community
colleges to illustrate the unique ability of community college faculty to spend most (75%)
of their time in activities that benefit students.
The university’s reputation for stringent academic standards works against the
inclusive nature of the community college. A reluctance to accept transfer credits from
community colleges into senior institutions is a barrier to educational opportunities. The
community college curriculum is designed to encourage completion rather than being
stringent to the point of exclusion. As Biermann (1996) wrote:
This kind of “elitism” is damaging to the students and to the system. Essentially,
in contrast with the senior colleges, the primary concern at the community college
level is with teaching. Community college students, especially those from urban
environments, require all sorts of assistance if they are to ultimately succeed in
their academic pursuits. Such a process ranges from basic sensitivity on the part
29
of faculty, to detailed course outlines, tutoring aid, opportunities to clarify subject
matter, guidance in developing test-taking abilities, mastery of oral and written
expression, critical thinking ability, and problem-solving capabilities, as well as
facility with the scientific method. Even guidance with registration is crucial to
the success of these underprepared students. (Community Colleges and Today’s
Students, para. 11)
Biermann underscored Reitano’s notion of educating the whole student in his discussion
of assistance and guidance.
Many community college students are entering the higher education community
for the first time, often at a later time in life than the traditional college freshman and in
many cases as first-generation college students. According to the American Association
of Community Colleges (2011), the average age of a community college student is 28.
Due to these factors, many students are in need of personal attention if they are to have a
significant possibility of becoming successful participants in higher education. Shannon
and Smith (2006) supported Biermann’s (1996) observations about the helpfulness of
community college faculty, as compared to faculty at senior institutions. Shannon and
Smith stated, “Community college faculty are not judged by their research or publishing
but on the strength of their ability to help students learn and to engage students with
different backgrounds, ethnicities, and aspirations” (p. 15).
With such a diverse student body, the community college collectively faces other
challenges not needing to be addressed in the traditional four-year track. Some students
begin or return to college lacking critical skills necessary for successfully completing an
advanced degree. Rather than reject these students, community college policies are
30
designed to embrace them, offering remedial or developmental education as leverage to
gain greater educational success. U.S. Department of Education (Basmat, Lewis, &
Greene, 2003; Lewis, Farris, & Greene, 1996) surveys indicated 98% of community
colleges offered developmental courses in English, math, or reading. The same surveys
also indicated over 40% of community college freshmen took advantage of remedial
courses. The community college curriculum is more suited to providing nearly
customized educational opportunities for those aspiring to attend college. Kozeracki and
Brooks (2006) underscored the necessity of developmental programs to the community
college curriculum when they stated:
the primary purpose of developmental programs is to facilitate students’ transition
from remedial to college-level courses, and to improve students’ chances of
success in transfer and vocational programs. This purpose requires that
developmental courses be fully integrated into the broader community college
curriculum. (p. 65)
The community college, by nature of the comprehensive curriculum, possesses the
mechanism for providing a high level of attention to the development of the whole
student.
The community college student can be a typical college freshman recently
graduated from high school, but more importantly the community college student can
come from any adult age group and/or educational background. Also, the educational
attainment goals of the community college student can vary widely from those in
traditional pursuit of a bachelor’s degree. Some community college students are pursuing
the first two years of a four-year degree, but many others seek skills training to enter or
31
re-enter the workforce as quickly as possible. Townsend and Wilson (2006) discussed
trends away from enrollment in traditional college transfer courses and towards
enrollment in vocational or occupational education. Cohen and Brawer (2003) cited
statistics showing increases in technical program enrollment from 26% in the early 1960s
to over 50% in the 1990s. Such examples illustrate changing educational goals in
community college culture.
To further complicate the mission of the community college, not all students want
or need to be degree-seeking. The community college curriculum provides for the needs
of these non-degree-seeking students with noncredit workforce training programs and
contract education. Information contained in a 2005 Government Accounting Office
survey (Bellis, 2004) showed student head count in noncredit programs was
approximately 90% percent of total curriculum head count during 1995. By 1999,
noncredit enrollment actually exceeded credit enrollment by over 8%. Workforce
development is another key component within the comprehensive mission of the
community college. If the comprehensive curriculum is to remain responsive to the
changing needs of the community, workforce development is yet another component to
maintain as a priority. According to the AACC (2000), “. . . community colleges should
view the preparation and development of the nation’s workforce as a primary part of their
mission and communicate to policymakers the uniqueness of this community college
role” (p. 8). Again, the changing educational environment contextualizes the importance
of maintaining access to education through the multiple missions of the community
college.
32
In order to fulfill the open access mission, a community college system responds
to varied needs. The ability to react to community needs makes community colleges
unique among academic institutions. Schuyler (1999), referring to the community
college, stated, “its curriculum is the source of that uniqueness, with such diverse areas of
study as general education, vocational education, and remedial or developmental
education” (p. 3). If responsiveness is a great strength of the community college, access is
the foundation. Shannon and Smith (2006), writing of the community college’s open
access policy, said:
The community colleges’ proverbial open door, which ensures access for all who
can benefit, is the foundation on which all other community college operations
rest. The open door concept influences admissions and enrollment processes,
curricular structures, faculty hiring, the relationships between community colleges
and four-year institutions, advising and counseling activities, and colleges’
responses to the needs of the K-12 sector, as well as those of the local economy.
Indeed, the open door concept is critical to our understanding of the community
college itself. (p. 16)
Maintaining the open access mission is critical to continuing the mandates set by
community college founders. To maintain open access and reduce financial barriers,
community college administrators struggle to keep tuition affordable. Community college
tuition is lower than the cost of a four-year institution, whether private or public, and has
increased at a slower rate than that of four-year institutions (Kasper, 2002; Shannon &
Smith, 2006). Both private and public four-year institutions can be prohibitively costly
for large segments of the population. Community colleges enrolled 44% of all
33
undergraduates in 2008. Minority students enrolled in community colleges are equally
well-represented, with 44% of African-Americans, 52 % of Hispanics, 45% of
Asian/Pacific Islanders, and 55% of Native Americans attending community colleges
(AACC, 2011).
The broad and varied mission of the community college is sometimes criticized
for trying to have something for everybody (Vaughan, 2003). However, difficulty
maintaining the open access mission is not a rationale to abandon it. Shannon and Smith
(2006) tied access to the community college with the Declaration of Independence,
framing the community college itself as quintessentially American, and reminiscent of
Reitano’s (1999) account of Franklin’s vision for education in America. No other
institution has the network and expertise in place to provide so many types of education.
Reitano stated, “Meaningful learning is a continuum in which skills and content
reinvigorate one another” (p. 68).
The ability of the community college system to adapt to prevailing educational
needs is its strength and access to the system is its foundation. The ability to educate
those who wish to be educated regardless of means or educational background is unique
to the American system of higher education and worth preserving. Reitano (1999) noted,
“Educating the whole student by integrating various forms of knowledge is the best way
to advance our democratic mission” (p. 68). By adhering to its democratic mission, the
American community college is integral to the American system of higher education
because it provides access to education for those who seek it.
34
Enrollment Management
Enrollment management is an administrative tool developed by higher education
policy-makers to shape the size and make-up of student populations. Developed in the
1970s, enrollment management has emerged as a commonly used group of strategies at
many four-year colleges and universities (Hossler, Bean, & Associates, 1990;
Huddleston, 2000; Kurz & Scannell, 2006). As the enrollment management process
underwent refinement during a maturation period, certain standards of practice emerged.
A growing number of community college administrators adopted certain enrollment
management policies in hopes of counteracting consistently under-funded budgets.
Administrators chose aspects of enrollment management, or selective marketing and
recruiting practices, despite the possible negative effects of selective marketing and
recruiting policies on the open access mission of the community college (Lords, 2000).
Definitions of enrollment management in the literature have been refined and
refocused since Spady and Tinto began to systematically explore recruitment and
retention issues in the 1970s (Pascarrella & Terenzini, 1979). Kemerer, Baldridge, and
Green (1982) began the process of formalizing enrollment management when they
outlined the process, defined the terminology, and presented organizational models for
implementation. They identified enrollment management as “an assertive approach to
ensuring the steady supply of qualified students required to maintain institutional vitality”
(p. 21).
Hossler, Bean, and Associates (1990) developed the definition commonly referred
to in the literature:
35
an organizational concept and a systematic set of activities designed to enable
educational institutions to exert more influence over their student enrollments.
Organized by strategic planning and supported by institutional research,
enrollment management activities concern student college choice, transition to
college, student attrition and retention, and student outcomes. (p. 5)
As a definition, the Hossler, Bean, and Associates description is comprehensive, and
much of the development of enrollment management has followed in its wake. Certain
aspects of the definition have been transformed by practice, resulting in more serious and
far-reaching implications for the community college than the basic definition implies.
In 2000, Huddleston modified the definition to include “identification, attraction,
selection, encouragement, registration, retention, and graduation of targeted student
segments” (p. 65). Using the terms identification, attraction, selection, and targeted
reflected the migration of the concept to a transparent marketing strategy, aligning
education with business practices previously avoided, or even deliberately shunned in
academic circles (Dixon, 1995; Hossler, 2004; Kurz & Scannell, 2006). Kurz and
Scannell (2006) moved the definition of enrollment management further into the realm of
a marketing strategy by defining enrollment management as “a process that brings
together often disparate functions having to do with recruiting, funding, tracking,
retaining, and replacing students” (p. 81). The Kurz and Scannell definition directed
attention away from the student as an individual in need of guidance and toward the
concept of the student as statistical variable and revenue stabilization source.
The framework for the historical development of modern enrollment management
practices began with the work of Spady, Tinto, Bean, Metzner, and others (Hossler, Bean,
36
and Associates, 1990). Spady (1967) and Tinto (1975) focused on the needs of the
student when discussing persistence to graduation, noting a lack of connection between
the individual and the institution as a primary reason for withdrawal. The work of
Pascarella and Terenzini (1979) supported this hypothesis. Other work cited by Hossler,
Bean, and Associates (1990) emphasized the importance of personal ties for the student
in determining academic persistence. Students who integrate socially have a much greater
likelihood of completing an academic degree. Within some of the same studies, authors
highlighted the necessity for institutional connections as essential components for
academic success. Tinto (1987) repeatedly emphasized the need for connections between
institution and individual. An equally important finding in the work of Tinto was a
commitment by the institution to the education of the whole individual, both socially and
academically. In short, the need for close interpersonal contact is a requisite for student
persistence and academic success. Early enrollment management programs focused on
these essential elements.
Coomes (2000) traced the development of enrollment management to a
scholarship endowment at Harvard begun shortly after its founding, circa 1646. An early
policy shows the school adopted minimum admission standards. Thus, with these two
acts, financial aid and admission requirements entered the American system of higher
education. The Morrill Acts of 1862 and 1890 served to focus the impetus of higher
education on expansion. As higher education became more available, larger segments of
the population gained access to it. Consequences of the Serviceman’s Readjustment Act
of 1944 had a tremendous influence in broadening the availability of higher education.
The recommendations of the President’s Commission on Higher Education of 1947
37
(Bonds, 1948) firmly established the community college, and made access to higher
education accessible and affordable for the majority of American adults.
During the 1950s and 1960s, various government programs and legislation
contributed to the creation of financial aid offices and student aid programs. The
availability of funding, coupled with increasing accessibility, greatly accelerated demand
for higher education (Coomes, 2000). During this period of rapid growth and prosperity,
educators became complacent with their role as gatekeepers in admissions. Admissions
officials were positioned as barriers against an onrush of admissions applicants, using
arrays of standards such as admissions testing as their method of selection (Hossler,
Bean, & Associates, 1990).
The catalyst for change to the existing system of enrollment practices was spurred
by projections of significant declines in high school graduation rates and college
enrollments for the decade of the 1970s. The combination of state and federal funding for
student aid programs coupled with the theoretical frameworks set forth by Spady, Tinto,
and others came together with projected shortages in student applications to create the
modern era of enrollment management. Concerned and astute administrators sought
practical steps to manage enrollment and minimize declines in student populations
(Coomes, 2000; Hossler, Bean, & Associates, 1990).
During the 1980s and 1990s, enrollment management matured. Institutional
departments were created and institutional positions defined. Early adopters developed
program implementation models. Successful enrollment management strategies spread
across most of higher education, beginning in the private sector and moving into public
universities. As the process matured, some strategies diverged while newer strategies
38
emerged as essential standards of practice. Data gathering and analysis were, and still are,
the hallmarks of contemporary enrollment management (Coomes, 2000; Kurz &
Scannell, 2006).
Kemerer, Baldridge, and Green (1982) presented four possible organizational
models for a managed enrollment program. The authors outlined the committee model, a
staffed position, the matrix model, and a divisional model. Each model has strengths and
weaknesses, with the divisional model most likely to succeed over time (Hossler, 2004).
Committees are cheap to implement, but mostly powerless to execute any real change. A
staffed position is often simply the reassignment of duties to someone already on staff.
Lack of training, administrative assistance, and positional authority limit the staffer from
creating any lasting changes to the organization.
The matrix model involves bringing together various departments in a cooperative
effort to enact enrollment management initiatives. Although it does not involve major
restructuring of the organization or additional staff, this model is not conducive to the
organizational structure of education, in which interdepartmental cooperation often
breaks down at the division of duty and authority.
The divisional model is the most expensive to implement, involving the creation
of a new department and hiring of additional staff. The divisional model is also the most
effective, bringing authority, focus, commitment and resources to the process, all under
one administrative structure (Kemerer, Baldridge, and Green, 1982).
While the divisional model is administratively the most effective, well-organized,
and well-executed, efforts can succeed without the benefit of a new division. Walters
(2003) described the implementation of a “One-Stop Shop Center” for student enrollment
39
at Onondaga Community College, Syracuse, New York. As part of the institution’s
strategic plan, admission officials at the college set out to improve the transition and
enrollment process for students as part of an overall plan to improve interactions between
students and the institution. The process involved multiple offices both inside and outside
the Division of Student Services. Leadership, originating from the Office of the
President, and communication were essential to the success of the project. Examples such
as the one set forth by Onondaga Community College demonstrate the necessity of
commitment across divisional lines within an institution if enrollment management
strategies are to be successfully adopted.
Ritze (2006) described the enrollment management process at Bronx Community
College in New York, New York, as an example of successful implementation at the
committee level. Bronx Community College made an institutional commitment to data
collection and analysis, and invested substantially in resources by increasing both
personnel and technology. Also, significant resources were dedicated to the training of
both senior managers and institutional research officers. The process involved an annual
assessment program requiring the participation of all divisions and departments. This
culture of evidence engaged the entire college and led to improvements in institutional
benchmarks.
Shirazi and French (2005) presented one enrollment management initiative under
the divisional model. Oklahoma City Community College added a Director of Early
College Awareness after combining existing programs and resources. The enrollment
management staff accomplished the addition of a directorship by anticipating funding for
the new program during the enrollment management planning process. The authors
40
emphasized the necessity of support from executive leadership, including commitment at
the board level, for successful implementation of such programs.
Data analysis is a key component of modern enrollment management, and data
mining practices are being adapted from business models. The Cross Industry Standard
Procedures for Data Mining (CRISP-DM) are used to predict enrollment, track student
performance, and guide retention measures. Data mining, an iterative process, involves
gathering, sorting, and analyzing large amounts of data to discover trends and uncover
previously unnoticed information. Data mining can help administrators spot disturbing
trends, ultimately prompting preventative measures before problems become
cumbersome or insurmountable. Data mining is also expensive to implement, requiring
investments in software, hardware, training, and personnel (Antons & Maltz, 2006; Kurz
& Scannell, 2006; Luan & Zhao, 2006). As sequestered administrators focus on column
after column of numbers, the practice of data mining can lead institutions to the more
troublesome side of enrollment management: viewing students as data rather than people.
Data mining also brings into sharp focus the financial value of each student, matching
each student identification number with a fully detailed projected cost figure.
If marketing and recruitment efforts are the public side of enrollment
management, student retention is an underlying goal of the process. Kemerer, Baldridge,
and Green (1982) recognized the importance of managed retention efforts when they
discussed the financial costs of attrition. Much of the cost of enrollment is spent up front
in persuading a student to enroll. An institution implicitly maintains student enrollment
through graduation in order to maximize return on the invested enrollment dollar.
Hossler, Bean, and Associates (1990) discussed reasons for student attrition and ways to
41
improve retention. They outlined plans for research practices, the strengths and
weaknesses of autopsy reports, cross-sectional studies, longitudinal studies,
qualitative/quantitative studies, and program evaluations. They also discussed various
successful programs and activities and made recommendations for best practices.
Levitz, Noel, and Richter (1999) tied retention to the goals of student satisfaction
and success, identifying persistence to graduation as an institutional performance
indicator. They also developed a Retention Savings Worksheet, bringing to the forefront
an acute awareness of small percentage increases in retention rates translating into large
increases in revenue for an institution. Levitz, Noel, and Richter’s study was a pertinent
illustration of a shift that began in enrollment management discussions during the late
1990s. As institutions cycled through the enrollment management process, patterns
emerged, and researchers focused on the cost/benefit portion of data analysis. This shift
in focus portended serious consequences for higher education practice in general, and
community colleges in particular. Levitz, Noel, and Richter (1999) stated, “On average,
more selective institutions experience lower attrition rates than do less selective
institutions” (p. 32), thereby potentially providing justification for a policy assault on the
open access mission of the community college.
Based on recommendations such as those from Levitz, Noel, and Richter (1999),
institutions began using enrollment management data to craft a specific student body
demographic make-up, an adaptation of enrollment management practices extending
beyond the simple management of raw enrollment numbers. Increased use of economic
theory was put in place to determine financial aid packages. Custom financial aid
packages were directed at recruiting and maintaining students with the best college

42
entrance test scores. These same techniques were also used to select students through the
awarding of merit aid. Merit aid is student financial aid packages calculated to maximize
revenue based on a student’s ability to pay the difference between the amount of aid
offered and the actual cost of tuition (Desjardins & Bell, 2006; Lapovsky, 1999; Russo &
Coomes, 2000). Lapovsky (1999) advised administrators to ask questions relating to the
distribution of financial aid and the desired student demographic make-up, stating, “Each
institution wants to maximize enrollment of the students it deems most desirable at the
least cost in terms of institutional financial aid” (p. 13).
Excluding students based on inability to pay or because of poor performance
indicators was not new. What was novel was the way in which such practices have
become institutionalized through enrollment management to the extent that exclusion
became a science. Antons and Maltz (2006) described creating an application tool that
“allowed the enrollment management staff to modify financial aid amounts and calculate
an expected probability of enrollment correspondingly based on changing values of the
financial aid” (p. 77). Hossler (2004), one of the pioneers of the enrollment management
movement, decried the practice of discounting tuition to attract more affluent students,
stating, “Every dollar that goes to enroll students who do not really require aid diminishes
access and equity for those who have moderate and high levels of financial need” (para.
17).
Implications of enrollment management for the community college are both
positive and negative. Private colleges have a greater interest in optimizing the tuition
dollar and are more sensitive to and dependent upon enrollment management strategies
that maximize revenue. As private institutions become more exclusionary, students will
43
turn to alternative sources for education. State-funded universities are not immune to the
pressures of maintaining high performing student populations. College rankings have
become a driving force behind the need to create pre-determined student demographics
(Hossler, 2004).
The challenge facing community college policy makers is remaining true to the
open access mission while maintaining academic standards and a viable budget.
Lapovsky’s (1999) justification for discounted tuitions and merit aid reflected an
acceptance of the practice by the academic community. The community college is
therefore vulnerable to accepting these practices into its culture. Even though financial
aid packages at the community college are generally limited to federal student aid, there
is potential in community colleges for abusing enrollment management practices.
Retention continues to be a problem for the community college, and administrators can
now impose admission standards via selective recruiting in order to matriculate students
with a statistical propensity for success.
Enrollment management can, however, have a positive influence. Using the
enrollment projection tool developed in their model, Antons and Maltz (2006) reported a
2.5% variance between projection and actual enrollment. This was an improvement from
a more than 15% variance in the previous two years. Community colleges can use
accurate figures such as these to manage program growth and resource allocations,
especially in states where funding is based on enrollment figures from the prior year.
Ritze (2006) addressed concerns for the open access mission when presenting the Bronx
Community College model as an example of successful preservation of it. Walters (2003)
also expressed a need to guard the access mission during Onondaga’s successful
44
implementation of an enrollment management program. Without cautious consideration
when implementing enrollment management programs, community college
administrators are susceptible to the admonition to “milk the demand curve,” as
Lapovsky (1999, p. 13) suggested.
Marketing and Recruiting Practices in Higher Education
Kotler and others (Kotler, 1972; Kotler, 1979; Kotler & Fox, 1995; Kotler &
Levy, 1969; Kotler & Murphy, 1981) have written extensively about the use of marketing
techniques in higher education. Kotler and Fox (1995) defined marketing for higher
education as
the analysis, planning, implementation, and control of carefully formulated
programs designed to bring about voluntary exchanges of values with target
markets to achieve institutional objectives. Marketing involves designing the
institution’s offerings to meet the target markets’ needs and desires, and using
effective pricing, communication, and distribution to inform, motivate, and
service these markets. (p. 6)
Topor (1983) effectively summarized marketing as “an exchange process” (p. 21),
whereby tuition is exchanged for the services of the institution. Contained within the
exchange process is the market research aspect, wherein consumer needs are assessed and
the product is modified to fit those needs accordingly (Dann, 1982).
Often mentioned in discussions of marketing strategies are the four Ps of
marketing: product, place, promotion, and price (Dann, 1982; O’Connor & Lundstrom,
2011; Topor, 1983). In higher education, the product is typically educational
programming, but can also include services rendered by the college. Place refers to
45
geographic location. Additional satellite locations and online, or distance education,
offerings are good examples of educational institutions attempting to address product
placement strategies through marketing. Promotion involves communications between
the campus and intended users, and can include many different advertising opportunities.
Radio, television, and print advertisements, websites, billboards, posters, brochures, and
numerous other media can be used to communicate institutional messages. Finally, price
is generally a reference to tuition in higher education. For community colleges in North
Carolina, tuition price is fixed by the NCCCS and is not a marketing variable subject to
manipulation. Nonetheless, tuition cost is relevant to pricing strategies when considered
in comparison to tuition cost at other higher educational institutions, particularly when
referenced in marketing communications.
The Kotler and Fox (1995) definition of marketing refers to target markets. A
thorough understanding of target markets requires a certain amount of investment by
marketing personnel at an institution. Market segmentation is the practice of examining
the entire consumer base and identifying groups within the consumer base that share
common preferences. As an extension of market segmentation, target marketing involves
creating products and communications specifically designed to meet the needs of a
particular market segment. Market segmentation and target marketing practices hold the
potential for altering access to education at the community college. Use of these
techniques to isolate specific segments of the consuming market can skew awareness of
educational opportunities among targeted and non-targeted market segments.
46
Emergence of Marketing in Higher Education
Marketing practices, at some level, have long been a part of the higher education
environment, although the recognition and even embracing of marketing practices by
higher education officials is a relatively recent phenomenon (Dixon, 1995; Edirisooriya,
2009) Marketing tools were traditionally considered as belonging to the realm of private
business practice, and educators eschewed such practices, electing rather to rely on the
reputation of the institution for maintaining viability (Kotler & Fox, 1995). Wiebe (1951)
first questioned the relevance of marketing techniques for social institutions when he
asked, “Why can’t you sell brotherhood and rational thinking like you sell soap?” (p.
679) Kotler and Levy (1969) tied the benefits of marketing social institutions directly to
education.
Kotler (1972) expanded on Wiebe’s concept of marketing for social institutions.
Kotler characterized the early understanding of marketing in business as being primarily
concerned with transactions between buyers and sellers. An evolution in marketing
occurred when sellers began to consider ways to communicate with all potential
customers, not just buyers. This, in turn, introduced the concept of market segmentation
and target marketing. Kotler (1972) asserted that the next evolution in marketing should
focus on broadening the application of marketing beyond sellers and consumers. Not only
should sellers be concerned with all potential buyers, but, according to Kotler, sellers
should also be marketing to vendors, employees, the government, and the general public.
It is within this context that Kotler made his broadest arguments for the appropriateness
of marketing in social institutions. Kotler chose to label marketing as an ongoing function
of the entire organization. Rather than discuss marketing within the limited terms of
47
buying and selling, he applied the concept to all transactions of the organization. By
expanding the scope of marketing understanding, Kotler’s work brought legitimacy to
marketing techniques within the context of higher education.
Litten (1979) completed early research in the area of marketing and higher
education. Litten (1980) also described some of the challenges for marketers in higher
education. The author outlined several key distinctions about higher education that made
marketing particularly distinct from traditional business practice. Choices of which
higher education institution to attend are often made only once, and these choices are
typically made with the input of others. Educational institutions market a total package of
goods, including courses in multiple disciplines, physical space, and extra-curricular
activities. Education is both a consumption and an investment purchase. Unlike products
with some quantifiable feature – tire tread wear, for example – education lacks an
objective standard of comparison. Most institutions lack the driving force of pressure to
maximize profits. Furthermore, in an environment where the seller judges the buyer on
performance outcomes, the student is both the consumer of goods and the product of the
institution. While any one of these distinctions may have a counterpart in the business
environment, this unique confluence of characteristics makes marketing higher education
an atypical environment for traditional marketing strategies.
Social marketing, a term generally attributed to Wiebe (O’Connor & Lundstrom,
2011), seeks to solve social problems through the application of commercial marketing
techniques. Affecting social change by changing behavior through marketing strategies
can be a concurrent goal of social institutions. Many of the same influences that drove
educators to develop and embrace enrollment management techniques also drove the
48
acceptance of marketing techniques in higher education (Bok, 2003; Kotler & Fox,
1995). Projections of decreased student enrollments along with budget pressures in a
changing economy forced administrators to look for ways to increase enrollment
throughout the decade of the 1970s. Educators attempted to influence behavior by
combating decreasing enrollment numbers as a percentage of the overall population with
conventional marketing techniques (Zemsky, Shaman, & Berberich, 1980). During the
1980s, an increase in both academic scrutiny and practical applications of commercial
marketing strategies solidified marketing as a viable and necessary tool for the
maintenance of institutional vitality (Cochran & Hengstler, 1983; Litten, 1980). A
wealth of literature developed during the 1980s, and many of the studies that influenced
the direction of marketing in higher education occurred during that time. In the ensuing
decades, researchers and practitioners have continued to explore and refine marketing
techniques within the context of higher education.
The Status of Marketing in Higher Education
Researchers and practitioners have continued to share information about
marketing practices in higher education. Access to, and improvements in, technology
have greatly influenced the speed and depth of how marketing strategies are researched
and implemented. Thomson and Schott (2007), for example, used marketing techniques
to increase awareness of library services to the internal population of students at two
community colleges. They used technology to compile a database showing how students
currently used library materials. Using the database for reference, they created a
marketing plan to address deficiencies within the system. The plan consisted of several
strategies, including a redesign of the library website, increased use of print materials
49
with better communications, and better promotion of library services by library
personnel. They also held instructional classes on library services for both students and
personnel. The authors reported a successful increase in the usage of library services.
Hastings (2000) discussed the importance of utilizing Institutional Research (IR)
in the development and implementation of a marketing plan at one college. He described
the challenges of marketing to a diverse college audience. Using student surveys, the
college gathered information on how students heard about the college. Results of the
survey research were then used to create a marketing plan for the college that included
increased relations with local media outlets, radio and television campaigns, billboard
placement, and increased communications in both Russian and Vietnamese. Hastings
emphasized the critical need for coordinating processes between personnel in IR and
personnel in marketing. He noted the necessity for support and leadership from senior
college administrators. Hastings’ observations echoed Kotler and Fox’s (1995)
recommendation to bring marketing and research together under the enrollment
management umbrella.
Other examples of technology integration demonstrated even more specific use of
advanced marketing techniques to define student populations and craft marketing plans.
Rindfleish (2003) used segment profiling to inform strategic planning decisions,
coordinate marketing activities, and track the success of marketing activities at one
university. Segment profiling involves combining geographic data, demographic data,
and consumer buying data to create lifestyle profiles for targeted geographic regions. The
university used the data to gain a better understanding of the current student population
and to modify marketing plans to attract new groups of students. In a related study,
50
Goenner and Pauls (2006) used predictive modeling to determine the likelihood of a
student’s enrollment based on a combination of geographic and demographic data. The
researchers captured very basic data from student inquiries at the college. Using the
model, researchers were able to predict a student’s propensity to enroll with 89%
accuracy. Singleton (2009) used data-mining techniques applied to a national database to
find patterns in student course selection. The author found that certain demographic and
socio-economic groups select courses in particular clusters. Singleton recommended that
colleges and universities use the results of the study to craft course offerings in such a
way as to appeal to specific target student markets.
Leverett, Parker, and McDonald (2007) used a traditional approach to marketing
for improving the recruitment and retention of African-American students into a Bachelor
of Business Administration (BBA) program. The researchers followed recommendations
by Kotler and Fox for developing a marketing plan within the context of higher
education. Broadly, they indentified the problem, defined goals and objectives, conducted
market research, determined a marketing strategy, planned and implemented the action
program, and evaluated the results. The researchers reported success in the recruitment
and retention of African-American students into the BBA program. The matter-of-fact
tone taken by the researchers was an indication that marketing techniques had become
commonplace in higher education.
Newman (2002) confirmed the widespread use of marketing in higher education.
She surveyed 1,000 four-year institutions. Survey results indicated that over half of the
participating institutions participated in advertising, market planning, market research,
market segmentation, market positioning, self audits, and target marketing. The author
51
concluded that, “The use of marketing tools and techniques appears to have become an
entrenched part of higher education enrollment management, indicating that admissions
professionals do have a comprehension of what marketing involves” (p. 26). While
Newman’s study showed an increase in the use of marketing techniques, it also revealed
some confusion around the understanding of terminology and the usage of terminology
among participants. Dann (1982) noted a similar observation. Newman (2002) also
discussed the integration of marketing and recruiting as a means of building the brand, or
identity, of an institution. Integration of marketing and recruiting is another source of
confusion for college officials regarding terminology, practical application, and
administrative structure.
Recruiting in Higher Education
The major distinction between marketing and recruiting efforts involves direct,
personalized student interaction with college representatives as an inherent function of
recruiting (Hugo, 2012). While marketing efforts are designed to raise awareness of the
college, recruiting efforts are designed to translate awareness directly into application for
admission to the college and matriculation to enrollment. Therefore, recruiting efforts are
defined as programs or activities designed by college personnel to directly influence the
student decision-making process in favor of application and matriculation to enrollment.
Kealy and Rockel (1987) examined student perceptions of institutional quality
and how recruiting practices influenced those perceptions. Among the most influential
recruiting practices listed were visits with significant persons, such as high school
faculty, college faculty, alumni and parents. Visits with high school counselors had the
least significant influence. Other significant recruiting tools were campus visits,
52
receptions for students and parents, and college catalogs. Less influential tools were also
cited, and they included overnight experiences, visits by college officials to local high
schools, and on-campus interviews.
For colleges and universities, the tools used to recruit students can be much more
effective if they are applied in the most advantageous context. Johnson (2008) described
a method for creating a database to profile high schools. Possessing useful profiles helped
universities to concentrate recruiting efforts on schools with the highest potential yield
rate. Because community colleges recruit within a much smaller geographic area, an
alternative to this technique might be profiling high schools to determine the best time of
the academic year to recruit, or how best to direct limited recruiting resources among the
student body.
Statistical modeling has also entered realm of recruiting, further blurring the lines
between marketing and recruiting in higher education. The blending of techniques under
the umbrella of enrollment management gives college admissions officials a complete set
of tools with which to manage marketing and recruiting resources. Desjardins (2002)
presented a statistical model designed to predict enrollment among students who had
been admitted but not yet enrolled. Desjardin’s model allows college officials to
concentrate recruiting efforts on the “fence sitters,” or students who may or may not
enroll, as opposed to students who are likely to enroll no matter what, or, conversely,
those students unlikely to enroll under any circumstances.
Viewbooks, campus visits, and direct contact with faculty are traditional
recruiting tools, but recruiters continue to add to the available techniques as technology
advances. Tubin and Klein (2007) discussed the school website in relation to its use as a
53
marketing tool and to its usefulness for school accountability. They concluded that the
school website was a recruiting tool whether or not it was intended to be. Mahar (2007)
examined text messaging and social media messaging as recruiting tools. These tools can
be fraught with serious complicating factors, particularly regarding athletics. There are
legal issues to consider within the National College Athletics Association, not to mention
complications with parents over appropriate usage of messaging devices, and monetary
concerns with some messaging plans. In the case of text messaging and social media, new
technology is outpacing college policy, and this area remains unresolved as a viable
recruiting tool for all colleges.
Marketing, Recruiting, and the Community College
Studies on marketing and recruiting at the community college are relatively
sparse. Some insight can be gained by examining the results of a few relevant studies.
Absher and Crawford (1996) completed a study on student perceptions of college image
and how those perceptions were used to make decisions on which college to attend. The
most important selection factors for students were overall quality of education, types of
academic programs, tuition, overall reputation, and faculty qualifications. The least
important factors for these students were advice from high school teachers, high school
friends, high school counselors, and employers.
Absher and Crawford (1996) also completed a factor analysis of participant
responses in the same study. Using the results of the analysis, they created five groups, or
market segments. They listed students as practical minded, advice seekers, campus
magnets, good timers, or warm friendlies, along with reporting the corresponding criteria
for each group. The authors made specific recommendations:
54
Community college administrators must plan and market their campuses in terms
of specific market segments such as the five discussed in this research. A target
market approach will help community college administrators in designing
programs and communications efforts to attract and maintain a desirable student
population. (p. 66)
Absher and Crawford did not discuss the implications of these recommendations for the
open access mission of the community college.
Dann (1982) completed a study on the status of marketing at the community
college. During the early eighties, much research was taking place following the work of
Kotler (1979), Litten (1980), Tinto (1975), and others. Within the community college
context, little work in the field has been completed since. Among other things, Dann
(1982) found that about one-third of colleges had mature marketing programs. The author
also reported, as did Newman (2002), that confusion about marketing terminology and
marketing structures was common among participants. Dann (1982) made
recommendations to community colleges. Recommendations included advice to examine
expectations regarding marketing, adopt a comprehensive view of marketing, give due
consideration to selecting the person responsible for marketing activities, include all
aspects of the four Ps of marketing into a comprehensive marketing plan, and consider
the availability of resources for adequate research and data gathering.
Summary
This chapter gave an overview of several major concepts considered within the
context of this study. The open access mission of the community college was given
historical context and was explained through the lens of social significance. Enrollment
55
management was discussed as a historical development and within the purview of
practical application. Marketing and recruiting practices were examined for their
relevance to higher education and for their status as practical tools for admissions
officials. Some consideration was given to the unique status of the community college in
higher education and how selective marketing and recruiting practices might affect the
open access mission of the community college. Lewison and Hawes (2007) wrote:
Supported by new technologies, extensive globalization, more socialization, and a
keen sense of entitlement, the notion of students as individuals has become a
market trend that can only be harvested by carefully crafted marketing strategies
and activities based on clearly delineated and profiled segments of the market. (p.
18)
Lewison and Hawes’ comments reflected a shifting attitude in education. Initially
resisted, marketing strategies and enrollment management techniques are becoming
requirements for successfully administrating a college. This study examined how selected
aspects of these strategies are manifesting at the open access community college.
56
CHAPTER THREE: RESEARCH DESIGN AND METHODOLOGY
The purpose of this study was to first determine the presence or absence of
selective marketing and recruiting practices at community colleges in North Carolina.
Once determined, the relationship between community college demographics and service
area demographics was investigated across community colleges with and without
selective marketing and recruiting practices. This chapter describes the research design
and methods used to complete this study, including descriptions of the population and
sample, data collection instrument, data collection, and the data analysis methods. This
chapter also contains a review of the research problem and a restatement of the research
questions. Community college administrators, board members, system office policy
makers, and state legislators can use the results of this study to make policy decisions
affecting the open access priority of the community college.
Research Problem and Purpose of Study
Enrollment management is a technique commonly used in public and private two-
and four-year institutions to craft student enrollment in such a way as to create a desired
demographic composition, increase retention and persistence, and maximize tuition
revenue (Hossler, Bean, & Associates, 1990; Kurz & Scannell, 2006; Lapovsky, 1999).
The community college, being an open access institution, is prohibited from formally
limiting enrollment (Dougherty & Reid, 2007). Marketing and recruiting practices may
serve as de facto barriers to education by increasing awareness of educational
opportunities for some groups and not for others. Little has been written on enrollment
management by way of selective marketing and recruiting practices at the community
college. This study was conducted to determine the prevalence of selective marketing and
57
recruiting practices at community colleges in North Carolina and then to further examine
the relationship between college demographics and service area demographics across
colleges with and without selective marketing and recruiting.
In this causal comparative study, preexisting marketing and recruiting practices
were considered in relation to whether or not these practices affected student
demographic composition, and, if so, how these practices affected student demographic
composition. Causal comparative analysis is appropriate when the independent variable is
beyond the control of the researcher. In causal comparative research, the researcher
examines relationships between the independent and dependent variable, but the
researcher does not manipulate the independent variable (Ary, Jacobs, Razavieh, &
Sorensen, 2006). Because this study looked at the relationship between marketing and
recruiting practices and student body demographics, causal comparative analysis was
determined to be an appropriate research method. The decision to manage enrollment
through the selective use of marketing and recruiting practices had already occurred at
some colleges, and it was not appropriate to force colleges to adopt selective marketing
and recruiting practices. Manipulation of the independent variable was therefore beyond
the control of the researcher in this study.
This study examined the student demographic composition and the service area
demographic composition for North Carolina community colleges with and without
selective marketing and recruiting practices. Once the demographic relationship between
colleges and respective service areas was established, the two groups were compared
using both descriptive and inferential statistics to investigate meaningful differences.
Community college organizational structures, funding models, and operational policies
58
vary widely from state to state (Dougherty & Reid, 2007). Because of the wide variation
of policy from state to state and the lack of research in this area, this study was delimited
to a survey of North Carolina community colleges.
Research Questions
Five research questions guided the research. To guide the statistical analysis of
research questions two, three, and four, null and alternative hypotheses were developed.
The research questions, null, and alternative hypotheses for this study were:
1. What percentage of community colleges in North Carolina practice selective
marketing and recruiting?
2. What is the relationship between student enrollment and service area
demographics at community colleges with selective marketing and recruiting
practices?
H02 = The demographic composition of community college enrollment is the
same as the demographic composition of the college service area population
for colleges with selective marketing and recruiting practices.
H2 = The demographic composition of community college enrollment is
different from the demographic composition of the college service area
population for colleges with selective marketing and recruiting practices.
3. What is the relationship between student enrollment and service area
demographics at community colleges without selective marketing and
recruiting practices?
H03 = The demographic composition of community college enrollment is the
same as the demographic composition of the college service area population
59
for colleges without selective marketing and recruiting practices.
H3 = The demographic composition of community college enrollment is
different from the demographic composition of the college service area
population for colleges without selective marketing and recruiting practices.
4. How do the demographic relationships of community colleges with selective
marketing and recruiting practices compare to the demographic relationships
of community colleges without selective marketing and recruiting practices?
H04 = The relationship between the demographic composition of community
college enrollment and the demographic composition of the college service
area population for colleges with selective marketing and recruiting practices
is the same as the relationship between the demographic composition of
community college enrollment and the demographic composition of the
college service area population for colleges without selective marketing and
recruiting practices.
H4 = The relationship between the demographic composition of community
college enrollment and the demographic composition of the college service
area population for colleges with selective marketing and recruiting practices
is different from the relationship between the demographic composition of
community college enrollment and the demographic composition of the
college service area population for colleges without selective marketing and
recruiting practices.
60
5. How does depth of implementation of selective marketing and recruiting
practices affect student demographics at North Carolina community colleges
practicing selective marketing and recruiting practices?
Study Setting, Population, and Sample
The theoretical population selected for this study was all community colleges. The
study was delimited to the finite population of community colleges in North Carolina.
Community college systems vary in size and administrative structure from state to state
(Dougherty & Reid, 2007), making comparisons across states prohibitive for this study.
North Carolina community colleges are geographically dispersed throughout the
state, with most colleges serving a one- to three-county service area. The North Carolina
Community College System (NCCCS) has a clearly defined service area for each
community college. Legislative language designates the service area for each community
college by county. There are 100 counties in North Carolina, and the counties are divided
among the 58 colleges in the NCCCS. Service area assignments are legislatively
mandated, and the State Board of Community Colleges determines service area
assignments. Persons may enroll at the college of their choice (NCCCS, 2008). System
wide, colleges enrolled approximately 340,000 curriculum students during fall 2010 and
spring 2011 (NCCCS, 2011). Colleges ranged in size by curriculum enrollment from
around 600 students to over 24,000. College funding was provided primarily by state
budget allocations, at around 70% of total funds. Local governments provided
approximately 13%, and slightly more than 12% of funding was derived from tuition.
Remaining funds came from federal or other sources (NCCCS, 2008).
61
There are 58 community colleges in the North Carolina system. One college in the
system was the setting to deliver the pilot survey. I selected the pilot college to reduce
researcher bias because I am familiar with the marketing and recruiting practices at that
college. The chief administrative officers of student services at the remaining 57 colleges
were selected to receive the electronic survey in this study. The chief administrative
officer of student services was selected to receive the survey because the chief
administrative officer was believed to be the person most likely to be familiar with the
marketing and recruiting practices of the college, or this person would be able to
recommend the person most familiar with these processes (Kemerer, Baldridge, & Green,
1982). Survey participants were selected by visiting the website of each college within
the system. Examining the administrative structure of each college identified the chief
administrative officer of student services, in most cases. When the chief administrative
officer was not apparent, phone calls were placed to the student services office and
personnel were asked to identify the chief administrative officer. A complete database
was developed for each college within the system including the chief administrative
officer’s title, email address, and telephone contact number.
Within the 57 college sampling frame, 51 participants returned usable surveys.
Forty-three participants responded to the electronic survey and eight responded to survey
questions by direct telephone contact. This yielded a response rate of 90%. The return of
51 surveys from participants met the requirements outlined by Krejcie and Morgan
(1970) as a minimum number of participants for a population of this size.
62
Data Sources
This study consisted of two data sources, an electronic survey and archival data.
A brief electronic survey was administered to determine community colleges with and
without selective marketing and recruiting practices. Subsequent analyses of archival
demographic data were used to make comparisons between the two groups. To obtain the
electronic survey data, the chief administrative officer of student services at each
community college in the NCCCS was asked to complete a survey on aspects of
enrollment management. Archival demographic data were obtained for colleges and
college service areas. College data were obtained from the NCCCS, and service area data
were downloaded from the U. S. Census Bureau website. One college was excluded from
the study to minimize researcher bias. The excluded college was the pilot college for the
study.
Survey Instrument
Survey instrument development. The goal of the survey was to determine the
presence or absence of selective marketing and recruiting practices at each college and to
gather data about the depth of implementation of selective marketing and recruiting
practices. A survey instrument was submitted to an expert panel and for review. The
expert panel consisted of survey research experts and community college experts.
Members of the panel included one former community college Director of Student
Services now serving as a community college Executive Vice President, one former
community college Director of Student Services now serving as a community college
President, one published expert on enrollment management, and one published expert on
63
community colleges. Members of the expert panel did not recommend any changes to the
survey instrument.
To pilot the survey, I delivered an electronic draft of the survey instrument to the
Director of Media Relations, the Director of Admissions, and the Executive Director of
Student Services at the pilot college via the Qualtrics (Version 33912 1.725s [0.488,
0.415, 0.613, 0.039, 0.047]) online survey tool provided by Western Carolina University.
Survey questions were piloted at the excluded college because I had access to personnel,
and to minimize the influence of researcher bias because I was familiar with the
recruiting processes of the college. These three persons were selected because of their
awareness of the marketing and recruiting procedures at the pilot college. The draft
survey contained comment areas suitable for written observations and suggestions by
participants (Creswell, 2008). These comment areas did not appear in the final survey.
Based on the feedback from the pilot participants and the research panel, the survey was
finalized with only minor revisions.
Survey instrument contents. The finalized survey delivered to study participants
was divided into three separate parts. Part one of the survey asked respondents to give
informed consent, job title, and the name of the respondent’s community college. Part
two contained 20 questions related to components of enrollment management, including
five questions specifically related to selective marketing and recruiting practices. Part
three of the survey briefly outlined several possible ways to coordinate recruitment and
marketing efforts at the community college. Questions were adapted from an instrument
used by Vander Schee (2009) in a study of enrollment management implementation at
small, private colleges. The final survey instrument appears in Appendix A.
64
Part one of the survey was concerned with obtaining informed consent and with
gathering the basic information needed to organize the study data. To obtain informed
consent, participants were presented with information about participation in the study.
Failure to respond to the statement in the affirmative prohibited participants from
proceeding with the remainder of the survey. Once informed consent was obtained, the
remainder of part one of the survey gathered information about the participant’s job title
and college name.
Part two of the study contained 20 questions about enrollment management
practices at the community college. The 20 questions about components of enrollment
management were initially derived from the literature on enrollment management. Taber
(1989) created a survey instrument to examine enrollment management at Liberal Arts II
colleges. Vander Schee (2009) later adapted Taber’s original instrument in a study of
enrollment management at small, private colleges. Vander Schee’s instrument was
adapted for this study after obtaining permission from the author. Taber’s original
instrument examined enrollment strategies by presenting five components of enrollment
management and determining the presence or absence of each of the five components.
Following the pattern outlined by Vander Schee (2009), part two of the survey
instrument in this study contained 20 questions. Five each of the 20 questions related to
one of the four key enrollment management components identified by Vander Schee.
Institutional marketing, admissions/recruitment, selective marketing, and planning were
subject matter for 5 each of the 20 survey questions. Questions 4, 7, 8, 11, and 15 were
specifically related to selective marketing and recruiting practices (Appendix A). The
65
questions unrelated to selective marketing and recruiting were left in the survey to reduce
socially desirable response bias (Matthews, Baker, & Spillers, 2003).
Vander Schee’s (2009) fifth component of enrollment management, model of
coordination, was addressed by part three of this survey and was used to examine college
demographic composition with respect to depth of implementation. Using Vander
Schee’s model, part three of this survey presented several models of coordination and
then asked participants to select the model best describing practices at the participant’s
institution. This part of the survey was concerned with the degree to which an enrollment
management program was incorporated into the organizational structure of an institution.
More elaborate organizational structures indicated a greater depth of implementation
regarding enrollment management practices.
Participants were asked to consider choices about the administrative oversight of
marketing and recruiting practices at the college. These choices consisted of a moniker
and a definition. Four of the choices in part three identified a specific approach to
marketing and recruiting practices based on depth of implementation. Participants also
had the opportunity to select choices indicating no practices were in place, or that none of
the above practices were in place. If none of the above was selected, participants had the
opportunity to provide an explanation of practices in place at the participant’s college.
Reliability and validity of the instrument. To enhance reliability and validity,
Taber (1989) submitted the original instrument to a panel of experts on enrollment
management. The expert committee was asked to evaluate each item for clarity and
validity. After adjustments, the survey instrument was presented to a pilot group of
participants. Pilot participants were also asked to evaluate the survey instrument for
66
clarity and validity. To evaluate the survey instrument, Taber administered a validating
instrument to pilot participants. The validating instrument consisted of a bank of
statements corresponding to items on the survey instrument. Each statement was
evaluated on clarity and relevance. Participants had the option to rate each statement as
very clear, somewhat clear, or not clear. They were also asked to rate each statement as
highly relevant, somewhat relevant, or not relevant. Taber provided examples of the
validating instrument, but did not report actual response numbers. Based on the results of
responses to the validating instrument, Taber’s survey instrument was finalized with only
minor editorial changes.
Vander Schee (2009) adapted Taber’s (1989) instrument to complete a similar
study of member colleges in the Council for Christian Colleges and Universities. Vander
Schee attempted to determine the presence or absence of a comprehensive enrollment
management program at these colleges. Vander Schee’s survey instrument was designed
to assess the presence or absence of five key enrollment management components:
institutional marketing, admissions/recruitment, retention, planning, and model of
coordination.
This study used an adapted version of Vander Schee’s (2009) survey instrument
to examine the relationship between selective marketing and recruiting practices, depth of
implementation, and student demographics. Some of the enrollment management
terminology in Vander Schee’s survey was replaced with marketing and recruiting
terminology. Community colleges in North Carolina are legislatively mandated to admit
all qualified applicants (N.C. G. S. 115-D-1, 2012). Eliminating direct references to
enrollment management was an attempt to eliminate any confusion of terms among
67
participants. Survey questions relating to retention were modified to reflect this study’s
focus on selective marketing and recruiting.
Using Taber’s (1989) procedure as a guiding example, paper copies of survey
questions for this study were delivered to an expert panel. The expert panel made no
recommendations for change. The survey was then delivered to the pilot group via email.
Each member of the pilot group participated in the survey. Members of the pilot group
made no recommendations for changes to the survey questions, although some questions
came back unanswered. Changes were made to the electronic format so that participants
were forced to complete each question before proceeding. The survey was then
redelivered to the pilot group.
Two of the pilot participants returned responses consistent with the first
administration of the survey, accurately identifying the college as selective. One
participant returned inconsistent results. After some discussion, it became apparent that
the participant had inadvertently selected inaccurate responses while completing the
survey a second time. Based on a lack of negative feedback from the expert panel and the
pilot group, a decision was made to proceed with delivery of the survey to participants.
Archival Data Contents
This study was limited to comparisons of gender, age, and ethnicity. The
President’s Commission on Higher Education specifically mentioned the importance of
increased access to higher education for all Americans, including women and minorities
(Russell, 1949). Following the logic of the President’s Commission on Higher Education,
this study examined enrollment numbers for specific demographic groups as a percentage
68
of college enrollment. To protect the privacy of individual students, no identifying
characteristics were gathered.
The NCCCS reported system-wide student information by age, gender, and
ethnicity. Age categories used by the NCCCS to report enrollment information were 19
and under, five-year increments from ages 20 through 69, and 70 and over. Ethnic
categories used for reporting enrollment information were White, Black, Native
American, Hispanic, Asian, and Other (NCCCS, 2008). The NCCCS reported enrollment
numbers for both curriculum and continuing education. Because this study was focused
on access to higher education, only data reflecting enrollment in curriculum programs
were examined. This study used the same standard categories as the NCCCS to gather,
report, and compare data.
Corresponding demographic data were gathered for each county in the respective
service area of colleges in the study. Demographic data for each North Carolina county
were available from the U. S. Census Bureau. Data from the 2010 census study were used
for this study (U. S. Census Bureau, 2010).
Data Collection Procedures
Survey Data Collection
Delivery of the survey followed the basic procedure outlined by Creswell (2008).
A pre-notification package was sent to each participant via U. S. mail. Mailing addresses
and email addresses were obtained through the NCCCS website and individual
community college websites. The pre-notification package was a uniquely packaged
letter of introduction requesting participation in the study and announcing the survey’s
69
impending arrival via email. A coupon for a free Chick-Fil-A© sandwich was included
with each letter of introduction. A copy of the introductory letter appears in Appendix B.
An email containing a link to the actual survey was sent to participants at each
college approximately one week later. Recipients were asked to complete the survey, or
to forward the survey to a person qualified to complete the survey. A copy of the email
appears in Appendix C. The initial survey contact yielded a response from 11
participants.
The following week a follow-up email was sent to administrators at each college
not yet completing surveys. In most cases, the follow-up email was sent to the original
recipient. In a few cases, the follow-up email was redirected according to instructions
received from the original email recipient. Recipients of the follow-up email were again
directed to either complete the survey or to forward the survey to an appropriately-
qualified person. The follow-up email appears in Appendix D. The first follow-up email
yielded a response from 12 participants.
A third and final email went out to each remaining survey participant from the
original list of administrators approximately one week later, again advising participants to
forward the survey if necessary. As in the case with the first follow-up email, some of the
second follow-up emails were redirected at the request of the initial recipient. A copy of
the final follow-up email appears in Appendix E. The final follow-up email yielded a
response from 20 participants.
To achieve an acceptable response rate, administrators from the remaining
colleges were contacted by telephone. According to Krejcie and Morgan (1970), an
acceptable sample size from a finite population of 57 is 50, based on the formula they
70
developed. During a telephone conversation, participants were asked to provide job title
information and to respond to the five statements relating to selective marketing and
recruiting practices. Participants were also asked to respond to part three of the survey.
Each participant contacted by telephone agreed to participate. Contact by telephone
yielded eight usable responses from participants. The total of usable responses obtained
from all contact with participants was 51.
Archival Data Collection
Concurrent with preparation and delivery of the electronic survey, data for each of
the 100 counties in North Carolina were downloaded from the U. S. Census Bureau
website (U. S. Census Bureau, 2010). Data were available as an electronic file and were
presented in individual spreadsheets. Each file contained a profile of the general
population and demographic profile data for each respective county. For example, raw
numbers for age categories were reported along with percentages for each category.
Other items, such as median age, household information, and household occupancy data
were included in the Census Bureau spreadsheets. I extracted the relevant data for each
county and composited the data into one spreadsheet for all 100 counties. This file was
named County Data.
Once the surveys were completed, demographic enrollment data for each
responding college were retrieved from the NCCCS. Personnel at the NCCCS provided
data on student enrollment numbers for the 2010-2011 academic year from each of the 58
community colleges. At my request, personnel from the NCCCS sent two electronic files
containing the data I requested. One file was a spreadsheet listing an unduplicated
headcount in each age category for each college. The other file was a spreadsheet listing
71
an unduplicated headcount in each ethnic category for each college. In each case,
numbers reported were for the 2010-2011 academic year.
I extracted the data from each demographic category in the NCCCS spreadsheets
and composited the data into a separate spreadsheet. This file was named College Data.
The College Data spreadsheet was arranged by college, with each college appearing on a
separate page within the spreadsheet. I then extracted data from the County Data
spreadsheet for each county within any given college’s service area. This data were
pasted into the relevant page of the College Data spreadsheet. The resulting spreadsheet
contained data in each demographic category for each college and each county in the
college service area. This file was renamed Composite Data.
Data Analysis Procedures
Descriptive statistics were used to answer research questions one and five, and
inferential statistics were used to answer research questions two, three, and four. The
specified level of alpha for the study was .05. To increase the sensitivity of the statistical
test, a Bonferroni adjustment was made to age and ethnicity variables. There were 12
discrete age categories. Dividing .05 by 12 yielded an αʹ′ of .004. Adjustment for the six
ethnic categories yielded an αʹ′ of .008.
Research Question One
To answer research question one, participant responses for survey questions 4, 7,
8, 11, and 15 from the Qualtrics (Version 33912 1.725s [0.488, 0.415, 0.613, 0.039,
0.047]) survey software were transposed into a spreadsheet and arranged by college.
Vander Schee (2009) separated groups according to model of coordination and length of
time after a program was in place. To separate for time after a program was in place,
72
Vander Schee used a time frame of more or less than five years after implementation as a
dividing criterion. The selection of a five-year time frame allowed for one complete cycle
of students at a four-year institution. This study used three years pre- or post-
implementation as an indicator for the presence or absence of selective marketing and
recruiting practices. A three-year timeframe allowed for one complete cycle of students at
a two-year institution.
To qualify for inclusion in the selective group of colleges, a participant must have
selected “More than three years” for at least three of the five questions related to selective
marketing and recruiting practices. Participants not selecting “More than three years” for
three or more of the five questions were included in the nonselective group. The criterion
for determining inclusion into the selective or nonselective group followed the same basic
pattern as Vander Schee’s (2009) study, with the exception of changing the five-year
timeframe to a three-year timeframe. Based on survey responses, colleges were divided
into two groups, one with selective marketing and recruiting practices and one without
selective marketing and recruiting practices. Percentages and frequency responses were
manually calculated for responses to each of the five questions.
To further organize the data, separate spreadsheets were created for the selective
group and the nonselective group. Responses for each college were transposed into the
new spreadsheets. Data about job title, response date, and response identification number
were recorded. The same spreadsheets were used as starting points for demographic data
that would be added for the remaining research questions.
73
Research Questions Two and Three
After the demographic data for each college and service area were collected and
composited into the Composite Data spreadsheet, demographic variables were redefined
so the enrollment and population data had comparable ranges for analysis. Reporting for
demographic categories varied slightly between the U. S. Census Bureau and the
NCCCS. For example, the U. S. Census Bureau reported age data in five-year increments
up through age 85 and over, whereas the NCCCS reported ages starting with ages 19 and
under and continuing in five-year increments through ages 70 and over. For ethnic
categories, the NCCCS reported both male and female data for each ethnic category,
whereas the U. S. Census Bureau only reported data for the category and not gender
within the category. In such cases, categories were collapsed where appropriate, resulting
in comparable ranges of data between the NCCCS and the U. S. Census Bureau for each
demographic category used in this study.
Demographic categories selected for examination in this study were age,
ethnicity, and gender. Age categories were subdivided into the groupings 19 and under,
and then in five-year increments up to age 70, and then 70 and over, resulting in 12 age
categories. Ethnic categories used in this study followed those reported by the NCCCS.
Ethnic categories were White, Black, Hispanic, Native American, Asian, and Other.
Gender data used for this study were Female. Male data were excluded because they were
simply the inverse of Female data.
For each college, the number of students in each demographic category was
divided by the total number of students enrolled at the college, yielding a percentage. For
each county in the college service area, the number of people in each demographic
74
category was divided by the total number of people in the county, yielding a percentage.
In service areas with more than one county, the number of people in each category was
added together to yield a total number of people in each demographic category for all
counties the college service area. Totals were used to calculate the percentage.
Once a percentage for each demographic category in both the college and the
college service area was determined, the percentage of people in each demographic
category of the college service area was subtracted from the percentage of students in
each demographic category of the college. This process was repeated for each
demographic category at each college. A deviation for each demographic category was
calculated by subtracting the percentage of people in each category of the service area
from the percentage of people in each category of the college. Basic mathematic
functions of the spreadsheet were used to calculate deviations for each college. Positive
values indicated an overrepresentation of any given demographic category, and negative
values indicated an underrepresentation of any given demographic category.
Once determined, deviation values for each college were transposed into a new
spreadsheet. Within the new spreadsheet, colleges were grouped according to selective or
nonselective marketing and recruiting practices. The spreadsheet was uploaded into SPSS
predictive analytics software. SPSS was used to create descriptive statistics for the two
groups and to compare means of the deviations. The mean of the deviation, standard
deviation, and standard error were calculated for each demographic category. One-sample
t-tests with Bonferroni adjustments were performed to compare the mean deviations for
each category to a hypothesized value of zero. Separate t-tests were performed for both
75
selective and nonselective colleges to answer research questions two and three. 95%
confidence intervals were constructed.
Research Question Four
The coded spreadsheet containing the mean deviations that were used in research
questions two and three was used as the database for research question four. To answer
research question four, the difference in the mean deviations for selective and
nonselective groups was analyzed using SPSS analytic software. Descriptive statistics
were used to create a mean of the deviations and the standard deviation for both groups.
Independent samples t-tests with Bonferonni adjustments were performed on the
difference in mean deviations for selective and nonselective colleges in each
demographic category. A 95% confidence interval was constructed.
Research Question Five
Survey responses from part three of the electronic survey were used to define
depth of implementation when answering research question five. Part three of the survey
gathered participant responses about the depth of implementation of selective marketing
and recruiting practices. Depth of implementation referred to the level of administrative
oversight and organizational structure each college devoted to the management of
marketing and recruiting practices (Kemerer, Baldridge, & Green, 1982; Vander Schee,
2009). Only participant responses from colleges identified as selective were used to
answer research question five. Each college in the selective group was coded according to
survey responses about implementation of particular marketing and recruiting practices at
the participant’s college.
76
All participant responses of “Staff Coordinator” were grouped and coded as group
one, for example. Remaining responses were grouped and coded accordingly. Responses
of “Marketing and Recruiting Division” were eliminated from the analysis due to
insufficient response rate. Four “None of the Above” responses were moved into the
remaining categories based on participant comments. In all four of these cases, further
analysis of participant comments indicated that the processes described were actually
appropriate to group within existing categories. Three of the responses were moved into
the “Matrix System” group and one was moved to the “Staff Coordinator” group.
After adjustments were made to the groupings, deviations for each demographic
category were arranged by college. In this analysis, the three levels of implementation
were the independent variable and the mean deviations for each demographic category
were the dependent variables. SPSS analytic software was used to calculate the mean,
standard deviation, and range of deviations for each demographic category in each group.
A descriptive comparison of the mean deviations across groups was performed to answer
research question five. Inadequate response numbers made inferential statistics
impractical for research question five.
Summary
Chapter three described the research methodology for this study. A brief overview
outlined the purpose of the study, which was to determine the presence or absence of
selective marketing and recruiting practices at North Carolina community colleges and
then to further examine relationships between community college demographics and
service area demographics. The study population and sample were described, and data
collection and analysis procedures were reviewed.
77
For this study, the population was community colleges in the United States. The
sampling frame was all community colleges in North Carolina, and the sample was 51
colleges from the NCCCS. Data collection involved the use of a survey to gather data on
whether or not colleges practiced selective marketing and recruiting. The study also used
demographic data from the NCCCS and the U. S. Census Bureau to make comparisons
across colleges with and without selective recruiting. Data analysis included using
descriptive statistics to portray the relationship between the demographic composition of
colleges and their respective service areas and to examine the effects of depth of
administrative implementation on student enrollment demographics. Inferential statistics
were used to examine the relationship between college demographics and respective
college service area demographics across colleges with and without selective recruiting.
78
CHAPTER FOUR: FINDINGS
This study was conducted to determine if the presence of selective marketing and
recruiting techniques significantly altered the demographic composition of community
college enrollment in North Carolina when compared to the demographic composition of
the college service area. Demographic groups were examined through the lens of the
community college open access mission to determine if the presence or absence of
selective marketing and recruiting practices limited access to education for any particular
demographic group. The study examined age, gender, and ethnic groups for discrepancies
in enrollment between colleges with selective marketing and recruiting practices and
colleges without selective marketing and recruiting practices when compared to the same
groups from the college service area. The study also considered the depth of
implementation of marketing and recruiting practices at selective colleges. Five research
questions guided the research. To guide the statistical analysis of research questions two,
three, and four, null and alternative hypotheses were developed. Research questions one
and five were answered using descriptive statistics and no hypotheses were posited. The
research questions, along with the appropriate null and alternative hypotheses, for this
study were:
1. What percentage of community colleges in North Carolina practice selective
marketing and recruiting?
2. What is the relationship between student enrollment and service area
demographics at community colleges with selective marketing and recruiting
practices?
H02 = The demographic composition of community college enrollment is the
79
same as the demographic composition of the college service area population
for colleges with selective marketing and recruiting practices.
H2 = The demographic composition of community college enrollment is
different from the demographic composition of the college service area
population for colleges with selective marketing and recruiting practices.
3. What is the relationship between student enrollment and service area
demographics at community colleges without selective marketing and
recruiting practices?
H03 = The demographic composition of community college enrollment is the
same as the demographic composition of the college service area population
for colleges without selective marketing and recruiting practices.
H3 = The demographic composition of community college enrollment is
different from the demographic composition of the college service area
population for colleges without selective marketing and recruiting practices.
4. How do the demographic relationships of community colleges with selective
marketing and recruiting practices compare to the demographic relationships
of community colleges without selective marketing and recruiting practices?
H04 = The relationship between the demographic composition of community
college enrollment and the demographic composition of the college service
area population for colleges with selective marketing and recruiting practices
is the same as the relationship between the demographic composition of
community college enrollment and the demographic composition of the
college service area population for colleges without selective marketing and
80
recruiting practices.
H4 = The relationship between the demographic composition of community
college enrollment and the demographic composition of the college service
area population for colleges with selective marketing and recruiting practices
is different from the relationship between the demographic composition of
community college enrollment and the demographic composition of the
college service area population for colleges without selective marketing and
recruiting practices.
5. How does depth of implementation of selective marketing and recruiting
practices affect student demographics at North Carolina community colleges
practicing selective marketing and recruiting practices?
An electronic survey was used to gather information about marketing and
recruiting practices at community colleges in North Carolina. The survey results were
used to create two groups for comparison. One group contained colleges with selective
marketing and recruiting practices, and one group contained colleges without selective
marketing and recruiting practices. Using data derived from the comparison of colleges to
service areas, a mean deviation for each demographic group was calculated. The
demographic data for colleges in each group were examined in comparison to the
demographic data from the service area of each selective college using a one-sample t-
test. The level of alpha used for all statistical tests in the study was .05. To control for
Type I error, a Bonferroni adjustment was applied to analyses for the age and ethnicity
variables.
81
An independent t-test was used to test for statistically significant differences in
the deviations of the selective and nonselective groups. After the initial comparisons were
made, demographic data from colleges with selective marketing and recruiting practices
were examined in relation to the depth of selective marketing and recruiting
implementation. After describing the survey respondents, this chapter presents the
findings from each of the five survey questions with analysis.
Survey Participants
The chief administrative officer of student services at each of 57 colleges from the
NCCCS was emailed an electronic survey. One college from the 58-college system was
excluded to pilot the study. The chief administrative officer was selected to receive the
survey because of his or her unique knowledge of the admissions process. The chief
administrative officer was asked to either complete the survey, or forward the survey to
the most qualified person. Participants from 51 colleges returned usable survey
responses. Forty-three participants responded to the electronic survey. Eight participants
responded to survey questions by telephone. The overall response rate was 90%.
Participants were asked to report the name of their college and their job title. A
complete listing of terms used in participant job titles appears in Table 1. Of those
reporting, Director was the title most commonly reported (n = 17), followed by Vice
President (n = 16). Three of the participants with Vice President in the job title were
Associate Vice Presidents, and one was an Interim Vice President. Among the Deans, one
was Executive Dean and one was Associate Dean.
Positional titles were associated with various college offices. The terms
“Enrollment” or “Enrollment Management” appeared seven times in the nonselective
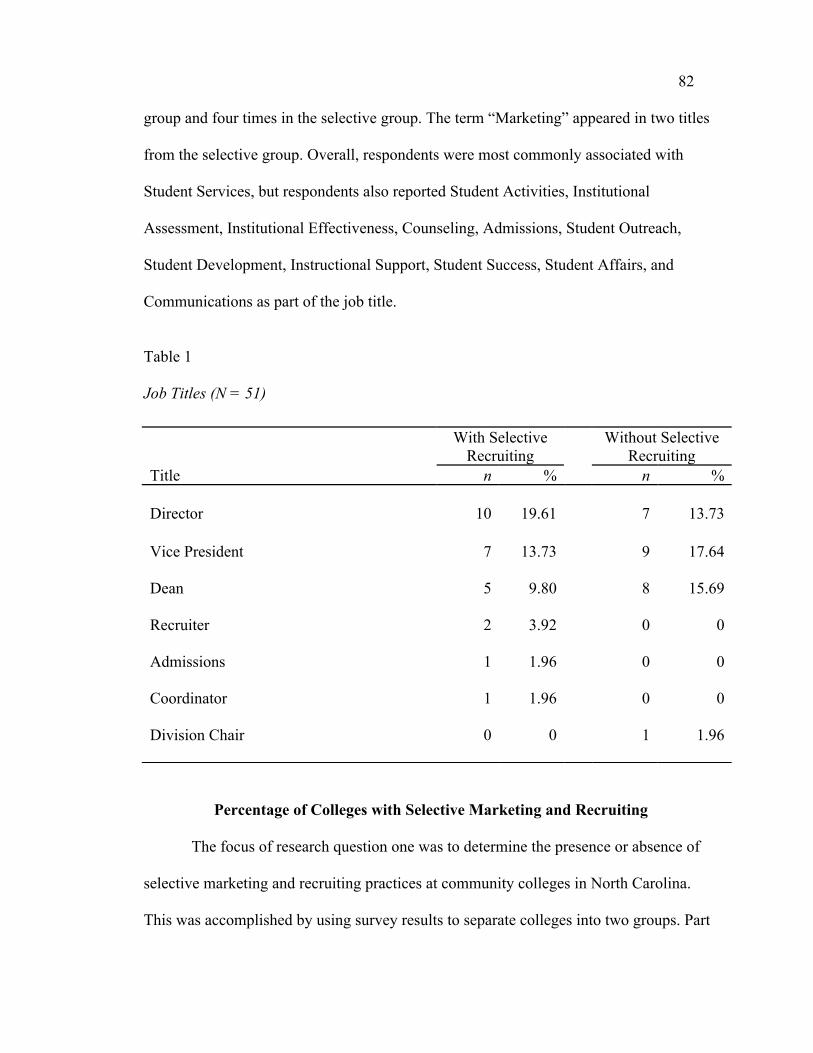
82
group and four times in the selective group. The term “Marketing” appeared in two titles
from the selective group. Overall, respondents were most commonly associated with
Student Services, but respondents also reported Student Activities, Institutional
Assessment, Institutional Effectiveness, Counseling, Admissions, Student Outreach,
Student Development, Instructional Support, Student Success, Student Affairs, and
Communications as part of the job title.
Table 1
Job Titles (N = 51)
Percentage of Colleges with Selective Marketing and Recruiting
The focus of research question one was to determine the presence or absence of
selective marketing and recruiting practices at community colleges in North Carolina.
This was accomplished by using survey results to separate colleges into two groups. Part
With Selective Recruiting
Without Selective Recruiting
Title n % n % Director 10 19.61 7 13.73 Vice President 7 13.73 9 17.64 Dean 5 9.80 8 15.69 Recruiter 2 3.92 0 0 Admissions 1 1.96 0 0 Coordinator 1 1.96 0 0 Division Chair 0 0 1 1.96
83
two of the survey was used to divide responding colleges into two groups, one group with
selective marketing and recruiting practices, and one without. To qualify as practicing
selective marketing and recruiting, survey respondents must have replied “More than
three years” on at least three of the five questions related to selective marketing and
recruiting practices. The five questions in the survey related to selective marketing and
recruiting practices were questions 4, 7, 8, 11, and 15. Possible responses were “Not in
Place,” “Less than three years,” and “More than three years.” Data for responses to
relevant survey questions are presented in Table 2.
Approximately 95% of responding participants reported using marketing
techniques aimed at different market segments. Nearly 65% have practiced target
marketing for more than three years. Around 92% of colleges have increased marketing
activities for specific target student markets. Forty-seven percent of colleges have done
so within the last three years.
One quarter (25.5%) of respondents did not recruit based on age or some other
criteria. A nearly equal number (23.5%) have done so for less than three years, meaning
over half of responding colleges have recruited based on age or some other specific
criteria for more than three years. One-third (33.3%) of respondents have different
recruiting programs in place for recruiting non-traditional students. Two-thirds (66.7%)
of reporting colleges have done so for less than three years, or not at all.
Ninety percent of colleges reported having identified specific demographic groups
for marketing efforts. More than half of reporting colleges (57%) have identified specific
groups for more than three years. One-third (33.3%) of reporting colleges have identified
specific groups for marketing efforts within the past three years.
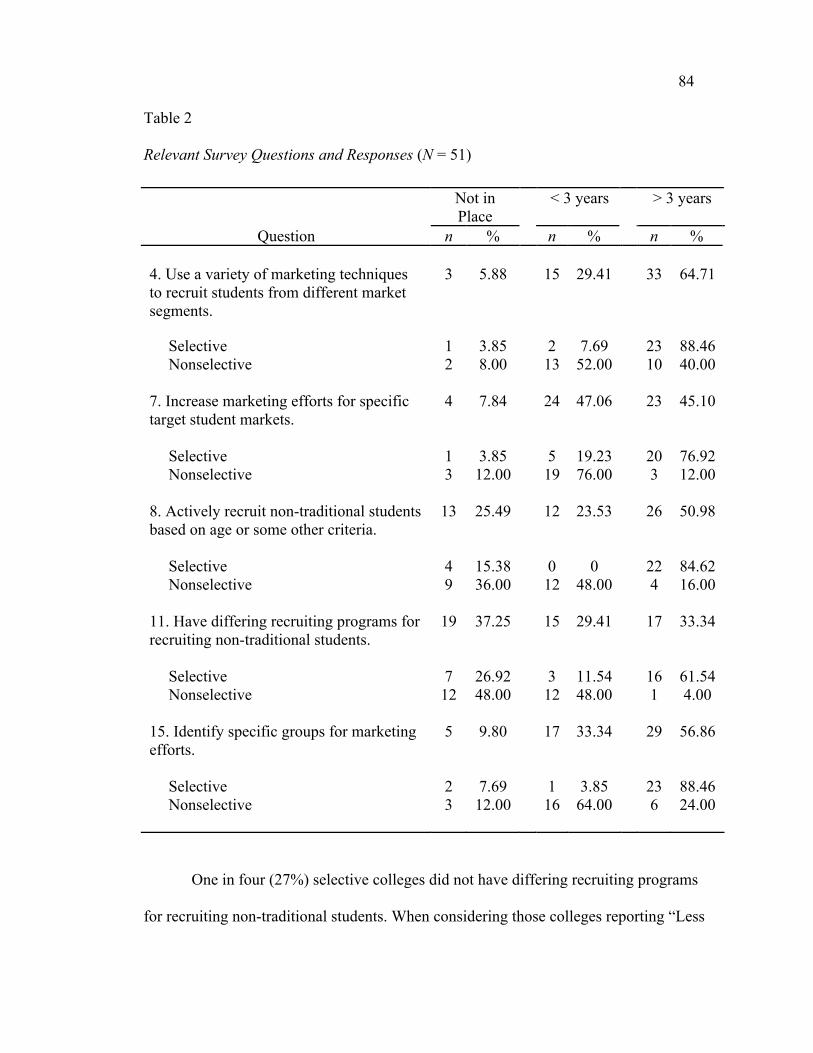
84
Table 2
Relevant Survey Questions and Responses (N = 51)
One in four (27%) selective colleges did not have differing recruiting programs
for recruiting non-traditional students. When considering those colleges reporting “Less
Not in Place
< 3 years > 3 years
Question n % n % n % 4. Use a variety of marketing techniques to recruit students from different market segments.
3 5.88 15 29.41 33 64.71
Selective 1 3.85 2 7.69 23 88.46 Nonselective 2 8.00 13 52.00 10 40.00
7. Increase marketing efforts for specific target student markets.
4 7.84 24 47.06 23 45.10
Selective 1 3.85 5 19.23 20 76.92 Nonselective 3 12.00 19 76.00 3 12.00
8. Actively recruit non-traditional students based on age or some other criteria.
13 25.49 12 23.53 26 50.98
Selective 4 15.38 0 0 22 84.62 Nonselective 9 36.00 12 48.00 4 16.00
11. Have differing recruiting programs for recruiting non-traditional students.
19 37.25 15 29.41 17 33.34
Selective 7 26.92 3 11.54 16 61.54 Nonselective 12 48.00 12 48.00 1 4.00
15. Identify specific groups for marketing efforts.
5 9.80
17 33.34 29 56.86
Selective 2 7.69 1 3.85 23 88.46 Nonselective 3 12.00 16 64.00 6 24.00
85
than three years” for the same question, more than one-third of selective colleges (38%)
did not have mature recruiting programs in place to recruit non-traditional students. Of
the remaining four marketing and recruiting strategies, more than three in four selective
colleges had mature strategies in place.
Forty percent of nonselective colleges have used a variety of marketing
techniques to recruit students from different target markets for more than three years,
making this strategy the most popular among nonselective colleges. Slightly fewer than
one in four (24%) identified specific groups for marketing efforts. For the remaining
marketing and recruiting strategies, fewer than two in ten nonselective colleges had
mature strategies in place. Nearly half or more of responding nonselective colleges had
some marketing strategy in place for less than three years.
Overall, survey responses indicated that 49% of reporting colleges (n = 25) did
not practice selective marketing and recruiting at a significant level for more than three
years, while 51% of reporting colleges (n = 26) did have significant selective marketing
and recruiting practices in place for three or more years. Based on these findings,
responding colleges were separated into two groups for further analysis.
Selective Marketing and Demographic Relationships
To determine the relationship between community college demographics and
service area demographics for community colleges with selective marketing and
recruiting practices, demographic data for each college with selective marketing and
recruiting were compared to demographics of the college’s service area. Subtracting the
service area percentage from the college percentage for each demographic category
created a deviation for each category. Positive numbers indicated an overrepresentation
86
of people at the college for any given demographic category. Negative numbers indicated
underrepresentation. The null hypothesis for this research question was a mean deviation
value of zero, or equal representation of each demographic category in both the college
and the service area.
Once a deviation for each demographic category was established, the mean,
standard deviation, and standard error were calculated. A one-sample t-test was
performed and a 95% confidence interval constructed. Level of alpha was a Bonferroni
adjusted αʹ′ = .004 for age categories and αʹ′ = .008 for ethnic categories. For this research
question, the actual mean deviation was compared to the hypothesized deviation of zero.
The statistics for research question two are shown in Table 3.
For most demographic categories, students were statistically significantly over or
underrepresented in overall college enrollment when compared to the corresponding
demographic category of the college service area. Twenty to twenty-four year olds were
the most overrepresented age category, enrolling on average at a rate of almost 25
percentage points more than the same age group in the college service area, t(25) = 27.47,
p < .001. Students aged 70 and over were the most under represented age group, MD = -
9.64, SDD = 2.28, t(25) = -21.57, p < .001. Enrollment of students aged 40-44 most
closely matched the corresponding age group when compared as a percentage of college
enrollment versus a percentage of the overall population of the service area, indicating
that the deviation in representation for this population is not statistically significantly
different from zero, MD = -0.22, SDD = 0.99, t(25) = -1.12, p = .274.
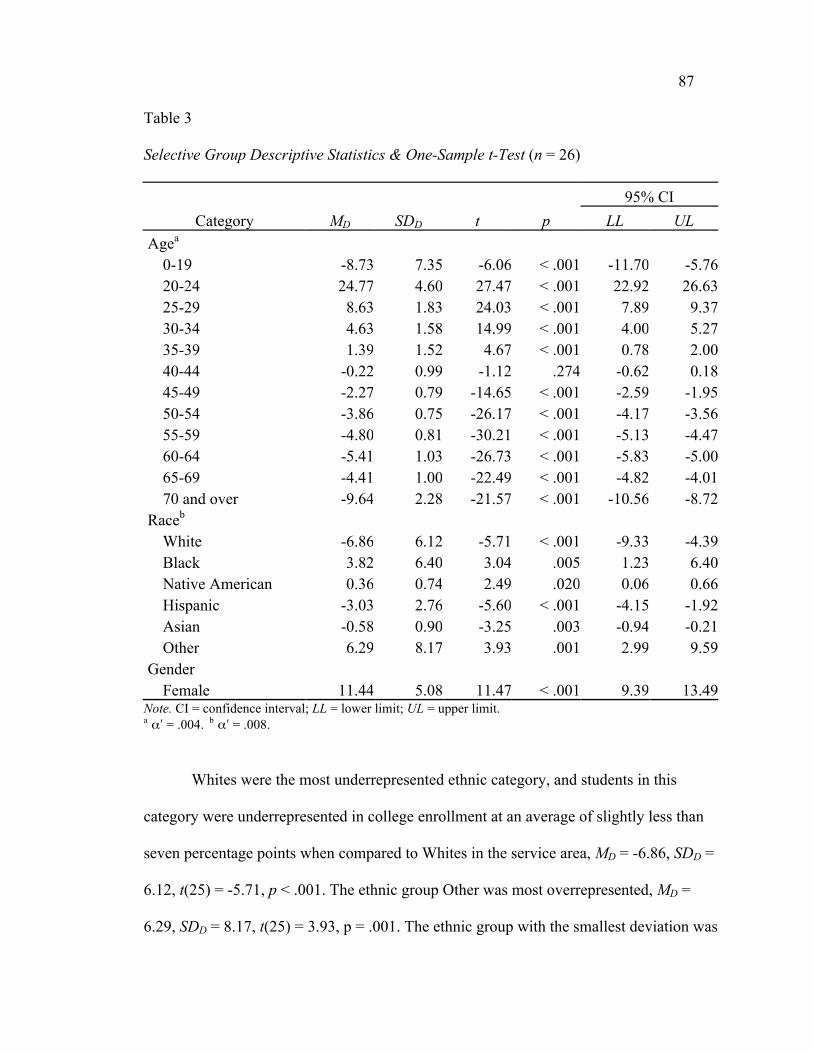
87
Table 3
Selective Group Descriptive Statistics & One-Sample t-Test (n = 26)
95% CI Category MD SDD t p LL UL
Agea 0-19 -8.73 7.35 -6.06 < .001 -11.70 -5.76 20-24 24.77 4.60 27.47 < .001 22.92 26.63 25-29 8.63 1.83 24.03 < .001 7.89 9.37 30-34 4.63 1.58 14.99 < .001 4.00 5.27 35-39 1.39 1.52 4.67 < .001 0.78 2.00 40-44 -0.22 0.99 -1.12 .274 -0.62 0.18 45-49 -2.27 0.79 -14.65 < .001 -2.59 -1.95 50-54 -3.86 0.75 -26.17 < .001 -4.17 -3.56 55-59 -4.80 0.81 -30.21 < .001 -5.13 -4.47 60-64 -5.41 1.03 -26.73 < .001 -5.83 -5.00 65-69 -4.41 1.00 -22.49 < .001 -4.82 -4.01 70 and over -9.64 2.28 -21.57 < .001 -10.56 -8.72
Raceb White -6.86 6.12 -5.71 < .001 -9.33 -4.39 Black 3.82 6.40 3.04 .005 1.23 6.40 Native American 0.36 0.74 2.49 .020 0.06 0.66 Hispanic -3.03 2.76 -5.60 < .001 -4.15 -1.92 Asian -0.58 0.90 -3.25 .003 -0.94 -0.21 Other 6.29 8.17 3.93 .001 2.99 9.59
Gender Female 11.44 5.08 11.47 < .001 9.39 13.49
Note. CI = confidence interval; LL = lower limit; UL = upper limit. a αʹ′ = .004. b αʹ′ = .008.
Whites were the most underrepresented ethnic category, and students in this
category were underrepresented in college enrollment at an average of slightly less than
seven percentage points when compared to Whites in the service area, MD = -6.86, SDD =
6.12, t(25) = -5.71, p < .001. The ethnic group Other was most overrepresented, MD =
6.29, SDD = 8.17, t(25) = 3.93, p = .001. The ethnic group with the smallest deviation was
88
Native American, MD = 0.36, SDD = 0.74, t(25) = 2.49, p = 0. 020. Female enrollment
was overrepresented at an average of slightly above 11 percentage points when compared
to the service area population, MD = 11.44, SDD = 5.08, t(25) 11.47, p < .001.
Overall, the demographic composition of community college enrollment was
statistically significantly different than the demographic composition of the college
service area. These findings suggested that enrollment at community colleges with
selective marketing and recruiting practices did not reflect the demographic composition
of the college service area. Specifically, North Carolina community college students
enrolled in community colleges with selective marketing and recruiting practices at rates
that did not accurately reflect the demographic composition of the college service area,
although patterns of over or underrepresentation varied.
This study examined 12 demographic categories for age. Within those 12 groups,
only 1 group showed a representation deviation that was not statistically significant. Not
only were all of the other 11 group deviations statistically significantly different, they
were different at the p < .001 level of significance. Among ethnic groups, only one group
was represented at colleges in numbers not statistically significantly different than the
representation of the group in the service area. The remaining groups, were over or
underrepresented at statistically significant levels, p < .008. Gender groups were also
over or underrepresented at statistically significant levels, p < .001. Based on these
findings, the null hypothesis (H02) for research question two was rejected.
Nonselective Marketing and Demographic Relationships
To guide the statistical analysis of research question three, a null hypothesis was
developed. The null hypothesis (H03) stated that the demographic composition of
89
community college enrollment is the same as the demographic composition of the college
service area population for colleges without selective marketing and recruiting practices.
To determine the relationship between community college demographics and service area
demographics for community colleges without selective marketing and recruiting
practices, demographic data for each college without selective marketing and recruiting
were compared to demographic data for the college’s service area. Subtracting the service
area percentage from the college percentage for each demographic category created a
deviation for each category. Positive numbers indicated an overrepresentation of people
at the college for any given demographic group. Negative numbers indicated
underrepresentation. The null hypothesis for this research question was a mean deviation
value of zero, or equal representation of each demographic category in both the college
and the service area.
Once a deviation for each demographic category was established, the mean,
standard deviation, and standard error were calculated. A one-sample t-test was
performed and a 5% confidence interval constructed. Level of alpha was a Bonferroni
adjusted αʹ′ = .004 for age categories and αʹ′ = .008 for ethnic categories. For this research
question, the actual deviation mean was compared to the hypothesized deviation of zero.
The descriptive statistics and results of the subsequent t-test for research question three
are shown in Table 4.
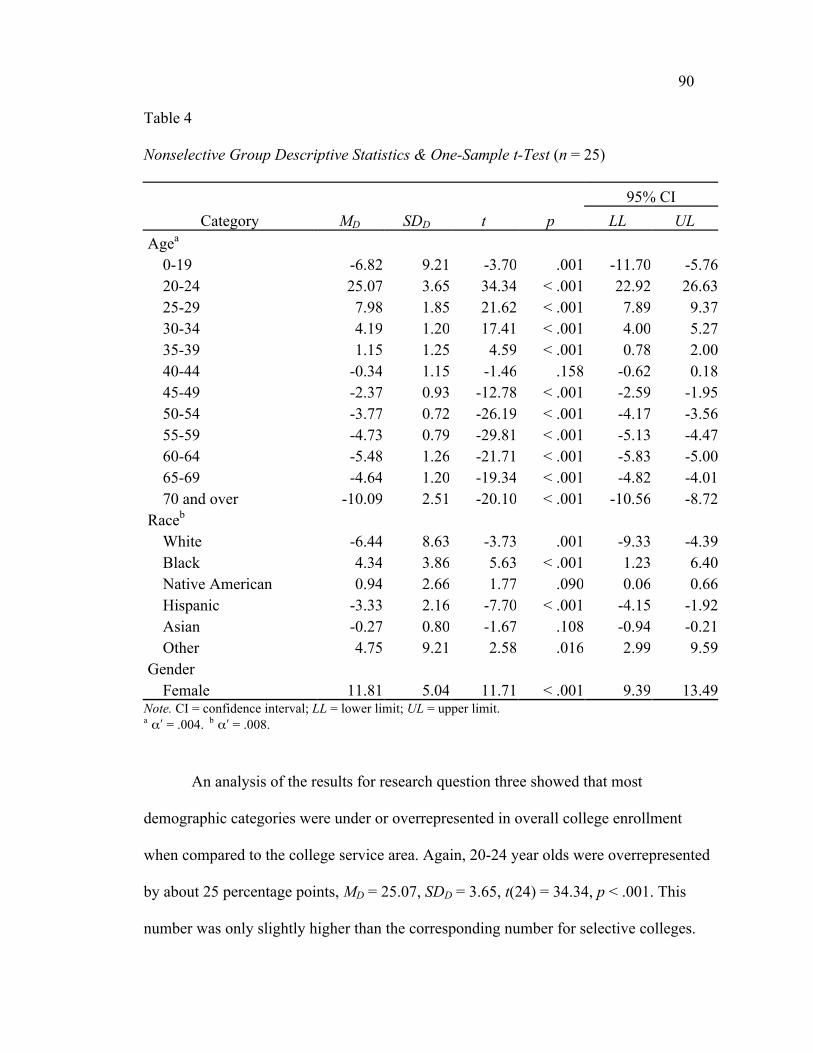
90
Table 4
Nonselective Group Descriptive Statistics & One-Sample t-Test (n = 25)
95% CI Category MD SDD t p LL UL
Agea 0-19 -6.82 9.21 -3.70 .001 -11.70 -5.76 20-24 25.07 3.65 34.34 < .001 22.92 26.63 25-29 7.98 1.85 21.62 < .001 7.89 9.37 30-34 4.19 1.20 17.41 < .001 4.00 5.27 35-39 1.15 1.25 4.59 < .001 0.78 2.00 40-44 -0.34 1.15 -1.46 .158 -0.62 0.18 45-49 -2.37 0.93 -12.78 < .001 -2.59 -1.95 50-54 -3.77 0.72 -26.19 < .001 -4.17 -3.56 55-59 -4.73 0.79 -29.81 < .001 -5.13 -4.47 60-64 -5.48 1.26 -21.71 < .001 -5.83 -5.00 65-69 -4.64 1.20 -19.34 < .001 -4.82 -4.01 70 and over -10.09 2.51 -20.10 < .001 -10.56 -8.72
Raceb White -6.44 8.63 -3.73 .001 -9.33 -4.39 Black 4.34 3.86 5.63 < .001 1.23 6.40 Native American 0.94 2.66 1.77 .090 0.06 0.66 Hispanic -3.33 2.16 -7.70 < .001 -4.15 -1.92 Asian -0.27 0.80 -1.67 .108 -0.94 -0.21 Other 4.75 9.21 2.58 .016 2.99 9.59
Gender Female 11.81 5.04 11.71 < .001 9.39 13.49
Note. CI = confidence interval; LL = lower limit; UL = upper limit. a αʹ′ = .004. b αʹ′ = .008.
An analysis of the results for research question three showed that most
demographic categories were under or overrepresented in overall college enrollment
when compared to the college service area. Again, 20-24 year olds were overrepresented
by about 25 percentage points, MD = 25.07, SDD = 3.65, t(24) = 34.34, p < .001. This
number was only slightly higher than the corresponding number for selective colleges.
91
Students aged 70 and over were the most underrepresented age category, MD = -10.09,
SDD = 2.51, t(24) = -20.10, p < .001. As with selective colleges, the only age category
showing no significant difference in over or underrepresentation was the 40-44 year old
category, MD = -0.34, SDD = 1.15, t(24) = -1.46, p = .158.
The demographic composition of college enrollment for the nonselective group
varied somewhat from that of the selective group among the ethnicity categories. Whites
were again the most underrepresented ethnic group, MD = -6.44, SDD = 8.63, t(24) = -
3.73, p = .001. The ethnic group Other was the most overrepresented group, MD = 4.75,
SDD = 9.21, t(24) = 2.58, p = .016, although the mean difference was not statistically
significant. The ethnic group Asian showed the least variation in representation, MD = -
0.27, SDD = 0.80, t(24) = -1.67, p = .108. Again, the mean difference in representation
was not statistically significant. On average, females were overrepresented in enrollment
by almost 12 percentage points when compared to the percentage of females in the
service area, MD = 11.81, SDD = 5.04), t(24) = 11.71, p < .001.
Overall, the demographic composition of college enrollment for colleges without
selective marketing and recruiting practices was statistically significantly different than
the demographic composition of the corresponding college service area. These findings
suggested that enrollment at community colleges without selective marketing and
recruiting practices did not match the demographic composition of the college service
area. Specifically, North Carolina community college students enrolled in community
colleges without selective marketing and recruiting practices at rates that did not
accurately reflect the demographic composition of the college service area. Again,
patterns of over or underrepresentation varied.
92
Within all 12 age categories, only one category showed a deviation that was not
statistically significant. The other 11 category deviations were statistically significantly
different at the p < .001 level of significance. Ethnic categories also exhibited variations
in student representation. Students in three categories were represented at colleges with
similar population characteristics as the service area. In the remaining categories,
students were over or underrepresented at statistically significant levels, p < .008. Gender
groups were over or underrepresented at statistically significant levels, p < .001. Based on
these findings, the null hypothesis (H03) for research question three was rejected.
Demographic Relationships Between Groups
To test for statistically significant differences between selective and nonselective
groups, a hypothesis was developed to guide the statistical analysis. The null hypothesis
(H04) for research question four stated that the relationship between the demographic
composition of community college enrollment and the demographic composition of the
college service area population for colleges with selective marketing and recruiting
practices is the same as the relationship between the demographic composition of
community college enrollment and the demographic composition of the college service
area population for colleges without selective marketing and recruiting practices. As in
research questions two and three, relationships between colleges and service areas were
determined by calculating the percent difference between college enrollment and the
population of the service area, resulting in a deviation value.
An independent samples t-test was conducted on the mean deviation of each
demographic category in the selective and nonselective groups. Results of the
independent samples t-tests appear in Table 5. The demographic category showing the
93
least variation between mean deviations was the 60-64 category, with the selective group
being less underrepresented on average by 0.07 percentage points. The 0-19 category was
the group with the greatest difference between means. Zero to nineteen year olds were
more underrepresented among nonselective colleges by an average of -1.91 percentage
points. Twenty to twenty-four year olds were the most overrepresented age group at both
selective and nonselective colleges. However, the variation between means for this group
was only -0.3 percentage points, indicating this group was more overrepresented at
nonselective colleges. Among all age categories, 11 of the 12 categories fell within one
percentage point of variation between selective and nonselective groups.
Ethnic categories followed age categories in the relatively minimal variation of
means between selective and nonselective colleges, with only the category Other showing
more than one percentage point of difference between means. All other ethnic groups fell
between -0.58 and 0.45 percentage points of variation. In other words, most ethnic groups
varied less than a percentage point, on average, in the difference in over or
underrepresentation at selective and nonselective colleges. Gender groups followed both
age and ethnic categories in the relatively small variation between representation at
selective and nonselective colleges. Females, while being overrepresented on the whole,
were only slightly more overrepresented at nonselective colleges (MS - N = -0.37).
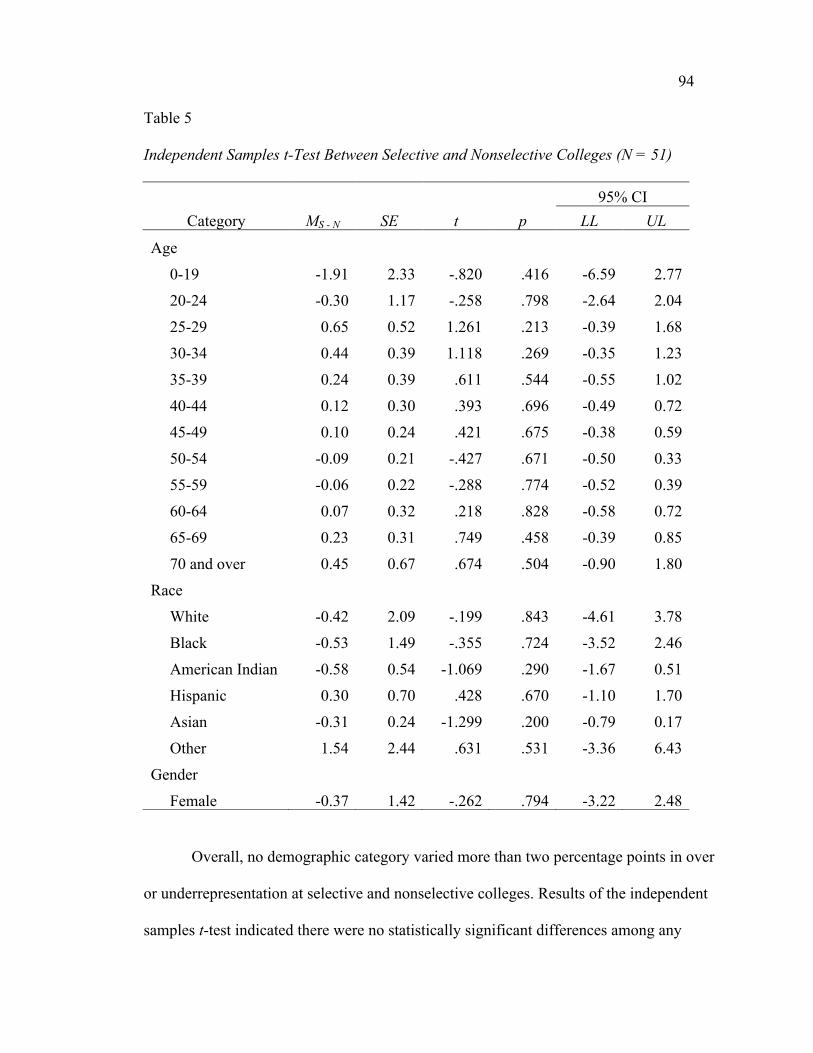
94
Table 5
Independent Samples t-Test Between Selective and Nonselective Colleges (N = 51)
Overall, no demographic category varied more than two percentage points in over
or underrepresentation at selective and nonselective colleges. Results of the independent
samples t-test indicated there were no statistically significant differences among any
95% CI Category MS - N SE t p LL UL
Age
0-19 -1.91 2.33 -.820 .416 -6.59 2.77
20-24 -0.30 1.17 -.258 .798 -2.64 2.04
25-29 0.65 0.52 1.261 .213 -0.39 1.68
30-34 0.44 0.39 1.118 .269 -0.35 1.23
35-39 0.24 0.39 .611 .544 -0.55 1.02
40-44 0.12 0.30 .393 .696 -0.49 0.72
45-49 0.10 0.24 .421 .675 -0.38 0.59
50-54 -0.09 0.21 -.427 .671 -0.50 0.33
55-59 -0.06 0.22 -.288 .774 -0.52 0.39
60-64 0.07 0.32 .218 .828 -0.58 0.72
65-69 0.23 0.31 .749 .458 -0.39 0.85
70 and over 0.45 0.67 .674 .504 -0.90 1.80
Race
White -0.42 2.09 -.199 .843 -4.61 3.78
Black -0.53 1.49 -.355 .724 -3.52 2.46
American Indian -0.58 0.54 -1.069 .290 -1.67 0.51
Hispanic 0.30 0.70 .428 .670 -1.10 1.70
Asian -0.31 0.24 -1.299 .200 -0.79 0.17
Other 1.54 2.44 .631 .531 -3.36 6.43
Gender
Female -0.37 1.42 -.262 .794 -3.22 2.48

95
demographic categories between colleges with and without selective marketing and
recruiting practices t(49), p > .004 for age categories, .008 for ethnic categories, and .05
for gender. These findings suggested there were no differences in the demographic
composition of colleges with and without selective marketing and recruiting practices
when compared to the demographic composition of the college service area. Specifically,
North Carolina community college students enrolled at the same rate relative to the
college service area at colleges with and without selective marketing and recruiting
practices. Based on these findings, the null hypothesis (H04) for research question four
was retained.
Depth of Implementation and Demographic Composition
The goal of research question five was to explain the relationship between the
depth of implementation of selective marketing and recruiting practices at selective
colleges and the student demographic composition of those colleges. Depth of
implementation referred to the level of administrative oversight and organizational
structure, or level of coordination, each college devoted to the management of marketing
and recruiting practices. Analysis for research question five was limited to colleges with
selective marketing and recruiting practices. The results of the analysis appear in Table 6.
The three levels of coordination included for analysis in research question five were Staff
Coordinator, Marketing Committee, and Matrix System. The Marketing and Student
Recruitment Division level of coordination was excluded from analysis due to
insufficient response numbers.
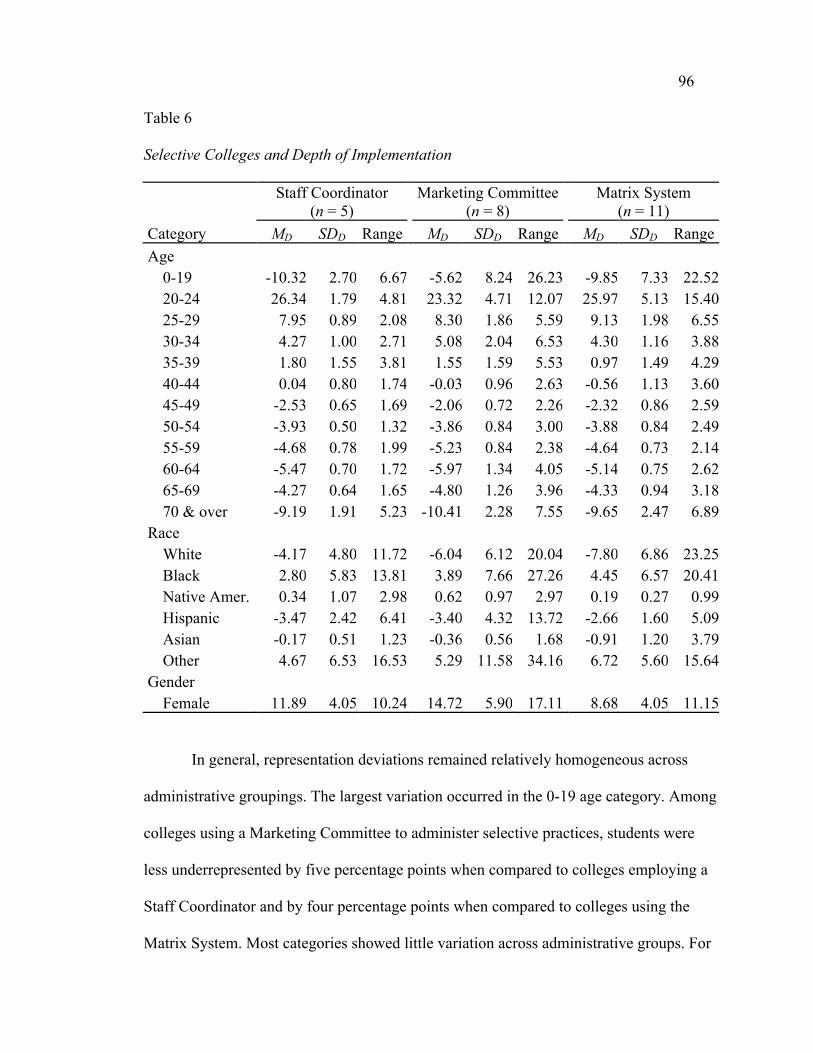
96
Table 6
Selective Colleges and Depth of Implementation
Staff Coordinator
(n = 5) Marketing Committee
(n = 8) Matrix System
(n = 11) Category MD SDD Range MD SDD Range MD SDD Range Age
0-19 -10.32 2.70 6.67 -5.62 8.24 26.23 -9.85 7.33 22.52 20-24 26.34 1.79 4.81 23.32 4.71 12.07 25.97 5.13 15.40 25-29 7.95 0.89 2.08 8.30 1.86 5.59 9.13 1.98 6.55 30-34 4.27 1.00 2.71 5.08 2.04 6.53 4.30 1.16 3.88 35-39 1.80 1.55 3.81 1.55 1.59 5.53 0.97 1.49 4.29 40-44 0.04 0.80 1.74 -0.03 0.96 2.63 -0.56 1.13 3.60 45-49 -2.53 0.65 1.69 -2.06 0.72 2.26 -2.32 0.86 2.59 50-54 -3.93 0.50 1.32 -3.86 0.84 3.00 -3.88 0.84 2.49 55-59 -4.68 0.78 1.99 -5.23 0.84 2.38 -4.64 0.73 2.14 60-64 -5.47 0.70 1.72 -5.97 1.34 4.05 -5.14 0.75 2.62 65-69 -4.27 0.64 1.65 -4.80 1.26 3.96 -4.33 0.94 3.18 70 & over -9.19 1.91 5.23 -10.41 2.28 7.55 -9.65 2.47 6.89
Race White -4.17 4.80 11.72 -6.04 6.12 20.04 -7.80 6.86 23.25 Black 2.80 5.83 13.81 3.89 7.66 27.26 4.45 6.57 20.41 Native Amer. 0.34 1.07 2.98 0.62 0.97 2.97 0.19 0.27 0.99 Hispanic -3.47 2.42 6.41 -3.40 4.32 13.72 -2.66 1.60 5.09 Asian -0.17 0.51 1.23 -0.36 0.56 1.68 -0.91 1.20 3.79 Other 4.67 6.53 16.53 5.29 11.58 34.16 6.72 5.60 15.64
Gender Female 11.89 4.05 10.24 14.72 5.90 17.11 8.68 4.05 11.15
In general, representation deviations remained relatively homogeneous across
administrative groupings. The largest variation occurred in the 0-19 age category. Among
colleges using a Marketing Committee to administer selective practices, students were
less underrepresented by five percentage points when compared to colleges employing a
Staff Coordinator and by four percentage points when compared to colleges using the
Matrix System. Most categories showed little variation across administrative groups. For
97
example, the overrepresentation deviation for 30-34 year olds varied less than one
percentage point across administrative groupings. The degree to which Native Americans
were overrepresented varied less than half a percentage point across groupings.
One interesting pattern did emerge from the findings. Although the variations
were slight, a common trend was a consistent increase or decrease in the over or
underrepresentation of students within demographic categories when administrative
oversight increased from a Staff Coordinator to a Marketing Committee to a Matrix
System. The overrepresentation of 25-29 year olds increased with each increase in the
depth of administrative implementation, whereas the overrepresentation of 35-39 year
olds decreased slightly as depth of implementation increased.
This trend was most prevalent among ethnic categories. The underrepresentation
of white students became slightly more pronounced with increased depth of
implementation. Likewise, Asian students were more underrepresented as depth of
implementation increased, although the overall variation was less than one percentage
point. Hispanic students, on the other hand, showed a consistent decrease in
underrepresentation as administrative oversight increased. When considering deviations
in overrepresentation, Black students were more overrepresented as depth of
implementation increased. This trend was also recorded among students expressing Other
as a racial identity.
For the remaining categories, the tendency was to note a slightly higher over or
underrepresentation of groups within the Marketing Committee group when compared to
colleges using a Staff Coordinator or colleges using the Matrix System. Twenty to
twenty-four year olds were less overrepresented within the Marketing Committee group.
98
Thirty to thirty-four year olds were more overrepresented among the Marketing
Committee group, as were females. Regarding underrepresentation, 45-49 year olds were
less underrepresented at colleges using Marketing Committees, whereas 55-59 year olds,
60-64 year olds, 65-69 year olds, and 70 & over students were more underrepresented at
colleges using Marketing Committees to oversee selective marketing and recruiting
practices. While these trends appeared in the sample, differences in representation were
minor and were not statistically significant.
Research question five explained the relationship between the amount of
administrative oversight devoted to selective marketing and recruiting practices at
selective colleges and the student demographic composition of those colleges. Depth of
implementation was used to group colleges according to the level of administrative
oversight given to selective marketing and recruiting practices at the college. Overall,
colleges showed little actual variation in over or underrepresentation deviations in
specific demographic categories when comparing those categories across groups defined
by depth of implementation.
Summary
Chapter four presented the research findings for this study. Five research
questions guided the study. North Carolina community colleges were surveyed to
determine the presence or absence of selective marketing and recruiting practices.
Enrollment was examined for differences among demographic categories between
colleges with and without selective marketing and recruiting practices. Selective colleges
were examined to determine if the depth of implementation affected the demographic
composition of enrollment.
99
The findings in this study indicated that about 50% of North Carolina community
colleges practiced selective marketing and recruiting practices. Student demographic
representation in enrollment at North Carolina community colleges was statistically
significantly different than the corresponding demographic composition of college
service areas. While demographic representation at colleges was different from that of the
service area population, demographic representation was not different between colleges
with and without selective marketing and recruiting practices. Finally, this study found
that the depth of implementation of selective marketing and recruiting practices had no
statistically significant effect on demographic representation among students enrolled at
selective colleges.
100
CHAPTER FIVE: DISCUSSION, RECOMMENDATIONS, AND CONCLUSION
Open access is a critical, even foundational, component of the multiple missions
of the community college. In an ever increasingly-competitive environment, two- and
four-year colleges and universities have refocused efforts to attract students and
resources. The community college, the youngest established institutional member of the
higher education family, has only recently reached a stage of relative institutional
maturity. As rapid growth ceases and institutions reach capacity, the community college
faces some of the same struggles as other higher educational institutions. Many two- and
four-year colleges and universities, both public and private, have adopted marketing
strategies from the business environment to maintain a competitive advantage. Once
unheard of in higher education, community colleges have begun to adopt marketing and
recruiting strategies in efforts to keep pace with other two- and four-year colleges and
universities. Some of these practices represent a direct threat to the egalitarian open-
access mission of the community college. This study was conducted to assess the status
of some of these same strategies.
This chapter will summarize the study, giving a brief overview of the research
problem, conceptual framework, methodology, and findings. Findings will be discussed
within the context of implications for community college leaders and researchers.
Limitations of the study, implications for practice, and recommendations for new
research will conclude the study.
101
Summary of the Study
From inception, the community college was conceived as an institution
committed to the removal of barriers to higher education. Selective marketing and
recruiting practices have the practical effect of raising awareness among targeted groups
at the expense of neglected groups. Disparities in awareness of educational opportunities
may serve as barriers to potential community college students. This causal comparative
study sought to determine the presence or absence of selective marketing and recruiting
practices at community colleges in North Carolina. Subsequent examinations explored
the relationships between selective practices and the demographic composition of college
enrollments. The depth of institutional implementation at selective colleges was
examined for effects on student enrollment.
Enrollment management gained prominence after a confluence of events caused a
shift in how college administrators considered admissions practices. Projections of
decreased student populations coupled with Tinto’s (1975) research findings about the
importance of student engagement on retention prompted administrators to abandon the
gatekeeper function of admissions. Instead, admissions officials began to actively seek
out specific student demographic groups to increase the potential for retention and
persistence to graduation. As competition increased for the brightest students,
administrators reacted by adopting traditional marketing techniques designed to segment
markets, target specific student populations, and raise awareness of the college among
targeted students. Community college officials, though slow to join the selective
marketing trend, have begun to adopt selective marketing and recruiting practices.
102
To determine the presence or absence of selective marketing and recruiting
practices at community colleges in North Carolina, this study employed an electronic
survey. Findings indicated that about half of community colleges practiced selective
marketing and recruiting practices. Archival demographic data was used to examine
enrollments at selective and nonselective colleges and to examine the demographic
composition of the college service area. Student demographic composition was compared
to the demographic composition of the college service area. This study found that the
demographic composition of community college student enrollment at both selective and
nonselective colleges was statistically significantly different than the demographic
composition of the college service area population.
Further analysis compared the demographic composition of students at selective
and nonselective colleges. This study found that student demographic composition
relative to the service area is not statistically significantly different between colleges with
and without selective marketing and recruiting practices. The level of administrative
oversight and institutional commitment, or depth of implementation, was examined with
respect to student demographic composition at selective colleges. The results of this
study indicated that depth of implementation did not impact the demographic
composition of colleges with selective marketing and recruiting practices.
Discussion of the Findings
Research Question One
Dann (1982) completed an early study of marketing practices at the community
college. At that time, 33% of colleges practiced marketing strategies. This study found
that about half of colleges in North Carolina practiced selective marketing and recruiting
103
strategies. A comparison of these two studies showed a relatively modest increase in the
implementation of marketing strategies at the community college when considered over
three decades. However, some of the findings in this study suggested that the status of
marketing at the community college could presently be undergoing accelerated changes.
This study used a criterion to classify colleges according to the presence or
absence of marketing strategies. Criterion for inclusion in the selective group of colleges
was the employment of three or more strategies for a period of three or more years. The
purpose of this criterion was to allow for recruiting strategies to have an effect on college
enrollments, which was the focus of this study. However, if marketing strategies are
considered as either in place or not, a different conclusion can be drawn from the data.
In some cases, as many as nine out of ten colleges practiced selective marketing
strategies. In all five of the strategies examined for this study, a majority of the
responding colleges practiced selective marketing strategies. The least employed
marketing strategy was in place at 63% of responding colleges. These findings, although
not part of the research questions for this study, have implications for the future of
selective marketing at North Carolina community colleges. If these practices are
maintained, the majority, and in some cases the vast majority, of community colleges in
North Carolina will be classified as selective within three years based on the criteria set
forth in this study.
Phillippe & Mullin (2011) found that community college enrollments increased
more than 20% in the three years prior to their nationwide study. They also found that
32% of responding colleges could not enroll every eligible student. The primary reason
given for inability to enroll students was lack of funding. According to the authors,
104
California has already capped enrollment at community colleges because of cuts in state
funding. Pennington, McGinty, and Williams (2002) found that enrollment at community
colleges increased in times of economic decline, yet community colleges have a finite
capacity for enrollment. Increased demand for education coupled with increased
selectivity at North Carolina community colleges has the potential to alter the access
mission despite current findings in this study.
Research Questions Two and Three
The findings for research questions two and three indicated that community
college students in North Carolina enrolled at statistically significant different rates of
demographic representation when compared to the population of the college service area.
While it was understood prior to the study that students enrolled in college at differing
rates than the population at large according to age, gender, and ethnicity (AACC, 2011),
comparisons in deviations of demographic representation were made in this study to aid
in analyzing the differences in representation across colleges with and without selective
recruiting practices. The results of data analysis for research questions two and three
placed quantitative values on these differences for community colleges in North Carolina.
This study provides practitioners and researchers with actual percentages of over
and underrepresentation for specific student demographic categories. Using this research
as a baseline, college administrators can now monitor student representation within the
scope of marketing and recruiting practices. Administrators have the capability to
recognize anomalous over or underrepresentations and react accordingly. This research
gives administrators a new context within which to consider enrollment related to open
access. Community college administrators can consider using marketing and recruiting
105
strategies to equivocate student representation with respect to inclusion rather than
exclusion.
Research Question Four
According to the results of data analysis for research question four, the
demographic composition of enrollment at selective and nonselective colleges is
surprisingly similar. While this is can be seen as a positive when considering the open
access mission of the community college, results of the analysis conveyed other issues. If
half of community colleges have mature marketing programs designed to selectively
recruit students, what are the outcomes of those efforts?
Selective colleges reported using a variety of marketing strategies to attract
specific demographic groups, yet the data indicated equal representation of demographic
groups at selective and nonselective colleges. Because this study looked at a static
measure of enrollment, trends in enrollment went unexamined. Selective colleges may be
affecting enrollment by correcting deficits in certain demographic groups.
This study used “more than three years” as a criterion to separate colleges into
selective and nonselective groups. Some marketing and recruiting practices may take
significantly more than three years to impact enrollment composition. In such cases, or in
the case of poorly implemented strategies, the effects on enrollment composition have yet
to emerge in the data.
Survey questions eight and eleven used the term “non-traditional” to describe
students. This terminology was retained from the instrument used in Vander Schee’s
(2009) study in an attempt to keep revisions to the survey instrument to a minimum. Non-
traditional students, that is, students not entering college directly after graduating from
106
high school, are more commonly understood to be a core group of students at the
community college (AACC, 2011). Usage of this specific term to describe students may
have affected participant response.
Community college enrollment data is gathered after the census date of a
semester. Colleges may, in fact, attract students within a specific targeted market. If those
students withdrew from class before the census date occurred, their presence would not
have been reflected in the demographic data for the college. It is possible colleges are
successfully targeting specific groups and that these groups are at a particularly high risk
for dropping out, thus effectively erasing any impact on the demographic composition of
enrollment.
Pennington, McGinty, and Williams (2002) connected increased enrollment with
economic declines. The data in this study were from 2010-2011, two years after the
economic crisis of 2008. Significant economic decline may have increased demand at
both selective and nonselective colleges. An overall increase in demand may have
masked the effects of recruiting efforts at selective colleges.
Research Question Five
Research question five examined varying levels of administrative oversight for
formal marketing efforts, each presumably consuming college resources. As college
budgets in North Carolina continue to tighten, are these administrative resources being
spent wisely? It is possible selective colleges have closed previous enrollment deficits, in
which case marketing strategies could be considered productive.
The open access mission may actually hinder the marketing and recruiting efforts
of selective colleges. Sophisticated enrollment management strategies designed to
107
directly manipulate student enrollment would violate the legislative mandate of the North
Carolina community college open access mission. Many community college marketing
and recruiting strategies are borrowed ad hoc from outside sources rather than being
coordinated from a central organizational point within the institution (Dann, 1982).
Vander Schee (2009) found that consistent marketing strategies with dedicated
organizational commitment are the most effective. Sevier (as cited in Kotler & Fox,
1995) presented an organizational model in which admissions, records, financial aid,
marketing, student services, and institutional research were all housed under one
executive administrator of enrollment management. This level of institutional
commitment is still rare at North Carolina community colleges.
Among selective colleges in this study, only two reported a Marketing and
Recruiting Division. Those colleges were eliminated from the analysis of research
question five because of statistically insufficient numbers. The lack of distinction
between the enrollment makeup of selective and nonselective colleges in this study
suggested that community colleges lack maturity in the execution of effective marketing
strategies at the institutional level. Dann (1982) reported a similar lack of cohesive
structure among colleges 30 years ago, indicating that community colleges have been
hesitant to fully embrace coordinated marketing efforts. Regardless of the goals or
effectiveness of selective marketing and recruiting practices, the open access mission at
this point appears to be intact, and student access to higher education is being maintained
at North Carolina community colleges.
108
Limitations of the Study
Limitations to this study included modifications to the survey instrument and
selection of the person completing the survey. The survey instrument was modified from
a version developed by Taber (1989) and used by Vander Schee (2009) to examine
enrollment management programs at small, private colleges. The survey instrument was
modified to remove references to enrollment management. Because community colleges
are mandated as open access institutions, the term enrollment management, as used in
other higher educational institutions, can have negative implications for the open access
mission of the community college. Therefore, the term enrollment management was
replaced with the term marketing or recruiting. Dann (1982) reported a misunderstanding
of marketing terms among community college officials. Confusion about these terms may
have affected participant responses in this study.
Other concerns about the survey instrument included usage of the term “non-
traditional” to describe students in survey questions eight and eleven. Non-traditional
students are more commonly encountered at the community college, where the average
student age is 28 (AACC, 2011). Using “more than three years” as a cutoff date for the
presence or absence of selective marketing and recruiting strategies may not have
allowed enough time for selective strategies to have an impact on the demographic
composition of enrollment.
Because fluctuations in community college enrollment are sensitive to economic
conditions (Pennington, McGinty, and Williams, 2002), the economic crisis that began in
2008 may have affected demands for community college education. This study did not
control for economic conditions that may have affected the demographics of enrollment
109
composition, such as government-sponsored worker retraining programs. Economic
conditions may have skewed the demographic composition of both selective and
nonselective colleges by inflating the overall demand for higher education during the
2010-2011 academic year.
This study used demographic enrollment data supplied by the NCCCS. Such data
are accumulated after the census date of any given class. Enrollment data on the first day
of class may be different for certain demographic groups than data for the same groups
after the census date. This discrepancy in enrollment data may have affected the research
outcomes for some demographic groups.
The chief administrative officer of student services at each community college
was asked to complete the survey in this study. Because of variations in organizational
structure among North Carolina community colleges, the person holding the position of
chief administrative officer of student services was not always readily identifiable. In
some cases, the chief administrative officer referred completion of the survey to another
employee. In some colleges, marketing and recruiting functions were not coordinated
among college employees, thereby contributing to the possibility of confusion
surrounding the terms used in the survey instrument. Lack of institutional coordination
may have contributed to confusion about whether or not and how long particular
strategies were in place. Any of these scenarios occurring during the completion of the
survey may have contributed to inaccuracies in reporting the presence or absence of
selective marketing and recruiting practices among survey respondents.
Community colleges in North Carolina are geographically dispersed. People in
different demographic categories are unevenly dispersed throughout the state. Certain
110
ethnic groups, for example, are more highly concentrated in specific geographic areas.
This may have affected the data for some demographic groups. Any effects on data may
have been amplified by the geographic location of the colleges within the selective and
nonselective groups, especially if a disproportionate number of geographically anomalous
colleges appeared in either the selective or nonselective group.
The inferential statistics used in this study compared deviations in enrollment
composition against a hypothesized value of zero. While it was understood that students,
particularly the very young and the very old, enrolled in college at rates that were not
indicative of the same groups’ representations in the overall population (AACC, 2011),
the hypothesized value of zero allowed for consistent comparisons across demographic
categories and between selective and nonselective colleges. As such, the data findings for
groups located in the extreme age ranges may have limited value.
Implications for Policy and Practice
Based on the findings in this study, it is possible that marketing and recruiting
strategies at community colleges in North Carolina are being practiced responsibly with
respect to the open access mission. With this caveat in mind, this study recommends
several strategies to improve the effectiveness of marketing and recruiting strategies
without sacrificing the community college commitment to the open access mission.
Community college administrators, board members, system office policy makers, and
state legislators can use the results of this study to make informed policy decisions about
selective marketing and recruiting practices that have the potential to affect the open
access priority of the community college.
111
Several specific recommendations for practice emerged from the research
conducted for this study. The recommendation of the highest priority is for increased
institutional commitment to effective marketing and recruiting strategies by the creation
of enrollment management divisions at each college. Variations in responses to the five
questions related to marketing and recruiting strategies were seen at both selective and
nonselective colleges. Also, depth of implementation of selective marketing and
recruiting practices varied among selective colleges. These variations, coupled with the
lack of variations in enrollment composition between selective and nonselective colleges,
suggest that marketing and recruiting practices lack coordination at North Carolina
community colleges.
Individual marketing strategies must be coordinated across various college areas
of responsibility to achieve maximum effectiveness. Student services, marketing,
institutional research, admissions, advising, and student engagement must act as a
coordinated unit if a unified institutional message is to be delivered effectively. Kotler
and Murphy (1981) emphasized the importance of coordinating the mission and vision of
the college at the strategic planning level. Divisionally coordinated enrollment
management functions at the community college will ensure that the strategic vision of
the college is maintained through institutional marketing efforts at all levels of contact
with the various stakeholders of the college. Coordinated marketing efforts also bring
awareness to the effects of such practices, thus allowing practitioners to conduct
marketing efforts responsibly with respect to the open access mission of the community
college.
112
Associated with a recommendation for the creation of an enrollment management
division at each college is the recommendation to create an office of enrollment
management at the North Carolina community college system office. Awareness of
enrollment management procedures at the system level allows for the conducting of
research system wide. System office administrators and researchers can consider
enrollment management holistically with respect to the community college system, and
guide research accordingly. Research results could then be used to make
recommendations for best practice to colleges within the system.
This study provides community college administrators with data about a group of
community colleges in North Carolina. Administrators can use the procedures outlined in
this study to gather data about one specific college. Administrators and researchers can
make the same comparisons used in this study to examine enrollment composition at
specific colleges. This data, in turn, can be used to inform enrollment management
decisions at the college.
Specific marketing and recruiting practices can be used to enhance enrollment and
retention at the community college without compromising the open access priority.
Goenner and Pauls’ (2006) description of predictive modeling suggested that community
colleges can use institutional research and marketing techniques to capture student data
and then use that data to influence enrollment decisions. The authors described using
basic information gathered from student inquiries to predict a propensity to enroll.
Community colleges should coordinate marketing efforts with institutional research
efforts to matriculate those students already familiar with college services. By completing
the enrollment process of students who have already been in contact with the college,
113
colleges can influence student enrollment behaviors through effective marketing and
recruiting without creating access barriers for students outside the sphere of marketing
influence.
Desjardins (2002) presented a method for using statistical modeling to predict
which students have a greater propensity to enroll after being admitted. By focusing
marketing and recruiting efforts on those students more likely to complete the enrollment
process after admission, colleges can streamline use of the marketing dollar. An added
benefit of this strategy is that it gives college marketing personnel another tool to manage
enrollment without creating access barriers for untargeted students. Effective
management of marketing and recruiting budgets benefits all college stakeholders.
Community colleges officials should view marketing and recruiting strategies as effective
ways to responsibly maximize return on invested budget dollars.
Effective marketing and recruiting strategies can be used to strengthen the
retention of at-risk students. Singleton’s (2009) method used data mining to examine
enrollment patterns based on course selection. By carefully monitoring enrollment for
specific patterns of course selection, college enrollment managers can target marketing
efforts toward at-risk students. Community college officials should broaden the
understanding of marketing to embrace all aspects of marketing, including how
marketing can be used to influence internal as well as external stakeholders. Efforts to
increase retention of currently-enrolled students are yet another way selective marketing
and recruiting practices can be used to support college enrollment without threatening the
open access mission.
114
Recommendations for Future Research
This study examined selective marketing and recruiting practices at North
Carolina community colleges in relation to the open access mission of the community
college. Because little research exists on selective marketing and recruiting practices at
the community college, this study was conducted to begin a dialogue on effective and
responsible selective marketing and recruiting practices that protect the open access
mission of the community college. To further the dialogue in this research area, several
recommendations for future study are suggested.
Many research questions about selective marketing and recruiting practices were
beyond the scope of this study, and many questions remain unanswered. This study
attempted to establish some parameters for future research. For example, prior to this
study no research existed to confirm the presence or absence of selective marketing and
recruiting practices at North Carolina community colleges. Now that this has been
established, it is recommended that further research be conducted to determine the
specific marketing and recruiting practices being conducted at selective colleges.
Results of this study revealed no obvious impact of selective marketing and
recruiting practices on enrollment at selective colleges. However, this study only
examined data for one academic year. Now that selective colleges have been identified, it
is recommended that research be conducted on enrollment trends over extended periods
of time at these colleges.
This study only examined the impact of selective marketing and recruiting
practices on enrollment composition. Marketing and recruiting practices can have an
115
effect on retention and persistence as well. It is recommended that research be conducted
to examine retention and persistence at selective and nonselective colleges.
Administrative structures dedicated to retention and persistence vary from college
to college, as confirmed by this study. This study recommended the creation of dedicated
enrollment management divisions at community colleges to maximize the return on
investments in marketing and recruiting efforts. Associated with administrative structures
and procedures are administrative costs. It is recommended that further research be
conducted to define the specific administrative structures dedicated to marketing and
recruiting practices in place at community colleges. Further research is needed to
determine the current budget allocations in both time and personnel for these structures at
community colleges.
Finally, the administrative structure of the North Carolina community college
system is unique. Because of the specific nature of the community college system in
North Carolina, this study was delimited to community colleges within the state. It is
recommended that similar research to this and other recommended studies be conducted
in other state community college systems.
Conclusion
An educated population is essential to the continued well-being of United States
citizens and the United States. The founders of the community college system recognized
the importance of access to higher education for all citizens. This study examined one
potential threat to the open access mission of the community college. Based on the results
of this study, it was concluded that selective marketing and recruiting practices are

116
having no significant impact on access to higher education in North Carolina community
colleges at this time.
117
REFERENCES
Absher, K., & Crawford, G. (1996). Marketing the community college starts with
understanding students’ perspectives. Community College Review, 23(4), 59-68.
Academic Search Premier database.
American Association of Community Colleges. (2000). The knowledge net: A report of
the New Expeditions Initiative. Retrieved from ERIC database. (ED439735)
American Association of Community Colleges. (2011). Fast facts. Washington, DC:
American Association of Community Colleges. Retrieved from
http://www.aacc.nche.edu/AboutCC/Pages/fastfacts.aspx
Antons, C. M., & Maltz, E. N. (2006). Expanding the role of institutional research at
small private universities: A case study in enrollment management using data
mining. New Directions for Institutional Research, (131), 69-81. Academic
Search Premier database.
Ary, D., Jacobs, L., Razavieh A., & Sorensen, C. (2006). Introduction to research in
education (3rd ed.). Belmont, CA: Thomson.
Astin, A. W. (1975). The myth of equal access in public higher education. Proceedings of
the Conference on Equality of Access in Postsecondary Education, Atlanta, GA
(32p). Retrieved from ERIC database. (ED119551)
Basmat, P., Lewis, L., & Greene, B. (2003). Remedial education at degree-granting
postsecondary institutions in fall 2000. Retrieved from ERIC database.
(ED482370)
Bellis, D. D. (2004). Public community colleges and technical schools: Most schools use
both credit and noncredit programs for workforce development. Report to the
118
Chairman, Committee on Health, Education, Labor, and Pensions, U.S. Senate,
GAO-05-04. Retrieved from ERIC database. (ED483230)
Biermann, C. A. (1996). The community college: Uniquely qualified to meet the
challenges of today’s science students. Community Review, 14, 45-51. Academic
Search Premier database.
Bissett, H. G. (1995). Selective admissions in community college nursing programs:
Ethical considerations. Community College Review, 22(4), 35-46. Academic
Search Premier database.
Bok, D. (2003). Universities in the marketplace: The commercialization of higher
education. Princeton, NJ: Princeton University Press.
Bonds, A. B. (1948). Some recommendations of the President’s Commission on Higher
Education. Science, 107(2781), 379-383. JSTOR database.
Braxton, J. M., McKinney, J. S., & Reynolds, P. J. (2006). Cataloging institutional efforts
to understand and reduce college student departure. New Directions for
Institutional Research, (130), 25-32. Academic Search Premier database.
Cavanaugh, S. (2003). State budgets push community colleges to rebuff students.
Education Week, 22(39), 1-2. Academic Search Premier database.
Cochran, T. R., & Hengstler, D. D. (1983). Assessing the image of a university. The
Journal of College Admissions, 27(4), 29-34.
Cohen, A., & Brawer, F. (2003). The American community college. San Francisco, CA:
Jossey-Bass.
Coomes, M. D. (2000). The historical roots of enrollment management. New Directions
for Student Services, (89), 5-18. Academic Search Premier database.
119
Cowley, W. H. (1948). Thoughts on the Truman Report. The Journal of Higher
Education, 19(6), 275-283, 329. Retrieved from
https://ohiostatepress.org/index.htm?journals/jhe/jhemain.htm
Creswell, J. W. (2008). Educational research: Planning, conducting, and evaluating
quantitative and qualitative research. Upper Saddle River, NJ: Prentice-Hall.
Dann, D. D. (1982). The status, scope, and structure of marketing in a selected group of
community colleges (Master’s thesis). University of Oregon, Eugene, OR.
Desjardins, S. L. (2002). An analytic strategy to assist institutional recruitment and
marketing efforts. Research in Higher Education, 43(5), 531-553. Academic
Search Complete database.
Desjardins, S. L., & Bell, A. (2006). Using economic concepts to inform enrollment
management. New Directions for Institutional Research, (132), 59-74. Academic
Search Premier database.
Dixon, R. (1995). What is enrollment management? New Directions for Student Services,
(71), 5-10.
Dougherty, K. J., Marshall, J., & Soonachan, A. (2006). Achieving the dream in Ohio:
State policies affecting access to, and success in, community colleges for students
of color and low-income students. New York, NY: Community College Research
Center, Teachers College, Columbia University. Retrieved from
http://www.achievingthedream.org/DATARESEARCH/PUBLICATIONSANDP
RESENTATION/default.tp#policybriefs
Dougherty, K. J., & Reid, M. (2006). Achieving the dream in Connecticut: State policies
affecting access to, and success in, community colleges for students of color and
120
low-income students. New York, NY: Community College Research Center,
Teachers College, Columbia University. Retrieved from
http://www.achievingthedream.org/DATARESEARCH/PUBLICATIONSANDP
RESENTATION/default.tp#policybriefs
Dougherty, K. J., & Reid, M. (2007). Fifty states of achieving the dream: State policies to
enhance access to and success in community colleges across the United States.
New York, NY: Community College Research Center, Teachers College,
Columbia University. Retrieved from
http://ccrc.tc.columbia.edu/Publication.asp?UID=504
Dougherty, K. J., Reid, M., & Nienhusser, H. K. (2006). State policies to achieve the
dream in five states: An audit of state policies to aid student access to and success
in community colleges in the first five achieving the dream states. New York, NY:
Community College Research Center, Teachers College, Columbia University.
Retrieved from http://ccrc.tc.columbia.edu/Publication.asp?uid=392
Edirisooriya, G. (2009). A market analysis of the latter half of the nineteenth-century
American higher education sector. History of Education, 38(1), 115-132.
Academic Search Complete database.
Goenner, C. F., & Pauls, K. (2006). A predictive model of inquiry to enrollment.
Research in Higher Education, 47(8), 935-956. Academic Search Complete
database.
Haines, R. W. (2012). Student recruitment practices: A survey yields some surprises.
Journal of College Admission, (214), 34-36. Retrieved from
121
http://www.nacacnet.org/research/PublicationsResources/Journal/Pages/Journal-
of-College-Admission.aspx
Hebel, S. (2004). No room in the class. Chronicle of Higher Education, 50(43), A19-
A22. Academic Search Premier database.
Holton, J. (1998). Whatever happened to the class of 1994? Frederick, MD: Frederick
Community College. Retrieved from ERIC database. (ED419568)
Hossler, D. (2004). How enrollment management has transformed – or ruined – higher
education. Chronicle of Higher Education, 50(34), B3-B5. Academic Search
Premier database.
Hossler, D., Bean, J. P., & Associates. (1990). The strategic management of college
enrollments. San Francisco, CA: Jossey-Bass.
Huddleston, T., Jr. (2000). Enrollment management. New Directions for Higher
Education, (111), 65-73. Academic Search Premier database.
Hugo, E. (2012). Recruitment practices change, but issues remain the same. Journal of
College Admission, (214), 34-36. Retrieved from
http://www.nacacnet.org/research/PublicationsResources/Journal/Pages/Journal-
of-College-Admission.aspx
Kasper, H. T. (2002). The changing role of the community college. Occupational
Outlook Quarterly, 46(4), 14-21. Retrieved from
http://www.bls.gov/opub/ooq/2002/winter/art02.pdf
Kealy, M. J., & Rockel, M. L. (1987). Student perceptions of college quality: The
influence of college recruitment policies. The Journal of Higher Education, 58(6),
122
683-703. Retrieved from
https://ohiostatepress.org/index.htm?journals/jhe/jhemain.htm
Kemerer, F. R., Baldridge, J. V., & Green, K. C. (1982). Strategies for effective
enrollment management. Washington, DC: American Association of State
Colleges and Universities.
Kozeracki, J,. & Brooks, J. B. (2006). Emerging institutional support for developmental
education. New Directions for Community Colleges, (136), 63-73. Academic
Search Complete database.
Kotler, P. (1972). A generic concept of marketing. Journal of Marketing, 36(2), 46-54.
JSTOR database.
Kotler, P. (1979). Strategies for introducing marketing into nonprofit organizations.
Journal of Marketing, 43(1), 37-44. Retrieved from
http://www.marketingpower.com/AboutAMA/Pages/AMA%20Publications/AM
A%20Journals/Journal%20of%20Marketing/JournalofMarketing.aspx
Kotler, P., & Fox, K. (1995). Strategic marketing for educational institutions. Englewood
Cliffs, NJ: Prentice-Hall.
Kotler, P., & Levy, S. (1969). Broadening the concept of marketing. Journal of
Marketing, 33(1), 10-15. Retrieved from
http://www.marketingpower.com/AboutAMA/Pages/AMA%20Publications/AM
A%20Journals/Journal%20of%20Marketing/JournalofMarketing.aspx
Kotler, P., & Murphy, P. E. (1981). Strategic planning for higher education. The Journal
of Higher Education, 52(5), 470-489. Retrieved from
https://ohiostatepress.org/index.htm?journals/jhe/jhemain.htm
123
Krejcie, R. V., & Morgan, D. W. (1970). Determining sample size for research activities.
Educational and Psychological Measurement, (30), 607-610. Retrieved from
people.usd.edu/~mbaron/edad810/Krejcie.pdf
Kurz, K., & Scannell, J. (2006). Enrollment management grows up. University Business,
9(5), 80-84. Academic Search Premier database.
Lapovsky, L. (1999). What you need to know about enrollment management. New
Directions for Higher Education, (107), 5-15. Academic Search Premier database.
Lewis, L., Farris, E., & Greene, B. (1996). Remedial Education at Higher Education
Institutions in Fall 1995, Statistical Analysis Report. Retrieved from ERIC
database. (ED402896)
Lewison, D. M., & Hawes, J. M. (2007). Student target marketing strategies for
universities. Journal of College Admission, (196), 14-19. Retrieved from
http://www.nacacnet.org/research/PublicationsResources/Journal/Pages/Journal-
of-College-Admission.aspx
Levitz, R. S., Noel, L., & Richter, B. J. (1999). Strategic moves for retention success.
New Directions for Higher Education, (108), 31-49. Academic Search Premier
database.
Litten, L. H. (1979). Market structure and institutional position in geographic market
segments. Research in Higher Education, 11(1), 59-83. JSTOR database.
Litten, L. H. (1980). Marketing higher education: Benefits and risks for the American
academic system. The Journal of Higher Education, 51(1), 40-59. Retrieved from
https://ohiostatepress.org/index.htm?journals/jhe/jhemain.htm
124
Lords, E. (2000). Community colleges turn to consultants to help them recruit and retain
students. Chronicle of Higher Education, 46(37), A65. Retrieved from ERIC
database. (EJ608276)
Luan, J., & Zhao, C. (2006). Practicing data mining for enrollment management and
beyond. New Directions for Institutional Research, (131), 117-122. Academic
Search Premier database.
Matthews, B. A., Baker, F., & Spillers, R. L. (2003). How true is true? Assessing socially
desirable response bias. Quality & Quantity, 37(3), 327-335. Retrieved from
Academic Search Complete database.
N.C. Gen. Stat. § 115D-1-97. (2012). From
http://www.ncleg.net/gascripts/Statutes/StatutesTOC.pl
Newman, C. (2002). The current state of marketing activity among higher education
institutions. Journal of Marketing for Higher Education, 12(1), 15-29.
North Carolina Community College System. (2008). A matter of facts. Retrieved from
http://www.nccommunitycolleges.edu/Publications/index.html
North Carolina Community College System. (2011). 2010-2011 Curriculum/Continuing
Education Information System: Curriculum and Continuing Education Student
Enrollment by College: Table 1 Annual. Retrieved from
http://www.nccommunitycolleges.edu/Statistical_Reports/index.html
O’Connor, L., & Lundstrom, K. (2011). The impact of social marketing strategies on the
information seeking behaviors of college students. Reference & User Services
Quarterly, 50(4), 351-365. Academic Search Complete database.
125
Pascarrella, E. T., & Terenzini, P. T. (1979). Interaction effects in Spady’s and Tinto’s
conceptual models of college dropout. Sociology of Education, 52(4), 197-210.
JSTOR database.
Pennington, K. L., McGinty, D., & Williams, M. R. (2002). Community college
enrollment as a function of economic indicators. Community College Journal of
Research and Practice, (26), 431-437. Academic Search Premier database.
Phillippe, K., & Mullin, C. M. (2011). Community college estimated growth: Fall 2010.
Washington, DC: American Association of Community Colleges. Retrieved from
ERIC database. (ED522918)
Reitano, J. (1999). Benjamin Franklin and the community college curriculum.
Community Review, 17, 65-70. Academic Search Premier database.
Rindfleish, J. M. (2003). Segment profiling: reducing strategic risk in higher education
management. Journal of Higher Education Policy and Management, 25(2), 147-
159. Academic Search Complete database.
Ritze, N. (2006). Enrollment management in the comprehensive community college: A
case study of Bronx Community College. New Directions for Community
Colleges, (136), 83-90. Academic Search Premier database.
Roman, M. A. (2007). Community college admission and student retention. Journal of
College Admission, (194), 18-23. Retrieved from ERIC database. (EJ783945)
Roueche, J. E., & Baker, G. A. (1987). Access & excellence: The open-door college.
Alexandria, VA: Community College Press. Retrieved from ERIC database.
(ED274391)
126
Russell, J. (1949). Basic conclusions and recommendations of the President’s
Commission on Higher Education. Journal of Educational Sociology, 22(8), 493-
508. JSTOR database.
Russo, J. A., & Coomes, M. D. (2000). Enrollment management, institutional resources,
and the private college. New Directions for Student Services, (89), 33-46.
Academic Search Premier database.
Sampson, J. P., Jr. (2012). A guide to quantitative and qualitative dissertation research.
Educational Psychology and Learning Systems Faculty Publications. Paper 1.
Retrieved from http://diginole.lib.fsu.edu/edpsy_faculty_publications/1/
Schuyler, G. (1999). A historical and contemporary view of the community college
curriculum. New Directions for Community Colleges, (108), 3-15. Academic
Search Premier database.
Shannon, H., & Smith, R. (2006). A case for the community college’s open access
mission. New Directions for Community Colleges, (136), 15-21. Academic Search
Complete database.
Shirazi, A., & French, C. (2005). Early college awareness as an enrollment management
strategy. Community College Journal of Research & Practice, 29(8), 649-650.
Academic Search Premier database.
Singleton, A. D. (2009). Data mining course choice sets and behaviours for target
marketing of higher education. Journal of Targeting, Measurement and Analysis
for Marketing, 17(3), 157-170. Retrieved from http://www.palgrave-
journals.com/jt/index.html
127
Spady, W. G. (1967). Educational mobility and access: Growth and paradoxes. The
American Journal of Sociology, 73(3), 273-286. Retrieved from
http://www.press.uchicago.edu/ucp/journals/journal/ajs.html.
Taber, R. A. (1989). Enrollment management programs at Liberal Arts II colleges
(Unpublished doctoral dissertation). University of Connecticut, Storrs, CT.
Thompson, K., Waterous, F., & Delaney, G. (2003). Colorado Community College
System analysis of fall 2001 applicants. Retrieved from ERIC database. (ED481
310)
Tinto, V. (1973). College proximity and rates of college attendance. American
Educational Research Journal, 10(4), 277-293. JSTOR database.
Tinto, V. (1975). Dropout from higher education: A theoretical synthesis of recent
research. Review of Educational Research, 45(1), 89-125. JSTOR database.
Tinto, V. (1987, November). The principles of effective retention. Paper presented at the
Fall Conference of the Maryland College Personnel Association, Largo, MD.
Retrieved from ERIC database. (ED301267)
Topor, R. (1983). Marketing higher education. Washington, DC: Council for
Advancement and Support of Education.
Townsend, B. K., & Wilson, K. B. (2006). The transfer mission: Tried and true, but
troubled? New Directions for Community Colleges, (136), 33-41. Academic
Search Complete database.
Tubin, D., & Klein, S. (2007). Designing a school website: Contents, structure, and
responsiveness. Planning and Change, 38(3&4), 191-207.
128
U. S. Census Bureau. (2010). 2010 Demographic Profile Data: Profile of General
Population and Housing Characteristics: 2010. Retrieved from
http://factfinder2.census.gov/faces/nav/jsf/pages/index.xhtml
Vaughan, G. B. (1982). The community college in America: A pocket history.
Washington, DC: American Association of Community and Junior Colleges.
Retrieved from ERIC database. (ED220140)
Vaughan, G. B. (2003). Redefining ‘open access.’ The Chronicle of Higher Education,
50(15), B24. Academic Search Complete database.
Vander Schee, B. A. (2009) Embracing enrollment management: A comprehensive
approach to college student marketing. Academy of Marketing Studies Journal,
13(1), 1-24. Retrieved from Business Source Complete database.
Walters, E. (2003). Becoming student centered via the one-stop shop initiative: A case
study of Onondaga Community College. Community College Review, 31(3), 40-
54. Academic Search Premier database.
Westcott, J. W., II. (2005). A vision of an open door: The establishment and expansion of
the North Carolina Community College System (Doctoral dissertation). Retrieved
from ProQuest Dissertations and Theses database. (UMI No. 3175892)
Wiebe, G. D. (1951). Merchandising commodities and citizenship on television. Public
Opinion Quarterly, 14, 679-691.
Zemsky, R., Shaman, S., & Berberich, M. A. (1980). Toward an understanding of
ollegiate enrollments: A first test of the market segment model. Journal of
Education Finance, 5(4), 355-374. Retrieved from
http://journalofeducationfinance.com/
129
Appendix A
Survey Instrument
PART I Please read and select the appropriate response to the following statement: INFORMED CONSENT You are being invited to participate in a research study about the student recruiting practices of North Carolina community colleges. David Brian Morris, a doctoral student at in Higher Educational Leadership at Western Carolina University is conducting this research. The objective is to examine student recruiting practices at North Carolina community colleges. A survey is being delivered to the chief administrative officer of student services at each community college in North Carolina, except the one where I am employed. Your participation involves the completion of this survey. You were selected as a possible participant in this study because of your unique knowledge of student recruiting practices at your community college. There are twenty questions in addition to basic identification information about you and your college. Completing the survey should take less than twenty minutes. You have no further obligations beyond the completion of this survey. There are no known risks if you decide to participate in this research study, nor are there any costs for participating in the study. The information you provide will help me understand basic information about North Carolina community college recruiting practices. The information collected may not benefit you directly, but what I learn from this study should provide general benefits to students, administrators, policy makers, and researchers. This survey is confidential. Any information obtained in connection with this study and that can be identified with you will remain confidential and will be disclosed only with your permission or as required by law. No personally identifying information will appear in the final report. No specific college names will appear in the final report. All electronic information will be password protected and kept in a locked, secure area. All hard copies of information will be kept in a locked, secure area. Information that can identify you individually will not be released to anyone outside the study. I will use the data collected in my dissertation and other potential publications. Any information used for publication will not identify you or your college. Your participation in this study is voluntary. If you choose to participate, please select the appropriate checkbox following this informed consent statement. I am the only person with access to this information.
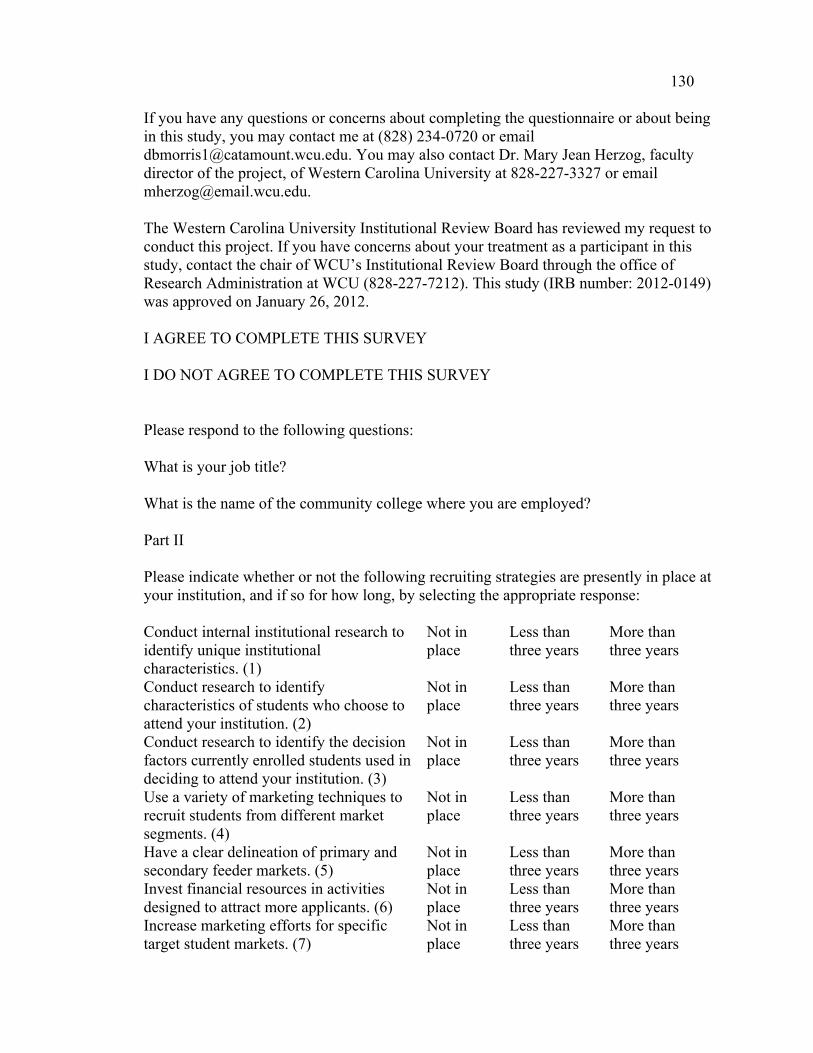
130
If you have any questions or concerns about completing the questionnaire or about being in this study, you may contact me at (828) 234-0720 or email [email protected]. You may also contact Dr. Mary Jean Herzog, faculty director of the project, of Western Carolina University at 828-227-3327 or email [email protected]. The Western Carolina University Institutional Review Board has reviewed my request to conduct this project. If you have concerns about your treatment as a participant in this study, contact the chair of WCU’s Institutional Review Board through the office of Research Administration at WCU (828-227-7212). This study (IRB number: 2012-0149) was approved on January 26, 2012. I AGREE TO COMPLETE THIS SURVEY I DO NOT AGREE TO COMPLETE THIS SURVEY Please respond to the following questions: What is your job title? What is the name of the community college where you are employed? Part II Please indicate whether or not the following recruiting strategies are presently in place at your institution, and if so for how long, by selecting the appropriate response: Conduct internal institutional research to identify unique institutional characteristics. (1)
Not in place
Less than three years
More than three years
Conduct research to identify characteristics of students who choose to attend your institution. (2)
Not in place
Less than three years
More than three years
Conduct research to identify the decision factors currently enrolled students used in deciding to attend your institution. (3)
Not in place
Less than three years
More than three years
Use a variety of marketing techniques to recruit students from different market segments. (4)
Not in place
Less than three years
More than three years
Have a clear delineation of primary and secondary feeder markets. (5)
Not in place
Less than three years
More than three years
Invest financial resources in activities designed to attract more applicants. (6)
Not in place
Less than three years
More than three years
Increase marketing efforts for specific target student markets. (7)
Not in place
Less than three years
More than three years
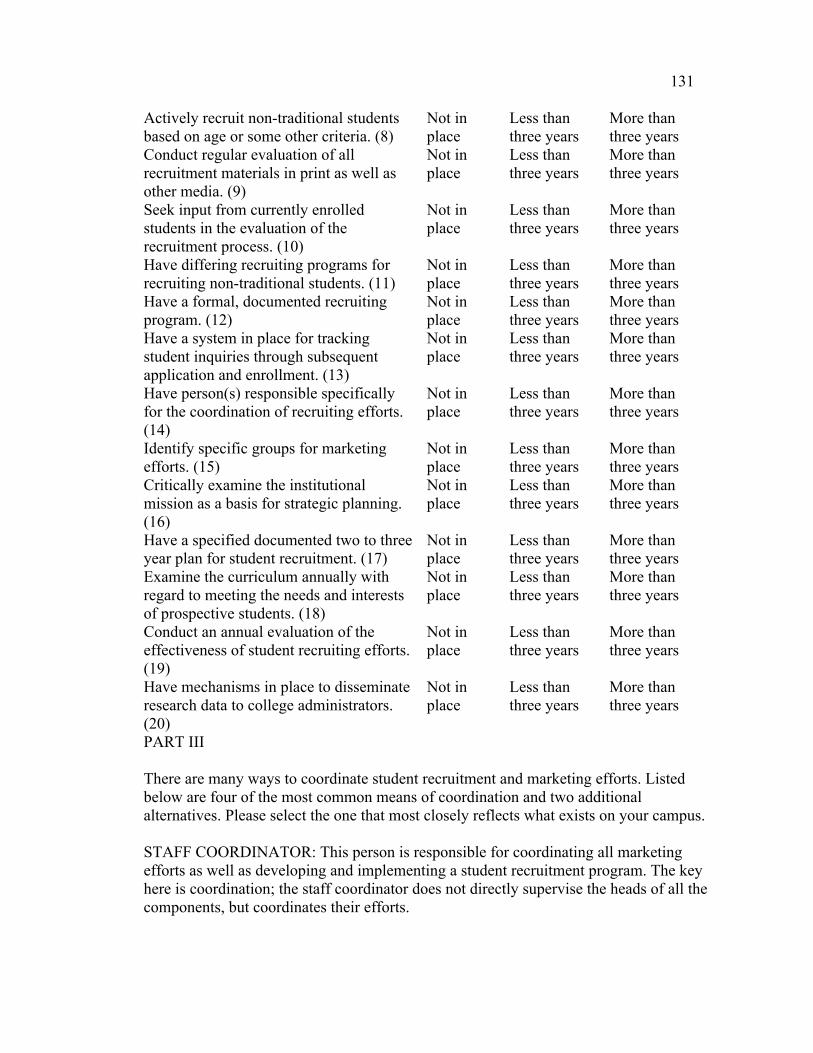
131
Actively recruit non-traditional students based on age or some other criteria. (8)
Not in place
Less than three years
More than three years
Conduct regular evaluation of all recruitment materials in print as well as other media. (9)
Not in place
Less than three years
More than three years
Seek input from currently enrolled students in the evaluation of the recruitment process. (10)
Not in place
Less than three years
More than three years
Have differing recruiting programs for recruiting non-traditional students. (11)
Not in place
Less than three years
More than three years
Have a formal, documented recruiting program. (12)
Not in place
Less than three years
More than three years
Have a system in place for tracking student inquiries through subsequent application and enrollment. (13)
Not in place
Less than three years
More than three years
Have person(s) responsible specifically for the coordination of recruiting efforts. (14)
Not in place
Less than three years
More than three years
Identify specific groups for marketing efforts. (15)
Not in place
Less than three years
More than three years
Critically examine the institutional mission as a basis for strategic planning. (16)
Not in place
Less than three years
More than three years
Have a specified documented two to three year plan for student recruitment. (17)
Not in place
Less than three years
More than three years
Examine the curriculum annually with regard to meeting the needs and interests of prospective students. (18)
Not in place
Less than three years
More than three years
Conduct an annual evaluation of the effectiveness of student recruiting efforts. (19)
Not in place
Less than three years
More than three years
Have mechanisms in place to disseminate research data to college administrators. (20)
Not in place
Less than three years
More than three years
PART III There are many ways to coordinate student recruitment and marketing efforts. Listed below are four of the most common means of coordination and two additional alternatives. Please select the one that most closely reflects what exists on your campus. STAFF COORDINATOR: This person is responsible for coordinating all marketing efforts as well as developing and implementing a student recruitment program. The key here is coordination; the staff coordinator does not directly supervise the heads of all the components, but coordinates their efforts.
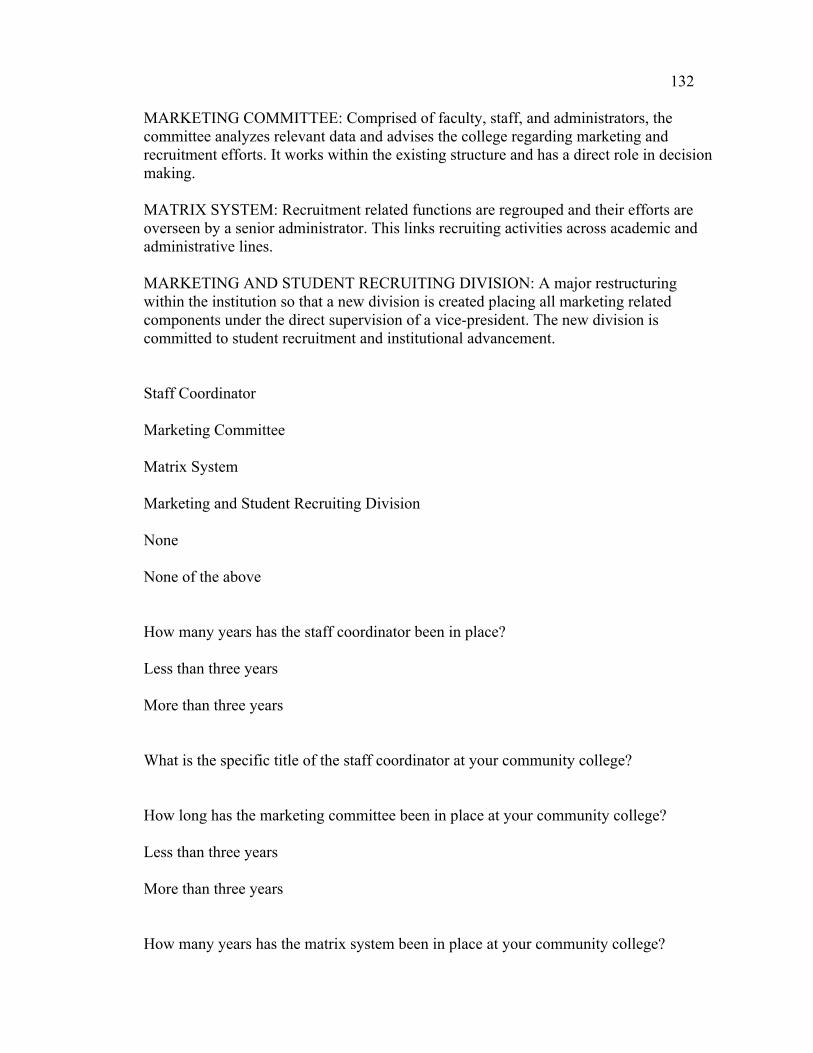
132
MARKETING COMMITTEE: Comprised of faculty, staff, and administrators, the committee analyzes relevant data and advises the college regarding marketing and recruitment efforts. It works within the existing structure and has a direct role in decision making. MATRIX SYSTEM: Recruitment related functions are regrouped and their efforts are overseen by a senior administrator. This links recruiting activities across academic and administrative lines. MARKETING AND STUDENT RECRUITING DIVISION: A major restructuring within the institution so that a new division is created placing all marketing related components under the direct supervision of a vice-president. The new division is committed to student recruitment and institutional advancement. Staff Coordinator Marketing Committee Matrix System Marketing and Student Recruiting Division None None of the above How many years has the staff coordinator been in place? Less than three years More than three years What is the specific title of the staff coordinator at your community college? How long has the marketing committee been in place at your community college? Less than three years More than three years How many years has the matrix system been in place at your community college?
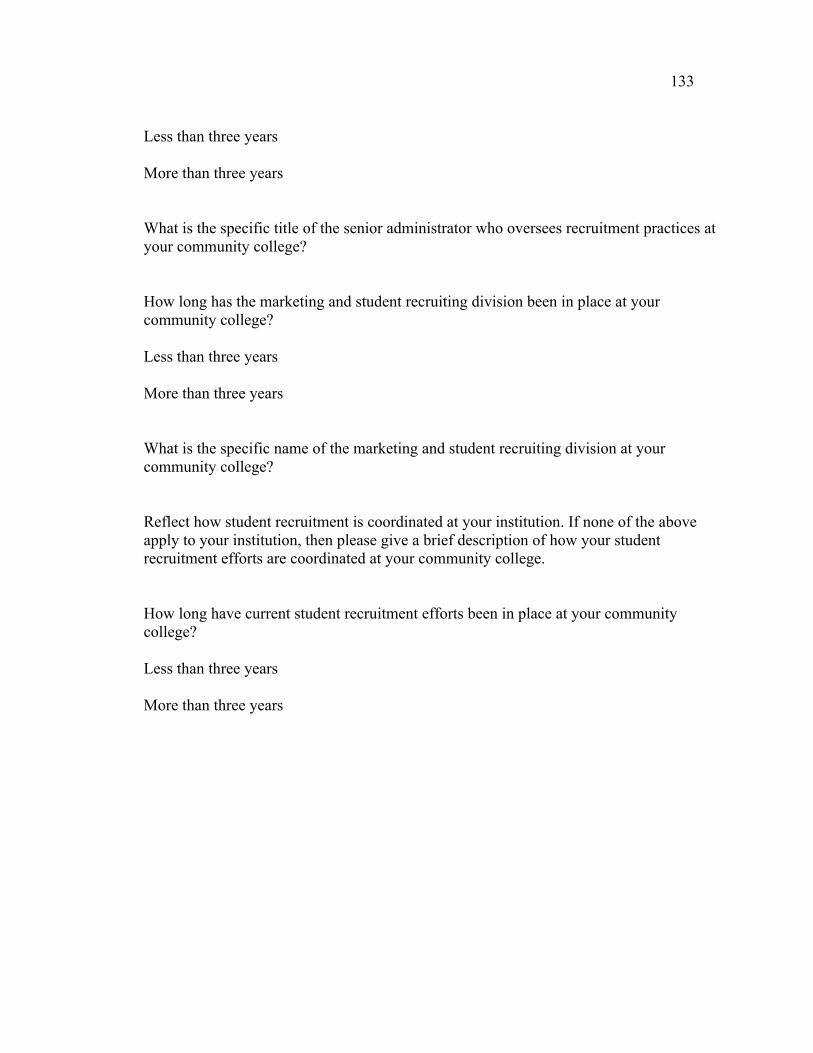
133
Less than three years More than three years What is the specific title of the senior administrator who oversees recruitment practices at your community college? How long has the marketing and student recruiting division been in place at your community college? Less than three years More than three years What is the specific name of the marketing and student recruiting division at your community college? Reflect how student recruitment is coordinated at your institution. If none of the above apply to your institution, then please give a brief description of how your student recruitment efforts are coordinated at your community college. How long have current student recruitment efforts been in place at your community college? Less than three years More than three years

134
Appendix B
Initial Mail Contact
Dear (Participant),
Thank you for taking a moment to read this letter. I am a doctoral student in the Higher Educational Leadership program at Western Carolina University with a concentration in community college leadership. For my dissertation, I am conducting research on student recruiting practices in North Carolina community colleges.
I am writing to ask you to complete a survey on such practices. I hope to gather sufficient data to examine how community college recruitment practices work.
You will receive the electronic survey via your college email within two weeks of receiving this letter.
If you choose to participate, your responses will remain strictly confidential. All electronic data will remain password protected and will be stored in a locked, secure area. All hard copies of data will remain in a locked, secure area. No personally identifying data or school names will appear in the final report.
I hope you will take a few minutes to complete this survey. Your participation is voluntary and there is no penalty if you do not participate. Without the help of people like you, research on community colleges could not be conducted.
If you have any questions or concerns about completing the survey or about participating in this study, you may contact me at (828) 327-7000 or at [email protected] . You may also contact Dr. Mary Jean Herzog, faculty director of the project, of Western Carolina University at 828-227-3327 or email [email protected]. If you have any questions about your rights as a research participant, you may contact the chair of WCU’s Institutional Review Board through the office of Research Administration at WCU (828-227-7212). This study (IRB number: 2012-0149) was approved on January 26, 2012. Sincerely, D. B. (Brian) Morris Doctoral Student Western Carolina University
135
Appendix C
Initial Email Contact
Hi, I recently sent you a cover letter explaining research I am conducting as a doctoral student in Higher Educational Leadership at Western Carolina University. My research is on student recruiting practices at North Carolina community colleges. You were selected because of your expertise in the area of student recruiting at your community college. If you feel someone at your college is more qualified to complete the survey, please forward the survey to the appropriate person. Completing the survey should take less than twenty minutes. You can access the survey by clicking the following link: https://wcu.qualtrics.com/SE/?SID=SV_dpxYlpxjvD2bazG Thank you for participating in this research. Please feel free to contact me at 828-234-0720 with any questions, comments, or concerns. Sincerely, D. B. (Brian) Morris Doctoral Student Western Carolina University
136
Appendix D
First Email Follow Up
Hi,
As a doctoral student at Western Carolina University, I am conducting research on student recruiting practices at your school. Recently, I sent you an email containing a link to a survey seeking information about recruiting practices at your school. It should take twenty minutes or less to complete the survey. You were selected because of your expertise in the area of student recruiting at your community college. If you feel someone at your college is more qualified to complete the survey, please forward the survey to the appropriate person. If you have already completed the survey, please accept my sincere thanks. If you have yet to complete the survey, please do so at your earliest convenience. It is extremely important that your college be included in this study. If by some chance you did not receive the survey or if it has been deleted, you may access the survey at the following link: https://wcu.qualtrics.com/SE/?SID=SV_dpxYlpxjvD2bazG Please feel free to contact me at 828-234-0720 if you have any questions, comments, or concerns. Thank you for taking the time to complete this survey. Sincerely, D. B. (Brian) Morris Doctoral Student Western Carolina University
137
Appendix E
Final Email Follow Up
Hi,
A few weeks ago I sent you a survey seeking information about student recruiting practices at your college. As of today I have not received your completed survey. I hope that this study will help provide the best information possible to policymakers and inform decisions about student recruiting at the community college. The usefulness of this study depends on how accurately I am able to describe student recruiting practices at community colleges in North Carolina. This study is being conducted at each community college in North Carolina. You were selected to complete the survey because of your expertise in the area of student recruiting. If someone else at your college is more qualified to complete this survey, please feel free to forward the survey to the appropriate person. In case you did not receive the survey I emailed to you earlier, or if it has been deleted, the link follows: https://wcu.qualtrics.com/SE/?SID=SV_dpxYlpxjvD2bazG Please complete the survey at your earliest convenience. If you have already completed the survey, thank you for your participation. Your contribution to the success of this study is greatly appreciated. Sincerely, D. B. (Brian) Morris Doctoral Student Western Carolina University