Embed Size (px)
Citation preview
Community identity and skill mismatch: A
study on Indian labour market∗
Anirban Mukherjee †
and
Sourabh Bikas Paul ‡
September, 2012
Abstract
The current paper characterizes skill mismatch in Indian labor market
and finds the role of community identity in explaining the existence of
skill mismatch measured by the difference between a laborer’s education
level and the educational requirement of a job (s)he is in. Such mismatch
leads to inefficient allocation of resources asking for policy reorientation
in both the education and labor sectors. This research agenda is inspired
by the fact that network plays an important role in getting a job or be-
ing discriminated in the job market. Therefore if a community identity
acts as an adverse (favorable) signal, people from that community should
acquire more (less) education than the educational requirement for a job
to compensate for the signal coming out of their community identities.
This may lead to over or under education depending whether the com-
munity identity transmits an adverse or favorable signal. We find that
both Muslim and SC/ST identity have positive significant impact on the
probability of over education. We also find that in case of under education
∗This is a preliminary draft.†Indian Institute of Technology, Kanpur. Email:[email protected]‡National Council of Applied Economic Research, New Delhi. Email: [email protected]
1
Muslim identity is positive significant while SC/ST is not. We calculate
the extent of over and under education for different industries and the
wage effect of over education which is found to be positive.
1 Introduction
Skill mismatch as reflected in over or under education implies inefficient alloca-
tion of resources as the resources spent on training the worker was not required
in the first place for performing her duty in the first place. This amounts to
wastage of social resource either in form of mistargeted subsidy in a highly sub-
sidized education system or irrational investment decision in a privately funded
one. The current paper looks at the wage effect of skill mismatch in India and
tries to identify the possible reasons behind it. Specifically, it enquires the role
of community network in explaining skill mismatch in India.
The current paper is related to the literature of return to education in gen-
eral and mismatch between education and occupation in particular. There is
already a large literature documenting existence of over education in different
labor markets (Rumberger, 1987; Sicherman, 1991; Groot, 1996; Verdugo and
Verdugo, 1989). Duncan and Hoffman (1981) found using Panel Study of Income
Dynamics data that nearly 40 percent of US workforce and about 50 percent of
black male have more education than their job requires. However, the resources
spent on acquiring education are not deadweight loss as the individual return to
a year of surplus education is positive and significant. However, return to sur-
plus education is less than the return to required education. Similar result was
found by Rumberger (1987), Tsang et al. (1991), Cohn and Khan (1995). Hersch
(1991) sheds light on the problem of skill mismatch from a different angle. Us-
ing primary data collected in Oregon, 1986 the author found that overqualified
workers are less satisfied with their jobs and therefore more likely to quit. There
are number of studies that focus on the effect of skill mismatch for different
occupations.
2
The decision to acquire more education than what is required for a current job
is explained in the current literature by other human capital components such
as experience or by the mobility pattern of the workers (Sicherman and Galor,
1990). In the first case more years spent in schools acts as a substitute for work
experience. According to the second explanation acquiring more education is a
forward looking decision by the employee to move up the skill ladder in the job
market and her current employment in a low skilled profession is just a transitory
phase. Sicherman (1991) found that in the context of American labor market
both these factors work. The decision to acquire more education than required
by the job profile can also be explained by signaling model in a labor market
where the employers use educational qualification as a screening device (Spence,
1973). Emphasizing the role of mobility Buchel and van Ham (2003) explained
over education using regional restrictions on labour mobility.
Though there is vast literature on matching and skill misallocation in devel-
oped countries, there is no study on India to the best of our knowledge. Our
study provides an important insight for designing labour and education poli-
cies geared towards avieving efficient allocation of skills. The question of skill
mismatch in the Indian labor market becomes even more important after the
economic reforms in 1991 which led India to the path of skill-biased growth.
Changes in the Indian labour market over recent decades has raised concern
over misallocation of skill. Since opening up of the economy in 1991 new job
opportunities have led to supply side response as well. Like all other developing
countries Indias share of industrial and service sector output in GDP grew over
time. The share of services in GDP (at factor cost, current price) increased
rapidly from around 31 percent in 1950-51 to 55 percent in 2009-10. However,
employment share is still disproportionally high in traditional sector. Between
1993-94 and 2004-05 the share of employment in traditional sector decreased
sharply and the consequent rise in share of employment in secondary and ter-
tiary sector was almost equally divided. The share of employment in services
was 21.2 percent in 1993-94 and that increased to 24.8 percent in 2004-05. It is
evident that service sectors output growth rate is mainly driven by some selected
3
skill intensive sectors. Employment share in formal services is again dwarfed by
stubbornly high employment share in informal sector. Overall, informal sector
absorbs around 86 percent of total 457 million workers (2004-05). Between 1999-
00 and 2004-05, employment in informal sector grew at almost equal rate of 2.9
percent with formal sector. Skill based technological change is evident in 1990s
(Berman et al. (2010) ). However, the timing of the skill based technological
change arrived late in India compared to other emerging economies. While most
high and middle income countries experienced skill-based technological change
in the 1980s, India did show this symptom only after opening up of the economy
in 1990s. Berman et al. (2010) confirm that while 1980s were a period of falling
skill demand, skill demand increased in 1990s.
On the supply side, the proportion of high skilled workers increased substan-
tially between 1983 and 2004-05. In 1983 the proportion of illiterate workers in
working age population (not enrolled in any educational institution) was around
50.6 percent and proportion of graduate workers was around 3.75 percent. The
corresponding figures are 29.6 and 8.4 in 2004-05. There is remarkable growth in
the share of secondary educated workers (from 9 percent in 1983 to 19 percent
in 2004-05). The moderate growth of secondary and above workers and workers
with technical education in recent decades has increased the pool of skilled work-
ers. According to World Bank (cite), India has the third largest higher education
system after China and the United States. Since independence, the number of
universities has increased by 18 times, the number of colleges by 35 times and
gross enrollment ratio more than 10 times. At the early stage of Indian higher
education system, the enrollment drew mostly from elite class. Over time, the
system became more mass-based and democratic. However, as expected, there
is a big gap in rural-urban divide in higher education.
In this context this paper performs three tasks: characterize sector wise skill
mismatch in India, finds the factors behind the decisions to acquire more or
less skill in India and finds the wage effect of under and over education. More
importantly, we invoke the network perspective in the question which has its
unique place in India’s perspective. The role of network in the both the edu-
4
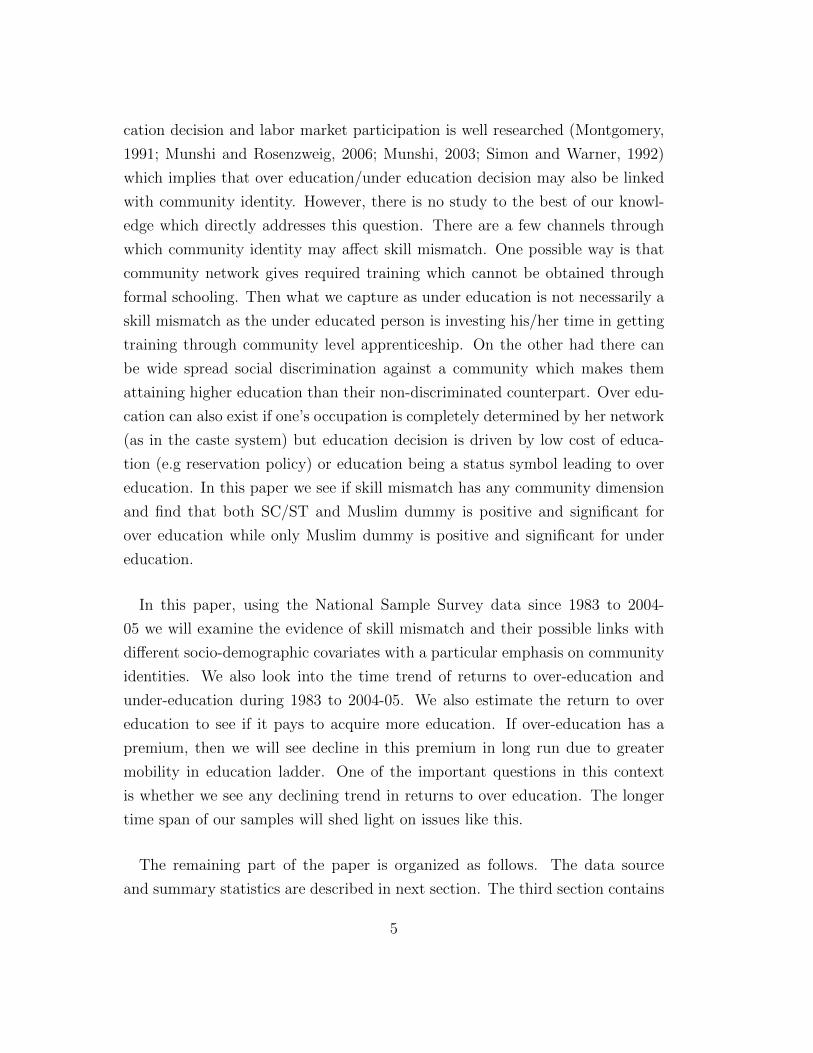
cation decision and labor market participation is well researched (Montgomery,
1991; Munshi and Rosenzweig, 2006; Munshi, 2003; Simon and Warner, 1992)
which implies that over education/under education decision may also be linked
with community identity. However, there is no study to the best of our knowl-
edge which directly addresses this question. There are a few channels through
which community identity may affect skill mismatch. One possible way is that
community network gives required training which cannot be obtained through
formal schooling. Then what we capture as under education is not necessarily a
skill mismatch as the under educated person is investing his/her time in getting
training through community level apprenticeship. On the other had there can
be wide spread social discrimination against a community which makes them
attaining higher education than their non-discriminated counterpart. Over edu-
cation can also exist if one’s occupation is completely determined by her network
(as in the caste system) but education decision is driven by low cost of educa-
tion (e.g reservation policy) or education being a status symbol leading to over
education. In this paper we see if skill mismatch has any community dimension
and find that both SC/ST and Muslim dummy is positive and significant for
over education while only Muslim dummy is positive and significant for under
education.
In this paper, using the National Sample Survey data since 1983 to 2004-
05 we will examine the evidence of skill mismatch and their possible links with
different socio-demographic covariates with a particular emphasis on community
identities. We also look into the time trend of returns to over-education and
under-education during 1983 to 2004-05. We also estimate the return to over
education to see if it pays to acquire more education. If over-education has a
premium, then we will see decline in this premium in long run due to greater
mobility in education ladder. One of the important questions in this context
is whether we see any declining trend in returns to over education. The longer
time span of our samples will shed light on issues like this.
The remaining part of the paper is organized as follows. The data source
and summary statistics are described in next section. The third section contains
5
methodology of measuring skill mismatch. The results are presented in the fourth
section followed by a section on general equilibrium effects of skill misallocation.
The last section concludes.
2 Data
National Sample Survey Organisation conducts large surveys on employment
and unemployment situation in India. Though these surveys are frequent in
recent times (almost every year), empirical analysis is usually drawn from quin-
quennial ‘thick rounds. We use round 38th (1983), 43rd (1987-88), 50th (1993-
94), 55th (1999-00), and 61st (2004-04). Therefore, our sample consists of mul-
tiple cross sections spanning a period of 20 years. Since our sample period starts
in the early 1980s, we will be able to capture the trend in our results before
and after the liberalisation process initiated in 1991. The surveys collect socio-
economic and demographic information of households and individual members
across all states except some remote and inaccessible pockets. This is a stratified
multi-stage sample and therefore, all units are assigned with adjusted sampling
weights. In our analysis, all results are reported using proper sample weights. It
should be noted that sampling strategy and questionnaire is very similar across
rounds therefore, the complications regarding the comparability issues do not
arise. The surveys collect information on individual occupation, education (dis-
aggregated categories), industry of employment, age, sex, marital status, status
of employment, etc. It also collects household level characteristics like monthly
consumption spending, social group, religion, household size, etc. On an av-
erage, there are 200 thousands individuals in working age population (16-65),
not enrolled in any educational institution, and with education and occupation
information. There are fewer samples with complete information on wages. A
larger portion of working age population report self-employed therefore, no wage
information is available. It should be noted that wage or regular salaried em-
ployment is much lower in India. We use both regular or salaried wage earners
and other types of wage earners in our analysis. We conduct our analysis based
on two different samples: overall sample and wage sample. Wage sample is a
6
subset of overall sample. Wage sample is about 35 percent of overall sample
except the round 1987-88. This is due huge missing wage data for this particular
sample. It is reported in the literature that 1987-88 wage sample is problematic
therefore; we take special caution while explaining any time trend in our result.
All wage analysis is based on wage sample, whereas all other results are based
on overall sample. We will specify sample size and sample selection whenever
necessary.
Table A1 reports sample summary statistics. Our sample consists of entire
working age population, not enrolled in any educational institution, having in-
formation on their educational qualification and occupation. Since National
Sample Surveys (NSS) do not collect data on years of schooling, we match each
education level to corresponding years based on Indian education system. We
also classify education levels in six uniform education categories: edu 1 (illit-
erate), edu 2 (below primary), edu 3 (primary), edu 4 (middle school), edu
5 (secondary), and edu 6 (graduation and above). On average, our sample is
around 36 years old and around 78 percent of them are married. About 16
percent of our sample is working at a regular or salaried job. The sample con-
sists of more than 70 percent male. It is also clear than rural population has
greater representation (around 78 percent). The lower castes groups are around
29 percent of the sample. It should be noted that according to population cen-
sus, scheduled castes and scheduled tribes consist of around 24 percent of total
population. Therefore, our sample has higher representation of backward castes
groups (OBC excluded from our definition of SCST). Muslims consist of around
nine percent of our sample whereas the corresponding figure for entire popula-
tion is 13.4 percent according to 2001 census. The trends of these numbers are
flat over the sample period. Most important trend we observe from the table is
educational attainment. The average years of education was 2.8 in 1983 and that
increased to 4.6 in 2004-05 registering around 65 percent growth. The average
household size also decreased over the sample period. All nominal figures in our
sample is deflated using poverty line of rural Maharashtra.
7
2.1 The supply side
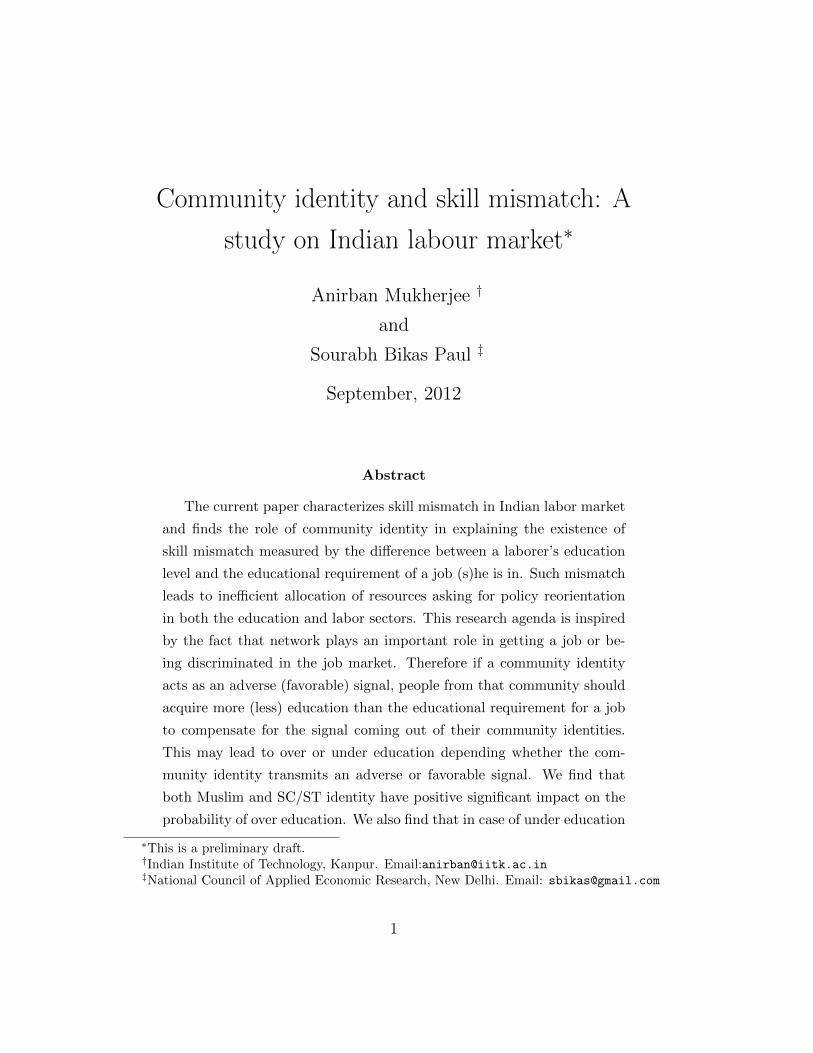
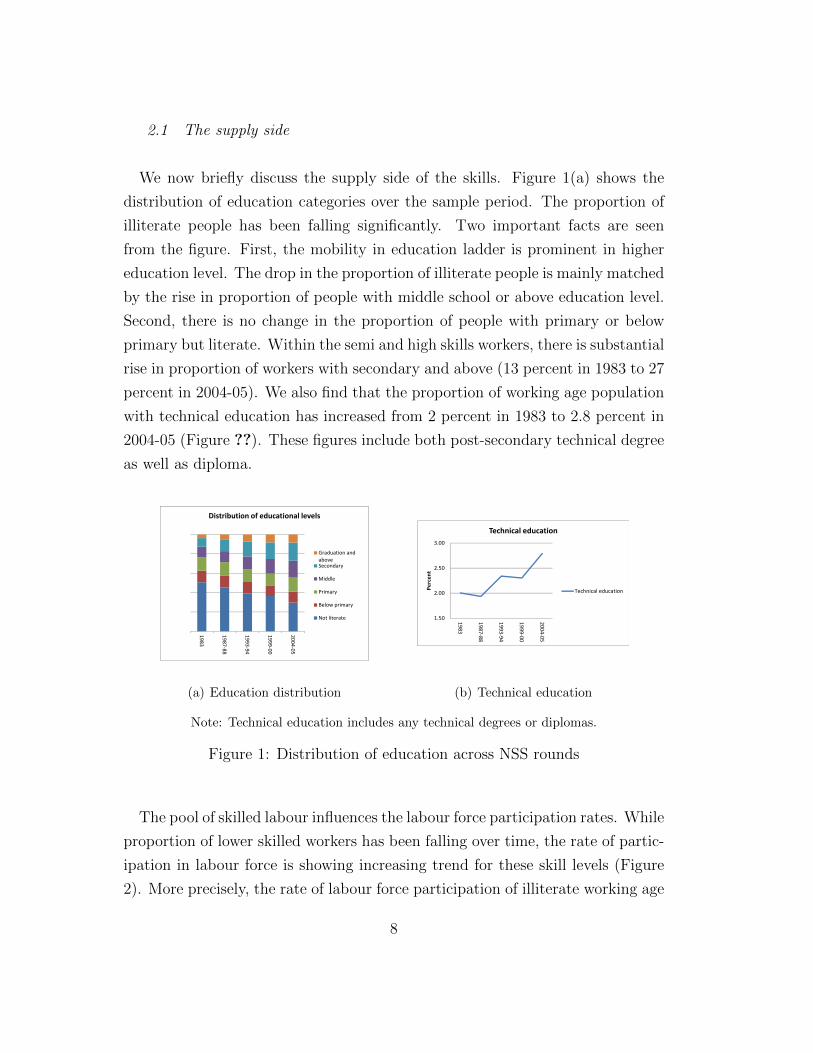
We now briefly discuss the supply side of the skills. Figure 1(a) shows the
distribution of education categories over the sample period. The proportion of
illiterate people has been falling significantly. Two important facts are seen
from the figure. First, the mobility in education ladder is prominent in higher
education level. The drop in the proportion of illiterate people is mainly matched
by the rise in proportion of people with middle school or above education level.
Second, there is no change in the proportion of people with primary or below
primary but literate. Within the semi and high skills workers, there is substantial
rise in proportion of workers with secondary and above (13 percent in 1983 to 27
percent in 2004-05). We also find that the proportion of working age population
with technical education has increased from 2 percent in 1983 to 2.8 percent in
2004-05 (Figure ??). These figures include both post-secondary technical degree
as well as diploma.
19
83
19
87
-88
19
93
-94
19
99
-00
20
04
-05
Distribution of educational levels
Graduation and
aboveSecondary
Middle
Primary
Below primary
Not literate
(a) Education distribution
1.50
2.00
2.50
3.00
19
83
19
87
-88
19
93
-94
19
99
-00
20
04
-05
Pe
rce
nt
Technical education
Technical education
(b) Technical education
Note: Technical education includes any technical degrees or diplomas.
Figure 1: Distribution of education across NSS rounds
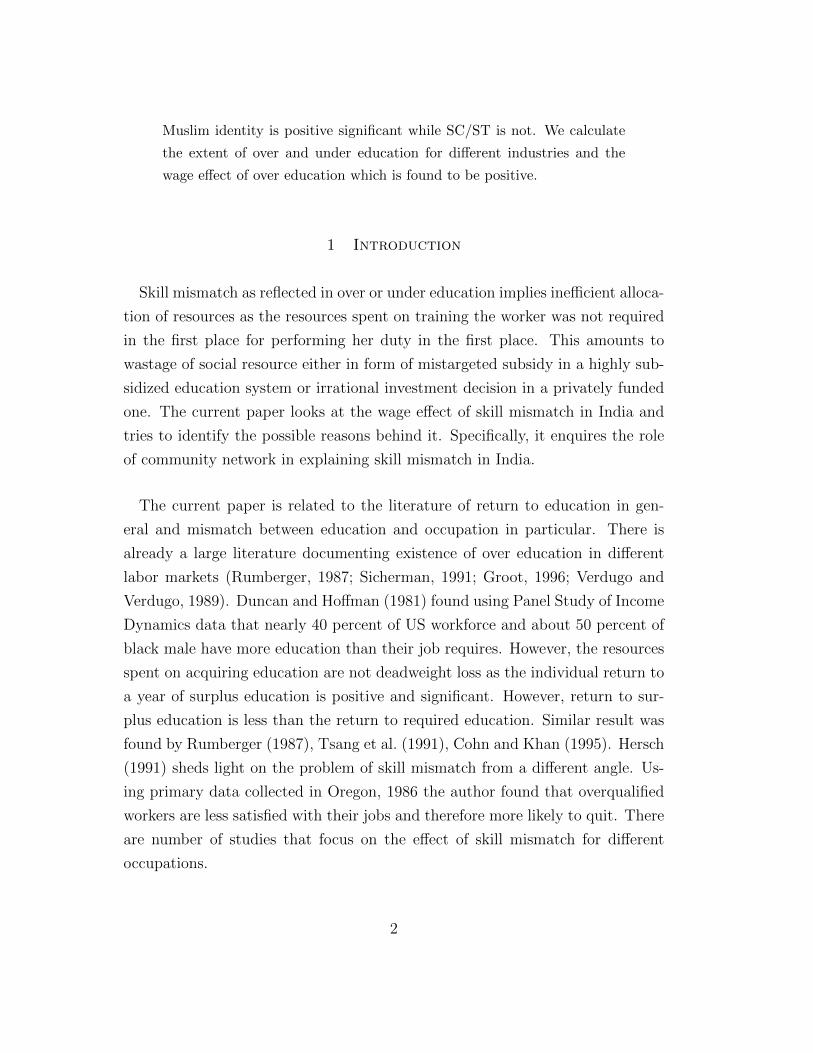
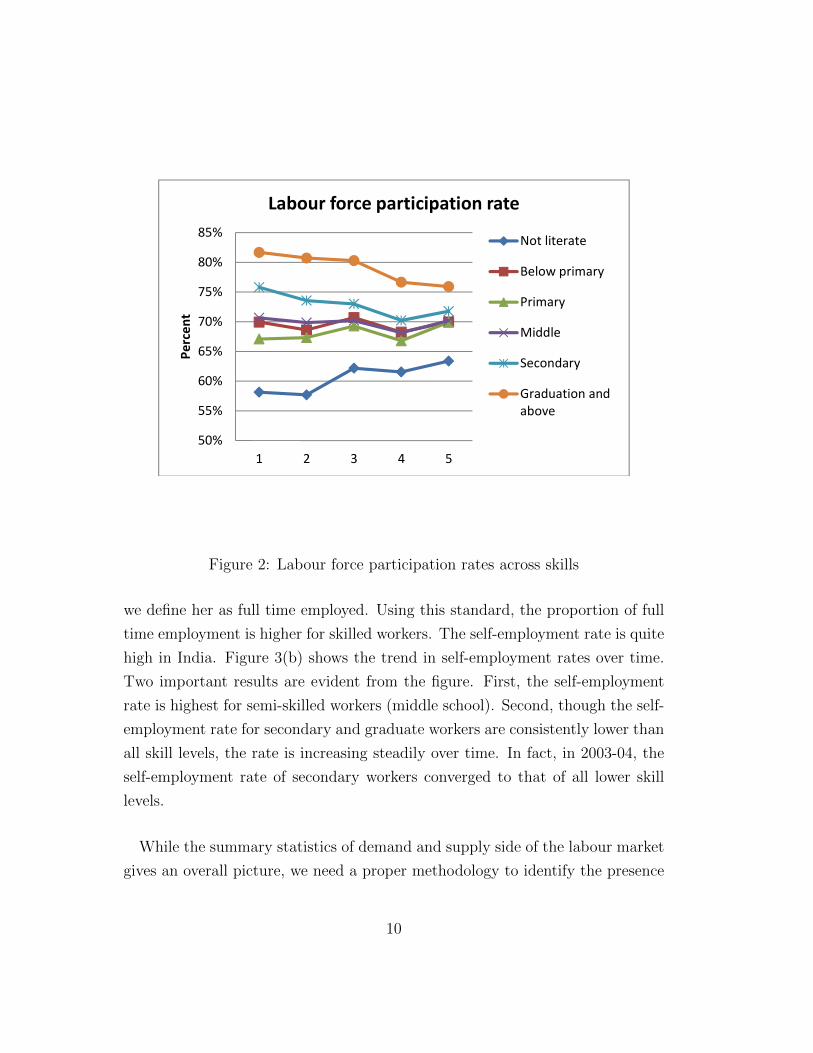
The pool of skilled labour influences the labour force participation rates. While
proportion of lower skilled workers has been falling over time, the rate of partic-
ipation in labour force is showing increasing trend for these skill levels (Figure
2). More precisely, the rate of labour force participation of illiterate working age
8
population has increased from 58.2 percent in 1983 to 63.4 percent in 2004-05.
Semi-skilled workforce (below primary, primary and middle school) has stable
rate of labour force participation at around 70 percent during the same period.
On the other hand, the skilled population (secondary and above) has declining
trend in labour force participation rate. Graduate and above working age popu-
lation had 82 percent participation rate in 1983 which declined to 76 percent in
2003-04. We see similar declining trend for secondary educated population. In a
nutshell, there is significantly greater number of people with higher skill level left
out of active labour force in 2003-04 compared to twenty years back. What may
cause this declining supply (not in absolute sense) of talent pool? One reason
could be higher educational attainment of women but less participation due to
several social constraints, especially after marriage exit from labour force. To
understand the dynamics, we also calculate the labour force participation rates
by sex (not reported). It is found that labour force participation rate by skill
level remained constant over time for male population. Therefore, our conjec-
ture is partly true. Our focus of this study is not to delve deeper into gender
issues of the labour market. However, the evidence of gender gap encourages us
to control several important demographic variables in formal analysis.
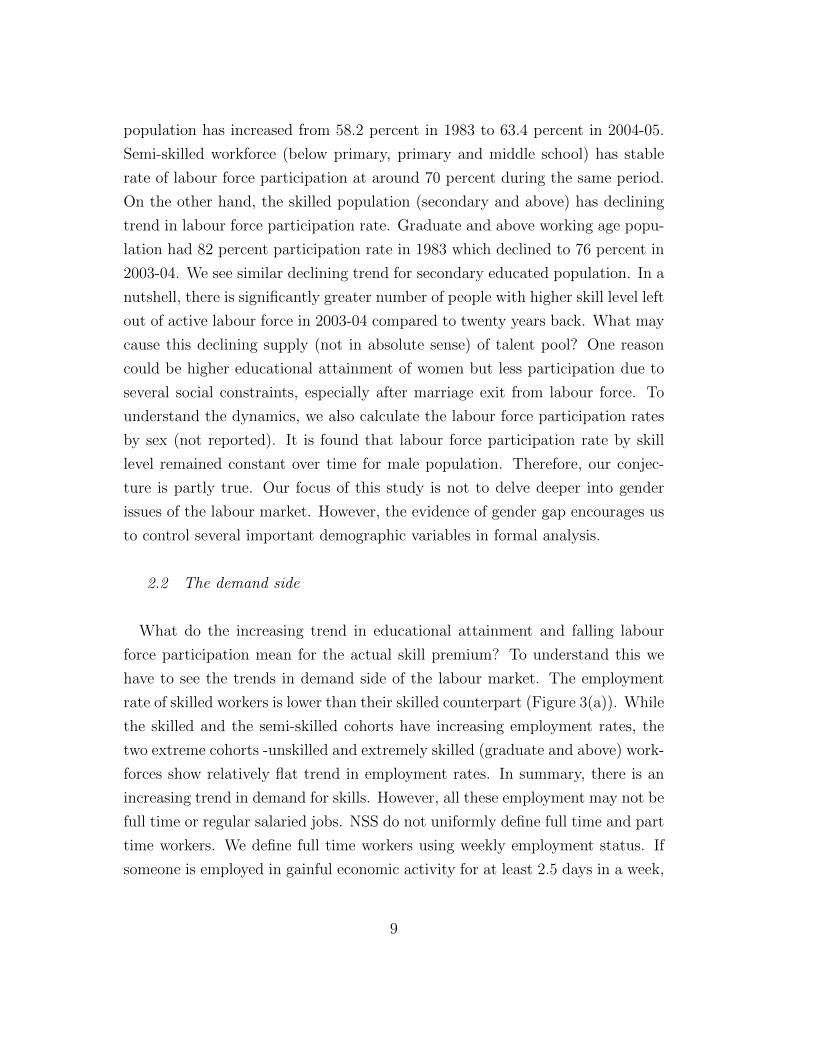
2.2 The demand side
What do the increasing trend in educational attainment and falling labour
force participation mean for the actual skill premium? To understand this we
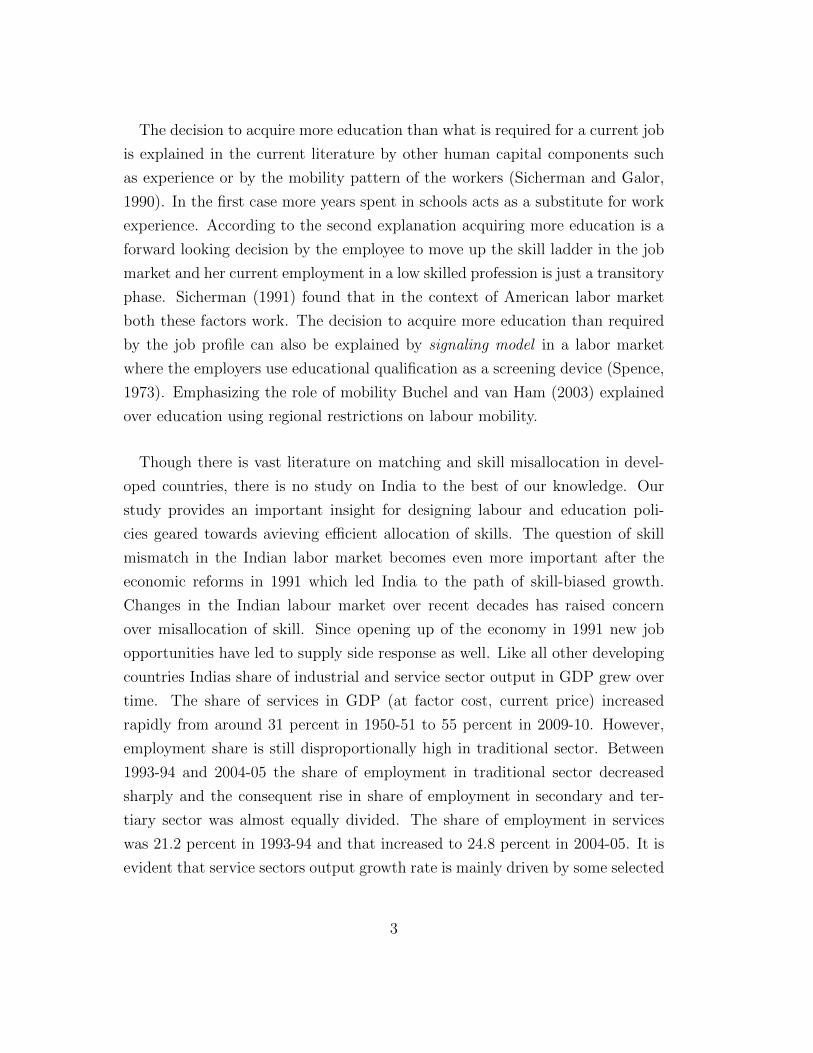
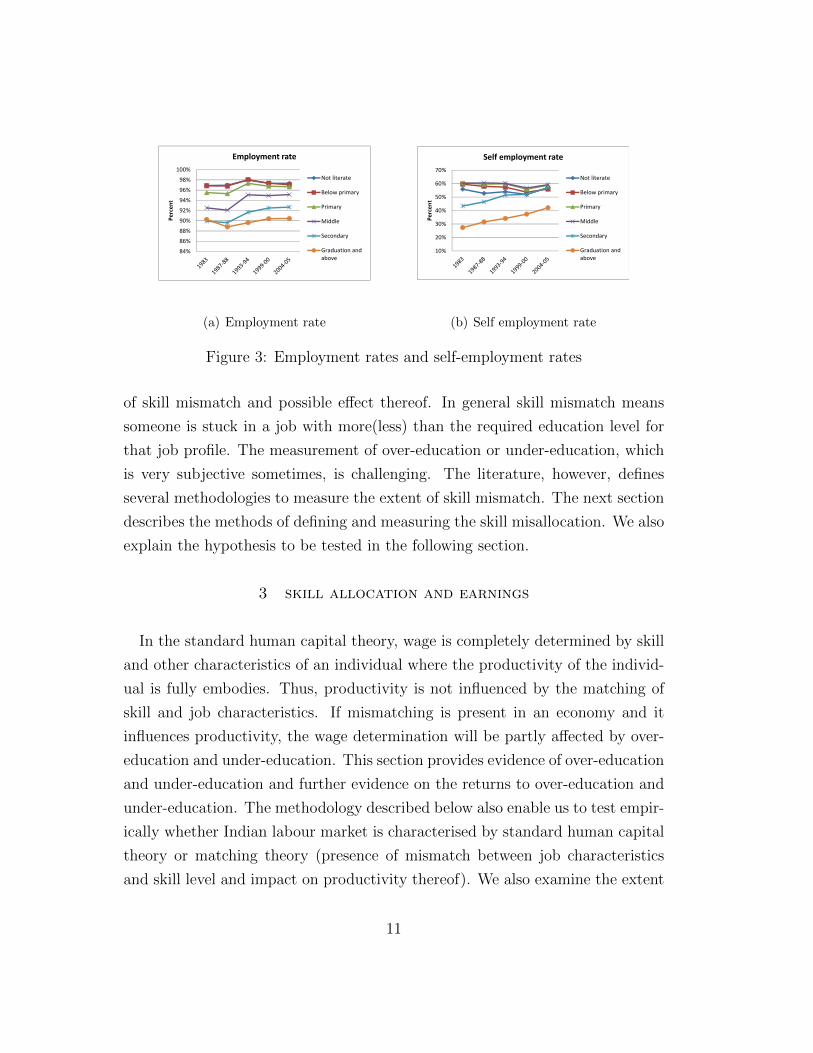
have to see the trends in demand side of the labour market. The employment
rate of skilled workers is lower than their skilled counterpart (Figure 3(a)). While
the skilled and the semi-skilled cohorts have increasing employment rates, the
two extreme cohorts -unskilled and extremely skilled (graduate and above) work-
forces show relatively flat trend in employment rates. In summary, there is an
increasing trend in demand for skills. However, all these employment may not be
full time or regular salaried jobs. NSS do not uniformly define full time and part
time workers. We define full time workers using weekly employment status. If
someone is employed in gainful economic activity for at least 2.5 days in a week,
9
50%
55%
60%
65%
70%
75%
80%
85%
1 2 3 4 5
Pe
rce
nt
Labour force participation rate
Not literate
Below primary
Primary
Middle
Secondary
Graduation and
above
Figure 2: Labour force participation rates across skills
we define her as full time employed. Using this standard, the proportion of full
time employment is higher for skilled workers. The self-employment rate is quite
high in India. Figure 3(b) shows the trend in self-employment rates over time.
Two important results are evident from the figure. First, the self-employment
rate is highest for semi-skilled workers (middle school). Second, though the self-
employment rate for secondary and graduate workers are consistently lower than
all skill levels, the rate is increasing steadily over time. In fact, in 2003-04, the
self-employment rate of secondary workers converged to that of all lower skill
levels.
While the summary statistics of demand and supply side of the labour market
gives an overall picture, we need a proper methodology to identify the presence
10
84%
86%
88%
90%
92%
94%
96%
98%
100%P
erc
en
t
Employment rate
Not literate
Below primary
Primary
Middle
Secondary
Graduation and
above
(a) Employment rate
10%
20%
30%
40%
50%
60%
70%
Pe
rce
nt
Self employment rate
Not literate
Below primary
Primary
Middle
Secondary
Graduation and
above
(b) Self employment rate
Figure 3: Employment rates and self-employment rates
of skill mismatch and possible effect thereof. In general skill mismatch means
someone is stuck in a job with more(less) than the required education level for
that job profile. The measurement of over-education or under-education, which
is very subjective sometimes, is challenging. The literature, however, defines
several methodologies to measure the extent of skill mismatch. The next section
describes the methods of defining and measuring the skill misallocation. We also
explain the hypothesis to be tested in the following section.
3 skill allocation and earnings
In the standard human capital theory, wage is completely determined by skill
and other characteristics of an individual where the productivity of the individ-
ual is fully embodies. Thus, productivity is not influenced by the matching of
skill and job characteristics. If mismatching is present in an economy and it
influences productivity, the wage determination will be partly affected by over-
education and under-education. This section provides evidence of over-education
and under-education and further evidence on the returns to over-education and
under-education. The methodology described below also enable us to test empir-
ically whether Indian labour market is characterised by standard human capital
theory or matching theory (presence of mismatch between job characteristics
and skill level and impact on productivity thereof). We also examine the extent
11
of wage gain and loss due to skill misallocation. The results are important for
setting up labour and education policy towards allocation of skill. If the skill
misallocation is not transient, rather permanent, we have to devise proper pol-
icy incentive so that there is no gap is demand for skill and supply of skill and
also improved search process so that productivity of individual workers are fully
utilised. The possibility of slower mobility should be addressed as well to this
end.
3.1 Measurement issues
There is substantial work in the area of over-education and under-education.
Two different approaches have been used in literature to measure the over-
education and under-education. First, in subjective approach the skill mismatch
is defined as the gap between actual skill of as individual and skill required
for the job as assessed subjectively by the employee or some independent job
analyst. In second approach, the skill mismatch is defined by the gap between
actual skill and some objective benchmark of skill level for the job. The objective
benchmark is often set at one standard deviation band around the mean edu-
cation level. Therefore, the objective classification of workers in over-education
and under-educated groups is influenced by the sample. Both the methodologies
have some drawbacks. For example, the subjective approach is often biased be-
cause the self-assessment is partly influenced by job satisfaction of the employee
and dissatisfied workers may misreport themselves as over-educated. The main
advantage of this approach is that the measurement is job specific and does
not depend on sample characteristics. Some studies have utilised expert opin-
ion to determine job specific skill requirements where bias due to misreporting
will be less. However, this approach, although superior, is costly to implement.
Whereas, in the objective approach, the chances of misreporting are low, how-
ever the measurement of over-qualification or under-qualification is unable to
uncover the technological requirements of a job. This measurement is partly in-
fluenced by actual allocation of skill resulting from hiring and matching process
and labour market conditions.
12
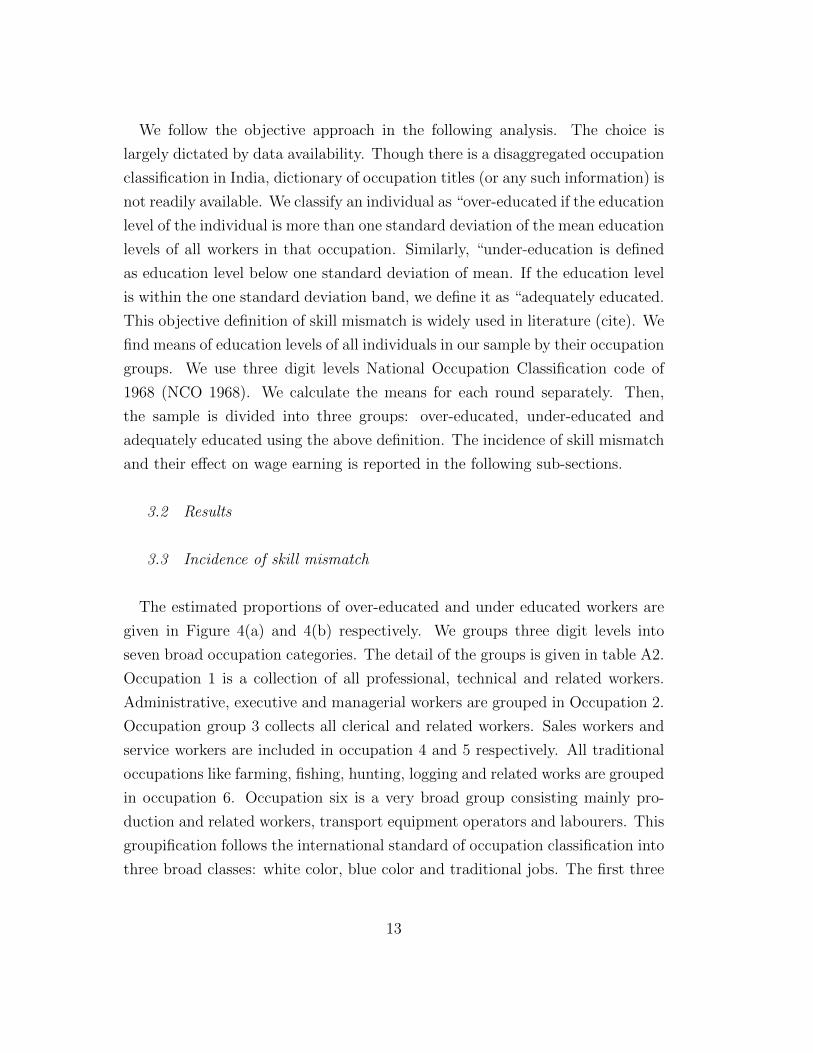
We follow the objective approach in the following analysis. The choice is
largely dictated by data availability. Though there is a disaggregated occupation
classification in India, dictionary of occupation titles (or any such information) is
not readily available. We classify an individual as “over-educated if the education
level of the individual is more than one standard deviation of the mean education
levels of all workers in that occupation. Similarly, “under-education is defined
as education level below one standard deviation of mean. If the education level
is within the one standard deviation band, we define it as “adequately educated.
This objective definition of skill mismatch is widely used in literature (cite). We
find means of education levels of all individuals in our sample by their occupation
groups. We use three digit levels National Occupation Classification code of
1968 (NCO 1968). We calculate the means for each round separately. Then,
the sample is divided into three groups: over-educated, under-educated and
adequately educated using the above definition. The incidence of skill mismatch
and their effect on wage earning is reported in the following sub-sections.
3.2 Results
3.3 Incidence of skill mismatch
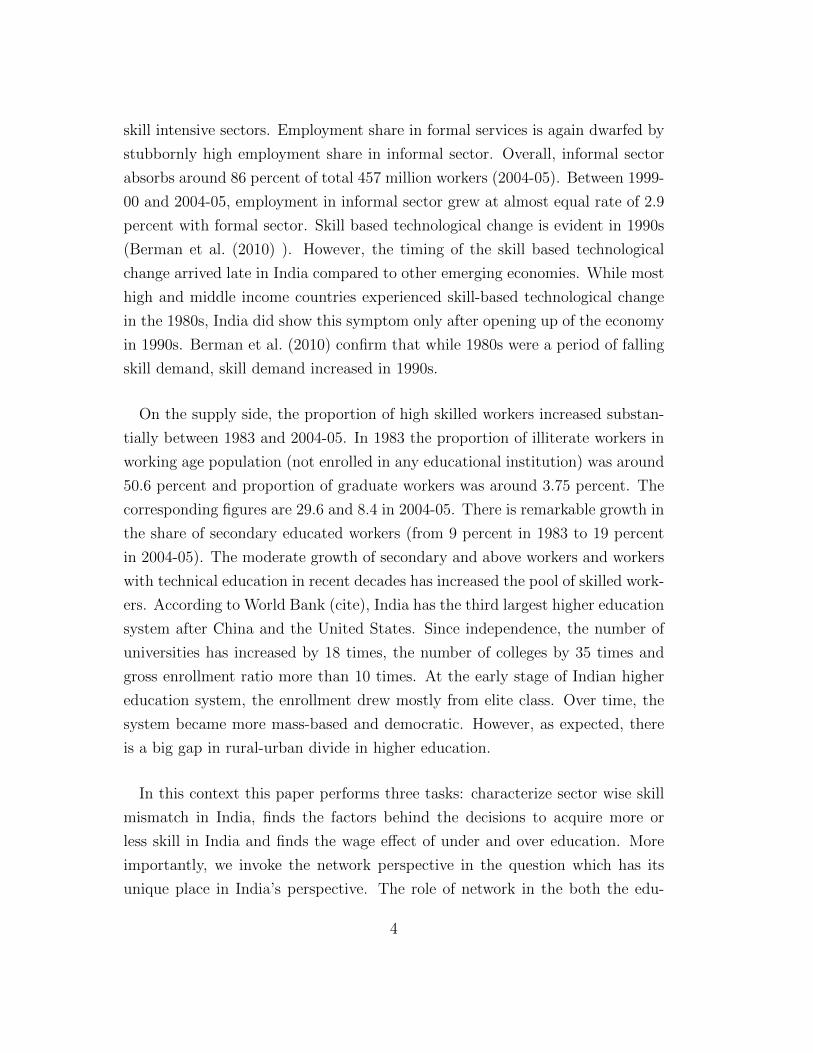
The estimated proportions of over-educated and under educated workers are
given in Figure 4(a) and 4(b) respectively. We groups three digit levels into
seven broad occupation categories. The detail of the groups is given in table A2.
Occupation 1 is a collection of all professional, technical and related workers.
Administrative, executive and managerial workers are grouped in Occupation 2.
Occupation group 3 collects all clerical and related workers. Sales workers and
service workers are included in occupation 4 and 5 respectively. All traditional
occupations like farming, fishing, hunting, logging and related works are grouped
in occupation 6. Occupation six is a very broad group consisting mainly pro-
duction and related workers, transport equipment operators and labourers. This
groupification follows the international standard of occupation classification into
three broad classes: white color, blue color and traditional jobs. The first three
13
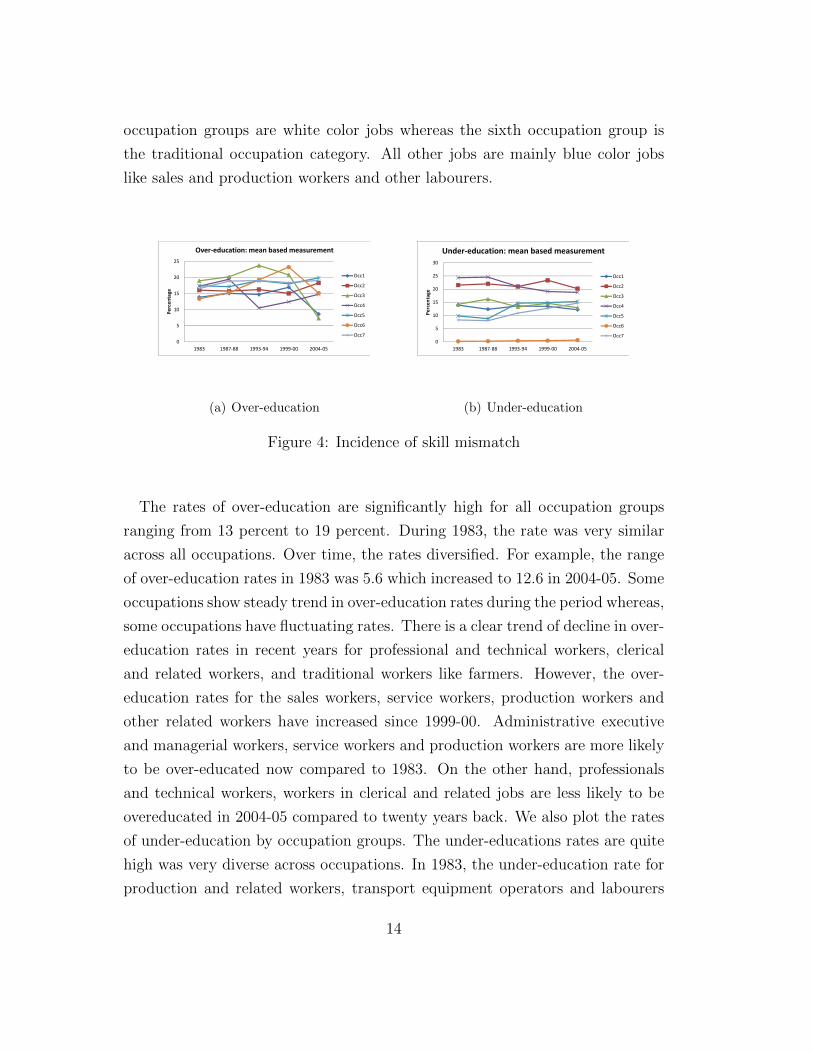
occupation groups are white color jobs whereas the sixth occupation group is
the traditional occupation category. All other jobs are mainly blue color jobs
like sales and production workers and other labourers.
0
5
10
15
20
25
1983 1987-88 1993-94 1999-00 2004-05
Pe
rce
nta
ge
Over-education: mean based measurement
Occ1
Occ2
Occ3
Occ4
Occ5
Occ6
Occ7
(a) Over-education
0
5
10
15
20
25
30
1983 1987-88 1993-94 1999-00 2004-05
Pe
rce
nta
ge
Under-education: mean based measurement
Occ1
Occ2
Occ3
Occ4
Occ5
Occ6
Occ7
(b) Under-education
Figure 4: Incidence of skill mismatch
The rates of over-education are significantly high for all occupation groups
ranging from 13 percent to 19 percent. During 1983, the rate was very similar
across all occupations. Over time, the rates diversified. For example, the range
of over-education rates in 1983 was 5.6 which increased to 12.6 in 2004-05. Some
occupations show steady trend in over-education rates during the period whereas,
some occupations have fluctuating rates. There is a clear trend of decline in over-
education rates in recent years for professional and technical workers, clerical
and related workers, and traditional workers like farmers. However, the over-
education rates for the sales workers, service workers, production workers and
other related workers have increased since 1999-00. Administrative executive
and managerial workers, service workers and production workers are more likely
to be over-educated now compared to 1983. On the other hand, professionals
and technical workers, workers in clerical and related jobs are less likely to be
overeducated in 2004-05 compared to twenty years back. We also plot the rates
of under-education by occupation groups. The under-educations rates are quite
high was very diverse across occupations. In 1983, the under-education rate for
production and related workers, transport equipment operators and labourers
14
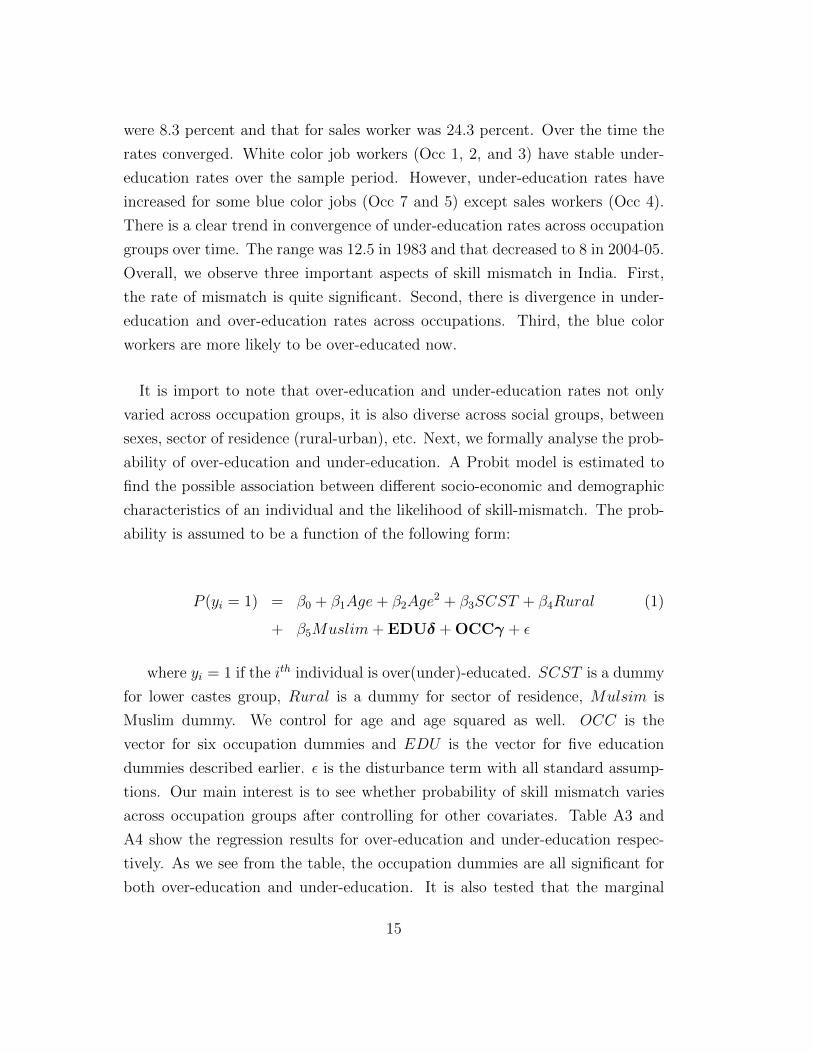
were 8.3 percent and that for sales worker was 24.3 percent. Over the time the
rates converged. White color job workers (Occ 1, 2, and 3) have stable under-
education rates over the sample period. However, under-education rates have
increased for some blue color jobs (Occ 7 and 5) except sales workers (Occ 4).
There is a clear trend in convergence of under-education rates across occupation
groups over time. The range was 12.5 in 1983 and that decreased to 8 in 2004-05.
Overall, we observe three important aspects of skill mismatch in India. First,
the rate of mismatch is quite significant. Second, there is divergence in under-
education and over-education rates across occupations. Third, the blue color
workers are more likely to be over-educated now.
It is import to note that over-education and under-education rates not only
varied across occupation groups, it is also diverse across social groups, between
sexes, sector of residence (rural-urban), etc. Next, we formally analyse the prob-
ability of over-education and under-education. A Probit model is estimated to
find the possible association between different socio-economic and demographic
characteristics of an individual and the likelihood of skill-mismatch. The prob-
ability is assumed to be a function of the following form:
P (yi = 1) = β0 + β1Age+ β2Age2 + β3SCST + β4Rural (1)
+ β5Muslim+ EDUδ + OCCγ + ε
where yi = 1 if the ith individual is over(under)-educated. SCST is a dummy
for lower castes group, Rural is a dummy for sector of residence, Mulsim is
Muslim dummy. We control for age and age squared as well. OCC is the
vector for six occupation dummies and EDU is the vector for five education
dummies described earlier. ε is the disturbance term with all standard assump-
tions. Our main interest is to see whether probability of skill mismatch varies
across occupation groups after controlling for other covariates. Table A3 and
A4 show the regression results for over-education and under-education respec-
tively. As we see from the table, the occupation dummies are all significant for
both over-education and under-education. It is also tested that the marginal
15
effects are significantly different across occupations 1. The other important re-
sults are: 1) lower caste association leads to higher probability of over-education
and lower probability of under-education, 2) Rural people are more likely to be
over-educated and less likely to be under-educated in their occupation 2, 3) the
effect of being Muslim on probability of under-education and over-education is
positive except for the year 1993-943, 4) the older the person is, the more they
may be probable to become over-educated, and 5) as expected, the probability
of becoming over-educated increases with education level and the probability of
becoming under-educated decreases with education level.
3.3.1 Wage effect of skill mismatch
In the following section we report the wage effect of over-education and under-
education. In the standard Mincerian wage equation, the returns to education
depend on the productivity of an individual that is fully embodied. That is,
wage is determined by
lnWi = αSi + Xiβ + ε (2)
where Si is the actual educational attainment of individual i and Xi is a vec-
tor of all other covariates capturing individual and demographic characteristics.
However, this wage determination does not capture the possibility of matching.
If productivity is partly determined by matching of workers and the jobs, the
wage equation should be given by
lnWi = α1Sai + α2S
oi + α3S
ui + Xiβ + ε (3)
where Sa, So, and Su are years of adequate education, over-education and
under-education respectively. Here, adequate education is defined as mean edu-
1Not reported in this draft. We are working on the marginal effects and change in marginaleffects of important covariates
2This could be due to several reasons most likely reason to be mobility. We will delvedeeper in future draft to understand the reasons behind each of these important findings.More formal analysis is required to draw any conclusion.
3We will also include several other important covariates in future draft of this paper genderand caste gaps would be important aspects.
16
cation level of the occupation of the individual i. If productivity is fully embod-
ied and standard human capital theory applies, all the α coefficients would be
same. In other words, the returns to over-education or under-education would
be equal to returns to adequate education. On the other hand, if productivity is
solely determined by the job profile, α2 = α3 = 0. That means wage should not
depend on over-education or under-education level of the individual. Rather,
it will solely depend on required skill level for the job. If skill mismatching
exists, α1 6= α2 6= α3 would be expected. We estimate equation 3 and test
whether returns to under-education and over-education are same as returns to
adequate education. In general, returns to one year of extra over-education are
positive but lower than the returns to adequate education whereas, return to
under-education is negative.
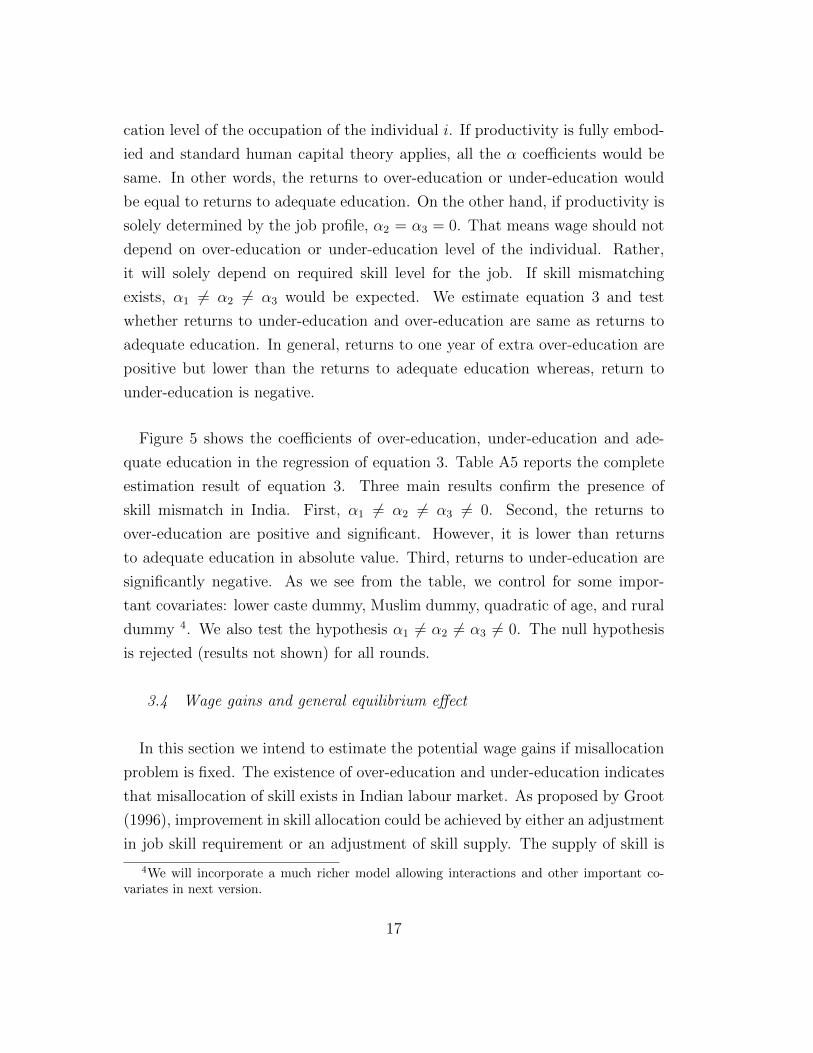
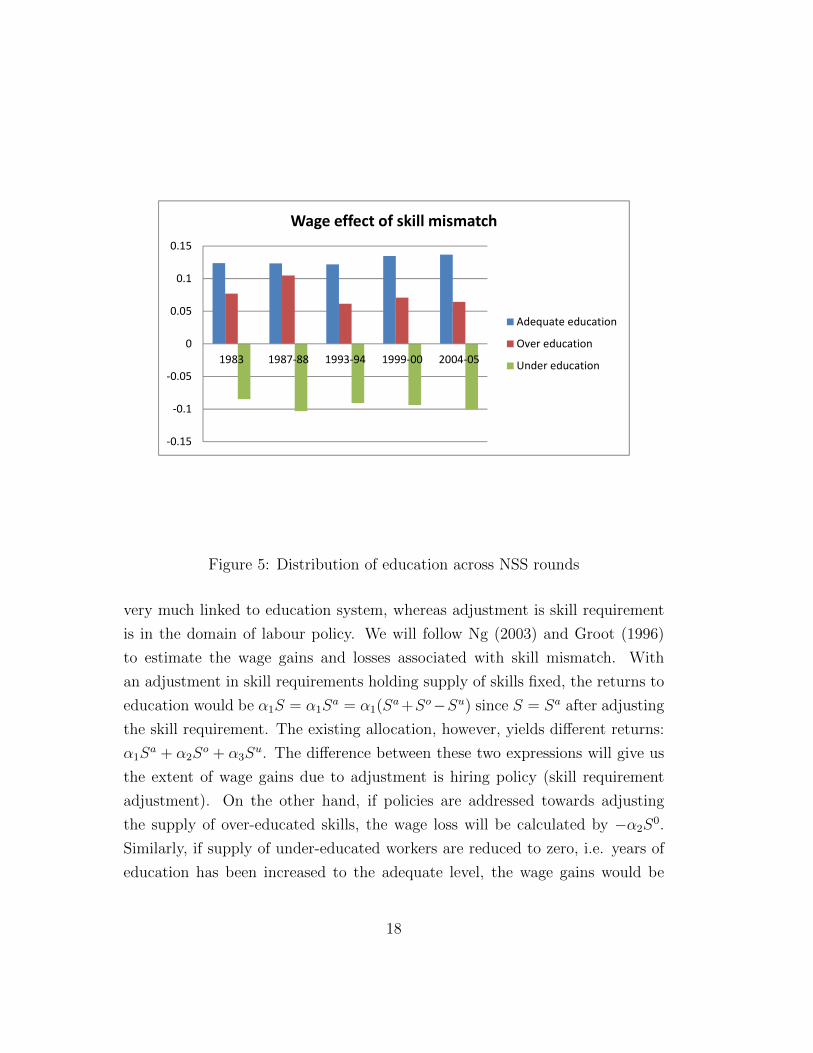
Figure 5 shows the coefficients of over-education, under-education and ade-
quate education in the regression of equation 3. Table A5 reports the complete
estimation result of equation 3. Three main results confirm the presence of
skill mismatch in India. First, α1 6= α2 6= α3 6= 0. Second, the returns to
over-education are positive and significant. However, it is lower than returns
to adequate education in absolute value. Third, returns to under-education are
significantly negative. As we see from the table, we control for some impor-
tant covariates: lower caste dummy, Muslim dummy, quadratic of age, and rural
dummy 4. We also test the hypothesis α1 6= α2 6= α3 6= 0. The null hypothesis
is rejected (results not shown) for all rounds.
3.4 Wage gains and general equilibrium effect
In this section we intend to estimate the potential wage gains if misallocation
problem is fixed. The existence of over-education and under-education indicates
that misallocation of skill exists in Indian labour market. As proposed by Groot
(1996), improvement in skill allocation could be achieved by either an adjustment
in job skill requirement or an adjustment of skill supply. The supply of skill is
4We will incorporate a much richer model allowing interactions and other important co-variates in next version.
17
-0.15
-0.1
-0.05
0
0.05
0.1
0.15
1983 1987-88 1993-94 1999-00 2004-05
Wage effect of skill mismatch
Adequate education
Over education
Under education
Figure 5: Distribution of education across NSS rounds
very much linked to education system, whereas adjustment is skill requirement
is in the domain of labour policy. We will follow Ng (2003) and Groot (1996)
to estimate the wage gains and losses associated with skill mismatch. With
an adjustment in skill requirements holding supply of skills fixed, the returns to
education would be α1S = α1Sa = α1(S
a+So−Su) since S = Sa after adjusting
the skill requirement. The existing allocation, however, yields different returns:
α1Sa + α2S
o + α3Su. The difference between these two expressions will give us
the extent of wage gains due to adjustment is hiring policy (skill requirement
adjustment). On the other hand, if policies are addressed towards adjusting
the supply of over-educated skills, the wage loss will be calculated by −α2S0.
Similarly, if supply of under-educated workers are reduced to zero, i.e. years of
education has been increased to the adequate level, the wage gains would be
18
expressed as −α3Su. It should be noted that the expected sign of α2 is positive
whereas expected sign of α3 is negative.
We also intend to estimate overall general equilibrium effect of skill misallo-
cation following Dougherty and SelowskyReviewed (1973).
4 Conclusion
We examine the extent of skill misallocation in Indian labour market using
national level employment survey data. The incidence of over-education is sig-
nificantly high and varies across occupations. In general, over-education rates
are high for blue colour and traditional jobs mainly in informal sectors. The
under-education rates are also significantly high among sales, managerial and
administrative workers. The returns to over-education are positive and signifi-
cant though lower than the returns to adequate education level. On the other
hand, returns to under-education are negative and significant.
References
Berman, E., Somanathan, R., and Tan, H. W. (2010). Is skill biased techno-
logical change here yet? evidence from india manufacturing in the 1990s. In
Contributions in Memory of Zvi Griliches, NBER Chapters, pages 299–321.
National Bureau of Economic Research, Inc.
Buchel, F. and van Ham, M. (2003). Overeducation, regional labor markets, and
spatial flexibility. Journal of Urban Economics, 53(3):482–493.
Cohn, E. and Khan, S. (1995). The wage effects of overschooling revisited.
Labour Economics, 2:67–76.
Dougherty, C. and SelowskyReviewed, M. (1973). Measuring the effects of the
misallocation of labour. The Review of Economics and Statistics, 55(3):386–
390.
19
Duncan, G. J. and Hoffman, S. D. (1981). The incidence and wage effects of
overeducation. Economics of Education Review, 1(1):75–86.
Groot, W. (1996). The incidence of, and returns to overeducation in the uk.
Applied Economics, 22:1345–50.
Hersch, J. (1991). Education match and job match. Review of Economics and
Statistics, 37:140–144.
Montgomery, J. D. (1991). Social networks and labor-market outcomes: Toward
an economic analysis. The American Economic Review, 81(5):1408–1418.
Munshi, K. (2003). Networks in the modern economy: Mexican migrants in the
u. s. labor market. The Quarterly Journal of Economics, 118(2):549–599.
Munshi, K. and Rosenzweig, M. (2006). Traditional institutions meet the modern
world: Caste, gender, and schooling choice in a globalizing economy. American
Economic Review, 96(4):12251252.
Ng, Y. C. (2003). Earnings and "skill" allocation in the canadian
labor market. International Journal of Manpower, 24(8):964–980.
Rumberger, R. W. (1987). The impact of surplus schooling on productivity and
earnings. Journal of Human Resources, 22(1):24–50.
Sicherman, N. (1991). “overeducation” in the labor market. Journal of Labor
Economics, 9(2):101–122.
Sicherman, N. and Galor, O. (1990). A theory of career mobility. Journal of
Political Economy, 98(1):169–192.
Simon, C. J. and Warner, J. T. (1992). Matchmaker, matchmaker: The effect
of old boy networks on job match quality, earnings, and tenure. Journal of
Labor Economics, 10(3):306–330.
Spence, M. (1973). Job market signaling. Quarterly Journal of Economics,
87:355374.
20

Tsang, M., Rumberger, R. W., and Levin, H. (1991). The impact of surplus
schooling on worker productivity. Industrial Relations, 30:209–228.
Verdugo, R. and Verdugo, N. (1989). The impact of surplus schooling on earn-
ings: some additional findings. The Journal of Human Resources, 24:629643.
21
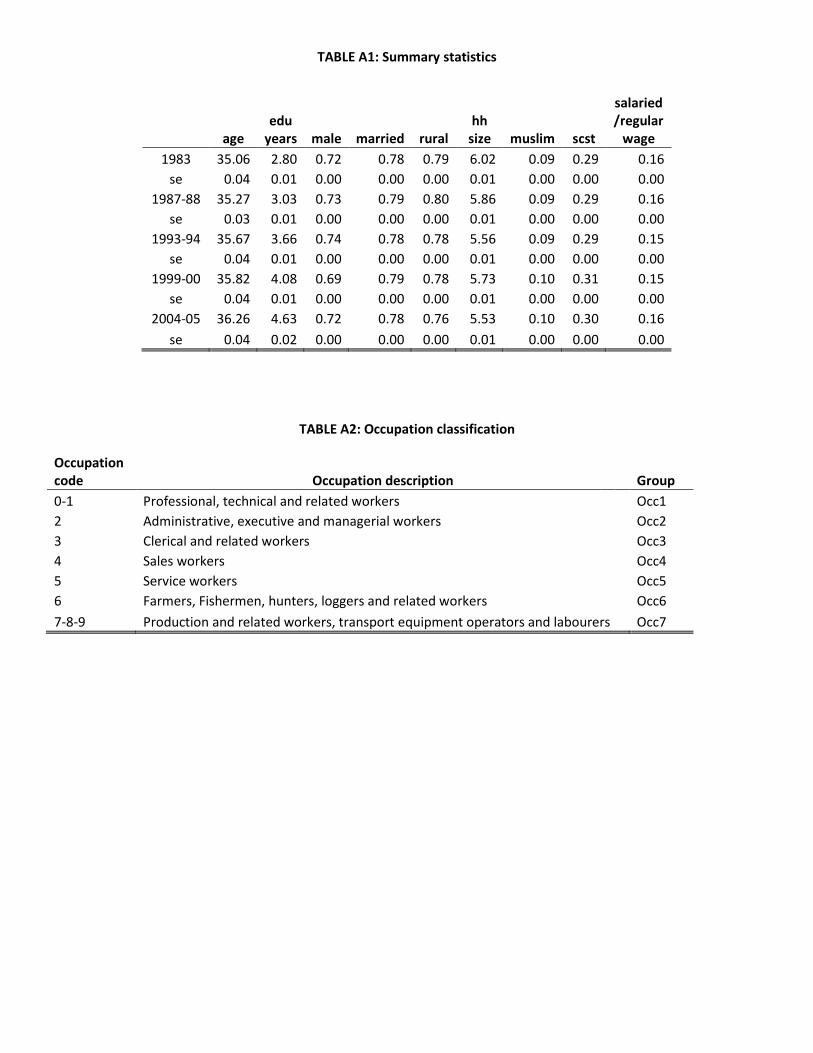
TABLE A1: Summary statistics
TABLE A2: Occupation classification
Occupation
code Occupation description Group
0-1 Professional, technical and related workers
Occ1
2 Administrative, executive and managerial workers
Occ2
3 Clerical and related workers
Occ3
4 Sales workers
Occ4
5 Service workers
Occ5
6 Farmers, Fishermen, hunters, loggers and related workers
Occ6
7-8-9 Production and related workers, transport equipment operators and labourers Occ7
age
edu
years male married rural
hh
size muslim scst
salaried
/regular
wage
1983 35.06 2.80 0.72 0.78 0.79 6.02 0.09 0.29 0.16
se 0.04 0.01 0.00 0.00 0.00 0.01 0.00 0.00 0.00
1987-88 35.27 3.03 0.73 0.79 0.80 5.86 0.09 0.29 0.16
se 0.03 0.01 0.00 0.00 0.00 0.01 0.00 0.00 0.00
1993-94 35.67 3.66 0.74 0.78 0.78 5.56 0.09 0.29 0.15
se 0.04 0.01 0.00 0.00 0.00 0.01 0.00 0.00 0.00
1999-00 35.82 4.08 0.69 0.79 0.78 5.73 0.10 0.31 0.15
se 0.04 0.01 0.00 0.00 0.00 0.01 0.00 0.00 0.00
2004-05 36.26 4.63 0.72 0.78 0.76 5.53 0.10 0.30 0.16
se 0.04 0.02 0.00 0.00 0.00 0.01 0.00 0.00 0.00
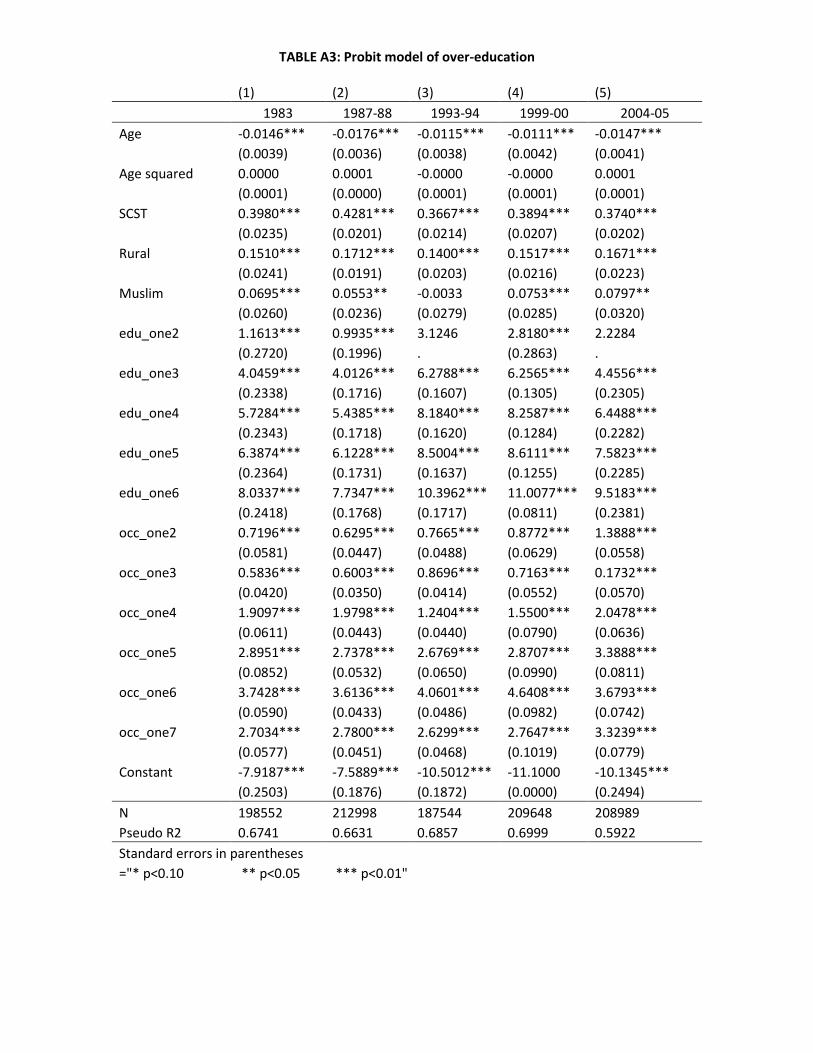
TABLE A3: Probit model of over-education
(1) (2) (3) (4) (5)
1983 1987-88 1993-94 1999-00 2004-05
Age -0.0146*** -0.0176*** -0.0115*** -0.0111*** -0.0147***
(0.0039) (0.0036) (0.0038) (0.0042) (0.0041)
Age squared 0.0000 0.0001 -0.0000 -0.0000 0.0001
(0.0001) (0.0000) (0.0001) (0.0001) (0.0001)
SCST 0.3980*** 0.4281*** 0.3667*** 0.3894*** 0.3740***
(0.0235) (0.0201) (0.0214) (0.0207) (0.0202)
Rural 0.1510*** 0.1712*** 0.1400*** 0.1517*** 0.1671***
(0.0241) (0.0191) (0.0203) (0.0216) (0.0223)
Muslim 0.0695*** 0.0553** -0.0033 0.0753*** 0.0797**
(0.0260) (0.0236) (0.0279) (0.0285) (0.0320)
edu_one2 1.1613*** 0.9935*** 3.1246 2.8180*** 2.2284
(0.2720) (0.1996) . (0.2863) .
edu_one3 4.0459*** 4.0126*** 6.2788*** 6.2565*** 4.4556***
(0.2338) (0.1716) (0.1607) (0.1305) (0.2305)
edu_one4 5.7284*** 5.4385*** 8.1840*** 8.2587*** 6.4488***
(0.2343) (0.1718) (0.1620) (0.1284) (0.2282)
edu_one5 6.3874*** 6.1228*** 8.5004*** 8.6111*** 7.5823***
(0.2364) (0.1731) (0.1637) (0.1255) (0.2285)
edu_one6 8.0337*** 7.7347*** 10.3962*** 11.0077*** 9.5183***
(0.2418) (0.1768) (0.1717) (0.0811) (0.2381)
occ_one2 0.7196*** 0.6295*** 0.7665*** 0.8772*** 1.3888***
(0.0581) (0.0447) (0.0488) (0.0629) (0.0558)
occ_one3 0.5836*** 0.6003*** 0.8696*** 0.7163*** 0.1732***
(0.0420) (0.0350) (0.0414) (0.0552) (0.0570)
occ_one4 1.9097*** 1.9798*** 1.2404*** 1.5500*** 2.0478***
(0.0611) (0.0443) (0.0440) (0.0790) (0.0636)
occ_one5 2.8951*** 2.7378*** 2.6769*** 2.8707*** 3.3888***
(0.0852) (0.0532) (0.0650) (0.0990) (0.0811)
occ_one6 3.7428*** 3.6136*** 4.0601*** 4.6408*** 3.6793***
(0.0590) (0.0433) (0.0486) (0.0982) (0.0742)
occ_one7 2.7034*** 2.7800*** 2.6299*** 2.7647*** 3.3239***
(0.0577) (0.0451) (0.0468) (0.1019) (0.0779)
Constant -7.9187*** -7.5889*** -10.5012*** -11.1000 -10.1345***
(0.2503) (0.1876) (0.1872) (0.0000) (0.2494)
N 198552 212998 187544 209648 208989
Pseudo R2 0.6741 0.6631 0.6857 0.6999 0.5922
Standard errors in parentheses
="* p<0.10 ** p<0.05 *** p<0.01"
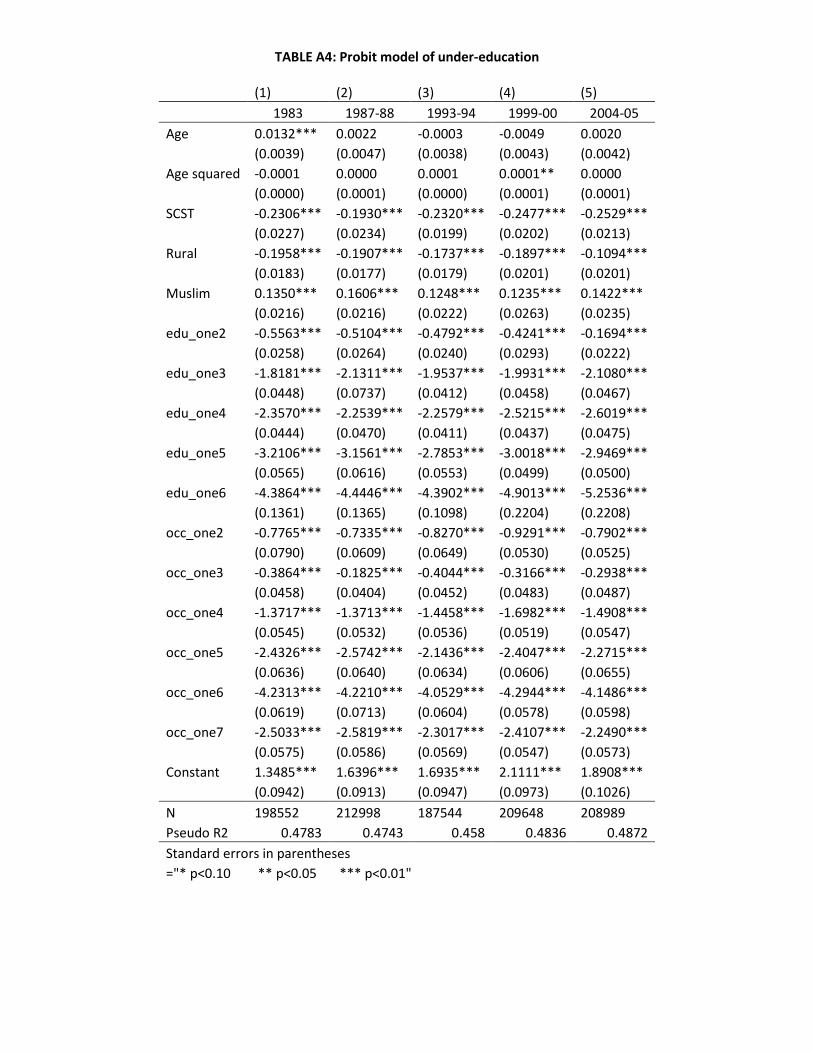
TABLE A4: Probit model of under-education
(1) (2) (3) (4) (5)
1983 1987-88 1993-94 1999-00 2004-05
Age 0.0132*** 0.0022 -0.0003 -0.0049 0.0020
(0.0039) (0.0047) (0.0038) (0.0043) (0.0042)
Age squared -0.0001 0.0000 0.0001 0.0001** 0.0000
(0.0000) (0.0001) (0.0000) (0.0001) (0.0001)
SCST -0.2306*** -0.1930*** -0.2320*** -0.2477*** -0.2529***
(0.0227) (0.0234) (0.0199) (0.0202) (0.0213)
Rural -0.1958*** -0.1907*** -0.1737*** -0.1897*** -0.1094***
(0.0183) (0.0177) (0.0179) (0.0201) (0.0201)
Muslim 0.1350*** 0.1606*** 0.1248*** 0.1235*** 0.1422***
(0.0216) (0.0216) (0.0222) (0.0263) (0.0235)
edu_one2 -0.5563*** -0.5104*** -0.4792*** -0.4241*** -0.1694***
(0.0258) (0.0264) (0.0240) (0.0293) (0.0222)
edu_one3 -1.8181*** -2.1311*** -1.9537*** -1.9931*** -2.1080***
(0.0448) (0.0737) (0.0412) (0.0458) (0.0467)
edu_one4 -2.3570*** -2.2539*** -2.2579*** -2.5215*** -2.6019***
(0.0444) (0.0470) (0.0411) (0.0437) (0.0475)
edu_one5 -3.2106*** -3.1561*** -2.7853*** -3.0018*** -2.9469***
(0.0565) (0.0616) (0.0553) (0.0499) (0.0500)
edu_one6 -4.3864*** -4.4446*** -4.3902*** -4.9013*** -5.2536***
(0.1361) (0.1365) (0.1098) (0.2204) (0.2208)
occ_one2 -0.7765*** -0.7335*** -0.8270*** -0.9291*** -0.7902***
(0.0790) (0.0609) (0.0649) (0.0530) (0.0525)
occ_one3 -0.3864*** -0.1825*** -0.4044*** -0.3166*** -0.2938***
(0.0458) (0.0404) (0.0452) (0.0483) (0.0487)
occ_one4 -1.3717*** -1.3713*** -1.4458*** -1.6982*** -1.4908***
(0.0545) (0.0532) (0.0536) (0.0519) (0.0547)
occ_one5 -2.4326*** -2.5742*** -2.1436*** -2.4047*** -2.2715***
(0.0636) (0.0640) (0.0634) (0.0606) (0.0655)
occ_one6 -4.2313*** -4.2210*** -4.0529*** -4.2944*** -4.1486***
(0.0619) (0.0713) (0.0604) (0.0578) (0.0598)
occ_one7 -2.5033*** -2.5819*** -2.3017*** -2.4107*** -2.2490***
(0.0575) (0.0586) (0.0569) (0.0547) (0.0573)
Constant 1.3485*** 1.6396*** 1.6935*** 2.1111*** 1.8908***
(0.0942) (0.0913) (0.0947) (0.0973) (0.1026)
N 198552 212998 187544 209648 208989
Pseudo R2 0.4783 0.4743 0.458 0.4836 0.4872
Standard errors in parentheses
="* p<0.10 ** p<0.05 *** p<0.01"
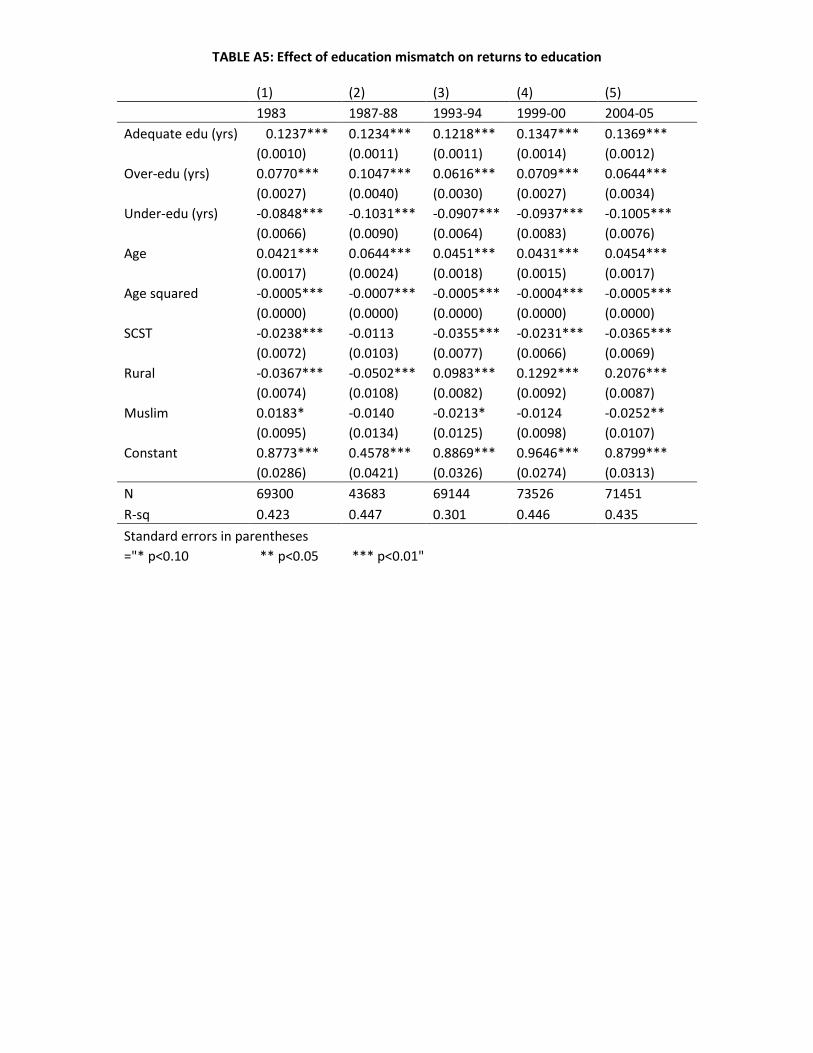
TABLE A5: Effect of education mismatch on returns to education
(1) (2) (3) (4) (5)
1983 1987-88 1993-94 1999-00 2004-05
Adequate edu (yrs) 0.1237*** 0.1234*** 0.1218*** 0.1347*** 0.1369***
(0.0010) (0.0011) (0.0011) (0.0014) (0.0012)
Over-edu (yrs) 0.0770*** 0.1047*** 0.0616*** 0.0709*** 0.0644***
(0.0027) (0.0040) (0.0030) (0.0027) (0.0034)
Under-edu (yrs) -0.0848*** -0.1031*** -0.0907*** -0.0937*** -0.1005***
(0.0066) (0.0090) (0.0064) (0.0083) (0.0076)
Age 0.0421*** 0.0644*** 0.0451*** 0.0431*** 0.0454***
(0.0017) (0.0024) (0.0018) (0.0015) (0.0017)
Age squared -0.0005*** -0.0007*** -0.0005*** -0.0004*** -0.0005***
(0.0000) (0.0000) (0.0000) (0.0000) (0.0000)
SCST -0.0238*** -0.0113 -0.0355*** -0.0231*** -0.0365***
(0.0072) (0.0103) (0.0077) (0.0066) (0.0069)
Rural -0.0367*** -0.0502*** 0.0983*** 0.1292*** 0.2076***
(0.0074) (0.0108) (0.0082) (0.0092) (0.0087)
Muslim 0.0183* -0.0140 -0.0213* -0.0124 -0.0252**
(0.0095) (0.0134) (0.0125) (0.0098) (0.0107)
Constant 0.8773*** 0.4578*** 0.8869*** 0.9646*** 0.8799***
(0.0286) (0.0421) (0.0326) (0.0274) (0.0313)
N 69300 43683 69144 73526 71451
R-sq 0.423 0.447 0.301 0.446 0.435
Standard errors in parentheses
="* p<0.10 ** p<0.05 *** p<0.01"
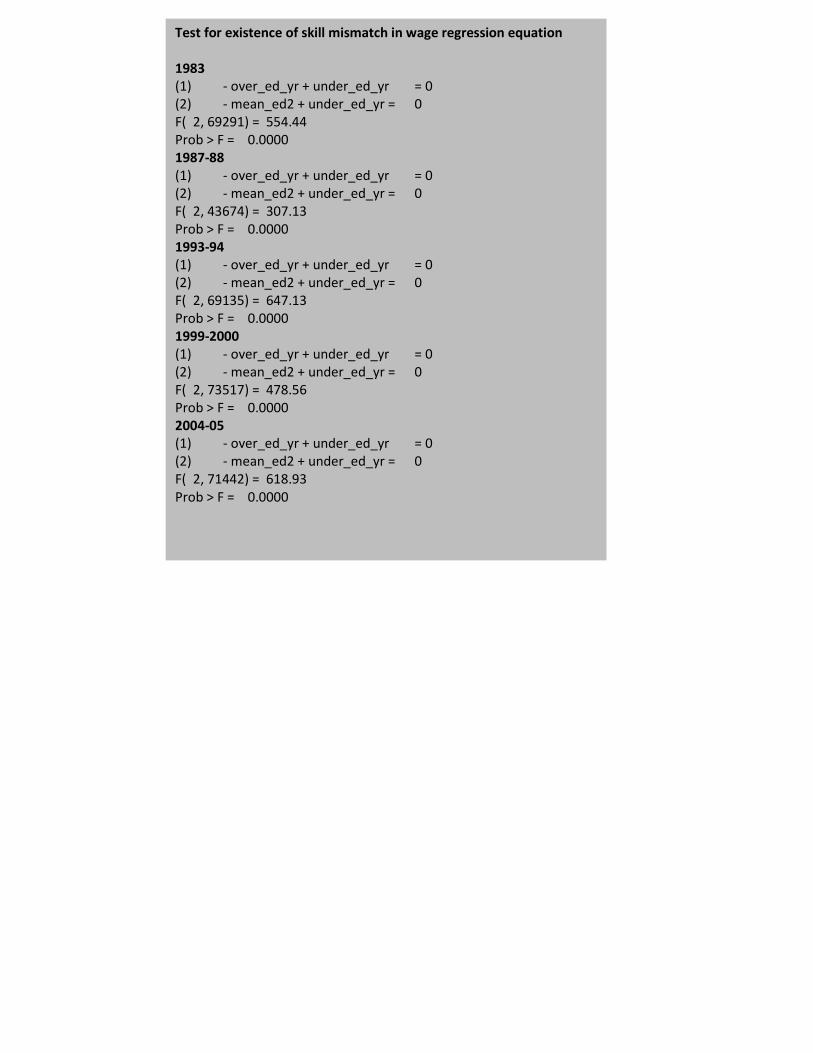
Test for existence of skill mismatch in wage regression equation
1983 (1) - over_ed_yr + under_ed_yr = 0 (2) - mean_ed2 + under_ed_yr = 0 F( 2, 69291) = 554.44 Prob > F = 0.0000 1987-88 (1) - over_ed_yr + under_ed_yr = 0 (2) - mean_ed2 + under_ed_yr = 0 F( 2, 43674) = 307.13 Prob > F = 0.0000 1993-94 (1) - over_ed_yr + under_ed_yr = 0 (2) - mean_ed2 + under_ed_yr = 0 F( 2, 69135) = 647.13 Prob > F = 0.0000 1999-2000 (1) - over_ed_yr + under_ed_yr = 0 (2) - mean_ed2 + under_ed_yr = 0 F( 2, 73517) = 478.56 Prob > F = 0.0000 2004-05 (1) - over_ed_yr + under_ed_yr = 0 (2) - mean_ed2 + under_ed_yr = 0 F( 2, 71442) = 618.93 Prob > F = 0.0000