Embed Size (px)
Citation preview
Acc
epte
d A
rtic
le
This article has been accepted for publication and undergone full peer review but has not been through the copyediting, typesetting, pagination and proofreading process, which may lead to differences between this version and the Version of Record. Please cite this article as doi: 10.1111/1365-2656.12224 This article is protected by copyright. All rights reserved.
Received Date : 03-Oct-2013
Revised Date : 12-Mar-2014
Accepted Date : 27-Mar-2014
Article type : Standard Paper
Editor : Thomas Ings
Section : Community Ecology
Community-level Demographic Consequences of Urbanization: An
Ecological Network Approach
Amanda D. Rodewald1*, Rudolf P. Rohr2, Miguel A. Fortuna2, Jordi Bascompte2
1School of Environment and Natural Resources, The Ohio State University, Columbus, OH USA
2Integrative Ecology Group, Estación Biológica de Doñana (EBD– CSIC), Sevilla, Spain
* Corresponding author: [email protected]. Current address: Cornell Lab of Ornithology
and Department of Natural Resources, Cornell University, Ithaca, NY 14850.
Acc
epte
d A
rtic
le
This article is protected by copyright. All rights reserved.
Running headline: Demography and multispecies networks
Summary
1. Ecological networks are known to influence ecosystem attributes, but we poorly
understand how interspecific network structure affect population demography of multiple
species, particularly for vertebrates. Establishing the link between network structure and
demography is at the crux of being able to use networks to understand population
dynamics and to inform conservation.
2. We addressed the critical but unanswered question, does network structure explain
demographic consequences of urbanization?
3. We studied 141 ecological networks representing interactions between plants and nesting
birds in forests across an urbanization gradient in Ohio, USA from 2001-2011. Nest
predators were identified by video-recording nests and surveyed from 2004-2011.
4. As landscapes urbanized, bird-plant networks were more nested, less compartmentalized,
and dominated by strong interactions between a few species (i.e., low evenness).
Evenness of interaction strengths promoted avian nest survival, and evenness explained
demography better than urbanization, level of invasion, numbers of predators, or other
qualitative network metrics. Highly uneven networks had approximately half the nesting
success as the most even networks. Thus, nest survival reflected how urbanization altered
species interactions, particularly with respect to how nest placement affected search
efficiency of predators.
Acc
epte
d A
rtic
le
This article is protected by copyright. All rights reserved.
5. The demographic effects of urbanization were not direct, but were filtered through bird-
plant networks. This study illustrates how network structure can influence demography at
the community level, and further, that knowledge of species interactions and a network
approach may be requisite to understanding demographic responses to environmental
change.
Key-words Birds, demography, evenness, exotic plants, invasive species, nest success,
predation, rural, urban development
Introduction
The need to understand and predict ecological responses to anthropogenic disturbance
and land use change has never been greater. Population and community responses to
anthropogenic disturbance are usually quantified in terms of diversity, density, and demography,
with the latter widely regarded as the gold standard. Yet studies often report variation in
demographic parameters across sites or years that proves difficult to explain directly with
environmental variables (Grosbois et al. 2008, Schaub et al. 2011, Salewski et al. 2013). This
difficulty may arise, in part, because studies seldom capture species interactions that can shape
population processes across a wide range of spatial and temporal scales. A mechanistic
understanding of the ecological and evolutionary consequences of anthropogenic change requires
study of the drivers and outcomes of species interactions.
Acc
epte
d A
rtic
le
This article is protected by copyright. All rights reserved.
Although species interactions have traditionally been studied using pairwise approaches,
species interact within the context of ecological communities that contain many species
interacting directly or indirectly. These multispecies interactions have the potential for
synergistic or antagonistic effects, and hence are difficult to understand or predict based on
pairwise interactions (Strauss and Irwin 2004). Ecological networks provide a powerful
alternative approach to holistically examine the drivers and outcomes of species interactions
(Bascompte and Jordano 2007, Bascompte 2009, Hagen et al. 2012). Network structure is
already known to mediate ecosystem attributes, including community stability and ecological
services (Bastolla et al. 2009). While reproductive consequences of individual-based networks
of plants and pollinators (Gómez et al. 2011) and parasitism rates among multispecies networks
of wasps and bees (Tylianakis et al. 2007) have been recently described, we poorly understand
the multispecies demographic consequences of interspecific network structure. Because
demography underlies ecological and evolutionary responses, this link is key to elucidating how
networks shape communities and selective environments.
Here, we assessed (1) how the structure of ecological networks changed with urbanization and
(2) to what degree network structure explained the demographic consequences of that
disturbance. Urbanizing landscapes were used as models to understand how shifts in resources
and species composition influence interactions, as network structure may be affected by habitat
modification (Albrecht et al. 2007, Tylianakis et al. 2007, Gagic et al. 2011, Geslin et al. 2013,
Lohaus et al. 2013, Spiesman and Inouye 2013) and invasive species (Aizen et al. 2008,
Spotswood et al. 2012). One of the most striking ways that urbanization influences forest
ecosystems in our study area was that it promoted invasion by Amur honeysuckle, Lonicera
Acc
epte
d A
rtic
le
This article is protected by copyright. All rights reserved.
maackii, an exotic woody shrub frequently planted as an ornamental in yards (Borgmann and
Rodewald 2005). Although it differs architecturally and phenologically from native plants at our
sites, honeysuckle is actively preferred as a nesting substrate by many birds nesting in our system
(Leston and Rodewald 2006). However, nests in honeysuckle are at greater risk of depredation
and, therefore, have lower probability of surviving and producing young than nests in native
plants (Borgmann and Rodewald 2004), especially early in the breeding season when the
majority of nests are placed in honeysuckle (Rodewald et al. 2010). Our familiarity with these
known and documented changes in bird and plant communities along a rural-urban gradient led
us to hypothesize that networks of interactions between nesting birds and plants would be altered
by urbanization in ways that impacted avian demography, as measured by nest survival.
Specifically, we predicted that (1) urban networks would be dominated by strong interactions
between nesting birds and a few exotic plants, resulting in networks that were less
compartmentalized, less even, and by virtue of the super-dominant invader, more nested than
rural networks and (2) reductions in evenness would reduce avian nest survival because the
simple nesting environment would improve the search efficiency of predators (Figure 1).
Materials and methods
FIELD MONITORING
Study sites
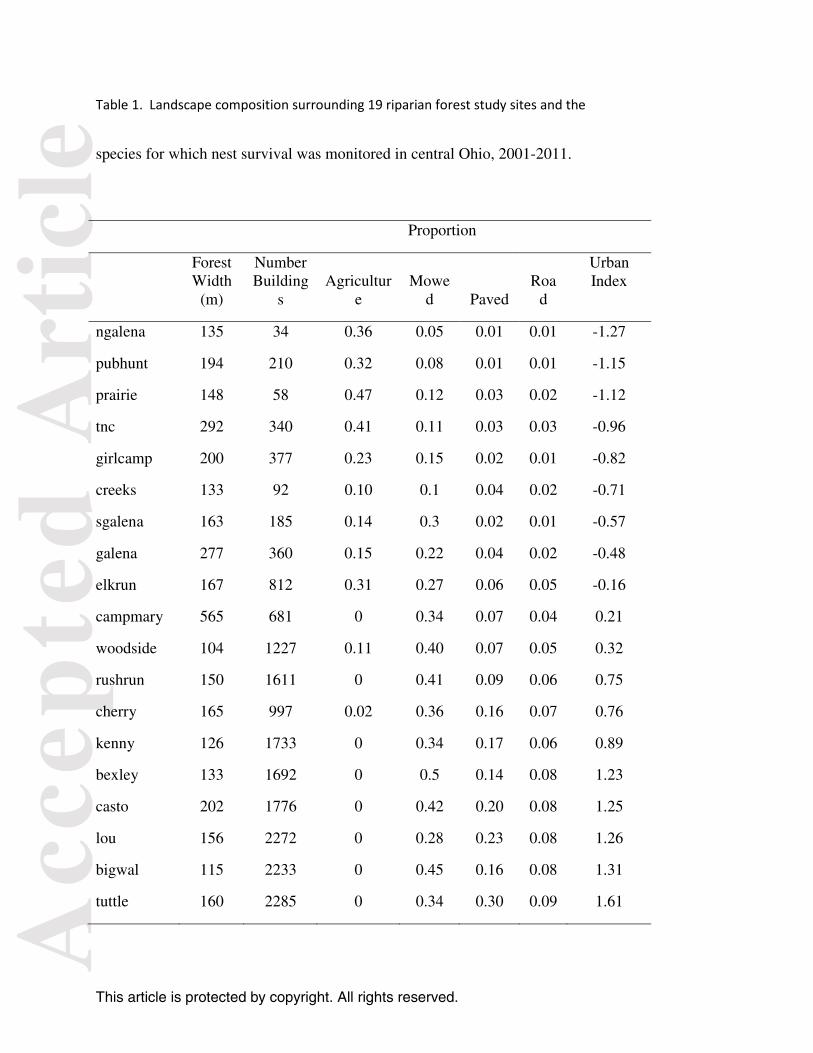
Bird-plant interactions were studied in 19 mature riparian forests in Ohio USA (Table 1).
Forests (115-565 m wide) were located along a rural-to-urban gradient in landscapes that shared
similar land use history as well as amount and spatial configurations of natural areas.
Landscapes in our system, therefore, differed primarily in the dominant land use (agriculture or

Acc
epte
d A
rtic
le
This article is protected by copyright. All rights reserved.
urban) within the matrix. Building densities ranged from 10-727 buildings / km2. The amount of
urbanization was described within a 1-km radius area centered on each study site because the 1-
km scale is known to be strongly associated with bird communities in our system (Rodewald and
Bakermans 2006), is commonly used in conservation efforts, and far exceeds average territory
size of birds breeding at our sites.
As part of a complementary study, an index of urbanization was created based on a
principal components analysis of landscape metrics within 1 km based on recent digital
orthophotos (Rodewald and Shustack 2008). The first principal component (hereafter termed the
“urban index”) explained 80% of the variation among sites and was positively associated with
number of buildings (0.92), percent cover by roads (0.94), pavement (0.90), and lawn (0.88), but
negatively associated with percent cover by agriculture (-0.83). Rural landscapes were
dominated by cropland, pasture, managed grassland, and farms. Urban landscapes, in contrast,
were dominated by residential areas, commercial development, and roads.
An index of honeysuckle dominance was derived from vegetation measurements collected at
four systematically-located 0.04-ha plots at each site. The honeysuckle dominance index
reflects the proportion of plots where honeysuckle was one of the three most abundant
understory woody plants at the site (Rodewald 2012). We were interested in this relative rather
than absolute measure of honeysuckle at a site because our previous experience and research
suggests that the impact of honeysuckle and the manner in which it affects the breeding birds is a
function of dominance rather than abundance (Rodewald et al. 2010, Rodewald 2012). Previous
analyses showed that, with the exception of honeysuckle cover, forest structure among sites was
comparable (Rodewald 2012).
Acc
epte
d A
rtic
le
This article is protected by copyright. All rights reserved.
Nest monitoring
From March-August 2001-2011 the fate of 4906 nests were monitored, represented by northern
cardinal (Cardinalis cardinalis, n = 2924), American robin (Turdus migratorius, n = 826),
Acadian flycatcher (Empidonax virescens, n = 563), gray catbird (Dumetella carolinensis, n =
285) wood thrush (Hylocichla mustelina, n = 232), indigo bunting (Passerina cyanea, n = 39),
and red-eyed vireo (Vireo olivaceous, n = 37). Our trained field crews mapped locations of
territorial birds at sites, thereby allowing us to determine densities of focal species, we believe
that differences in numbers of nests among species generally reflects the relative abundance of
our focal species at sites. Acadian flycatcher, wood thrush, indigo bunting, and red-eyed vireos
are urban-avoiding Neotropical migrants that occurred at low numbers at our sites, whereas the
resident northern cardinal, temperate migrant American robin, and Neotropical migrant gray
catbird were most abundant within urban landscapes and, with the exception of the catbird, bred
in higher numbers at our urban than rural sites (Rodewald and Bakermans 2006).
Each nest was checked at 2-4 day intervals by viewing nest contents or by observing
parental behavior to track nest stage (e.g., onset of incubation behavior) and locate young
fledglings, when possible. To avoid exposing nests to predators as a consequence of our visits,
we observed nests from as far a distance as possible (often >10 m), as briefly as possible, and
from different routes each time. If a predator was observed in the vicinity, we delayed checking
the nest. The plant species within which each nest was located was recorded.
Acc
epte
d A
rtic
le
This article is protected by copyright. All rights reserved.
Nest predators
Nest predators were surveyed at each site within 2-ha grids flagged at 50-m intervals at
weekly intervals between May and July 2004-2011, totaling 10 surveys each year. During
surveys a trained observer systematically traversed the entire marked grid over an approximately
45-min period between 0545-1000 and recorded all nest predators seen or heard.
To construct an ecologically meaningful measure of predator numbers, we determined
which species were actual, not only hypothetical, predators in our study system. This
information came from a complementary study where nest predator species were identified at 99
incidents of nest predation that were video-recorded across the rural-urban gradient (Rodewald
and Kearns 2011) While these data were insufficient to construct a plant-bird-predator
network, the data allowed us to include only relevant species in our predator measure. There
were 21 species of known predators at our sites, including corvids, raptors, squirrels, common
grackles (Quiscalus quiscala), brown-headed cowbirds (Molothrus ater), raccoons (Procyon
lotor), opossum (Didelphis virginiana), and domestic cats (Felis catus).
Because (1) detections of nest predator species were correlated and (2) most species were
comparable in contribution to depredations with no single predator dominating the system (i.e.,
the most dominant predator still only accounted for 18% of depredations; Rodewald and Kearns
2011), detections were pooled across all known predator species within a 2-ha grid at each site in
each year. Being based upon number of detections, the measure better represents the relative
activity of predators than actual densities at sites.
Acc
epte
d A
rtic
le
This article is protected by copyright. All rights reserved.
ANALYSES
Daily nest survival rates were estimated for each species at each site in each year using logistic
exposure models. The logistic exposure model is a generalized linear model that specifies a
binomial error distribution and a link function similar to a logit link function adjusted for length
of exposure for each nest (Shaffer, 2004 in SAS 9.2). The logistic exposure model estimates
probability of nest survival (either 0 for failed nests of 1 for surviving nests) between each nest
check thereby eliminating potential bias due to different exposure periods. Predation was
responsible for most nest failures (>95%), and we omitted the few nests whose failure was
confirmed to be unrelated to predators (e.g., weather).
Over 10 years, 141 networks were quantified, comprising a total of 71 plant species and 7
species of understory-nesting birds. Because several sites were added halfway through the study
period (i.e., not monitored during the early years of the study), our sample of networks is fewer
than the hypothetical maximum of 190. We considered the pattern of birds nesting on plants to
be weighted bipartite networks in which a link between a plant and a bird species is established if
that bird nests on that plant. To construct these networks, each site and year is represented by a
separate matrix where each row represents a plant species and each column represents a bird
species. There is a link when a species of bird has placed a nest in a given plant species. The
weight of the link is represented by the number of nests on the plant species. Five network
statistics were computed for each site and year: nestedness, modularity, evenness for plants,
evenness for birds, and evenness for the whole network (see below for details). Nestedness
measures how plants used by specialist birds for nesting are a subset of those plants used by the
Acc
epte
d A
rtic
le
This article is protected by copyright. All rights reserved.
more generalist ones, and how birds nesting on specialist plants were a subset of those nesting on
more generalist ones. Nestedness was based on the presence or absence of nests and calculated
using the NODF measure (i.e., nestedness measure based on overlap and decreasing fills;
Almeida-Neto et al. 2008, Guimarães and Guimarães 2006). Because NODF is dependent on
network size and connectance, we relativized its value from what we could expect from a
similarly randomly built matrix (Bascompte et al. 2003). From a community perspective,
generalist invaders can increase the amount of nestedness in a network because as the most
connected species, they become the central nodes (Aizen et al. 2008, Bartomeus et al. 2008).
Nestedness also may provide a buffer against secondary extinctions because if specialists are lost
from a network, interactions among the remaining species will likely persist if the network is
nested (Tylianakis et al. 2010). From the predator-prey standpoint of greatest interest to us, a
more nested community should facilitate search efforts of predators given that certain plant-bird
associations will be common to many, if not most, communities.
Modularity is a measure of how compartmentalized the network structure is in relation to
a random occupancy pattern of plants by birds, i.e., to what extent some groups of bird species
tend to nest on some groups of plant species but not on plants associated with other groups.
Modularity was computed in Matlab using the spectral algorithm adapted to bipartite graph
(Barber 2007). Because modularity is partly a function of network size and connectance, we also
calculated relative modularity as (M − M̅ random)/M̅ random, where M̅ random was average modularity
of the random runs. Compartmentalization is often thought to increase stability of networks
because disturbances should spread more slowly, but empirical support for this idea is lacking
(Tylianakis et al. 2010).
Acc
epte
d A
rtic
le
This article is protected by copyright. All rights reserved.
Evenness quantified the homogeneity or symmetry in interaction strength. This is similar to the
standard Shannon diversity index, only applied to interactions rather than species, and
standardized by network size. We expected evenness to decline as sites were invaded by exotic
shrubs that were used as nest substrate by many understory-breeding birds in our study area.
Moreover, we predicted that in more even sites (i.e., where nests are partitioned such that
individuals and species nest in different locations), predators would have more difficulty locating
nests than in sites with very asymmetric interactions. Evenness was calculated for plants solely,
birds solely, and the complete network, respectively, using the following equations:
( )
( )1
log
log
plantS
i ii
plant
plant
p pJ
S=
−=∑
,
where Splant is the number of plants and pi is the proportion of nests in plant i.
( )( )
1
log
log
birdS
i ii
birdbird
p pJ
S=
−=∑
,
where Sbird is the number of birds and pi is the proportion of nests from bird i.
( )( )
, ,,
log
log
i j i ji j
all
plant bird
p p
JS S
−=
⋅
∑,
where pi,j is the proportion of nests from bird j in plant i. These calculations were performed in
R.
A different network was constructed for each year, and all analyses used repeated
measures regression with year as the repeated variable in PROC MIXED SAS 9.2. For each site
Acc
epte
d A
rtic
le
This article is protected by copyright. All rights reserved.
and year, daily nest survival rate was calculated by averaging across species. The relationship
between evenness and nest survival was tested using a mixed model with site as a random effects
variable. An information-theoretic approach (Akaike’s information criterion; AIC) was used to
compare the ability of network, habitat, and landscape metrics to explain variation in nest
survival among sites. AIC approaches allow one to evaluate the weight of evidence for multiple
alternative hypotheses (a priori models), even in cases where predictor variables are correlated.
Based on our previous research in the system, we hypothesized that avian nest survival might be
influenced by relative intensity of urbanization within 1-km (i.e., the urban index), extent of
invasion by the exotic shrub, Lonicera maackii, and the structure of the bird-plant network, as
represented by qualitative (nestedness and modularity) and quantitative network measures (plant
evenness, bird evenness, total network evenness).
Because predator numbers were positively correlated with urbanization (r = 0.35, P =
0.0002, n=108) and negatively correlated with evenness of networks (r = -0.417, P <0.0001, n =
108), we used the residuals of predator numbers regressed on evenness as our predator metric.
The relationship between evenness and nest survival was expected to be partly a function of the
number of predators at the site (e.g., evenness may only be important when predators are
abundant, and unimportant when there are few predators). Therefore, with our reduced dataset
for which we had predator abundance data (108 networks), a mixed model was run with
evenness and the residual of predator numbers as main effects and an evenness*predator residual
interaction.
Acc
epte
d A
rtic
le
This article is protected by copyright. All rights reserved.
We also examined the possibility that the observed demographic outcomes of evenness
were the consequence of shifts in the importance of certain predators. To do this, the proportions
of recorded depredation events attributed to different predator groups (mesopredator, small
mammal, raptor, corvid, small bird, and snake) were calculated from the video-recorded
depredation events. The predator identity data were analyzed with a canonical correlation
analysis to determine if composition of the predator community was related to evenness of the
network or to nesting success.
Results
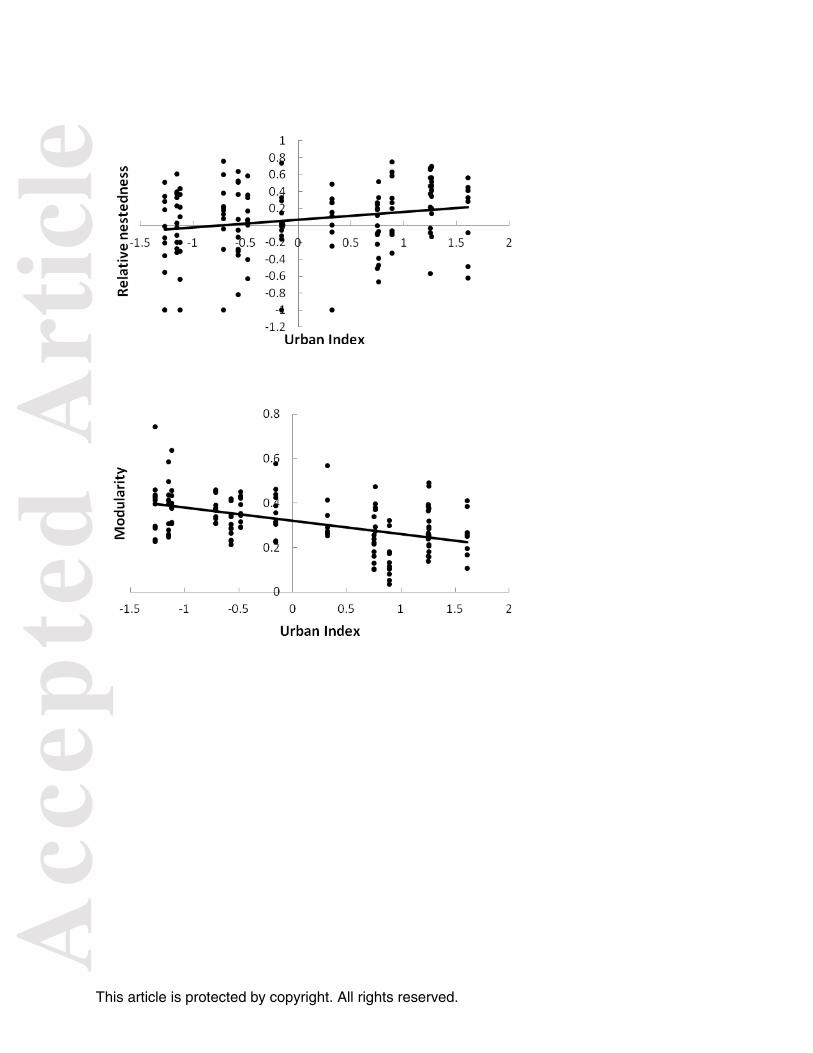
Network size declined as landscapes surrounding forests urbanized. As urbanization increased,
the relative nestedness of bird-plant networks increased (β = 0.09 + 0.036SE, F1,139 = 6.79, P =
0.01), though relative modularity was unchanged (F1, 139 = 0.85, P =0.359). In contrast, network
size (β = -1.03 + 0.30SE, F1,139 = 12.20, P <0.01), absolute modularity (β = - 0.06 + 0.009SE,F1,
139 = 40.5, P <0.01), and evenness of interaction strengths, hereafter interaction evenness,
decreased as landscapes surrounding forests urbanized (plant β = - 0.06 + 0.01SE, F1, 139 = 40.72,
P <0.01; bird β = - 0.08 + 0.012SE, F1, 139 = 41.35, P <0.01, network β = - 0.04 + 0.006SE, F1, 139
= 34.05, P <0.01) (Fig. 2). Thus, urban networks were smaller, less compartmentalized, and
were dominated by a few strong interactions compared to networks from rural landscapes.
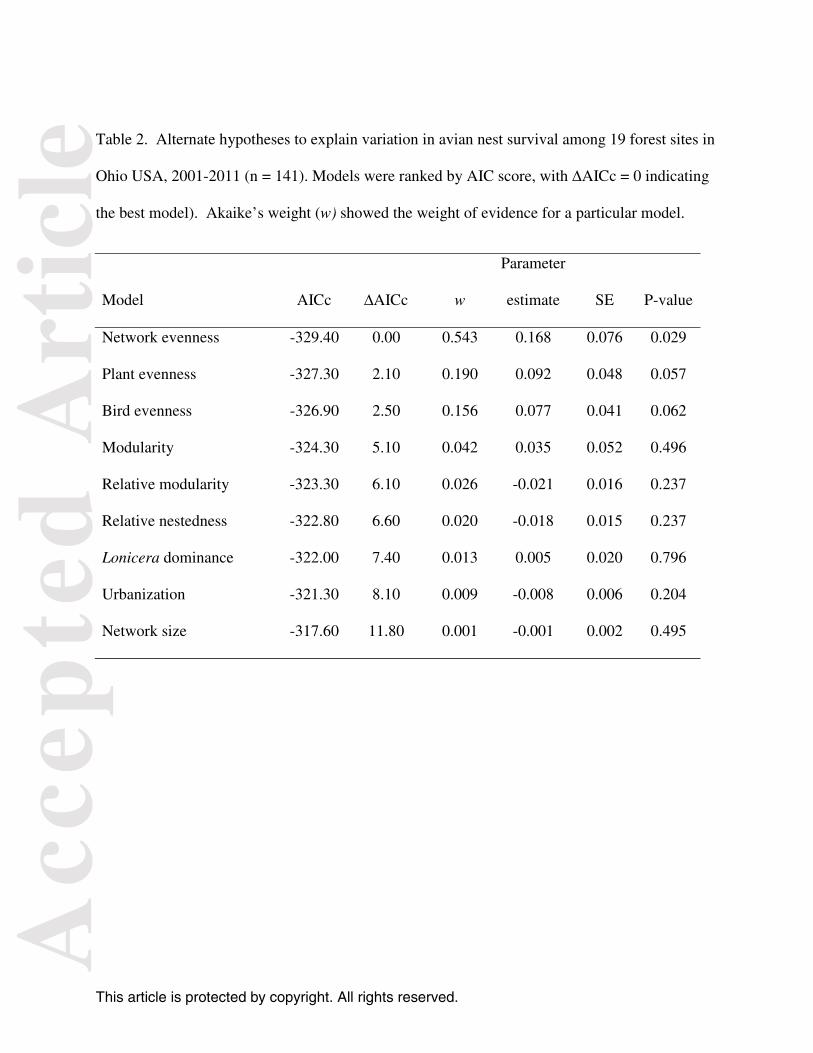
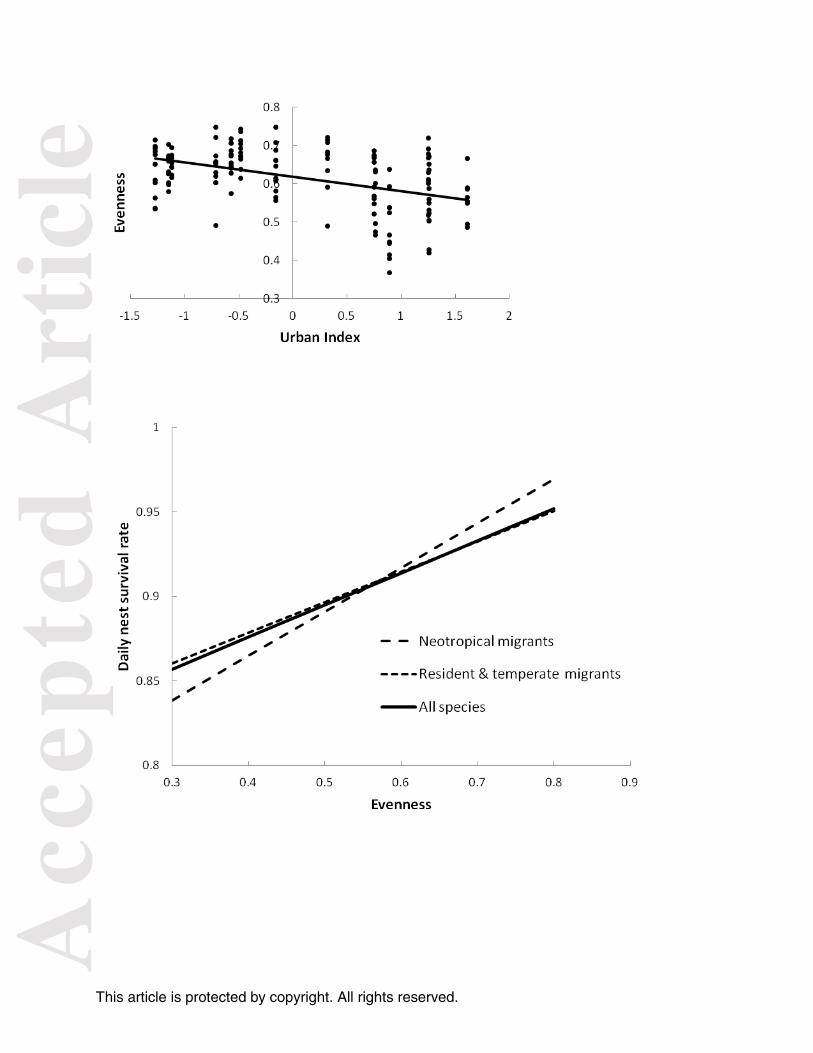
Interaction evenness of the entire network was positively related to nest survival (F1, 139 = 4.90, P
= 0.03) and best explained variation in survival among sites, performing better than measures of
urbanization or invasion (Table 2). The same pattern of model rankings persisted when the
subset of sites for which we had predator abundance data (n = 108); predator numbers ranked as
Acc
epte
d A
rtic
le
This article is protected by copyright. All rights reserved.
the lowest model (ΔAICc = 10) and evenness for the entire network as the top ranked model.
The collective weight of evidence for evenness (for plant, bird, and whole networks) was 0.914,
providing strong support that evenness predicted nest success better than other metrics. Nest
survival increased with interaction evenness for the network (95% confidence interval of βentire
network: 0.02 – 0.32), and showed similar trends for plants (95% confidence interval of βplants: 0 –
0.19) and birds alone (95% confidence interval of βbirds: -0.01 – 0.16). This pattern held for both
the resident and migratory birds in our system (Figure 3).
When accounting for predator numbers with our reduced dataset, daily nest survival
remained positively related to evenness (β = 0.151+ 0. 086 SE, F1,104 = 3.04, P = 0.08) but not
significantly related to either predator numbers (F1,104 = 2.29, P = 0.13) and a predator*evenness
interaction (F1,104 = 1.56, P = 0.21). Thus, the number of predators did not appear to drive the
relationship that we observed between nest survival and network structure.
Shifts in the species composition of the predator community also are unlikely to drive observed
patterns as the relative importance of different predator groups (e.g., mesopredator, raptor) were
not significantly related to either evenness of networks (Wilks’ Lambda F6,5 = 0.28, P = 0.926)
nor to daily nest survival (Wilks’ Lambda F6,5 = 1.56, P = 0.322). Likewise, when predator
identifications (i.e., from nest videos) were pooled across years and sites to compare a rural to an
urban predator-bird network, the evenness scores were comparable with 17.86 for rural and
16.78 for urban.
Acc
epte
d A
rtic
le
This article is protected by copyright. All rights reserved.
Discussion
Urbanization within landscapes surrounding riparian forests was associated with changes
to ecological networks of birds and the plants in which they nested. As landscapes surrounding
riparian forests urbanized, networks were smaller, more nested, less compartmentalized, and
dominated by stronger interactions than rural networks. These shifts in network structure are
consistent with environmental changes known to occur in riparian forests as the surrounding
landscapes become more urban (Rodewald 2013). Most notably, as landscapes urbanize, the
understory of forests becomes increasingly dominated by the exotic and invasive shrub, Amur
honeysuckle (Borgmann and Rodewald 2005). Invasion by honeysuckle reduces the diversity
and abundance of native plants (Gould and Gorchov 2000, Gorchov and Trisel 2003, Miller and
Gorchov 2004), which would reduce network size in the heavily invaded urban forests. The
higher nestedness and lower modularity of more urban forests likely reflects the fact that
generalist invaders like honeysuckle become the most connected species and the central nodes of
sites (Aizen et al. 2008, Bartomeus et al. 2008). This becomes relevant to predator-prey
interactions because when so many interactions are directed towards honeysuckle, predators can
more easily form search images and patterns that increase their efficiency locating nests.
More important than describing shifts in network structure, our study shows that changes
to network structure can have demographic consequences across multiple species within a
community and is the first to demonstrate this with vertebrates. The strength of interactions at
higher trophic levels (i.e., rate of predation reflects the outcome of interactions between
predators and prey) was mediated by interactions at lower levels (i.e., the distribution and
relative abundance of bird nests among plants). The evenness of the network, or the symmetry
of interaction strengths, was positively related to avian nest survival – even after accounting for
Acc
epte
d A
rtic
le
This article is protected by copyright. All rights reserved.
variation among sites in numbers of predators. Thus, when nests were more evenly distributed
among plants, nest survival improved.
Our finding that network structure changed with urbanization is consistent with research
on the response of parasite-parasitoid networks to habitat modification. Albrecht et al. (2007)
reported that interaction diversity, evenness, and linkage density of networks of host-prey and
parasitoid-predator insects were higher in restored than intensively managed meadows, with
interaction diversity declining more rapidly than species diversity. For networks of 33 species of
cavity-nesting bees, wasps, and their parasitoids, evenness of interaction frequencies declined
with increasing intensity of habitat modification in agriculturally managed systems, likely due to
differences in species density (Tylianakis et al. 2007). Moreover, the decline in interaction
evenness was associated with greater top-down pressures – in their case, parasitism rates. In
contrast, others have reported higher evenness of interactions in the more highly modified sites,
as with plants and pollinators in urban compared to agricultural or suburban sites (Geslin et al.
2013) and cereal aphid-parasitoid-hyperparasitoid communities in conventional versus organic
winter wheat fields (Lohaus et al. 2013).
The positive relationship that we found between interaction evenness and avian nest
success may stem from the manner in which nest partitioning (i.e., when individuals and species
nest in different locations) affects predator search efficiency. The pattern we report is consistent
with field experiments with understory-nesting birds showing that nest predation declines with
greater partitioning of nests among vegetation strata and substrates (Martin 1988). Likewise,
previous research in our system indicates that birds nesting in honeysuckle face a higher risk of
Acc
epte
d A
rtic
le
This article is protected by copyright. All rights reserved.
depredation in early spring when the majority of nests were placed in early-leafing honeysuckle
and multiflora rose (Rosa multiflora) (i.e., less partitioning in April and early May), as opposed
to later in the season (June-August) when nests were more widely distributed across strata and
substrates (Rodewald et al. 2010). The penalty for nesting in a common location was substantial;
birds that nested in honeysuckle early in the season, when most nests were placed in
honeysuckle, had 20% lower annual reproductive output than those nesting in other plants, even
after renesting (Rodewald et al. 2010). This difference in nest survival in our system was likely
attributable to changes in search efficiency of predators, especially given that (1) the community
of plants, birds, and predators at a site was similar throughout the season and (2) height of nests
in honeysuckle and rose (i.e., accessibility) did not change over the season. In our current
examination of networks, as bird-plant interactions became increasingly asymmetric and
networks were dominated by a few strong links to exotic plants, predators were more successful
locating the less partitioned nests. This reduction in daily nest survival rates can translate to half
the apparent nesting success – from approximately 22% to 11% of nests succeeding over a 21-
day nest cycle across the range of evenness values we measured.
That evenness was a stronger determinant of nest survival than the number of predators
detected at sites may initially seem counterintuitive. However, this pattern likely reflects the
effects of anthropogenic resources on predators. Sites with rich sources of human-provided food
often support high densities of generalist predators (Marzluff et al. 2001, Gehrt 2004, Prange and
Gehrt 2004), which frequently shift foraging behavior to rely more heavily on those
anthropogenic resources. This shift can result in a “predator paradox”, where high predator
numbers in cities are not matched with correspondingly high rates of nest predation (Fischer et
Acc
epte
d A
rtic
le
This article is protected by copyright. All rights reserved.
al. 2012). The predator paradox is consistent with patterns detected in empirical demographic
studies (Rodewald et al. 2011, Stracey 2011) as well as in literature reviews (Fischer et al. 2012).
Our study shows that knowledge of landscape or habitat attributes, as typically measured in
ecological studies, was not sufficient to predict the demographic consequences of environmental
change. This finding is consistent with the equivocal support linking urbanization to rates of nest
predation in other studies (Chamberlain et al. 2009). In our study, neither the amount of
urbanization nor the degree of invasion by honeysuckle explained variation in nest survival.
Rather, explicit knowledge of species interactions, as measured by interaction evenness, was
necessary to explain patterns. Because urbanization was directly related to network structure but
only indirectly to nest survival, we propose that inter-site variation in nest survival reflected how
species interactions responded to urbanization. In this way, demographic effects of urbanization
were filtered through the network.
Scientists and managers have long known that the complexity of ecological communities
thwarts many efforts to predict the response of ecosystems to environmental change. This study
provides compelling evidence that knowledge of multispecies interactions is requisite to
understand demographic responses to anthropogenic change. Network approaches, thus, offer
elegant and practical means to describe and analyze the complexity of multispecies interactions
within applied ecological research.
Acc
epte
d A
rtic
le
This article is protected by copyright. All rights reserved.
Acknowledgments
Support for this research was provided by NSF DEB-0340879 and DEB- 0639429, Ohio
Division of Wildlife, and US Fish and Wildlife Service (ADR), European Research Council
through an Advanced Grant (JB), the FP7-REGPOT-2010-1 program project 264125 EcoGenes
(RPR), a JAE-Doc postdoctoral fellowship from the Program “Junta para la Ampliacion de
Estudios” co-funded by the Fondo Social Europeo (MAF), and the Marie Curie International
Outgoing Fellowship within the 7th European Community Framework Programme (MAF). The
Ohio State University supported ADR’s contributions to this paper while on sabbatical, and
Estación Biológica de Doñana (EBD– CSIC) provided office space and support. Our deep
gratitude goes to the many graduate students, especially D. Shustack, L. Kearns, I. Ausprey, M.
Bakermans, K. Borgmann, L. Leston, J. Malpass, D. Narango, B. Padilla, S. Rose, L. Rowse, J.
Smith-Castro, and others who have spent countless hours collecting field data. We are grateful
to Franklin County Metro Parks, Columbus Recreation and Parks, Ohio Division of Wildlife,
The Nature Conservancy, City of Bexley, Gahanna Parks and Recreation and private landowners
for access to study sites. All research was conducted in accordance with approved protocol by
Ohio State University’s Institutional Animal Use and Care Committee (2010A0003, 2007A0015,
2004A0047, 00A0167) and banding was conducted under US Federal Bird Banding Permit
22272.
References
Albrecht M., Duelli, P., Schmid, B., & Mueller, C.B. (2007) Interaction diversity within
quantified insect food webs in restored and adjacent intensively managed meadows.
Journal of Animal Ecology, 76, 1015-1025.
Acc
epte
d A
rtic
le
This article is protected by copyright. All rights reserved.
Almeida-Neto M., Guimarães P, Guimaraes P.R., Loyola R.D., & Ulrich W. (2008) A
consistent metric for nestedness analysis in ecological systems: reconciling concept and
measurement. Oikos 117,:1227-1239.
Aizen M.A., Morales, C.L. & Morales, J.M. (2008). Invasive mutualists erode native pollination
webs. Plos Biology 6, 396-403.
Barber M.J. (2007) Modularity and community detection in bipartite networks. Physical Review
E 76, 066102.
Bartomeus, I., Vila, M., Santamaria, L. (2008) Contrasting effects of invasive plants in plant-
pollinator networks. Oecologia 155, 761-770.
Bascompte, J. (2009) Disentangling the Web of Life. Science, 325, 416-419.
Bascompte, J. & Jordano, P. (2007) Plant-animal mutualistic networks: The architecture of
biodiversity. Annual Review of Ecology Evolution and Systematics , 38, 567-593.
Bascompte J., Jordano, P. Melian, C.J., & Olesen J.M. (2003) The nested assembly of plant-
animal mutualistic networks. Proceedings of the National Academy of Sciences of the
United States of America 100, 9383-9387.
Bastolla, U., Fortuna, M.A., Pascual-Garcia, A., Ferrera, A., Luque, B. & Bascompte, J. (2009)
The architecture of mutualistic networks minimizes competition and increases
biodiversity. Nature, 458, 1018-U91.
Acc
epte
d A
rtic
le
This article is protected by copyright. All rights reserved.
Blick, R. & Burns, K.C. (2009) Network properties of arboreal plants: Are ephiphytes,
misletoes, and lianas structured similarly? Perspectives in Plant Ecology, Evolution, and
Systematics 11:41-52.
Borgmann, K.L. & Rodewald, A.D. (2005) Forest restoration in urbanizing landscapes:
Interactions between land uses and exotic shrubs. Restoration Ecology, 13, 334-340.
Borgmann, K.L. & Rodewald, A.D. (2004) Nest predation in an urbanizing landscape: The role
of exotic shrubs. Ecological Applications, 14, 1757-1765.
Burns, K.C. (2007) Network properties of an ephiphytic meta-community. Journal of
Theoretical Biology 249:307-313.
Chamberlain, D.E., Cannon, A.R., Toms, M.P., Leech, D.I., Hatchwell, B.J. & Gaston, K.J.
(2009) Avian productivity in urban landscapes: a review and meta-analysis. Ibis , 151, 1-
18.
Fischer, J.D., Cleeton, S.H., Lyons, T.P., & Miller. J.R. (2012) Urbanization and the predation
paradox: The role of trophic dynamics in structuring vertebrate communities. Bioscience
62, 809-818.
Gagic V., Tscharntke, T., Dormann, C.F., Gruber, B., Wilstermann, A., & Thies C. (2011) Food
web structure and biocontrol in a four-trophic level system across a landscape complexity
gradient. Proceedings of the Royal Society B-Biological Sciences 278, 2946-2953.
Acc
epte
d A
rtic
le
This article is protected by copyright. All rights reserved.
Gehrt, S.D. (2004) Ecology and management of striped skunks, raccoons, and coyotes in urban
landscapes. . Pages 81-104 in Fascione, N., Delach, A., Smith, M., editor. People and
Predators: From Conflict to Conservation. Island Press.
Geslin, B., Gauzens, B. Thebault, E., Dajoz, I. (2013) Plant pollinator networks along a gradient
of urbanization. PLoS ONE 8 (5): e63421.
Gómez J.M,, Perfectti, F. & Jordano, P. (2011) The functional consequences of mutualistic
network architecture. Plos One 6:e16143.
Gorchov, D. L. and D. E. Trisel. (2003) Competitive effects of the invasive shrub, Lonicera
maackii (Rupr.) Herder (Caprifoliaceae) on the growth and survival of native tree
seedlings. Plant Ecology 166,13-24.
Gould, A. M. A., and D. L. Gorchov. (2000) Effects of the exotic invasive shrub Lonicera
maackii on the survival and fecundity of three species of native annuals. American
Midland Naturalist 144, 36-50.
Grosbois, V., Gimenez, O, Gaillard, J. -M., Pradel, R., Barbraud, C., Clobert, J., Moller, A. P.,
Weimerskirch, H. (2008) Assessing the impact of climate variation on survival in vertebrate
populations. Biological Reviews 83:357-399.
Guimarães P. R., Guimarães, P. (2006) Improving the analyses of nestedness for large sets of
matrices. Environmental Modelling & Software 21, 1512-1513.
Hagen, M., Kissling, W. D., Rasmussen, C., De Aguiar, M.A. M, Brown, L.E., Carstensen, D.
W., Alves-Dos-Santos, I., Dupont, Y.L, Edwards, F.K., Genini, J, Guimaraes, P. R.,
Jenkins, G. B., Jordano, P., Kaiser-Bunbury, C. N., Ledger, M. E, Maia, K.P., Darcie
Acc
epte
d A
rtic
le
This article is protected by copyright. All rights reserved.
Marquitti, F.M., Mclaughlin, O., Morellato, L. P.C., O'Gorman, E. J., Trojelsgaard, K.,
Tylianakis, J. M., Vidal, M., Woodward, G., Olesen, J.M. (2012) Biodiversity, species
interactions and ecological networks in a fragmented world. Advances in Ecological
Research 46:89-210.
Lohaus, K., Vidal, S., & Thies, C. (2013) Farming practices change food web structures in cereal
aphid-parasitoid-hyperparasitoid communities. Oecologia 171:249-259.
Leston, L.F.V. & Rodewald, A.D. (2006) Are urban forests ecological traps for understory birds?
An examination using Northern cardinals. Biological Conservation, 131, 566-574.
Martin T.E. (1988) On the advantage of being different: nest predation and the coexistence of
bird species. Proceedings of the National Academy of Sciences of the United States of
America 85, 2196-99.
Marzluff, J.M., Bowman, R. & Donnelly, R.E. (2001) Avian Ecology and Conservation in an
Urbanizing World.. Kluwer Academic Publishers, MA.
Miller, K. E. and D. L. Gorchov. 2004. The invasive shrub, Lonicera maackii, reduces growth
and fecundity of perennial forest herbs. Oecologia 139, 359-375.
Prange, S, Gehrt,S.D. & Wiggers, E.P. (2004) Influences of anthropogenic resources on
raccoon (Procyon lotor) movements and spatial distribution. Journal of Mammalogy 85,
483–490.
Acc
epte
d A
rtic
le
This article is protected by copyright. All rights reserved.
Rodewald, A.D. (2012) Evaluating factors that guide avian community response to urbanization.
Pages 71-92 in Urban Bird Ecology & Conservation (C.A. Lepczyk and P.S. Warren,
editors), Studies in Avian Biology No. 45.
Rodewald, A.D. & Bakermans, M.H. (2006) What is the appropriate paradigm for riparian forest
conservation? Biological Conservation, 128, 193-200.
Rodewald, A.D. & Shustack, D.P. (2008) Urban flight: understanding individual and population-
level responses of Nearctic-Neotropical migratory birds to urbanization. Journal of
Animal Ecology 77, 83-91.
Rodewald, A.D., Shustack, D.P. & Hitchcock, L.E. (2010) Exotic shrubs as ephemeral ecological
traps for nesting birds. Biological Invasions, 12, 33-39.
Salewski, V., Hochachka, W.M., Fiedler, W. (2013) Multiple weather factors affect apparent
survival of European passerine birds. PLoS ONE 8(4): e59110.
Sáyago, R., Lopezaraiza-Mikel, M., Quesada, M., Álvarez-Añorve, M.Y., Cascante-Marin, A., &
Bastida, J.M. (2013) Evaluating factors that predict the structure of commensalistic
ephiphtye-phorophyte network. Proceedings of the Royal Society B. 20122821.
Schaub, M., Jakober, H., Stauber, W. (2011) Demographic response to environmental variation
in breeding, stopover, and non-breeding areas in a migratory passerine. Oecologia
167:445-459.
Shaffer, T.L. (2004) A unified approach to analyzing nest success. Auk , 121, 526-540.
Acc
epte
d A
rtic
le
This article is protected by copyright. All rights reserved.
Spiesman, B.J. & Inouye, B.D. (2013) Habitat loss alters the architecture of plant-pollinator
interaction networks. Ecology 94: 2688-2696.
Spotswood, E.N., Meyer, J.Y., Bartolome, J.W. (2012) An invasive tree alters the structure of
seed dispersal networks between birds and plants in French Polynesia. Journal of
Biogeography 39:2007-2020.
Stracey, C.M. (2011) Resolving the urban nest predator paradox: The role of alternative foods
for nest predators. Biological Conservation , 144, 1545-1552.
Strauss S.Y., Irwin, R.E. (2004) Ecological and evolutionary consequences of multispecies
plant-animal interactions. Annual Review of Ecology Evolution and Systematics 35, 435-
466.
Tylianakis J.M., Tscharntke, T. & Lewis, O.T. (2007). Habitat modification alters the structure
of tropical host-parasitoid food webs. Nature 445, 202-205.
Tylianakis J.M., Laliberte, E., Nielsen, A., & Bascompte, J. (2010) Conservation of species
interaction networks. Biological Conservation 143, 2270-2279.
Acc
epte
d A
rtic
le
This article is protected by copyright. All rights reserved.
Table 1. Landscape composition surrounding 19 riparian forest study sites and the
species for which nest survival was monitored in central Ohio, 2001-2011.
Proportion
Forest Width
(m)
Number Building
s Agricultur
e Mowe
d Paved Roa
d
Urban Index
ngalena 135 34 0.36 0.05 0.01 0.01 -1.27
pubhunt 194 210 0.32 0.08 0.01 0.01 -1.15
prairie 148 58 0.47 0.12 0.03 0.02 -1.12
tnc 292 340 0.41 0.11 0.03 0.03 -0.96
girlcamp 200 377 0.23 0.15 0.02 0.01 -0.82
creeks 133 92 0.10 0.1 0.04 0.02 -0.71
sgalena 163 185 0.14 0.3 0.02 0.01 -0.57
galena 277 360 0.15 0.22 0.04 0.02 -0.48
elkrun 167 812 0.31 0.27 0.06 0.05 -0.16
campmary 565 681 0 0.34 0.07 0.04 0.21
woodside 104 1227 0.11 0.40 0.07 0.05 0.32
rushrun 150 1611 0 0.41 0.09 0.06 0.75
cherry 165 997 0.02 0.36 0.16 0.07 0.76
kenny 126 1733 0 0.34 0.17 0.06 0.89
bexley 133 1692 0 0.5 0.14 0.08 1.23
casto 202 1776 0 0.42 0.20 0.08 1.25
lou 156 2272 0 0.28 0.23 0.08 1.26
bigwal 115 2233 0 0.45 0.16 0.08 1.31
tuttle 160 2285 0 0.34 0.30 0.09 1.61
Acc
epte
d A
rtic
le
This article is protected by copyright. All rights reserved.
Table 2. Alternate hypotheses to explain variation in avian nest survival among 19 forest sites in
Ohio USA, 2001-2011 (n = 141). Models were ranked by AIC score, with ∆AICc = 0 indicating
the best model). Akaike’s weight (w) showed the weight of evidence for a particular model.
Model AICc ∆AICc w
Parameter
estimate SE P-value
Network evenness -329.40 0.00 0.543 0.168 0.076 0.029
Plant evenness -327.30 2.10 0.190 0.092 0.048 0.057
Bird evenness -326.90 2.50 0.156 0.077 0.041 0.062
Modularity -324.30 5.10 0.042 0.035 0.052 0.496
Relative modularity -323.30 6.10 0.026 -0.021 0.016 0.237
Relative nestedness -322.80 6.60 0.020 -0.018 0.015 0.237
Lonicera dominance -322.00 7.40 0.013 0.005 0.020 0.796
Urbanization -321.30 8.10 0.009 -0.008 0.006 0.204
Network size -317.60 11.80 0.001 -0.001 0.002 0.495
Acc
epte
d A
rtic
le
This article is protected by copyright. All rights reserved.
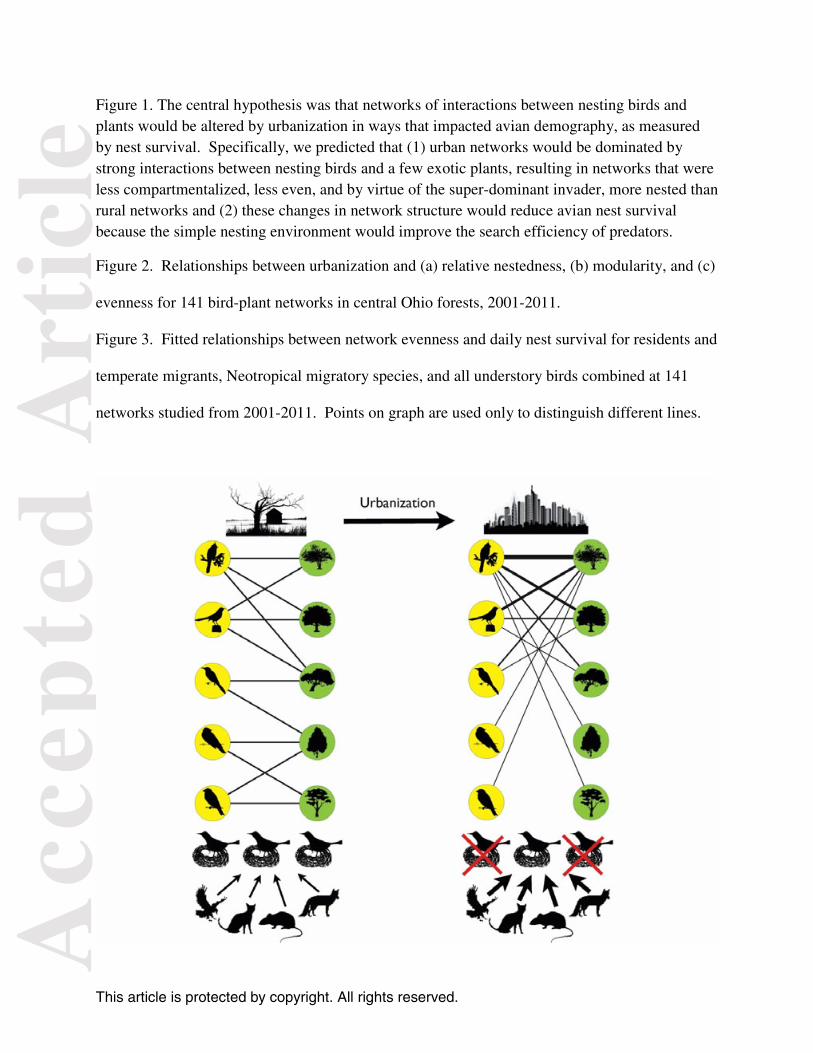
Figure 1. The central hypothesis was that networks of interactions between nesting birds and plants would be altered by urbanization in ways that impacted avian demography, as measured by nest survival. Specifically, we predicted that (1) urban networks would be dominated by strong interactions between nesting birds and a few exotic plants, resulting in networks that were less compartmentalized, less even, and by virtue of the super-dominant invader, more nested than rural networks and (2) these changes in network structure would reduce avian nest survival because the simple nesting environment would improve the search efficiency of predators.
Figure 2. Relationships between urbanization and (a) relative nestedness, (b) modularity, and (c)
evenness for 141 bird-plant networks in central Ohio forests, 2001-2011.
Figure 3. Fitted relationships between network evenness and daily nest survival for residents and
temperate migrants, Neotropical migratory species, and all understory birds combined at 141
networks studied from 2001-2011. Points on graph are used only to distinguish different lines.
Acc
epte
d A
rtic
le
This article is protected by copyright. All rights reserved.
Acc
epte
d A
rtic
le
This article is protected by copyright. All rights reserved.