Embed Size (px)
Citation preview
Maple Ridge Immigrant Demographics I Page 1
MAPLERIDGE
COMMUNITY PROFILE
Maple Ridge Immigrant Demographics I Page 2
MAPLE RIDGE Your quick and easy look at facts and figures
around immigration. Newcomers are an
important and growing part of your community.
Here’s what you need to know.IMMIGRANT DEMOGRAPHICS
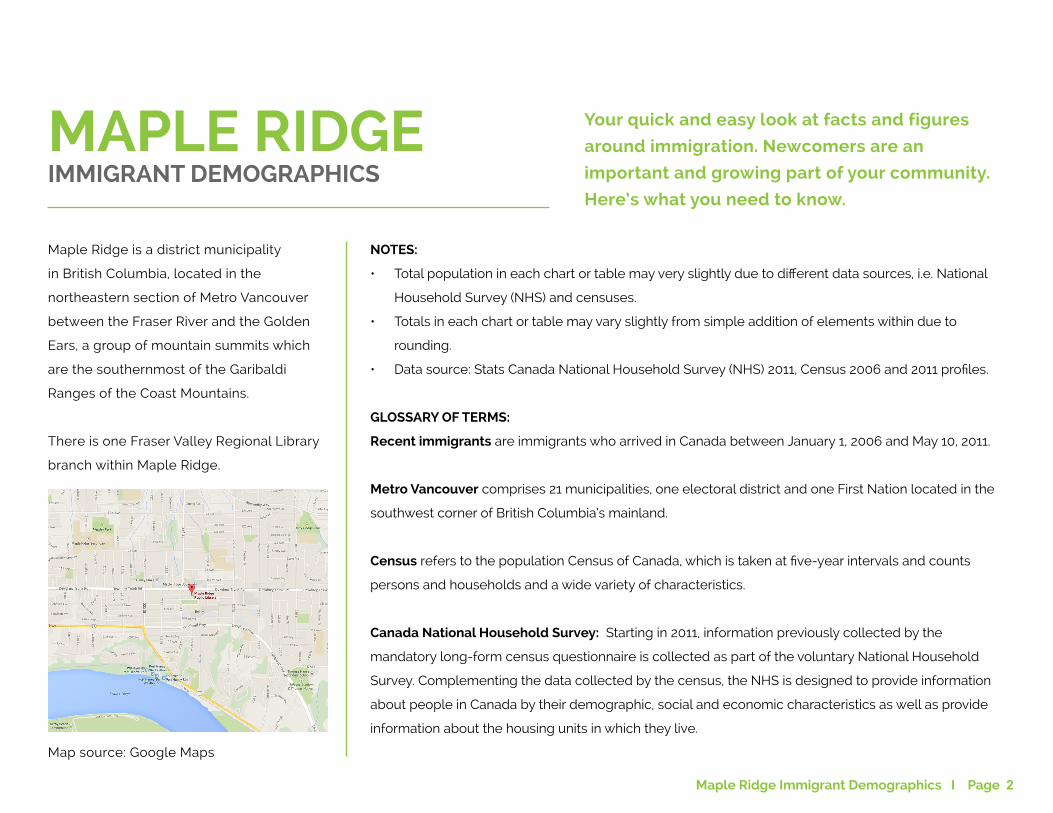
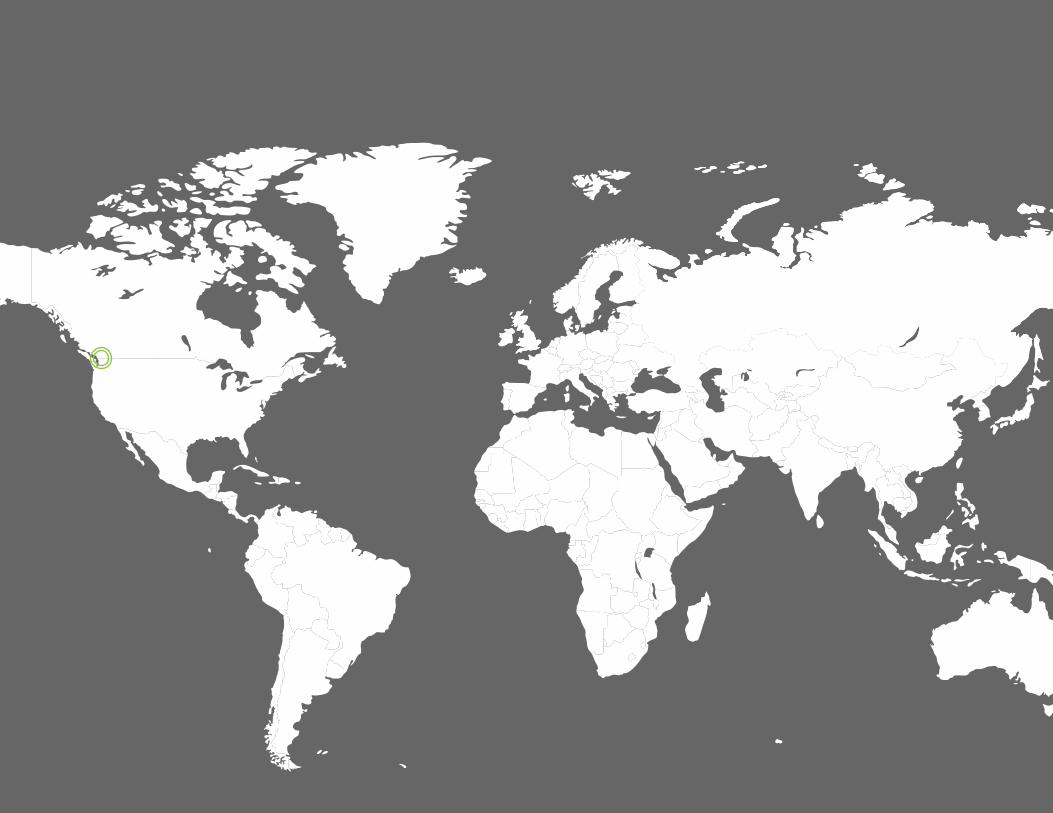
Maple Ridge is a district municipality
in British Columbia, located in the
northeastern section of Metro Vancouver
between the Fraser River and the Golden
Ears, a group of mountain summits which
are the southernmost of the Garibaldi
Ranges of the Coast Mountains.
There is one Fraser Valley Regional Library
branch within Maple Ridge.
Map source: Google Maps
NOTES:
• Total population in each chart or table may very slightly due to different data sources, i.e. National
Household Survey (NHS) and censuses.
• Totals in each chart or table may vary slightly from simple addition of elements within due to
rounding.
• Data source: Stats Canada National Household Survey (NHS) 2011, Census 2006 and 2011 profiles.
GLOSSARY OF TERMS:
Recent immigrants are immigrants who arrived in Canada between January 1, 2006 and May 10, 2011.
Metro Vancouver comprises 21 municipalities, one electoral district and one First Nation located in the
southwest corner of British Columbia’s mainland.
Census refers to the population Census of Canada, which is taken at five-year intervals and counts
persons and households and a wide variety of characteristics.
Canada National Household Survey: Starting in 2011, information previously collected by the
mandatory long-form census questionnaire is collected as part of the voluntary National Household
Survey. Complementing the data collected by the census, the NHS is designed to provide information
about people in Canada by their demographic, social and economic characteristics as well as provide
information about the housing units in which they live.
Maple Ridge Immigrant Demographics I Page 3
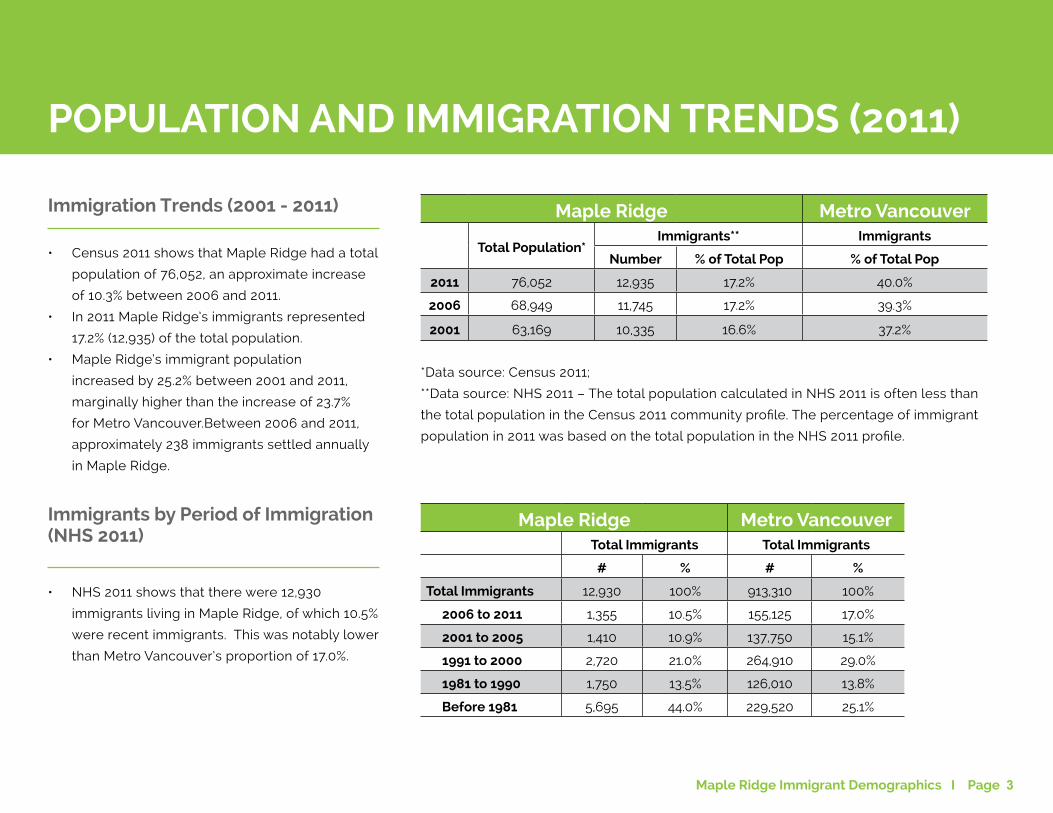
POPULATION AND IMMIGRATION TRENDS (2011)
Maple Ridge Metro Vancouver
Total Population*Immigrants** Immigrants
Number % of Total Pop % of Total Pop
2011 76,052 12,935 17.2% 40.0%
2006 68,949 11,745 17.2% 39.3%
2001 63,169 10,335 16.6% 37.2%
Immigration Trends (2001 - 2011)
• Census 2011 shows that Maple Ridge had a total
population of 76,052, an approximate increase
of 10.3% between 2006 and 2011.
• In 2011 Maple Ridge’s immigrants represented
17.2% (12,935) of the total population.
• Maple Ridge’s immigrant population
increased by 25.2% between 2001 and 2011,
marginally higher than the increase of 23.7%
for Metro Vancouver.Between 2006 and 2011,
approximately 238 immigrants settled annually
in Maple Ridge.
Immigrants by Period of Immigration (NHS 2011)
• NHS 2011 shows that there were 12,930
immigrants living in Maple Ridge, of which 10.5%
were recent immigrants. This was notably lower
than Metro Vancouver’s proportion of 17.0%.
Maple Ridge Metro VancouverTotal Immigrants Total Immigrants
# % # %
Total Immigrants 12,930 100% 913,310 100%
2006 to 2011 1,355 10.5% 155,125 17.0%
2001 to 2005 1,410 10.9% 137,750 15.1%
1991 to 2000 2,720 21.0% 264,910 29.0%
1981 to 1990 1,750 13.5% 126,010 13.8%
Before 1981 5,695 44.0% 229,520 25.1%
*Data source: Census 2011;
**Data source: NHS 2011 – The total population calculated in NHS 2011 is often less than
the total population in the Census 2011 community profile. The percentage of immigrant
population in 2011 was based on the total population in the NHS 2011 profile.
Maple Ridge Immigrant Demographics I Page 4
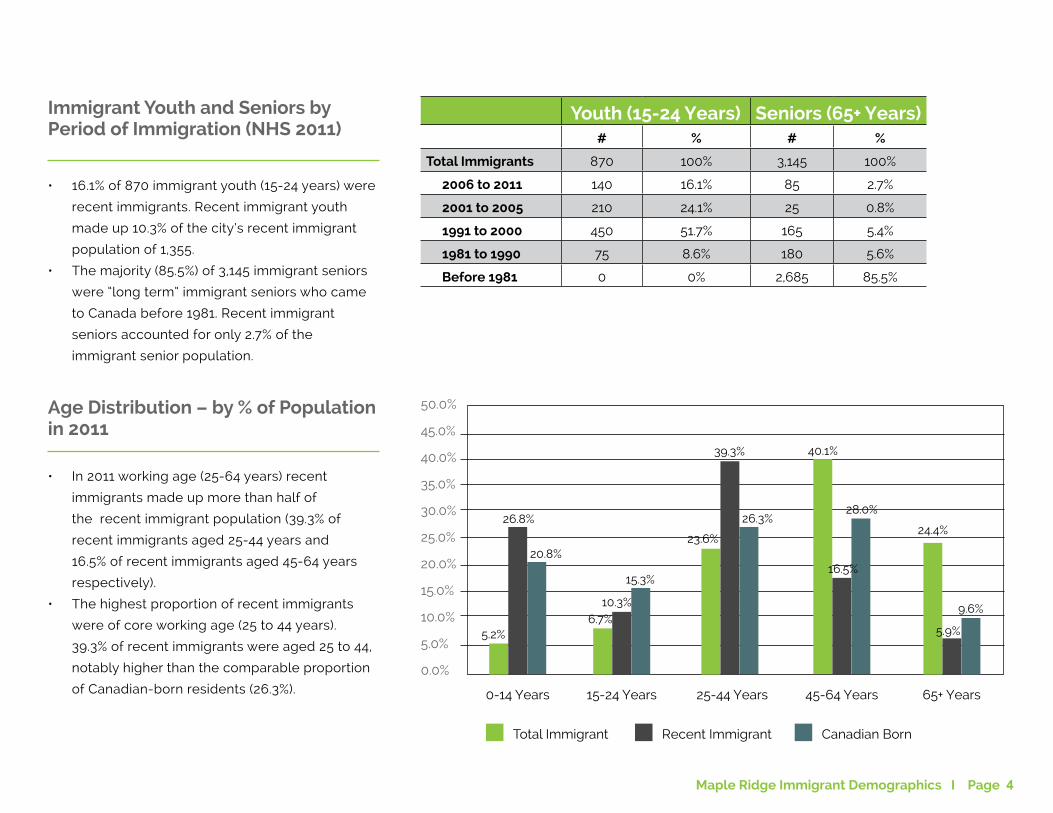
Immigrant Youth and Seniors by Period of Immigration (NHS 2011)
• 16.1% of 870 immigrant youth (15-24 years) were
recent immigrants. Recent immigrant youth
made up 10.3% of the city’s recent immigrant
population of 1,355.
• The majority (85.5%) of 3,145 immigrant seniors
were “long term” immigrant seniors who came
to Canada before 1981. Recent immigrant
seniors accounted for only 2.7% of the
immigrant senior population.
Youth (15-24 Years) Seniors (65+ Years)# % # %
Total Immigrants 870 100% 3,145 100%
2006 to 2011 140 16.1% 85 2.7%
2001 to 2005 210 24.1% 25 0.8%
1991 to 2000 450 51.7% 165 5.4%
1981 to 1990 75 8.6% 180 5.6%
Before 1981 0 0% 2,685 85.5%
Age Distribution – by % of Population in 2011
• In 2011 working age (25-64 years) recent
immigrants made up more than half of
the recent immigrant population (39.3% of
recent immigrants aged 25-44 years and
16.5% of recent immigrants aged 45-64 years
respectively).
• The highest proportion of recent immigrants
were of core working age (25 to 44 years).
39.3% of recent immigrants were aged 25 to 44,
notably higher than the comparable proportion
of Canadian-born residents (26.3%).
Total Immigrant Recent Immigrant Canadian Born
50.0%
45.0%
40.0%
35.0%
30.0%
25.0%
20.0%
15.0%
10.0%
5.0%
0.0%
0-14 Years 15-24 Years 25-44 Years 45-64 Years 65+ Years
5.2%
26.8%
20.8%
6.7%10.3%
15.3%
23.6%
39.3%
26.3%
40.1%
16.5%
28.0%
24.4%
5.9%
9.6%
Maple Ridge Immigrant Demographics I Page 5
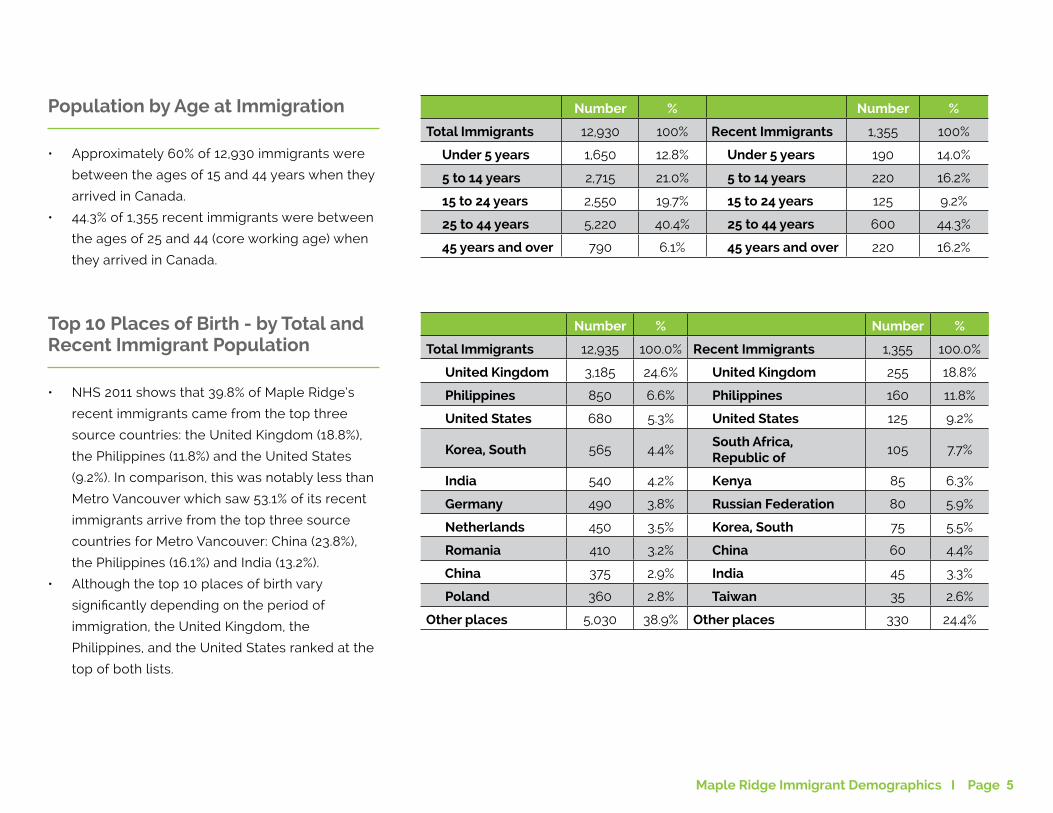
Population by Age at Immigration
• Approximately 60% of 12,930 immigrants were
between the ages of 15 and 44 years when they
arrived in Canada.
• 44.3% of 1,355 recent immigrants were between
the ages of 25 and 44 (core working age) when
they arrived in Canada.
Top 10 Places of Birth - by Total and Recent Immigrant Population
• NHS 2011 shows that 39.8% of Maple Ridge’s
recent immigrants came from the top three
source countries: the United Kingdom (18.8%),
the Philippines (11.8%) and the United States
(9.2%). In comparison, this was notably less than
Metro Vancouver which saw 53.1% of its recent
immigrants arrive from the top three source
countries for Metro Vancouver: China (23.8%),
the Philippines (16.1%) and India (13.2%).
• Although the top 10 places of birth vary
significantly depending on the period of
immigration, the United Kingdom, the
Philippines, and the United States ranked at the
top of both lists.
Number % Number %
Total Immigrants 12,930 100% Recent Immigrants 1,355 100%
Under 5 years 1,650 12.8% Under 5 years 190 14.0%
5 to 14 years 2,715 21.0% 5 to 14 years 220 16.2%
15 to 24 years 2,550 19.7% 15 to 24 years 125 9.2%
25 to 44 years 5,220 40.4% 25 to 44 years 600 44.3%
45 years and over 790 6.1% 45 years and over 220 16.2%
Number % Number %
Total Immigrants 12,935 100.0% Recent Immigrants 1,355 100.0%
United Kingdom 3,185 24.6% United Kingdom 255 18.8%
Philippines 850 6.6% Philippines 160 11.8%
United States 680 5.3% United States 125 9.2%
Korea, South 565 4.4% South Africa, Republic of
105 7.7%
India 540 4.2% Kenya 85 6.3%
Germany 490 3.8% Russian Federation 80 5.9%
Netherlands 450 3.5% Korea, South 75 5.5%
Romania 410 3.2% China 60 4.4%
China 375 2.9% India 45 3.3%
Poland 360 2.8% Taiwan 35 2.6%
Other places 5,030 38.9% Other places 330 24.4%
Maple Ridge Immigrant Demographics I Page 6
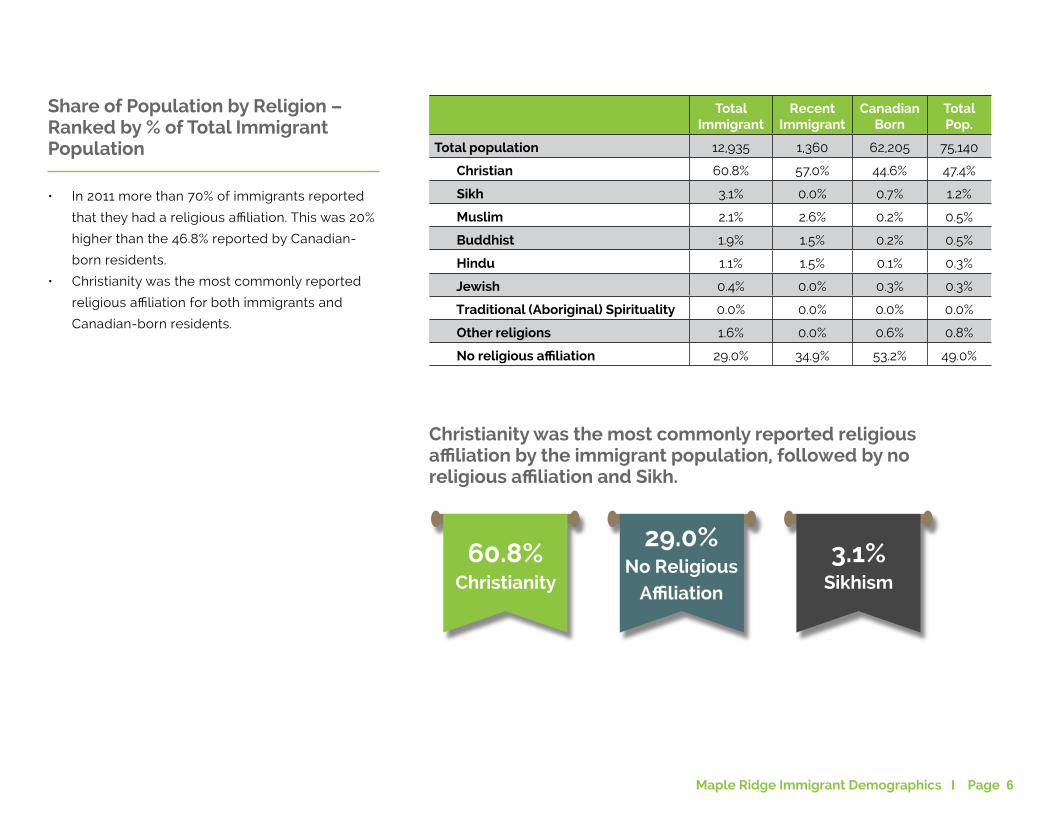
Share of Population by Religion – Ranked by % of Total Immigrant Population
• In 2011 more than 70% of immigrants reported
that they had a religious affiliation. This was 20%
higher than the 46.8% reported by Canadian-
born residents.
• Christianity was the most commonly reported
religious affiliation for both immigrants and
Canadian-born residents.
Total Immigrant
Recent Immigrant
Canadian Born
Total Pop.
Total population 12,935 1,360 62,205 75,140
Christian 60.8% 57.0% 44.6% 47.4%
Sikh 3.1% 0.0% 0.7% 1.2%
Muslim 2.1% 2.6% 0.2% 0.5%
Buddhist 1.9% 1.5% 0.2% 0.5%
Hindu 1.1% 1.5% 0.1% 0.3%
Jewish 0.4% 0.0% 0.3% 0.3%
Traditional (Aboriginal) Spirituality 0.0% 0.0% 0.0% 0.0%
Other religions 1.6% 0.0% 0.6% 0.8%
No religious affiliation 29.0% 34.9% 53.2% 49.0%
60.8%Christianity
29.0%No Religious
Affiliation
3.1%Sikhism
Christianity was the most commonly reported religious affiliation by the immigrant population, followed by no religious affiliation and Sikh.
Maple Ridge Immigrant Demographics I Page 7
LANGUAGE ABILITY (CENSUS 2011 & NHS 2011)
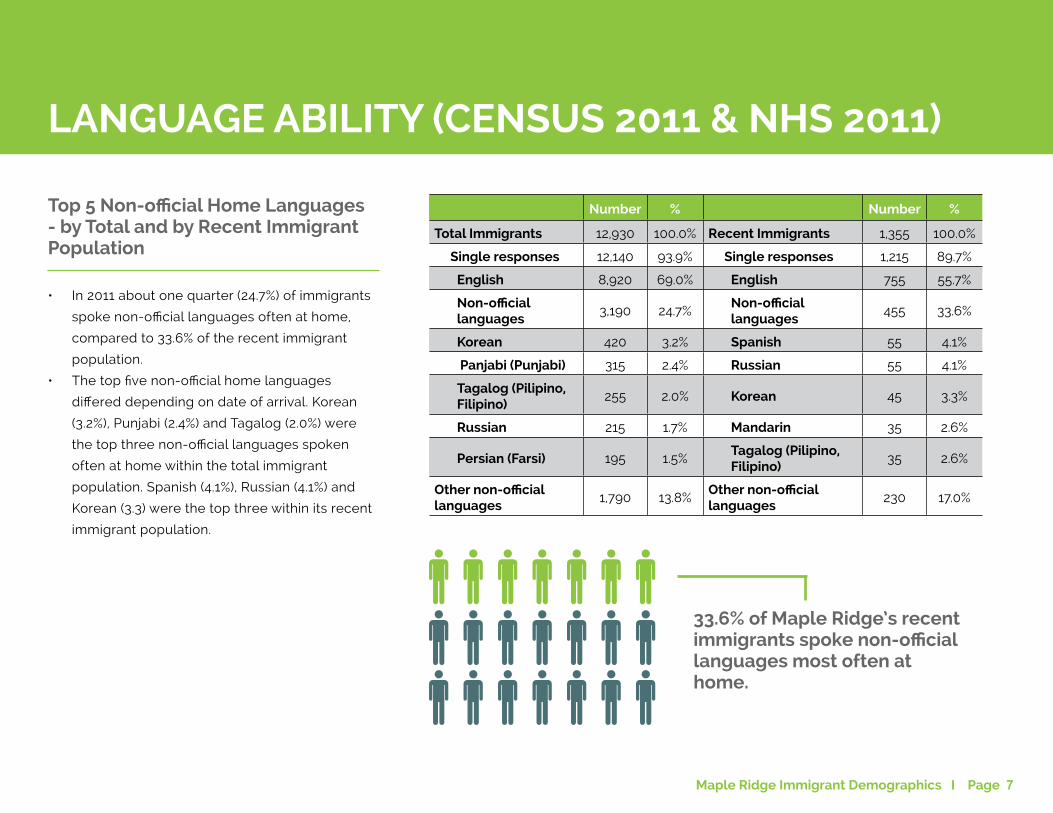
Top 5 Non-official Home Languages - by Total and by Recent Immigrant Population
• In 2011 about one quarter (24.7%) of immigrants
spoke non-official languages often at home,
compared to 33.6% of the recent immigrant
population.
• The top five non-official home languages
differed depending on date of arrival. Korean
(3.2%), Punjabi (2.4%) and Tagalog (2.0%) were
the top three non-official languages spoken
often at home within the total immigrant
population. Spanish (4.1%), Russian (4.1%) and
Korean (3.3) were the top three within its recent
immigrant population.
Number % Number %
Total Immigrants 12,930 100.0% Recent Immigrants 1,355 100.0%
Single responses 12,140 93.9% Single responses 1,215 89.7%
English 8,920 69.0% English 755 55.7%
Non-official languages
3,190 24.7%Non-official languages
455 33.6%
Korean 420 3.2% Spanish 55 4.1%
Panjabi (Punjabi) 315 2.4% Russian 55 4.1%
Tagalog (Pilipino, Filipino)
255 2.0% Korean 45 3.3%
Russian 215 1.7% Mandarin 35 2.6%
Persian (Farsi) 195 1.5%Tagalog (Pilipino, Filipino)
35 2.6%
Other non-official languages
1,790 13.8%Other non-official languages
230 17.0%
33.6% of Maple Ridge’s recent immigrants spoke non-official languages most often at home.
Maple Ridge Immigrant Demographics I Page 8
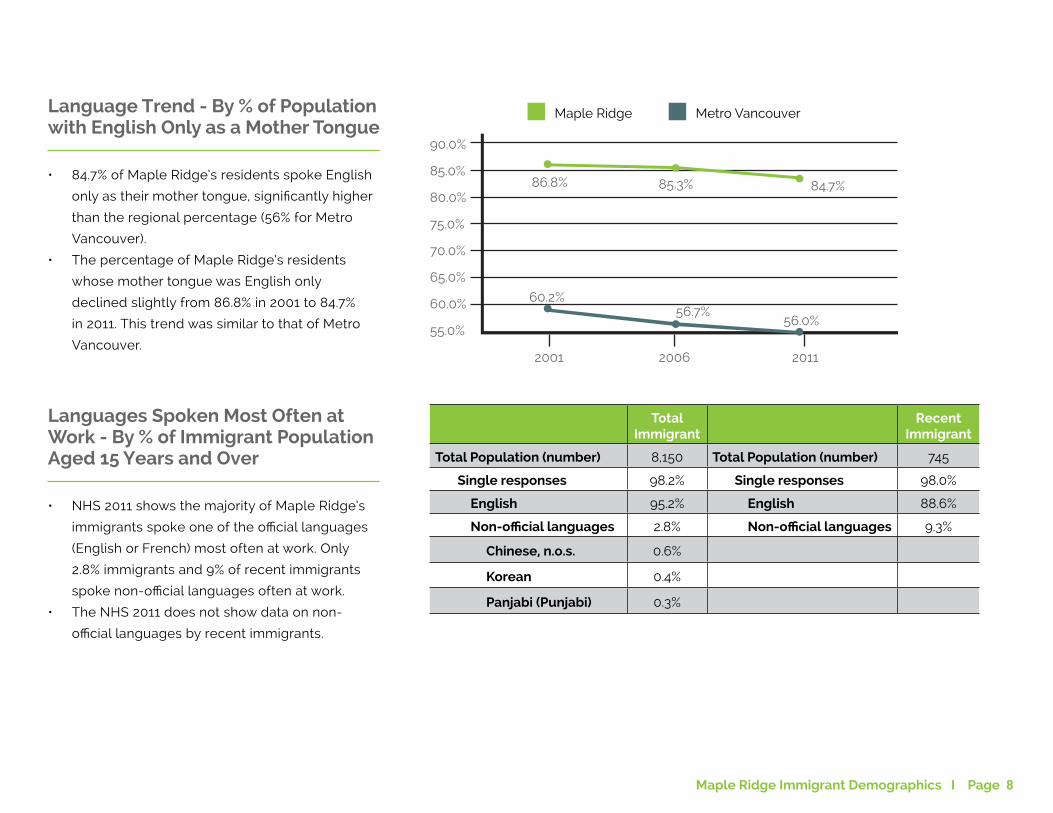
• 84.7% of Maple Ridge’s residents spoke English
only as their mother tongue, significantly higher
than the regional percentage (56% for Metro
Vancouver).
• The percentage of Maple Ridge’s residents
whose mother tongue was English only
declined slightly from 86.8% in 2001 to 84.7%
in 2011. This trend was similar to that of Metro
Vancouver.
Languages Spoken Most Often at Work - By % of Immigrant Population Aged 15 Years and Over
• NHS 2011 shows the majority of Maple Ridge’s
immigrants spoke one of the official languages
(English or French) most often at work. Only
2.8% immigrants and 9% of recent immigrants
spoke non-official languages often at work.
• The NHS 2011 does not show data on non-
official languages by recent immigrants.
Total Immigrant
Recent Immigrant
Total Population (number) 8,150 Total Population (number) 745
Single responses 98.2% Single responses 98.0%
English 95.2% English 88.6%
Non-official languages 2.8% Non-official languages 9.3%
Chinese, n.o.s. 0.6%
Korean 0.4%
Panjabi (Punjabi) 0.3%
Language Trend - By % of Population with English Only as a Mother Tongue
Maple Ridge Metro Vancouver
90.0%
85.0%
80.0%
75.0%
70.0%
65.0%
60.0%
55.0%
2001 2006 2011
86.8% 85.3% 84.7%
60.2%56.7%
56.0%
Maple Ridge Immigrant Demographics I Page 9
EDUCATION ATTAINMENT (NHS 2011)
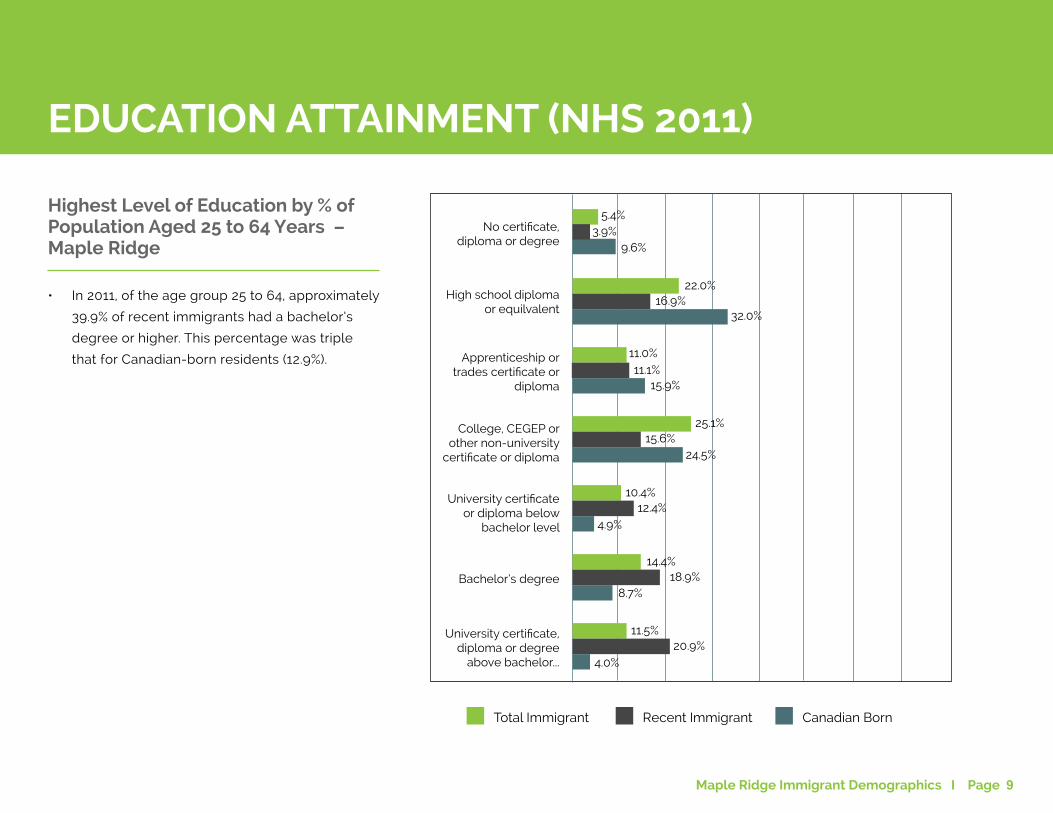
Highest Level of Education by % of Population Aged 25 to 64 Years – Maple Ridge
• In 2011, of the age group 25 to 64, approximately
39.9% of recent immigrants had a bachelor’s
degree or higher. This percentage was triple
that for Canadian-born residents (12.9%).
Total Immigrant Recent Immigrant Canadian Born
No certificate, diploma or degree
5.4%
High school diploma or equilvalent
Apprenticeship or trades certificate or
diploma
College, CEGEP or other non-university
certificate or diploma
University certificate or diploma below
bachelor level
Bachelor’s degree
University certificate, diploma or degree
above bachelor...
3.9%9.6%
22.0%16.9%
32.0%
11.0%11.1%
15.9%
25.1%15.6%
24.5%
10.4%12.4%
4.9%
14.4%
8.7%
11.5%20.9%
4.0%
18.9%
Maple Ridge Immigrant Demographics I Page 10
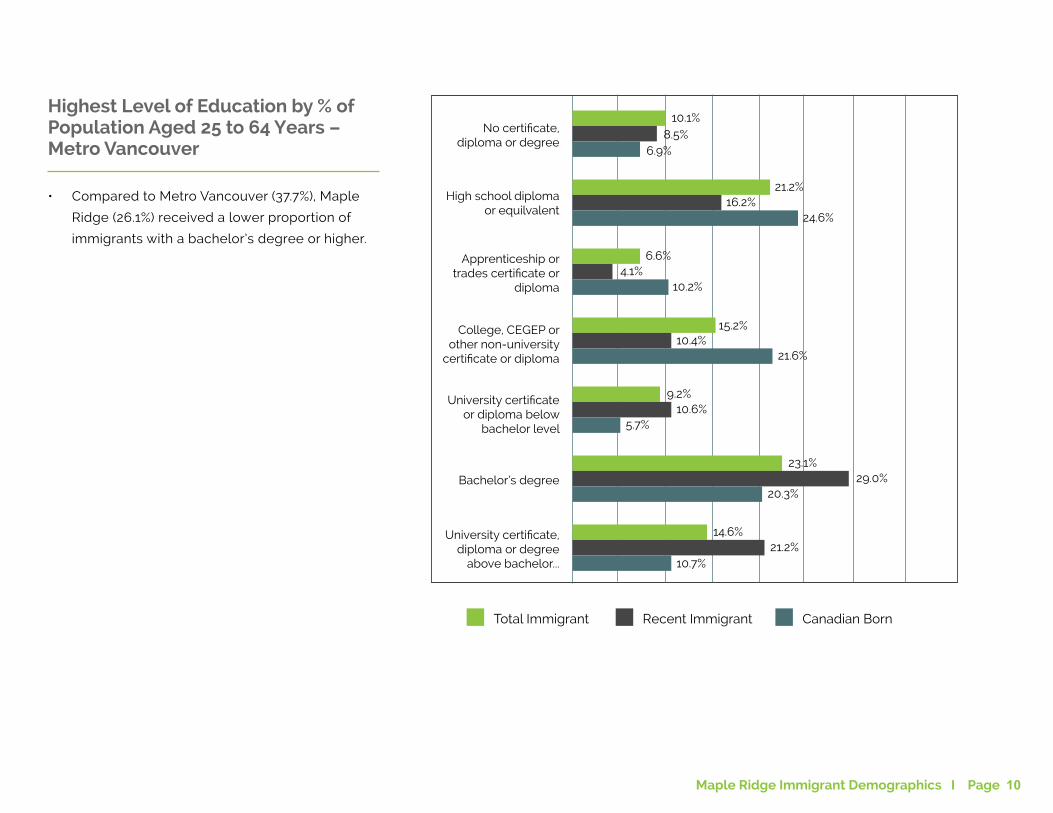
Highest Level of Education by % of Population Aged 25 to 64 Years – Metro Vancouver
• Compared to Metro Vancouver (37.7%), Maple
Ridge (26.1%) received a lower proportion of
immigrants with a bachelor’s degree or higher.
Total Immigrant Recent Immigrant Canadian Born
No certificate, diploma or degree
10.1%
High school diploma or equilvalent
Apprenticeship or trades certificate or
diploma
College, CEGEP or other non-university
certificate or diploma
University certificate or diploma below
bachelor level
Bachelor’s degree
University certificate, diploma or degree
above bachelor...
8.5%6.9%
21.2%16.2%
24.6%
10.2%
6.6%4.1%
15.2%10.4%
21.6%
9.2%10.6%
5.7%
10.7%21.2%
14.6%
20.3%29.0%
23.1%
Maple Ridge Immigrant Demographics I Page 11
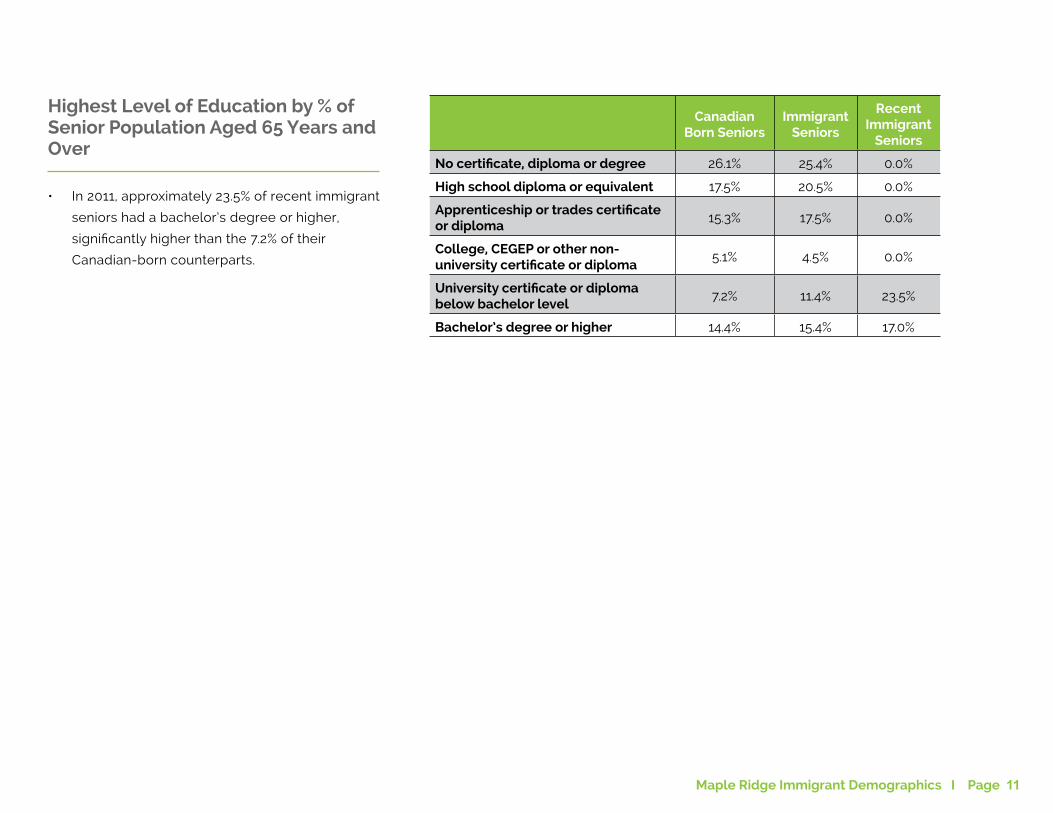
Highest Level of Education by % of Senior Population Aged 65 Years and Over
• In 2011, approximately 23.5% of recent immigrant
seniors had a bachelor’s degree or higher,
significantly higher than the 7.2% of their
Canadian-born counterparts.
Canadian Born Seniors
Immigrant Seniors
Recent Immigrant
Seniors
No certificate, diploma or degree 26.1% 25.4% 0.0%
High school diploma or equivalent 17.5% 20.5% 0.0%
Apprenticeship or trades certificate or diploma
15.3% 17.5% 0.0%
College, CEGEP or other non-university certificate or diploma
5.1% 4.5% 0.0%
University certificate or diploma below bachelor level
7.2% 11.4% 23.5%
Bachelor’s degree or higher 14.4% 15.4% 17.0%
Maple Ridge Immigrant Demographics I Page 12
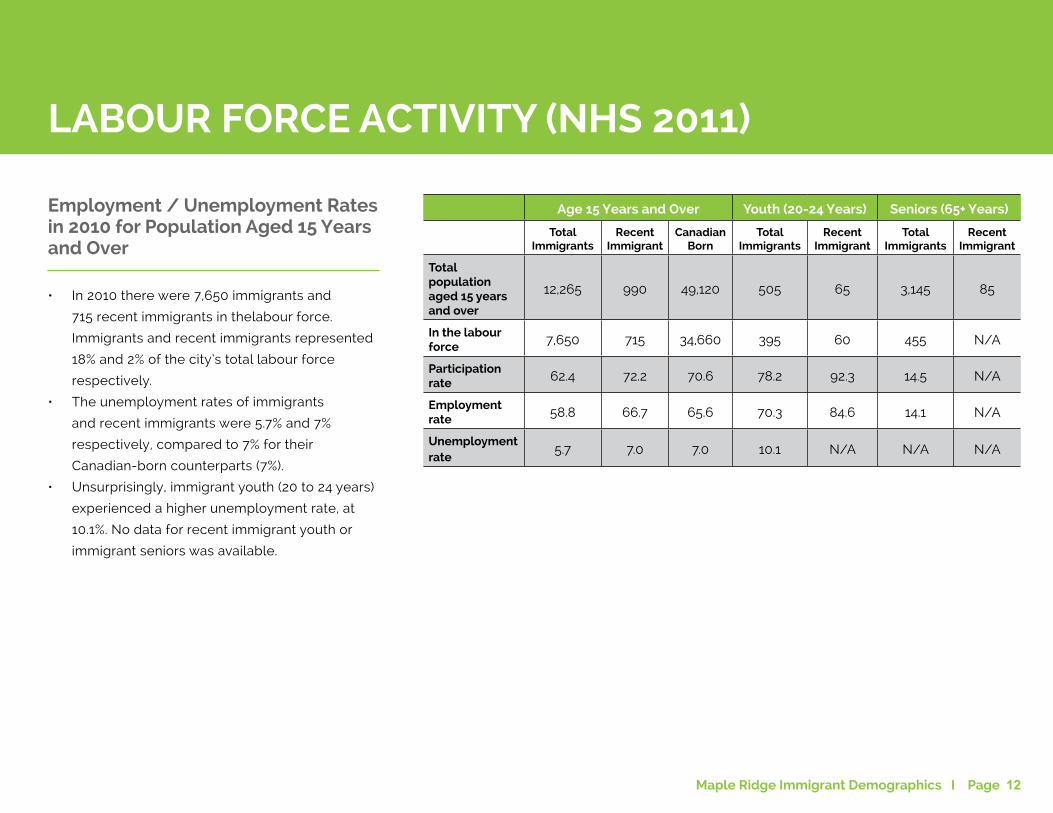
LABOUR FORCE ACTIVITY (NHS 2011)
Employment / Unemployment Rates in 2010 for Population Aged 15 Years and Over
• In 2010 there were 7,650 immigrants and
715 recent immigrants in thelabour force.
Immigrants and recent immigrants represented
18% and 2% of the city’s total labour force
respectively.
• The unemployment rates of immigrants
and recent immigrants were 5.7% and 7%
respectively, compared to 7% for their
Canadian-born counterparts (7%).
• Unsurprisingly, immigrant youth (20 to 24 years)
experienced a higher unemployment rate, at
10.1%. No data for recent immigrant youth or
immigrant seniors was available.
Age 15 Years and Over Youth (20-24 Years) Seniors (65+ Years)
Total Immigrants
Recent Immigrant
CanadianBorn
Total Immigrants
Recent Immigrant
Total Immigrants
Recent Immigrant
Total population aged 15 years and over
12,265 990 49,120 505 65 3,145 85
In the labour force 7,650 715 34,660 395 60 455 N/A
Participation rate 62.4 72.2 70.6 78.2 92.3 14.5 N/A
Employment rate 58.8 66.7 65.6 70.3 84.6 14.1 N/A
Unemployment rate
5.7 7.0 7.0 10.1 N/A N/A N/A
Maple Ridge Immigrant Demographics I Page 13
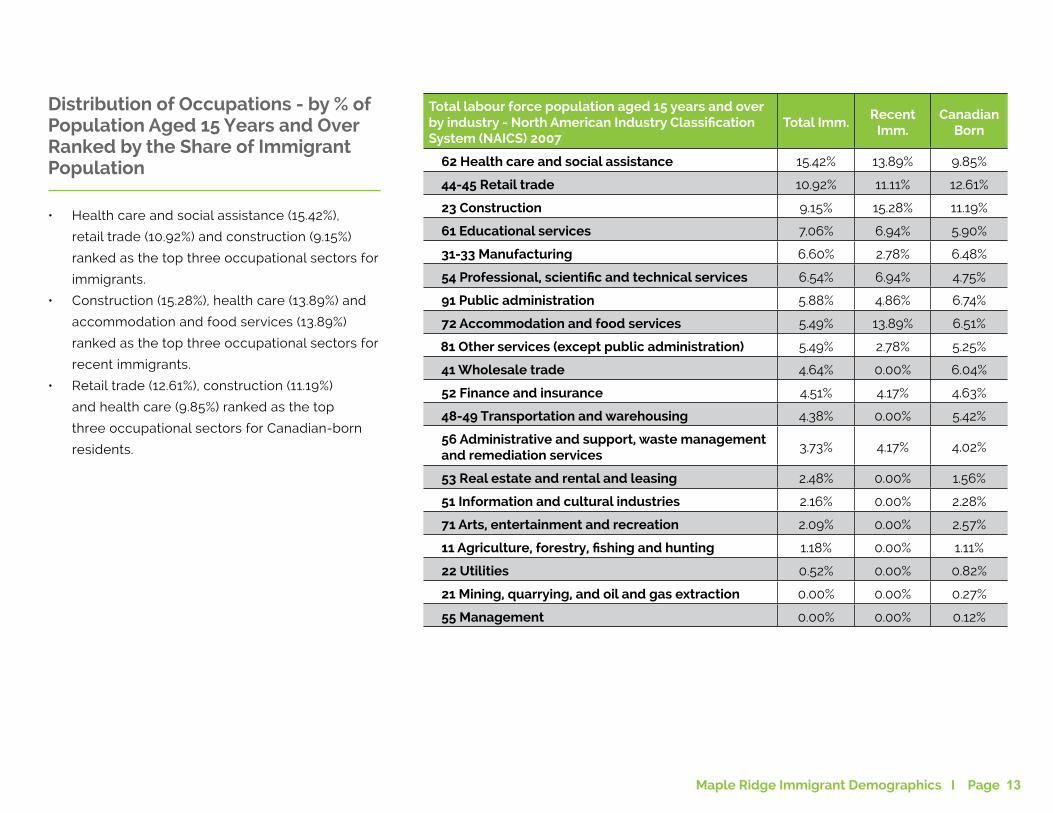
Distribution of Occupations - by % of Population Aged 15 Years and Over Ranked by the Share of Immigrant Population
• Health care and social assistance (15.42%),
retail trade (10.92%) and construction (9.15%)
ranked as the top three occupational sectors for
immigrants.
• Construction (15.28%), health care (13.89%) and
accommodation and food services (13.89%)
ranked as the top three occupational sectors for
recent immigrants.
• Retail trade (12.61%), construction (11.19%)
and health care (9.85%) ranked as the top
three occupational sectors for Canadian-born
residents.
Total labour force population aged 15 years and over by industry - North American Industry Classification System (NAICS) 2007
Total Imm.Recent
Imm.Canadian
Born
62 Health care and social assistance 15.42% 13.89% 9.85%
44-45 Retail trade 10.92% 11.11% 12.61%
23 Construction 9.15% 15.28% 11.19%
61 Educational services 7.06% 6.94% 5.90%
31-33 Manufacturing 6.60% 2.78% 6.48%
54 Professional, scientific and technical services 6.54% 6.94% 4.75%
91 Public administration 5.88% 4.86% 6.74%
72 Accommodation and food services 5.49% 13.89% 6.51%
81 Other services (except public administration) 5.49% 2.78% 5.25%
41 Wholesale trade 4.64% 0.00% 6.04%
52 Finance and insurance 4.51% 4.17% 4.63%
48-49 Transportation and warehousing 4.38% 0.00% 5.42%
56 Administrative and support, waste management and remediation services
3.73% 4.17% 4.02%
53 Real estate and rental and leasing 2.48% 0.00% 1.56%
51 Information and cultural industries 2.16% 0.00% 2.28%
71 Arts, entertainment and recreation 2.09% 0.00% 2.57%
11 Agriculture, forestry, fishing and hunting 1.18% 0.00% 1.11%
22 Utilities 0.52% 0.00% 0.82%
21 Mining, quarrying, and oil and gas extraction 0.00% 0.00% 0.27%
55 Management 0.00% 0.00% 0.12%
Maple Ridge Immigrant Demographics I Page 14
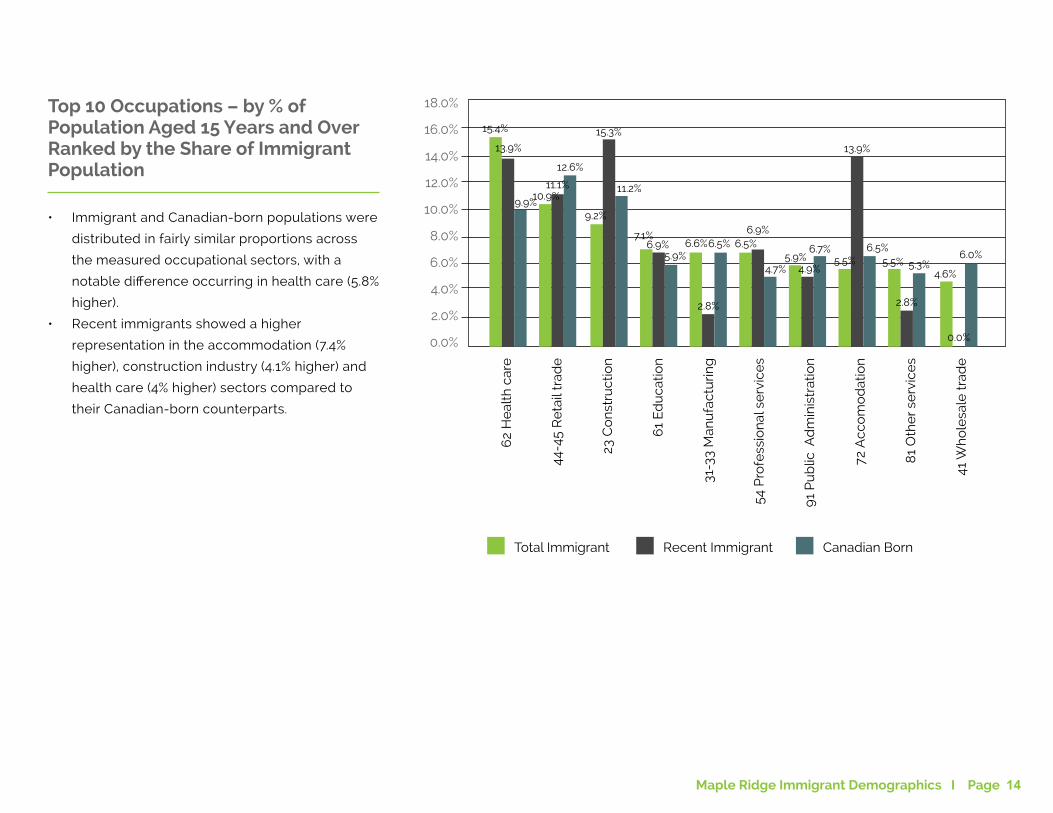
Top 10 Occupations – by % of Population Aged 15 Years and Over Ranked by the Share of Immigrant Population
• Immigrant and Canadian-born populations were
distributed in fairly similar proportions across
the measured occupational sectors, with a
notable difference occurring in health care (5.8%
higher).
• Recent immigrants showed a higher
representation in the accommodation (7.4%
higher), construction industry (4.1% higher) and
health care (4% higher) sectors compared to
their Canadian-born counterparts.
Total Immigrant Recent Immigrant Canadian Born
18.0%
16.0%
14.0%
12.0%
10.0%
8.0%
6.0%
4.0%
2.0%
0.0%
62
He
alth
car
e
44-4
5 R
eta
il tr
ade
23 C
on
stru
ctio
n
61
Ed
uca
tion
31-3
3 M
anu
fact
urin
g
54 P
rofe
ssio
nal
se
rvic
es
91
Pu
blic
Ad
min
istr
atio
n
72 A
cco
mo
dat
ion
81
Oth
er
serv
ice
s
41 W
ho
lesa
le t
rad
e
15.4%
13.9%
9.9%10.9%
11.1%
12.6%
9.2%
15.3%
11.2%
7.1%6.9%
5.9%6.6%
2.8%
6.5% 6.5%6.9%
4.7%5.9%
4.9%
6.7%5.5%
13.9%
6.5%5.5%
2.8%
5.3%4.6%
6.0%
0.0%
Maple Ridge Immigrant Demographics I Page 15
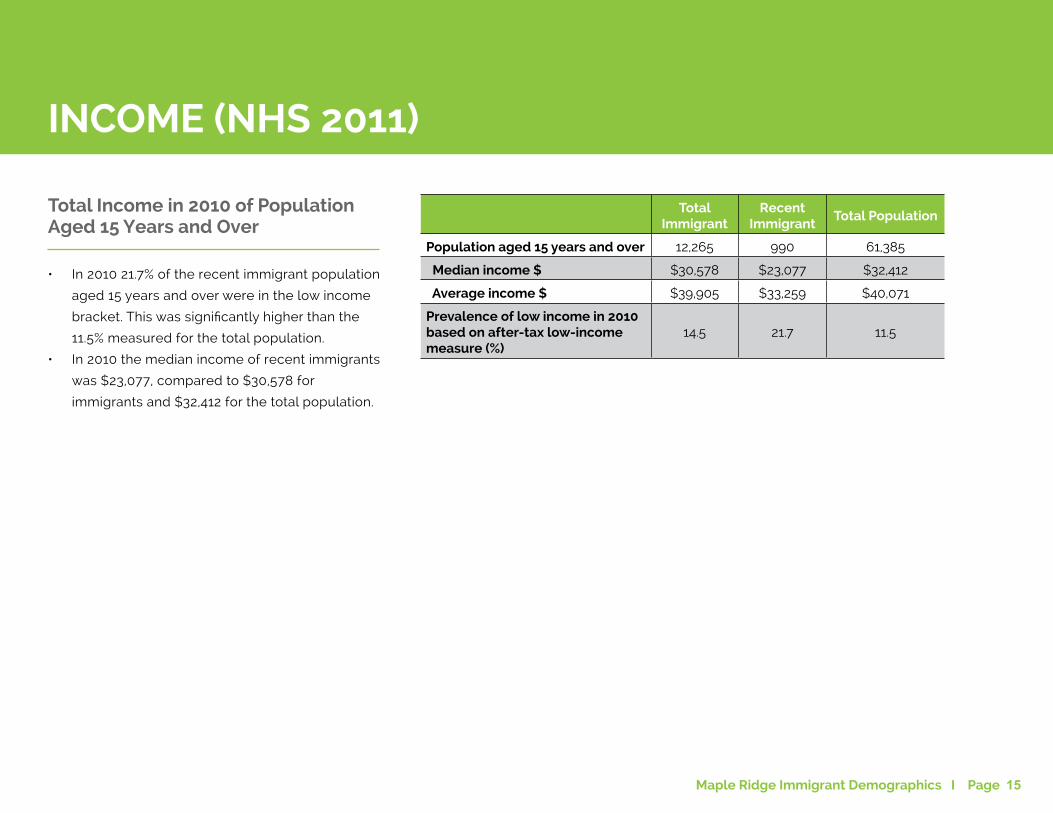
INCOME (NHS 2011)
Total Income in 2010 of Population Aged 15 Years and Over
• In 2010 21.7% of the recent immigrant population
aged 15 years and over were in the low income
bracket. This was significantly higher than the
11.5% measured for the total population.
• In 2010 the median income of recent immigrants
was $23,077, compared to $30,578 for
immigrants and $32,412 for the total population.
Total Immigrant
RecentImmigrant
Total Population
Population aged 15 years and over 12,265 990 61,385
Median income $ $30,578 $23,077 $32,412
Average income $ $39,905 $33,259 $40,071
Prevalence of low income in 2010 based on after-tax low-income measure (%)
14.5 21.7 11.5
Maple Ridge Immigrant Demographics I Page 16
Total Immigrant Recent Immigrant Canadian Born
$80,000
$70,000
$60,000
$50,000
$40,000
$30,000
$20,000
$10,000
$0
Median employment
income in 2010 $
$52,468
Average employment
income in 2010 $
$48,638$52,269
$61,313$59,547$59,151
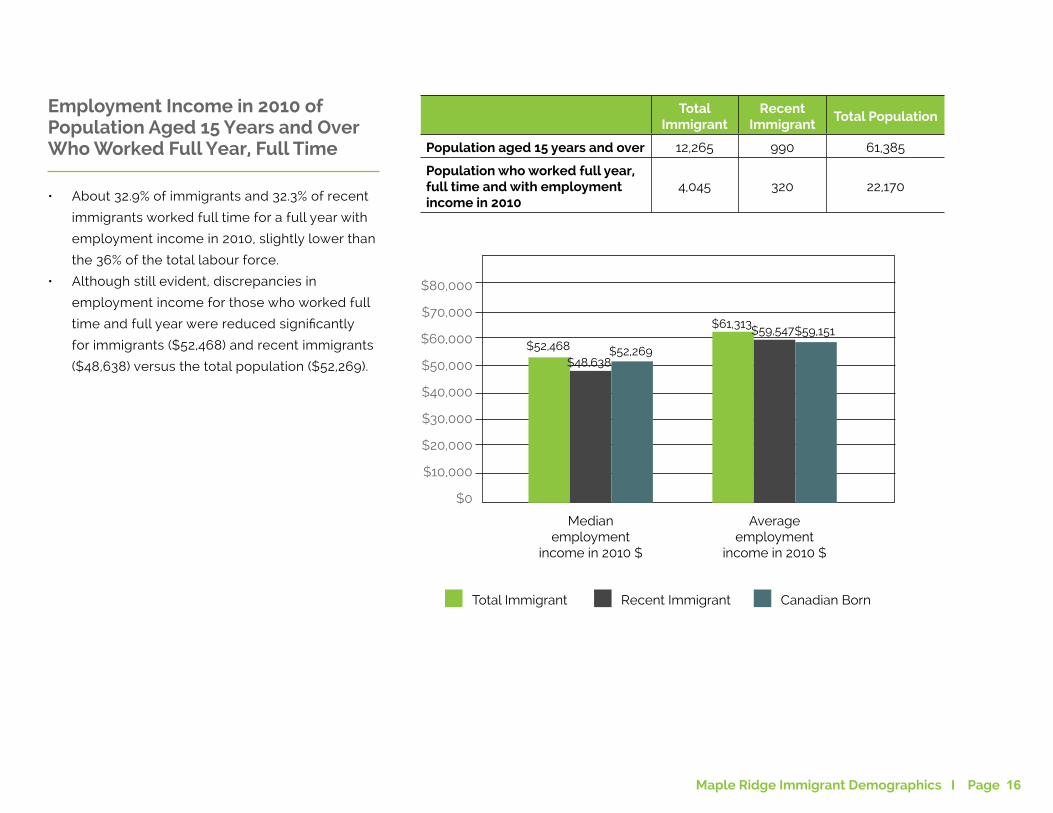
Employment Income in 2010 of Population Aged 15 Years and Over Who Worked Full Year, Full Time
• About 32.9% of immigrants and 32.3% of recent
immigrants worked full time for a full year with
employment income in 2010, slightly lower than
the 36% of the total labour force.
• Although still evident, discrepancies in
employment income for those who worked full
time and full year were reduced significantly
for immigrants ($52,468) and recent immigrants
($48,638) versus the total population ($52,269).
Total Immigrant
RecentImmigrant
Total Population
Population aged 15 years and over 12,265 990 61,385
Population who worked full year, full time and with employment income in 2010
4,045 320 22,170
Maple Ridge Immigrant Demographics I Page 17
NewToBC
NewToBC unites 18 public library systems in southwestern British Columbia in the planning, development and provision of library-based settlement services
to newcomer immigrants. The project also aims to recognize, promote, support, sustain, and complement the tremendous settlement services offered
by partner libraries and by other immigrant serving organizations and community groups. NewToBC helps partner libraries adapt to the evolving needs of
newcomer immigrants by identifying emerging opportunities, by adopting promising practices, and by supporting innovative settlement and integration
services. Ultimately, NewToBC is meant to enhance each of the partner libraries’ ability to help build welcoming and diverse communities. NewToBC is
managed by Public Library InterLINK and funded by the Ministry of Education and the Ministry of Jobs, Tourism and Skills Training and by the Government of
Canada.
Copyright © 2014: NewToBC: The Library Link For Newcomers and Public Library InterLINK
Maple Ridge Immigrant Demographics I Page 18