Embed Size (px)
Citation preview
Community Support for Youth and
Families Emilie Phillips Smith, Ph.D.
Professor, Human Development and Family Studies
The Pennsylvania State University
United States of America
Helping Families Conference 2013
Los Angeles, California

ACKNOWLEDGEMENTS
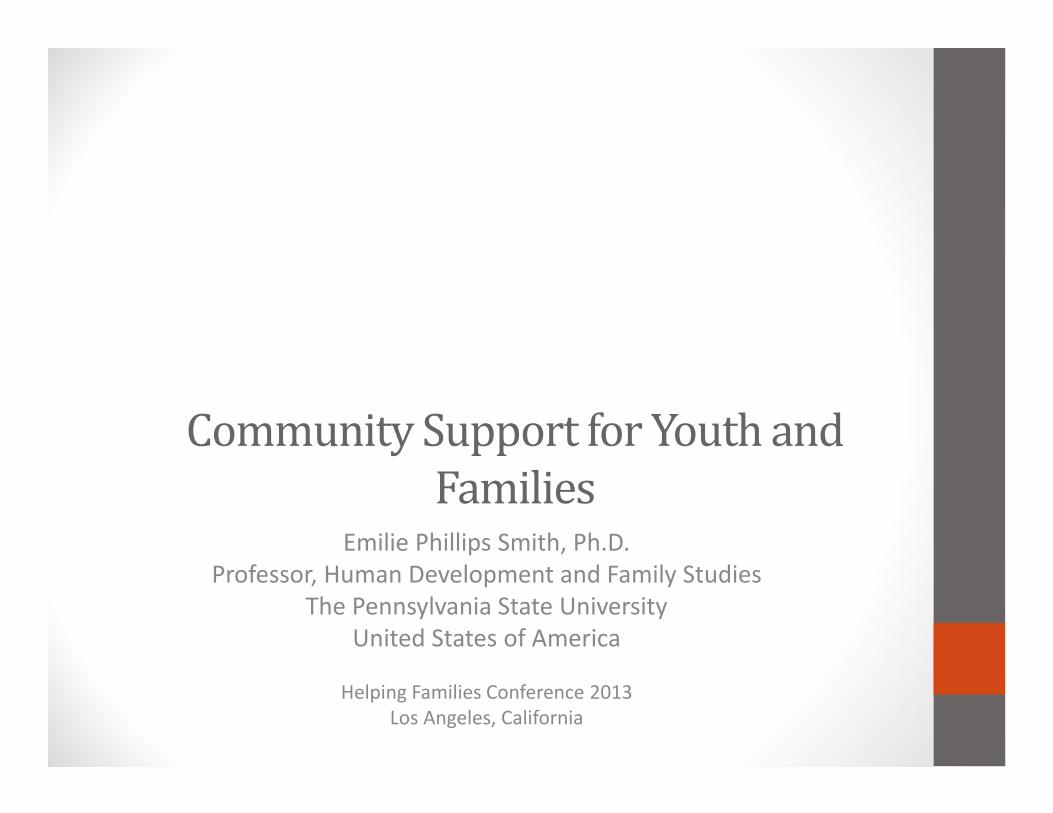
“
Probably no one thing has so tended to decrease delinquency as this
public movement to furnish constructive recreational and social
opportunities to boys and girls who would otherwise be denied these
privileges.” (Louise deKovenBowen, 1920)
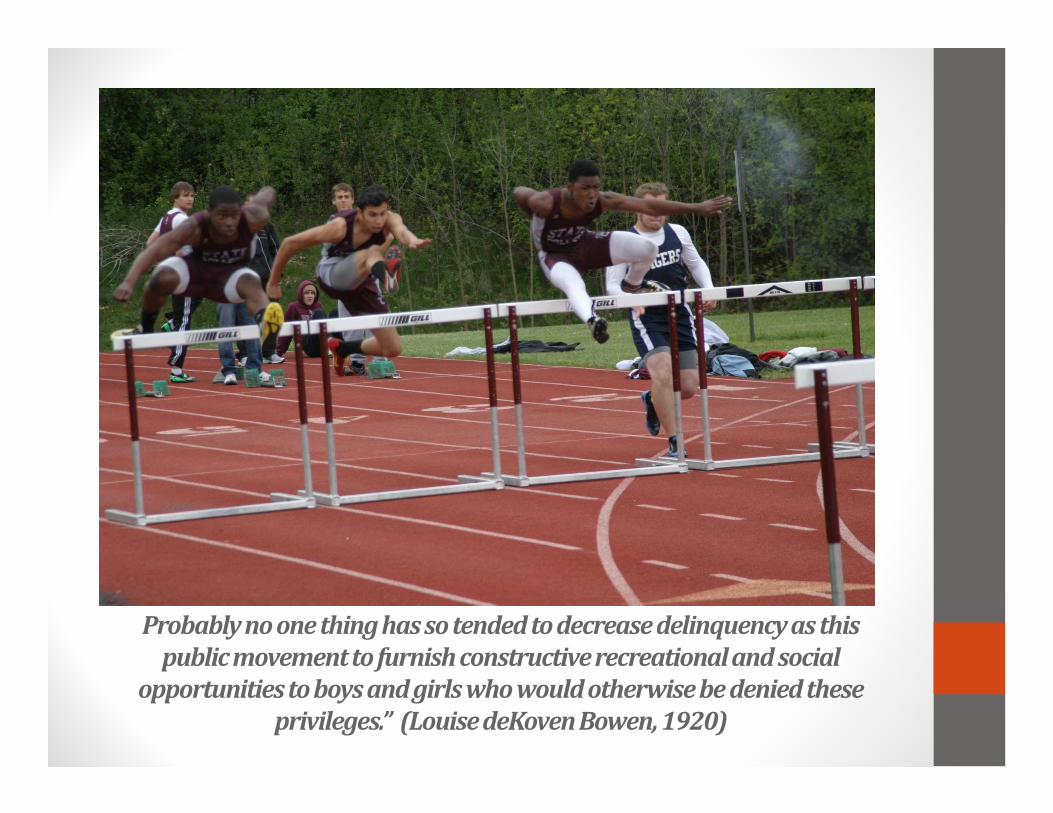
Rationale and Significance
• Juvenile delinquency is an important problem
• Juvenile offenders comprise 25% of the U.S. population. They commit:
• 51% of arson, 39% of vandalism,
• 29% of motor vehicle theft and burglary,
• 12% of drug abuse violation, and 9% of murder arrests.
• 1 in 3 African American men between the ages of 16-24 were arrested in 2004 (Smith, Richardson, & Belue,
2009; Guerra & Smith, 2006)
• 66% of juvenile crime occurs between the hours of 3-6pm (Snyder & Sickmund, 2006)
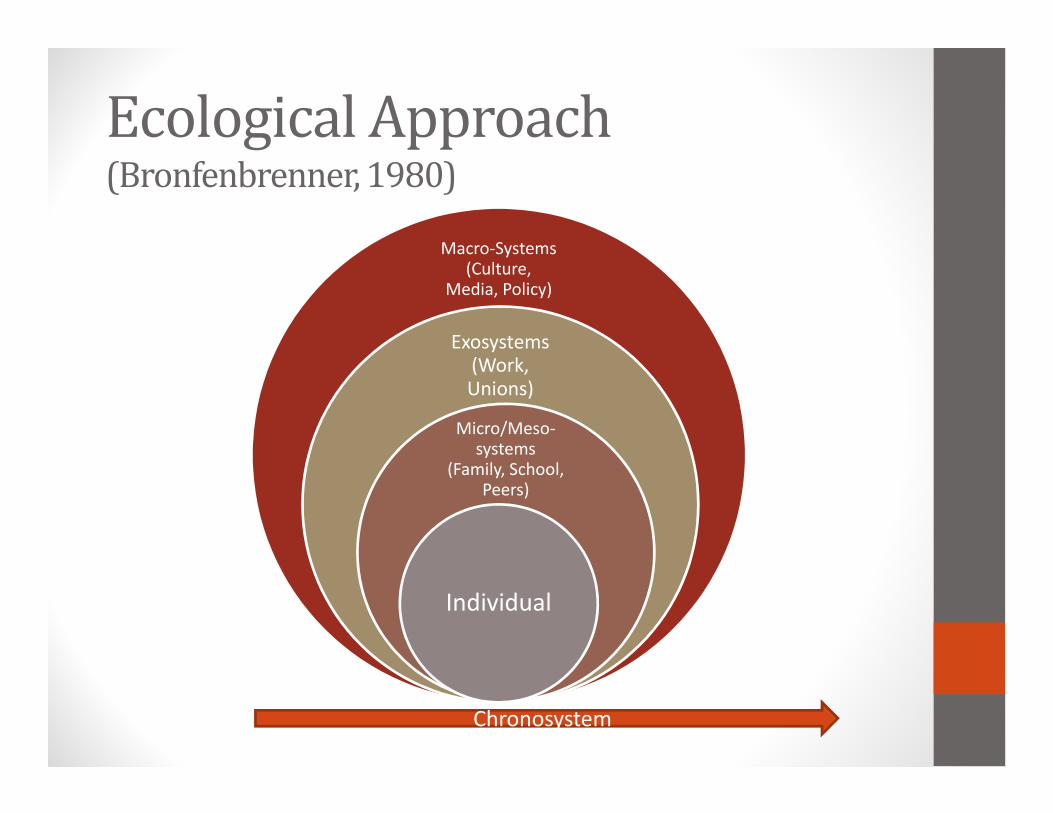
Ecological Approach (Bronfenbrenner, 1980)
Macro-Systems (Culture,
Media, Policy)
Exosystems(Work, Unions)
Micro/Meso-systems
(Family, School, Peers)
Individual
Chronosystem
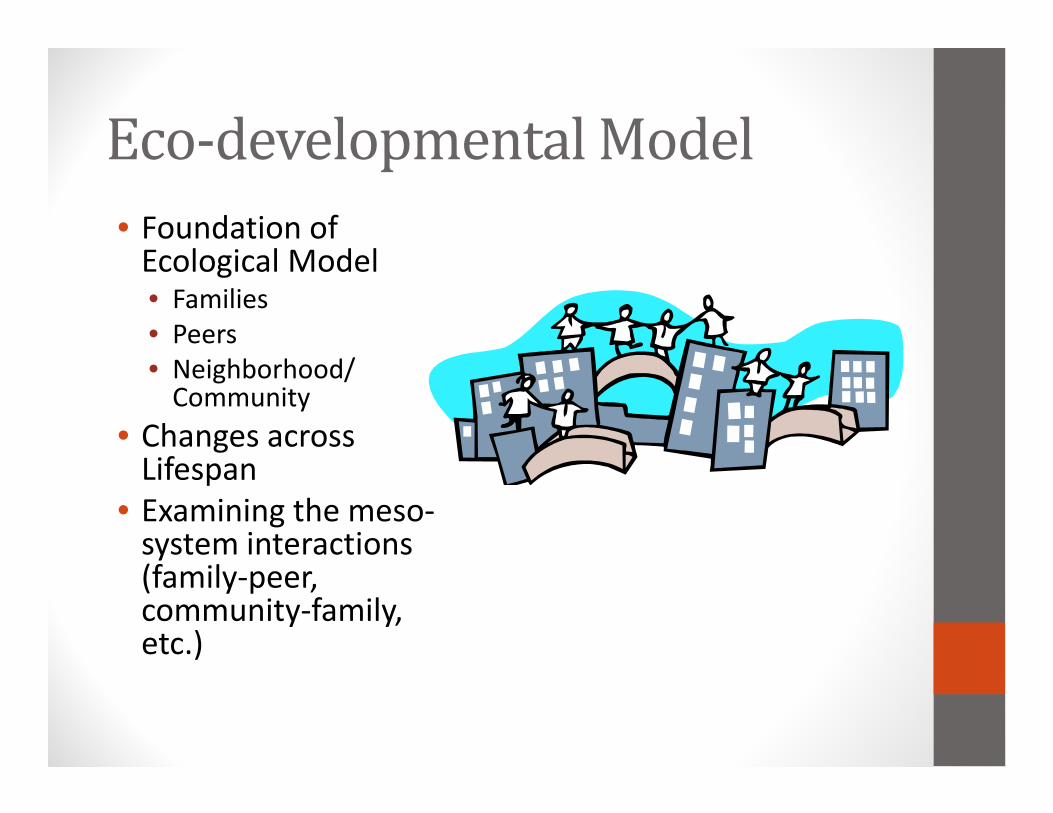
Eco-developmental Model
• Foundation of Ecological Model • Families
• Peers
• Neighborhood/ Community
• Changes across Lifespan
• Examining the meso-system interactions (family-peer, community-family, etc.)
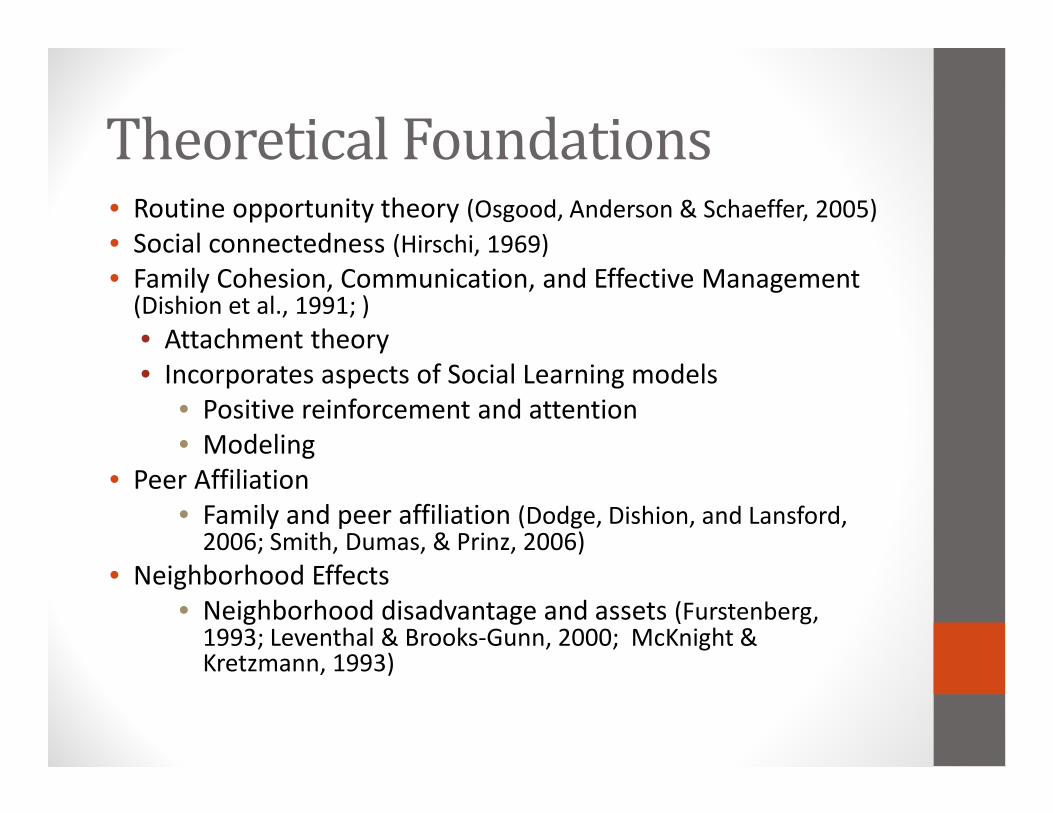
Theoretical Foundations• Routine opportunity theory (Osgood, Anderson & Schaeffer, 2005)
• Social connectedness (Hirschi, 1969)
• Family Cohesion, Communication, and Effective Management (Dishion et al., 1991; )
• Attachment theory
• Incorporates aspects of Social Learning models
• Positive reinforcement and attention
• Modeling
• Peer Affiliation
• Family and peer affiliation (Dodge, Dishion, and Lansford, 2006; Smith, Dumas, & Prinz, 2006)
• Neighborhood Effects
• Neighborhood disadvantage and assets (Furstenberg, 1993; Leventhal & Brooks-Gunn, 2000; McKnight & Kretzmann, 1993)
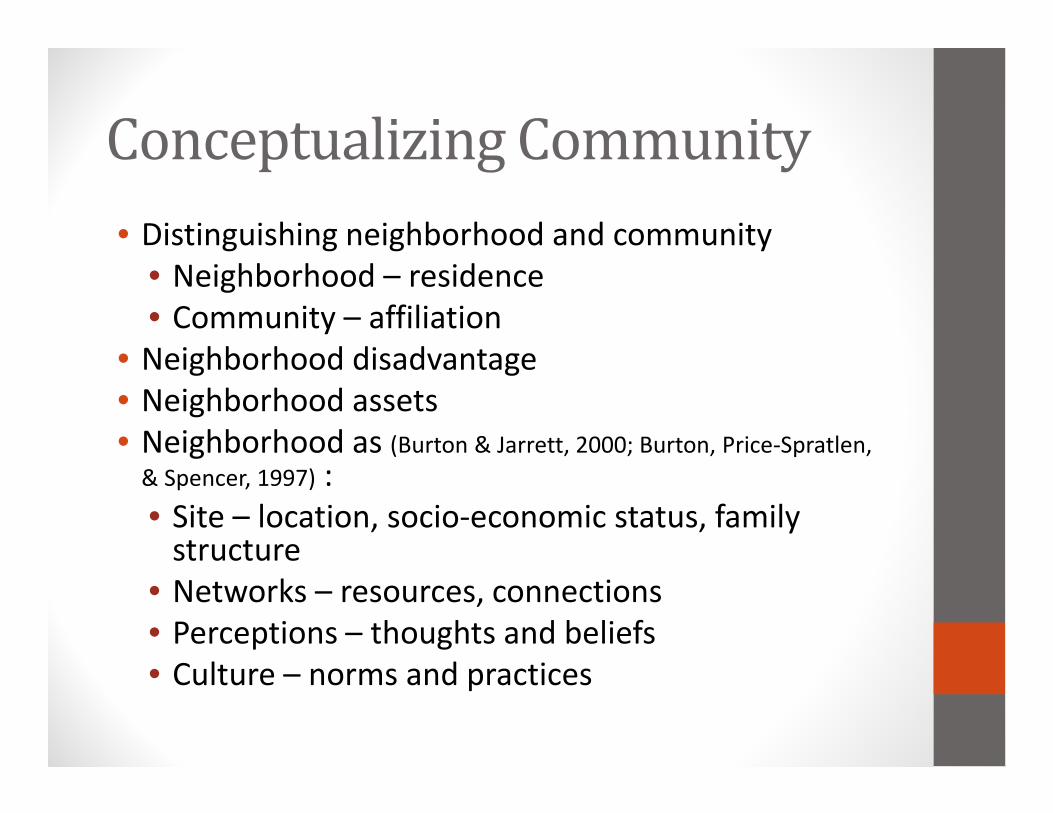
Conceptualizing Community
• Distinguishing neighborhood and community
• Neighborhood – residence
• Community – affiliation
• Neighborhood disadvantage
• Neighborhood assets
• Neighborhood as (Burton & Jarrett, 2000; Burton, Price-Spratlen,
& Spencer, 1997) :
• Site – location, socio-economic status, family structure
• Networks – resources, connections
• Perceptions – thoughts and beliefs
• Culture – norms and practices
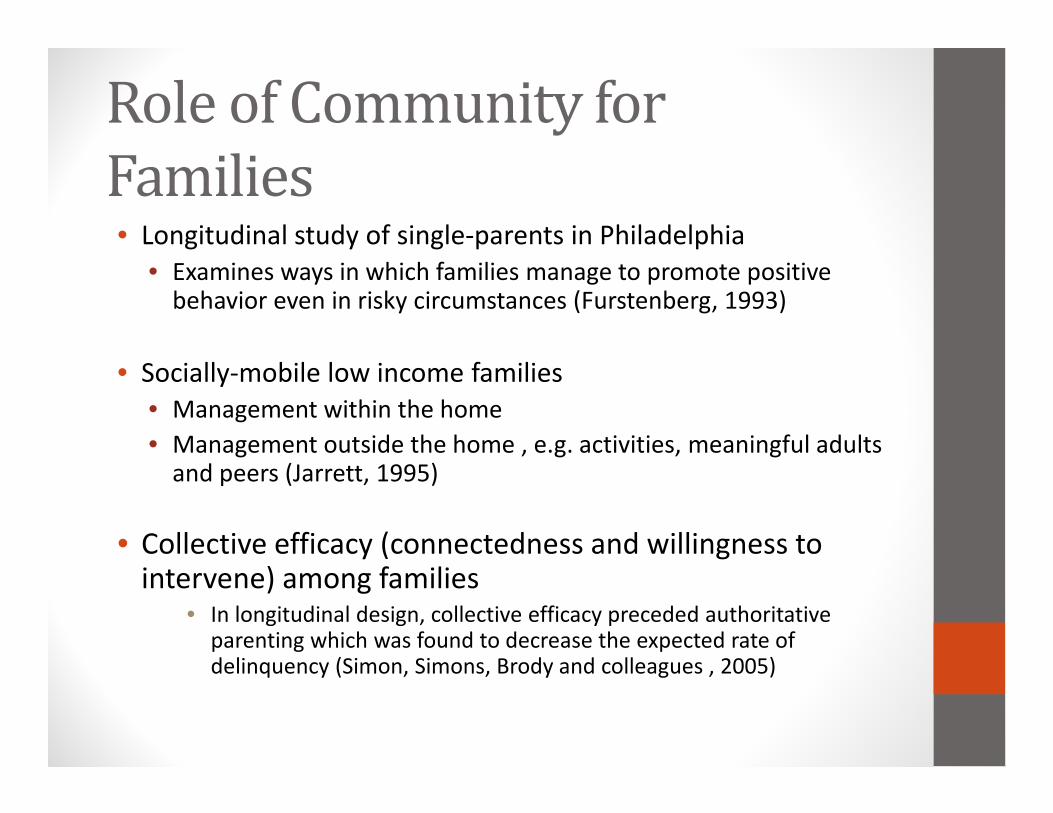
Role of Community for
Families • Longitudinal study of single-parents in Philadelphia
• Examines ways in which families manage to promote positive behavior even in risky circumstances (Furstenberg, 1993)
• Socially-mobile low income families
• Management within the home
• Management outside the home , e.g. activities, meaningful adults and peers (Jarrett, 1995)
• Collective efficacy (connectedness and willingness to intervene) among families
• In longitudinal design, collective efficacy preceded authoritative parenting which was found to decrease the expected rate of delinquency (Simon, Simons, Brody and colleagues , 2005)
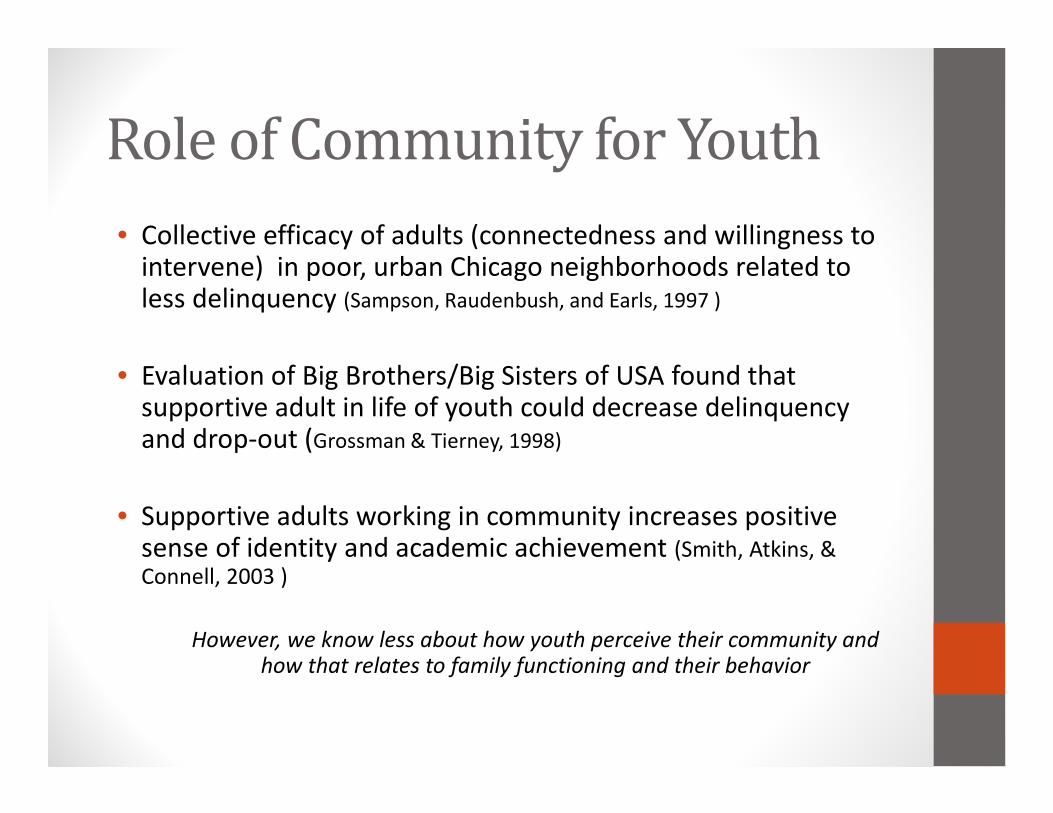
Role of Community for Youth
• Collective efficacy of adults (connectedness and willingness to intervene) in poor, urban Chicago neighborhoods related to less delinquency (Sampson, Raudenbush, and Earls, 1997 )
• Evaluation of Big Brothers/Big Sisters of USA found that supportive adult in life of youth could decrease delinquency and drop-out (Grossman & Tierney, 1998)
• Supportive adults working in community increases positive sense of identity and academic achievement (Smith, Atkins, &
Connell, 2003 )
However, we know less about how youth perceive their community and
how that relates to family functioning and their behavior
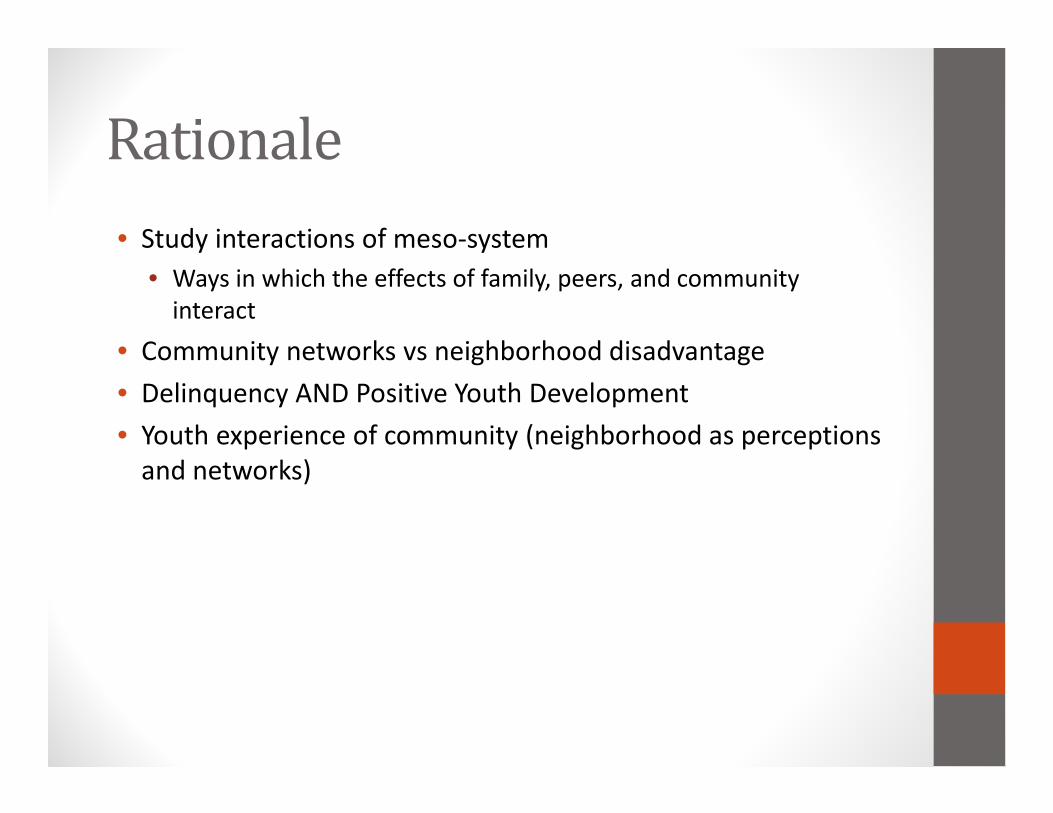
Rationale
• Study interactions of meso-system
• Ways in which the effects of family, peers, and community
interact
• Community networks vs neighborhood disadvantage
• Delinquency AND Positive Youth Development
• Youth experience of community (neighborhood as perceptions
and networks)
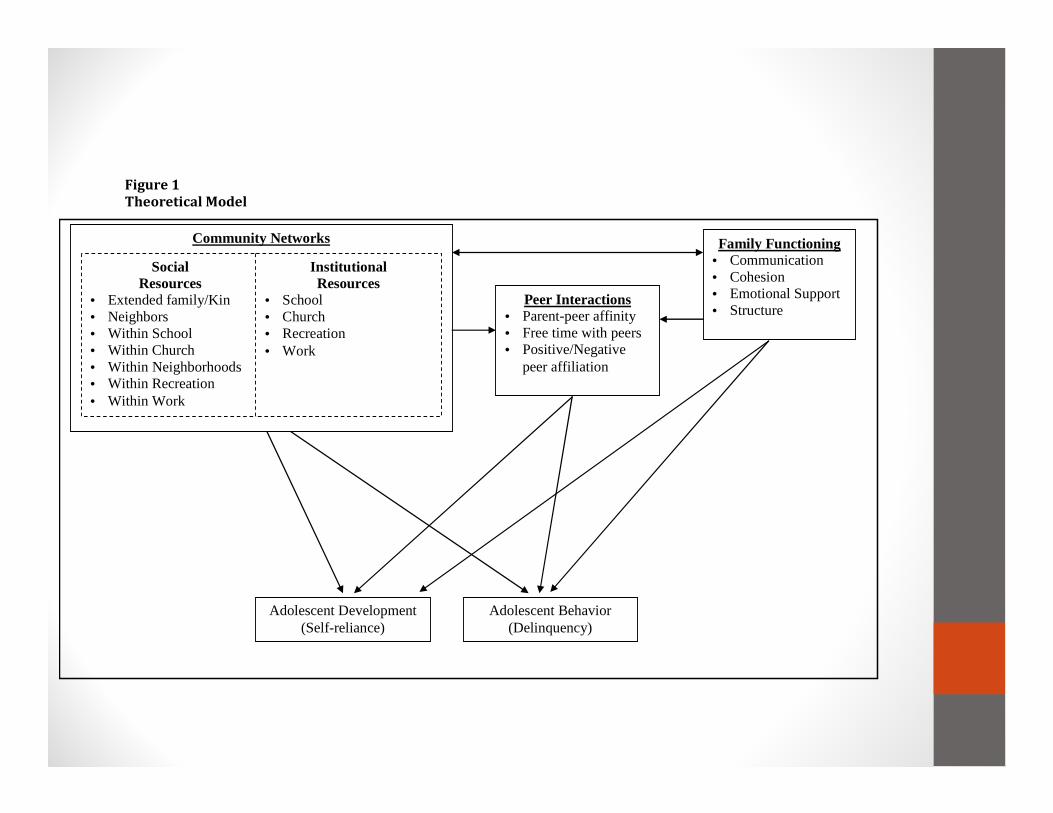
Figure 1
Theoretical Model
Community Networks
Peer Interactions • Parent-peer affinity • Free time with peers • Positive/Negative
peer affiliation
Adolescent Development (Self-reliance)
Adolescent Behavior (Delinquency)
Family Functioning • Communication • Cohesion • Emotional Support • Structure
Social Resources
• Extended family/Kin • Neighbors • Within School • Within Church • Within Neighborhoods • Within Recreation • Within Work
Institutional Resources
• School • Church • Recreation • Work
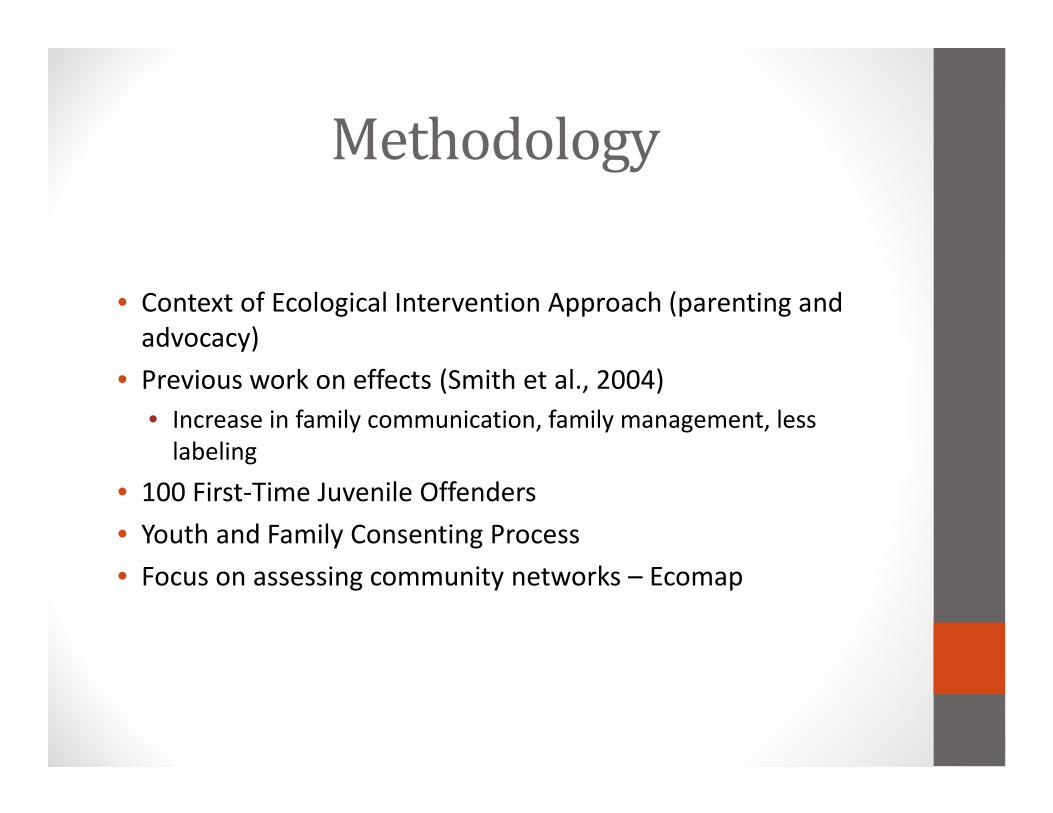
Methodology
• Context of Ecological Intervention Approach (parenting and
advocacy)
• Previous work on effects (Smith et al., 2004)
• Increase in family communication, family management, less
labeling
• 100 First-Time Juvenile Offenders
• Youth and Family Consenting Process
• Focus on assessing community networks – Ecomap
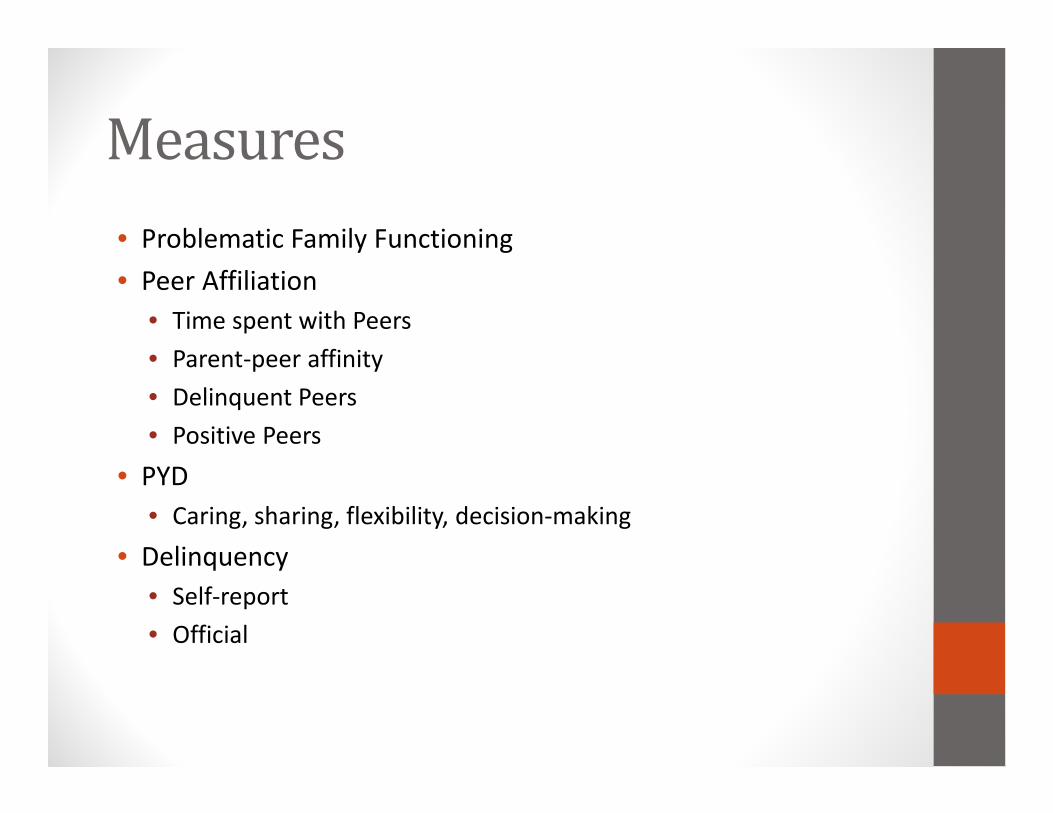
Measures
• Problematic Family Functioning
• Peer Affiliation
• Time spent with Peers
• Parent-peer affinity
• Delinquent Peers
• Positive Peers
• PYD
• Caring, sharing, flexibility, decision-making
• Delinquency
• Self-report
• Official
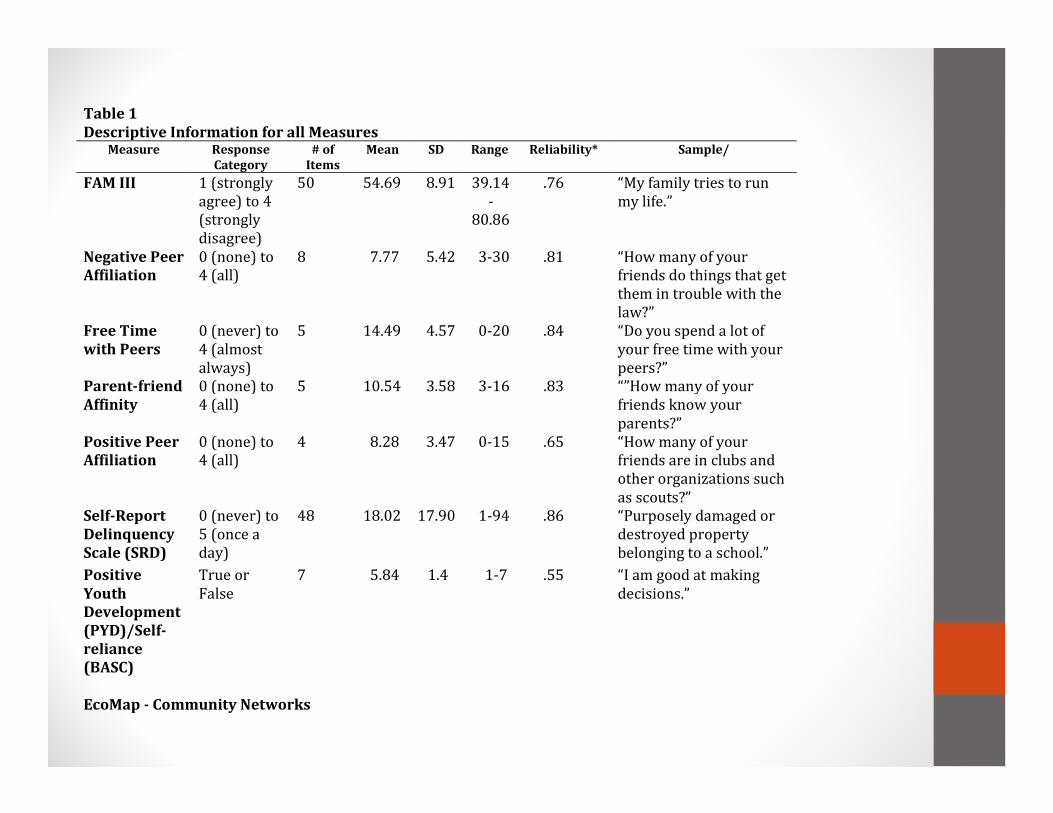
Table 1
Descriptive Information for all Measures Measure Response
Category
# of
Items
Mean SD Range Reliability* Sample/
FAM III 1 (strongly
agree) to 4
(strongly
disagree)
50 54.69 8.91 39.14
-
80.86
.76 “My family tries to run
my life.”
Negative Peer
Affiliation
0 (none) to
4 (all)
8 7.77 5.42 3-30 .81 “How many of your
friends do things that get
them in trouble with the
law?”
Free Time
with Peers
0 (never) to
4 (almost
always)
5 14.49 4.57 0-20 .84 “Do you spend a lot of
your free time with your
peers?”
Parent-friend
Affinity
0 (none) to
4 (all)
5 10.54 3.58 3-16 .83 “”How many of your
friends know your
parents?”
Positive Peer
Affiliation
0 (none) to
4 (all)
4 8.28 3.47 0-15 .65 “How many of your
friends are in clubs and
other organizations such
as scouts?”
Self-Report
Delinquency
Scale (SRD)
0 (never) to
5 (once a
day)
48 18.02 17.90 1-94 .86 “Purposely damaged or
destroyed property
belonging to a school.”
Positive
Youth
Development
(PYD)/Self-
reliance
(BASC)
True or
False
7 5.84 1.4 1-7 .55 “I am good at making
decisions.”
EcoMap - Community Networks
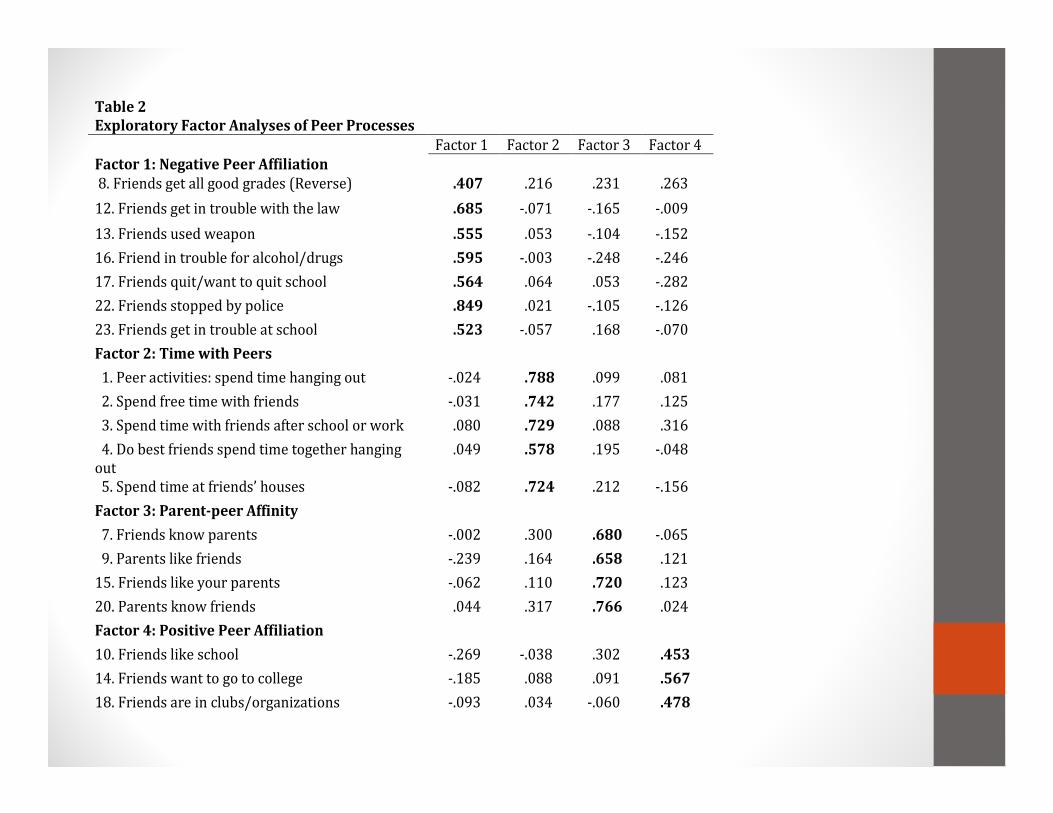
Table 2
Exploratory Factor Analyses of Peer Processes
Factor 1 Factor 2 Factor 3 Factor 4
Factor 1: Negative Peer Affiliation
8. Friends get all good grades (Reverse) .407 .216 .231 .263
12. Friends get in trouble with the law .685 -.071 -.165 -.009
13. Friends used weapon .555 .053 -.104 -.152
16. Friend in trouble for alcohol/drugs .595 -.003 -.248 -.246
17. Friends quit/want to quit school .564 .064 .053 -.282
22. Friends stopped by police .849 .021 -.105 -.126
23. Friends get in trouble at school .523 -.057 .168 -.070
Factor 2: Time with Peers
1. Peer activities: spend time hanging out -.024 .788 .099 .081
2. Spend free time with friends -.031 .742 .177 .125
3. Spend time with friends after school or work .080 .729 .088 .316
4. Do best friends spend time together hanging
out
.049 .578 .195 -.048
5. Spend time at friends’ houses -.082 .724 .212 -.156
Factor 3: Parent-peer Affinity
7. Friends know parents -.002 .300 .680 -.065
9. Parents like friends -.239 .164 .658 .121
15. Friends like your parents -.062 .110 .720 .123
20. Parents know friends .044 .317 .766 .024
Factor 4: Positive Peer Affiliation
10. Friends like school -.269 -.038 .302 .453
14. Friends want to go to college -.185 .088 .091 .567
18. Friends are in clubs/organizations -.093 .034 -.060 .478
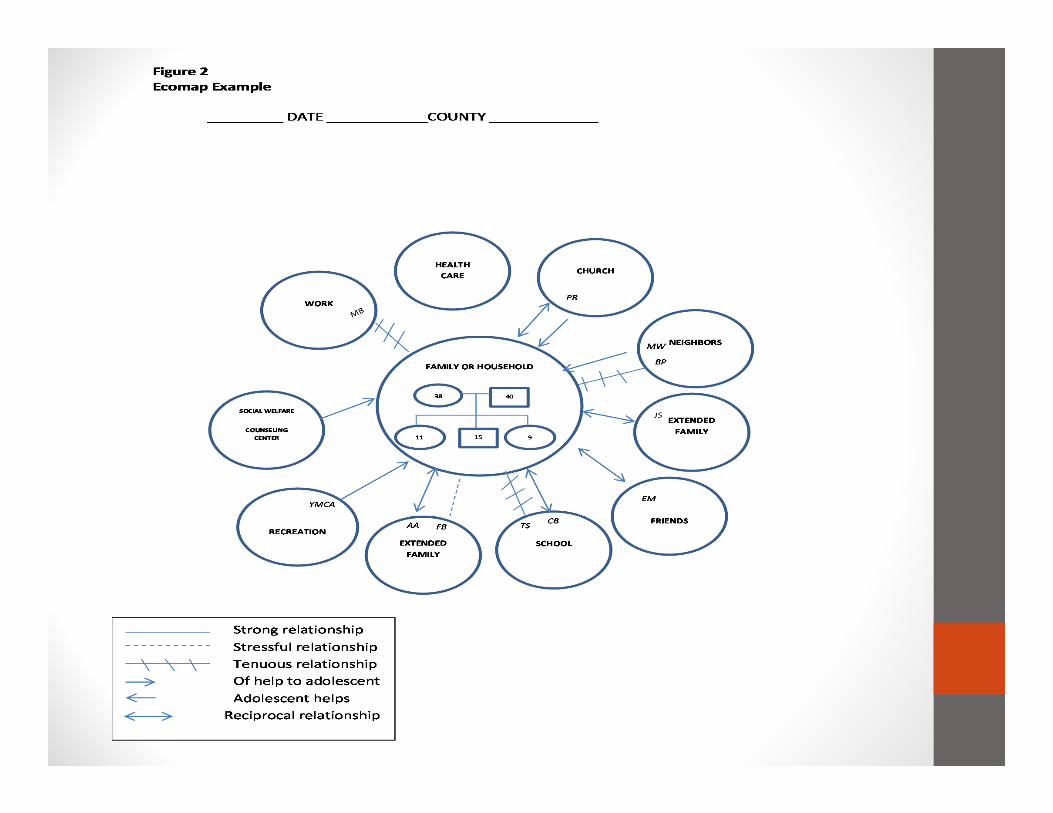
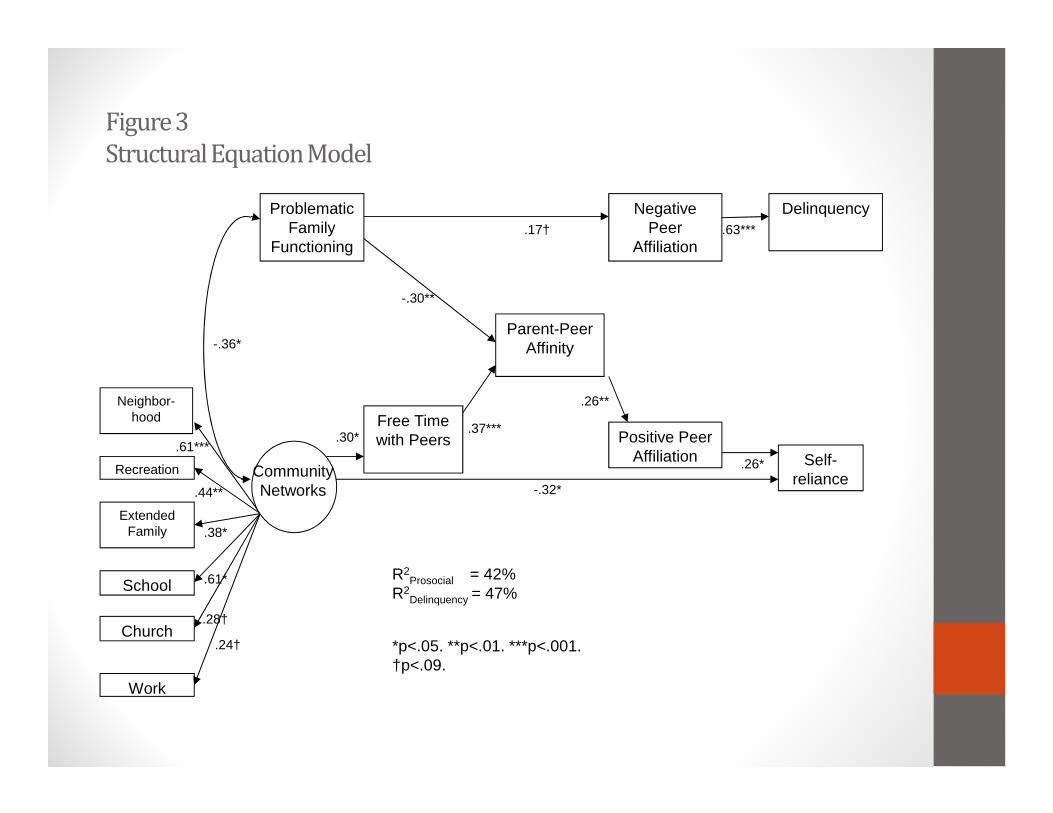
Figure 3
Structural Equation Model
Self-reliance
Delinquency
Extended Family
School
Church
Work
Neighbor-hood
Recreation
Parent-Peer Affinity
Positive Peer Affiliation
Negative Peer
Affiliation
ProblematicFamily
Functioning
Free Time with Peers
.44**
.61***
.38*
.61*
.28†
.24†
-.36*
.30*.37***
.26**
.26*
-.30**
.17† .63***
Community Networks -.32*
R2Prosocial = 42%
R2Delinquency = 47%
*p<.05. **p<.01. ***p<.001. †p<.09.
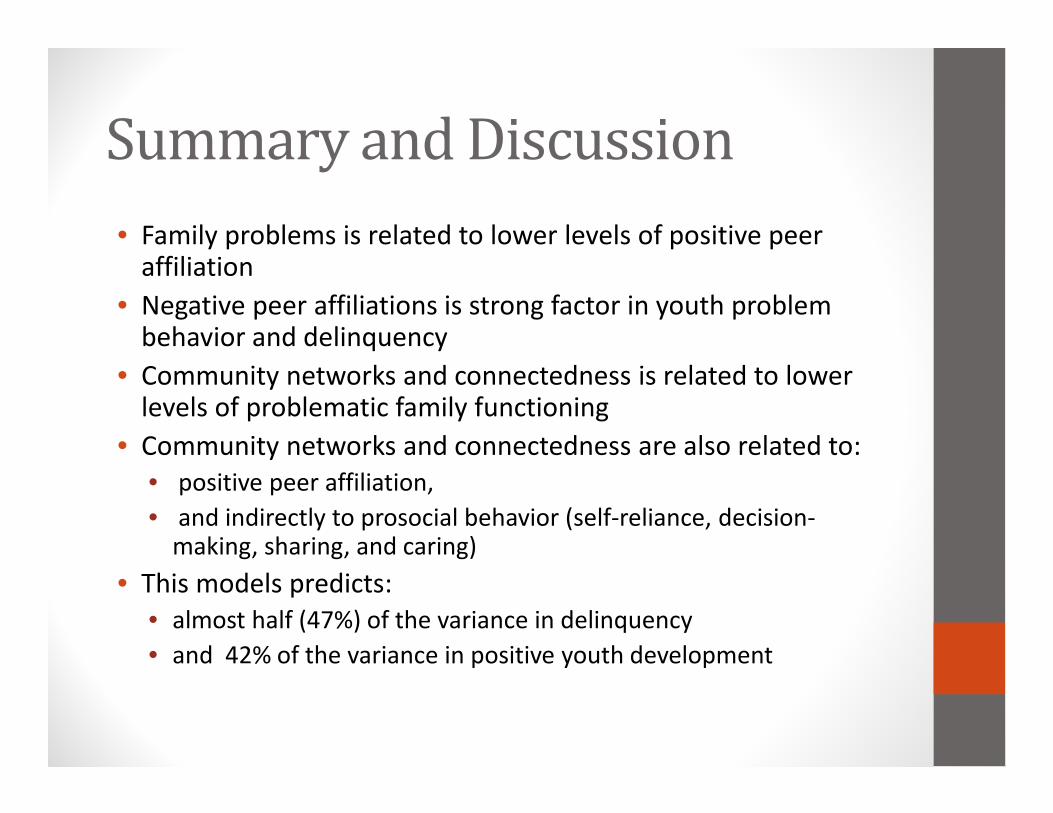
Summary and Discussion
• Family problems is related to lower levels of positive peer affiliation
• Negative peer affiliations is strong factor in youth problem behavior and delinquency
• Community networks and connectedness is related to lower levels of problematic family functioning
• Community networks and connectedness are also related to:
• positive peer affiliation,
• and indirectly to prosocial behavior (self-reliance, decision-making, sharing, and caring)
• This models predicts:
• almost half (47%) of the variance in delinquency
• and 42% of the variance in positive youth development
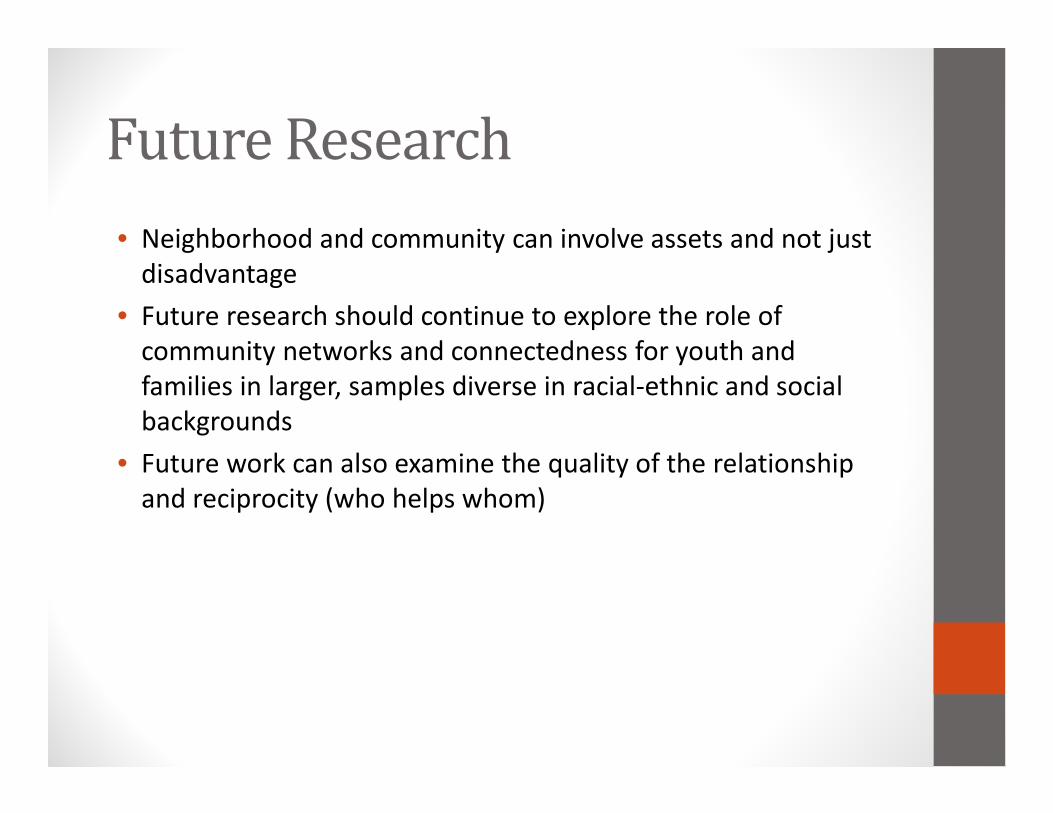
Future Research
• Neighborhood and community can involve assets and not just
disadvantage
• Future research should continue to explore the role of
community networks and connectedness for youth and
families in larger, samples diverse in racial-ethnic and social
backgrounds
• Future work can also examine the quality of the relationship
and reciprocity (who helps whom)
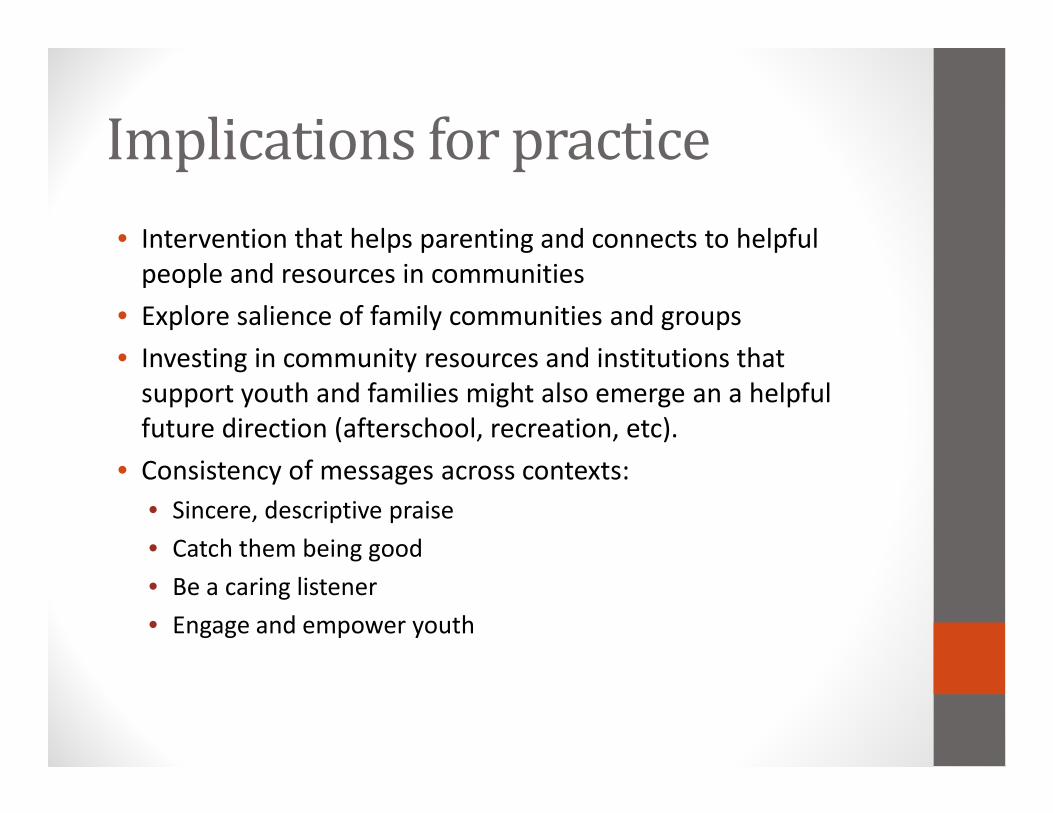
Implications for practice
• Intervention that helps parenting and connects to helpful
people and resources in communities
• Explore salience of family communities and groups
• Investing in community resources and institutions that
support youth and families might also emerge an a helpful
future direction (afterschool, recreation, etc).
• Consistency of messages across contexts:
• Sincere, descriptive praise
• Catch them being good
• Be a caring listener
• Engage and empower youth

“Leading, Educating, Guiding , Communities of Youth Together”
LEGACY Together Project
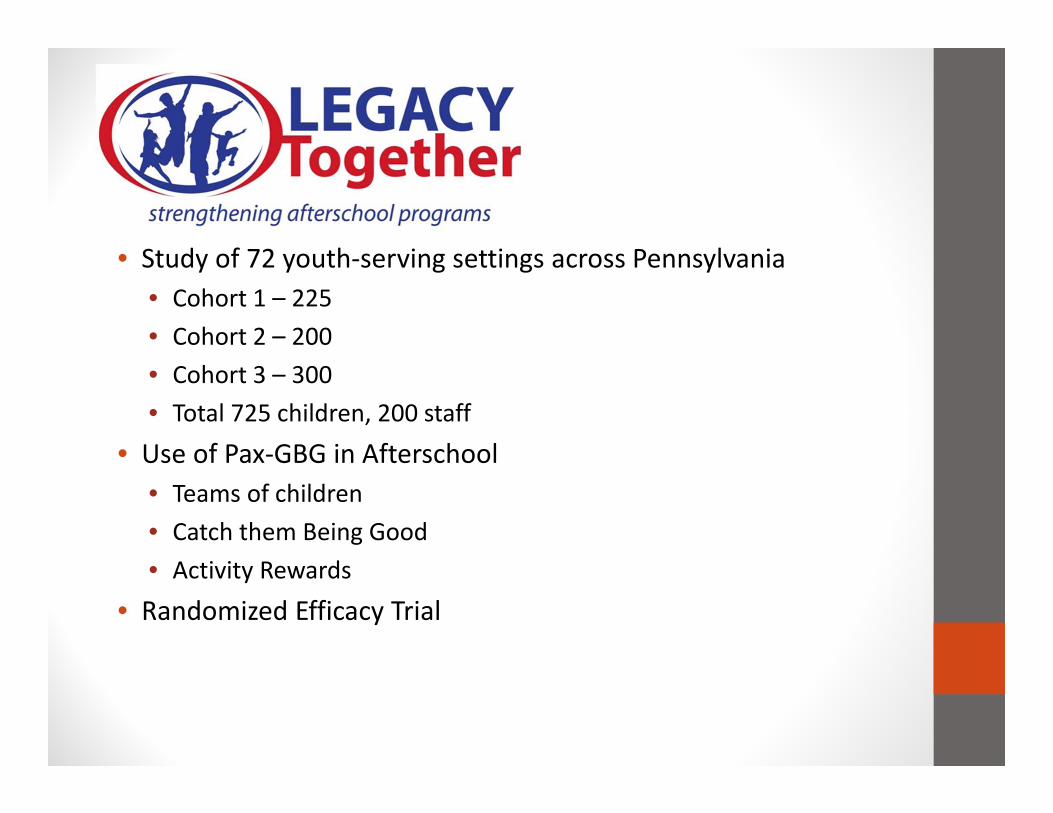
• Study of 72 youth-serving settings across Pennsylvania
• Cohort 1 – 225
• Cohort 2 – 200
• Cohort 3 – 300
• Total 725 children, 200 staff
• Use of Pax-GBG in Afterschool
• Teams of children
• Catch them Being Good
• Activity Rewards
• Randomized Efficacy Trial
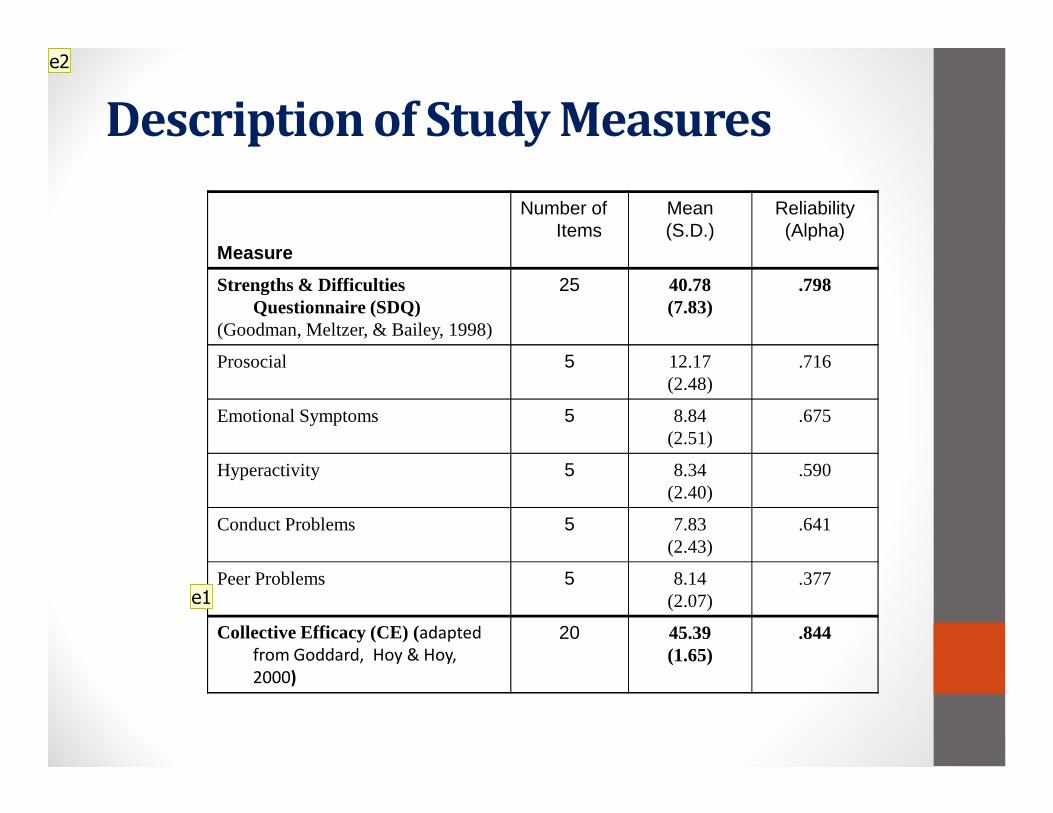
Measure
Number of Items
Mean(S.D.)
Reliability(Alpha)
Strengths & Difficulties Questionnaire (SDQ)
(Goodman, Meltzer, & Bailey, 1998)
25 40.78(7.83)
.798
Prosocial 5 12.17(2.48)
.716
Emotional Symptoms 5 8.84(2.51)
.675
Hyperactivity 5 8.34(2.40)
.590
Conduct Problems 5 7.83(2.43)
.641
Peer Problems 5 8.14(2.07)
.377
Collective Efficacy (CE) (adapted
from Goddard, Hoy & Hoy,
2000)
20 45.39(1.65)
.844
Description of Study Measures
e1
e2
Slide 24
e1 esp, 10/17/2009
e2 need missing (e.g.wave 2 if these are wave 1 means and alphas) data here. esp, 10/17/2009
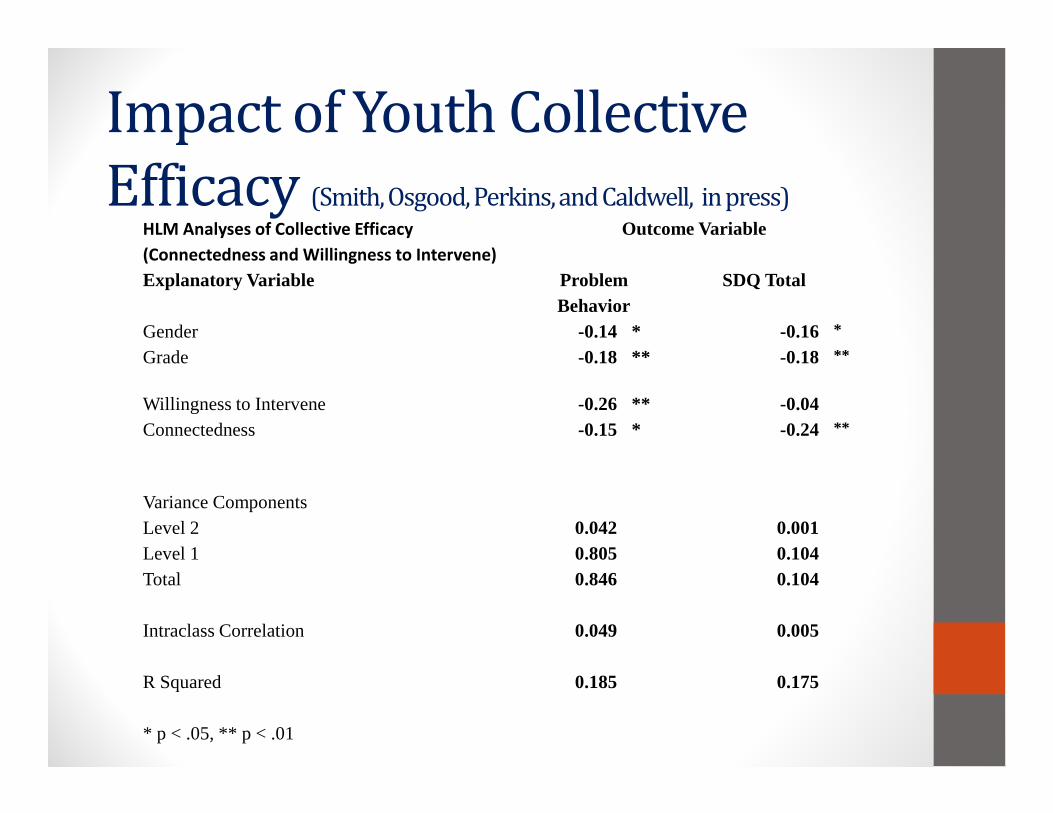
Impact of Youth Collective
Efficacy (Smith, Osgood, Perkins, and Caldwell, in press)HLM Analyses of Collective Efficacy
(Connectedness and Willingness to Intervene)
Outcome Variable
Explanatory Variable Problem Behavior
SDQ Total
Gender -0.14 * -0.16 *
Grade -0.18 ** -0.18 **
Willingness to Intervene -0.26 ** -0.04Connectedness -0.15 * -0.24 **
Variance ComponentsLevel 2 0.042 0.001Level 1 0.805 0.104Total 0.846 0.104
Intraclass Correlation 0.049 0.005
R Squared 0.185 0.175
* p < .05, ** p < .01