Embed Size (px)
Citation preview
Postharvest Biology and Technology
ELSEVIER Postharvest Biology and Technology 5 (1995) 167-175
Comparative heat of respiration of five grain beetles in stored wheat
R. Cofie-Agblor av*, W.E. Muir a, R.N. Sinha b
a De artment of Agricultural Engineering, Universi~ of Manitoba, Winnipeg, Man. R3T 2N2, Canada g Agncultute Canada Research Station, 195 Dafoe Road, Winnipeg, Man. R3T 2M9, Canada
Accepted 25 January, 1994
Abstract
The heat production of five grain beetles in wheat of 14.5% moisture content was measured at two initial grain temperatures of 20 and 30°C in 10 h using a computer- controlled adiabatic calorimeter. Heat production per individual at both temperatures was highest in Sitophilus granarius (66.1 and 81.4 pW) and lowest in Rhyzoperha dominica (12.5 and 35.3 @W). S. o’yzae had the highest heat production rate per unit biomass at 25.3 and 30.6 pW/mg at 20 and 30°C respectively. Heat production by all species was higher at 30°C than at 20°C; the difference was greater for Tribolium castaneum, I: confisum, and R. dominica than for S. granatius and S. oryzae. The rate of heat production by S. granatius at 30°C decreased with time, the average rate during the first 6 h was 93.7 pW/insect, while during the final 2 h the rate was 58.7 pW/insect. Heat production rates of S. granatius, S. ovzae, and R. dominica increased with time at 20°C. For all species at both temperatures, the measured heat production was greater than the amount calculated from the respiratory exchange.
Keywords: Heat production; Respiration; Adiabatic; Calorimeter; Beetles; Wheat
1. Introduction
Grain deterioration results from interactions among several physical, chemical, and biological variables within a stored grain bulk (Sinha, 1973). Metabolic activity of the biological agents results in the production of heat which subsequently raises the temperature, occasionally heating the grain.
Heating in stored grain is generally associated with damp grain (Carter and Young, 1950). Oxley (1948), however, observed that the amount of heat produced from the respiration of the grain itself and that of the microorganisms associated with it were
* Corresponding author.
0925-5214/95/$09,50 0 1995 Elsevier Science B.V. All rights reserved. SSDI 0925-5214(94)00007-F
168 R. Cojie-Agblor et al. /Postharvest Biology and Technology 5 (1995) 167-175
negligible when the grain moisture content (m.c.) was below 15% wet basis. After studying many cases of heating in dry grain, he concluded that in every case, the cause was insect infestation. Insect-induced heating of stored-grain has been studied by Robertson (1948); Howe (1962); and Sinha and Wallace (1966). High rates of insect fecundity under favourable environmental conditions, and the low thermal diffusivity of the grain, are two important factors that can enhance the metabolic heat production by the insects and thereby create a hot spot within bulk grain.
Metabolism of biotic agents and the associated heat evolved can be measured either directly by calorimetric techniques, or indirectly by the consumption of oxygen (02) or the evolution of carbon dioxide (CO2). The respiratory exchange of insects and the accompanying respiratory quotients (RQ) have been used as an indicator of insect metabolic activity facilitating calculation of insect respiratory energy and heat production (Robertson, 1948; Howe, 1962; and Campbell et al., 1976). The reliability of tl : respiratory exchange as an index of heat production was questioned by Lindgren (1935). He stated that even when the RQ is used to determine the substrate being oxidized, incomplete metabolism and the storing of CO2 as solid carbonate may lower the RQ without a change in the substrate being oxidized. Wightman (1981) observed that several factors may be responsible for the discrepancy between measured respiration (using respiratory exchange) and calculated respiration (from the energy budget equation).
The objective of this research, therefore, was to determine and compare the heat production of five adult grain beetles; Sitophilus granarius (L), 5. oryzae (L) (Curculionidae), Ttibolium castaneum (Herbst), T con&sum Jacquelin du Val (Tenebrionidae), and Rhizopertha dominica (Fabricius) (Bostrichidae) in stored wheat by direct measurement of their heat production using adiabatic calorimeters.
2. Materials and methods
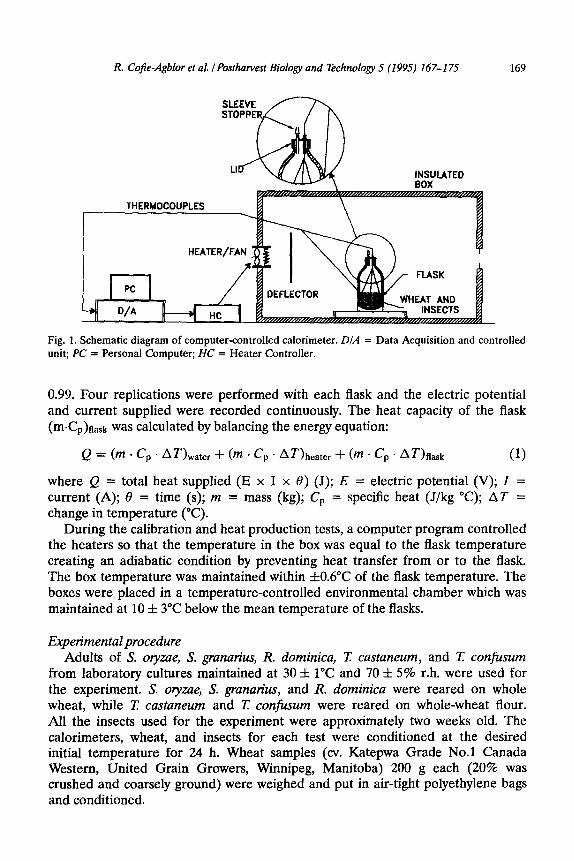
Adiabatic calorimeter The adiabatic calorimeter (Fig. 1) was similar to that of Zhang et al. (1992)
with minor modifications. It consisted of a 1.2-1 vacuum-jacketed flask (Thermos, Canada.) in a box, 750 mm x 480 mm x 580 mm, made of extruded polystyrene insulation, 50.8 mm thick. ‘Iwo 6-mm diameter holes were drilled through the lid of the flask and plastic tubing 35 mm long and 4 mm id. was inserted into each hole. The outer end of one tube was plugged with a tight-fitting rubber sleeve stopper, while three thermocouples were inserted through the other hole and into the flask. The tubes and thermocouples were held in place by filling the spaces around them with silicone, which also provided an airtight seal. The flask lid was covered with a fitted cap made of extruded polystyrene to improve the flask insulation.
Each box was equipped with a 1500-W heater and a fan and the set up was controlled by an HP 3497A Data Acquisition and Control Unit, an HP85 Personal Computer and a control unit for the heaters. The thermal performances of the calorimeters were measured by using electric-resistance heaters and a constant power supply to heat 600 g of distilled water in the flasks. Regression analysis of temperature rise and accumulated heat yielded a coefficient of determination of
R. Cofie-Agblor et al. /Postharvest Biology and Technology 5 (1995) 167-175 169
Fig. 1. Schematic diagram of computer-controlled calorimeter. D/A = Data Acquisition and controlled unit; PC = Personal Computer; HC = Heater Controller.
0.99. Four replications were performed with each flask and the electric potential and current supplied were recorded continuously. The heat capacity of the flask @.Cp)flask was calculated by balancing the energy equation:
Q = (m . c, . ~~Av,ter + (m . c, . AUheater + (m * c, . AT)flask (1)
where Q = total heat supplied (E x I x 13) (J); E = electric potential (V); I = current (A); 8 = time (s); m = mass (kg); C, = specific heat (J/kg “C); AT = change in temperature (“C).
During the calibration and heat production tests, a computer program controlled the heaters so that the temperature in the box was equal to the flask temperature creating an adiabatic condition by preventing heat transfer from or to the flask. The box temperature was maintained within f0.6”C of the flask temperature. The boxes were placed in a temperature-controlled environmental chamber which was maintained at 10 f 3°C below the mean temperature of the flasks.
Experimental procedure Adults of S. oryzae, S. granaries, R. dominica, T. castaneum, and T. conjksum
from laboratory cultures maintained at 30 f 1°C and 70 f 5% r.h. were used for the experiment. S. oryae, S. granarius, and R. dominica were reared on whole wheat, while T. castaneum and lY confusum were reared on whole-wheat flour. All the insects used for the experiment were approximately two weeks old. The calorimeters, wheat, and insects for each test were conditioned at the desired initial temperature for 24 h. Wheat samples (cv. Katepwa Grade No.1 Canada Western, United Grain Growers, Winnipeg, Manitoba) 200 g each (20% was crushed and coarsely ground) were weighed and put in air-tight polyethylene bags and conditioned.
170 R. Cofie-Agblor et aL /Postharvest Biology and Technology 5 (1995) 167-175
The insects were sieved out of the cultures and 900 insects were collected by aspiration into glass vials. The conditioned wheat samples and insects (giving a density of 900 insects/200 g of wheat) were poured into each calorimeter flask and the lids were closed tightly. A 160-mm long needle was inserted through the sleeve stopper into the flask and a 2-ml air sample was taken for gas chromatographic analysis. The boxes were then covered and the temperature of the chamber was lowered by 10°C. The temperature was continuously recorded and the experiment was stopped after 10 h. Air samples were taken for analysis and the insects were sieved out and collected. When all parts of an insect remained immobile, it was considered dead and was counted to calculate percent mortality.
Gas analysis was performed using an HP 5890A gas chromatograph (Hewlett- Packard, Avondale, Pa., U.S.A.) with thermal conductivity detector, porapak Q column in series with molecular sieve 13X and operated at an oven temperature of 70°C and a detector temperature of 150°C. A column head pressure of 420 kPa was maintained.
For each insect species, the heat of respiration and CO2 production were measured at two initial grain temperatures, 20 and 30°C in wheat of 14.5% moisture content (wet basis).
Analyses of experimental data Heat production was determined by two methods. In method A, cumulative heat
production was calculated from the temperature increase as:
H = AT(m,c, + q) (2)
where H = cumulative heat production (kJ); AT = cumulative temperature increase (“C); mg = mass of grain (kg); cp = specific heat of grain &J/kg “C); and cf = heat capacity of flask (kJ/“C).
Method B involved the use of the respiratory exchange (volumes of CO2 produced and 02 utilized), the RQ, and the thermal equivalents of 02 and CO:! listed in Brody (1964) to calculate cumulative heat production of each insect species. The volume of CO2 produced and 02 utilized was calculated from the measured concentrations as:
u = Vf - y x (G-Q ( ) where v = volume of gas (m3); Vf = flask volume (m3); p = particle density of grain (kg/m3); C, = initial gas concentration (decimal fraction by volume); and Cb = final gas concentration (decimal fraction by volume).
The RQ was determined from the ratio of moles of CO2 produced to moles of 02 consumed. The ideal gas equation and Dalton’s law of partial pressures were used to calculate the moles of each gas, assuming a perfect gas behaviour for COz. The pressure inside the flask at the end of the experiment was calculated from Nz concentrations, assuming that the mass of N2 in the flask remained constant throughout the test.
R. Cofie-Agblor et al. /Postharvest Biology and Technology 5 (1995) 167-175 171
3. Results and discussion
General comments The mortality of all species was less than 1% under both initial grain tempera-
tures. Because a controlled test without insects did not produce significant changes in CO2 concentration and temperature rise at both initial grain temperatures, we assumed that the heat produced exclusively by the grain was negligible. Compar- isons of heat production and respiratory rates were made on a biomass basis, unless stated otherwise.
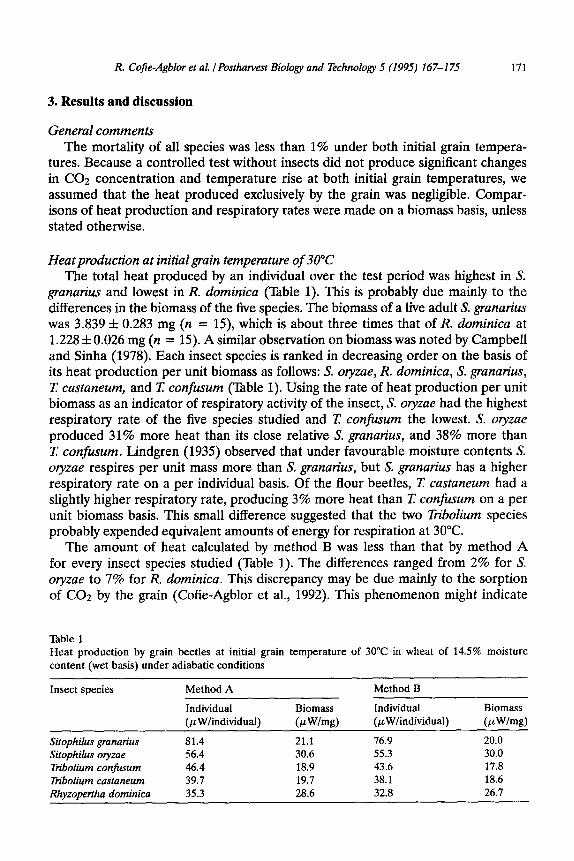
Heat production at initialgrain temperature of 30°C The total heat produced by an individual over the test period was highest in S.
granatius and lowest in R. dominica (Table 1). This is probably due mainly to the differences in the biomass of the five species. The biomass of a live adult S. granatiw was 3.839 f 0.283 mg (n = 15), which is about three times that of R. dominica at 1.228 f 0.026 mg (n = 15). A similar observation on biomass was noted by Campbell and Sinha (1978). Each insect species is ranked in decreasing order on the basis of its heat production per unit biomass as follows: S. oryzae, R. dominica, S. granarius, T. castaneum, and T. confusum (Table 1). Using the rate of heat production per unit biomass as an indicator of respiratory activity of the insect, S. oryzae had the highest respiratory rate of the five species studied and I: confusum the lowest. S. olyzae produced 31% more heat than its close relative S. granatius, and 38% more than T. confusum. Lindgren (1935) observed that under favourable moisture contents S. olyzae respires per unit mass more than S. granaries, but S. granaries has a higher respiratory rate on a per individual basis. Of the flour beetles, I: castaneum had a slightly higher respiratory rate, producing 3% more heat than I: confksum on a per unit biomass basis. This small difference suggested that the two Tribolium species probably expended equivalent amounts of energy for respiration at 30°C.
The amount of heat calculated by method B was less than that by method A for every insect species studied (Table 1). The differences ranged from 2% for S. oryzae to 7% for R. dominica. This discrepancy may be due mainly to the sorption of CO2 by the grain (Cofie-Agblor et al., 1992). This phenomenon might indicate
Table 1 Heat production by grain beetles at initial grain temperature of 30°C in wheat of 14.5% moisture content (wet basis) under adiabatic conditions
Insect species Method A
individual (,uW/individual)
Biomass
(wW/mg)
Method B
Individual (pW/individual)
Biomass
(pW/mg)
Sitophilus gmnarius 81.4 21.1 76.9 20.0 Sitophilus oyzae 56.4 30.6 55.3 30.0 Tribolium confusum 46.4 18.9 43.6 17.8 Tribolium castaneum 39.7 19.7 38.1 18.6 RhyzoDertha dominica 35.3 28.6 32.8 26.7
172 R. Cofie-Agblor et al. /Postharvest Biology and Technology 5 (1995) 167-175
that the amount of CO2 measured was less than the actual amount produced and therefore affected the measured concentrations of 02 and N2. In turn the values of the respiratory quotient, 02 concentration, and the final pressure inside the flask would be affected. The results obtained by either method, however, compared favourably with some of the published research on insect respiration. Campbell et al. (1976) determined the amount of energy respired by S. grunarius as 82.18 PWlindividual at a constant temperature of 30°C and 70% relative humidity (r.h.) in wheat of 14% m.c. (wet basis). The average energy required for maintenance of r castuneum adults at 29°C and 70% r.h. in 95% wheat flour and 5% brewer’s yeast was approximately 42.13 @W/individual (Klekowski et al., 1967). The results reported by Birch (1947), which are lower than those that we measured, were calculated from 02 consumption and include 22.92 pW/individual for R. dominicu and 31.83 pW/individual for S. oryzue at a constant temperature of 30°C in wheat of 11% and 14% m.c. (wet basis) and 55 and 70% r.h., respectively. Lindgren (1935) observed that the respiration of S. oryzae at 25 and 30°C increases with increasing m.c. from 8.7% to 15.2% wet basis. Howe (1962) noted that the accumulation of metabolic heat in grain raises the temperature of the grain, and subsequently increases the metabolic activity of the insects. It is possible, therefore, that the rate of heat production under adiabatic conditions might be higher than that at constant temperatures.
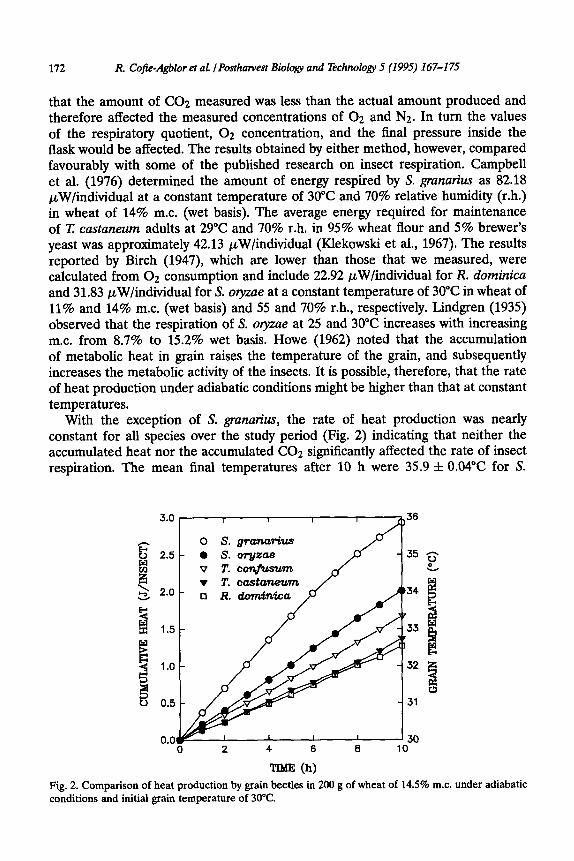
With the exception of S. grunutius, the rate of heat production was nearly constant for all species over the study period (Fig. 2) indicating that neither the accumulated heat nor the accumulated CO2 significantly affected the rate of insect respiration. The mean final temperatures after 10 h were 35.9 f 0.04”C for S.
TIME (h) Fig. 2. Comparison of heat production by grain beetles in 200 g of wheat of 14.5% m.c. under adiabatic conditions and initial grain temperature of 30°C.
R. Coje-Agblor et al. IPostharvest Biology and Technology 5 (1995) 167-175 173
granarius, 34.1 f 0.07”C for S. oryzae, 33.4 f 0.12”C for I: confisum, 32.8 f 0.21”C for T. castaneum, and 32.6 f 0.12”C for R. dominica.
The respiratory rate of S. granatius decreased with time (Fig. 2). The amount of heat produced in the first 2 h was 0.70 J/insect or 24% of the total heat produced, and only 14% of the total heat produced or 0.42 J/insect occurred within the last 2 h of the experiment. The average rate of heat production in the first 6 h was 93.7 pW/insect while the last 2 h produced on average 58.7 pW/insect. The decrease in the rate of heat production by S. granatius might be due to a combined effect of the increased temperature of 35.9”C and the increased CO;? concentration of 12%. Sinha and Watters (1985) indicated that S. granaries prefers a cooler climate compared with S. olyzae and that S. granatius is less tolerant to short exposures of supraoptimal temperatures (40°C) than is S. o’yzae in grain at 13-14% m.c.
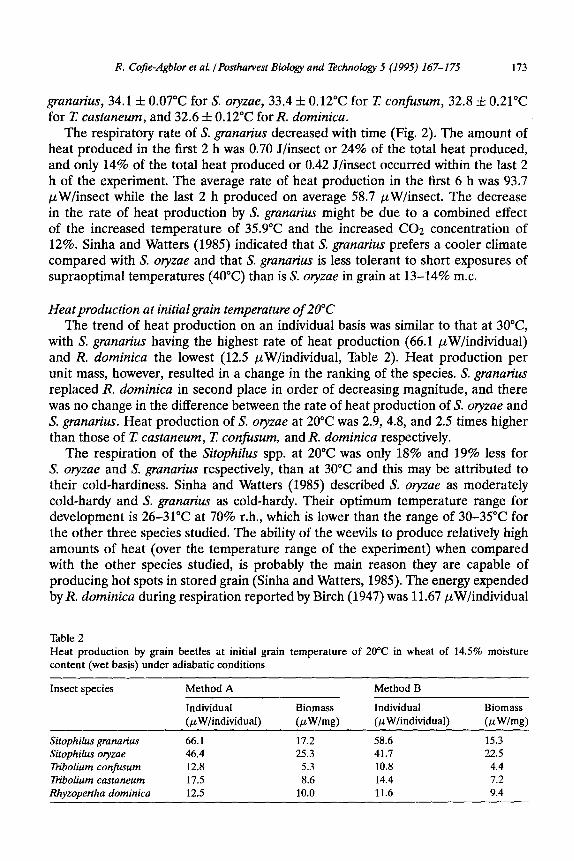
Heat production at initial grain temperature of 20°C The trend of heat production on an individual basis was similar to that at 30°C
with S. granatius having the highest rate of heat production (66.1 ,xWlindividual) and R. dominica the lowest (12.5 PWlindividual, Table 2). Heat production per unit mass, however, resulted in a change in the ranking of the species. S. granatius replaced R. dominica in second place in order of decreasing magnitude, and there was no change in the difference between the rate of heat production of S. olyzae and S. granatius. Heat production of S. olytae at 20°C was 2.9, 4.8, and 2.5 times higher than those of T. castaneum, T. confusum, and R. dominica respectively.
The respiration of the Sitophilus spp. at 20°C was only 18% and 19% less for S. oqzae and S. granatius respectively, than at 30°C and this may be attributed to their cold-hardiness. Sinha and Watters (1985) described S. oryzae as moderately cold-hardy and S. granarius as cold-hardy. Their optimum temperature range for development is 26-31°C at 70% r.h., which is lower than the range of 30-35°C for the other three species studied. The ability of the weevils to produce relatively high amounts of heat (over the temperature range of the experiment) when compared with the other species studied, is probably the main reason they are capable of producing hot spots in stored grain (Sinha and Watters, 1985). The energy expended by R. dominica during respiration reported by Birch (1947) was 11.67 ,xWlindividual
Table 2 Heat production by grain beetles at initial grain temperature of 20°C in wheat of 14.5% moisture content (wet basis) under adiabatic conditions
Insect species Method A
Individual (pW/individual)
Biomass
(KW/mg)
Method B
Individual @W/individual)
Biomass
(pW/mg)
Sitophilus granatius 66.1 17.2 58.6 15.3 Sitophilus oryzae 46.4 25.3 41.7 22.5 Ttibolium conjiwm 12.8 5.3 10.8 4.4 Ttibolium castaneum 17.5 8.6 14.4 7.2 Rhyzoperiha dominica 12.5 10.0 11.6 9.4
174 R. Cafe-Agblor et aL I Postharvest Biology and Technology 5 (1995) 167-l 75
2.5 , I I I I 25
0 s. E 0 s. gj 2.0 -
Ei v T.
2 v T. q R. E -
4
1.5
granarius
24 2
23
L3 d v 0.5 21
0.0 20 0 2 4 6 6 10
TIME (h) Fig. 3. Comparison of heat production by grain beetles in 200 g of wheat of 14.5% m.c. under adiabatic conditions and initial grain temperature of 20°C.
(2.02 mm3 02/h) at 22°C and it is in close agreement with our measured results at 20°C. The same paper reported a value of 14.03 pW/individual(2.39 mm3 02/h) for S. olyzae at 22°C. The small strain of S. oryzae and a moisture content of 14% used in that experiment may be responsible for the difference in the results. Also, the effect of accumulated heat in the current study may be responsible for the higher respiratory rate observed.
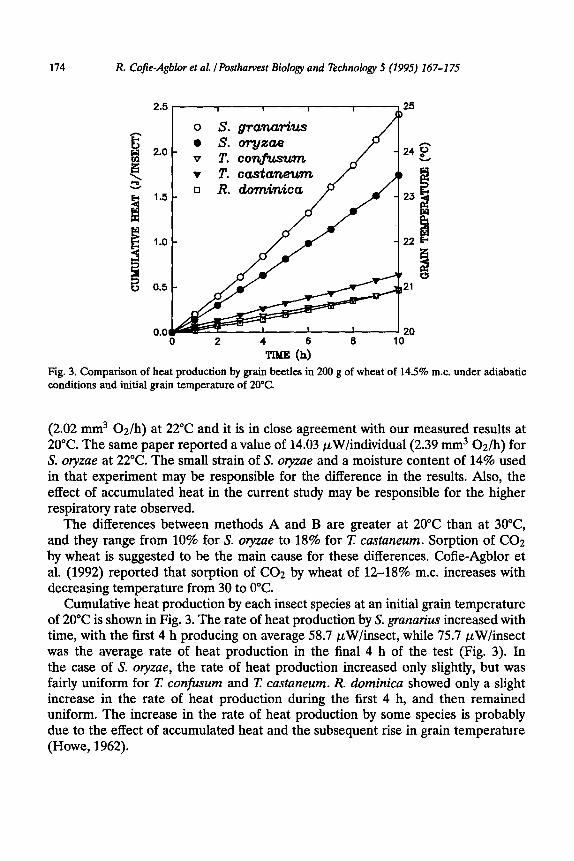
The differences between methods A and B are greater at 20°C than at 3O”C, and they range from 10% for S. oryzae to 18% for I: castuneum. Sorption of CO:! by wheat is suggested to be the main cause for these differences. Cofie-Agblor et al. (1992) reported that sorption of CO2 by wheat of 12-18% m.c. increases with decreasing temperature from 30 to 0°C.
Cumulative heat production by each insect species at an initial grain temperature of 20°C is shown in Fig. 3. The rate of heat production by S. grunarius increased with time, with the first 4 h producing on average 58.7 pW/insect, while 75.7 pW/insect was the average rate of heat production in the final 4 h of the test (Fig. 3). In the case of S. olyzae, the rate of heat production increased only slightly, but was fairly uniform for T. con&sum and I: castaneum. R. dominica showed only a slight increase in the rate of heat production during the first 4 h, and then remained uniform. The increase in the rate of heat production by some species is probably due to the effect of accumulated heat and the subsequent rise in grain temperature (Howe, 1962).
R. Cofie-Agblor et al. IPostharvest Biology and Technology 5 (1995) 167-175 175
4. Conclusions
The heat of respiration measured directly by temperature increase was higher than that calculated from the respiratory exchange. The rate of heat production was a function of the initial grain temperature and in some species, was affected by the increasing temperature during the test. S. ovzae had the highest rate of heat production among the five stored grain beetles studied at both initial grain temperatures of 20 and 30°C.
Acknowledgements
This research was supported by a grant from the Natural Sciences and Engineer- ing Research Council of Canada.
References
Birch, L.C., 1947. The oxygen consumption of the small strain of Calandra otyzae L. and Rhizopetiha dominica Fab. as affected by temperature and humidity. Ecology, 28: 17-25.
Brody, S., 1964. Bioenergetics and Growth. Hafner, New York, N.Y. Campbell, A. and Sinha, R.N., 1978. Bioenergetics of the granivorous beetles, Cvptolestes ferrugineus
and Rhyzopertha dominica (Coleoptera: Cucujidae and Bostrichidae). Can. J. Zool., .56(4): 624-633. Campbell, A., Singh, N.B. and Sinha, R.N., 1976. Bioenergetics of the granary weevil, SitophiZus
granurius (L.) (Coleoptera: Curculionidae). Can. J. Zool., 54: 786-798. Carter, E.I? and Young, G.Y., 1950. Role of fungi in the heating of moist wheat. USDA Circular No.
838. Cofie-Agblor, R., Muir, W.E., Cenkowski, S. and Jayas, D.S., 1992. Carbon dioxide sorption in stored
wheat. Presented at the International Conference on Controlled Atmosphere and Fumigation in Grain Storages, June 11-13, 1992, Winnipeg, Man.
Howe, R.W., 1962. A study of the heating of stored grain caused by insects. Ann. Appl. Biol., 50: 137-15s.
Klekowski, R.Z., Prus, T and Zyromska-Rudzka, H., 1967. Elements of energy budget of Ttibolium castaneum (Hbst) in its developmental cycle. In: K. Petrusewicz (Editor), Secondary Productivity of Terrestrial Ecosystems (Principles and Methods). Panstwowe Wydawnictwo Naukowe, Warszawa- Krakow, pp. 859-879.
Lindgren, D.L., 1935. The respiration of insects in relation to the heating and the fumigation of grain. Univ. Minn. Agric. Exp. Stn. Tech. Bull., 109, 32 pp.
Oxley, ‘LA., 1948. The Scientific Principles of Grain Storage. The Northern Publ. Co., Liverpool, 103
PP. Robertson, R.N., 1948. Heating in stored wheat, II. Heat production, heat conductivity, and temper-
ature rise in grain in the presence and absence of insects. Bull. Count. Sci. Ind. Res. Aust., 237: 18-29.
Sinha, R.N., 1973. Ecology of storage. Ann. Technol. Agric., 22: 351-369. Sinha, R.N. and Wallace, H.A.H., 1966. Ecology of insect-induced hot spots in stored grain in Western
Canada. Res. Popul. Ecol., 8: 107-132. Sinha, R.N. and Watters, FL., 1985. Insect Pests of Flour Mills, Grain Elevators, and Feed Mills and
their Control. Agric. Can. Publ. 17768, 290 pp. Wightman, J.A., 1981. Why insect energy budgets do not balance. Oecologia (Berlin), 50: 166-169. Zhang, Q., Muir, W.E., Sinha, R.N. and Cenkowski, S., 1992, Heat production in wet wheat under
adiabatic conditions. Can. Agric. Eng., 34: 233-239.