Embed Size (px)
Citation preview

UNF Digital Commons
UNF Graduate Theses and Dissertations Student Scholarship
2013
Comparative Sugar Transport by CrustaceanHepatopancreas and IntestineAda DukaUniversity of North Florida
This Master's Thesis is brought to you for free and open access by theStudent Scholarship at UNF Digital Commons. It has been accepted forinclusion in UNF Graduate Theses and Dissertations by an authorizedadministrator of UNF Digital Commons. For more information, pleasecontact Digital Projects.© 2013 All Rights Reserved
Suggested CitationDuka, Ada, "Comparative Sugar Transport by Crustacean Hepatopancreas and Intestine" (2013). UNF Graduate Theses andDissertations. 466.https://digitalcommons.unf.edu/etd/466
COMPARATIVE SUGAR TRANSPORT BY CRUSTACEAN HEPATOPANCREAS AND INTESTINE
By
Ada Duka
A thesis submitted to the Department of Biology
in partial fulfillment of the requirements for the degree of
Master of Science in Biology
UNIVERSITY OF NORTH FLORIDA
COLLEGE OF ARTS AND SCIENCES
August, 2013
Unpublished work © Ada Duka
2
CERTIFICATE OF APPROVAL
The thesis of Ada Duka is approved: (Date)
_____________________________ ______________
_____________________________ ______________
_____________________________ ______________
Committee Chairperson
Accepted for the Department:
_____________________________ _______________
Chairperson
Accepted for the College:
_____________________________ _______________
Dean
Accepted for the University:
_____________________________ _______________
Dean of Graduate Studies
II
3
ACKNOWLEDGEMENTS
This work is supported by USDA grant no. 2010-65206-20617 and Dr. Gregory Ahearn. I
would like to thank my mentor, Dr. Gregory Ahearn for his guidance and support that allowed
me to complete the graduate program here at the University of North Florida. I would also like
to thank my graduate committee members, Dr. Judith Ochrietor and Dr. James Gelsleichter for
their advice and support. I would like to thank the faculty and staff of the University of North
Florida Biology Department for making my graduate experience very memorable.
I owe much gratitude to my family for their support, especially to my mother Arta Duka
for being there for me throughout graduate school. She has been my motivation and
inspiration.
iii
4
TABLE OF CONTENTS
Certificate of Approval II
Acknowledgements iii
Table of Contents iv
List of Tables and Figures v
Abstract vii
Introduction 9
Materials and Methods 19
Results 26
Discussion 47
Conclusions 57
References 58
Vita 62
iv
5
LIST OF TABLES AND FIGURES
Figure 1 SGLT 1 transport protein model. 11
Figure 2 GLUT transport protein model. 13
Figure 3 Diagram of the digestive tract of Homarus americanus showing an
epithelial- lined hepatopancreatic (mid-gut gland) tubule and intestine.
17
Figure 4 Simplified steps for preparing lobster hepatopancreatic BBMV using a
series of buffers, a Waring blender, Potter-Elvehjm homogenizer and a
Sorvall RC-2B centrifuge.
21
Figure 5 A diagram of the perfusion apparatus. 25
Figure 6 Frozen BBMV act in a similar manner to fresh BBMV. 27
Figure 7 Increasing NaCl concentrations stimulate glucose transport in a
hyperbolic manner.
29
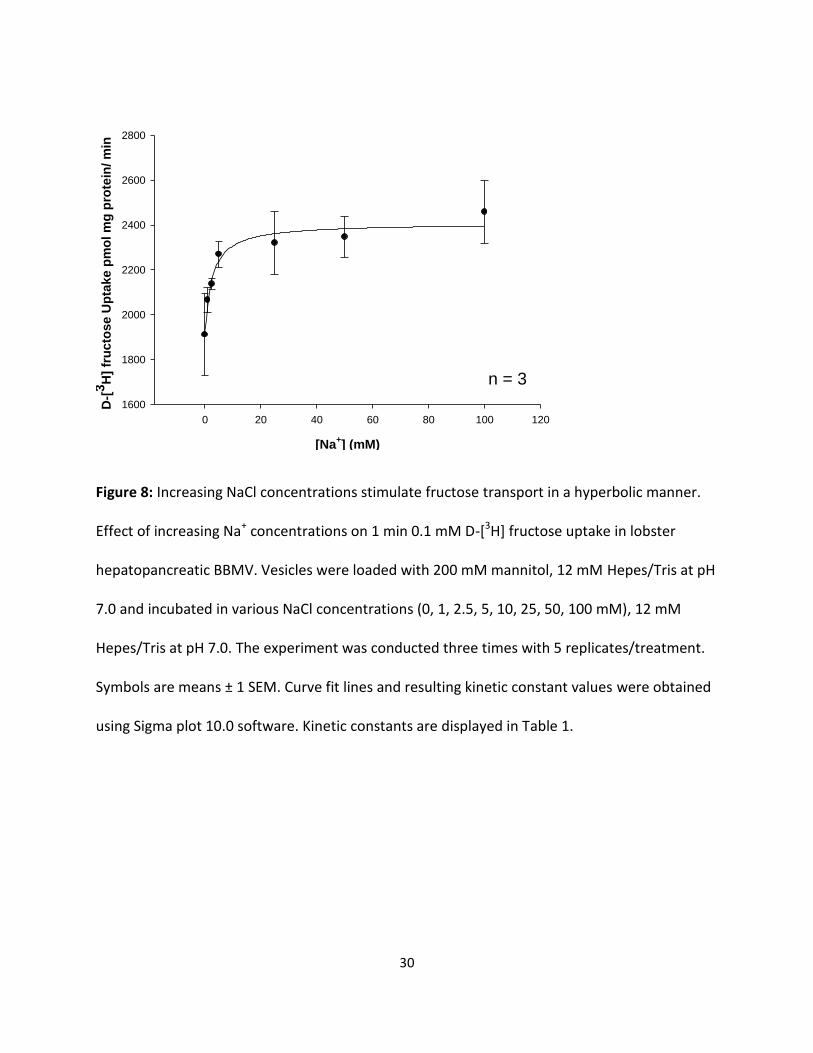
Figure 8 Increasing NaCl concentrations stimulate fructose transport in a
hyperbolic manner.
30
Figure 9 Increasing KCl concentrations stimulate glucose in a hyperbolic manner. 32
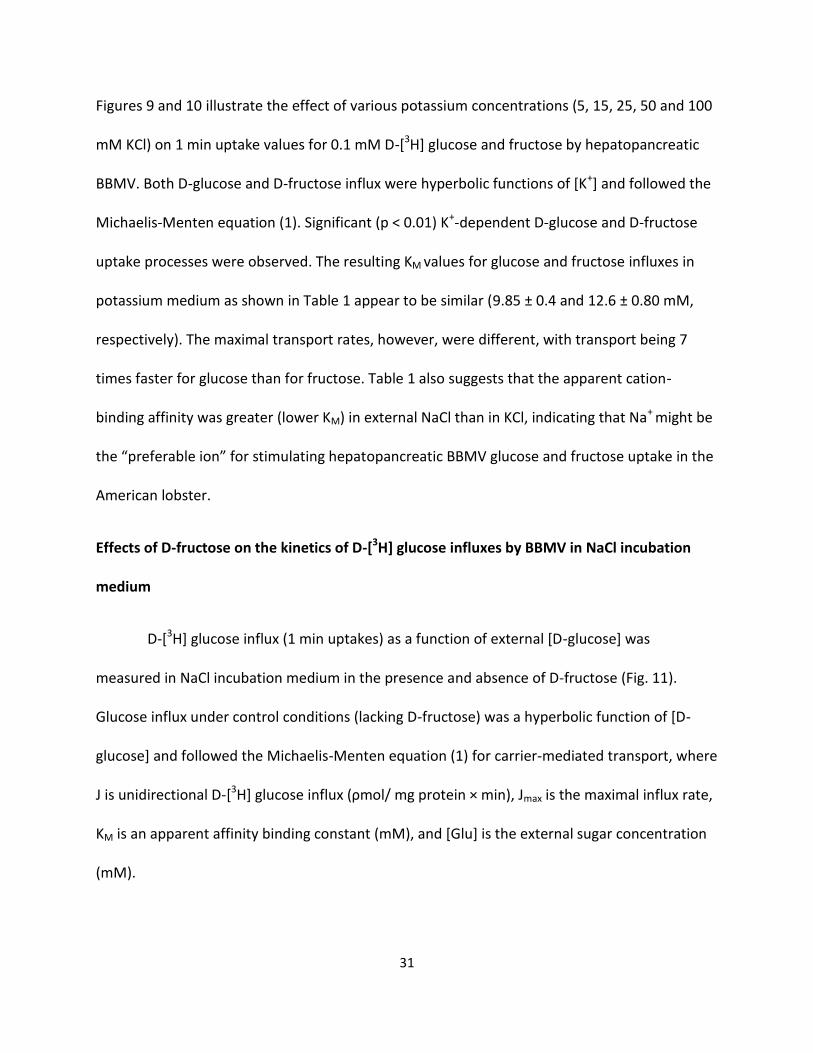
Figure 10 D-fructose displays K+-dependent uptake processes in the hepatopancreas.
33
Figure 11 Effect of increasing D-[3H] glucose concentrations (0.1, 0.5, 1, 5, 10 mM)
on 1 min uptake in NaCl incubation medium in the presence and absence
of D-fructose (75 and 100 mM).
36
Figure 12 Increasing NaCl concentrations stimulate transepithelial glucose
transport in a hyperbolic manner.
39
Figure 13 Increasing NaCl concentrations stimulate transepithelial fructose
transport in a hyperbolic manner.
40
Figure 14 D-glucose displays K+-dependent uptake processes in the intestine. 41
Figure 15 D-fructose displays K+-dependent uptake processes in the intestine. 42
v
6
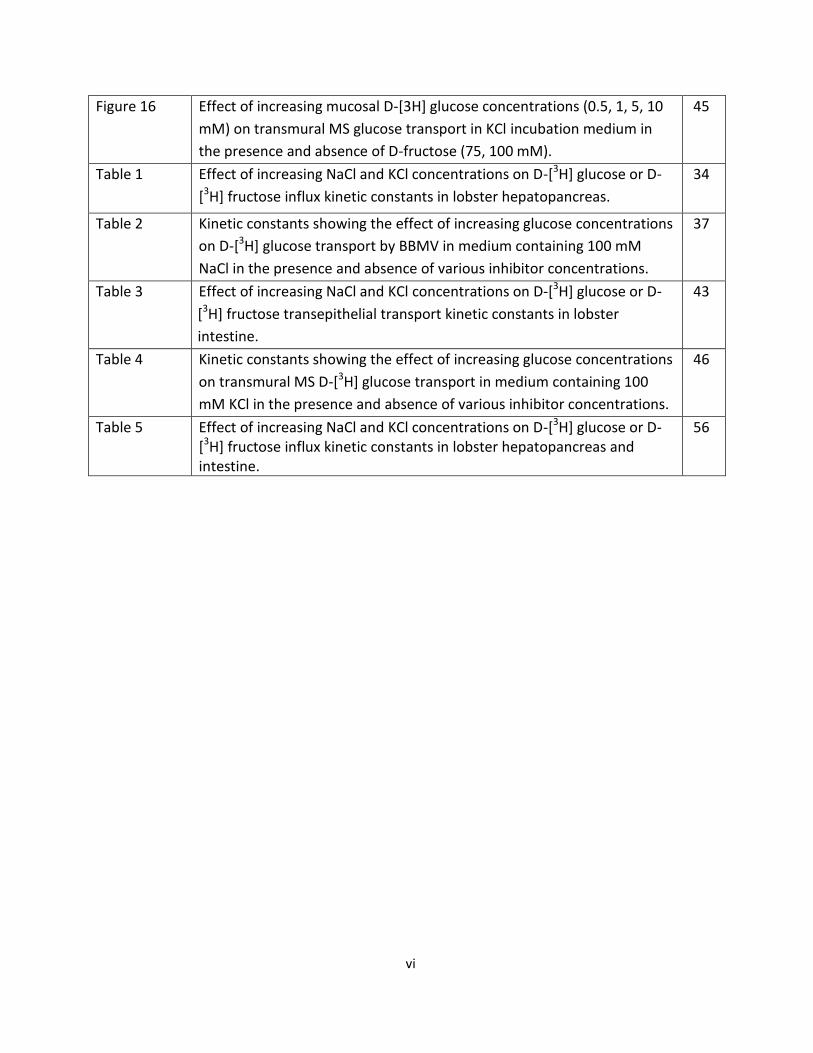
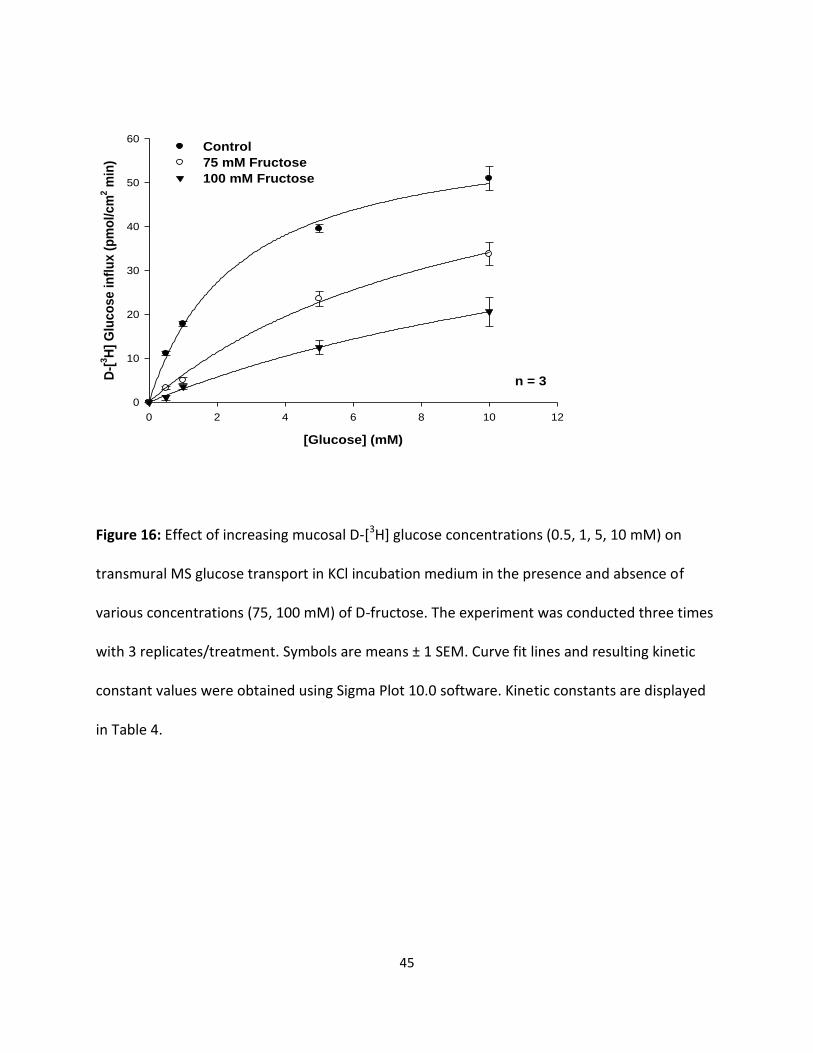
Figure 16 Effect of increasing mucosal D-[3H] glucose concentrations (0.5, 1, 5, 10
mM) on transmural MS glucose transport in KCl incubation medium in
the presence and absence of D-fructose (75, 100 mM).
45
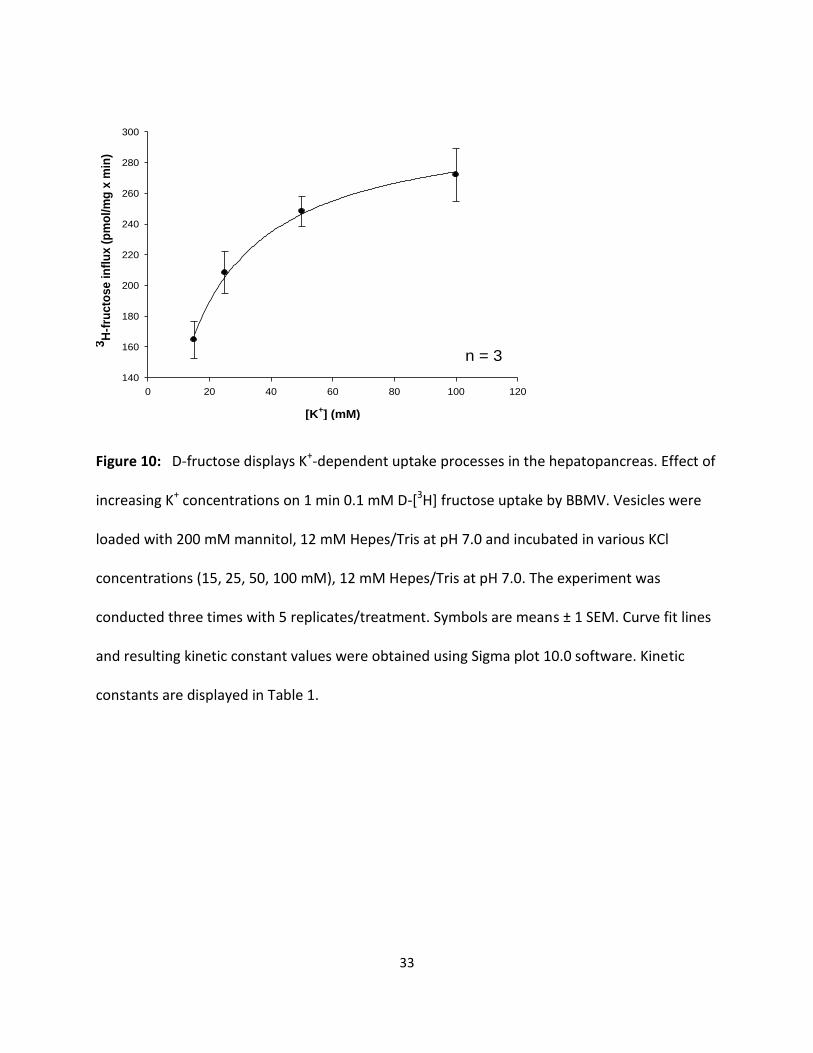
Table 1 Effect of increasing NaCl and KCl concentrations on D-[3H] glucose or D-
[3H] fructose influx kinetic constants in lobster hepatopancreas.
34
Table 2 Kinetic constants showing the effect of increasing glucose concentrations
on D-[3H] glucose transport by BBMV in medium containing 100 mM
NaCl in the presence and absence of various inhibitor concentrations.
37
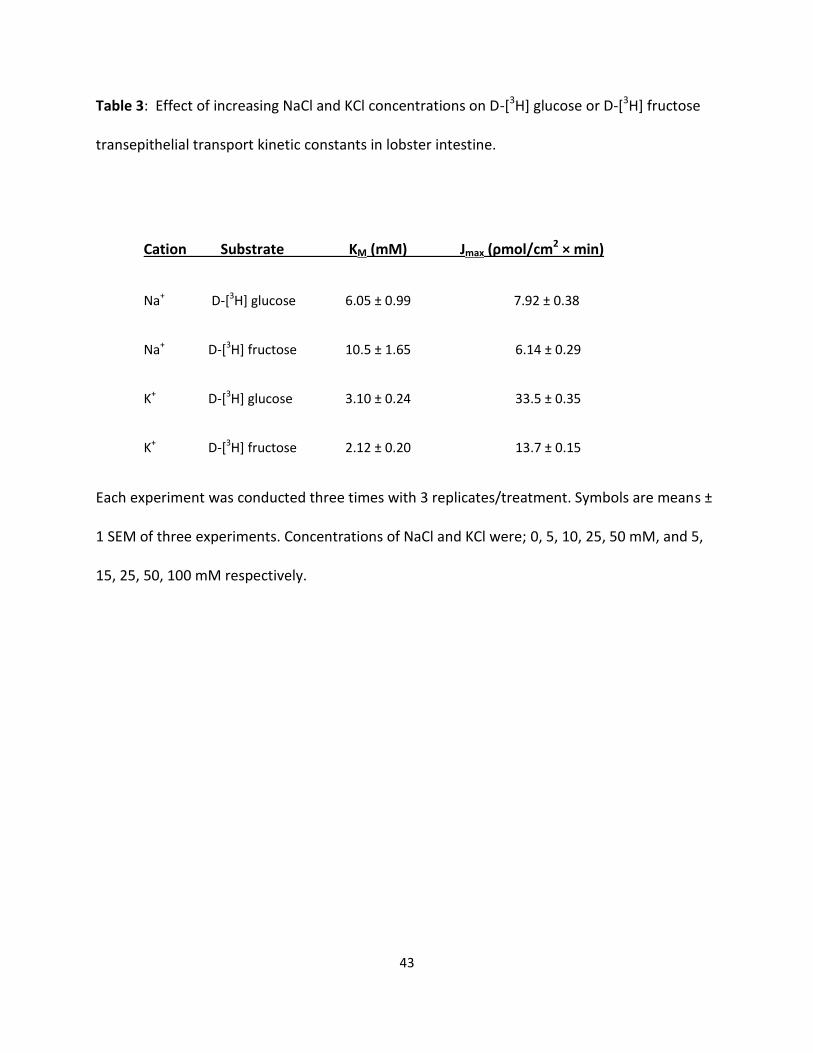
Table 3 Effect of increasing NaCl and KCl concentrations on D-[3H] glucose or D-
[3H] fructose transepithelial transport kinetic constants in lobster
intestine.
43
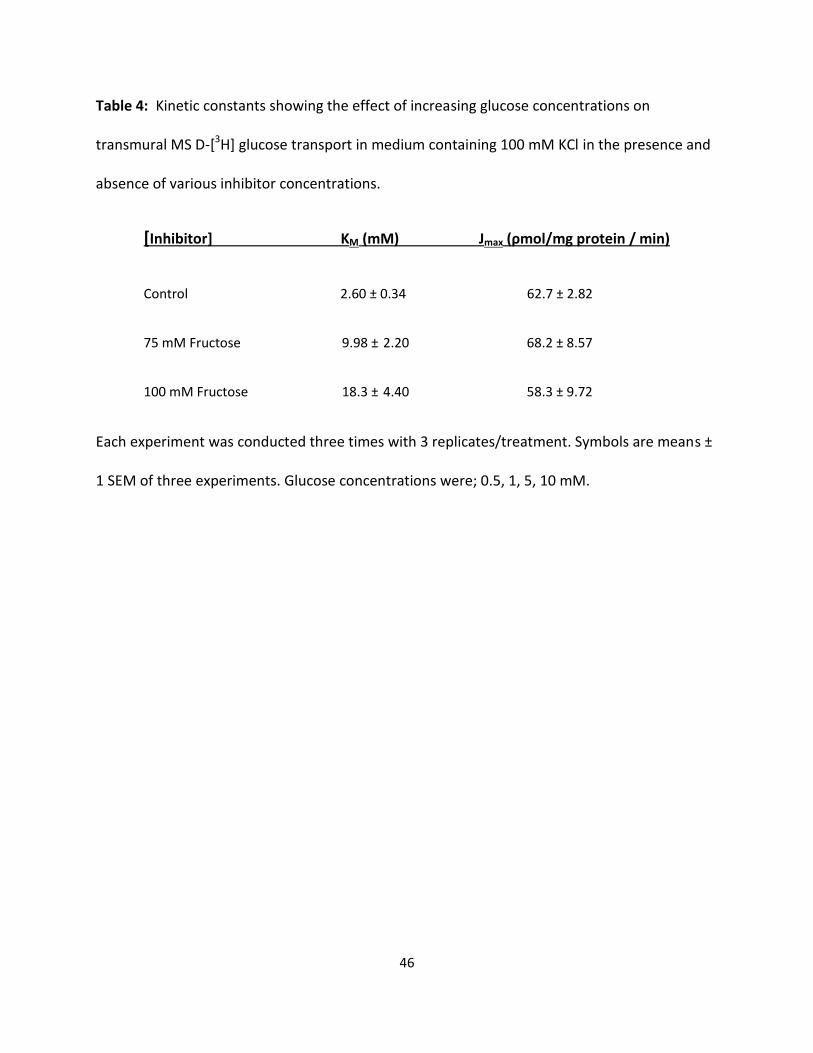
Table 4 Kinetic constants showing the effect of increasing glucose concentrations
on transmural MS D-[3H] glucose transport in medium containing 100
mM KCl in the presence and absence of various inhibitor concentrations.
46
Table 5 Effect of increasing NaCl and KCl concentrations on D-[3H] glucose or D-[3H] fructose influx kinetic constants in lobster hepatopancreas and intestine.
56
vi
7
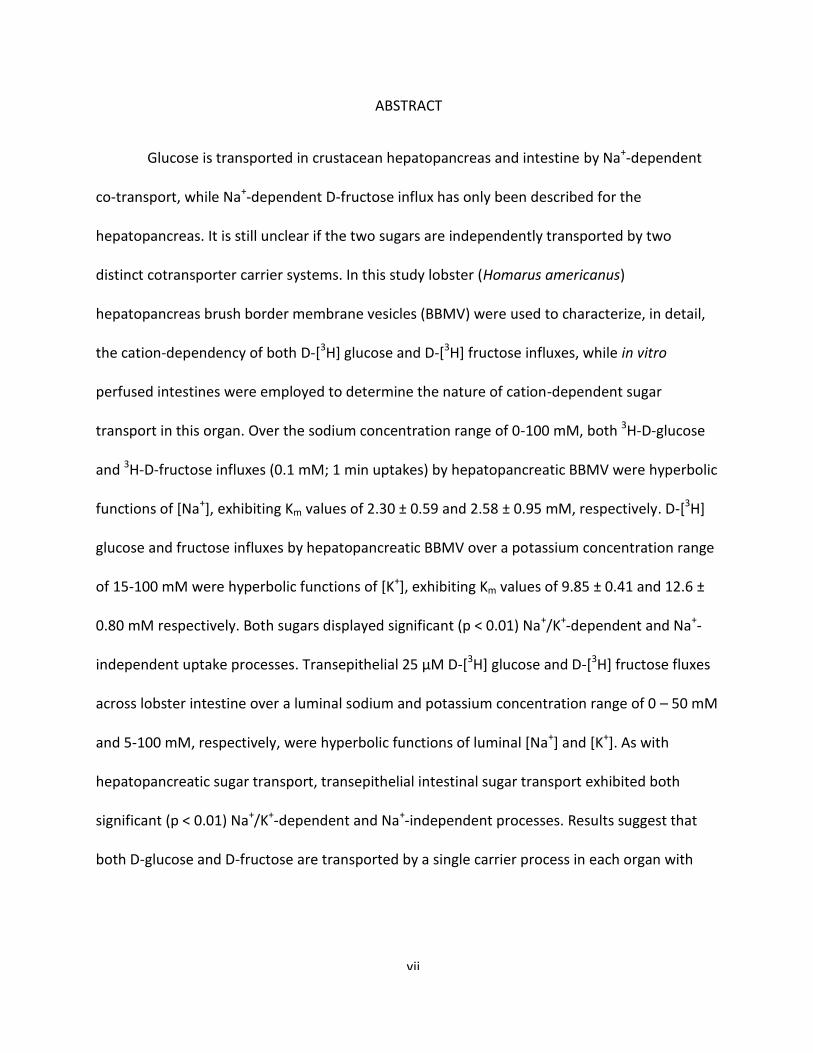
ABSTRACT
Glucose is transported in crustacean hepatopancreas and intestine by Na+-dependent
co-transport, while Na+-dependent D-fructose influx has only been described for the
hepatopancreas. It is still unclear if the two sugars are independently transported by two
distinct cotransporter carrier systems. In this study lobster (Homarus americanus)
hepatopancreas brush border membrane vesicles (BBMV) were used to characterize, in detail,
the cation-dependency of both D-[3H] glucose and D-[3H] fructose influxes, while in vitro
perfused intestines were employed to determine the nature of cation-dependent sugar
transport in this organ. Over the sodium concentration range of 0-100 mM, both 3H-D-glucose
and 3H-D-fructose influxes (0.1 mM; 1 min uptakes) by hepatopancreatic BBMV were hyperbolic
functions of [Na+], exhibiting Km values of 2.30 ± 0.59 and 2.58 ± 0.95 mM, respectively. D-[3H]
glucose and fructose influxes by hepatopancreatic BBMV over a potassium concentration range
of 15-100 mM were hyperbolic functions of [K+], exhibiting Km values of 9.85 ± 0.41 and 12.6 ±
0.80 mM respectively. Both sugars displayed significant (p < 0.01) Na+/K+-dependent and Na+-
independent uptake processes. Transepithelial 25 μM D-[3H] glucose and D-[3H] fructose fluxes
across lobster intestine over a luminal sodium and potassium concentration range of 0 – 50 mM
and 5-100 mM, respectively, were hyperbolic functions of luminal [Na+] and [K+]. As with
hepatopancreatic sugar transport, transepithelial intestinal sugar transport exhibited both
significant (p < 0.01) Na+/K+-dependent and Na+-independent processes. Results suggest that
both D-glucose and D-fructose are transported by a single carrier process in each organ with
vii
8
sodium being the preferred cation for both sugars in the hepatopancreas, and potassium being
the preferred cation for both sugars in the intestine.
viii
9
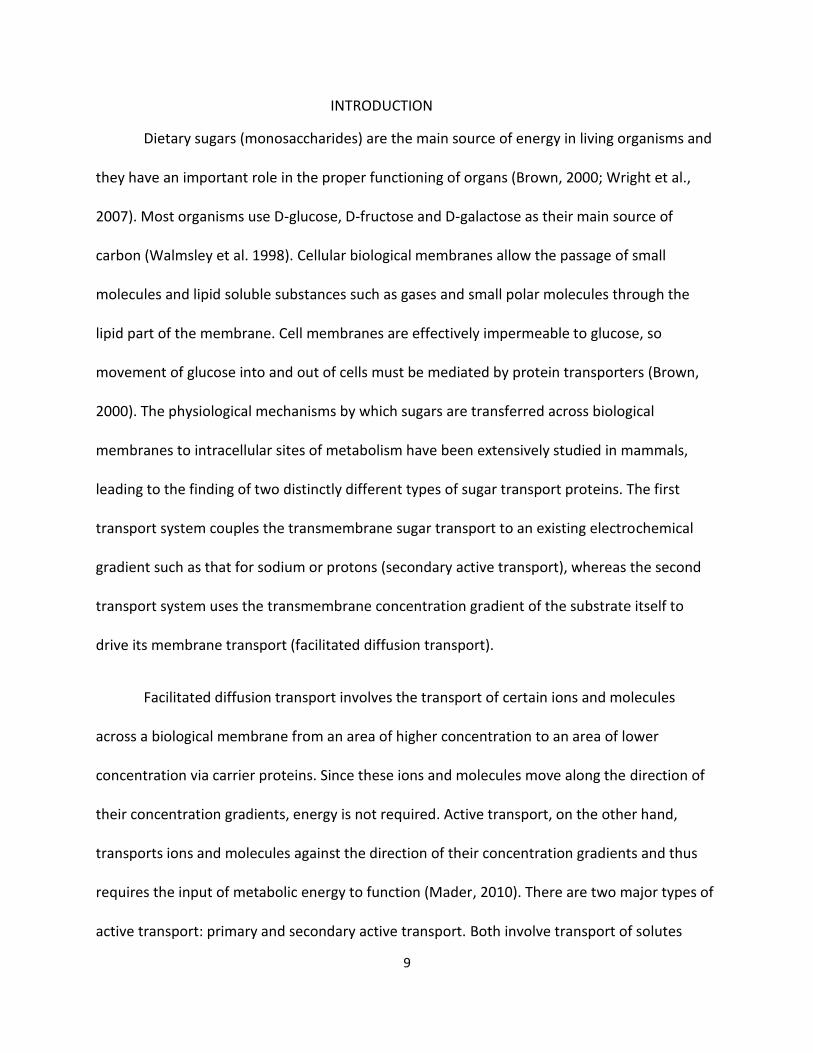
INTRODUCTION
Dietary sugars (monosaccharides) are the main source of energy in living organisms and
they have an important role in the proper functioning of organs (Brown, 2000; Wright et al.,
2007). Most organisms use D-glucose, D-fructose and D-galactose as their main source of
carbon (Walmsley et al. 1998). Cellular biological membranes allow the passage of small
molecules and lipid soluble substances such as gases and small polar molecules through the
lipid part of the membrane. Cell membranes are effectively impermeable to glucose, so
movement of glucose into and out of cells must be mediated by protein transporters (Brown,
2000). The physiological mechanisms by which sugars are transferred across biological
membranes to intracellular sites of metabolism have been extensively studied in mammals,
leading to the finding of two distinctly different types of sugar transport proteins. The first
transport system couples the transmembrane sugar transport to an existing electrochemical
gradient such as that for sodium or protons (secondary active transport), whereas the second
transport system uses the transmembrane concentration gradient of the substrate itself to
drive its membrane transport (facilitated diffusion transport).
Facilitated diffusion transport involves the transport of certain ions and molecules
across a biological membrane from an area of higher concentration to an area of lower
concentration via carrier proteins. Since these ions and molecules move along the direction of
their concentration gradients, energy is not required. Active transport, on the other hand,
transports ions and molecules against the direction of their concentration gradients and thus
requires the input of metabolic energy to function (Mader, 2010). There are two major types of
active transport: primary and secondary active transport. Both involve transport of solutes
10
against an electrochemical gradient, but they differ in their source of energy. Primary active
transport involves a carrier protein that directly hydrolyzes ATP to drive the transport process.
Such carrier proteins are usually called ATPases. The Na+-K+ ATPase is an example of primary
active transport whose function is to pump three sodium ions out of the cell in concert with
pumping two potassium ions into the cell, thus maintaining an intracellular environment that
has low sodium and high potassium. In addition, an electrical gradient across the plasma
membrane is generated. In most cells, one-third to one-half of the total energy expended is
used to run these ion pumps (Mader, 2010). Thus, the driving forces for actively transporting
ions and molecules across the plasma membrane are both the concentration gradient and the
membrane potential. Secondary active transport, however, utilizes energy stored in
electrochemical gradients of ions to drive transport, which are established and maintained by
the Na+-K+ ATPases. The transport of glucose is an example of secondary active transport in
which the sodium exported from the cell by the Na+-K+ ATPase, is co-transported back into the
cell, down its concentration gradient, using a glucose-specific transporter.
The SLC5 co-transporter gene family is a large family of 75kDa proteins consisting of
several sodium-dependent glucose co-transporter proteins (e.g. SGLT) that transport glucose
and other solutes such as galactose across biological membranes in conjunction with the
cations Na+ or H+ using transmembrane ion gradients to drive the co-transported substrate into
the cytosol of both eukaryotic and prokaryotic cells (Turk and Wright, 1997). Four SGLTs have
had their transport functions illustrated experimentally: SGLT1, SGLT2, SGLT3, and SGLT4.
11
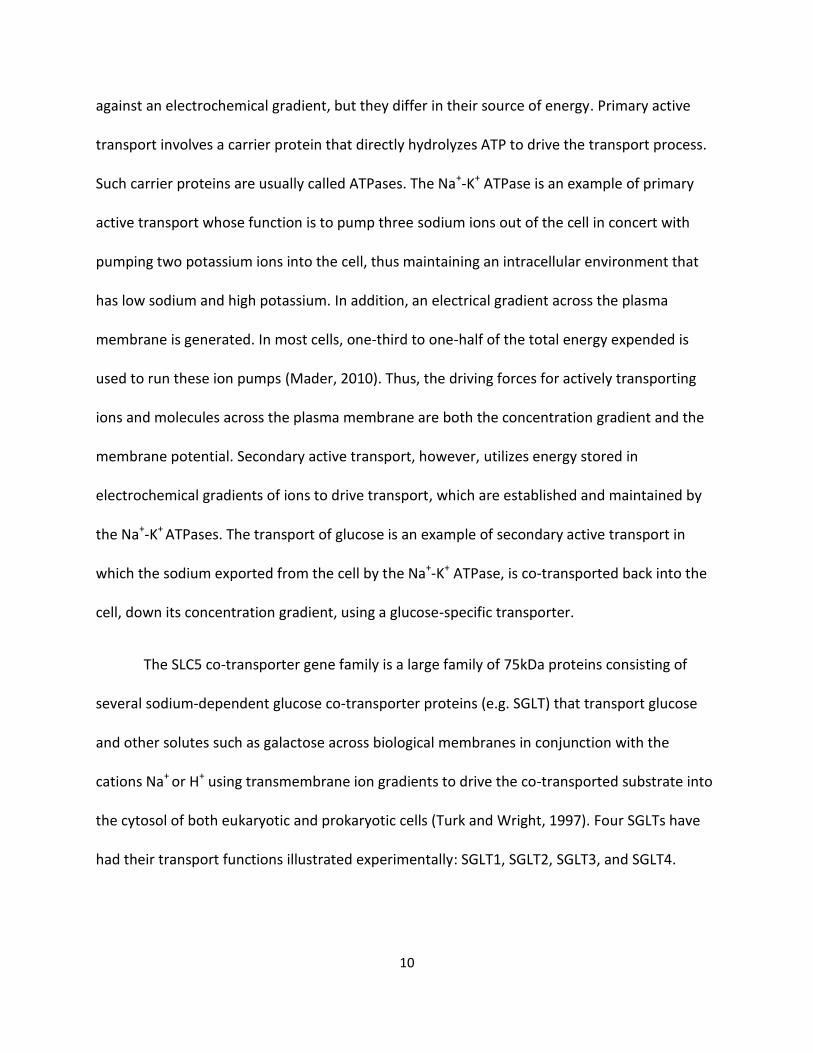
Figure 1: SGLT 1 model. SGLT1 is a sodium-dependent co-transporter protein responsible for
the uptake of dietary glucose from the gut. Sodium has to bind to the negatively charged co-
transporter first to make the binding site for glucose available. Once glucose binds to its binding
site, the co-transporter undergoes a conformational change releasing glucose into the cytosol
first followed by Na+. The co-transporter regains its negative charge and undergoes a
conformational change returning to original state. From Wright et al. (2011).
Graphic redacted, paper copy available upon request to home institution.
12
SGLT1, whose mechanism of action is shown in Figure 1, is perhaps the best studied member
and was the first to be cloned in 1987 (Hediger et al., 1987). SGLT1 functions as a high affinity,
sodium-dependent glucose co-transporter and mainly participates in nutritional D-glucose and
D-galactose absorption in the apical membrane of the mammalian intestine (Hediger et al.,
1987). The SGLT1 transport protein consists of 14 transmembrane α-helices with both the N
and C terminal facing the extracellular side of the membrane (Wright et al., 2007). SGLT2 is of
low affinity, high capacity, and functions as a sodium-dependent glucose cotransporter as well
but is mainly involved in renal reabsorption of glucose (Kanai et al., 1994), and SGLT 3 has been
recently suggested to function as a glucose sensor rather than a glucose transporter (Diez-
Sampedro et al., 2003). Recently, a cDNA clone of SGLT4 was isolated from a human small
intestine cDNA library and was reported to act as a mannose/1,5-anhydro-D-glucitol/fructose
(Man/1,5AG/Fru) transporter in the intestine and kidney (Tazawa et al., 2005).
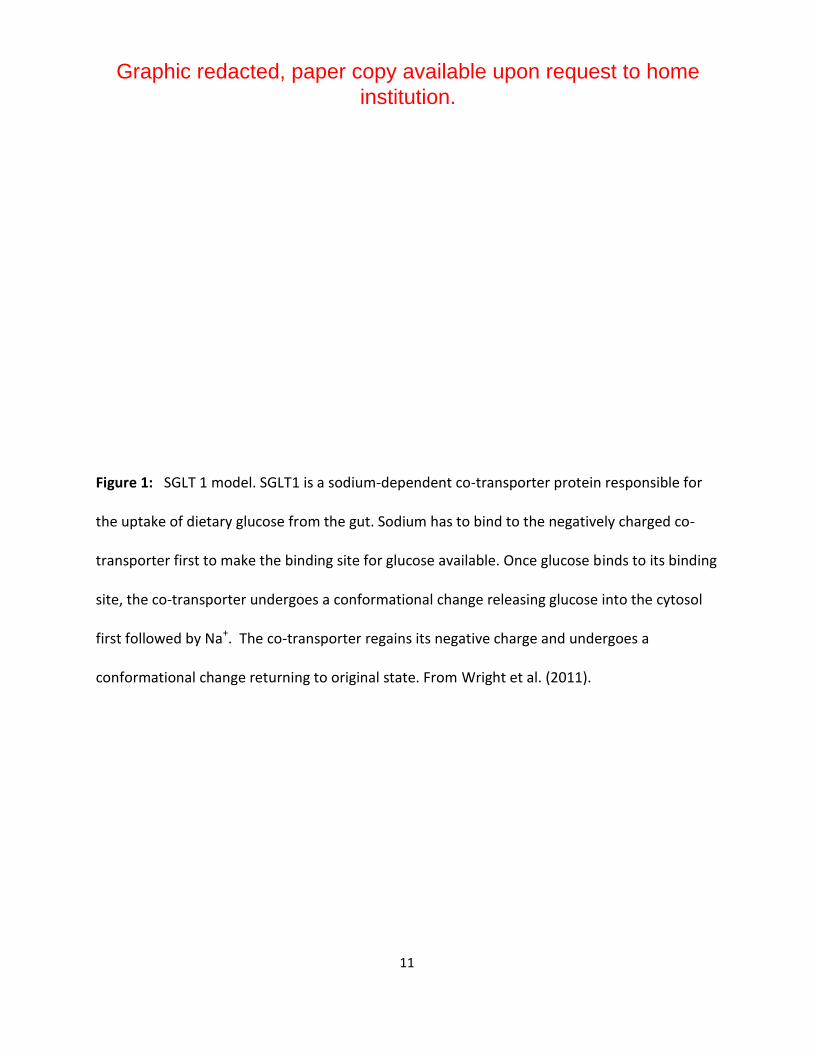
The SLC2 gene family consists of 50 kDa proteins that use a separate mode of action
than the SLC5 gene family. The SLC2 family transports glucose in a sodium independent manner
(e.g. GLUT). Sugar molecules are transferred across a membrane, down the concentration
gradient, by transport proteins that act as facilitated diffusion systems belonging to the GLUT
family, whose mechanism of action is shown in Figure 2. Members of the GLUT family possess
12 transmembrane α-helices with both the N and C termini facing the intracellular side of the
membrane (Brown, 2000). GLUT 2, located in the apical side of the intestinal epithelial cell, is
the carrier protein responsible for the uptake of luminal glucose in the presence of high glucose
concentrations.
13
Figure 2: GLUT transport protein model. GLUT transport proteins are sodium independent and
act as a facilitated diffusion system. Glucose binds to its binding site on the transporter, the
transporter undergoes a conformational change releasing glucose in the cytosol. The
transporter undergoes a conformational change again to its original state. From Pessin and Bell
(1992).
Graphic redacted, paper copy available upon request to home institution.
14
In addition, GLUT 2 is also present on the basolateral membrane and is responsible for bringing
in both glucose and fructose from the blood into the cytosol and for efflux of both sugars from
cytoplasm to blood (Kellett et al., 2000; Caccia et al., 2007). GLUT 5, however, is the known
carrier protein responsible for luminal fructose uptake (Caccia et al., 2007).
While sugar transporters have been studied in detail in mammals, very little is known
about the absorption of sugars in invertebrates. The first study describing a detailed model for
carrier-mediated sugar transport across an insect epithelium was published in 2007 (Caccia et
al., 2007). Aphidius ervi is a parasitic wasp that lays its eggs in the haemocoel of different
species of aphids. The larval development of the insect occurs in the hemolymph of its host
(Caccia et al., 2007). These authors used apical and basolateral fluxes of radiolabelled D-glucose
and D-fructose, immunocytochemistry, and Western blot analysis to describe the sugar carrier
proteins in larval parasitoid wasp (Aphidius ervi, Hymenoptera) midgut epithelial cells. The
localization of SGLT1-like and GLUT5-like transporters were shown to be present on the
intestinal brush-border membrane, while GLUT2-like proteins were present on the basolateral
side of the gut and the brush-border membrane (Caccia et al., 2007), similar to the
arrangement of these sugar carrier proteins in mammalian intestine (Uldry and Thorens, 2004).
In crustaceans, the digestive tract consists of three major divisions: the foregut, the
midgut, and the hindgut (Wright and Ahearn, 1997). The foregut and hindgut are lined with a
chitinous cuticle and are believed to play a minimal role in nutrient absorption. The midgut
includes the epithelial-lined intestine and a group of anterior and posterior diverticula that are
all unchitinized and arise from embryonic endoderm (Wright and Ahearn, 1997). The
15
hepatopancreas is the largest diverticulum and is generally a large bilateral organ composed of
a plethora of blind-ending epithelial-lined tubules in which the lumen is in fluid contact with the
contents coming from the stomach and the intestine.
The hepatopancreas has several functions including synthesis and secretion of digestive
enzymes, absorption of nutrients, secretion of emulsifiers, and storage of carbohydrates. The
hepatopancreas epithelium is lined with at least four different cell types (Verri et al., 2001). The
four cells types each have different structures thereby having different roles in digestive and
absorptive functions (Wright and Ahearn, 1997; Verri et al., 2001). Embryonic cells (E-cells) are
the smallest cells located at the distal tips of each hepatopancreatic tubule and are the only
cells that give rise to the other three types of cells by differentiation processes (Al-Mohanna et
al., 1985). Fibrillar cells (F-cells) are elongated cells and also found at the most distal part of
each tubule. They have an extensive rough endoplasmic reticulum which suggests that they’re
involved in protein synthesis. They are also involved in transcellular nutrient absorption of
sugars and amino acids (Verri et al, 2001; Finadra et al., 2006). Resorptive cells (R-cells) are the
most abundant cell type and occur throughout the length of the tubule. During differentiation
these cells store glycogen and then start lipogenesis processes (Conklin, 1995). Acid, alkaline
and sugar phosphatases have been found at the brush border of R-cells, which suggests that R-
cells could be involved in digestion and nutrient absorption of substrate molecules (Verri et al,
2001). R-cells are the primary site for storage and uptake of nutrients (Conklin, 1995). Blister
cells (B-cells) are found in the proximal part of each tubule, they contain one large vacuole
containing a variety of digestive enzymes that are released into the tubular lumen during entry
of nutrients (Al-Mohanna and Nott, 1986; Conklin, 1995).
16
The crustacean intestine runs from the posterior portion of the pyloric foregut to the
anterior part of the chitinized hindgut and is comprised of a single epithelial cell type possessing
a microvillar apical border. The intestine is considered to be a scavenger organ, absorbing any
leftover nutrients (Wright and Ahearn, 1997). A diagram of the digestive tract of Homarus
Americanus illustrating the position of the intestine and hepatopancreas (mid-gut gland) and its
cell types, is shown in Fig. 3.
Previous studies have shown glucose transport in both organs by facilitative transport
and Na+-dependent co-transport (Ahearn et al., 1985; Obi et al., 2011), while Na+-dependent D-
fructose influx has only been described for the hepatopancreas (Sterling et al., 2009). In neither
organ have the details of ion-dependent sugar transport been elucidated and it is still unclear as
to whether the two sugars are independently transported by two distinct co-transporter carrier
systems or by the same transporter. Sodium or potassium gradients across brush border
membrane vesicles of shrimp hepatopancreatic epithelial cells were each capable of driving the
uptake of D-[3H] glucose against transient concentration gradients in white shrimp (L. setiferus)
(Simmons et al., 2012; Obi et al., 2013). In this shrimp, several hexoses (D-glucose, D-fructose,
D-mannose) reduced labeled D-[3H] glucose transport as potential competitive inhibitors (Obi et
al., 2013). It was suggested that the sugar transporter in shrimp hepatopancreas physiologically
resembles the mammalian SGLT4 sugar transporter (Tazawa et al., 2005).
17
Figure 3: Diagram of the digestive tract of Homarus Americanus showing an epithelial-lined
hepatopancreatic (mid-gut gland) tubule and intestine. Part of the intestine lies underneath the
hepatopancreas and runs through the tail of the lobster. The hepatopancreas, also called the
midgut gland, has several functions including synthesis and secretion of digestive enzymes,
absorption of nutrients, secretion of emulsifiers, and storage of carbohydrates. The intestine is
involved in the absorption of any leftover nutrients. From Conklin D. E 1995.
Graphic redacted, paper copy available upon request to home institution.
18
In the present study, lobster (Homarus americanus) hepatopancreatic brush-border
membrane vesicles (BBMV) were used to characterize, in detail, the cation-dependency of both
D-[3H] glucose and D-[3H] fructose influxes, while in vitro perfused intestines were employed to
determine cation-dependent sugar transport in this organ. Results suggested that both D-
glucose and D-fructose are transported by a single carrier process in each organ with sodium
being the preferred cation for both sugars in the hepatopancreas, and potassium being the
preferred cation for both sugars in the intestine.
19
MATERIALS AND METHODS
Magnesium precipitation technique to purify hepatopancreatic brush border membrane
vesicles:
Live male lobsters (Homarus americanus), weighing approximately 500 g, were
purchased from a commercial dealer (Fisherman’s Dock, Jacksonville, Florida) and were
maintained unfed at 15 °C for up to 1 week in an aquarium containing filtered seawater.
Hepatopancreatic brush border membrane vesicles (BBMV) of fresh tissue removed from
individual lobsters were produced using the MgCl2 method of Kessler et al. (1978), as modified
by Biber at al. (1981) for mammalian epithelia, and applied to crustacean hepatopancreas
(Ahearn et al.,1985) as shown in Fig. 4.
In this study, an entire hepatopancreas was homogenized for 3 min at high speed in a
Waring blender in 60 mL ice-cold Buffer 1 (300 mM mannitol, 5 mM EGTA, 1 mM PMSF, and 12
mM Tris-HCl, pH 7.0) made hypotonic by adding 240 mL ultra-pure water. The homogenate was
placed in 8 tubes and centrifuged at 27,000 x g for 30 min at 4°C. The resulting pellets were
combined (pellet 1) and re-suspended in 60 mL ice-cold Buffer 2 (300 mM mannitol, 12 mM
Tris/HCl, pH 7.0) and homogenized using 10 strokes of a Potter-Elvehjem tissue grinder at high
speed. The homogenate was centrifuged at 27,000 x g for 30 min at 4°C. The resulting pellet
(pellet 2) was re-suspended in 60 mL ice-cold Buffer 2 and homogenized. The homogenate to
which 10 mM MgCl2 was added was allowed to incubate on ice for 15 min followed by two
centrifugations, the first at 3000 x g for 15 min at 4°C (discard pellet 3) and the second at
27,000 x g for 30 min at 4°C (save pellet 4). The resulting pellet (pellet 4) was resuspended in 35
20
mL of buffer 3 (60 mM mannitol, 5 mM EGTA, 12 mM Tris/HCl, pH 7.0) and the MgCl2 was
repeated on this mixture. Two centrifugations followed, the first at 3000 x g (discard pellet 5)
and the second at 27,000 x g, retrieving pellet 6 from the second centrifugation. Pellet 6 was
resuspended in 35 mL transport buffer (usually 200-300 mM mannitol, 12 mM Hepes, at pH 7.0)
and homogenized. This was followed by centrifugation for 30 min at 27,000 x g. The resulting
Pellet 7 was resuspended with a 20 gauge needle in enough transport buffer for
experimentation, usually 500-1000 µL.
A small aliquot of this vesicle suspension was used to determine the amount of protein
present by the BioRad protein assay (BioRad, Hercules, CA) at 595 nm using a DU 640
spectrophotometer (Beckman Coulter, CO). A standard curve was prepared using various
concentrations of bovine serum albumin (BSA). BioRad dye (5 mL) was added to each sample
and vortexed. The standards were tested using the Bradford-Stahl test, in a spectrophotometer,
which yielded absorbances at 595 nm. Three 10 µL samples of the vesicles were tested against
the standards. The absorbance values of the vesicles fell on the standard curve and were used
to estimate protein concentrations of the vesicles.
Transport experiments were conducted at 23°C using BBMV produced by the method
described above and the Millipore filtration technique developed by Hopfer et al. (1973). In
these experiments 20 µL of BBMV were added to 180 µL of radiolabeled external medium
containing D-[3H]glucose, D-[3H]fructose (American Radiochemical Corp., USA) and other
chemical constituents specific to each experiment.
21
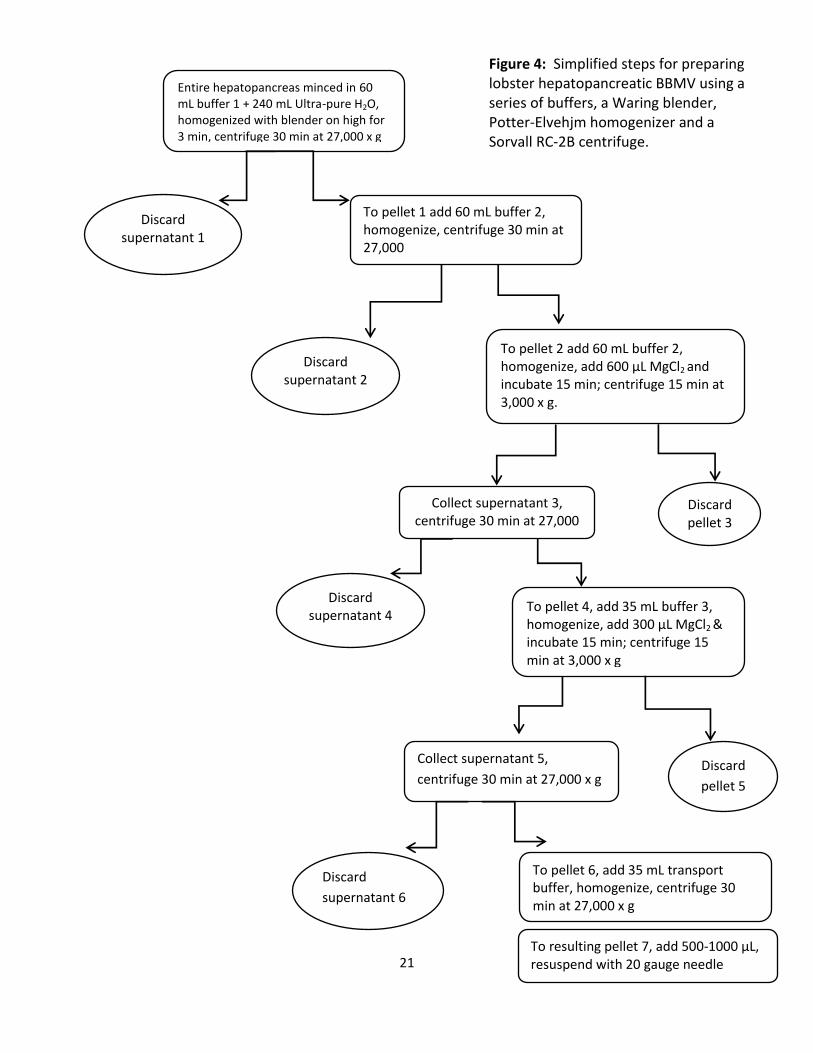
Entire hepatopancreas minced in 60 mL buffer 1 + 240 mL Ultra-pure H2O, homogenized with blender on high for 3 min, centrifuge 30 min at 27,000 x g
Discard supernatant 1
sussss
To pellet 1 add 60 mL buffer 2, homogenize, centrifuge 30 min at 27,000
Discard supernatant 2
To pellet 2 add 60 mL buffer 2, homogenize, add 600 µL MgCl2 and incubate 15 min; centrifuge 15 min at 3,000 x g.
Discard pellet 3
Collect supernatant 3, centrifuge 30 min at 27,000
x g
To pellet 4, add 35 mL buffer 3, homogenize, add 300 µL MgCl2 & incubate 15 min; centrifuge 15 min at 3,000 x g
Discard supernatant 4
Discard
pellet 5
Collect supernatant 5,
centrifuge 30 min at 27,000 x g
Discard
supernatant 6
To pellet 6, add 35 mL transport buffer, homogenize, centrifuge 30 min at 27,000 x g
To resulting pellet 7, add 500-1000 µL, resuspend with 20 gauge needle
Figure 4: Simplified steps for preparing lobster hepatopancreatic BBMV using a series of buffers, a Waring blender, Potter-Elvehjm homogenizer and a Sorvall RC-2B centrifuge.
22
Incubation of vesicles with the radiolabeled nutrient was continued for time periods from 1 to
60 min after which a known volume of this incubation mixture (20 µL) was withdrawn and
plunged into 2 mL ice-cold stop solution (generally an isotonic choline chloride medium with
the inside buffer) to stop the uptake process. The resulting suspensions were rapidly filtered
through Millipore filter paper (0.65 µm) to retain the vesicles and washed with another 3 mL of
stop solution. Filters were then added to a Beckman scintillation cocktail and counted for
radioactivity in a Beckman LS-6500 scintillation counter. Uptake values were expressed as
ρmoles/mg of membrane protein per filter. Each experiment was conducted three times with 3
replicate samples per treatment using membranes prepared from different animals. The data
were pooled for subsequent analysis. Values are means +/- SEM. Sigma Plot 10.0 curve fitting
software (Systat Software, Inc. Point Richmond, CA, USA) was used to present data in figures
and to obtain carrier-mediated influx constants.
Preservation and storage of lobster hepatopancreatic border membrane vesicles (BBMV):
The combined time for hepatopancreatic BBMV isolation and assay is often quite long
and the ability to preserve a large quantity of vesicles permits many experiments on the same
vesicle population and/or on the same day, thereby facilitating comparison of results. In a
previous study, experiments were reported on the preservation of glucose transport and
enzyme activities during freezing of BBMV from the intestinal epithelium of the warm-water
euryhaline fish, Oreochromis mossambicus (Reshkin et al., 1988). Their study showed that the
freezing of BBMV in liquid nitrogen preserved the properties of glucose transport found in fresh
vesicles, including sodium-dependency, and overshoot characteristics. To assess the effect of
23
freezing on the transport activity of lobster hepatopancreatic BBMV, vesicles prepared from an
individual lobster hepatopancreas were loaded with 300 mM mannitol, 12 mM Hepes/Tris at
pH 7.0 and the resulting suspension was split into two. One half was placed into liquid nitrogen
for 30 min and then stored in -80°C for at least 48 hours. The other half was used immediately
to measure 0.1 mM D-glucose uptake over time periods of 15s, 1, 2, 5, 10, and 60 min of
incubation in media consisting of either 150 mM NaCl, KCl or mannitol each with 12 mM
Hepes/Tris at pH 7.0. The same experiment was repeated with the frozen half of the BBMV
sample.
In vitro lobster intestinal perfusion technique:
The part of the intestine used for each experiment was cut from 1 cm posterior to the
stomach to about two-thirds of the length of the tail. This fraction of intestine was composed of
midgut tissue only. In vitro transmural mucosal to serosal (MS) transport of D-[3H]glucose and
D-[3H]fructose was studied using a perfusion apparatus as previously described (Ahearn and
Maginniss, 1976) (Fig. 5). Isolated whole intestine was flushed with physiological saline (410
mM NaCl, 15 mM KCl, 5 mM CaSO4, 10 mM MgSO4, 5 mM Hepes/ KOH at pH 7.1) and mounted
on an 18 gauge needle at both ends of the perfusion apparatus using surgical thread. The
length and diameter of the experimental intestine were measured and the intestinal surface
area was calculated using the equation A=πld, where “l” and “d” represent the length and
diameter of the intestine, respectively. The perfusion bath (serosal medium) was filled with 35
mL of physiological saline. The experimental perfusate (the experimental saline plus
appropriate experimental treatments) was pumped through the intestine using a peristaltic
24
pump (Instech Laboratories Inc., Plymouth Meeting, PA, USA) at a rate of 0.38 mL min-1 [a rate
previously shown to provide constant transmural transport in lobster intestine for over 3 h of
incubation without added oxygen at 23°C (Conrad and Ahearn, 2005)].
Transport time course experiments were conducted by adding concentrations of D-
glucose or D-fructose, and NaCl or KCl to different 50 mL tubes (Falcon, Newark, N.J) containing
physiological saline and D-[3H]glucose or D-[3H]fructose. Prior to the start of experimentation,
triplicate aliquots of each experimental perfusate (200 µL) were collected from each Falcon
tube to determine the total counts of radioactively labeled sugar in each tube, and from the
bath to determine the amount of background radioactivity at the beginning of an experiment.
Experimental solutions were then perfused through the intestine for a total of 30 min. All
experimental procedures were carried out at 23°C. Triplicate radioactive samples (200 µL) were
collected from the serosal medium after passage across the intestine every 5 min for the
duration of each experimental treatment. An equal amount of physiological saline was added to
the serosal medium in order to maintain a constant volume in the bath.
The radioactive experimental samples collected were placed in 7 mL tubes containing 3
mL scintillation cocktail and counted for radioactivity. The mean background count was
subtracted from each triplicate sample at each time point. Transmural MS rates were expressed
in ρmol cm-2 min-1.
25
Figure 5: A diagram of the perfusion apparatus used to measure D-[3H]glucose and D-
[3H]fructose transport by the lobster intestine, Homarus americanus (Ahearn and Maginniss,
1976). The serosal medium represents the blood side while the mucosal medium represents
inside the intestine.
Graphic redacted, paper copy available upon request to home institution.
26
RESULTS
HEPATOPANCREAS:
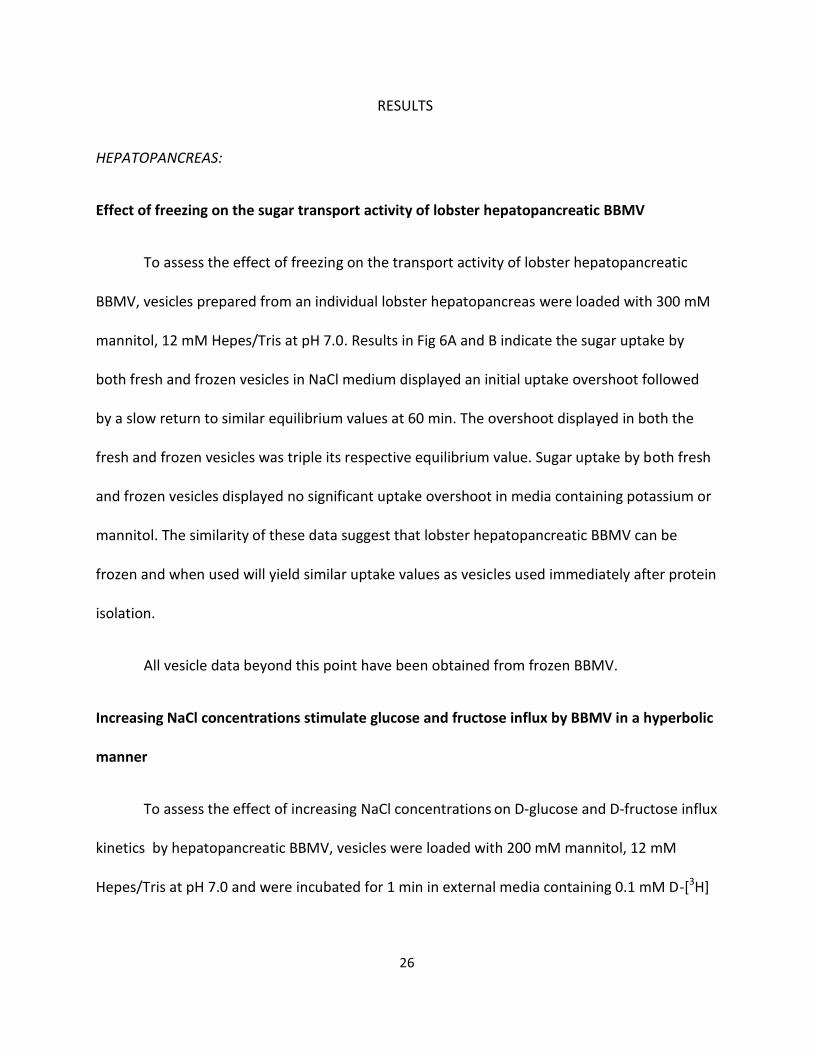
Effect of freezing on the sugar transport activity of lobster hepatopancreatic BBMV
To assess the effect of freezing on the transport activity of lobster hepatopancreatic
BBMV, vesicles prepared from an individual lobster hepatopancreas were loaded with 300 mM
mannitol, 12 mM Hepes/Tris at pH 7.0. Results in Fig 6A and B indicate the sugar uptake by
both fresh and frozen vesicles in NaCl medium displayed an initial uptake overshoot followed
by a slow return to similar equilibrium values at 60 min. The overshoot displayed in both the
fresh and frozen vesicles was triple its respective equilibrium value. Sugar uptake by both fresh
and frozen vesicles displayed no significant uptake overshoot in media containing potassium or
mannitol. The similarity of these data suggest that lobster hepatopancreatic BBMV can be
frozen and when used will yield similar uptake values as vesicles used immediately after protein
isolation.
All vesicle data beyond this point have been obtained from frozen BBMV.
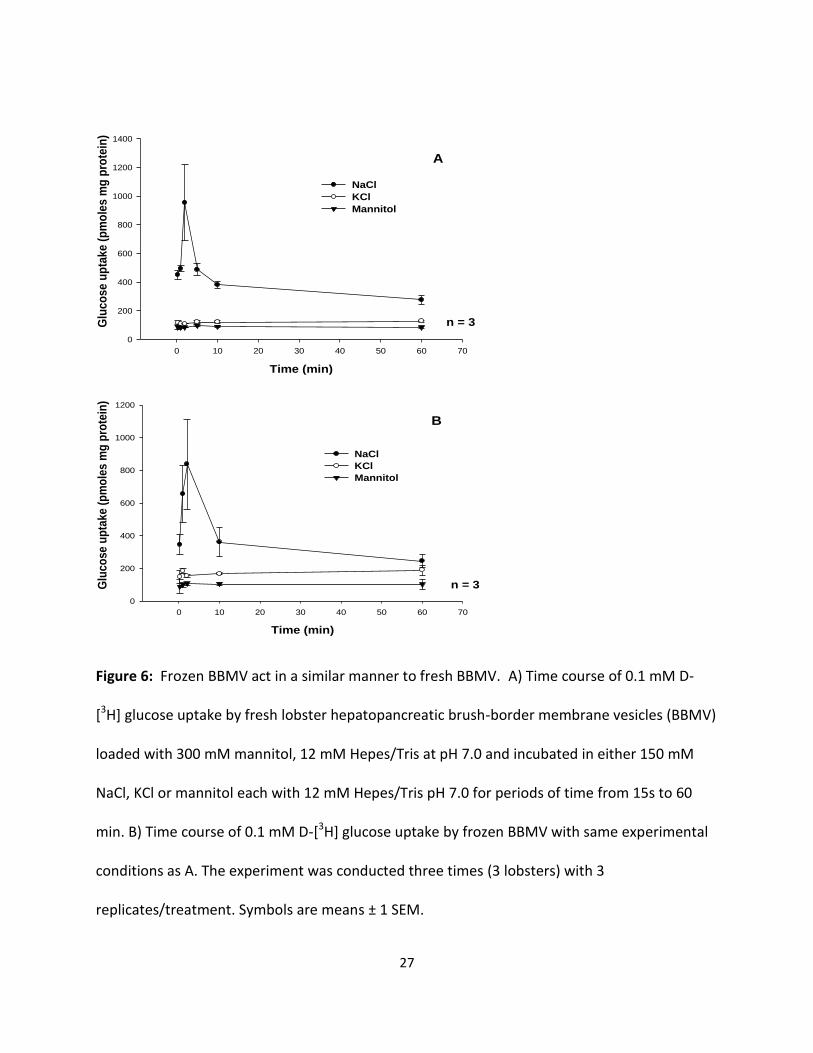
Increasing NaCl concentrations stimulate glucose and fructose influx by BBMV in a hyperbolic
manner
To assess the effect of increasing NaCl concentrations on D-glucose and D-fructose influx
kinetics by hepatopancreatic BBMV, vesicles were loaded with 200 mM mannitol, 12 mM
Hepes/Tris at pH 7.0 and were incubated for 1 min in external media containing 0.1 mM D-[3H]
27
Time (min)
0 10 20 30 40 50 60 70
0
200
400
600
800
1000
1200
1400
NaCl
KCl
Mannitol
Glu
co
se u
pta
ke (
pm
ole
s m
g p
rote
in)
n = 3
A
Time (min)
0 10 20 30 40 50 60 70
0
200
400
600
800
1000
1200
NaCl
KCl
Mannitol
Glu
co
se
up
tak
e (
pm
ole
s m
g p
rote
in)
n = 3
B
Figure 6: Frozen BBMV act in a similar manner to fresh BBMV. A) Time course of 0.1 mM D-
[3H] glucose uptake by fresh lobster hepatopancreatic brush-border membrane vesicles (BBMV)
loaded with 300 mM mannitol, 12 mM Hepes/Tris at pH 7.0 and incubated in either 150 mM
NaCl, KCl or mannitol each with 12 mM Hepes/Tris pH 7.0 for periods of time from 15s to 60
min. B) Time course of 0.1 mM D-[3H] glucose uptake by frozen BBMV with same experimental
conditions as A. The experiment was conducted three times (3 lobsters) with 3
replicates/treatment. Symbols are means ± 1 SEM.
28
glucose or D-[3H] fructose, increasing concentrations of sodium (0, 1, 2.5, 5, 10, 25, 50, 100 mM
NaCl) and 12 mM Hepes/Tris at pH 7.0. Results in Fig 7 and 8 displayed influx as a hyperbolic
function of [Na+] and followed the Michaelis-Menten equation for carrier-mediated transport:
J = Jmax [Na+] / (KM + [Na+]) (1)
Where J is D-[3H] glucose or D-[3H] fructose influx (ρmol/mg protein x min), Jmax is maximal
glucose or fructose influx rate (ρmol/mg protein x min), KM is the apparent affinity binding
constant (mM), and [Na+] is NaCl concentration in mM. Figures 7 and 8 indicate that NaCl was
able to stimulate the uptake of both sugars in a saturable manner, indicating significant (p <
0.01) Na+-dependent and Na+-independent uptake processes. The resulting KM values for
glucose and fructose as shown in Table 1 were similar (2.30 ± 0.59 and 2.58 ± 0.95 mM,
respectively). The maximal transport rates, however, were different, with transport being 26
times faster for fructose than for glucose.
Increasing KCl concentrations stimulate glucose and fructose influx by BBMV in a hyperbolic
manner
There is not much research on the effect of potassium on sugar influx since adult
lobsters are mostly carnivores, consuming little potassium in the foods they eat. This
experiment was designed to demonstrate whether or not potassium was an effective
symporter for glucose and fructose transport.
29
[Na+] (mM)
0 20 40 60 80 100 120
5
10
15
20
25
30
35
D-[
3H
] G
luco
se U
pta
ke p
mo
l m
g p
rote
in/ m
in
n = 3
Figure 7: Increasing NaCl concentrations stimulate glucose transport in a hyperbolic manner.
Effect of increasing Na+ concentrations on 1 min 0.1 mM D-[3H] glucose uptake in lobster
hepatopancreatic BBMV. Vesicles were loaded with 200 mM mannitol, 12 mM Hepes/Tris at pH
7.0 and incubated in various NaCl concentrations (0, 1, 2.5, 5, 10, 25, 50, 100 mM), 12 mM
Hepes/Tris at pH 7.0. The experiment was conducted three times with 5 replicates/treatment.
Symbols are means ± 1 SEM. Curve fit lines and resulting kinetic constant values were obtained
using Sigma plot 10.0 software. Kinetic constants are displayed in Table 1.
30
[Na+] (mM)
0 20 40 60 80 100 120
1600
1800
2000
2200
2400
2600
2800
D-[
3H
] fr
ucto
se U
pta
ke p
mo
l m
g p
rote
in/ m
in
n = 3
Figure 8: Increasing NaCl concentrations stimulate fructose transport in a hyperbolic manner.
Effect of increasing Na+ concentrations on 1 min 0.1 mM D-[3H] fructose uptake in lobster
hepatopancreatic BBMV. Vesicles were loaded with 200 mM mannitol, 12 mM Hepes/Tris at pH
7.0 and incubated in various NaCl concentrations (0, 1, 2.5, 5, 10, 25, 50, 100 mM), 12 mM
Hepes/Tris at pH 7.0. The experiment was conducted three times with 5 replicates/treatment.
Symbols are means ± 1 SEM. Curve fit lines and resulting kinetic constant values were obtained
using Sigma plot 10.0 software. Kinetic constants are displayed in Table 1.
31
Figures 9 and 10 illustrate the effect of various potassium concentrations (5, 15, 25, 50 and 100
mM KCl) on 1 min uptake values for 0.1 mM D-[3H] glucose and fructose by hepatopancreatic
BBMV. Both D-glucose and D-fructose influx were hyperbolic functions of [K+] and followed the
Michaelis-Menten equation (1). Significant (p < 0.01) K+-dependent D-glucose and D-fructose
uptake processes were observed. The resulting KM values for glucose and fructose influxes in
potassium medium as shown in Table 1 appear to be similar (9.85 ± 0.4 and 12.6 ± 0.80 mM,
respectively). The maximal transport rates, however, were different, with transport being 7
times faster for glucose than for fructose. Table 1 also suggests that the apparent cation-
binding affinity was greater (lower KM) in external NaCl than in KCl, indicating that Na+ might be
the “preferable ion” for stimulating hepatopancreatic BBMV glucose and fructose uptake in the
American lobster.
Effects of D-fructose on the kinetics of D-[3H] glucose influxes by BBMV in NaCl incubation
medium
D-[3H] glucose influx (1 min uptakes) as a function of external [D-glucose] was
measured in NaCl incubation medium in the presence and absence of D-fructose (Fig. 11).
Glucose influx under control conditions (lacking D-fructose) was a hyperbolic function of [D-
glucose] and followed the Michaelis-Menten equation (1) for carrier-mediated transport, where
J is unidirectional D-[3H] glucose influx (ρmol/ mg protein × min), Jmax is the maximal influx rate,
KM is an apparent affinity binding constant (mM), and [Glu] is the external sugar concentration
(mM).

32
[K+] (mM)
0 20 40 60 80 100 120
1200
1300
1400
1500
1600
1700
1800
1900
2000
3H
-glu
co
se in
flu
x (
pm
ol/m
g x
min
)
n = 3
Figure 9: Increasing KCl concentrations stimulate glucose influx in a hyperbolic manner. Effect
of increasing K+ concentrations on 1 min 0.1 mM D-[3H] glucose uptake in lobster
hepatopancreatic BBMV. Vesicles were loaded with 200 mM mannitol, 12 mM Hepes/Tris at pH
7.0 and incubated in various KCl concentrations (15, 25, 50, 100 mM), 12 mM Hepes/Tris at pH
7.0. The experiment was conducted three times with 5 replicates/treatment. Symbols are
means ± 1 SEM. Curve fit lines and resulting kinetic constant values were obtained using Sigma
plot 10.0 software. Kinetic constants are displayed in Table 1.
33
[K+] (mM)
0 20 40 60 80 100 120
140
160
180
200
220
240
260
280
300
3H
-fru
cto
se
in
flu
x (
pm
ol/m
g x
min
)
n = 3
Figure 10: D-fructose displays K+-dependent uptake processes in the hepatopancreas. Effect of
increasing K+ concentrations on 1 min 0.1 mM D-[3H] fructose uptake by BBMV. Vesicles were
loaded with 200 mM mannitol, 12 mM Hepes/Tris at pH 7.0 and incubated in various KCl
concentrations (15, 25, 50, 100 mM), 12 mM Hepes/Tris at pH 7.0. The experiment was
conducted three times with 5 replicates/treatment. Symbols are means ± 1 SEM. Curve fit lines
and resulting kinetic constant values were obtained using Sigma plot 10.0 software. Kinetic
constants are displayed in Table 1.
34
Table 1: Effect of increasing NaCl and KCl concentrations on D-[3H] glucose or D-[3H] fructose
influx kinetic constants in lobster hepatopancreas.
Cation Substrate KM (mM) Jmax (ρmol/mg protein / min)
Na+ D-[3H] glucose 2.30 ± 0.59 19.3 ± 1.40
Na+ D-[3H] fructose 2.58 ± 0.95 492 ± 50.2
K+ D-[3H] glucose 9.85 ± 0.41 2112 ± 19.8
K+ D-[3H] fructose 12.6 ± 0.80 308 ± 5.01
Each experiment was conducted three times with 5 replicates/treatment. Symbols are means ±
1 SEM of three experiments. Concentrations of NaCl and KCl were; 0, 1, 2.5, 5, 10, 25, 50, 100
mM, and 15, 25, 50, 100 mM, respectively.
35
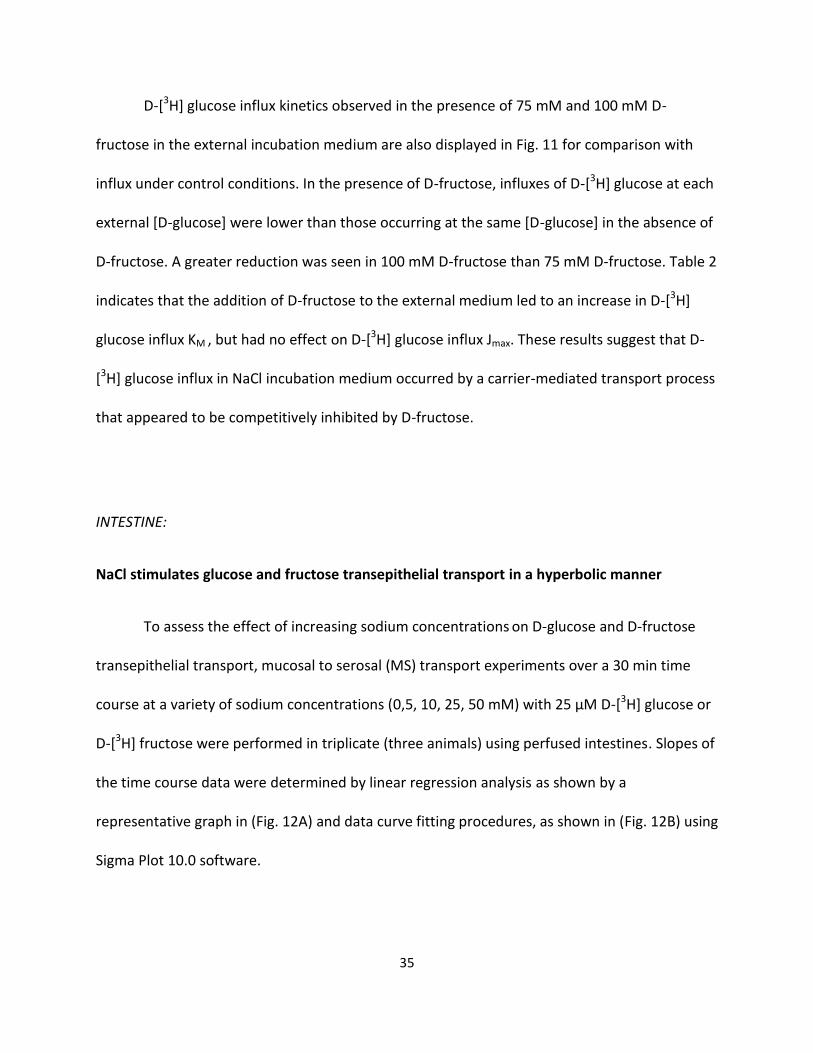
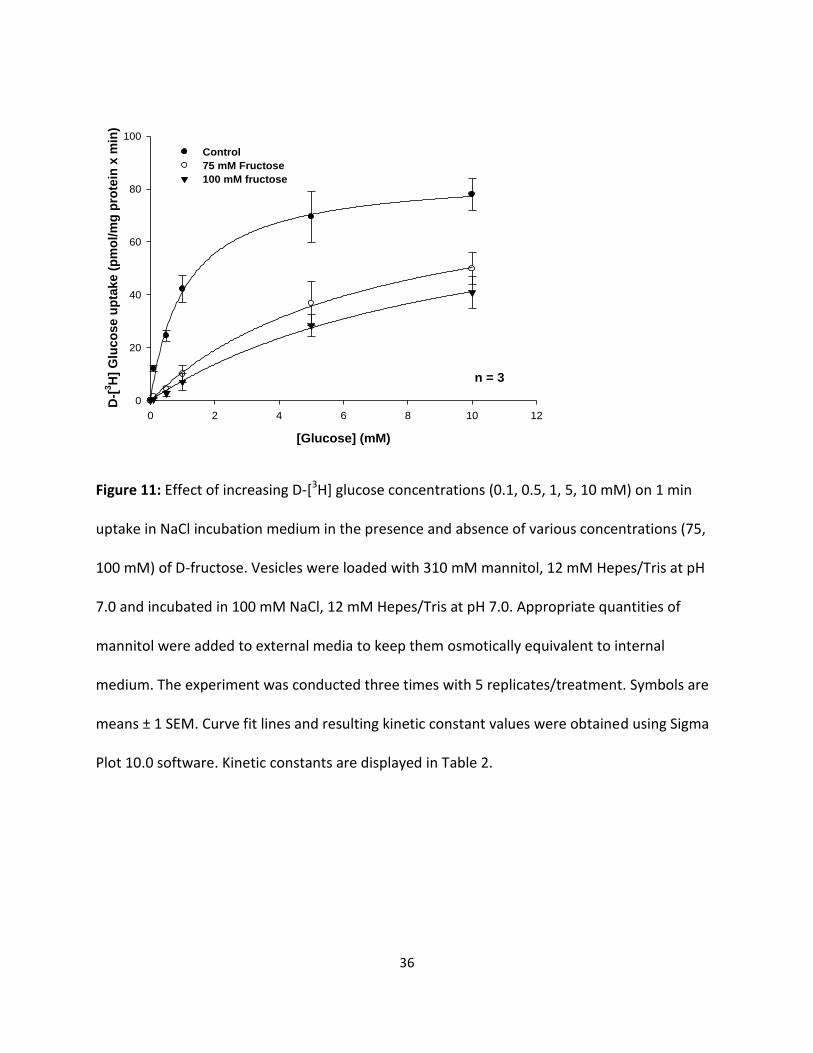
D-[3H] glucose influx kinetics observed in the presence of 75 mM and 100 mM D-
fructose in the external incubation medium are also displayed in Fig. 11 for comparison with
influx under control conditions. In the presence of D-fructose, influxes of D-[3H] glucose at each
external [D-glucose] were lower than those occurring at the same [D-glucose] in the absence of
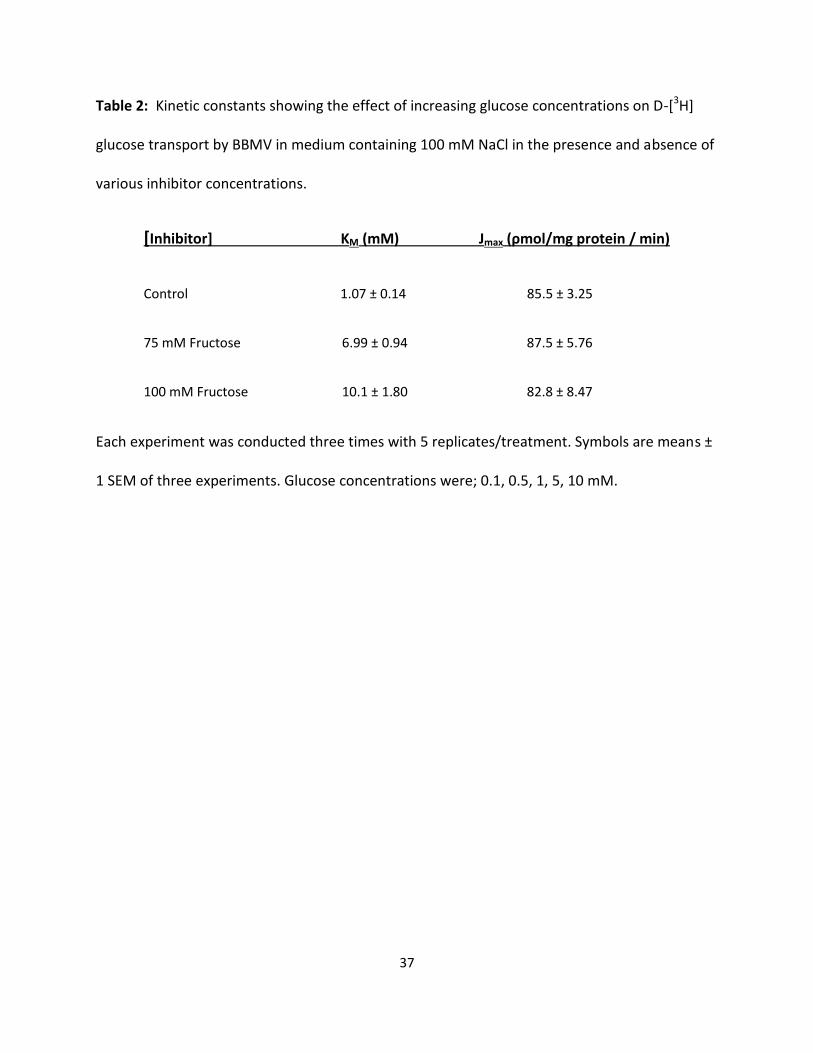
D-fructose. A greater reduction was seen in 100 mM D-fructose than 75 mM D-fructose. Table 2
indicates that the addition of D-fructose to the external medium led to an increase in D-[3H]
glucose influx KM , but had no effect on D-[3H] glucose influx Jmax. These results suggest that D-
[3H] glucose influx in NaCl incubation medium occurred by a carrier-mediated transport process
that appeared to be competitively inhibited by D-fructose.
INTESTINE:
NaCl stimulates glucose and fructose transepithelial transport in a hyperbolic manner
To assess the effect of increasing sodium concentrations on D-glucose and D-fructose
transepithelial transport, mucosal to serosal (MS) transport experiments over a 30 min time
course at a variety of sodium concentrations (0,5, 10, 25, 50 mM) with 25 µM D-[3H] glucose or
D-[3H] fructose were performed in triplicate (three animals) using perfused intestines. Slopes of
the time course data were determined by linear regression analysis as shown by a
representative graph in (Fig. 12A) and data curve fitting procedures, as shown in (Fig. 12B) using
Sigma Plot 10.0 software.
36
[Glucose] (mM)
0 2 4 6 8 10 12
D-[
3H
] G
luc
os
e u
pta
ke
(p
mo
l/m
g p
rote
in x
min
)
0
20
40
60
80
100
Control
75 mM Fructose
100 mM fructose
n = 3
Figure 11: Effect of increasing D-[3H] glucose concentrations (0.1, 0.5, 1, 5, 10 mM) on 1 min
uptake in NaCl incubation medium in the presence and absence of various concentrations (75,
100 mM) of D-fructose. Vesicles were loaded with 310 mM mannitol, 12 mM Hepes/Tris at pH
7.0 and incubated in 100 mM NaCl, 12 mM Hepes/Tris at pH 7.0. Appropriate quantities of
mannitol were added to external media to keep them osmotically equivalent to internal
medium. The experiment was conducted three times with 5 replicates/treatment. Symbols are
means ± 1 SEM. Curve fit lines and resulting kinetic constant values were obtained using Sigma
Plot 10.0 software. Kinetic constants are displayed in Table 2.
37
Table 2: Kinetic constants showing the effect of increasing glucose concentrations on D-[3H]
glucose transport by BBMV in medium containing 100 mM NaCl in the presence and absence of
various inhibitor concentrations.
[Inhibitor] KM (mM) Jmax (ρmol/mg protein / min)
Control 1.07 ± 0.14 85.5 ± 3.25
75 mM Fructose 6.99 ± 0.94 87.5 ± 5.76
100 mM Fructose 10.1 ± 1.80 82.8 ± 8.47
Each experiment was conducted three times with 5 replicates/treatment. Symbols are means ±
1 SEM of three experiments. Glucose concentrations were; 0.1, 0.5, 1, 5, 10 mM.
38
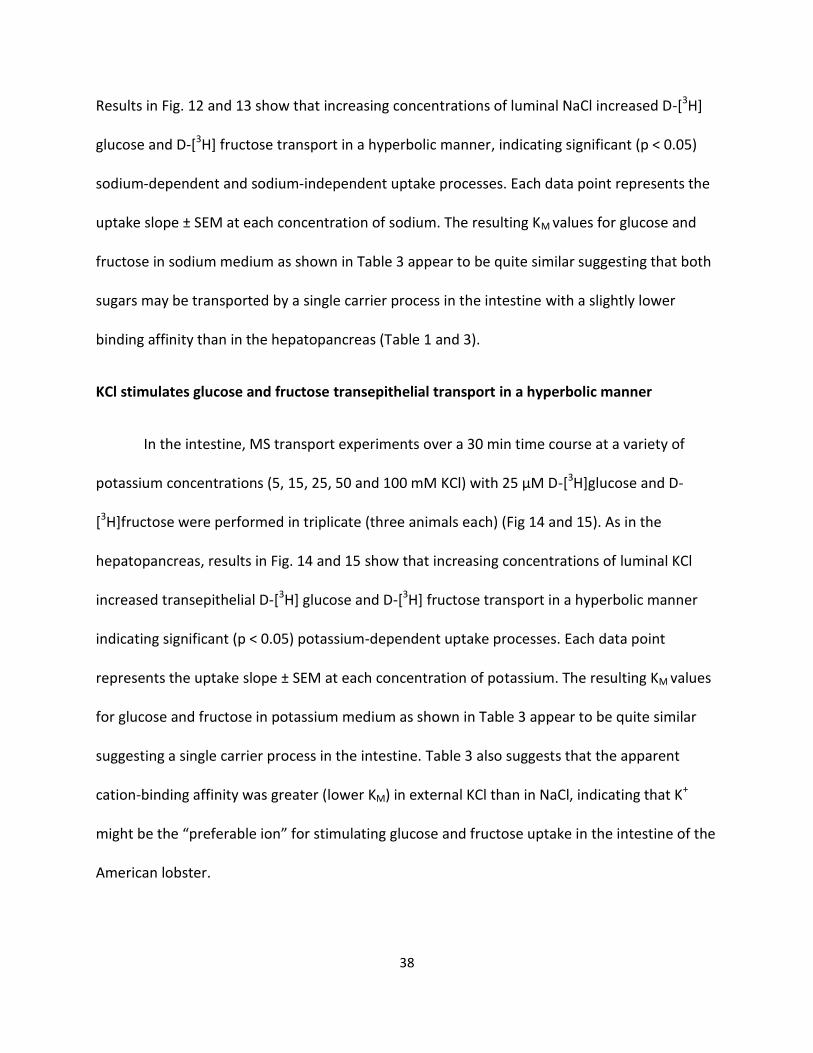
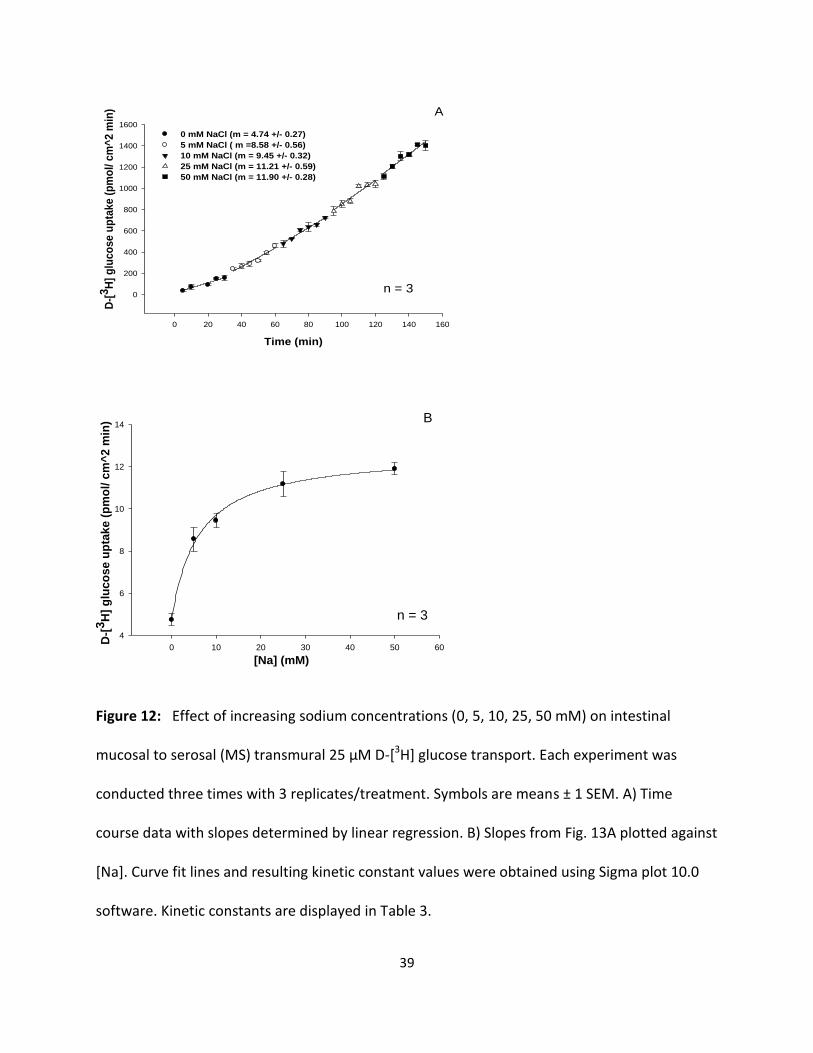
Results in Fig. 12 and 13 show that increasing concentrations of luminal NaCl increased D-[3H]
glucose and D-[3H] fructose transport in a hyperbolic manner, indicating significant (p < 0.05)
sodium-dependent and sodium-independent uptake processes. Each data point represents the
uptake slope ± SEM at each concentration of sodium. The resulting KM values for glucose and
fructose in sodium medium as shown in Table 3 appear to be quite similar suggesting that both
sugars may be transported by a single carrier process in the intestine with a slightly lower
binding affinity than in the hepatopancreas (Table 1 and 3).
KCl stimulates glucose and fructose transepithelial transport in a hyperbolic manner
In the intestine, MS transport experiments over a 30 min time course at a variety of
potassium concentrations (5, 15, 25, 50 and 100 mM KCl) with 25 µM D-[3H]glucose and D-
[3H]fructose were performed in triplicate (three animals each) (Fig 14 and 15). As in the
hepatopancreas, results in Fig. 14 and 15 show that increasing concentrations of luminal KCl
increased transepithelial D-[3H] glucose and D-[3H] fructose transport in a hyperbolic manner
indicating significant (p < 0.05) potassium-dependent uptake processes. Each data point
represents the uptake slope ± SEM at each concentration of potassium. The resulting KM values
for glucose and fructose in potassium medium as shown in Table 3 appear to be quite similar
suggesting a single carrier process in the intestine. Table 3 also suggests that the apparent
cation-binding affinity was greater (lower KM) in external KCl than in NaCl, indicating that K+
might be the “preferable ion” for stimulating glucose and fructose uptake in the intestine of the
American lobster.
39
Time (min)
0 20 40 60 80 100 120 140 160
0
200
400
600
800
1000
1200
1400
1600
0 mM NaCl (m = 4.74 +/- 0.27)
5 mM NaCl ( m =8.58 +/- 0.56)
10 mM NaCl (m = 9.45 +/- 0.32)
25 mM NaCl (m = 11.21 +/- 0.59)
50 mM NaCl (m = 11.90 +/- 0.28)
n = 3
D-[
3H
] g
luco
se u
pta
ke (
pm
ol/
cm
^2 m
in) A
[Na] (mM)
0 10 20 30 40 50 60
4
6
8
10
12
14
D-[
3H
] g
luco
se u
pta
ke (
pm
ol/ c
m^
2 m
in)
n = 3
B
Figure 12: Effect of increasing sodium concentrations (0, 5, 10, 25, 50 mM) on intestinal
mucosal to serosal (MS) transmural 25 µM D-[3H] glucose transport. Each experiment was
conducted three times with 3 replicates/treatment. Symbols are means ± 1 SEM. A) Time
course data with slopes determined by linear regression. B) Slopes from Fig. 13A plotted against
[Na]. Curve fit lines and resulting kinetic constant values were obtained using Sigma plot 10.0
software. Kinetic constants are displayed in Table 3.
40
[Na+] (mM)
0 10 20 30 40 50 60
6
7
8
9
10
11
12
13
D-[
3H
] fr
uc
tos
e u
pta
ke
(p
mo
l/ c
m^
2 m
in)
n = 3
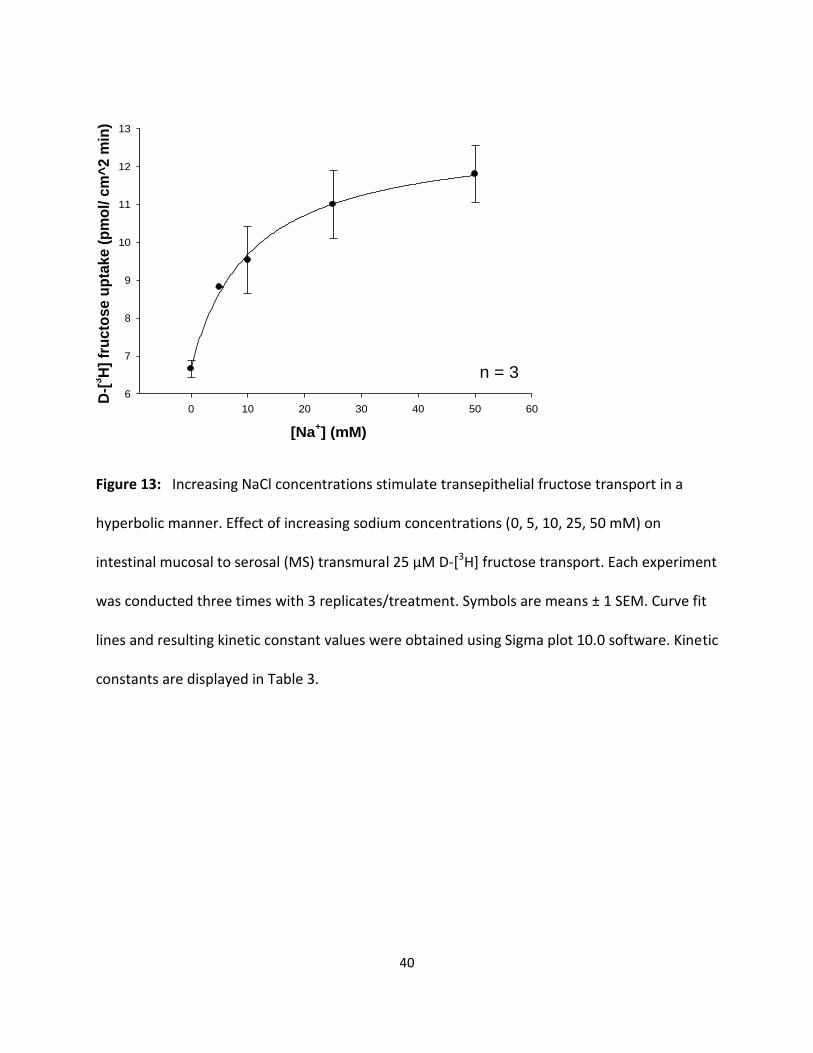
Figure 13: Increasing NaCl concentrations stimulate transepithelial fructose transport in a
hyperbolic manner. Effect of increasing sodium concentrations (0, 5, 10, 25, 50 mM) on
intestinal mucosal to serosal (MS) transmural 25 µM D-[3H] fructose transport. Each experiment
was conducted three times with 3 replicates/treatment. Symbols are means ± 1 SEM. Curve fit
lines and resulting kinetic constant values were obtained using Sigma plot 10.0 software. Kinetic
constants are displayed in Table 3.
41
[K+] (mM)
0 20 40 60 80 100 120
16
18
20
22
24
26
28
30
32
34
D-[
3H
] g
luc
os
e i
nfl
ux
(p
mo
l/ c
m-2
min
)
n = 3
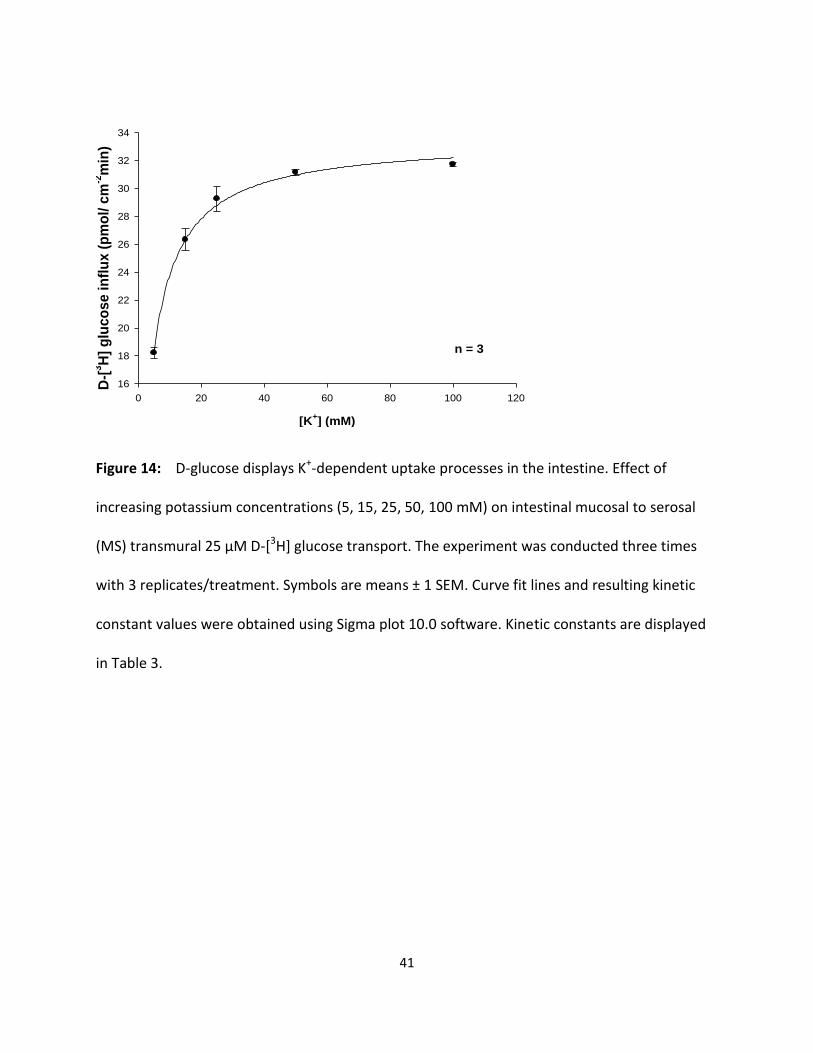
Figure 14: D-glucose displays K+-dependent uptake processes in the intestine. Effect of
increasing potassium concentrations (5, 15, 25, 50, 100 mM) on intestinal mucosal to serosal
(MS) transmural 25 µM D-[3H] glucose transport. The experiment was conducted three times
with 3 replicates/treatment. Symbols are means ± 1 SEM. Curve fit lines and resulting kinetic
constant values were obtained using Sigma plot 10.0 software. Kinetic constants are displayed
in Table 3.
42
[K+] (mM)
0 20 40 60 80 100 120
8
9
10
11
12
13
14
15
D-[
3H
] fr
ucto
se i
nfl
ux
(p
mo
l/ c
m-2
min
)
n = 3
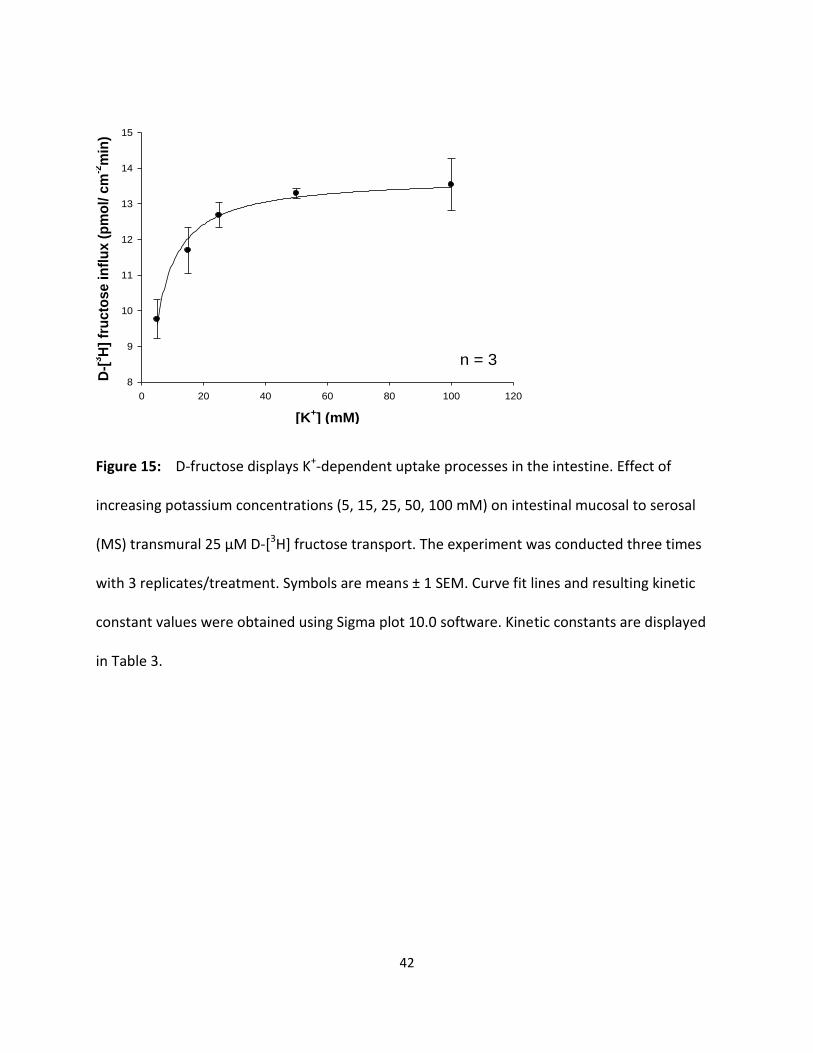
Figure 15: D-fructose displays K+-dependent uptake processes in the intestine. Effect of
increasing potassium concentrations (5, 15, 25, 50, 100 mM) on intestinal mucosal to serosal
(MS) transmural 25 µM D-[3H] fructose transport. The experiment was conducted three times
with 3 replicates/treatment. Symbols are means ± 1 SEM. Curve fit lines and resulting kinetic
constant values were obtained using Sigma plot 10.0 software. Kinetic constants are displayed
in Table 3.
43
Table 3: Effect of increasing NaCl and KCl concentrations on D-[3H] glucose or D-[3H] fructose
transepithelial transport kinetic constants in lobster intestine.
Cation Substrate KM (mM) Jmax (ρmol/cm2 × min)
Na+ D-[3H] glucose 6.05 ± 0.99 7.92 ± 0.38
Na+ D-[3H] fructose 10.5 ± 1.65 6.14 ± 0.29
K+ D-[3H] glucose 3.10 ± 0.24 33.5 ± 0.35
K+ D-[3H] fructose 2.12 ± 0.20 13.7 ± 0.15
Each experiment was conducted three times with 3 replicates/treatment. Symbols are means ±
1 SEM of three experiments. Concentrations of NaCl and KCl were; 0, 5, 10, 25, 50 mM, and 5,
15, 25, 50, 100 mM respectively.
44
Effects of D-fructose on the kinetics of transmural MS D-[3H] glucose transport in KCl
incubation medium
Transepithelial D-[3H] glucose transport as a function of external [D-glucose] was
measured in KCl incubation medium in the presence and absence of D-fructose (Fig. 16).
Glucose influx under control conditions (lacking D-fructose) was a hyperbolic function of [D-
glucose] and followed the Michaelis-Menten equation (1) for carrier-mediated transport. D-[3H]
glucose influx kinetics observed in the presence of 75 mM and 100 mM D-fructose in the
mucosal medium are also displayed in Fig. 16 for comparison with influx under control
conditions. In the presence of D-fructose, influxes of D-[3H] glucose at each [D-glucose] mucosal
were lower than those occurring at the same [D-glucose] in the absence of D-fructose. A
greater reduction was seen in 100 mM D-fructose than 75 mM D-fructose. Table 4 indicates
that the addition of D-fructose to the mucosal medium led to an increase in D-[3H] glucose
influx KM , but had no effect on D-[3H] glucose influx Jmax. These results suggest that D-[3H]
glucose influx in KCl incubation medium occurred by a carrier-mediated transport process that
appeared to be competitively inhibited by D-fructose in the intestine.
45
[Glucose] (mM)
0 2 4 6 8 10 12
D-[
3H
] G
luc
os
e in
flu
x (
pm
ol/cm
2 m
in)
0
10
20
30
40
50
60Control
75 mM Fructose
100 mM Fructose
n = 3
Figure 16: Effect of increasing mucosal D-[3H] glucose concentrations (0.5, 1, 5, 10 mM) on
transmural MS glucose transport in KCl incubation medium in the presence and absence of
various concentrations (75, 100 mM) of D-fructose. The experiment was conducted three times
with 3 replicates/treatment. Symbols are means ± 1 SEM. Curve fit lines and resulting kinetic
constant values were obtained using Sigma Plot 10.0 software. Kinetic constants are displayed
in Table 4.
46
Table 4: Kinetic constants showing the effect of increasing glucose concentrations on
transmural MS D-[3H] glucose transport in medium containing 100 mM KCl in the presence and
absence of various inhibitor concentrations.
[Inhibitor] KM (mM) Jmax (ρmol/mg protein / min)
Control 2.60 ± 0.34 62.7 ± 2.82
75 mM Fructose 9.98 ± 2.20 68.2 ± 8.57
100 mM Fructose 18.3 ± 4.40 58.3 ± 9.72
Each experiment was conducted three times with 3 replicates/treatment. Symbols are means ±
1 SEM of three experiments. Glucose concentrations were; 0.5, 1, 5, 10 mM.
47
DISCUSSION
The results of the present investigation suggest that both D-glucose and D-fructose are
transported across the intestinal epithelium and hepatopancreatic brush border membrane of
the American lobster (Homarus americanus), at least in part, by transport processes with
properties apparently different from those of mammalian SGLT1.
The present research has examined the effects of a freezing preservation technique on
lobster hepatopancreatic BBMV glucose transport characteristics. Previous investigations in
which experiments the preservation of glucose transport and enzyme activities during freezing
of BBMV from the intestinal epithelium of the warm-water euryhaline fish, Oreochromis
mossambicus, showed that the freezing of BBMV in liquid nitrogen preserved the properties of
glucose transport found in fresh vesicles, including sodium-dependency, and overshoot
characteristics (Reshkin et al., 1988). Long-term storage and maintenance of functionality of a
membrane system offers advantages over exclusive use of fresh protein preparations. The
similarity in activity of frozen to fresh preparations greatly reduces experimental time and thus
greatly increases productivity. Additionally, preservation of a single large vesicle preparation
permits an increased number of experiments to be conducted on the same vesicle population,
thereby reducing the variability created due to organismal and preparative differences. In this
investigation, however, experiments were conducted with vesicles prepared from an individual
lobster hepatopancreas and were repeated three times (3 lobsters). Rapid freezing in liquid
nitrogen and storage in -80°C (at least 48 hours), in combination with slow, gentle thawing of
the samples on ice, results in a sample preparation with essentially identical glucose transport
48
characteristics to those found in the fresh preparation. The overshoot displayed in both the
fresh and frozen vesicle preparations was triple its respective equilibrium value. Glucose uptake
by both fresh and frozen vesicle preparations displayed no significant uptake overshoot in
media containing potassium or mannitol. The overshoot phenomenon was thus conserved and
essentially unchanged in glucose transport by frozen vesicle preparations. The slow thawing
seemingly results in less structural and functional change in membrane proteins, resulting in an
improved preservation of original transport properties (Rudolph and Crow, 1985; Reshkin et al.,
1988). Thus, slow thawing on ice may be an essential component for freeze-thaw vesicle
preservation. All hepatopancreatic BBMV data in this investigation were obtained using at least
3 sets of pooled frozen BBMV preparations.
Glucose transport has been shown to be sodium-dependent in the invertebrate
digestive tract (Ahearn and Maginniss, 1977; Ahearn et al., 1985; Blaya et al., 1998; Verri et al.,
2001; Vilella et al., 2003). Glucose uptake in the absence of sodium was equilibrative (Ahearn et
al., 1985). Sodium-coupled D-glucose transport by digestive tract epithelial cells was confirmed
in the present study. While Na+-dependent D-glucose influx has been extensively investigated,
Na+-dependent D-fructose influx has only been described in the hepatopancreas (Sterling et al.,
2009). The observed sodium-dependent fructose influx by BBMV is in contrast to the
mammalian paradigm, in which fructose uptake by BBMV involves a Na+-independent GLUT-like
facilitative transporter. Mucosal GLUT 5 is a known fructose transporter previously identified in
the mammalian intestinal epithelial brush-border membrane (Miyamoto et al., 1994; Corpe et
al., 2002). Increasing concentrations of sodium stimulated D-fructose influx by BBMV in a
hyperbolic manner, similar to sodium-coupled D-glucose transport by BBMV. Similarity in KM
49
values for Na+-dependent D-glucose and D-fructose transport by hepatopancreatic BBMV (2.30
± 0.59 and 2.58 ± 0.95 mM, respectively) suggest that they may be transported by a single
carrier process with substrate specificities different from those demonstrated by mammalian
SGLT1. The maximal transport rate, however, was different, with transport of fructose being 26
times faster than for glucose. The sodium-dependent fructose transport activity reported here
can be compared with that of the mammalian SGLT4, which is known to transport fructose, in
addition to glucose, in a sodium-dependent manner (Tazawa et al., 2005). D-fructose (75 and
100 mM) inhibits D-glucose influx in a competitive manner. Increasing [D-fructose] led to an
increase in KM (decrease in binding affinity) but no change in Jmax. D-glucose and D-fructose
appear to be competing for the same binding site on this sodium-coupled hexose transporter,
and thus supporting the appearance of a carrier process that transports both D-glucose and D-
fructose in a sodium-dependent manner in the hepatopancreas.
The ion-dependency of both D-glucose and D-fructose transport appeared due to the
use of a co-transport protein that employed two simultaneous driving forces working together
to power the transfer of the sugars from gut lumen to epithelial cytosol. These combined
driving forces in vivo are the trans-apical sodium concentration gradient established and
maintained by a basolateral ATP-dependent 3Na/2K-ATPase, and the transmembrane electrical
potential difference created by the same primary active transport process. Both D-glucose and
D-fructose influxes were hyperbolic functions of [potassium] and followed the Michaelis-
Menten equation (1). Significant (p < 0.01) K+-dependent D-glucose and D-fructose uptake
processes were observed. The resulting KM values for glucose and fructose in potassium
medium appear to be similar (9.85 ± 0.4 and 12.6 ± 0.80 mM, respectively). The maximal
50
transport rates, however, were different with transport being 7 times faster for glucose than for
fructose. Both D-glucose and D-fructose appear to be transported by a single carrier process
with sodium and potassium as alternative driving forces. The apparent cation-binding affinity
was approximately 5 times greater (lower KM) in external NaCl than in KCl indicating that Na+
might be the “preferable ion” for stimulating hepatopancreatic BBMV glucose and fructose
uptake in the American lobster. While D-glucose transport using transmembrane gradients of
either sodium or potassium as driving forces have been previously described for the Atlantic
white shrimp (Simmons et al., 2012; Obi et al., 2013), sodium or potassium-coupled D-fructose
transport by lobster hepatopancreatic BBMV has only been reported in the present
investigation. The question, however, arises as to why increasing KCl concentrations stimulate
sugar influx by BBMV in a hyperbolic manner as shown in the present investigation, while in a
previous study by Ahearn et al.,(1985) a transmembrane potassium gradient was unable to
result in a D-[3H] glucose uptake overshoot in the same species. A tentative answer may be that
potassium may be acting as an activator rather than a driver ion mediating D-glucose transport
across the hepatopancreatic brush border membrane. By K + binding to cation-dependent sugar
transporters it allows for more transporters to have an available binding site for sugar (see Fig.
1). Sugar transport is thus driven by the concentration gradient of the sugar itself, stimulating
sugar transport without using a driving ion.
In addition to lobster hepatopancreatic BBMV, in vitro perfused intestines were
employed to characterize the nature of cation-dependent D-glucose and D-fructose transport in
this organ. Sodium-dependent D-glucose co-transport has been reported in both the
hepatopancreas and intestine (Ahearn et al., 1985; Obi et al., 2011) while sodium-dependent D-
51
fructose co-transport has only previously been described for the hepatopancreas (Sterling et al.,
2009). In the present study, however, sodium-dependent D-fructose influx by epithelial
intestinal mucosal to serosal (MS) transport is reported. Increasing concentrations of sodium
stimulate D-fructose influx by epithelial intestinal MS transport in a hyperbolic manner, similar
to sodium-coupled D-glucose transport in the same organ. Similarity in KM values for Na+-
dependent D-glucose and D-fructose influx by epithelial intestinal MS transport (6.05 ± 0.99 and
10.5 ± 1.65 mM, respectively) suggest that they may be transported by a single carrier process in
the intestine. Furthermore, D-fructose (75 and 100 mM) inhibits D-glucose influx in a
competitive manner. Increasing [D-fructose] led to an increase in KM (decrease in binding
affinity) but no change in Jmax. D-glucose and D-fructose appear to be competing for the same
binding site on this sodium-coupled hexose transporter, and thus supporting the appearance of
a carrier process that transports both D-glucose and D-fructose in a sodium-dependent manner
in the intestine also.
Potassium-dependency of glucose and fructose transport was investigated in the
intestine as well. No previous studies have reported K+-dependent sugar transport in the
intestine except in the present investigation. In a recent study, D-glucose and D-fructose
transport were examined in the lobster intestine but only sodium was used as the cation driving
force (Obi et al., 2011). Both D-glucose and D-fructose influx by epithelial intestinal transport
were hyperbolic functions of [potassium] and followed the Michaelis-Menten equation (1).
Significant (p < 0.01) K+-dependent D-glucose and D-fructose uptake processes were observed
in the intestine also. The resulting KM values for transmural MS transport of D-glucose and D-
fructose in potassium medium appear to be similar (3.10 ± 0.24 and 2.12 ± 0.20 mM,
52
respectively). The maximal transport rates, however, were different with transport being 2.5
times faster for fructose than for glucose. Both D-glucose and D-fructose appear to be
transported by a single carrier process with sodium and potassium as alternative driving forces.
The apparent cation-binding affinity was approximately 5 times greater (lower KM) in external
KCl than in NaCl, indicating that K+ might be the “preferable ion” for stimulating epithelial
intestinal MS glucose and fructose influx in the American lobster. The magnitudes of the
potassium concentration gradient or membrane potential across the epithelial luminal
membrane in vivo is not known but even though the American lobster is mostly carnivorous,
they do include some amount of marine algae in their diets (Conklin et al., 1995), which are
high in potassium. An increase in luminal [potassium] would disturb the potassium equilibrium
across the epithelial luminal membrane and result in an increased inwardly-directed
electrochemical driving force for the uptake of potassium from lumen to epithelial cytosol (Obi
et al., 2013). An estimation of the minimum luminal [K] needed to stimulate sugar uptake by an
in vivo electrochemical driving force has been previously calculated using the potassium Nernst
equation and was reported to be 10 mM (as occurs in seawater) (Obi et al., 2013).
In addition to cation-dependent glucose and fructose carrier processes observed in the
hepatopancreas and intestine, sodium-independent glucose and fructose carrier processes
appeared to be observed as well. In the absence of sodium (0 mM), there was still a
considerable amount of glucose and fructose uptake by hepatopancreatic BBMV and
transepithelial transport, suggesting the presence of lobster GLUT2-like and GLUT5-like
transporters, respectively. In a recent study by Sterling et al., (2009) polyclonal antibodies to
mammalian GLUT2 and GLUT5 were used to determine the localization of orthologous lobster
53
hepatopancreas proteins by western blot analysis. Both GLUT2 and GLUT5 were found in the
hepatopancreas and intestine (Sterling et al., 2009). In addition, GLUT5-like transporters were
localized to the brush border membrane of lobster intestine using immunohistochemical
methods (Obi et al., 2011). Furthermore, western blot analysis using a rabbit anti-human SGLT4
antibody located an SGLT4-like protein in the lobster hepatopancreas (Sterling et al., 2009).
These findings and those reported in the present investigation suggest that the sugar
transporter ensemble for gastrointestinal absorption of glucose and fructose may be present,
as previously described for mammalian epithelia, but also includes a co-transport process
(SGLT-like) with properties apparently different from those of mammalian SGLT1.
Kinetic values of cation-dependent glucose and fructose transport in the
hepatopancreas and intestine reported in this investigation are all displayed in Table 5
permitting comparisons between both organs. D-glucose and D-fructose appear to be
transported by a single SGLT-like carrier process in each organ with Na+ being the preferred
(lower KM) cation in the hepatopancreas and K+ being the preferred (lower KM) cation in the
intestine. This cation preference in each organ may be due to [sodium] being depleted as it
moves across the hepatopancreas (anterior organ) to the intestine (posterior organ) and
potassium becoming more concentrated as it enters the intestine. Thus, in the hepatopancreas;
Na+ appears to be the preferred cation since it is in higher concentration than [K+]; in the
intestine, K+ is the preferred cation since it may be in higher concentration than [Na+]. The
identity of this carrier that has the ability to transport D-glucose and D-fructose and be
stimulated by either sodium or potassium in the lobster hepatopancreas and intestine is still
unclear. It appears to be an SGLT-like carrier protein responsible for sugar transport in each
54
organ but whether it is a SGLT1-like or SGLT4-like co-transporter in the hepatopancreas or
intestine remains unclear. It has been previously reported that SGLT1 does not use fructose at
all (Ikeda et al., 1989; Wright and Turk, 2004), while SGLT4 has been reported to be selective for
D-mannose, D-fructose and D-glucose (Tazawa et al., 2005). It appears the latter is a more
suitable candidate for the identity of the sugar co-transport reported in the present
investigation even though the potential role of potassium in mammalian SGLT4 function has not
been reported.
Sugar absorption in the lobster digestive tract may occur sequentially as food travels
from stomach to rectum, with transport characteristics being determined by substrate and ion
concentration in each organ to fully remove glucose and fructose from the lumen. The apparent
binding affinities for sugars in the lobster and prawn intestine are reported to be in the
micromolar range (Ahearn and Maginniss, 1977; Obi et al., 2011), while in the hepatopancreatic
epithelial cells these KM values are much higher (Verri et al., 2001). In the hepatopancreas
(anterior organ) luminal substrate concentrations are high and the brush border membrane
employs low affinity sugars transporters, while in the intestine (posterior organ) where luminal
substrate concentrations are depleted, intestinal epithelial cells employ high-affinity sugar
transporters to mediate maximum sugar removal from the lumen. Similar arrangement of
sodium-dependent sugar transporter apparent binding affinities is also observed along teleost
fish digestive tract. In the rockfish (Sebastes caurinus) pyloric caeca (anterior organ) D-glucose
transport had a glucose binding affinity four times lower than the D-glucose transporters in the
upper intestine (posterior organ) (Ahearn et al., 1992). Also, the apparent binding affinity of the
D-glucose transporter for sodium was at least two times higher in the pyloric caeca (anterior)
55
than in the upper intestine (posterior organ) (Ahearn et al., 1992). A similar trend in binding
affinities for sodium is observed in the present investigation as well. Furthermore, in the
mammalian proximal tubule, lower affinity sodium-dependent D-glucose transporters (SGLT2)
displaying a higher sodium binding constant (high KM) have been reported immediately after
the glomerulus, followed by a high affinity SGLT1 transporter with a lower sodium binding
constant (low KM) (Turner and Moran, 1982).
56
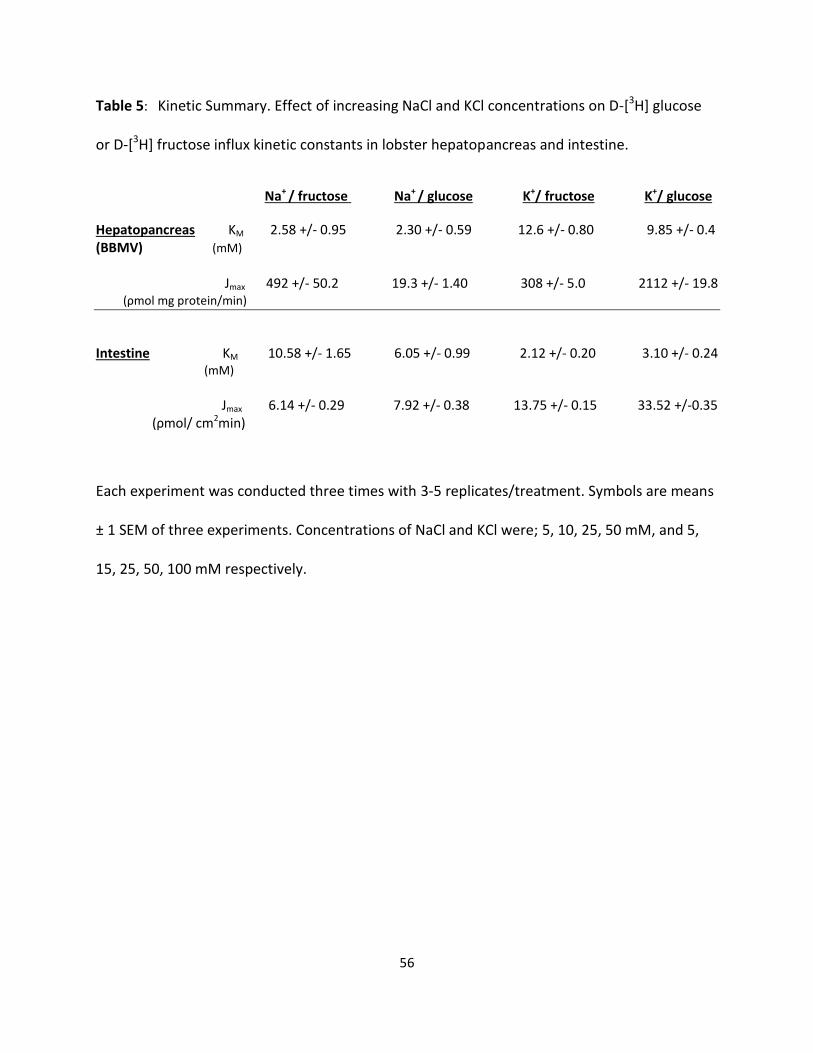
Table 5: Kinetic Summary. Effect of increasing NaCl and KCl concentrations on D-[3H] glucose
or D-[3H] fructose influx kinetic constants in lobster hepatopancreas and intestine.
Na+ / fructose Na+ / glucose K+/ fructose K+/ glucose
Hepatopancreas KM 2.58 +/- 0.95 2.30 +/- 0.59 12.6 +/- 0.80 9.85 +/- 0.4 (BBMV) (mM) Jmax 492 +/- 50.2 19.3 +/- 1.40 308 +/- 5.0 2112 +/- 19.8
(ρmol mg protein/min)
Intestine KM 10.58 +/- 1.65 6.05 +/- 0.99 2.12 +/- 0.20 3.10 +/- 0.24 (mM)
Jmax 6.14 +/- 0.29 7.92 +/- 0.38 13.75 +/- 0.15 33.52 +/-0.35 (ρmol/ cm2min)
Each experiment was conducted three times with 3-5 replicates/treatment. Symbols are means
± 1 SEM of three experiments. Concentrations of NaCl and KCl were; 5, 10, 25, 50 mM, and 5,
15, 25, 50, 100 mM respectively.
57
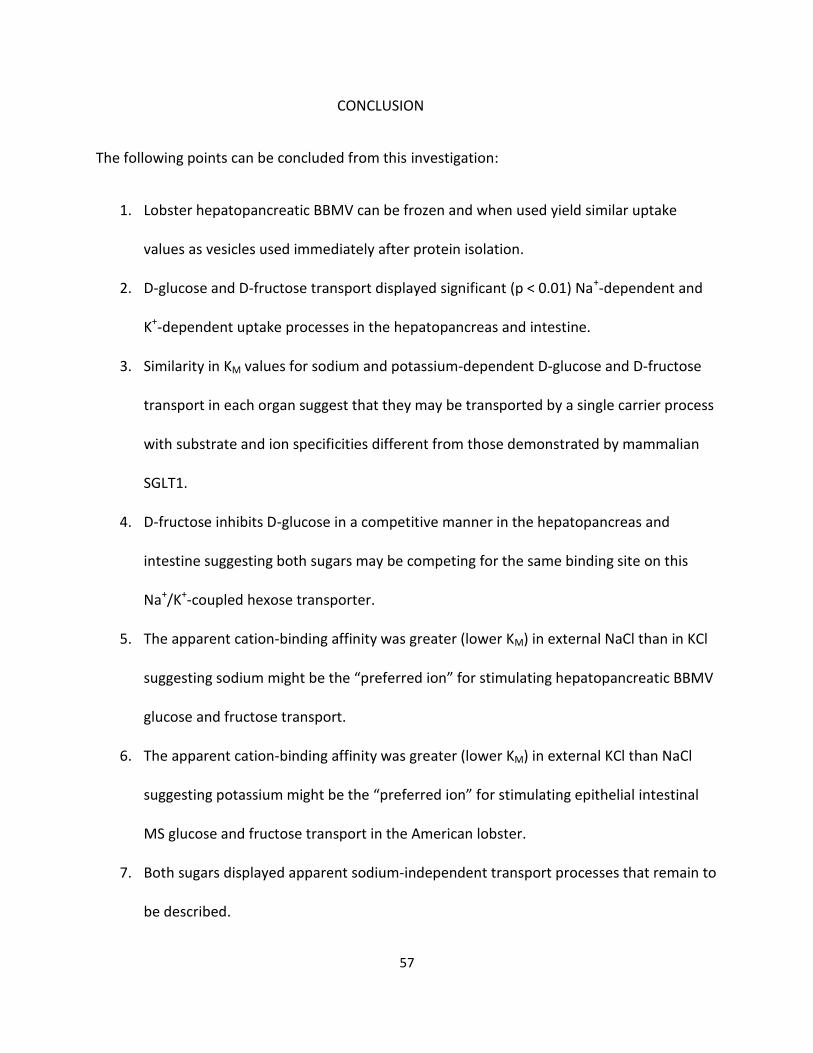
CONCLUSION
The following points can be concluded from this investigation:
1. Lobster hepatopancreatic BBMV can be frozen and when used yield similar uptake
values as vesicles used immediately after protein isolation.
2. D-glucose and D-fructose transport displayed significant (p < 0.01) Na+-dependent and
K+-dependent uptake processes in the hepatopancreas and intestine.
3. Similarity in KM values for sodium and potassium-dependent D-glucose and D-fructose
transport in each organ suggest that they may be transported by a single carrier process
with substrate and ion specificities different from those demonstrated by mammalian
SGLT1.
4. D-fructose inhibits D-glucose in a competitive manner in the hepatopancreas and
intestine suggesting both sugars may be competing for the same binding site on this
Na+/K+-coupled hexose transporter.
5. The apparent cation-binding affinity was greater (lower KM) in external NaCl than in KCl
suggesting sodium might be the “preferred ion” for stimulating hepatopancreatic BBMV
glucose and fructose transport.
6. The apparent cation-binding affinity was greater (lower KM) in external KCl than NaCl
suggesting potassium might be the “preferred ion” for stimulating epithelial intestinal
MS glucose and fructose transport in the American lobster.
7. Both sugars displayed apparent sodium-independent transport processes that remain to
be described.
58
REFERENCES
Ahearn, G. A., and Maginniss, L. A. (1976). Kinetics of glucose transport by the perfused mid-gut
of the freshwater prawn Macrobrachium rosenbergii. J. Physiol. 271: 319-336.
Ahearn, G. A., Grover, M. L., and Dunn, R. E. (1985) Glucose transport by lobster
hepatopancreatic brush-border membrane vesicles. Am. J. Physiol. 248: R133-R141.
Ahearn, G. A., Behnke, R. D., Zonno, V. and Storelli, C. (1992). Kinetic heterogeneity of Na-D-
glucose cotransport in teleost gastrointestinal tract. Am. J. Physiol. 263, R1018-R1023.
Al-Mohanna, S. Y., Nott, J. A., and Lane, D. J. W. (1985). Mitotic E- and secretory F-cells in the
hepatopancreas of the shrimp Penaeus semisculcatus (Crustacea: Decapoda). J. mar. Biol.
Assoc. U. K. 65: 901-910.
Al-Mohanna, S. Y., and Nott, J. A. (1986). R-cells and the digestion in the hepatopancreas of
Penaeus semisculcatus (Crustacea: Decapoda). J. mar. Biol. Assoc. U. K. 66: 403-411.
Biber J., Stieger B., Haase W., Murer H. (1981) A high yield preparation for rat kidney brush
border membranes. Different behavior of lysosomal markers. Biochem Biophys Acta 647: 169-
176
Blaya, J. A., Vasquez, C. M., Muriana, F. J., Ruiz-Gutierrez, V. and Bolufer, J. (1998). Alpha-MeGlc
and D-glucose transport by hepatopancreatic brush border membrane vesicles from prawn. J.
Physiol. Biochem. 54: 1-7.
Brown G. K. (2000) Glucose transporters: structure, function and consequences of deficiency. J.
of Inherit. Metab. Dis. 23, 237-246.
Caccia S., Casartelli A., Losa E., de Eguileor M., Pennacchio F. and Giordana B. (2007) The
unexpected similarity of intestinal sugar absorption by SGLT1 and apical GLUT2 in an insect
(Aphidius ervi, Hymenoptera) and mammals. Am. J. Physiol. 292, R2284-R2291.
Conklin, D. E. (1995). Digestive physiology and nutrition. In Biology of the Lobster, Homarus
americanus (ed. J. R. Factor), pp. 441-463. New York: Academic Press.
Conrad E. M. and Ahearn G. A. (2005) 3H-histidine and 65Zn2+ are cotransported by a dipeptide
transport system in the intestine of lobster Homarus americanus. J. Exp. Biol. 208, 287-296.
Corpe, C. P., Bovelander, F. J., Munoz, C. M., Hoekstra, J. H., Simpson, I. A., Kwon, O., Levine,
M., and Burrant, C. F. (2002) Cloning and functional characterization of the mouse fructose
transporter, GLUT 5. Biochimica et Siophysica Acta. 1576: 191-197.
59
Diez-Sampedro A., Hirayama B. A., Osswald C., Gorboulev v., Baumgarten K., Volk C., Wright E.
M., Koepsell H. (2003) A glucose sensor hiding in a family of transporters. Proceedings of the
National Academy of Sciences USA 100, 11753-11758.
Fiandra, L., Mandal, P. K., Giordana, B., and Ahearn, G. A. (2006). L-proline transport by purified
cell types of lobster hepatopancreas. J. Exp. Zool. 305 (10): 851-861.
Hediger M. A., Coady M. J., Ikeda T. S., Wright E. M. (1987) Expression cloning and cDNA
sequencing of the Na+/ glucose co-transporter. Nature 330, 379-381.
Hopfer U., Nelson K., Perrotto J., Isselbacher K. J. (1973) Glucose transport in isolated brush
border membrane from rat small intestine. J. Biol Chem 248: 25-32.
Ikeda, T. S., Hwang, E-S., Coady, M. J., Hirayama, B. A., Hediger, M. A. and Wright, E. M. (1989).
Characterization of a Na+/glucose cotransporter cloned from rabbit small intestine. J.
Membrane Biol. 110: 87-95.
Kanai Y., Lee W. S., You G., Brown D., Hediger M. A. (1994) The human kidney low affinity Na+/
glucose cotransporter SGLT2. Delineation of the major renal reabsorptive mechanism for D-
glucose. Journal of Clinical Investigation 93, 397-404.
Kellet, G. L. and Helliwell, P. A. (2000). The diffusive component of intestinal glucose absorption
is mediated by the glucose-induced recruitment of GLUT2 to the brush border membrane.
Biochem. J. 350, 155-162.
Kessler M., Acuto O., Storelli C., Murer H., Semenza G. (1978) A modified procedure for the
rapid preparation of efficiently transporting vesicles from small intestinal brush border
membranes. Their use in investigating some properties of D-glucose and choline transport
systems. Biochem Biophys Acta 506: 136-154.
Mader, S. (2010). Biology. New York: McGraw-Hill. P85.
Miyamoto, K. I., Tatsumi, S., Morimoto, A., Minami, H., Yamamoto, H., Sone, K., Taketani, Y.,
Nakabou, Y., Oka, T., and Takeda, E. (1994). Characterization of the rabbit intestinal fructose
transporter (GLUT 5). Biochem. J. 303: 877-883.
Obi I. E., Sterling K. M., Ahearn G. A. (2011) Transepithelial D-glucose and D-fructose transport
across the American lobster, Homarus americanus, intestine. J. Exp. Biol. 214, 2337-2344.
Obi, I. E., Sterling, K. M., Ahearn, G. A (2013). K+-dependent 3H-D-glucose transport by
hepatopancreatic brush border membrane vesicles of a marine shrimp. J. Comp. Physiol B 183:
61-69.
60
Pessin J. E., and Bell, G. I. (1992). Mammalian facilitative glucose transporter family: structure
and molecular regulation. Annu. Rev. Physiol. 54: 911-930
Reshkin S. J., Cassano G., Womersley C., Ahearn G. A. (1988) Preservation of glucose transport
and enzyme activity in fish intestinal brush-border and basolateral membrane vesicles. J. Exp.
Biol. 140, 123-135.
Rudolph, H. S., and Crowe, J. H. (1985). Membrane stabilization during freezing: The role of two
natural cryoprotectants, trehalose and proline. Cryobiol. 22: 367-377.
Simmons, T., Mozo, J., Wilson, J., Ahearn, G. A. (2012). Cation-dependent nutrient transport in
shrimp digestive tract. J. Comp. Physiol. B 182: 209-216.
Sterling K. M., Cheeseman C. I. and Ahearn G. A. (2009) Identification of a novel sodium-
dependent fructose transport activity in the hepatopancreas of the Atlantic lobster, Homarus
americanus. J. Exp. Biol 212; 1912-1920.
Tazawa S., Yamato T., Fujikura H., Hiratochi M., Itoh F., Tomae M., Takemura Y., Maruyama H.,
Sugiyama T., Wakamatsu A., Isogai T., Isaji M. (2005) SLC5A9/SGLT4, a new Na+-dependent
glucose transporter, is an essential transporter for mannose, 1,5-anhydro-D-glucitol, and
fructose. Life Sciences 76: 1039-1050.
Turk E. and Wright E. M. (1997) Membrane topology motifs in the SGLT cotransporter family. J.
Membr. Biol. 159, 1-20.
Turner, R. J. and Moran, A. (1982). Heterogeneity of sodium-dependent D-glucose transport
sites along the proximal tubule: evidence from vesicle studies. Am. J. Physiol. 242, F406-F414.
Uldry M. and Thorens B. (2004) The SLC2 family of facilitated hexose and polyol transporters.
Pflugers Archiv European Journal of Physiology. 447; 480-489.
Verri T., Mandal A., Zilli L., Bossa D., Mandal P. K., Ingrosso L., Zonno V., Vilella S., Ahearn G. A.,
Storelli C. (2001) D-glucose transport in decapod crustacean hepatopancreas. Comp. Biochem.
Physiol. A: 130: 585-606.
Vilella, S., Zilli, L., Ingrosso, L., Schiavone, R., Zonno, V., Verri, T., Storelli, C. (2003). Differential
expression of Na+/D-glucose cotransport in isolated cells of Marsupaneus japonicas
hepatopancreas. J. Comp. Physiol. B 173: 679-686.
Walmsley, A. R., Barrett, M. P., Bringaud, F., and Gould, G. W. (1998). Sugar transporters from
bacteria, parasites and mammals: structure-activity relationships. TIBS reviews, 23: 476-481.
61
Wright, E. M., Hirayama, B. A., and Loo D. F. (2007). Active sugar transportin Health and
Disease. J. Internal Med. 261: 32-43.
Wright, E. M., Loo D.F., and Hirayama B. A. (2011) Biology of Human Sodium Glucose
Transporters. Physiol. Review. Vol. 91 no. 2, 733-794.
Wright, E. M., and Turk, E. (2004) The sodium/glucose cotransport family SLC5. Pflugers Arch
447: 510-518.
Wright S. H. and Ahearn G. A (1997) Nutrient absorption in invertebrates. IN: Handbook of
Physiology (Sect. 13: Comparative Physiology), Vol. II, Chap. 16: 1137-1206.
62
VITA
Ada Duka was born . She completed her B.S in Biology
in December 2008 at the University of North Florida in Jacksonville, FL. Ada became a graduate
student at the University of North Florida in January 2011. As an M. S Biology student, she was
also a research assistant. In April 2012, Ada presented some of her findings at the Experimental
Biology Conference held in San Diego, CA. Also, in April 2013, some of her findings were
published in the Journal for Integrative and Comparative Biology. Currently, Ada is working as a
Laboratory Technician at the University of North Florida’s physiology laboratory and plans on
pursuing a Ph.D in Biomedical Sciences.