Embed Size (px)
Citation preview
Volume 6, Number 1 (February 2013) p. 121-138 • ISSN 1983-4195
© 2013 IBRACON
The last four decades were important for the Brazilian highway system. Financial investments were made so it could expand and many structural solutions for bridges and viaducts were developed. In parallel, there was a significant raise of pathologies in these structures, due to lack of main-tenance procedures. Thus, this paper main purpose is to create a short-term monitoring plan in order to check the structural behavior of a curved highway concrete bridge in current use. A bridge was chosen as a case study. A hierarchy of six numerical models is shown, so it can validate the bridge’s structural behaviour. The acquired data from the monitoring was compared with the finest models so a calibration could be made.
Keywords: short-term monitoring, SAP2000, Midas FX+, DIANA, numerical modelling.
As últimas quatro décadas foram importates para o desenvolvimento da malha rodoviária brasileira. O país recebeu incentivos financeiros à sua expansão e diversas soluções estruturais para pontes e viadutos foram criadas. Em paralelo a este desenvolvimento, houve nos últimos anos um crescimento significativo dessas estruturas em estágio avançado de deterioração devido à ausência de programas de manutenção preventiva. Dessa maneira, este trabalho propõe um plano de monitoramento de curta duração para acompanhar o comportamento estrutural de uma ponte rodoviária curva de concreto armado já em serviço. Uma ponte situada na divisa SP-MG foi escolhida para a implantação do plano proposto. Uma hierarquia de seis modelos numéricos foi apresentada, a fim de avaliar estruturalmente o comportamento da ponte. Por fim, os dados obtidos no monitoramento foram avaliados e confrontados com os resultados do modelo numérico mais refinado a título de calibração.
Palavras-chave: monitoramento de curta-duração, SAP2000, Midas FX+, DIANA, modelagem numérica
Comparison and calibration of numerical models from monitoring data of a reinforced concrete highway bridge
Comparativo e calibração de modelos numéricos a partir de dados de monitoramento de uma ponte rodoviária curva de concreto armado
R. G. M. de AndRAde a
L. M. TRAuTwein b
T. n. BiTTenCouRT c
a Rodolfo Giacomim Mendes de Andrade, Master Student of Polytechnical School of the University of São Paulo, [email protected], São Paulo, Brasil;b Leandro Mouta Trautwein, Professor at Structures Department of Civil Engineering, Architecture and Urbanism of State University of Campinas, [email protected], Campus Zeferino Vaz - Av. Albert Einstein, 951 - Campinas-SP – Brasil.c Túlio Nogueira Bittencourt, Professor Professor at Strutuctural Engineering and Foundations Department of Polytechnical School of University of São Paulo, [email protected], Av. Prof. Almeida Prado, trav. 2, 271, 05508-900, São Paulo, São Paulo, Brasil.
Received: 11 Jun 2012 • Accepted: 14 Sep 2012 • Available Online: 08 Feb 2013
Abstract
Resumo
122 IBRACON Structures and Materials Journal • 2013 • vol. 6 • nº 1
Comparison and calibration of numerical models from monitoring data of a reinforced concrete highway bridge
1. introduction
The last decades presented a significant growth of bridges and viaducts in Brazil which suffered from early deterioration caused by lack of maintenance programmes. Although Brazil presents regu-lations that provide procedures for bridges assessment, in most cases those procedures are only taken when the deterioration of the structure reaches a critical state where users are under risk (Oliveira [1]), (Lencioni [2]).A case study by SINAENCO (National Union of Architecture and Consulting Engineering), titled “Infrastructure of the City: Expiration Date”, shows the need for a permanent policy of maintenance and management of structures. Regarding the city of São Paulo, the study shows that more than 240 bridges and viaducts are in a state of deterioration, offering risk to users. One of the main reasons for the deterioration is given to the low investment, which corresponds to less than 0.38% of the construction budget (SINAENCO [3]).On the other hand, some initiatives concerning the behaviour of the structure can be found. The cable-stayed bridge over Pinheiros river, where runs a station on Line 5 of the underground system in the city, was monitored for temperature, strain and acceleration during its constructive phase until operation. Also, due to the com-plexity of the structural solution adopted by the construction meth-od for Bernard Goldfarb bridge located in Pinheiros, São Paulo, it was monitored for deformation not only during construction but in subsequent years. The newly-built cable-stayed bridge João Alves, located in Aracaju-SE, is an example of a particular bridge that is being continuously monitored (ASSIS [4]). Thus, this paper aims to propose a monitoring plan for a curved re-inforced concrete road bridge already in service. A bridge located on the border between the states of São Paulo and Minas Gerais was chosen as a case study to implement the proposed plan. To evaluate the structural behaviour of the bridge, a hierarchy of six numerical models will be done. Finally, it is intended o evaluate the acquired data and compare them with the results of the numerical model.
2. The bridge
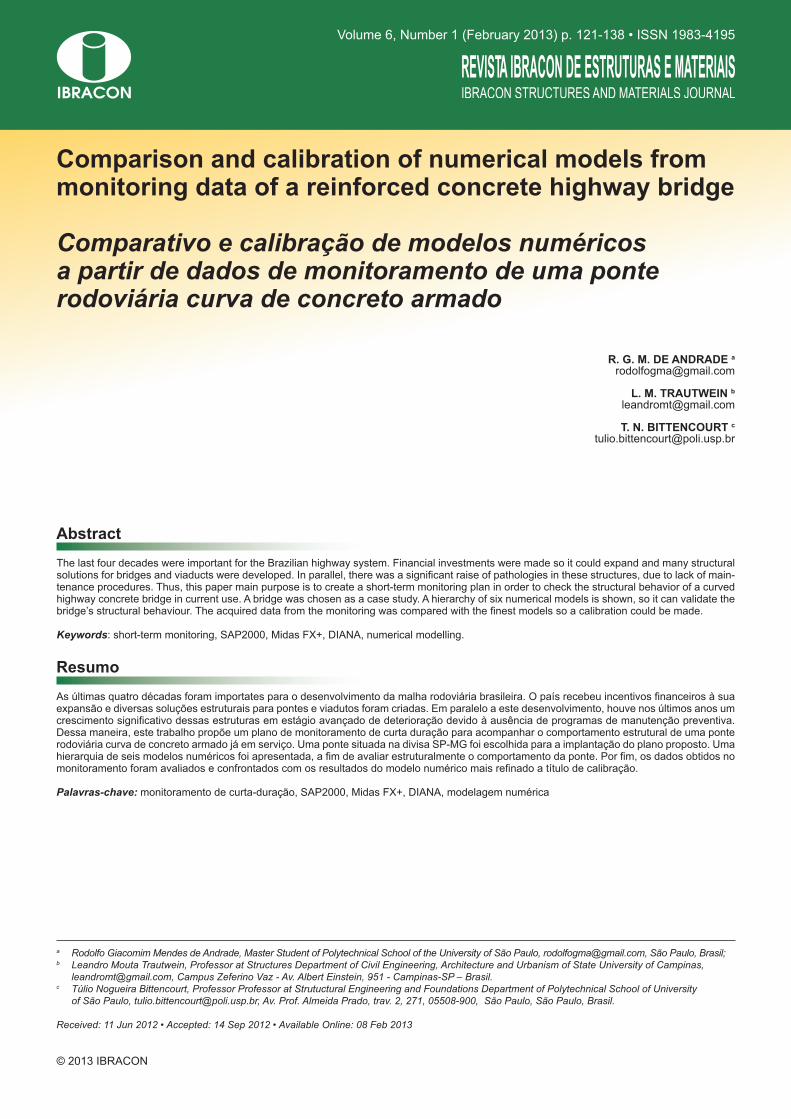
The bridge over Jaguari river is a reinforced concrete bridge built in 1999, located in Fernão Dias highway (BR 381), km 946 +300, on the border between the states of São Paulo and Minas Gerais. Figure 1 shows a view in where it is possible to observe part of the structure.The bridge consists of five spans (20m, 26m, 30m, 26m and 20m) supported on six pairs of columns. Its superstructure is continuous, without joints, presenting a reinforced concrete transition slab on each ends.The longitudinal axis of the bridge has a 5.9% slope towards Belo Horizonte - São Paulo, also presents constant superelevation of 8% and radius of curvature 305.50 m. Due to the superelevation, the two girders (GB – greater radius and GA and – smaller radius) and the pairs of columns present a 50cm depth offset. The loading is transferred from the superstructure to the columns by rubber bearing supports . The superstructure has an overall width of 11.70 m, in which 10.90 m is divided into two carriageways, and 0.40 m is for each rein-forced concrete New Jersey barriers. The bridge has a π shape cross-section, with main girders 6.40 m (center to center) apart, with an individual cross-section of 40cm wide and depth of 2.80 m.
Monolithically connected to the girders, the slab presents variable thickness, being 15 cm at the end of the 2.65m long cantilever and 24 cm at the center. Besides the curvature in plan and longitudinal slope, the girders have prismatic variation of the cross section as they approach the support columns. The structure consists of 20 transverse beams connected to the bottom of the main girders, spacing from 6.00m to 6.70m. The transverse beams over the columns consist of a cross-section of 25 x 220 cm, while the remaining ones consist of 20 x 220 cm. The columns have circular section (diameter of 120 cm), being each pair connected by beams (cross section 30 x 80 cm).The bridge’s infrastructure consists of reinforced concrete cais-sons (diameter of 140 cm).
3. Hierarchy of numerical models
One of the most common questions related to numerical modeling concern the accuracy and quality of results. The data to be inserted while designing model (its geometry, material properties, loads and boundary conditions) are extremely important in order to create a representation of the structure in which it is possible to obtain their structural behaviour (deformation, stress, strain, etc.).The essence of hierarchical modeling lies on the creation of addition-al models (and more refined one) of the chosen structure. Aligned with to the refinement, mathematical equations represent that the more complex the model is, the harder it will be the solution to con-
Figure 1 – The bridge over Jaguari river
Girder B
Girder A
P4B
Cassion
Column P4A
123IBRACON Structures and Materials Journal • 2013 • vol. 6 • nº 1
R. G. M. de AndRAde | L. M. TRAuTwein | T. n. BiTTencouRT
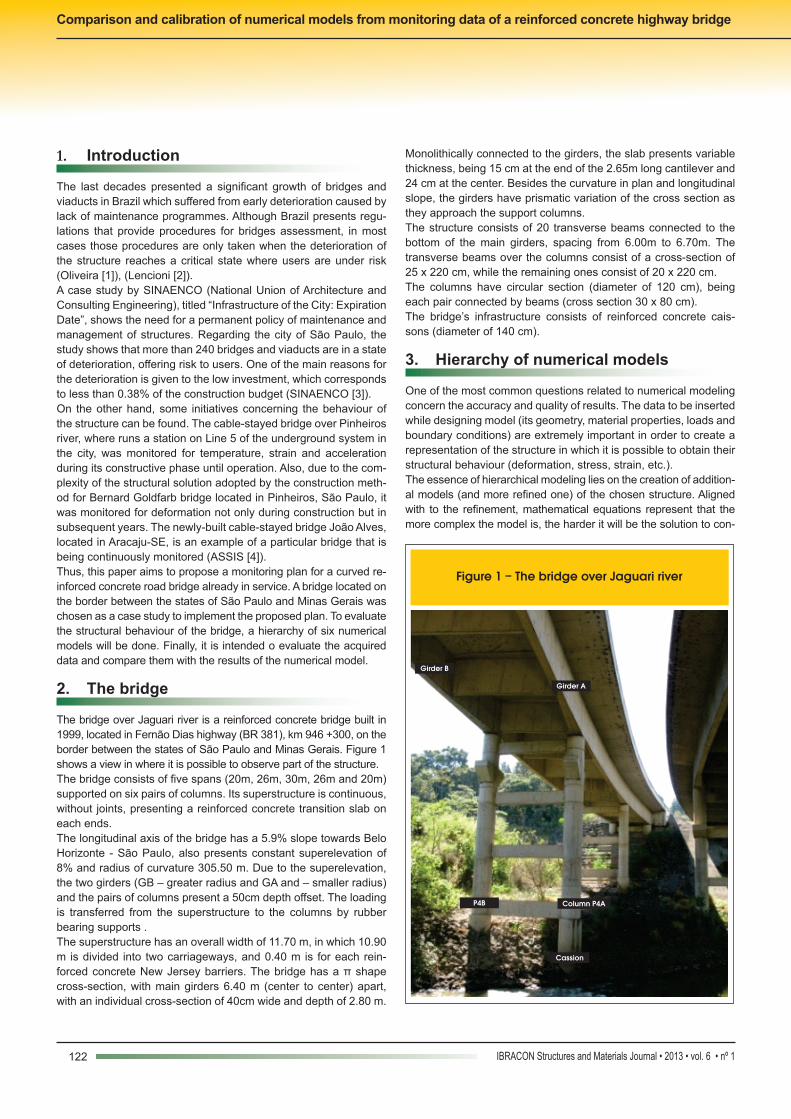
perstructure from the single bar element for two T-shaped girders. Both girders are connected by the 20 transverse beams.
3.2 Model 3
While Model 2 presents the full flange width of the T-shaped sec-tion, Model 3 shows the same properties and geometric criteria adopted in modeling, differing by a reduced flange width according to NBR 6118:2007 (ABNT, [6]).
3.4 Model 4
This model is an enhanced version of the models described above and uses area elements. However, the columns remain as 3-D frames. This model allows new considerations to be made, such as the distribution of the loading on the surface; relative displace-ment between girders; geometric modeling of transverse beams; transverse bending of the slab (in relation to the girders). Concrete properties and the whole structure geometry used to create Model 1 were maintained.
3.5 Model 5
After using area elements in hierarchical model 4, volumetric ele-ments were used for the development of Model 5 (linear-elastic behaviour). So far, Model 5 is considered the most complete of the five described models.Designed in MIDAS + Fx software, its geometry was developed from the insertion of individual points created in Excel spread-sheets. The software automatically generated the volume ele-
verge. Thus, when changing to a more refined, new hypotheses to the problem are raised so to reach the final model, to be considered satisfactory in terms of accuracy and results (Bucalem [5)].Thus, the physical problem under study is a curved reinforced con-crete bridge under traffic loads and permanent loads. The possible numerical models are shown in Figure 2.The bridge structural analysis over Jaguari river was performed using numerical models based on the Finite Element Method. Five linear elastic models were studied and developed, and also a non-linear model, all using softwares SAP2000 ® V14 (models 1 to 4) and Midas Fx + for DIANA ® (models 5 and 6). Such models, illus-trated in Figure 3, will be analysed in order to validate the results among them.
3.1 Model 1
Model 1 has the advantages for being simple, agile in the creation and data processing and information in simpler terms of internal forces. For the whole structure 3-D frame elements were used.The cross-section of the superstructure was represented as a sin-gle bar along the whole bridge. Regarding the variation of linear prismatic cross section of girders, three cross sections were cre-ated to represent the entire superstructure.In this model, the entire cross section remains rigid, but with free-dom for translations and rotations. As the superstructure behaves like a beam element, the transverse beams were only considered as dead loading. For the creation of the cross section, the super-structure superelevation of 8% was taken into account, as well as the radius of curvature.
3.2 Model 2
Model 2 presents the same geometric and material properties cri-teria adopted for model 1, except for the replacement of the su-
Figure 2 – Hierarchy of numerical models for the bridge
Figure 3 – Numerical models (1 to 6)
124 IBRACON Structures and Materials Journal • 2013 • vol. 6 • nº 1
Comparison and calibration of numerical models from monitoring data of a reinforced concrete highway bridge
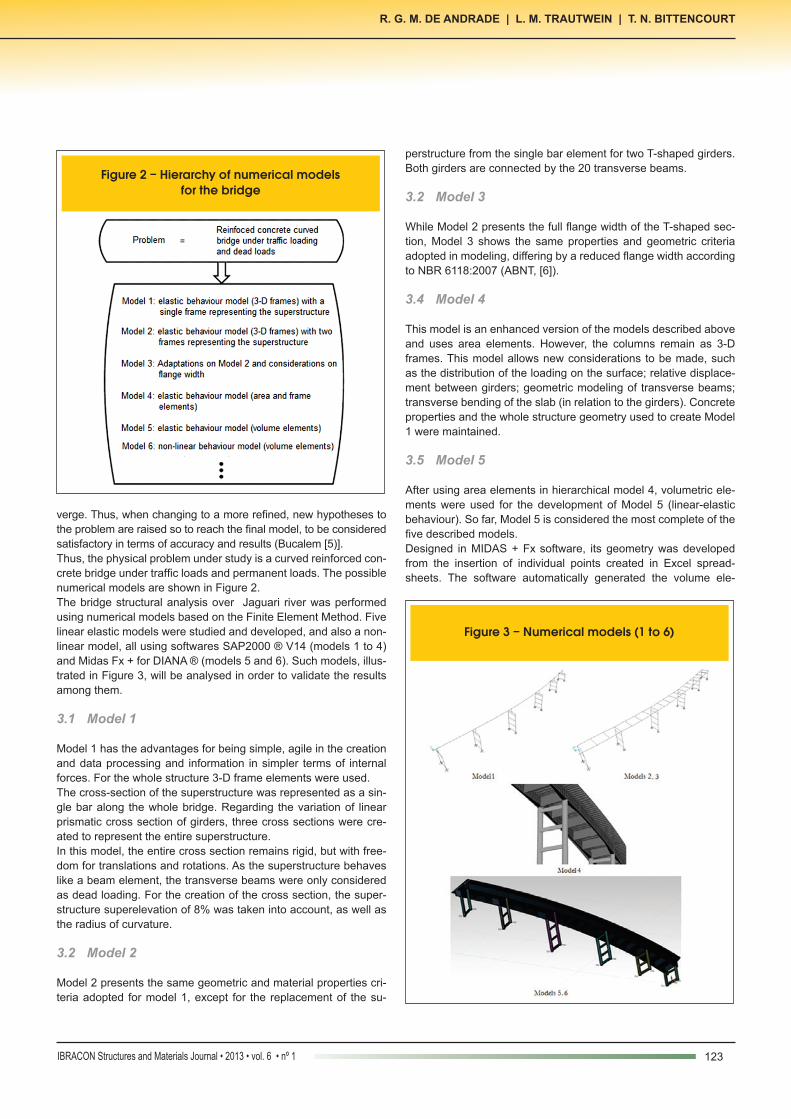
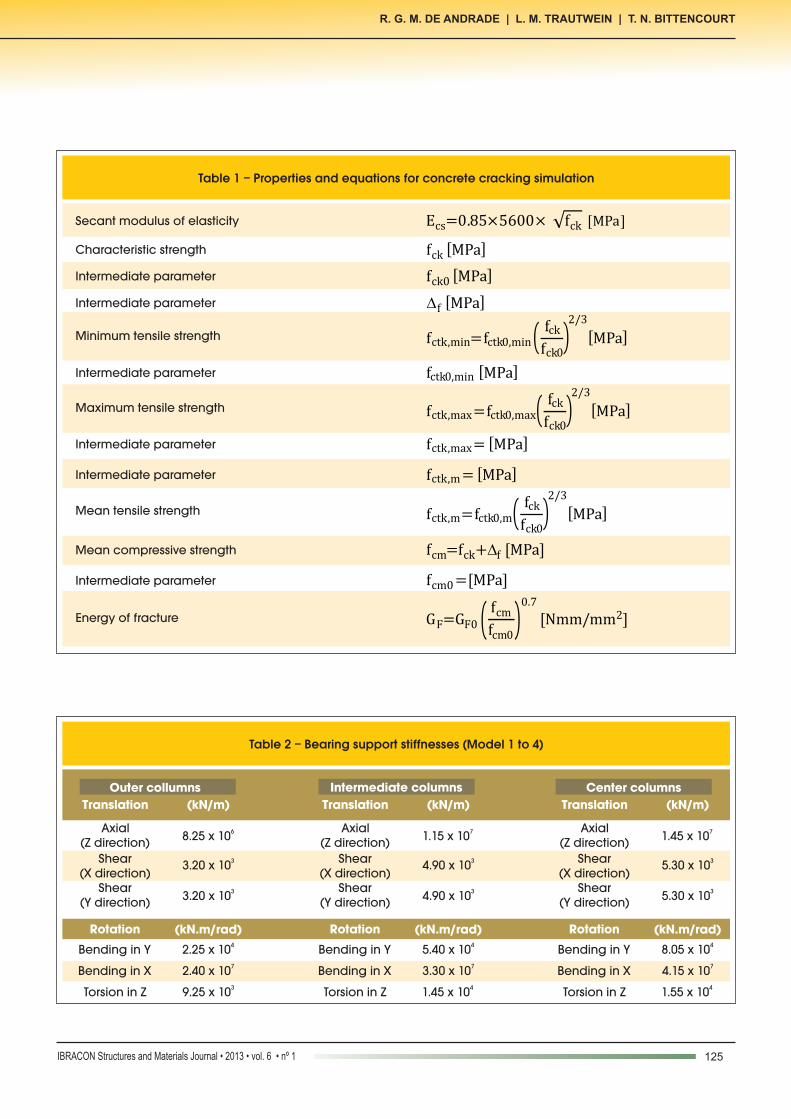
strength, fck. The adopted equation for E was taken from the Brazil-ian Standard NBR 6118:2007 [6], shown in Table 1.The input data for properties and equations for the simulations of concrete cracking in DIANA are presented in Table 1 (Trautwein [7]), (Schereppers [8]). It is also presented the equation of the concrete’s energy of fracture (CEB, [9]). This energy equation is a function of concrete’s fck and maximum aggregate diameter. It can be found in DIANA’s library the constitutive model of con-crete’s tensile softening, presented in five different curves. For this paper, Curve number 5 was adopted, as shown in Figure 5 (Trautwein [7]).
3.8 Boundary conditions
To calculate the stiffness of rubber bearing support, which con-nects the superstructure with the columns, it was considered the transverse elastic modulus as G = 1.0 MPa, Poisson’s Coef-ficient ν = 0.5, and durometer Shore A 60. The stiffness coef-ficients obtained for the spring models 1 to 4 are listed in Table 2 (Braga [10]).Volume elements for the bearing support were used in models 5 and 6. For both models, a fictitious elastic modulus was adopted (Braga [10]), as shown in equation 1 below:
(1)Efic=
3G× [1+0.5×ν× (Le)2
]1-ν2
The boundary condition for columns support to the ground on all six models is restriction to the six degrees of freedom – 3 DOF on translation and 3 DOF on rotation.
3.9 Loadings
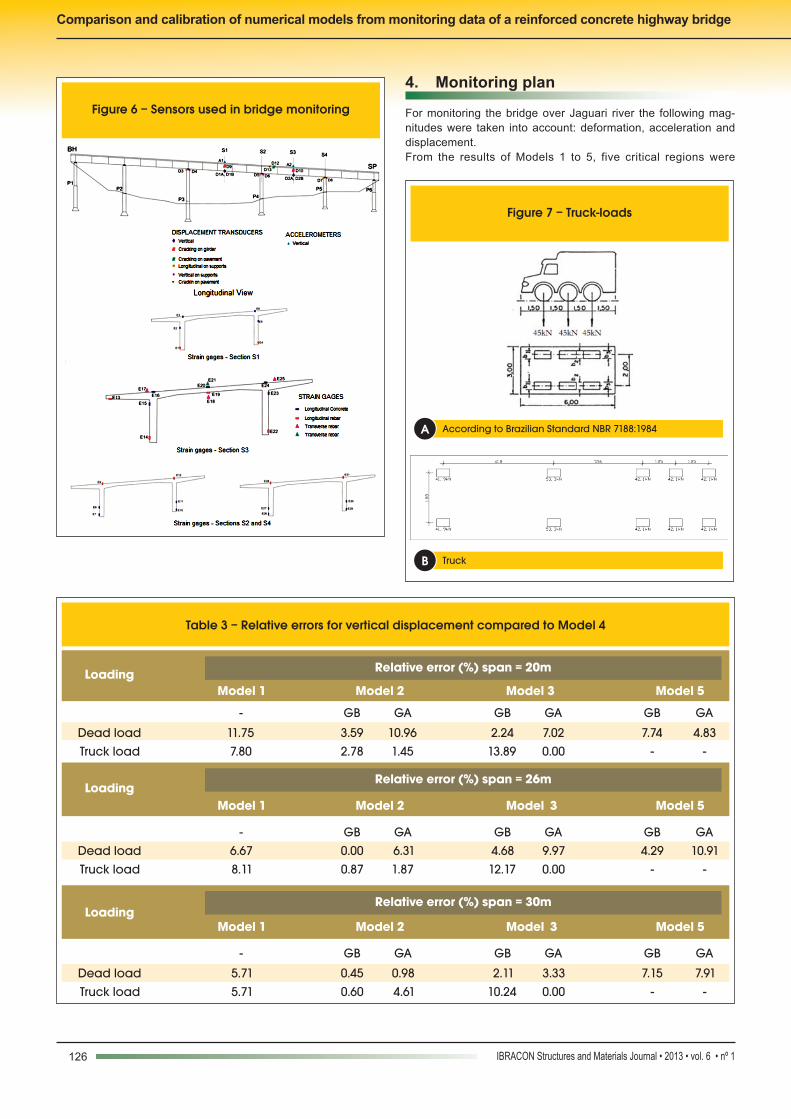
In all loading cases, it was considered the structure’s self-weight. For models 1 to 4, the traffic loading was used according to NBR 6118:2007 (ABNT, [11]) and for models 5 and 6, a real truck loading was used (truck loaded with gravel). The dimensions and loadings are shown in Figure 6. For the six models, the traffic loading was inserted as nodal static loading.
ments, from the insertion of points, drawn lines and areas created manually for it. Tests were made in order to gain accuracy and a 15cm-sided volume element was chosen. For this model, the whole structure was modeled into volume elements.
3.6 Model 6
Model 6 has the same geometric description considered in Model 5, differing by the non-linear behaviour of volume elements of su-perstructure and by inserting concentrations of rebar incorporated into the concrete mesh (embedded reinforcement).Figure 4 illustrates all rebar concentrations inserted in the numeri-cal model; each concentration was placed in the center of gravity of the represented set. In order to satisfactorily represent concrete’s non-linearity effects of and cracks’ propagation along the sections all rebars were strictly included according to the design project.
3.7 Materials properties
The material properties for the input data in the numerical models were linear-elastic behaviour (models 1 to 5) and non-linear physi-cal behaviour (Model 6).The main property so the model can behave elastically is the Elas-tic Modulus, E, which depends from the concrete’s characteristic
Figure 4 – Rebar concentration for Model 6 Figure 5 – Concrete's tensile softening diagram (Trautwein [7])
125IBRACON Structures and Materials Journal • 2013 • vol. 6 • nº 1
R. G. M. de AndRAde | L. M. TRAuTwein | T. n. BiTTencouRT
Table 1 – Properties and equations for concrete cracking simulation
Secant modulus of elasticity
Characteristic strength
Intermediate parameter
Intermediate parameter
Minimum tensile strength
Intermediate parameter
Maximum tensile strength
Intermediate parameter
Intermediate parameter
Mean tensile strength
Mean compressive strength
Intermediate parameter
Energy of fracture
Ecs=0.85×5600× fck [MPa]
fck [MPa]
fck0 [MPa]
f [MPa]
fctk,min=fctk0,min( fck
fck0)2 3/
[MPa]
fctk,m=fctk0,m( fck
fck0)2 3/
[MPa]
fctk,max=fctk0,max( fck
fck0)2 3/
[MPa]
fctk,max= [MPa]
fctk,m = [MPa]
fctk0,min [MPa]
fcm=fck+f [MPa]
fcm0 =[MPa]
GF=GF0 ( fcm
fcm0)
0.7
[Nmm mm2/ ]
Table 2 – Bearing support stiffnesses (Model 1 to 4)
Outer collumns Intermediate columns Center columns Translation (kN/m) Translation (kN/m) Translation (kN/m)
Axial (Z direction)
68.25 x 10 Axial
(Z direction) 71.15 x 10
Axial (Z direction)
71.45 x 10
Shear (X direction)
33.20 x 10 Shear (X direction)
34.90 x 10 Shear (X direction)
35.30 x 10
Shear (Y direction)
33.20 x 10 Shear
(Y direction)34.90 x 10
Shear (Y direction)
35.30 x 10
Rotation
(kN.m/rad)
Rotation
(kN.m/rad)
Rotation
(kN.m/rad)
Bending in Y 42.25 x 10 Bending in Y 45.40 x 10 Bending in Y 48.05 x 10
Bending in X 72.40 x 10 Bending in X 73.30 x 10 Bending in X 74.15 x 10
Torsion in Z 39.25 x 10 Torsion in Z 41.45 x 10 Torsion in Z 41.55 x 10
126 IBRACON Structures and Materials Journal • 2013 • vol. 6 • nº 1
Comparison and calibration of numerical models from monitoring data of a reinforced concrete highway bridge
4. Monitoring plan
For monitoring the bridge over Jaguari river the following mag-nitudes were taken into account: deformation, acceleration and displacement. From the results of Models 1 to 5, five critical regions were
Figure 6 – Sensors used in bridge monitoring
Figure 7 – Truck-loads
According to Brazilian Standard NBR 7188:1984
Truck
A
B
Table 3 – Relative errors for vertical displacement compared to Model 4
Loading
Relative error (%) span = 20m
Model 1 Model 2 Model 3 Model 5
- GB GA GB GA GB GA
Dead load 11.75 3.59 10.96 2.24 7.02 7.74 4.83 Truck load
7.80
2.78
1.45
13.89
0.00
-
-
Loading
Relative error (%) span = 26m
Model 1 Model 2 Model 3 Model 5
- GB GA GB GA GB GA Dead load 6.67 0.00 6.31 4.68 9.97 4.29 10.91 Truck load 8.11 0.87 1.87 12.17 0.00 - -
Loading
Relative error (%) span = 30m
Model 1 Model 2 Model 3 Model 5
- GB GA GB GA GB GA
Dead load 5.71 0.45 0.98 2.11 3.33 7.15 7.91 Truck load 5.71 0.60 4.61 10.24 0.00 - -
127IBRACON Structures and Materials Journal • 2013 • vol. 6 • nº 1
R. G. M. de AndRAde | L. M. TRAuTwein | T. n. BiTTencouRT
detected and hence monitored (Figure 7): S1 and S3, in the center of spans of 30m and 26m, respectively, S2 and S4, re-gions right above columns P4 and P5. Sections S1 and S3 presented sagging bending moment and maximum displace-ments, whereas S2 and S4, high tensile stresses due to hog-ging bending moment. Thus, it was found that the static vertical displacement of both girders should be measured by displace-ment transducers. Still, longitudinal and transverse displace-ments were monitored by displacement sensors inserted on the bearing support over columns P4 and P6. Finally, displace-ment transducers were used to monitor cracks on the outside face of the girders.Three accelerometers were installed in regions corresponding to one of the first vibration modes obtained from Model 4: Sections S1 and S3.This paper approaches the results for displacements only. The dy-namic results and deformations are related to other studies from monitoring group.
5. Analyses and results
In order to compare the acquired data during bridge monitoring with numerical models 5 and 6, a previous validation among mod-els 1 to 5 was carried out.For convenience, Model 4 was considered master model and was
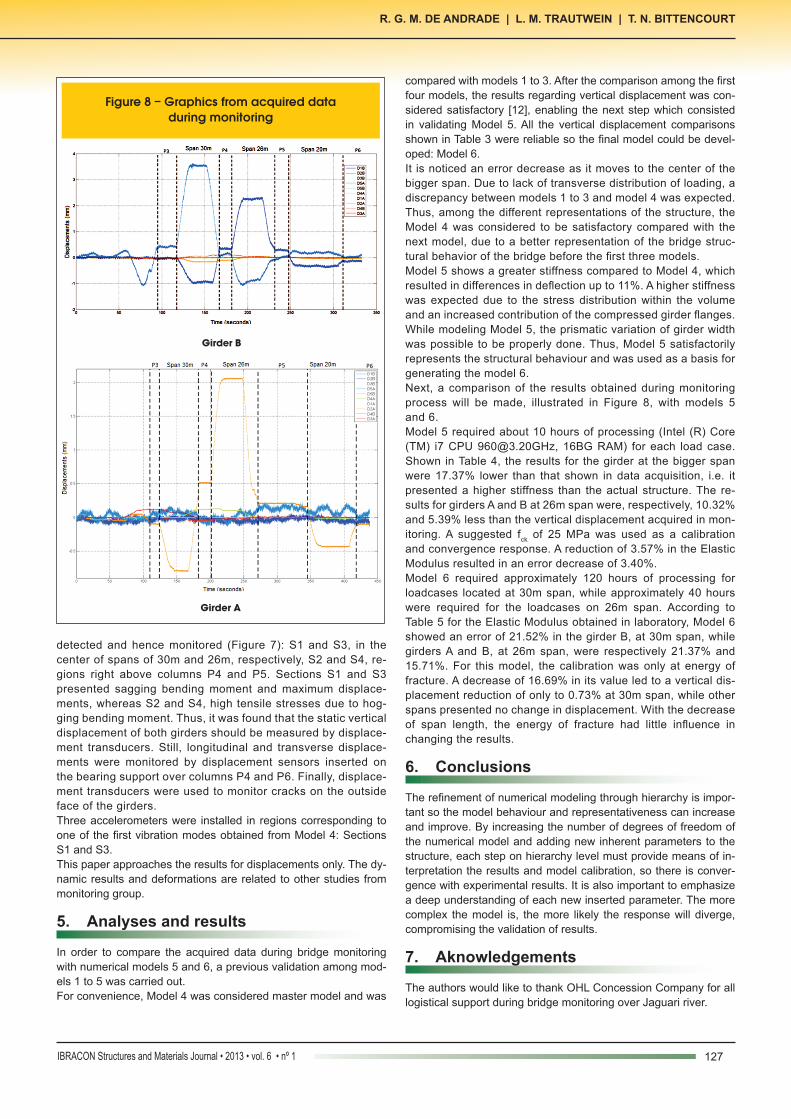
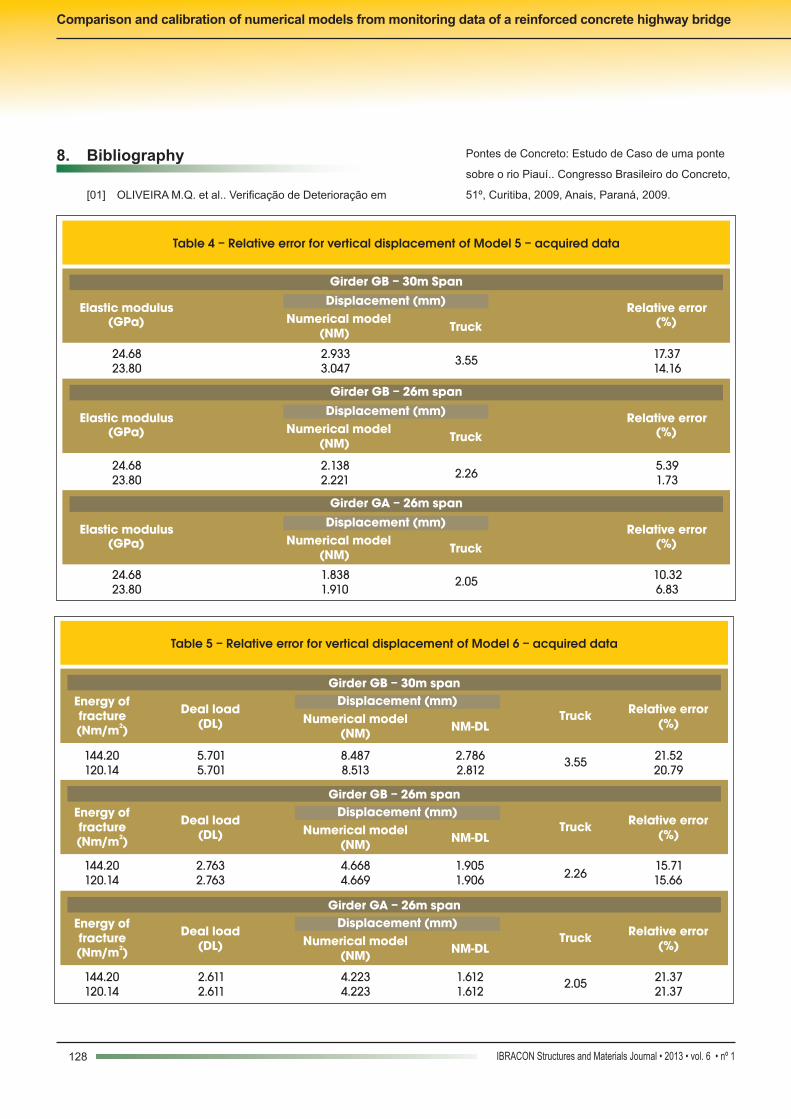
compared with models 1 to 3. After the comparison among the first four models, the results regarding vertical displacement was con-sidered satisfactory [12], enabling the next step which consisted in validating Model 5. All the vertical displacement comparisons shown in Table 3 were reliable so the final model could be devel-oped: Model 6. It is noticed an error decrease as it moves to the center of the bigger span. Due to lack of transverse distribution of loading, a discrepancy between models 1 to 3 and model 4 was expected. Thus, among the different representations of the structure, the Model 4 was considered to be satisfactory compared with the next model, due to a better representation of the bridge struc-tural behavior of the bridge before the first three models.Model 5 shows a greater stiffness compared to Model 4, which resulted in differences in deflection up to 11%. A higher stiffness was expected due to the stress distribution within the volume and an increased contribution of the compressed girder flanges. While modeling Model 5, the prismatic variation of girder width was possible to be properly done. Thus, Model 5 satisfactorily represents the structural behaviour and was used as a basis for generating the model 6.Next, a comparison of the results obtained during monitoring process will be made, illustrated in Figure 8, with models 5 and 6.Model 5 required about 10 hours of processing (Intel (R) Core (TM) i7 CPU [email protected], 16BG RAM) for each load case. Shown in Table 4, the results for the girder at the bigger span were 17.37% lower than that shown in data acquisition, i.e. it presented a higher stiffness than the actual structure. The re-sults for girders A and B at 26m span were, respectively, 10.32% and 5.39% less than the vertical displacement acquired in mon-itoring. A suggested fck of 25 MPa was used as a calibration and convergence response. A reduction of 3.57% in the Elastic Modulus resulted in an error decrease of 3.40%.Model 6 required approximately 120 hours of processing for loadcases located at 30m span, while approximately 40 hours were required for the loadcases on 26m span. According to Table 5 for the Elastic Modulus obtained in laboratory, Model 6 showed an error of 21.52% in the girder B, at 30m span, while girders A and B, at 26m span, were respectively 21.37% and 15.71%. For this model, the calibration was only at energy of fracture. A decrease of 16.69% in its value led to a vertical dis-placement reduction of only to 0.73% at 30m span, while other spans presented no change in displacement. With the decrease of span length, the energy of fracture had little influence in changing the results.
6. Conclusions
The refinement of numerical modeling through hierarchy is impor-tant so the model behaviour and representativeness can increase and improve. By increasing the number of degrees of freedom of the numerical model and adding new inherent parameters to the structure, each step on hierarchy level must provide means of in-terpretation the results and model calibration, so there is conver-gence with experimental results. It is also important to emphasize a deep understanding of each new inserted parameter. The more complex the model is, the more likely the response will diverge, compromising the validation of results.
7. Aknowledgements
The authors would like to thank OHL Concession Company for all logistical support during bridge monitoring over Jaguari river.
Figure 8 – Graphics from acquired data during monitoring
Girder B
Girder A
128 IBRACON Structures and Materials Journal • 2013 • vol. 6 • nº 1
Comparison and calibration of numerical models from monitoring data of a reinforced concrete highway bridge
8. Bibliography
[01] OLIVEIRA M.Q. et al.. Verificação de Deterioração em
Pontes de Concreto: Estudo de Caso de uma ponte
sobre o rio Piauí.. Congresso Brasileiro do Concreto,
51º, Curitiba, 2009, Anais, Paraná, 2009.
Table 4 – Relative error for vertical displacement of Model 5 – acquired data
Girder GB – 30m Span
Girder GB – 26m span
Girder GA – 26m span
Elastic modulus
Elastic modulus
Elastic modulus
(GPa)
(GPa)
(GPa)
Displacement (mm)
Displacement (mm)
Displacement (mm)
Relative error
Relative error
Relative error
(%)
(%)
(%)
Numerical model
Numerical model
Numerical model
(NM)
(NM)
(NM)
Truck
Truck
Truck
24.68 2.933 3.55 17.37 23.80 3.047 14.16
24.68 2.138 2.26
5.39 23.80 2.221 1.73
24.68 1.838 2.05 10.32 23.80 1.910 6.83
Table 5 – Relative error for vertical displacement of Model 6 – acquired data
Girder GB – 30m span
Girder GB – 26m span
Girder GA – 26m span
Energy of
Energy of
Energy of
fracture
fracture
fracture
2(Nm/m )
2(Nm/m )
2(Nm/m )
Displacement (mm)
Displacement (mm)
Displacement (mm)
Relative error
Relative error
Relative error
(%)
(%)
(%)
Deal load
Deal load
Deal load
(DL)
(DL)
(DL)
Numerical model
Numerical model
Numerical model
(NM)
(NM)
(NM)
NM-DL
NM-DL
NM-DL
Truck
Truck
Truck
144.20 5.701 8.487 2.786 3.55 21.52 120.14
5.701
8.513
2.812
20.79
144.20 2.763 4.668 1.905
2.26 15.71
120.14 2.763 4.669 1.906 15.66
144.20 2.611 4.223 1.612 2.05 21.37 120.14 2.611 4.223 1.612 21.37
129IBRACON Structures and Materials Journal • 2013 • vol. 6 • nº 1
R. G. M. de AndRAde | L. M. TRAuTwein | T. n. BiTTencouRT
[02] LENCIONI, J.W., LIMA, M.G. Análise da Importância da Consideração de Fatores Ambientais na
Degradação de Obras de Arte. Congresso Brasileiro do Concreto, 46º, Florianópolis, 2004, Anais, Santa Catarina, 2004.
[03] SINDICATO DA ARQUITETURA E DA ENGENHARIA. Infra-Estrutura da Cidade de São Paulo: Prazo de Validade Vencido, São Paulo, 2007. [04] ASSIS, W.S., Sistemas Computacionais de Apoio à
Monitoração de Estruturas de Engenharia Civil, São Paulo, 2007, Tese (doutorado) – Escola Politécnica da
Universidade de São Paulo. [05] BUCALEM, M.L., BATHE, K.J., The Mechanics of Solids and Structures – Hierarchical Modeling and the Finite Element Solution, Cambridge, 2011. [06] ASSOCIAÇÃO BRASILEIRA DE NORMAS TÉCNICAS. Projeto de Estruturtas de Concreto - Procedimento -
NBR 6118, Rio de Janeiro, 2007. [07] TRAUTWEIN, L.M., Punção em Lajes Cogumelo de
Concreto Armado: Análise Experimental e Numérica, São Paulo, 2006, Tese (doutorado) – Escola Politécnica
da Universidade de São Paulo. [08] SCHREPPERS, G.J., FRISSEN, C., KANG, H.J., Prediction of Crack-Width and Crack-Pattern. TNO DIANA BV, Netherlands, 2011. [09] COMITE EURO-INTERNATIONAL DU BETON, CEB-FIP Modelo Code 1990 – Design Code, Lausanne, 1991. [10] BRAGA, W.A. Aparelhos de Apoio das Estruturas,
São Paulo, 1986. [11] ASSOCIAÇÃO BRASILEIRA DE NORMAS TÉCNICAS. Carga Móvel em Ponte Rodoviária e Passarela de Pedestre - NBR 7188, Rio de Janeiro, 1984. [12] ANDRADE, R.G.M., TEIXEIRA, R.M., MENEGHETTI, L.C., BITTENCOURT, T.N., Aplicação de Hierarquia
de Modelos Numéricos para uma Ponte Curva em Concreto Armado. Congresso Brasileiro do Concreto, 53º, Florianópolis, 2011, Anais, Santa Catarina, 2011.