Embed Size (px)
Citation preview
For the latest information, please see http://www.microsoft.com/sql/
Comparing Business Intelligence
Platforms
Microsoft SQL Server 2000 Analysis Services
vs. IBM DB2 OLAP Server 8.1 & Hyperion Essbase 6.5
Thierry D'Hers, Microsoft Corporation
Stacy Vickery, Progressive Strategies
For the latest information, please see http://www.microsoft.com/sql/
The information contained in this document represents the current view of Progressive Strategies, Inc. and Microsoft Corporation on the issues discussed as of the date of publication. Because Microsoft must respond to changing market conditions, it should not be interpreted to be a commitment on the part of Microsoft or Progressive Strategies, Inc., and we cannot guarantee the accuracy of any information presented after the date of publication.
This White Paper is for informational purposes only. Progressive Strategies, Inc. MAKES NO WARRANTIES, EXPRESS OR IMPLIED, AS TO THE INFORMATION IN THIS DOCUMENT.
Complying with all applicable copyright laws is the responsibility of the user. Without limiting the rights under copyright, no part of this document may be reproduced, stored in or introduced into a retrieval system, or transmitted in any form or by any means (electronic, mechanical, photocopying, recording, or otherwise), or for any purpose, without the express written permission of Progressive Strategies Inc.
Microsoft may have patents, patent applications, trademarks, copyrights, or other intellectual property rights covering subject matter in this document. Except as expressly provided in any written license agreement from Microsoft, the furnishing of this document does not give you any license to these patents, trademarks, copyrights, or other intellectual property.
The example companies, organizations, products, people and events depicted herein are fictitious. No association with any real company, organization, product, person or event is intended or should be inferred.
2003 Progressive Strategies, Inc. All rights reserved.
Microsoft, PivotTable, SQL Server, Visual Basic, Windows, and Windows NT are either registered trademarks or trademarks of Microsoft Corporation in the U.S.A. and/or other countries.
The names of actual companies and products mentioned herein may be the trademarks of their respective owners.
Progressive Strategies, Inc., is a leading market and product research and consulting firm that provides hands-on product, services, and website analysis to help our high-tech clients. Based in New York City, Progressive Strategies teams highly regarded technology analysts proficient in hands-on testing of hardware and software products, with business and marketing analysts, to pinpoint tactics for our vendor clients and identify best-in-class solutions for our corporate clients. Microsoft retained Progressive Strategies, Inc. to update this previously published white paper to reflect product updates and changes in the marketplace.
Produced by: Stacy Vickery, Technical Writer: Barry Cohen, Managing Editor
Table of Contents Table of Figures 2 Introduction 1
A Comprehensive Offering 2 Database Architecture 4
Data Storage Options 4
Data Explosion 4
Data Loading, Automating, and Scheduling Database Administration Tasks 6
Real-Time OLAP 6
Caching 6
Managing Dimensions 7
Restructuring Dimensions 7
Loading Data into a Parent 8
Analysis Services Virtual Dimensions Compared with DB2 OLAP Server/Essbase Dimension Attributes 8
Partitioning 9
Virtual Cubes Compared with DB2 OLAP Server/Essbase Partitions 9
Multicube Architecture 10
Database Availability 10
The Meta Data Structure 11
Member Names 11
Rollup 11
Availability of Meta Data to Applications 12
User Writebacks 12
Data Mining 13 Scalability 14
Ability to Scale with Large Volumes of Data 14
Ability to Manage Large Numbers of Users 14
Ability to Manage Large Dimensions 15
Parallelism/Lazy Aggregation 15 Performance 17
Database Tuning 17
Data Load Performance 17
Usage-Based Optimization and Reporting 18
For the latest information, please see http://www.microsoft.com/sql/
Custom Aggregation Design 18
Benchmarks 18 Modeling and Calculation 19
User Interface 19
Calc Script Procedure Compared with Declarative MDX (Calculated Cells, Calculated Members) 19
Outline Formula and Analysis Services Custom Member 19
Custom Level Rollup and Unary Operators 20
Analysis Services Support for Complex Modeling 20
Analysis Services Server Side Cell Attribute Compared with DB2 OLAP Server/Essbase Excel Add-in Style: Conditional Formatting (Color Coding) 20
Delivering OLAP Information to the User 21
Third-Party Tools 21
Excel Integration 21
Web Integration – Thin Client Support 21
Developing Custom Applications 22
Stand-Alone Cubes 22
Client-Side or Server-Side Only Calculations 22
Real-Time OLAP 22
Drillthrough 23
Analysis Services Action Compared with DB2 OLAP Server/Essbase LROs: Drill Across to Other Systems 23
Ease of Use 24
Building the Meta Data 24
Loading and Calculating the Data (Processing) 24
Performance Tuning 25
Security 26
Authentication 26
Cell Level Security 26
Member Level Security 26
Task Level Security 26
Network Traffic 26
Server Operating Systems Supported 27
Databases Supported 27
International Considerations 27
For the latest information, please see http://www.microsoft.com/sql/
Cost of Ownership 28
Product Acquisition 28
Licensing 28
Hardware 28
The Integrated Data Warehousing Solution 28
Development Cycle 29
Product Deployment 29
Product Support 29 Conclusion 30 For More Information 31
Table of Figures Figure 1 OLAP Market Shares 2 Figure 2 OLAP Allocation Methods 13
Comparing Business intelligence Platforms 1
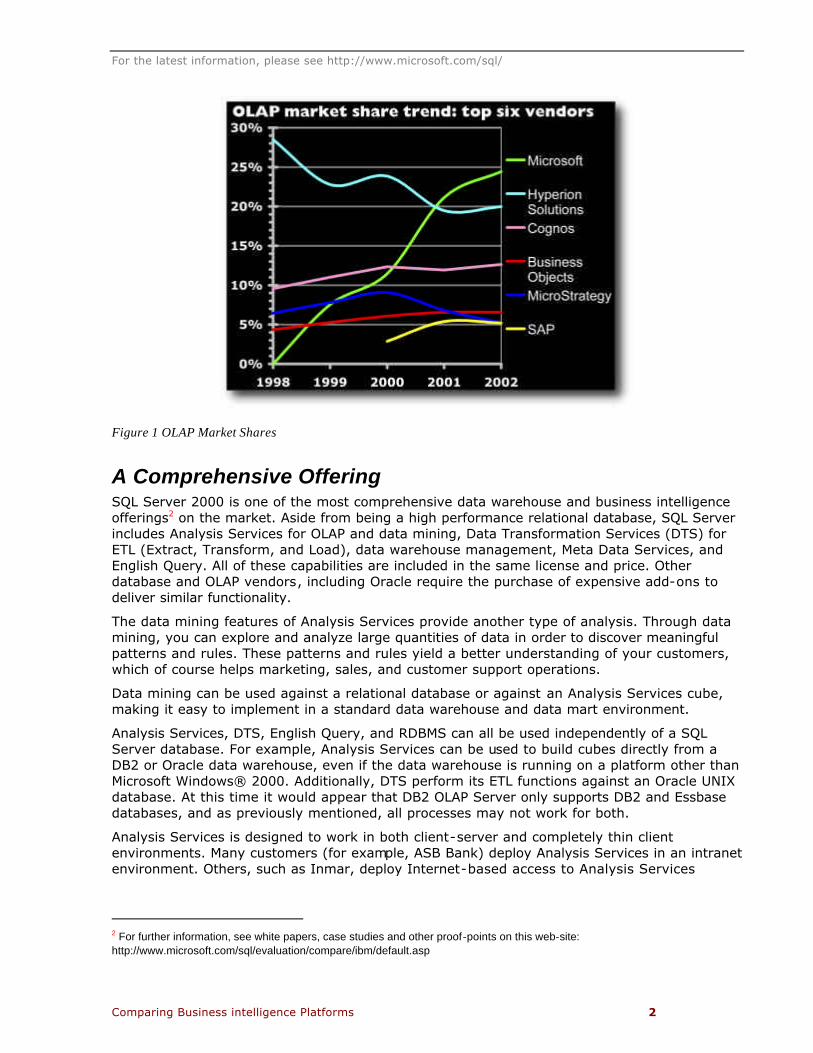
Introduction This white paper compares the features of Microsoft® SQL Server™ 2000 Analysis Services, IBM DB2 OLAP Server 8.1, and Hyperion Essbase 6.5. As you'll learn, Analysis Services has functionality that compares favorably against other offerings such as IBM DB2 OLAP Server 8.1 and Hyperion Essbase 6.5. SQL Server 2000 Analysis Services and Hyperion Essbase 6.5 lead the industry in online analytical processing (OLAP), according to The OLAP Report (www.olapreport.com), and Microsoft has taken a clear lead in the marketplace over Hyperion and the other vendors (Figure 1 OLAP Market Share Page 2). According to The OLAP Report, this lead is sure to increase in 2003. Customers1 such as MGM Mirage, Starbucks Coffee, and Comp USA have adopted Analysis Services to gain competitive advantages in their respective businesses. Numerous independent software vendors (ISVs), including Ascential Software, Brio Software, Cognos, ProClarity Corporation, Sagent Technology, and Business Objects, have implemented solutions on Analysis Services. It is a more modern, flexible, scalable, and usable OLAP database than Essbase or DB2. Some of the greatest benefits of Analysis Services are:
• Scalability, both in terms of the volume of source data contained within a cube, and in the
size and complexity of dimensions
• Closed-loop analysis
• Internet capabilities
• Ease-of-system design and maintenance
• Open application programming interfaces (APIs)
Microsoft first delivered analytical applications through Microsoft Excel, the most popular analytical product on the market. Microsoft entered the OLAP industry with the acquisition of both the Panorama Software Systems technology (the forerunner to SQL Server 7.0 OLAP Services), and key Panorama personnel in 1996. The large number of Microsoft Solution Providers and consultants who develop with Analysis Services and participate in ongoing advancement of Microsoft technologies help to ensure delivery of powerful, open data warehousing capabilities to the widest possible community of business users.
Recognizing that Hyperion’s Essbase product would enable IBM to become competitive in the OLAP market, they licensed the core product from Hyperion and developed DB2 OLAP Server 8.1 around its core functionality. For comparative purposes, there may be discussions throughout the document that pertain to tools which are not part of the DB2 OLAP Server core product and require an additional license to operate. One example is data mining, which IBM sells as the DB2 Intelligent Miner product family. There is also a presumption that some of the limitations that exist within the Essbase core engine exist with DB2 OLAP Server. It should also be noted that while DB2 is shipped with the product, many of the references in their documentation identify tasks specific to Essbase databases, therefore some of what we discuss is only applicable to the Hyperion Essbase product.
1 For further information, see the following case studies: http://www.microsoft.com/sql/productinfo/casestudies.htm
For the latest information, please see http://www.microsoft.com/sql/
Comparing Business intelligence Platforms 2
Figure 1 OLAP Market Shares
A Comprehensive Offering SQL Server 2000 is one of the most comprehensive data warehouse and business intelligence offerings2 on the market. Aside from being a high performance relational database, SQL Server includes Analysis Services for OLAP and data mining, Data Transformation Services (DTS) for ETL (Extract, Transform, and Load), data warehouse management, Meta Data Services, and English Query. All of these capabilities are included in the same license and price. Other database and OLAP vendors, including Oracle require the purchase of expensive add-ons to deliver similar functionality.
The data mining features of Analysis Services provide another type of analysis. Through data mining, you can explore and analyze large quantities of data in order to discover meaningful patterns and rules. These patterns and rules yield a better understanding of your customers, which of course helps marketing, sales, and customer support operations.
Data mining can be used against a relational database or against an Analysis Services cube, making it easy to implement in a standard data warehouse and data mart environment.
Analysis Services, DTS, English Query, and RDBMS can all be used independently of a SQL Server database. For example, Analysis Services can be used to build cubes directly from a DB2 or Oracle data warehouse, even if the data warehouse is running on a platform other than Microsoft Windows® 2000. Additionally, DTS perform its ETL functions against an Oracle UNIX database. At this time it would appear that DB2 OLAP Server only supports DB2 and Essbase databases, and as previously mentioned, all processes may not work for both.
Analysis Services is designed to work in both client-server and completely thin client environments. Many customers (for example, ASB Bank) deploy Analysis Services in an intranet environment. Others, such as Inmar, deploy Internet-based access to Analysis Services
2 For further information, see white papers, case studies and other proof-points on this web-site: http://www.microsoft.com/sql/evaluation/compare/ibm/default.asp
For the latest information, please see http://www.microsoft.com/sql/
Comparing Business intelligence Platforms 3
cubes. Analysis Services is used in many comprehensive business analysis deployments. Several of these deployments involve quite complex financial and budget applications.
The balance of this white paper will compare the functions and features of Analysis Services and DB2 OLAP Server/Hyperion Essbase that are used by fairly common applications.
For the latest information, please see http://www.microsoft.com/sql/
Comparing Business intelligence Platforms 4
Database Architecture Analysis Services wields the greatest advantage over DB2 OLAP Server and Essbase through its database architecture and design. In addition to having a flexible storage architecture, Analysis Services is extremely efficient in managing data aggregations and controlling data explosion. With an easy-to-use partitioning strategy and powerful write-back architecture, Analysis Services offers more robust design than that of DB2 OLAP Server and Essbase.
Data Storage Options Analysis Services has one of the biggest architectural advantages over Hyperion Essbase by offering multiple data storage options. Users can choose from multidimensional OLAP (MOLAP), relational OLAP (ROLAP), and hybrid OLAP (HOLAP) storage. Even better, in terms of administrator management, storage selection is transparent. This storage transparency is seamless for the developer and for the end user. No matter what storage option is selected, Analysis Services handles data requests smoothly.
Analysis Services storage options are listed below:
• MOLAP stores detailed data and aggregations in multidimensional form on the OLAP server.
• ROLAP stores detailed data and aggregations in a relational database.
• HOLAP is a hybrid of the two: aggregations are stored on the OLAP server, but detailed
data is stored in an RDBMS.
The strength and flexibility implied in this design is clear. Cubes can include multiple partitions and each partition can use a different storage option; therefore, one cube may use all three of these storage options. This capability is significant because it provides the following:
• Improved scalability.
• Greater flexibility of data management.
• Real-time OLAP (cubes that automatically and consistently reflect the current information
in the server database without the need for manual updates).
• Flexible storage modes that best suit the business and technical requirements of any data.
Analysis Services ROLAP includes several important new features, including real-time OLAP, indexed views for high performance relational structures, and ROLAP dimensions for handling hundreds of millions of dimension members.
DB2 OLAP Server/Essbase offer hybrid OLAP, which utilizes the combination of Essbase Integration Services and Hybrid Analysis manager to create applications that access the relational data. Hybrid Analysis manager is responsible for generating the query that retrieves the data from the source system.
Data Explosion A common problem with OLAP databases is data explosion. In all OLAP databases, the following circumstances lead to data explosion:
• Storage required by data and indexes
For the latest information, please see http://www.microsoft.com/sql/
Comparing Business intelligence Platforms 5
• Storage devoted to empty cells
• Storage devoted to aggregations
Analysis Services architecture directly addresses each of these potential sources of data explosion by:
• Efficiently compressing data
• Not storing empty cells
• Prior computing of aggregations, flexibly and intelligently
These techniques effectively reverse data explosion. While other OLAP products wrestle with data explosion, Analysis Services cubes typically see data implosion: cubes including atomic data, indexes, and aggregations that are significantly smaller than the source data from which they are built. Explosion is not necessarily a serious concern for small databases, but it can create very serious problems in larger ones.
Moderate to extensive data explosion is typical in Essbase, with a ratio of 10:1, to as much as 1,000:1, based on the source data. In the versions of Essbase prior to Essbase 5.0, most data, if not all, was usually pre aggregated and stored. This meant that the databases created by Essbase were always much larger than the original data set. The architecture in Essbase 5.0 was somewhat enhanced so areas could be calculated in memory at query time rather than pre calculated. As a result, data explosion in Essbase 5.0 was marginally reduced, but not eliminated.
DB2 OLAP Server and Essbase have somewhat improved management of the explosion problem. In order to guarantee excellent query performance, most current Essbase databases compute a large number of aggregations prior to query time, leaving only the simplest aggregations to be calculated at the time of query. It is still common to expect fairly significant data explosion after a DB2 OLAP Server/Essbase database has been calculated. In the best-published results, Essbase required 347 megabytes (MB) to aggregate 48 MB of source data.
In the DB2 OLAP Server/Essbase architecture, data is stored based on an algorithm using dense and sparse dimension settings. A cell is created for every combination of the dense dimensions and a block is created for every combination of the sparse dimensions. By default, a bitmap compression algorithm is used to compress the blocks as they are stored to disk. (The user has the option to change this to run-length encoding (RLE) or turn off compression.) All nonempty cells are stored; each can take up to eight bytes. Additionally, each block contains a 72-byte overhead, and a bitmap that also must be stored. Depending on the settings and the database, areas for which there may not be data, often have storage allocated in the database.
Analysis Services architecture is an improvement in this area as it only allocates storage if there is data to store. By combining multiple compression algorithms and storing a completely dense cube, the results are small cubes relative to source data size. Not only does this make the cubes more deployable, it greatly improves query times while significantly reducing load times.
Intelligent aggregation design and usage contribute to effective storage in Analysis Services. For example, suppose a time dimension consists of a Year-Quarter-Month hierarchy. Further suppose that aggregations by Quarter are pre calculated and aggregations by Year are not. When a given query asks for Year totals, the server will not access detailed data. Instead, it will use the aggregations by Quarter to satisfy the query. This means that outstanding query performance can be realized by creating relatively few pre-aggregations.
For the latest information, please see http://www.microsoft.com/sql/
Comparing Business intelligence Platforms 6
Until recently, a 50 GB cube was considered large. Analysis Services is dramatically redefining large by delivering efficient cubes based on hundreds of GB of data. The Analysis Services cubes are typically one-third to one-fifth the size of the original data set size. Using the same data set, a DB2 OLAP Server/Essbase cube is 30 to 5,000 times larger than an Analysis Services cube.
In a recent test, 1.2 terabytes (TB) of non-indexed source data, including 7.7 billion fact rows, was all stored and aggregated in a single Analysis Services cube. Queries returned with sub-second response times and the resultant cube size was 416 GB, one-third the size of the original data set.
Data Loading, Automating, and Scheduling Database Administration Tasks Analysis Services takes advantage of Data Transformation Services (DTS), which provides automated, scheduled database administration. DTS is a graphical, easy-to-use workflow component available in SQL Server 2000. Scheduling routine updates to a data warehouse, to OLAP cubes, or to data mining models is just one of the many uses of DTS.
Administration Services are a part of DB2 OLAP Server, and allow the administrator to manage, administer and maintain multiple OLAP servers via a GUI interface through the Administration Server.
Real-Time OLAP Real-time OLAP refers to an implementation in which data resides on the relational server and is not loaded into the OLAP environment. With real-time OLAP, Analysis Services delivers excellent performance even with very large cubes, as long as partitions are well designed, multiple storage methods on different partitions are used, and indexed views are applied.
Real-time OLAP in Analysis Services opens up the possibility of new and exciting types of analytical applications such as call-center analysis or stock market analysis, where the data has to be current all the time. DB2 OLAP Server/Essbase does not currently have an equivalent feature.
Caching DB2 OLAP Server/Essbase and Analysis Services use caches extensively to improve performance, but for different purposes. The main differential is how each is used.
Analysis Services uses primarily client and server caches to store query results. These caches are not based upon simple FIFO or LIFO rules rather, Analysis Services caches intelligently refresh data based on how often a dataset is requested. Specifically, as queries are performed, the result sets in the client and server caches are examined and used before the data source is touched. If a client requests information that can be solved by data already stored in the client cache, there is no network activity. Thus, Analysis Services query performance is greatly enhanced by both the client and server caches.
Client-side caching usually reduces server activity and network traffic, and improves query performance. However, Analysis Services provides administrators the additional flexibility of completely disabling the client-side cache.
In DB2 OLAP Server, there are four memory cache settings: calculation, index, data, and data file cache. Data file cache is used if I/O is configured direct instead of using buffered I/O. In DB2 the amount of memory allocated is assigned manually. Optimizing the configurations for
For the latest information, please see http://www.microsoft.com/sql/
Comparing Business intelligence Platforms 7
these different caches is vital for good system performance, yet doing so requires great expertise. In DB2 OLAP Server/Essbase, there is no client-side caching, and therefore, no opportunity to take advantage of powerful desktop computing. Every client operation results in a roundtrip to the server, which can greatly increase network traffic. With DB2 OLAP Server, the hit ratios of index cache, data cache and data file cache can be monitored, which is an indication of the complexity involved in manually allocating cache.
For their mobile, disconnected users, many organizations seek to incorporate powerful analytical capabilities into applications that can be used anywhere. This enhanced functionality is not possible with DB2 OLAP Server/Essbase, nor is Hyperion likely to implement such a solution given their strong stance on server-side only computing.
Managing Dimensions As a result of data explosion, DB2 OLAP Server/Essbase has a limited number of dimensions that it can realistically handle. While Essbase has no documented limits, performance considerations limit the typical Essbase database to eight to ten dimensions. Although this is adequate for many applications, users frequently require more than ten dimensions. Because of this limitation, developers are forced to omit less-than-critical dimensions. Another typical workaround is for multiple dimensions to be combined artificially into a single dimension, a technique that makes cross-dimensional analysis impossible. DB2 OLAP Server/Essbase reduces this problem by the introduction of a new dimension type to support attribute information. This new type of dimension is discussed further in the section entitled “Analysis Services Virtual Dimensions Compared with Essbase Dimension Attributes.
Analysis Services outperforms DB2 OLAP Server/Essbase in this area. It is capable of handling up to 128 dimensions, or 256 levels in a single cube, a capacity that is vital for certain types of analysis (for example, survey results analysis). Large numbers of dimensions do not hinder the performance of Analysis Services, due to efficient storage architecture. This is extremely useful when analyzing data using different customer attributes or less critical dimensions that are not typically included in an Essbase cube.
Analysis Services supports ragged, asymmetrical, and parent-child dimensions. Ragged, asymmetrical dimensions are dimensions that contain holes in their levels and for which leaf members are not necessarily all at the same depth from the root. Product, Organization, and Geography dimensions are commonly ragged, asymmetrical dimensions.
Analysis Services supports very large dimensions, many times larger than the numbers DB2 OLAP Server/Essbase supports. Essbase brought many improvements in this area and now claims to support dimensions with up to one million members. However, Analysis Services effectively supports MOLAP dimensions of over ten million members and ROLAP dimensions of hundreds of millions of members. For more information, see “Large Dimensions and Very Large ROLAP Dimensions” in this paper.
Restructuring Dimensions Some OLAP applications require that the OLAP administrator, or even a small set of business people, be able to change the structure of a dimension by adding, deleting, moving, or renaming members. DB2 OLAP Server/Essbase provides this functionality, but with two major complications:
• The database must be restructured after the edit, a potentially lengthy process during
which the cube is unavailable for querying (users must be disconnected from the cube).
For the latest information, please see http://www.microsoft.com/sql/
Comparing Business intelligence Platforms 8
• The dimension edit is not propagated back to the source database, and this can lead to
referential integrity problems upon future cube processing.
The Analysis Services implementation of this feature avoids many of these problems. When a dimension is modified and saved by the administrator in Analysis Services, the database immediately reflects the change without having to reprocess the cube. End users, therefore, immediately see the impact of the dimension change which enables very powerful real-time simulation and modeling applications. Users can also continue to query the database during edits made by the administrator.
Secondly, dimension changes are immediately propagated back to the source system. The source system and cube are always synchronized, therefore automatically eliminating any referential integrity problems.
Loading Data into a Parent While most cubes load data into the most atomic level of a cube, there are applications for which it is necessary to load data into a parent or nonleaf member. A classic example is salary data for an organization, where a parent (the manager of other employees) has data associated directly with it (the manager’s own salary.)
Both DB2 OLAP Server/Essbase and Analysis Services support this functionality, but again, Analysis Services avoids serious issues Essbase encounters. Data can be entered at a nonleaf level in Essbase, but this data overwrites and replaces the aggregation or calculation result defined for this member. In contrast, the Analysis Services administrator can select whether the data entered for nonleaf member(s) should replace or be added along with other child values. This offers great flexibility for any type of business scenario.
Analysis Services Virtual Dimensions Compared with DB2 OLAP Server/Essbase Dimension Attributes In addition to handling more dimensions than DB2 OLAP Server/Essbase, Analysis Services supports virtual dimensions. Virtual dimensions are created in memory based on member properties. For example, in a company that sells toys, each product SKU might have a color associated with it. Perhaps there is a need to compare the performance of one color versus another. Analysis Services allows this type of member property to be treated as a dimension. Virtual dimensions, unlike regular dimensions, do not require processing or additional disk space. This is another effective way in which Analysis Services adds additional analytical dimensions to an application, without exploding the data.
DB2 OLAP Server/Essbase added Dimension Attributes to provide limited virtual dimension functionality. Essbase Dimension Attributes must be based on a dimension that is tagged as sparse. This can be a problem because some dimensions have to be tagged dense to use dynamic calc member and reduce data explosion. The customer is then forced to choose between reducing the data explosion problem and supporting dimension attributes in the cube. Further, the Essbase Dimension Attribute can only be based on a single level of a dimension, in contrast with the far more flexible implementation offered by Analysis Services.
Another limitation of the DB2 OLAP Server/Essbase dimension attribute is that there is no way to automate the association of an attribute member to a dimension member. This limitation is a problem when dealing with large dimensions with hundreds of thousands of members. The manual association is cumbersome; in practice, Essbase Dimension Attributes are maintainable only for small dimensions.
For the latest information, please see http://www.microsoft.com/sql/
Comparing Business intelligence Platforms 9
Partitioning Both DB2 OLAP Server/Essbase and Analysis Services contain features called partitions, used for two distinct purposes with different architecture and design. In both Essbase and Analysis Services, partitions are a physical data storage mechanism invisible to the user. In both products, partitioning optimizes performance by distributing the processing. For example, in both DB2 OLAP Server/Essbase and Analysis Services, a second partition might reside on a second server, yielding better performance by using the extra processing power of the multiple machines. Partitions are also useful in facilitating data archiving and dropping tables from the database.
In DB2 OLAP Server/Essbase, a partition links two separate databases (or cubes, in Analysis Services terms). Analysis Services partitions are used within a single cube. The Essbase partitioning strategy is more akin to the use of virtual cubes in Analysis Services. For more information about Essbase partitioning, see “Virtual Cubes Compared with Essbase Partitions” in this paper.
In Analysis Services, partitioning enables scalability while maintaining excellent query and processing performance. An unlimited number of partitions can be used in any one cube, and each partition can have a different storage option and a different setting for how many pre-aggregations are performed. Again, with Analysis Services, partitions can reside on multiple computers and thus scale with the growing needs of a business.
Partitions are also useful when only one partition must be updated at a time. For example, consider a budgeting application that performs budgets regionally. If a partition is created for each geographic region and the data for the region is entered at different times, only the latest region loaded requires processing. Other regions can remain untouched. This is similar to Essbase's ability to perform intelligent calculations (calculations on only the data that has changed), without having to worry whether the blocks have been correctly designated as dirty or clean.
Partitions effectively manage incremental updates to a cube. As each new month of data is added to the cube, a new partition can be created and an incremental update performed. This ensures optimal processing performance. Partitions created to facilitate fast, incremental updates can be merged into the main partition at a later time if desired. Analysis Services provides an incremental update wizard that creates the partition, loads it, and merges it back into the main partition automatically. Users can continue to use the database during incremental updates.
Virtual Cubes Compared with DB2 OLAP Server/Essbase Partitions Virtual cubes in Analysis Services allow one or more cubes, which share at least one dimension in common, to be combined into a virtual cube. Virtual cubes in Analysis Services are much more powerful and flexible than the DB2 OLAP Server/Essbase partitioning strategy.
In Analysis Services, virtual cubes do not replicate the data, but rather create a virtual view of the data. There is no processing or data storage penalty when using virtual cubes. Nor do virtual cubes require that all dimensions be exactly the same.
In DB2 OLAP Server/Essbase, there are three types of partitions: replicated, transparent, and linked. With the exception of linked partitions, DB2 OLAP Server/Essbase requires that the two linked cubes share the same dimensions, but not necessarily the same levels or names in the dimensions. Therefore, meta data synchronization is required. (Shared dimensions in Analysis Services ensure meta data synchronization between cubes without additional processing.)
For the latest information, please see http://www.microsoft.com/sql/
Comparing Business intelligence Platforms 10
In a replicated partition in DB2 OLAP Server/Essbase, data is actually copied from one database to another through a batch process. Therefore, the partition is not linked in real time. Given the data explosion factor for Essbase, this type of partition can be effective, although it requires additional data storage. This is similar to creating a copy of an Analysis Services cube that uses shared dimensions, and then disabling some levels in the copy. Again, the Essbase data will be processed in both cubes, and, in some circumstances, can be beneficial.
In a transparent partition in DB2 OLAP Server/Essbase, data is not replicated, but transparently linked at a logical level. This is comparable to virtual cubes in Analysis Services. A user browsing a cube that has a transparent partition might actually drill down into a second cube without realizing it. Essbase transparent partitions have performance and maintenance issues that limit their usefulness. Because transparent partitions simply link two cubes, data synchronization issues can occur. If a detailed cube is updated and calculated and the transparently linked summary cube is not updated, it is possible for the data to get out of synch. This can be addressed by ensuring all aggregations of transparently linked partitions are performed dynamically. This option solves the synchronization issue, but can result in severe query performance issues.
DB2 OLAP Server/Essbase linked partitions transport the user, rather than the data, from a source to a target database. Users who encounter a linked cell can drill into a second database. This option is not transparent to a user, because a second spreadsheet opens to show the new cube. The advantage of this option is that the two databases do not need to share dimensional structures, nor does meta data synchronization need to occur. The disadvantage is that data synchronization issues can still occur if processing schedules between the two databases are not aligned. Virtual cubes in Analysis Services provide a much more seamless integration than linked partitions.
Multicube Architecture Analysis Services has true multicube architecture, whereas Essbase is limited by its single cube architecture.
Analysis Services allows multiple cubes to be defined for your application to create a more comprehensive solution. In addition, cubes can be joined together using virtual cubes, as long as both cubes contain at least one shared dimension. By joining cubes, users can view the data in many different ways using any of the combined dimensions available.
DB2 OLAP Server/Essbase allows only a single cube to be defined in an application. A user must resort to implementing strange and slow workarounds to gain access to data from other cubes, using the Xref calc script function (Analysis Services supports a similar but more powerful function under the name LookupCube). The single cube architecture of Essbase makes it very difficult to manage an application consisting of multiple cubes, because the administrator must constantly ensure that the dimensions in the various cubes are always in sync.
Database Availability SQL Server 2000 Analysis Services was designed for a 24x7 operation. All data loading, updating, aggregation and calculation are done in an isolated transaction. This allows:
• Data in existing cubes to be available to users during processing.
• Cubes to be rolled back automatically should processing fail or be terminated.
For the latest information, please see http://www.microsoft.com/sql/
Comparing Business intelligence Platforms 11
A DB2 OLAP Server/Essbase database in the process of being exported, restructured, or copied, is unavailable to users. Although databases are available during calculation, the underlying data is changing. This is often confusing to users; thus, administrators usually make the databases unavailable while performing calculations. This DB2 OLAP Server/Essbase limitation forces administrators to struggle with completing the updates within an update time window (usually very late at night) when users cannot access the data. For global businesses, however, no such window is available because of time zone differences, and unavailable data is simply unacceptable.
The built-in isolation and transaction support of Analysis Services ensures continuous 24x7 availability of the data, even under the most extreme modifications to the data itself, or to the structure and definitions of the cubes.
The Meta Data Structure There are several key differences in the way in which meta data is managed in Essbase and Analysis Services. Specifically, the following areas are handled differently:
• Member name uniqueness
• Level symmetry
• Rollup functionality within the meta data
Member Names DB2 OLAP Server/Essbase requires a unique name for each member of a cube. For instance, a region and a sales rep cannot both be named “West”, even though they are members of different dimensions. Accordingly, you must implement elaborate prefixing schemes in order to ensure member uniqueness. This adds a degree of complexity to the data-loading process, as the user must now view somewhat confusing prefixes attached to names that had been familiar.
Analysis Services does not have this limitation. A member can be repeated within the same level of the same dimension, so long as the duplicate members have different parents. This flexibility in Analysis Services greatly simplifies the data loading process.
Rollup Meta data in DB2 OLAP Server/Essbase is consolidated in the outline based on designated unary operators. Essbase allows members to be added, subtracted, multiplied, divided, or unaggregated when calculating the parent level. This is particularly effective in financial applications, and most often used on the measures dimension. Profit and loss statements can be recreated by using hierarchies and unary operators to create most members.
Analysis Services offers similar outline functionality with the support of a similar set of unary operators (+, -, /, *, ~).
In addition, Analysis Services supports a native measures dimension oriented towards traditional data warehousing applications. The measures are aggregated uniformly across all of the other dimensions using one of five aggregation methods (SUM, COUNT, DISTINCT COUNT, MIN, and MAX), and allowing the use of Multidimensional Expressions (MDX) to accomplish sophisticated calculations such as time series analysis, semi-additive measures, and basket analysis. The DISTINCT COUNT aggregation, which is essential in market basket and Web click stream analysis, is available only in Analysis Services.
For the latest information, please see http://www.microsoft.com/sql/
Comparing Business intelligence Platforms 12
Availability of Meta Data to Applications Analysis Services maintains a rich set of meta data and fully exposes it to outside applications in the published object models. Most Essbase meta data is unavailable to outside applications. There is no associated API for Essbase load rules. The customer is locked within the user interface of the Essbase Load Rules. In contrast, by using Decision Support Objects (DSO), third-party software providers and customers can easily write a custom administration or loading facility for Analysis Services.
User Writebacks Most OLAP cubes are read-only, meaning users can query and view data but cannot change it. Typically, Budgeting and forecasting applications require user writebacks. DB2 OLAP Server/Essbase and Analysis Services both support user writebacks at any level of a dimension. Analysis Services goes further by providing immediate access to correctly aggregated data.
In Essbase, when data is locked and sent to the database, the database literally locks the cells that will be updated and writes over the existing data with the new data. This architecture ensures that two users will not overwrite each other's work. After the data is updated, the new aggregations are not available until the database has been recalculated. Therefore, if another user drills down right after the data is updated but before it has been calculated, the summary data will be in sync with the details.
Although an audit trail can be turned on using Essbase.cfg, the user interface for this task is not simple. To maintain an audit record of updates, the Essbase.cfg file must be created and the essaudit parameter must be included in the file. After it is created, the audit trail is only available as a text file, making it difficult to query.
In Analysis Services, when a user writes data back to the database, the delta is loaded into a write-back table. This audit trail allows you to track and query changes without having to make additional changes in your configuration. Since aggregations are performed in memory at query time, the aggregated data is immediately available and consistent for all users. This is extremely useful in budgeting applications when users are performing what-if analyses. Moreover, the audit log facility has a unique ability that allows an administrator to roll back changes made by the users. The addition of indexed views to SQL Server 2000 greatly enhances the performance of the write-enabled cubes.
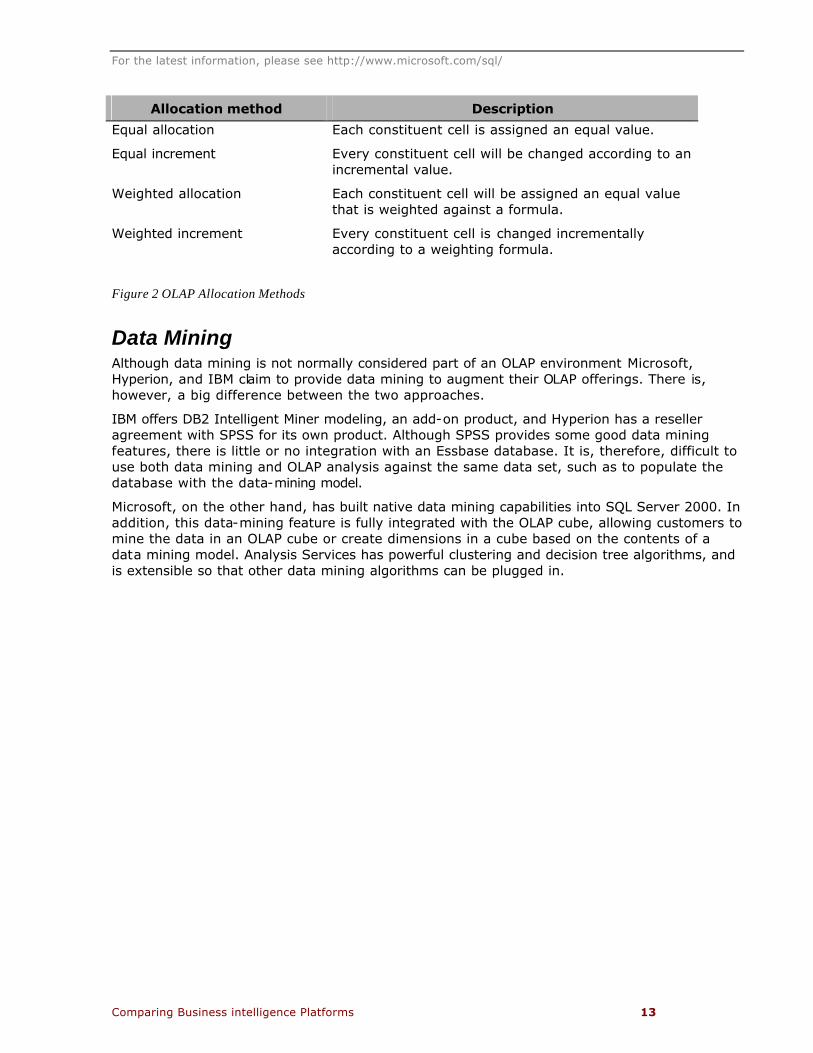
Analysis Services provides an advanced facility, UPDATE CUBE, to support operations that are applied to the data as it is written back to the cell. The default behavior causes data to be written back directly to a cell. Four other options enable non-atomic data to be allocated to atomic cells when the data is committed.
When the value of a non-atomic cell is changed, the cells that contribute to that cell need to be updated to avoid inconsistent data within the cube. The UPDATE CUBE statement provides this facility. The new value of a non-atomic cell must be allocated among all of its constituent cells. The administrator determines the method by which this allocation is made at design time. The following table describes these allocation methods.
For the latest information, please see http://www.microsoft.com/sql/
Comparing Business intelligence Platforms 13
Allocation method Description
Equal allocation Each constituent cell is assigned an equal value.
Equal increment Every constituent cell will be changed according to an incremental value.
Weighted allocation Each constituent cell will be assigned an equal value that is weighted against a formula.
Weighted increment Every constituent cell is changed incrementally according to a weighting formula.
Figure 2 OLAP Allocation Methods
Data Mining Although data mining is not normally considered part of an OLAP environment Microsoft, Hyperion, and IBM claim to provide data mining to augment their OLAP offerings. There is, however, a big difference between the two approaches.
IBM offers DB2 Intelligent Miner modeling, an add-on product, and Hyperion has a reseller agreement with SPSS for its own product. Although SPSS provides some good data mining features, there is little or no integration with an Essbase database. It is, therefore, difficult to use both data mining and OLAP analysis against the same data set, such as to populate the database with the data-mining model.
Microsoft, on the other hand, has built native data mining capabilities into SQL Server 2000. In addition, this data-mining feature is fully integrated with the OLAP cube, allowing customers to mine the data in an OLAP cube or create dimensions in a cube based on the contents of a data mining model. Analysis Services has powerful clustering and decision tree algorithms, and is extensible so that other data mining algorithms can be plugged in.
For the latest information, please see http://www.microsoft.com/sql/
Comparing Business intelligence Platforms 14
Scalability Because scalability is a broad category, this paper focuses on five main components:
• The ability to scale with large volumes of data
• The ability to handle large numbers of users
• The ability to support large dimensions
• Parallelism
• Support for analysis of click stream distinct count
Analysis Services provides considerable advantages in these areas
Ability to Scale with Large Volumes of Data Analysis Services can handle large database volumes, primarily due to three key architectural features: flexible data storage, partitioning, and the storage algorithm that prevents data explosion. Microsoft has implemented a MOLAP cube based on 1.2 TB of real-world data, including loading all 7.7 billion fact rows and 840,000 members in the largest dimension, resulting in exceptional performance on a single 8-way server. The resultant cube was 416 GB in size and the loading time was only 36 hours.
Essbase and IBM have also claimed implementation of a one TB cube, but this was just a small Essbase database (only one percent or roughly 10 GB of the raw data was loaded in Essbase) with drill-through to a terabyte DB2 data warehouse. Although they achieved good performance with 100 users, it took 32 four-way servers to accomplish this.
Unlike Essbase, Analysis Services can store one cube in partitions on multiple servers. This allows a single, more manageable cube and takes advantage of the parallel processing and the storage capacity of multiple servers. Aggregation and storage settings are also more flexible, being defined at the partition level. In addition, the cube can handle more dimensions than DB2 OLAP Server/Essbase because the data explosion issue does not impact an Analysis Services cube as it does with Essbase. With DB2 OLAP Server, parallel processing can be enabled, allowing the administrator to allocate the appropriate number of threads.
Ability to Manage Large Numbers of Users Analysis Services is a true client/server application. As such, it takes full advantage of the processing power on both the desktop and server computers. Individual users have a marginal impact on the server load, while the client cache helps reduce network traffic by eliminating many query requests that come in over the network.
DB2 OLAP Server/Essbase can also accommodate a large numbers of users, but it does not take advantage of client caching or client-side processing. This is a double-edged sword. If the client computers are not robust, this can work in favor of Essbase. If clients are robust, Analysis Services is better able to leverage the distributed processing power. Another significant advantage for users of Analysis Services is the ability to conduct offline analysis in a mobile environment.
Security is another important consideration in managing large numbers of users. Analysis Services provides integrated security with Microsoft Windows NT® and Windows® 2000 and Internet Information Services (IIS). Roles can be created and assigned to cubes or virtual
For the latest information, please see http://www.microsoft.com/sql/
Comparing Business intelligence Platforms 15
cubes. Analysis Services in SQL Server 2000 provides a user interface that makes it much easier to administer security, including on cells and dimension members. A distinct advantage of creating a partitioned single cube across multiple servers is that the administrator only needs to administer user roles on the single cube. Integration with Windows security ensures that the same security model is automatically applied to all partitions in that cube regardless of location.
Although DB2 OLAP Server/Essbase provides a user interface for administering cell security, it is cumbersome when managing large user communities. Many Essbase customers use the Essbase API to program custom security administration interfaces. Managing user roles across partitions in Essbase requires the administrator to manage them on each server, for example changing Essbase user passwords on a regular basis. You cannot synchronize user roles automatically and Essbase does not support dimension member security, as does Analysis Services.
Ability to Manage Large Dimensions Analysis Services effectively manages very large dimensions, largely due to the storage architecture preventing data explosion. According to the product documentation for DB2 OLAP Server/Essbase should be able to handle one million members in a dimension. However, few clients are working with greater than 100,000 members in an Essbase dimension today.
Analysis Services has been able to support dimensions as large as three million members since its first release (SQL Server version 7.0). With SQL Server 2000, Analysis Services can now effectively support dimensions of up to 10 million members when using MOLAP to store the dimension. Hundreds of millions of members can be supported when using ROLAP to store the dimension. A ROLAP dimension stores the lowest dimension level in the relational database and does not load it into memory. It is not as efficient as a MOLAP dimension, but it can scale as large as the relational database can scale. In the Microsoft lab, an 80-million member dimension was created and queried with very reasonable response time (under 10 seconds).
To ensure that users can navigate these very large dimensions (imagine a user drilling down to a list of one million members in Excel), the system supports a unique feature that groups members into a directory system, similar to page headers in a phone book. This feature greatly simplifies the navigation of these members.
Parallelism/Lazy Aggregation IBM, Microsoft and Hyperion offer enterprise editions of their OLAP servers with advanced scalability and parallelism options. For example, Analysis Services and Essbase both take full advantage of multiprocessors. Also, Windows 2000 brings robust scalability to the platform of the OLAP solution. Approximately 80 percent of Essbase implementations are on a Windows platform.
In addition to taking advantage of the multiprocessor, Analysis Services also supports a new option called lazy aggregation. Lazy aggregation is useful in providing information more rapidly to the user while performing an update to the database. In DB2 OLAP Server/Essbase, when the administrator loads new data or performs a restructure of a database, it is not accessible for user queries until the reprocessing is completed. With Analysis Services, a database being processed is still available for user queries. While the new data being loaded and processed is released to the user when the process is complete, the users can still query the old data.
An application that needs to minimize the lag time before users are presented with updated data would use the lazy aggregation option. This option releases the new data immediately after being loaded and before all the optimization tasks (preaggregated cells) have been
For the latest information, please see http://www.microsoft.com/sql/
Comparing Business intelligence Platforms 16
completed. These optimization tasks are being completed in the background while users query the updated data. The amount of time required to present the updated data to the users is shortened significantly.
Analysis Services never stops serving the users. Even during these intensive maintenance tasks, users can still query the database. Unlike DB2 OLAP Server/Essbase, the database is always available.
For the latest information, please see http://www.microsoft.com/sql/
Comparing Business intelligence Platforms 17
Performance Experienced Essbase administrators know that a significant amount of time is spent tuning the database. There are three key areas IBM DB2 OLAP Server/Essbase administrators focus on improving: data load performance, data calculation performance, and query performance. Analysis Services has revolutionized the process of performance tuning in all of these areas by using a series of user-friendly, powerful wizards.
According to publications from Hyperion, the only reasonable approach to tuning and optimizing an OLAP environment is to employ experts to hand-tune the server. The same can be said about implementing DB2 OLAP Server, as the product user guide is over 400 pages in length. Additionally, many of the tuning that the administrator needs to do must be done using commands. This is in stark contrast to Microsoft’s position of employing technology in the form of easy-to-use, yet sophisticated algorithms, or wizards that eliminate the need for expensive consultants, reducing the chances of misconfiguration. Microsoft’s philosophy is that valuable resources should be spent on meeting user requirements, rather than attending to the technology in order to achieve acceptable levels of performance.
Database Tuning In DB2 OLAP Server/Essbase, database tuning requires extensive knowledge of the underlying architecture. Understanding density and sparsity is a must when determining the optimal database settings for the outline. Although Essbase can recommend a dense/sparse setting based on the type of dimension, often this setting is not optimal. Users use estimating assumptions and algorithms to calculate the size and number of potential blocks before they calculate the database.
After the database has been calculated, DB2 OLAP Server/Essbase provides a series of database statistics to help users optimize their databases. These statistics provide valuable information, but a user must have deep product expertise to make use of all the statistics and settings. Because the optimization is dependent on many different settings (density, sparsity, cache settings, compression algorithms), some amount of trial and error is required. Often, weeks are spent tuning the database.
Analysis Services has simplified the initial tuning process by providing the Storage Design Wizard. This wizard graphically presents the tradeoff between database size and query performance. It uses advanced algorithms to determine where aggregations will have the greatest impact on query performance. These aggregations are precalculated and stored while the others are calculated in memory at query time. Aggregations are easily tuned based on users’ actual use of the database.
Data Load Performance Data load performance is an issue with very large databases. In DB2 OLAP Server/Essbase, performance considerations require the data load file to be structured so a block does not need to be swapped in and out of memory numerous times. Again, users must have thorough understanding of the dense/sparse settings, along with the data file structure. If the system needs to use a rules file to manipulate the data file (for example, to add prefixes to ensure uniqueness) data load performance is even further degraded, to the extent that large data loads cannot use rules files. Instead, external data transformation tools must prepare the data for loading.
For the latest information, please see http://www.microsoft.com/sql/
Comparing Business intelligence Platforms 18
Analysis Services is designed to load data from any data source. The most effective practice is to source a cube from a relational dimensional schema: both star and snowflake schemas work well. With clean and well-structured source data, the Analysis administrator can turn off the default referential integrity checking, and the load can proceed very quickly.
SQL Server 2000 Data Transformation Services (DTS) provides an integrated mechanism for transforming and loading data from a variety of sources.
Usage-Based Optimization and Reporting Analysis Services provides usage-based optimization, which allows a cube to be preaggregated based on actual query patterns. A query log maintained by the server collects a sample of user queries specified by the database administrator (DBA). A wizard-driven interface allows aggregations to be implemented based on various criteria applied against the contents of this log. For example, queries can be optimized based on a given user or user group, or optimized for all queries that take more than n seconds to execute. This easy-to-use feature delivers outstanding query performance while minimizing data explosion. By adding to or replacing the existing aggregations with the new ones, the DBA can easily manage performance to support an evolving workload.
In addition to providing usage-based optimization, Analysis Services includes a variety of usage-based reports. These reports provide an excellent mechanism for tracking and analyzing query performance on live applications. This is an invaluable feature when designing future enhancements to existing cubes.
Essbase offers no equivalent feature.
Custom Aggregation Design In addition to the wizard and the usage based optimization feature, Analysis Services also provides a means to select and programmatically create individual aggregation nodes. If the administrator knows exactly which aggregation needs to be created in order to improve performance for specific queries, the DSO API offers all the functions to create them.
DB2 OLAP Server/Essbase offers no equivalent feature.
Benchmarks Hyperion implemented the ABP-1 benchmark and a few results have been posted, most recently in April 1999. This loss of interest in APB-1, by Hyperion and the remainder of the OLAP vendors, validates Microsoft’s position that this benchmark was not a valid measure of OLAP performance. In addition, the benchmark was designed in such a way as to completely prevent OLAP Services (as Analysis Services was called in SQL Server version 7.0) from running it.
Proof-of-concept projects that compare and contrast each product is a more direct way of determining how an OLAP product will perform for a given customer.
For the latest information, please see http://www.microsoft.com/sql/
Comparing Business intelligence Platforms 19
Modeling and Calculation
User Interface Both products have a strong editor for outline/metadata management. Analysis Services offers many wizards throughout the product. These wizards introduce complex concepts in an easy to understand way and help novices come up to speed on the product quickly. Even experts find some of them useful as online checklists in order to make sure all steps completed successfully. Wizards are available to assist in setting up dimensions, designing cubes, designing aggregations and storage, creating virtual dimensions and a myriad of other modeling tasks. Analysis Services also offers a wizard to assist the administrator in defining cell calculations.
Calc Script Procedure Compared with Declarative MDX (Calculated Cells, Calculated Members) Neither calc scripting (DB2 OLAP Server/Essbase) nor developing calculated members or calculated cells (Analysis Services) are exceptionally intuitive. Both tools require learning a new language however; Analysis Services has some key advantages in this area.
In Essbase, calc scripts are written in a proprietary language. A strong understanding of data blocks and how they are created is necessary to perform effective calculations in Essbase. In Analysis Services, calculations are created using MDX. For people familiar with other Microsoft programming languages, such as Visual Basic®, the MDX syntax is not hard to learn.
One of the biggest advantages of creating calculations in Analysis Services is that they are calculated in memory and do not require processing. This makes troubleshooting MDX expressions somewhat easier than debugging calc scripts. When debugging calculated cells, users are debugging just the calculation, not the server optimization settings.
After receiving feedback from customers, Microsoft implemented calculated cell and Multipass order capabilities in order to support advanced complex modeling scenarios (such as Forecasting, Budgeting, and Goal Seeking). Users or administrators can define an MDX formula for a cell or group of cells, and save the definition as calculated cells. Multipass enables users to define iterative calculations that reference themselves.
Other key advantages are the functions available to MDX expressions. Analysis Services includes Visual Basic and Excel function libraries for use in creating MDX expressions. Because many users are comfortable and familiar with these functions, Analysis Services calculations are easy to read and can provide powerful functionality. Users can also create their own user-defined functions extending the available functions even further.
Finally, MDX is becoming the standard syntax for querying multidimensional databases. Seven other OLAP databases can already be queried using MDX expressions: TM1, SAS, SAP, Whitelight, Silvon, Harmony, NCR, and Seagate.
Outline Formula and Analysis Services Custom Member In both products, members of a dimension can be associated with a formula that defines how these members are evaluated.
For the latest information, please see http://www.microsoft.com/sql/
Comparing Business intelligence Platforms 20
Custom Level Rollup and Unary Operators Both Analysis Services and Essbase support a Unary operator associated with members, to customize the way member values are rolled up to their parent.
Analysis Services also permits an MDX Formula to be defined once for a specific level and be applied for all members of this level. This feature greatly increases the maintainability of a complex analytical cube.
Analysis Services Support for Complex Modeling Essbase prides itself on its strength in the high-end financial analysis arena. Analysis Services supports the same complexity of modeling and calculation, including these types of calculations:
• Allocation
• Currency conversion
• Goal seeking
• Forecasting
SQL Server 2000 Analysis Services is the only OLAP product in the market that can natively support the calculation of Distinct Counts, which are critical for applications such as click-stream analysis and market basket analysis.
Analysis Services Server Side Cell Attribute Compared with DB2 OLAP Server/Essbase Excel Add-in Style: Conditional Formatting (Color Coding) The DB2 OLAP Server/Essbase Excel client provides a facility to apply an Excel style against displayed cells and member names. This formatting must be defined for each application. In contrast, Analysis Services provides server-based conditional formatting using MDX expressions and makes them available to all applications.
For the latest information, please see http://www.microsoft.com/sql/
Comparing Business intelligence Platforms 21
Delivering OLAP Information to the User The key to the success of an OLAP tool is information delivery to users. In the 1990s, Essbase performed effectively in this area and led the marketplace because of this. Essbase has excellent Excel integration, a powerful Web-based data access strategy, and strong integration with a variety of third-party reporting packages. Analysis Services performs equally well in delivering information to users. Microsoft's primary strategy in this area is to take advantage of the excellent array of third-party packages that currently exist in the marketplace.
Third-Party Tools More than 70 application and tools vendors support Essbase as a mature product. Hundreds of third-party products support Analysis Services, with more on the way. Furthermore, Microsoft's OLE DB for OLAP API is becoming a standard in the marketplace; multiple OLAP servers such as TM1, SAS, SAP, Whitelight, Silvon, Harmony, NCR, and Seagate support OLE DB for OLAP. This strong support indicates a bright future. A visible and increasing community of knowledge is available for any product that incorporates OLE DB for OLAP.
Excel Integration Analysis Services data can be accessed using PivotTable® dynamic views in Microsoft Excel 2000. For companies that use PivotTable views extensively, this integration allows rapid deployment with minimal user training. Because this feature ships with Microsoft Office 2000, users do not need to install additional software to receive this benefit.
Essbase's Excel interface is delivered in the form of an Excel add-in. The add-in must be installed on all user computers that will access Essbase. This is a minor issue because the add-in can easily be deployed over the network and is easy to install. The add-in attaches an Essbase menu to the Excel interface, allowing users to perform data analysis against the database from within Excel.
Each Excel interface has its benefits and drawbacks. PivotTable is generally more intuitive and easier to use. The Essbase interface provides greater flexibility, and supports write-back capability.
Web Integration – Thin Client Support Both products have compelling strategies for accessing data across the Web. Essbase has three Web products: Wired for OLAP, Spiderman, and Web Gateway. In addition to these three products, several third-party Web tools support Essbase. Currently, Wired for OLAP is the most popular Web product that Hyperion sells.
The strategy of Analysis Services is to integrate with all of the best third-party Web solutions. Most of them have released or are planning to release a zero footprint solution for thin clients. Analysis Services can use the Web publishing capabilities of Office 2000; for example, a powerful and easy-to-use PivotTable view can be published as a dynamic or static Web page in seconds.
For the latest information, please see http://www.microsoft.com/sql/
Comparing Business intelligence Platforms 22
Developing Custom Applications Developers can implement custom applications against Analysis Services using either of two supported object models. Microsoft ActiveX® Data Objects (Multidimensional) (ADO MD) is a high-level data access interface that sits on top of OLE DB for OLAP. Decision Support Objects (DSO) exposes the server for database administration purposes. These tools allow customers and third parties to extend the offerings in Analysis Services even further.
ADO MD is an extension to ADO, and is familiar to any developer acquainted with ADO (or earlier Microsoft database access object models). Because ADO MD sits on top of OLE DB for OLAP, the same code that works with Analysis Services works with other OLE DB for OLAP providers.
DSO is the object model used for database definition and administration. Anything that can be done using the Analysis Manager user interface can be automated using DSO. Analysis Manager itself is customizable and extensible.
DB2 OLAP Server/Essbase's API is an old-fashioned, proprietary API that is not an object model. The Essbase objects add-in is not inclusive the way ADO MD is.
Stand-Alone Cubes The ability to spawn standalone cubes is essential for mobile users. Analysis Services provides this functionality with a simple interface through Office 2000. A slice of a server cube can be created on the client locally, for disconnected mobile analysis. These standalone cubes are very small and can be sent in e-mail or made available on a network. Furthermore, these cubes can be accessed using a variety of client tools, including Excel, without the need for the OLAP server or any additional software. This extremely powerful capability brings multidimensional cubes to everybody's desktop.
Although Essbase claims to have standalone capabilities, these capabilities require the purchase of additional licenses. The cubes cannot easily be mailed, or accessed by a variety of client tools without a server. We are unable to determine whether this limitation exists with DB2 OLAP Server.
Client-Side or Server-Side Only Calculations Some client applications expose MDX to the user, allowing creation of private calculations. Super users can create customized solutions without needing to contact the DBA. DB2 OLAP Server/Essbase does not offer this feature.
DB2 OLAP Server/Essbase touts the fact that 100 percent of its query resolution and computation is performed on the server, therefore minimizing network traffic. In a world where intranet networks are high bandwidth and desktop computing power is cheap, the advantages of such a server-side architecture are less important and must be counter-balanced by the reduced productivity available through a rich client-side interface for an analyst-oriented product. Analysis Services offers several connection options that let the system designer decide how to split processing most effectively among servers, middle-tier clients, and user desktops.
Real-Time OLAP Analysis Services has the ability to provide real-time OLAP. If the data storage is set as relational with no aggregations, the cube does not require processing, and data is accessible to users in a multidimensional format in real time. Applications, such as those providing up-to-
For the latest information, please see http://www.microsoft.com/sql/
Comparing Business intelligence Platforms 23
the-minute stock analysis or commodities trading and risk/exposure assessment, can benefit from this capability in Analysis Services.
Most updates to Essbase are done in real time with a minimal amount of user intervention, although the option exists to defer updates.
Drillthrough Both Essbase and Analysis Services support drillthrough capabilities. Analysis Services drillthrough is natively supported and is integrated in the Analysis manager.
Analysis Services Action Compared with DB2 OLAP Server/Essbase LROs: Drill Across to Other Systems In DB2 OLAP Server/Essbase, each cell can be associated with a file stored on the server, a URL, another Essbase database, or a comment string.
In Analysis Services, each cell or dimension member can be associated with an action. Actions can take the form of: URL, HTML, Command statement, Rowset, Dataset, and Proprietary (Custom action). In addition, an action can take, as a parameter (cell position), the context from which it was initiated. For example, a consumer products marketing analyst can automatically send the results of a customer buying analysis, including the names and addresses retrieved from native drillthrough to the data warehouse, to a marketing management system for the creation of a more effective direct-mail campaign. Actions close the loop between analysis and business execution.
For the latest information, please see http://www.microsoft.com/sql/
Comparing Business intelligence Platforms 24
Ease of Use Analysis Services has simplified the overall process of developing, deploying, and maintaining OLAP applications.
Building the Meta Data The Application Manager in DB2 OLAP Server/Essbase is an easy interface for administering OLAP applications. The outline can be manipulated with simple drag and drop operations. Outline members can be cut and pasted from other applications such as Excel. Developing a functioning outline, however, is not a simple process.
All member names must be unique across all dimensions. This limitation can make outline development treacherous. DB2 OLAP Server/Essbase provides the ability to use rules files to create dimension members. In these rules files, prefixes and suffixes can be added and other simple data field manipulations can be performed. Nonetheless, rules files are not wizard-driven nor are they particularly intuitive.
Analysis Services provides a wizard that walks the user through the process of creating dimensions. Because there is no unique member name constraint, this process is straightforward and usually takes less than an hour. In many Essbase applications, it can take days to resolve the unique constraint issues and build a working outline.
Experienced Essbase users who now use Analysis Services report that Analysis Services is relatively easy and straightforward to learn. Consulting partners with experience on both products report that it is a relatively simple and straightforward process to convert Essbase applications to Analysis Services.
Loading and Calculating the Data (Processing) Preparing for data loading in DB2 OLAP Server/Essbase usually involves the creation of a series of rules files mapped against one or many data files or ODBC sources. Rules files are not intuitive and can be tricky for some first-time Essbase users. Once understood, however, the rules file can perform fairly powerful functions, but still require some time to create the proper data field mappings. For some large data load files, rules files will not perform effectively, requiring data transformation to be performed outside of Essbase.
In Analysis Services, the cube is designed with the user-friendly Cube Wizard. The wizard walks the user through the process of selecting a fact table that will populate the cube and the dimension tables. If the dimensions have already been created, this process takes less than ten minutes.
In DB2 OLAP Server/Essbase, after the rules files are created, loading data interactively requires that each data file and the appropriate rules file be specified (the tool does not link these files). If many files are loaded with numerous rules files, this can be a tedious process of mouse clicks and keystrokes. Another difficulty in DB2 OLAP Server/Essbase is that all of the file names, even in the 32-bit version, must be eight characters or less.
Processing in Analysis Services is a simple matter of clicking Process and designating whether the load is incremental, a refresh, or a full process.
For the latest information, please see http://www.microsoft.com/sql/
Comparing Business intelligence Platforms 25
Performance Tuning Analysis Services provides a series of wizards to make performance tuning very straightforward. DB2 OLAP Server/Essbase requires extensive database knowledge and provides few intuitive tools for database tuning. Performance tuning is the area in which Analysis Services significantly differentiates itself as a much easier to use product.
For the latest information, please see http://www.microsoft.com/sql/
Comparing Business intelligence Platforms 26
OLAP Databases in the Enterprise
Security
Authentication Analysis Services supports integrated Windows NT/Windows 2000 security in addition to integrated IIS authentication that allows traversal of firewalls, and authentication over the Internet.
Essbase uses a proprietary server authentication that is not integrated with any external security model such as Windows NT or LDAP. Multiple Essbase servers do not share a common security database; users must be manually created and maintained in every server. The Essbase security model severely limits the use of Essbase across large enterprises that take data security seriously.
Cell Level Security Both DB2 OLAP Server/Essbase and Analysis Services support cell level security. Analysis Services uses MDX to define the slices of a cube that each user role can read and write. The administrator does not have to learn a new language and can use his or her knowledge of MDX to define cell security. Essbase uses a new syntactical construct, filters, to define which user group can see or update specific cells.
Member Level Security Analysis Services supports member security in addition to cell security. With member level security, the administrator uses MDX or the security wizard to specify what dimension members each user/role can see. Restricted members do not appear to the user when he or she is browsing the dimension—to the user, it is as if the member does not exist.
The Analysis Services administrator can specify whether the user should see a real total or a total based on the set of members the user is allowed to see. Again, Analysis Services does not force the administrator to adopt one approach or another, but instead offers complete flexibility.
Even though Hyperion has been asked to support member level security by its partners for many years, it still lacks functionality in this area.
Task Level Security DB2 OLAP Server/Essbase supports task level security, allowing the definition of administrators with different access, on a server. For example, an administrator may be restricted to administer only certain cubes. This is a flexible approach and provides value when multiple administrators, for different databases, operate on the same server.
With Analysis Services, the administrator role can access any database and cube on a specific server.
Network Traffic In DB2 OLAP Server/Essbase, all calculations and queries are performed on the server, which, under certain circumstances, may help to minimize network traffic.
For the latest information, please see http://www.microsoft.com/sql/
Comparing Business intelligence Platforms 27
Analysis Services offers flexible configuration options that can also reduce network traffic. It can operate identically to DB2 OLAP Server/Essbase, keeping all the calculations on the server. It can also be configured to perform local caching, enabling you to make intelligent use of the power of the client computer. This minimizes the number of round trips to the server by answering some queries from the client cache and significantly improves response time especially when the server is loaded down with the calculations of multiple concurrent users.
XML for Analysis advances the concepts of OLE DB by providing standardized universal data access to any standard data source residing over the Web without the need to deploy a client component that exposes COM interfaces. XML for Analysis is optimized for the Web by minimizing roundtrips to the server and targeting stateless client requests to maximize the scalability and robustness of a data source. XML for Analysis allows completely thin, but very powerful, browser-based applications to be constructed against Analysis Services for OLAP and Data Mining data. Analysis Services also includes disconnected or local cubes in the same license price with the rest of the SQL Server components. A local cube user can analyze a particular slice of the cube with no network traffic.
Server Operating Systems Supported Analysis Services supports only Windows server platforms, whereas Essbase supports Windows NT, Linux, UNIX, and AS/400. Windows 95 and Windows 98 operating systems are also supported for the stand-alone version. Currently, the majority of Essbase's installed base uses Windows NT/2000.
Hyperion has been known to argue that the Windows platform lacks scalability relative to Unix. In fact, databases from both Microsoft and IBM currently3 hold six of the top 10 (including the top four) positions for the TPC-C database benchmark. These benchmarks were all produced on hardware running the Windows 2000 operating system. With the advent of Windows 2000 Datacenter, hardware solutions are now available that can support up to 32 processors and can be loaded with up to 512 GB of RAM. The advent of machine configurations with this level of processing power should eradicate any scalability concerns completely.
Databases Supported Analysis Services supports SQL Server, Oracle, and any other ODBC or OLE DB data sources. DB2 OLAP Server/Essbase can also support any ODBC data source but does not include the ability to easily build and load data from a star or snowflake schema.
International Considerations • Multilanguage Support
• Multi-Byte Character Set (MBCS)
• Unicode Support
Analysis Services offers multilanguage support on both the client and the server. Analysis Services also offers support for MBCS and supports Unicode. Essbase also offers strong multilanguage support.
3 As of October 25, 2000.
For the latest information, please see http://www.microsoft.com/sql/
Comparing Business intelligence Platforms 28
Cost of Ownership Analysis Services has a much lower cost of ownership in all aspects than DB2 OLAP Server/Essbase. This section will discuss cost related matters, including:
• Acquisition (license pricing)
• Deployment (technical setup, client tools, training, and user access)
• Support (post-deployment maintenance costs)
Product Acquisition Product acquisition includes licensing and hardware costs as well as integration with a data warehousing solution.
Licensing Analysis Services is included with SQL Server 2000. For users interested in just the Analysis Services product, SQL Server, DTS and the rest of the components are side benefits.
The entry price for Essbase is reportedly much higher than SQL Server 2000, according to Independent Software Vendors (ISVs) who are OEMs for both products. The inability to resell Essbase, due to the high cost of the product, prompts many vendors to offer support for Analysis Services. Essbase also charges for a variety of features that ship standard in Analysis Services: for example, Essbase API (typically 20 percent of server fees), Hyperion Integration Server (to build the meta data from a relational scheme, costing 80 percent of server fees). Partitions cost an additional 60 percent of applicable server fees. Other Essbase-related products that offer functionality that is included standard in SQL Server, are Hyperion Essbase Application Manager and Hyperion Essbase SQL Interface.
Hardware Both tools yield better performance with more robust hardware. Both perform well with more processing power and large amounts of RAM, however, Essbase requires more disk space because of the data explosion issue. Though disk space is relatively inexpensive, the price difference becomes significant as you begin to build very large cubes. In addition, management and deployment is much more cumbersome with the larger Essbase cubes.
The Integrated Data Warehousing Solution Customers implementing data warehouses will see significantly lower acquisition costs with Analysis Services. Microsoft provides an integrated data warehouse solution. SQL Server 2000 includes data mining capabilities, a data transformation tool (DTS), an OLAP engine (Analysis Services), and a relational database (SQL Server).
Companies that acquire Essbase will need to acquire the relational database and data transformation software from one or more additional vendors. This is not only more complicated but more costly as well. DB2 OLAP Server is available as an optional product for DB2 customers.
For the latest information, please see http://www.microsoft.com/sql/
Comparing Business intelligence Platforms 29
Development Cycle Partners that have developed with both products found that it takes, on average, half the time to develop and deploy an application with Analysis Services than with DB2 OLAP Server/Essbase.
Product Deployment Consulting, training, and custom application development are typical deployment costs associated with rolling out OLAP tools. Because of the ease of use, specifically in the area of performance tuning, consulting costs are expected to be lower with Analysis Services. Although the tool is easier to use, more functionality is included, and therefore training costs are likely to be similar. Custom application development varies greatly by client. Because the API is now the standard, there will likely be more consultants able to assist in custom application development on Analysis Services than DB2 OLAP Server/Essbase.
Product Support Because Analysis Services provides powerful utilities, such as the Aggregation and Cube Processing Wizards, to automate many database administration tasks, it is also expected to cost less in terms of the resources required to maintain the cubes.
For the latest information, please see http://www.microsoft.com/sql/
Comparing Business intelligence Platforms 30
Conclusion Although Essbase has a strong OLAP engine, and IBM has made significant improvements in the capabilities of DB2 OLAP Server, Analysis Services is a much more scalable, comprehensive, and affordable solution. The database architecture of Analysis Services has set a new standard in the OLAP marketplace, and is superior to that of DB2 OLAP Server/Essbase for three main reasons:
• Its ability to manage data explosion. Analysis Services doesn’t store sparse data, and
contains support for virtual dimensions, dynamic calculated measures, and partial
aggregation. Analysis Services also applies powerful data compression algorithms to reduce
the final size of the cube that gets stored.
• Its ability to store data using MOLAP, ROLAP, or HOLAP across multiple partitions in a single
cube, thereby allowing for very large applications.
• Its ability to provide an audit trail and instant availability of aggregations from write-back
operations.
Analysis Services can be implemented and deployed more quickly because:
• It provides a series of wizards that walk users through the key steps of designing, building,
and tuning the database.
• It can build meta data structures directly from the star and snowflake schemas in the data
warehouse, without the need to purchase additional software.
• It uses an open API architecture that enables more rapid development of custom
applications.
Analysis Services total cost of ownership is lower because:
• The software licensing fees are simply not as high.
• Implementation costs are reduced due to shorter implementation times. Fewer consulting
hours will be required to perform database tuning.
• Cost of support is lower since Analysis Services provides powerful scheduling and data
transformation tools.
Analysis Services has demonstrated that it is the best-in-class OLAP engine.
For the latest information, please see http://www.microsoft.com/sql/
Comparing Business intelligence Platforms 31
For More Information The following Web sites provide more information, including white papers, benchmarks, and case studies:
Microsoft Business Intelligence: http://www.microsoft.com/solutions/bi/
Office XP Business Intelligence: http://www.microsoft.com/office/business/intelligence/
Microsoft SQL Server: http://www.microsoft.com/sql/
DB2 comparisons: http://www.microsoft.com/sql/evaluation/compare/ibm/default.asp
SQL Server case studies: http://www.microsoft.com/sql/evaluation/casestudies/alphalisting.asp
Benchmarks: http://www.microsoft.com/sql/evaluation/compare/benchmarks.asp and http://www.tpc.org