Embed Size (px)
Citation preview

Comparison of chicken performance when fed with diets containing Bt
cotton, parental non Bt line or commercial cotton
Chapter V
Annexure 3

FINAL REPORT
Comparison of Chicken Performance When Fed With Diets containing Bt Cotton, Parental Non-Bt Line or
Commercial Cotton
Project Leader Dr T.S. Joshi Principal Scientist & Head, Associates Dr A.B. Mandal Principal Scientist Dr A.V. Elangovan
Scientist (Senior Scale)
Avian Nutrition & Feed Technology Division
Central Avian Research Institute Izatnagar (UP), 243 122,
India
Sponsored by Maharashtra Hybrid Seeds Company Ltd. (Mahyco)
Ashok Centre, 4 E/15, III Floor, Jhandewalan Ext. New Delhi, 110 055
Final Report Project Title: Comparison of Chicken Performance When Fed With Diets
containing Bt Cotton, Parental Non-Bt Line or Commercial Cotton
Project Associates:
Study Centre: Avian Nutrition & Feed Technology Division Central Avian Research Institute Izatnagar (UP), 243122, India Fax : 091-0581-447321 E Mail : [email protected] Study Dates : Chicks received : 05-02-2001-09-14 Biossay period : 5th Feb – 19th Mar. 2001 Summary : 21st Mar. 2001 Final Report : 25th Mar. 2001 Objectives: Comparing performance and carcass yield of broiler chicks fed with Bt cottonseed, Parental Non-Bt Cottonseed, and commercial cottonseed.

Summary
This study was conducted to assess comparative nutrient utilization and carcass
quality in broiler chickens fed diets containing solvent extracted cottonseed meal
(CSM) processed from Bt & parental non-Bt line cottonseeds. For effective
comparison similarly processed meal of national check and commercially produced
cottonseeds were also used in the broiler diets and fed separately. The free gossypol
contents were 0.02, 0.02, 0.44 and 0.03% in solvent extracted meals of Bt, parental
Non-Bt line, national check and commercially produced cottonseeds, respectively.
Day-old unsexed broiler chicks (n=243) were divided to 27 groups of 9 each. Nine
dietary treatments (isonitrogenour, 23% crude protein and isocaloric, 2800 kcal
ME/kg) were formulated viz., DI (control, soybean meal-SBM based), D2 and D3 (Bt
CSM included at 10% of diet with and without additional iron, respectively), D4 and
D5 (Non-Bt CSM with and without additional iron, respectively), D6 and D7 (national
check CSM with or without additional iron, Respectively). The additional iron (Fe)
was included at the rate of 2 ppm for every 1 ppm of free gossypol. Each dietary
treatment was offered to 27 broiler chicks in three replicated groups up to 6 weeks of
age. All the birds were housed in battery cages under uniform housing, management
and feeding except the variations in the dietary treatments as envisaged above. The
body weight change and feed intake were recorded weekly. At the end of 6 weeks of
age, 10 birds were taken out randomly from each treatment and were sacrificed to
study carcass and giblet yield and weight of organs.
The date of 0-6 week’s period revealed that the body weight from Bt (D2,
1753g & D3, 1638g) & parental non-Bt (D4, 1653g & D5, 1687g) Line cottonseeds
with or without additional Fe were similar to those of broilers fed the soybean meal
(solvent ext.) based diet (D1, 1676g). The feed intake and feed conversion efficiency
(feed intake : weight gain) in these dietary treatments (Bt, non-Bt line based diets)
also did not differ significantly (P>0.05) from control diet. Similar observation with
also observed in dietary treatments (D8 & D9) containing solvent extracted cottonseed
meal of commercially produced origin. However, a significant decrease (P>0.01) in

body weight gain and feed intake was observed in D6 containing national check CSM
with high gossypol content. Addition of Fe in the diet (D7) improved (P>0.01) feed
intake and weight gain but not to the extent as observed in diets
Containing Bt, Parental non-Bt, commercially produced CSM or control.
However, CSM, regardless of type, did not affect feed conversion efficiency when fed
with or without addition iron.
The carcass characteristics in terms of dressing percentage and giblet yield
were similar (P>0.05) between the Bt, non-Bt, commercially produced, or control
soybean meal treatments. The eviscerated yields emanated from diets containing
either Bt, non-Bt or commercially produced CSM were statistically similar to that of
the control. However, eviscerated yield of broilers fed National check CSM with or
without iron supplementation was significantly (P>0.05) lower than the control
soybean meal.
Survival, growth rate, feed intake, feed conversion and carcass characteristics
were not statistically different between boiler chicks fed Bt cottonseed meal compared
to broiler chicks fed non-Bt or conventional cottonseed meal. Furthermore, based on
the extensive research experiences at the Central Avian Research Institute, the
survival, growth rate, feed intake, feed conversion and carcass characteristics
measured in the current study for broiler checks fed Bt cottonseed meal were typical
of those observed for broiler chicks in other studies. Based on the data from the
current study, Bt cottonseed meal is as safe and nutritious as non-Bt cottonseed meal
for performance of broiler chicks.
Growth rate, feed conversion and carcass characteristics of broiler chicks fed
diets containing Bt or non-Bt cottonseed meal were not statistically different from
broiler chicks fed diet containing soybean meal. Therefore, the results of this study
suggest that solvent-extracted cottonseed meal could be used in place of soyabean
meal in broiler chick feed up to 6 weeks of age (market age)

A significant decrease in body weight gain and feed intake was observed broiler
chicks fed diets containing National check CSM with high gossypol content. Addition
of Fe in the diet improved weight gain and feed intake but not to the extent as
observed in diets containing low gossypol levels (Bt, parental non-Bt, commercially
produced CSM or soybean control). Lower body weight gain and feed intake in the
National check might be attributed to higher free gossypol content in the National
check variety (0.44% flee gossypol). Addition of iron at the rate of 2 ppm per 1 ppm
gossypol partially ameliorated the toxic effect of gossypol but was unable to curb its
toxicity completely.
Introduction
Proteinic ingredients are costlier components in poultry mash. Identification
and evaluation of effective levels of proteinic agro-industrial by-products has been the
priorities amongst the nutritionists. Cottonseed and cottonseed meal (expeller pressed)
are popular amongst the dauy farmers because these help in increasing the butter fat
content and separation of fat from milk However, with the installation of solvent
extraction plant, it is likely that large quantity of solvent extracted cottonseed meal
will be available in market in near future, which may have little value in the diet of
milch animal for milk production and separation of milk fat. Therefore, it may be used
in poultry mash as a diversified source of protein. There are certain factors viz. high
fibre content, gossypol content and lysine deficiency are limiting its use in poultry
feed. Bt and non-Bt cottonseeds meals (solvent extracted) are low in fibre and free
gossypol contents. therefore, the present experiment was conducted to find out the
efficacy of Bt cotton non-Bt cotton and commercial cottonseed meals at 10% levels in
soybean meal (a commonly used proteinic by-product rich in lysine) based diets for
optimum broiler performance.

Materials and Methods
The research work was conducted at Avian Nutrition and Feed Technology
Division of Central Avian Research Institute, Izatnagar, India The biological trial
involving broiler chicks was conducted from 5" Feb. to 19Lh Mar. 2001. The detailed
materials and methods employed in the study are presented as follows:
Selection of chicks and experimental design
Three hundred day-old unsexed broiler chicks (ARBOR ACRESCRES strain) were
procured from local hatchery at Haldwani, Uttaranchal state. They were vaccinated
against Ranikhet (day 1) and Infectious Bursal Disease (14 and 35 days of age). Two
hundred and forty three (243) thrifty and bright looking unsexed, day-old broiler
chicks were selected, wing banded, weighed and randomly distributed into 27 groups
of 9 chicks each. The experiment was conducted following completely randomized
design having 9· dietary treatments with 3 observations (replicates) in each.
Housing and Brooding
Chicks from day-old were housed in battery brooder cages up to 3 weeks of
age. and thereafter shifted to battery cages fitted with feeder, waterer and dropping
trays.
Selection of leed ingredients
The feed ingredients were procured once for all in one lot from feed store of
Central Avian Research Institute. They were analysed for proximate composition,
calcium and phosphorus. The four cottonseed (Bt cotton, non-Bt cotton, National
check .cotton and commercially produced of cotton) samples, supplied by
Maharashtra Hybrid Seeds company Ltd. (Mahyco), New Delhi, were processed
(defatted and ground) in the laboratory (Central Avian Research Institute, Izatnagar,
India) for preparation of their respective solvent extracted meals (undecorticated).
The proximate composition of different cottonseed meals is presented in Table 1.
The gossypol contents of each cottonseed meal are presented in Table 2.
Feeds and feeding
During the entire growth period extra care was exercised to ensure efficient
feeding and watering of chicks. They were supplied fresh drinking water ad lib.
Ninedietary treatments (isonitrogenous, 23% crude protein and isocaloric, 2800 kcal
ME/kg) were formulated following standard specifications (ISI, 1992) viz., D1
(control, soybean meal-SBM based), D2 and D3 (Bt CSM included at 10% of diet
with and without additional iron, respectively), D4 and 13;5 (non-Bt CSM included at
10% of the diet with and without additional iron, respectively), D6 and D7 (national
check CSM included at 10% of the diet with or without additional iron, respectively)
and T8 and T9 (commercially produced CSM included at 10% of the diet with or
without additional iron). Additional iron(as ferrous sulphate) was included at the rate
of2 ppm for every 1ppm of free gossypol. The details of identification of dietary
treatments, their ingredient and chemical composition are given in Tables 3 and 4. The
ingredients were ground (2.4 mm, screen size) if required, weighed as per feed
formulae and added successively, by and by, in the whole lot The mineral and vitamin
supplements were premixed in maize before mixing in the whole lot to ensure uniform
mixing. All diets had more or less similar metabolisable energy, crude protein, lysine,
methionine, calcium, phosphorus and crude fibre concentration, and met the
requirements as specified by ISI (1992). No medications or feed additives I growth
promoters was added to the diet. The mixing was done in vertical feed mixer. Each
dietary treatment was offered to 27 broiler chicks in three replicated groups of 9 each
up to 6 weeks of age. Body weight of individual broiler chicks was recorded weekly.
The feed intake of chicks was recorded at weekly intervals from 0-6 weeks of age by
offering weighed quantity of feed and weighing their residues The mortality of birds
was recorded as and when it occurred, weighed and sent for postmortem examination.
The feed conversion ratio was calculated on the basis of unit feed consumed to unit

body weight gain. The body weight of dead birds were recorded as and when it
occurred and the gain was also taken into consideration for calculation of feed
conversion ratio.
Carcass traits
At the end of 6th week of age, 10 broiler chicks picked up randomly from each
treatment groups'(3 birds each from two pens & 4 from the third pen). They were
starved for 12-hr. (drinking water was supplied ad lib), and were sacrificed as per
standard procedure (Mead, 1989) for evaluation of carcass characteristics including
thedefeathered yield, eviscerated carcass yield, weight of the liver, heart and gizzard
of chicks.
Laboratory Analyses
The representative samples of feed ingredients were analysed for proximate
composition (moisture, crude protein, ether extract, crude fibre, total ash and nitrogen
free extract), calcium and phosphorus following standard techniques (AOAC, 1990 ).
The processed cotton seed meal samples were analysed for total and ~ee gossypol
content following standard techniques (AOCS, 1989).
Statistical analysis
Data were subjected to analyses of variance following one way classification of
completely randomized design (Snedecor and Cochran, 1989). The means of different
dietary treatments were tested for statistical significance using Duncan's multiple
range tests (Duncan, 1969)

Results
The results.obtained in the present study are presented in this chapter under
different headings.
Body weight gain
The body weight gains at 0-4 weeks and 0-6 weeks of age are given in Tables 5
and 6, respectively. The live weight changes have also been depicted in fig. 1 and fig.
2. The six weeks body weight gain of broiler chickens receiving solvent extracted
cottonseed meal (CSM) processed from Bt (D2, 1753g & D3, 16388) and parental
non-Bt D4, 16538 & M, 16878) line cottonseeds with or without additional Fe were
similar to those observed for broilers fed soybean meal (solvent ext.) based diet (D1,
16768).
The rapidly growing chicks are highly sensitive to any toxic effect of the feed
which may manifest itself by growth depression. As Bt, non-Bt and commercially
produced CSM did not depress body weight gain either at 0-4 or 0-6 weeks of age,
one can conclude the incorporation of CSM at 10% level did not exert any toxic
effect. However, a significant decrease CP<O:OI) in body weight gain was observed
in D6 containing National check CSM with high gossypol content. Addition of Fe in
the diet (D7) improved (e<0.01) weight gain but not to the extent as observed in diets
containing low levels of gossypol (Bf parental non-Bt, commercially produced CSM
or soybean control). Lower body weight gain in D6 might be attributed to higher free
gossypol content in National check variety (0.44% free gossypol). Addition of iron at
the rate of 2 ppm per 1 ppm of free gossypol partially ameliorated the toxic effect of
gossypol but was unable to curb its toxicity completely.

Feed intake and Feed conversion ratio
The feed intaice and body weight gain (Tables 5 and 6) for dietary treatments (Bt,
non-Bt line based diets) were similar (P>O.O5) to the soybean meal control diet. Feed
intake recorded in D8 and D9 (with commercially produced CSM) was also similar to
that in the soybean meal control. These results indicate that the cottonseed meal from
Bt, non-Bt or commercially produced CSM were equally palatable and nutritious for
broiler chick growth. However, a signi6cant (P~0.05) depression in feed intake was
observed in D6 containing CSM of National check, which might account for the lower
body weight gain of birds in this group. Supplementation of Fe improved feed intake
(D7). Lower feed intake in D6 might be attributed to higher free gossypol content in
National check variety (0.44% free gossypol).
There was no significant difference in feed conversion efficiency (feed intake:
body weight gain) among any of the CSM and control soybean meal treatments when
fed with or without additional iron both at 0-4 (Table 5) or 0-6 (Table 6) weeks of age.
Therefore, feed conversion efficiency was not affected by the level of free gossypol
(up to 0.44%) in this study.
Carcass characteristics
The carcass characteristics (Table 7) in terms of dressing percentage and giblet yield
were not significantly (P>0.05) different between the Bt, non-Bt, ·commercially
produced CSM, or control soybean meal treatments. The eviscerated yields emanated
from diets containing either Bt, non-Bt or commercially produced were statistically
similar to that of control. However, eviscerated yield of broilers fed National check
CSM with or without iron supplementation was significantly (P<0.05) lower than the
control soybean meal. (Table 7 shows no statistical difference between the National
Check and the other CSMs, but difference from control soy). The yield of different
organs when expressed on unit live weight did not differ significantly among the
treatments (P>0.05).
Mortality
Total of seven birds died (Table 9) during the whole experimental period which
is equivalent to 2.89%, an insignificant event. The mortality of birds were 2, 2, 2, and
1 in dietary treatments D2, D5, D6 & D9, respectively. However, the pathological
changes observed on post-mortem examination of dead birds during the experimental
period did not attribute to the dietary treatments.
Conclusion
Survival, growth rate, feed intake, feed conversion and carcass characteristics were
not statistically different between broiler chicks fed Bt cottonseed meal compared to
broiler chicks fed non-Bt or conventional cottonseed meal. Furthermore, based on the
extensive research experiences at the Central Avian Research Institute, Izatnagar, the
survival, growth rate, feed intake, feed conversion and carcass characteristics
measured in the current study for broiler chicks fed Bt cottonseed meal were typical of
those observed for broiler chicks in other studies. Based on the data from the current
study, Bt cottonseed meal .is as safe and nutritious as non-Bt cottonseed meal for
performance of broiler chicks.
Growth rate, feed intake, feed conversion and carcass characteristics of broiler
chicks fed diet containing Bt or non-Bt cottonseed meal were not statistically different
from broiler chicks fed diet containing soybean meal. Therefore, the results of this
study suggest that solvent-extracted cottonseed meal could be used at 10% level (w/w)
in place of soybean meal in broiler chick feed up to 6 weeks of age (market age).
A significant decrease in body, weight gain and feed intake was observed in
broiler chicks fed diets containing National check CSM with high gossypol content.
Addition of Fe iii the diet improved weight gain and feed intake but not to the extent
as observed in diets containing low levels of free gossypol. Addition of iron at the rate
of 2 ppm per 1 ppm of 6~ee gossypol partially ameliorated the toxic effect of gossypol
but was unable to curb its toxicity completely.
REFERENCES AOAC (1990). Association of Official Analytical Chemists. Official Methods Analysis. 15th edn. FCrashington, D.C. AOCS, 1989. AOCS Official Method Ba 7-58; 8-78. Duncan, 1955. Multiple range and multiple F-tests. Biometrics, 11 : 1-42. ISI, 1992. Nutrient requirements for poultry. Bureau of Indian Standards, Manak Bhavan, New Delhi, India. Mead, G. C. 1984. Processing of poultry. Elsevier Applied Science, London & New York. Snedecor, G.W. and Cochran, W.G. (1967). Statistical Methods(6 edn.).Iowa State University Press, Ames, Iowa, USA.
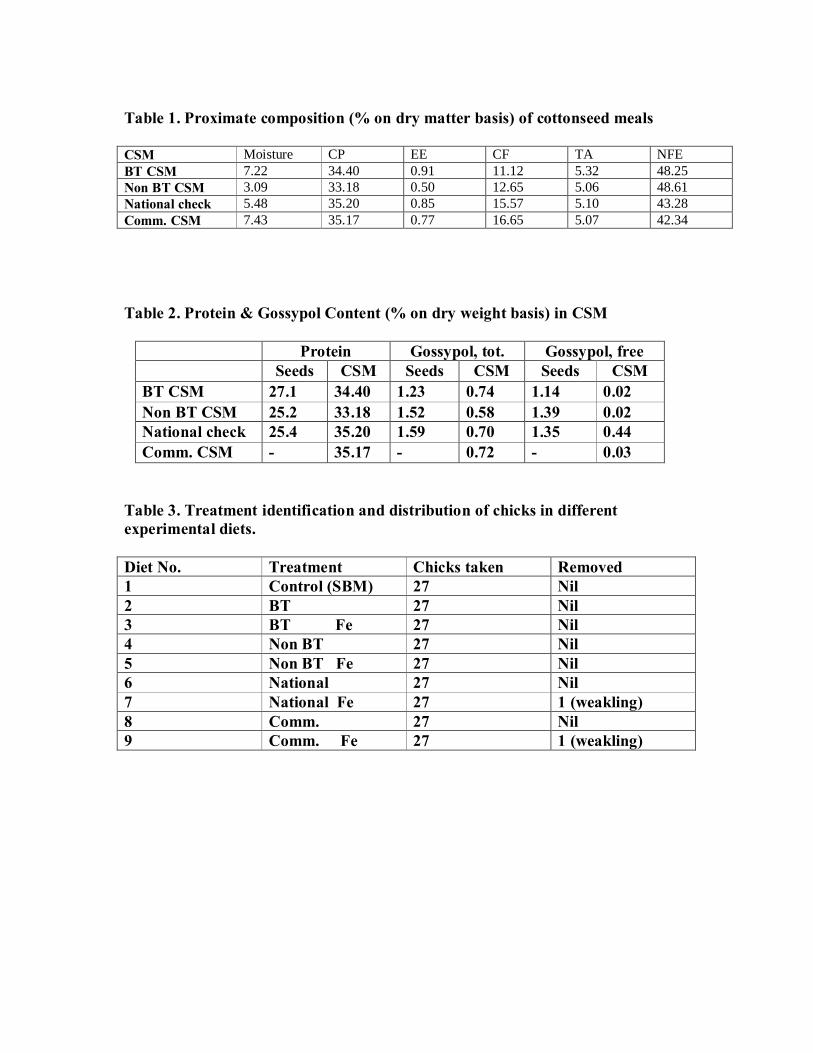
Table 1. Proximate composition (% on dry matter basis) of cottonseed meals CSM Moisture CP EE CF TA NFE BT CSM 7.22 34.40 0.91 11.12 5.32 48.25 Non BT CSM 3.09 33.18 0.50 12.65 5.06 48.61 National check 5.48 35.20 0.85 15.57 5.10 43.28 Comm. CSM 7.43 35.17 0.77 16.65 5.07 42.34 Table 2. Protein & Gossypol Content (% on dry weight basis) in CSM
Protein Gossypol, tot. Gossypol, free Seeds CSM Seeds CSM Seeds CSM
BT CSM 27.1 34.40 1.23 0.74 1.14 0.02 Non BT CSM 25.2 33.18 1.52 0.58 1.39 0.02 National check 25.4 35.20 1.59 0.70 1.35 0.44 Comm. CSM - 35.17 - 0.72 - 0.03
Table 3. Treatment identification and distribution of chicks in different experimental diets. Diet No. Treatment Chicks taken Removed 1 Control (SBM) 27 Nil 2 BT 27 Nil 3 BT Fe 27 Nil 4 Non BT 27 Nil 5 Non BT Fe 27 Nil 6 National 27 Nil 7 National Fe 27 1 (weakling) 8 Comm. 27 Nil 9 Comm. Fe 27 1 (weakling)
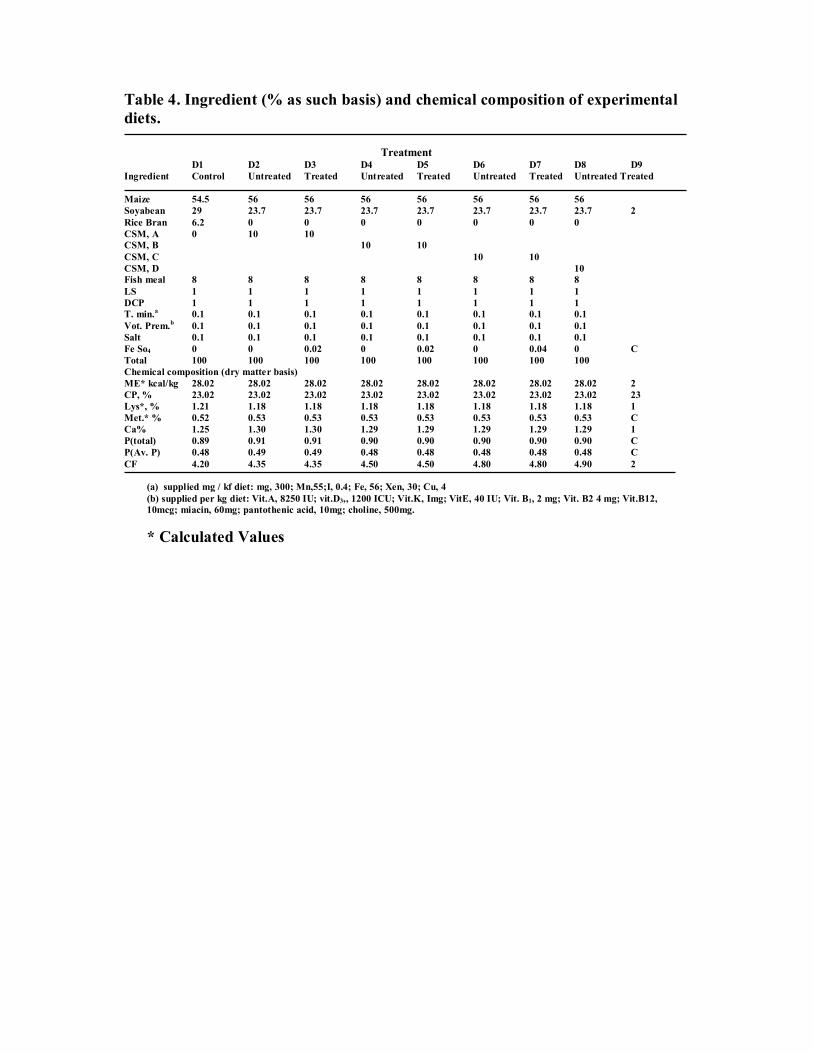
Table 4. Ingredient (% as such basis) and chemical composition of experimental diets.
Treatment D1 D2 D3 D4 D5 D6 D7 D8 D9 Ingredient Control Untreated Treated Untreated Treated Untreated Treated Untreated Treated Maize 54.5 56 56 56 56 56 56 56 Soyabean 29 23.7 23.7 23.7 23.7 23.7 23.7 23.7 2 Rice Bran 6.2 0 0 0 0 0 0 0 CSM, A 0 10 10 CSM, B 10 10 CSM, C 10 10 CSM, D 10 Fish meal 8 8 8 8 8 8 8 8 LS 1 1 1 1 1 1 1 1 DCP 1 1 1 1 1 1 1 1 T. min.a 0.1 0.1 0.1 0.1 0.1 0.1 0.1 0.1 Vot. Prem.b 0.1 0.1 0.1 0.1 0.1 0.1 0.1 0.1 Salt 0.1 0.1 0.1 0.1 0.1 0.1 0.1 0.1 Fe So4 0 0 0.02 0 0.02 0 0.04 0 C Total 100 100 100 100 100 100 100 100 Chemical composition (dry matter basis) ME* kcal/kg 28.02 28.02 28.02 28.02 28.02 28.02 28.02 28.02 2 CP, % 23.02 23.02 23.02 23.02 23.02 23.02 23.02 23.02 23 Lys*, % 1.21 1.18 1.18 1.18 1.18 1.18 1.18 1.18 1 Met.* % 0.52 0.53 0.53 0.53 0.53 0.53 0.53 0.53 C Ca% 1.25 1.30 1.30 1.29 1.29 1.29 1.29 1.29 1 P(total) 0.89 0.91 0.91 0.90 0.90 0.90 0.90 0.90 C P(Av. P) 0.48 0.49 0.49 0.48 0.48 0.48 0.48 0.48 C CF 4.20 4.35 4.35 4.50 4.50 4.80 4.80 4.90 2
(a) supplied mg / kf diet: mg, 300; Mn,55;I, 0.4; Fe, 56; Xen, 30; Cu, 4 (b) supplied per kg diet: Vit.A, 8250 IU; vit.D3,, 1200 ICU; Vit.K, Img; VitE, 40 IU; Vit. B1, 2 mg; Vit. B2 4 mg; Vit.B12, 10mcg; miacin, 60mg; pantothenic acid, 10mg; choline, 500mg.
* Calculated Values
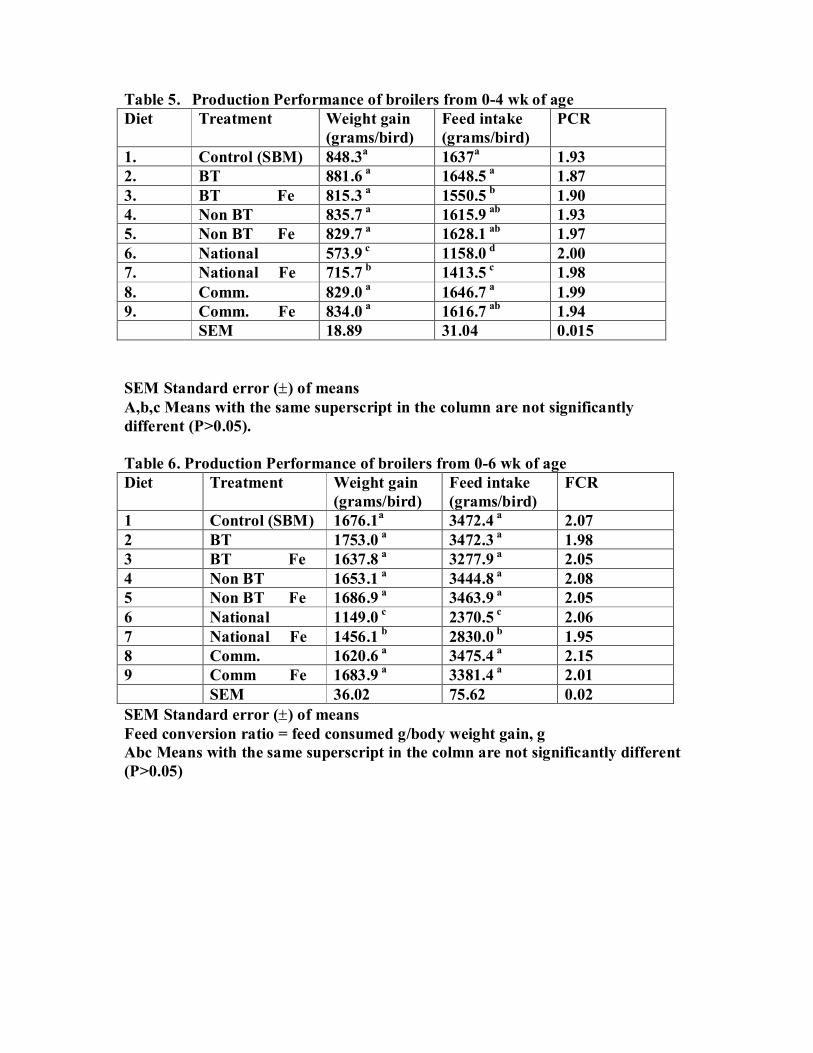
Table 5. Production Performance of broilers from 0-4 wk of age Diet Treatment Weight gain
(grams/bird) Feed intake (grams/bird)
PCR
1. Control (SBM) 848.3a 1637a 1.93 2. BT 881.6 a 1648.5 a 1.87 3. BT Fe 815.3 a 1550.5 b 1.90 4. Non BT 835.7 a 1615.9 ab 1.93 5. Non BT Fe 829.7 a 1628.1 ab 1.97 6. National 573.9 c 1158.0 d 2.00 7. National Fe 715.7 b 1413.5 c 1.98 8. Comm. 829.0 a 1646.7 a 1.99 9. Comm. Fe 834.0 a 1616.7 ab 1.94 SEM 18.89 31.04 0.015 SEM Standard error (±) of means A,b,c Means with the same superscript in the column are not significantly different (P>0.05). Table 6. Production Performance of broilers from 0-6 wk of age Diet Treatment Weight gain
(grams/bird) Feed intake (grams/bird)
FCR
1 Control (SBM) 1676.1a 3472.4 a 2.07 2 BT 1753.0 a 3472.3 a 1.98 3 BT Fe 1637.8 a 3277.9 a 2.05 4 Non BT 1653.1 a 3444.8 a 2.08 5 Non BT Fe 1686.9 a 3463.9 a 2.05 6 National 1149.0 c 2370.5 c 2.06 7 National Fe 1456.1 b 2830.0 b 1.95 8 Comm. 1620.6 a 3475.4 a 2.15 9 Comm Fe 1683.9 a 3381.4 a 2.01 SEM 36.02 75.62 0.02 SEM Standard error (±) of means Feed conversion ratio = feed consumed g/body weight gain, g Abc Means with the same superscript in the colmn are not significantly different (P>0.05)
Table 7. Carcass yield (% of live weight) of broilers at 6 weeks of age Diet Treatment Defeathered
Yield (%) Eviscerated Yield (%)
Giblet (g/100g)
1 Control (SBM) 89.57 64.93ab 21.08 2 BT 90.21 65.09 ab 18.98 3 BT Fe 89.24 65.89 a 19.14 4 Non BT 90.04 64.73 ab 21.37 5. Non BT Fe 89.58 65.05 ab 22.06 6 Nantional 90.38 63.83 b 20.82 7 National Fe 90.45 63.63 b 23.90 8 Comm. 90.94 66.31 a 21.78 9 Comm. Fe 90.73 66.26 a 21.84 SEM 0.16 0.22 0.49 SEM Standard error (±) of means Abc Means with the same superscript in the column are not significantly different (P>0.05). Table 8. Carcass yield (% of live weight) of broilers at 6 weeks of age Diet Treatment Gizzard
(g/100g) Heart (g/1000g)
Liver (g/1000g)
1 Control (SBM) 21.08 4.55 21.52 2 BT 18.98 4.6 21.99 3 BT Fe 19.14 4.83 21.43 4 Non BT 21.37 5.07 23.50 5 Non BT Fe 22.06 4.68 21.76 6 National 20.82 4.79 22.20 7 National Fe 23.90 5.12 23.20 8 Comm. 21.78 5.12 23.62 9 Comm. Fe 21.84 4.62 21.46 SEM 0.33 0.079 0.32 SEM Standard error (±) of means
Table 9. Mortality of birds at different experimental weeks Diet Treatment 1st 2nd 3rd 4th 5th 6th Total Total
(%) 1 Control (SBM Nil 2 BT 1 1 2 7.4 3 BT Fe Nil 4 Non BT Nil 5 Non BT Fe 2 2 7.4 6 National 2 2 7.4 7 National Fe Nil 8 Comm. Nil 9 Comm Fe 1 1 3.7


Effect of feeding cottonseed produced from Bt cotton on feed intake milk
production and composition in lactating cows in India
Chapter V
Annexure 6
FINAL REPORT
Effects of Feeding Cottonseed Produced from Bt Cotton for Four Weeks on Feed Intake, Milk Production and
Composition in Lactating Cows in India
Study Sponsorer MAHARASHTRA HYBRID SEEDS
COMPANY LIMITED RESHAM BHAVAN, 4TH FLOOR,
78, VEER NARIMAN ROAD MUMBAI 400 020
2001
Dairy Cattle Nutrition Division NATIONAL DAIRY RESEARCH INSTITUTE
(Indian Council of Agricultural Research) KARNAL 132 001, Haryana

Final Report
April, 2001
Study Title
Effects of Feeding Cottonseed Produced from Bt Cotton for Four Weeks on Feed Intake, Milk Production and
Composition in Lactating Cows in India Principal Investigator Dr. K.K. Singhal Co Investigators Dr. A.K. Tyagi & Dr. Y.S. Rajput
Technical Assistants Mr. Raj Bahadur
Mr. Baru Ram
Coordinator & In charge, Consultancy Cell Dr. S.P. Agrawala
Head of the Institution Dr. B.N. MATHUR
Director National Dairy Research Institute, Karnal

CONTENTS
Page Statement of No data Confidentiality Claim………………………………….1 Statement of Particulars of Study…………………………………………… ..2 Abbreviations…………………………………………………………………3 Abstract……………………………………………………………………… .4 Introduction……………………………………………………………………4 Materials and Methods…………………………………………………………5 Results………………………………………………………………………………..10 Discussion…………………………………………………………………………….13 Acknowledgements…………………………………………………………………...15 References…………………………………………………………………………….16 Tables…………………………………………………………………………………18

Statement of No Data Confidentiality Claims This is to certify that the performing laboratory is not making any claim of confidentiality for any information in this study. This performing laboratory also states that the issues related to raw data and materials will be stored in the laboratory and will be accessible to the authorized scientists of the laboratory and/or persons authorized by the sponsors. The workers on the project are free to publish the data in the form of research paper or in any other form. Laboratory Diary Cattle Nutrition Division National Dairy Research Institute, Karnal Principal Investigator Dr. K.K. Singhal Designation Sr. Scientist

Statement of Particular of Study Title Effects of feeding cottonseed produced from Bt cotton
for four weeks on feed intake, milk production and composition in lactating cows in India
Facility Dairy Cattle Nutrition Division National Dairy research Institute Karnal – 132 001 Fax : 0184-250042 E-mail : [email protected] Study Director Dr. K.K. Singhal Co-study Director Dr. A.K. Tyagi Dr. Y.S. Rajput Investigators Mr. Rajbahadur Mr. Baru Ram Study Initiation Data 22.01.2001 Experimentation termination Date 10.03.2001 Record Retention Raw data of the study will be retained by the Study
Director and this will be made available to the authorized personal from the sponsors

Abbreviations ADF Acid detergent fibre Ad lib. Ad libitum Bt Bacillus thuringiensis oC degree Celsius DM Dry matter g gram l litres kg Kilogram KF Karn Friasian KS Karn Swiss MAHYCO Maharashtra Hybrid Seed Company mg milligram NDF Neutral detergent fibre NDRI National Dairy Research Institute NBt Non Bacillus thuringiensis µg microgram SCC Somatic cell counts

ABSTRACT Twenty crossbred (KS and KF) multiparous cows, divided in two groups of 10 each on basis of milk yield and stage of lactation were housed in two separate well ventilated sheds, and fed on berseem fodder ad lib., wheat straw (1kg/cow/day) and a concentrate mixture consisting of crushed cottonseed (Non Bt) 40 parts, groundnut cake 15 parts according to their nutritional requirements for 13 days to adapt them to the cottonseed based diet. Group 1 was continued on the same ration and designated as NBt group while in the concentrate mixture of group 2 cottonseed was replaced with Bt cottonseed and designated as Bt group. Milk yield and voluntary feed intake were recorded daily. Average milk yield in Bt and NBt group during adaptation period of 13 days was 7.47 and 7.99 kg, respectively. Milk samples were collected at weekly intervals during the four week experimental period for the analysis of milk composition and to test for the presence of Bt protein. At the end, a blood sample from each cow was collected and plasma was separated to test for the presence of Bt protein. Bt protein in cottonseed, milk and blood samples was measured by ELISA method. The amount of Bt protein in BT cottonseed was 52 µg/g cottonseed. Mean voluntary dry matter intake /100 kg body weight varied in the range of 2.61 to 4.07 kg (Av 3.16 ± 0.16) in Bt group and 2,.61 to 3.71 kg (Av 3.32 ± 0.13) in NBt group and cows maintained their body weight during the study. Average milk yield in corresponding groups was 8.15 ± 0.31 and 9.04 ± 0.66 kg/cow/day. The average 4% FCM yield in Bt and NBt groups was 8.87 ± 1.09 and 9.65 ± 0.76 kg, respectively. Average milk yield as well as dry matter intake/100 kg body weight was similar (P>0.05) between the groups. Mean and Standard Error (SE) for fat, protein, and lactose content in yield of Bt group was 4.55 ± 0.18, 2.39 ± 0.08 and 4.64 ± 0.09 % and the value in NBt group was 4.41 ± 0.16, 2.43 ± 0.03 and 4.58 ± 0.18 %, respectively. The analysis of milk did not exhibit the presence of Bt protein in any of the samples in milk of both groups at any stage of sampling in lactating cows. Similarly, Bt protein was not detected in blood plasma of both groups. Lactating dairy cows performed in a similar fashion when fed Bt and non Bt cottonseed during the flour week experimental period. INTRODUCTION
Cotton (Gossypium hirsutum) has been genetically engineered to be resistant to
be resistant to selected insect pests and this resistance has been accomplished by the
insertion of gene from Bacillus thuringiensis var. kurstaki which encodes for the
production of a protein insecticidal to Lepidopteran insect/pests of cotton but is safe to
mammals, birds, fish and beneficial insects. Monsanto Co. has developed transgenic
cotton containing cry-1Ac gene encoding a specific insecticidal protein from Bacillus

thuringiensis (Bt protein). Monsanto Co, USA and Maharashtra Hybrid Seeds Co. Ltd.
(MAHYCO) has crossed genetically modified cotton developed at USA with Indian
cotton on incorporate the cry-1Ac gene into Indian cotton hybrid to minimize the
chemical sprays on the cotton frop and to economize cotton production. Prior to the
commercialization of newly developmed varieties of cotton in India it is essential to
investigate all aspects of cotton producting including the safety of proteins expressed
by the inserted genes by assessing effects on domestic animals and beneficial insects.
Traditionally, cottonseed is used in the ration of lactating animals as a source of
energy and protein (Singhal and Sharma, 1995). Newly developed Indian varieties of
transgenic cottonseed containing the Bt protein were investigated for their feeding
value taking goats as a model of ruminants. It was concluded that Bt cottonseed and
parent cottonseed (Non-Bt) were similar in nutrient composition and there was no
meaningful difference in nutrient and toxicant content between Bt and Non Bt
cottonseed. The growth performance of goats fed on Bt and Non Bt cottonseed was
similar during 90 days of a feeding trial at the Industrial Toxicology Research Centre,
Lucknow ( Dutta and Dogra, 1998). These results indicated that the feeding of Bt
cottonseed to ruminants did not cause any harmful effect on the performance of
ruminants. The purpose of present study was to confirm that Bt cottonseed is
nutritionally equivalent to non Bt cottonseed as a feed for lactating cows and to
determine if the Bt protein is detectable in the milk of cows fed Bt cottonseed.
Therefore, the objective of the present study is to investigate the effect of feeding
transgenic cottonseed (Bt) feeding on milk yield and milk composition in lactating
crossbred cows.
MATERIALS AND METHODS:
Twenty multiparous crossbred cows (KS) were selected from the general herd
of National Dairy Research Institute, Karnal, Calving date and milk yield details of
these animals are given in Table 1. The animals were maintained under loose housing
system and fed a groundnut cake based concentrate mixture as per their milk yield and
green fodder (berseem) ad lib.
Housing of Animals:
All the cows were housed in two well ventilated sheds having pacca floor and
tied with ropes during pretreatment as well as during treatment period of four weeks.
The sheds were equipped to individually feed the cows. Each animal’s manger was
divided into two, one for green fodder and another for concentrate mixture and wheat
straw. All the cows had their identification number tattooed on the hip region as well
as in their ears.
Feeding of Animals:
Initially, all the cows were maintained on the concentrate mixture having
groundnut cake as protein supplement for three days so that they can adjust to the
changed housing system. Therefore, the cows were distributed in two groups of 10
each in a manner that each group was having similar milk yield. Concentrate mixture
was replaced gradually with that containing crushed cottonseed (Non Bt, Control).
After three days cows were stitched over to the new concentrate mixture completely.
In addition to the green fodder (Berseem, Trifolium alexandrinum) fed ad libitum,
each cow was supplied with one kg wheat straw/day to fulfill their dry matter
requirement and to maintain good faecal consistency. Feeding of crushed cottonseed
based concentrate mixture continued for 13 days for the adaptation of rumen microbes
for the changed nutrient supplement. Both the groups were housed in separate shed.
Control group, designated as NBt group, continued receiving the experimental
cottonseed (Bt, MRC-162), crushed similarly as control cottonseed and designated as
Bt group. Composition of concentrate mixtures containing Bt and NBt cottonseeds is
given in Table 2.

Preparation of Concentrate Mixture:
Consignments of crushed cottonseeds (Non-Bt and Bt) received from Mahyco
were stored in a godown (well ventilated store room) safely. The other ingredients
were received from Central Store of NDRI and crushed using hammer mill in feed
unit. Experimental cottonseeds, both Bt and Non Bt, were checked fro the presence of
Bt protein using an adaptation of the ELISA described by Sims and Berberich (1996)
test prior to the preparation of concentrate mixtures. The ingredients of concentrate
mixture were mixed homogeneously using a mixer and both types of concentrate were
stored safelyu in a godown. Fresh green fodder (Berseem) was supplied by Farm
section of the institute, daily.
Table 1. Particulars of the crossbred cows in both the groups
Bt group N Bt group Animal No. Date of calving Milk yield (kg)
at the time of
distribution
Animal No Date of calving Milk yield (kg)
at the time of
distribution
5782 22.12.1999 8.0 5229 26.09.2000 7.3
5920 29.02.2000 9.1 5094 21.05.2000 5.5
5909 30.03.2000 7.9 5922 15.09.2000 7.8
5663 11.04.2000 5.3 5934 21.02.2000 9.1
5816 28.06.2000 7.0 5908 19.03.2000 7.9
5342 01.07.2000 9.2 5956 03.04.2000 8.1
5797 24.07.2000 5.0 5919 14.07.2000 7.7
5519 18.08.2000 16.1 5898 31.08.2000 11.1
5822 14.09.2000 6.6 5675 06.09.2000 8.2
5786 25.10.2000 4.4 6049 20.09.2000 11.0

Table 2 Ingredient composition of concentrate mixture
Name of ingredient Parts
Maize grain 20
Cottonseed (Bt/NBt) 40
Groundnut cake 15
Wheat bran 22
Common salt 1
Mineral mixture 2
Feeding schedule:
Cow in both groups were offered weighed amount of berseem three times a day
i.e. 10 am, 10 noon and 5 pm. One kg wheat straw was offered at 10am to each cow
daily. Respective concentrate mixture was provided to each cow in weighed amount at
the time of milking. Total amount of concentrate mixture was according to NRC
(1978) to fulfill their nutritional requirements. Left over green fodder of individual
cow was weighed daily. Dry matter content of fresh fodder as well as left over
material was determined daily to calculate the dry matter intake. Fresh and clean water
was provided free choice to each cow two times a day.
Milking Schedule:
Cows was weighed daily. Dry matter content of fresh fodder as well as left over
material was determined daily to calculate the dry matter intake. Fresh and clean water
was provided free choice to each cow two times a day.
Milking Schedule:
Cows were milked manually three times a day i.e. 5 am, 12 noon and 6 pm
daily and milk yield for individual cow was recorded. Milk sample from each cow
were collected on 3, 7, 14, 21 and 28th day of initiating the experimental feeding. Milk
samples consist the milk of each milking in proportion of milk yield of individual
cow. Milk samples collected at each milking were stored in a refrigerator prior to their
pooling and analyzed for their composition.
Health Status:
Health of all the experimental cows were monitored daily by a veterinarian
during the course of study. Body weight of each cow was recorded prior to their
feeding and watering in the morning before starting the experimental feeding and
again after completion of four week experimental feeding.
Disposal of Milk:
Total milk collected at each milking from the cows of experimental group was
discarded in a pit which was inaccessible to the animals including birds and dogs.
Blood Sampling:
Blood sample from each cow were collected on 26th day of experimental
feeding by puncturing the jugular vein in a heparinized tube. Plasma was separated by
centrifugation of blood samples at 3000g for 15 min. and analyzed for the presence of
Bt protein on the same day.

Sampling and analysis of feed and milk:
Sample of each type of cottonseed was taken from the supply made by Mahyco
and preserved in polythene bags till analysis.
(i) Feed: Representative samples: of both types of crushed cottonseed and
the respective concentrate mixture were analyzed for dry matter, crude
protein, ether extract, total ash (AOAC, 1990) neutral detergent fibre
(NDF) and acid detergent fibre (ADF) as per Goering and Van Soast
(1970). Pooled dry samples (28 days) of green berseem and left over
feeds were also analyzed for above mentioned proximate and fibre
fractions. Bt and Non Bt cotton seeds were also analyzed for the
presence of Bt-protein. The amount of Bt protein in Bt-cotton seed was
also measured using the ELISA method of Sims and Berberich(l996).
(ii) Milk and blood plasma samples: Milk samples, collected on3, 7,14,21
and 28th day of experimental feeding, were analyzed for fat OSI,
1958), protein (Singhal and Desraj, 1989), lactose (Ferry and Doon,
1950) and somatic cell counts (SCC) using standard procedure ( IDF,
1989) immediately after collection. All the milk samples were frozen in
liquid nitrogen and stored at 200C for the analysis of Bt protein. Blood
plasma samples, collected on 26th day of experimental feeding were
analyzed on the same day. Following procedure was used for this
purpose:
ELISA based sandwich was used for estimation of Bt-protein in Bt cotton seed,
milk and blood samples. The protocol provided by MAHYCO was followed, and is an
adaptation of method described by Sims and Berberich (1996). Blood samples were
centrifuged and plasma was collected. For preparing standard curve for Bt- protein,
either pure Bt-protein or Bt-protein-added-milk/blood samples were used. These
samples were also subjected to the same freaing and thawing steps as used for analysis

of milk and plasma samples collected from lactating cows. Every ELISA plate
contained standard samples. The ELISA procedure was as follows:
ELISA plates, supplied by MAHYCO were pre-coated with monoclonal
antibody against Bt-protein. To each well, 50 µl polyclonal antiserum (rabbit
antiserum against Bt protein) and 150 µl PBSTO (Phosphate buffer saline-Tween 20
ovalbumin) were added. Samples prepared from milk, plasma and cottonseed or milk
and plasma with added Bt- protein were then added in 50 µl volumes. The ELISA
plates were then washed two times with PEST, Then 250 µl goat anti-rabbit IgG
alkaline phosphatase conjugate (1:2500 diluted with PBSTO) was added and ELISA
plates were incubated at room temperature for 2 h. Each well was washed once
quickly and followed by two 5 min. washes with PEST. Then, 250 ~1 of substrate (25
mg para-nitrophenyl phosphate dissolved in 25 mi ethanolamine-HCI buffer, pH 9.8)
was added. After incubating ELISA plate at room temperature for 30 to 60
min,absorbance at 405 nm was recorded.
Following protocol was used for extraction of Bt- protein from milk of blood plasma.:
Milk or serum samples were thawed and diluted in 1:4 ratio with extraction
buffer. The extraction buffer was prepared by mixing 1 mi Sigma cocktail I #P2850),
1 mi Sigma cocktail I (#P5726), 1 mi of 100 mM PMSF (dissolved in isopropanol) to
IxPBS containing O.9% NaCI. Then milk and blood plasma samples were thoroughly
mixed and incubated at 50C overnight. Next day, samples were centrifuged at 10,000
x g for 15 min, at 50C. Supernatant, avoiding fat was removed and used for analysis.
For testing presence of Bt- protein in Bt- cotton seed, dip-stick test was also
used. The sticks were provided by MAHYCO. This is very quick test but relatively
less sensitive as compare to ELISA method Bt- cottonseed gave colored band at
defined position, which is characteristic of Bt- protein in sample. Non Bt-cotton seed
gave negative response.

Statistical Analysis:
Statistical analysis of the data on daily dry matter intake , daily milk yield as well as
milk composition determined at various intervals were considered while using the
student's paired "t' test( Snedecor and Cochran, 1967).
RESULTS
Chemical composition of Bt and Non-Bt cottonseed indicated that the nutritive
value of both the protein supplements was similar, however, Bt cottonseed contained
higher oil, protein and lower ADF contents than that in Non-Bt cottonseed. The Bt
cottonseed contained 52 µg/g Bt protein whereas this protein was not detected in Non-
Bt cottonseed (Table 3).
Lactating cows in Bt and NBt groups were fed according to their nutritional
requirements , however, the dry matter intake was higher by 36 per cent and crude
protein intake was higher by 47 per cent than the recommended requirement given by
Kearl (1982). The TDN intake was as per the recommended level (Table 5). The
concentrate mixtures were formulated to ensure about 2 kg cottonseed intakes as per
the protocol agreed upon by the sponsor. The concentrate mixtures were palatable as
evident from their rapid consumption in both the groups. Concentrate mixtures, mixed
with wheatstraw was consumed selectively, however, wheat straw was consumed
completely by all the cows daily. Green fodder contained about·88 percent moisture
and the faecal consistency was loose in spite Of feeding dry roughage i.e. wheat straw.
Feed intake:
Intake of berseem, wheat straw and concentrate mixture was recorded daily and
the dry matter intake was calculated based on moisture determinations The total dry
matter consumed per day of the concentrate mix, berseem and wheat straw during
adaptation period as well as during experimental period is presented in Table 5. Mean
total dry matter intake during adaptation period was 12.15 ± 0.08 and 12.27 ± 0.16 kg
in cows allotted to Bt and NBt group, respectively. During the experimental period of
four week the value in Bt and NBt group was 12.13 ± 0.11 and 12.39 ± 0.18 kg and
the variation between groups was non- significant In addition, the consumption of
berseem, wheat straw and concentrate mix were similar between the two groups. Total
DM intake /1M)kg body weight in Bt and NBt group was 3.16 ± 0.16 and 3.32 ± 0.13
kg, respectively. These values were higher by 36 per cent than that recommended by
feeding standard ( Kearl 1982). Concentrate to roughage ratio i.e. 37:63 (on dry matter
basis) was similar in both the groups and this ratio is considered optimum for medium
yielding cows.
Milk production performance:
The milk yield improved beyond the initial milk yield during feeding of Non-
Bt cottonseed as a part of concentrate mixture during the adaptation period, The
average milk yield at the time of selection i.e. before starting the feeding of cottonseed
based diet of animals was similar in both the groups (Figure 1). Mean ± SE milk yield
in cows allotted to Bt and NBt groups was 7.47 ± 0.81 and 7.99 ± 0.45 kg,
respectively and the variation between the groups was non-significant ~0.05). When
these groups were fed their respective treatment diet the milk yield further improved
and the average (meant SE) milk yield in Bt and NBt groups was 8.15 + 0.31 and 9.04
c 0.66 kg, respectively, The application of students 't' test indicated non-significant
difference in milk yield between the groups. When the milk yield was calculated as
4% FCM, the milk yield in Bt and NBt group was 8.87 ± 1.09 and 9.65 ± 0.76 kg,
respectively and again variations for milk yield and 4% FCM yield between the
groups were non-significant.
Health Status:
In general, the animals maintained good health during the entire experimental
period None of the animal exhibited any symptom of sickness, howevs, one animal in
Pt group showed reluctance towards the Bt concentrate for few days and during that
period she was given Himalayan Batisa, an Aauervedic appetizer. Cows maintained

their body weight. Before starting the experimental feeding the average body weight
in Bt and NBt group was 411.7 ± 55.2 and 385.6 ± 56.5 kg, respectively and the final
body weight (after terminating the experimental feeding) was 432.7 ~ 18.9 and 401.2 i
17.6 kg, respectively table 5). These results showed an average improvement in body
weight was about 22 kg in Bt group and 16 kg in NBt group during four weeks of
experimental feeding. Mastitis or any other disease was not detected in any of the
cows of both the groups during the experimental period.
Milk composition:
Milk composition in terms of fat protein lactose, SCC and Bt protein wee
determined on 3, 7, 14, 21 and 28th days of experimental feeding to check the
influence of dietary treatments on milk composition Data on milk composition is
presented in Table 6.
Fat: Average (mean ± SE) milk fat content was highs in Bt group than in NBt group
irrespective of day of milk sampling. Overall fat content in Bt and NBt groups was
4.55 ± 0.18 and 4.41 ± 0.16 percent respectively. The variation in fat content between
the groups was non- significant
Protein: Average (mean ± SE) milk protein content in Bt and NBt groups at various
intervals was similar and the difference in milk protein content between groups was
non- significant. The overall average milk protein content in Bt and NBt groups was
2.39 ± 0.08 and 2.39 ± 0.08 percent, respectively. These results showed that feeding
cottonseed, irrespective of the variety, did not influence the milk protein content
Lactose: Average (mean ± SE) milk lactose content varied in the range of 3.87 to
4.25 percent irrespective of group or sampling day. The milk lactose did not show any
pattern at different sampling days. The average milk lactose content in Bt and NBt
groups was similar (P>0.05) (4.6.4 + 0.09 and 4.58 + 0.18 percent in Bt and NBt
group, respectively).

Bt protein in milk: ELISA method, used for the estimation of Bt protein in milk
samples, has a sensitivity to detect 0.002 ppm Bt protein in milk samples. Bt protein
was not detected in any of milk sample drawn on various sampling intervals, both the
Bt and NBt groups.
Bt-protein in blood: ELISA method used for estimation of Bt protein in blood
plasma samples has a sensitivity to detect 0.004 ppm Bt protein in blood plasma
samples. No Bt protein was detected in any of the blood plasma samples in both the
Bt and NBt groups.
DISCUSSION
Nutrient composition of Bt cottonseed as well as non-Bt cottonseed (Table 3)
indicated that both the seeds had similar composition. Bt cottonseed contained
slightly higher oil and protein contents than non-Bt cottonseed, but the differences
may not be statistically significant Similar variation in proximate composition in both
varieties of cottonseed was reported by Subramaian at al. (personal communication).
The values for proximate and fiber fractions in both types of cottonseed were within
the normal range reported by Berberich, ei a1.(1996) who also concluded that the
insect protected cottonseed was equivalent to that of conventional cottonseed. Similar
proximate composition of cottonseed was reported by Learl (earl (1982). ADF content
was lower and NDF content was higher in Bt cottonseed than in non-Bt cottonseed
which may be attronited tp ots jogjer hamicellulose content Nutrient composition of
concentrate mixture reflected the variation in Bt and Non Bt cottonseeds while the
composition of berseem and wheat straw was similar to the reported values in the
literature (Sen and Ray, 1971).
The dry matter intake in both the Bt and NBt groups of cows was similar
during the adaptation period as well as during the experimental period The TDN
intake in both the groups was similar to the recommendations of Kearl (1982),

however, crude protein intake was about 4T per cent higher than the recommended
values which may be attributed to the ad lib feeding of berseem fodder (Table 5).
These results suggested that the inclusion of Bt cottonseed in the diet of dairy cows
did not affect the feed intake during four weeks of feeding trial. Similar findings were
reported by Dutta and Dogra (1998) after the dietary inclusion of Bt and non- Bt
cottonseeds in the ration of goats.
Average milk yield as well as 40/0 FCM yield increased following the shifting
of cows from normal farm ration to cottonseed (Non-Bt) based ration during
adaptation period which may be attributed to the higher oil content in cottonseed
based ration than in normal farm ration The magnitude of increase was maintained
during the four week experimental period as both the rations were having almost
similar composition. Based on the adaptation period milk yields, cows in the Bt group
had stabilized their production whereas cows in the NBt group were still increasing so
at the start of the treatment period, cows in NBt group already had higher production
than those in the Bt groups. Increase in milk yield was higher in NBt group than in Bt
group but this difference existed even at the time of allotment of treatment diets and
persisted throughout the experimental period The non-significant difference between
the groups indicated that dietary inclusion of Bt cottonseed did not influence the milk
yield in crossbred dairy cows.
Body weight of experimental cows in both the groups was improved during the
experimental period ~able 5) and there was no symptom of any disease during four
weeks of experimental feeding. The improvement in body weight may be attributed to
the high caloric value of cottonseed due to its higher ether extract content than that of
normal farm ration based on expeller pressed groundnut cake as a source of protein.
Data on milk composition revealed that the milk fat, protein and lactosecontent
were similar (pz0.05) in Bt and NBt groups (Table 2).

Bt protein was not detected in milk samples, collected during the course of
study. From the data it was calculated that average Bt prdtein intake was 93.6 mg/day
in Bt group, which got destroyed in the digestive tract of dairy cows. Ream (1994)
studied in vitro digestive fate of Bt protein ( Bacillus thuringiensis var. kurstaki HD
73) and reported that the Bt protein and its associated functional activity readily
degraded upon exposure to gastric nuid in the mammalian digestive tract. Dutta and
Dogra (1998) recorded the growth performance of ruminants, taking goat as ruminant
model, fed on Bt and non-Bt cottonseeds based diets and did not find any significant
effect on their growth performance without any toxicity symptom and they concluded
that cottonseed containing the Bt protein was as wholesome and safe for feeding
ruminants as cottonseed without Bt protein. Bt protein was not detected in the blood
plasma samples of Bt and NBt groups on 26m day of feeding the experimental diets.
These results further confirmed that dietary Bt protein was destroyed in the digestive
tract of dairy cows.
In the present study, there were no statistical differences in feed intake, weight
gain, milk yield and milk composition between cows fed Bt cottonseed compared to
cows fed non-Bt cottonseed. Therefore, it is concluded that Bt cottonseed is as
nutritious and wholesome as non-Bt cottonseed as a feed for dairy cows. Furthermore,
no Bt protein was detected in milk or blood plasma samples of cows fed either Bt or
non-8t cottonseed.
ACKNOWLEI)GEMENT
Authors are grateful to Dr.B.N. Mathur, Director, and Dr. N. Balaraman, Joint
Director (IEesearch), National Dairy Research Institute for extending the facilities
and moral support during the course of study. We are thankful to Dr. S.P. Agarwal
Incharge, Consultancy Cell for his continuous cooperation. Cooperation and help
provided by DGT.K7Nalli, Incharge, Dairy Cattle Nutrition Division, B.K. Joshi
Head, Animal Genetics and Breeding Division and Dr. RC. Sharma, Incharge, Cattle
yard are duly acknowledged. Laboratory facilities provided by Dr. Mahendra Singh,
Sr. Scientist and assistance of Mr. Anil Kumar, Mahyco, Jalana for milk analysis are
also acknowledged. Assistance provided by Mr. Santhil Kumar, and Sahia Ram
during the study and the moral support of faculty members of Dairy Cattle Nutrition
Division are worth mentioning.
References: AOAC (1990) Official Methods of Analysis. Association of Official Analytical
Chemists, Arlington,Va,USA Berberich, S.A., J.E. Ream, T.L. Jackson, R. Wood, R. Stipanovic, P. Harvey, S.
Patzer, and R.L. Fuchs. (1996). The composition of insect-protected cottonseed is equivalent to that of conventional cottonseed. Journal of Agricultural and food Chemistry 44:365-371.
Dutta, K.K.and Dogra, R.K.S. (1998) A 90 days feeding study with cottonseed in goat. Final Report, Industrial toxicological research Institute, Lucknow, India.
Goering, H.K. and Van Soast, P.J. (1970) Forage Fibre Analysis. Agril handbook 379, ARS, USDA, USA
IDF (1997) Recommendations for the presentation of mestatis related data. International Dairy Federation. Bulletin No 321, pp 16-21
I.S.I. (1958) Determination of fate in whole milk, evaporated milk, separated milk, skin milk, butter milk and cream by Gerber method. I.S: 1224, Indian Standards Institute, Manak Bhavan, New Delhi.
Kearl, L.C. (1982) Nutrient requirements of ruminants in developing countries. International Feedstuffs Institute, Utah State Agricultural University, Logan, Utah, USA
NRC (1978) Nutrients Requirements of Dairy Cattle. National Research Council, Washington DC.
Perry, N.A. and Doon, R.J. (1950) Picric acid method for simultaneous determination for lactose and sucrose in dairy products. Journal of Dairy Sci., 33:176.
Ream, J.E. (1994) Assessment of the in vitro digestive fate of Bacillus thuringiensis var. kursstaki HD 73 protein. Monsanto Co., Agricultural group-new product division, 700 Chesterfield Parkway North, St. Louis Mo 63198, USA
Sen, K.C. and Ray, S.N. (1971) Nutritive value of Cattle Feeds and Feeding of Animals, Indian Council of Agricultural Research, New Delhi, India.
Sims, S.R. and Berberich, S.A. (1996) Bacillus thuringiensis Cry 1A protein levels in raw and processed seed of transgenic cotton: Determination using insect bioassay and ELISA, Journal of Econ. Entomol. 89:248-251.
Singhal, K.K and Sharma, D.D. (1995) Cottonseed and its meal for livestock feeding Agril Reviews 16(1): 7-22
Singhal, O.P. and Desraj (1989) New approaches for chemical quality assurance, Indian Dairyman, 41:43-47.
Smedecpr. G.W. and Cocharan, W.G. (1997) Statistical Methods. 6th Edn. The Owa State College Press, Ames, Iowa, USA.

Table 3. Chemical composition of Bt and Non-Bt cottonseed (% Dry matter basis)
Parameter Bt cottonseed Non Bt cottonseed Organic matter 95.06 95.31 Crude protein 29.48 26.90 Ether extract 21.12 19.22 Crude fibre 18.24 21.73 Total ash 4.94 4.69 Neutral detergent fibre (NDF) 54.88 48.59 Acid detergent fibre (ADF) 21.61 27.67 Hemicellulose 33.26 20.92 Bt Protein (µg/g) 52.00 0.0
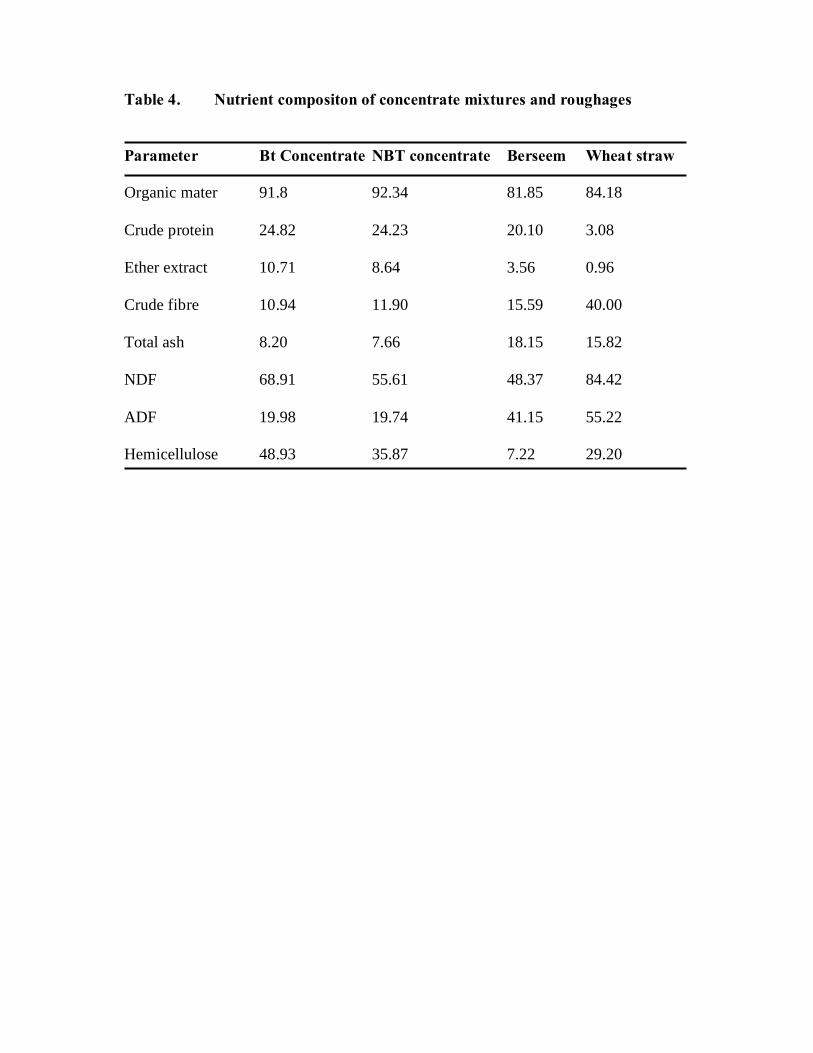
Table 4. Nutrient compositon of concentrate mixtures and roughages Parameter Bt Concentrate NBT concentrate Berseem Wheat straw Organic mater 91.8 92.34 81.85 84.18 Crude protein 24.82 24.23 20.10 3.08 Ether extract 10.71 8.64 3.56 0.96 Crude fibre 10.94 11.90 15.59 40.00 Total ash 8.20 7.66 18.15 15.82 NDF 68.91 55.61 48.37 84.42 ADF 19.98 19.74 41.15 55.22 Hemicellulose 48.93 35.87 7.22 29.20

Table 5. Performance of crossbred cows on Bt and non-Bt cottonseed based rations Parameter BT group NBt group Av. Initial body weight (Kg)* 411.7 ± 55.24 385 ± 56.5 Av. Final body weight (Kg) 432.7 ± 18.93 401.3 ± 7.55 Av. Body weight gain (Kg) 21.0 15.6 During 4 weeks DM intake during adaptation period (Kg/day)** Berseem 6.69 ± 0.13 6.78 ± 0.19 Wheat straw 0.9 ± 0.03 0.9 ± 0.03 Concentrate mixture 4.5 ± 0.05 4.5 ± 0.05 Total DM intake 12.15 ± 0.08 12.27 ± 0.16 DM intake/100kg b. wt. 3.11 ± 0.31 3.27 ± 0.29 Milk production during adaptation period (Kg/day)** Milk yield 7.47 ± 0.81 7.99 ± 0.45 4% FCM yield 7.90 ± 0.95 8.20 ± 0.23 DM intake /kg milk yield 1.62 1.53 DM intake during experimental period (Kg/day)*** Berseem 6.73 ± 0.12 6.99 ± 0.17 Wheat straw 0.9 ± 0.03 0.9 ± 0.03 Concentrate mixture 4.5 ± 0.05 4.5 ± 0.05 Total DM intake 12.13 ± 0.11 12.39 ± 0.18 Crude protein intake 2.46 2.47 TDN intake 7.33 7.76 DM intake/100 kg b. wt. 3.16 ± 0.16 3.32 ± 0.13 Milk production during experimental period (Kg/day)*** Milk yield 8.15 ± 0.31 9.04 ± 0.66 4% FCM yield 8.87 ± 109 9.65 ± 0.76 DM intake/kg milk yield 1.48 1.37 * Each value is an average of 10 observations ** Each value is an average of 130 observations *** Each value is an average of 280 observations Each value represents the mean and standard error.
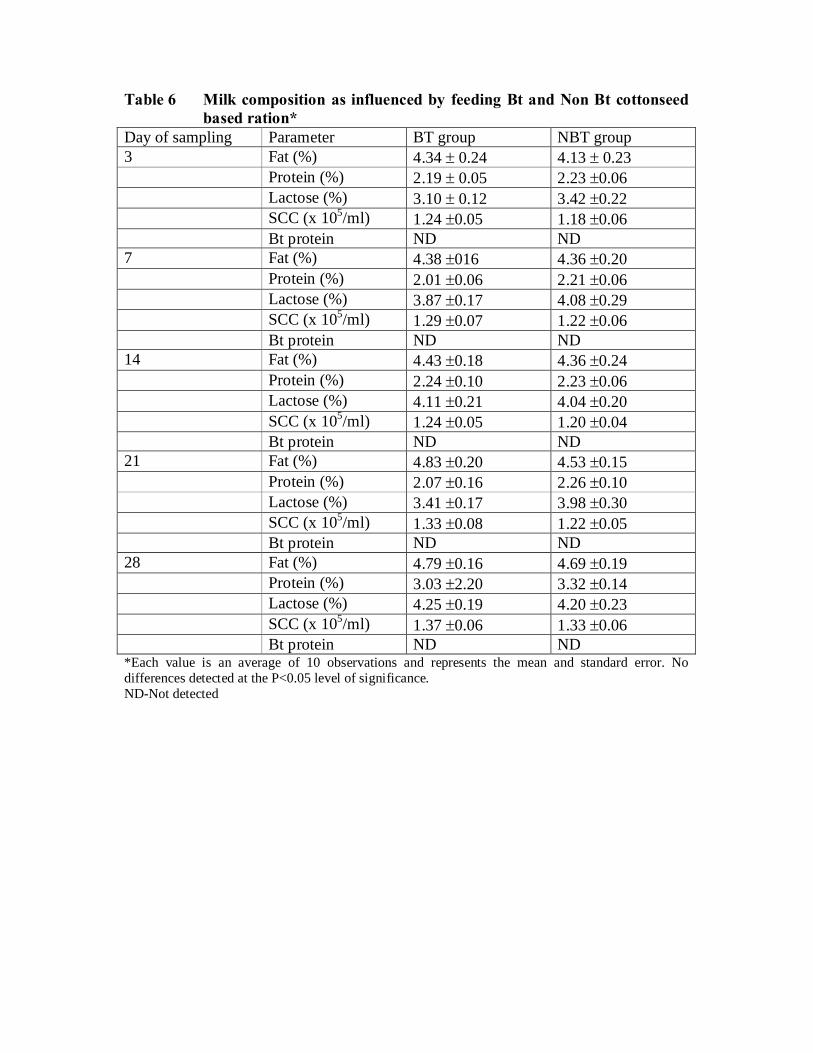
Table 6 Milk composition as influenced by feeding Bt and Non Bt cottonseed based ration*
Day of sampling Parameter BT group NBT group 3 Fat (%) 4.34 ± 0.24 4.13 ± 0.23 Protein (%) 2.19 ± 0.05 2.23 ±0.06 Lactose (%) 3.10 ± 0.12 3.42 ±0.22 SCC (x 105/ml) 1.24 ±0.05 1.18 ±0.06 Bt protein ND ND 7 Fat (%) 4.38 ±016 4.36 ±0.20 Protein (%) 2.01 ±0.06 2.21 ±0.06 Lactose (%) 3.87 ±0.17 4.08 ±0.29 SCC (x 105/ml) 1.29 ±0.07 1.22 ±0.06 Bt protein ND ND 14 Fat (%) 4.43 ±0.18 4.36 ±0.24 Protein (%) 2.24 ±0.10 2.23 ±0.06 Lactose (%) 4.11 ±0.21 4.04 ±0.20 SCC (x 105/ml) 1.24 ±0.05 1.20 ±0.04 Bt protein ND ND 21 Fat (%) 4.83 ±0.20 4.53 ±0.15 Protein (%) 2.07 ±0.16 2.26 ±0.10 Lactose (%) 3.41 ±0.17 3.98 ±0.30 SCC (x 105/ml) 1.33 ±0.08 1.22 ±0.05 Bt protein ND ND 28 Fat (%) 4.79 ±0.16 4.69 ±0.19 Protein (%) 3.03 ±2.20 3.32 ±0.14 Lactose (%) 4.25 ±0.19 4.20 ±0.23 SCC (x 105/ml) 1.37 ±0.06 1.33 ±0.06 Bt protein ND ND *Each value is an average of 10 observations and represents the mean and standard error. No differences detected at the P<0.05 level of significance. ND-Not detected


Effect of feeding Bt cottonseed on fed intake milk production and
compostion in lactating water buffaloes
Chapter V
Annexure 5
REPORT
Effect of Feeding Cottonseed Produced from Bt Cotton on Feed Intake, Milk Production and Composition in Lactating Water Buffalo in
India
Study Sponsor MAHARASHTRA HYBRID SEEDS COMPANY LIMITED
RESHAM BHAVAM, 4th Floor, 78, VEER NARIMAN ROAD
MUMBAI 400 020
2001
Department of Animal Nutrition College of Veterinary Sciences
G.B. Pant University of Agriculture and Technology Pantnager – 260 145, Uttranchal

Report
April, 2001
Study Title
Effects of Feeding Cottonseed Produced from Bt Cotton on Feed Intake, Milk Production and Composition in Lactating Water
Buffalo in India Principal Investigator Dr. D/P/ Tiwari Co Investigators Dr. B.D. Lakhchaura
Technical Assistants Dr. Maha Singh
Dr. Seema Chavan
Head of the Institution Dr. Amreesh Kumar
Dean College for Veterinary Sciences
G.B. Pant University of Agriculture and Technology
CONTENTS Page
• Statement of No data Confidentiality Claim……………………………….1
• Statement of Particulars of Study…………………………………………..2
• Abbreviations………………………………………………………………3
• Abstract…………………………………………………………………… .4
• Introduction………………………………………………………………...7
• Materials and Methods……………………………………………………..9
• Results…………………………………………………………………… .16
• References……………………………………………………………...…19
• Tables…………………………………………………………………..…20

Statement of No Data Confidentiality Claims
This is to certify that the performing laboratory is not making any claim of confidentiality for any information in this study.
This performing laboratory also states that the issues related to raw data and
materials will be stored in the laboratory and will be accessible to the authorized scientists of the laboratory and/or persons authorized by the sponsors. The workers on the project are free to publish the data in the form of research paper or in any other form.
Principal Investigator Dr. D.P. Tiwari Designation Professor and Head Department of Animal Nutrition
Statement of Particulars of Study Title Effects of feeding cottonseed produced from
Bt cotton on feed intake, milk production and composition in lactating water buffalo in India.
Facility Department of Animal Nutrition College of
Veterinary Sciences G.B. Pant Univ. of Agriculture & Technology Pantnagar. Fax: 05944-333473
Study Director Dr. D.P. Tiwari Co-Study Director Dr. B.D. Lakhchaura Investigators Dr. Maha Singh & Dr. Seema Chavan Study Initiation Date 22.02.2001 Experimentation Termination Date 16.04.2001 Record retention Raw data of the study will be retained by the
Study Director and this will be made available to the authorized personal from the sponsors
Abbreviations
ADF Acid Detergent Fibre
ad lib. Ad libitum
Bt Bacillus thuringiensis oC degree Celsius
FCM Fat Corrected Milk
DM Dry Matter
g gram
l litres
kg Kilogram
MAHYCO Maharashtra Hybid seed company
mg milligram
NDF Natural Detergent Fibre
NBt Non Bascillus thuringiensis
µg microgram
SCC Somatic Cell Count

ABSTRACT
Twenty lactating Murrah buffaloes in mid lactation were housed in a we8ll
ventilated shed with an arrangement for individual feeding. Buffaloes were fed on a
concentrate mixture consisting of 39.5 parts crushed cotton seed (Non-Bt.), 59.5 parts
milk feed and 1 part mineral mixture as per nutritional requirements along with 20 kg.
Mixed green fodder (Oats + Berseem ) and wheat straw old lib for 18 days to adapt
the animals to a cotton-seed based diet. Thereafter, buffaloes were divided into 2
groups of 10 each on the basis of their milk yield and lactation number. Buffaloes in
group 1 were continued on the same concentrate misture (Non-Bt. group), whereas
buffaloes in group 11 were fed concentrate mixture containing 39.5 parts crushed Bt.
cotton seed (Bt. group) instead of cotton seed in accordance with the nutritional
requirements along with 20 kg. Mixed green fodder (Oats + Berseem) and wheat straw
adlib. For 35 days during experimental feeding period. The allowance of concentrate
mixture was offered two times to each buffalo at the time of milking at 4.00 a.m. and
4.00 p.m. daily. The buffaloes were offered green fodder and wheat straw twice daily.
All the buffaloes were also offered adlib.clean drinking water thrice in a day. The
average initial milk yield of buffaloes was yield, voluntary feed intake (concentrate
mixture, green folder and wheat straw) were maintained during adaptation and
experimental feeding periods. The representative samples of milk from each buffalo
were collected on 7th to 14th and 21st to 28th day and 35th day of the experimental
feeding for analysis of milk for its chemical composition and also for testing for the
presence of the Bt. Protein. After 35 days of experimental feeding, blood samples
were also collected for testing the presence of Bt. protein. Bt. protein Cry 1 Ac in
crushed non Bt. cotton-seed and crushed Bt. cotton seed, milk samples and blood
samples was estimated by an ELISA method specific to the Cry 1 Ac protein.
The presence of the Bt. protein in both non-Bt and Bt. Cotton seed was also
tested by a strip test method in which Bt. cotton seed gave colored band whereas non-
Bt. cotton seed gave negative (no band) results. The Bt. cotton seed contained 20
µg/Bt protein/g.
The average initial body weight of experimental buffaloes was 442.1 and 468.9
kg. In non-Bt. and Bt. groups, respectively. The voluntary dry matter intake per 100
kg body weight ranged from 3.32 to 4.37 kg. In non Bt. group and from 3.18 to 4.52
kg in Bt. group. The average DM intake per 100 kg body weight was 3.98 and 3.75 kg
in non-Bt and Bt. groups, respectively. The quantity of non-Bt. Cotton seed and Bt
Cotton seed as percent of total dry matter intake was 10.75 and 10.83% in buffaloes
fed non-Bt. and Bt. groups, respectively. The quantity of non-Bt. Cotton seed and Bt.
Cotton seed as percent of total dry matter intake was 10.75 and 10.83% in buffaloes
fed non-Bt. and Bt. cotton seed, respectively. During the experimental feeding period,
the average daily milk yield was 4.88 and 4.87 kg, respectively in non-Bt. and Bt.
groups of buffaloes. The 4% FCM yield was 8.47 kg, and 8.04 kg., respectively in
non-Bt. and Bt. cotton seed was 8.99 and 9.61% respectively. The voluntary DM
intake, milk yield, 4% FCM yield and fat % values were comparable in both the
groups of buffaloes.
The milk samples tested on 7th, 14th and 21st to 28th day and also on 35th day of
sampling in buffaloes fed Bt. Cotton seed did not show the presence of Bt. protein at
any stage of sampling. Similarly, the blood samples collected after 35 days of feeding
did not show the presence of Bt. protein. The present study shows that voluntary DM
intake, milk yield, FCM yield and fat % in milk were comparable between buffaloes
fed Bt. cotton seed and non-Bt cotton seed. It is concluded from this study that Bt.
cottonseed is as nutritious and sholesome as non-Bt. cottonseed to support the milk
yield and development of buffaloes.
However the study is in progress for determining the digestibility of different
nutrients in buffaloes fed non-Bt, and Bt. cotton seed. The analysis of milk for its
composition and statistical analysis are in progress.

INTRODUCTION
Cotton (Gossypium hirsutum) has been genetically modified to provide
resistance against certain insects and pests specially against bollwonn comples. This
resistance has been produced by insertion of insect tolerance trait with gene coding for
Cry 1 Ac protein derived from Bacillus thuringiensis (Bt.) Var. kurstaki which
encodes for the production of a protein insecticidal to lepidopteran insects/pests of
cotton but is safe to animals, birds, fish and beneficial insects. Monsanto Co. has
developed a transgenic cotton containing Cry 1 Ac gene encoding a specific
insecticidal protein from Bascillus thuringiensis (Bt. Protein). Maharashtra Hybrid
Seeds Co. Ltd. (MAHYCO) has crossed genetically engineered cotton developed by
Monsanto in USA with Indian cotton to insert the Cry 1 Ac gene into Indian cotton
hybrid to minimize the chemical sprays on the cotton crop and has given crop
producers an alternative strategy for managing insect/pest pressure with low cost.
Prior to the commercialization of newly developed variety of cotton (Bt. cotton) in
India, it is essential to investigate all aspects of cotton production including the safely
of proteins expressed by the inserted genes by assessing the effects on domestic
animals and beneficial insects.
Traditionally cotton seed is utilized in the ration of lactating crows and
buffaloes as a source of energy and protein. Newly developed transgenic cotton seed
in India by Mahyco which contains Bt. protein has been investigated for its feeding
value in goats as a model of ruminants at Industrial Toxicology Research Centre,
Lucknow and it is reported that Bt. cotton seed and parental cotton seed (Non-Bt.)
were similar in nutrient composition with no significant difference in nutrient and
toxicant contents between Bt. and non-Bt. cotton seed. The growth performance of
goats fed rations containing Bt. and non-Bt cotton seed was similar during 90 days of
a feeding trail (Dutta and Dorga, 1998). These findings indicated that the feeding of
Bt. cotton seed to ruminants did not cause any harmful effect on their performance.
The primary purpose of the present study was to assess the nutritional value of Bt.
cotton seed in comparison to non-Bt. cotton seed in lactating water buffaloes and also

to determine if the Bt. protein is detectable in milk and blood of the lactating buffaloes
fed ration containing Bt. cotton seed. In view to genrate the information, the present
study was undertaken to investigate the effect of feeding transgenic cotton seed (Bt.
cotton) on milk yield, milk composition and nutrient utilization in lactating murrah
buffaloes.
Materials and Methods:
Twenty multiparous lactating Murrah buffaloes in mid lactating were selected
from herd of the Livestock Research Centre, G.B. Pant University of Agriculture and
Technology, Pantnager. All the animals were maintained under stall feeding on milk l
(concentrate) as per their milk yield and green folder (Oats + Berseem) ab lib.
Housing of Buffaloes:
All the buffaloes were housed in a well ventilated shed having pucca floor and
tied with iron chain having tail to tail arrangement during control (adaptation) period
of 18 days as well as during experimental feeding period of 35 days. The manger was
partitioned for individual feeding of buffaloes and they were tied with such a distance
so as to avoid access to the manger of other buffaloes. All the buffaloes included
under the study had their identification number uniquely tattooed on the hip region.
Feeding of Animals:
Initially at the buffaloes maintained on milk feed (concentrate) and green
fodder (Oats+berseem) ad lib. Were fed concentrate misture consisting of 39.5 parts
crushed cotton seed. Milk feed 59.5 parts ad miniral mixture 1 part as per nutritional
requirements (Kearl. 1982) alongwith 20 kg green fodder (Oats+berseem_ and wheat
straw ad lib. For 18 days as adaptation period to accustom the rumen microbes for
changed feed supplement. After adaptation period, the buffaloes were divided into 2
groups of 10 each on the basis of their milk yield and lactation number so that each
groups was having similar milk yield. The details the buffaloes are given in Tble 1.
The buffaloes in group I were continued on the same concentrate mixture (non-Bt.
group). Whereas the buffaloes in group II were fed concentrate misture containg 19.5
parts crushed Bt. cotton seed (Bt. group. MRC-162) in place of cotton seed as per their
nutritional requirements (Kearl, 1982) alongwith 20 kg. Green fodder (Oats+berseem)
and wheat straw adlib. to fulfill their dry matter requirement and to maintain good

faecal consistency. The experimental feeding period latest for 35 days. The
composition of concentrate mixtures containing non-Bt. cotton seeds is given in Table
2.
Table1. Details of lactating Murrah buffaloes in Non-Bt. groups. Non – Bt. group Bt. group
S. No. Animal
No.
Date of
Calving
Average milk
Yiedl
(kg./day)
at the time of
distribution
Animal
No.
Date of
Calving
Average
milk
Yield
(kg./day) at
the time of
distriution
1. 374 3.12.2000 7.2 388 10.12.2000 7.2
2. 404 27.9.2000 6.8 390 26.6.2000 7.0
3. 411 - 6.5 400 9.9.2000 6.3
4. 355 15.9.2000 5.5 384 28.9.2000 5.7
5. 407 30.6.2000 4.5 393 6.8.2000 5.6
6. 408 20.7.2000 5.2 397 15.8.2000 5.3
7. 363 21.8.2000 4.1 357 7.9.2000 3.8
8. 405 26.6.2000 4.2 394 3.9.2000 4.4
9. 406 4.7.2000 3.6 395 26.6.2000 3.4
10. 409 - 2.9 410 - 2.0

Table 2 : Composition of concentrate mixtures fed to buffaloes during
experimental feeding period.
Ingredients Parts
Cotton seed (Non-Bt./Bt.) 39.5
Milk feed (concentrate) 59.5
Mineral Mixture 1.0
Preparation of concentrate Mixture.
Consignments of crushed cotton seeds (non-Bt. and Bt.) received from Mahyco were
stored in a well ventilated store room safely. The milk feed (concentrate) was received
from Livestock Research Centre. The experimental cotton seeds both non-Bt, and Bt.
were tested for the presence of Bt. protein using ELISA by the method as described by
Sims and Berberich (1996). The ingredients of concentrate mixture were mixed
homogenously and both types of concentrate mixtures were stored safely in the
storeroom. The fresh mixed green fodder (Oats+Berseem) after chffing and wheat
straw were supplied by the Livestock Research Centre of the university daily.
Feeding Schedule:
The buffaloes of both the groups were offered the weighed quantity of respective
concentrate mixturate mixture in two instalments half an hour before milking i.e. at
4.00 a.m. and 4.00 a.m. daily according to their nutritional requirements (kearl, 1982).
20 kg. Mixed green fodder (Oars+ Berseem) was offered to each buffalo twice a day
at 9.00 a.m. and 3.00 p.m. in equal instalments and wheat straw was offered ad lib. To
fulfill the dry matter requirement. Left over wheat straw along with little green fodder
of individual burraloes was weighed and recorded daily. The dry matter content of the
feeds offered and left over was determined weekly and during digestion trial daily to
calculate the dry matter intake. All the buffaloes were also offered fresh clean
drinking water thrice in a day.

Milking Schedule:
All the buffaloes were miled twice daily at 4.30 a.m. and 4.30 p.m. the milk
yield of individual buffalo was recorded daily. Milk samples from each buffalo were
collected on 7th , 14th , 21st and 28th and 35th day of the experimental feeding period for
determing the chemical composition and for testing the presence of Bt. protein. The
milk samples collected in the evening milking were stored in a refrigerator and then
pooled with the samples of morning milking prior to analyze for chemical
composition.
Health Status:
The Veterinary Officer did proper monitoring for health status of all the
experimental buffaloes during the course of study. All the buffaloes were weighed for
3 consecutive days prior to the start also at the end of experimental feeding period of
35 days before morning feeding and watering.
Disposal of Milk:
The total milk of the experimental buffaloes fed ration containing Bt. cotton
seed (Group II) at each milking was collected in a milk can and discarded in a soaking
pit which was not accessible to other animals including dogs and birds.
Blood Sampling:
Blood samples from Murrah Buffalo were after 35th day of experimental
feeding period by puncturing the jugular vein in test tubes containing anticoagulant
and analyzed for the presence of Bt. protein on the same day.
Sampling and analysis of feed and milk:

Feed:
Sampling of non Bt. cotton seed and Bt. cotton seed both supplied by Mahyco
were taken in the polythene bags for proximate analysis and for testing of Bt. protein
in Bt. cotton seed. Representative samples of feed offered and residue left were also
collected for analysis of any matter, crude protein, mater extract, crude fibre and total
ash (AOAC, 1990), neutral detergent fibre (NDF) and acid detergent fibre (ADF) as
per Goering and Van Soast (1970). The amount of Bt. protein in Bt. cotton seed was
measured using ELISA method (Sims and Berberich, 1996).
Milk:
Representative milk samples were collected from individual buffalo of both the
groups during experimental feeding period from morning and evening milking and
pooled on 7th, 14th , 21st to 28th and 35th day of experimental feeding. The pooled
samples were analyzed for fat ( ISI, 1958), protein, ash (AOAC, 1990), lactose and for
somatic cell counts (SCC) using standard procedure (IDF, 1989). All samples of milk
were analyzed for Bt. protein on the same day following the ELISA method as
described by Sims and Berberich (1996).
Blood:
Blood samples from each buffalo were collected on 35th day of experimental
feeding and analyzed for the presence of Bt. protein (Sims and berberich, 1996).
The following procedure was used for the Bt. or Bt. cotton seed, milk and
blood samples. The protocol provided by Mahyco was followed which is an
adaptation of method described by Sims and Berberich (1996).

Blood samples were centrifuged at 3000 rpm an plasma was separated and
collected. For preparing the standard curve for Bt. protein, either pure Bt. protein or
Bt. protein added milk or blood samples were used. These samples were also
subjected to freexing and thawing steps as used for analysis of milk and plasma
samples collected from lactating buffaloes. Every ELISA plate contained standard
samples. The ELISA procedure was as follows:
ELISA plats supplied by Mahyco were pre-coated with monoclonal antibody
against Bt. protein. To each well, 50 µl polyclonal antiserum (rabbit anti serum
against Bt. protein) and 150 µl good anti-rabbit lg G alkaline phophatase conjugate
(1:2500 diluted with PBSTO) was added and ELISA plates were incubated at room
temperatures for 2 hours. Each well was washed once again quickly, followed by two
5 minutes washes with PBSTO. Thereafter, 250 µl of substrate (25 mg
paranitrophenyl phosphate dissolved in 25 ml ethanol amine – HCL buffer, Ph 9.8)
was added. After incubating ELISA plate at room temperature for 20 to 60 minutes,
absorbance at 405 nm was recorded.
Following protocol was used for extraction of Bt. protein from milk and blood
plasma samples:
Milk or serum samples were thawed and diluted in 1:4 ratios with extraction
buffer. The extraction buffer was prepared by mixing 1 ml Sigma cocktail I (#P2850),
1 ml Sigma cocktail II (#5726); 1 ml of 100Mm pmsf (dissolved in isopropanol) to
1xPBS containing 0.9% NaCl. Then milk and plasma samples were thoroughly mixed
and incubated at 5o C over night. Next day, samples were centrifuged at 10,000xg for
15 minutes at 5o C Supernatant avoiding fat was removed and used for analysis.
For testing the presence of Bt. protein in Bt. cotton feed, strip test method was
also used. The strips were provided by Mahyco. This is a very quick test but relatively
less sensitive as compared to ELISA method. Bt, cotton seed gave colored bank at
defined position, which is characteristic of Bt. protein whereas, non Bt. cotton seed
gave (no band) no response.
Statistical analysis:
Statistical analysis of the data on dry matter intake, milk yield as well as milk
composition determined at different intervals during experimental feeding period is to
be done using student’s paired ‘t’ test (Snedecor and Cochran, 1967).
Results:
The chemical composition of non-Bt. cotton seed alongwith gossypol and Bt.
protein contents in presented in Table-3. The nutrients concentration s are more or less
similar in both types of cotton seeds. The Bt. cotton seed contained 20 µg Bt protein/g
whereas, non-Bt cotton seed did not contain any Bt. protein.
The analysis for chemical composition of other feed ingredients fed to
buffaloes during experimental feeding period is in progress.
The average voluntary dry matter intake in buffaloes of non-Bt. (Group-I) and
Bt. cotton seed (Group II) led groups was 3.98 kg per 100 kg body weight, (Table 4).
The daily dry matter intake in buffaloes fed ration containing non Bt. cotton seed
varied from 3.32 to 4.37 kg per 100 kg body weight whereas daily dry matter intake in
buffaloes fed ration containing Bt. cotton seed varied from 3.18 to 4.52 kg per 100 kg
body weight. Each buffalo in group II (Bt. cotton seed group) consumed 1.81 kg Bt.
cotton seed/day on dry matter basis which varied from 1.23 to 2.18 kg/day. The
quantity of non Bt cotton seed and Bt. cotton seed as percent of total dry mater intake
was 10.83% in buffaloes fed non-Bt. (group1) and Bt. cotton seed (groupII),
respectively.
Milk yield:
The average daily milk yield in buffaloes during experimental feeding period
was 4.88 and 4.87 kg in group I (non-Bt. cottonseed) and group II (Bt. cotton seed),
respectively whereas, 4% FCM yield was 8.47 and 8.04 kg, respectively in group I
and group II.
Milk compstion:
Fat % : The average fat content in milk of buffaloes fed non-Bt. (groupI) and
Bt. cotton seed (group II) was 8.99 and 8.61% respectively.
The voluntary dry matter intake, milk yield, 4% FCM, yield and fat% values in
the buffaloes fed ration containing either non-Bt. cotton seed or Bt. cotton seed were
comparable.
Health Status:
In general all the buffaloes maintained good health during the entire
experimental feeding period. Not of the animal showed any symptoms of sickness.
The buffaloes in both the groups gained body weight. The body weight gain/day was
488.6 and 414.3 in buffaloes of group I (non-Bt.) and group II (Bt.), respectively. At
the start of experimental feeding period the average body weight of buffaloes in group
I (non-Bt. cotton seed) and group II (Bt. cotton seed) was 442.1 and 468.9 kg,
respectively, whereas, at the end of experimental feeding period of 35 days the body
weight of buffaloes was increased to 459.2 and 483.4 kg, respectively, in group I
(non-Bt. cotton seed) and group II (Bt. cotton seed).

Bt. Protein in milk:
The Bt. Protein was not detected in the milk of buffaloes collected on7th,14th,
21st to 28th and 35th day of feeding ration containing either Bt. cotton seed or non-Bt.
cotton seed. The ELISA method which was used for detection of Bt. protein in milk
samples had sensitivity to detect 0.002 ppm Bt. protein in milk.
Bt. protein in blood
Bt. Protein in the blood plasma samples of buffaloes collected on 35th day of
experimental feeding was not detected in both the groups of buffaloes fed ration
containing either Bt. cotton seed or non Bt. cotton seed. The ELISA method which
was used for detection of Bt. protein in blood plasma samples had a sensitivity to
detect 0.004 ppm Bt protein in blood plasma samples.
From the information obtained in the present study, it is concluded that Bt.
cotton seed is as nutritious, palatable and wholesome as non-Bt. cotton seed as a feed
for lactating buffaloes. Further more, no Bt. protein was detected in milk or blood
plasma samples of buffaloes fed ration containing either Bt. or non-Bt. cotton seed.
References: AOAC (1990) Official Methods of Analysis. Association of Official Analytical
chemists, Arlington, Va, USA. Berberich, S.A., J.E. Ream, T.L. Jackson, R. Wood, R. Stipanovic, P. Harvey, S.
Patzer, and R.L. Fuchs. (1996). The composition of insect-protected cottonseed is equivalent to that of conventional cottonseed. Journal of Agricultural and Food Chemistry 44:365-371.
Dutta, K.K. and Dogra, R.K.S. (1998) A 90 days feeding study with cottonseed in goat. Final Report, Industrial toxicological research Institute, Lucknow, India.
Goering, H.K. and Van Soast, P.J. (1970) Forage Fibre Analysis. April handbood 379, ARS, USDA, USA
IDF (1997) Recommendations for the presentation of mestatis related data. International Dairy Federation. Bulletin No 321, pp 16-21.
I.S.I. (1958) Determination of fate in whole milk, evaporated milk, separated milk, skim milk, butter milk and cream by Gerber method. I.S; 1224, Indian Standards Institute, Manak Bhavan, New Delhi.
Keari, L.C. (1982) Nutrient requirements of ruminants in developing countries. International Feedstuffs Institute, Utah State Agricultural University, Logan, Utah, USA
Ream, J.E. (1994) Assessment of the in vitro digestive fate of Bacillus thuringiensis var. kursstaki HD 73 protein. Monsanto Co., Agricultural group-new product Division, 700 Chesterfield Parkway North, St. Louis Mo 63198, USA.
Sims, S.R. and Berberich, S.A. (1996) Bacillus thuringiensis Cry 1A protein levels in
raw and processed seed of transgenic cotton: Determination using insect bioassay and ELISA. Journal of. Econ. Entomol.89: 248-251.
Snedecor, G.W. and Cochran, W.G. (1967) Statistical Methods. 6th Edn. The Owa State College Press, Ames, lowa, USA.
Table 3. Chemical composition of non Bt. and Bt. cotton seed (% dry matter basis)*
Nutrients Non Bt. cotton seed Bt. cotton seed Organic matter 95.9 95.9 Crude protein 25.2 27.1 Ether extract 19.7 24.2 Total carbohydrates 51.0 44.6 Gross energy (Kcal/g) 4.82 5.05 Total gossypol (%) 1.52 1.23 Free gossypol (%) 1.39 1.14 Bt. protein (µg/g) - 20
* Source: V. Subramaniam, Mahyco Kalaco Kalakal, Hyderabad (A.P.) (Personal communication)

Table 4. Performance of Murrah buffaloes fed ration containing non Bt. and Bt. cotton seed during experimental feeding period.
Particulars Non-Bt. group Bt. group
Av. Initial body weight (Kg) 442.1 468.9 Av. Final body weight (Kg) 459.2 483.4 Av. Body weight gain during 35 days (Kg) 17.1 14.5 Av. Weight gain per day (g) 488.6 414.3 Av. Dry matter intake/100Kg body weight 3.98 3.75 Av. Milk yield/day (Kg) 4.88 4.87 Av. 4% FCM yield/day (Kg) 8.47 8.04 Av. Fat % in milk 8.99 8.61

Evaluation of raw cottonseed meal derived from Bt cottonseed as a feed ingredient for Indian catfish, Magur
(Clarias batrachus)
Chapter V
Annexure 4

PROJECT REPORT
CONSULTANCY PROJECT
Central Institute of Fisheries Education (Deemed University)
Mumbai – 400061
FINAL TECHNICAL REPORT
Title of the Project
Evaluation of raw cottonseed meal derived from Bt-cotton seed as a feed ingredient
for Indian catfish, Magur (Clarias batrachus)
8th Sptember, 2000 to 8th January, 2001 Name of the Investigaor(s)/ : Dr. K.K. Jain Author(s) : Dr. S. Raizada Dr. P.P. Srivastava
Performing Laboratory Fish Nutrition and Physiology Division Central Institute of Fisheries Education
(Deemed University) Versova, Mumbai-400 061 (MS),India
Laboratory Project ID Study : DPN-CR-2000-01
Experiment : BGCOT/CIFE/MAHY/200/1
Central Institute of Fisheries Education Page 1 of 20 India Study, # DPN-CR-2000-01

Abbreviation Bt. : Bacillus thuringiensis CIFE : Central Institute of Fisheries Education MAHYCO/MAHY : Maharashtra Hybrid Seeds Company VM : Vitamin Mixture MM : Mineral Misture CMC : Carboxy Methyl Cellulose FM : Fish Meal GOC : Groundnut Oil Cake FCR : Food conversion Ratio FER : Feed Efficiency Ratio g : Gram ND : Not detected CR : Contract Research DPN : Digestive Physiology and Nutrition BGCOT : Bt-gene incorporated cotton ID : Identification
Central Institute of Fisheries Education Page 2 of 20 India Study, # DPN-CR-2000-01

1. Title of the Project : Evaluation of cottonseed me derived from
Bt-cotton seed as feed ingredient for Indian caftis magur
2. Name of the Investigator(s) : Dr. K. ·K.Jain Author(s) : Dr. S. Raizada Dr. P. P. Srivastava 3. Implementing Institution : Central institute of: Fisheries Education'
(Deemed University), Versova, Mumbai-400 061 (MS), India.
4. Laboratory/Division : Fish Nutrition and Physiology Division involved in experimentation 5. Funding Agency : Maharashitra Hybrid Seeds Compar
Limited, Resham BhaMn, 4" near, 71 Veer Nariman Road, Mumbai - 400 02(India)
6. Date of Contract : 8t" September, 2000 Research undertaken 7. Tenure of Contract : 4 months (from September 8, 2000 to Research January 8, 2001) 8. Date of completion of : 31st December, 2000. Contract Research
NOTE: *Record retention : All study specific raw data; protocols, and fina technical reports will be retained at the implementing institute and i. will be confidential document until the sponsorer approves release.
Central Institute of Fisheries Education Page 3 of 20 India Study, # DPN-CR-2000-01
9. Objectives and purpose of : Annexure-I Study as stated in the Contact Research 10. Experimental work : Annexure-II giving full details of experimental setup, methods adopted, etc. 11. Results obtained and : Annexure-III detailed analyses of results of present Contract research project 12. Condusions summarizing : Annexure-IV
Central Institute of Fisheries Education Page 4 of 20 India Study, # DPN-CR-2000-01

Annesure – I
Objectives
Objectives as stated in the Contract Research Project proposal from MAHYCO
Mumbai.
1. To assess the growth and survival of Indian catfish, Clarias batrachus fed o
a diet containing raw cotton seed meal derived from Bt. Gene incorporate
(Bacillus thuringiensis) cotton.
2. To study the comparative growth and survival on feeding of given samples
of cotton seed as
A : Bt. Cotton variety MRC-162
B : Non Bt. Cotton variety MRC-162
C : Commercial cotton variety NHH-44
D : Non-Cottonseed groundnut (control)
Purpose
This contract research was designed to assess whether raw cotton seed meal
derived from Bt. gene incorporated cotton plant is as safe and nutritious for growth of
the Indian catfish, Magur (Clarias batrachus) as the meal derived from the non-Bt.
gene raw cotton-seed meal and commercial cotton variety.
A. Test material: The test material was defined as a cotton meal derived from Bt-
gene cotton, ID # as Bt. cotton variety (MRC-162).
Central Institute of Fisheries Education Page 5 of 20 India Study, # DPN-CR-2000-01
B. Control Material : The control material was defined as the cottonseed meal
derived from the control, same germplasm cotton line and ID # a non-Bt.
Cotton variety (MRC-162)
C. Commercial Material : The commercial material was defined as the
cottonseed meal derived from the commercial lot of different germplam cotton
line and ID # as commercial cotton variety NHH-44.
D. Laboratory Control Material : The laboratory control material was identified as
the goundnut oil cake and ID # as GOC.
Samples of cottonseed meal of the test and control materials were evaluated for
anti-nutrient contents to determine gossypol level. The were kept frozen and
were powered to 0.5 mm (500 micron) size partickle using Cyclotec (1093
sample mill, TECATOR Foss, Sweden) and used to feed preparation.
Central Institute of Fisheries Education Page 6 of 20 India Study, # DPN-CR-2000-01
Annexure – II
Materials and Methods
Experimental diets (Table-1) were formulated to contain (crude protein 36-39
%). Experimental diets were formulated by substituting cotton seed meals @ 20 %
(‘A’ contained gossypol, 1.23 %; ‘B’ contained gossypol, 1.52 % and ‘C’ contained
gossypol, 1.59 %) with that of groundnut cake. Out of these three A contained free
1.14 % gossypol; ‘B’ contained 1.39 % free gossypol, and ‘C’ contained 1.35 % free
gossypol (Table-2). These values are preheated values of raw ingredients. Twenty
percent groundnut was fully replaced by cotton seeds ‘A’ or ‘B’ or ‘C’. Before mixing
the ingredients ‘A’ or ‘B’ and ‘C’ in rest of the others ingredients (Table-1) the
ingredients ‘A’, ‘B’ and ‘C’ were autoclaved (at 15 Atmospheric pressure, and 121 oC
for 20 minutes to ensure complete degradation / destruction and/or inactivation of
gossypol from cotton seed and also denaturing of Aflatoxin, if at all present. The
values of free and total gossypol in the feeds (autoclaved and non-autoclaved) are
presented in Table-3.
Central Institute of Fisheries Education Page 7 of 20 India Study, # DPN-CR-2000-01

Table 1 : Percentage composition (dry weight basis) of experimental diets ‘A’ to
‘D’ fed to catfish, Clarias batrachus. Feed FM
(%) Acetes (%)
Wheat Flour(%)
Wheat Bran(%)
(%)
GOC (%)
Cod (%)
VM* (%)
CMC (%)
Yeast (%)
Beefext (%)
Eggyolk (%)
A 50 10 8 4 20 - 2 2 2 0.5 0.5 1 B 50 10 8 4 20 - 2 2 2 0.5 0.5 1 C 50 10 8 4 20 - 2 2 2 0.5 0.5 1 D Control
50 10 8 4 - 20 2 2 2 0.5 0.5 1
FM = Fishmeal; GOC = Groundnut oil cake; CMC = Carboxymethyl cellulose; VM=Vitamin mix = MM = Mineral mix. *VM+MM (2.5kg contains); Vitamin A, 5.000,000 IU; Vitamin D3, 1,025,000 IU; Vitamin B2 1.3 g; Vitamin E, 875 Units; Vitamin K, 1.0g; Calcium pantothenate, 2.5 g; Vitamin B12, 7.5 mg; Choloride, 6% w/w; Calcium, 850 g, Manganese, 27.5 g; Iodine, 1.0 g; Zinc, 15.0 g; Iron, 7.5 g; Copper, 2.0g; Cobalt, 0.45 g (Alembic Chemicals, Vadodara, India, Lot No. V-9944)
Central Institute of Fisheries Education Page 8of 20 India Study, # DPN-CR-2000-01

Table 2 : Chemical Composition of raw Cottonseed Samples (on dry weight basis) Sample Oil
(%) Protein (%)
Ash (%)
Car bohy drate (%)
K.Cal/ 100g
Total Gossy- pol (%)
Free Gossy- pol # (%)
Aflato- xin$#
(µg/g)
A 24.2 27.1 4.1 44.6 504.6 1.23 1.14 ND* B 19.7 25.2 4.1 51.0 482.1 1.52 1.39 ND* C 19.8 25.4 4.1 50.7 482.6 1.59 1.35 ND* ND* = Not Detected. $ = Aflatoxin content were analzed at Vimta Labs Limited, Hyderabad and
data provided to the Nutrition Division of CIFE, Mumbai. # = Analyzed by Dr. V. Subramaniam of MAHYCO, Medak, Kollakal-
502334 (Andhra Pradesh) and data provided to the Nutrition Laboratory, CIEF, Mumbai
The feed (A, B, C and D) were weighed (dry matter basis), as per the
percentage of the ingredients (Table-1) and water was added to make moist feed. No known contaminants were expected in the diet that would interfere with the present study.
Central Institute of Fisheries Education Page 9 20 India Study, # DPN-CR-2000-01
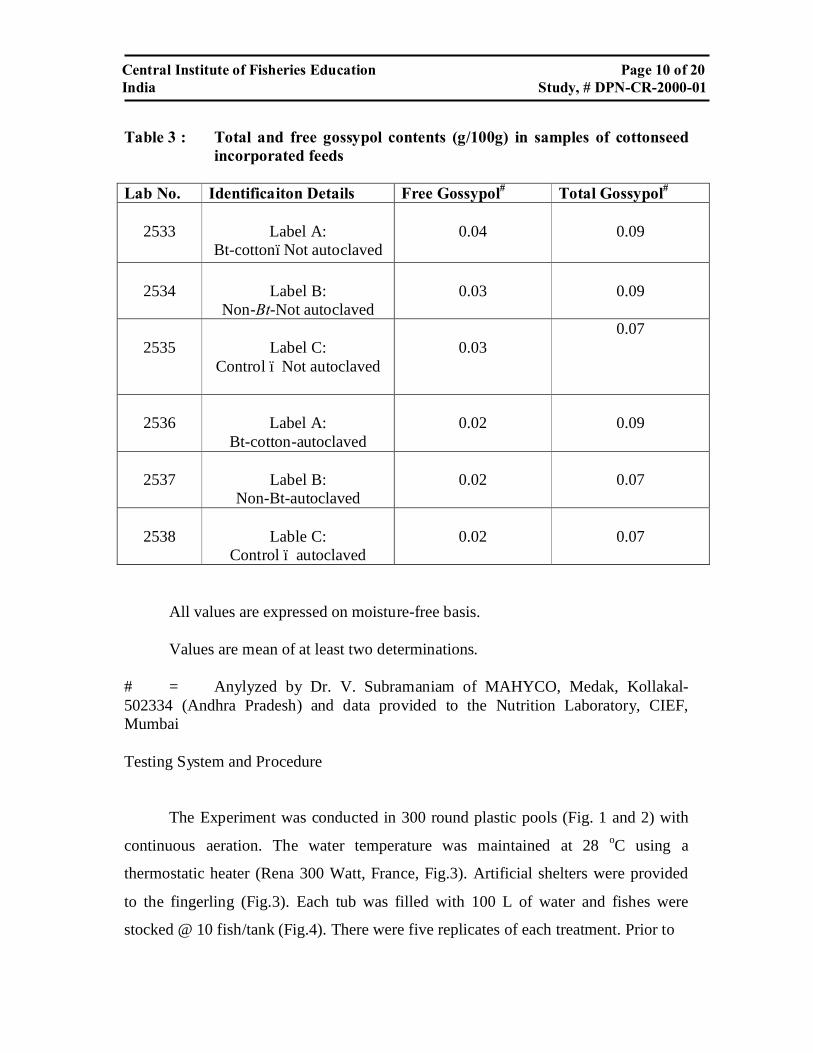
Table 3 : Total and free gossypol contents (g/100g) in samples of cottonseed
incorporated feeds Lab No. Identificaiton Details Free Gossypol# Total Gossypol#
2533
Label A: Bt-cotton–Not autoclaved
0.04
0.09
2534
Label B:
Non-Bt-Not autoclaved
0.03
0.09
2535
Label C:
Control – Not autoclaved
0.03
0.07
2536
Label A:
Bt-cotton-autoclaved
0.02
0.09
2537
Label B: Non-Bt-autoclaved
0.02
0.07
2538
Lable C:
Control – autoclaved
0.02
0.07
All values are expressed on moisture-free basis. Values are mean of at least two determinations. # = Anylyzed by Dr. V. Subramaniam of MAHYCO, Medak, Kollakal-502334 (Andhra Pradesh) and data provided to the Nutrition Laboratory, CIEF, Mumbai Testing System and Procedure
The Experiment was conducted in 300 round plastic pools (Fig. 1 and 2) with
continuous aeration. The water temperature was maintained at 28 oC using a
thermostatic heater (Rena 300 Watt, France, Fig.3). Artificial shelters were provided
to the fingerling (Fig.3). Each tub was filled with 100 L of water and fishes were
stocked @ 10 fish/tank (Fig.4). There were five replicates of each treatment. Prior to
Central Institute of Fisheries Education Page 10 of 20 India Study, # DPN-CR-2000-01

beginning of the experiment, catfish weighing 0.165 g ± 0.030 g (10 fish weighing
1.65 g were fed feed ‘D’ as conditioning feed for 15 days. Initially fish were fed @ 50
% of the body weight in two equal installments. The feed quantity was adjusted
weekly on the basis of growth (Fig.5). After two weeks the quantity of feed was
reduced to 20% of the body weight until the end of the experiment. The experiment
was conducted for 28 days. After each weekly weighing, the fish were given a bath of
acrifliavin @ 3 mg/L to prevent bacterial infection. Water temperature 28 oC,
dissolved oxygen 7.2.7.8 mg/L, and Ph 8.2-8.4 were monitored during the
experimental period and were found within normal limits required for the fish culture.
Data Collection and Proximate analysis of fish and feed
At the end – of- 28 days feeding experiment, minimum of three fish from each
plastic pool were taken for the purpose of pooled tissues analysis and final length and
weight of individual using Soxtec system (Model : HT-2, 1045, Sweden) for lipid
analysis; Kjeltec system (model : 2200 Kjeltec Autosystem, Sweden) for fibre
analysis; Muffle furnace (Expo, Mumbai) for ash contents and oven (Newtronic,
Mumbai) for moisture content. Growth, survival, feed conversion and fish body
proximate composition were subjected to one-way analysis of variance and Duncan’s
multiple range test to determine treatment differences (P<0.05). A student’s ‘t’ – test
was used to statistically evaluate any differences in measured parameters between fish
fed diets containing Bt. Cotton seed and non-Bt. Cotton seed (Steel and Torrie, 1960),
and to other treatment groups.
Central Institute of Fisheries Education Page 11 of 20 India Study, # DPN-CR-2000-01
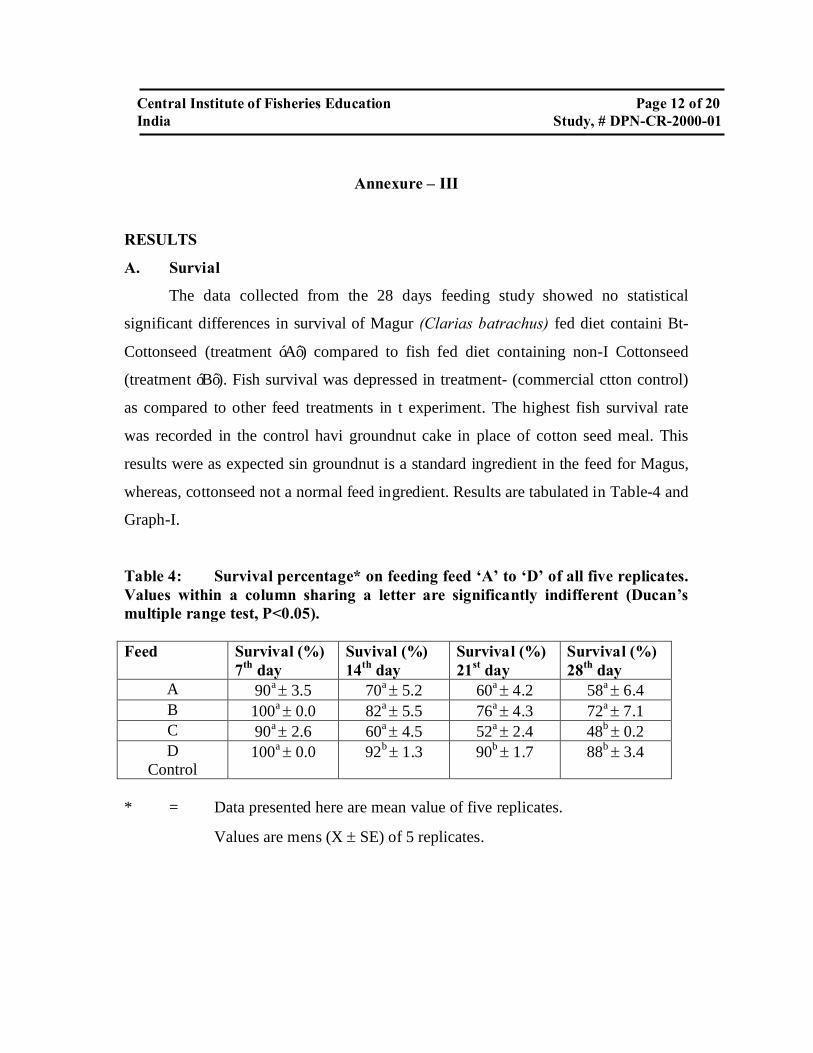
Annexure – III
RESULTS
A. Survial
The data collected from the 28 days feeding study showed no statistical
significant differences in survival of Magur (Clarias batrachus) fed diet containi Bt-
Cottonseed (treatment ‘A’) compared to fish fed diet containing non-I Cottonseed
(treatment ‘B’). Fish survival was depressed in treatment- (commercial ctton control)
as compared to other feed treatments in t experiment. The highest fish survival rate
was recorded in the control havi groundnut cake in place of cotton seed meal. This
results were as expected sin groundnut is a standard ingredient in the feed for Magus,
whereas, cottonseed not a normal feed ingredient. Results are tabulated in Table-4 and
Graph-I.
Table 4: Survival percentage* on feeding feed ‘A’ to ‘D’ of all five replicates. Values within a column sharing a letter are significantly indifferent (Ducan’s multiple range test, P<0.05). Feed Survival (%)
7th day Suvival (%) 14th day
Survival (%) 21st day
Survival (%) 28th day
A 90a ± 3.5 70a ± 5.2 60a ± 4.2 58a ± 6.4 B 100a ± 0.0 82a ± 5.5 76a ± 4.3 72a ± 7.1 C 90a ± 2.6 60a ± 4.5 52a ± 2.4 48b ± 0.2 D
Control 100a ± 0.0 92b ± 1.3 90b ± 1.7 88b ± 3.4
* = Data presented here are mean value of five replicates.
Values are mens (X ± SE) of 5 replicates.
Central Institute of Fisheries Education Page 12 of 20 India Study, # DPN-CR-2000-01
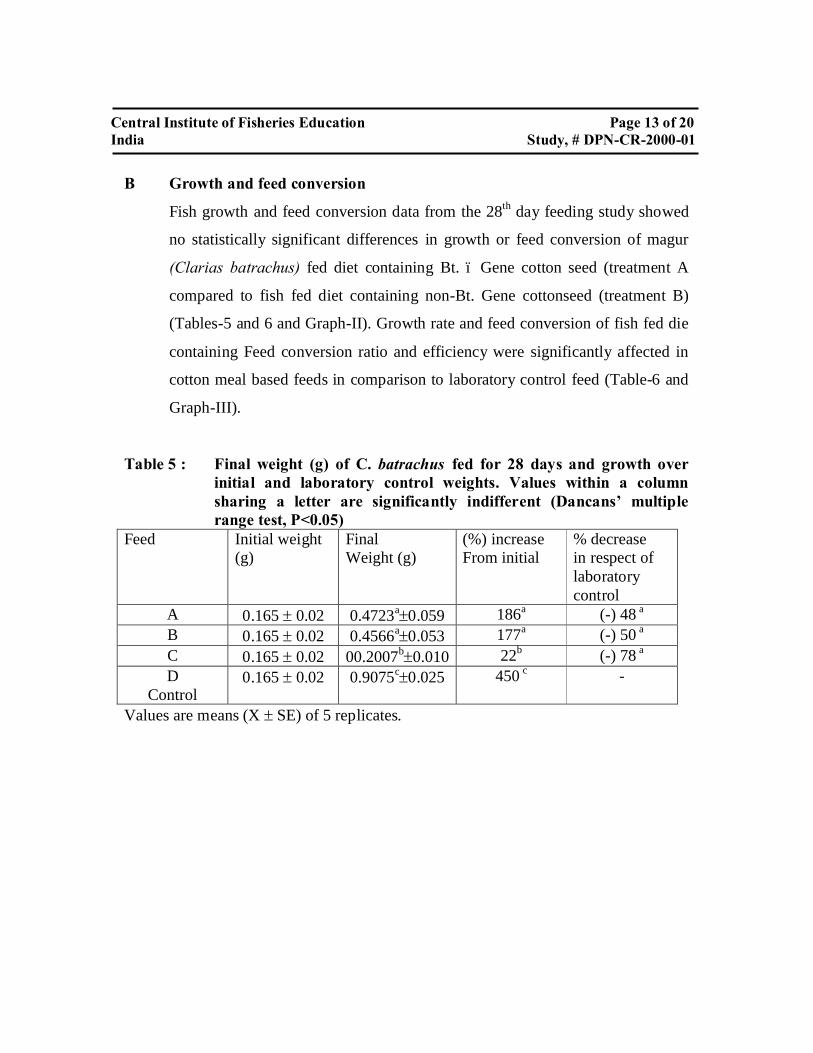
B Growth and feed conversion
Fish growth and feed conversion data from the 28th day feeding study showed
no statistically significant differences in growth or feed conversion of magur
(Clarias batrachus) fed diet containing Bt. – Gene cotton seed (treatment A
compared to fish fed diet containing non-Bt. Gene cottonseed (treatment B)
(Tables-5 and 6 and Graph-II). Growth rate and feed conversion of fish fed die
containing Feed conversion ratio and efficiency were significantly affected in
cotton meal based feeds in comparison to laboratory control feed (Table-6 and
Graph-III).
Table 5 : Final weight (g) of C. batrachus fed for 28 days and growth over initial and laboratory control weights. Values within a column sharing a letter are significantly indifferent (Dancans’ multiple range test, P<0.05)
Feed Initial weight (g)
Final Weight (g)
(%) increase From initial
% decrease in respect of laboratory control
A 0.165 ± 0.02 0.4723a±0.059 186a (-) 48 a B 0.165 ± 0.02 0.4566a±0.053 177a (-) 50 a C 0.165 ± 0.02 00.2007b±0.010 22b (-) 78 a D
Control 0.165 ± 0.02 0.9075c±0.025 450 c -
Values are means (X ± SE) of 5 replicates.
Central Institute of Fisheries Education Page 13 of 20 India Study, # DPN-CR-2000-01

Table 6 : Growth and feed conversion of Magus, Clarias batrachus fed feed A to
D, Values within a column sharing a letter are significantly indifferent (Ducan’s siltiple range test(P<0.05)
Feed Cotton
meal (%) Groundnut cake (%)
Weight gain (%) over initial
Feed conversion ratio
Feed efficiency ratio
A 20 - 187 3.10a 0.32a B 20 - 177 3.18a 0.31a C 20 - 22 3.48a 0.28a D
Control -
20
450
1.98a
0.51b
FCR = Feed given (dry weight basis)/ weight gain (live weight) in 28 days C. Proximate Composition
Proximate composition of feed and fish bodies are summarized in Table-7 & 8
and graphs – IV,V,VI, VII and VIII respectively.
Table 7 : Proximate composition of feeds (A and D) Feed Lipid *
(%) Protein * (%)
Ash* (%)
Carbohydrate* (%) NFE
Moisture (%)
A 12.8±1.0 38.0±1.6 9.5±0.07 36.9±2.12 39.6±1.52 B 11.7±0.7 36.0±2.1 8.9±0.09 39.2±1.85 38.5±2.17 C 11.9±0.4 37.5±1.1 8.7±0.20 40.7±3.72 37.7±3.01 D 12.3±0.2 39.0±1.8 7.8±0.36 39.6±1.56 37.9±2.33
* On dry weight basis. Values are means (X ± SE) of 3 replicates
Central Institute of Fisheries Education Page 14 of 20 India Study, # DPN-CR-2000-01
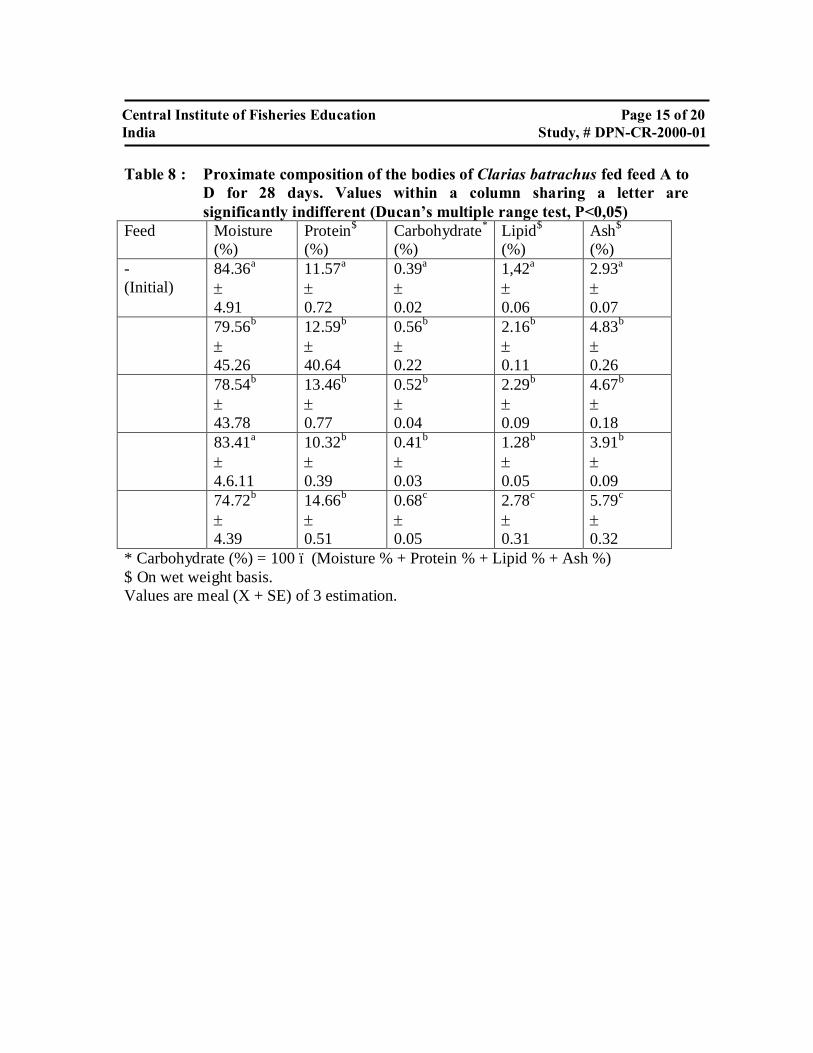
Table 8 : Proximate composition of the bodies of Clarias batrachus fed feed A to
D for 28 days. Values within a column sharing a letter are significantly indifferent (Ducan’s multiple range test, P<0,05)
Feed Moisture (%)
Protein$ (%)
Carbohydrate* (%)
Lipid$ (%)
Ash$
(%) - (Initial)
84.36a ± 4.91
11.57a ± 0.72
0.39a ± 0.02
1,42a ± 0.06
2.93a ± 0.07
79.56b ± 45.26
12.59b ± 40.64
0.56b ± 0.22
2.16b ± 0.11
4.83b ± 0.26
78.54b ± 43.78
13.46b ± 0.77
0.52b ± 0.04
2.29b ± 0.09
4.67b ± 0.18
83.41a ± 4.6.11
10.32b ± 0.39
0.41b ± 0.03
1.28b ± 0.05
3.91b ± 0.09
74.72b ± 4.39
14.66b ± 0.51
0.68c ± 0.05
2.78c ± 0.31
5.79c ± 0.32
* Carbohydrate (%) = 100 – (Moisture % + Protein % + Lipid % + Ash %) $ On wet weight basis. Values are meal (X + SE) of 3 estimation.
Central Institute of Fisheries Education Page 15 of 20 India Study, # DPN-CR-2000-01
There were no statistically significant differences in proximate compostion of
bodies of magur (Clarias batrachus) fed diet containing Bt Cottonseed compared to
fish fed diet containing non-Bt Cottonseed in this experiment. (Table 8). Bodies of
fish fed diets containing commercial control cottonseed were significantly lower in
protein, corbohydrate and lipids compare to fish fed the other treatments in the
experiment. Bodies of the fish fec groundnut cake had the highest content of Protein,
carbohydrate, lipids and ash among the treatments in this experiment (Table 8). This
result was as expected since groundnut is anormal ingredient in feed for magur,
whereas cottonseed is not commonly used in feed for magur.
Central Institute of Fisheries Education Page 16 of 20 India Study, # DPN-CR-2000-01
ANNEXURE – IV
Conclusions summarizing the results
1. Cotton seed meal contained total and free gossypol content in sample A 1.2
and 1.14, sample B 1.52 and 1.39, and sample C 1.59 and 1.35 percent
respectively, However, on sterilization using Autoclave, the gossipol
content also reduced below the threshold limit of toxicity as recommended
by Dorsa et al. (1992).
2. There was no aflatoxin content in any of the cotton seed meal sample.
3. Weight gain, survival, feed conversion ratio, feed efficiency and body
proximate composition were not significantly different between fish fed Bt
Cottonseed as sompared to fish fed non-Bt. Cottonseed during the study.
4. The overall survival range between 40% to 88% is considered normal for
fatfish, Magur (Clarias batrachus) fed with moist feed containing
autoclaved raw cottonmeal or with groundnut cake. Also this range is
consistent with the database for magur fed with various feed.
5. Survival, growth rate, feed conversion and composition of bodies of Clarias
batrachus are statistically insignificant for the size used in the study fed
with either autoclaved Bt. Cotton seed or non-Bt. Cotton seed meal. Lowest
survival, growth, feed conversion and body proximate compostion were
recorded in fish fed with diet containing the commercial control cottonseed
whereas highest values were recorded for fish fed with the diet containing
Central Institute of Fisheries Education Page 17 of 20 India Study, # DPN-CR-2000-01

groundnut and no cottonseed. The differences in survival, growth rate, feed
conversion and body proximate composition between fish fed cottonseed in
their diet compared to fish fed diet containing groundnut cake may be due
to low levels of free gossypol, even after autoclaving, in the cottonseed
diets. It has been shown that gossipol has toxic effects on catfish when
included in the fish diet (Dorsa et al., 1992). Also, differences in the types
of protein and lipids in cottonseed compared to groundnut cake may
account for the differences in performance of fish fed cottonseed compared
to fish fed groundnut cake.
6. Based on the data from the present study, Bt. Cotton variety MRC – 162
(Sample-A) and Non-Bt. Cotton variety MRC-162 (Sample-B) provided the
same nutrition growth performance results for magur. This result was an
expected since Bt. Cottonseed is similar in composition as Non-Bt.
Cottonseed (Beerberich et al., 1996) since they share a common
germplasm. The only difference between the Bt. and Non-Bt cotton lines is
the presence of the B Protein, and this protein has been shown to be highly
specific to the target insect pests, and has no deleterious effects to non-
target organisms such as birds, fish and mammals (EPA, 1988).
Central Institute of Fisheries Education Page 18 of 20 India Study, # DPN-CR-2000-01
7. In the case of sample ‘C’ the commercial control cottonseed, growth
performance and survival were comparatively poor. Since the commercial
control may be of different germplasm from the Bt. and non-Bt cottons, its
different genetic constituency may cause differences in growth performance
in comparison to the Bt and non-Bt cottonseed.
Central Institute of Fisheries Education Page 19 of 20 India Study, # DPN-CR-2000-01
8. The Bt Gene incorporated cotton variety MRC-162 (Sample A) and Non-
Bt. Gene incorporated cotton variety MRC-162 (Sample B) gave
statistically similar growth performance, and survival, and can be
recommended for use in catfish nutrition for making wet feed following
strict procedures of detoxificaiton for gossypol.
References Berberich, S.A., J.E. Ream, T.L. Jackson, R. Wood, R. Stipanovic, P. Harvey, S. Patzer, and R.L. Fuchs. 1996. The compositon of insect-protected cottonseed is equivalent to that of conventional Cottonseed. Journal of Agricultural and Food Chemistry 44:365-371. EPA (Environmental Protection Agency). Guidance for the re-registration of pesticide products containing Bacillus thuringiensis as the active ingredient. U.S. Government Printing Office: Washington D.C., 1988; NTIS PB 89-164198. Steel, R.G.D. and J.H. Torrie. Principles and procedures of statistics: with special references to the biological sciences. 1960. McGraw-Hill, New York, New York, USA. Dorsa, W.J., Robinette, R.H. Robinson, E.H., and W.E. Poe. 1982. Effects of dietary cottonseed meal and gossypol on growth of young channel catfish. Transactions of the American Fisheries Society 111:651-655.
Central Institute of Fisheries Education Page 20 of 20 India Study, # DPN-CR-2000-01