Embed Size (px)
Citation preview

Compensation Study for
Lake County, FL
FINAL REPORT
May 3, 2016
PAGE
1.0 INTRODUCTION .......................................................................................................... 1-1 1.1 Study Methodology ............................................................................................ 1-1 1.2 Report Organization........................................................................................... 1-2 2.0 MARKET SUMMARY ................................................................................................... 2-1 2.1 Public Sector Salary Survey Results ................................................................. 2-1 2.2 Private Sector Market Data .............................................................................. 2-7 2.3 Summary ............................................................................................................ 2-9 3.0 RECOMMENDATIONS ................................................................................................ 3-1 3.1 Compensation Analysis ..................................................................................... 3-1 3.2 System Administration ...................................................................................... 3-9 3.3 Pay Practices...................................................................................................... 3-9 3.4 Summary ......................................................................................................... 3-11 APPENDIX A: COMPENSATION STUDY DATA FOR LAKE EMERGENCY MEDICAL
SERVICES (LAKE EMS)
E V E R G R E E N S O L U T I O N S , L L C
Table of Contents
Evergreen Solutions, LLC Page 1-1
In December 2015, Evergreen Solutions was retained by Lake County, FL (County) to conduct a Compensation Study. The methodology and work plan developed to conduct this study was designed to examine the compensation for selected classifications compared to the identified peers. Analyzing the results of the data enabled Evergreen Solutions to assess the external equity, or differences between the County’ compensation system and what is similarly available in the market.
Specifically, Evergreen Solutions was tasked to perform the following:
evaluate the current compensation systems and determine the strengths and weaknesses of the current pay plans;
conduct a salary survey and provide an external assessment summary regarding the structures’ market competitiveness;
develop strategic positioning recommendations using market data and best practices;
develop competitive compensation structures; and
develop and submit draft and final reports summarizing findings and recommendations.
1.1 STUDY METHODOLOGY
Evergreen Solutions combined qualitative as well as quantitative data analysis to produce an equitable solution with the purpose of maximizing the competitiveness of the compensation structures and practices.
Study activities included:
conducting a project kick-off meeting; conducting a market salary survey; developing recommendations for competitive pay structures; creating implementation plans for the proposed compensation systems; and creating draft and final reports.
E V E R G R E E N S O L U T I O N S , L L C
Chapter 1 - Introduction
Chapter 1 – Introduction Compensation Study for Lake County, FL
Evergreen Solutions, LLC Page 1-2
Kickoff Meeting The kickoff meeting with the County’s project team provided Evergreen Solutions an opportunity to discuss specific study goals, finalize the work plan, and begin the data collection process. The collection of relevant background material (including existing pay plans, current job descriptions, employee salary data, and other pertinent material) was a part of this process.
Salary Survey
For the salary survey, peers were identified that compete with the County for human resources and provide similar services. A specified number of classifications were selected to be included in the salary survey. The salary data collected during this survey were analyzed, and a summary of this market data can be found in Chapter 2 of this report.
Concurrently, Evergreen Solutions was asked to collect salary data for Lake Emergency Medical Services (Lake EMS). This was accomplished utilizing the same salary survey methodology. The salary data collected can be found in Appendix A.
Recommendations
During this phase of the study, Evergreen Solutions proposed utilizing the current pay plan and assigned each classification a pay grade based on the analysis of the salary survey results. The goal was to improve the competitiveness of those classification ranges that were below the market average. Recommendations were made for all classifications; those that were surveyed and those that were not. Next, the cost associated with adjusting salaries of some employees were estimated. A summary of the grade recommendations and the implementation of the new grades can be found in Chapter 3 of this report. Likewise, recommendations for Lake EMS are presented in Appendix A.
1.2 REPORT ORGANIZATION
The remainder of this report includes the following chapters:
Chapter 2 – Market Summary Chapter 3 – Recommendations
Evergreen Solutions, LLC Page 2-1
This chapter provides the County a market analysis in which the existing pay plan’s salary ranges were compared to the salary ranges of peer organizations. The data from targeted peers were used to evaluate the competiveness of the salary structure at the time of this study. It is important to note that the market comparison contained herein does not translate at the individual level and are instead used to provide the County with an overall analyses. The utilized methodology is not intended to evaluate particular salaries offered to individuals because individual compensation is determined through a combination of factors, which could include: the demand for a particular job, a candidate’s prior experience, or an individual’s negotiation skills during the hiring process.
Furthermore, it should be noted that market comparisons should be thought of as a snapshot of current market conditions. In other words, market conditions change, and in some cases change quickly; so while market surveys are useful for making updates to salary structures, they must be done at regular intervals if the County wishes to remain current with its market peers and salary trends.
2.1 PUBLIC SECTOR SALARY SURVEY RESULTS
Evergreen Solutions collected pay range information from targeted public sector peers utilizing a survey tool. Development of this tool included identifying 94 County classifications to be surveyed. The title, a description of the assigned duties, and the education and experience requirements were provided in the survey tool for each surveyed classification.
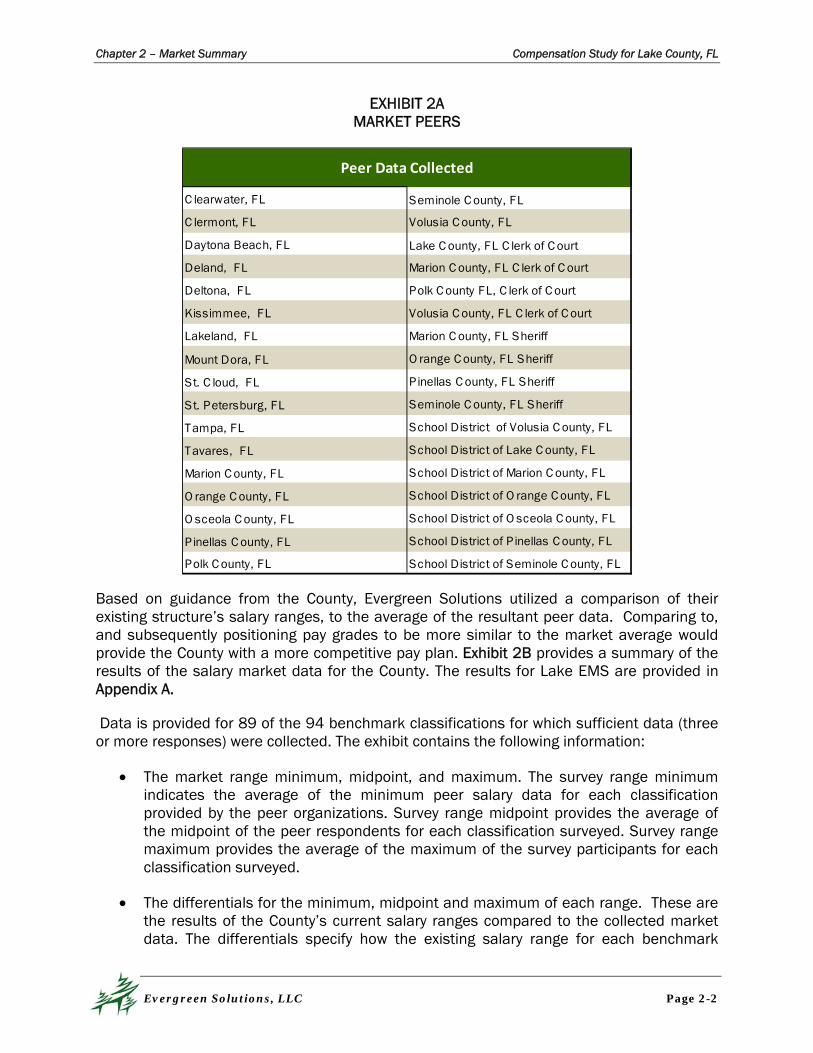
The public sector peers were selected by Evergreen Solutions in collaboration with the County’s project team. Several factors were utilized when developing this peer list, including geographic proximity to the County, organization size, and the relative population size being served by the organizations. All data collected were adjusted for cost of living using a national cost of living index factor which allowed any salary information from organizations outside of the immediate area to be adjusted for the cost of living relative to the County. Exhibit 2A provides the list of 34 market peers from which data were collected. The list of peers for the Lake EMS survey are provided in Appendix A.
E V E R G R E E N S O L U T I O N S , L L C
Chapter 2 – Market Summary
Chapter 2 – Market Summary Compensation Study for Lake County, FL
Evergreen Solutions, LLC Page 2-2
EXHIBIT 2A MARKET PEERS
C learwater, FL Seminole C ounty, FL
C lermont, FL Volusia C ounty, FL
Daytona Beach, FL Lake C ounty, FL C lerk of C ourt
Deland, FL Marion C ounty, FL C lerk of C ourt
Deltona, FL Polk C ounty FL, C lerk of C ourt
Kissimmee, FL Volusia C ounty, FL C lerk of C ourt
Lakeland, FL Marion C ounty, FL Sheriff
Mount Dora, FL O range C ounty, FL Sheriff
St. C loud, FL P inellas C ounty, FL Sheriff
St. Petersburg, FL Seminole C ounty, FL Sheriff
Tampa, FL School District of Volusia C ounty, FL
Tavares, FL School District of Lake C ounty, FL
Marion C ounty, FL School District of Marion C ounty, FL
O range C ounty, FL School District of O range C ounty, FL
O sceola C ounty, FL School District of O sceola C ounty, FL
Pinellas C ounty, FL School District of P inellas C ounty, FL
Polk C ounty, FL School District of Seminole C ounty, FL
Peer Data Collected
Based on guidance from the County, Evergreen Solutions utilized a comparison of their existing structure’s salary ranges, to the average of the resultant peer data. Comparing to, and subsequently positioning pay grades to be more similar to the market average would provide the County with a more competitive pay plan. Exhibit 2B provides a summary of the results of the salary market data for the County. The results for Lake EMS are provided in Appendix A.
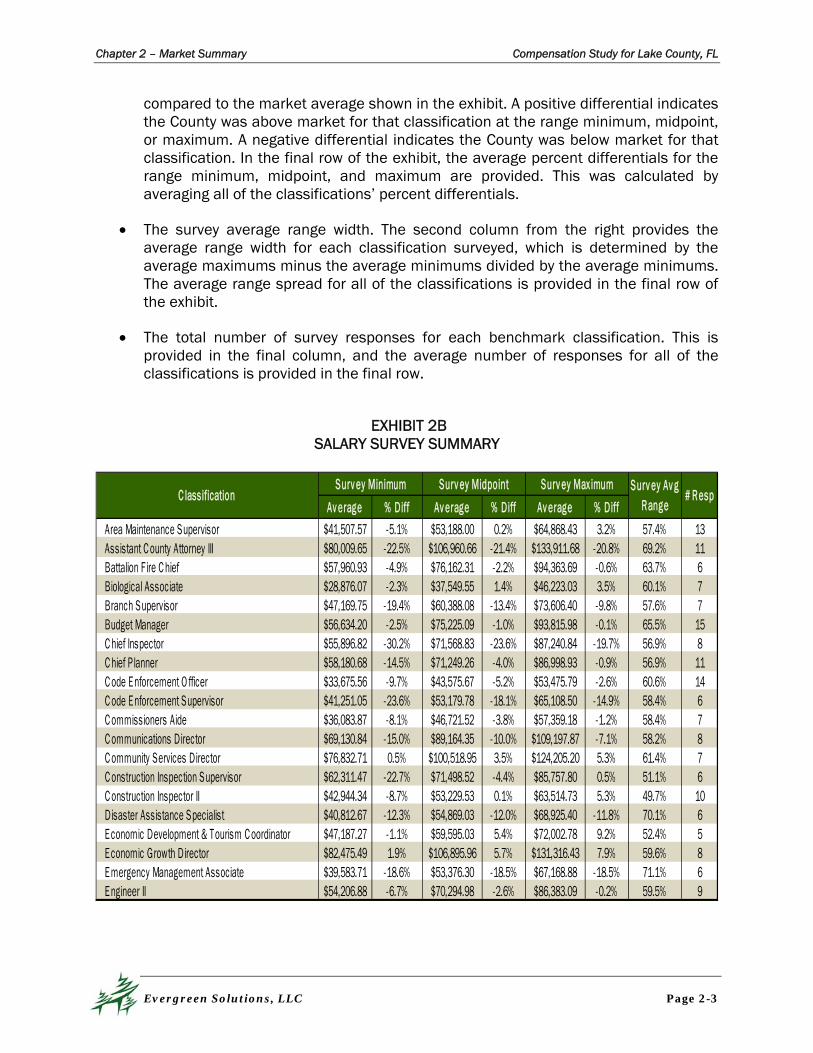
Data is provided for 89 of the 94 benchmark classifications for which sufficient data (three or more responses) were collected. The exhibit contains the following information:
The market range minimum, midpoint, and maximum. The survey range minimum indicates the average of the minimum peer salary data for each classification provided by the peer organizations. Survey range midpoint provides the average of the midpoint of the peer respondents for each classification surveyed. Survey range maximum provides the average of the maximum of the survey participants for each classification surveyed.
The differentials for the minimum, midpoint and maximum of each range. These are the results of the County’s current salary ranges compared to the collected market data. The differentials specify how the existing salary range for each benchmark
Chapter 2 – Market Summary Compensation Study for Lake County, FL
Evergreen Solutions, LLC Page 2-3
compared to the market average shown in the exhibit. A positive differential indicates the County was above market for that classification at the range minimum, midpoint, or maximum. A negative differential indicates the County was below market for that classification. In the final row of the exhibit, the average percent differentials for the range minimum, midpoint, and maximum are provided. This was calculated by averaging all of the classifications’ percent differentials.
The survey average range width. The second column from the right provides the average range width for each classification surveyed, which is determined by the average maximums minus the average minimums divided by the average minimums. The average range spread for all of the classifications is provided in the final row of the exhibit.
The total number of survey responses for each benchmark classification. This is provided in the final column, and the average number of responses for all of the classifications is provided in the final row.
EXHIBIT 2B
SALARY SURVEY SUMMARY
Av erage % Diff Av erage % Diff Av erage % Diff
Area Maintenance Supervisor $41,507.57 -5.1% $53,188.00 0.2% $64,868.43 3.2% 57.4% 13Assistant C ounty Attorney III $80,009.65 -22.5% $106,960.66 -21.4% $133,911.68 -20.8% 69.2% 11Battalion Fire C hief $57,960.93 -4.9% $76,162.31 -2.2% $94,363.69 -0.6% 63.7% 6Biological Associate $28,876.07 -2.3% $37,549.55 1.4% $46,223.03 3.5% 60.1% 7Branch Supervisor $47,169.75 -19.4% $60,388.08 -13.4% $73,606.40 -9.8% 57.6% 7Budget Manager $56,634.20 -2.5% $75,225.09 -1.0% $93,815.98 -0.1% 65.5% 15C hief Inspector $55,896.82 -30.2% $71,568.83 -23.6% $87,240.84 -19.7% 56.9% 8C hief P lanner $58,180.68 -14.5% $71,249.26 -4.0% $86,998.93 -0.9% 56.9% 11C ode Enforcement O fficer $33,675.56 -9.7% $43,575.67 -5.2% $53,475.79 -2.6% 60.6% 14C ode Enforcement Supervisor $41,251.05 -23.6% $53,179.78 -18.1% $65,108.50 -14.9% 58.4% 6C ommissioners Aide $36,083.87 -8.1% $46,721.52 -3.8% $57,359.18 -1.2% 58.4% 7C ommunications Director $69,130.84 -15.0% $89,164.35 -10.0% $109,197.87 -7.1% 58.2% 8C ommunity Services Director $76,832.71 0.5% $100,518.95 3.5% $124,205.20 5.3% 61.4% 7C onstruction Inspection Supervisor $62,311.47 -22.7% $71,498.52 -4.4% $85,757.80 0.5% 51.1% 6C onstruction Inspector II $42,944.34 -8.7% $53,229.53 0.1% $63,514.73 5.3% 49.7% 10Disaster Assistance Specialist $40,812.67 -12.3% $54,869.03 -12.0% $68,925.40 -11.8% 70.1% 6Economic Development & Tourism C oordinator $47,187.27 -1.1% $59,595.03 5.4% $72,002.78 9.2% 52.4% 5Economic Growth Director $82,475.49 1.9% $106,895.96 5.7% $131,316.43 7.9% 59.6% 8Emergency Management Associate $39,583.71 -18.6% $53,376.30 -18.5% $67,168.88 -18.5% 71.1% 6Engineer II $54,206.88 -6.7% $70,294.98 -2.6% $86,383.09 -0.2% 59.5% 9
# RespSurv ey Maximum Surv ey Av g
RangeC lassification
Surv ey Minimum Surv ey Midpoint
Chapter 2 – Market Summary Compensation Study for Lake County, FL
Evergreen Solutions, LLC Page 2-4
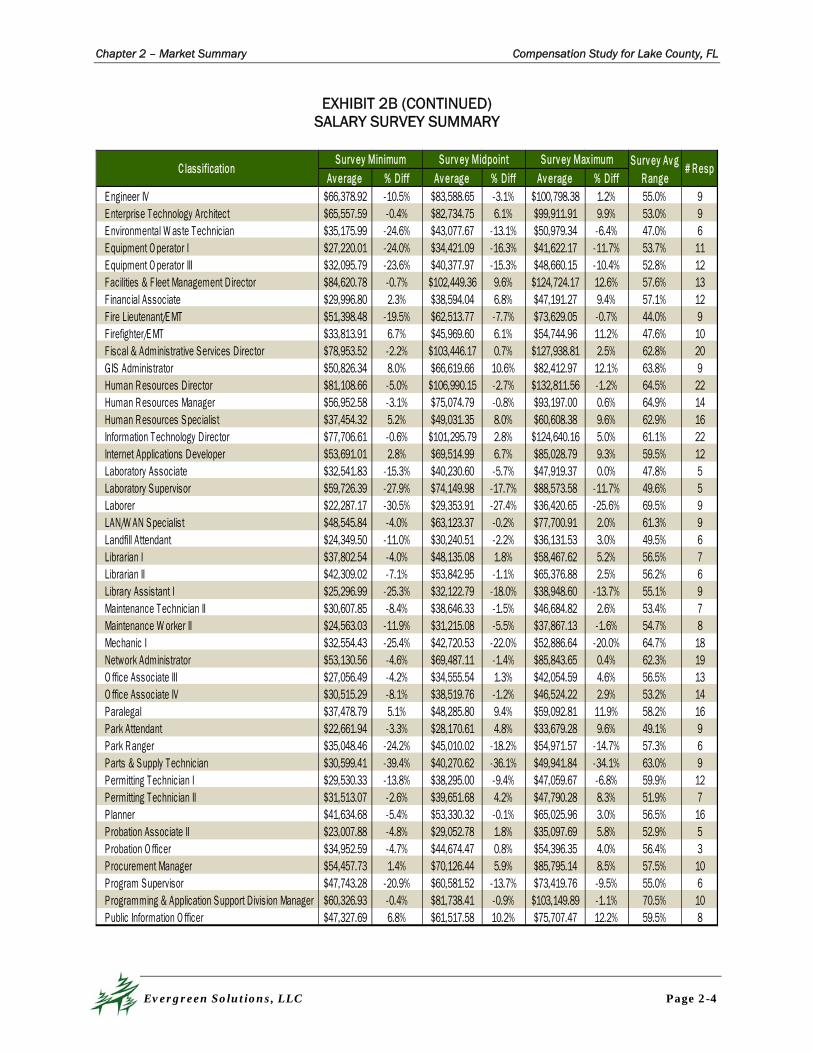
EXHIBIT 2B (CONTINUED) SALARY SURVEY SUMMARY
Av erage % Diff Av erage % Diff Av erage % DiffEngineer IV $66,378.92 -10.5% $83,588.65 -3.1% $100,798.38 1.2% 55.0% 9Enterprise Technology Architect $65,557.59 -0.4% $82,734.75 6.1% $99,911.91 9.9% 53.0% 9Environmental W aste Technician $35,175.99 -24.6% $43,077.67 -13.1% $50,979.34 -6.4% 47.0% 6Equipment O perator I $27,220.01 -24.0% $34,421.09 -16.3% $41,622.17 -11.7% 53.7% 11Equipment O perator III $32,095.79 -23.6% $40,377.97 -15.3% $48,660.15 -10.4% 52.8% 12Facilities & Fleet Management Director $84,620.78 -0.7% $102,449.36 9.6% $124,724.17 12.6% 57.6% 13Financial Associate $29,996.80 2.3% $38,594.04 6.8% $47,191.27 9.4% 57.1% 12Fire Lieutenant/EMT $51,398.48 -19.5% $62,513.77 -7.7% $73,629.05 -0.7% 44.0% 9Firefighter/EMT $33,813.91 6.7% $45,969.60 6.1% $54,744.96 11.2% 47.6% 10Fiscal & Administrative Services Director $78,953.52 -2.2% $103,446.17 0.7% $127,938.81 2.5% 62.8% 20GIS Administrator $50,826.34 8.0% $66,619.66 10.6% $82,412.97 12.1% 63.8% 9Human Resources Director $81,108.66 -5.0% $106,990.15 -2.7% $132,811.56 -1.2% 64.5% 22Human Resources Manager $56,952.58 -3.1% $75,074.79 -0.8% $93,197.00 0.6% 64.9% 14Human Resources Specialist $37,454.32 5.2% $49,031.35 8.0% $60,608.38 9.6% 62.9% 16Information Technology Director $77,706.61 -0.6% $101,295.79 2.8% $124,640.16 5.0% 61.1% 22Internet Applications Developer $53,691.01 2.8% $69,514.99 6.7% $85,028.79 9.3% 59.5% 12Laboratory Associate $32,541.83 -15.3% $40,230.60 -5.7% $47,919.37 0.0% 47.8% 5Laboratory Supervisor $59,726.39 -27.9% $74,149.98 -17.7% $88,573.58 -11.7% 49.6% 5Laborer $22,287.17 -30.5% $29,353.91 -27.4% $36,420.65 -25.6% 69.5% 9LAN/W AN Specialist $48,545.84 -4.0% $63,123.37 -0.2% $77,700.91 2.0% 61.3% 9Landfill Attendant $24,349.50 -11.0% $30,240.51 -2.2% $36,131.53 3.0% 49.5% 6Librarian I $37,802.54 -4.0% $48,135.08 1.8% $58,467.62 5.2% 56.5% 7Librarian II $42,309.02 -7.1% $53,842.95 -1.1% $65,376.88 2.5% 56.2% 6Library Assistant I $25,296.99 -25.3% $32,122.79 -18.0% $38,948.60 -13.7% 55.1% 9Maintenance Technician II $30,607.85 -8.4% $38,646.33 -1.5% $46,684.82 2.6% 53.4% 7Maintenance W orker II $24,563.03 -11.9% $31,215.08 -5.5% $37,867.13 -1.6% 54.7% 8Mechanic I $32,554.43 -25.4% $42,720.53 -22.0% $52,886.64 -20.0% 64.7% 18Network Administrator $53,130.56 -4.6% $69,487.11 -1.4% $85,843.65 0.4% 62.3% 19O ffice Associate III $27,056.49 -4.2% $34,555.54 1.3% $42,054.59 4.6% 56.5% 13O ffice Associate IV $30,515.29 -8.1% $38,519.76 -1.2% $46,524.22 2.9% 53.2% 14Paralegal $37,478.79 5.1% $48,285.80 9.4% $59,092.81 11.9% 58.2% 16Park Attendant $22,661.94 -3.3% $28,170.61 4.8% $33,679.28 9.6% 49.1% 9Park Ranger $35,048.46 -24.2% $45,010.02 -18.2% $54,971.57 -14.7% 57.3% 6Parts & Supply Technician $30,599.41 -39.4% $40,270.62 -36.1% $49,941.84 -34.1% 63.0% 9Permitting Technician I $29,530.33 -13.8% $38,295.00 -9.4% $47,059.67 -6.8% 59.9% 12Permitting Technician II $31,513.07 -2.6% $39,651.68 4.2% $47,790.28 8.3% 51.9% 7Planner $41,634.68 -5.4% $53,330.32 -0.1% $65,025.96 3.0% 56.5% 16Probation Associate II $23,007.88 -4.8% $29,052.78 1.8% $35,097.69 5.8% 52.9% 5Probation O fficer $34,952.59 -4.7% $44,674.47 0.8% $54,396.35 4.0% 56.4% 3Procurement Manager $54,457.73 1.4% $70,126.44 5.9% $85,795.14 8.5% 57.5% 10Program Supervisor $47,743.28 -20.9% $60,581.52 -13.7% $73,419.76 -9.5% 55.0% 6Programming & Application Support Division Manager $60,326.93 -0.4% $81,738.41 -0.9% $103,149.89 -1.1% 70.5% 10Public Information O fficer $47,327.69 6.8% $61,517.58 10.2% $75,707.47 12.2% 59.5% 8
Surv ey Av g Range
# RespC lassificationSurv ey Minimum Surv ey Midpoint Surv ey Maximum
Chapter 2 – Market Summary Compensation Study for Lake County, FL
Evergreen Solutions, LLC Page 2-5
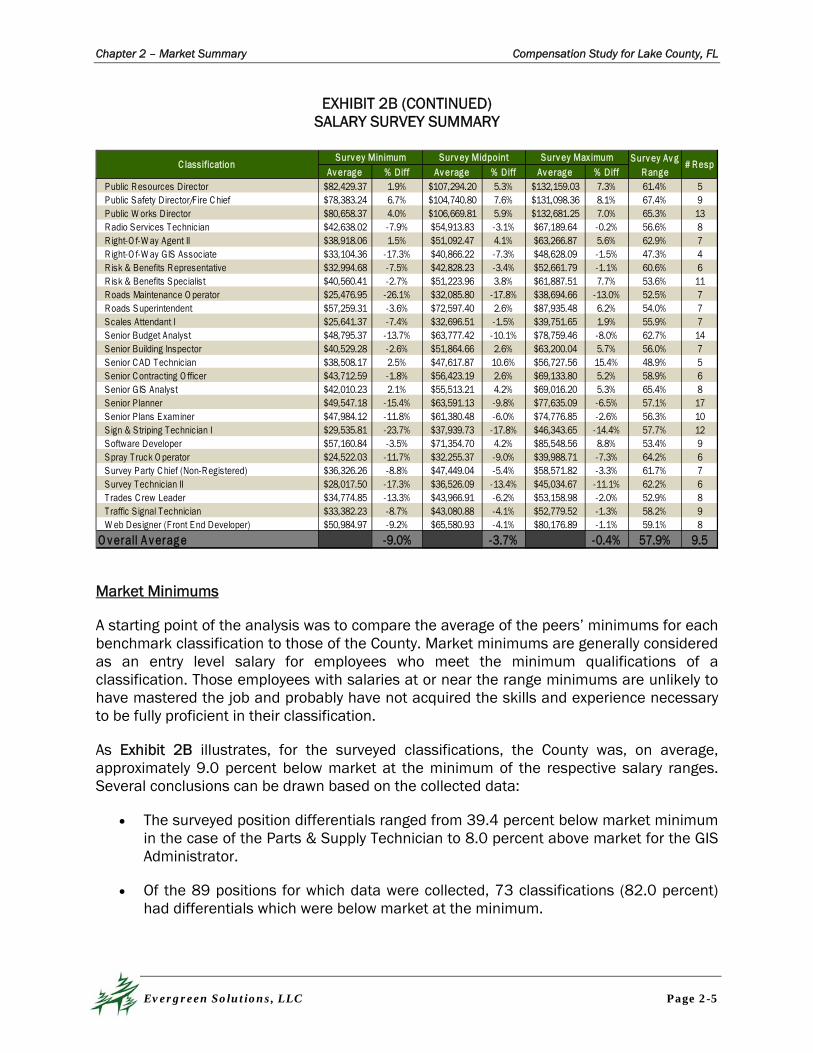
EXHIBIT 2B (CONTINUED) SALARY SURVEY SUMMARY
Av erage % Diff Av erage % Diff Av erage % DiffPublic Resources Director $82,429.37 1.9% $107,294.20 5.3% $132,159.03 7.3% 61.4% 5Public Safety Director/Fire C hief $78,383.24 6.7% $104,740.80 7.6% $131,098.36 8.1% 67.4% 9Public W orks Director $80,658.37 4.0% $106,669.81 5.9% $132,681.25 7.0% 65.3% 13Radio Services Technician $42,638.02 -7.9% $54,913.83 -3.1% $67,189.64 -0.2% 56.6% 8Right-O f-W ay Agent II $38,918.06 1.5% $51,092.47 4.1% $63,266.87 5.6% 62.9% 7Right-O f-W ay GIS Associate $33,104.36 -17.3% $40,866.22 -7.3% $48,628.09 -1.5% 47.3% 4Risk & Benefits Representative $32,994.68 -7.5% $42,828.23 -3.4% $52,661.79 -1.1% 60.6% 6Risk & Benefits Specialist $40,560.41 -2.7% $51,223.96 3.8% $61,887.51 7.7% 53.6% 11Roads Maintenance O perator $25,476.95 -26.1% $32,085.80 -17.8% $38,694.66 -13.0% 52.5% 7Roads Superintendent $57,259.31 -3.6% $72,597.40 2.6% $87,935.48 6.2% 54.0% 7Scales Attendant I $25,641.37 -7.4% $32,696.51 -1.5% $39,751.65 1.9% 55.9% 7Senior Budget Analyst $48,795.37 -13.7% $63,777.42 -10.1% $78,759.46 -8.0% 62.7% 14Senior Building Inspector $40,529.28 -2.6% $51,864.66 2.6% $63,200.04 5.7% 56.0% 7Senior C AD Technician $38,508.17 2.5% $47,617.87 10.6% $56,727.56 15.4% 48.9% 5Senior C ontracting O fficer $43,712.59 -1.8% $56,423.19 2.6% $69,133.80 5.2% 58.9% 6Senior GIS Analyst $42,010.23 2.1% $55,513.21 4.2% $69,016.20 5.3% 65.4% 8Senior P lanner $49,547.18 -15.4% $63,591.13 -9.8% $77,635.09 -6.5% 57.1% 17Senior P lans Examiner $47,984.12 -11.8% $61,380.48 -6.0% $74,776.85 -2.6% 56.3% 10Sign & Striping Technician I $29,535.81 -23.7% $37,939.73 -17.8% $46,343.65 -14.4% 57.7% 12Software Developer $57,160.84 -3.5% $71,354.70 4.2% $85,548.56 8.8% 53.4% 9Spray T ruck O perator $24,522.03 -11.7% $32,255.37 -9.0% $39,988.71 -7.3% 64.2% 6Survey Party C hief (Non-Registered) $36,326.26 -8.8% $47,449.04 -5.4% $58,571.82 -3.3% 61.7% 7Survey Technician II $28,017.50 -17.3% $36,526.09 -13.4% $45,034.67 -11.1% 62.2% 6Trades C rew Leader $34,774.85 -13.3% $43,966.91 -6.2% $53,158.98 -2.0% 52.9% 8Traffic Signal Technician $33,382.23 -8.7% $43,080.88 -4.1% $52,779.52 -1.3% 58.2% 9W eb Designer (Front End Developer) $50,984.97 -9.2% $65,580.93 -4.1% $80,176.89 -1.1% 59.1% 8
O v erall A v erag e -9.0% -3.7% -0.4% 57.9% 9.5
C lassificationSurv ey Minimum Surv ey Midpoint Surv ey Maximum Surv ey Av g
Range# Resp
Market Minimums
A starting point of the analysis was to compare the average of the peers’ minimums for each benchmark classification to those of the County. Market minimums are generally considered as an entry level salary for employees who meet the minimum qualifications of a classification. Those employees with salaries at or near the range minimums are unlikely to have mastered the job and probably have not acquired the skills and experience necessary to be fully proficient in their classification.
As Exhibit 2B illustrates, for the surveyed classifications, the County was, on average, approximately 9.0 percent below market at the minimum of the respective salary ranges. Several conclusions can be drawn based on the collected data:
The surveyed position differentials ranged from 39.4 percent below market minimum in the case of the Parts & Supply Technician to 8.0 percent above market for the GIS Administrator.
Of the 89 positions for which data were collected, 73 classifications (82.0 percent) had differentials which were below market at the minimum.
Chapter 2 – Market Summary Compensation Study for Lake County, FL
Evergreen Solutions, LLC Page 2-6
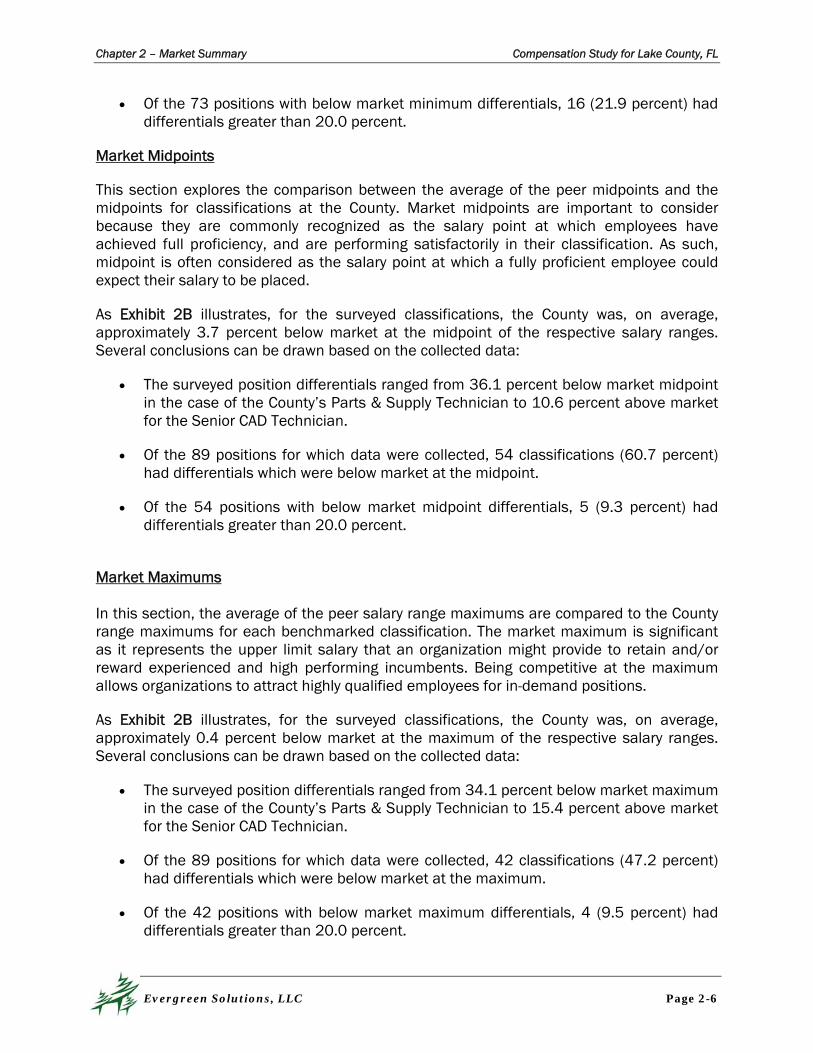
Of the 73 positions with below market minimum differentials, 16 (21.9 percent) had differentials greater than 20.0 percent.
Market Midpoints
This section explores the comparison between the average of the peer midpoints and the midpoints for classifications at the County. Market midpoints are important to consider because they are commonly recognized as the salary point at which employees have achieved full proficiency, and are performing satisfactorily in their classification. As such, midpoint is often considered as the salary point at which a fully proficient employee could expect their salary to be placed.
As Exhibit 2B illustrates, for the surveyed classifications, the County was, on average, approximately 3.7 percent below market at the midpoint of the respective salary ranges. Several conclusions can be drawn based on the collected data:
The surveyed position differentials ranged from 36.1 percent below market midpoint in the case of the County’s Parts & Supply Technician to 10.6 percent above market for the Senior CAD Technician.
Of the 89 positions for which data were collected, 54 classifications (60.7 percent) had differentials which were below market at the midpoint.
Of the 54 positions with below market midpoint differentials, 5 (9.3 percent) had differentials greater than 20.0 percent.
Market Maximums In this section, the average of the peer salary range maximums are compared to the County range maximums for each benchmarked classification. The market maximum is significant as it represents the upper limit salary that an organization might provide to retain and/or reward experienced and high performing incumbents. Being competitive at the maximum allows organizations to attract highly qualified employees for in-demand positions.
As Exhibit 2B illustrates, for the surveyed classifications, the County was, on average, approximately 0.4 percent below market at the maximum of the respective salary ranges. Several conclusions can be drawn based on the collected data:
The surveyed position differentials ranged from 34.1 percent below market maximum in the case of the County’s Parts & Supply Technician to 15.4 percent above market for the Senior CAD Technician.
Of the 89 positions for which data were collected, 42 classifications (47.2 percent) had differentials which were below market at the maximum.
Of the 42 positions with below market maximum differentials, 4 (9.5 percent) had differentials greater than 20.0 percent.
Chapter 2 – Market Summary Compensation Study for Lake County, FL
Evergreen Solutions, LLC Page 2-7
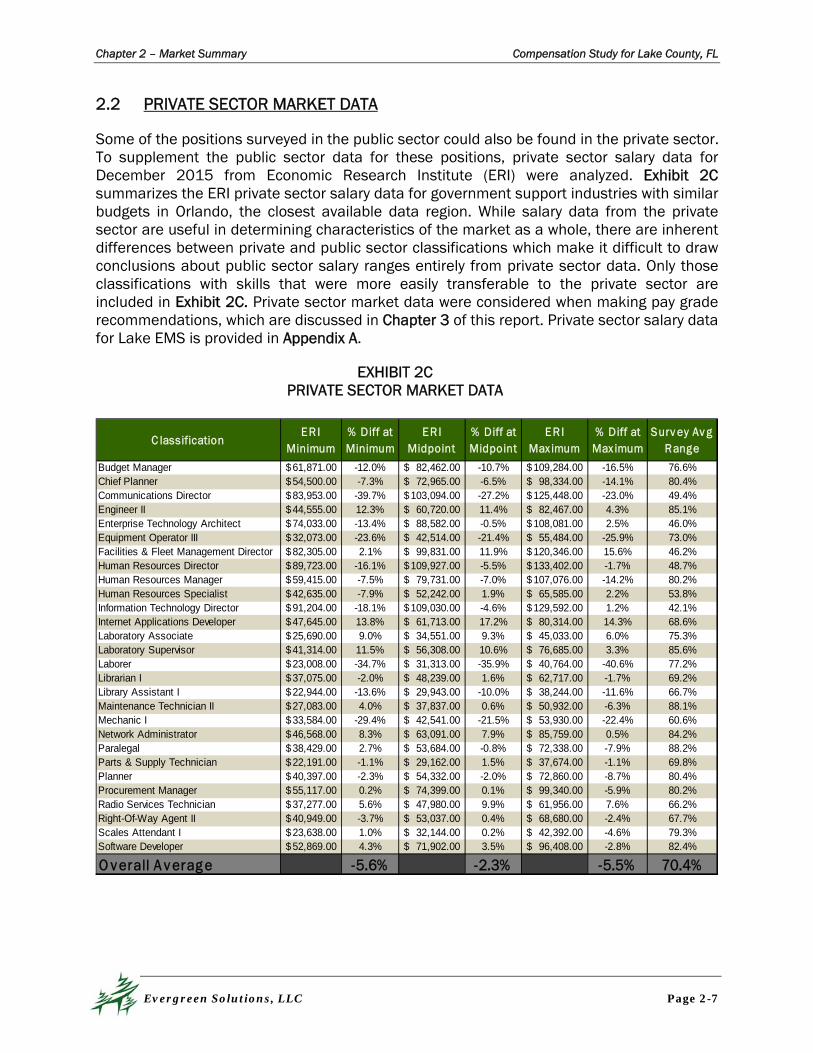
2.2 PRIVATE SECTOR MARKET DATA
Some of the positions surveyed in the public sector could also be found in the private sector. To supplement the public sector data for these positions, private sector salary data for December 2015 from Economic Research Institute (ERI) were analyzed. Exhibit 2C summarizes the ERI private sector salary data for government support industries with similar budgets in Orlando, the closest available data region. While salary data from the private sector are useful in determining characteristics of the market as a whole, there are inherent differences between private and public sector classifications which make it difficult to draw conclusions about public sector salary ranges entirely from private sector data. Only those classifications with skills that were more easily transferable to the private sector are included in Exhibit 2C. Private sector market data were considered when making pay grade recommendations, which are discussed in Chapter 3 of this report. Private sector salary data for Lake EMS is provided in Appendix A.
EXHIBIT 2C PRIVATE SECTOR MARKET DATA
C lassificationERI
Minimum% Diff at Minimum
ERI Midpoint
% Diff at Midpoint
ER I Max imum
% Diff at Max imum
Surv ey Av g Range
Budget Manager 61,871.00$ -12.0% 82,462.00$ -10.7% 109,284.00$ -16.5% 76.6%Chief Planner 54,500.00$ -7.3% 72,965.00$ -6.5% 98,334.00$ -14.1% 80.4%Communications Director 83,953.00$ -39.7% 103,094.00$ -27.2% 125,448.00$ -23.0% 49.4%Engineer II 44,555.00$ 12.3% 60,720.00$ 11.4% 82,467.00$ 4.3% 85.1%Enterprise Technology Architect 74,033.00$ -13.4% 88,582.00$ -0.5% 108,081.00$ 2.5% 46.0%Equipment Operator III 32,073.00$ -23.6% 42,514.00$ -21.4% 55,484.00$ -25.9% 73.0%Facilities & Fleet Management Director 82,305.00$ 2.1% 99,831.00$ 11.9% 120,346.00$ 15.6% 46.2%Human Resources Director 89,723.00$ -16.1% 109,927.00$ -5.5% 133,402.00$ -1.7% 48.7%Human Resources Manager 59,415.00$ -7.5% 79,731.00$ -7.0% 107,076.00$ -14.2% 80.2%Human Resources Specialist 42,635.00$ -7.9% 52,242.00$ 1.9% 65,585.00$ 2.2% 53.8%Information Technology Director 91,204.00$ -18.1% 109,030.00$ -4.6% 129,592.00$ 1.2% 42.1%Internet Applications Developer 47,645.00$ 13.8% 61,713.00$ 17.2% 80,314.00$ 14.3% 68.6%Laboratory Associate 25,690.00$ 9.0% 34,551.00$ 9.3% 45,033.00$ 6.0% 75.3%Laboratory Supervisor 41,314.00$ 11.5% 56,308.00$ 10.6% 76,685.00$ 3.3% 85.6%Laborer 23,008.00$ -34.7% 31,313.00$ -35.9% 40,764.00$ -40.6% 77.2%Librarian I 37,075.00$ -2.0% 48,239.00$ 1.6% 62,717.00$ -1.7% 69.2%Library Assistant I 22,944.00$ -13.6% 29,943.00$ -10.0% 38,244.00$ -11.6% 66.7%Maintenance Technician II 27,083.00$ 4.0% 37,837.00$ 0.6% 50,932.00$ -6.3% 88.1%Mechanic I 33,584.00$ -29.4% 42,541.00$ -21.5% 53,930.00$ -22.4% 60.6%Network Administrator 46,568.00$ 8.3% 63,091.00$ 7.9% 85,759.00$ 0.5% 84.2%Paralegal 38,429.00$ 2.7% 53,684.00$ -0.8% 72,338.00$ -7.9% 88.2%Parts & Supply Technician 22,191.00$ -1.1% 29,162.00$ 1.5% 37,674.00$ -1.1% 69.8%Planner 40,397.00$ -2.3% 54,332.00$ -2.0% 72,860.00$ -8.7% 80.4%Procurement Manager 55,117.00$ 0.2% 74,399.00$ 0.1% 99,340.00$ -5.9% 80.2%Radio Services Technician 37,277.00$ 5.6% 47,980.00$ 9.9% 61,956.00$ 7.6% 66.2%Right-Of-Way Agent II 40,949.00$ -3.7% 53,037.00$ 0.4% 68,680.00$ -2.4% 67.7%Scales Attendant I 23,638.00$ 1.0% 32,144.00$ 0.2% 42,392.00$ -4.6% 79.3%Software Developer 52,869.00$ 4.3% 71,902.00$ 3.5% 96,408.00$ -2.8% 82.4%
O v erall A v erag e -5.6% -2.3% -5.5% 70.4%
Chapter 2 – Market Summary Compensation Study for Lake County, FL
Evergreen Solutions, LLC Page 2-8
After examining the private sector data, the following conclusions can be drawn:
For the selected classifications, the County was approximately 5.6 percent below the private sector minimum.
For the selected classifications, the County was approximately 2.3 percent below the private sector midpoint.
For the selected classifications, the County was approximately 5.5 percent below the private sector maximum.
Additional Information Regarding Merit Pay
When surveying market peer organizations, the County wished to obtain additional pay system/practice related information. Primarily, the County was interested in obtaining information from its peers related to merit or pay performance pay. Detailed information from the peers has been provided to the County under separate cover. However, below is the summary of the 13 respondents providing a response to the following question:
Does the peer organization offer Merit Pay or Pay for Performance Pay?
Of the responding peers, 11 provided some form of merit pay for which the maximum amount (~3%) was typically described as dependent on and determined by the organization’s annual budget.
2.3 SUMMARY
It should again be noted that the standing of a classification’s pay range compared to the market is not a definitive assessment of an individual employee’s salary being equally above or below market. A salary range does, however, speak to the County’s general ability to recruit and retain talent over time. If a range minimum is significantly lower than the market would offer, the County could lose out to the market peers when seeking to fill a position. It is equally true that range maximums lower than the market maximums may serve as a disincentive for tenured employees to remain with the organizations.
This analysis provided a comparison of the existing compensation structures, to the available market peer data at the time of the study. Some classifications had ranges that were ahead of the market while some were well behind. Overall, when comparing the public sector data at the desired position in the market, the County’s current pay plan was behind their peers. Based on these findings, appropriate recommendations are discussed in Chapter 3 of this report. Findings and recommendations for Lake EMS are presented in Appendix A.
Evergreen Solutions, LLC Page 3-1
The analysis of the County compensation system revealed areas of opportunities for improving its competitiveness. The existing pay plans were designed well and suited the needs of the County. Evergreen Solutions determined that adjusting the pay grades of positions that were below the market average would be the most appropriate method of developing a more competitive pay structure. The focus was placed specifically on recommending pay ranges that should remain competitive for several years with some maintenance by the Human Resources staff. These recommendations, as well as the findings that led to each, are presented in this chapter.
3.1 COMPENSATION ANALYSIS
The compensation analysis consisted of the external market assessment (salary survey). During this assessment, the County’s pay ranges for selected benchmark classifications were compared to average pay ranges offered in the identified market. Overall, the salary ranges were below market peers at the minimum, midpoint and maximum of the desired average market position. Details of the external market assessment were provided in Chapter 2 of this report.
FINDING:
The salary ranges were behind market for a number of the benchmarked classifications indicating a need for revision to the pay grades of some positions to remain competitive.
RECOMMENDATION 1: Utilizing the existing structure, based on salary survey results and a review of internal equity, slot all classifications into the existing pay structure; and propose a method for transitioning employee’ salaries into the proposed pay grades.
Exhibit 3A provides the General and Public Safety pay plans for the County.
Chapter 3 – Recommendations
E V E R G R E E N S O L U T I O N S , L L C
Chapter 3 – Recommendations Compensation Study for Lake County, FL
Evergreen Solutions, LLC Page 3-2
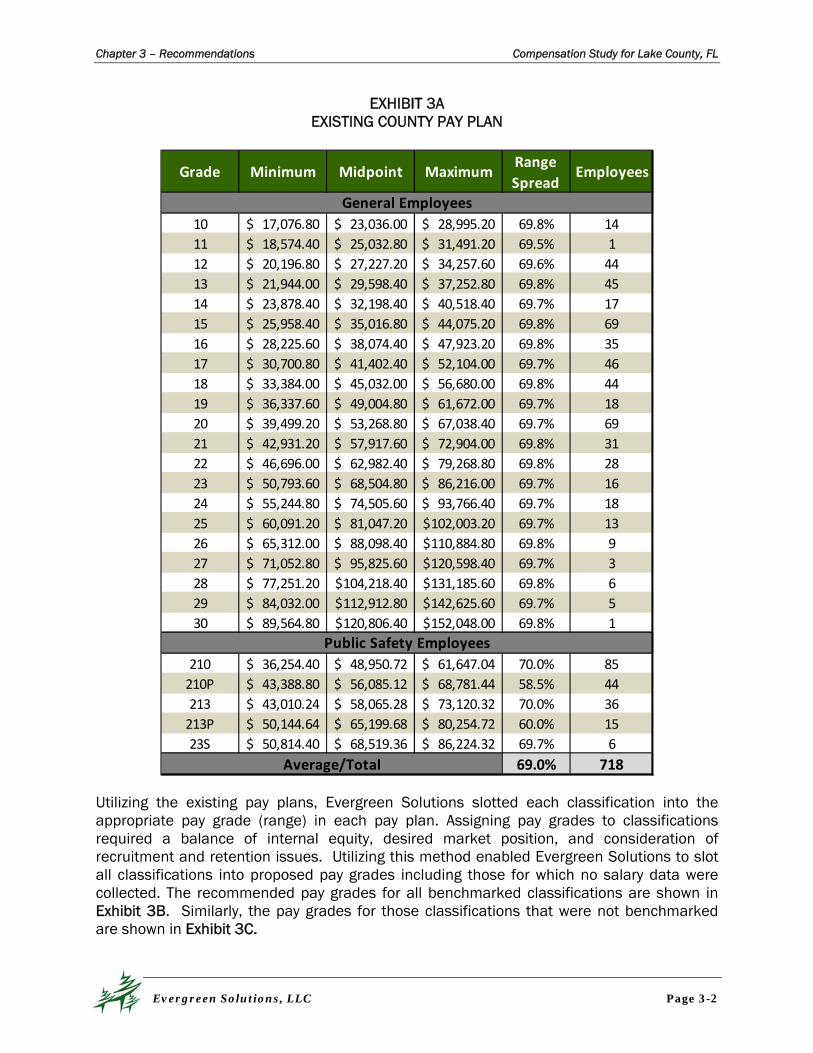
EXHIBIT 3A EXISTING COUNTY PAY PLAN
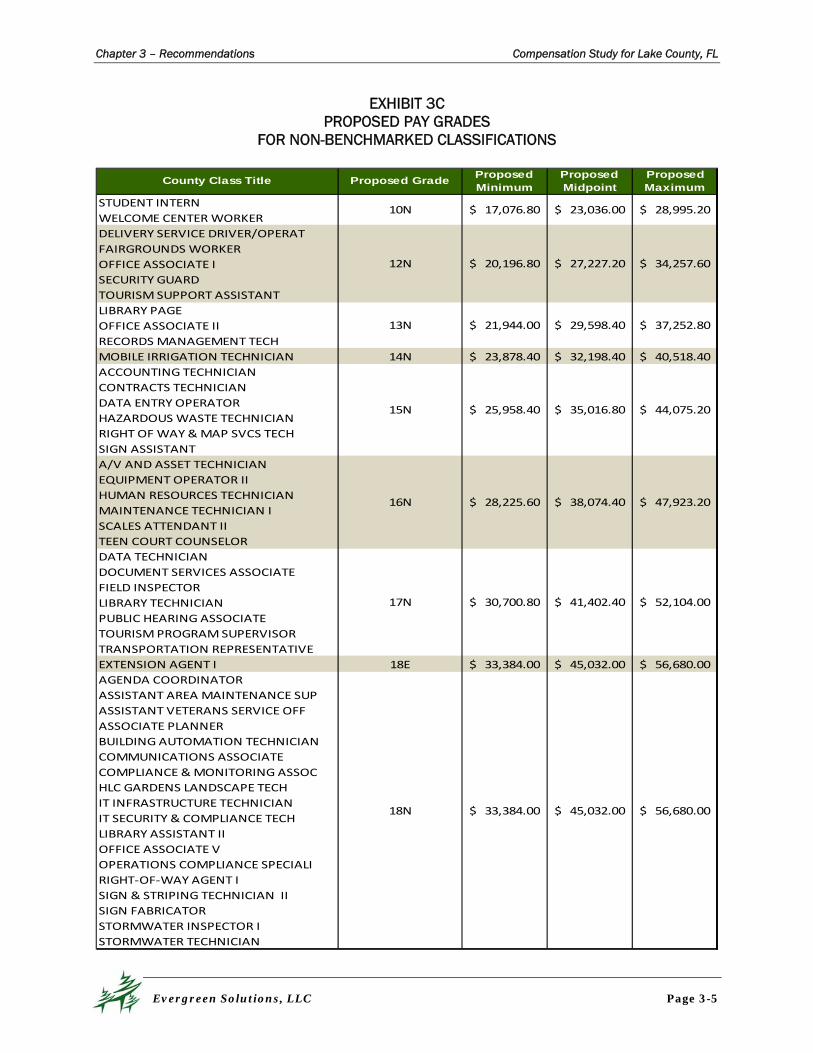
Utilizing the existing pay plans, Evergreen Solutions slotted each classification into the appropriate pay grade (range) in each pay plan. Assigning pay grades to classifications required a balance of internal equity, desired market position, and consideration of recruitment and retention issues. Utilizing this method enabled Evergreen Solutions to slot all classifications into proposed pay grades including those for which no salary data were collected. The recommended pay grades for all benchmarked classifications are shown in Exhibit 3B. Similarly, the pay grades for those classifications that were not benchmarked are shown in Exhibit 3C.
Grade Minimum Midpoint MaximumRange
SpreadEmployees
10 17,076.80$ 23,036.00$ 28,995.20$ 69.8% 14
11 18,574.40$ 25,032.80$ 31,491.20$ 69.5% 1
12 20,196.80$ 27,227.20$ 34,257.60$ 69.6% 44
13 21,944.00$ 29,598.40$ 37,252.80$ 69.8% 45
14 23,878.40$ 32,198.40$ 40,518.40$ 69.7% 17
15 25,958.40$ 35,016.80$ 44,075.20$ 69.8% 69
16 28,225.60$ 38,074.40$ 47,923.20$ 69.8% 35
17 30,700.80$ 41,402.40$ 52,104.00$ 69.7% 46
18 33,384.00$ 45,032.00$ 56,680.00$ 69.8% 44
19 36,337.60$ 49,004.80$ 61,672.00$ 69.7% 18
20 39,499.20$ 53,268.80$ 67,038.40$ 69.7% 69
21 42,931.20$ 57,917.60$ 72,904.00$ 69.8% 31
22 46,696.00$ 62,982.40$ 79,268.80$ 69.8% 28
23 50,793.60$ 68,504.80$ 86,216.00$ 69.7% 16
24 55,244.80$ 74,505.60$ 93,766.40$ 69.7% 18
25 60,091.20$ 81,047.20$ 102,003.20$ 69.7% 13
26 65,312.00$ 88,098.40$ 110,884.80$ 69.8% 9
27 71,052.80$ 95,825.60$ 120,598.40$ 69.7% 3
28 77,251.20$ 104,218.40$ 131,185.60$ 69.8% 6
29 84,032.00$ 112,912.80$ 142,625.60$ 69.7% 5
30 89,564.80$ 120,806.40$ 152,048.00$ 69.8% 1
210 36,254.40$ 48,950.72$ 61,647.04$ 70.0% 85
210P 43,388.80$ 56,085.12$ 68,781.44$ 58.5% 44
213 43,010.24$ 58,065.28$ 73,120.32$ 70.0% 36
213P 50,144.64$ 65,199.68$ 80,254.72$ 60.0% 15
23S 50,814.40$ 68,519.36$ 86,224.32$ 69.7% 6
69.0% 718
General Employees
Public Safety Employees
Average/Total

Chapter 3 – Recommendations Compensation Study for Lake County, FL
Evergreen Solutions, LLC Page 3-3
EXHIBIT 3B PROPOSED PAY GRADES
FOR BENCHMARKED CLASSIFICATIONS
County Class TitleProposed
GradeProposed Minimum
Proposed Midpoint
Proposed Maximum
LABORER
PARK ATTENDANT
LANDFILL ATTENDANT
MAINTENANCE WORKER II
PROBATION ASSOCIATE II
SPRAY TRUCK OPERATOR
EQUIPMENT OPERATOR I
LIBRARY ASSISTANT I
OFFICE ASSOCIATE III
ROADS MAINTENANCE OPERATOR
SCALES ATTENDANT I
PARTS & SUPPLY TECHNICIAN
PERMITTING TECHNICIAN I
SURVEY TECHNICIAN II
BIOLOGICAL ASSOCIATE
EQUIPMENT OPERATOR III
FINANCIAL ASSOCIATE
MAINTENANCE TECHNICIAN II
OFFICE ASSOCIATE IV
PERMITTING TECHNICIAN II
SIGN & STRIPING TECHNCIAN I
CODE ENFORCEMENT OFFICER
LABORATORY ASSOCIATE
MECHANIC I
PARK RANGER
PROBATION OFFICER
RIGHT‐OF‐WAY GIS ASSOCIATE
RISK & BENEFITS REPRESENTATIVE
TRADES CREW LEADER
TRAFFIC SIGNAL TECHNICIAN
COMMISSIONERS AIDE
ENVIRONMENTAL WASTE TECHNICIAN
SURVEY PARTY CHIEF (NON‐REGIS)
AREA MAINTENANCE SUPERVISOR
HUMAN RESOURCES SPECIALIST
LIBRARIAN I
RISK AND BENEFITS SPECIALIST
CODE ENFORCEMENT SUPERVISOR
DISASTER ASSISTANCE SPECIALIST
EMERGENCY MANAGEMENT ASSOCIATE
PARALEGAL
PLANNER
RADIO SERVICES TECHNICIAN
RIGHT‐OF‐WAY AGENT II
SENIOR BUILDING INSPECTOR
SENIOR CAD TECHNICIAN
39,499.20$ 53,268.80$ 67,038.40$
39,499.20$ 53,268.80$ 67,038.40$
33,384.00$ 45,032.00$ 56,680.00$
36,337.60$ 49,004.80$ 61,672.00$
35,016.80$ 44,075.20$
28,225.60$ 38,074.40$ 47,923.20$
30,700.80$ 41,402.40$ 52,104.00$
21,944.00$ 29,598.40$ 37,252.80$
23,878.40$ 32,198.40$ 40,518.40$
25,958.40$
19N
20E
20N
13N
14N
15N
16N
17N
18N
Chapter 3 – Recommendations Compensation Study for Lake County, FL
Evergreen Solutions, LLC Page 3-4
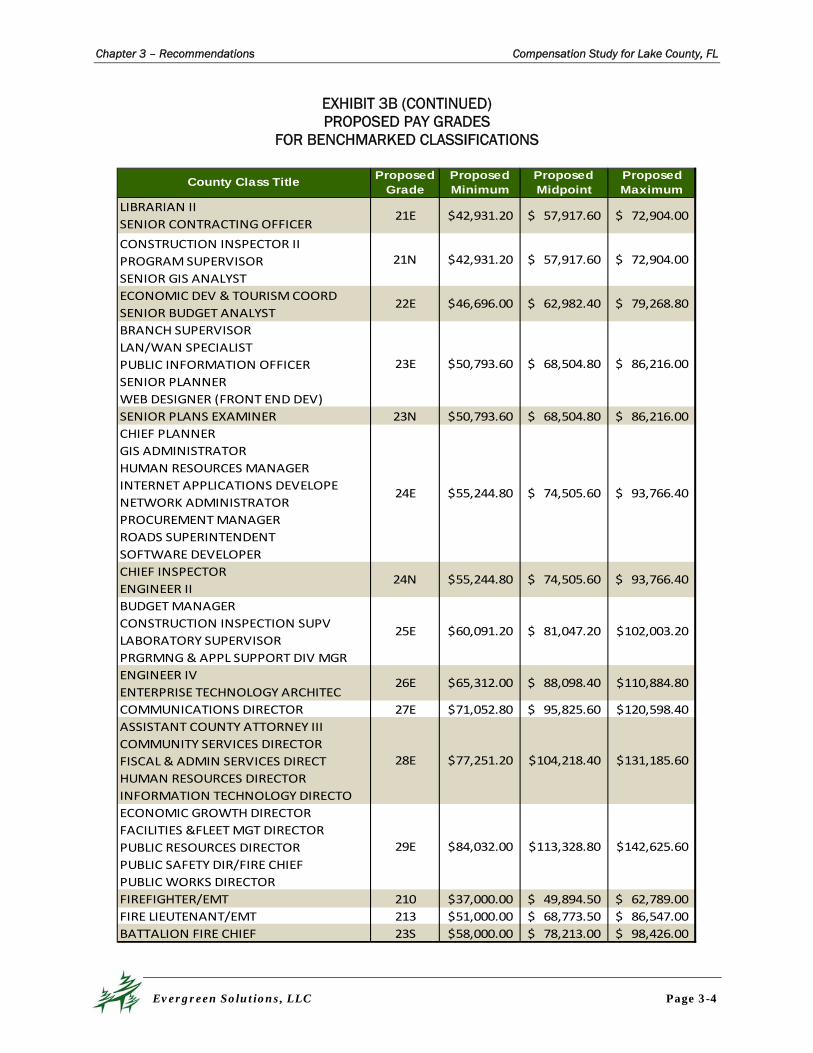
EXHIBIT 3B (CONTINUED) PROPOSED PAY GRADES
FOR BENCHMARKED CLASSIFICATIONS
County Class TitleProposed
GradeProposed Minimum
Proposed Midpoint
Proposed Maximum
LIBRARIAN II
SENIOR CONTRACTING OFFICER
CONSTRUCTION INSPECTOR II
PROGRAM SUPERVISOR
SENIOR GIS ANALYST
ECONOMIC DEV & TOURISM COORD
SENIOR BUDGET ANALYST
BRANCH SUPERVISOR
LAN/WAN SPECIALIST
PUBLIC INFORMATION OFFICER
SENIOR PLANNER
WEB DESIGNER (FRONT END DEV)
SENIOR PLANS EXAMINER 23N 50,793.60$ 68,504.80$ 86,216.00$
CHIEF PLANNER
GIS ADMINISTRATOR
HUMAN RESOURCES MANAGER
INTERNET APPLICATIONS DEVELOPE
NETWORK ADMINISTRATOR
PROCUREMENT MANAGER
ROADS SUPERINTENDENT
SOFTWARE DEVELOPER
CHIEF INSPECTOR
ENGINEER II
BUDGET MANAGER
CONSTRUCTION INSPECTION SUPV
LABORATORY SUPERVISOR
PRGRMNG & APPL SUPPORT DIV MGR
ENGINEER IV
ENTERPRISE TECHNOLOGY ARCHITEC
COMMUNICATIONS DIRECTOR 27E 71,052.80$ 95,825.60$ 120,598.40$
ASSISTANT COUNTY ATTORNEY III
COMMUNITY SERVICES DIRECTOR
FISCAL & ADMIN SERVICES DIRECT
HUMAN RESOURCES DIRECTOR
INFORMATION TECHNOLOGY DIRECTO
ECONOMIC GROWTH DIRECTOR
FACILITIES &FLEET MGT DIRECTOR
PUBLIC RESOURCES DIRECTOR
PUBLIC SAFETY DIR/FIRE CHIEF
PUBLIC WORKS DIRECTOR
FIREFIGHTER/EMT 210 37,000.00$ 49,894.50$ 62,789.00$
FIRE LIEUTENANT/EMT 213 51,000.00$ 68,773.50$ 86,547.00$
BATTALION FIRE CHIEF 23S 58,000.00$ 78,213.00$ 98,426.00$
77,251.20$ 104,218.40$ 131,185.60$
84,032.00$ 113,328.80$ 142,625.60$
60,091.20$ 81,047.20$ 102,003.20$
65,312.00$ 88,098.40$ 110,884.80$
55,244.80$ 74,505.60$ 93,766.40$
55,244.80$ 74,505.60$ 93,766.40$
46,696.00$ 62,982.40$ 79,268.80$
50,793.60$ 68,504.80$ 86,216.00$
42,931.20$ 57,917.60$ 72,904.00$
42,931.20$ 57,917.60$ 72,904.00$
23E
22E
21N
21E
29E
28E
26E
25E
24N
24E
Chapter 3 – Recommendations Compensation Study for Lake County, FL
Evergreen Solutions, LLC Page 3-5
EXHIBIT 3C PROPOSED PAY GRADES
FOR NON-BENCHMARKED CLASSIFICATIONS
County Class Title Proposed GradeProposed Minimum
Proposed Midpoint
Proposed Maximum
STUDENT INTERN
WELCOME CENTER WORKER
DELIVERY SERVICE DRIVER/OPERAT
FAIRGROUNDS WORKER
OFFICE ASSOCIATE I
SECURITY GUARD
TOURISM SUPPORT ASSISTANT
LIBRARY PAGE
OFFICE ASSOCIATE II
RECORDS MANAGEMENT TECH
MOBILE IRRIGATION TECHNICIAN 14N 23,878.40$ 32,198.40$ 40,518.40$
ACCOUNTING TECHNICIAN
CONTRACTS TECHNICIAN
DATA ENTRY OPERATOR
HAZARDOUS WASTE TECHNICIAN
RIGHT OF WAY & MAP SVCS TECH
SIGN ASSISTANT
A/V AND ASSET TECHNICIAN
EQUIPMENT OPERATOR II
HUMAN RESOURCES TECHNICIAN
MAINTENANCE TECHNICIAN I
SCALES ATTENDANT II
TEEN COURT COUNSELOR
DATA TECHNICIAN
DOCUMENT SERVICES ASSOCIATE
FIELD INSPECTOR
LIBRARY TECHNICIAN
PUBLIC HEARING ASSOCIATE
TOURISM PROGRAM SUPERVISOR
TRANSPORTATION REPRESENTATIVE
EXTENSION AGENT I 18E 33,384.00$ 45,032.00$ 56,680.00$
AGENDA COORDINATOR
ASSISTANT AREA MAINTENANCE SUP
ASSISTANT VETERANS SERVICE OFF
ASSOCIATE PLANNER
BUILDING AUTOMATION TECHNICIAN
COMMUNICATIONS ASSOCIATE
COMPLIANCE & MONITORING ASSOC
HLC GARDENS LANDSCAPE TECH
IT INFRASTRUCTURE TECHNICIAN
IT SECURITY & COMPLIANCE TECH
LIBRARY ASSISTANT II
OFFICE ASSOCIATE V
OPERATIONS COMPLIANCE SPECIALI
RIGHT‐OF‐WAY AGENT I
SIGN & STRIPING TECHNICIAN II
SIGN FABRICATOR
STORMWATER INSPECTOR I
STORMWATER TECHNICIAN
45,032.00$ 56,680.00$
35,016.80$ 44,075.20$
28,225.60$ 38,074.40$ 47,923.20$
30,700.80$ 41,402.40$ 52,104.00$
23,036.00$ 28,995.20$
20,196.80$ 27,227.20$ 34,257.60$
21,944.00$ 29,598.40$ 37,252.80$
17,076.80$
25,958.40$
33,384.00$ 18N
10N
12N
13N
15N
16N
17N
Chapter 3 – Recommendations Compensation Study for Lake County, FL
Evergreen Solutions, LLC Page 3-6
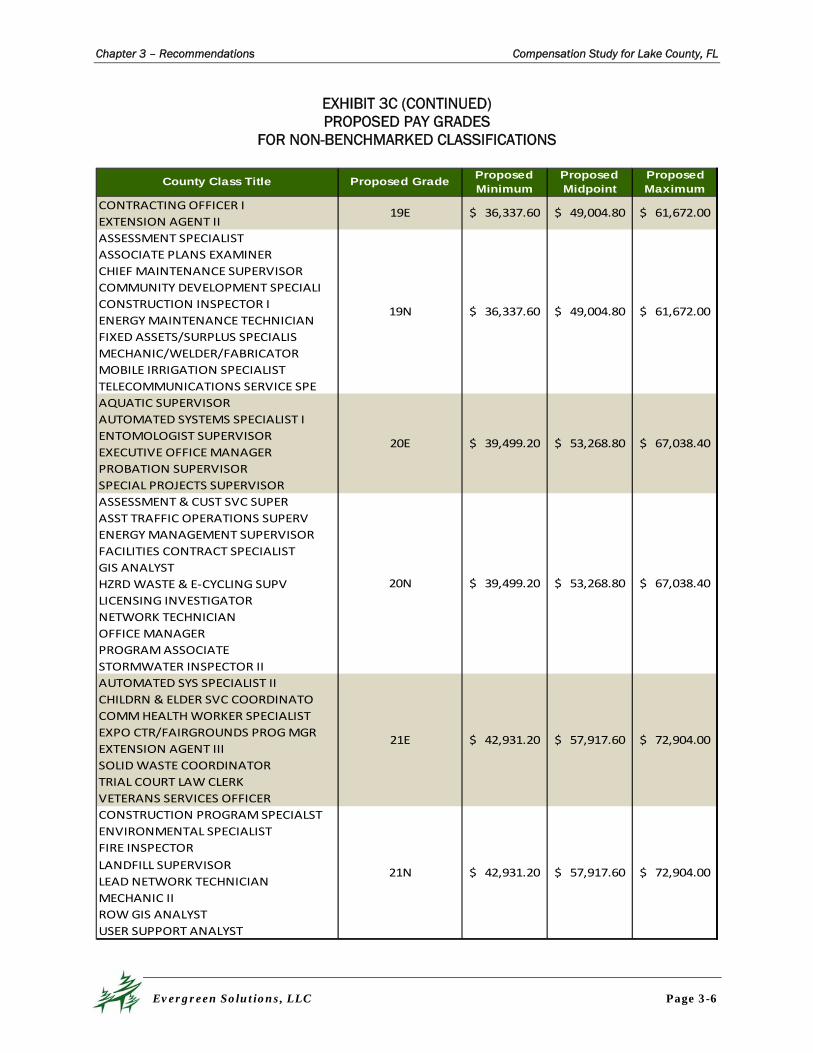
EXHIBIT 3C (CONTINUED) PROPOSED PAY GRADES
FOR NON-BENCHMARKED CLASSIFICATIONS
County Class Title Proposed GradeProposed Minimum
Proposed Midpoint
Proposed Maximum
CONTRACTING OFFICER I
EXTENSION AGENT II
ASSESSMENT SPECIALIST
ASSOCIATE PLANS EXAMINER
CHIEF MAINTENANCE SUPERVISOR
COMMUNITY DEVELOPMENT SPECIALI
CONSTRUCTION INSPECTOR I
ENERGY MAINTENANCE TECHNICIAN
FIXED ASSETS/SURPLUS SPECIALIS
MECHANIC/WELDER/FABRICATOR
MOBILE IRRIGATION SPECIALIST
TELECOMMUNICATIONS SERVICE SPE
AQUATIC SUPERVISOR
AUTOMATED SYSTEMS SPECIALIST I
ENTOMOLOGIST SUPERVISOR
EXECUTIVE OFFICE MANAGER
PROBATION SUPERVISOR
SPECIAL PROJECTS SUPERVISOR
ASSESSMENT & CUST SVC SUPER
ASST TRAFFIC OPERATIONS SUPERV
ENERGY MANAGEMENT SUPERVISOR
FACILITIES CONTRACT SPECIALIST
GIS ANALYST
HZRD WASTE & E‐CYCLING SUPV
LICENSING INVESTIGATOR
NETWORK TECHNICIAN
OFFICE MANAGER
PROGRAM ASSOCIATE
STORMWATER INSPECTOR II
AUTOMATED SYS SPECIALIST II
CHILDRN & ELDER SVC COORDINATO
COMM HEALTH WORKER SPECIALIST
EXPO CTR/FAIRGROUNDS PROG MGR
EXTENSION AGENT III
SOLID WASTE COORDINATOR
TRIAL COURT LAW CLERK
VETERANS SERVICES OFFICER
CONSTRUCTION PROGRAM SPECIALST
ENVIRONMENTAL SPECIALIST
FIRE INSPECTOR
LANDFILL SUPERVISOR
LEAD NETWORK TECHNICIAN
MECHANIC II
ROW GIS ANALYST
USER SUPPORT ANALYST
57,917.60$ 72,904.00$
53,268.80$ 67,038.40$
39,499.20$ 53,268.80$ 67,038.40$
42,931.20$ 57,917.60$ 72,904.00$
36,337.60$ 49,004.80$ 61,672.00$
36,337.60$ 49,004.80$ 61,672.00$
39,499.20$
42,931.20$ 21N
19E
19N
20E
20N
21E
Chapter 3 – Recommendations Compensation Study for Lake County, FL
Evergreen Solutions, LLC Page 3-7
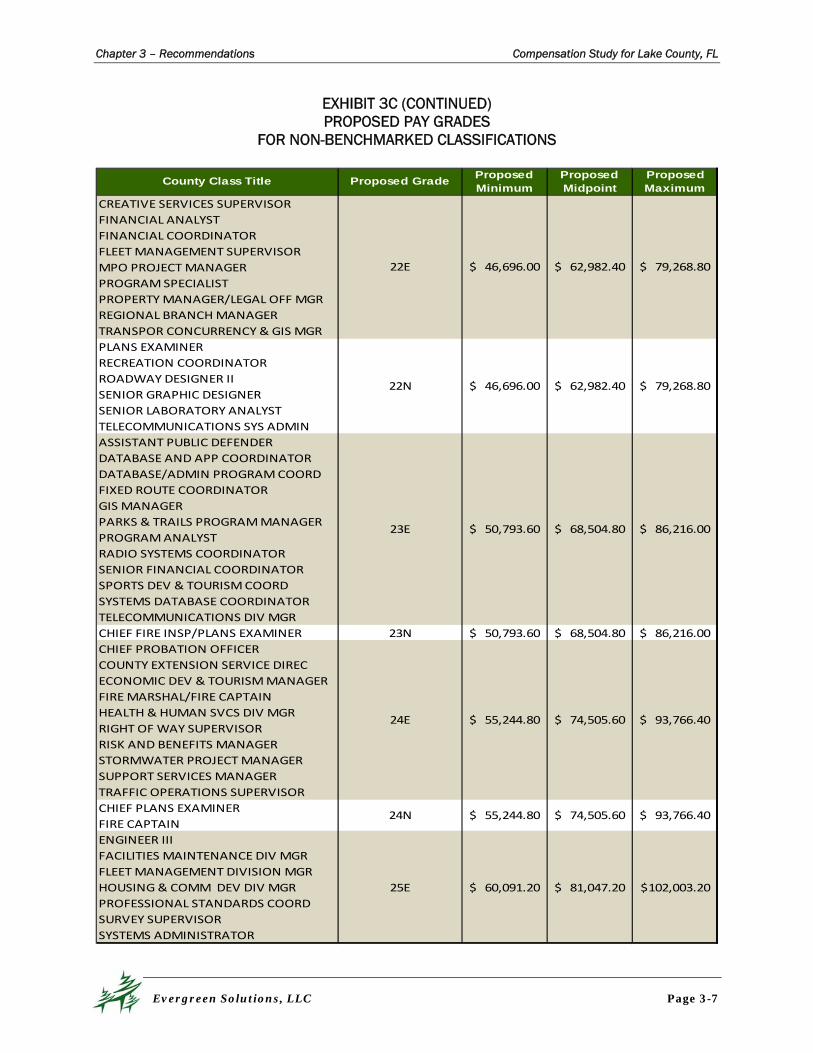
EXHIBIT 3C (CONTINUED) PROPOSED PAY GRADES
FOR NON-BENCHMARKED CLASSIFICATIONS
County Class Title Proposed GradeProposed Minimum
Proposed Midpoint
Proposed Maximum
CREATIVE SERVICES SUPERVISOR
FINANCIAL ANALYST
FINANCIAL COORDINATOR
FLEET MANAGEMENT SUPERVISOR
MPO PROJECT MANAGER
PROGRAM SPECIALIST
PROPERTY MANAGER/LEGAL OFF MGR
REGIONAL BRANCH MANAGER
TRANSPOR CONCURRENCY & GIS MGR
PLANS EXAMINER
RECREATION COORDINATOR
ROADWAY DESIGNER II
SENIOR GRAPHIC DESIGNER
SENIOR LABORATORY ANALYST
TELECOMMUNICATIONS SYS ADMIN
ASSISTANT PUBLIC DEFENDER
DATABASE AND APP COORDINATOR
DATABASE/ADMIN PROGRAM COORD
FIXED ROUTE COORDINATOR
GIS MANAGER
PARKS & TRAILS PROGRAM MANAGER
PROGRAM ANALYST
RADIO SYSTEMS COORDINATOR
SENIOR FINANCIAL COORDINATOR
SPORTS DEV & TOURISM COORD
SYSTEMS DATABASE COORDINATOR
TELECOMMUNICATIONS DIV MGR
CHIEF FIRE INSP/PLANS EXAMINER 23N 50,793.60$ 68,504.80$ 86,216.00$
CHIEF PROBATION OFFICER
COUNTY EXTENSION SERVICE DIREC
ECONOMIC DEV & TOURISM MANAGER
FIRE MARSHAL/FIRE CAPTAIN
HEALTH & HUMAN SVCS DIV MGR
RIGHT OF WAY SUPERVISOR
RISK AND BENEFITS MANAGER
STORMWATER PROJECT MANAGER
SUPPORT SERVICES MANAGER
TRAFFIC OPERATIONS SUPERVISOR
CHIEF PLANS EXAMINER
FIRE CAPTAIN
ENGINEER III
FACILITIES MAINTENANCE DIV MGR
FLEET MANAGEMENT DIVISION MGR
HOUSING & COMM DEV DIV MGR
PROFESSIONAL STANDARDS COORD
SURVEY SUPERVISOR
SYSTEMS ADMINISTRATOR
60,091.20$ 81,047.20$ 102,003.20$
50,793.60$ 68,504.80$ 86,216.00$
55,244.80$ 74,505.60$
55,244.80$ 74,505.60$ 93,766.40$
93,766.40$
46,696.00$ 62,982.40$ 79,268.80$
46,696.00$ 62,982.40$ 79,268.80$
25E
22E
22N
23E
24E
24N

Chapter 3 – Recommendations Compensation Study for Lake County, FL
Evergreen Solutions, LLC Page 3-8
EXHIBIT 3C (CONTINUED) PROPOSED PAY GRADES
FOR NON-BENCHMARKED CLASSIFICATIONS
After assigning pay grades to classifications, the next phase was to propose a method of transitioning current employee’ salaries into the new pay plans. This was done by establishing a method of calculating salaries in the new pay grades and determining whether adjustments were needed to individual employee salaries to bring them to their calculated salary. Evergreen Solutions approached this transition by calculating employee salaries for placement in the new pay grades utilizing a method of bringing employee’ salaries to the new minimums as necessary if there was a change in the employee’s assigned classification’s pay grade. Provided below is the cost estimate for this method. Typically, additional methods are provided, however, at the time of this report, the County was reviewing fiscal constraints and various alternative transition methods.
Bring Employee Salaries to New Minimums
In this approach, each employee’s current salary was compared to the minimum of his or her proposed classification’s pay grade. If an employee’s current salary was below his or her new grade minimum, an adjustment is proposed to raise the individual’s salary to the minimum. If the employee’s current salary was already above his or her grade minimum, no adjustment is recommended.
County Class Title Proposed GradeProposed Minimum
Proposed Midpoint
Proposed Maximum
BUILDING SERVICES DIV MGR
CODE ENFORCEMENT DIVISION MGR
COMMUNITY LIAISON MANAGER
PARKS & TRAILS DIVISION MANGR
PLANNING DIVISION MANAGER
PUB SAFTY COM TCH DIV MGR/E911
ASSISTANT FIRE CHIEF
EMERGENCY MANAGEMENT DIV MGR
ROAD OPS DIVISION MANAGER
COMMUNITY SAFETY & COMPLIANCE
COUNTY ENGINEER
ENVIRONMENTAL SVCS DIV MANAGER
LIBRARY SERVICES DIVISION MGR
DEPUTY COUNTY MANAGER 30E 89,564.80$ 120,806.40$ 152,048.00$
EXEC DIR MPO No Assigned Grade 75,732.80$ 98,467.20$ 121,201.60$
COUNTY ATTORNEY
COUNTY MANAGER
FIREFIGHTER/PARAMEDIC 210P 44,299.96$ 57,257.70$ 70,215.44$
FIRE LIEUTENANT/PARAMEDIC 213P 57,500.00$ 74,750.00$ 92,000.00$
71,052.80$
77,251.20$
104,000.00$ 201,999.20$ 299,998.40$
131,185.60$ 104,218.40$
95,825.60$ 120,598.40$
65,312.00$ 88,098.40$ 110,884.80$ 26E
27E
28E
No Assigned Grade
Chapter 3 – Recommendations Compensation Study for Lake County, FL
Evergreen Solutions, LLC Page 3-9
With this approach, salary adjustments are recommended for 209 County employees with an approximate annualized cost of $588,784. The approximate cost is for salary adjustments only and does not include the associated cost for employee benefits.
3.2 SYSTEM ADMINISTRATION
The County and compensation system will continue to need periodic maintenance. The recommendations provided to improve the competiveness of the compensation system were developed based on conditions at the time the data were collected. Without proper upkeep, the potential for recruitment and retention issues may increase as the compensation system becomes dated and less competitive.
FINDING:
The salary survey results indicated that the existing pay plans for identified classifications were behind the desired market position. As discovered during the salary survey, the pay grades of several classifications should be adjusted to be competitive with the market.
RECOMMENDATION 2: Conduct small-scale salary surveys as needed to assess the market competitiveness of hard-to-fill classifications and/or classifications with retention issues, and make adjustments to pay grade assignments as necessary.
While it is unlikely that the pay plan as a whole will need to be adjusted for several years, a small number of classifications’ pay grades may need to be reassigned more frequently. If one or more classifications are exhibiting high turnover or are having difficulty with recruitment, the County should collect salary range data from peer organizations to determine whether an adjustment is needed for the pay grade of these classifications.
RECOMMENDATION 3: Conduct a comprehensive classification and compensation study every three to five years.
Small-scale salary surveys can improve the market position of specific classifications, however it is recommended that a full classification and compensation study be conducted every three to five years to preserve both internal and external equity of the County’s classification and compensation system. Changes to classification and compensation do occur, and while the increments of change may seem minor, they can compound over time. A failure to react to these changes quickly has the potential to place both organizations in challenging positions for recruiting and retaining quality employees.
3.3 PAY PRACTICES
While the previous recommendations are intended to maintain the competitiveness over time of particular classifications and the compensation structure, it is also necessary to continue to review, evaluate, and as appropriate, update the County’s associated pay practices.
Chapter 3 – Recommendations Compensation Study for Lake County, FL
Evergreen Solutions, LLC Page 3-10
FINDING:
The County’s pay practices were within today’s standards. However, the County should consider more flexible guidelines to be more aligned with today’s best practices. While the method of moving salaries through the pay plan and setting new salaries for new hires, promotions, demotions, and transfers depends largely on an organization’s compensation philosophy, it should also consider the practices of its peer market. Ultimately, it is important for the County to have established guidelines for each of these situations, and that they are followed consistently for all employees.
RECOMMENDATION 4: Review and consider revisions to policies for moving employee’ salaries through the pay plan, including procedures for determining salaries of newly hired employees and employees who have been promoted, demoted, or transferred to a different classification or department. Best practices for progressing and establishing employee salaries are outlined below.
New Hires
A new employee’s starting salary should largely depend on the amount of education and experience the employee possesses beyond the minimum requirements for the job. Typically, an employee holding only the minimum education and experience requirements for a classification is hired at or near the classification’s pay grade minimum. An upper limit to the percentage above minimum that can be offered to a new employee with only the minimum requirements is typically established, where approval is needed to offer a starting salary that is a higher percentage above minimum. Another threshold is usually in place as the maximum starting salary possible without approval for new employees with considerable experience and/or education above the requirements for the position. It is common for the midpoint to be used as the maximum starting salary. All starting salaries should take into consideration internal equity, meaning that determining a new hire salary should be done with consideration of existing employee salaries with similar levels of education and experience in the classification.
Salary Progression
There are several best practice, common methods for salary progression including cost of living adjustments (COLA), merit pay, and to a lesser extent today, longevity increases. Organizations sometimes utilize multiple methods together to reward employees. For example, merit pay is often used in tandem with a COLA, so that a minimum increase tied to a measure of inflation is awarded to all employees and an additional percentage increase is earned by employees with positive evaluations. Historically, employers in the private sector and more recently, employers in the public sector have moved away from COLA and longevity as a means of progressing employee salaries and more toward merit. However, in order for a merit pay system to work effectively, a fair, organization-wide performance evaluation system must be in place, and supervisors and management must receive proper training to ensure an equitable application of the process.
Chapter 3 – Recommendations Compensation Study for Lake County, FL
Evergreen Solutions, LLC Page 3-11
Promotions
When an employee is promoted to a new classification, it is important to have guidelines for calculating the employee’s new salary that rewards the employee for his or her new responsibilities, moves the salary into the new pay grade, and ensures internal equity in the new classification. It is common for organizations to establish a minimum percentage salary increase that depends on the increase in pay grade as a result of the promotion. For example, if an employee moves into the next pay grade he or she may receive a minimum of a three to five percent increase and if the individual moves up two pay grades he or she may experience an increase closer to six to ten percent. Regardless of the minimum percent increase, the employee’s new salary should be within the new pay grade’s range, and internal equity of salaries within the classification should be preserved.
Demotions
An employee demotion is a sensitive subject and must be handled as such. While some organizations do reduce the salary of demoted employees, there are other options available for these situations. One option is to adjust the employee’s salary to the salary received while in the previous position if the demotion occurs following a promotion to a higher level position within the same job family. Another option is to reduce the employee’s salary to a salary commensurate with the level of an employee joining that organization in that classification. Another option is reduce the employee’s salary by a percentage, for example three percent, and apply this practice consistently across the organization for all demotions.
Transfers
An employee transfer occurs when an employee is reassigned to a classification at the same pay grade as his or her current classification or when an employee’s classification stays the same, but his or her department changes. In either of these cases, it is likely that no adjustment is necessary to the employee’s salary. The only situation in which a salary adjustment would be needed for a transferred employee would be if his or her current salary is not aligned with the salaries of employees in the new classification or department. If that occurs, it may be necessary to adjust the salary of the employee or the incumbents of the classification to ensure salary equity within the new classification.
3.4 SUMMARY
The recommendations in this chapter, if implemented, will improve the competitiveness of the County’s pay system by providing externally and internally equitable pay plan ranges. In addition, by developing and implementing more flexible pay practices the County will likely alleviate some of its current recruiting and retention concerns. While the upkeep of the compensation system will require work, the County will find that having a more competitive, flexible system that enables strong recruitment and encourages employee retention is well worth this commitment.
Evergreen Solutions, LLC
Appendix A Compensation Study Data for Lake EMS
APPENDIX A
Compensation Study Data for Lake Emergency Medical Services (Lake EMS)
Market Summary:
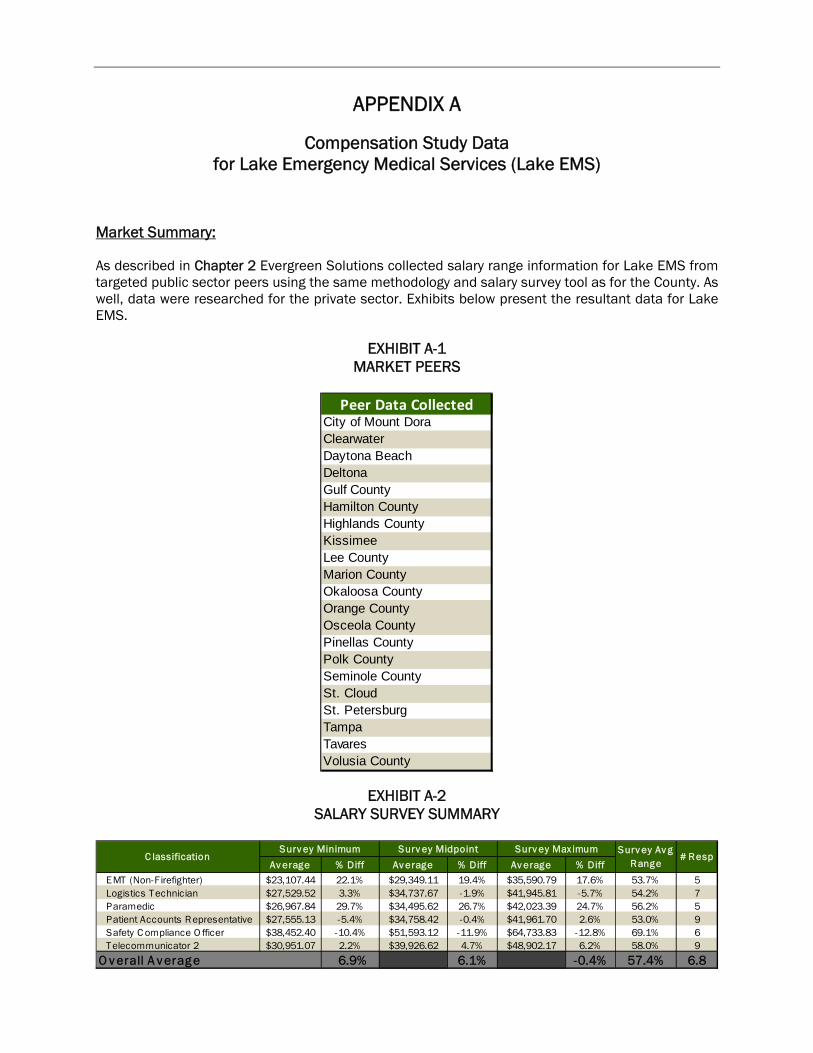
As described in Chapter 2 Evergreen Solutions collected salary range information for Lake EMS from targeted public sector peers using the same methodology and salary survey tool as for the County. As well, data were researched for the private sector. Exhibits below present the resultant data for Lake EMS.
EXHIBIT A-1 MARKET PEERS
EXHIBIT A-2 SALARY SURVEY SUMMARY
Peer Data CollectedCity of Mount DoraClearwaterDaytona BeachDeltonaGulf CountyHamilton CountyHighlands CountyKissimeeLee CountyMarion CountyOkaloosa CountyOrange CountyOsceola CountyPinellas CountyPolk CountySeminole CountySt. CloudSt. PetersburgTampaTavaresVolusia County
Av erage % Diff Av erage % Diff Av erage % Diff
EMT (Non-Firefighter) $23,107.44 22.1% $29,349.11 19.4% $35,590.79 17.6% 53.7% 5Logistics Technician $27,529.52 3.3% $34,737.67 -1.9% $41,945.81 -5.7% 54.2% 7Paramedic $26,967.84 29.7% $34,495.62 26.7% $42,023.39 24.7% 56.2% 5Patient Accounts Representative $27,555.13 -5.4% $34,758.42 -0.4% $41,961.70 2.6% 53.0% 9Safety C ompliance O fficer $38,452.40 -10.4% $51,593.12 -11.9% $64,733.83 -12.8% 69.1% 6Telecommunicator 2 $30,951.07 2.2% $39,926.62 4.7% $48,902.17 6.2% 58.0% 9
O v erall A v erag e 6.9% 6.1% -0.4% 57.4% 6.8
# RespSurv ey Maximum Surv ey Av g
RangeC lassification
Surv ey Minimum Surv ey Midpoint
Appendix Compensation Study for Lake County, FL
Evergreen Solutions, LLC Page A-2
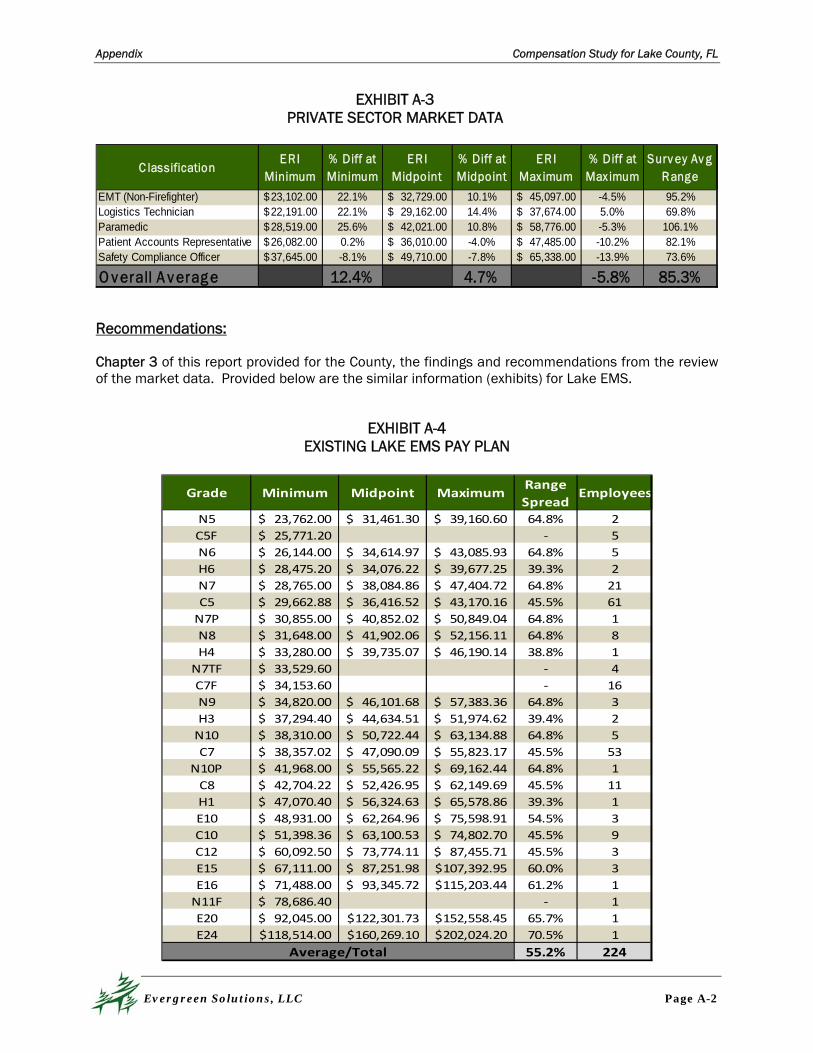
EXHIBIT A-3 PRIVATE SECTOR MARKET DATA
Recommendations:
Chapter 3 of this report provided for the County, the findings and recommendations from the review of the market data. Provided below are the similar information (exhibits) for Lake EMS.
EXHIBIT A-4
EXISTING LAKE EMS PAY PLAN
C lassificationERI
Minimum% Diff at Minimum
ERI Midpoint
% Diff at Midpoint
ER I Max imum
% Diff at Max imum
Surv ey Av g Range
EMT (Non-Firefighter) 23,102.00$ 22.1% 32,729.00$ 10.1% 45,097.00$ -4.5% 95.2%Logistics Technician 22,191.00$ 22.1% 29,162.00$ 14.4% 37,674.00$ 5.0% 69.8%Paramedic 28,519.00$ 25.6% 42,021.00$ 10.8% 58,776.00$ -5.3% 106.1%Patient Accounts Representative 26,082.00$ 0.2% 36,010.00$ -4.0% 47,485.00$ -10.2% 82.1%Safety Compliance Officer 37,645.00$ -8.1% 49,710.00$ -7.8% 65,338.00$ -13.9% 73.6%
O v erall A v erag e 12.4% 4.7% -5.8% 85.3%
Grade Minimum Midpoint MaximumRange
SpreadEmployees
N5 23,762.00$ 31,461.30$ 39,160.60$ 64.8% 2
C5F 25,771.20$ ‐ 5
N6 26,144.00$ 34,614.97$ 43,085.93$ 64.8% 5
H6 28,475.20$ 34,076.22$ 39,677.25$ 39.3% 2
N7 28,765.00$ 38,084.86$ 47,404.72$ 64.8% 21
C5 29,662.88$ 36,416.52$ 43,170.16$ 45.5% 61
N7P 30,855.00$ 40,852.02$ 50,849.04$ 64.8% 1
N8 31,648.00$ 41,902.06$ 52,156.11$ 64.8% 8
H4 33,280.00$ 39,735.07$ 46,190.14$ 38.8% 1
N7TF 33,529.60$ ‐ 4
C7F 34,153.60$ ‐ 16
N9 34,820.00$ 46,101.68$ 57,383.36$ 64.8% 3
H3 37,294.40$ 44,634.51$ 51,974.62$ 39.4% 2
N10 38,310.00$ 50,722.44$ 63,134.88$ 64.8% 5
C7 38,357.02$ 47,090.09$ 55,823.17$ 45.5% 53
N10P 41,968.00$ 55,565.22$ 69,162.44$ 64.8% 1
C8 42,704.22$ 52,426.95$ 62,149.69$ 45.5% 11
H1 47,070.40$ 56,324.63$ 65,578.86$ 39.3% 1
E10 48,931.00$ 62,264.96$ 75,598.91$ 54.5% 3
C10 51,398.36$ 63,100.53$ 74,802.70$ 45.5% 9
C12 60,092.50$ 73,774.11$ 87,455.71$ 45.5% 3
E15 67,111.00$ 87,251.98$ 107,392.95$ 60.0% 3
E16 71,488.00$ 93,345.72$ 115,203.44$ 61.2% 1
N11F 78,686.40$ ‐ 1
E20 92,045.00$ 122,301.73$ 152,558.45$ 65.7% 1
E24 118,514.00$ 160,269.10$ 202,024.20$ 70.5% 1
55.2% 224Average/Total
Appendix Compensation Study for Lake County, FL
Evergreen Solutions, LLC Page A-3
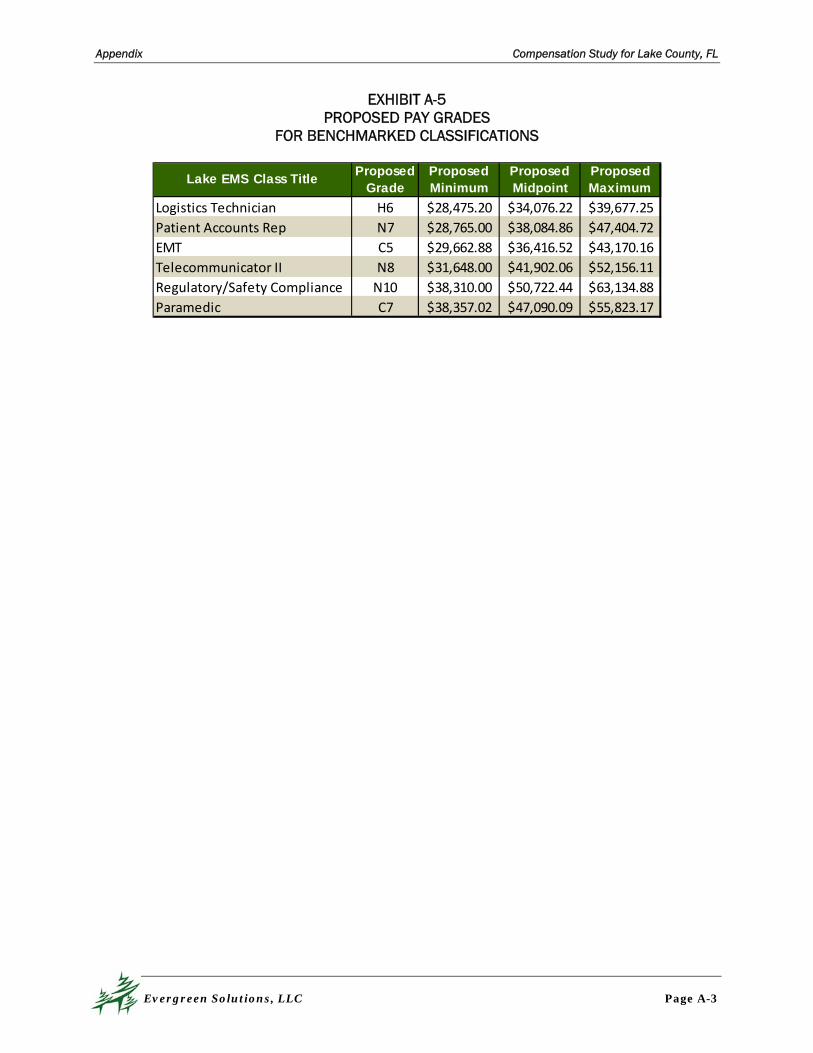
EXHIBIT A-5 PROPOSED PAY GRADES
FOR BENCHMARKED CLASSIFICATIONS
Lake EMS Class TitleProposed
GradeProposed Minimum
Proposed Midpoint
Proposed Maximum
Logistics Technician H6 28,475.20$ 34,076.22$ 39,677.25$
Patient Accounts Rep N7 28,765.00$ 38,084.86$ 47,404.72$
EMT C5 29,662.88$ 36,416.52$ 43,170.16$
Telecommunicator II N8 31,648.00$ 41,902.06$ 52,156.11$
Regulatory/Safety Compliance N10 38,310.00$ 50,722.44$ 63,134.88$
Paramedic C7 38,357.02$ 47,090.09$ 55,823.17$
Appendix Compensation Study for Lake County, FL
Evergreen Solutions, LLC Page A-4
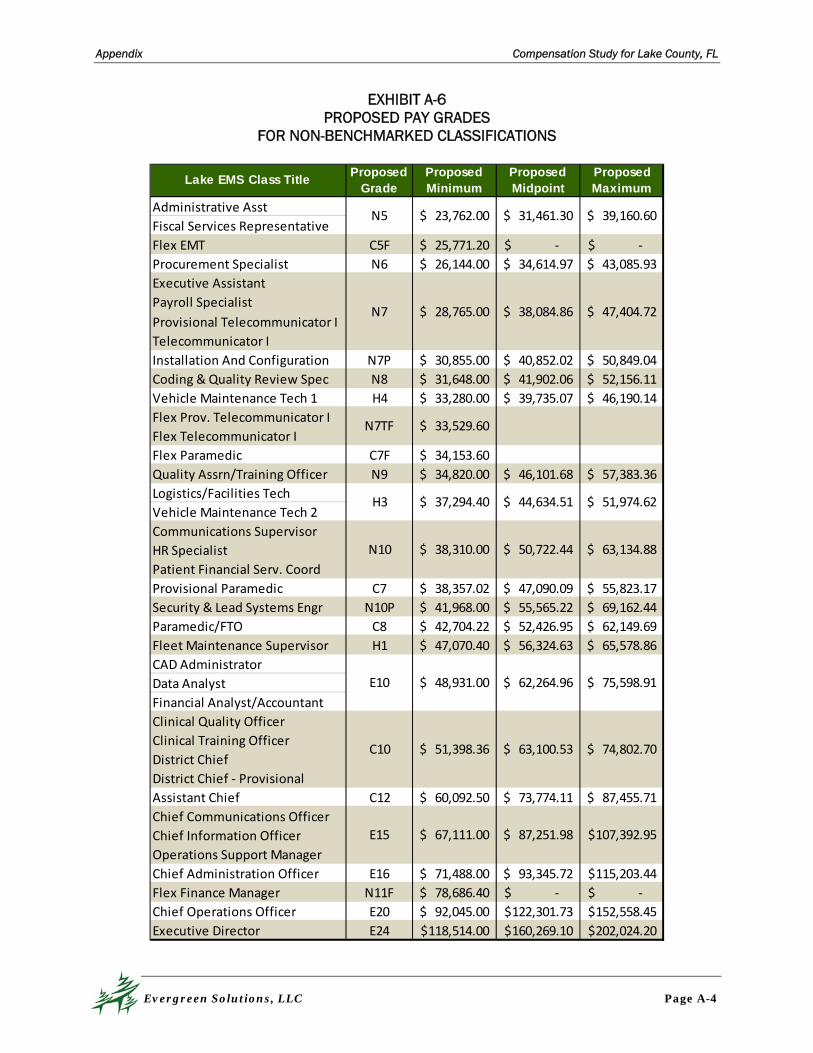
EXHIBIT A-6 PROPOSED PAY GRADES
FOR NON-BENCHMARKED CLASSIFICATIONS
Lake EMS Class TitleProposed
GradeProposed Minimum
Proposed Midpoint
Proposed Maximum
Administrative Asst
Fiscal Services Representative
Flex EMT C5F 25,771.20$ ‐$ ‐$
Procurement Specialist N6 26,144.00$ 34,614.97$ 43,085.93$
Executive Assistant
Payroll Specialist
Provisional Telecommunicator I
Telecommunicator I
Installation And Configuration N7P 30,855.00$ 40,852.02$ 50,849.04$
Coding & Quality Review Spec N8 31,648.00$ 41,902.06$ 52,156.11$
Vehicle Maintenance Tech 1 H4 33,280.00$ 39,735.07$ 46,190.14$
Flex Prov. Telecommunicator I
Flex Telecommunicator I
Flex Paramedic C7F 34,153.60$
Quality Assrn/Training Officer N9 34,820.00$ 46,101.68$ 57,383.36$
Logistics/Facilities Tech
Vehicle Maintenance Tech 2
Communications Supervisor
HR Specialist
Patient Financial Serv. Coord
Provisional Paramedic C7 38,357.02$ 47,090.09$ 55,823.17$
Security & Lead Systems Engr N10P 41,968.00$ 55,565.22$ 69,162.44$
Paramedic/FTO C8 42,704.22$ 52,426.95$ 62,149.69$
Fleet Maintenance Supervisor H1 47,070.40$ 56,324.63$ 65,578.86$
CAD Administrator
Data Analyst
Financial Analyst/Accountant
Clinical Quality Officer
Clinical Training Officer
District Chief
District Chief ‐ Provisional
Assistant Chief C12 60,092.50$ 73,774.11$ 87,455.71$
Chief Communications Officer
Chief Information Officer
Operations Support Manager
Chief Administration Officer E16 71,488.00$ 93,345.72$ 115,203.44$
Flex Finance Manager N11F 78,686.40$ ‐$ ‐$
Chief Operations Officer E20 92,045.00$ 122,301.73$ 152,558.45$
Executive Director E24 118,514.00$ 160,269.10$ 202,024.20$
C10 51,398.36$ 63,100.53$ 74,802.70$
E15 67,111.00$ 87,251.98$ 107,392.95$
51,974.62$
38,310.00$ 50,722.44$ 63,134.88$
E10 48,931.00$ 62,264.96$ 75,598.91$
N7TF 33,529.60$
H3
N10
37,294.40$ 44,634.51$
N5 23,762.00$ 31,461.30$ 39,160.60$
N7 28,765.00$ 38,084.86$ 47,404.72$
Appendix Compensation Study for Lake County, FL
Evergreen Solutions, LLC Page A-5
To implement the new pay grades, some adjustments to employee salaries would be required. Evergreen Solutions approached this transition by calculating employee salaries for placement in the new pay grades utilizing a method of bringing employee’ salaries to the new minimums as necessary if there was a change in the employee’s assigned classification’s pay grade. This would result in salary adjustments for 8 Lake EMS employees with an approximate annualized cost of $852. The approximate cost is for salary adjustments only and do not include the associated cost for employee benefits.