Embed Size (px)
Citation preview
Computer-Aided Design 45 (2013) 65–76
Contents lists available at SciVerse ScienceDirect
Computer-Aided Design
journal homepage: www.elsevier.com/locate/cad
Computational microstructure characterization and reconstruction for stochasticmultiscale material designYu Liu a,1, M. Steven Greene b, Wei Chen c,∗, Dmitriy A. Dikin c, Wing Kam Liu c
a School of Mechatronics Engineering, University of Electronic Science and Technology of China, Chengdu, Sichuan, 611731, PR Chinab Theoretical and Applied Mechanics, Northwestern University, Evanston, IL, 60208, USAc Department of Mechanical Engineering, Northwestern University, Evanston, IL, 60208, USA
a r t i c l e i n f o
Keywords:Multiscale material designMicrostructure characterizationMicrostructure reconstructionMaterial parameterization
a b s t r a c t
There are two critical components of connecting material and structural design in a multiscale designprocess: (1) relate material processing parameters to the microstructure that arises after processing, and(2) stochastically characterize and subsequently reconstruct the microstructure to enable automation ofmaterial design that scales upward to the structural domain. Thiswork proposes a data-driven frameworkto address both the above components for two-phase materials (composites with two materials mixedtogether, each having distinct material properties) and presents the algorithmic backbone to such aframework. In line with the two components above, a set of numerical algorithms is presented forcharacterization and reconstruction of two-phase materials from microscopic images: these includegrayscale image binarization, point-correlation and cluster-correlation characterization, and simulatedannealing algorithm for microstructure reconstruction. Another set of algorithms is proposed to connectthematerial processing parameters with the resultingmicrostructure bymapping nonlinear, nonphysicalregression parameters in microstructure correlation functions to a physically based, simple regressionmodel of key material characteristic parameters. This methodology that relates material design variablesto material structure is crucial for stochastic multiscale material design.
© 2012 Elsevier Ltd. All rights reserved.
1. Introduction
With advances in physical, chemical, and materials sciencespaired with the development of new physical measurements andcomputer simulation techniques, multiscale modeling methodshave received much attention as of late. Multiscale methods havegained popularity since they more accurately model complexphysical phenomena witnessed at multiple scales, both spatiallyfrom angstrom to meter, and/or temporally from picosecondsto years [1]. The information gained across multiple spatial andtemporal scales canbe integrated inmultiscale engineeringmodelsto consider crucial local details lost in conventional one-scaleapproaches. Making more practical the approaches in multiscaleanalysis, multiscale design is an emerging research paradigm thatfocuses on multilevel performance of material-structure systems.Existing multiscale design research focuses on the efficientutilization of information frommultiscalemodels, ormodels at oneparticular scale, to explore a vast design space and enable future
∗ Correspondence to: 2145 N. Sheridan Rd, Tech B224, Evanston, IL, 60208-3111,USA. Tel.: +1 847 491 7019; fax: +1 847 491 3915.
E-mail address:[email protected] (W. Chen).1 Visiting Pre-doctoral Fellow at Northwestern University.
0010-4485/$ – see front matter© 2012 Elsevier Ltd. All rights reserved.doi:10.1016/j.cad.2012.03.007
engineered systems to achieve exceptional system performancethrough concurrent optimization of both the material and productscales [1]. To achieve this broad goal, several attempts have beenmade to facilitate the uncertainty representation, propagation, andreduction under the multiscale design framework [1–3].
In considering the multiscale nature of structures, uncer-tainty at small-scales must be accounted for and exists in threeways [1,4,5]: (1) random multiscale conditions: inherent materialstructure (morphology) variation and uncertain multiscale bound-ary conditions, (2) lack of knowledge about physical phenomenaor lack of information due to insufficient experimental resolution,and (3) limited computational resources,which arise in the contextof design or in models with excessive degrees of freedom. Sinceuncertainties are unavoidable in multiscale analysis and are moreprevalent in bridging the cause–effect relationship between thematerial processing and the resulting structure, a data-driven ap-proach to define this bridge, as described herein, is vital to advanc-ing the paradigm of multiscale design. By data-driven, we meanthat data collected from image analysis and physical experimentsdrive the definition of the material microstructure and that of un-derlying material properties. In our previous work, stochastic con-stitutive theory has been proposed to use the constitutive relationas the vehicle to propagatemicrostructure uncertainties in compu-tational microstructuremodels to bulkmaterial behavior [4,6], but
66 Y. Liu et al. / Computer-Aided Design 45 (2013) 65–76
the definition of the random structure was not rigorously definedfrom a dataset nor was any connection made to material process-ing. This work addresses those items.
In this paper, our focus is to (1) characterize the uncertainty as-sociated with inherent material structure (morphology) variation– type 1 in the previous paragraph – and to (2) relate the uncertainmaterial structure to material processing parameters for isotropic,homogeneous two-phasematerials (compositematerials with twotypes of individual materials mixed together). These efforts arepresented as a general framework (Section 2) and as a synthesisof several algorithms (Sections 3 and 4). Such an effort is a criti-cal component to achieving multiscale material design that beginswith controllable material processing parameters and scales up-ward to the macroscopic structure. The motivation of the currenteffort is that material processing leads to material structure whichleads tomaterial properties and then performance [7], so that to ef-fectively designmaterials the links and components of the process-ing–structure–property chain must be understood and, if possible,automated to speed design. Therefore this work is a necessary partof the larger multiscale design process.
Characterizing the microstructure morphology using statisticalmeans has two benefits. First, it enables a quantitative understand-ing of the microstructure–property relationship and the sensitiv-ity of various descriptors of microstructure morphology, such asclustering, percolation, dispersion, orientation of inclusions, etc.,with respect to their impacts on the prediction of bulk proper-ties [8,9]. The knowledge gained from this can be further utilizedfor sophisticated material design through shaping the microstruc-ture morphology via controlling ingredients and manufacturingprocesses [8,10]. Second, based on the statistical descriptors, a mi-crostructure can be reconstructed froma sample space to debar theneed for repeating costly high resolution imaging techniques likescanning or transmission electron microscopy (SEM, TEM) when-ever a digital microstructure is needed for analysis or model vali-dation. In the situation where three dimensional (3D) imaging likeX-ray microtomography technique is not affordable or unavailableand information about the isotropy of the material is known, the3D structure of heterogeneousmaterial can be reconstructed usingstatistical information extracted from 2D planar cuts and extrapo-lated to the third dimension [8,11–13].
To achieve digital microstructure reconstruction in an accurateand computationally efficient manner, either in 2D or 3D, a varietyof algorithms have been developed. These include simulatedannealing methods [12,13], genetic algorithms [14], discreteminimization algorithms [15], and gradient-based algorithms [16].A great amount of descriptors have been introduced in thepast decade to characterize the randomness of microstructuremorphology [17,18], including correlation measures, continuousrandom fields, random point fields, and more. A comprehensivereview of microstructure characterization is provided in [8]. Itis noteworthy that choosing proper microstructure descriptorsis purely case-dependent, and only the ones having significantcontribution to the microstructure configuration and materialproperties of interest ought to be selected to characterize themicrostructure [8]. In this work, the demonstration sectionconsiders only the two-point and two-point cluster correlationfunctions where the inclusion of the latter is justified fromerror analysis of the reconstructed microstructures. To reliablyquantify errors associated with choosing these two descriptorfunctions only, an analysis of higher order descriptors is required.These functions are well suited for two-phase materials suchas micro/nano-reinforced elastomers, voided metal alloys, ormicro-granular materials; on the other hand, these functions areunsuited for multi-phase (> 3) materials and polycrystals, wheredescriptors like n-point correlations, grain shape, volume, andprincipal axes orientation are more effective [19].
With the aim of achieving a desired material property and per-formance,material design techniques concernedwith the relation-ships between production processes andmicrostructure have beenreceiving more attention in recent years. A comprehensive reviewof microstructure sensitive design (MSD) framework is presentedin [8]. The essence is to treat themicrostructure sensitive design asan inverse design problem which is able to facilitate design of ma-terial internal structure for performance optimization [8,10]. How-ever, the microstructure sensitive design method requires validand rigorous homogenization relations [8], and it also does not di-rectly associate the material processing parameter with the mate-rial internal structure. In this paper, instead of designing amaterialwith target property and performance, we focus on material prop-erty and performance predictions within different design settings.Therefore, the core contribution is to link the microstructure mor-phology, its randomness, and material design variables to showthat with the methods described herein future multiscale materialdesign efforts can successfully explore the design space.
The remainder of this paper is organized as follows: Section 2will introduce the general framework of the proposed data-drivenmodeling approach for two-phase materials. Section 3 explainsthe process in moving from a grayscale image to predictionof material properties via finite element simulations throughthree separate algorithms: transformation, characterization, andreconstruction. An algorithm is also presented in Section 3.4 todetermine the size of the computational domain based on theconcept of a representative volume element (RVE). Section 4details the other focus of the paper: parameterizing the stochasticdescription of the microstructure and relating these parameters tomaterial processing parameters. Section 5 combines and verifiesthe methodology from Sections 3 and 4 on a two-phase material,and Section 6 closes the paper.
2. A data-driven framework
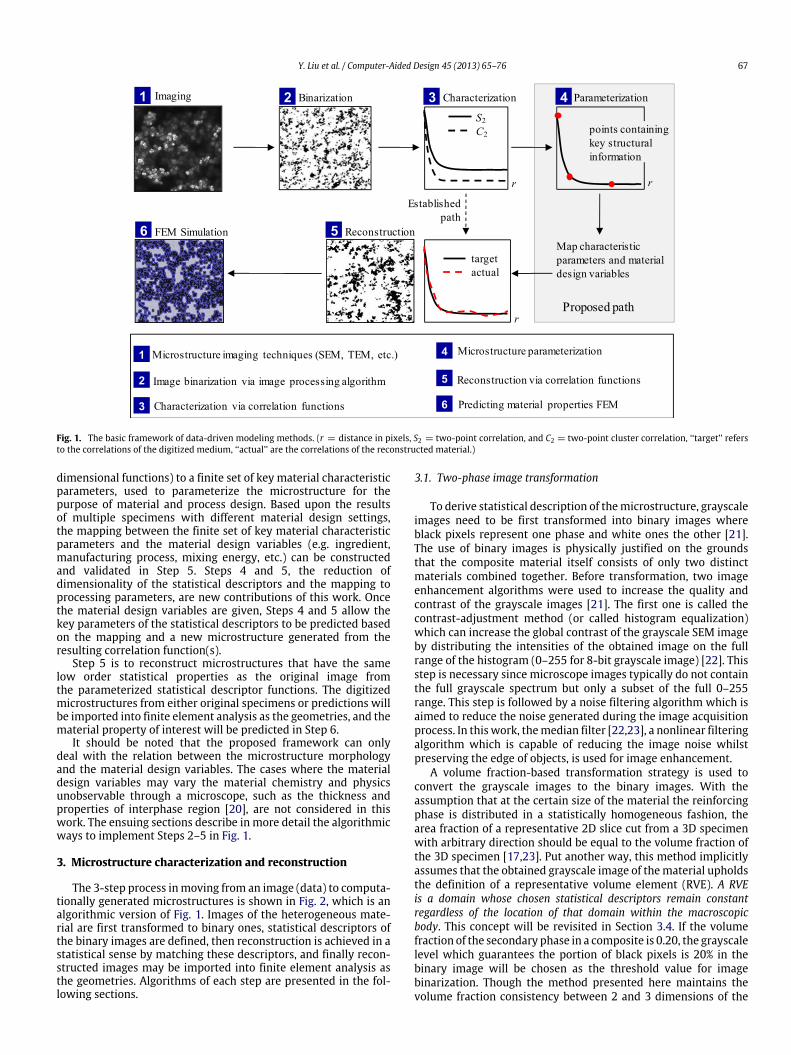
The proposed framework of the data-driven material prop-erty prediction of two-phase materials includes six steps shownin Fig. 1, where the key difference in the traditional approach tomicrostructure uncertainty quantification is shown and the con-tribution of this work is highlighted. The grayscale microstructureimages are taken by a high-resolution imaging technique (SEMshown in Fig. 1) in Step 1 and act as the data driving the rest ofthe process, hence the claim these methods are ‘‘data-driven’’. Fortwo-phase materials, Step 2 is to transform a high-resolution im-age to a binary one that separates the two phases. More advancedtechniques are needed to separate the phases within compositematerials containing more than two phases. A crucial part of thebinary transformation step is to determine some way to thresholdthe pixels sowhite and black onesmay be differentiated in the finalimage. Step 3, elaborated in Section 3.2, is to characterize the mi-crostructure morphology with a set of statistical descriptors basedon the binary digitized medium. Many statistical functions existto describe a microstructure, such as the generalized n-point cor-relation function, n-point cluster correlation function, particle sizedistribution, or others.When deciding onwhich descriptors to use,the analyst must strike a balance between the computational de-mand required to determine the function and the benefit receivedfrom the extra descriptive capability of adding it. Often the low or-der statistical functions contain sufficient information to describethemicrostructure and computing high order ones is unwarranted.In this paper, the two-point correlation and two-point cluster cor-relation are identified to be sufficient for characterizing the two-phase materials of interest.
Based on the correlations derived from binary images, weintroduce two new steps to the loop. Step 4 reduces thedimensionality of the statistical descriptors (which are infinite
Y. Liu et al. / Computer-Aided Design 45 (2013) 65–76 67
Fig. 1. The basic framework of data-driven modeling methods. (r = distance in pixels, S2 = two-point correlation, and C2 = two-point cluster correlation, ‘‘target’’ refersto the correlations of the digitized medium, ‘‘actual’’ are the correlations of the reconstructed material.)
dimensional functions) to a finite set of key material characteristicparameters, used to parameterize the microstructure for thepurpose of material and process design. Based upon the resultsof multiple specimens with different material design settings,the mapping between the finite set of key material characteristicparameters and the material design variables (e.g. ingredient,manufacturing process, mixing energy, etc.) can be constructedand validated in Step 5. Steps 4 and 5, the reduction ofdimensionality of the statistical descriptors and the mapping toprocessing parameters, are new contributions of this work. Oncethe material design variables are given, Steps 4 and 5 allow thekey parameters of the statistical descriptors to be predicted basedon the mapping and a new microstructure generated from theresulting correlation function(s).
Step 5 is to reconstruct microstructures that have the samelow order statistical properties as the original image fromthe parameterized statistical descriptor functions. The digitizedmicrostructures from either original specimens or predictions willbe imported into finite element analysis as the geometries, and thematerial property of interest will be predicted in Step 6.
It should be noted that the proposed framework can onlydeal with the relation between the microstructure morphologyand the material design variables. The cases where the materialdesign variables may vary the material chemistry and physicsunobservable through a microscope, such as the thickness andproperties of interphase region [20], are not considered in thiswork. The ensuing sections describe in more detail the algorithmicways to implement Steps 2–5 in Fig. 1.
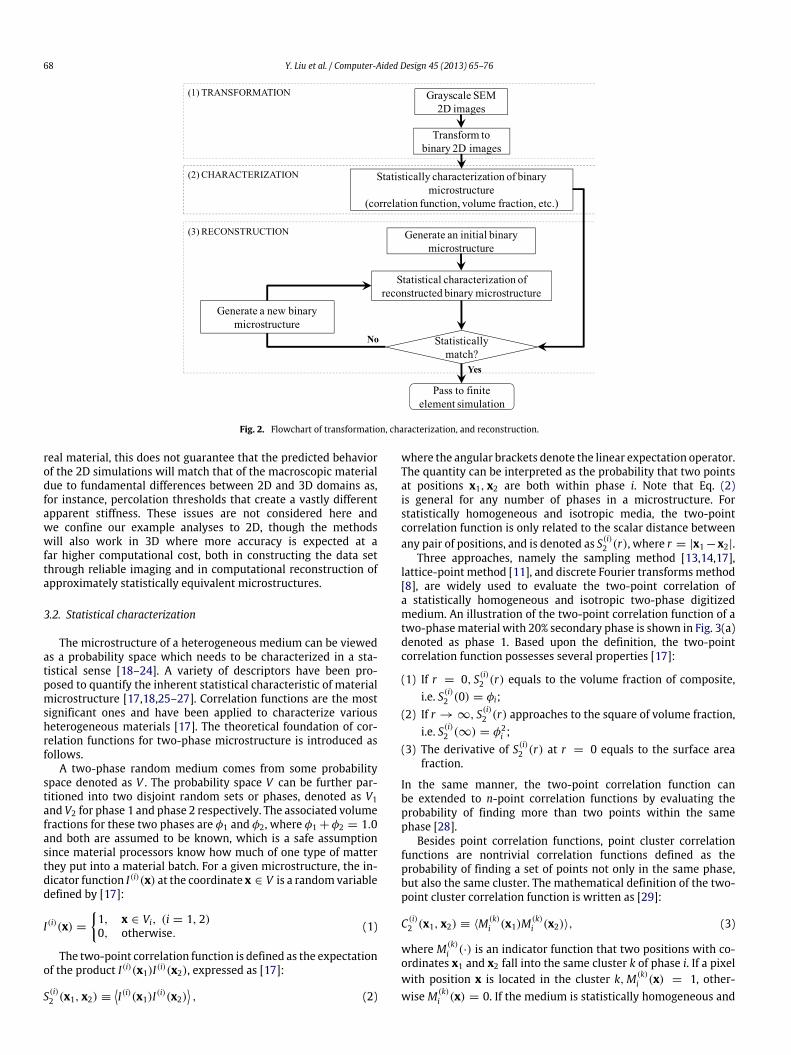
3. Microstructure characterization and reconstruction
The 3-step process inmoving from an image (data) to computa-tionally generated microstructures is shown in Fig. 2, which is analgorithmic version of Fig. 1. Images of the heterogeneous mate-rial are first transformed to binary ones, statistical descriptors ofthe binary images are defined, then reconstruction is achieved in astatistical sense by matching these descriptors, and finally recon-structed images may be imported into finite element analysis asthe geometries. Algorithms of each step are presented in the fol-lowing sections.
3.1. Two-phase image transformation
To derive statistical description of themicrostructure, grayscaleimages need to be first transformed into binary images whereblack pixels represent one phase and white ones the other [21].The use of binary images is physically justified on the groundsthat the composite material itself consists of only two distinctmaterials combined together. Before transformation, two imageenhancement algorithms were used to increase the quality andcontrast of the grayscale images [21]. The first one is called thecontrast-adjustment method (or called histogram equalization)which can increase the global contrast of the grayscale SEM imageby distributing the intensities of the obtained image on the fullrange of the histogram (0–255 for 8-bit grayscale image) [22]. Thisstep is necessary since microscope images typically do not containthe full grayscale spectrum but only a subset of the full 0–255range. This step is followed by a noise filtering algorithm which isaimed to reduce the noise generated during the image acquisitionprocess. In this work, themedian filter [22,23], a nonlinear filteringalgorithm which is capable of reducing the image noise whilstpreserving the edge of objects, is used for image enhancement.
A volume fraction-based transformation strategy is used toconvert the grayscale images to the binary images. With theassumption that at the certain size of the material the reinforcingphase is distributed in a statistically homogeneous fashion, thearea fraction of a representative 2D slice cut from a 3D specimenwith arbitrary direction should be equal to the volume fraction ofthe 3D specimen [17,23]. Put another way, this method implicitlyassumes that the obtained grayscale image of thematerial upholdsthe definition of a representative volume element (RVE). A RVEis a domain whose chosen statistical descriptors remain constantregardless of the location of that domain within the macroscopicbody. This concept will be revisited in Section 3.4. If the volumefraction of the secondary phase in a composite is 0.20, the grayscalelevel which guarantees the portion of black pixels is 20% in thebinary image will be chosen as the threshold value for imagebinarization. Though the method presented here maintains thevolume fraction consistency between 2 and 3 dimensions of the
68 Y. Liu et al. / Computer-Aided Design 45 (2013) 65–76
Fig. 2. Flowchart of transformation, characterization, and reconstruction.
real material, this does not guarantee that the predicted behaviorof the 2D simulations will match that of the macroscopic materialdue to fundamental differences between 2D and 3D domains as,for instance, percolation thresholds that create a vastly differentapparent stiffness. These issues are not considered here andwe confine our example analyses to 2D, though the methodswill also work in 3D where more accuracy is expected at afar higher computational cost, both in constructing the data setthrough reliable imaging and in computational reconstruction ofapproximately statistically equivalent microstructures.
3.2. Statistical characterization
The microstructure of a heterogeneous medium can be viewedas a probability space which needs to be characterized in a sta-tistical sense [18–24]. A variety of descriptors have been pro-posed to quantify the inherent statistical characteristic of materialmicrostructure [17,18,25–27]. Correlation functions are the mostsignificant ones and have been applied to characterize variousheterogeneous materials [17]. The theoretical foundation of cor-relation functions for two-phase microstructure is introduced asfollows.
A two-phase random medium comes from some probabilityspace denoted as V . The probability space V can be further par-titioned into two disjoint random sets or phases, denoted as V1and V2 for phase 1 and phase 2 respectively. The associated volumefractions for these two phases are φ1 and φ2, where φ1 + φ2 = 1.0and both are assumed to be known, which is a safe assumptionsince material processors know how much of one type of matterthey put into a material batch. For a given microstructure, the in-dicator function I(i)(x) at the coordinate x ∈ V is a randomvariabledefined by [17]:
I(i)(x) =
1, x ∈ Vi, (i = 1, 2)0, otherwise. (1)
The two-point correlation function is defined as the expectationof the product I(i)(x1)I(i)(x2), expressed as [17]:
S(i)2 (x1, x2) ≡
I(i)(x1)I(i)(x2)
, (2)
where the angular brackets denote the linear expectation operator.The quantity can be interpreted as the probability that two pointsat positions x1, x2 are both within phase i. Note that Eq. (2)is general for any number of phases in a microstructure. Forstatistically homogeneous and isotropic media, the two-pointcorrelation function is only related to the scalar distance betweenany pair of positions, and is denoted as S(i)
2 (r), where r = |x1 −x2|.Three approaches, namely the sampling method [13,14,17],
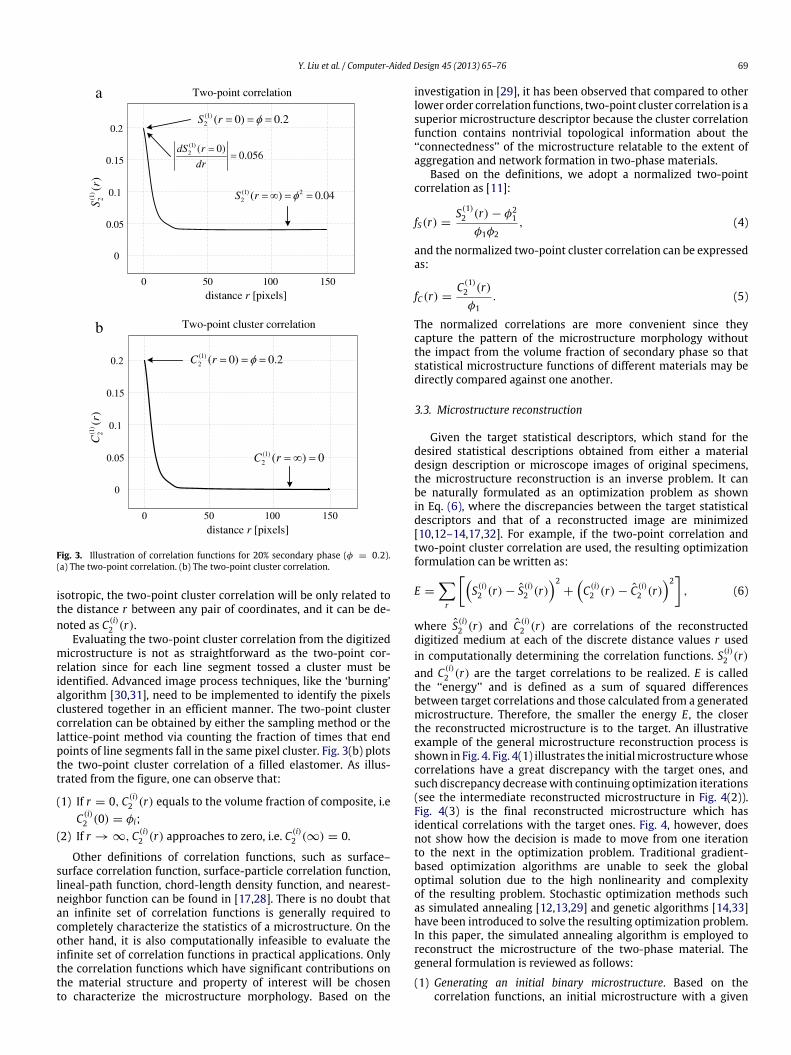
lattice-point method [11], and discrete Fourier transformsmethod[8], are widely used to evaluate the two-point correlation ofa statistically homogeneous and isotropic two-phase digitizedmedium. An illustration of the two-point correlation function of atwo-phasematerial with 20% secondary phase is shown in Fig. 3(a)denoted as phase 1. Based upon the definition, the two-pointcorrelation function possesses several properties [17]:
(1) If r = 0, S(i)2 (r) equals to the volume fraction of composite,
i.e. S(i)2 (0) = φi;
(2) If r → ∞, S(i)2 (r) approaches to the square of volume fraction,
i.e. S(i)2 (∞) = φ2
i ;(3) The derivative of S(i)
2 (r) at r = 0 equals to the surface areafraction.
In the same manner, the two-point correlation function canbe extended to n-point correlation functions by evaluating theprobability of finding more than two points within the samephase [28].
Besides point correlation functions, point cluster correlationfunctions are nontrivial correlation functions defined as theprobability of finding a set of points not only in the same phase,but also the same cluster. The mathematical definition of the two-point cluster correlation function is written as [29]:
C (i)2 (x1, x2) ≡ ⟨M(k)
i (x1)M(k)i (x2)⟩, (3)
where M(k)i (·) is an indicator function that two positions with co-
ordinates x1 and x2 fall into the same cluster k of phase i. If a pixelwith position x is located in the cluster k,M(k)
i (x) = 1, other-wise M(k)
i (x) = 0. If the medium is statistically homogeneous and
Y. Liu et al. / Computer-Aided Design 45 (2013) 65–76 69
a
b
Fig. 3. Illustration of correlation functions for 20% secondary phase (φ = 0.2).(a) The two-point correlation. (b) The two-point cluster correlation.
isotropic, the two-point cluster correlation will be only related tothe distance r between any pair of coordinates, and it can be de-noted as C (i)
2 (r).Evaluating the two-point cluster correlation from the digitized
microstructure is not as straightforward as the two-point cor-relation since for each line segment tossed a cluster must beidentified. Advanced image process techniques, like the ‘burning’algorithm [30,31], need to be implemented to identify the pixelsclustered together in an efficient manner. The two-point clustercorrelation can be obtained by either the sampling method or thelattice-point method via counting the fraction of times that endpoints of line segments fall in the same pixel cluster. Fig. 3(b) plotsthe two-point cluster correlation of a filled elastomer. As illus-trated from the figure, one can observe that:
(1) If r = 0, C (i)2 (r) equals to the volume fraction of composite, i.e
C (i)2 (0) = φi;
(2) If r → ∞, C (i)2 (r) approaches to zero, i.e. C (i)
2 (∞) = 0.
Other definitions of correlation functions, such as surface–surface correlation function, surface-particle correlation function,lineal-path function, chord-length density function, and nearest-neighbor function can be found in [17,28]. There is no doubt thatan infinite set of correlation functions is generally required tocompletely characterize the statistics of a microstructure. On theother hand, it is also computationally infeasible to evaluate theinfinite set of correlation functions in practical applications. Onlythe correlation functions which have significant contributions onthe material structure and property of interest will be chosento characterize the microstructure morphology. Based on the
investigation in [29], it has been observed that compared to otherlower order correlation functions, two-point cluster correlation is asuperior microstructure descriptor because the cluster correlationfunction contains nontrivial topological information about the‘‘connectedness’’ of the microstructure relatable to the extent ofaggregation and network formation in two-phase materials.
Based on the definitions, we adopt a normalized two-pointcorrelation as [11]:
fS(r) =S(1)2 (r) − φ2
1
φ1φ2, (4)
and the normalized two-point cluster correlation can be expressedas:
fC (r) =C (1)2 (r)φ1
. (5)
The normalized correlations are more convenient since theycapture the pattern of the microstructure morphology withoutthe impact from the volume fraction of secondary phase so thatstatistical microstructure functions of different materials may bedirectly compared against one another.
3.3. Microstructure reconstruction
Given the target statistical descriptors, which stand for thedesired statistical descriptions obtained from either a materialdesign description or microscope images of original specimens,the microstructure reconstruction is an inverse problem. It canbe naturally formulated as an optimization problem as shownin Eq. (6), where the discrepancies between the target statisticaldescriptors and that of a reconstructed image are minimized[10,12–14,17,32]. For example, if the two-point correlation andtwo-point cluster correlation are used, the resulting optimizationformulation can be written as:
E =
r
S(i)2 (r) − S(i)
2 (r)2
+
C (i)2 (r) − C (i)
2 (r)2
, (6)
where S(i)2 (r) and C (i)
2 (r) are correlations of the reconstructeddigitized medium at each of the discrete distance values r usedin computationally determining the correlation functions. S(i)
2 (r)and C (i)
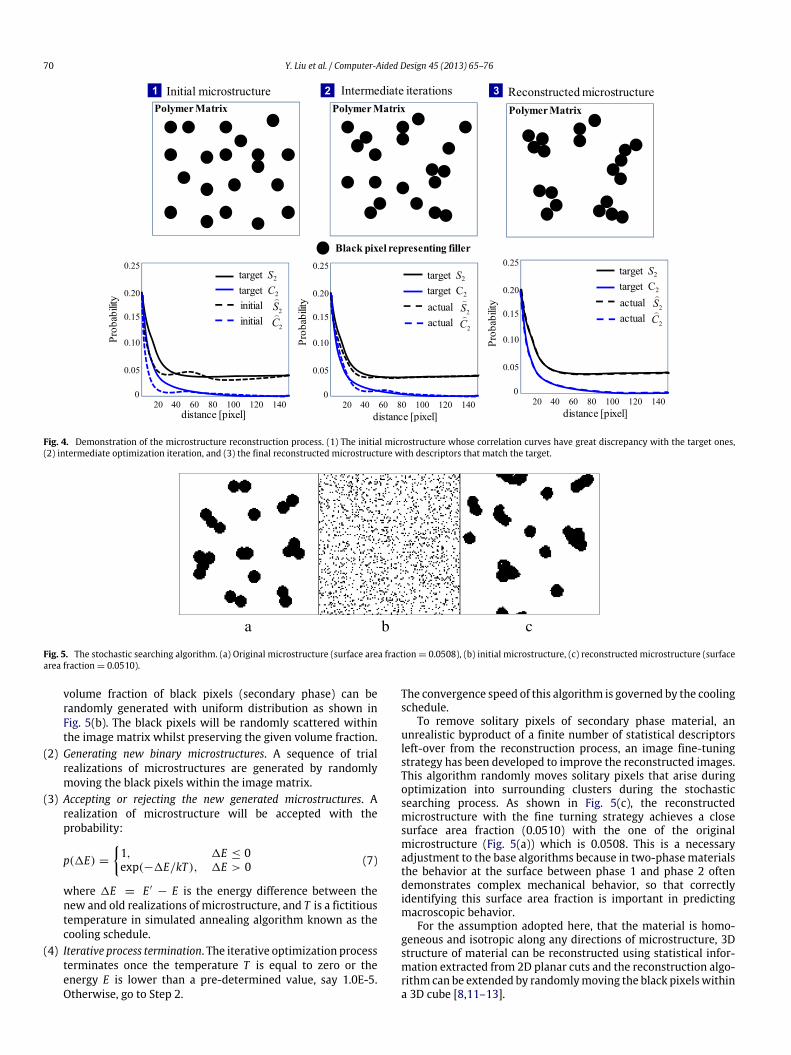
2 (r) are the target correlations to be realized. E is calledthe ‘‘energy’’ and is defined as a sum of squared differencesbetween target correlations and those calculated from a generatedmicrostructure. Therefore, the smaller the energy E, the closerthe reconstructed microstructure is to the target. An illustrativeexample of the general microstructure reconstruction process isshown in Fig. 4. Fig. 4(1) illustrates the initialmicrostructurewhosecorrelations have a great discrepancy with the target ones, andsuch discrepancy decreasewith continuing optimization iterations(see the intermediate reconstructed microstructure in Fig. 4(2)).Fig. 4(3) is the final reconstructed microstructure which hasidentical correlations with the target ones. Fig. 4, however, doesnot show how the decision is made to move from one iterationto the next in the optimization problem. Traditional gradient-based optimization algorithms are unable to seek the globaloptimal solution due to the high nonlinearity and complexityof the resulting problem. Stochastic optimization methods suchas simulated annealing [12,13,29] and genetic algorithms [14,33]have been introduced to solve the resulting optimization problem.In this paper, the simulated annealing algorithm is employed toreconstruct the microstructure of the two-phase material. Thegeneral formulation is reviewed as follows:
(1) Generating an initial binary microstructure. Based on thecorrelation functions, an initial microstructure with a given
70 Y. Liu et al. / Computer-Aided Design 45 (2013) 65–76
Fig. 4. Demonstration of the microstructure reconstruction process. (1) The initial microstructure whose correlation curves have great discrepancy with the target ones,(2) intermediate optimization iteration, and (3) the final reconstructed microstructure with descriptors that match the target.
a b c
Fig. 5. The stochastic searching algorithm. (a) Original microstructure (surface area fraction = 0.0508), (b) initial microstructure, (c) reconstructed microstructure (surfacearea fraction = 0.0510).
volume fraction of black pixels (secondary phase) can berandomly generated with uniform distribution as shown inFig. 5(b). The black pixels will be randomly scattered withinthe image matrix whilst preserving the given volume fraction.
(2) Generating new binary microstructures. A sequence of trialrealizations of microstructures are generated by randomlymoving the black pixels within the image matrix.
(3) Accepting or rejecting the new generated microstructures. Arealization of microstructure will be accepted with theprobability:
p(1E) =
1, 1E ≤ 0exp(−1E/kT ), 1E > 0 (7)
where 1E = E ′− E is the energy difference between the
new and old realizations of microstructure, and T is a fictitioustemperature in simulated annealing algorithm known as thecooling schedule.
(4) Iterative process termination. The iterative optimization processterminates once the temperature T is equal to zero or theenergy E is lower than a pre-determined value, say 1.0E-5.Otherwise, go to Step 2.
The convergence speed of this algorithm is governed by the coolingschedule.
To remove solitary pixels of secondary phase material, anunrealistic byproduct of a finite number of statistical descriptorsleft-over from the reconstruction process, an image fine-tuningstrategy has been developed to improve the reconstructed images.This algorithm randomly moves solitary pixels that arise duringoptimization into surrounding clusters during the stochasticsearching process. As shown in Fig. 5(c), the reconstructedmicrostructure with the fine turning strategy achieves a closesurface area fraction (0.0510) with the one of the originalmicrostructure (Fig. 5(a)) which is 0.0508. This is a necessaryadjustment to the base algorithms because in two-phasematerialsthe behavior at the surface between phase 1 and phase 2 oftendemonstrates complex mechanical behavior, so that correctlyidentifying this surface area fraction is important in predictingmacroscopic behavior.
For the assumption adopted here, that the material is homo-geneous and isotropic along any directions of microstructure, 3Dstructure of material can be reconstructed using statistical infor-mation extracted from 2D planar cuts and the reconstruction algo-rithm can be extended by randomlymoving the black pixelswithina 3D cube [8,11–13].
Y. Liu et al. / Computer-Aided Design 45 (2013) 65–76 71
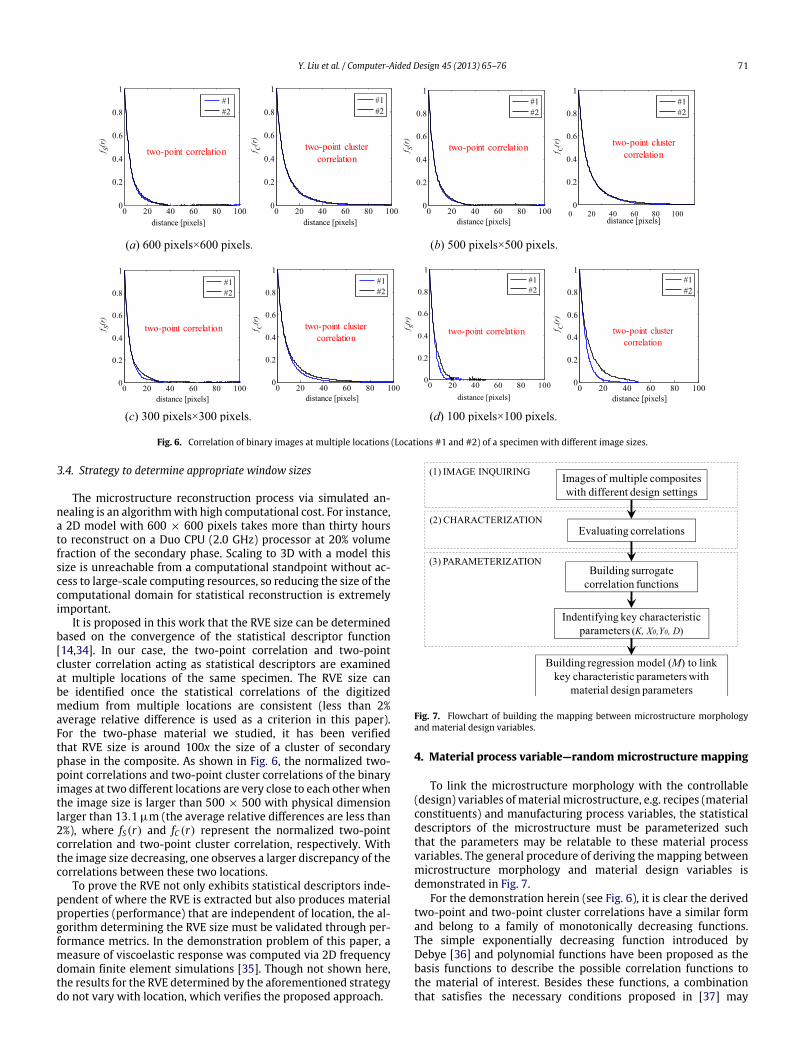
Fig. 6. Correlation of binary images at multiple locations (Locations #1 and #2) of a specimen with different image sizes.
3.4. Strategy to determine appropriate window sizes
The microstructure reconstruction process via simulated an-nealing is an algorithmwith high computational cost. For instance,a 2D model with 600 × 600 pixels takes more than thirty hoursto reconstruct on a Duo CPU (2.0 GHz) processor at 20% volumefraction of the secondary phase. Scaling to 3D with a model thissize is unreachable from a computational standpoint without ac-cess to large-scale computing resources, so reducing the size of thecomputational domain for statistical reconstruction is extremelyimportant.
It is proposed in this work that the RVE size can be determinedbased on the convergence of the statistical descriptor function[14,34]. In our case, the two-point correlation and two-pointcluster correlation acting as statistical descriptors are examinedat multiple locations of the same specimen. The RVE size canbe identified once the statistical correlations of the digitizedmedium from multiple locations are consistent (less than 2%average relative difference is used as a criterion in this paper).For the two-phase material we studied, it has been verifiedthat RVE size is around 100x the size of a cluster of secondaryphase in the composite. As shown in Fig. 6, the normalized two-point correlations and two-point cluster correlations of the binaryimages at two different locations are very close to each other whenthe image size is larger than 500 × 500 with physical dimensionlarger than 13.1 µm (the average relative differences are less than2%), where fS(r) and fC (r) represent the normalized two-pointcorrelation and two-point cluster correlation, respectively. Withthe image size decreasing, one observes a larger discrepancy of thecorrelations between these two locations.
To prove the RVE not only exhibits statistical descriptors inde-pendent of where the RVE is extracted but also produces materialproperties (performance) that are independent of location, the al-gorithm determining the RVE size must be validated through per-formance metrics. In the demonstration problem of this paper, ameasure of viscoelastic response was computed via 2D frequencydomain finite element simulations [35]. Though not shown here,the results for the RVE determined by the aforementioned strategydo not vary with location, which verifies the proposed approach.
Fig. 7. Flowchart of building the mapping between microstructure morphologyand material design variables.
4. Material process variable—randommicrostructure mapping
To link the microstructure morphology with the controllable(design) variables of material microstructure, e.g. recipes (materialconstituents) and manufacturing process variables, the statisticaldescriptors of the microstructure must be parameterized suchthat the parameters may be relatable to these material processvariables. The general procedure of deriving the mapping betweenmicrostructure morphology and material design variables isdemonstrated in Fig. 7.
For the demonstration herein (see Fig. 6), it is clear the derivedtwo-point and two-point cluster correlations have a similar formand belong to a family of monotonically decreasing functions.The simple exponentially decreasing function introduced byDebye [36] and polynomial functions have been proposed as thebasis functions to describe the possible correlation functions tothe material of interest. Besides these functions, a combinationthat satisfies the necessary conditions proposed in [37] may
72 Y. Liu et al. / Computer-Aided Design 45 (2013) 65–76
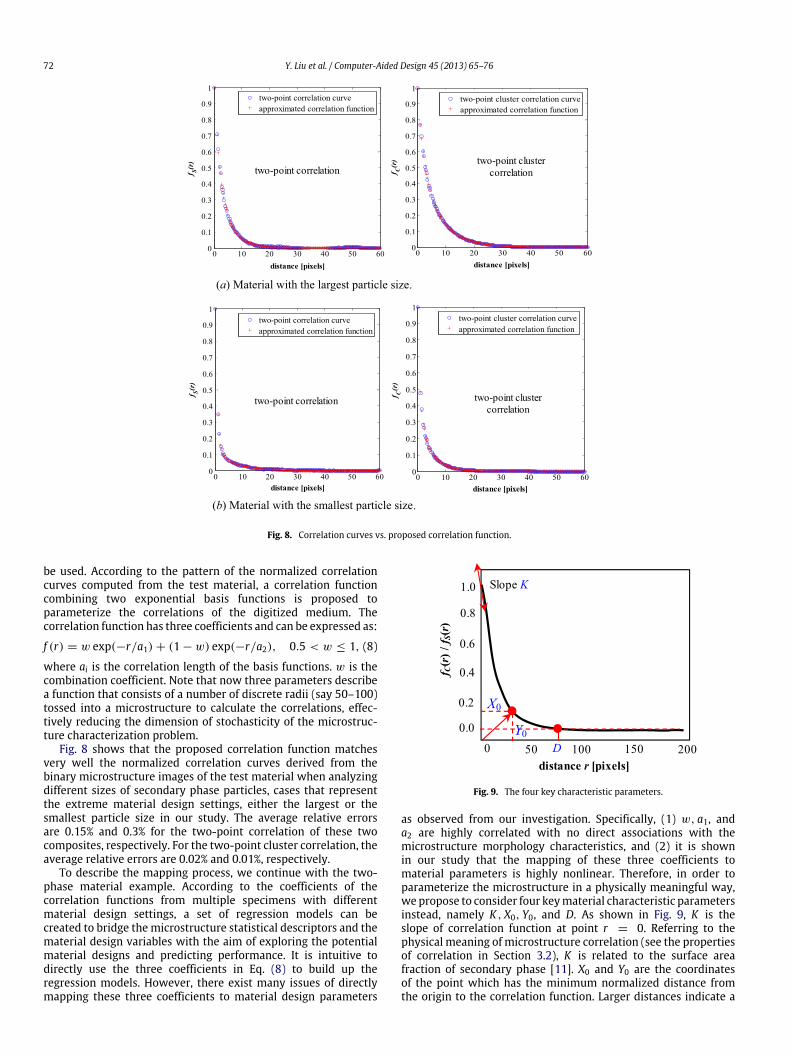
Fig. 8. Correlation curves vs. proposed correlation function.
be used. According to the pattern of the normalized correlationcurves computed from the test material, a correlation functioncombining two exponential basis functions is proposed toparameterize the correlations of the digitized medium. Thecorrelation function has three coefficients and can be expressed as:
f (r) = w exp(−r/a1) + (1 − w) exp(−r/a2), 0.5 < w ≤ 1, (8)
where ai is the correlation length of the basis functions. w is thecombination coefficient. Note that now three parameters describea function that consists of a number of discrete radii (say 50–100)tossed into a microstructure to calculate the correlations, effec-tively reducing the dimension of stochasticity of the microstruc-ture characterization problem.
Fig. 8 shows that the proposed correlation function matchesvery well the normalized correlation curves derived from thebinary microstructure images of the test material when analyzingdifferent sizes of secondary phase particles, cases that representthe extreme material design settings, either the largest or thesmallest particle size in our study. The average relative errorsare 0.15% and 0.3% for the two-point correlation of these twocomposites, respectively. For the two-point cluster correlation, theaverage relative errors are 0.02% and 0.01%, respectively.
To describe the mapping process, we continue with the two-phase material example. According to the coefficients of thecorrelation functions from multiple specimens with differentmaterial design settings, a set of regression models can becreated to bridge the microstructure statistical descriptors and thematerial design variables with the aim of exploring the potentialmaterial designs and predicting performance. It is intuitive todirectly use the three coefficients in Eq. (8) to build up theregression models. However, there exist many issues of directlymapping these three coefficients to material design parameters
Fig. 9. The four key characteristic parameters.
as observed from our investigation. Specifically, (1) w, a1, anda2 are highly correlated with no direct associations with themicrostructure morphology characteristics, and (2) it is shownin our study that the mapping of these three coefficients tomaterial parameters is highly nonlinear. Therefore, in order toparameterize the microstructure in a physically meaningful way,we propose to consider four keymaterial characteristic parametersinstead, namely K , X0, Y0, and D. As shown in Fig. 9, K is theslope of correlation function at point r = 0. Referring to thephysical meaning of microstructure correlation (see the propertiesof correlation in Section 3.2), K is related to the surface areafraction of secondary phase [11]. X0 and Y0 are the coordinatesof the point which has the minimum normalized distance fromthe origin to the correlation function. Larger distances indicate a
Y. Liu et al. / Computer-Aided Design 45 (2013) 65–76 73
Fig. 10. The correlations of microstructures of various composites.
stronger extent of correlation in microstructure morphology. D isthe pixel distance when the probability of normalized correlationis less than 0.005, a pre-specified value which indicates thatthe correlation between secondary phase pixels is negligible. Dis, therefore, related to the homogeneity of the microstructure.With this intermediate step that produces parameters of thestatistical functions that more closely relate to physical meaningof the controllable material processing variables at hand, themapping is done to these parameters which then predict thecoefficients of Eq. (8). As demonstrated in our study, these fourkey characteristic parameters are sufficient to characterize themicrostructure with the chosen descriptors; however, accuracycan be further improved by introducing additional characteristicparameters.
In reality, there may be many material design variables. Forexample, the size and surface area of secondary particles, thevolume fraction of secondary particles, the amount of additives,and the manufacturing process. In order to reduce the complexity,only the material design variables that have significant impact onthe microstructure statistical descriptors will be used to create themap linking to themicrostructuremorphology. Sensitivity analysiscan be conducted to first identify the important design variableswhile ignoring the design variables which have less impact onthe microstructure morphology [3,38]. On the other hand, thespecimens being used to construct the regression model shouldevenly spread over the entire material design space [39]. It shouldbe also noted that the regression model could be either a linear ornonlinear one, depending on the linearity of the mapping and theaccuracy requirement. Here, we choose a linear regression modeland do not conduct error analysis on othermodel forms due to lackof data.
Once the regression model between the four key characteristicparameters and the material design variables is constructed,the microstructure under different material design settings canbe predicted. The coefficients (w, a1, and a2) of the correlationfunctions of the predictedmicrostructure can be determined basedon the predicted four key characteristic parameters (K , X0, Y0, andD). However, the coefficients of the correlation functions cannot besolved analytically due to their nontrivial, nonlinear relationshipto the key characteristic parameters. The genetic algorithm (GA),which has great capability to seek global optimums is used tofind the best set of coefficients (w, a1, and a2) that generates thecorrelation curve having closest match with the predicted keycharacteristic parameters.
5. Combining the pieces: microstructure prediction
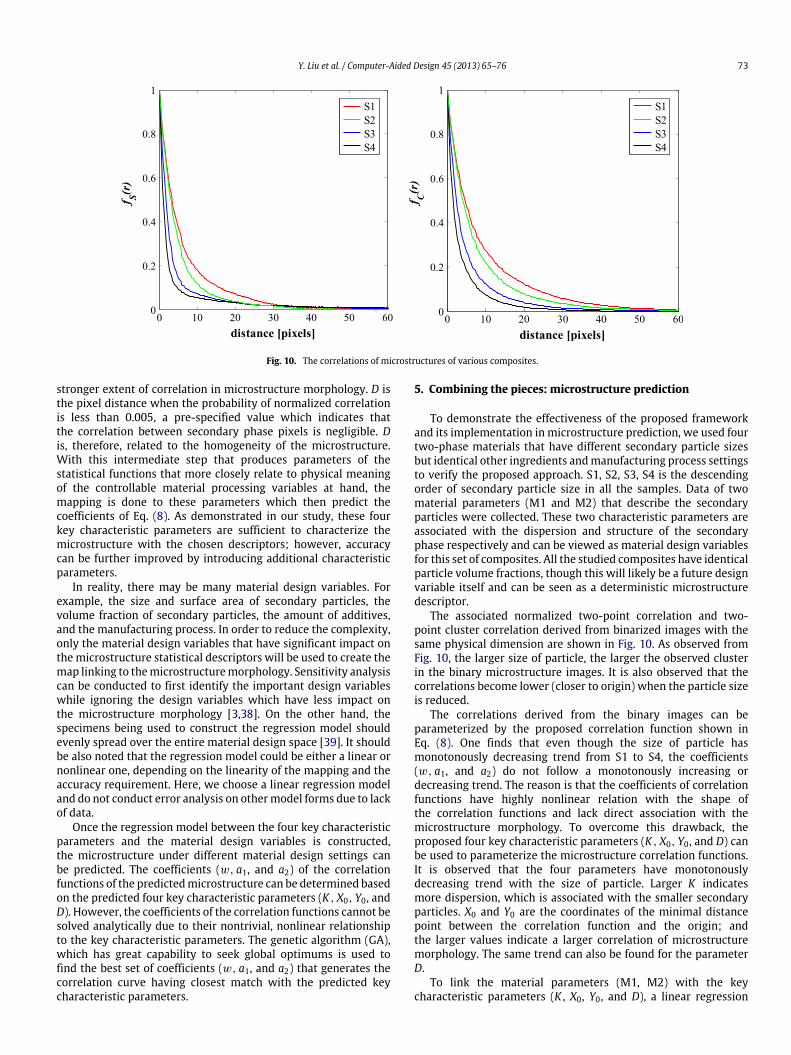
To demonstrate the effectiveness of the proposed frameworkand its implementation in microstructure prediction, we used fourtwo-phase materials that have different secondary particle sizesbut identical other ingredients andmanufacturing process settingsto verify the proposed approach. S1, S2, S3, S4 is the descendingorder of secondary particle size in all the samples. Data of twomaterial parameters (M1 and M2) that describe the secondaryparticles were collected. These two characteristic parameters areassociated with the dispersion and structure of the secondaryphase respectively and can be viewed as material design variablesfor this set of composites. All the studied composites have identicalparticle volume fractions, though this will likely be a future designvariable itself and can be seen as a deterministic microstructuredescriptor.
The associated normalized two-point correlation and two-point cluster correlation derived from binarized images with thesame physical dimension are shown in Fig. 10. As observed fromFig. 10, the larger size of particle, the larger the observed clusterin the binary microstructure images. It is also observed that thecorrelations become lower (closer to origin) when the particle sizeis reduced.
The correlations derived from the binary images can beparameterized by the proposed correlation function shown inEq. (8). One finds that even though the size of particle hasmonotonously decreasing trend from S1 to S4, the coefficients(w, a1, and a2) do not follow a monotonously increasing ordecreasing trend. The reason is that the coefficients of correlationfunctions have highly nonlinear relation with the shape ofthe correlation functions and lack direct association with themicrostructure morphology. To overcome this drawback, theproposed four key characteristic parameters (K , X0, Y0, and D) canbe used to parameterize the microstructure correlation functions.It is observed that the four parameters have monotonouslydecreasing trend with the size of particle. Larger K indicatesmore dispersion, which is associated with the smaller secondaryparticles. X0 and Y0 are the coordinates of the minimal distancepoint between the correlation function and the origin; andthe larger values indicate a larger correlation of microstructuremorphology. The same trend can also be found for the parameterD.
To link the material parameters (M1, M2) with the keycharacteristic parameters (K , X0, Y0, and D), a linear regression
74 Y. Liu et al. / Computer-Aided Design 45 (2013) 65–76
Fig. 11. Predicted correlations vs. correlations from original binary image.
Table 1The predicted key characteristic parameters for composite A3.
Correlation K X0 Y0 D
Two-point −0.5674 6.925 0.1089 38.98Two-point cluster −0.4080 9.10 0.1402 38.93
Table 2The coefficients of the predicted correlation functions for composite A3.
Correlation w a1 a2
Two-point 0.1793 10.84 1.49Two-point cluster 0.4136 8.74 1.63
function was used in our study for mapping the two sets ofparameters.
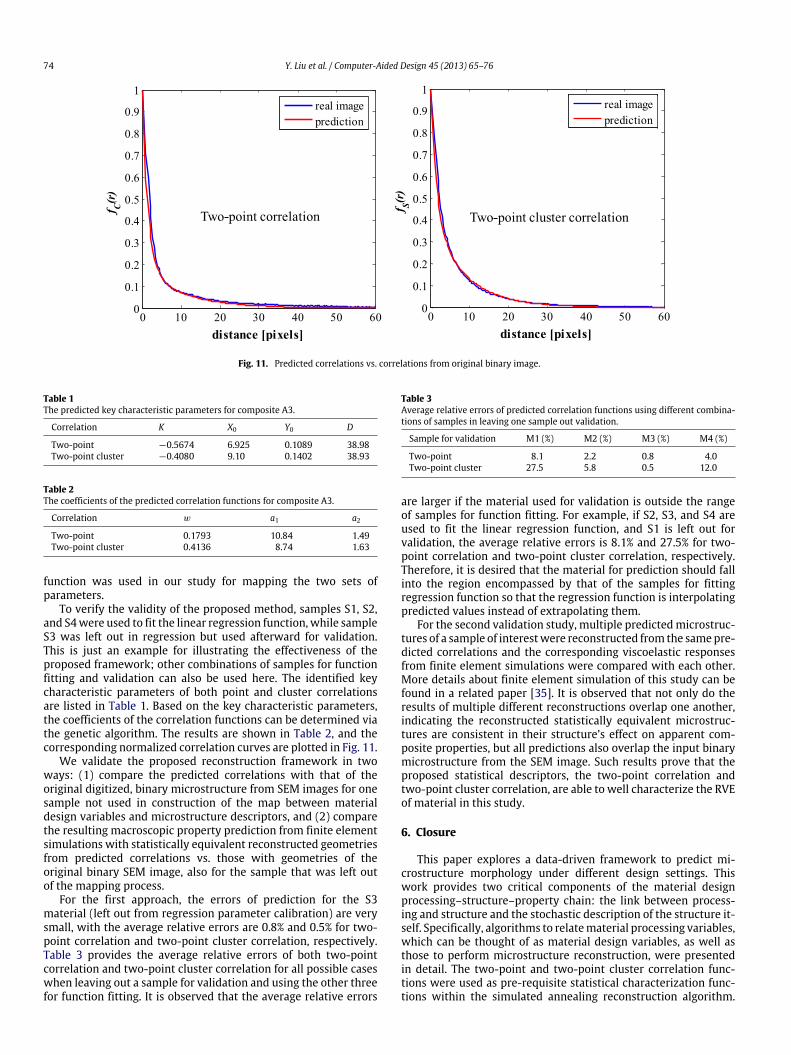
To verify the validity of the proposed method, samples S1, S2,and S4were used to fit the linear regression function, while sampleS3 was left out in regression but used afterward for validation.This is just an example for illustrating the effectiveness of theproposed framework; other combinations of samples for functionfitting and validation can also be used here. The identified keycharacteristic parameters of both point and cluster correlationsare listed in Table 1. Based on the key characteristic parameters,the coefficients of the correlation functions can be determined viathe genetic algorithm. The results are shown in Table 2, and thecorresponding normalized correlation curves are plotted in Fig. 11.
We validate the proposed reconstruction framework in twoways: (1) compare the predicted correlations with that of theoriginal digitized, binary microstructure from SEM images for onesample not used in construction of the map between materialdesign variables and microstructure descriptors, and (2) comparethe resulting macroscopic property prediction from finite elementsimulations with statistically equivalent reconstructed geometriesfrom predicted correlations vs. those with geometries of theoriginal binary SEM image, also for the sample that was left outof the mapping process.
For the first approach, the errors of prediction for the S3material (left out from regression parameter calibration) are verysmall, with the average relative errors are 0.8% and 0.5% for two-point correlation and two-point cluster correlation, respectively.Table 3 provides the average relative errors of both two-pointcorrelation and two-point cluster correlation for all possible caseswhen leaving out a sample for validation and using the other threefor function fitting. It is observed that the average relative errors
Table 3Average relative errors of predicted correlation functions using different combina-tions of samples in leaving one sample out validation.
Sample for validation M1 (%) M2 (%) M3 (%) M4 (%)
Two-point 8.1 2.2 0.8 4.0Two-point cluster 27.5 5.8 0.5 12.0
are larger if the material used for validation is outside the rangeof samples for function fitting. For example, if S2, S3, and S4 areused to fit the linear regression function, and S1 is left out forvalidation, the average relative errors is 8.1% and 27.5% for two-point correlation and two-point cluster correlation, respectively.Therefore, it is desired that the material for prediction should fallinto the region encompassed by that of the samples for fittingregression function so that the regression function is interpolatingpredicted values instead of extrapolating them.
For the second validation study, multiple predictedmicrostruc-tures of a sample of interestwere reconstructed from the samepre-dicted correlations and the corresponding viscoelastic responsesfrom finite element simulations were compared with each other.More details about finite element simulation of this study can befound in a related paper [35]. It is observed that not only do theresults of multiple different reconstructions overlap one another,indicating the reconstructed statistically equivalent microstruc-tures are consistent in their structure’s effect on apparent com-posite properties, but all predictions also overlap the input binarymicrostructure from the SEM image. Such results prove that theproposed statistical descriptors, the two-point correlation andtwo-point cluster correlation, are able to well characterize the RVEof material in this study.
6. Closure
This paper explores a data-driven framework to predict mi-crostructure morphology under different design settings. Thiswork provides two critical components of the material designprocessing–structure–property chain: the link between process-ing and structure and the stochastic description of the structure it-self. Specifically, algorithms to relatematerial processing variables,which can be thought of as material design variables, as well asthose to perform microstructure reconstruction, were presentedin detail. The two-point and two-point cluster correlation func-tions were used as pre-requisite statistical characterization func-tions within the simulated annealing reconstruction algorithm.
Y. Liu et al. / Computer-Aided Design 45 (2013) 65–76 75
These algorithms were used as manifestations of the frame-work and a surrogate-regression methodology was used to relatenon-physical microstructure parameters to processing variablesthrough an intermediate but simple linear regression for the casestudy. Themicrostructure prediction, bothmorphology and appar-ent properties, from our proposed methods has very high accu-racy with the one from the real image even with the simple linearregression models. It should be noted that by inquiring more mi-crostructure images of various two-phasematerials over the entirematerial design space, the accuracy of prediction can be further im-proved. The proposed framework and algorithms prove the abilityto explore a multiscale material design space that considers mate-rial and structure domains, a contribution not to be overlooked incontinuing research in multiscale design.
However, assumptions, limitations, and possible extensions ofthe proposed methods are worth mentioning here. There are sev-eral assumptions in our proposed method: (1) the microstruc-ture studied is statistically homogeneous and isotropic, (2) thetwo-point and two-point cluster correlation functions are suffi-cient to describe theirmorphology, (3) thematerial behavior of thematrix, filler, and interphase region of the microstructure does notdepend on the structure but is determined a priori, (4) the mate-rial volume fractions are known, and (5) the obtained SEM imagesrepresent our definition of a representative volume element. Thereare several possible extensions that can further broaden applica-tions of the proposed framework. First, for compositematerialwithmore than two phases, the proposed statistical descriptors needto be extended to characterize the correlations between any twophases. Second, the time for reconstruction increases in an expo-nential fashion with the image size of microstructure, especially inthe case of reconstructing 3D microstructures, thus more compu-tationally efficient algorithms are needed in 3D applications of themethodology.
Several sources of errors and model uncertainties of the pro-posed method are summarized here. First, image transformationfrom grayscale to binarized microstructure may introduce errorif the quality of gray images is poor. Second, due to the compu-tational capability, only a finite set of statistical descriptors (saytwo-point correlation and two-point cluster correlations in ourstudied case) are pragmatically used to characterize the mi-crostructure morphology. This, of course, introduces errors tocharacterization since a finite set of descriptors leaves out somemorphological information. Adding more statistical descriptorswill further reduce such error, but require more computing power.Therefore, designers have to make a tradeoff between the com-putational burden and accuracy. Third, even though only four keycharacteristic parameters are used in our study, depending onthe practical needs for accuracy, more key characteristic param-eters can be added to achieve a more accurate parameterization ofmicrostructures. Finally, due to the limited samples, only a linearregression function is used in our study to predict these key charac-teristic parameters based on material design variables. The uncer-tainty introduced by linear regression function can be reduced byusing a higher order nonlinear regression function which requiresadditional samples.
Other future work items include reconstructing 3D imagesfrom 2D slices of images, an ongoing research topic of practicalrelevance to the material design community. One area notconsidered in this work, though of great importance in predictingapparent properties of microstructural domains, is the inadequacyof the underlying physical model. Though out of the scope ofthis paper, model updating strategies like those of Bayesiannature or constant physics-based model refinement are relevantcontinuations of the present study. In sum, the microstructurereconstruction framework presented here is a synthesis of severalalgorithms that, when used in conjunction with the proposedphysical mapping between material processing parameters andresultingmicrostructuremorphology, provide a key element in the
multiscale material design paradigm: an automated link betweenprocessing and structure of multiscale materials.
Acknowledgments
The authors greatly acknowledge grants from NSF CMMI-0928320. M. Steven Greene is supported by a Graduate ResearchFellowship from the National Science Foundation and extends hisgratitude to the NSF.
References
[1] ChenW, Yin X, Lee S, LiuWK. Amultiscale designmethodology for hierarchicalsystems with random field uncertainty. ASME Journal of Mechanical Design2010;132(4):041006.
[2] Yin X, Lee S, Chen W, Liu WK. Efficient random field uncertainty propagationin design using multiscale analysis. ASME Journal of Mechanical Design 2009;131(2):021006.
[3] Liu Y, Yin X, Arendt P, Chen W, Huang HZ. A hierarchical statistical sensitivityanalysis method for multilevel systems with shared variables. ASME Journalof Mechanical Design 2010;132(3):031006.
[4] Greene MS, Liu Y, Chen W, Liu WK. Computational uncertainty analysisin multiresolution materials via stochastic constitutive theory. ComputerMethods in Applied Mechanics and Engineering 2011;200(1–4):309–25.
[5] Liu WK, Siad L, Tian R, et al. Complexity science of multiscale materialsvia stochastic computations. International Journal for Numerical Methods inEngineering 2009;80(6–7):932–78.
[6] Yin X, ChenW, ToA,McVeigh C, LiuWK. Statistical volume elementmethod forpredictingmicrostructure-constitutive property relations. ComputerMethodsin Applied Mechanics and Engineering 2008;197(43–44):3516–29.
[7] OlsonGB. Computational design of hierarchically structuredmaterials. Science1997;277(5330):1237–42.
[8] Fullwood DT, Niezgoda SR, Adams BL, Kalidindi SR. Microstructure sensitivedesign for performance optimization. Progress in Materials Science 2009;55(6):477–562.
[9] Saheli G, Garmestani H, Adams BL. Microstructure design of a two phasecomposite using two-point correlation functions. Journal of Computer-AidedMaterials Design 2004;11(2–3):103–15.
[10] Torquato S. Optimal design of heterogeneous materials. Annual Review ofMaterials Research 2010;40:101–29.
[11] Jiao Y, Stillinger FH, Torquato S. Modeling heterogeneous materials via two-point correlation functions. II. Algorithmic details and applications. PhysicalReview E 2008;77(3):031135.
[12] YeongCLY, Torquato S. Reconstructing randommedia. Physical ReviewE1998;57(1):495–506.
[13] Yeong CLY, Torquato S. Reconstructing random media. II. Three-dimensionalmedia from two-dimensional cuts. Physical Review E 1998;58(1):224–33.
[14] Collins BC, Matous K, Rypl D. Three-dimensional reconstruction of statisticallyoptimal unit cells of multimodal particulate composites. International Journalfor Multiscale Computational Engineering 2010;8(5):489–507.
[15] RozmanMG, UtzM. Efficient reconstruction ofmultiphasemorphologies fromcorrelation functions. Physical Review E 2001;63(6):066701.
[16] Fullwood DT, Kalidindi SR, Niezgoda SR, Fast A, Hampson N. Gradient-based microstructure reconstructions from distributions using fast Fouriertransforms. Materials Science and Engineering A 2008;494(1–2):68–72.
[17] Torquato S. Random heterogeneous materials: microstructure and macro-scopic properties. New York: Springer; 2002.
[18] Sobczyk K, Kirkner DJ. Stochastic modeling of microstructures. New York:Springer; 2001.
[19] Groeber M, Ghosh S, Uchic MD, Dimiduk DM. A framework for automatedanalysis and simulation of 3D polycrystalline microstructures. Part 1:statistical characterization. Acta Materialia 2008;56(6):1257–73.
[20] Qiao R, Brinson LC. Simulation of interphase percolation and gradients inpolymer nanocomposites. Journal of Composites Science and Technology2009;69(3–4):491–9.
[21] Abbé F, Chermant L, Coster M, Gomina M, Chermant JL. Morphologicalcharacterization of ceramic–ceramic composites by image analysis. Journal ofComposites Science and Technology 1990;37(1–3):109–27.
[22] Castleman KR. Digital image processing. Upper Saddle River: Prentice Hall;1996.
[23] Dehoff RT, Rhines FN. Quantitativemicroscopy. NewYork:McGraw-Hill; 1968.[24] Tscheschel A, Lacayo J, Stoyan D. Statistical characterization of TEM images of
silica-filled rubber. Journal of Microscopy 2005;217(1):75–82.[25] Bochenek B, Pyrz R. Reconstruction of random microstructures—a stochastic
optimization problem. Computational Materials Science 2004;31:93–112.[26] Jeulin D. Radnom texture models for material structures. Statistics and
Computing 2000;10(2):121–32.[27] Al-Ostaz A, Diwakar A, Alzebdeh KI. Statistical model for characterizing
random microstructure of inclusion-matrix composites. Journal of MaterialsScience 2007;42(16):7016–30.
[28] Sundararaghavan V, Zabaras N. Classification and reconstruction of three-dimensional microstructure using support vector machines. ComputationalMaterials Science 2005;32(2):223–39.

76 Y. Liu et al. / Computer-Aided Design 45 (2013) 65–76
[29] Jiao Y, Stillinger FH, Torquato S. A superior descriptor of random textures andits predictive capacity. Proceedings of the National Academy of Sciences 2009;106(42):17634–9.
[30] Stauffer D. Percolation theory. London: Taylor and Francis; 1985.[31] Bentz DP, Garboczi EJ. Percolation of phases in a three-dimensional cement
paste microstructural model. Cement and Concrete Research 1991;21(2–3):325–44.
[32] Talukdar MS, Torsaeter O, Ioannidis MA. Stochastic reconstruction ofparticulate media from two-dimensional images. Journal of Colloid andInterface Science 2002;248(2):419–28.
[33] Kumar NC, Matous K, Geubelle PH. Reconstruction of periodic unit cellsof multimodal random particulate composites using genetic algorithms.Computational Materials Science 2008;42(2):352–67.
[34] Povirk GL. Incorporation of microstructural information into models of two-phase materials. Acta Metallurgica et Materialia 1995;43(8):3199–206.
[35] Deng H, Liu Y, Gai D, Dikin DA, Putz KW, Chen W, et al. Utilizing realand statistically reconstructed microstructures for the viscoelastic modelingof polymer nanocomposites. Composites Science and Technology 2012;http://dx.doi.org/10.1016/j.compscitech.2012.03.020.
[36] Debye P, Bueche AM. Scattering by an inhomogeneous solid. Journal of AppliedPhysics 1949;20(6):518–25.
[37] Torquato S. Necessary conditions on realizable two-point correlation functionsof random media. Industrial & Engineering Chemistry Research 2006;45(21):6923–8.
[38] Sobol IM. Global sensitivity indices for nonlinear mathematical models andtheirMonte Carlo estimates. Mathematics and Computers in Simulation 2001;55(1–3):271–80.
[39] Jin R, Chen W, Sudjianto A. An efficient algorithm for constructing optimaldesign of computer experiment. Journal of Statistical Planning and Inference2005;134(1):268–87.