Embed Size (px)
Citation preview
Advanced Powder Technol Vol 15 No 1 pp 13ndash29 (2004)Oacute VSP and Society of Powder Technology Japan 2004Also available online - wwwvsppubcom
Original paper
Computational model for prediction of particledegradation during dilute-phase pneumatic conveyingthe use of a laboratory-scale degradation testerfor the determination of degradation propensity
PIERRE CHAPELLE1curren HADI ABOU-CHAKRA2 NICHOLAS CHRISTAKIS 1 MAYUR PATEL 1 AZLINA ABU-NAHAR2UGUR TUumlZUumlN 2 and MARK CROSS 1
1 Centre for Numerical Modelling and Process Analysis University of GreenwichOld Royal Naval College Park Row Greenwich London SE10 9LS UK
2 Chemical and Process Engineering School of Engineering University of Surrey GuildfordSurrey GU2 7XH UK
Received 3 December 2002 accepted 7 March 2003
AbstractmdashThe overall objective of this work is to develop a computational model of particledegradation during dilute-phasepneumatic conveying A key feature of such a model is the predictionof particle breakage due to particlendashwall collisions in pipeline bends This paper presents a methodfor calculating particle impact degradation propensity under a range of particle velocities and particlesizes It is based on interpolation on impact data obtained in a new laboratory-scale degradationtester The method is tested and validated against experimental results for degradation at 90plusmn impactangle of a full-size distribution sample of granulated sugar In a subsequent work the calculation ofdegradation propensity is coupled with a ow model of the solids and gas phases in the pipeline
Keywords Dilute phase pneumatic conveying impact degradation tester breakage matrix
1 INTRODUCTION
The degradation of particles of granulated materials during pneumatic transportis an issue of considerable industrial concern Degradation is usually an undesiredprocess and leads to dif culties associated with dust creation change in thematerial characteristics and product quality etc For example the resulting change
currenTo whom correspondence should be addressed E-mail pchapellegreacuk
14 P Chapelle et al
in particle shape and particle size distribution might lead to the production ofoff-speci cation products causing severe problems of quality with regard to theend use of the material The nes generated by attrition can cause a decrease inthe material owability and considerably enhance its propensity for caking Theabove dif culties have to be overcome through the use of additional handling andrecycling systems These can signi cantly increase production costs in processingand handling of particulate materials
The degradation in pneumatic systems occurs mainly as a result of impact orshear loads [1] Particles on their way through a pipe bend undergo for exampleextensive impact loads on the bend walls The most important parameters affectingparticle degradation are the air and particle velocities the solids air mass ratiothe bend structure and the particle properties such as the strength size and shapeof the particles [2] More speci cally in the case of degradation due to impactthe collision velocity the angle of collision and the elasticity of the collisionhave been shown to in uence signi cantly particle damage It is well establishedthat a reduction of the transport velocity can considerably reduce the attrition ofparticles [1] Hence dense-phase pneumatic conveying systems which operateat low gas velocities can achieve lower rates of particle attrition However notall materials are suitable for dense-phase conveying [3] Moreover dilute-phaseconveying is still the most widely used technology as it is the most cost effectiveand versatile design to use [4]
Studies reported so far in the literature on the degradation in pneumatic conveyingsystems are largely based on an empirical approach For an existing systemcomparing the particle size distribution of a material at the inlet and the outletof the system is the only way to assess degradation however for most of thesystems it is impossible to access the inlet and the outlet Different methodsto predict degradation in pneumatic conveyors have then been developed Theseare either to build a pilot-sized conveyor scaled to the actual plant componentdimensions [5ndash8] or use a small-scale air blast rig [9ndash11] However it is oftendif cult to extend with con dence the results obtained to the real processes as wellas to diagnose and understand how and where the degradation occurs Anotherdisadvantage of using the above methods is the cost of building the test rigs Onthe other hand computational models of conveying systems which describe themotion of uid and particles in the pipe system based either on the EulerLagrangeapproach [12ndash14] or on the two- uid theory [15] do not generally incorporatemodels for particle degradation or employ any particle degradation data In thecontext of dilute-phase systems most of the calculations have been performed usingthe EulerLagrange approach To determine particle trajectory such models areable to take into account particle wall impacts using the momentum equations forthe particle wall interactions and including the effect of wall roughness [16 17]However there is at present limited experimental information available on thedetails of the degradation mechanisms to support the development of a generallyapplicable model for particle damage Moreover the application of the Lagrangian
Use of a laboratory-scaledegradation tester 15
approach for the particulate phase in large-scale pneumatic conveyors is not deemedto be computationally effective due to the large amount of memory and CPU timerequirements
A powerful mathematical representation of degradation processes is the popula-tion balance model founded in the work of Epstein [18] and widely used by manysubsequent authors to describe grinding operations of solids materials (see eg[19 20] for reviews of the population balance model and [21] for a recent exampleof application) This approach is based on the de nition of two statistical functionsthe breakage function and the selection function which allow a population balanceto be performed for a given size class The breakage function is de ned as the sizedistribution of the products of a breakage event and the selection function repre-sents the rate at which degradation occurs The standard methods for determiningthese functions include measuring the change in a given monosize class sample ora marked particle size class [22] or extracting the functions from degradation testsby numerical optimization [23] However no attempt has been made to apply thepopulation balance approach to the study of pneumatic conveying systems due inparticular to the lack of detailed experiments which are needed for the determina-tion of the particle breakage parameters
A matrix representation of degradation processes based on the concepts of thepopulation balance model is applied in this paper with the aim of describing particledegradation by impact during dilute-phase pneumatic conveying A procedureis then presented to determine the extent of impact degradation under a rangeof particle velocities and particle sizes from single-impact tests carried out in alaboratory-scale degradation tester The procedure is validated against experimentaldata from degradation tests on granulated sugar
2 METHODOLOGY OVERVIEW
As a preliminary an outline of the methodology developed for predicting the extentof degradation imparted to particles during their transport in dilute-phase pneumaticconveying systems is presented in Fig 1 The primary mechanism of particledegradation under consideration in the present study is due to particlendashbend wallcollisions [1]
In the present work particle single-impact testing at a speci ed velocity iscarried out in a laboratory-scale degradation tester to quantify particle degradationpropensity based on particle size analysis and a matrix representation of degradationprocesses (using the concept of population balance models) Interpolated breakagematrices for a range of both impact velocities and particle sizes are derived from alimited number of experimentally determined breakage matrices
A computational model of particle degradation occurring during dilute-phasepneumatic conveying is then developed in a subsequent work [24] which combinescalculation of the degradation propensity by the use of the above breakage matrices
16 P Chapelle et al
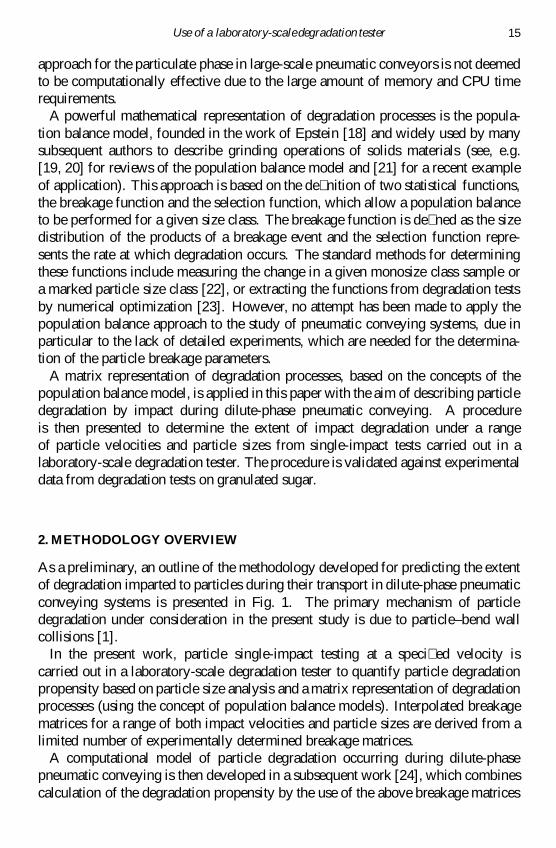
Figure 1 Methodology used for predicting the overall particle degradation in dilute-phase conveyingsystems from single impact data
with a ow model of the gas and solids phases in the pipeline This model providesestimates of the overall degradation in dilute-phase pneumatic conveying systems
3 EXPERIMENTAL TESTS
31 The purpose of the tester
The degradation tester was designed to simulate conditions in transport systems andenable an assessment of the extent of degradation for granular materials in suchsystems to be made [25] This tester is a bench-scale unit for assessing degradationby impact This test facility can control both the velocity of the particles and theangle of impact Bene ts associated with this facility are that the particle velocityis very closely controlled the tester is portable and only a small quantity of testmaterial is required for each test A degradation test will yield the particle sizedistribution from an input sample being subjected to impacts at a certain velocityThe input sample can be a mixture of size fractions or a single-size fraction asappropriate The former will inform of the collective breakage behavior thelatter will give speci c information on the breakage characteristics of a single-sizeclass The scale of the tester enables the entire degraded batch to be collected andsubjected to particle size analysis The material will be then analyzed in order toassess the amount of degradation caused under the designed test conditions
32 Description of the tester
The degradation tester consists of a balanced disk where the velocity of rotationcan be varied continuously and xed at any given value (see Fig 2) The rotating
Use of a laboratory-scaledegradation tester 17
Fig
ure
2S
chem
atic
ofth
ero
tati
ngdi
skof
the
degr
adat
ion
test
er
18 P Chapelle et al
disk (Fig 2 Detail A) is 100 mm in diameter and contains eight radial channels of10 mm internal diameter A mechanical arrangement ensures even splitting of thepowder into the eight acceleration channels During operation the particles are fedinto the central hole of the rotating disk These particles are accelerated throughthe eight radial channels by the centrifugal and Coriolis forces and ejected from theend of the acceleration tubes It was important to assess the magnitude and directionof the particle velocity at exit from the acceleration tubes The calculation of theparticle velocity (Vp) is based upon an analysis of the velocity components of anindividual particle exiting the acceleration tube
Vp D2frac14R
cosregn (1)
where R is the radius of the accelerator disk n is the rotation (rpm) and reg is theexit angle Burnett [26] referred an approximate value of reg D 40plusmn At the pointof exit the particles enter a free trajectory phase until they impact onto the targetsThe targets are angled to 90o of the trajectory of the particles exiting the accelerationtubes and are equally spaced around a ring tted around the acceleration disk (Fig 2Detail B)
33 Test methodology
Tests were carried out on a single-size fraction sample to obtain speci c informa-tion on the breakage characteristics of a single-size class In order to test individ-ual size fractions a particulate mixture sample was separated into size fractionsas appropriate by passing it through a sieve stack Each size fraction was storedseparately In a series of experiments allowing for systematic step changes in sizeclasses the input sample of a size fraction was subjected to impacts at a certainvelocity The methodology of carrying out the tests on the degradation tester ispresented out sequentially below
(i) A collection basket was inserted into the tester the necessary set of targetswas tted in place the lid was placed and secured to avoid any escape of dustgenerated during degradation and the feed hopper was inserted
(ii) The motor was switched on and the rotating disk was set to the requiredvelocity
(iii) A 5 g sample was poured in the feed hopper
(iv) The motor was stopped a moment after the feed hopper empties (the samplewill exit the acceleration tube and impact on the target very rapidly)
(v) The lid was removed and brushed down over a tray to collect any dust Thematerial inside the tester was emptied completely into the tray ensuring thatno particles were left inside
Use of a laboratory-scaledegradation tester 19
(vi) The particle size distribution of the degraded sample was recorded
(vii) To test the reproducibility of the method a second run was made with freshparticles of the same size
34 Experimental results
Once the entire sample of degraded material had been collected from the testerthe degradation analysis was undertaken The scale of the tester enabled the entiredegraded batch to be collected and subjected to the particle size analysis undertakenaccording to British Standard [26] procedure for conducting a manual sieve testThe material was then analyzed in order to assess the amount of degradation causedunder the designed test conditions
Ninety-degree impact tests were carried out on granulated sugar samples atdifferent particle velocities to assess the amount of degradation caused by theparticle velocity The resulting data of the degradation tests are presented in Fig 3The results presented are the average of two runs of fresh particles of the same sizeand weight The reproducibility of the resulting data was in general within 1An accuracy of 0001 g on an analytical balance was used during the weighing ofthe samples however in order to assess the experimental error resulting from thedegradation tests and for re ned analysis the error in weight was considered to beequal to 001 g for each measurement The experimental errors resulting from thedegradation tests were below 2 for all samples
It is clear that as the particle velocity increased the amount of degradationgenerated for a given size class also increased More severe damage at higherimpact velocities appears to be consistent with all size classes This was expectedas the particle velocity increased the strength of the particle was not great enoughto withstand the resultant impact hence the particles fractured into smaller particlesof comparable sizes Figure 3 shows clearly that the largest particles break moreeasily than the smallest This is believed to be due to the fact that particles of agiven material generally have a range of strengths related to their sizes [28] hencethe stress required to break large particles is much less than that required for smallparticles
It is seen from Fig 3 that the effect of the impact velocity on degradation increaseswith decreasing particle size For example increasing the velocity from 7 to 21 msincreases the proportion of broken particles by a factor of 2 for the size rangebetween 850 and 1180 sup1m (201 and 403 at 7 and 21 ms respectively) whereasthe same variation of the velocity causes an increase in the proportion of brokenparticles by a factor of about 10 for the size range between 212 and 300 sup1m (12 and13 at 7 and 21 ms respectively) In terms of particle size effect this observationshows that the effect of the particle size on degradation is smaller with an increasein velocity This result re ects the fact that as the impact velocity is increased thestress induced by the impact becomes gradually suf cient to overcome the strengthof every particle
20 P Chapelle et al
Figure 3 Particle size distribution resulting from degradation tests of various size classes ofgranulated sugar samples at different impact velocities
Use of a laboratory-scaledegradation tester 21
4 THEORETICAL
41 Matrix analysis of degradation processes
The size range is divided into a number of size classes indexed from 1 (coarse)to n ( nes) The breakage matrix approach is based around the following matrixequation
B cent i D o (2)
where i and o are column vectors whose entries are the particle mass fraction ineach size class respectively before and after the degradation event and B is thebreakage matrix whose elements bij de ne the mass fraction of particles of sizeclass j which ends up in size class i as a result of degradation
The breakage matrix takes the following form (eg for four particle size classes)
B D
2
664
b11 0 0 0b21 b22 0 0b31 b32 b33 0b41 b42 b43 b44
3
775 (3)
Each column of the matrix describes the fate of a given size class in the input sizedistribution For example for particles initially in size class 2 b42 denotes theproportion degrading to size class 4 b32 is the proportion degrading to size class 3and b22 represents the proportion of undegraded material The sum of the elementsof each column must be unity Each row of the matrix informs of the source ofparticles ending up in a given class in the output size distribution
All elements above the diagonal of the breakage matrix are zero as by de nitionit is impossible for particles to move to larger size classes
The breakage matrix constitutes a robust and quantitative means of following thedegradation processes for all particles size classes
42 Numerical procedure for the determination of the extent of degradation
Experiments described in Section 3 consist essentially of measuring individualcolumns of the breakage matrix for a given impact velocity and a given set ofsieve sizes The interpolation procedure described below is intended to allow foran estimation of the amount of degradation on a full particle size distribution forany set of sieve sizes of the particle distribution and any impact velocity both withina certain envelope of values by measuring the breakage matrix for a limited numberof cases across this envelope
The procedure requires as input the breakage matrix for a small number ofvelocities (typically three to ve velocities) obtained from experimental data onsingle impacts The calculation methodology which combines an interpolation withrespect to the sieve size and the particle velocity proceeds in three steps
22 P Chapelle et al
(i) The rst step is to build the breakage matrices for the set of size classesof the investigated particle size distribution when these are different fromthe set of size classes used to determine the experimental breakage matricesThe breakage matrix for the desired set of size classes for a certain impactvelocity is calculated through bilinear interpolation from the breakage matrixmeasured at this velocity [29] Because of the rapidly varying size distributionof the breakage fragments of a given size class (see columns of the breakagematrices in Section 3) it has been found in practice that the matrix can be moreaccurately interpolated by treating separately the diagonal elements and the rst element below them in the same column The determination of a diagonalelement is performed by a simple linear interpolation from the diagonalcoef cients of the experimental matrix This is due to the observed propertythat the propensity of particle degradation along the diagonal decreases (iesmaller particles tend to degrade less than bigger ones) The rst elementbelow the diagonal element in the same column is calculated using thenormalizability condition (ie the sum of elements of each column of thebreakage matrix must be equal to unity)
(ii) The amount of degradation on the investigated size distribution at each of thevelocities used in the experimental tests is then evaluated through (2) by usingthe known breakage matrices
(iii) Finally an estimate of the degradation at intermediate velocities is determinedby means of an N -order polynomial interpolation [where N is the total numberof velocities (vi) for which tests have been performed] from the set of values(oi) calculated in the second step The interpolating polynomial of degreeN iexcl 1 can be written as [29]
P v DNX
iD1
Rivoi (4)
where
Riv DNY
jD1j 6Di
v iexcl vj
vi iexcl vj (5)
As will be demonstrated this simple interpolation procedure is found to givesatisfactory estimates Moreover it guarantees that the values thus calculated willreproduce the experimental points It may be advisable to restrict the application ofthe method proposed for interpolating the breakage matrix with respect to the sievesize to cases for which the number of investigated sieve sizes is less than or close tothe number of sieve sizes used to measure the breakage matrices Limited reductionof the experimental work required to build the initial breakage matrices by usingthe size interpolation method should therefore be expected The main interest of the
Use of a laboratory-scaledegradation tester 23
size interpolation procedure lies in the capability of lsquoshiftingrsquo the breakage matrixwithin a range of values of the sieve sizes
The choice of a generally applicable size interpolation method was found to bedif cult because of the likely sharp variations of the fragment size distribution of agiven size class such as in the case of the degradation of granulated sugar presentedin Section 34 A limitation of the proposed size interpolation method is that ittends to concentrate the interpolation error in the approximation of the rst elementbelow the diagonal element in the same column This may affect the accuracy of theprediction of the fraction of particles ending up in the intermediate-size classes ofthe distribution However the information from the interpolated breakage matricescan be used with con dence to determine the fraction of particles ending up inthe smaller-size classes (commonly referred to as nes) which are generally inindustrial practice the size classes of interest regarding the assessment of the extentof degradation during pneumatic conveying This will be clearly demonstrated inthe following section where an interpolated-in-size breakage matrix was calculatedand used to estimate the extent of degradation for a full particle size distribution forwhich experimental data from the degradation tester were available
5 VALIDATION OF THE DEGRADATION MODEL AGAINST DEGRADATIONTESTS IN THE LABORATORY
51 Experimental results
To validate the outcome of the model degradation tests were carried out usinggranulated sugar samples consisting of a mixture of size fractions to obtain speci cinformation on the collective breakage behavior In order to test the full sizedistribution it is important that the particle size distribution is reproduced preciselyfor each test The particulate mixture was separated into six size fractions asappropriate by passing through a sieve stack Each size fraction was storedseparately Samples (5 g) were assembled according to the initial particle sizedistribution of the particulate mixture using material from the stored size classes
In a series of tests allowing for systematic step changes in particle velocity theinput sample of a full particle size distribution was subjected to 90plusmn impacts at acertain velocity The methodology of carrying out the tests in the degradation testeris similar to that described in Section 33 The experimental uncertainty has beencalculated to be as before of the order of 2 Two series of experiments (referencedas experiments A and B respectively) were performed with two different initialparticle size distributions associated with different sets of sieve sizes
To illustrate the effect of particle velocity on the amount of degradation obtainedduring the tests the entire degraded sample collected from the tester was subjectedto particle size analysis The resulting data are presented in Figs 4 and 5 forexperiments A and B respectively It is clear that as the particle velocity increasedthe net amount of degradation increased
24 P Chapelle et al
Figure 4 Particle size distribution resulting from degradation tests at different particle velocities inexperiment A
Figure 5 Particle size distribution resulting from degradation tests at different particle velocities inexperiment B
Use of a laboratory-scaledegradation tester 25
52 Prediction of the extent of degradation
The interpolation procedure described in Section 42 has been applied to predictthe extent of degradation for the two different size fraction mixtures de ned inSection 51 by using the experimental breakage matrices for the three velocities7 14 and 21 ms that were presented in Section 3 Direct use of the experimentalbreakage matrices was possible for the conditions of experiment A Howeversince the sieve sizes of the particle size distribution in experiment B are differentfrom those that have been used to measure the breakage matrices in Section 3breakage matrices for the appropriate sieve sizes employed in experiment B havebeen generated prior of the simulation from the experimental matrices using thesize interpolation procedure The simulation results for both series of experiments(given in Tables 1 and 2) are compared to the change in the particle size distributionmeasured in the degradation tester in Figs 6 and 7
In view of the experimental conditions in experiments A and B the results inFigs 6 and 7 illustrate the ef cacy of the interpolation methods with respect to theimpact velocity and to the particle size respectively Very good agreement was
Table 1Particle size distributioncalculated at different particle velocities using the breakagematrices for the conditions of experiment A
Sieve size Initial particle Degraded Degraded Degraded(sup1m) size distribution at 9 ms at 16 ms at 22 ms
1180 000 000 000 000850 1331 1090 1013 732600 4139 3995 3740 3332425 3121 3009 3015 3067300 1047 1440 1493 1689212 362 429 501 672
0 000 099 239 509Total 100 100 100 100
Table 2Particle size distributioncalculated at different particle velocities using the breakagematrices for the conditions of experiment B
Sieve size Initial particle Degraded Degraded Degraded(sup1m) size distribution at 7 ms at 14 ms at 21 ms
1000 0 0 0 0710 5861 5016 4948 3987600 948 1284 1227 1516425 1857 1958 1975 2182250 1141 1433 1443 162
0 193 309 407 694Total 100 100 100 100
26 P Chapelle et al
Figure 6 Comparison between the particle size distributionsmeasured in the degradation tester andpredicted using the breakage matrices for the conditions of experiment A
found between the particle size distributions predicted using the breakage matricesand those measured in the degradation tester at each velocity for the two seriesof experiments It can be seen in particular that the procedure gave an accuraterepresentation of the fractions of ne particles generated (see lower size classesbelow 300 and 250 sup1m for experiments A and B respectively) This latter point isof particular importance for quantitative assessment of degradation and nal productquality (ie percentage of nes resulting from the conveying process) in industrialpractice
6 CONCLUSIONS
A methodology has been developed to predict degradation propensity over a rangeof particle impact velocities and particle sizes It is based upon interpolation onexperimental data for particle single impacts obtained in a speci cally designeddegradation tester The advantages of the degradation tester developed are inparticular the fact that the tester is portable and that only a small amount of material
Use of a laboratory-scaledegradation tester 27
Figure 7 Comparison between the particle size distributionsmeasured in the degradation tester andpredicted using the breakage matrices for the conditions of experiment B
is required for each test A simple interpolation procedure based on a matrixrepresentation of degradation processes has been found to give faithful estimatesusing a relatively small number of experimental input data Comparison of theresults obtained by this method for a full size distribution sample of granulatedsugar at 90plusmn impact angle with those obtained by direct use of the degradationtester shows very good agreement The method described in this paper is employedin a subsequent work for the prediction of degradation in dilute-phase pneumaticconveying through its coupling with a ow model of the solids and gas phases inthe pipeline
Acknowledgements
This work forms part of the co-ordinated research project in Quality in Particu-late Manufacturing (QPM) funded by EPSRC Innovative Manufacturing Initiativefor Process Industries (grant no GRM1505701) whose support is gratefully ac-knowledged The authors wish to thank Professor Alan Reed and Dr Mike Bradleyfor useful discussions
28 P Chapelle et al
REFERENCES
1 H Kalman Attrition control by pneumatic conveying Powder Technol 104 214ndash220 (1999)2 H Kalman Particle breakage and attrition KONA 18 108ndash120 (2000)3 S B Savage R Pfeffer and Z M Zhao Solids transport separation and classi cation Powder
Technol 88 323ndash333 (1996)4 T Singer You too can select a pneumatic conveying system Technical article
wwwpowderandbulkcom(accessed on 121102) (2002)5 P M M Vervoorn M C Franken J K Hoeksma and B Scarlett Attrition of alumna pellets
during lean-phase conveying in Proc 3rd Int Pneumatic Conveying Technology Conf JerseyIslands pp 487ndash496 (1987)
6 A R Reed and M S A Bradley Techniques for Minimising Particle Degradation in PneumaticConveying Systems Powder Handling Process 3 (1) 49ndash52 (1991)
7 U Schwanke and H Ruumlssemeyer Product degradation of LDPE pellets in pneumatic conveyingsystems Powder Handling Process 4 (2) 199ndash201 (1992)
8 I Bridle M S A Bradley S R Woodhead and R J Farnish Effect of bend geometry onparticle attrition in pneumatic conveyors in Powder to Bulk Proc Int Conf on Powder andBulk Solids Handling pp 363ndash733 London (2000)
9 A D Salman M Szabo I Angyal A Verba and D Mills The design of pneumatic conveyingsystems to minimise product degradation in Proc 13th Powder and Bulk Solids Conf ChicagoIL pp 351ndash362 (1988)
10 M Ghadiri J A S Cleaver and N Rolfe Impact attrition of sodium carbonate monohydratecrystals Powder Technol 76 15ndash22 (1993)
11 A D Salman D A Gorham and A Verba A study of solid particle failure under normal andoblique impact Wear 186187 92ndash98 (1995)
12 Y Tsuji N Y Shen and Y Morikawa Lagrangian simulation of dilute gasndashsolid ows in ahorizontal pipe Advanced Powder Technol 2 63ndash81 (1991)
13 Y Tsuji T Tanaka and T Ishida Lagrangian numerical simulation of plug ow of cohesionlessparticles in a horizontal pipe Powder Technol 71 239ndash250 (1992)
14 A Yilmaz and E K Levy Formation and dispersion of ropes in pneumatic conveying PowderTechnol 114 168ndash185 (2001)
15 E K Levy Two- uid approach for plug ow simulations in horizontal pneumatic conveyingPowder Technol 112 263ndash272 (2000)
16 M Sommerfeld Modelling of particlendashwall collisions in con ned gasndashparticle ows Int JMultiphase Flow 18 (6) 905ndash926 (1992)
17 N Huber and M Sommerfeld Modelling and numerical calculation of dilute-phase pneumaticconveying in pipe systems Powder Technol 99 90ndash101 (1998)
18 B Epstein Logarithmico-normal distribution in breakage of solids Ind Engng Chem 40 2289(1948)
19 K J Reid A solution to the batch grinding equation Chem Engng Sci 20 953ndash963 (1965)20 L G Austin Introduction to the mathematical description of grinding as a rate process Powder
Technol 5 1ndash17 (197172)21 R Hogg Breakage mechanisms and mill performance in ultra ne grinding Powder Technol
105 135ndash140 (1999)22 S L Yu Bosco and R P Gardner The preparation and use of radioactive tracers for the study of
comminution processes Part I Homogeneous materials Powder Technol 30 265ndash275 (1981)23 T P Meloy and M C Williams Problems in population balance modelling of wet grinding
Powder Technol 71 273ndash279 (1992)24 P Chapelle N Christakis H Abou-Chakra I Bridle M S A Bradley M Patel and M Cross
Computational model for prediction of particle degradation during dilute-phase pneumatic
Use of a laboratory-scaledegradation tester 29
conveying modeling of dilute-phase pneumatic conveying Advanced Powder Technol 15 31ndash49 (2004)
25 H Abou-Chakra U Tuumlzuumln I Bridle M C Leaper M S A Bradley and A R Reed Aninvestigationof particle degradation by impact within a centrifugal accelerator type degradationtester in Proc I Mech E Journal of Process Mechanical Engineering Part E 217 257ndash266(2003)
26 A J Burnett The use of laboratoryerosion tests for the predictionof wear in pneumatic conveyorbends PhD Thesis University of Greenwich London (1996)
27 British Standards Institution Test Sieving Methods using Test Sieves of Woven Wire Cloth andPerforated Metal Plate BS 1796 Part 1 BSI London (1989)
28 L M Tavares and R P King Single-particle fracture under impact loading Int J MinerProcess 54 1ndash28 (1998)
29 W H Press S A TeukolskyW T Vetterling and B P Flannery Numerical Recipes in FortranThe Art of Scientic Computing 2nd edn Cambridge University Press Cambridge (1992)

14 P Chapelle et al
in particle shape and particle size distribution might lead to the production ofoff-speci cation products causing severe problems of quality with regard to theend use of the material The nes generated by attrition can cause a decrease inthe material owability and considerably enhance its propensity for caking Theabove dif culties have to be overcome through the use of additional handling andrecycling systems These can signi cantly increase production costs in processingand handling of particulate materials
The degradation in pneumatic systems occurs mainly as a result of impact orshear loads [1] Particles on their way through a pipe bend undergo for exampleextensive impact loads on the bend walls The most important parameters affectingparticle degradation are the air and particle velocities the solids air mass ratiothe bend structure and the particle properties such as the strength size and shapeof the particles [2] More speci cally in the case of degradation due to impactthe collision velocity the angle of collision and the elasticity of the collisionhave been shown to in uence signi cantly particle damage It is well establishedthat a reduction of the transport velocity can considerably reduce the attrition ofparticles [1] Hence dense-phase pneumatic conveying systems which operateat low gas velocities can achieve lower rates of particle attrition However notall materials are suitable for dense-phase conveying [3] Moreover dilute-phaseconveying is still the most widely used technology as it is the most cost effectiveand versatile design to use [4]
Studies reported so far in the literature on the degradation in pneumatic conveyingsystems are largely based on an empirical approach For an existing systemcomparing the particle size distribution of a material at the inlet and the outletof the system is the only way to assess degradation however for most of thesystems it is impossible to access the inlet and the outlet Different methodsto predict degradation in pneumatic conveyors have then been developed Theseare either to build a pilot-sized conveyor scaled to the actual plant componentdimensions [5ndash8] or use a small-scale air blast rig [9ndash11] However it is oftendif cult to extend with con dence the results obtained to the real processes as wellas to diagnose and understand how and where the degradation occurs Anotherdisadvantage of using the above methods is the cost of building the test rigs Onthe other hand computational models of conveying systems which describe themotion of uid and particles in the pipe system based either on the EulerLagrangeapproach [12ndash14] or on the two- uid theory [15] do not generally incorporatemodels for particle degradation or employ any particle degradation data In thecontext of dilute-phase systems most of the calculations have been performed usingthe EulerLagrange approach To determine particle trajectory such models areable to take into account particle wall impacts using the momentum equations forthe particle wall interactions and including the effect of wall roughness [16 17]However there is at present limited experimental information available on thedetails of the degradation mechanisms to support the development of a generallyapplicable model for particle damage Moreover the application of the Lagrangian
Use of a laboratory-scaledegradation tester 15
approach for the particulate phase in large-scale pneumatic conveyors is not deemedto be computationally effective due to the large amount of memory and CPU timerequirements
A powerful mathematical representation of degradation processes is the popula-tion balance model founded in the work of Epstein [18] and widely used by manysubsequent authors to describe grinding operations of solids materials (see eg[19 20] for reviews of the population balance model and [21] for a recent exampleof application) This approach is based on the de nition of two statistical functionsthe breakage function and the selection function which allow a population balanceto be performed for a given size class The breakage function is de ned as the sizedistribution of the products of a breakage event and the selection function repre-sents the rate at which degradation occurs The standard methods for determiningthese functions include measuring the change in a given monosize class sample ora marked particle size class [22] or extracting the functions from degradation testsby numerical optimization [23] However no attempt has been made to apply thepopulation balance approach to the study of pneumatic conveying systems due inparticular to the lack of detailed experiments which are needed for the determina-tion of the particle breakage parameters
A matrix representation of degradation processes based on the concepts of thepopulation balance model is applied in this paper with the aim of describing particledegradation by impact during dilute-phase pneumatic conveying A procedureis then presented to determine the extent of impact degradation under a rangeof particle velocities and particle sizes from single-impact tests carried out in alaboratory-scale degradation tester The procedure is validated against experimentaldata from degradation tests on granulated sugar
2 METHODOLOGY OVERVIEW
As a preliminary an outline of the methodology developed for predicting the extentof degradation imparted to particles during their transport in dilute-phase pneumaticconveying systems is presented in Fig 1 The primary mechanism of particledegradation under consideration in the present study is due to particlendashbend wallcollisions [1]
In the present work particle single-impact testing at a speci ed velocity iscarried out in a laboratory-scale degradation tester to quantify particle degradationpropensity based on particle size analysis and a matrix representation of degradationprocesses (using the concept of population balance models) Interpolated breakagematrices for a range of both impact velocities and particle sizes are derived from alimited number of experimentally determined breakage matrices
A computational model of particle degradation occurring during dilute-phasepneumatic conveying is then developed in a subsequent work [24] which combinescalculation of the degradation propensity by the use of the above breakage matrices
16 P Chapelle et al
Figure 1 Methodology used for predicting the overall particle degradation in dilute-phase conveyingsystems from single impact data
with a ow model of the gas and solids phases in the pipeline This model providesestimates of the overall degradation in dilute-phase pneumatic conveying systems
3 EXPERIMENTAL TESTS
31 The purpose of the tester
The degradation tester was designed to simulate conditions in transport systems andenable an assessment of the extent of degradation for granular materials in suchsystems to be made [25] This tester is a bench-scale unit for assessing degradationby impact This test facility can control both the velocity of the particles and theangle of impact Bene ts associated with this facility are that the particle velocityis very closely controlled the tester is portable and only a small quantity of testmaterial is required for each test A degradation test will yield the particle sizedistribution from an input sample being subjected to impacts at a certain velocityThe input sample can be a mixture of size fractions or a single-size fraction asappropriate The former will inform of the collective breakage behavior thelatter will give speci c information on the breakage characteristics of a single-sizeclass The scale of the tester enables the entire degraded batch to be collected andsubjected to particle size analysis The material will be then analyzed in order toassess the amount of degradation caused under the designed test conditions
32 Description of the tester
The degradation tester consists of a balanced disk where the velocity of rotationcan be varied continuously and xed at any given value (see Fig 2) The rotating
Use of a laboratory-scaledegradation tester 17
Fig
ure
2S
chem
atic
ofth
ero
tati
ngdi
skof
the
degr
adat
ion
test
er
18 P Chapelle et al
disk (Fig 2 Detail A) is 100 mm in diameter and contains eight radial channels of10 mm internal diameter A mechanical arrangement ensures even splitting of thepowder into the eight acceleration channels During operation the particles are fedinto the central hole of the rotating disk These particles are accelerated throughthe eight radial channels by the centrifugal and Coriolis forces and ejected from theend of the acceleration tubes It was important to assess the magnitude and directionof the particle velocity at exit from the acceleration tubes The calculation of theparticle velocity (Vp) is based upon an analysis of the velocity components of anindividual particle exiting the acceleration tube
Vp D2frac14R
cosregn (1)
where R is the radius of the accelerator disk n is the rotation (rpm) and reg is theexit angle Burnett [26] referred an approximate value of reg D 40plusmn At the pointof exit the particles enter a free trajectory phase until they impact onto the targetsThe targets are angled to 90o of the trajectory of the particles exiting the accelerationtubes and are equally spaced around a ring tted around the acceleration disk (Fig 2Detail B)
33 Test methodology
Tests were carried out on a single-size fraction sample to obtain speci c informa-tion on the breakage characteristics of a single-size class In order to test individ-ual size fractions a particulate mixture sample was separated into size fractionsas appropriate by passing it through a sieve stack Each size fraction was storedseparately In a series of experiments allowing for systematic step changes in sizeclasses the input sample of a size fraction was subjected to impacts at a certainvelocity The methodology of carrying out the tests on the degradation tester ispresented out sequentially below
(i) A collection basket was inserted into the tester the necessary set of targetswas tted in place the lid was placed and secured to avoid any escape of dustgenerated during degradation and the feed hopper was inserted
(ii) The motor was switched on and the rotating disk was set to the requiredvelocity
(iii) A 5 g sample was poured in the feed hopper
(iv) The motor was stopped a moment after the feed hopper empties (the samplewill exit the acceleration tube and impact on the target very rapidly)
(v) The lid was removed and brushed down over a tray to collect any dust Thematerial inside the tester was emptied completely into the tray ensuring thatno particles were left inside
Use of a laboratory-scaledegradation tester 19
(vi) The particle size distribution of the degraded sample was recorded
(vii) To test the reproducibility of the method a second run was made with freshparticles of the same size
34 Experimental results
Once the entire sample of degraded material had been collected from the testerthe degradation analysis was undertaken The scale of the tester enabled the entiredegraded batch to be collected and subjected to the particle size analysis undertakenaccording to British Standard [26] procedure for conducting a manual sieve testThe material was then analyzed in order to assess the amount of degradation causedunder the designed test conditions
Ninety-degree impact tests were carried out on granulated sugar samples atdifferent particle velocities to assess the amount of degradation caused by theparticle velocity The resulting data of the degradation tests are presented in Fig 3The results presented are the average of two runs of fresh particles of the same sizeand weight The reproducibility of the resulting data was in general within 1An accuracy of 0001 g on an analytical balance was used during the weighing ofthe samples however in order to assess the experimental error resulting from thedegradation tests and for re ned analysis the error in weight was considered to beequal to 001 g for each measurement The experimental errors resulting from thedegradation tests were below 2 for all samples
It is clear that as the particle velocity increased the amount of degradationgenerated for a given size class also increased More severe damage at higherimpact velocities appears to be consistent with all size classes This was expectedas the particle velocity increased the strength of the particle was not great enoughto withstand the resultant impact hence the particles fractured into smaller particlesof comparable sizes Figure 3 shows clearly that the largest particles break moreeasily than the smallest This is believed to be due to the fact that particles of agiven material generally have a range of strengths related to their sizes [28] hencethe stress required to break large particles is much less than that required for smallparticles
It is seen from Fig 3 that the effect of the impact velocity on degradation increaseswith decreasing particle size For example increasing the velocity from 7 to 21 msincreases the proportion of broken particles by a factor of 2 for the size rangebetween 850 and 1180 sup1m (201 and 403 at 7 and 21 ms respectively) whereasthe same variation of the velocity causes an increase in the proportion of brokenparticles by a factor of about 10 for the size range between 212 and 300 sup1m (12 and13 at 7 and 21 ms respectively) In terms of particle size effect this observationshows that the effect of the particle size on degradation is smaller with an increasein velocity This result re ects the fact that as the impact velocity is increased thestress induced by the impact becomes gradually suf cient to overcome the strengthof every particle
20 P Chapelle et al
Figure 3 Particle size distribution resulting from degradation tests of various size classes ofgranulated sugar samples at different impact velocities
Use of a laboratory-scaledegradation tester 21
4 THEORETICAL
41 Matrix analysis of degradation processes
The size range is divided into a number of size classes indexed from 1 (coarse)to n ( nes) The breakage matrix approach is based around the following matrixequation
B cent i D o (2)
where i and o are column vectors whose entries are the particle mass fraction ineach size class respectively before and after the degradation event and B is thebreakage matrix whose elements bij de ne the mass fraction of particles of sizeclass j which ends up in size class i as a result of degradation
The breakage matrix takes the following form (eg for four particle size classes)
B D
2
664
b11 0 0 0b21 b22 0 0b31 b32 b33 0b41 b42 b43 b44
3
775 (3)
Each column of the matrix describes the fate of a given size class in the input sizedistribution For example for particles initially in size class 2 b42 denotes theproportion degrading to size class 4 b32 is the proportion degrading to size class 3and b22 represents the proportion of undegraded material The sum of the elementsof each column must be unity Each row of the matrix informs of the source ofparticles ending up in a given class in the output size distribution
All elements above the diagonal of the breakage matrix are zero as by de nitionit is impossible for particles to move to larger size classes
The breakage matrix constitutes a robust and quantitative means of following thedegradation processes for all particles size classes
42 Numerical procedure for the determination of the extent of degradation
Experiments described in Section 3 consist essentially of measuring individualcolumns of the breakage matrix for a given impact velocity and a given set ofsieve sizes The interpolation procedure described below is intended to allow foran estimation of the amount of degradation on a full particle size distribution forany set of sieve sizes of the particle distribution and any impact velocity both withina certain envelope of values by measuring the breakage matrix for a limited numberof cases across this envelope
The procedure requires as input the breakage matrix for a small number ofvelocities (typically three to ve velocities) obtained from experimental data onsingle impacts The calculation methodology which combines an interpolation withrespect to the sieve size and the particle velocity proceeds in three steps
22 P Chapelle et al
(i) The rst step is to build the breakage matrices for the set of size classesof the investigated particle size distribution when these are different fromthe set of size classes used to determine the experimental breakage matricesThe breakage matrix for the desired set of size classes for a certain impactvelocity is calculated through bilinear interpolation from the breakage matrixmeasured at this velocity [29] Because of the rapidly varying size distributionof the breakage fragments of a given size class (see columns of the breakagematrices in Section 3) it has been found in practice that the matrix can be moreaccurately interpolated by treating separately the diagonal elements and the rst element below them in the same column The determination of a diagonalelement is performed by a simple linear interpolation from the diagonalcoef cients of the experimental matrix This is due to the observed propertythat the propensity of particle degradation along the diagonal decreases (iesmaller particles tend to degrade less than bigger ones) The rst elementbelow the diagonal element in the same column is calculated using thenormalizability condition (ie the sum of elements of each column of thebreakage matrix must be equal to unity)
(ii) The amount of degradation on the investigated size distribution at each of thevelocities used in the experimental tests is then evaluated through (2) by usingthe known breakage matrices
(iii) Finally an estimate of the degradation at intermediate velocities is determinedby means of an N -order polynomial interpolation [where N is the total numberof velocities (vi) for which tests have been performed] from the set of values(oi) calculated in the second step The interpolating polynomial of degreeN iexcl 1 can be written as [29]
P v DNX
iD1
Rivoi (4)
where
Riv DNY
jD1j 6Di
v iexcl vj
vi iexcl vj (5)
As will be demonstrated this simple interpolation procedure is found to givesatisfactory estimates Moreover it guarantees that the values thus calculated willreproduce the experimental points It may be advisable to restrict the application ofthe method proposed for interpolating the breakage matrix with respect to the sievesize to cases for which the number of investigated sieve sizes is less than or close tothe number of sieve sizes used to measure the breakage matrices Limited reductionof the experimental work required to build the initial breakage matrices by usingthe size interpolation method should therefore be expected The main interest of the
Use of a laboratory-scaledegradation tester 23
size interpolation procedure lies in the capability of lsquoshiftingrsquo the breakage matrixwithin a range of values of the sieve sizes
The choice of a generally applicable size interpolation method was found to bedif cult because of the likely sharp variations of the fragment size distribution of agiven size class such as in the case of the degradation of granulated sugar presentedin Section 34 A limitation of the proposed size interpolation method is that ittends to concentrate the interpolation error in the approximation of the rst elementbelow the diagonal element in the same column This may affect the accuracy of theprediction of the fraction of particles ending up in the intermediate-size classes ofthe distribution However the information from the interpolated breakage matricescan be used with con dence to determine the fraction of particles ending up inthe smaller-size classes (commonly referred to as nes) which are generally inindustrial practice the size classes of interest regarding the assessment of the extentof degradation during pneumatic conveying This will be clearly demonstrated inthe following section where an interpolated-in-size breakage matrix was calculatedand used to estimate the extent of degradation for a full particle size distribution forwhich experimental data from the degradation tester were available
5 VALIDATION OF THE DEGRADATION MODEL AGAINST DEGRADATIONTESTS IN THE LABORATORY
51 Experimental results
To validate the outcome of the model degradation tests were carried out usinggranulated sugar samples consisting of a mixture of size fractions to obtain speci cinformation on the collective breakage behavior In order to test the full sizedistribution it is important that the particle size distribution is reproduced preciselyfor each test The particulate mixture was separated into six size fractions asappropriate by passing through a sieve stack Each size fraction was storedseparately Samples (5 g) were assembled according to the initial particle sizedistribution of the particulate mixture using material from the stored size classes
In a series of tests allowing for systematic step changes in particle velocity theinput sample of a full particle size distribution was subjected to 90plusmn impacts at acertain velocity The methodology of carrying out the tests in the degradation testeris similar to that described in Section 33 The experimental uncertainty has beencalculated to be as before of the order of 2 Two series of experiments (referencedas experiments A and B respectively) were performed with two different initialparticle size distributions associated with different sets of sieve sizes
To illustrate the effect of particle velocity on the amount of degradation obtainedduring the tests the entire degraded sample collected from the tester was subjectedto particle size analysis The resulting data are presented in Figs 4 and 5 forexperiments A and B respectively It is clear that as the particle velocity increasedthe net amount of degradation increased
24 P Chapelle et al
Figure 4 Particle size distribution resulting from degradation tests at different particle velocities inexperiment A
Figure 5 Particle size distribution resulting from degradation tests at different particle velocities inexperiment B
Use of a laboratory-scaledegradation tester 25
52 Prediction of the extent of degradation
The interpolation procedure described in Section 42 has been applied to predictthe extent of degradation for the two different size fraction mixtures de ned inSection 51 by using the experimental breakage matrices for the three velocities7 14 and 21 ms that were presented in Section 3 Direct use of the experimentalbreakage matrices was possible for the conditions of experiment A Howeversince the sieve sizes of the particle size distribution in experiment B are differentfrom those that have been used to measure the breakage matrices in Section 3breakage matrices for the appropriate sieve sizes employed in experiment B havebeen generated prior of the simulation from the experimental matrices using thesize interpolation procedure The simulation results for both series of experiments(given in Tables 1 and 2) are compared to the change in the particle size distributionmeasured in the degradation tester in Figs 6 and 7
In view of the experimental conditions in experiments A and B the results inFigs 6 and 7 illustrate the ef cacy of the interpolation methods with respect to theimpact velocity and to the particle size respectively Very good agreement was
Table 1Particle size distributioncalculated at different particle velocities using the breakagematrices for the conditions of experiment A
Sieve size Initial particle Degraded Degraded Degraded(sup1m) size distribution at 9 ms at 16 ms at 22 ms
1180 000 000 000 000850 1331 1090 1013 732600 4139 3995 3740 3332425 3121 3009 3015 3067300 1047 1440 1493 1689212 362 429 501 672
0 000 099 239 509Total 100 100 100 100
Table 2Particle size distributioncalculated at different particle velocities using the breakagematrices for the conditions of experiment B
Sieve size Initial particle Degraded Degraded Degraded(sup1m) size distribution at 7 ms at 14 ms at 21 ms
1000 0 0 0 0710 5861 5016 4948 3987600 948 1284 1227 1516425 1857 1958 1975 2182250 1141 1433 1443 162
0 193 309 407 694Total 100 100 100 100
26 P Chapelle et al
Figure 6 Comparison between the particle size distributionsmeasured in the degradation tester andpredicted using the breakage matrices for the conditions of experiment A
found between the particle size distributions predicted using the breakage matricesand those measured in the degradation tester at each velocity for the two seriesof experiments It can be seen in particular that the procedure gave an accuraterepresentation of the fractions of ne particles generated (see lower size classesbelow 300 and 250 sup1m for experiments A and B respectively) This latter point isof particular importance for quantitative assessment of degradation and nal productquality (ie percentage of nes resulting from the conveying process) in industrialpractice
6 CONCLUSIONS
A methodology has been developed to predict degradation propensity over a rangeof particle impact velocities and particle sizes It is based upon interpolation onexperimental data for particle single impacts obtained in a speci cally designeddegradation tester The advantages of the degradation tester developed are inparticular the fact that the tester is portable and that only a small amount of material
Use of a laboratory-scaledegradation tester 27
Figure 7 Comparison between the particle size distributionsmeasured in the degradation tester andpredicted using the breakage matrices for the conditions of experiment B
is required for each test A simple interpolation procedure based on a matrixrepresentation of degradation processes has been found to give faithful estimatesusing a relatively small number of experimental input data Comparison of theresults obtained by this method for a full size distribution sample of granulatedsugar at 90plusmn impact angle with those obtained by direct use of the degradationtester shows very good agreement The method described in this paper is employedin a subsequent work for the prediction of degradation in dilute-phase pneumaticconveying through its coupling with a ow model of the solids and gas phases inthe pipeline
Acknowledgements
This work forms part of the co-ordinated research project in Quality in Particu-late Manufacturing (QPM) funded by EPSRC Innovative Manufacturing Initiativefor Process Industries (grant no GRM1505701) whose support is gratefully ac-knowledged The authors wish to thank Professor Alan Reed and Dr Mike Bradleyfor useful discussions
28 P Chapelle et al
REFERENCES
1 H Kalman Attrition control by pneumatic conveying Powder Technol 104 214ndash220 (1999)2 H Kalman Particle breakage and attrition KONA 18 108ndash120 (2000)3 S B Savage R Pfeffer and Z M Zhao Solids transport separation and classi cation Powder
Technol 88 323ndash333 (1996)4 T Singer You too can select a pneumatic conveying system Technical article
wwwpowderandbulkcom(accessed on 121102) (2002)5 P M M Vervoorn M C Franken J K Hoeksma and B Scarlett Attrition of alumna pellets
during lean-phase conveying in Proc 3rd Int Pneumatic Conveying Technology Conf JerseyIslands pp 487ndash496 (1987)
6 A R Reed and M S A Bradley Techniques for Minimising Particle Degradation in PneumaticConveying Systems Powder Handling Process 3 (1) 49ndash52 (1991)
7 U Schwanke and H Ruumlssemeyer Product degradation of LDPE pellets in pneumatic conveyingsystems Powder Handling Process 4 (2) 199ndash201 (1992)
8 I Bridle M S A Bradley S R Woodhead and R J Farnish Effect of bend geometry onparticle attrition in pneumatic conveyors in Powder to Bulk Proc Int Conf on Powder andBulk Solids Handling pp 363ndash733 London (2000)
9 A D Salman M Szabo I Angyal A Verba and D Mills The design of pneumatic conveyingsystems to minimise product degradation in Proc 13th Powder and Bulk Solids Conf ChicagoIL pp 351ndash362 (1988)
10 M Ghadiri J A S Cleaver and N Rolfe Impact attrition of sodium carbonate monohydratecrystals Powder Technol 76 15ndash22 (1993)
11 A D Salman D A Gorham and A Verba A study of solid particle failure under normal andoblique impact Wear 186187 92ndash98 (1995)
12 Y Tsuji N Y Shen and Y Morikawa Lagrangian simulation of dilute gasndashsolid ows in ahorizontal pipe Advanced Powder Technol 2 63ndash81 (1991)
13 Y Tsuji T Tanaka and T Ishida Lagrangian numerical simulation of plug ow of cohesionlessparticles in a horizontal pipe Powder Technol 71 239ndash250 (1992)
14 A Yilmaz and E K Levy Formation and dispersion of ropes in pneumatic conveying PowderTechnol 114 168ndash185 (2001)
15 E K Levy Two- uid approach for plug ow simulations in horizontal pneumatic conveyingPowder Technol 112 263ndash272 (2000)
16 M Sommerfeld Modelling of particlendashwall collisions in con ned gasndashparticle ows Int JMultiphase Flow 18 (6) 905ndash926 (1992)
17 N Huber and M Sommerfeld Modelling and numerical calculation of dilute-phase pneumaticconveying in pipe systems Powder Technol 99 90ndash101 (1998)
18 B Epstein Logarithmico-normal distribution in breakage of solids Ind Engng Chem 40 2289(1948)
19 K J Reid A solution to the batch grinding equation Chem Engng Sci 20 953ndash963 (1965)20 L G Austin Introduction to the mathematical description of grinding as a rate process Powder
Technol 5 1ndash17 (197172)21 R Hogg Breakage mechanisms and mill performance in ultra ne grinding Powder Technol
105 135ndash140 (1999)22 S L Yu Bosco and R P Gardner The preparation and use of radioactive tracers for the study of
comminution processes Part I Homogeneous materials Powder Technol 30 265ndash275 (1981)23 T P Meloy and M C Williams Problems in population balance modelling of wet grinding
Powder Technol 71 273ndash279 (1992)24 P Chapelle N Christakis H Abou-Chakra I Bridle M S A Bradley M Patel and M Cross
Computational model for prediction of particle degradation during dilute-phase pneumatic
Use of a laboratory-scaledegradation tester 29
conveying modeling of dilute-phase pneumatic conveying Advanced Powder Technol 15 31ndash49 (2004)
25 H Abou-Chakra U Tuumlzuumln I Bridle M C Leaper M S A Bradley and A R Reed Aninvestigationof particle degradation by impact within a centrifugal accelerator type degradationtester in Proc I Mech E Journal of Process Mechanical Engineering Part E 217 257ndash266(2003)
26 A J Burnett The use of laboratoryerosion tests for the predictionof wear in pneumatic conveyorbends PhD Thesis University of Greenwich London (1996)
27 British Standards Institution Test Sieving Methods using Test Sieves of Woven Wire Cloth andPerforated Metal Plate BS 1796 Part 1 BSI London (1989)
28 L M Tavares and R P King Single-particle fracture under impact loading Int J MinerProcess 54 1ndash28 (1998)
29 W H Press S A TeukolskyW T Vetterling and B P Flannery Numerical Recipes in FortranThe Art of Scientic Computing 2nd edn Cambridge University Press Cambridge (1992)
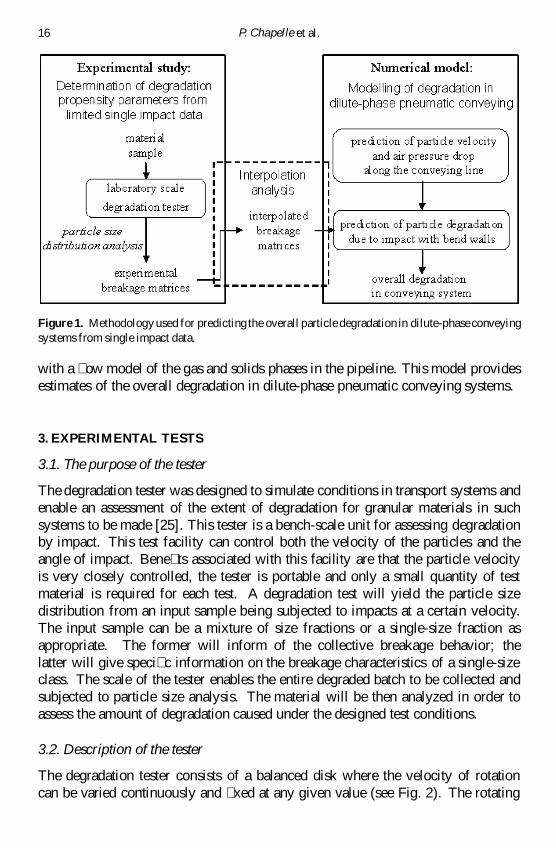
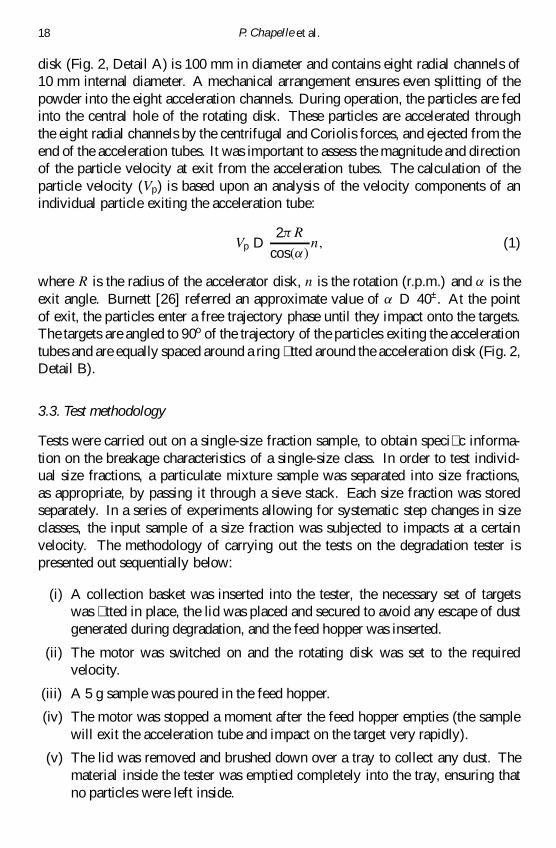
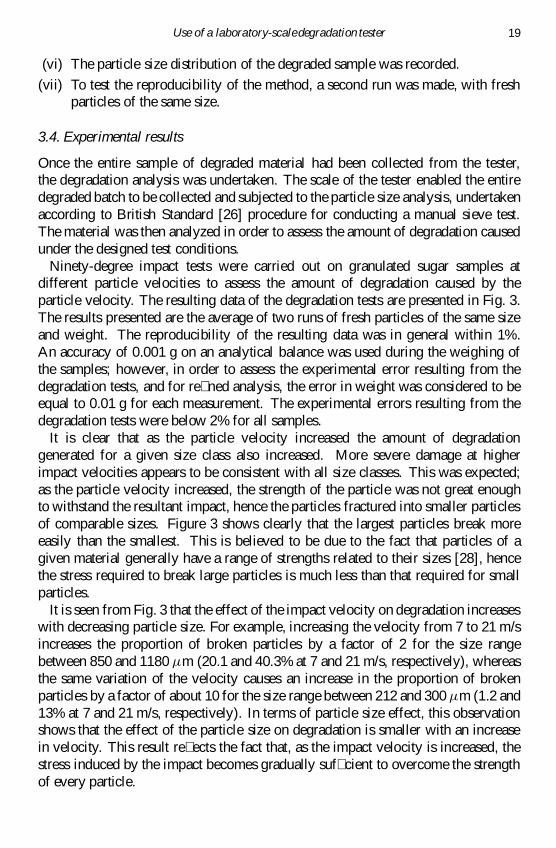
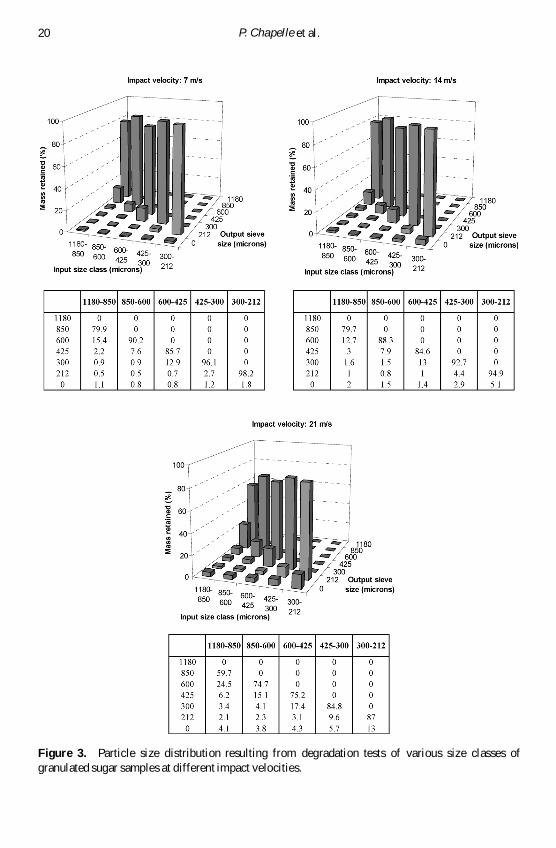
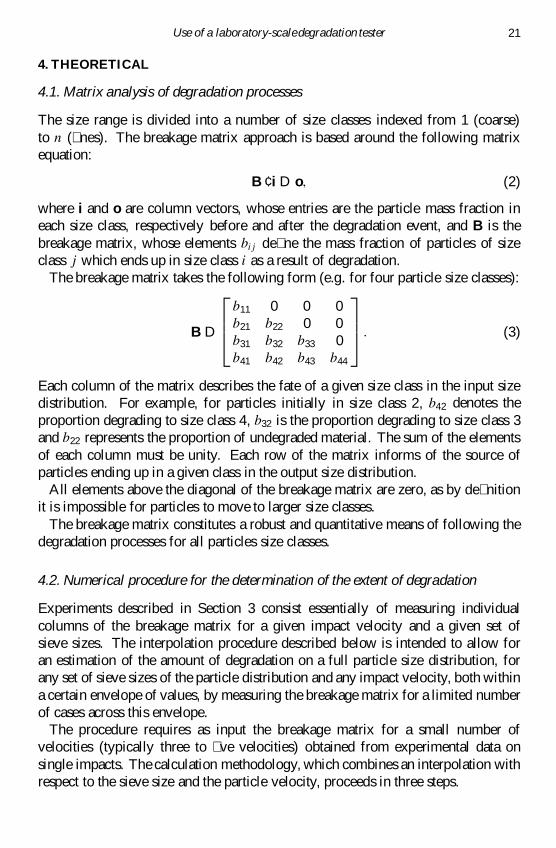
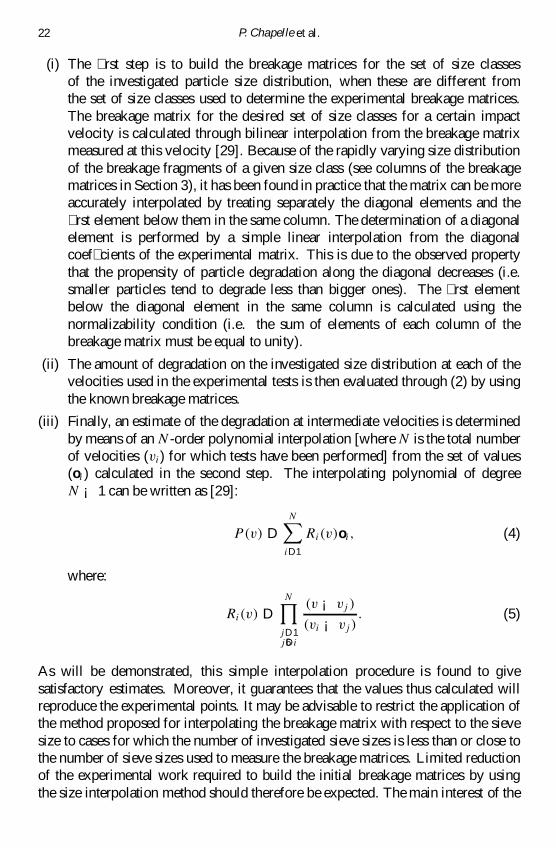
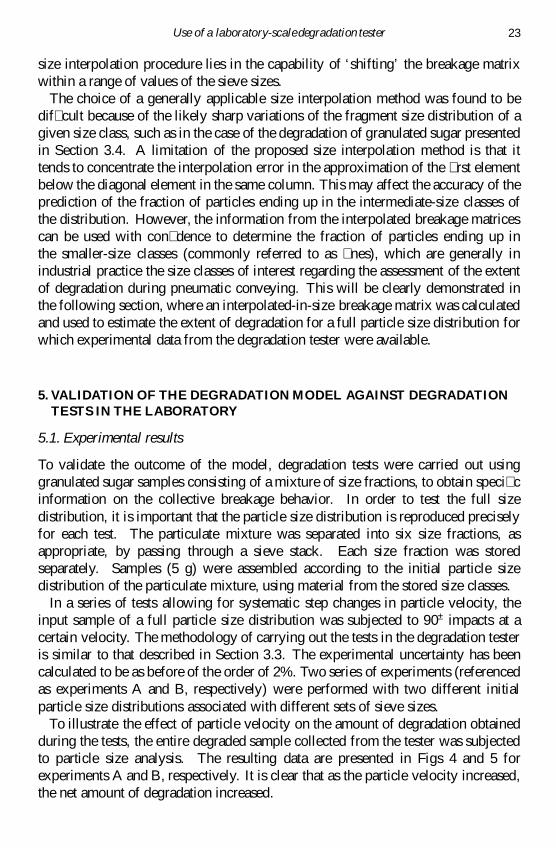
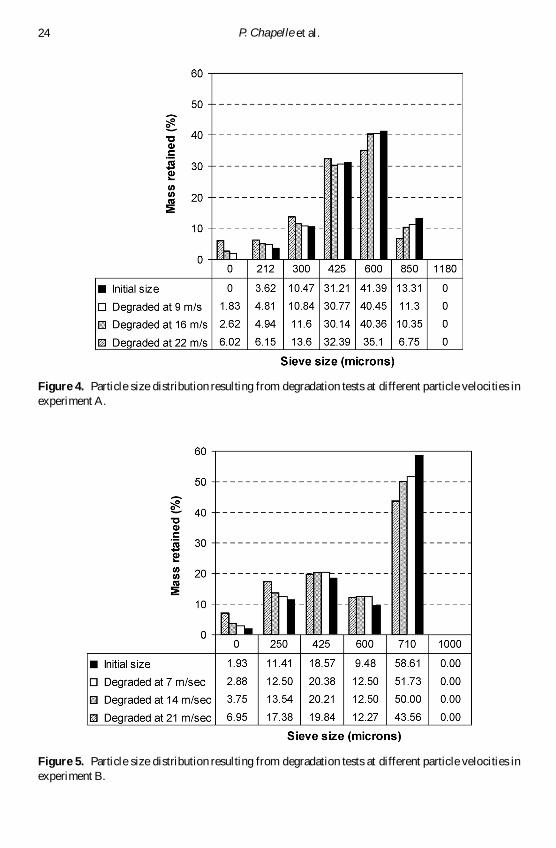
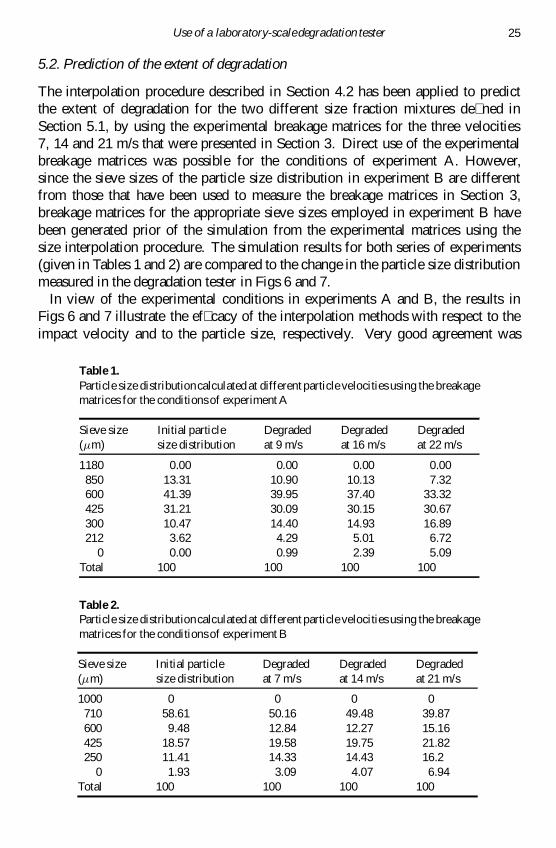
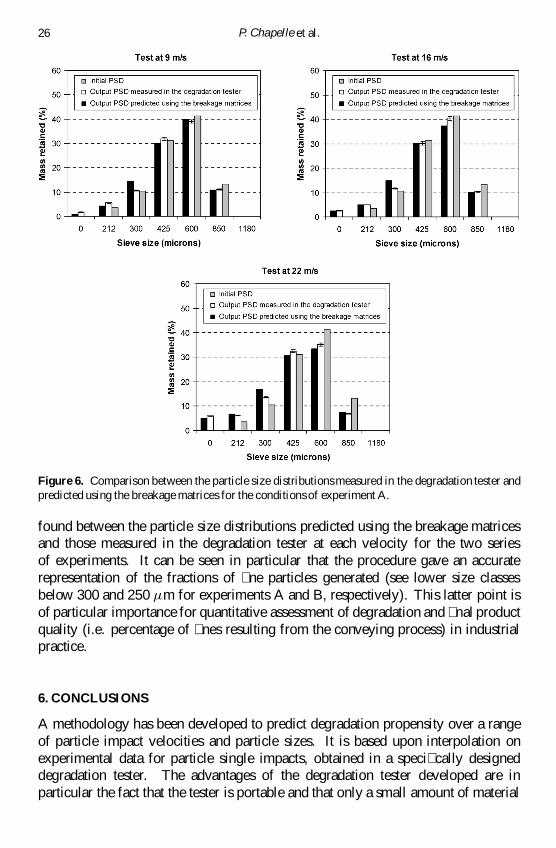
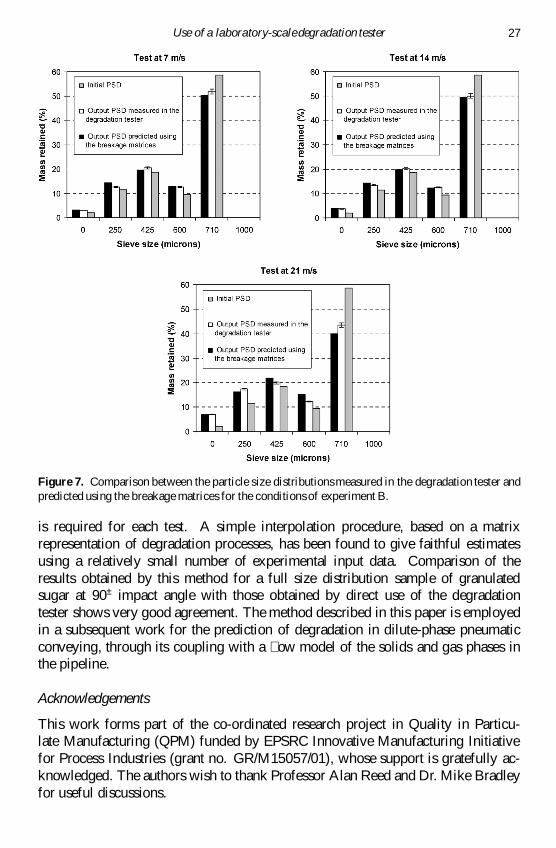
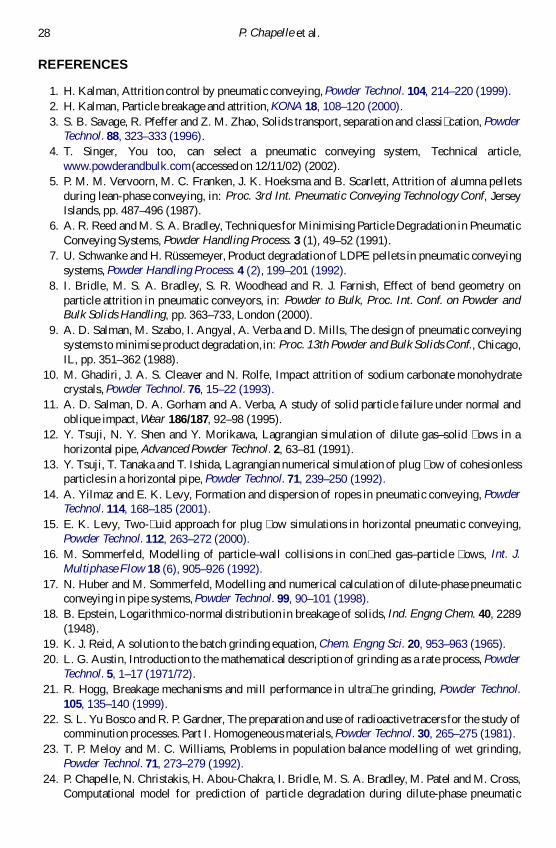