Embed Size (px)
Citation preview
Computers for Schools: Sustainability Assessment of Supply Strategies in Developing Countries
A case study in Colombia
Department of Environmental Science Swiss Federal Institute of Technology Zürich (ETH)
MASTER THESIS
Christian Marthaler
April 2008
Supervision
Prof. Stefanie Hellweg Institute of Environmental Engineering, ETH Zürich
Heinz Böni
Sustainable Technology Cooperation, EMPA

“Too poor not to invest in information and communication technology.”
Meles Zenawi Asres, Prime Minister of Ethiopia

Acknowledgment I would like to express my gratitude to all the people that supported me in one way or the other. Special thanks goes to… …Heinz Böni for enabling me to conduct this study, faith and a fantastic support …Stefanie Hellweg for the supervision of the thesis …Angel Camacho for taking me under his wings in Colombia …Roland Hischier for being an ever approachable source of expertise …Mauricio Peñalosa Reyes, Guillermo Cristancho y Jaime Prieto for being fastest providers of data in whole Colombia; the interest and support …Mary Lou Jepsen, Sonia Sinanan, James Fairweather and Victor Chao for providing data, interest and cooperation …Nadine Wolf and Dani Ott for their friendship and hospitality …the team at the CNPML for giving me a wonderful introduction into Colombian lifestyle …my two spirits, Sarah and Luk, during the last long nights …Colombia! …last but not least, all the members of Computadores para Educar who welcomed me warmly, showed a lot of interest towards my work and always took their time for my requests

Abstract
The ‘digital divide’, commonly defined as the gap between those who have and do not have access
to computers and the Internet, has been a central issue on the scholastic and political agendas of
new media development. Several private and public initiatives have been launched since the late
1990s in order to overcome this gap and provide computers to schools in developing countries.
In 2000 Colombia initiated a refurbishment program called “Computadores para Educar” (CPE) in
order to supply domestically donated computers to schools.
This study aims to assess the sustainability of the refurbishment program CPE and incorporate
alternative supply strategies. The results should help to facilitate the decision making process,
regarding the implementation of the most appropriate supply strategy for providing computers to
schools.
A material flow analysis (MFA) of the program CPE was carried out. Alternative strategies were
then identified, incorporated and assessed regarding their economic, environmental and social
performance using the method Multi Attribute Utility Theory (MAUT).
The results of the MFA provided new data, regarding the benefits of a combined refurbishment-
recycling system as compared to a recycling system. Taking the Eco-indicator’99 as reference this
study concludes that a refurbished-recycled personal computer (PC) compared to a directly
recycled PC has a 16.8% better environmental performance.
The MAUT assessment shows that the well-established program CPE sets a high standard that will
challenge alternative solutions. This study concludes that the refurbishment of computers of
Colombian origin is the most sustainable strategy. Furthermore it concludes that the ‘XO laptop’,
representing a recent development, is the most cost efficient and second best environmental
solution. However, the non-use of local human resources leads to a lower overall sustainability as
compared to other strategies.
Table of contents List of figures..................................................................................................................................... iii List of tables.......................................................................................................................................v Abbreviations ................................................................................................................................... vii Glossary.......................................................................................................................................... viii Executive Summary .......................................................................................................................... ix
1 Introduction ............................................................................................................................... 1 1.1 The digital divide ............................................................................................................... 1 1.2 Bridging the digital divide with computers ......................................................................... 2 1.3 Problem outline ................................................................................................................. 3 1.4 Research objective............................................................................................................ 4 1.5 Research questions........................................................................................................... 5 1.6 Case study region ............................................................................................................. 6
1.6.1 General information................................................................................................... 6 1.6.2 School system ........................................................................................................... 7 1.6.3 ICT usage.................................................................................................................. 8 1.6.4 E-waste management ............................................................................................. 11
2 Methods .................................................................................................................................. 12 2.1 Material Flow Analysis (MFA).......................................................................................... 12
2.1.1 Definitions................................................................................................................ 12 2.1.2 Mathematical description......................................................................................... 14 2.1.3 System analysis ...................................................................................................... 14
2.2 Scenario analysis ............................................................................................................ 17 2.3 Multi Attribute Utility Theory (MAUT)............................................................................... 18
2.3.1 Mathematical formula of the MAUT......................................................................... 19 2.3.2 Attributes used in the MAUT assessment ............................................................... 19 2.3.3 Economic performance ........................................................................................... 21 2.3.4 Environmental performance .................................................................................... 22 2.3.5 Social performance ................................................................................................. 24 2.3.6 Normalisation of attributes....................................................................................... 24 2.3.7 Weighting of the attributes....................................................................................... 25
2.4 Data collection................................................................................................................. 25
3 Results .................................................................................................................................... 27 3.1 System analysis .............................................................................................................. 27
3.1.1 Computadores Para Educar (CPE) ......................................................................... 27 3.1.2 ComputerAid ........................................................................................................... 35 3.1.3 One Laptop Per Child (OLPC)................................................................................. 35
3.2 Mass flow analysis .......................................................................................................... 37 3.2.1 Model input.............................................................................................................. 37 3.2.2 Model scenarios ...................................................................................................... 48
3.3 Application of the MAUT.................................................................................................. 55 3.3.1 Weighting of the attributes....................................................................................... 55 3.3.2 Economical performance......................................................................................... 56 3.3.3 Environmental performance .................................................................................... 64 3.3.4 Social performance ................................................................................................. 72
3.4 Summary of the results ................................................................................................... 76 3.4.1 Comparison of weighted and unweighted utilities ................................................... 76 3.4.2 The benefits of maintenance ................................................................................... 78 3.4.3 The benefits of refurbishment.................................................................................. 80
4 Discussion............................................................................................................................... 83 4.1 Consolidation and discussion of research....................................................................... 83 4.2 Limitations of the study.................................................................................................... 92
5 Conclusion and Outlook .......................................................................................................... 94
6 Literature ................................................................................................................................. 96
7 Appendix ............................................................................................................................... 100
List of figures
Figure 1: Locating Colombia in the world map Figure 2: Geographical coordination and map of Colombia
Figure 3: Investments per capita in ICT of selected countries in Latin America
Figure 4: Development of the penetration rate of computers per capita in Latin America
Figure 5: Penetration gap of Colombia compared to Latin America
Figure 6: Development of the installed base of computers between 2000 and 2007
Figure 7: Schematic description of a Transfer Coefficient
Figure 8: MFA model scheme
Figure 9: Schematic illustration of the model input data
Figure 10: Illustration of the processes being considered during each life cycle stage
Figure 11: General procedure for the calculation of the Eco-indicator’99
Figure 12: Refurbishment centre in Bogotá
Figure 13: Amount of donated CPUs to each centre of CPE since 2001
Figure 14: Production of refurbished computers at each of the five centres since 2000
Figure 15: Production share of each centre from 2000 to 2006
Figure 16: Flow scheme of the processes at the refurbishment centres
Figure 17: Most likely defect parts after a two year usage at school
Figure 18: A classroom before and after maintenance
Figure 19: Improvised hot wiring technique for separating CRT glass at the CENARE
Figure 20: Photos of a fotomobile, a weather vane and an electronic door
Figure 21: The child-friendly and distinctive design of the ‘XO laptop’
Figure 22: Schematic derivation of the failure rate for computers treated at the CRs
Figure 23: Model scheme of the material flows of the scenarios Ia and Ib
Figure 24: Model scheme of the mass flows of scenario II
Figure 25: Model scheme of the mass flows of scenario III
Figure 26: Model scheme of the mass flows of scenario IV
Figure 27: Model scheme of the mass flows of the scenario Va and Vb
Figure 28: Weighted and unweighted MAUT results of the different scenarios
Figure 29: Comparison of the weighted and unweighted utilities
Figure 30: Environmental performances of the corresponding processes during scenario Ia
Figure 31: Comparison of the environmental performance of scenario Ia and Ib Figure 32: Process distribution of the environmental performance of a refurbished computer
Figure 33: Process distribution of the environmental performance of a recycled computer and a
‘XO laptop’
Figure 34: Comparison of the total environmental performance of a refurbished computer, a
recycled computer and a recycled ‘XO laptop’
iii

iv
List of tables
Table 1: Indicators of the ICT development of Colombia and selected countries/regions
Table 2: Average weight of a CPU, CRT monitor, keyboard and mouse
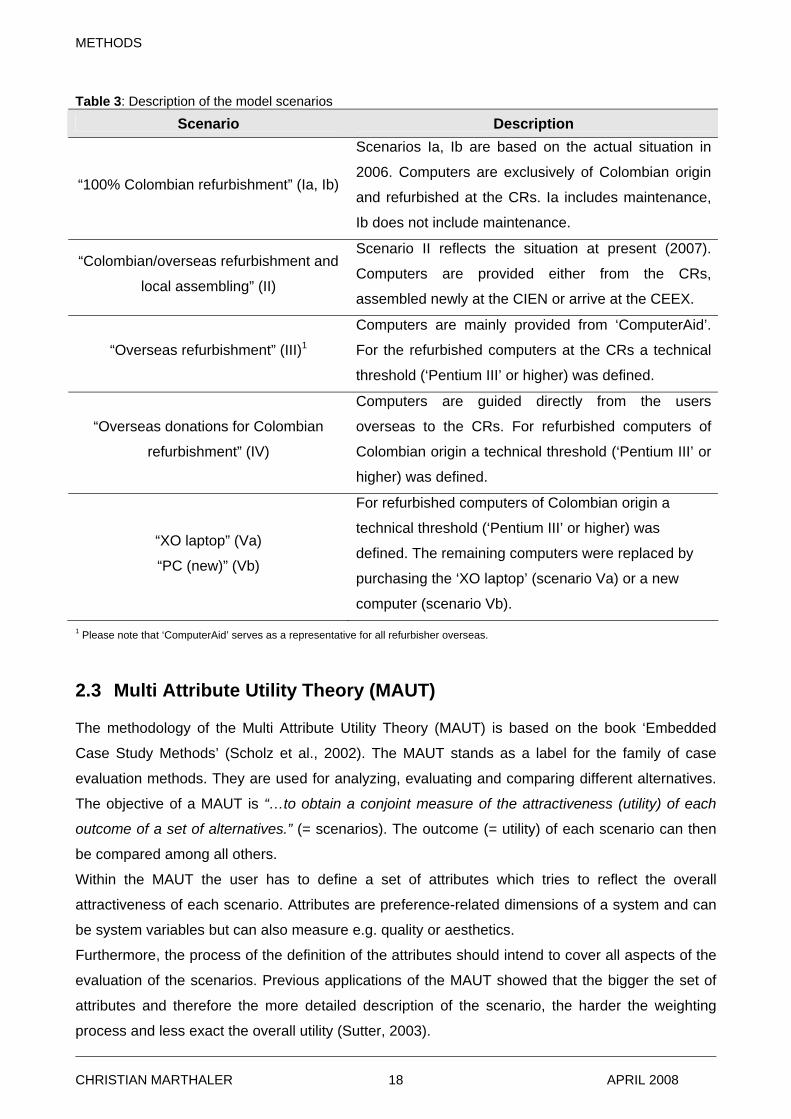
Table 3: Description of the model scenarios
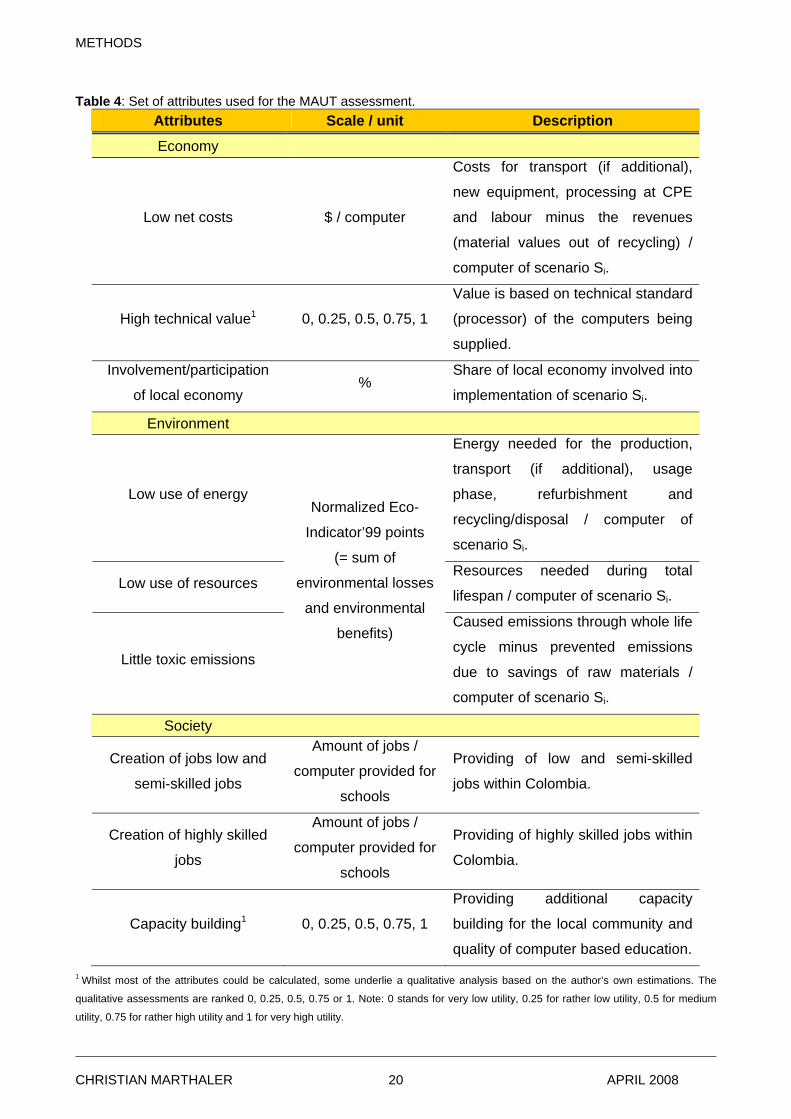
Table 4: Set of attributes used for the MAUT assessment
Table 5: Allocated weights for the sustainability attributes
Table 6: Different technical standards at the CRs
Table 7: Specification of the required parts and components during the process CR, Maintenance
and ‘ComputerAid’
Table 8: The apportionments of the standards in unit and % during the production at the CRB
Table 9: Illustration of the assumed lifespan of a computer in a certain scenario
Table 10: Overview of used transfer coefficients
Table 11: Transfer coefficients of ‘level two’ and ‘level three’ materials and their further destination
after the dismantling of a CRT monitor
Table 12: Transfer coefficients of ‘level two’ and ‘level three’ materials and their further destination
after the dismantling of a keyboard
Table 13: Transfer coefficients of ‘level two’ and ‘level three’ materials and their further destination
after the dismantling of a mouse
Table 14: Transfer coefficients of ‘level two’ and ‘level three’ materials and their further destination
after the dismantling process of a CPU
Table 15: Transfer coefficients of materials ‘level two’ and ‘level three’ and their further destination
after the dismantling of an ‘XO laptop’
Table 16: Material flows ‘level one’ for each scenario
Table 17: Result of the weighting process of the attributes and the weightings applied in the MAUT
Table 18: Description of the costs taken into account and corrections made to determine the
attribute ‘low net costs’
Table 19: Overview of the production costs (in US$) per unit computer depending on its origin
Table 20: Overview of further costs (in US $) per unit computer
Table 21: Revenues and costs for the dismantling processes at the CENARE
Table 22: Overview of the overall costs of each scenario
Table 23: Percentages of the technical standard of each scenario
Table 24: Involvement/participation of the local economy for each scenario
Table 25: Electricity use at the CIEN, CEEX, CRs and CENARE per unit
Table 26: Usage times at school depending on the derivation of the electricity
Table 27: Minima and maxima of electricity use of a computer without screen, a CRT monitor and
the XO laptop
v
Table 28: Derivation of the electricity of selected schools all over Colombia
Table 29: Overview of transports taken into account for calculating the environmental
performance.
Table 30: Environmental performance of each scenario
Table 31: Overview of low and semi-skilled jobs being considered
Table 32: Created low and semi-skilled jobs per scenario
Table 33: Overview of highly skilled jobs being considered
Table 34: Created highly skilled jobs per scenario
Table 35: Qualitatively assessed utilities of the attribute capacity building
vi
Abbreviations
CEEX Centro de Equipos del Exterior
CENARE Centro Nacional del Aprovechamiento de Residuos Electrónicos
CIEN Centro de Integración de Equipos Nuevos
CPE Computadores para Educar, www.computadoresparaeducar.gov.co
CPU Central Processing Unit
CRB Centro de Reacondicionamiento de Bogotá
CRBQ Centro de Reacondicionamiento de Baranquilla
CRC Centro de Reacondicionamiento de Cali
CRCB Centro Regional del Convenio de Basilea
CRCU Centro de Reacondicionamiento de Cúcuta
CRM Centro de Reacondicionamiento de Medellín
CRs Centros de Reacondicionamiento (Refurbishment Centres)
CRT Cathode Ray Tube
EEE Electrical and Electronic Equipment
EMPA Swiss Federal Laboratories for Materials Testing and Research, www.empa.ch
GDP Gross Domestic Product
ICT Information and Communications Technology
IDC International Data Corporation, www.idc.com
LAC Latin America and the Caribbean
LCD Liquid Crystal Display
MAUT Multi Attribute Utility Theory
MAVDT Ministerio de Ambiente, Vivienda y Desarrollo Territorial, www.minambiente.gov.co
MFA Material Flow Analysis
MIT Massachusetts Institute of Technology, http://web.mit.edu
OECD Organisation for Economic Co-operation and Development, www.oecd.org
OLPC One Laptop Per Child, www.laptop.org, http://wiki.laptop.org
PC Personal Computer
PWB Printed Wiring Board
RoHS Directive on the Restriction of the Use of Certain Hazardous Substances in EEE
SENA Servicio Nacional de Aprendizaje, www.sena.edu.co
SUSTEC Sustainable Technology Cooperation, www.empa.ch/sustec
vii
Glossary
Assembling Fitting together parts and pieces of a computer
Disassembling Taking apart parts and pieces of a computer
Dismantling Synonym for disassembling (see above)
E-waste Waste of electrical and electronic equipment
Maintenance Technical upkeep of a personal computer (PC) which includes servicing and
repair. It usually takes place after a two year usage of a PC at schools and
prolongs the lifespan for another two years
Normalizing Bringing different scales into one standard or norm in order to make them
comparable
Overseas Synonym for North America and Europe
Recycling Process that allows the reuse of material as secondary raw material after the
disassembling of a product
Refurbishment Renovation and restoration of a computer. Can include cleaning and technical
maintenance. Allows a re-use of the computer
Utility Attractiveness of a certain scenario/strategy. 1 implies the highest possible
attractiveness, 0 the least.
viii
Executive Summary
Introduction
Deployed in many different ways, technology is seen as one of the main sources of human
prosperity, progress and rationalization. The benefits of technological development and its range of
applications seem boundless. Yet due to lack of access and competence not all profit equally from
new technologies. Since the mid-1990s this gap between those who have, and do not have access
has been labelled as the ‘digital divide’.
An extended research has been carried out to identify the reasons it exists (Pinkett 2003; Chinn
and Fairlie 2006; van Dijek 2006) and to offer advice regarding which policies would be best
implemented in order to narrow the gap (Mariscal, 2005). For all conducted studies the cost
seemed to be a crucial element in bridging the gap. Once the reasons were identified, possible
solutions were suggested. James (2000) stated that “…costs of computers used in developing
countries can be reduced in two main ways, the first of which is by extending the lives of existing
models and the second of which is by designing entirely new products”. He anticipated what has
become reality today.
‘One Laptop Per Child’ (OLPC) designed a low cost laptop, the so-called ‘XO laptop’ in order to
supply huge quantities to schools in developing countries. Refurbishing programs like
‘ComputerAid’, ‘Close the Gap’ or ‘World Computer Exchange’ ship computers from developed to
developing countries for reuse. All with the vision of bridging the digital divide.
But what happens after the solutions are implemented? Or as Smith (2004) put it “…the issues is
not whether we should or should not use computers for educational purposes, rather, the issue is
how computers are manufactured, used, and ultimately disposed of.”.
He brings up what has been an open question and idle research field. Once the delivered
computers reach their ‘end-of-life’ they turn into ‘e-waste’1. According to Widmer et al. (2005) ‘e-
waste’ contains hazards such as lead, mercury, arsenic or flame retardants, to name only a few
and can cause damage to the environment and human health if not treated in an appropriate way.
It is therefore of crucial importance to investigate the environmental sustainability of different
strategies aiming to bridge the ‘digital divide’.
In 2000 Colombia took the matter of narrowing the gap into its own hands by launching the
refurbishment program ‘Computadores para Educar’ (CPE). CPE is a governmental organization
that refurbishes domestically donated computers and distributes them to schools all over the
country.
1 E-waste is “any appliance using an electric power supply that has reached its end-of-life” as defined by the Organisation for Economic Co-operation and Development (OECD 2001).
ix
Objective of the study
This study aims to investigate the sustainability of different strategies to supply computers to
schools in Colombia. New findings regarding the benefits of refurbishing a personal computer (PC)
should be acquired additionally. Cooperation with CPE was established and the following research
questions defined:
A What are the exact material flows of the refurbishment program CPE?
B What are possible alternative scenarios to provide a sufficient supply of computers to
schools in Colombia?
C What are the involved costs of each of these scenarios?
D What are the critical stages during the life cycle of a refurbished and recycled computer
regarding the environmental impact?
E Which of the scenarios has the best performance regarding its economic, environmental
and social impacts?
Methods
A material flow analysis (MFA) has been used as the method to estimate the material flows of
CPE. The flows of a CPU, CRT monitor, keyboard and mouse were investigated. Parts and
components during the refurbishment were quantified, as well as the resulting materials after the
dismantling process.
In order to assess the sustainability of different scenarios, the Multi Attribute Utility Theory (MAUT)
was chosen as the default method. The MAUT requires a set of attributes (see also figure 2)
encompassing the desired aspects of the problem being assessed. To allow subjective
preferences they undergo a stakeholder weighting. Once all scenarios have been rated according
to each of the attributes, the MAUT composes the ratings and realizes a synthesis resulting in a
one-dimensional utility measure.
Within the MAUT the environmental performance was assessed with a Life Cycle Analysis (LCA)
and further evaluated with the Eco-indicator’99 (figure 3). This allowed the identification of critical
life cycle stages. Stages are: the production, use, refurbishment, transport, recycling and disposal
(figure 1).
Results
As the functional unit for all scenarios the supply of 46’000 computers, for a usage time of five
years at schools, was defined. The number is based on the Colombian government’s goal to
reduce the ratio of pupils per computer to 20:1 from the present ratio of 40:1.
x
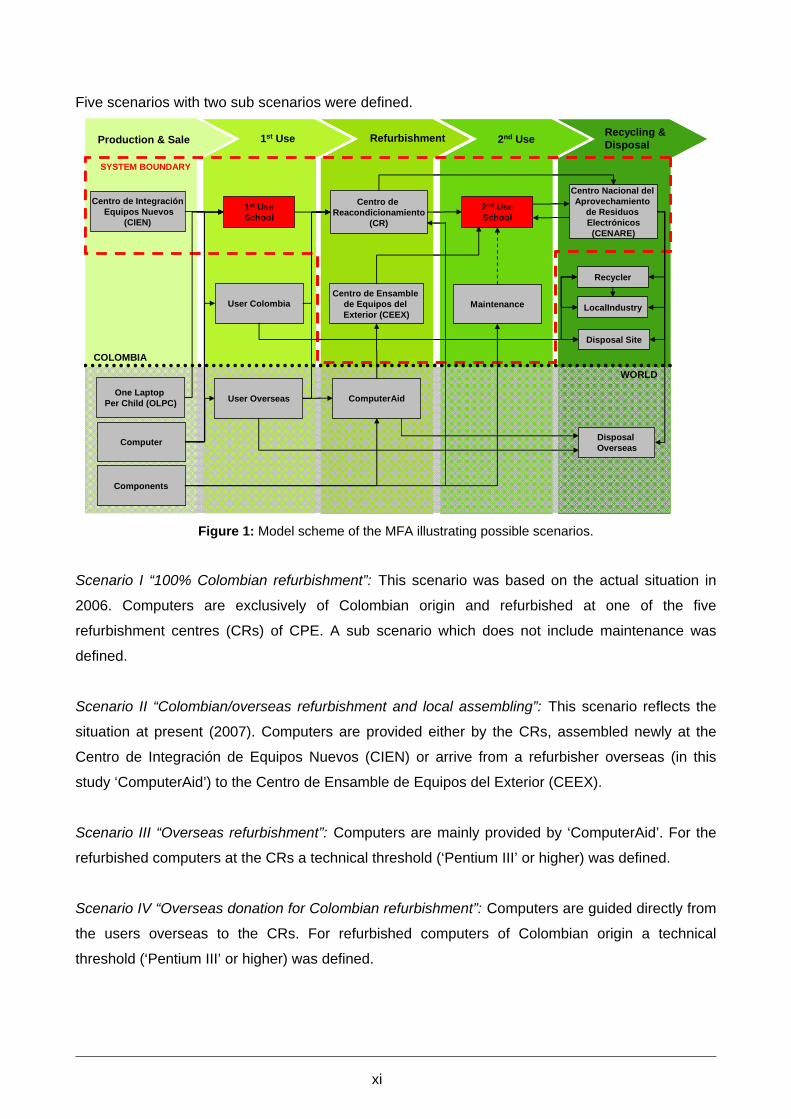
Five scenarios with two sub scenarios were defined.
Recycling &DisposalProduction & Sale
1st UseSchool
1st Use Refurbishment
Centro de IntegraciónEquipos Nuevos
(CIEN)
One Laptop Per Child (OLPC)
2nd Use
Centro Nacional del Aprovechamiento
de Residuos Electrónicos(CENARE)
LocalIndustry
Disposal Site
Recycler
Centro de Reacondicionamiento
(CR)
2nd UseSchool
Centro de Ensamblede Equipos del Exterior (CEEX)
DisposalOverseas
Components
Computer
User Overseas
User Colombia
ComputerAid
Maintenance
COLOMBIA
WORLD
SYSTEM BOUNDARY
Recycling &DisposalProduction & Sale
1st UseSchool
1st Use Refurbishment
Centro de IntegraciónEquipos Nuevos
(CIEN)
One Laptop Per Child (OLPC)
2nd Use
SYSTEM BOUNDARY
Centro Nacional del Aprovechamiento
de Residuos Electrónicos(CENARE)
LocalIndustry
Disposal Site
Recycler
Centro de Reacondicionamiento
(CR)
2nd UseSchool
Centro de Ensamblede Equipos del Exterior (CEEX)
User Colombia Maintenance
COLOMBIA
WORLD
ComputerAidUser Overseas
DisposalOverseasComputer
Components
Figure 1: Model scheme of the MFA illustrating possible scenarios.
Scenario I “100% Colombian refurbishment”: This scenario was based on the actual situation in
2006. Computers are exclusively of Colombian origin and refurbished at one of the five
refurbishment centres (CRs) of CPE. A sub scenario which does not include maintenance was
defined.
Scenario II “Colombian/overseas refurbishment and local assembling”: This scenario reflects the
situation at present (2007). Computers are provided either by the CRs, assembled newly at the
Centro de Integración de Equipos Nuevos (CIEN) or arrive from a refurbisher overseas (in this
study ‘ComputerAid’) to the Centro de Ensamble de Equipos del Exterior (CEEX).
Scenario III “Overseas refurbishment”: Computers are mainly provided by ‘ComputerAid’. For the
refurbished computers at the CRs a technical threshold (‘Pentium III’ or higher) was defined.
Scenario IV “Overseas donation for Colombian refurbishment”: Computers are guided directly from
the users overseas to the CRs. For refurbished computers of Colombian origin a technical
threshold (‘Pentium III’ or higher) was defined.
xi
Scenario Va “XO laptop”, Vb “Purchase PC (new)”: For refurbished computers of Colombian origin
a technical threshold (‘Pentium III’ or higher) was defined. The remaining computers were replaced
by purchasing the ‘XO laptop’ (scenario Va) or a new computer (scenario Vb).
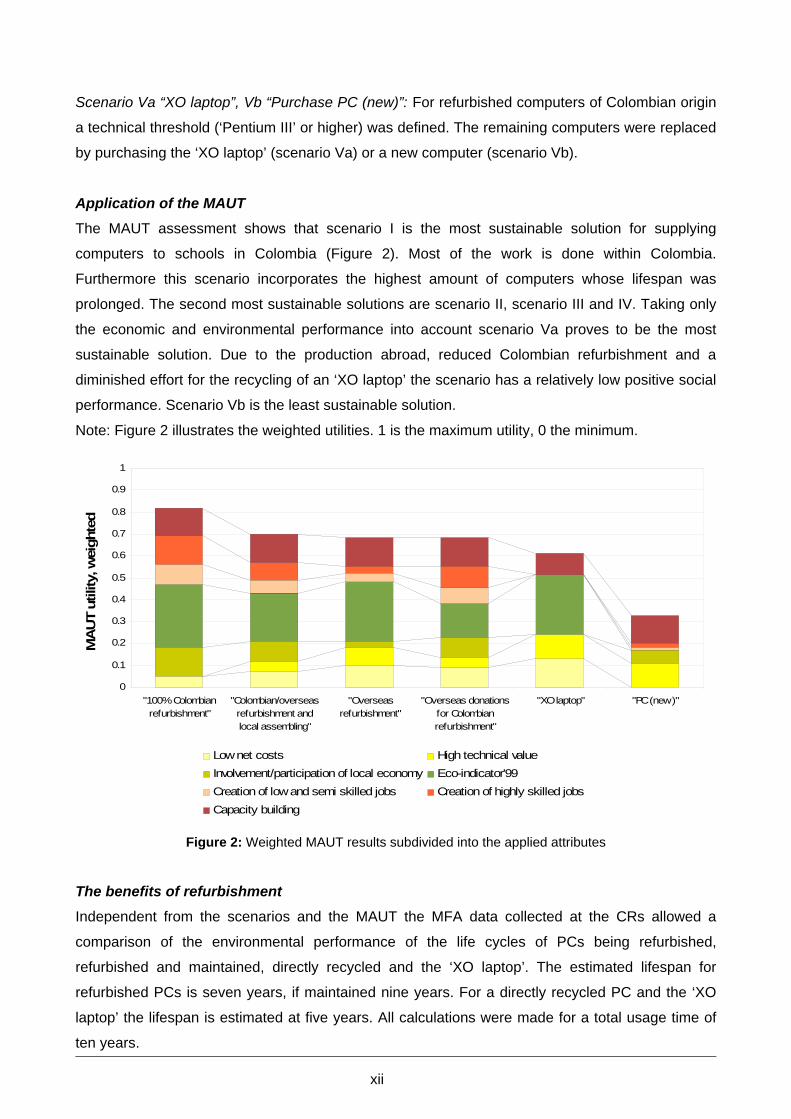
Application of the MAUT
The MAUT assessment shows that scenario I is the most sustainable solution for supplying
computers to schools in Colombia (Figure 2). Most of the work is done within Colombia.
Furthermore this scenario incorporates the highest amount of computers whose lifespan was
prolonged. The second most sustainable solutions are scenario II, scenario III and IV. Taking only
the economic and environmental performance into account scenario Va proves to be the most
sustainable solution. Due to the production abroad, reduced Colombian refurbishment and a
diminished effort for the recycling of an ‘XO laptop’ the scenario has a relatively low positive social
performance. Scenario Vb is the least sustainable solution.
Note: Figure 2 illustrates the weighted utilities. 1 is the maximum utility, 0 the minimum.
0
0.1
0.2
0.3
0.4
0.5
0.6
0.7
0.8
0.9
1
"100% Colombianrefurbishment"
"Colombian/overseasrefurbishment andlocal assembling"
"Overseasrefurbishment"
"Overseas donationsfor Colombianrefurbishment"
"XO laptop" "PC (new)"
MA
UT
utili
ty, w
eigh
ted
Low net costs High technical valueInvolvement/participation of local economy Eco-indicator'99Creation of low and semi skilled jobs Creation of highly skilled jobsCapacity building
Figure 2: Weighted MAUT results subdivided into the applied attributes
The benefits of refurbishment
Independent from the scenarios and the MAUT the MFA data collected at the CRs allowed a
comparison of the environmental performance of the life cycles of PCs being refurbished,
refurbished and maintained, directly recycled and the ‘XO laptop’. The estimated lifespan for
refurbished PCs is seven years, if maintained nine years. For a directly recycled PC and the ‘XO
laptop’ the lifespan is estimated at five years. All calculations were made for a total usage time of
ten years.
xii
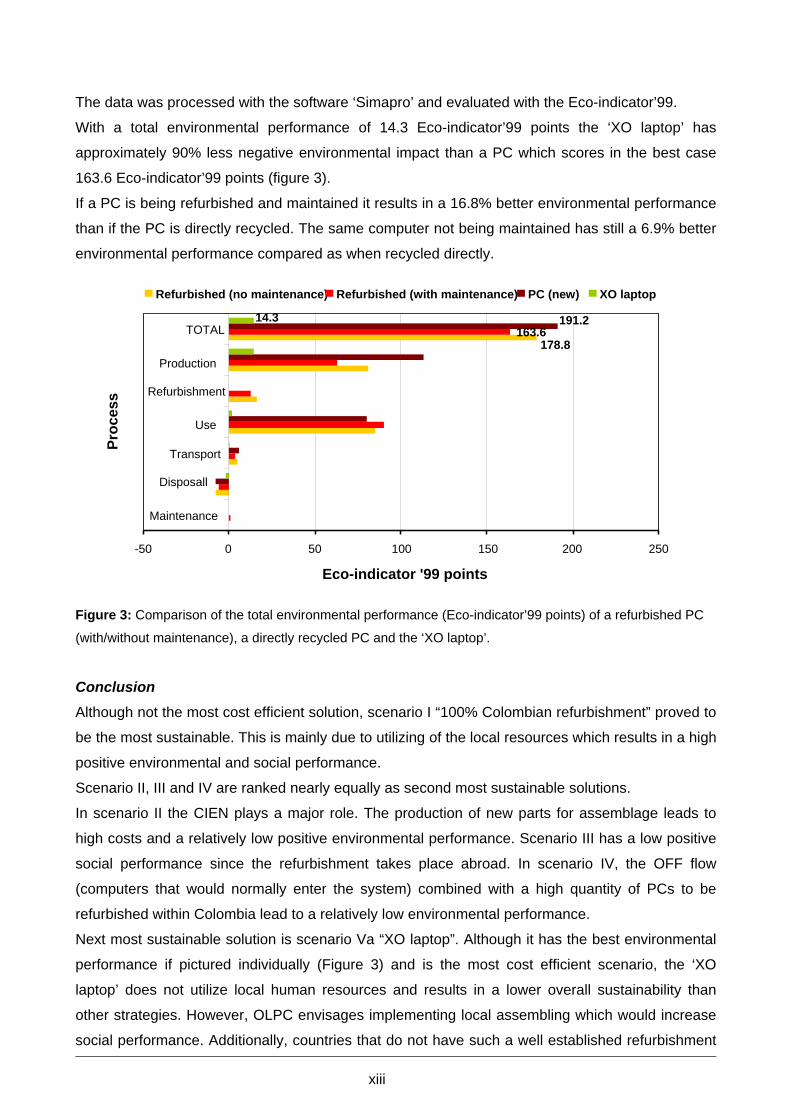
The data was processed with the software ‘Simapro’ and evaluated with the Eco-indicator’99.
With a total environmental performance of 14.3 Eco-indicator’99 points the ‘XO laptop’ has
approximately 90% less negative environmental impact than a PC which scores in the best case
163.6 Eco-indicator’99 points (figure 3).
If a PC is being refurbished and maintained it results in a 16.8% better environmental performance
than if the PC is directly recycled. The same computer not being maintained has still a 6.9% better
environmental performance compared as when recycled directly.
178.8 163.6
191.2 14.3
-50 0 50 100 150 200 250
Maintenance
Disposall
Transport
Use
Refurbishment
Production
TOTAL
Proc
ess
Eco-indicator '99 points
Refurbished (no maintenance) Refurbished (with maintenance) PC (new) XO laptop
Figure 3: Comparison of the total environmental performance (Eco-indicator’99 points) of a refurbished PC
(with/without maintenance), a directly recycled PC and the ‘XO laptop’.
Conclusion
Although not the most cost efficient solution, scenario I “100% Colombian refurbishment” proved to
be the most sustainable. This is mainly due to utilizing of the local resources which results in a high
positive environmental and social performance.
Scenario II, III and IV are ranked nearly equally as second most sustainable solutions.
In scenario II the CIEN plays a major role. The production of new parts for assemblage leads to
high costs and a relatively low positive environmental performance. Scenario III has a low positive
social performance since the refurbishment takes place abroad. In scenario IV, the OFF flow
(computers that would normally enter the system) combined with a high quantity of PCs to be
refurbished within Colombia lead to a relatively low environmental performance.
Next most sustainable solution is scenario Va “XO laptop”. Although it has the best environmental
performance if pictured individually (Figure 3) and is the most cost efficient scenario, the ‘XO
laptop’ does not utilize local human resources and results in a lower overall sustainability than
other strategies. However, OLPC envisages implementing local assembling which would increase
social performance. Additionally, countries that do not have such a well established refurbishment
xiii
program the situation would have to be assessed differently. Further research has to be done
regarding small scale refurbishment in combination with the ‘XO laptop’.
xiv
INTRODUCTION
1 Introduction
Technological development is the embodiment of modern society. Deployed in many different ways
technology is seen as one of the main sources of human prosperity, progress and rationalization.
Enthusiasm over its anticipated benefits appears boundless.
The technological development runs parallel with the modernization of our society and is
considered as the dynamic element of its development. It offers an endless range of new
possibilities and conveniences and the scope of its applications is growing daily. Yet due to lack of
access and competence not all profit equally from new technologies. This gap between those who
have and do not have access is labelled as the ‘digital divide’.
1.1 The digital divide
The term ‘digital divide’ came into regular usage in the mid-1990s and referred initially to the
discrepancy in the ownership of personal computers (PCs) between groups. According to a
definition by the OECD (2001) ‘digital divide’ refers to “…the gap between individuals, households,
business and geographic areas at different socio-economic levels with regard both to their
opportunities to access information technologies (ITs)2 and to their use of the Internet for a wide
variety of activities”.
Since the birth of the term, extended investigations were dedicated to analyse the structure of and
reasons for the ‘digital divide’ (Pinkett 2003; Chinn and Fairlie 2006; van Dijek 2006).
Until recently research in this field predominantly focussed on the imbalances of material access,
lately the main focus was also put on the imbalances in resources, skills and motivational access
(van Dijek, 2006). However, the following study assesses strategies aiming to overcome the
material (physical) access.
Many of the studies identified a strong positive relationship between technology use and income,
across and within countries (OECD, 2001; US Department of Commerce, 2002). According to
Chinn et al. (2006) the differences in income explain approximately 50% of the penetration gap
(except for Europe and Central Asia). Other reasons are telecommunication infrastructure, human
capital (measured by the years of schooling) or regulatory quality (Chinn, 2006; Dasgupta, 2001).
2 IT (information technology) is a term that encompasses all forms of technology used to create, store, exchange, and use information in its various forms (business data, voice conversations, still images, motion pictures, multimedia presentations, and other forms, including those not yet conceived). It's a convenient term for including both telephony and computer technology in the same word. It is the technology that is driving what has often been called "the information revolution". See also http://searchdatacenter.techtarget.com/sDefinition/0,,sid80_gci214023,00.html
CHRISTIAN MARTHALER APRIL 2008 1
INTRODUCTION
Requests for the providing of low-cost information technology already arose at the beginning of the
new millennium. A summary report of the International Millennium Conference on information
technology and development held in India 2000 recognized that,
“…while there have been very significant advances in telecom-related science in recent decades,
most of these in developed countries have focussed on providing better services and greater
bandwith to the user at a constant cost which is affordable to most in these countries. The
requirement in developing countries is, however, significantly different: to provide lower-cost basic
access”.
There is no consensus among the academic literature, regarding the appropriate policy to
implement in order to achieve higher IT penetration in developing countries. While some argue that
the market alone will take care of any perceived disparities, others think that governments should
implement policies that subsidize access in some fashion (Mariscal, 2005).
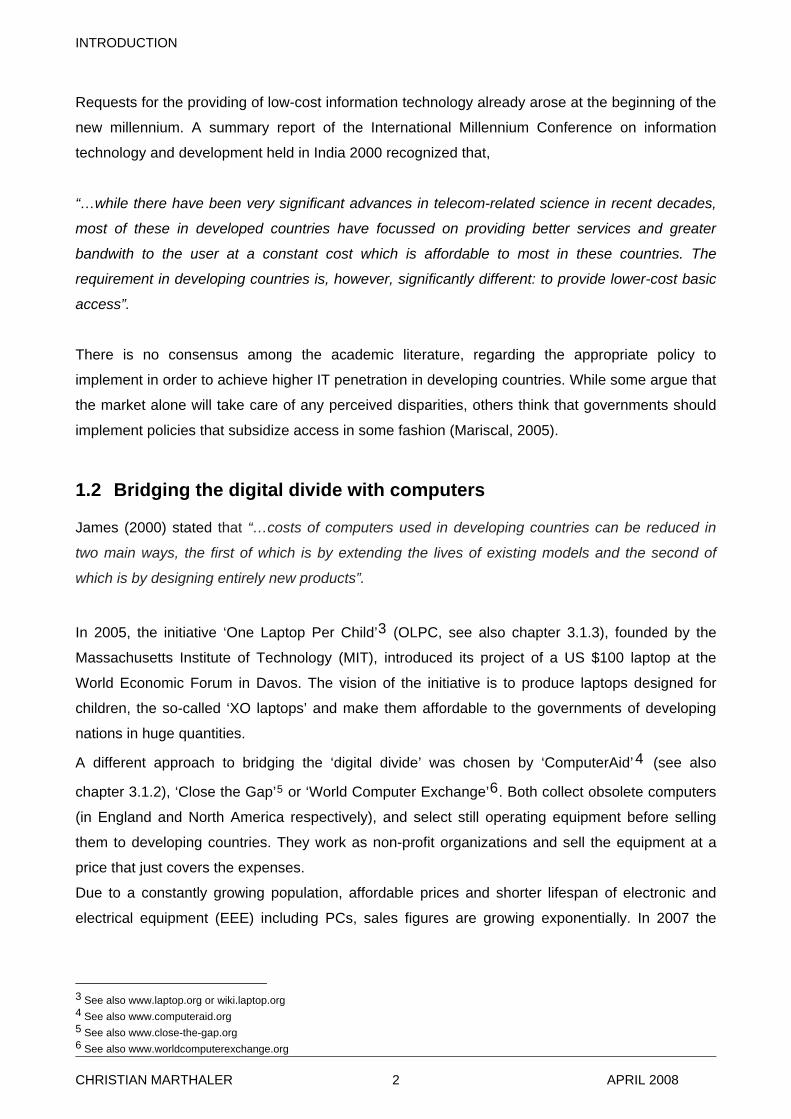
1.2 Bridging the digital divide with computers
James (2000) stated that “…costs of computers used in developing countries can be reduced in
two main ways, the first of which is by extending the lives of existing models and the second of
which is by designing entirely new products”.
In 2005, the initiative ‘One Laptop Per Child’3 (OLPC, see also chapter 3.1.3), founded by the
Massachusetts Institute of Technology (MIT), introduced its project of a US $100 laptop at the
World Economic Forum in Davos. The vision of the initiative is to produce laptops designed for
children, the so-called ‘XO laptops’ and make them affordable to the governments of developing
nations in huge quantities.
A different approach to bridging the ‘digital divide’ was chosen by ‘ComputerAid’4 (see also
chapter 3.1.2), ‘Close the Gap’5 or ‘World Computer Exchange’6. Both collect obsolete computers
(in England and North America respectively), and select still operating equipment before selling
them to developing countries. They work as non-profit organizations and sell the equipment at a
price that just covers the expenses.
Due to a constantly growing population, affordable prices and shorter lifespan of electronic and
electrical equipment (EEE) including PCs, sales figures are growing exponentially. In 2007 the
3 See also www.laptop.org or wiki.laptop.org 4 See also www.computeraid.org 5 See also www.close-the-gap.org 6 See also www.worldcomputerexchange.org
CHRISTIAN MARTHALER APRIL 2008 2
INTRODUCTION
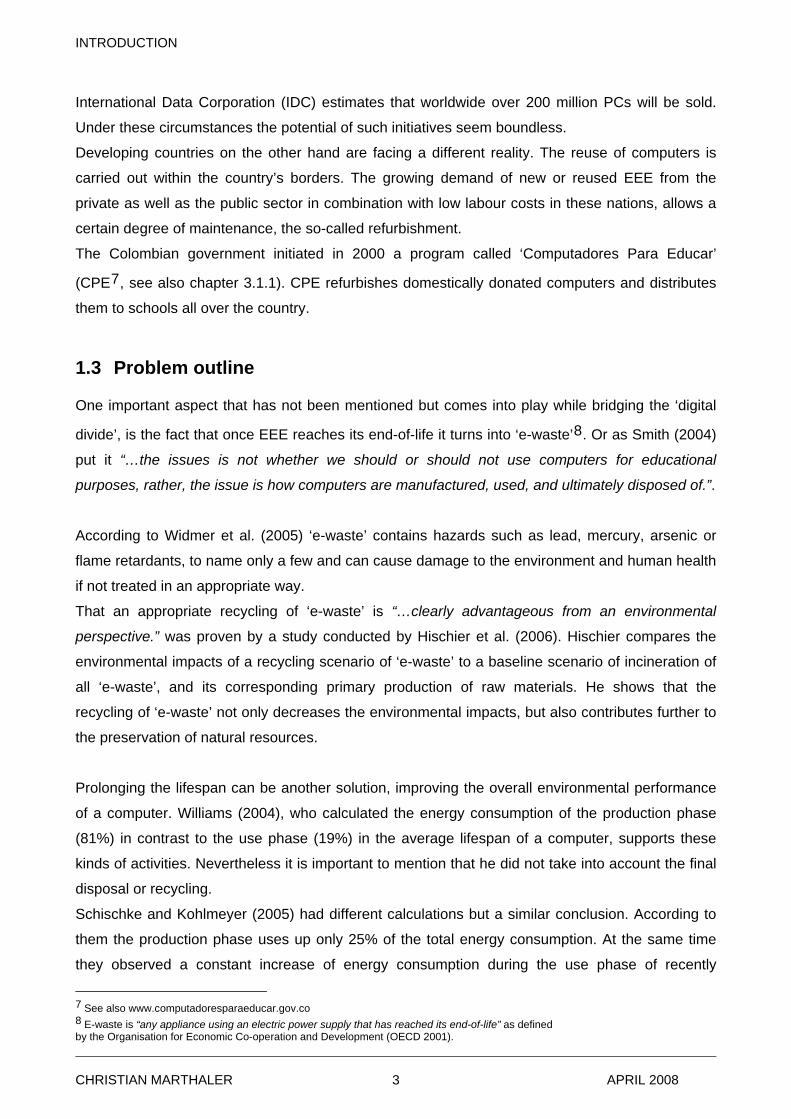
International Data Corporation (IDC) estimates that worldwide over 200 million PCs will be sold.
Under these circumstances the potential of such initiatives seem boundless.
Developing countries on the other hand are facing a different reality. The reuse of computers is
carried out within the country’s borders. The growing demand of new or reused EEE from the
private as well as the public sector in combination with low labour costs in these nations, allows a
certain degree of maintenance, the so-called refurbishment.
The Colombian government initiated in 2000 a program called ‘Computadores Para Educar’
(CPE7, see also chapter 3.1.1). CPE refurbishes domestically donated computers and distributes
them to schools all over the country.
1.3 Problem outline
One important aspect that has not been mentioned but comes into play while bridging the ‘digital
divide’, is the fact that once EEE reaches its end-of-life it turns into ‘e-waste’8. Or as Smith (2004)
put it “…the issues is not whether we should or should not use computers for educational
purposes, rather, the issue is how computers are manufactured, used, and ultimately disposed of.”.
According to Widmer et al. (2005) ‘e-waste’ contains hazards such as lead, mercury, arsenic or
flame retardants, to name only a few and can cause damage to the environment and human health
if not treated in an appropriate way.
That an appropriate recycling of ‘e-waste’ is “…clearly advantageous from an environmental
perspective.” was proven by a study conducted by Hischier et al. (2006). Hischier compares the
environmental impacts of a recycling scenario of ‘e-waste’ to a baseline scenario of incineration of
all ‘e-waste’, and its corresponding primary production of raw materials. He shows that the
recycling of ‘e-waste’ not only decreases the environmental impacts, but also contributes further to
the preservation of natural resources.
Prolonging the lifespan can be another solution, improving the overall environmental performance
of a computer. Williams (2004), who calculated the energy consumption of the production phase
(81%) in contrast to the use phase (19%) in the average lifespan of a computer, supports these
kinds of activities. Nevertheless it is important to mention that he did not take into account the final
disposal or recycling.
Schischke and Kohlmeyer (2005) had different calculations but a similar conclusion. According to
them the production phase uses up only 25% of the total energy consumption. At the same time
they observed a constant increase of energy consumption during the use phase of recently
7 See also www.computadoresparaeducar.gov.co 8 E-waste is “any appliance using an electric power supply that has reached its end-of-life” as defined by the Organisation for Economic Co-operation and Development (OECD 2001).
CHRISTIAN MARTHALER APRIL 2008 3
INTRODUCTION
released computers. Contrasting a computer with an average lifespan of four years to a computer
being reused (life prolonging of two years), they calculated a decreased energy consumption of
11% (or 900 kWh) over the period of 12 years (two lifespan of a reused computer). However, the
study of Schischke and Kohlmeyer (2005) does not mention a technical maintenance for the reuse.
At present Smith (2004) conducted the only study known to the author, that investigates computer
based education from an environmental point of view. However, he only compared traditional (pen
and paper) with digital (computer) learning at the small scale of a classroom, applying the
‘ecological footprint’9.
This study takes the topic of how sustainable computer based education is to a complete new
level. By analysing the refurbishment program CPE in Colombia the study provides new findings
regarding the benefits of extending the lifespan of a computer. Furthermore the study aims to fill
the gap of research assessing the sustainability of different strategies recently being launched and
traditional ideas of how to supply schools in developing countries with computers.
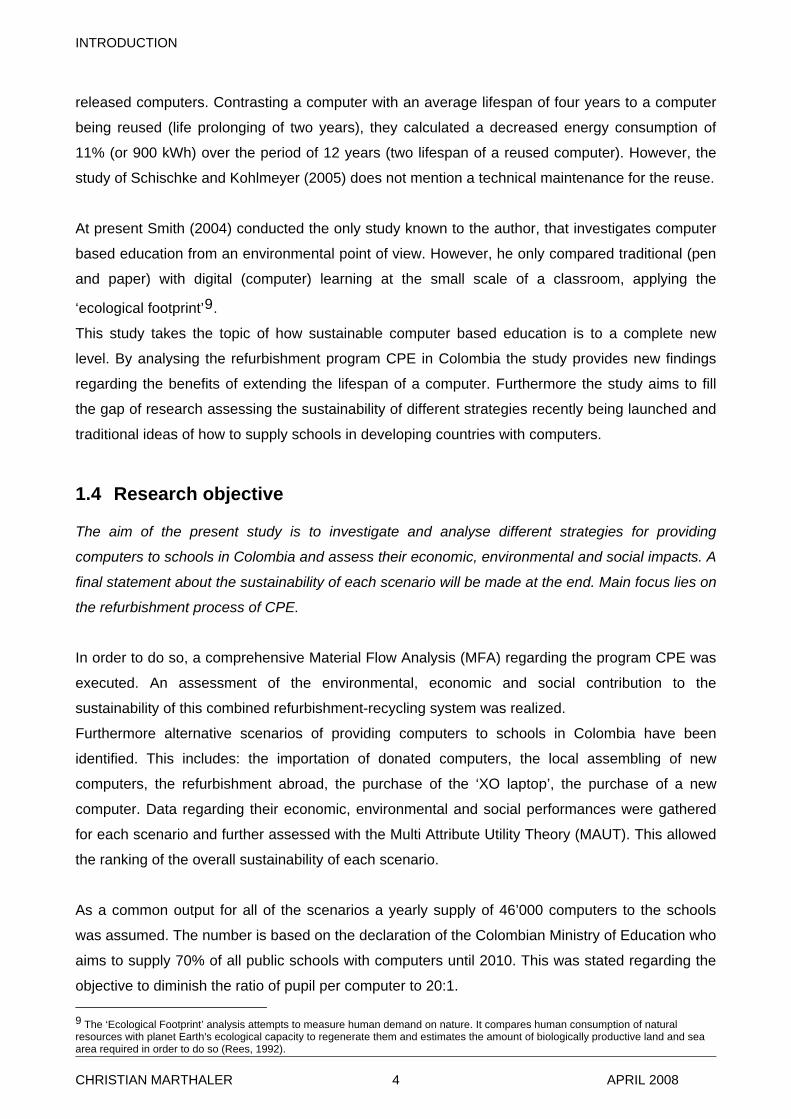
1.4 Research objective
The aim of the present study is to investigate and analyse different strategies for providing
computers to schools in Colombia and assess their economic, environmental and social impacts. A
final statement about the sustainability of each scenario will be made at the end. Main focus lies on
the refurbishment process of CPE.
In order to do so, a comprehensive Material Flow Analysis (MFA) regarding the program CPE was
executed. An assessment of the environmental, economic and social contribution to the
sustainability of this combined refurbishment-recycling system was realized.
Furthermore alternative scenarios of providing computers to schools in Colombia have been
identified. This includes: the importation of donated computers, the local assembling of new
computers, the refurbishment abroad, the purchase of the ‘XO laptop’, the purchase of a new
computer. Data regarding their economic, environmental and social performances were gathered
for each scenario and further assessed with the Multi Attribute Utility Theory (MAUT). This allowed
the ranking of the overall sustainability of each scenario.
As a common output for all of the scenarios a yearly supply of 46’000 computers to the schools
was assumed. The number is based on the declaration of the Colombian Ministry of Education who
aims to supply 70% of all public schools with computers until 2010. This was stated regarding the
objective to diminish the ratio of pupil per computer to 20:1. 9 The ‘Ecological Footprint’ analysis attempts to measure human demand on nature. It compares human consumption of natural resources with planet Earth's ecological capacity to regenerate them and estimates the amount of biologically productive land and sea area required in order to do so (Rees, 1992).
CHRISTIAN MARTHALER APRIL 2008 4
INTRODUCTION
To take into account the different lifespan of a computer in a certain scenario the supply of a
school for a usage time of five years was hypothesized for all scenarios. The functional unit therefore is defined as the usage of 46’000 computers during five years at a school.
The results shall primarily give an evaluation of different strategies (separate or combined) for the
supply of computers to schools and serve as the foundation to determine the contribution of the
refurbishment process to sustainability. Additionally they should give an understanding of the
advantages and shortcomings of CPE or the OLPC initiative. Different ideas regarding the support
accompanying of such programs or the educational effects will only be discussed qualitatively.
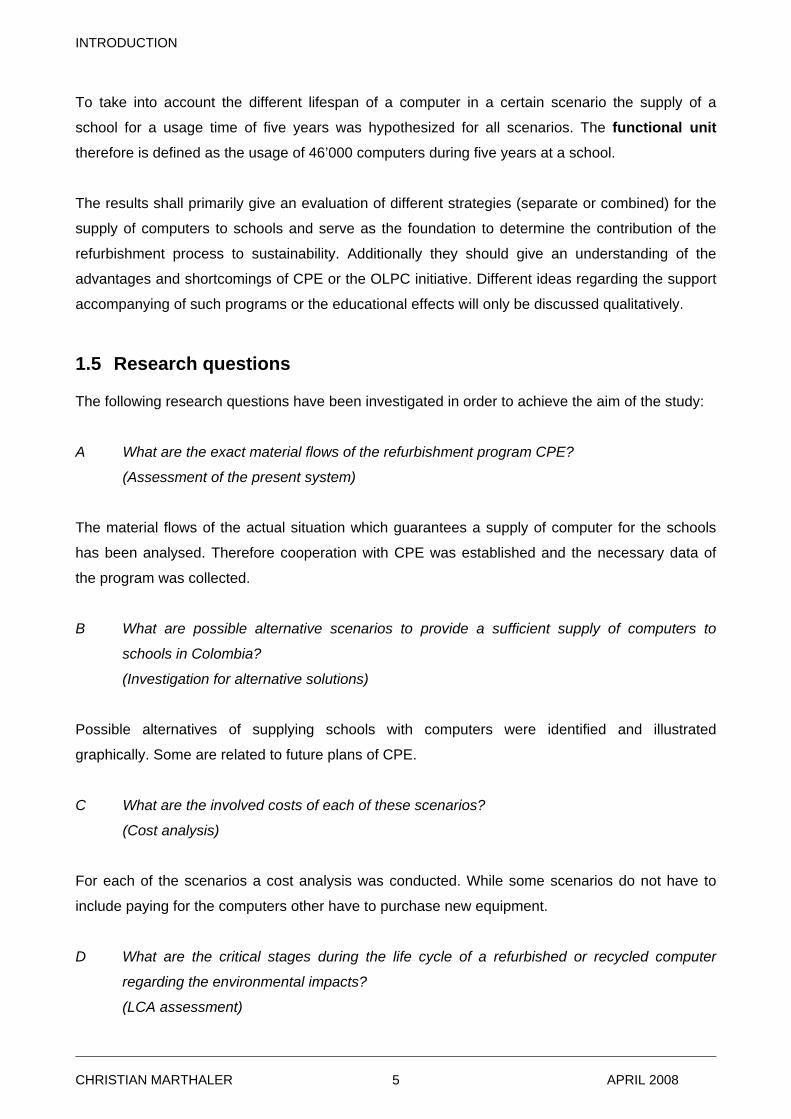
1.5 Research questions
The following research questions have been investigated in order to achieve the aim of the study:
A What are the exact material flows of the refurbishment program CPE?
(Assessment of the present system)
The material flows of the actual situation which guarantees a supply of computer for the schools
has been analysed. Therefore cooperation with CPE was established and the necessary data of
the program was collected.
B What are possible alternative scenarios to provide a sufficient supply of computers to
schools in Colombia?
(Investigation for alternative solutions)
Possible alternatives of supplying schools with computers were identified and illustrated
graphically. Some are related to future plans of CPE.
C What are the involved costs of each of these scenarios?
(Cost analysis)
For each of the scenarios a cost analysis was conducted. While some scenarios do not have to
include paying for the computers other have to purchase new equipment.
D What are the critical stages during the life cycle of a refurbished or recycled computer
regarding the environmental impacts?
(LCA assessment)
CHRISTIAN MARTHALER APRIL 2008 5
INTRODUCTION
For each of the scenarios a Life Cycle Analysis (LCA) of a computer was conducted. This shows
the environmental impacts of each stage during the life cycle of a computer. Stages are the
production, the use, the transport, possible processes to enable reuse and the final disposal of the
computer.
E Which of the scenarios has the best performance regarding its economic, environmental
and social impacts?
(Sustainability and best case assessment)
Each of the scenarios has been assessed with the Multi Attribute Utility Theory (MAUT). This
method allows a comparison of the sustainability of the scenarios. It was applied in order to gain
information about which strategy has the best sustainability performance and give future advice of
how schools in Colombia could be supplied with computers in the most sustainable way.
1.6 Case study region
As a case study region, Colombia was selected. This was due to the well established
refurbishment program CPE, the biggest of its kind in Latin America.
1.6.1 General information
Capital: Bogotá
Surface: 1'141'748 km2
Population: 44'065’000
GDP (PPP): US $3,245.859 (2008)
Currency: Colombian Peso
Literacy: 92.5% Figure 1: Locating Colombia on the world map
Colombia is the fourth-largest and second-most populated country in South America. In the West it
borders the Pacific Ocean and in the North the Atlantic. Neighbouring states are Panama in the
North-West, Venezuela in the North-East, Brazil in the South-East, Peru in the South and Ecuador
in the South-West. It is politically subdivided into 32 departments and a federal district with the
capital Bogotá (Distrito Capital).
Colombia's main exports include manufactured goods (41.32% of exports), petroleum (28.28%),
coal (13.17%), and coffee (6.25%). Moreover it is the largest provider worldwide of cut flowers and
the third largest of plantains. Unofficially illegal drugs are also a major export.
CHRISTIAN MARTHALER APRIL 2008 6
INTRODUCTION
Due to internal conflicts there exists a huge amount of displaced people. This increases the effect
of the migratory movements from the rural to urban areas. While in 1951 around 54% of the
population lived in an urban area it is estimated to be around 77% at present.
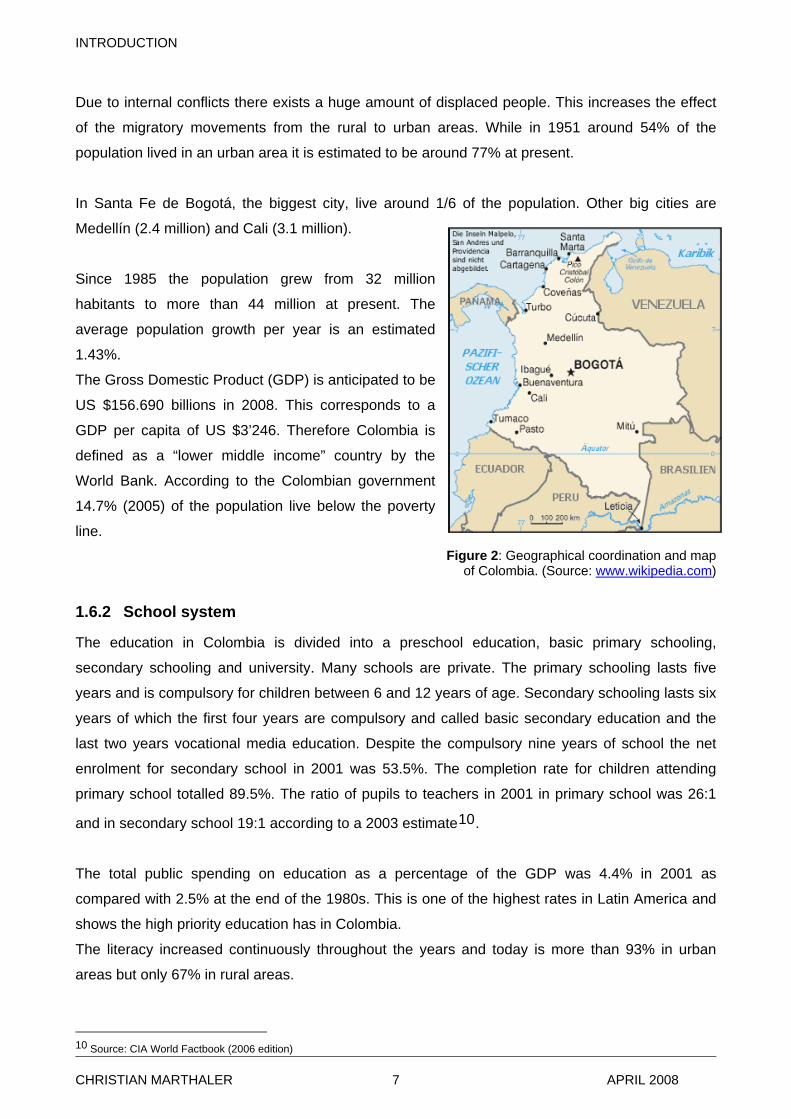
In Santa Fe de Bogotá, the biggest city, live around 1/6 of the population. Other big cities are
Medellín (2.4 million) and Cali (3.1 million).
Since 1985 the population grew from 32 million
habitants to more than 44 million at present. The
average population growth per year is an estimated
1.43%.
The Gross Domestic Product (GDP) is anticipated to be
US $156.690 billions in 2008. This corresponds to a
GDP per capita of US $3’246. Therefore Colombia is
defined as a “lower middle income” country by the
World Bank. According to the Colombian government
14.7% (2005) of the population live below the poverty
line. Figure 2: Geographical coordination and map
of Colombia. (Source: www.wikipedia.com)
1.6.2 School system
The education in Colombia is divided into a preschool education, basic primary schooling,
secondary schooling and university. Many schools are private. The primary schooling lasts five
years and is compulsory for children between 6 and 12 years of age. Secondary schooling lasts six
years of which the first four years are compulsory and called basic secondary education and the
last two years vocational media education. Despite the compulsory nine years of school the net
enrolment for secondary school in 2001 was 53.5%. The completion rate for children attending
primary school totalled 89.5%. The ratio of pupils to teachers in 2001 in primary school was 26:1
and in secondary school 19:1 according to a 2003 estimate10.
The total public spending on education as a percentage of the GDP was 4.4% in 2001 as
compared with 2.5% at the end of the 1980s. This is one of the highest rates in Latin America and
shows the high priority education has in Colombia.
The literacy increased continuously throughout the years and today is more than 93% in urban
areas but only 67% in rural areas.
10 Source: CIA World Factbook (2006 edition)
CHRISTIAN MARTHALER APRIL 2008 7
INTRODUCTION
The ratio of pupil to computer at present is 48:111. In its four year plan between 2006 and 2010 the
Colombian government12 formulated the goal to bring this ratio down to 20:1. The specifications
are to provide a supply of computers for 70% of all public schools by the year 2010. 45% of the
schools will be supplied through CPE. This requires an increase of the turnaround of 18’000
computers (2006) at CPE to a yearly amount of 46’000 computers between 2007 and 2010.
1.6.3 ICT usage
In 1999 the ‘Ministry of Communication’ launched a program called ‘Compartel’. The initiative aims
to improve the accessibility of telecommunication services to rural zones and low social stratums.
Steps to achieve this aim are the expanding of basic telephone services, building community
access centres and providing internet connections to schools and hospitals. CPE is among others
one wing of the initiative.
The following chapter describes and illustrates the need for these activities.
According to a study by CompTIA, Colombia is ranked in the middle of the development and usage
of information and communication technology (ICT) within Latin America.
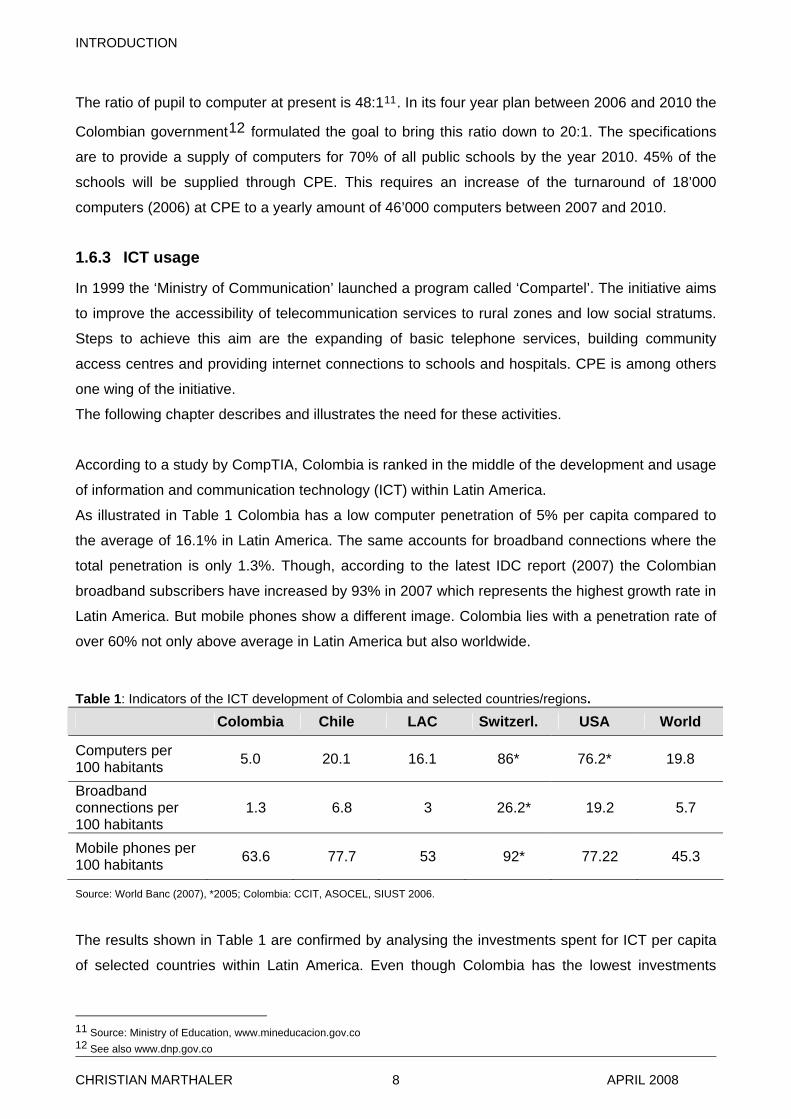
As illustrated in Table 1 Colombia has a low computer penetration of 5% per capita compared to
the average of 16.1% in Latin America. The same accounts for broadband connections where the
total penetration is only 1.3%. Though, according to the latest IDC report (2007) the Colombian
broadband subscribers have increased by 93% in 2007 which represents the highest growth rate in
Latin America. But mobile phones show a different image. Colombia lies with a penetration rate of
over 60% not only above average in Latin America but also worldwide.
Table 1: Indicators of the ICT development of Colombia and selected countries/regions.
Source: World Banc (2007), *2005; Colombia: CCIT, ASOCEL, SIUST 2006.
The results shown in Table 1 are confirmed by analysing the investments spent for ICT per capita
of selected countries within Latin America. Even though Colombia has the lowest investments
11 Source: Ministry of Education, www.mineducacion.gov.co 12 See also www.dnp.gov.co
Colombia Chile LAC Switzerl. USA World
Computers per 100 habitants 5.0 20.1 16.1 86* 76.2* 19.8
Broadband connections per 100 habitants
1.3 6.8 3 26.2* 19.2 5.7
Mobile phones per 100 habitants 63.6 77.7 53 92* 77.22 45.3
CHRISTIAN MARTHALER APRIL 2008 8
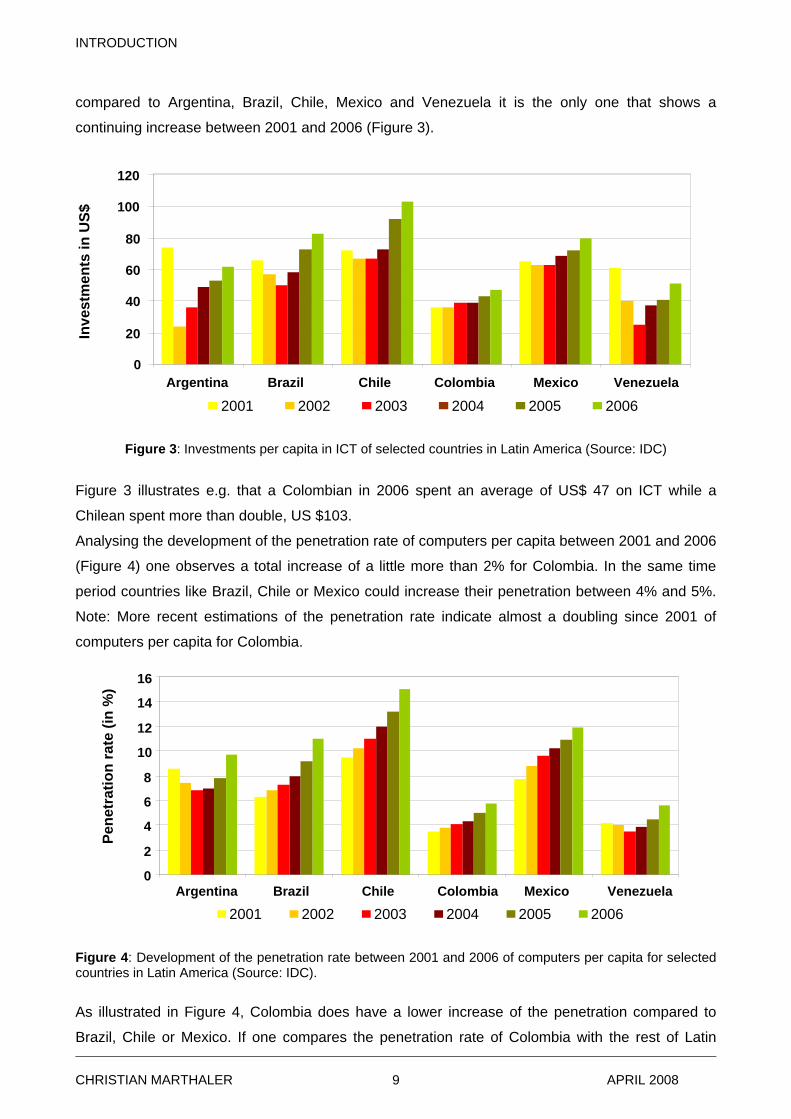
INTRODUCTION
compared to Argentina, Brazil, Chile, Mexico and Venezuela it is the only one that shows a
continuing increase between 2001 and 2006 (Figure 3).
0
20
40
60
80
100
120
Argentina Brazil Chile Colombia Mexico Venezuela
2001 2002 2003 2004 2005 2006
Inve
stm
ents
in U
S$
Figure 3: Investments per capita in ICT of selected countries in Latin America (Source: IDC)
Figure 3 illustrates e.g. that a Colombian in 2006 spent an average of US$ 47 on ICT while a
Chilean spent more than double, US $103.
Analysing the development of the penetration rate of computers per capita between 2001 and 2006
(Figure 4) one observes a total increase of a little more than 2% for Colombia. In the same time
period countries like Brazil, Chile or Mexico could increase their penetration between 4% and 5%.
Note: More recent estimations of the penetration rate indicate almost a doubling since 2001 of
computers per capita for Colombia.
0
2
4
6
8
10
12
14
16
Argentina Brazil Chile Colombia Mexico Venezuela
2001 2002 2003 2004 2005 2006
Pene
trat
ion
rate
(in
%)
Figure 4: Development of the penetration rate between 2001 and 2006 of computers per capita for selected countries in Latin America (Source: IDC).
As illustrated in Figure 4, Colombia does have a lower increase of the penetration compared to
Brazil, Chile or Mexico. If one compares the penetration rate of Colombia with the rest of Latin
CHRISTIAN MARTHALER APRIL 2008 9
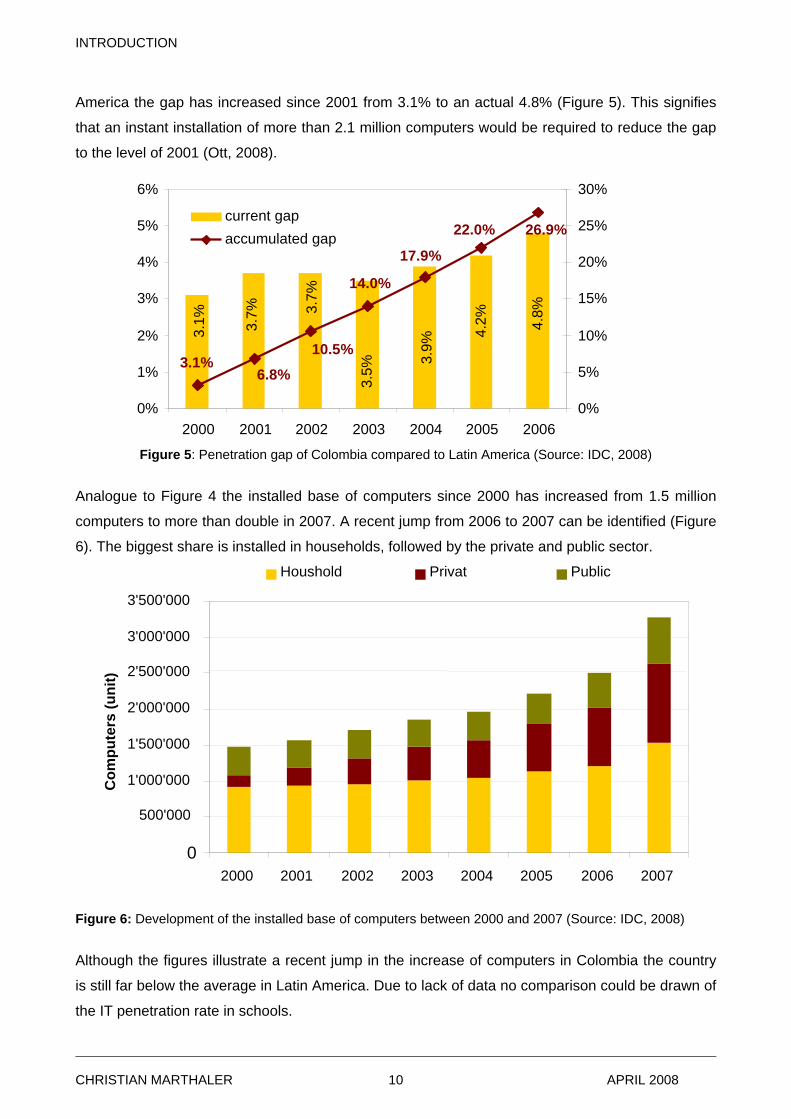
INTRODUCTION
America the gap has increased since 2001 from 3.1% to an actual 4.8% (Figure 5). This signifies
that an instant installation of more than 2.1 million computers would be required to reduce the gap
to the level of 2001 (Ott, 2008).
4.8%
3.7%
3.1%
3.7%
3.5%
3.9%
4.2%
26.9%
17.9%
10.5%
6.8% 3.1%
14.0%
22.0%
0%
1%
2%
3%
4%
5%
6%
2000 2001 2002 2003 2004 2005 20060%
5%
10%
15%
20%
25%
30%
current gap
accumulated gap
Figure 5: Penetration gap of Colombia compared to Latin America (Source: IDC, 2008)
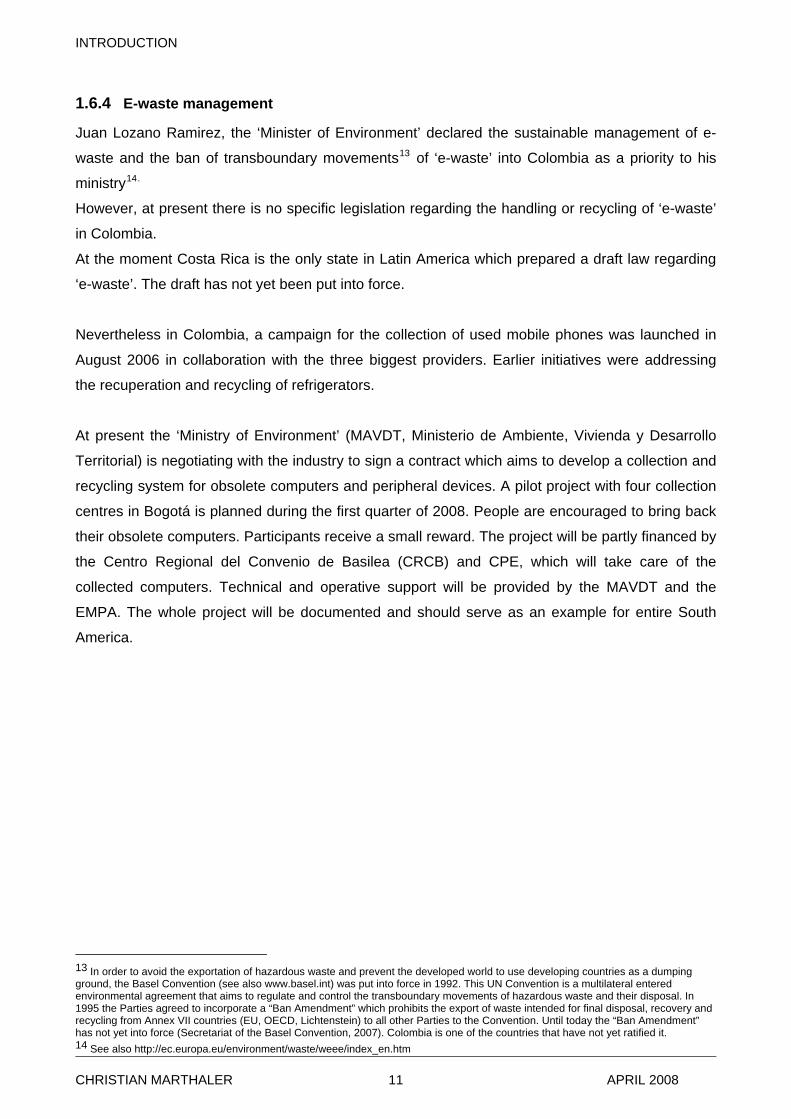
Analogue to Figure 4 the installed base of computers since 2000 has increased from 1.5 million
computers to more than double in 2007. A recent jump from 2006 to 2007 can be identified (Figure
6). The biggest share is installed in households, followed by the private and public sector.
0
500'000
1'000'000
1'500'000
2'000'000
2'500'000
3'000'000
3'500'000
2000 2001 2002 2003 2004 2005 2006 2007
Com
pute
rs (u
nit)
Houshold Privat Public
Figure 6: Development of the installed base of computers between 2000 and 2007 (Source: IDC, 2008)
Although the figures illustrate a recent jump in the increase of computers in Colombia the country
is still far below the average in Latin America. Due to lack of data no comparison could be drawn of
the IT penetration rate in schools.
CHRISTIAN MARTHALER APRIL 2008 10
INTRODUCTION
1.6.4 E-waste management
Juan Lozano Ramirez, the ‘Minister of Environment’ declared the sustainable management of e-
waste and the ban of transboundary movements13 of ‘e-waste’ into Colombia as a priority to his
ministry14.
However, at present there is no specific legislation regarding the handling or recycling of ‘e-waste’
in Colombia.
At the moment Costa Rica is the only state in Latin America which prepared a draft law regarding
‘e-waste’. The draft has not yet been put into force.
Nevertheless in Colombia, a campaign for the collection of used mobile phones was launched in
August 2006 in collaboration with the three biggest providers. Earlier initiatives were addressing
the recuperation and recycling of refrigerators.
At present the ‘Ministry of Environment’ (MAVDT, Ministerio de Ambiente, Vivienda y Desarrollo
Territorial) is negotiating with the industry to sign a contract which aims to develop a collection and
recycling system for obsolete computers and peripheral devices. A pilot project with four collection
centres in Bogotá is planned during the first quarter of 2008. People are encouraged to bring back
their obsolete computers. Participants receive a small reward. The project will be partly financed by
the Centro Regional del Convenio de Basilea (CRCB) and CPE, which will take care of the
collected computers. Technical and operative support will be provided by the MAVDT and the
EMPA. The whole project will be documented and should serve as an example for entire South
America.
13 In order to avoid the exportation of hazardous waste and prevent the developed world to use developing countries as a dumping ground, the Basel Convention (see also www.basel.int) was put into force in 1992. This UN Convention is a multilateral entered environmental agreement that aims to regulate and control the transboundary movements of hazardous waste and their disposal. In 1995 the Parties agreed to incorporate a “Ban Amendment” which prohibits the export of waste intended for final disposal, recovery and recycling from Annex VII countries (EU, OECD, Lichtenstein) to all other Parties to the Convention. Until today the “Ban Amendment” has not yet into force (Secretariat of the Basel Convention, 2007). Colombia is one of the countries that have not yet ratified it. 14 See also http://ec.europa.eu/environment/waste/weee/index_en.htm
CHRISTIAN MARTHALER APRIL 2008 11
METHODS
2 Methods
2.1 Material Flow Analysis (MFA)
The material flow analysis (MFA) is a systematic assessment of the flows and stocks of materials
within a system defined in space and time. A MFA determines, describes and analyzes the
metabolism of industries, regions or materials. The metabolism of a system stands for the transfer,
storage and transformation of materials within the system and the exchange of materials within its
environment (Brunner und Rechberger, 2004). It therefore has to connect the sources, pathways
and the intermediate and final sinks of a material. The results of an MFA can serve to identify
theoretical possibilities for regulations (Baccini & Bader, 1996). It can be controlled by a simple
material balance comparing all input, stocks and outputs of a process. This distinct characteristic of
the MFA makes it an attractive method as a decision-support tool in resource management, waste
management and environmental management (Brunner und Rechberger, 2004). Originally the
MFA was developed for processes in industrialized countries but was recently applied in
developing countries (Binder et al., 2001; Streicher-Porte, 2006) for the early recognition of the
environmental impacts of human activities.
The working process contains the following four steps:
- System analysis: Defining the system boundaries, description of the system through
processes and materials
- Data collection of the material flows
- Calculation of stock flows
- Schematic description and interpretation of the results
The practical execution of the MFA is often an iterative progress during the further understanding
of the system.
2.1.1 Definitions
The following list defines the most important terms used for the material flow analysis in the context
of this study. The definitions are carried out according to the Practical Handbook of Material Flow
Analysis (Brunner and Rechberger, 2004):
Material
The term material includes substances and goods. Substances are defined as chemical elements,
whereas goods are real life items, such as wood or a computer.
In this study, the term material refers to a computer including all parts and components.
CHRISTIAN MARTHALER 12 APRIL 2008
METHODS
Process
A process is defined as the transformation, transport or storage of materials. The processes used
in the material flow analysis conducted in this study involve production (where additional),
transport, refurbishment, storage and disposal of a computer. A process of storage includes a
stock, where material is stored for a defined time.
Flow
A flow is defined as a mass flow rate. This is the ratio of mass per time that flows through a system
or process e.g. the amount of computer material that flow from the refurbishment process to the
recycling and disposal process during one year. The physical unit of a flow may thus be given in
units of kg/year. In this study, a flow may also refer to a flow of goods. The flow is then given in
units/year (which can easily be converted into a mass flow, multiplying the units by their mass).
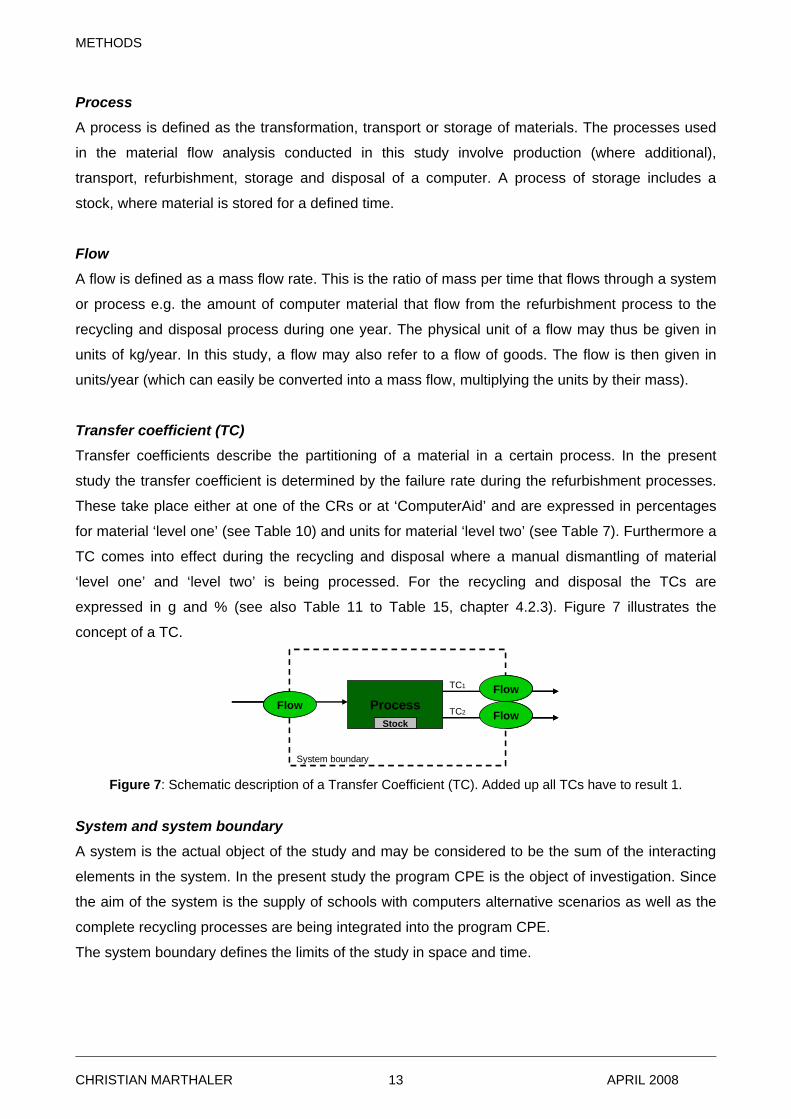
Transfer coefficient (TC)
Transfer coefficients describe the partitioning of a material in a certain process. In the present
study the transfer coefficient is determined by the failure rate during the refurbishment processes.
These take place either at one of the CRs or at ‘ComputerAid’ and are expressed in percentages
for material ‘level one’ (see Table 10) and units for material ‘level two’ (see Table 7). Furthermore a
TC comes into effect during the recycling and disposal where a manual dismantling of material
‘level one’ and ‘level two’ is being processed. For the recycling and disposal the TCs are
expressed in g and % (see also Table 11 to Table 15, chapter 4.2.3). Figure 7 illustrates the
concept of a TC.
Flow ProcessStock
Flow
FlowTC2
TC1
System boundary
Flow ProcessStock
Flow
FlowTC2
TC1
System boundary Figure 7: Schematic description of a Transfer Coefficient (TC). Added up all TCs have to result 1.
System and system boundary
A system is the actual object of the study and may be considered to be the sum of the interacting
elements in the system. In the present study the program CPE is the object of investigation. Since
the aim of the system is the supply of schools with computers alternative scenarios as well as the
complete recycling processes are being integrated into the program CPE.
The system boundary defines the limits of the study in space and time.
CHRISTIAN MARTHALER APRIL 2008 13
METHODS
2.1.2 Mathematical description
In order to describe a system mathematically a set of variables has to be found that reproduces the
system in the most descriptive possible way. The set is complete when it enables calculating the
material density as well as all material flows and storages at any time and any point of the system.
Taking the principles of the mass conservation into account the principal equation of the material
balance is as follows:
( )
∑ ∑−=r s
jsrj
j
AAdt
dM (1)
( ) ( )tM j : amount of material in ( )jV
( )tArj : material flow from to ( )rV ( )jV
The partitioning of material flow through a process is modulated by transfer coefficients.
The transfer coefficients indicate the (relative) fraction of the total input into balance volume
into the balance volume , i.e. the flow that leaves the balance volume .
k rV
sV rsV rV
The mathematical definition is as follows:
∑=
jjr
rsrs A
Ak (2)
Whereas represents the total . ∑j
jrA rV
The principal steps involved in developing a mathematical model are:
• A complete description of the system and the involved variables (e.g. transfer coefficients)
• The determination of the mass balance equations which describe the interactions in
the system
• The implementation of these in a model
2.1.3 System analysis
2.1.3.1 System boundary
The system boundary for the MFA is the refurbishment program CPE. Since the program supplies
schools all over the country the system is geographically limited to Colombia. Alternative
scenarios, e.g. the supply of schools through the OLPC initiative are integrated in the system CPE.
CHRISTIAN MARTHALER APRIL 2008 14
METHODS
Recycling &DisposalProduction & Sale
1st UseSchool
1st Use Refurbishment
Centro de IntegraciónEquipos Nuevos
(CIEN)
One Laptop Per Child (OLPC)
2nd Use
Centro Nacional del Aprovechamiento
de Residuos Electrónicos(CENARE)
LocalIndustry
Disposal Site
Recycler
Centro de Reacondicionamiento
(CR)
2nd UseSchool
Centro de Ensamblede Equipos del Exterior (CEEX)
DisposalOverseas
Components
Computer
User Overseas
User Colombia
ComputerAid
Maintenance
COLOMBIA
WORLD
SYSTEM BOUNDARY
Recycling &DisposalProduction & Sale
1st UseSchool
1st Use Refurbishment
Centro de IntegraciónEquipos Nuevos
(CIEN)
One Laptop Per Child (OLPC)
2nd Use
SYSTEM BOUNDARY
Centro Nacional del Aprovechamiento
de Residuos Electrónicos(CENARE)
LocalIndustry
Disposal Site
Recycler
Centro de Reacondicionamiento
(CR)
2nd UseSchool
Centro de Ensamblede Equipos del Exterior (CEEX)
User Colombia Maintenance
COLOMBIA
WORLD
ComputerAidUser Overseas
DisposalOverseasComputer
Components
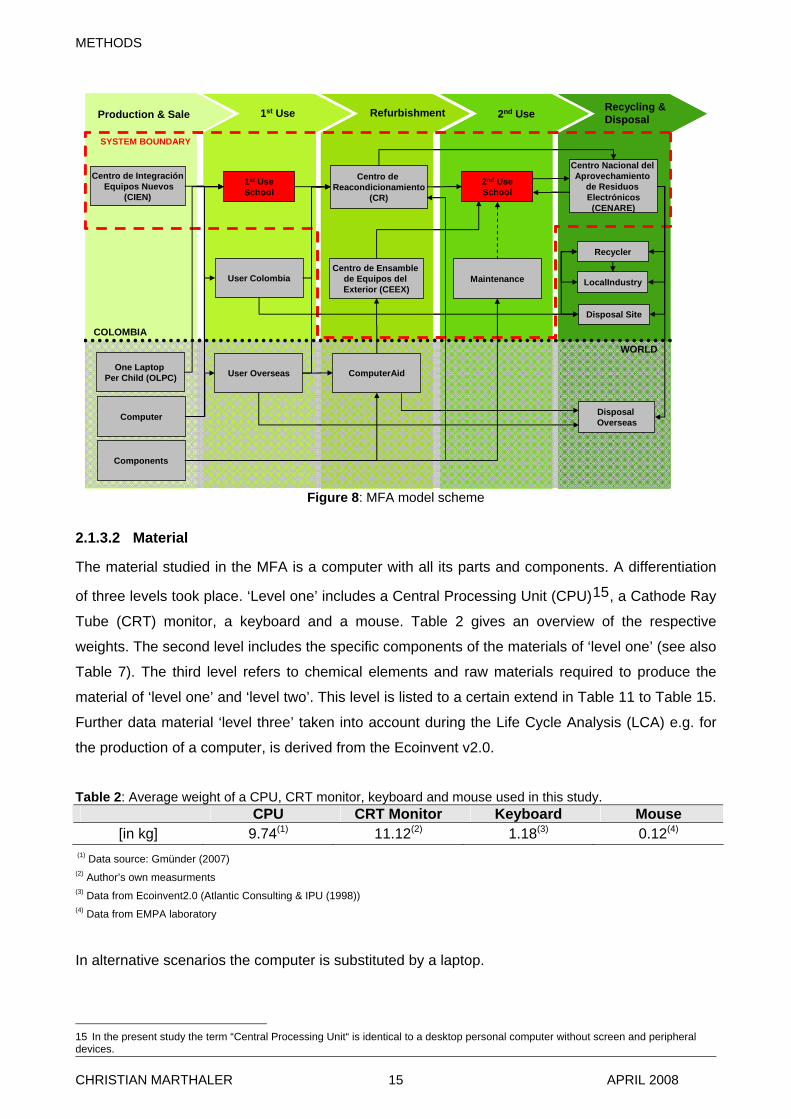
Figure 8: MFA model scheme
2.1.3.2 Material
The material studied in the MFA is a computer with all its parts and components. A differentiation
of three levels took place. ‘Level one’ includes a Central Processing Unit (CPU)15, a Cathode Ray
Tube (CRT) monitor, a keyboard and a mouse. Table 2 gives an overview of the respective
weights. The second level includes the specific components of the materials of ‘level one’ (see also
Table 7). The third level refers to chemical elements and raw materials required to produce the
material of ‘level one’ and ‘level two’. This level is listed to a certain extend in Table 11 to Table 15.
Further data material ‘level three’ taken into account during the Life Cycle Analysis (LCA) e.g. for
the production of a computer, is derived from the Ecoinvent v2.0.
Table 2: Average weight of a CPU, CRT monitor, keyboard and mouse used in this study.
CPU CRT Monitor Keyboard Mouse [in kg] 9.74(1) 11.12(2) 1.18(3) 0.12(4)
(1) Data source: Gmünder (2007) (2) Author’s own measurments (3) Data from Ecoinvent2.0 (Atlantic Consulting & IPU (1998)) (4) Data from EMPA laboratory
In alternative scenarios the computer is substituted by a laptop.
15 In the present study the term “Central Processing Unit“ is identical to a desktop personal computer without screen and peripheral devices.
CHRISTIAN MARTHALER APRIL 2008 15
METHODS
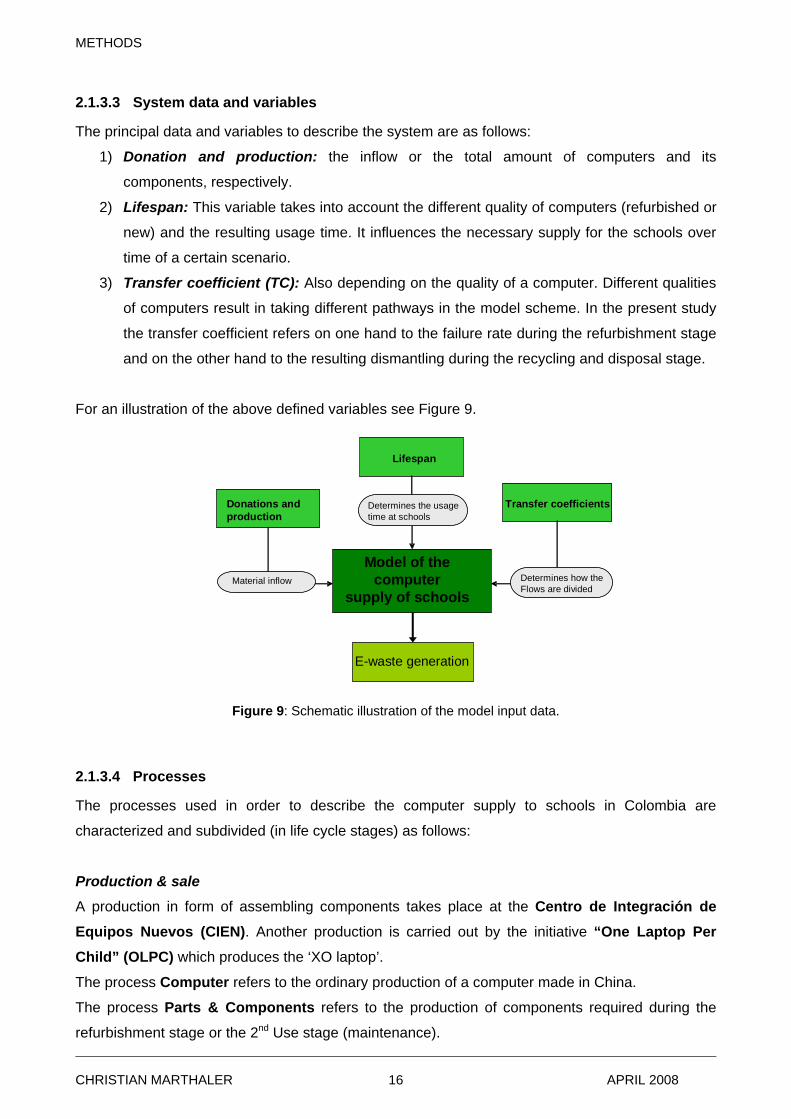
2.1.3.3 System data and variables
The principal data and variables to describe the system are as follows:
1) Donation and production: the inflow or the total amount of computers and its
components, respectively.
Model of the computer
supply of schools Material inflow
Determines the usage time at schools
Donations and production
Lifespan
Transfer coefficients
E-waste generation
Determines how theFlows are divided
2) Lifespan: This variable takes into account the different quality of computers (refurbished or
new) and the resulting usage time. It influences the necessary supply for the schools over
time of a certain scenario.
3) Transfer coefficient (TC): Also depending on the quality of a computer. Different qualities
of computers result in taking different pathways in the model scheme. In the present study
the transfer coefficient refers on one hand to the failure rate during the refurbishment stage
and on the other hand to the resulting dismantling during the recycling and disposal stage.
For an illustration of the above defined variables see Figure 9.
Figure 9: Schematic illustration of the model input data.
2.1.3.4 Processes
The processes used in order to describe the computer supply to schools in Colombia are
characterized and subdivided (in life cycle stages) as follows:
Production & sale
A production in form of assembling components takes place at the Centro de Integración de Equipos Nuevos (CIEN). Another production is carried out by the initiative “One Laptop Per Child” (OLPC) which produces the ‘XO laptop’.
The process Computer refers to the ordinary production of a computer made in China.
The process Parts & Components refers to the production of components required during the
refurbishment stage or the 2nd Use stage (maintenance).
CHRISTIAN MARTHALER APRIL 2008 16
METHODS
1st Use
A 1st use takes place through the donators. They are either within or outside the boarders of the
country characterized by User Colombia and User Overseas. Another 1st use is possible at the
Schools supposing that the equipment come directly from the production stage.
Refurbishment
The refurbishment process takes place either in Colombia at one of the Refurbishment Centres (CRs, Centros de Reacondicionamiento) or overseas at ComputerAid (as representative for all
refurbisher overseas). If the refurbishment is being processed outside of Colombia the computers
are first sent to the Centro de Equipos del exterior (CEEX) in Bogota.
2nd Use
A 2nd use takes place at the Schools. This occurs when the provided computers already
underwent a 1st use. The 2nd use is prolonged through the process Maintenance which refers to a
technical maintenance of the computers at the school sites.
Recycling & disposal
Having reached their ‘end-of-life’ the computers are sent to the Centro Nacional del Aprovechamiento de Residuos Electrónicos (CENARE) where a manual dismantling process
takes place. Some components are then being transported back to the schools for educational
purposes (Robotic). Other parts are either directly sold to the Local Industry or to other Recyclers
for further treatment. Due to their composition some parts have to be sent to a Disposal Site. The
process Disposal Overseas refers to the ‘state-of-the-art’ recycling scenario of a computer in
Europe.
2.2 Scenario analysis
Out of the MFA model scheme (figure 8) different scenarios have been identified. As mentioned
before the functional unit is the supply of 46’000 computers for a five year usage at schools.
First, the current situation (2006) was analyzed. Then, under discussion with members of CPE
future plans and possibilities (2007 or later) of the program were identified and integrated in
different scenarios (Table 3). After that they were assessed with regard to their sustainability,
applying the Multi Attribute Utility Theory (MAUT).
CHRISTIAN MARTHALER APRIL 2008 17
METHODS
Table 3: Description of the model scenarios Scenario Description
“100% Colombian refurbishment” (Ia, Ib)
Scenarios Ia, Ib are based on the actual situation in
2006. Computers are exclusively of Colombian origin
and refurbished at the CRs. Ia includes maintenance,
Ib does not include maintenance.
“Colombian/overseas refurbishment and
local assembling” (II)
Scenario II reflects the situation at present (2007).
Computers are provided either from the CRs,
assembled newly at the CIEN or arrive at the CEEX.
“Overseas refurbishment” (III)1
Computers are mainly provided from ‘ComputerAid’.
For the refurbished computers at the CRs a technical
threshold (‘Pentium III’ or higher) was defined.
“Overseas donations for Colombian
refurbishment” (IV)
Computers are guided directly from the users
overseas to the CRs. For refurbished computers of
Colombian origin a technical threshold (‘Pentium III’ or
higher) was defined.
“XO laptop” (Va)
“PC (new)” (Vb)
For refurbished computers of Colombian origin a
technical threshold (‘Pentium III’ or higher) was
defined. The remaining computers were replaced by
purchasing the ‘XO laptop’ (scenario Va) or a new
computer (scenario Vb).
1 Please note that ‘ComputerAid’ serves as a representative for all refurbisher overseas.
2.3 Multi Attribute Utility Theory (MAUT)
The methodology of the Multi Attribute Utility Theory (MAUT) is based on the book ‘Embedded
Case Study Methods’ (Scholz et al., 2002). The MAUT stands as a label for the family of case
evaluation methods. They are used for analyzing, evaluating and comparing different alternatives.
The objective of a MAUT is “…to obtain a conjoint measure of the attractiveness (utility) of each
outcome of a set of alternatives.” (= scenarios). The outcome (= utility) of each scenario can then
be compared among all others.
Within the MAUT the user has to define a set of attributes which tries to reflect the overall
attractiveness of each scenario. Attributes are preference-related dimensions of a system and can
be system variables but can also measure e.g. quality or aesthetics.
Furthermore, the process of the definition of the attributes should intend to cover all aspects of the
evaluation of the scenarios. Previous applications of the MAUT showed that the bigger the set of
attributes and therefore the more detailed description of the scenario, the harder the weighting
process and less exact the overall utility (Sutter, 2003).
CHRISTIAN MARTHALER APRIL 2008 18
METHODS
In this study the attributes were defined by the author in discussion with experts from the
‘Sustainable Technology Cooperation’ (sustec) at the Swiss Federal Laboratories for Materials
Testing and Research (EMPA) in St.Gallen and further developed in conjunction with CPE.
Zumbühl (2005) applied a similar set of attributes evaluating different scenarios for the disposal of
CRT screens in the Republic South Africa. The set represents economic, environmental and social
attributes. They are specified in chapter 2.3.2.
The weighting of the attributes is determined by the author based on stakeholder weightings,
interviews with employees of CPE and the priorities set by CPE.
Once all alternatives have been rated accordingly to each of the attributes the MAUT composes
the ratings and realizes a synthesis resulting in a one-dimensional utility measure.
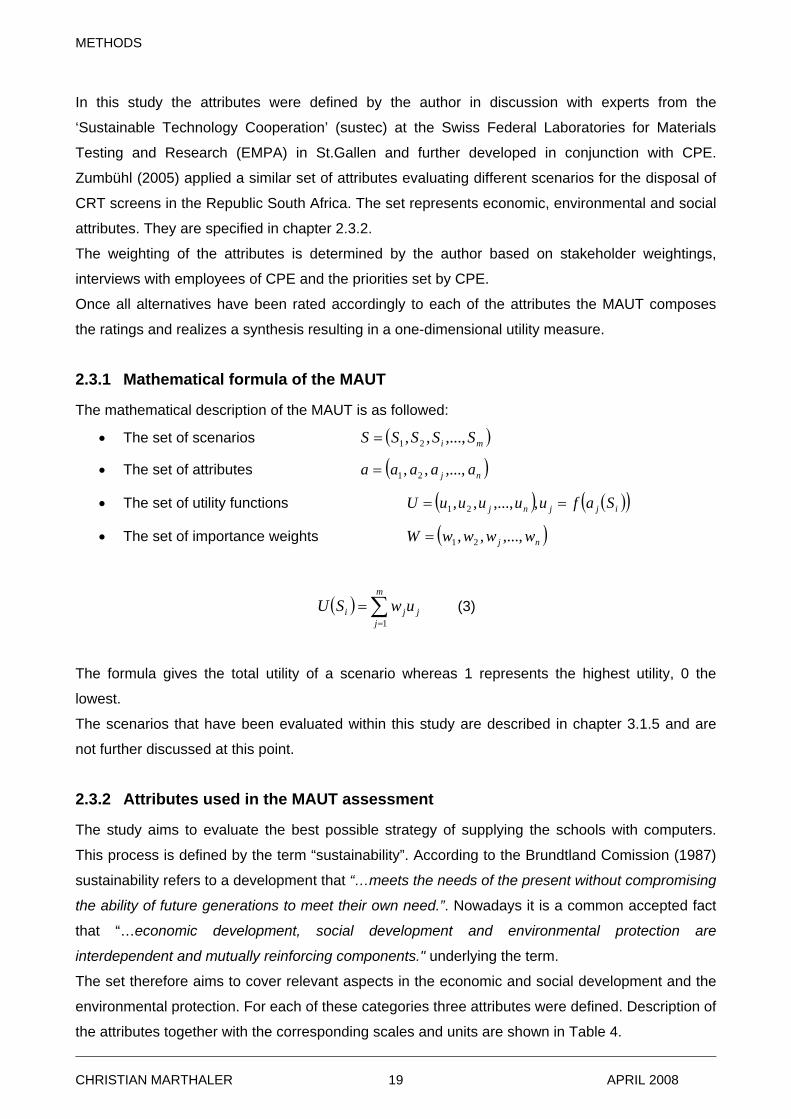
2.3.1 Mathematical formula of the MAUT
The mathematical description of the MAUT is as followed:
• The set of scenarios ( )mi SSSSS ,...,,, 21=
• The set of attributes ( )nj aaaaa ,...,,, 21=
• The set of utility functions ( ) ( )( )ijjnj SafuuuuuU == ,,...,,, 21
• The set of importance weights ( )nj wwwwW ,...,,, 21=
( ) ∑=
=m
jjji uwSU
1 (3)
The formula gives the total utility of a scenario whereas 1 represents the highest utility, 0 the
lowest.
The scenarios that have been evaluated within this study are described in chapter 3.1.5 and are
not further discussed at this point.
2.3.2 Attributes used in the MAUT assessment
The study aims to evaluate the best possible strategy of supplying the schools with computers.
This process is defined by the term “sustainability”. According to the Brundtland Comission (1987)
sustainability refers to a development that “…meets the needs of the present without compromising
the ability of future generations to meet their own need.”. Nowadays it is a common accepted fact
that “…economic development, social development and environmental protection are
interdependent and mutually reinforcing components." underlying the term.
The set therefore aims to cover relevant aspects in the economic and social development and the
environmental protection. For each of these categories three attributes were defined. Description of
the attributes together with the corresponding scales and units are shown in Table 4.
CHRISTIAN MARTHALER APRIL 2008 19
METHODS
Table 4: Set of attributes used for the MAUT assessment. Attributes Scale / unit Description
Economy
Low net costs $ / computer
Costs for transport (if additional),
new equipment, processing at CPE
and labour minus the revenues
(material values out of recycling) /
computer of scenario Si.
High technical value1 0, 0.25, 0.5, 0.75, 1
Value is based on technical standard
(processor) of the computers being
supplied.
Involvement/participation
of local economy %
Share of local economy involved into
implementation of scenario Si.
Environment
Low use of energy
Energy needed for the production,
transport (if additional), usage
phase, refurbishment and
recycling/disposal / computer of
scenario Si.
Low use of resources Resources needed during total
lifespan / computer of scenario Si.
Little toxic emissions
Normalized Eco-
Indicator’99 points
(= sum of
environmental losses
and environmental
benefits) Caused emissions through whole life
cycle minus prevented emissions
due to savings of raw materials /
computer of scenario Si.
Society
Creation of jobs low and
semi-skilled jobs
Amount of jobs /
computer provided for
schools
Providing of low and semi-skilled
jobs within Colombia.
Creation of highly skilled
jobs
Amount of jobs /
computer provided for
schools
Providing of highly skilled jobs within
Colombia.
Capacity building1 0, 0.25, 0.5, 0.75, 1
Providing additional capacity
building for the local community and
quality of computer based education.
1 Whilst most of the attributes could be calculated, some underlie a qualitative analysis based on the author’s own estimations. The
qualitative assessments are ranked 0, 0.25, 0.5, 0.75 or 1. Note: 0 stands for very low utility, 0.25 for rather low utility, 0.5 for medium
utility, 0.75 for rather high utility and 1 for very high utility.
CHRISTIAN MARTHALER APRIL 2008 20
METHODS
2.3.3 Economic performance
2.3.3.1 Low net costs
For CPE a detailed cost analysis was realized based on the budgets of the year 2006 and 2007.
The costs at the CRs, the CIEN, the CEEX, the CENARE and during the maintenance were all
calculated separately. It was distinguished between direct labour costs, indirect labour costs, direct
material costs, indirect material costs, indirect costs of fabrication, promotion costs,
accompaniment and monitoring and the maintenance (see also Table 18). Some corrections, in
order to take all cost into account, led to minor differences between the author’s calculation and the
calculations of CPE.
Due to the lack of information exterior processes could not be analyzed in detail. This is insofar not
a problem as the price for the equipment reflects all previous emerged costs. Revenues for selling
materials out of the recycling process are considered only for computers entering the program
CPE.
The overall costs are then calculated per year per unit computer.
Low net costs implicate high utility.
2.3.3.2 High technical value
This attribute was introduced in order to meet concerns about the different technical levels of the
delivered computers. It is reviewed semi-quantitatively and ranked either 0, 0.25, 0.5, 0.75 or 1.
For every scenario the percentage of computers with a processor equivalent to ‘Pentium I’ or
lower, ‘Pentium II’, ‘Pentium III’ and ‘Pentium IV’ and higher, respectively was calculated. The
choice of this attribute is based on the author’s assumption that a higher technical standard allows
a broader application and more adequate education for the users. It therefore creates a higher
value for the national economy for future generations.
High technical value implicates high utility.
2.3.3.3 Involvement/participation of local economy
The participation of the local economy was divided in two categories. Category one, called life
cycle, takes all processes regarding the production, the refurbishment and the disposal into
account. It was assessed by appraising the contribution of CPE to all these processes of a certain
scenario. For example if the equipment was purchased no involvement for local economy was
allocated. Category two assessed the share of local economy for the transports of a certain
scenario. For example, if a computer had to be transferred from a foreign country to Colombia,
then from the harbour to the refurbishment site and locally to schools the involvement of the local
economy was calculated as one third. To get an approximation of the total
involvement/participation of the local economy the category life cycle was counted three times as
CHRISTIAN MARTHALER APRIL 2008 21
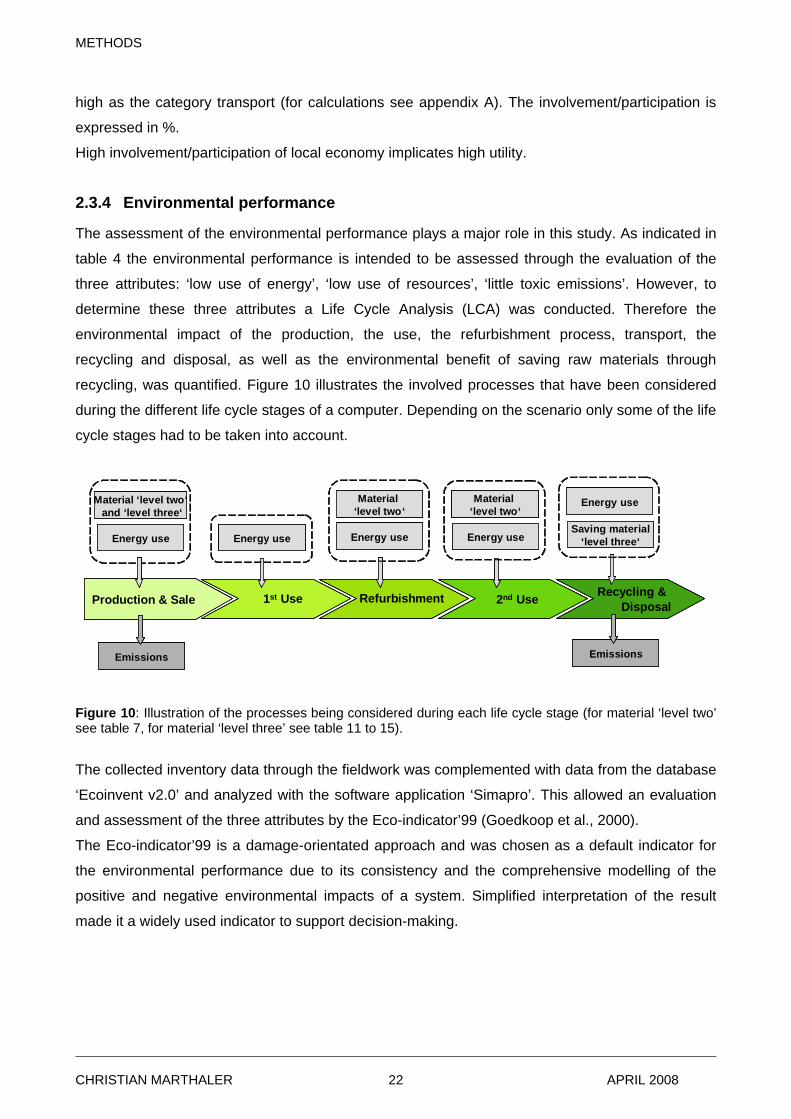
METHODS
high as the category transport (for calculations see appendix A). The involvement/participation is
expressed in %.
High involvement/participation of local economy implicates high utility.
2.3.4 Environmental performance
The assessment of the environmental performance plays a major role in this study. As indicated in
table 4 the environmental performance is intended to be assessed through the evaluation of the
three attributes: ‘low use of energy’, ‘low use of resources’, ‘little toxic emissions’. However, to
determine these three attributes a Life Cycle Analysis (LCA) was conducted. Therefore the
environmental impact of the production, the use, the refurbishment process, transport, the
recycling and disposal, as well as the environmental benefit of saving raw materials through
recycling, was quantified. Figure 10 illustrates the involved processes that have been considered
during the different life cycle stages of a computer. Depending on the scenario only some of the life
cycle stages had to be taken into account.
Recycling &DisposalProduction & Sale UseProduction & Sale 1st Use Refurbishment 2nd Use
Material ‘level two‘and ‘level three‘
Energy use
Emissions
Energy use
Material ‘level two‘
Energy useSaving material
‘level three‘
Energy use
Emissions
Energy use
Material ‘level two‘
Recycling &DisposalProduction & Sale UseProduction & Sale 1st Use Refurbishment 2nd Use
Material ‘level two‘and ‘level three‘
Energy use
Emissions
Energy use
Material ‘level two‘
Energy useSaving material
‘level three‘
Energy use
Emissions
Energy use
Material ‘level two‘
Figure 10: Illustration of the processes being considered during each life cycle stage (for material ‘level two’ see table 7, for material ‘level three’ see table 11 to 15). The collected inventory data through the fieldwork was complemented with data from the database
‘Ecoinvent v2.0’ and analyzed with the software application ‘Simapro’. This allowed an evaluation
and assessment of the three attributes by the Eco-indicator’99 (Goedkoop et al., 2000).
The Eco-indicator’99 is a damage-orientated approach and was chosen as a default indicator for
the environmental performance due to its consistency and the comprehensive modelling of the
positive and negative environmental impacts of a system. Simplified interpretation of the result
made it a widely used indicator to support decision-making.
CHRISTIAN MARTHALER APRIL 2008 22
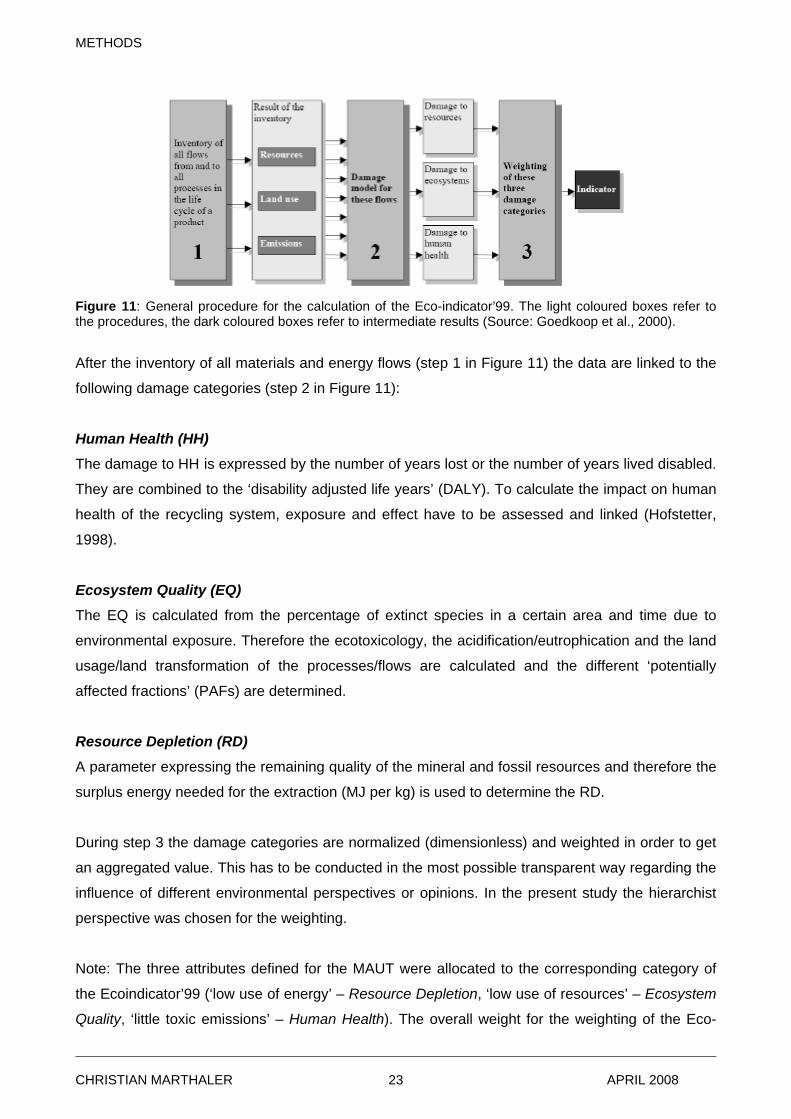
METHODS
Figure 11: General procedure for the calculation of the Eco-indicator’99. The light coloured boxes refer to the procedures, the dark coloured boxes refer to intermediate results (Source: Goedkoop et al., 2000).
After the inventory of all materials and energy flows (step 1 in Figure 11) the data are linked to the
following damage categories (step 2 in Figure 11):
Human Health (HH)
The damage to HH is expressed by the number of years lost or the number of years lived disabled.
They are combined to the ‘disability adjusted life years’ (DALY). To calculate the impact on human
health of the recycling system, exposure and effect have to be assessed and linked (Hofstetter,
1998).
Ecosystem Quality (EQ)
The EQ is calculated from the percentage of extinct species in a certain area and time due to
environmental exposure. Therefore the ecotoxicology, the acidification/eutrophication and the land
usage/land transformation of the processes/flows are calculated and the different ‘potentially
affected fractions’ (PAFs) are determined.
Resource Depletion (RD)
A parameter expressing the remaining quality of the mineral and fossil resources and therefore the
surplus energy needed for the extraction (MJ per kg) is used to determine the RD.
During step 3 the damage categories are normalized (dimensionless) and weighted in order to get
an aggregated value. This has to be conducted in the most possible transparent way regarding the
influence of different environmental perspectives or opinions. In the present study the hierarchist
perspective was chosen for the weighting.
Note: The three attributes defined for the MAUT were allocated to the corresponding category of
the Ecoindicator’99 (‘low use of energy’ – Resource Depletion, ‘low use of resources’ – Ecosystem
Quality, ‘little toxic emissions’ – Human Health). The overall weight for the weighting of the Eco-
CHRISTIAN MARTHALER APRIL 2008 23
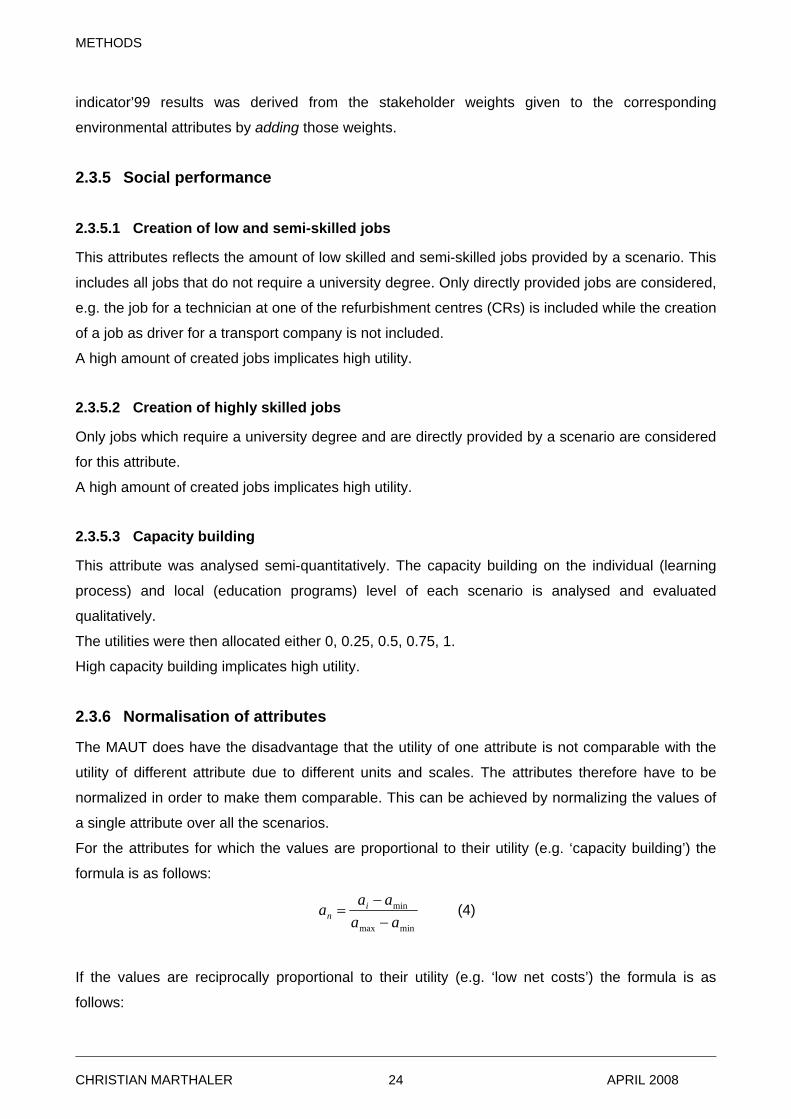
METHODS
indicator’99 results was derived from the stakeholder weights given to the corresponding
environmental attributes by adding those weights.
2.3.5 Social performance
2.3.5.1 Creation of low and semi-skilled jobs
This attributes reflects the amount of low skilled and semi-skilled jobs provided by a scenario. This
includes all jobs that do not require a university degree. Only directly provided jobs are considered,
e.g. the job for a technician at one of the refurbishment centres (CRs) is included while the creation
of a job as driver for a transport company is not included.
A high amount of created jobs implicates high utility.
2.3.5.2 Creation of highly skilled jobs
Only jobs which require a university degree and are directly provided by a scenario are considered
for this attribute.
A high amount of created jobs implicates high utility.
2.3.5.3 Capacity building
This attribute was analysed semi-quantitatively. The capacity building on the individual (learning
process) and local (education programs) level of each scenario is analysed and evaluated
qualitatively.
The utilities were then allocated either 0, 0.25, 0.5, 0.75, 1.
High capacity building implicates high utility.
2.3.6 Normalisation of attributes
The MAUT does have the disadvantage that the utility of one attribute is not comparable with the
utility of different attribute due to different units and scales. The attributes therefore have to be
normalized in order to make them comparable. This can be achieved by normalizing the values of
a single attribute over all the scenarios.
For the attributes for which the values are proportional to their utility (e.g. ‘capacity building’) the
formula is as follows:
minmax
min
aaaaa i
n −−
= (4)
If the values are reciprocally proportional to their utility (e.g. ‘low net costs’) the formula is as
follows:
CHRISTIAN MARTHALER APRIL 2008 24
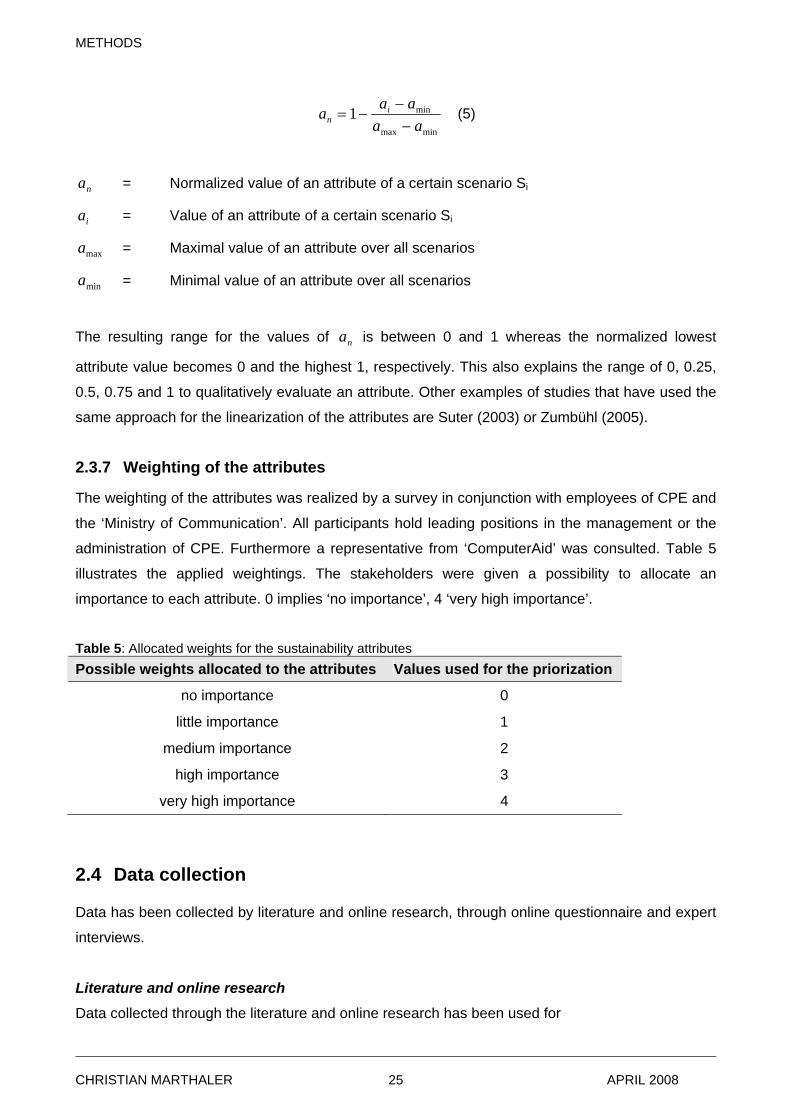
METHODS
minmax
min1aa
aaa in −
−−= (5)
na = Normalized value of an attribute of a certain scenario Si
ia = Value of an attribute of a certain scenario Si
maxa = Maximal value of an attribute over all scenarios
mina = Minimal value of an attribute over all scenarios
The resulting range for the values of is between 0 and 1 whereas the normalized lowest
attribute value becomes 0 and the highest 1, respectively. This also explains the range of 0, 0.25,
0.5, 0.75 and 1 to qualitatively evaluate an attribute. Other examples of studies that have used the
same approach for the linearization of the attributes are Suter (2003) or Zumbühl (2005).
na
2.3.7 Weighting of the attributes
The weighting of the attributes was realized by a survey in conjunction with employees of CPE and
the ‘Ministry of Communication’. All participants hold leading positions in the management or the
administration of CPE. Furthermore a representative from ‘ComputerAid’ was consulted. Table 5
illustrates the applied weightings. The stakeholders were given a possibility to allocate an
importance to each attribute. 0 implies ‘no importance’, 4 ‘very high importance’.
Table 5: Allocated weights for the sustainability attributes Possible weights allocated to the attributes Values used for the priorization
no importance 0
little importance 1
medium importance 2
high importance 3
very high importance 4
2.4 Data collection
Data has been collected by literature and online research, through online questionnaire and expert
interviews.
Literature and online research
Data collected through the literature and online research has been used for
CHRISTIAN MARTHALER APRIL 2008 25
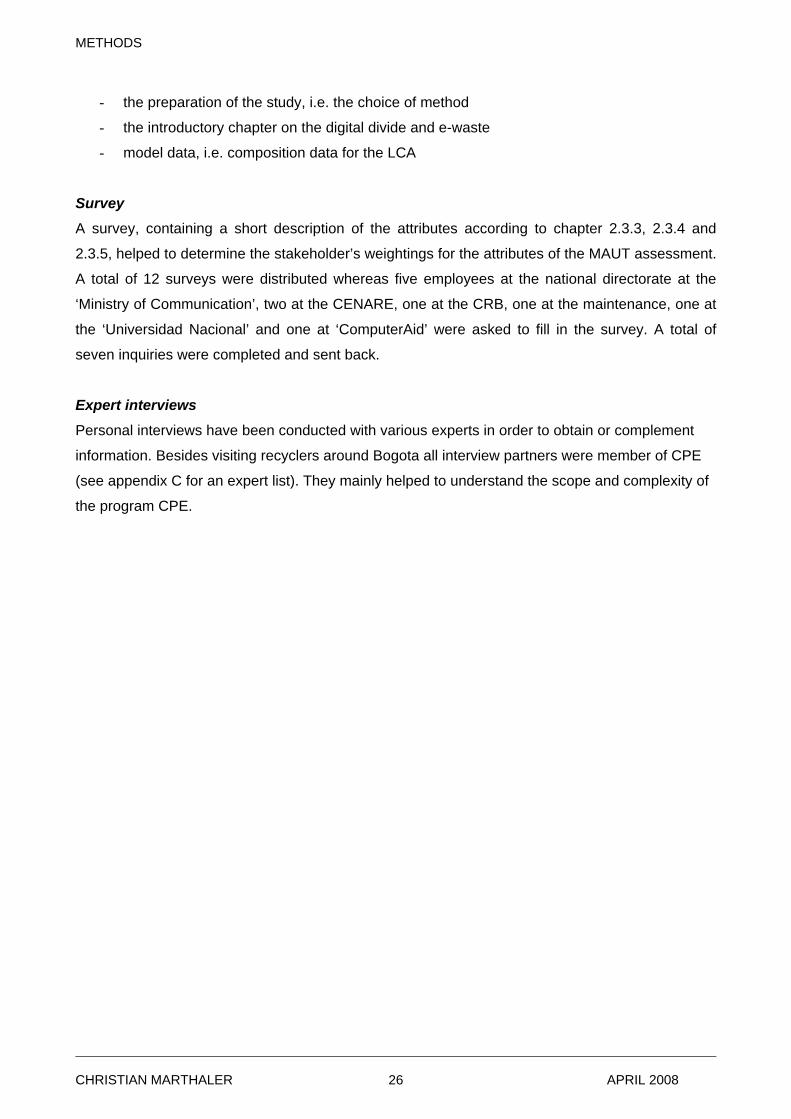
METHODS
- the preparation of the study, i.e. the choice of method
- the introductory chapter on the digital divide and e-waste
- model data, i.e. composition data for the LCA
Survey
A survey, containing a short description of the attributes according to chapter 2.3.3, 2.3.4 and
2.3.5, helped to determine the stakeholder’s weightings for the attributes of the MAUT assessment.
A total of 12 surveys were distributed whereas five employees at the national directorate at the
‘Ministry of Communication’, two at the CENARE, one at the CRB, one at the maintenance, one at
the ‘Universidad Nacional’ and one at ‘ComputerAid’ were asked to fill in the survey. A total of
seven inquiries were completed and sent back.
Expert interviews
Personal interviews have been conducted with various experts in order to obtain or complement
information. Besides visiting recyclers around Bogota all interview partners were member of CPE
(see appendix C for an expert list). They mainly helped to understand the scope and complexity of
the program CPE.
CHRISTIAN MARTHALER APRIL 2008 26
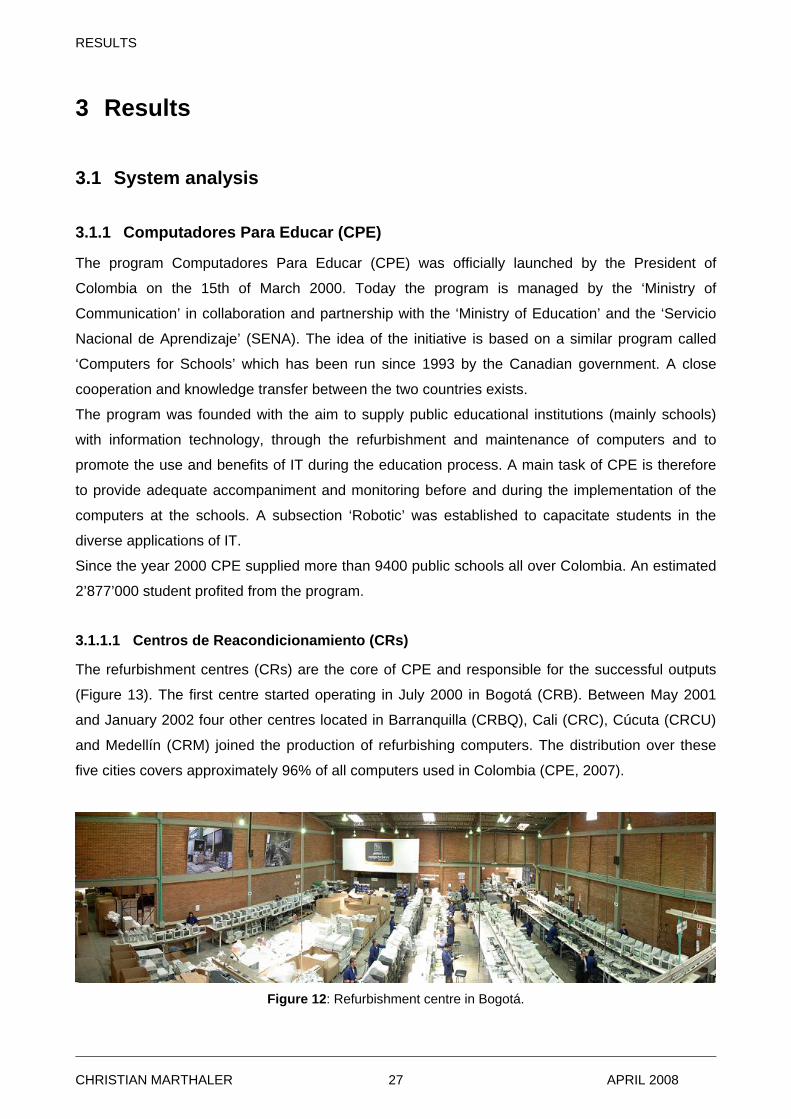
RESULTS
3 Results
3.1 System analysis
3.1.1 Computadores Para Educar (CPE)
The program Computadores Para Educar (CPE) was officially launched by the President of
Colombia on the 15th of March 2000. Today the program is managed by the ‘Ministry of
Communication’ in collaboration and partnership with the ‘Ministry of Education’ and the ‘Servicio
Nacional de Aprendizaje’ (SENA). The idea of the initiative is based on a similar program called
‘Computers for Schools’ which has been run since 1993 by the Canadian government. A close
cooperation and knowledge transfer between the two countries exists.
The program was founded with the aim to supply public educational institutions (mainly schools)
with information technology, through the refurbishment and maintenance of computers and to
promote the use and benefits of IT during the education process. A main task of CPE is therefore
to provide adequate accompaniment and monitoring before and during the implementation of the
computers at the schools. A subsection ‘Robotic’ was established to capacitate students in the
diverse applications of IT.
Since the year 2000 CPE supplied more than 9400 public schools all over Colombia. An estimated
2’877’000 student profited from the program.
3.1.1.1 Centros de Reacondicionamiento (CRs)
The refurbishment centres (CRs) are the core of CPE and responsible for the successful outputs
(Figure 13). The first centre started operating in July 2000 in Bogotá (CRB). Between May 2001
and January 2002 four other centres located in Barranquilla (CRBQ), Cali (CRC), Cúcuta (CRCU)
and Medellín (CRM) joined the production of refurbishing computers. The distribution over these
five cities covers approximately 96% of all computers used in Colombia (CPE, 2007).
Figure 12: Refurbishment centre in Bogotá.
CHRISTIAN MARTHALER APRIL 2008 27
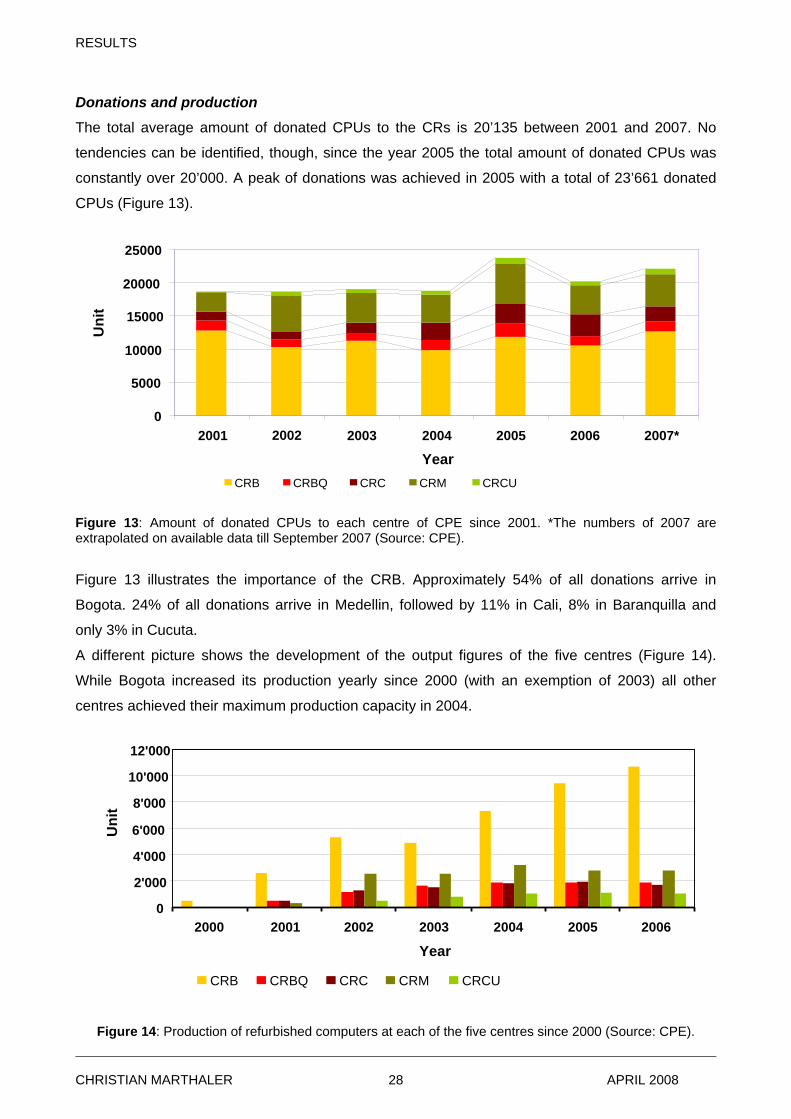
RESULTS
Donations and production
The total average amount of donated CPUs to the CRs is 20’135 between 2001 and 2007. No
tendencies can be identified, though, since the year 2005 the total amount of donated CPUs was
constantly over 20’000. A peak of donations was achieved in 2005 with a total of 23’661 donated
CPUs (Figure 13).
0
5000
10000
15000
20000
25000
2001 2002 2003 2004 2005 2006 2007*
Year
Uni
t
CRB CRBQ CRC CRM CRCU
Figure 13: Amount of donated CPUs to each centre of CPE since 2001. *The numbers of 2007 are extrapolated on available data till September 2007 (Source: CPE).
Figure 13 illustrates the importance of the CRB. Approximately 54% of all donations arrive in
Bogota. 24% of all donations arrive in Medellin, followed by 11% in Cali, 8% in Baranquilla and
only 3% in Cucuta.
A different picture shows the development of the output figures of the five centres (Figure 14).
While Bogota increased its production yearly since 2000 (with an exemption of 2003) all other
centres achieved their maximum production capacity in 2004.
0
2'000
4'000
6'000
8'000
10'000
12'000
2000 2001 2002 2003 2004 2005 2006
Year
Uni
t
CRB CRBQ CRC CRM CRCU
Figure 14: Production of refurbished computers at each of the five centres since 2000 (Source: CPE).
CHRISTIAN MARTHALER APRIL 2008 28
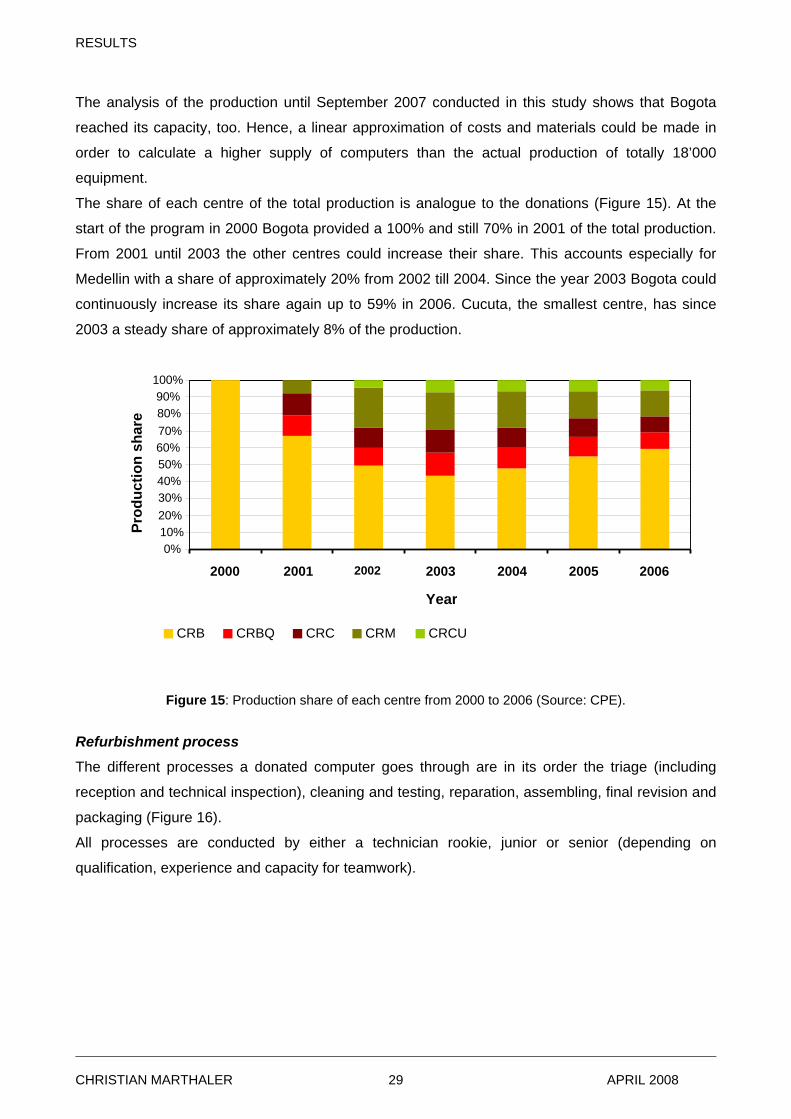
RESULTS
The analysis of the production until September 2007 conducted in this study shows that Bogota
reached its capacity, too. Hence, a linear approximation of costs and materials could be made in
order to calculate a higher supply of computers than the actual production of totally 18’000
equipment.
The share of each centre of the total production is analogue to the donations (Figure 15). At the
start of the program in 2000 Bogota provided a 100% and still 70% in 2001 of the total production.
From 2001 until 2003 the other centres could increase their share. This accounts especially for
Medellin with a share of approximately 20% from 2002 till 2004. Since the year 2003 Bogota could
continuously increase its share again up to 59% in 2006. Cucuta, the smallest centre, has since
2003 a steady share of approximately 8% of the production.
0% 10% 20% 30% 40% 50% 60% 70% 80% 90%
100%
2000 2001 2002 2003 2004 2005 2006
Year
Prod
uctio
n sh
are
CRB CRBQ CRC CRM CRCU
Figure 15: Production share of each centre from 2000 to 2006 (Source: CPE).
Refurbishment process
The different processes a donated computer goes through are in its order the triage (including
reception and technical inspection), cleaning and testing, reparation, assembling, final revision and
packaging (Figure 16).
All processes are conducted by either a technician rookie, junior or senior (depending on
qualification, experience and capacity for teamwork).
CHRISTIAN MARTHALER APRIL 2008 29
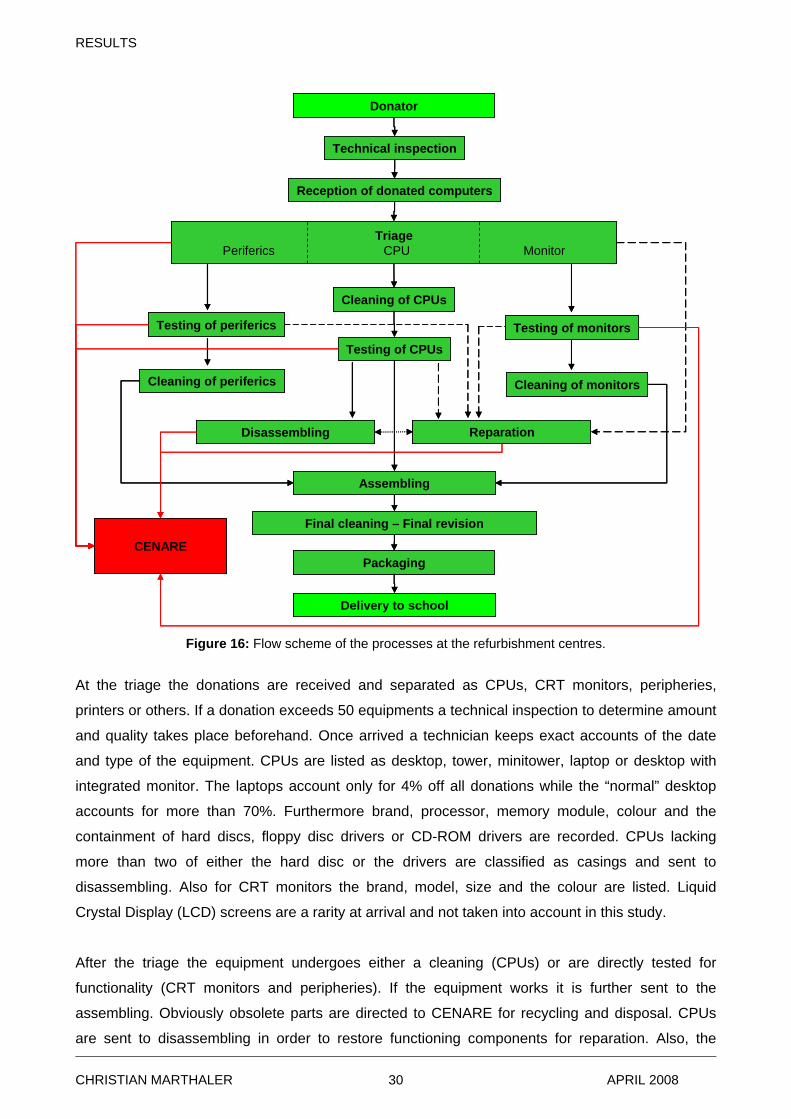
RESULTS
Technical inspection
Reception of donated computers
TriagePeriferics CPU Monitor
Assembling
Final cleaning – Final revision
Packaging
Delivery to school
Testing of periferics Testing of monitors
Reparation
Cleaning of CPUs
Testing of CPUs
Cleaning of periferics Cleaning of monitors
Disassembling
CENARE
Donator
Figure 16: Flow scheme of the processes at the refurbishment centres.
At the triage the donations are received and separated as CPUs, CRT monitors, peripheries,
printers or others. If a donation exceeds 50 equipments a technical inspection to determine amount
and quality takes place beforehand. Once arrived a technician keeps exact accounts of the date
and type of the equipment. CPUs are listed as desktop, tower, minitower, laptop or desktop with
integrated monitor. The laptops account only for 4% off all donations while the “normal” desktop
accounts for more than 70%. Furthermore brand, processor, memory module, colour and the
containment of hard discs, floppy disc drivers or CD-ROM drivers are recorded. CPUs lacking
more than two of either the hard disc or the drivers are classified as casings and sent to
disassembling. Also for CRT monitors the brand, model, size and the colour are listed. Liquid
Crystal Display (LCD) screens are a rarity at arrival and not taken into account in this study.
After the triage the equipment undergoes either a cleaning (CPUs) or are directly tested for
functionality (CRT monitors and peripheries). If the equipment works it is further sent to the
assembling. Obviously obsolete parts are directed to CENARE for recycling and disposal. CPUs
are sent to disassembling in order to restore functioning components for reparation. Also, the
CHRISTIAN MARTHALER APRIL 2008 30
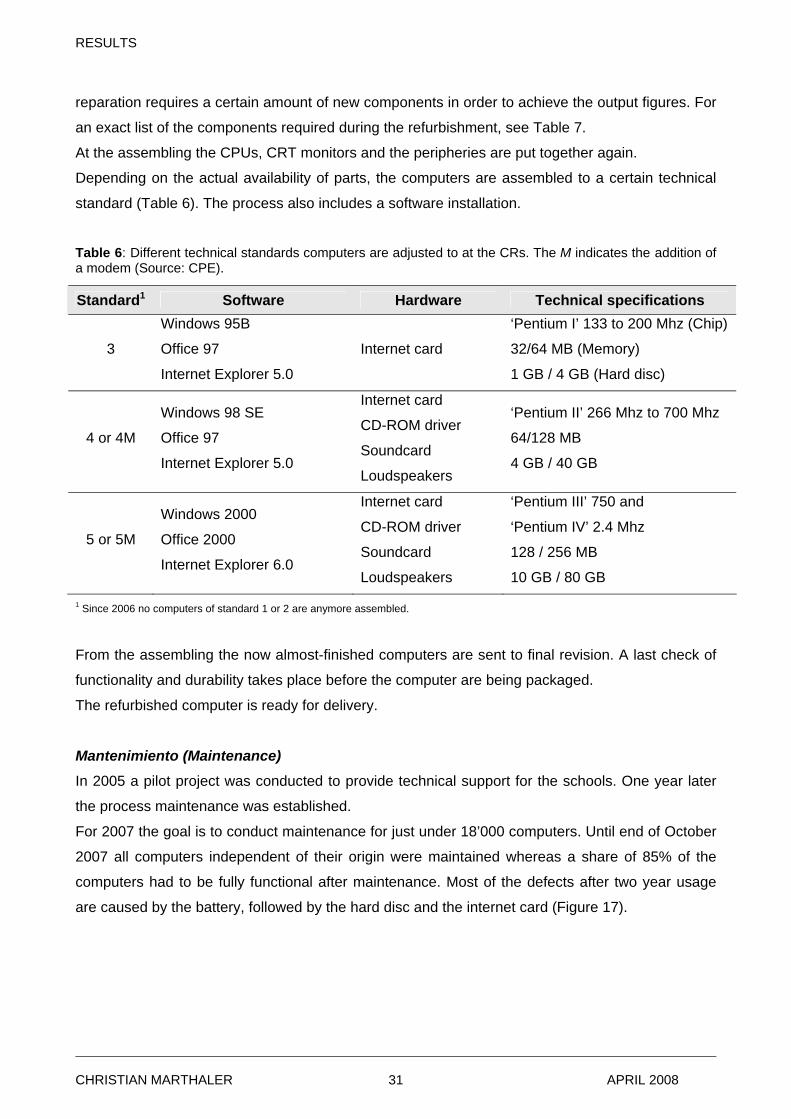
RESULTS
reparation requires a certain amount of new components in order to achieve the output figures. For
an exact list of the components required during the refurbishment, see Table 7.
At the assembling the CPUs, CRT monitors and the peripheries are put together again.
Depending on the actual availability of parts, the computers are assembled to a certain technical
standard (Table 6). The process also includes a software installation.
Table 6: Different technical standards computers are adjusted to at the CRs. The M indicates the addition of a modem (Source: CPE).
Standard1 Software Hardware Technical specifications
3
Windows 95B
Office 97
Internet Explorer 5.0
Internet card
‘Pentium I’ 133 to 200 Mhz (Chip)
32/64 MB (Memory)
1 GB / 4 GB (Hard disc)
4 or 4M
Windows 98 SE
Office 97
Internet Explorer 5.0
Internet card
CD-ROM driver
Soundcard
Loudspeakers
‘Pentium II’ 266 Mhz to 700 Mhz
64/128 MB
4 GB / 40 GB
5 or 5M
Windows 2000
Office 2000
1 Since 2006 no computers of standard 1 or 2 are anymore assembled.
From the assembling the now almost-finished computers are sent to final revision. A last check of
functionality and durability takes place before the computer are being packaged.
The refurbished computer is ready for delivery.
Mantenimiento (Maintenance)
In 2005 a pilot project was conducted to provide technical support for the schools. One year later
the process maintenance was established.
For 2007 the goal is to conduct maintenance for just under 18’000 computers. Until end of October
2007 all computers independent of their origin were maintained whereas a share of 85% of the
computers had to be fully functional after maintenance. Most of the defects after two year usage
are caused by the battery, followed by the hard disc and the internet card (Figure 17).
Internet Explorer 6.0
Internet card
CD-ROM driver
Soundcard
Loudspeakers
‘Pentium III’ 750 and
‘Pentium IV’ 2.4 Mhz
128 / 256 MB
10 GB / 80 GB
CHRISTIAN MARTHALER APRIL 2008 31
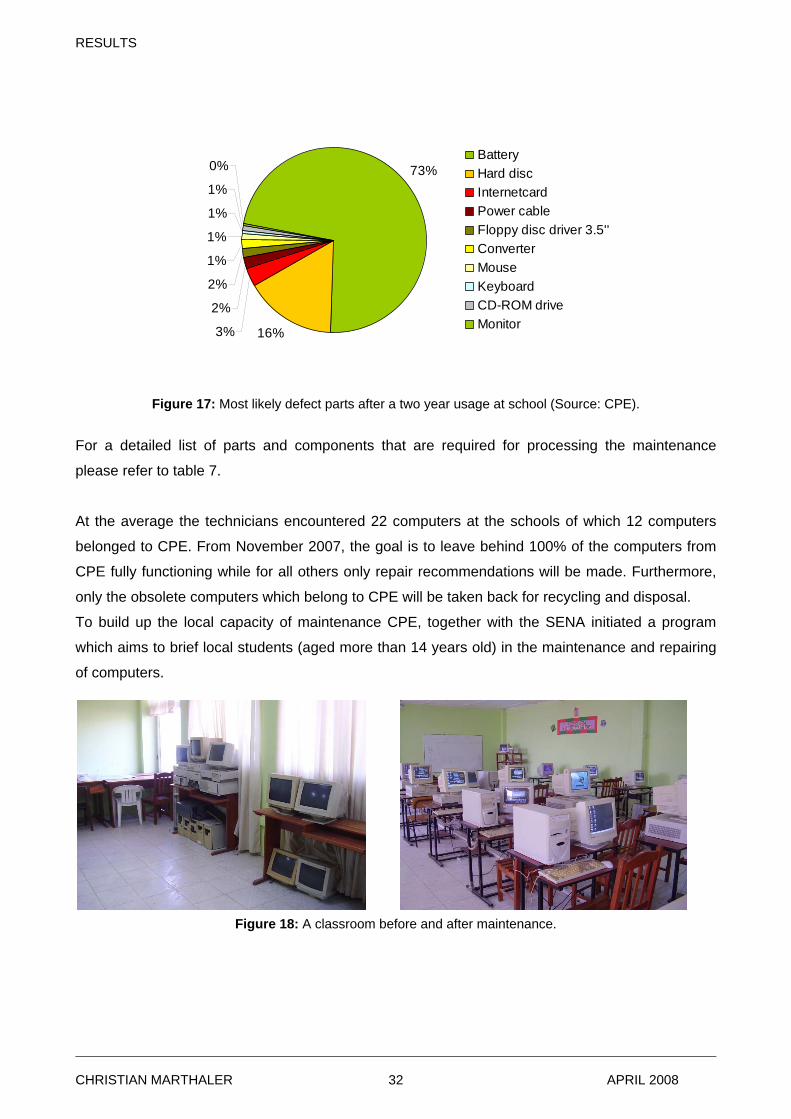
RESULTS
73%
16%3%
2%
2%
1%
1%
1%
1%
0%BatteryHard discInternetcardPower cableFloppy disc driver 3.5''ConverterMouseKeyboardCD-ROM driveMonitor
Figure 17: Most likely defect parts after a two year usage at school (Source: CPE).
For a detailed list of parts and components that are required for processing the maintenance
please refer to table 7.
At the average the technicians encountered 22 computers at the schools of which 12 computers
belonged to CPE. From November 2007, the goal is to leave behind 100% of the computers from
CPE fully functioning while for all others only repair recommendations will be made. Furthermore,
only the obsolete computers which belong to CPE will be taken back for recycling and disposal.
To build up the local capacity of maintenance CPE, together with the SENA initiated a program
which aims to brief local students (aged more than 14 years old) in the maintenance and repairing
of computers.
Figure 18: A classroom before and after maintenance.
CHRISTIAN MARTHALER APRIL 2008 32
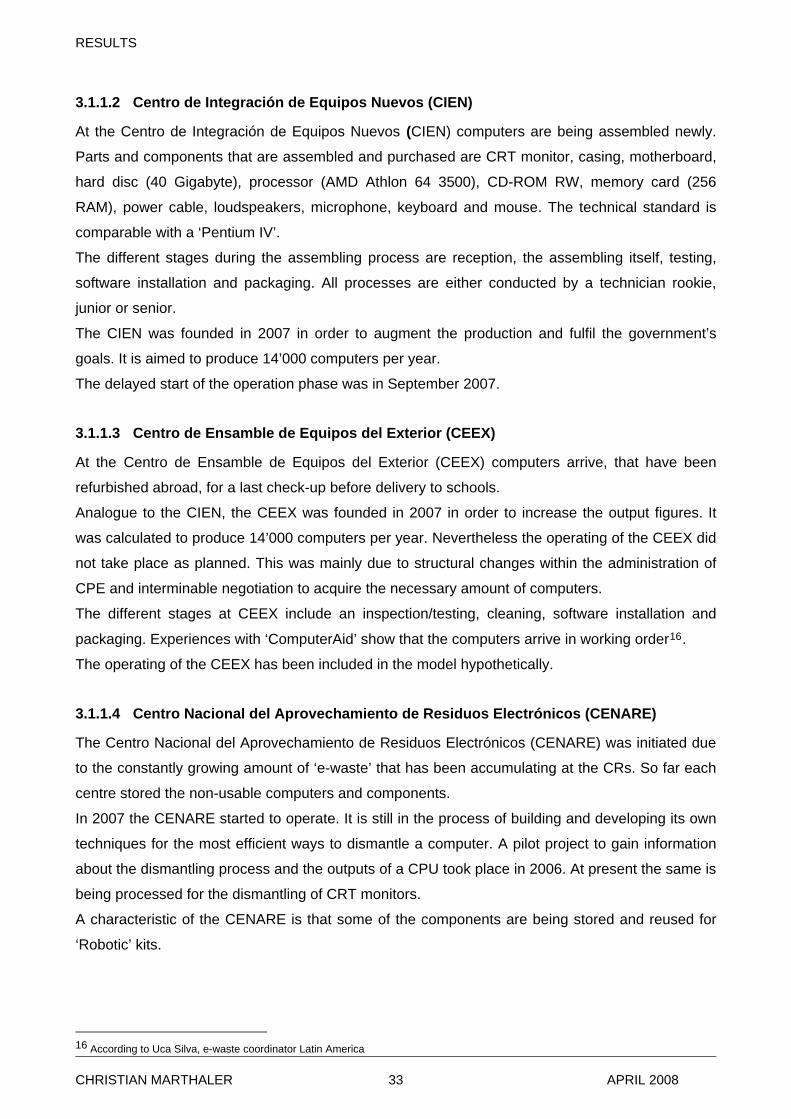
RESULTS
3.1.1.2 Centro de Integración de Equipos Nuevos (CIEN)
At the Centro de Integración de Equipos Nuevos (CIEN) computers are being assembled newly.
Parts and components that are assembled and purchased are CRT monitor, casing, motherboard,
hard disc (40 Gigabyte), processor (AMD Athlon 64 3500), CD-ROM RW, memory card (256
RAM), power cable, loudspeakers, microphone, keyboard and mouse. The technical standard is
comparable with a ‘Pentium IV’.
The different stages during the assembling process are reception, the assembling itself, testing,
software installation and packaging. All processes are either conducted by a technician rookie,
junior or senior.
The CIEN was founded in 2007 in order to augment the production and fulfil the government’s
goals. It is aimed to produce 14’000 computers per year.
The delayed start of the operation phase was in September 2007.
3.1.1.3 Centro de Ensamble de Equipos del Exterior (CEEX)
At the Centro de Ensamble de Equipos del Exterior (CEEX) computers arrive, that have been
refurbished abroad, for a last check-up before delivery to schools.
Analogue to the CIEN, the CEEX was founded in 2007 in order to increase the output figures. It
was calculated to produce 14’000 computers per year. Nevertheless the operating of the CEEX did
not take place as planned. This was mainly due to structural changes within the administration of
CPE and interminable negotiation to acquire the necessary amount of computers.
The different stages at CEEX include an inspection/testing, cleaning, software installation and
packaging. Experiences with ‘ComputerAid’ show that the computers arrive in working order16.
The operating of the CEEX has been included in the model hypothetically.
3.1.1.4 Centro Nacional del Aprovechamiento de Residuos Electrónicos (CENARE)
The Centro Nacional del Aprovechamiento de Residuos Electrónicos (CENARE) was initiated due
to the constantly growing amount of ‘e-waste’ that has been accumulating at the CRs. So far each
centre stored the non-usable computers and components.
In 2007 the CENARE started to operate. It is still in the process of building and developing its own
techniques for the most efficient ways to dismantle a computer. A pilot project to gain information
about the dismantling process and the outputs of a CPU took place in 2006. At present the same is
being processed for the dismantling of CRT monitors.
A characteristic of the CENARE is that some of the components are being stored and reused for
‘Robotic’ kits.
16 According to Uca Silva, e-waste coordinator Latin America
CHRISTIAN MARTHALER APRIL 2008 33
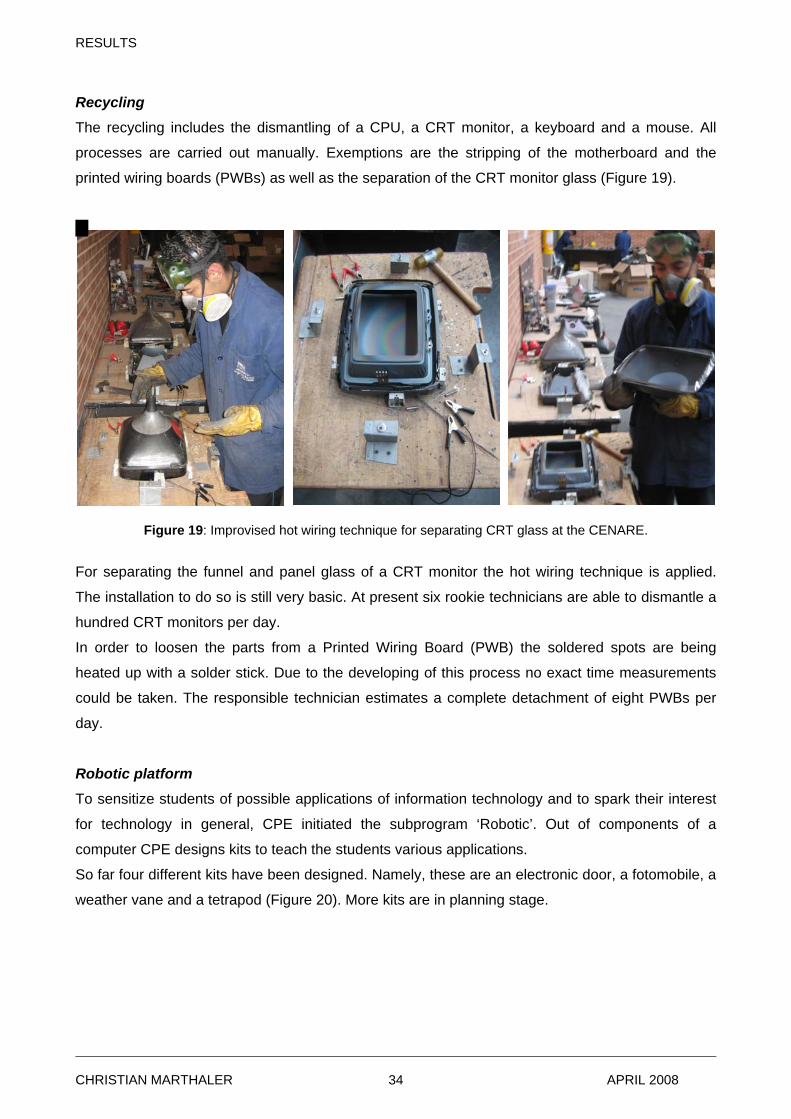
RESULTS
Recycling
The recycling includes the dismantling of a CPU, a CRT monitor, a keyboard and a mouse. All
processes are carried out manually. Exemptions are the stripping of the motherboard and the
printed wiring boards (PWBs) as well as the separation of the CRT monitor glass (Figure 19).
Figure 19: Improvised hot wiring technique for separating CRT glass at the CENARE.
For separating the funnel and panel glass of a CRT monitor the hot wiring technique is applied.
The installation to do so is still very basic. At present six rookie technicians are able to dismantle a
hundred CRT monitors per day.
In order to loosen the parts from a Printed Wiring Board (PWB) the soldered spots are being
heated up with a solder stick. Due to the developing of this process no exact time measurements
could be taken. The responsible technician estimates a complete detachment of eight PWBs per
day.
Robotic platform
To sensitize students of possible applications of information technology and to spark their interest
for technology in general, CPE initiated the subprogram ‘Robotic’. Out of components of a
computer CPE designs kits to teach the students various applications.
So far four different kits have been designed. Namely, these are an electronic door, a fotomobile, a
weather vane and a tetrapod (Figure 20). More kits are in planning stage.
CHRISTIAN MARTHALER APRIL 2008 34
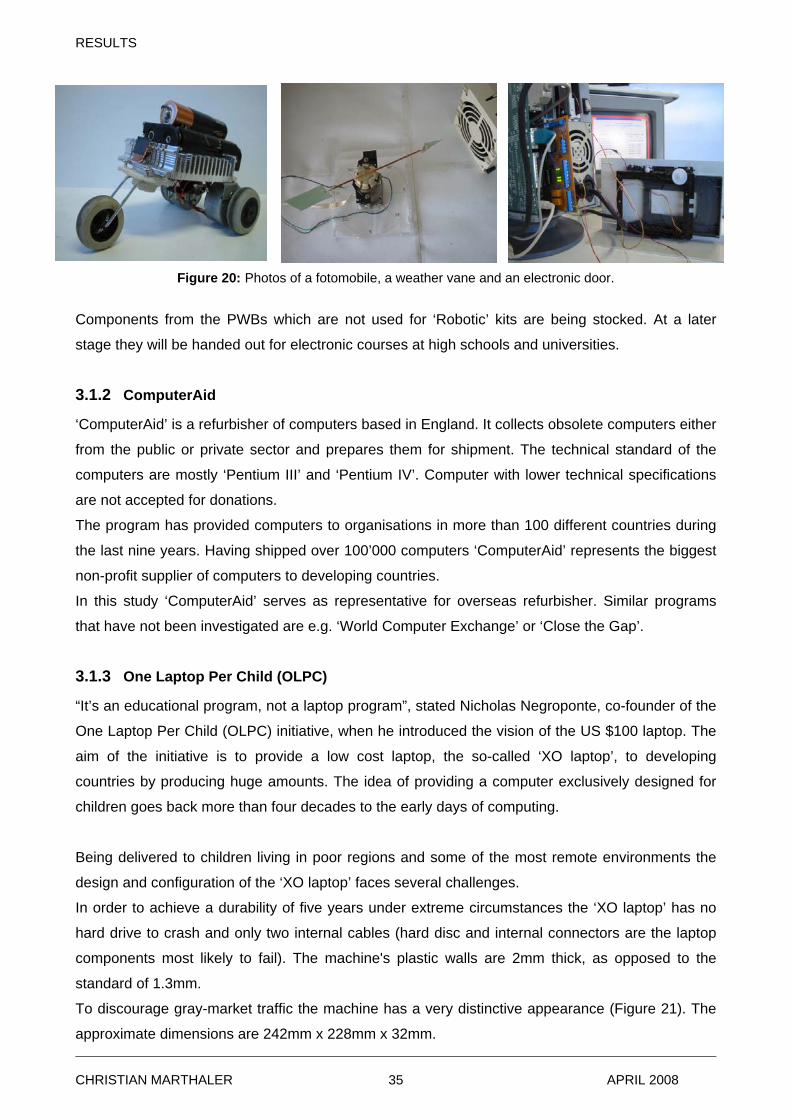
RESULTS
Figure 20: Photos of a fotomobile, a weather vane and an electronic door.
Components from the PWBs which are not used for ‘Robotic’ kits are being stocked. At a later
stage they will be handed out for electronic courses at high schools and universities.
3.1.2 ComputerAid
‘ComputerAid’ is a refurbisher of computers based in England. It collects obsolete computers either
from the public or private sector and prepares them for shipment. The technical standard of the
computers are mostly ‘Pentium III’ and ‘Pentium IV’. Computer with lower technical specifications
are not accepted for donations.
The program has provided computers to organisations in more than 100 different countries during
the last nine years. Having shipped over 100’000 computers ‘ComputerAid’ represents the biggest
non-profit supplier of computers to developing countries.
In this study ‘ComputerAid’ serves as representative for overseas refurbisher. Similar programs
that have not been investigated are e.g. ‘World Computer Exchange’ or ‘Close the Gap’.
3.1.3 One Laptop Per Child (OLPC)
“It’s an educational program, not a laptop program”, stated Nicholas Negroponte, co-founder of the
One Laptop Per Child (OLPC) initiative, when he introduced the vision of the US $100 laptop. The
aim of the initiative is to provide a low cost laptop, the so-called ‘XO laptop’, to developing
countries by producing huge amounts. The idea of providing a computer exclusively designed for
children goes back more than four decades to the early days of computing.
Being delivered to children living in poor regions and some of the most remote environments the
design and configuration of the ‘XO laptop’ faces several challenges.
In order to achieve a durability of five years under extreme circumstances the ‘XO laptop’ has no
hard drive to crash and only two internal cables (hard disc and internal connectors are the laptop
components most likely to fail). The machine's plastic walls are 2mm thick, as opposed to the
standard of 1.3mm.
To discourage gray-market traffic the machine has a very distinctive appearance (Figure 21). The
approximate dimensions are 242mm x 228mm x 32mm.
CHRISTIAN MARTHALER APRIL 2008 35
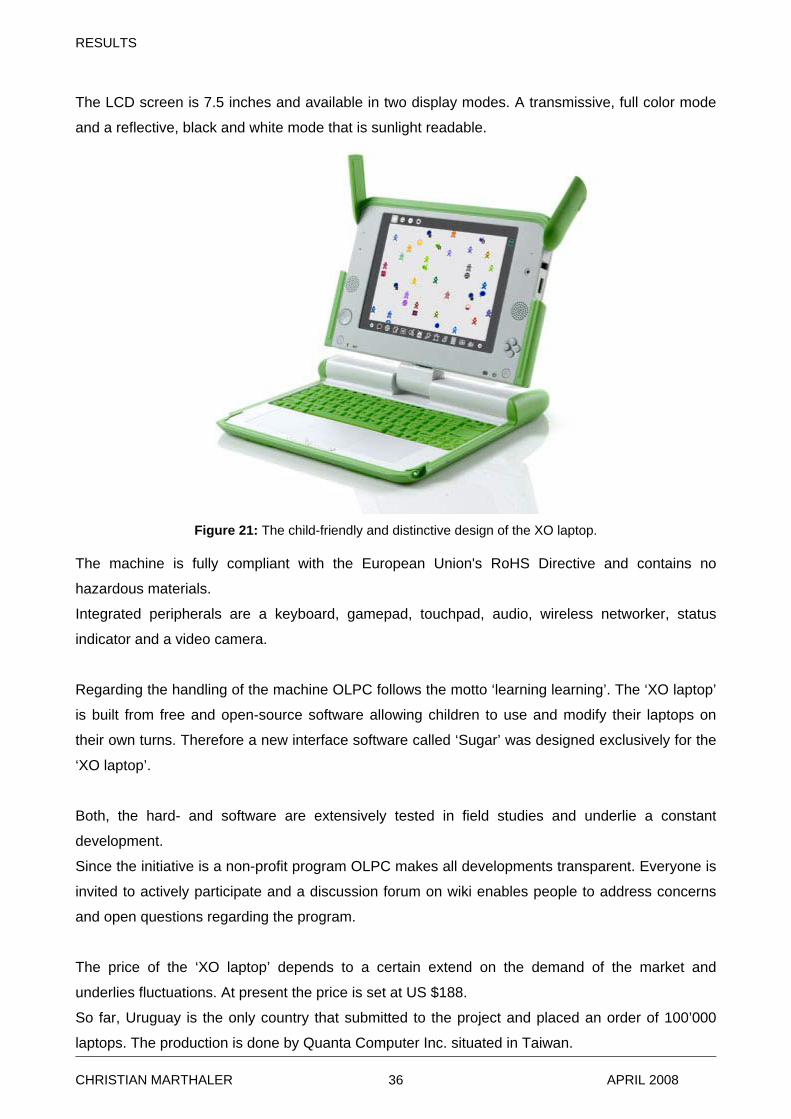
RESULTS
The LCD screen is 7.5 inches and available in two display modes. A transmissive, full color mode
and a reflective, black and white mode that is sunlight readable.
Figure 21: The child-friendly and distinctive design of the XO laptop.
The machine is fully compliant with the European Union's RoHS Directive and contains no
hazardous materials.
Integrated peripherals are a keyboard, gamepad, touchpad, audio, wireless networker, status
indicator and a video camera.
Regarding the handling of the machine OLPC follows the motto ‘learning learning’. The ‘XO laptop’
is built from free and open-source software allowing children to use and modify their laptops on
their own turns. Therefore a new interface software called ‘Sugar’ was designed exclusively for the
‘XO laptop’.
Both, the hard- and software are extensively tested in field studies and underlie a constant
development.
Since the initiative is a non-profit program OLPC makes all developments transparent. Everyone is
invited to actively participate and a discussion forum on wiki enables people to address concerns
and open questions regarding the program.
The price of the ‘XO laptop’ depends to a certain extend on the demand of the market and
underlies fluctuations. At present the price is set at US $188.
So far, Uruguay is the only country that submitted to the project and placed an order of 100’000
laptops. The production is done by Quanta Computer Inc. situated in Taiwan.
CHRISTIAN MARTHALER APRIL 2008 36
RESULTS
3.2 Mass flow analysis
3.2.1 Model input
3.2.1.1 Parts and components for refurbishment and maintenance
For the refurbishment processes CRs and ‘ComputerAid’ as well as for the process maintenance
the purchase of new parts and components is necessary. Table 7 gives an overview of all required
materials for the output of 1000 computers. For the process CR with computers of Colombia origin
the data is based on the average consumption of the years 2005/06/07 at the CRs. Data for
‘ComputerAid’ is based solely on the year 2006. For the process maintenance data was taken from
the projection and goals for the year 2007 made by CPE.
The data is used to determine the production costs as well as the environmental impacts of a
process. Due to lack of data in ‘Ecoinvent v2.0’ some of the components had to be replaced
through the author’s own estimation (see also appendix B). Due to the level of detail the inputs are
not illustrated graphically in chapter 3.2.2.
CHRISTIAN MARTHALER APRIL 2008 37
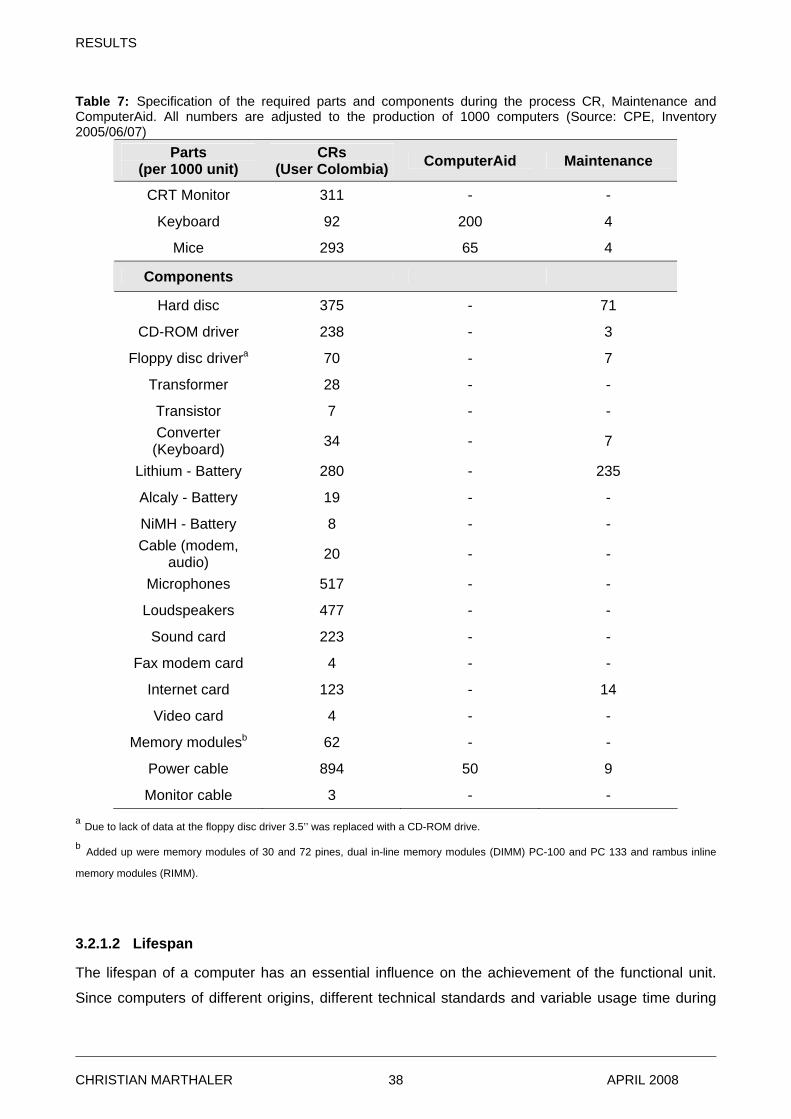
RESULTS
Table 7: Specification of the required parts and components during the process CR, Maintenance and ComputerAid. All numbers are adjusted to the production of 1000 computers (Source: CPE, Inventory 2005/06/07)
Parts (per 1000 unit)
CRs (User Colombia) ComputerAid Maintenance
CRT Monitor 311 - -
Keyboard 92 200 4
Mice 293 65 4
Components
Hard disc 375 - 71
CD-ROM driver 238 - 3
Floppy disc drivera 70 - 7
Transformer 28 - -
Transistor 7 - - Converter
(Keyboard) 34 - 7
Lithium - Battery 280 - 235
Alcaly - Battery 19 - -
NiMH - Battery 8 - - Cable (modem,
audio) 20 - -
Microphones 517 - -
Loudspeakers 477 - -
Sound card 223 - -
Fax modem card 4 - -
Internet card 123 - 14
Video card 4 - -
Memory modulesb 62 - -
Power cable 894 50 9
Monitor cable 3 - - a Due to lack of data at the floppy disc driver 3.5’’ was replaced with a CD-ROM drive. b Added up were memory modules of 30 and 72 pines, dual in-line memory modules (DIMM) PC-100 and PC 133 and rambus inline
memory modules (RIMM).
3.2.1.2 Lifespan
The lifespan of a computer has an essential influence on the achievement of the functional unit.
Since computers of different origins, different technical standards and variable usage time during
CHRISTIAN MARTHALER APRIL 2008 38
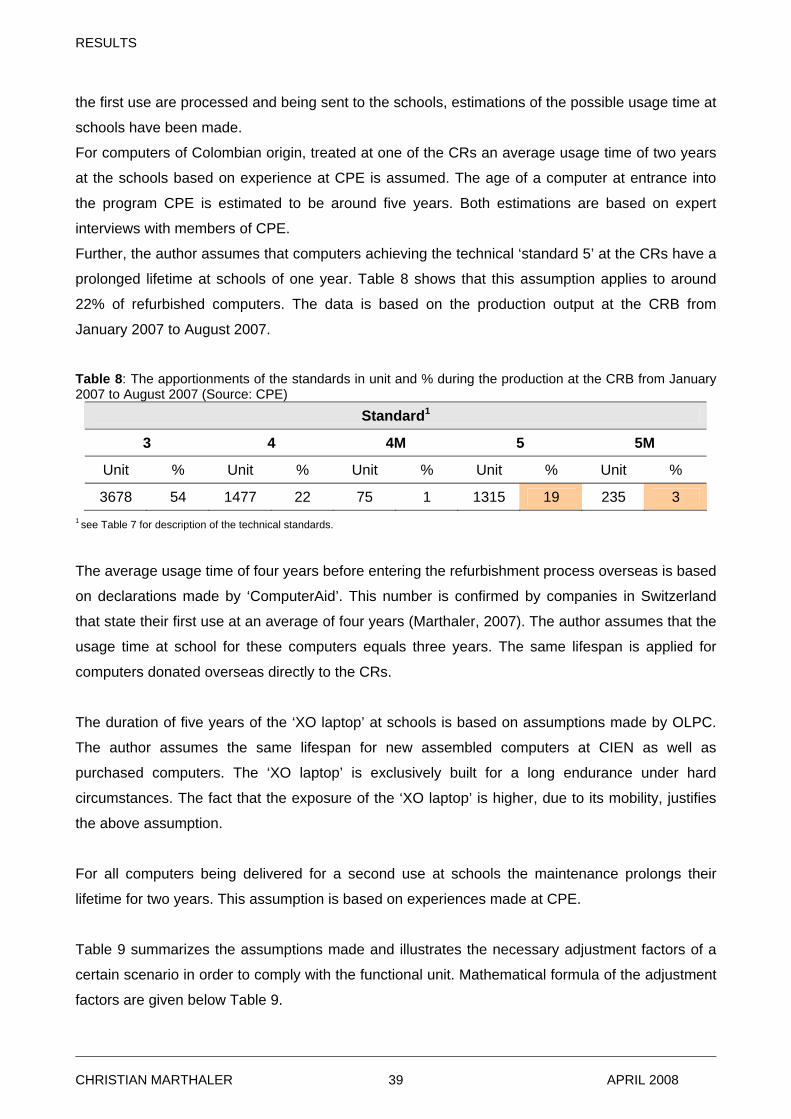
RESULTS
the first use are processed and being sent to the schools, estimations of the possible usage time at
schools have been made.
For computers of Colombian origin, treated at one of the CRs an average usage time of two years
at the schools based on experience at CPE is assumed. The age of a computer at entrance into
the program CPE is estimated to be around five years. Both estimations are based on expert
interviews with members of CPE.
Further, the author assumes that computers achieving the technical ‘standard 5’ at the CRs have a
prolonged lifetime at schools of one year. Table 8 shows that this assumption applies to around
22% of refurbished computers. The data is based on the production output at the CRB from
January 2007 to August 2007.
Table 8: The apportionments of the standards in unit and % during the production at the CRB from January 2007 to August 2007 (Source: CPE)
Standard1
3 4 4M 5 5M
Unit % Unit % Unit % Unit % Unit %
3678 54 1477 22 75 1 1315 19 235 3 1 see Table 7 for description of the technical standards.
The average usage time of four years before entering the refurbishment process overseas is based
on declarations made by ‘ComputerAid’. This number is confirmed by companies in Switzerland
that state their first use at an average of four years (Marthaler, 2007). The author assumes that the
usage time at school for these computers equals three years. The same lifespan is applied for
computers donated overseas directly to the CRs.
The duration of five years of the ‘XO laptop’ at schools is based on assumptions made by OLPC.
The author assumes the same lifespan for new assembled computers at CIEN as well as
purchased computers. The ‘XO laptop’ is exclusively built for a long endurance under hard
circumstances. The fact that the exposure of the ‘XO laptop’ is higher, due to its mobility, justifies
the above assumption.
For all computers being delivered for a second use at schools the maintenance prolongs their
lifetime for two years. This assumption is based on experiences made at CPE.
Table 9 summarizes the assumptions made and illustrates the necessary adjustment factors of a
certain scenario in order to comply with the functional unit. Mathematical formula of the adjustment
factors are given below Table 9.
CHRISTIAN MARTHALER APRIL 2008 39
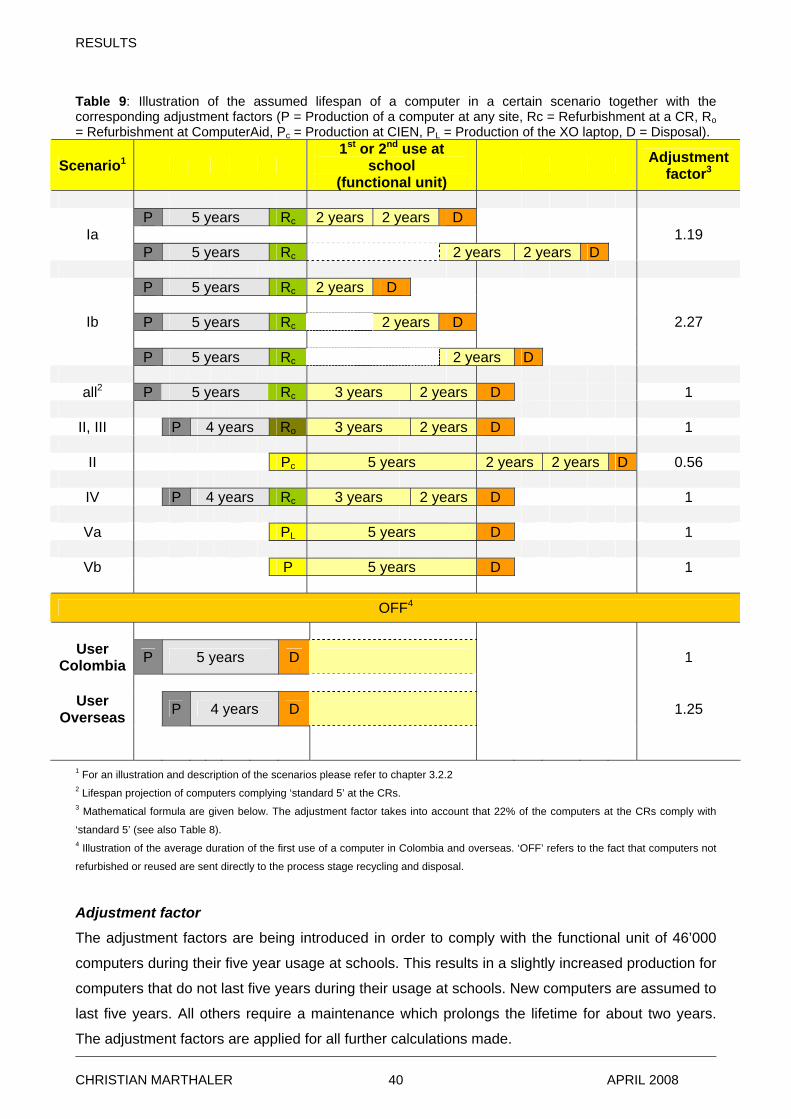
RESULTS
Table 9: Illustration of the assumed lifespan of a computer in a certain scenario together with the corresponding adjustment factors (P = Production of a computer at any site, Rc = Refurbishment at a CR, Ro = Refurbishment at ComputerAid, Pc = Production at CIEN, PL = Production of the XO laptop, D = Disposal).
Scenario1 1st or 2nd use at
school (functional unit)
Adjustment factor3
P 5 years Rc 2 years 2 years D Ia
P 5 years Rc 2 years 2 years D 1.19
P 5 years Rc 2 years D
P 5 years Rc 2 years D
Ib
P 5 years Rc 2 years D
2.27
all2 P 5 years Rc 3 years 2 years D 1
II, III P 4 years Ro 3 years 2 years D 1
II Pc 5 years 2 years 2 years D 0.56
IV P 4 years Rc 3 years 2 years D 1
Va PL 5 years D 1
Vb P 5 years D 1
OFF4
User
Colombia P 5 years D 1
User
Overseas P 4 years D 1.25
1 For an illustration and description of the scenarios please refer to chapter 3.2.2 2 Lifespan projection of computers complying ‘standard 5’ at the CRs. 3 Mathematical formula are given below. The adjustment factor takes into account that 22% of the computers at the CRs comply with
‘standard 5’ (see also Table 8). 4 Illustration of the average duration of the first use of a computer in Colombia and overseas. ‘OFF’ refers to the fact that computers not
refurbished or reused are sent directly to the process stage recycling and disposal.
Adjustment factor
The adjustment factors are being introduced in order to comply with the functional unit of 46’000
computers during their five year usage at schools. This results in a slightly increased production for
computers that do not last five years during their usage at schools. New computers are assumed to
last five years. All others require a maintenance which prolongs the lifetime for about two years.
The adjustment factors are applied for all further calculations made.
CHRISTIAN MARTHALER APRIL 2008 40
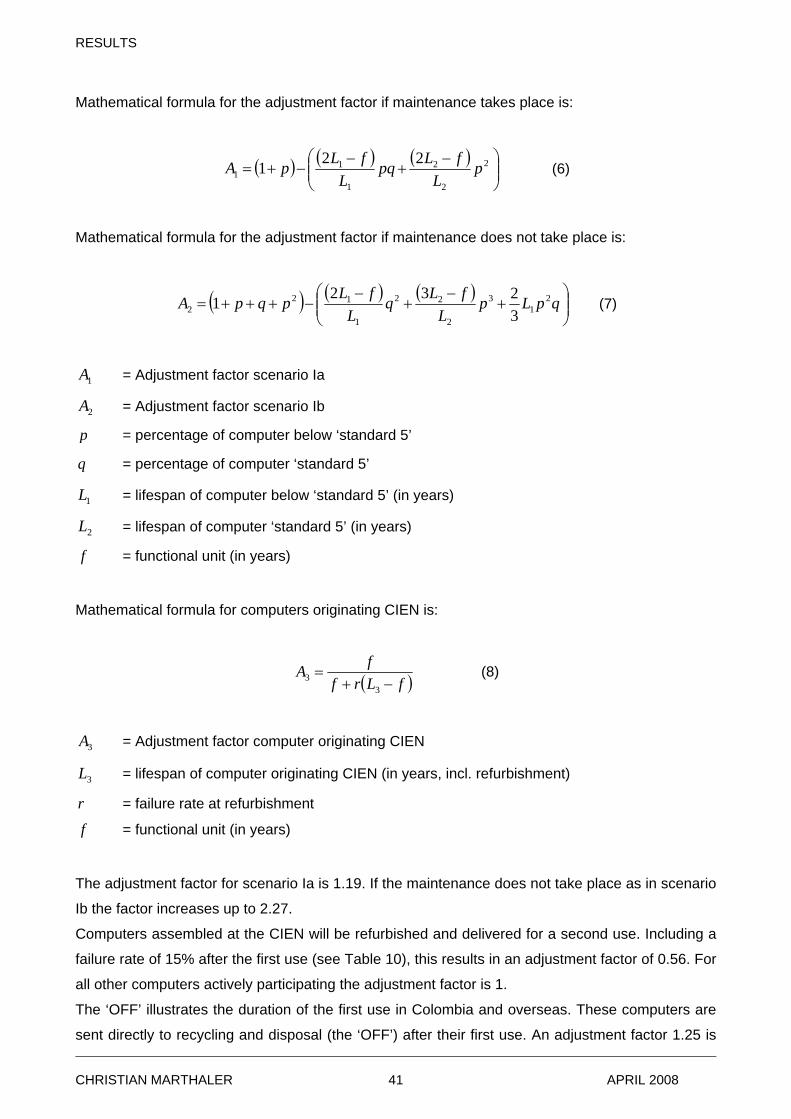
RESULTS
Mathematical formula for the adjustment factor if maintenance takes place is:
( ) ( ) ( )⎟⎟⎠
⎞⎜⎜⎝
⎛ −+
−−+= 2
2
2
1
11
221 pL
fLpqL
fLpA (6)
Mathematical formula for the adjustment factor if maintenance does not take place is:
( ) ( ) ( )⎟⎟⎠
⎞⎜⎜⎝
⎛+
−+
−−+++= qpLp
LfLq
LfLpqpA 2
13
2
22
1
122 3
2321 (7)
1A = Adjustment factor scenario Ia
2A = Adjustment factor scenario Ib
p = percentage of computer below ‘standard 5’
q = percentage of computer ‘standard 5’
1L = lifespan of computer below ‘standard 5’ (in years)
2L = lifespan of computer ‘standard 5’ (in years)
f = functional unit (in years)
Mathematical formula for computers originating CIEN is:
( )fLrffA−+
=3
3 (8)
3A = Adjustment factor computer originating CIEN
3L = lifespan of computer originating CIEN (in years, incl. refurbishment)
r = failure rate at refurbishment
f = functional unit (in years)
The adjustment factor for scenario Ia is 1.19. If the maintenance does not take place as in scenario
Ib the factor increases up to 2.27.
Computers assembled at the CIEN will be refurbished and delivered for a second use. Including a
failure rate of 15% after the first use (see Table 10), this results in an adjustment factor of 0.56. For
all other computers actively participating the adjustment factor is 1.
The ‘OFF’ illustrates the duration of the first use in Colombia and overseas. These computers are
sent directly to recycling and disposal (the ‘OFF’) after their first use. An adjustment factor 1.25 is
CHRISTIAN MARTHALER APRIL 2008 41
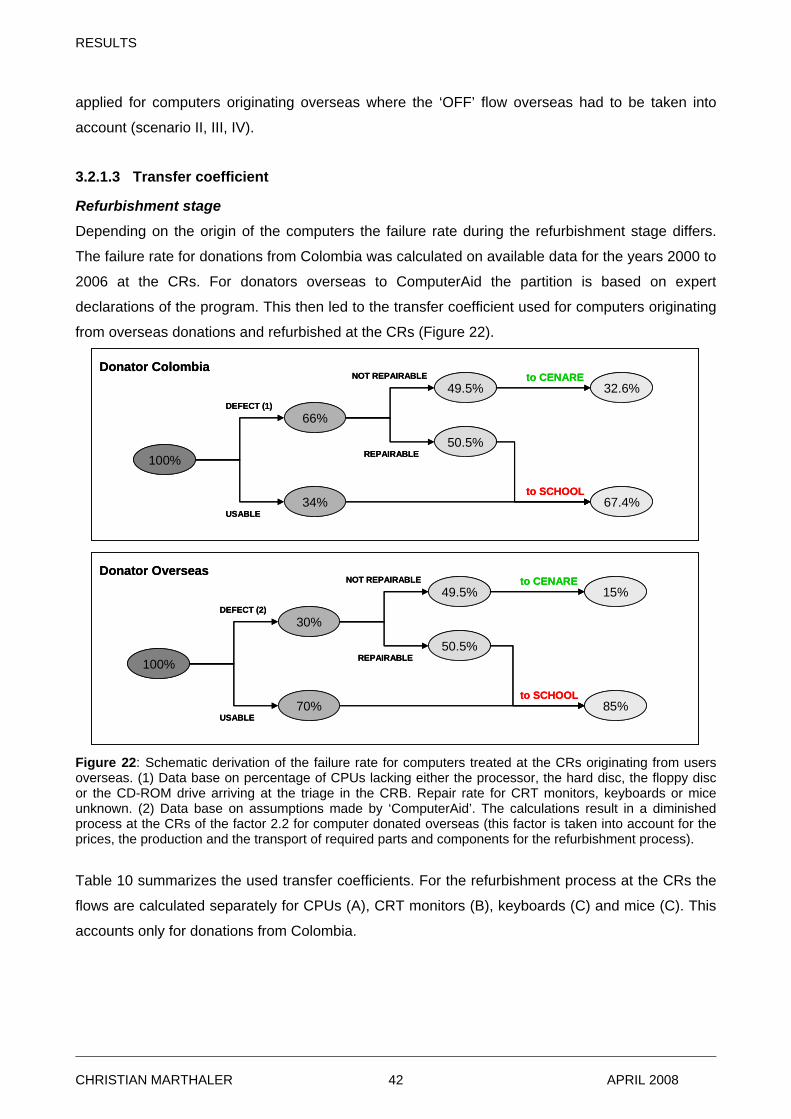
RESULTS
applied for computers originating overseas where the ‘OFF’ flow overseas had to be taken into
account (scenario II, III, IV).
3.2.1.3 Transfer coefficient
Refurbishment stage
Depending on the origin of the computers the failure rate during the refurbishment stage differs.
The failure rate for donations from Colombia was calculated on available data for the years 2000 to
2006 at the CRs. For donators overseas to ComputerAid the partition is based on expert
declarations of the program. This then led to the transfer coefficient used for computers originating
from overseas donations and refurbished at the CRs (Figure 22).
100%
66%
34% 67.4%
50.5%
49.5% 32.6%DEFECT (1)
USABLE
NOT REPAIRABLE
REPAIRABLE
to CENARE
100%
30%
70% 85%
50.5%
49.5% 15%DEFECT (2)
USABLE
NOT REPAIRABLE
REPAIRABLE
to CENARE
Donator Colombia
to SCHOOL
Donator Overseas
to SCHOOL
100%
66%
34% 67.4%
50.5%
49.5% 32.6%DEFECT (1)
USABLE
NOT REPAIRABLE
REPAIRABLE
to CENAREDonator Colombia
to SCHOOL
100%
30%
70% 85%
50.5%
49.5% 15%DEFECT (2)
USABLE
NOT REPAIRABLE
REPAIRABLE
to CENARE
to SCHOOL
Donator Overseas
Figure 22: Schematic derivation of the failure rate for computers treated at the CRs originating from users overseas. (1) Data base on percentage of CPUs lacking either the processor, the hard disc, the floppy disc or the CD-ROM drive arriving at the triage in the CRB. Repair rate for CRT monitors, keyboards or mice unknown. (2) Data base on assumptions made by ‘ComputerAid’. The calculations result in a diminished process at the CRs of the factor 2.2 for computer donated overseas (this factor is taken into account for the prices, the production and the transport of required parts and components for the refurbishment process).
Table 10 summarizes the used transfer coefficients. For the refurbishment process at the CRs the
flows are calculated separately for CPUs (A), CRT monitors (B), keyboards (C) and mice (C). This
accounts only for donations from Colombia.
CHRISTIAN MARTHALER APRIL 2008 42
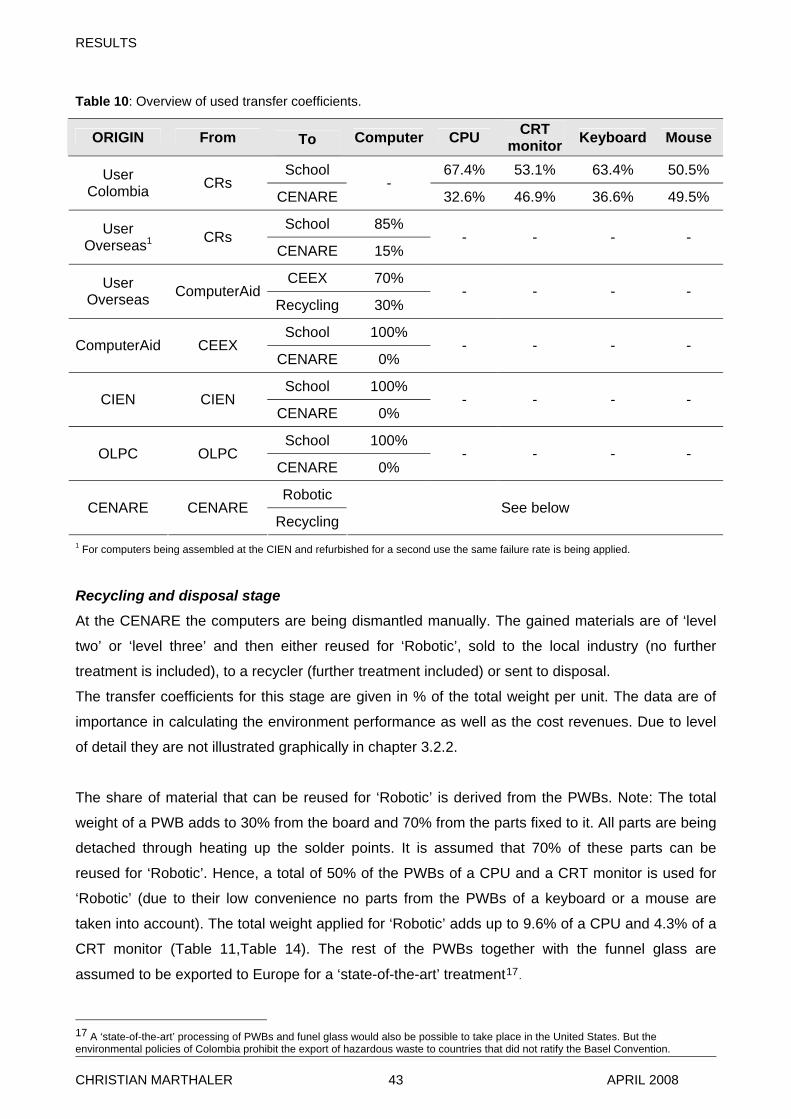
RESULTS
Table 10: Overview of used transfer coefficients.
1 For computers being assembled at the CIEN and refurbished for a second use the same failure rate is being applied.
Recycling and disposal stage
At the CENARE the computers are being dismantled manually. The gained materials are of ‘level
two’ or ‘level three’ and then either reused for ‘Robotic’, sold to the local industry (no further
treatment is included), to a recycler (further treatment included) or sent to disposal.
The transfer coefficients for this stage are given in % of the total weight per unit. The data are of
importance in calculating the environment performance as well as the cost revenues. Due to level
of detail they are not illustrated graphically in chapter 3.2.2.
The share of material that can be reused for ‘Robotic’ is derived from the PWBs. Note: The total
weight of a PWB adds to 30% from the board and 70% from the parts fixed to it. All parts are being
detached through heating up the solder points. It is assumed that 70% of these parts can be
reused for ‘Robotic’. Hence, a total of 50% of the PWBs of a CPU and a CRT monitor is used for
‘Robotic’ (due to their low convenience no parts from the PWBs of a keyboard or a mouse are
taken into account). The total weight applied for ‘Robotic’ adds up to 9.6% of a CPU and 4.3% of a
CRT monitor (Table 11,Table 14). The rest of the PWBs together with the funnel glass are
assumed to be exported to Europe for a ‘state-of-the-art’ treatment17.
17 A ‘state-of-the-art’ processing of PWBs and funel glass would also be possible to take place in the United States. But the environmental policies of Colombia prohibit the export of hazardous waste to countries that did not ratify the Basel Convention.
ORIGIN From To Computer CPU CRT monitor Keyboard Mouse
School 67.4% 53.1% 63.4% 50.5% User Colombia CRs
CENARE -
32.6% 46.9% 36.6% 49.5%
School 85% User Overseas1 CRs
CENARE 15% - - - -
CEEX 70% User Overseas ComputerAid
Recycling 30% - - - -
School 100% ComputerAid CEEX
CENARE 0% - - - -
School 100% CIEN CIEN
CENARE 0% - - - -
School 100% OLPC OLPC
CENARE 0% - - - -
Robotic CENARE CENARE
RecyclingSee below
CHRISTIAN MARTHALER APRIL 2008 43
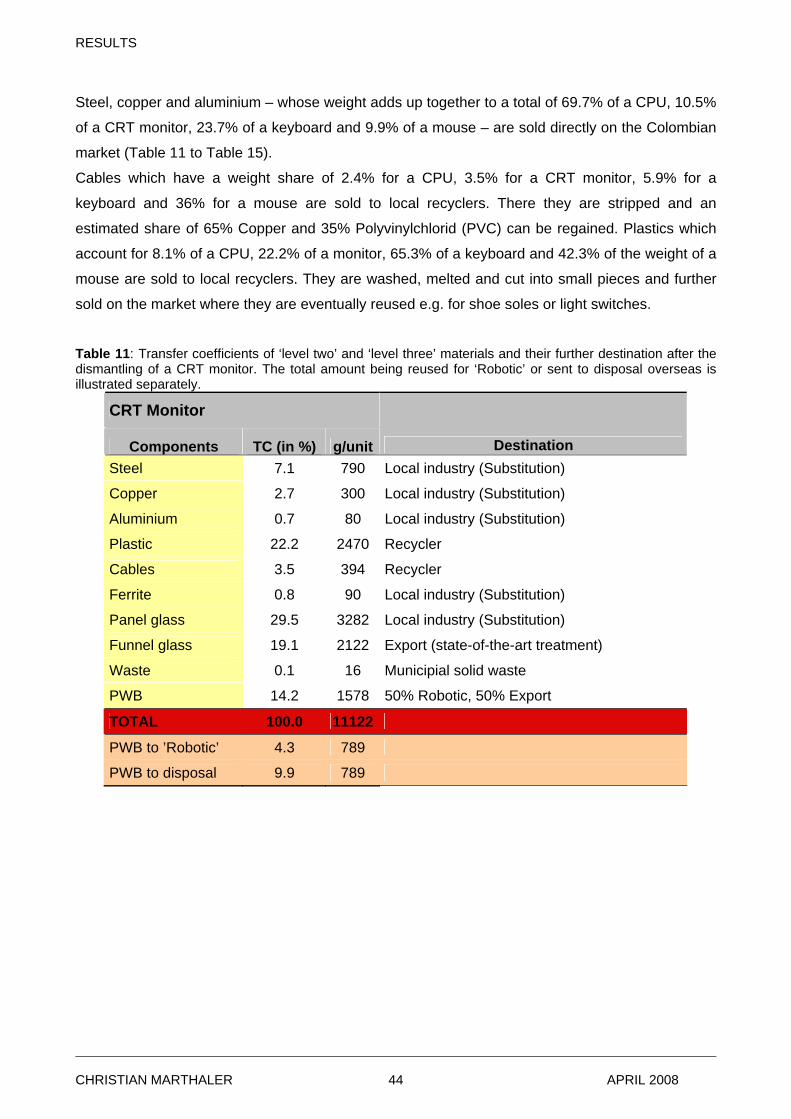
RESULTS
Steel, copper and aluminium – whose weight adds up together to a total of 69.7% of a CPU, 10.5%
of a CRT monitor, 23.7% of a keyboard and 9.9% of a mouse – are sold directly on the Colombian
market (Table 11 to Table 15).
Cables which have a weight share of 2.4% for a CPU, 3.5% for a CRT monitor, 5.9% for a
keyboard and 36% for a mouse are sold to local recyclers. There they are stripped and an
estimated share of 65% Copper and 35% Polyvinylchlorid (PVC) can be regained. Plastics which
account for 8.1% of a CPU, 22.2% of a monitor, 65.3% of a keyboard and 42.3% of the weight of a
mouse are sold to local recyclers. They are washed, melted and cut into small pieces and further
sold on the market where they are eventually reused e.g. for shoe soles or light switches.
Table 11: Transfer coefficients of ‘level two’ and ‘level three’ materials and their further destination after the dismantling of a CRT monitor. The total amount being reused for ‘Robotic’ or sent to disposal overseas is illustrated separately.
CRT Monitor
Components TC (in %) g/unit Destination Steel 7.1 790 Local industry (Substitution)
Copper 2.7 300 Local industry (Substitution)
Aluminium 0.7 80 Local industry (Substitution)
Plastic 22.2 2470 Recycler
Cables 3.5 394 Recycler
Ferrite 0.8 90 Local industry (Substitution)
Panel glass 29.5 3282 Local industry (Substitution)
Funnel glass 19.1 2122 Export (state-of-the-art treatment)
Waste 0.1 16 Municipial solid waste
PWB 14.2 1578 50% Robotic, 50% Export
TOTAL 100.0 11122
PWB to ’Robotic’ 4.3 789
PWB to disposal 9.9 789
CHRISTIAN MARTHALER APRIL 2008 44
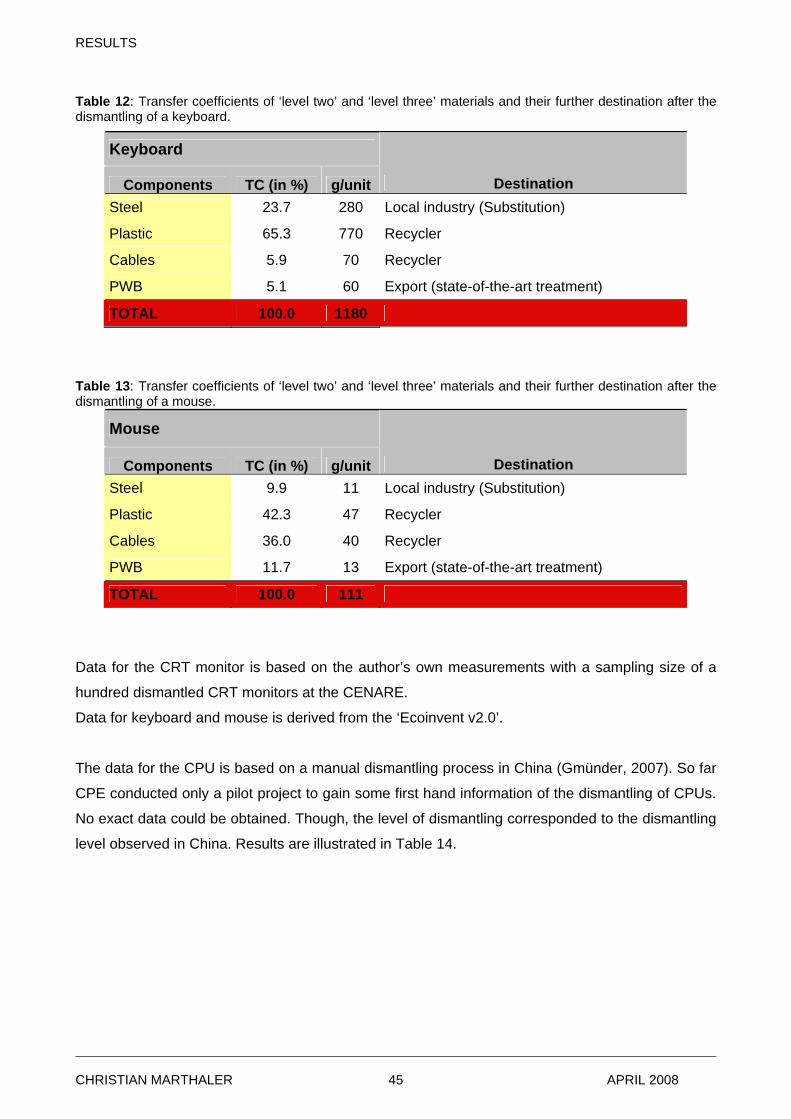
RESULTS
CHRISTIAN MARTHA
Data for the CRT monitor is based on the author’s own measurements with a sampling size of a
hundred dismantled CRT monitors at the CENARE.
Data for keyboard and mouse is derived from the ‘Ecoinvent v2.0’.
The data for the CPU is based on a manual dismantling process in China (Gmünder, 2007). So far
CPE conducted only a pilot project to gain some first hand information of the dismantling of CPUs.
No exact data could be obtained. Though, the level of dismantling corresponded to the dismantling
level observed in China. Results are illustrated in Table 14.
Table 13: Transfer coefficients of ‘level two’ and ‘level three’ materials and their further destination after the dismantling of a mouse.
LER APRIL 2008 45
Table 12: Transfer coefficients of ‘level two’ and ‘level three’ materials and their further destination after the dismantling of a keyboard.
Keyboard
Components TC (in %) g/unit Destination Steel 23.7 280 Local industry (Substitution)
Plastic 65.3 770 Recycler
Cables 5.9 70 Recycler
PWB 5.1 60 Export (state-of-the-art treatment)
TOTAL 100.0 1180
Mouse
Components TC (in %) g/unit Destination Steel 9.9 11 Local industry (Substitution)
Plastic 42.3 47 Recycler
Cables 36.0 40 Recycler
PWB 11.7 13 Export (state-of-the-art treatment)
TOTAL 100.0 111
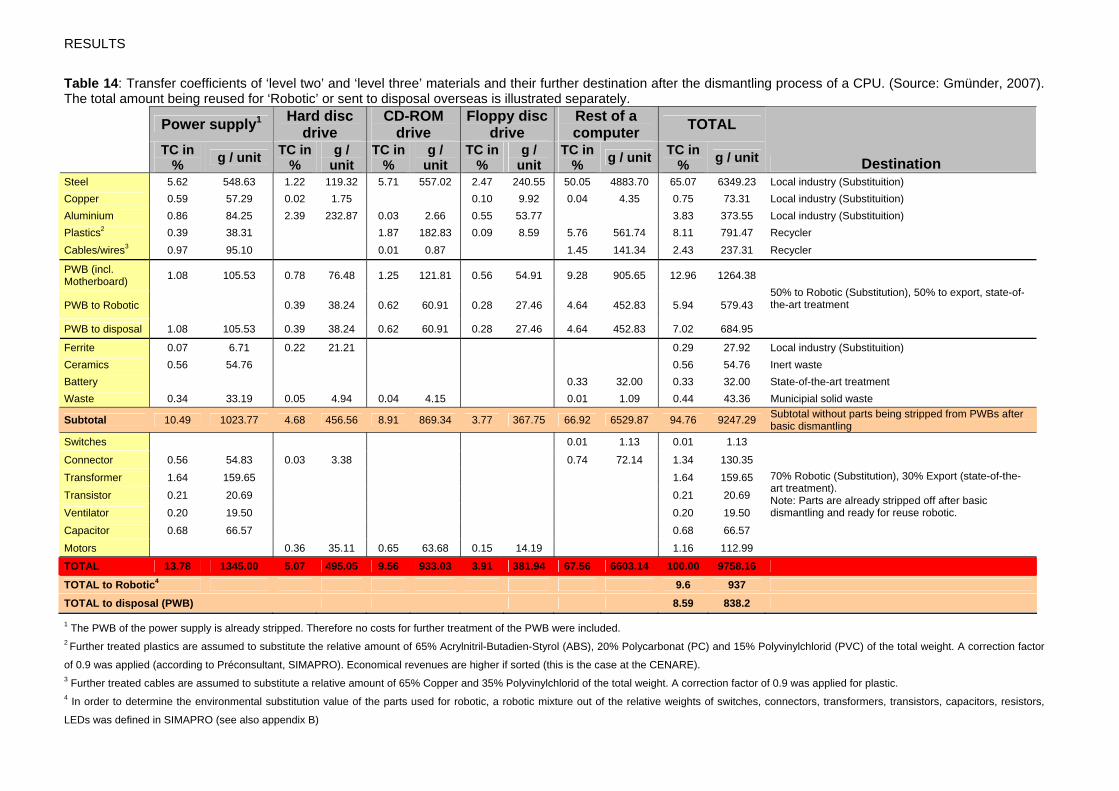
Table 14: Transfer coefficients of ‘level two’ and ‘level three’ materials and their further destination after the dismantling process of a CPU. (Source: Gmünder, 2007). The total amount being reused for ‘Robotic’ or sent to disposal overseas is illustrated separately.
Power supply1 Hard disc drive
CD-ROM drive
Floppy disc drive
Rest of a computer TOTAL
TC in % g / unit TC in
% g /
unit TC in
% g /
unit TC in
% g /
unit TC in
% g / unit TC in % g / unit Destination
Steel 5.62 548.63 1.22 119.32 5.71 557.02 2.47 240.55 50.05 4883.70 65.07 6349.23 Local industry (Substituition) Copper 0.59 57.29 0.02 1.75 0.10 9.92 0.04 4.35 0.75 73.31 Local industry (Substituition) Aluminium 0.86 84.25 2.39 232.87 0.03 2.66 0.55 53.77 3.83 373.55 Local industry (Substituition) Plastics2 0.39 38.31 1.87 182.83 0.09 8.59 5.76 561.74 8.11 791.47 Recycler Cables/wires3 0.97 95.10 0.01 0.87 1.45 141.34 2.43 237.31 Recycler
PWB (incl. Motherboard) 1.08 105.53 0.78 76.48 1.25 121.81 0.56 54.91 9.28 905.65 12.96 1264.38
PWB to Robotic 0.39 38.24 0.62 60.91 0.28 27.46 4.64 452.83 5.94 579.43
PWB to disposal 1.08 105.53 0.39 38.24 0.62 60.91 0.28 27.46 4.64 452.83 7.02 684.95
50% to Robotic (Substitution), 50% to export, state-of-the-art treatment
Ferrite 0.07 6.71 0.22 21.21 0.29 27.92 Local industry (Substituition) Ceramics 0.56 54.76 0.56 54.76 Inert waste Battery 0.33 32.00 0.33 32.00 State-of-the-art treatment Waste 0.34 33.19 0.05 4.94 0.04 4.15 0.01 1.09 0.44 43.36 Municipial solid waste
Subtotal 10.49 1023.77 4.68 456.56 8.91 869.34 3.77 367.75 66.92 6529.87 94.76 9247.29 Subtotal without parts being stripped from PWBs after basic dismantling
Switches 0.01 1.13 0.01 1.13
Connector 0.56 54.83 0.03 3.38 0.74 72.14 1.34 130.35 Transformer 1.64 159.65 1.64 159.65 Transistor 0.21 20.69 0.21 20.69 Ventilator 0.20 19.50 0.20 19.50 Capacitor 0.68 66.57 0.68 66.57 Motors 0.36 35.11 0.65 63.68 0.15 14.19 1.16 112.99
70% Robotic (Substitution), 30% Export (state-of-the-art treatment). Note: Parts are already stripped off after basic dismantling and ready for reuse robotic.
TOTAL 13.78 1345.00 5.07 495.05 9.56 933.03 3.91 381.94 67.56 6603.14 100.00 9758.16
TOTAL to Robotic4 9.6 937
TOTAL to disposal (PWB) 8.59 838.2
RESULTS
4 In order to determine the environmental substitution value of the parts used for robotic, a robotic mixture out of the relative weights of switches, connectors, transformers, transistors, capacitors, resistors,
LEDs was defined in SIMAPRO (see also appendix B)
2 Further treated plastics are assumed to substitute the relative amount of 65% Acrylnitril-Butadien-Styrol (ABS), 20% Polycarbonat (PC) and 15% Polyvinylchlorid (PVC) of the total weight. A correction factor
of 0.9 was applied (according to Préconsultant, SIMAPRO). Economical revenues are higher if sorted (this is the case at the CENARE). 3 Further treated cables are assumed to substitute a relative amount of 65% Copper and 35% Polyvinylchlorid of the total weight. A correction factor of 0.9 was applied for plastic.
1 The PWB of the power supply is already stripped. Therefore no costs for further treatment of the PWB were included.
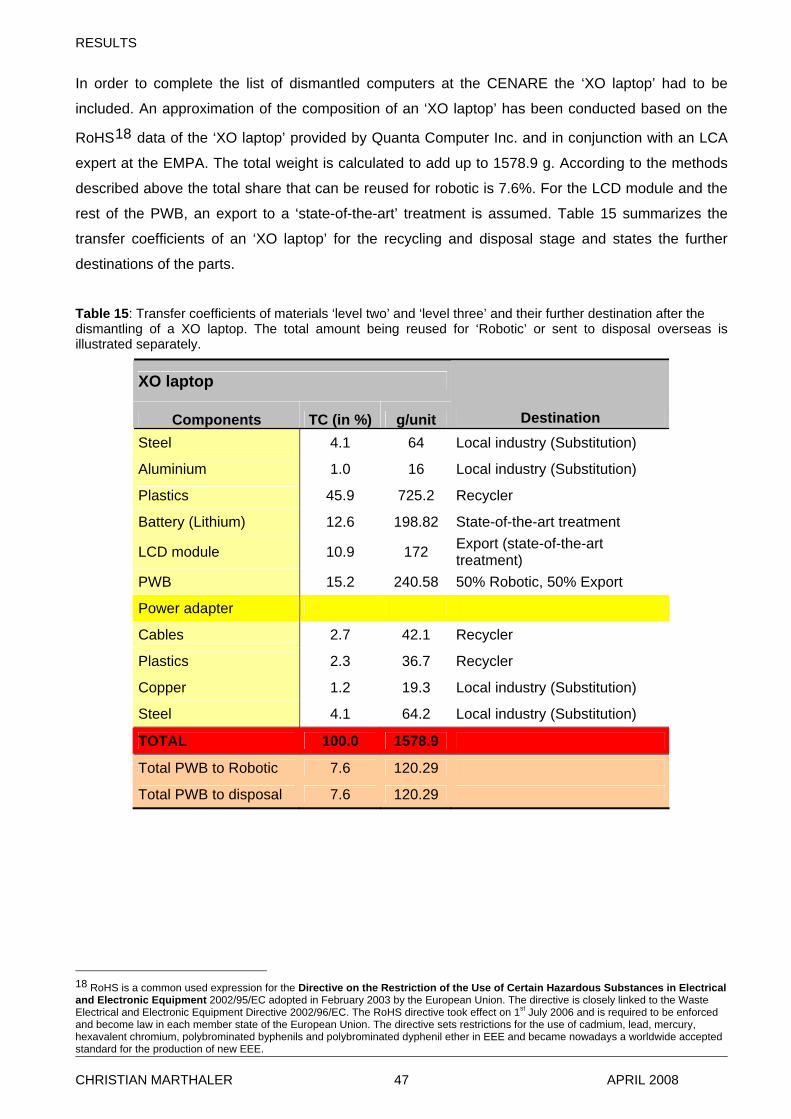
RESULTS
In order to complete the list of dismantled computers at the CENARE the ‘XO laptop’ had to be
included. An approximation of the composition of an ‘XO laptop’ has been conducted based on the
RoHS18 data of the ‘XO laptop’ provided by Quanta Computer Inc. and in conjunction with an LCA
expert at the EMPA. The total weight is calculated to add up to 1578.9 g. According to the methods
described above the total share that can be reused for robotic is 7.6%. For the LCD module and the
rest of the PWB, an export to a ‘state-of-the-art’ treatment is assumed. Table 15 summarizes the
transfer coefficients of an ‘XO laptop’ for the recycling and disposal stage and states the further
destinations of the parts.
Table 15: Transfer coefficients of materials ‘level two’ and ‘level three’ and their further destination after the dismantling of a XO laptop. The total amount being reused for ‘Robotic’ or sent to disposal overseas is illustrated separately.
XO laptop
Components TC (in %) g/unit Destination Steel 4.1 64 Local industry (Substitution)
Aluminium 1.0 16 Local industry (Substitution)
Plastics 45.9 725.2 Recycler
Battery (Lithium) 12.6 198.82 State-of-the-art treatment
LCD module 10.9 172 Export (state-of-the-art treatment)
PWB 15.2 240.58 50% Robotic, 50% Export
Power adapter
Cables 2.7 42.1 Recycler
Plastics 2.3 36.7 Recycler
Copper 1.2 19.3 Local industry (Substitution)
Steel 4.1 64.2 Local industry (Substitution)
TOTAL 100.0 1578.9
Total PWB to Robotic 7.6 120.29
Total PWB to disposal 7.6 120.29
18 RoHS is a common used expression for the Directive on the Restriction of the Use of Certain Hazardous Substances in Electrical and Electronic Equipment 2002/95/EC adopted in February 2003 by the European Union. The directive is closely linked to the Waste Electrical and Electronic Equipment Directive 2002/96/EC. The RoHS directive took effect on 1st July 2006 and is required to be enforced and become law in each member state of the European Union. The directive sets restrictions for the use of cadmium, lead, mercury, hexavalent chromium, polybrominated byphenils and polybrominated dyphenil ether in EEE and became nowadays a worldwide accepted standard for the production of new EEE.
CHRISTIAN MARTHALER APRIL 2008 47
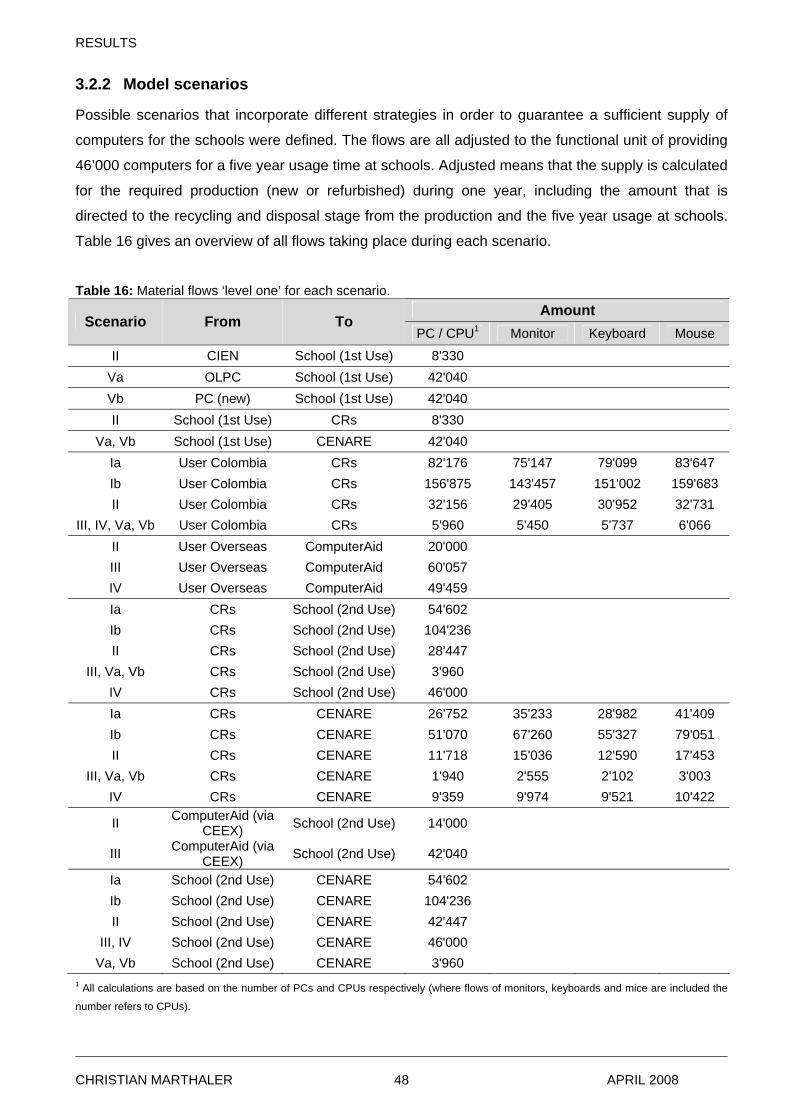
RESULTS
3.2.2 Model scenarios
Possible scenarios that incorporate different strategies in order to guarantee a sufficient supply of
computers for the schools were defined. The flows are all adjusted to the functional unit of providing
46’000 computers for a five year usage time at schools. Adjusted means that the supply is calculated
for the required production (new or refurbished) during one year, including the amount that is
directed to the recycling and disposal stage from the production and the five year usage at schools.
Table 16 gives an overview of all flows taking place during each scenario.
Table 16: Material flows ‘level one’ for each scenario.
Amount Scenario From To
PC / CPU1 Monitor Keyboard Mouse
II CIEN School (1st Use) 8'330 Va OLPC School (1st Use) 42'040 Vb PC (new) School (1st Use) 42'040 II School (1st Use) CRs 8'330
Va, Vb School (1st Use) CENARE 42'040 Ia User Colombia CRs 82'176 75'147 79'099 83'647 Ib User Colombia CRs 156'875 143'457 151'002 159'683 II User Colombia CRs 32'156 29'405 30'952 32'731
III, IV, Va, Vb User Colombia CRs 5'960 5'450 5'737 6'066 II User Overseas ComputerAid 20'000 III User Overseas ComputerAid 60'057 IV User Overseas ComputerAid 49'459 Ia CRs School (2nd Use) 54'602 Ib CRs School (2nd Use) 104'236 II CRs School (2nd Use) 28'447
III, Va, Vb CRs School (2nd Use) 3'960 IV CRs School (2nd Use) 46'000 Ia CRs CENARE 26'752 35'233 28'982 41'409 Ib CRs CENARE 51'070 67'260 55'327 79'051 II CRs CENARE 11'718 15'036 12'590 17'453
III, Va, Vb CRs CENARE 1'940 2'555 2'102 3'003 IV CRs CENARE 9'359 9'974 9'521 10'422
II ComputerAid (via CEEX) School (2nd Use) 14'000
III ComputerAid (via CEEX) School (2nd Use) 42'040
Ia School (2nd Use) CENARE 54'602 Ib School (2nd Use) CENARE 104'236 II School (2nd Use) CENARE 42'447
III, IV School (2nd Use) CENARE 46'000 Va, Vb School (2nd Use) CENARE 3'960
1 All calculations are based on the number of PCs and CPUs respectively (where flows of monitors, keyboards and mice are included the
number refers to CPUs).
CHRISTIAN MARTHALER APRIL 2008 48

RESULTS
Because CPE does have different failure rates for CPUs (A), CRT monitors (B), keyboards (C) and
mice (D) their flows were all assessed, where necessary, separately. This is the case for the amount
of donations of Colombian origin and for the parts being then transferred directly to the CENARE.
However, the flows of monitors, keyboards and mice are not illustrated graphically.
All further calculations are based on the amount of CPUs.
The material flows ‘level two’ are not included graphically in the figures but marked with an arrow.
This concerns the flows for parts and components used during the refurbishment processes at the
CRs and ‘ComputerAid’ as well as the necessary amount used during the maintenance. Furthermore
the flows for ‘Robotic’ (marked with an arrow from the CENARE back to the schools) and the flows
from the CENARE to the local industry, further recycling treatment or disposal site.
The dismantling process at the CENARE results in materials ‘level three’ that can either be sold
directly to the local industry, must be disposed off (within or outside of Colombia) or undergo a
further treatment through a recycler. This relates on one hand to cables which are further stripped in
order to regain plastic and copper. On the other hand to plastics which are being washed and
melted. The arrow drawn from recycler to local industry reflects the fact that these materials are
eventually sold to the local industry.
Flows marked yellow are responsible for the supply to schools (including flows to recycling and
disposal). Flows marked orange signify the ‘OFF’ flows. ‘OFF’ flows are given by the maximum
number of computers that could enter the supply chain. A differentiation between computers of
Colombian origin and overseas origin takes place. In this case the maximum amount of computers of
Colombian origin is given by scenario I “100% Colombian refurbishment” and for computers
originating from overseas by scenario III “Overseas refurbishment”. The flows (yellow) and the ‘OFF’
flows (orange) have to add up equally for each scenario.
This results in the total amount of 142’233 computers calculated for each of the scenarios whereas
82’176 stem from Colombia and 60’057 stem from overseas.
Boxes marked light grey are playing an active part in the supply chain (inclusive recycling and
disposal). Boxes marked dark grey are not taking part in the corresponding scenario.
The stock refers to the amount of CPUs, CRT monitors, keyboards and mice still in process at the
end of the year or used for employees of CPE. This accounts approximately for 1% of the total
amount entering the refurbishment process. The stock was extrapolated or adjusted where
necessary (scenario I, III, IV, Va, Vb).
CHRISTIAN MARTHALER APRIL 2008 49
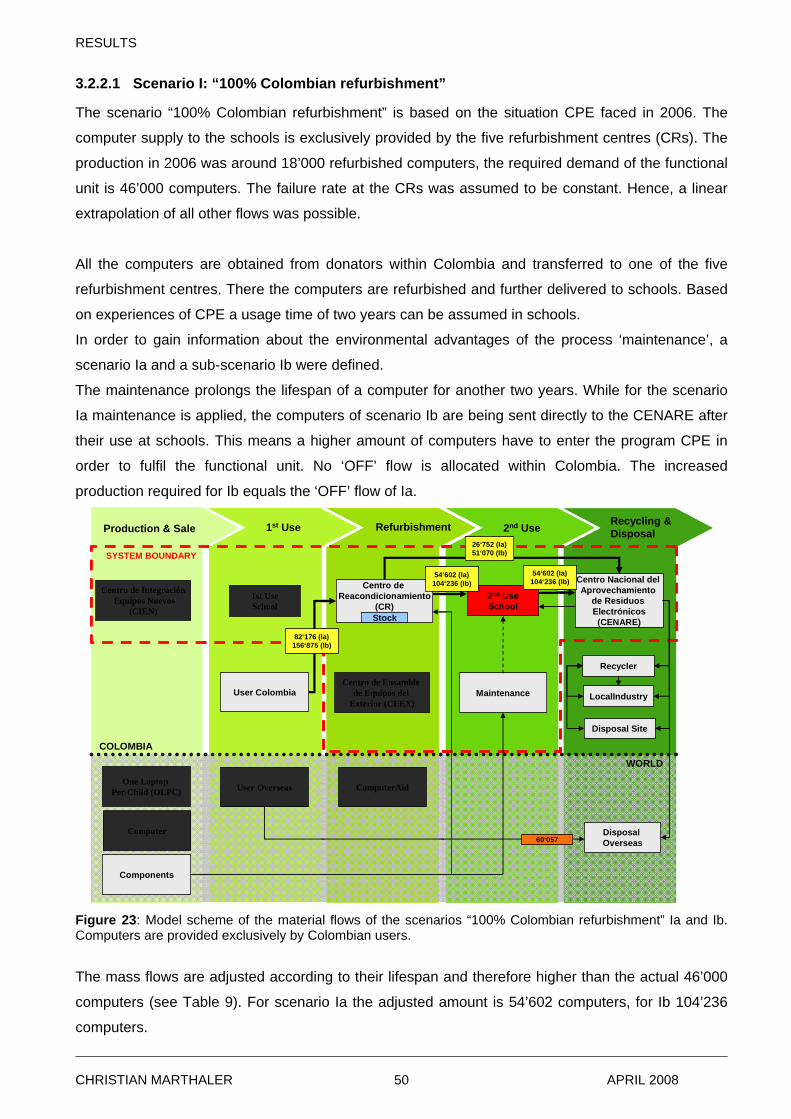
RESULTS
3.2.2.1 Scenario I: “100% Colombian refurbishment”
The scenario “100% Colombian refurbishment” is based on the situation CPE faced in 2006. The
computer supply to the schools is exclusively provided by the five refurbishment centres (CRs). The
production in 2006 was around 18’000 refurbished computers, the required demand of the functional
unit is 46’000 computers. The failure rate at the CRs was assumed to be constant. Hence, a linear
extrapolation of all other flows was possible.
All the computers are obtained from donators within Colombia and transferred to one of the five
refurbishment centres. There the computers are refurbished and further delivered to schools. Based
on experiences of CPE a usage time of two years can be assumed in schools.
In order to gain information about the environmental advantages of the process ‘maintenance’, a
scenario Ia and a sub-scenario Ib were defined.
The maintenance prolongs the lifespan of a computer for another two years. While for the scenario
Ia maintenance is applied, the computers of scenario Ib are being sent directly to the CENARE after
their use at schools. This means a higher amount of computers have to enter the program CPE in
order to fulfil the functional unit. No ‘OFF’ flow is allocated within Colombia. The increased
production required for Ib equals the ‘OFF’ flow of Ia.
Recycling &DisposalProduction & Sale
1st UseSchool
1st Use Refurbishment
Centro de IntegraciónEquipos Nuevos
(CIEN)
One Laptop Per Child (OLPC)
2nd Use
Centro Nacional del Aprovechamiento
de Residuos Electrónicos(CENARE)
LocalIndustry
Disposal Site
Recycler
Centro de Reacondicionamiento
(CR)2nd UseSchool
Centro de Ensamblede Equipos del
Exterior (CEEX)
DisposalOverseas
Components
Computer
User Overseas
User Colombia
ComputerAid
Maintenance
COLOMBIA
WORLD
SYSTEM BOUNDARY
54‘602 (Ia)104‘236 (Ib)
60‘057
54‘602 (Ia)104‘236 (Ib)
82‘176 (Ia)156‘875 (Ib)
26‘752 (Ia)51‘070 (Ib)
Stock
Recycling &DisposalProduction & Sale
1st UseSchool
1st Use Refurbishment
Centro de IntegraciónEquipos Nuevos
(CIEN)
One Laptop Per Child (OLPC)
2nd Use
Centro Nacional del Aprovechamiento
de Residuos Electrónicos(CENARE)
LocalIndustry
Disposal Site
Recycler
Centro de Reacondicionamiento
(CR)2nd UseSchool
Centro de Ensamblede Equipos del
Exterior (CEEX)
DisposalOverseas
Components
Computer
User Overseas
User Colombia
ComputerAid
Maintenance
COLOMBIA
WORLD
SYSTEM BOUNDARY26‘752 (Ia)51‘070 (Ib)
54‘602 (Ia)104‘236 (Ib)
54‘602 (Ia)104‘236 (Ib)
Stock
82‘176 (Ia)156‘875 (Ib)
60‘057
Figure 23: Model scheme of the material flows of the scenarios “100% Colombian refurbishment” Ia and Ib. Computers are provided exclusively by Colombian users.
The mass flows are adjusted according to their lifespan and therefore higher than the actual 46’000
computers (see Table 9). For scenario Ia the adjusted amount is 54’602 computers, for Ib 104’236
computers.
CHRISTIAN MARTHALER APRIL 2008 50
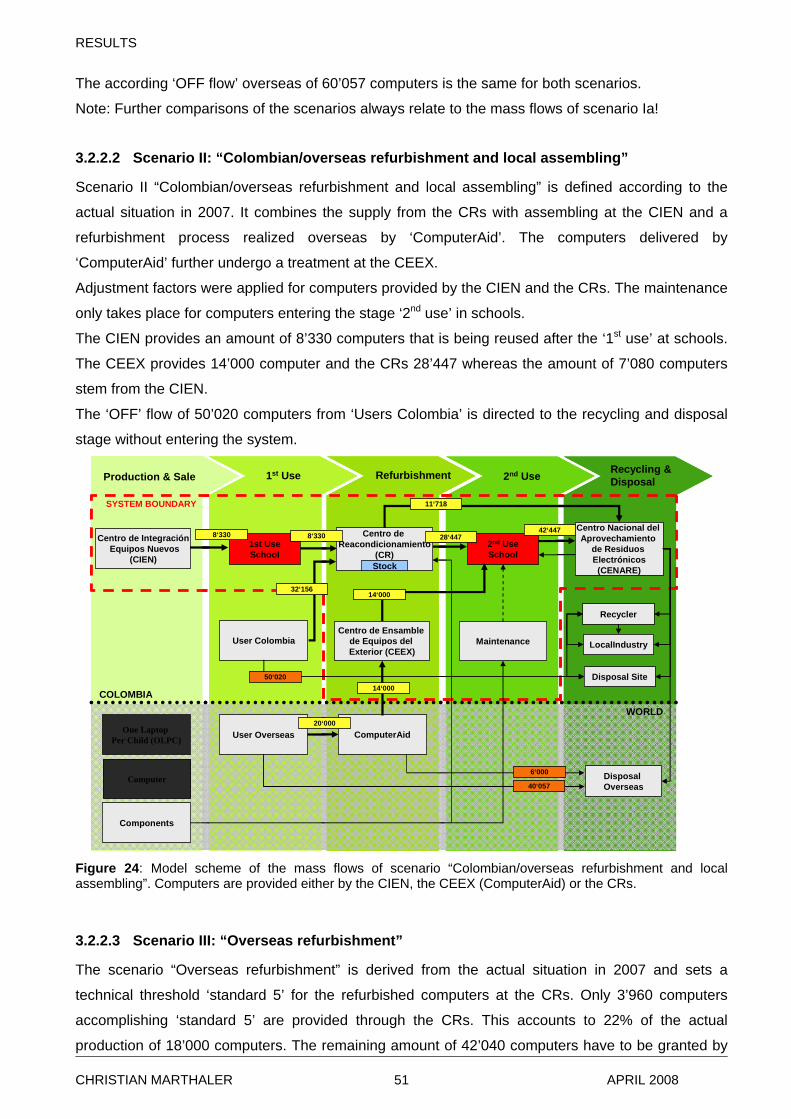
RESULTS
The according ‘OFF flow’ overseas of 60’057 computers is the same for both scenarios.
Note: Further comparisons of the scenarios always relate to the mass flows of scenario Ia!
3.2.2.2 Scenario II: “Colombian/overseas refurbishment and local assembling”
Scenario II “Colombian/overseas refurbishment and local assembling” is defined according to the
actual situation in 2007. It combines the supply from the CRs with assembling at the CIEN and a
refurbishment process realized overseas by ‘ComputerAid’. The computers delivered by
‘ComputerAid’ further undergo a treatment at the CEEX.
Adjustment factors were applied for computers provided by the CIEN and the CRs. The maintenance
only takes place for computers entering the stage ‘2nd use’ in schools.
The CIEN provides an amount of 8’330 computers that is being reused after the ‘1st use’ at schools.
The CEEX provides 14’000 computer and the CRs 28’447 whereas the amount of 7’080 computers
stem from the CIEN.
The ‘OFF’ flow of 50’020 computers from ‘Users Colombia’ is directed to the recycling and disposal
stage without entering the system.
Recycling &DisposalProduction & Sale
1st UseSchool
1st Use Refurbishment
Centro de IntegraciónEquipos Nuevos
(CIEN)
One Laptop Per Child (OLPC)
2nd Use
Centro Nacional del Aprovechamiento
de Residuos Electrónicos(CENARE)
LocalIndustry
Disposal Site
Recycler
Centro de Reacondicionamiento
(CR)2nd UseSchool
Centro de Ensamblede Equipos del Exterior (CEEX)
DisposalOverseas
Components
Computer
User Overseas
User Colombia
ComputerAid
Maintenance
COLOMBIA
WORLD
SYSTEM BOUNDARY
42‘447
40‘057
28‘4478‘330
20‘000
32‘156
50‘020
11‘718
8‘330
14‘000
14‘000
Stock
6‘000
Recycling &DisposalProduction & Sale
1st UseSchool
1st Use Refurbishment
Centro de IntegraciónEquipos Nuevos
(CIEN)
One Laptop Per Child (OLPC)
2nd Use
Centro Nacional del Aprovechamiento
de Residuos Electrónicos(CENARE)
LocalIndustry
Disposal Site
Recycler
Centro de Reacondicionamiento
(CR)2nd UseSchool
Centro de Ensamblede Equipos del Exterior (CEEX)
DisposalOverseas
Components
Computer
User Overseas
User Colombia
ComputerAid
Maintenance
COLOMBIA
WORLD
SYSTEM BOUNDARY 11‘718
42‘4478‘330 8‘330 28‘447
40‘057
20‘000
32‘156
50‘020
14‘000
14‘000
Stock
6‘000
Figure 24: Model scheme of the mass flows of scenario “Colombian/overseas refurbishment and local assembling”. Computers are provided either by the CIEN, the CEEX (ComputerAid) or the CRs.
3.2.2.3 Scenario III: “Overseas refurbishment”
The scenario “Overseas refurbishment” is derived from the actual situation in 2007 and sets a
technical threshold ‘standard 5’ for the refurbished computers at the CRs. Only 3’960 computers
accomplishing ‘standard 5’ are provided through the CRs. This accounts to 22% of the actual
production of 18’000 computers. The remaining amount of 42’040 computers have to be granted by
CHRISTIAN MARTHALER APRIL 2008 51
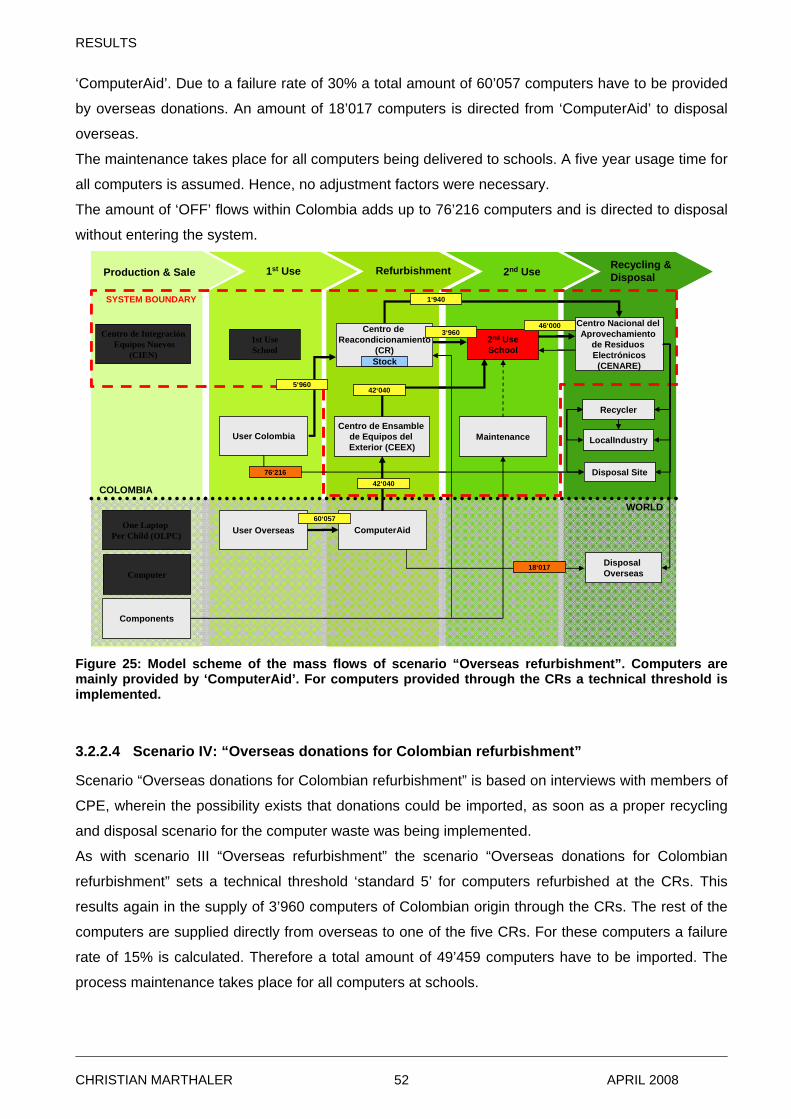
RESULTS
‘ComputerAid’. Due to a failure rate of 30% a total amount of 60’057 computers have to be provided
by overseas donations. An amount of 18’017 computers is directed from ‘ComputerAid’ to disposal
overseas.
The maintenance takes place for all computers being delivered to schools. A five year usage time for
all computers is assumed. Hence, no adjustment factors were necessary.
The amount of ‘OFF’ flows within Colombia adds up to 76’216 computers and is directed to disposal
without entering the system.
Recycling &DisposalProduction & Sale
1st UseSchool
1st Use Refurbishment
Centro de IntegraciónEquipos Nuevos
(CIEN)
One Laptop Per Child (OLPC)
2nd Use
Centro Nacional del Aprovechamiento
de Residuos Electrónicos(CENARE)
LocalIndustry
Disposal Site
Recycler
Centro de Reacondicionamiento
(CR)2nd UseSchool
Centro de Ensamblede Equipos del Exterior (CEEX)
DisposalOverseas
Components
Computer
User Overseas
User Colombia
ComputerAid
Maintenance
COLOMBIA
WORLD
SYSTEM BOUNDARY
46‘0003‘960
60‘057
5‘960
76‘216
1‘940
42‘040
42‘040
Stock
18‘017
Recycling &DisposalProduction & Sale
1st UseSchool
1st Use Refurbishment
Centro de IntegraciónEquipos Nuevos
(CIEN)
One Laptop Per Child (OLPC)
2nd Use
Centro Nacional del Aprovechamiento
de Residuos Electrónicos(CENARE)
LocalIndustry
Disposal Site
Recycler
Centro de Reacondicionamiento
(CR)2nd UseSchool
Centro de Ensamblede Equipos del Exterior (CEEX)
DisposalOverseas
Components
Computer
User Overseas
User Colombia
ComputerAid
Maintenance
COLOMBIA
WORLD
SYSTEM BOUNDARY 1‘940
46‘0003‘960
60‘057
5‘960
76‘216
42‘040
42‘040
Stock
18‘017
Figure 25: Model scheme of the mass flows of scenario “Overseas refurbishment”. Computers are mainly provided by ‘ComputerAid’. For computers provided through the CRs a technical threshold is implemented.
3.2.2.4 Scenario IV: “Overseas donations for Colombian refurbishment”
Scenario “Overseas donations for Colombian refurbishment” is based on interviews with members of
CPE, wherein the possibility exists that donations could be imported, as soon as a proper recycling
and disposal scenario for the computer waste was being implemented.
As with scenario III “Overseas refurbishment” the scenario “Overseas donations for Colombian
refurbishment” sets a technical threshold ‘standard 5’ for computers refurbished at the CRs. This
results again in the supply of 3’960 computers of Colombian origin through the CRs. The rest of the
computers are supplied directly from overseas to one of the five CRs. For these computers a failure
rate of 15% is calculated. Therefore a total amount of 49’459 computers have to be imported. The
process maintenance takes place for all computers at schools.
CHRISTIAN MARTHALER APRIL 2008 52
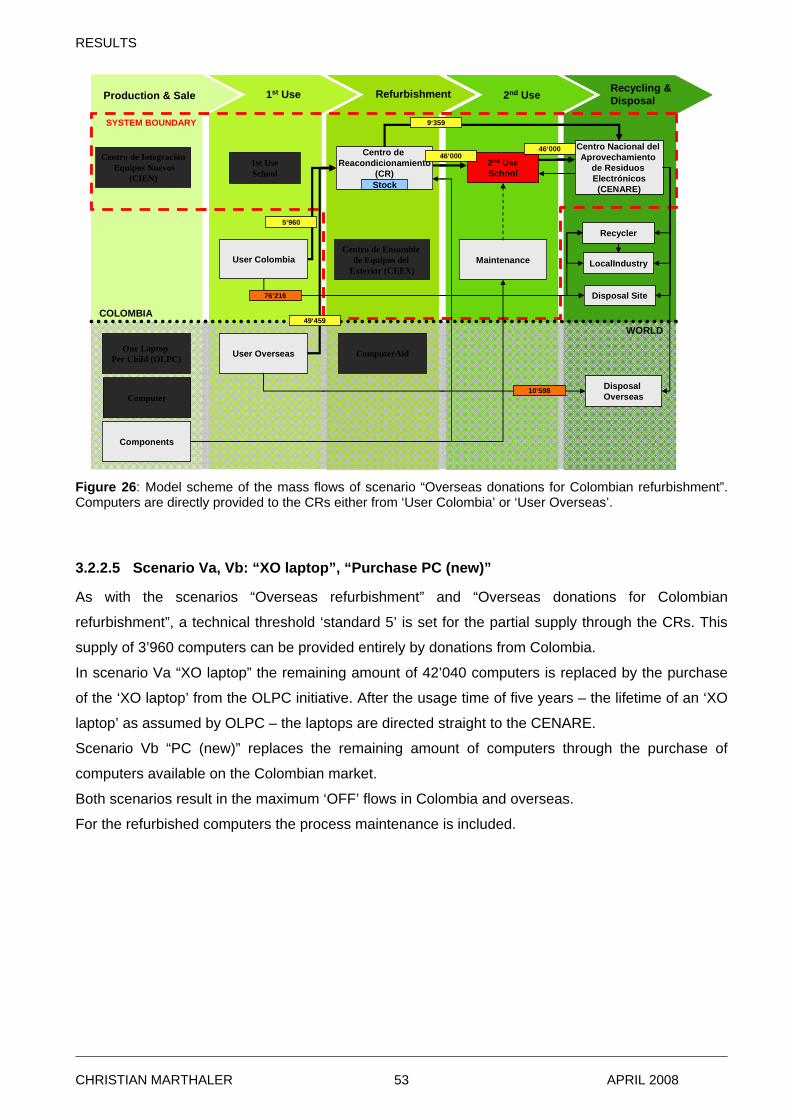
RESULTS
Recycling &DisposalProduction & Sale
1st UseSchool
1st Use Refurbishment
Centro de IntegraciónEquipos Nuevos
(CIEN)
One Laptop Per Child (OLPC)
2nd Use
Centro Nacional del Aprovechamiento
de Residuos Electrónicos(CENARE)
LocalIndustry
Disposal Site
Recycler
Centro de Reacondicionamiento
(CR)2nd UseSchool
Centro de Ensamblede Equipos del
Exterior (CEEX)
DisposalOverseas
Components
Computer
User Overseas
User Colombia
ComputerAid
Maintenance
COLOMBIA
WORLD
SYSTEM BOUNDARY
46‘00046‘000
76‘216
9‘359
Stock
5‘960
49‘459
10‘598
Recycling &DisposalProduction & Sale
1st UseSchool
1st Use Refurbishment
Centro de IntegraciónEquipos Nuevos
(CIEN)
One Laptop Per Child (OLPC)
2nd Use
Centro Nacional del Aprovechamiento
de Residuos Electrónicos(CENARE)
LocalIndustry
Disposal Site
Recycler
Centro de Reacondicionamiento
(CR)2nd UseSchool
Centro de Ensamblede Equipos del
Exterior (CEEX)
DisposalOverseas
Components
Computer
User Overseas
User Colombia
ComputerAid
Maintenance
COLOMBIA
WORLD
SYSTEM BOUNDARY 9‘359
46‘00046‘000
76‘216
Stock
5‘960
49‘459
10‘598
Figure 26: Model scheme of the mass flows of scenario “Overseas donations for Colombian refurbishment”. Computers are directly provided to the CRs either from ‘User Colombia’ or ‘User Overseas’.
3.2.2.5 Scenario Va, Vb: “XO laptop”, “Purchase PC (new)”
As with the scenarios “Overseas refurbishment” and “Overseas donations for Colombian
refurbishment”, a technical threshold ‘standard 5’ is set for the partial supply through the CRs. This
supply of 3’960 computers can be provided entirely by donations from Colombia.
In scenario Va “XO laptop” the remaining amount of 42’040 computers is replaced by the purchase
of the ‘XO laptop’ from the OLPC initiative. After the usage time of five years – the lifetime of an ‘XO
laptop’ as assumed by OLPC – the laptops are directed straight to the CENARE.
Scenario Vb “PC (new)” replaces the remaining amount of computers through the purchase of
computers available on the Colombian market.
Both scenarios result in the maximum ‘OFF’ flows in Colombia and overseas.
For the refurbished computers the process maintenance is included.
CHRISTIAN MARTHALER APRIL 2008 53
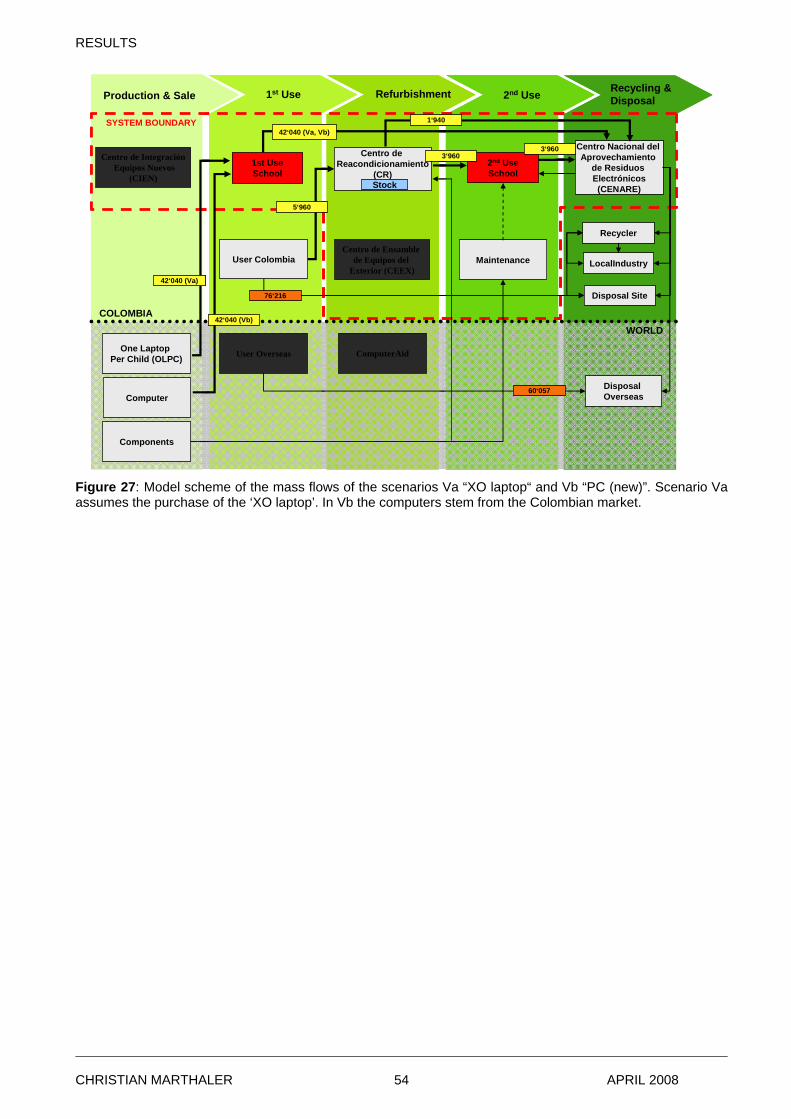
RESULTS
Recycling &DisposalProduction & Sale
1st UseSchool
1st Use Refurbishment
Centro de IntegraciónEquipos Nuevos
(CIEN)
One Laptop Per Child (OLPC)
2nd Use
Centro Nacional del Aprovechamiento
de Residuos Electrónicos(CENARE)
LocalIndustry
Disposal Site
Recycler
Centro de Reacondicionamiento
(CR)2nd UseSchool
Centro de Ensamblede Equipos del
Exterior (CEEX)
DisposalOverseas
Components
Computer
User Overseas
User Colombia
ComputerAid
Maintenance
COLOMBIA
WORLD
SYSTEM BOUNDARY
3‘9603‘960
76‘216
1‘940
Stock
5‘960
60‘057
42‘040 (Va)
42‘040 (Vb)
42‘040 (Va, Vb)
Recycling &DisposalProduction & Sale
1st UseSchool
1st Use Refurbishment
Centro de IntegraciónEquipos Nuevos
(CIEN)
One Laptop Per Child (OLPC)
2nd Use
Centro Nacional del Aprovechamiento
de Residuos Electrónicos(CENARE)
LocalIndustry
Disposal Site
Recycler
Centro de Reacondicionamiento
(CR)2nd UseSchool
Centro de Ensamblede Equipos del
Exterior (CEEX)
DisposalOverseas
Components
Computer
User Overseas
User Colombia
ComputerAid
Maintenance
COLOMBIA
WORLD
SYSTEM BOUNDARY 1‘940
3‘9603‘960
42‘040 (Va, Vb)
Stock
5‘960
42‘040 (Va)
76‘216
42‘040 (Vb)
60‘057
Figure 27: Model scheme of the mass flows of the scenarios Va “XO laptop“ and Vb “PC (new)”. Scenario Va assumes the purchase of the ‘XO laptop’. In Vb the computers stem from the Colombian market.
CHRISTIAN MARTHALER APRIL 2008 54
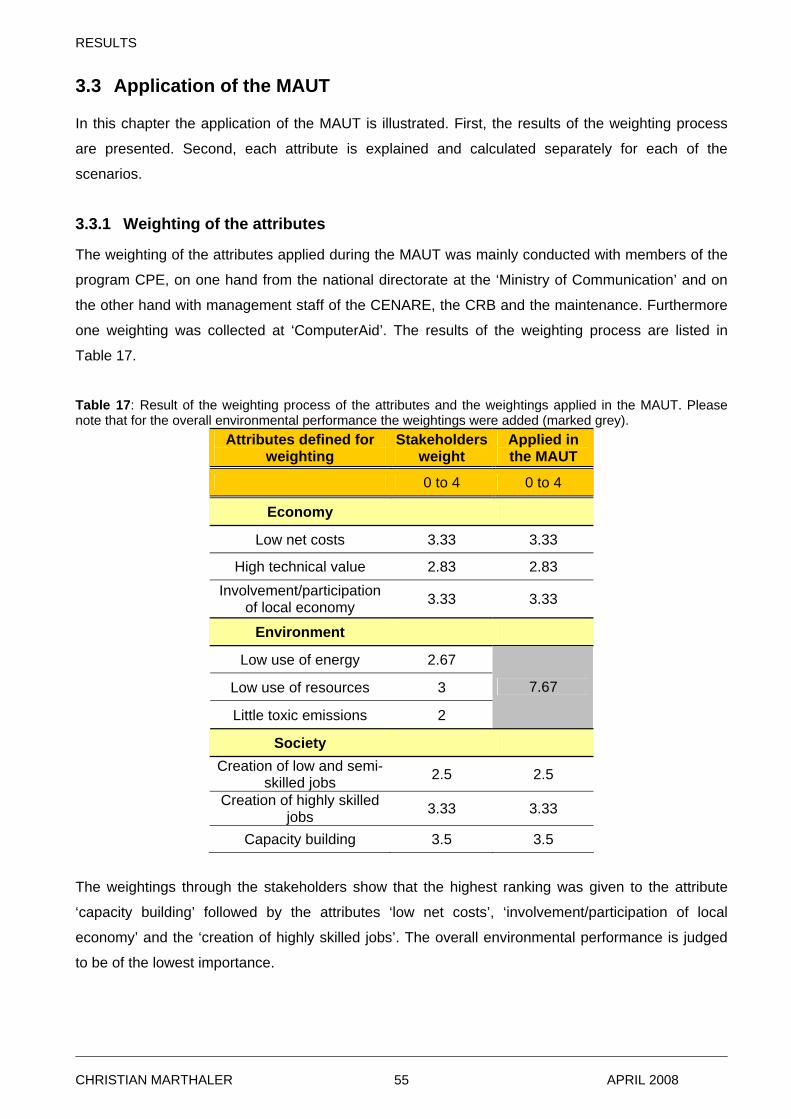
RESULTS
3.3 Application of the MAUT
In this chapter the application of the MAUT is illustrated. First, the results of the weighting process
are presented. Second, each attribute is explained and calculated separately for each of the
scenarios.
3.3.1 Weighting of the attributes
The weighting of the attributes applied during the MAUT was mainly conducted with members of the
program CPE, on one hand from the national directorate at the ‘Ministry of Communication’ and on
the other hand with management staff of the CENARE, the CRB and the maintenance. Furthermore
one weighting was collected at ‘ComputerAid’. The results of the weighting process are listed in
Table 17.
Table 17: Result of the weighting process of the attributes and the weightings applied in the MAUT. Please note that for the overall environmental performance the weightings were added (marked grey).
Attributes defined for weighting
Stakeholders weight
Applied in the MAUT
0 to 4 0 to 4
Economy
Low net costs 3.33 3.33
High technical value 2.83 2.83 Involvement/participation
of local economy 3.33 3.33
Environment
Low use of energy 2.67
Low use of resources 3
Little toxic emissions 2
7.67
Society Creation of low and semi-
skilled jobs 2.5 2.5
Creation of highly skilled jobs 3.33 3.33
Capacity building 3.5 3.5
The weightings through the stakeholders show that the highest ranking was given to the attribute
‘capacity building’ followed by the attributes ‘low net costs’, ‘involvement/participation of local
economy’ and the ‘creation of highly skilled jobs’. The overall environmental performance is judged
to be of the lowest importance.
CHRISTIAN MARTHALER APRIL 2008 55
RESULTS
3.3.2 Economical performance
The economical performance was subdivided into the three attributes ‘low net costs’, ‘high technical
value’ and ‘involvement/participation of local economy’.
3.3.2.1 Low net costs
The low net costs for computers provided through the CRs, the CIEN or the CEEX include;
direct/indirect labour costs, direct/indirect material costs and indirect fabrication costs. All costs are
based on the 2007 budget of CPE. For the computers provided through the CEEX an average price
of a computer at ‘ComputerAid’ was assumed19. The prices for the ‘XO laptop’ or a newly purchased
computer are based on their corresponding market price.
Furthermore general costs of the program CPE were evaluated and included for each of the
scenarios. This includes costs for promotion, the accompaniment, the monitoring and the
maintenance, as well as transportation for distribution from schools to disposal.
Distribution costs from the centres to the schools are based on declarations of CPE. Note: the
transport costs for recollecting the computers, as well as the costs for translation transports between
centres are already included in the indirect costs for fabrication. Hence, the transport costs from the
CRs to the CENARE can be neglected. It is assumed that the price for the ‘XO laptop’ includes
transportation to the country of destination.
So far no official take-back program has been implemented by CPE and therefore no costs raised for
the transport of obsolete computers from schools to the CENARE. Since the model includes this
flow, the costs were included. It suggests that these costs equal the distribution costs.
For the transport for computers arriving to Colombia – either from ‘ComputerAid’ at the CEEX or
directly at the CRs from a user overseas – costs relate to the oceanic transport, custom duties and
transport to Bogota (listed separately). Please note that a computer sent directly from ‘ComputerAid’
(representing a finished consumer good) might have a different custom duty level than computers
directed to the refurbishment process (being intermediate and capital good not produced in
Colombia).
All the above mentioned costs could be calculated per unit computer. Therefore a linear
extrapolation to determine the total costs of each scenario could be made. Table 18 summarizes and
describes the costs further detailed. It also describes corrections made by the author.
19 Price based on declarations of ‘ComputerAid’ on their homepage (June 2007) and take into account a 20%/80% mix of PIV/PIII. PIII is assumed to be half medium- and half high-end quality.
CHRISTIAN MARTHALER APRIL 2008 56
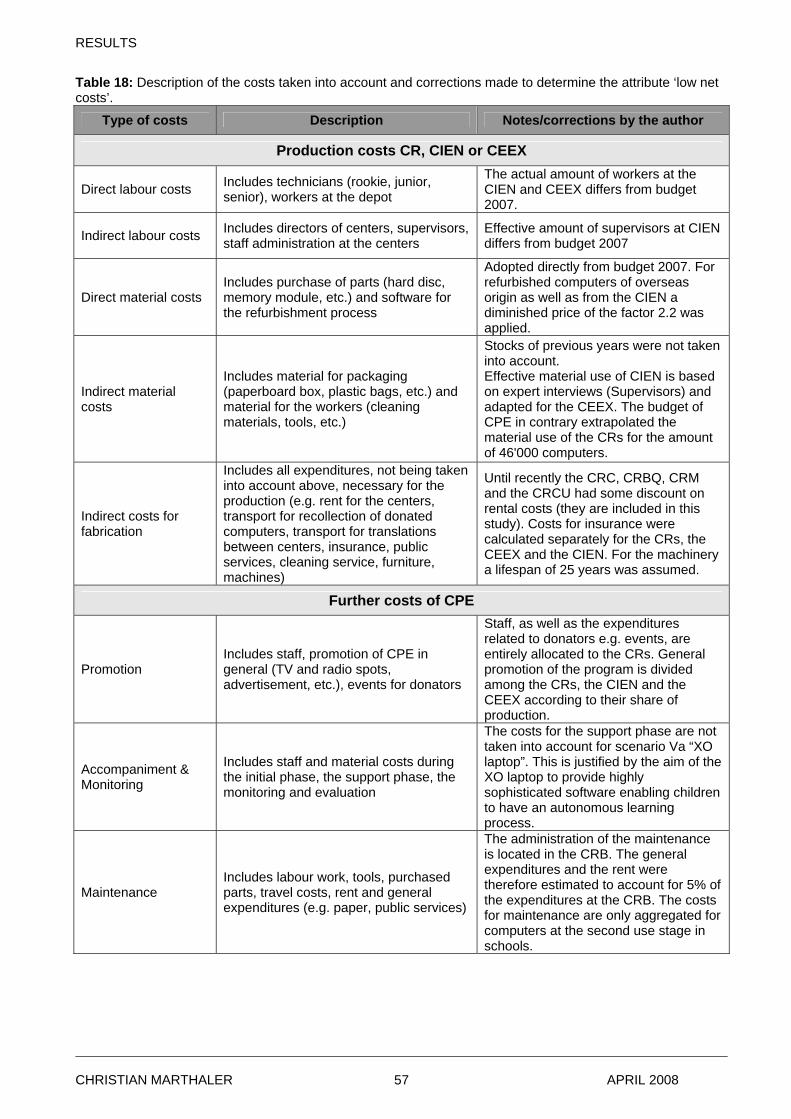
RESULTS
Table 18: Description of the costs taken into account and corrections made to determine the attribute ‘low net costs’.
Description Notes/corrections by the author Type of costs
Production costs CR, CIEN or CEEX The actual amount of workers at the CIEN and CEEX differs from budget 2007.
Direct labour costs Includes technicians (rookie, junior, senior), workers at the depot
Indirect labour costs Includes directors of centers, supervisors, staff administration at the centers
Effective amount of supervisors at CIEN differs from budget 2007
Direct material costs Includes purchase of parts (hard disc, memory module, etc.) and software for the refurbishment process
Adopted directly from budget 2007. For refurbished computers of overseas origin as well as from the CIEN a diminished price of the factor 2.2 was applied.
Indirect material costs
Includes material for packaging (paperboard box, plastic bags, etc.) and material for the workers (cleaning materials, tools, etc.)
Stocks of previous years were not taken into account. Effective material use of CIEN is based on expert interviews (Supervisors) and adapted for the CEEX. The budget of CPE in contrary extrapolated the material use of the CRs for the amount of 46'000 computers.
Includes all expenditures, not being taken into account above, necessary for the production (e.g. rent for the centers, transport for recollection of donated computers, transport for translations between centers, insurance, public services, cleaning service, furniture, machines)
Until recently the CRC, CRBQ, CRM and the CRCU had some discount on rental costs (they are included in this study). Costs for insurance were calculated separately for the CRs, the CEEX and the CIEN. For the machinery a lifespan of 25 years was assumed.
Indirect costs for fabrication
Further costs of CPE Staff, as well as the expenditures related to donators e.g. events, are entirely allocated to the CRs. General promotion of the program is divided among the CRs, the CIEN and the CEEX according to their share of production.
Promotion Includes staff, promotion of CPE in general (TV and radio spots, advertisement, etc.), events for donators
The costs for the support phase are not taken into account for scenario Va “XO laptop”. This is justified by the aim of the XO laptop to provide highly sophisticated software enabling children to have an autonomous learning process.
Accompaniment & Monitoring
Includes staff and material costs during the initial phase, the support phase, the monitoring and evaluation
The administration of the maintenance is located in the CRB. The general expenditures and the rent were therefore estimated to account for 5% of the expenditures at the CRB. The costs for maintenance are only aggregated for computers at the second use stage in schools.
Includes labour work, tools, purchased parts, travel costs, rent and general expenditures (e.g. paper, public services)
Maintenance
CHRISTIAN MARTHALER APRIL 2008 57
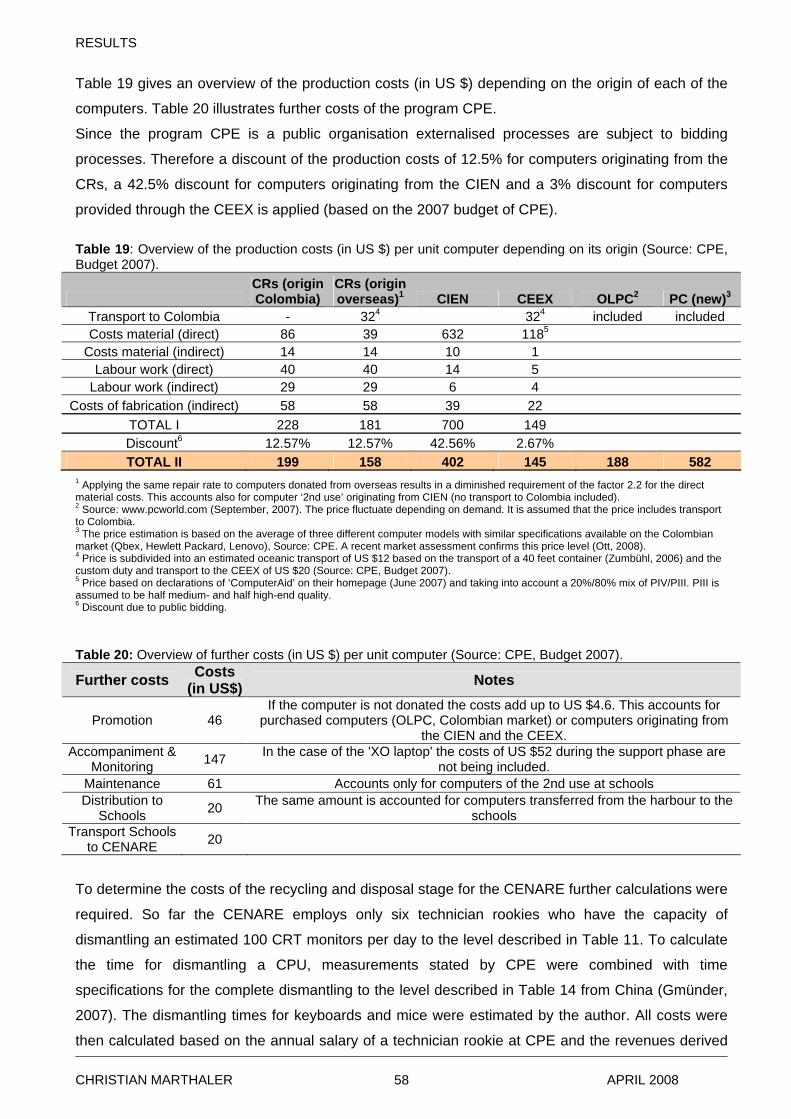
RESULTS
Table 19 gives an overview of the production costs (in US $) depending on the origin of each of the
computers. Table 20 illustrates further costs of the program CPE.
Since the program CPE is a public organisation externalised processes are subject to bidding
processes. Therefore a discount of the production costs of 12.5% for computers originating from the
CRs, a 42.5% discount for computers originating from the CIEN and a 3% discount for computers
provided through the CEEX is applied (based on the 2007 budget of CPE). Table 19: Overview of the production costs (in US $) per unit computer depending on its origin (Source: CPE, Budget 2007).
CRs (origin Colombia)
CRs (origin overseas)1 CIEN CEEX OLPC2 PC (new)3
Transport to Colombia - 324 324 included included Costs material (direct) 86 39 632 1185
Costs material (indirect) 14 14 10 1 Labour work (direct) 40 40 14 5
Labour work (indirect) 29 29 6 4 Costs of fabrication (indirect) 58 58 39 22
TOTAL I 228 181 700 149 Discount6 12.57% 12.57% 42.56% 2.67% TOTAL II 199 188 158 402 145 582
1 Applying the same repair rate to computers donated from overseas results in a diminished requirement of the factor 2.2 for the direct material costs. This accounts also for computer ‘2nd use’ originating from CIEN (no transport to Colombia included). 2 Source: www.pcworld.com (September, 2007). The price fluctuate depending on demand. It is assumed that the price includes transport to Colombia. 3 The price estimation is based on the average of three different computer models with similar specifications available on the Colombian market (Qbex, Hewlett Packard, Lenovo), Source: CPE. A recent market assessment confirms this price level (Ott, 2008). 4 Price is subdivided into an estimated oceanic transport of US $12 based on the transport of a 40 feet container (Zumbühl, 2006) and the custom duty and transport to the CEEX of US $20 (Source: CPE, Budget 2007). 5 Price based on declarations of ‘ComputerAid’ on their homepage (June 2007) and taking into account a 20%/80% mix of PIV/PIII. PIII is assumed to be half medium- and half high-end quality. 6 Discount due to public bidding. Table 20: Overview of further costs (in US $) per unit computer (Source: CPE, Budget 2007).
Further costs Costs (in US$) Notes
Promotion 46 If the computer is not donated the costs add up to US $4.6. This accounts for
purchased computers (OLPC, Colombian market) or computers originating from the CIEN and the CEEX.
Accompaniment & Monitoring 147 In the case of the 'XO laptop' the costs of US $52 during the support phase are
not being included. Maintenance 61 Accounts only for computers of the 2nd use at schools
The same amount is accounted for computers transferred from the harbour to the schools
Distribution to Schools 20
Transport Schools to CENARE 20
To determine the costs of the recycling and disposal stage for the CENARE further calculations were
required. So far the CENARE employs only six technician rookies who have the capacity of
dismantling an estimated 100 CRT monitors per day to the level described in Table 11. To calculate
the time for dismantling a CPU, measurements stated by CPE were combined with time
specifications for the complete dismantling to the level described in Table 14 from China (Gmünder,
2007). The dismantling times for keyboards and mice were estimated by the author. All costs were
then calculated based on the annual salary of a technician rookie at CPE and the revenues derived
CHRISTIAN MARTHALER APRIL 2008 58
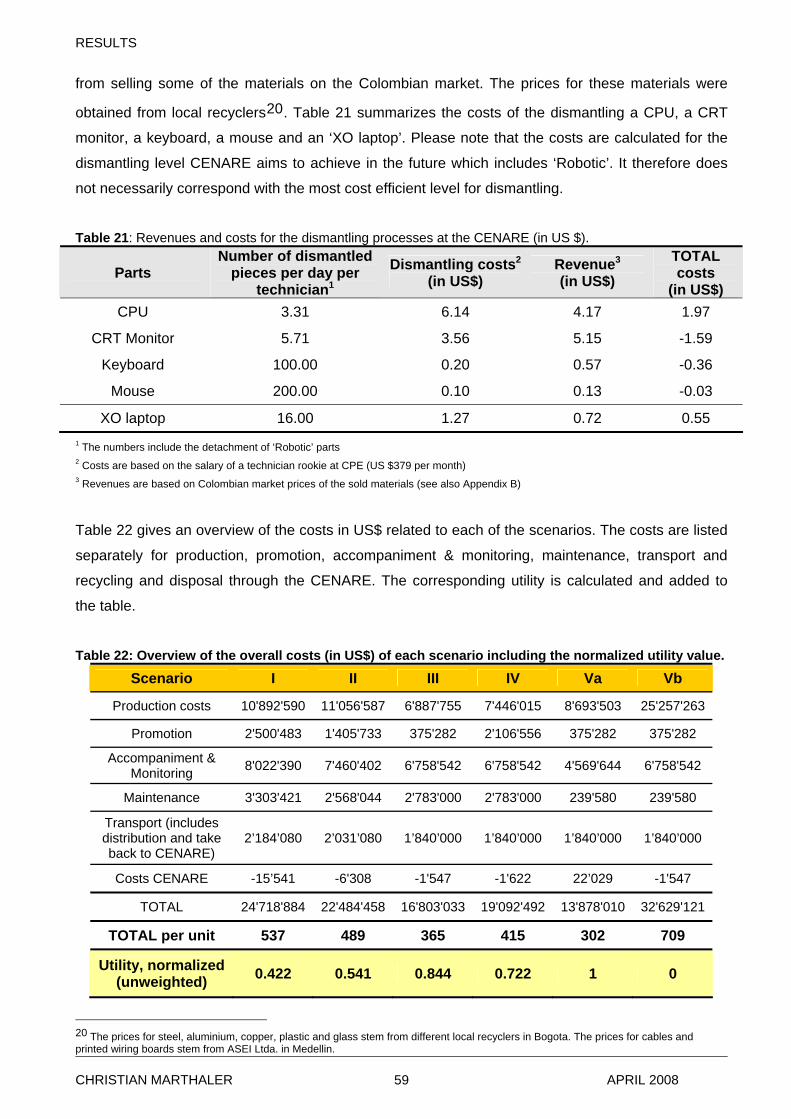
RESULTS
from selling some of the materials on the Colombian market. The prices for these materials were
obtained from local recyclers20. Table 21 summarizes the costs of the dismantling a CPU, a CRT
monitor, a keyboard, a mouse and an ‘XO laptop’. Please note that the costs are calculated for the
dismantling level CENARE aims to achieve in the future which includes ‘Robotic’. It therefore does
not necessarily correspond with the most cost efficient level for dismantling.
Table 21: Revenues and costs for the dismantling processes at the CENARE (in US $).
Parts Number of dismantled
pieces per day per technician1
Dismantling costs2 Revenue3 (in US$)
TOTAL costs
(in US$) (in US$)
CPU 3.31 6.14 4.17 1.97
CRT Monitor 5.71 3.56 5.15 -1.59
Keyboard 100.00 0.20 0.57 -0.36
Mouse 200.00 0.10 0.13 -0.03
XO laptop 16.00 1.27 0.72 0.55 1 The numbers include the detachment of ‘Robotic’ parts 2 Costs are based on the salary of a technician rookie at CPE (US $379 per month) 3 Revenues are based on Colombian market prices of the sold materials (see also Appendix B)
Table 22 gives an overview of the costs in US$ related to each of the scenarios. The costs are listed
separately for production, promotion, accompaniment & monitoring, maintenance, transport and
recycling and disposal through the CENARE. The corresponding utility is calculated and added to
the table.
Table 22: Overview of the overall costs (in US$) of each scenario including the normalized utility value.
Scenario I II III IV Va Vb
Production costs 10'892'590 11'056'587 6'887'755 7'446'015 8'693'503 25'257'263
Promotion 2'500'483 1'405'733 375'282 2'106'556 375'282 375'282
Accompaniment & Monitoring 8'022'390 7'460'402 6'758'542 6'758'542 4'569'644 6'758'542
Maintenance 3'303'421 2'568'044 2'783'000 2'783'000 239'580 239'580
Transport (includes distribution and take back to CENARE)
2’184’080 2’031’080 1’840’000 1’840’000 1’840’000 1’840’000
Costs CENARE -15’541 -6'308 -1'547 -1'622 22’029 -1'547
TOTAL 24'718'884 22'484'458 16'803'033 19'092'492 13'878'010 32'629'121
TOTAL per unit 537 489 365 415 302 709
Utility, normalized (unweighted) 0.422 0.541 0.844 0.722 1 0
20 The prices for steel, aluminium, copper, plastic and glass stem from different local recyclers in Bogota. The prices for cables and printed wiring boards stem from ASEI Ltda. in Medellin.
CHRISTIAN MARTHALER APRIL 2008 59
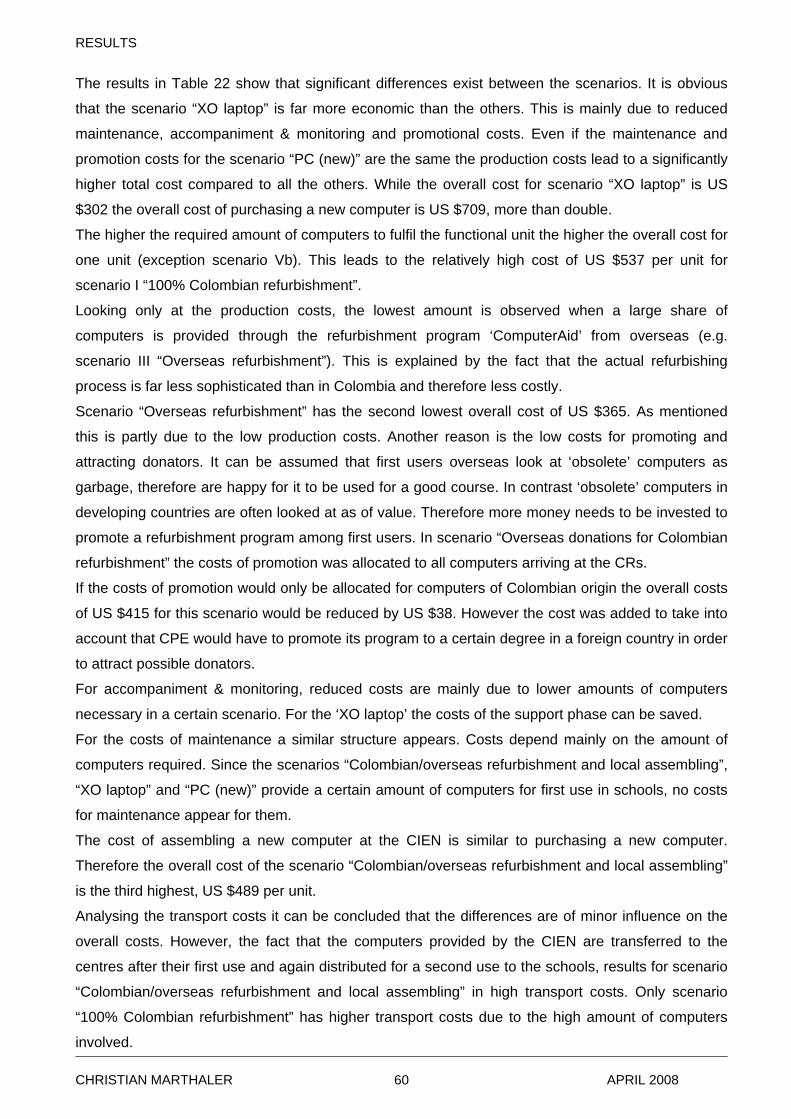
RESULTS
The results in Table 22 show that significant differences exist between the scenarios. It is obvious
that the scenario “XO laptop” is far more economic than the others. This is mainly due to reduced
maintenance, accompaniment & monitoring and promotional costs. Even if the maintenance and
promotion costs for the scenario “PC (new)” are the same the production costs lead to a significantly
higher total cost compared to all the others. While the overall cost for scenario “XO laptop” is US
$302 the overall cost of purchasing a new computer is US $709, more than double.
The higher the required amount of computers to fulfil the functional unit the higher the overall cost for
one unit (exception scenario Vb). This leads to the relatively high cost of US $537 per unit for
scenario I “100% Colombian refurbishment”.
Looking only at the production costs, the lowest amount is observed when a large share of
computers is provided through the refurbishment program ‘ComputerAid’ from overseas (e.g.
scenario III “Overseas refurbishment”). This is explained by the fact that the actual refurbishing
process is far less sophisticated than in Colombia and therefore less costly.
Scenario “Overseas refurbishment” has the second lowest overall cost of US $365. As mentioned
this is partly due to the low production costs. Another reason is the low costs for promoting and
attracting donators. It can be assumed that first users overseas look at ‘obsolete’ computers as
garbage, therefore are happy for it to be used for a good course. In contrast ‘obsolete’ computers in
developing countries are often looked at as of value. Therefore more money needs to be invested to
promote a refurbishment program among first users. In scenario “Overseas donations for Colombian
refurbishment” the costs of promotion was allocated to all computers arriving at the CRs.
If the costs of promotion would only be allocated for computers of Colombian origin the overall costs
of US $415 for this scenario would be reduced by US $38. However the cost was added to take into
account that CPE would have to promote its program to a certain degree in a foreign country in order
to attract possible donators.
For accompaniment & monitoring, reduced costs are mainly due to lower amounts of computers
necessary in a certain scenario. For the ‘XO laptop’ the costs of the support phase can be saved.
For the costs of maintenance a similar structure appears. Costs depend mainly on the amount of
computers required. Since the scenarios “Colombian/overseas refurbishment and local assembling”,
“XO laptop” and “PC (new)” provide a certain amount of computers for first use in schools, no costs
for maintenance appear for them.
The cost of assembling a new computer at the CIEN is similar to purchasing a new computer.
Therefore the overall cost of the scenario “Colombian/overseas refurbishment and local assembling”
is the third highest, US $489 per unit.
Analysing the transport costs it can be concluded that the differences are of minor influence on the
overall costs. However, the fact that the computers provided by the CIEN are transferred to the
centres after their first use and again distributed for a second use to the schools, results for scenario
“Colombian/overseas refurbishment and local assembling” in high transport costs. Only scenario
“100% Colombian refurbishment” has higher transport costs due to the high amount of computers
involved.
CHRISTIAN MARTHALER APRIL 2008 60
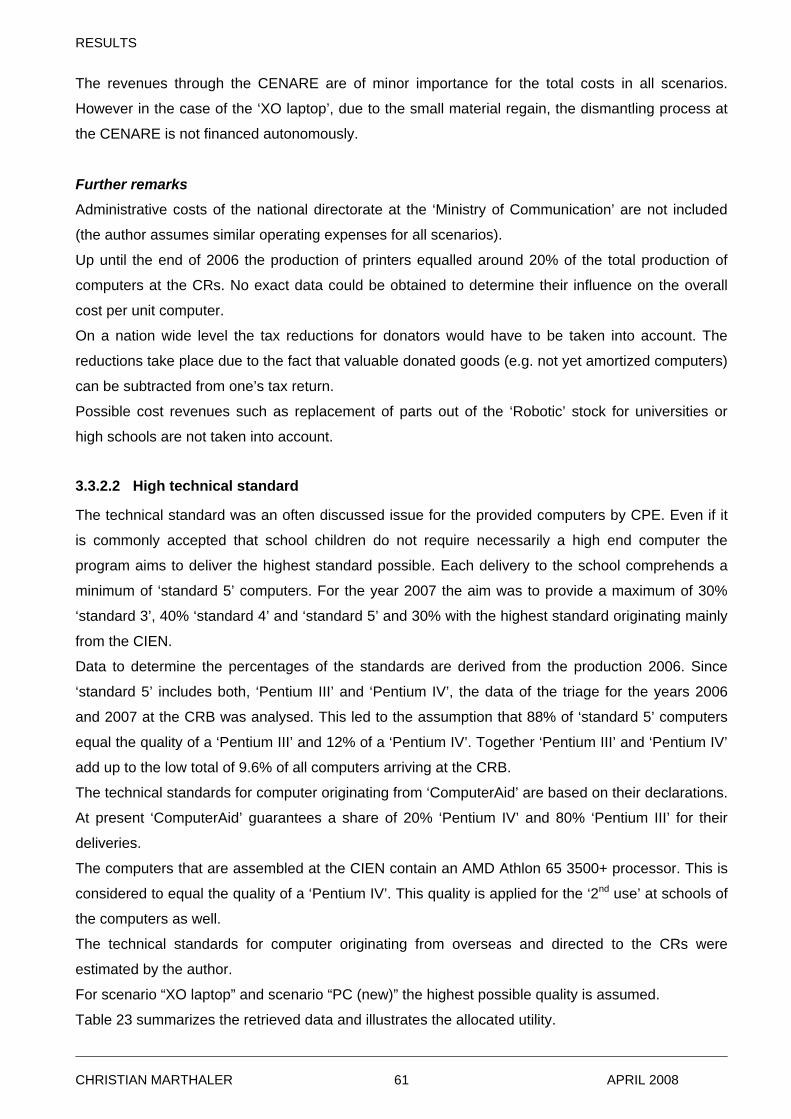
RESULTS
The revenues through the CENARE are of minor importance for the total costs in all scenarios.
However in the case of the ‘XO laptop’, due to the small material regain, the dismantling process at
the CENARE is not financed autonomously.
Further remarks
Administrative costs of the national directorate at the ‘Ministry of Communication’ are not included
(the author assumes similar operating expenses for all scenarios).
Up until the end of 2006 the production of printers equalled around 20% of the total production of
computers at the CRs. No exact data could be obtained to determine their influence on the overall
cost per unit computer.
On a nation wide level the tax reductions for donators would have to be taken into account. The
reductions take place due to the fact that valuable donated goods (e.g. not yet amortized computers)
can be subtracted from one’s tax return.
Possible cost revenues such as replacement of parts out of the ‘Robotic’ stock for universities or
high schools are not taken into account.
3.3.2.2 High technical standard
The technical standard was an often discussed issue for the provided computers by CPE. Even if it
is commonly accepted that school children do not require necessarily a high end computer the
program aims to deliver the highest standard possible. Each delivery to the school comprehends a
minimum of ‘standard 5’ computers. For the year 2007 the aim was to provide a maximum of 30%
‘standard 3’, 40% ‘standard 4’ and ‘standard 5’ and 30% with the highest standard originating mainly
from the CIEN.
Data to determine the percentages of the standards are derived from the production 2006. Since
‘standard 5’ includes both, ‘Pentium III’ and ‘Pentium IV’, the data of the triage for the years 2006
and 2007 at the CRB was analysed. This led to the assumption that 88% of ‘standard 5’ computers
equal the quality of a ‘Pentium III’ and 12% of a ‘Pentium IV’. Together ‘Pentium III’ and ‘Pentium IV’
add up to the low total of 9.6% of all computers arriving at the CRB.
The technical standards for computer originating from ‘ComputerAid’ are based on their declarations.
At present ‘ComputerAid’ guarantees a share of 20% ‘Pentium IV’ and 80% ‘Pentium III’ for their
deliveries.
The computers that are assembled at the CIEN contain an AMD Athlon 65 3500+ processor. This is
considered to equal the quality of a ‘Pentium IV’. This quality is applied for the ‘2nd use’ at schools of
the computers as well.
The technical standards for computer originating from overseas and directed to the CRs were
estimated by the author.
For scenario “XO laptop” and scenario “PC (new)” the highest possible quality is assumed.
Table 23 summarizes the retrieved data and illustrates the allocated utility.
CHRISTIAN MARTHALER APRIL 2008 61
RESULTS
Table 23: Percentages of the technical standard of each scenario and their allocated utility.
Scenario Origin Units Pentium Ior lower Pentium II Pentium
III Pentium
IV or higher
Utility
CR 54’602 39.70% 50.20% 8.50% 1.20% I
54’602 39.70% 50.20% 8.50% 1.20% 0
CR 21’366 39.70% 50.20% 8.50% 1.20%
CEEX 14000 80.00% 20.00%
CIEN 15410 100.00% II
50776 16.71% 21.12% 25.63% 36.37%
0.50
CR (Standard 5) 3960 88.00% 12.00%
CEEX 42040 80.00% 20.00% III
46000 80.69% 19.31%
0.75
CR (Standard 5) 3960 88.00% 12.00%
User Overseas 42040 20.00% 65.00% 15.00% IV
46000 18.28% 66.98% 14.74%
0.50
CR (Standard 5) 3960 88.00% 12.00%
XO laptop 42040 100.00% Va
46000 7.58% 92.42%
1
CR (Standard 5) 3960 88.00% 12.00%
PC (new) 42040 100.00% Vb
46000 7.58%
1
92.42%
The results show that the highest technical standard is achieved by purchasing new computers. This
accounts for the scenario “XO laptop” and “PC (new)”. To scenario “Overseas refurbishment” an
utility of 0.75 is allocated. To scenario “Colombian/overseas refurbishment and local assembling”
and “Overseas donations for Colombian refurbishment” the same utility of 0.5 is allocated. Although
scenario “Colombian/overseas refurbishment and local assembling” delivers more ‘Pentium II’ and
even some ‘Pentium I’ computers to the schools, the high share of ‘Pentium IV’ computers
compensates the difference compared to scenario “Overseas donations for Colombian
refurbishment”. The lowest technical standard is achieved by scenario “100% Colombian
refurbishment”.
3.3.2.3 Involvement/participation of local industry
The involvement/participation of the local economy was assessed in two categories. First the
participation of CPE during the processes for supplying and disposing the computers was assessed.
CHRISTIAN MARTHALER APRIL 2008 62
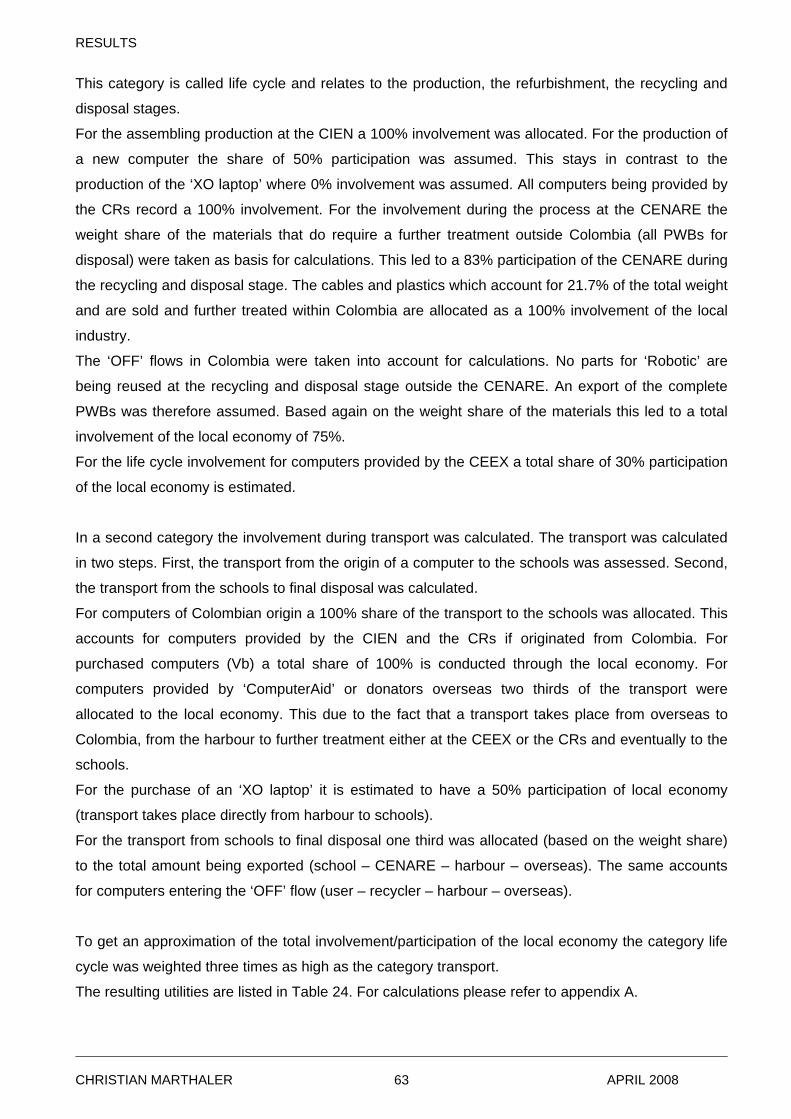
RESULTS
This category is called life cycle and relates to the production, the refurbishment, the recycling and
disposal stages.
For the assembling production at the CIEN a 100% involvement was allocated. For the production of
a new computer the share of 50% participation was assumed. This stays in contrast to the
production of the ‘XO laptop’ where 0% involvement was assumed. All computers being provided by
the CRs record a 100% involvement. For the involvement during the process at the CENARE the
weight share of the materials that do require a further treatment outside Colombia (all PWBs for
disposal) were taken as basis for calculations. This led to a 83% participation of the CENARE during
the recycling and disposal stage. The cables and plastics which account for 21.7% of the total weight
and are sold and further treated within Colombia are allocated as a 100% involvement of the local
industry.
The ‘OFF’ flows in Colombia were taken into account for calculations. No parts for ‘Robotic’ are
being reused at the recycling and disposal stage outside the CENARE. An export of the complete
PWBs was therefore assumed. Based again on the weight share of the materials this led to a total
involvement of the local economy of 75%.
For the life cycle involvement for computers provided by the CEEX a total share of 30% participation
of the local economy is estimated.
In a second category the involvement during transport was calculated. The transport was calculated
in two steps. First, the transport from the origin of a computer to the schools was assessed. Second,
the transport from the schools to final disposal was calculated.
For computers of Colombian origin a 100% share of the transport to the schools was allocated. This
accounts for computers provided by the CIEN and the CRs if originated from Colombia. For
purchased computers (Vb) a total share of 100% is conducted through the local economy. For
computers provided by ‘ComputerAid’ or donators overseas two thirds of the transport were
allocated to the local economy. This due to the fact that a transport takes place from overseas to
Colombia, from the harbour to further treatment either at the CEEX or the CRs and eventually to the
schools.
For the purchase of an ‘XO laptop’ it is estimated to have a 50% participation of local economy
(transport takes place directly from harbour to schools).
For the transport from schools to final disposal one third was allocated (based on the weight share)
to the total amount being exported (school – CENARE – harbour – overseas). The same accounts
for computers entering the ‘OFF’ flow (user – recycler – harbour – overseas).
To get an approximation of the total involvement/participation of the local economy the category life
cycle was weighted three times as high as the category transport.
The resulting utilities are listed in Table 24. For calculations please refer to appendix A.
CHRISTIAN MARTHALER APRIL 2008 63
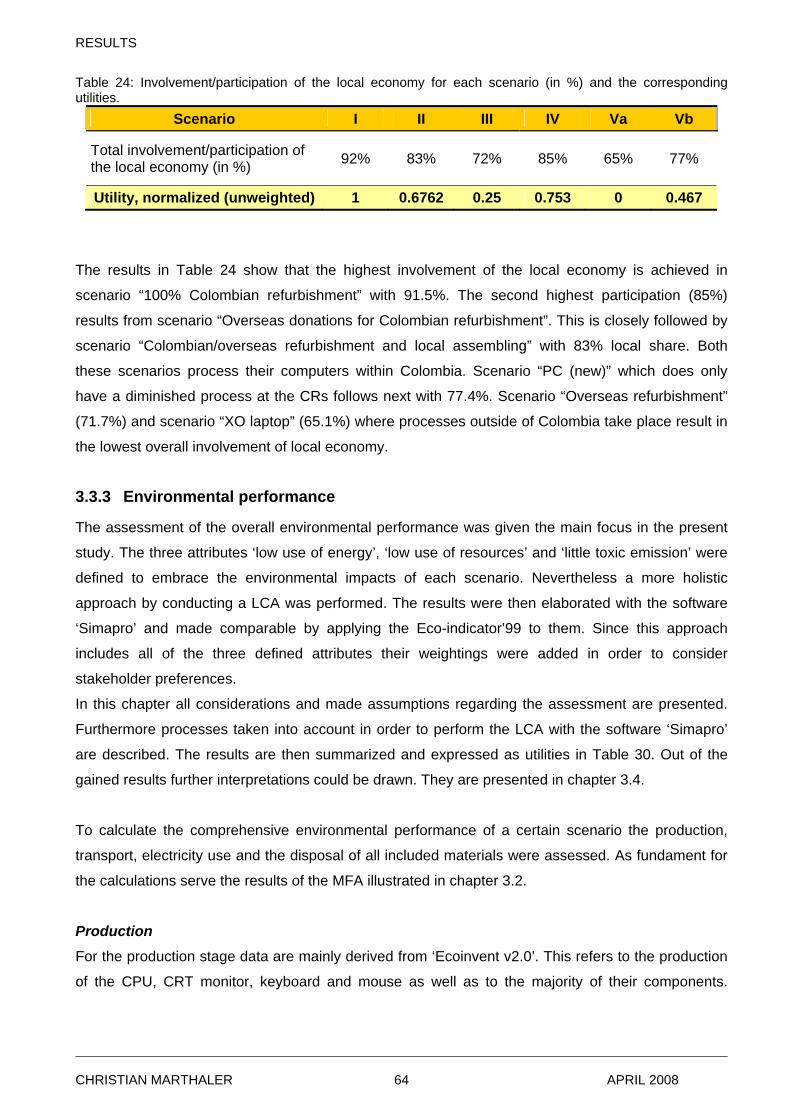
RESULTS
Table 24: Involvement/participation of the local economy for each scenario (in %) and the corresponding utilities.
Scenario I II III IV Va Vb
Total involvement/participation of the local economy (in %) 92% 83% 72% 85% 65% 77%
Utility, normalized (unweighted) 1 0.6762 0.25 0.753 0 0.467
The results in Table 24 show that the highest involvement of the local economy is achieved in
scenario “100% Colombian refurbishment” with 91.5%. The second highest participation (85%)
results from scenario “Overseas donations for Colombian refurbishment”. This is closely followed by
scenario “Colombian/overseas refurbishment and local assembling” with 83% local share. Both
these scenarios process their computers within Colombia. Scenario “PC (new)” which does only
have a diminished process at the CRs follows next with 77.4%. Scenario “Overseas refurbishment”
(71.7%) and scenario “XO laptop” (65.1%) where processes outside of Colombia take place result in
the lowest overall involvement of local economy.
3.3.3 Environmental performance
The assessment of the overall environmental performance was given the main focus in the present
study. The three attributes ‘low use of energy’, ‘low use of resources’ and ‘little toxic emission’ were
defined to embrace the environmental impacts of each scenario. Nevertheless a more holistic
approach by conducting a LCA was performed. The results were then elaborated with the software
‘Simapro’ and made comparable by applying the Eco-indicator’99 to them. Since this approach
includes all of the three defined attributes their weightings were added in order to consider
stakeholder preferences.
In this chapter all considerations and made assumptions regarding the assessment are presented.
Furthermore processes taken into account in order to perform the LCA with the software ‘Simapro’
are described. The results are then summarized and expressed as utilities in Table 30. Out of the
gained results further interpretations could be drawn. They are presented in chapter 3.4.
To calculate the comprehensive environmental performance of a certain scenario the production,
transport, electricity use and the disposal of all included materials were assessed. As fundament for
the calculations serve the results of the MFA illustrated in chapter 3.2.
Production
For the production stage data are mainly derived from ‘Ecoinvent v2.0’. This refers to the production
of the CPU, CRT monitor, keyboard and mouse as well as to the majority of their components.
CHRISTIAN MARTHALER APRIL 2008 64
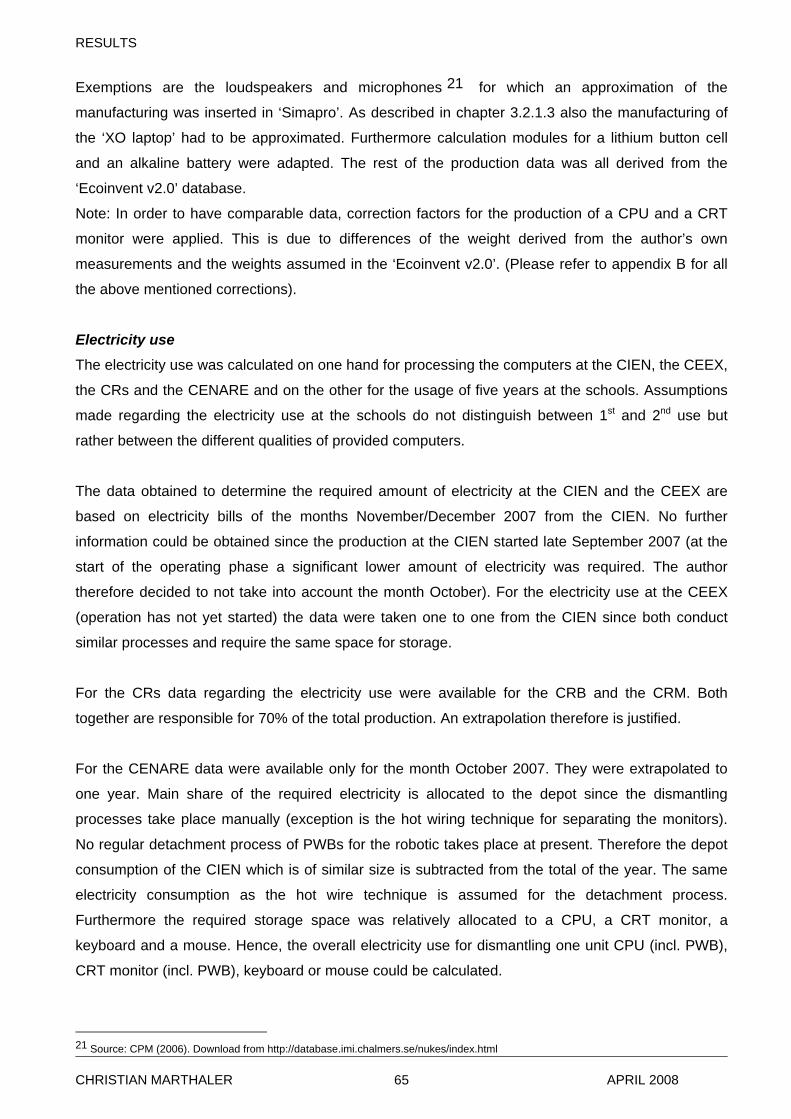
RESULTS
Exemptions are the loudspeakers and microphones 21 for which an approximation of the
manufacturing was inserted in ‘Simapro’. As described in chapter 3.2.1.3 also the manufacturing of
the ‘XO laptop’ had to be approximated. Furthermore calculation modules for a lithium button cell
and an alkaline battery were adapted. The rest of the production data was all derived from the
‘Ecoinvent v2.0’ database.
Note: In order to have comparable data, correction factors for the production of a CPU and a CRT
monitor were applied. This is due to differences of the weight derived from the author’s own
measurements and the weights assumed in the ‘Ecoinvent v2.0’. (Please refer to appendix B for all
the above mentioned corrections).
Electricity use
The electricity use was calculated on one hand for processing the computers at the CIEN, the CEEX,
the CRs and the CENARE and on the other for the usage of five years at the schools. Assumptions
made regarding the electricity use at the schools do not distinguish between 1st and 2nd use but
rather between the different qualities of provided computers.
The data obtained to determine the required amount of electricity at the CIEN and the CEEX are
based on electricity bills of the months November/December 2007 from the CIEN. No further
information could be obtained since the production at the CIEN started late September 2007 (at the
start of the operating phase a significant lower amount of electricity was required. The author
therefore decided to not take into account the month October). For the electricity use at the CEEX
(operation has not yet started) the data were taken one to one from the CIEN since both conduct
similar processes and require the same space for storage.
For the CRs data regarding the electricity use were available for the CRB and the CRM. Both
together are responsible for 70% of the total production. An extrapolation therefore is justified.
For the CENARE data were available only for the month October 2007. They were extrapolated to
one year. Main share of the required electricity is allocated to the depot since the dismantling
processes take place manually (exception is the hot wiring technique for separating the monitors).
No regular detachment process of PWBs for the robotic takes place at present. Therefore the depot
consumption of the CIEN which is of similar size is subtracted from the total of the year. The same
electricity consumption as the hot wire technique is assumed for the detachment process.
Furthermore the required storage space was relatively allocated to a CPU, a CRT monitor, a
keyboard and a mouse. Hence, the overall electricity use for dismantling one unit CPU (incl. PWB),
CRT monitor (incl. PWB), keyboard or mouse could be calculated.
21 Source: CPM (2006). Download from http://database.imi.chalmers.se/nukes/index.html
CHRISTIAN MARTHALER APRIL 2008 65
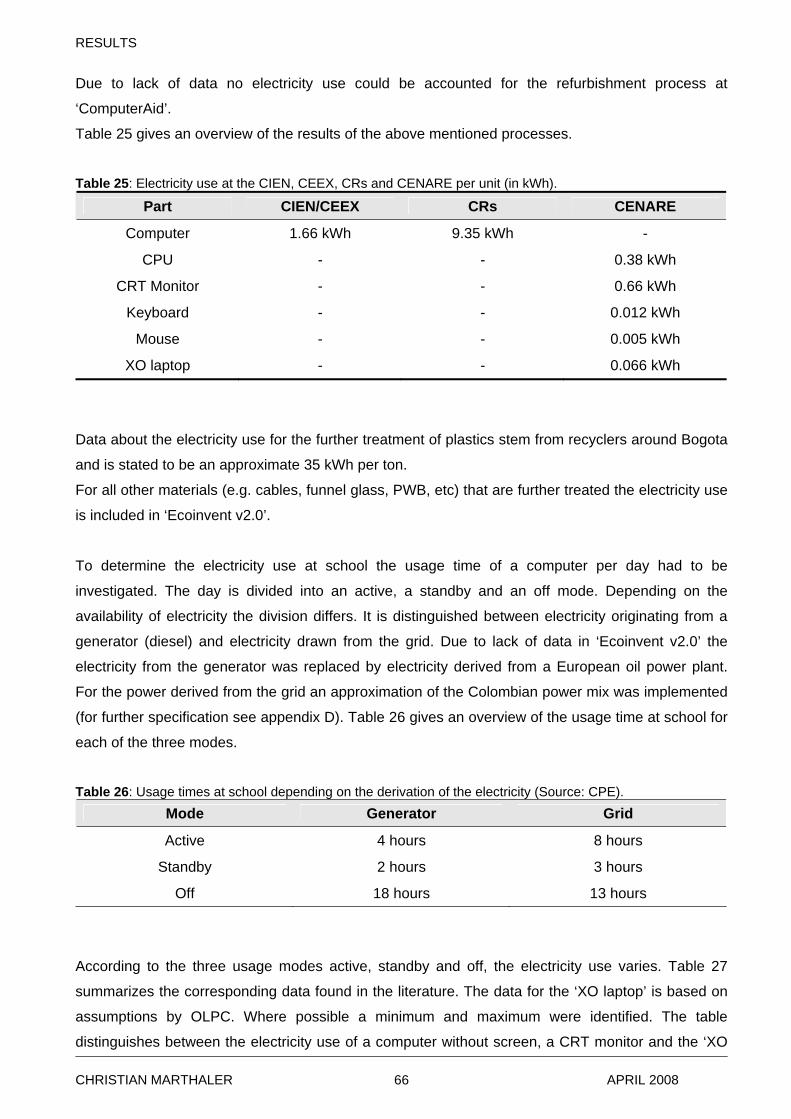
RESULTS
Due to lack of data no electricity use could be accounted for the refurbishment process at
‘ComputerAid’.
Table 25 gives an overview of the results of the above mentioned processes.
Table 25: Electricity use at the CIEN, CEEX, CRs and CENARE per unit (in kWh).
Part CIEN/CEEX CRs CENARE
Computer 1.66 kWh 9.35 kWh -
CPU - - 0.38 kWh
CRT Monitor - - 0.66 kWh
Keyboard - - 0.012 kWh
Mouse - - 0.005 kWh
XO laptop - - 0.066 kWh
Data about the electricity use for the further treatment of plastics stem from recyclers around Bogota
and is stated to be an approximate 35 kWh per ton.
For all other materials (e.g. cables, funnel glass, PWB, etc) that are further treated the electricity use
is included in ‘Ecoinvent v2.0’.
To determine the electricity use at school the usage time of a computer per day had to be
investigated. The day is divided into an active, a standby and an off mode. Depending on the
availability of electricity the division differs. It is distinguished between electricity originating from a
generator (diesel) and electricity drawn from the grid. Due to lack of data in ‘Ecoinvent v2.0’ the
electricity from the generator was replaced by electricity derived from a European oil power plant.
For the power derived from the grid an approximation of the Colombian power mix was implemented
(for further specification see appendix D). Table 26 gives an overview of the usage time at school for
each of the three modes.
Table 26: Usage times at school depending on the derivation of the electricity (Source: CPE).
Mode Generator Grid
Active 4 hours 8 hours
Standby 2 hours 3 hours
Off 18 hours 13 hours
According to the three usage modes active, standby and off, the electricity use varies. Table 27
summarizes the corresponding data found in the literature. The data for the ‘XO laptop’ is based on
assumptions by OLPC. Where possible a minimum and maximum were identified. The table
distinguishes between the electricity use of a computer without screen, a CRT monitor and the ‘XO
CHRISTIAN MARTHALER APRIL 2008 66
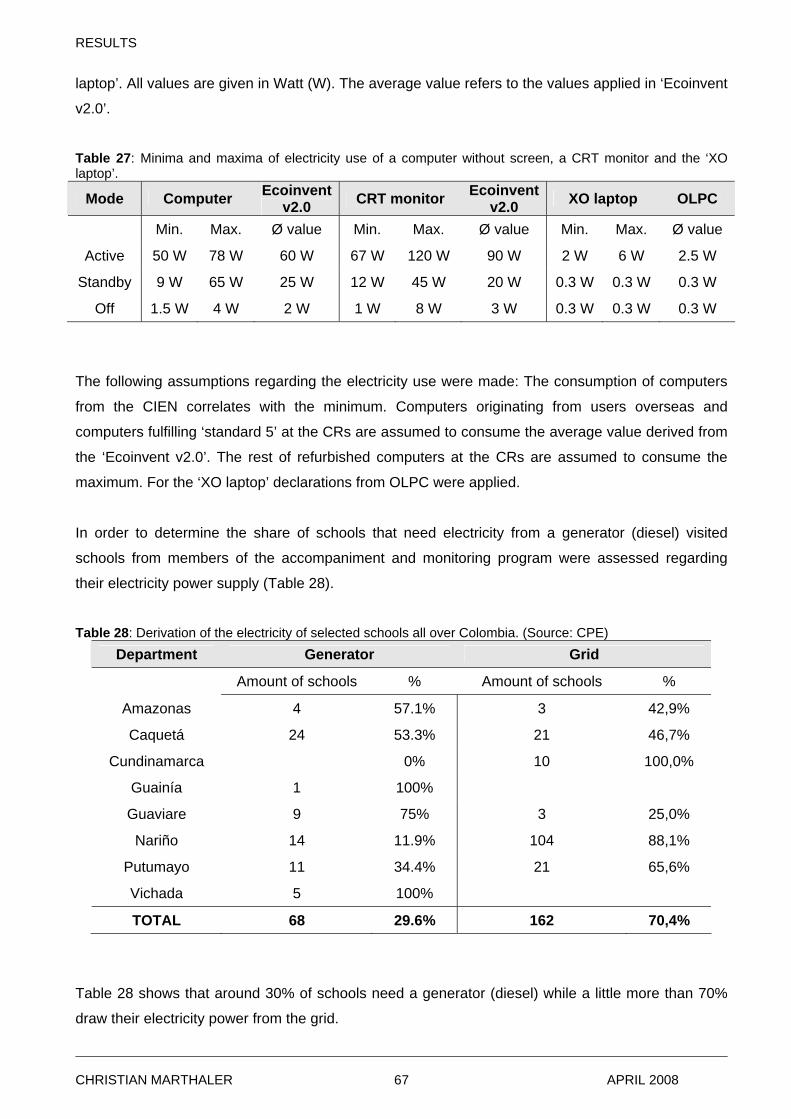
RESULTS
laptop’. All values are given in Watt (W). The average value refers to the values applied in ‘Ecoinvent
v2.0’.
Table 27: Minima and maxima of electricity use of a computer without screen, a CRT monitor and the ‘XO laptop’.
Mode Computer Ecoinvent v2.0 CRT monitor Ecoinvent
v2.0 XO laptop OLPC
Min. Max. Ø value Min. Max. Ø value Min. Max. Ø value
Active 50 W 78 W 60 W 67 W 120 W 90 W 2 W 6 W 2.5 W
Standby 9 W 65 W 25 W 12 W 45 W 20 W 0.3 W 0.3 W 0.3 W
Off 1.5 W 4 W 2 W 1 W 8 W 3 W 0.3 W 0.3 W 0.3 W
The following assumptions regarding the electricity use were made: The consumption of computers
from the CIEN correlates with the minimum. Computers originating from users overseas and
computers fulfilling ‘standard 5’ at the CRs are assumed to consume the average value derived from
the ‘Ecoinvent v2.0’. The rest of refurbished computers at the CRs are assumed to consume the
maximum. For the ‘XO laptop’ declarations from OLPC were applied.
In order to determine the share of schools that need electricity from a generator (diesel) visited
schools from members of the accompaniment and monitoring program were assessed regarding
their electricity power supply (Table 28).
Table 28: Derivation of the electricity of selected schools all over Colombia. (Source: CPE)
Department Generator Grid
Amount of schools % Amount of schools %
Amazonas 4 57.1% 3 42,9%
Caquetá 24 53.3% 21 46,7%
Cundinamarca 0% 10 100,0%
Guainía 1 100%
Guaviare 9 75% 3 25,0%
Nariño 14 11.9% 104 88,1%
Putumayo 11 34.4% 21 65,6%
Vichada 5 100%
TOTAL 68 29.6% 162 70,4%
Table 28 shows that around 30% of schools need a generator (diesel) while a little more than 70%
draw their electricity power from the grid.
CHRISTIAN MARTHALER APRIL 2008 67
RESULTS
Transport
Most of the transports take place within Colombia and are mainly conducted by a truck.
An exemption is the transport to the schools which requires for some destination a boat or even an
airplane in order to get there. For the transport from the CIEN and the CEEX to the schools the same
data were applied. Since more than half of all transports from the CRs to the schools stem from
Bogota this is justified. The data for this transport were mainly provided by Rodarcarga SA who is
responsible for the distribution of the computers to the nearest municipality of the schools. According
to them 95% of the municipalities are reached by truck, 4% require transport by boat22 and 1% can
only be reached by plane. In the year 2006 91.1% of the computers required a further transport to
their final destination. This last bit is done to 80% by a truck, to 15% by boats and to 5% by horses or
mules. The total distance to a school accounts to 70% from the providing centre to the municipality
and to 30% from the municipality to the school (estimations made by staff of the accompaniment and
monitoring at the National University in Bogota). Based on this an average total distance of 172.3 km
per school was calculated of which 162.7 km are conducted by truck.
Due to the fact that around 5% of the computer fall under warranty during the first year an additional
transport was calculated (is assumed to account only for equipment below ‘standard 5’).
For the process maintenance the same distances have been taken but were calculated for a
passenger. Due to lack of data in ‘Ecoinvent v2.0’ no passenger data were available for the transport
by boat. The distance was therefore allocated to the transport by car.
For new purchased computers, the ‘XO laptop’, parts & components for the refurbishment and
maintenance and for the assembling parts at the CIEN an oceanic transport from China to Colombia
was calculated. Where necessary a second transport from the harbour to the centres was included.
For the ‘XO laptop’ and a newly purchased computer a transport directly to the schools was
calculated. It was assumed that this equals the transport from the CRs to the schools.
Computers provided either by ‘ComputerAid’ to the CEEX or users overseas to the CRs an oceanic
transport from England to Colombia was taken into account. The transport from the harbour to the
centre was added.
The transport of parts & components to England during the refurbishment of ‘ComputerAid’ was
neglected due to the marginal amount of required parts.
The transport of the ‘OFF’ flows within Colombia and further to disposal overseas was also taken
into account. Please note that the transports ‘User Colombia’ – CRs, ‘User Colombia’ – Recycling
and CRs – CENARE are all calculated on the amount of CPUs (weight of the other parts were
included).
22 According to Rodarcarga SA, 95% of the total distance of transports that do require a boat are conducted by a truck beforehand.
CHRISTIAN MARTHALER APRIL 2008 68
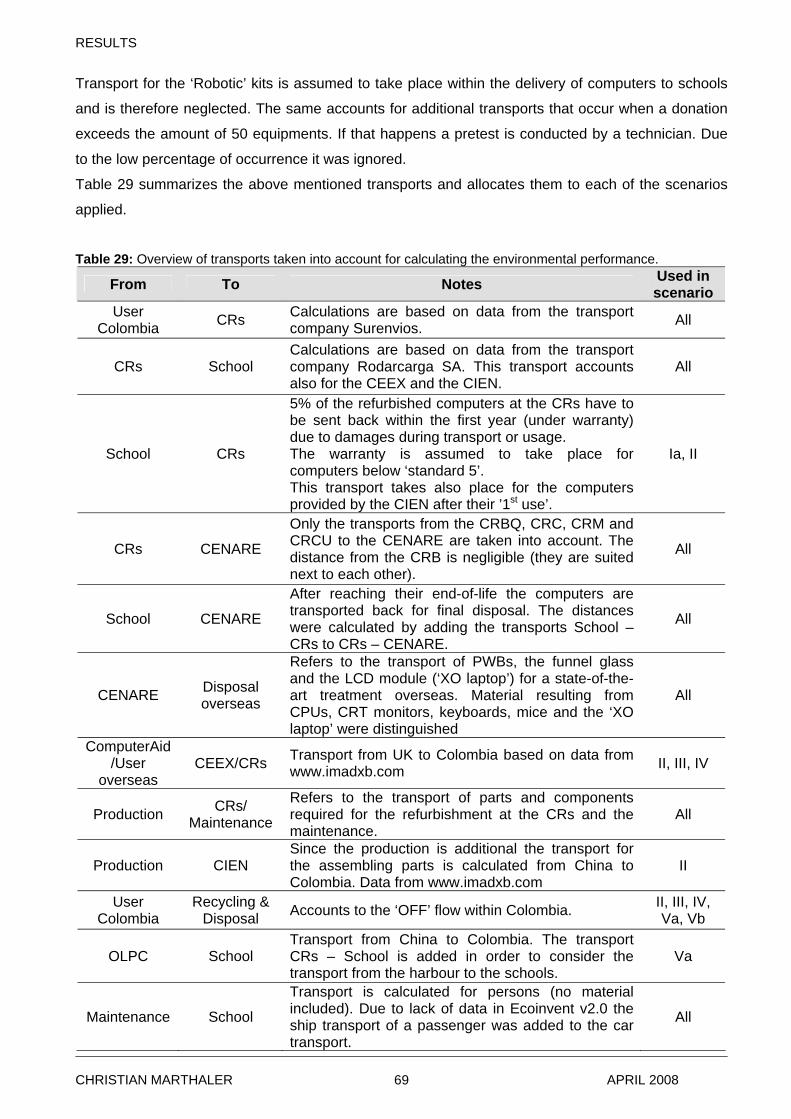
RESULTS
Transport for the ‘Robotic’ kits is assumed to take place within the delivery of computers to schools
and is therefore neglected. The same accounts for additional transports that occur when a donation
exceeds the amount of 50 equipments. If that happens a pretest is conducted by a technician. Due
to the low percentage of occurrence it was ignored.
Table 29 summarizes the above mentioned transports and allocates them to each of the scenarios
applied.
Table 29: Overview of transports taken into account for calculating the environmental performance.
From To Notes Used in scenario
User Colombia CRs Calculations are based on data from the transport
company Surenvios. All
CRs School Calculations are based on data from the transport company Rodarcarga SA. This transport accounts also for the CEEX and the CIEN.
All
School CRs
5% of the refurbished computers at the CRs have to be sent back within the first year (under warranty) due to damages during transport or usage. The warranty is assumed to take place for computers below ‘standard 5’. This transport takes also place for the computers provided by the CIEN after their ’1st use’.
Ia, II
CRs CENARE
Only the transports from the CRBQ, CRC, CRM and CRCU to the CENARE are taken into account. The distance from the CRB is negligible (they are suited next to each other).
All
School CENARE
After reaching their end-of-life the computers are transported back for final disposal. The distances were calculated by adding the transports School – CRs to CRs – CENARE.
All
CENARE Disposal overseas
Refers to the transport of PWBs, the funnel glass and the LCD module (‘XO laptop’) for a state-of-the-art treatment overseas. Material resulting from CPUs, CRT monitors, keyboards, mice and the ‘XO laptop’ were distinguished
All
ComputerAid/User
overseas CEEX/CRs Transport from UK to Colombia based on data from
www.imadxb.com II, III, IV
Production CRs/ Maintenance
Refers to the transport of parts and components required for the refurbishment at the CRs and the maintenance.
All
Production CIEN Since the production is additional the transport for the assembling parts is calculated from China to Colombia. Data from www.imadxb.com
II
User Colombia
Recycling & Disposal Accounts to the ‘OFF’ flow within Colombia. II, III, IV,
Va, Vb
OLPC School Transport from China to Colombia. The transport CRs – School is added in order to consider the transport from the harbour to the schools.
Va
Maintenance School
Transport is calculated for persons (no material included). Due to lack of data in Ecoinvent v2.0 the ship transport of a passenger was added to the car transport.
All
CHRISTIAN MARTHALER APRIL 2008 69
RESULTS
Recycling & Disposal
In order to embrace the complete life cycle of a computer the final disposal has to be included. In the
present study this was conducted by modelling the dismantling processes at the CENARE as well as
the further destinations of the materials.
Table 11 to Table 15 give an overview of the material flows that are leaving the CENARE and
therefore had to be modelled.
Because some of them substitute the primary production of raw materials (e.g. steel, cooper,
aluminium, etc.) they were calculated in ‘Simapro’ as avoided products. Note: The lower quality of
regained materials was taken into account (see appendix B for further specifications). The parts
reused for ‘Robotic’ were also assumed to substitute raw materials. This is insofar justified that some
of them serve as stock for technical education at universities or high schools and the ones delivered
to schools experience a significant life extension.
Cables are calculated to substitute copper to 65% and polyvynilchlorid (PVC) to 35% of their weight
(based on data from Gmünder, 2007). Since it was not possible to gather information about the exact
stripping process in Colombia, a ‘state-of-the-art’ recycling according to Switzerland was assumed.
Note: This accounts only for the stripping process but not for the final disposal.
For further treatment of plastics the commonly applied recycling process in Colombia was
investigated and modelled in ‘Simapro’. It is assumed that plastic substitutes to 65% of its weight
acrylonitrile-butadiene-styrene copolymer (ABS), to 20% polycarbonate and to 15%
polyvinylchloride. These percentages base on observations made at the CENARE. Again, for
plastics a significant life extension can be assumed and therefore a substitution is justified.
As described in chapter 3.2.1.3 the funnel glass and the PWBs of a PC as well as the LCD module
of the ‘XO laptop’ are assumed to be exported since no adequate treatment in Colombia is
established at present. The data therefore could be obtained from ‘Ecoinvent v2.0’.
For batteries a ‘state-of-the-art’ treatment according to Switzerland takes place in Colombia. The
same accounts for panel glass. Data stem from ‘Ecoinvent v2.0’. To map the final destination of
ceramics the disposal of glass to inert material landfill served as approximation. For waste that could
not be identified (accounts only for 0.44% of the weight of a CPU and 0.1% of a CRT monitor) a
disposal of municipal solid waste to sanitary landfill was applied.
Results
To make the scenarios comparable no environmental impacts caused by the production for donated
computers were taken into account. If the computers are new the production was included. The
environmental benefits out of the recycling were allocated to 100% if an entering computer is guided
directly to the CENARE. If used at schools only 50% of the recycling benefits are allocated.
The overall environmental impacts were aggregated with the Eco-indicator’99 to one value and
normalized to the utility value. The results of the environmental performance are shown in Table 30.
CHRISTIAN MARTHALER APRIL 2008 70
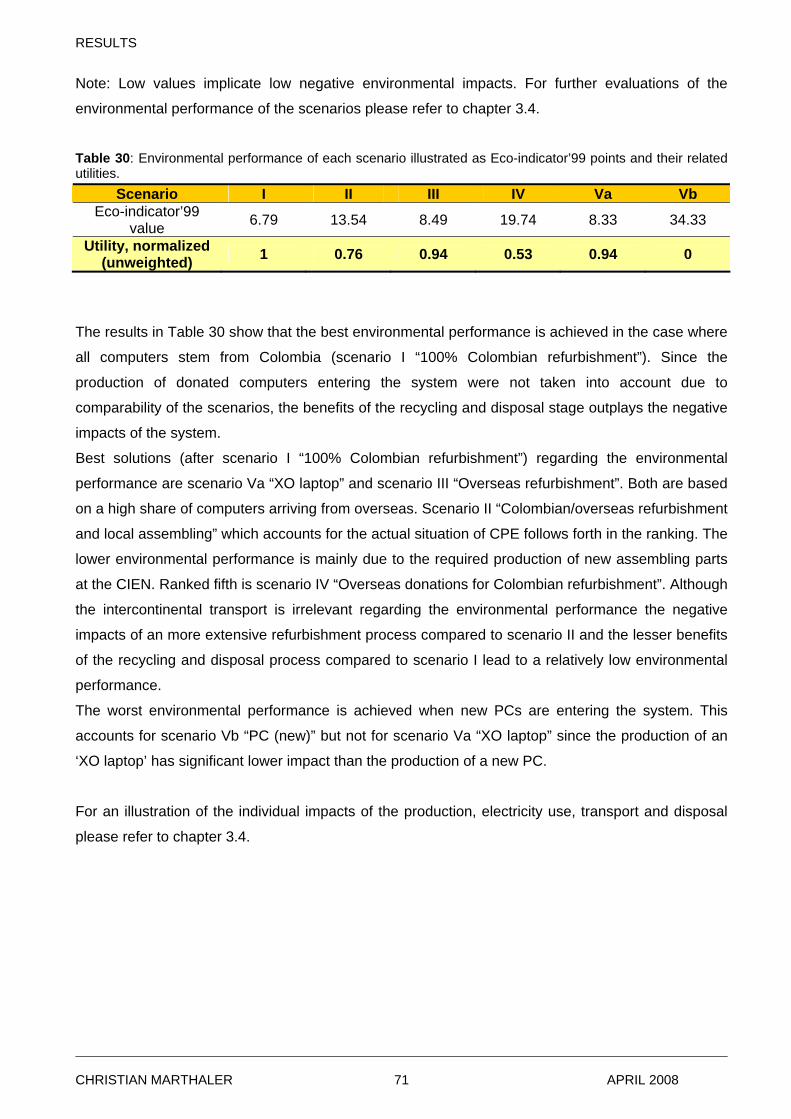
RESULTS
Note: Low values implicate low negative environmental impacts. For further evaluations of the
environmental performance of the scenarios please refer to chapter 3.4.
Table 30: Environmental performance of each scenario illustrated as Eco-indicator’99 points and their related utilities.
The results in Table 30 show that the best environmental performance is achieved in the case where
all computers stem from Colombia (scenario I “100% Colombian refurbishment”). Since the
production of donated computers entering the system were not taken into account due to
comparability of the scenarios, the benefits of the recycling and disposal stage outplays the negative
impacts of the system.
Best solutions (after scenario I “100% Colombian refurbishment”) regarding the environmental
performance are scenario Va “XO laptop” and scenario III “Overseas refurbishment”. Both are based
on a high share of computers arriving from overseas. Scenario II “Colombian/overseas refurbishment
and local assembling” which accounts for the actual situation of CPE follows forth in the ranking. The
lower environmental performance is mainly due to the required production of new assembling parts
at the CIEN. Ranked fifth is scenario IV “Overseas donations for Colombian refurbishment”. Although
the intercontinental transport is irrelevant regarding the environmental performance the negative
impacts of an more extensive refurbishment process compared to scenario II and the lesser benefits
of the recycling and disposal process compared to scenario I lead to a relatively low environmental
performance.
The worst environmental performance is achieved when new PCs are entering the system. This
accounts for scenario Vb “PC (new)” but not for scenario Va “XO laptop” since the production of an
‘XO laptop’ has significant lower impact than the production of a new PC.
For an illustration of the individual impacts of the production, electricity use, transport and disposal
please refer to chapter 3.4.
Scenario I II III IV Va Vb Eco-indicator’99
value 6.79 13.54 8.49 19.74 8.33 34.33
Utility, normalized (unweighted) 1 0.76 0.94 0.53 0.94 0
CHRISTIAN MARTHALER APRIL 2008 71
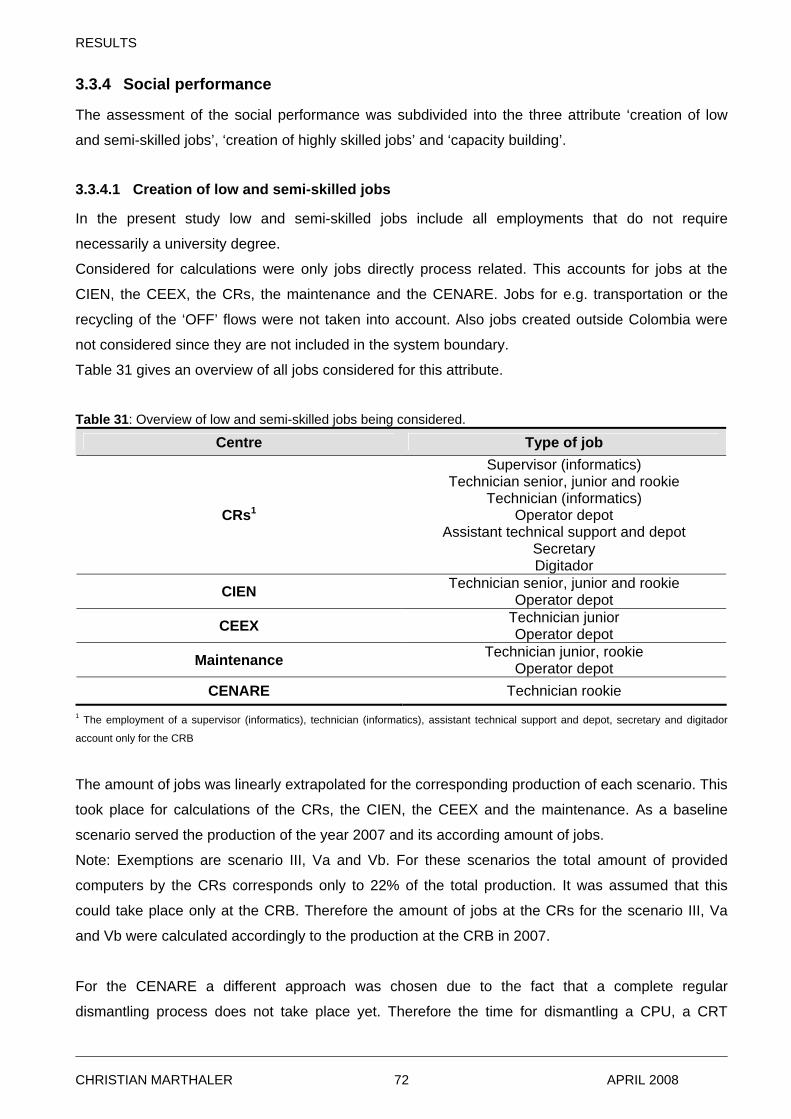
RESULTS
3.3.4 Social performance
The assessment of the social performance was subdivided into the three attribute ‘creation of low
and semi-skilled jobs’, ‘creation of highly skilled jobs’ and ‘capacity building’.
3.3.4.1 Creation of low and semi-skilled jobs
In the present study low and semi-skilled jobs include all employments that do not require
necessarily a university degree.
Considered for calculations were only jobs directly process related. This accounts for jobs at the
CIEN, the CEEX, the CRs, the maintenance and the CENARE. Jobs for e.g. transportation or the
recycling of the ‘OFF’ flows were not taken into account. Also jobs created outside Colombia were
not considered since they are not included in the system boundary.
Table 31 gives an overview of all jobs considered for this attribute.
Table 31: Overview of low and semi-skilled jobs being considered.
Centre Type of job
CRs1
Supervisor (informatics) Technician senior, junior and rookie
Technician (informatics) Operator depot
Assistant technical support and depot Secretary Digitador
CIEN Technician senior, junior and rookie Operator depot
CEEX Technician junior Operator depot
Technician junior, rookie Maintenance Operator depot Technician rookie CENARE
1 The employment of a supervisor (informatics), technician (informatics), assistant technical support and depot, secretary and digitador
account only for the CRB
The amount of jobs was linearly extrapolated for the corresponding production of each scenario. This
took place for calculations of the CRs, the CIEN, the CEEX and the maintenance. As a baseline
scenario served the production of the year 2007 and its according amount of jobs.
Note: Exemptions are scenario III, Va and Vb. For these scenarios the total amount of provided
computers by the CRs corresponds only to 22% of the total production. It was assumed that this
could take place only at the CRB. Therefore the amount of jobs at the CRs for the scenario III, Va
and Vb were calculated accordingly to the production at the CRB in 2007.
For the CENARE a different approach was chosen due to the fact that a complete regular
dismantling process does not take place yet. Therefore the time for dismantling a CPU, a CRT
CHRISTIAN MARTHALER APRIL 2008 72
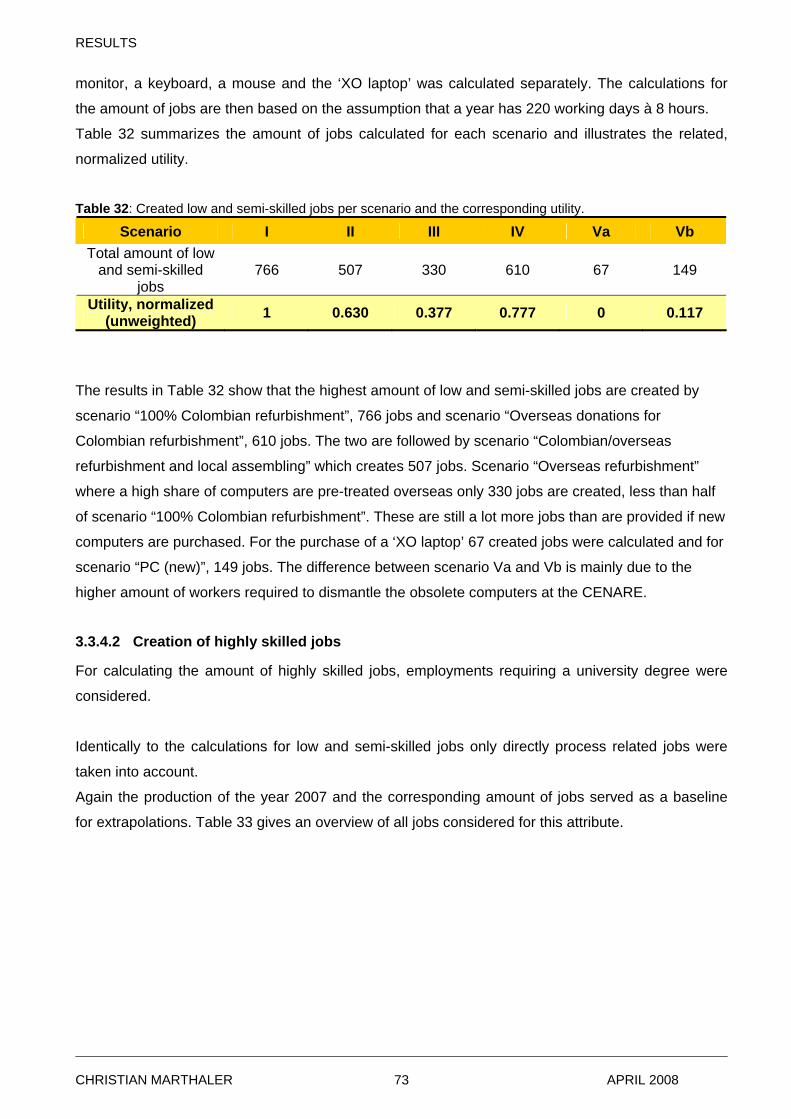
RESULTS
monitor, a keyboard, a mouse and the ‘XO laptop’ was calculated separately. The calculations for
the amount of jobs are then based on the assumption that a year has 220 working days à 8 hours.
Table 32 summarizes the amount of jobs calculated for each scenario and illustrates the related,
normalized utility.
Table 32: Created low and semi-skilled jobs per scenario and the corresponding utility.
Scenario I II III IV Va Vb Total amount of low
and semi-skilled jobs
766 507 330 610 67 149
Utility, normalized (unweighted) 1 0.630 0.377 0.777 0 0.117
The results in Table 32 show that the highest amount of low and semi-skilled jobs are created by
scenario “100% Colombian refurbishment”, 766 jobs and scenario “Overseas donations for
Colombian refurbishment”, 610 jobs. The two are followed by scenario “Colombian/overseas
refurbishment and local assembling” which creates 507 jobs. Scenario “Overseas refurbishment”
where a high share of computers are pre-treated overseas only 330 jobs are created, less than half
of scenario “100% Colombian refurbishment”. These are still a lot more jobs than are provided if new
computers are purchased. For the purchase of a ‘XO laptop’ 67 created jobs were calculated and for
scenario “PC (new)”, 149 jobs. The difference between scenario Va and Vb is mainly due to the
higher amount of workers required to dismantle the obsolete computers at the CENARE.
3.3.4.2 Creation of highly skilled jobs
For calculating the amount of highly skilled jobs, employments requiring a university degree were
considered.
Identically to the calculations for low and semi-skilled jobs only directly process related jobs were
taken into account.
Again the production of the year 2007 and the corresponding amount of jobs served as a baseline
for extrapolations. Table 33 gives an overview of all jobs considered for this attribute.
CHRISTIAN MARTHALER APRIL 2008 73
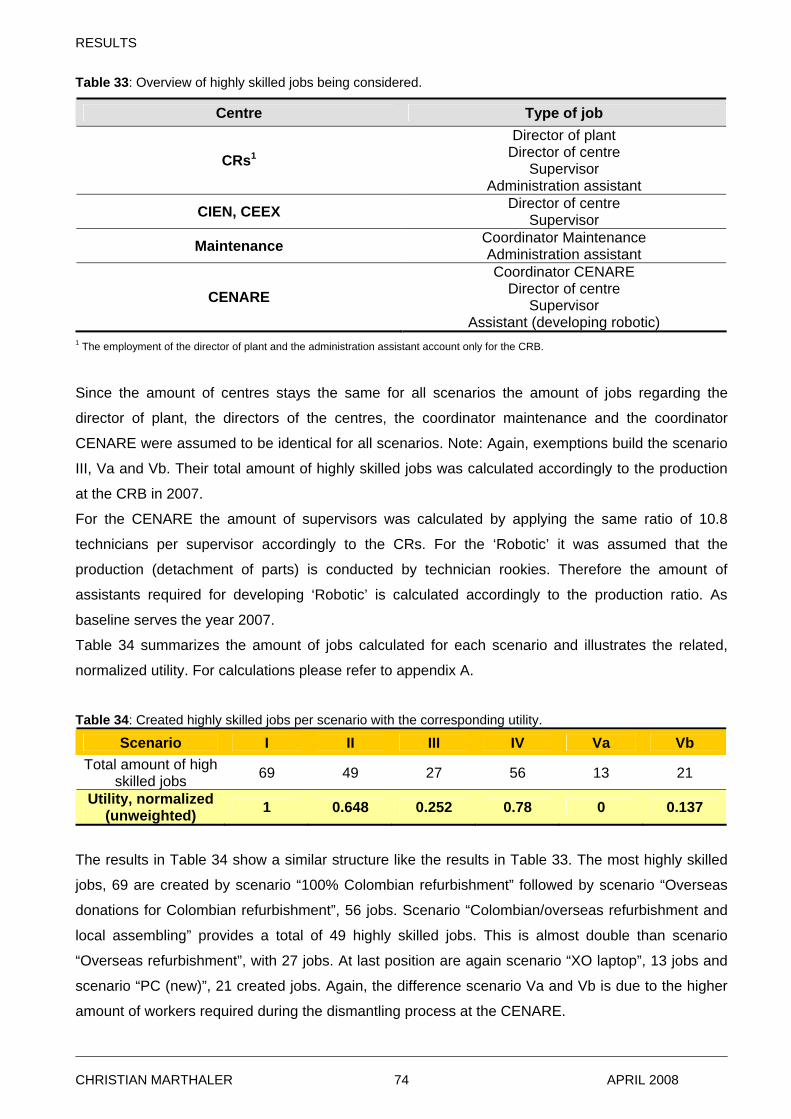
RESULTS
Table 33: Overview of highly skilled jobs being considered.
Centre Type of job Director of plant
Director of centre Supervisor CRs1
Administration assistant
CIEN, CEEX Director of centre Supervisor
Maintenance Coordinator Maintenance Administration assistant Coordinator CENARE
Director of centre CENARE Supervisor Assistant (developing robotic)
1 The employment of the director of plant and the administration assistant account only for the CRB.
Since the amount of centres stays the same for all scenarios the amount of jobs regarding the
director of plant, the directors of the centres, the coordinator maintenance and the coordinator
CENARE were assumed to be identical for all scenarios. Note: Again, exemptions build the scenario
III, Va and Vb. Their total amount of highly skilled jobs was calculated accordingly to the production
at the CRB in 2007.
For the CENARE the amount of supervisors was calculated by applying the same ratio of 10.8
technicians per supervisor accordingly to the CRs. For the ‘Robotic’ it was assumed that the
production (detachment of parts) is conducted by technician rookies. Therefore the amount of
assistants required for developing ‘Robotic’ is calculated accordingly to the production ratio. As
baseline serves the year 2007.
Table 34 summarizes the amount of jobs calculated for each scenario and illustrates the related,
normalized utility. For calculations please refer to appendix A.
Table 34: Created highly skilled jobs per scenario with the corresponding utility.
Scenario I II III IV Va Vb Total amount of high
skilled jobs 69 49 27 56 13 21
Utility, normalized (unweighted) 1 0.648 0.252 0.78 0 0.137
The results in Table 34 show a similar structure like the results in Table 33. The most highly skilled
jobs, 69 are created by scenario “100% Colombian refurbishment” followed by scenario “Overseas
donations for Colombian refurbishment”, 56 jobs. Scenario “Colombian/overseas refurbishment and
local assembling” provides a total of 49 highly skilled jobs. This is almost double than scenario
“Overseas refurbishment”, with 27 jobs. At last position are again scenario “XO laptop”, 13 jobs and
scenario “PC (new)”, 21 created jobs. Again, the difference scenario Va and Vb is due to the higher
amount of workers required during the dismantling process at the CENARE.
CHRISTIAN MARTHALER APRIL 2008 74
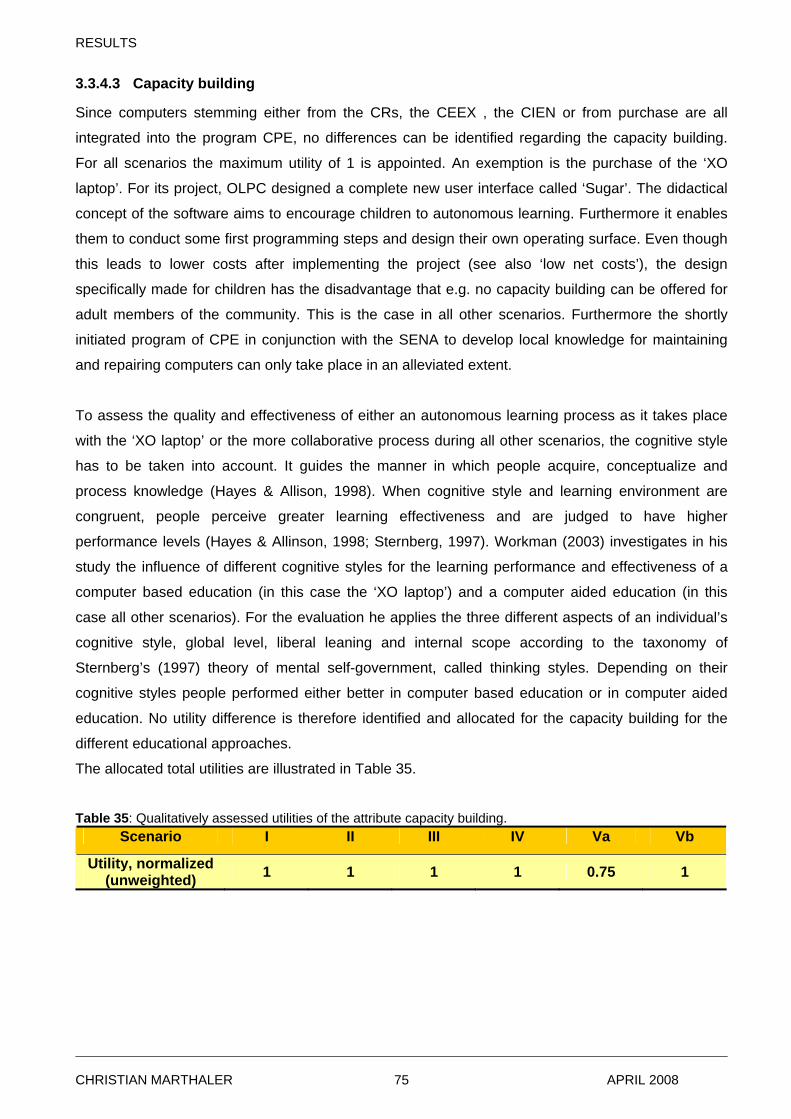
RESULTS
3.3.4.3 Capacity building
Since computers stemming either from the CRs, the CEEX , the CIEN or from purchase are all
integrated into the program CPE, no differences can be identified regarding the capacity building.
For all scenarios the maximum utility of 1 is appointed. An exemption is the purchase of the ‘XO
laptop’. For its project, OLPC designed a complete new user interface called ‘Sugar’. The didactical
concept of the software aims to encourage children to autonomous learning. Furthermore it enables
them to conduct some first programming steps and design their own operating surface. Even though
this leads to lower costs after implementing the project (see also ‘low net costs’), the design
specifically made for children has the disadvantage that e.g. no capacity building can be offered for
adult members of the community. This is the case in all other scenarios. Furthermore the shortly
initiated program of CPE in conjunction with the SENA to develop local knowledge for maintaining
and repairing computers can only take place in an alleviated extent.
To assess the quality and effectiveness of either an autonomous learning process as it takes place
with the ‘XO laptop’ or the more collaborative process during all other scenarios, the cognitive style
has to be taken into account. It guides the manner in which people acquire, conceptualize and
process knowledge (Hayes & Allison, 1998). When cognitive style and learning environment are
congruent, people perceive greater learning effectiveness and are judged to have higher
performance levels (Hayes & Allinson, 1998; Sternberg, 1997). Workman (2003) investigates in his
study the influence of different cognitive styles for the learning performance and effectiveness of a
computer based education (in this case the ‘XO laptop’) and a computer aided education (in this
case all other scenarios). For the evaluation he applies the three different aspects of an individual’s
cognitive style, global level, liberal leaning and internal scope according to the taxonomy of
Sternberg’s (1997) theory of mental self-government, called thinking styles. Depending on their
cognitive styles people performed either better in computer based education or in computer aided
education. No utility difference is therefore identified and allocated for the capacity building for the
different educational approaches.
The allocated total utilities are illustrated in Table 35.
Table 35: Qualitatively assessed utilities of the attribute capacity building.
Scenario I II III IV Va Vb
Utility, normalized (unweighted) 1 1 1 1 0.75 1
CHRISTIAN MARTHALER APRIL 2008 75
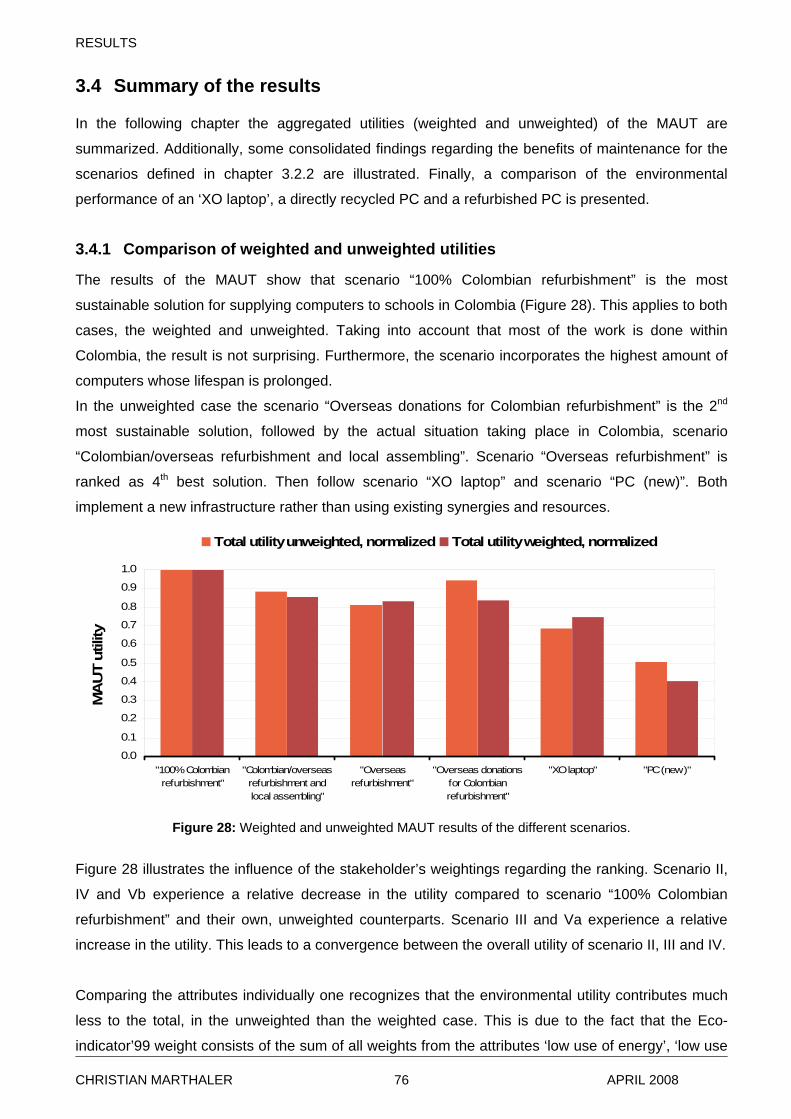
RESULTS
3.4 Summary of the results
In the following chapter the aggregated utilities (weighted and unweighted) of the MAUT are
summarized. Additionally, some consolidated findings regarding the benefits of maintenance for the
scenarios defined in chapter 3.2.2 are illustrated. Finally, a comparison of the environmental
performance of an ‘XO laptop’, a directly recycled PC and a refurbished PC is presented.
3.4.1 Comparison of weighted and unweighted utilities
The results of the MAUT show that scenario “100% Colombian refurbishment” is the most
sustainable solution for supplying computers to schools in Colombia (Figure 28). This applies to both
cases, the weighted and unweighted. Taking into account that most of the work is done within
Colombia, the result is not surprising. Furthermore, the scenario incorporates the highest amount of
computers whose lifespan is prolonged.
In the unweighted case the scenario “Overseas donations for Colombian refurbishment” is the 2nd
most sustainable solution, followed by the actual situation taking place in Colombia, scenario
“Colombian/overseas refurbishment and local assembling”. Scenario “Overseas refurbishment” is
ranked as 4th best solution. Then follow scenario “XO laptop” and scenario “PC (new)”. Both
implement a new infrastructure rather than using existing synergies and resources.
0.0
0.1
0.2
0.3
0.4
0.5
0.6
0.7
0.8
0.9
1.0
"100% Colombianrefurbishment"
"Colombian/overseasrefurbishment andlocal assembling"
"Overseasrefurbishment"
"Overseas donationsfor Colombianrefurbishment"
"XO laptop" "PC (new)"
MA
UT
utili
ty
Total utility unweighted, normalized Total utility weighted, normalized
Figure 28: Weighted and unweighted MAUT results of the different scenarios.
Figure 28 illustrates the influence of the stakeholder’s weightings regarding the ranking. Scenario II,
IV and Vb experience a relative decrease in the utility compared to scenario “100% Colombian
refurbishment” and their own, unweighted counterparts. Scenario III and Va experience a relative
increase in the utility. This leads to a convergence between the overall utility of scenario II, III and IV.
Comparing the attributes individually one recognizes that the environmental utility contributes much
less to the total, in the unweighted than the weighted case. This is due to the fact that the Eco-
indicator’99 weight consists of the sum of all weights from the attributes ‘low use of energy’, ‘low use
CHRISTIAN MARTHALER APRIL 2008 76
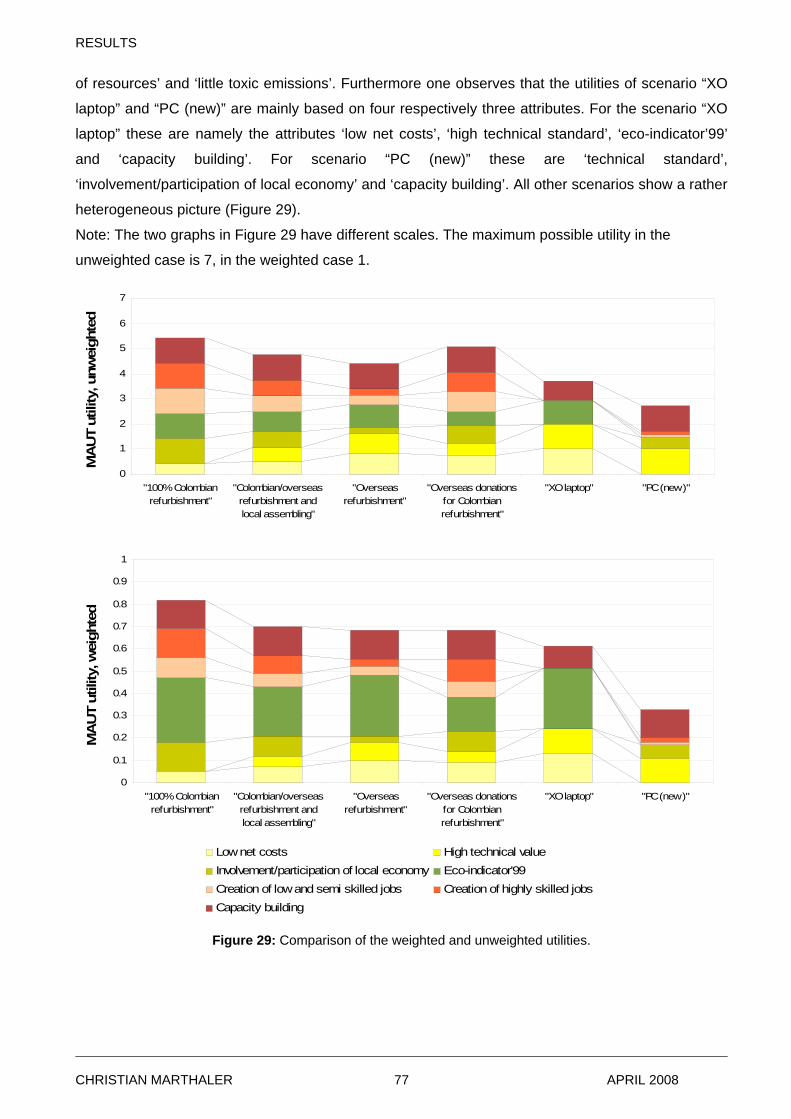
RESULTS
of resources’ and ‘little toxic emissions’. Furthermore one observes that the utilities of scenario “XO
laptop” and “PC (new)” are mainly based on four respectively three attributes. For the scenario “XO
laptop” these are namely the attributes ‘low net costs’, ‘high technical standard’, ‘eco-indicator’99’
and ‘capacity building’. For scenario “PC (new)” these are ‘technical standard’,
‘involvement/participation of local economy’ and ‘capacity building’. All other scenarios show a rather
heterogeneous picture (Figure 29).
Note: The two graphs in Figure 29 have different scales. The maximum possible utility in the
unweighted case is 7, in the weighted case 1.
0
1
2
3
4
5
6
7
"100% Colombianrefurbishment"
"Colombian/overseasrefurbishment andlocal assembling"
"Overseasrefurbishment"
"Overseas donationsfor Colombianrefurbishment"
"XO laptop" "PC (new)"
MA
UT
utili
ty, u
nwei
ghte
d
0
0.1
0.2
0.3
0.4
0.5
0.6
0.7
0.8
0.9
1
"100% Colombianrefurbishment"
"Colombian/overseasrefurbishment andlocal assembling"
"Overseasrefurbishment"
"Overseas donationsfor Colombianrefurbishment"
"XO laptop" "PC (new)"
MA
UT
utili
ty, w
eigh
ted
Low net costs High technical valueInvolvement/participation of local economy Eco-indicator'99Creation of low and semi skilled jobs Creation of highly skilled jobsCapacity building
Figure 29: Comparison of the weighted and unweighted utilities.
CHRISTIAN MARTHALER APRIL 2008 77
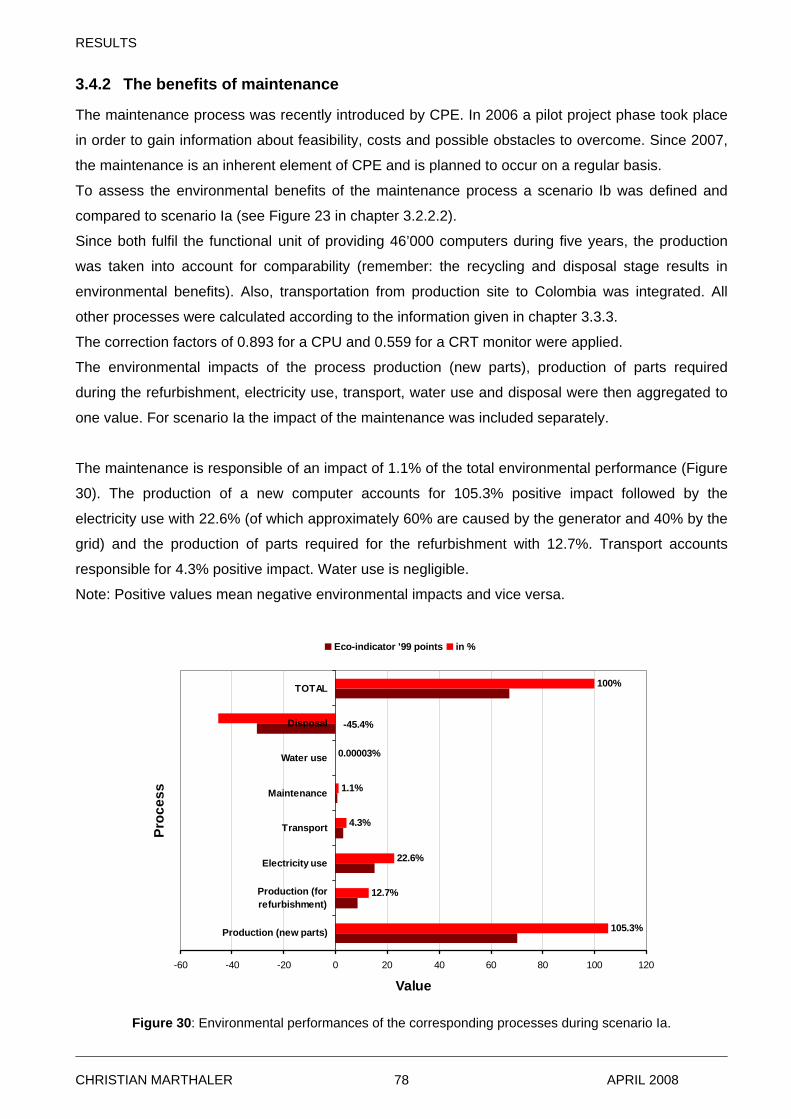
RESULTS
3.4.2 The benefits of maintenance
The maintenance process was recently introduced by CPE. In 2006 a pilot project phase took place
in order to gain information about feasibility, costs and possible obstacles to overcome. Since 2007,
the maintenance is an inherent element of CPE and is planned to occur on a regular basis.
To assess the environmental benefits of the maintenance process a scenario Ib was defined and
compared to scenario Ia (see Figure 23 in chapter 3.2.2.2).
Since both fulfil the functional unit of providing 46’000 computers during five years, the production
was taken into account for comparability (remember: the recycling and disposal stage results in
environmental benefits). Also, transportation from production site to Colombia was integrated. All
other processes were calculated according to the information given in chapter 3.3.3.
The correction factors of 0.893 for a CPU and 0.559 for a CRT monitor were applied.
The environmental impacts of the process production (new parts), production of parts required
during the refurbishment, electricity use, transport, water use and disposal were then aggregated to
one value. For scenario Ia the impact of the maintenance was included separately.
The maintenance is responsible of an impact of 1.1% of the total environmental performance (Figure
30). The production of a new computer accounts for 105.3% positive impact followed by the
electricity use with 22.6% (of which approximately 60% are caused by the generator and 40% by the
grid) and the production of parts required for the refurbishment with 12.7%. Transport accounts
responsible for 4.3% positive impact. Water use is negligible.
Note: Positive values mean negative environmental impacts and vice versa.
0.00003%
-45.4%
100%
1.1%
4.3%
22.6%
12.7%
105.3%
-60 -40 -20 0 20 40 60 80 100 120
Production (new parts)
Production (forrefurbishment)
Electricity use
Transport
Maintenance
Water use
Disposal
TOTAL
Proc
ess
Value
Eco-indicator '99 points in %
Figure 30: Environmental performances of the corresponding processes during scenario Ia.
CHRISTIAN MARTHALER APRIL 2008 78
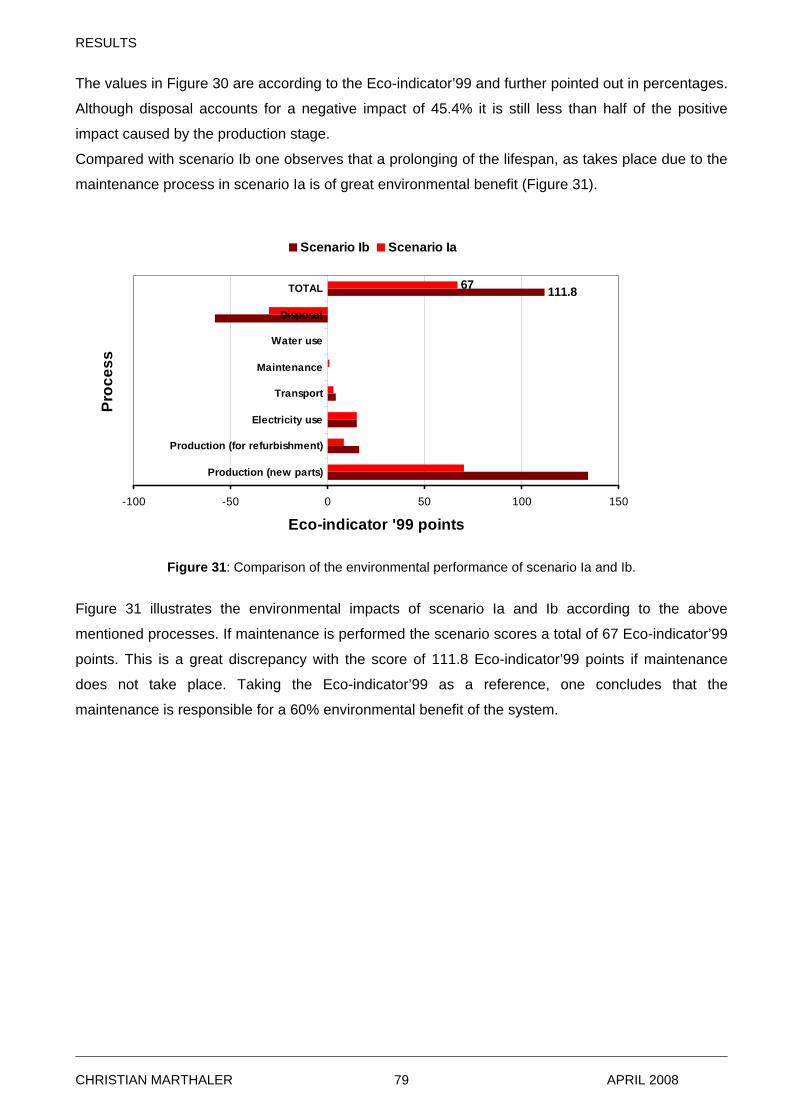
RESULTS
The values in Figure 30 are according to the Eco-indicator’99 and further pointed out in percentages.
Although disposal accounts for a negative impact of 45.4% it is still less than half of the positive
impact caused by the production stage.
Compared with scenario Ib one observes that a prolonging of the lifespan, as takes place due to the
maintenance process in scenario Ia is of great environmental benefit (Figure 31).
111.867
-100 -50 0 50 100 150
Production (new parts)
Production (for refurbishment)
Electricity use
Transport
Maintenance
Water use
Disposal
TOTAL
Proc
ess
Eco-indicator '99 points
Scenario Ib Scenario Ia
Figure 31: Comparison of the environmental performance of scenario Ia and Ib.
Figure 31 illustrates the environmental impacts of scenario Ia and Ib according to the above
mentioned processes. If maintenance is performed the scenario scores a total of 67 Eco-indicator’99
points. This is a great discrepancy with the score of 111.8 Eco-indicator’99 points if maintenance
does not take place. Taking the Eco-indicator’99 as a reference, one concludes that the
maintenance is responsible for a 60% environmental benefit of the system.
CHRISTIAN MARTHALER APRIL 2008 79
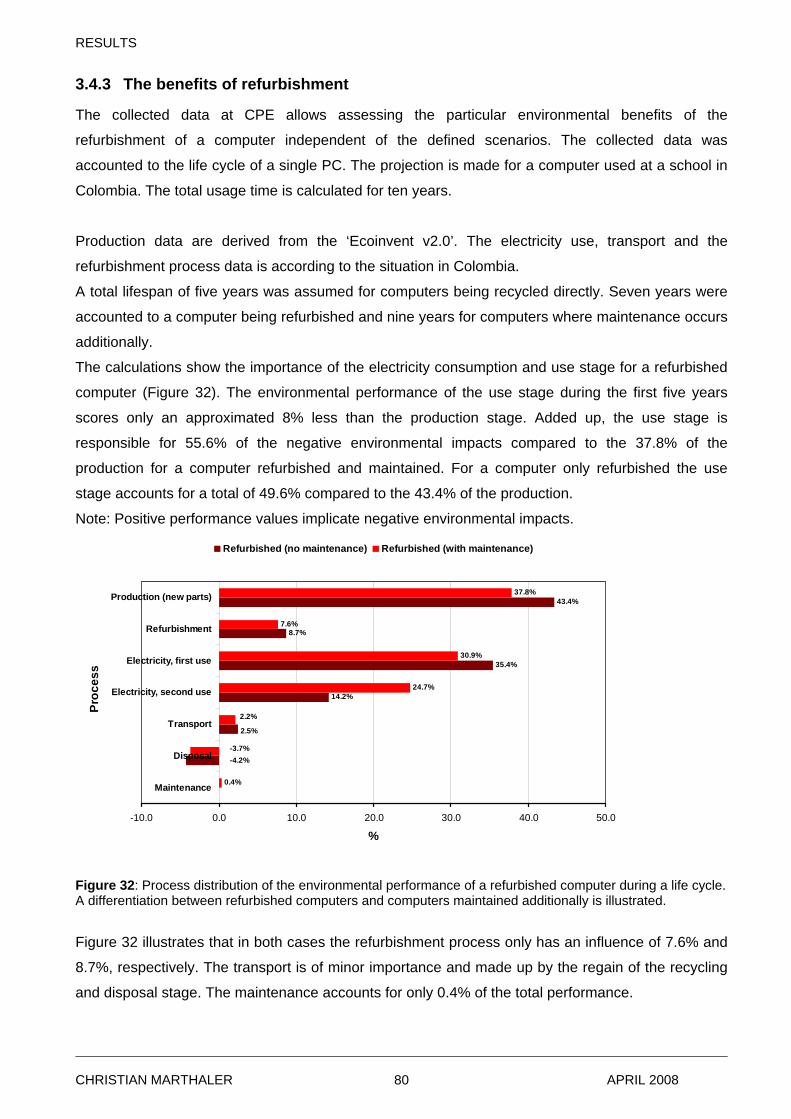
RESULTS
3.4.3 The benefits of refurbishment
The collected data at CPE allows assessing the particular environmental benefits of the
refurbishment of a computer independent of the defined scenarios. The collected data was
accounted to the life cycle of a single PC. The projection is made for a computer used at a school in
Colombia. The total usage time is calculated for ten years.
Production data are derived from the ‘Ecoinvent v2.0’. The electricity use, transport and the
refurbishment process data is according to the situation in Colombia.
A total lifespan of five years was assumed for computers being recycled directly. Seven years were
accounted to a computer being refurbished and nine years for computers where maintenance occurs
additionally.
The calculations show the importance of the electricity consumption and use stage for a refurbished
computer (Figure 32). The environmental performance of the use stage during the first five years
scores only an approximated 8% less than the production stage. Added up, the use stage is
responsible for 55.6% of the negative environmental impacts compared to the 37.8% of the
production for a computer refurbished and maintained. For a computer only refurbished the use
stage accounts for a total of 49.6% compared to the 43.4% of the production.
Note: Positive performance values implicate negative environmental impacts.
43.4%
-4.2%
8.7%
35.4%
14.2%
2.5%
7.6%
37.8%
-3.7%
30.9%
24.7%
2.2%
0.4%
-10.0 0.0 10.0 20.0 30.0 40.0 50.0
Maintenance
Disposal
Transport
Electricity, second use
Electricity, first use
Refurbishment
Production (new parts)
Proc
ess
%
Refurbished (no maintenance) Refurbished (with maintenance)
Figure 32: Process distribution of the environmental performance of a refurbished computer during a life cycle. A differentiation between refurbished computers and computers maintained additionally is illustrated.
Figure 32 illustrates that in both cases the refurbishment process only has an influence of 7.6% and
8.7%, respectively. The transport is of minor importance and made up by the regain of the recycling
and disposal stage. The maintenance accounts for only 0.4% of the total performance.
CHRISTIAN MARTHALER APRIL 2008 80
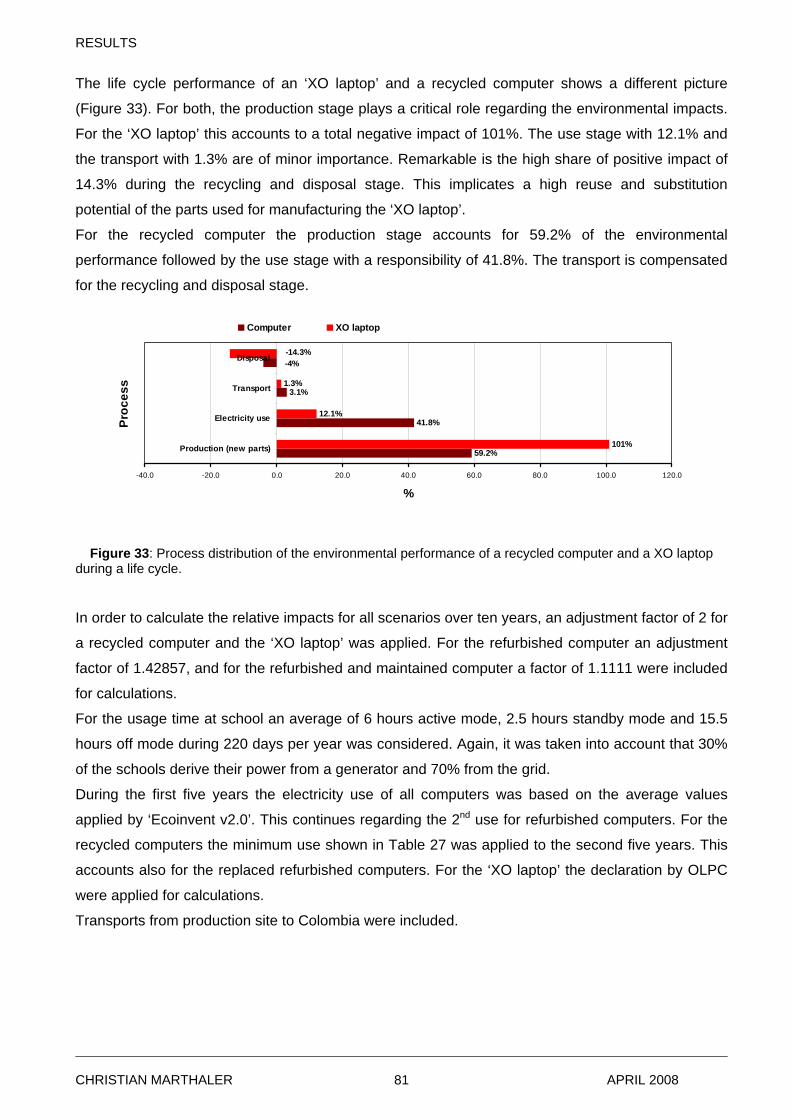
RESULTS
The life cycle performance of an ‘XO laptop’ and a recycled computer shows a different picture
(Figure 33). For both, the production stage plays a critical role regarding the environmental impacts.
For the ‘XO laptop’ this accounts to a total negative impact of 101%. The use stage with 12.1% and
the transport with 1.3% are of minor importance. Remarkable is the high share of positive impact of
14.3% during the recycling and disposal stage. This implicates a high reuse and substitution
potential of the parts used for manufacturing the ‘XO laptop’.
For the recycled computer the production stage accounts for 59.2% of the environmental
performance followed by the use stage with a responsibility of 41.8%. The transport is compensated
for the recycling and disposal stage.
59.2%
41.8%
3.1%
-4%
101%
12.1%
1.3%
-14.3%
-40.0 -20.0 0.0 20.0 40.0 60.0 80.0 100.0 120.0
Production (new parts)
Electricity use
Transport
Disposal
Proc
ess
%
Computer XO laptop
Figure 33: Process distribution of the environmental performance of a recycled computer and a XO laptop
during a life cycle.
In order to calculate the relative impacts for all scenarios over ten years, an adjustment factor of 2 for
a recycled computer and the ‘XO laptop’ was applied. For the refurbished computer an adjustment
factor of 1.42857, and for the refurbished and maintained computer a factor of 1.1111 were included
for calculations.
For the usage time at school an average of 6 hours active mode, 2.5 hours standby mode and 15.5
hours off mode during 220 days per year was considered. Again, it was taken into account that 30%
of the schools derive their power from a generator and 70% from the grid.
During the first five years the electricity use of all computers was based on the average values
applied by ‘Ecoinvent v2.0’. This continues regarding the 2nd use for refurbished computers. For the
recycled computers the minimum use shown in Table 27 was applied to the second five years. This
accounts also for the replaced refurbished computers. For the ‘XO laptop’ the declaration by OLPC
were applied for calculations.
Transports from production site to Colombia were included.
CHRISTIAN MARTHALER APRIL 2008 81
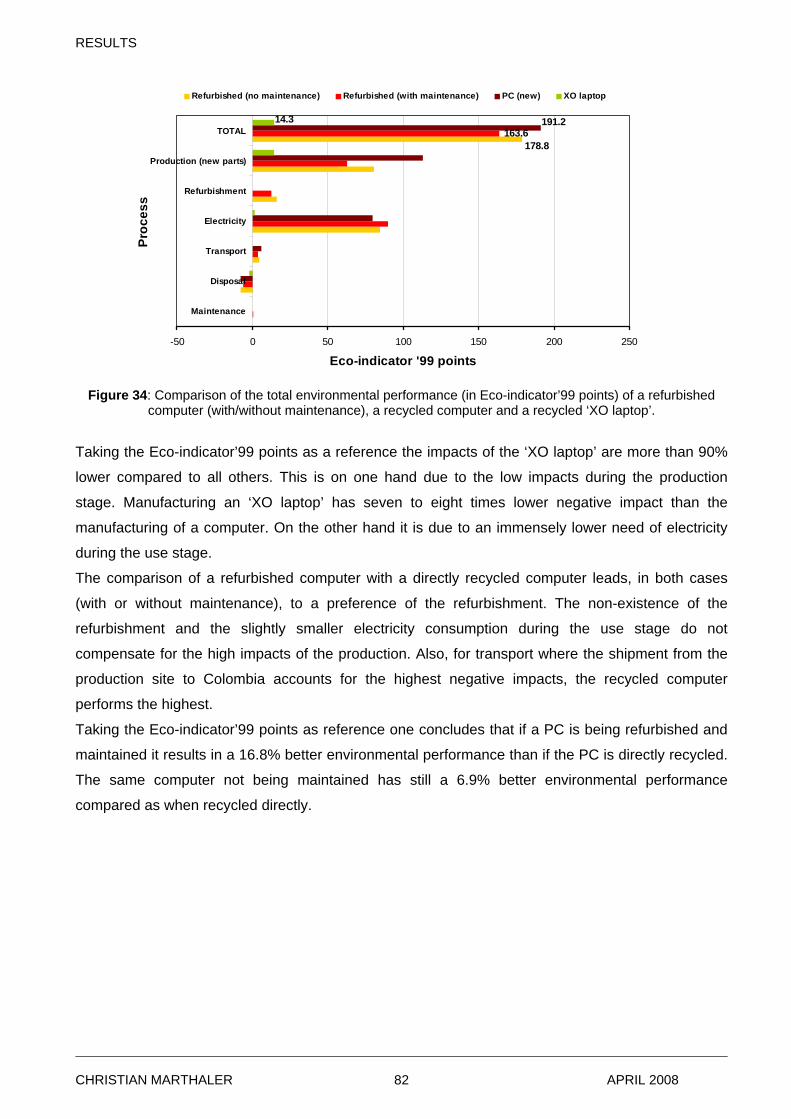
RESULTS
178.8163.6
191.214.3
-50 0 50 100 150 200 250
Maintenance
Disposal
Transport
Electricity
Refurbishment
Production (new parts)
TOTALPr
oces
s
Eco-indicator '99 points
Refurbished (no maintenance) Refurbished (with maintenance) PC (new) XO laptop
Figure 34: Comparison of the total environmental performance (in Eco-indicator’99 points) of a refurbished
computer (with/without maintenance), a recycled computer and a recycled ‘XO laptop’.
Taking the Eco-indicator’99 points as a reference the impacts of the ‘XO laptop’ are more than 90%
lower compared to all others. This is on one hand due to the low impacts during the production
stage. Manufacturing an ‘XO laptop’ has seven to eight times lower negative impact than the
manufacturing of a computer. On the other hand it is due to an immensely lower need of electricity
during the use stage.
The comparison of a refurbished computer with a directly recycled computer leads, in both cases
(with or without maintenance), to a preference of the refurbishment. The non-existence of the
refurbishment and the slightly smaller electricity consumption during the use stage do not
compensate for the high impacts of the production. Also, for transport where the shipment from the
production site to Colombia accounts for the highest negative impacts, the recycled computer
performs the highest.
Taking the Eco-indicator’99 points as reference one concludes that if a PC is being refurbished and
maintained it results in a 16.8% better environmental performance than if the PC is directly recycled.
The same computer not being maintained has still a 6.9% better environmental performance
compared as when recycled directly.
CHRISTIAN MARTHALER APRIL 2008 82
DISCUSSION
4 Discussion
4.1 Consolidation and discussion of research
Overall, the aim of the study was achieved. A statement could be made regarding the economic,
environmental and social impacts of the strategies identified to supply computers to schools in
Colombia. Furthermore, the study delivers new findings regarding the benefits of refurbishing
computers and relates them to recent developments in the supply market.
In the following pages the methods and results are reviewed and discussed in the context of the
research questions.
A What are the exact material flows of the refurbishment program CPE?
To analyze the exact material flows of the refurbishment program CPE the MFA was chosen as a
default method. It allowed a realistic analysis to be made despite the inevitable shortcomings
discussed in the following section. It was appropriate to understand the system, helped to elaborate
a profound foundation and worked as a precursor for later calculations required applying the MAUT.
Model input
This section discusses the results of chapter 3.2.1.
Reliability and comprehensiveness of model input data are crucial elements of authenticity.
Data regarding the refurbishment process at the CRs could be obtained first hand. This accounts for:
parts and components required during the refurbishment process, the average lifespan of a
computer before entering the system, the average usage time in schools; the separate failure rate of
a CPU, CRT monitor, keyboard or mouse.
For the maintenance model input data could be obtained in situ as well.
No detailed data was available regarding the material flows of the processes at the CIEN and the
CEEX which were incorporated into the program CPE. Due to the recent start of the ‘operation
phase’ at the CIEN, and the fact that the CEEX has not yet begun to function, many real time output
figures had to be assumed.
A similar situation took place at the CENARE. The centre is not yet running at its capacity and
dismantling processes are still in development. Nevertheless, the transfer coefficients could either be
CHRISTIAN MARTHALER APRIL 2008 83
DISCUSSION
determined in situ (CRT monitor) 23 , obtained from a comparable Chinese dismantling plant
(CPU)24 or derived from the ‘Ecoinvent v2.0’ (keyboard, mouse).
Two critical elements regarding the MFA at the CENARE are the ‘Robotic’ and the further destination
for final disposal of the materials. The ‘Robotic’ is still in development and more kits are planned. An
approximation of the composition of these components had to be made (see also appendix B).
Furthermore, the present study excludes the environmental responsibility of CPE for delivered kits.
This is only justified assuming that the kits will not be dumped in the near future.
Once established, investigations regarding the material flows of robotic kits have to be made
continuously. Likewise, the benefit of stockpiling separated components, for future use at universities
or high schools, would first have to be proven.
For the final disposal of ‘e-waste’, real life solutions for Colombia were identified. Currently, the
MAVDT is evaluating existing and possible future e-waste treatments within Colombia. However,
based on the present situation, this study assumes an export of PWBs (without parts used for
‘Robotic’), funnel glass and LCD modules (‘XO laptop’).
As a crucial model input, the lifespan of the computers could be identified. In this study the lifespan
indicated in table 9 were applied. Further research in the field should include a sensitivity analysis
regarding the lifespan of computers of different origins.
B What are possible alternative scenarios to provide a sufficient supply of computers to
schools in Colombia?
Having begun the study with the possibility of certain alternative supply strategies (‘ComputerAid’,
‘XO laptop’), the iterative process of conducting a MFA at CPE revealed further possible scenarios.
Interviews with members of CPE, helped to reveal new strategies and identify their requirements.
This resulted in incorporating the CIEN or the CEEX as possible scenarios into the program CPE.
Five scenarios were identified that could potentially provide a sufficient supply of computers, two of
them with sub scenarios (see chapter 3.2.2).
Model scenarios
The functional unit proved to be well chosen. The amount of 46’000 computers corresponds with the
set targets of the Colombian government. An assumed five year usage at schools allowed a realistic
projection of supply strategies.
23 Sampling size were a hundred CRT monitors dismantled at the CENARE. 24 CPE conducted a pilot project of dismantling CPUs in 2005. The basic dismantling depth is comparable to the results in China (Gmünder, 2007). However, due to the requirements of the ‘Robotic’ further dismantling times of the HDD, FDD and CDD were derived from experiences made in China.
CHRISTIAN MARTHALER APRIL 2008 84
DISCUSSION
The modelling of the scenarios is exclusively based on the functional unit. As a result adaptations
were required of some scenarios.
For the scenarios Ia and Ib “100% Colombian refrubishment” an extrapolation from the present
production of 18’000 to the model of 46’000 computers had to be made. Regarding the input this is
justified since sale figures of computers in Colombia outnumber the required amount of CPE.
Scenario II “Colombian/overseas refurbishment and local assembling” fulfils this requirement without
having to be adapted.
For scenario III “Overseas refurbishment” it must be taken into account that the required amount of
42’040 computers is a huge number even for ComputerAid, the largest and most experienced
overseas computer refurbisher. Furthermore it can not be assumed that ComputerAid would give so
many computers to one organisation. This problem does not exist regarding scenario IV “Overseas
donations for Colombian refurbishment”, though the required amount of over 49’000 computers is
rather at the high end of a possible supply.25 This is in contrast to the supply by OLPC who aims to
sell at least 100’000 ‘XO laptops’ at once. However, ordering 42’040 computers over several years
would be possible26.
In summary, a sufficient supply is guaranteed in the case of new purchases (scenario Va, Vb) or in
the combination of different strategies (scenario II). In all other cases additional efforts would have to
be made to achieve the set targets. In scenario “100% Colombian refurbishment” sufficient input
figures could possibly be achieved by investing in the promoting of CPE. The same accounts for
scenario “Overseas donations for Colombian refrubishment”. However, in Colombia the program has
an established reputation while in a foreign country the reputation would have to be built. Scenario III
“Overseas refurbishment” does not function within the control of CPE and is therefore of
questionable possibility.
C What are the involved costs of each of these scenarios?
The cost analysis was, in the form of the attribute ‘low net costs’, part of the MAUT assessment.
The production costs, as well as further costs incurred by the program CPE (see table 14) were both
taken into account.
The results in chapter 3.3.2.1 show that the purchase of the ‘XO laptop’ is by far the most cost
efficient solution. This is mainly because no support during accompaniment is assumed to be
required, due to the concept of the ‘XO laptop’ to encourage autonomous learning. Low maintenance
requirements (calculated to be US $61) per computer are another reason.
25 Angel Camacho (Coordinator CENARE) estimates the total amount of computers that could directly be acquired through donations from overseas between 30’000 and 40’000 computers. 26 According to Mary Lou Jepsen, former chief technology officer of OLPC.
CHRISTIAN MARTHALER APRIL 2008 85
DISCUSSION
Though they have lower production costs than the ‘XO laptop’, computers provided by ‘ComputerAid’
and refurbished computers at the CRs originating from overseas (both requiring maintenance) result
in higher overall cost.
This is also the case for refurbished computers at the CRs donated within Colombia. High
maintenance requirements and, in this case high costs for promotion directed to donators (US $46
per computer) result in approximately 75% higher overall costs than the ‘XO laptop’.
New computers (assembled at the CIEN or purchased) are due to high production costs no
improvement of the present situation.
CPE calculates in its budget the production costs for a refurbished computer to be US $164 while
this study estimates costs to be US $199. The discrepancy arises from the ‘direct material’ as well as
the ‘indirect costs of fabrication’. The calculations of the ‘direct material’ costs within this study did
not include stocks from the previous year. For the ‘indirect costs of fabrication’, rentals and public
services of the CRC, CRM, CRBQ and the CRCU which are, at present partly paid by the
government, were included.
For a computer provided by a refurbishing program from abroad CPE calculated a price of US $221,
the present study of US $145. The discrepancy arises from different assumptions regarding the
‘direct material’ costs. The present study calculated ‘direct material’ costs according to declarations
of ‘ComputerAid’27.
For computers assembled at the CIEN CPE budgeted a price of US $390, the present study of US
$402. The discrepancy arises from the different amount of workers effectively required in the
‘operating phase’.
An estimation of the financial value of the ‘Robotic’ parts was not taken into account.
Overall the costs could be estimated satisfyingly. However, they remain subject to fluctuations and
must be assessed continuously.
D What are the critical stages during the life cycle of a refurbished or recycled computer
regarding the environmental impacts?
In order to identify the critical stages during the life cycle of a computer, a Life Cycle Analysis (LCA)
with the software tool ‘Simapro’ was performed. Taken into account were: the production stage, the
use stage (measured by the electricity consumption), the refurbishment, the transport, the
maintenance, the recycling and disposal stage.
27 Listed on www.computeraid.org are: Mid-range P III PCs at £49, high-end P III PCs at £59 and 256Mb RAM P IV PCs at £ 89 (all excl. shipping).
CHRISTIAN MARTHALER APRIL 2008 86
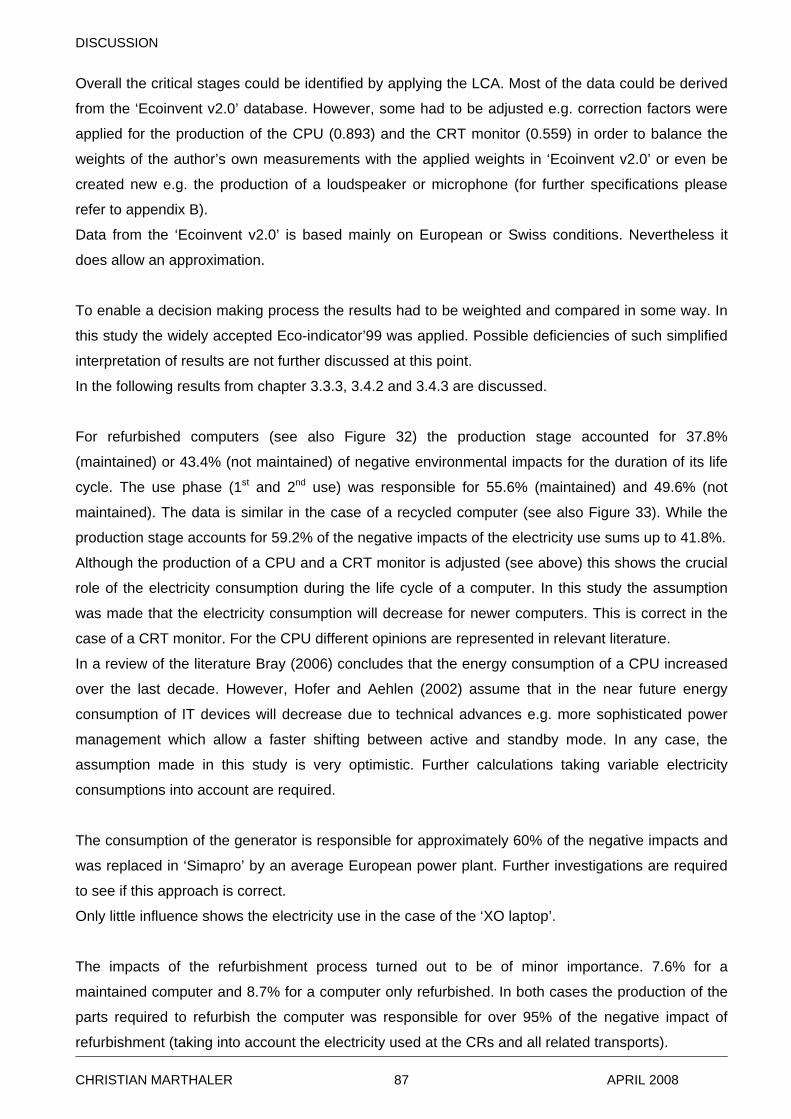
DISCUSSION
Overall the critical stages could be identified by applying the LCA. Most of the data could be derived
from the ‘Ecoinvent v2.0’ database. However, some had to be adjusted e.g. correction factors were
applied for the production of the CPU (0.893) and the CRT monitor (0.559) in order to balance the
weights of the author’s own measurements with the applied weights in ‘Ecoinvent v2.0’ or even be
created new e.g. the production of a loudspeaker or microphone (for further specifications please
refer to appendix B).
Data from the ‘Ecoinvent v2.0’ is based mainly on European or Swiss conditions. Nevertheless it
does allow an approximation.
To enable a decision making process the results had to be weighted and compared in some way. In
this study the widely accepted Eco-indicator’99 was applied. Possible deficiencies of such simplified
interpretation of results are not further discussed at this point.
In the following results from chapter 3.3.3, 3.4.2 and 3.4.3 are discussed.
For refurbished computers (see also Figure 32) the production stage accounted for 37.8%
(maintained) or 43.4% (not maintained) of negative environmental impacts for the duration of its life
cycle. The use phase (1st and 2nd use) was responsible for 55.6% (maintained) and 49.6% (not
maintained). The data is similar in the case of a recycled computer (see also Figure 33). While the
production stage accounts for 59.2% of the negative impacts of the electricity use sums up to 41.8%.
Although the production of a CPU and a CRT monitor is adjusted (see above) this shows the crucial
role of the electricity consumption during the life cycle of a computer. In this study the assumption
was made that the electricity consumption will decrease for newer computers. This is correct in the
case of a CRT monitor. For the CPU different opinions are represented in relevant literature.
In a review of the literature Bray (2006) concludes that the energy consumption of a CPU increased
over the last decade. However, Hofer and Aehlen (2002) assume that in the near future energy
consumption of IT devices will decrease due to technical advances e.g. more sophisticated power
management which allow a faster shifting between active and standby mode. In any case, the
assumption made in this study is very optimistic. Further calculations taking variable electricity
consumptions into account are required.
The consumption of the generator is responsible for approximately 60% of the negative impacts and
was replaced in ‘Simapro’ by an average European power plant. Further investigations are required
to see if this approach is correct.
Only little influence shows the electricity use in the case of the ‘XO laptop’.
The impacts of the refurbishment process turned out to be of minor importance. 7.6% for a
maintained computer and 8.7% for a computer only refurbished. In both cases the production of the
parts required to refurbish the computer was responsible for over 95% of the negative impact of
refurbishment (taking into account the electricity used at the CRs and all related transports).
CHRISTIAN MARTHALER APRIL 2008 87
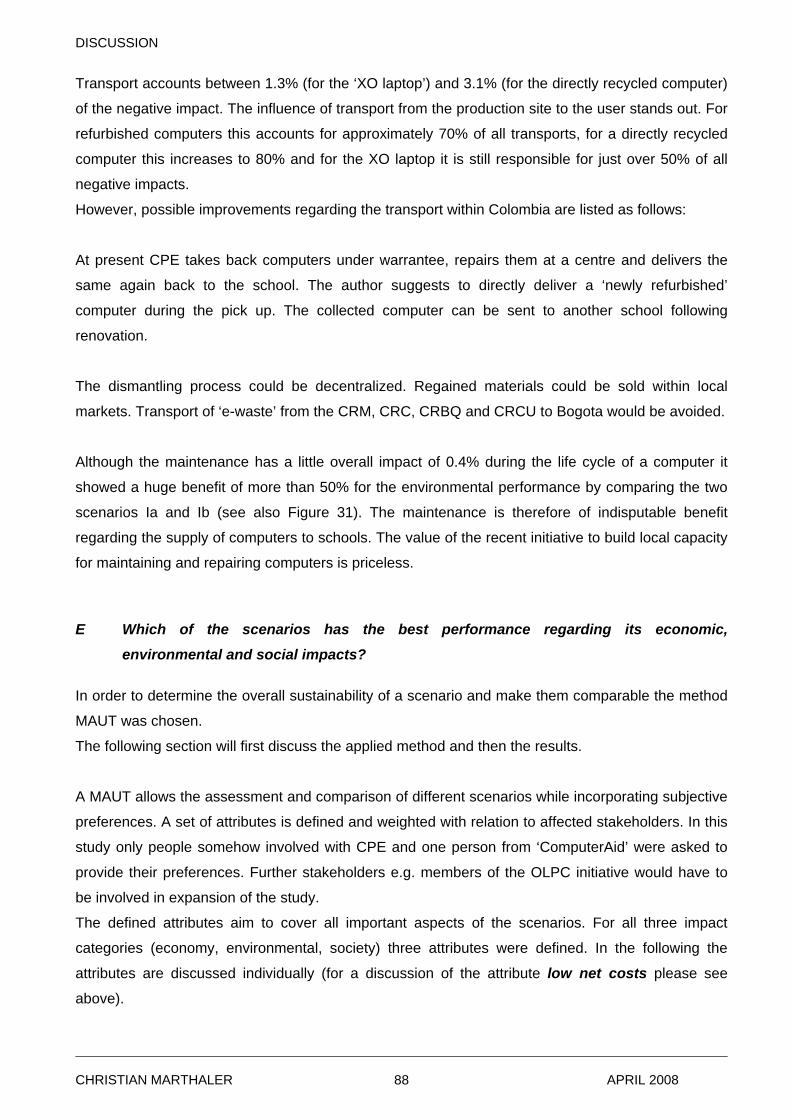
DISCUSSION
Transport accounts between 1.3% (for the ‘XO laptop’) and 3.1% (for the directly recycled computer)
of the negative impact. The influence of transport from the production site to the user stands out. For
refurbished computers this accounts for approximately 70% of all transports, for a directly recycled
computer this increases to 80% and for the XO laptop it is still responsible for just over 50% of all
negative impacts.
However, possible improvements regarding the transport within Colombia are listed as follows:
At present CPE takes back computers under warrantee, repairs them at a centre and delivers the
same again back to the school. The author suggests to directly deliver a ‘newly refurbished’
computer during the pick up. The collected computer can be sent to another school following
renovation.
The dismantling process could be decentralized. Regained materials could be sold within local
markets. Transport of ‘e-waste’ from the CRM, CRC, CRBQ and CRCU to Bogota would be avoided.
Although the maintenance has a little overall impact of 0.4% during the life cycle of a computer it
showed a huge benefit of more than 50% for the environmental performance by comparing the two
scenarios Ia and Ib (see also Figure 31). The maintenance is therefore of indisputable benefit
regarding the supply of computers to schools. The value of the recent initiative to build local capacity
for maintaining and repairing computers is priceless.
E Which of the scenarios has the best performance regarding its economic,
environmental and social impacts?
In order to determine the overall sustainability of a scenario and make them comparable the method
MAUT was chosen.
The following section will first discuss the applied method and then the results.
A MAUT allows the assessment and comparison of different scenarios while incorporating subjective
preferences. A set of attributes is defined and weighted with relation to affected stakeholders. In this
study only people somehow involved with CPE and one person from ‘ComputerAid’ were asked to
provide their preferences. Further stakeholders e.g. members of the OLPC initiative would have to
be involved in expansion of the study.
The defined attributes aim to cover all important aspects of the scenarios. For all three impact
categories (economy, environmental, society) three attributes were defined. In the following the
attributes are discussed individually (for a discussion of the attribute low net costs please see
above).
CHRISTIAN MARTHALER APRIL 2008 88
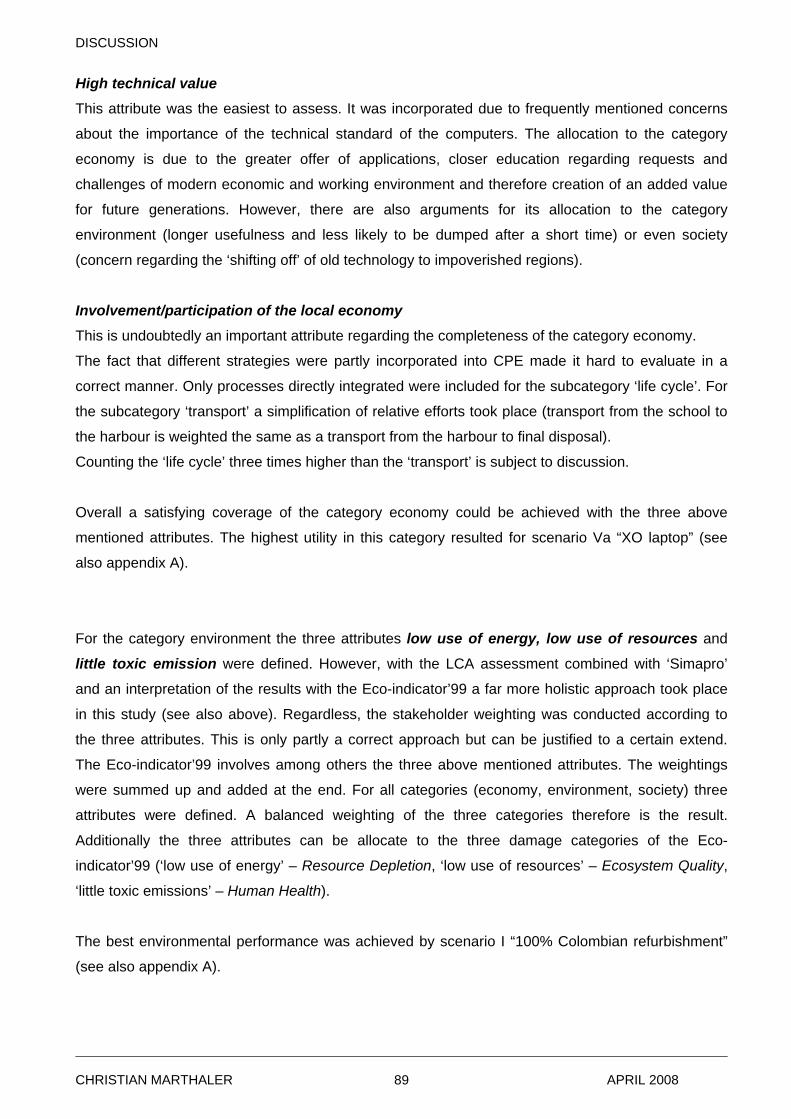
DISCUSSION
High technical value
This attribute was the easiest to assess. It was incorporated due to frequently mentioned concerns
about the importance of the technical standard of the computers. The allocation to the category
economy is due to the greater offer of applications, closer education regarding requests and
challenges of modern economic and working environment and therefore creation of an added value
for future generations. However, there are also arguments for its allocation to the category
environment (longer usefulness and less likely to be dumped after a short time) or even society
(concern regarding the ‘shifting off’ of old technology to impoverished regions).
Involvement/participation of the local economy
This is undoubtedly an important attribute regarding the completeness of the category economy.
The fact that different strategies were partly incorporated into CPE made it hard to evaluate in a
correct manner. Only processes directly integrated were included for the subcategory ‘life cycle’. For
the subcategory ‘transport’ a simplification of relative efforts took place (transport from the school to
the harbour is weighted the same as a transport from the harbour to final disposal).
Counting the ‘life cycle’ three times higher than the ‘transport’ is subject to discussion.
Overall a satisfying coverage of the category economy could be achieved with the three above
mentioned attributes. The highest utility in this category resulted for scenario Va “XO laptop” (see
also appendix A).
For the category environment the three attributes low use of energy, low use of resources and
little toxic emission were defined. However, with the LCA assessment combined with ‘Simapro’
and an interpretation of the results with the Eco-indicator’99 a far more holistic approach took place
in this study (see also above). Regardless, the stakeholder weighting was conducted according to
the three attributes. This is only partly a correct approach but can be justified to a certain extend.
The Eco-indicator’99 involves among others the three above mentioned attributes. The weightings
were summed up and added at the end. For all categories (economy, environment, society) three
attributes were defined. A balanced weighting of the three categories therefore is the result.
Additionally the three attributes can be allocate to the three damage categories of the Eco-
indicator’99 (‘low use of energy’ – Resource Depletion, ‘low use of resources’ – Ecosystem Quality,
‘little toxic emissions’ – Human Health).
The best environmental performance was achieved by scenario I “100% Colombian refurbishment”
(see also appendix A).
CHRISTIAN MARTHALER APRIL 2008 89
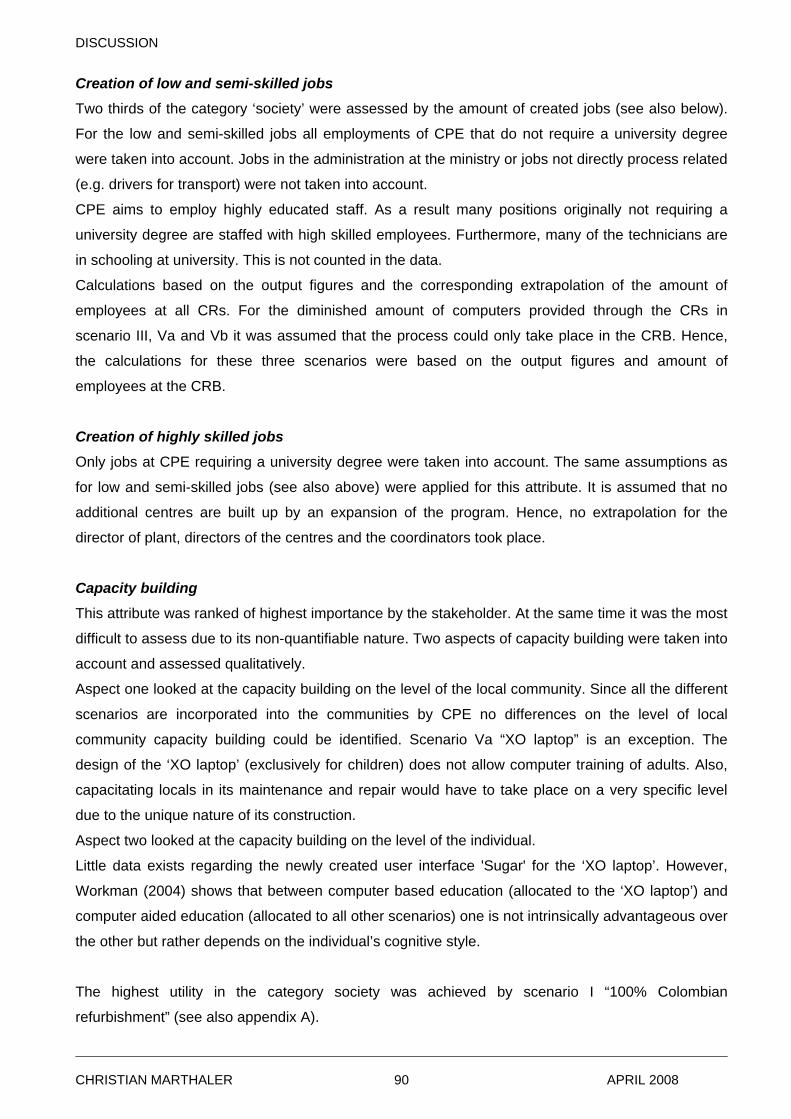
DISCUSSION
Creation of low and semi-skilled jobs
Two thirds of the category ‘society’ were assessed by the amount of created jobs (see also below).
For the low and semi-skilled jobs all employments of CPE that do not require a university degree
were taken into account. Jobs in the administration at the ministry or jobs not directly process related
(e.g. drivers for transport) were not taken into account.
CPE aims to employ highly educated staff. As a result many positions originally not requiring a
university degree are staffed with high skilled employees. Furthermore, many of the technicians are
in schooling at university. This is not counted in the data.
Calculations based on the output figures and the corresponding extrapolation of the amount of
employees at all CRs. For the diminished amount of computers provided through the CRs in
scenario III, Va and Vb it was assumed that the process could only take place in the CRB. Hence,
the calculations for these three scenarios were based on the output figures and amount of
employees at the CRB.
Creation of highly skilled jobs
Only jobs at CPE requiring a university degree were taken into account. The same assumptions as
for low and semi-skilled jobs (see also above) were applied for this attribute. It is assumed that no
additional centres are built up by an expansion of the program. Hence, no extrapolation for the
director of plant, directors of the centres and the coordinators took place.
Capacity building
This attribute was ranked of highest importance by the stakeholder. At the same time it was the most
difficult to assess due to its non-quantifiable nature. Two aspects of capacity building were taken into
account and assessed qualitatively.
Aspect one looked at the capacity building on the level of the local community. Since all the different
scenarios are incorporated into the communities by CPE no differences on the level of local
community capacity building could be identified. Scenario Va “XO laptop” is an exception. The
design of the ‘XO laptop’ (exclusively for children) does not allow computer training of adults. Also,
capacitating locals in its maintenance and repair would have to take place on a very specific level
due to the unique nature of its construction.
Aspect two looked at the capacity building on the level of the individual.
Little data exists regarding the newly created user interface 'Sugar' for the ‘XO laptop’. However,
Workman (2004) shows that between computer based education (allocated to the ‘XO laptop’) and
computer aided education (allocated to all other scenarios) one is not intrinsically advantageous over
the other but rather depends on the individual’s cognitive style.
The highest utility in the category society was achieved by scenario I “100% Colombian
refurbishment” (see also appendix A).
CHRISTIAN MARTHALER APRIL 2008 90
DISCUSSION
Eventually a statement regarding the economic, environmental and social impacts of each scenario
can be made. The discussion relates heavily to figure 27, 28 and appendix A:
Scenario I: “100% Colombian refrubsihment”
Scenario “100% Colombian refurbishment” is the most sustainable strategy within the defined
system boarder and given circumstances. The use of the existing infrastructure and resources of
Colombia leads to the best environmental performance and the most positive social impacts.
Economically it is the second most costly scenario, though expenses stay exclusively within the
borders of Colombia.
The scenario is built upon a hypothetical amount of donations. It has yet to be proven possible to
acquire this amount of computers.
Scenario II: “Colombian/overseas refurbishment and local assembling”
This scenario reflects the current situation and turned out to be the second most sustainable overall
(together with scenario III and IV). It is relatively costly but compensates with a high involvement in
the local economy. As with scenario I it uses the infrastructure and resources of Colombia and has
high positive social impacts. However, the production of new computers at the CIEN leads to a
relatively low environmental performance.
It is the only scenario, next to Va and Vb, that has been proven able to achieve a sufficient supply of
computers. Nevertheless, investigations of a combination of “CRs and CEEX” rather than “CIEN and
CEEX” should be conducted in order to improve the environmental performance.
Scenario III: “Overseas refurbishment”
The scenario “Overseas refurbishment” is ranked second for overall sustainability (together with
scenario II and IV). Although resulting in relatively high positive economic and environmental
performance, the strategy to refurbish computers abroad before shipping them to a developing
nation does not utilize local human resources. The positive social impacts of this strategy are
relatively low.
At present no refurbishing program exists that would have the capacity to deliver the required
amount by Colombia. As mentioned above, this strategy might be an option in combination with
scenario I.
Scenario IV: “Overseas donations for Colombian refurbishment”
Scenario “Overseas donations for Colombian refurbishment” was ranked second for overall
sustainability (together with scenario II and IV), due to the use of the existing infrastructure and
human resources of Colombia similar to scenario I.
Due to the low negative environmental impact of intercontinental transport, one could conclude that
the origin of a computer is of no relevance. However, situations where developing countries serve as
CHRISTIAN MARTHALER APRIL 2008 91
DISCUSSION
a dumping ground for ‘e-waste’ have to be avoided (Puckett et al., 2005). It is therefore essential that
donations sent directly by the user pass through established systems like CPE, which can take care
of the computers in an appropriate way. Well functioning recycling systems have to be in place. In
Colombia the CENARE is still in development. Therefore, at present, “Overseas donations for
Colombian refurbishment” is not a strategy that should be considered. Furthermore, the scenario has
still to prove itself able to supply a sufficient amount of computers.
Scenario Va: “XO laptop”
This scenario represents one of the recent developments regarding strategies to supply schools with
computers.
Although having by far the lowest overall costs (by more than US $110) than all other scenarios and
resulting in the highest positive economic impacts, the overall sustainability of the scenario “XO
laptop” is relatively low. It is ranked fifth for overall sustainability. The scenario does not use local
human resources but rather implements a solution from outside. This results in a low social
performance. However, OLPC envisages outsourcing the assembling process to the corresponding
countries of destination. This would significantly improve the social performance and make the ‘XO
laptop’ a viable solution.
Next to scenario II it is the only strategy that guarantees a sufficient supply of computers.
Scenario Vb: “PC (new)”
This scenario was investigated in order to have a comparison of computers being recycled directly
and computers being refurbished first. The results are presented and discussed in chapter 3.4.3.
However, the overall sustainability of this scenario is assessed to be the lowest. The scenario “PC
(new)” gets the lowest utilities for the categories economy and environment. Regarding the positive
social impacts it does score better than the ‘XO laptop’ due to a slightly higher use of existing human
resources.
Although offering the possibility of a sufficient supply of computers, this strategy is not an appropriate
alternative to the above described scenarios.
4.2 Limitations of the study
As is with any study the modelling of the reality is only possible to certain extent. In this study three
main aspects were identified as having limited the certitude of the results.
The first aspect is the required extrapolations or adjustments in some of the scenarios. The costs
and environmental impacts were calculated per computer and extrapolated based on the existing
infrastructure and regarding to the output figures. The expansion in reality of the program CPE e.g.
in scenario I to a total production of 46’000 computers might have some benefiting/unfavourable
economic or environmental impacts that were not considered in the scope of this study. Also,
scenario III, Va and Vb do involve a partial supply from the CRs that equals only 22% of the actual
CHRISTIAN MARTHALER APRIL 2008 92
DISCUSSION
production. For the case of the attributes ‘creation of low and semi-skilled jobs’ as well as ‘creation of
high skilled jobs’, the calculations are based upon the assumption that the total production could be
achieved solely in Bogota. However, for all attributes especially in regard to costs and environmental
performance this could not be assumed.
The second aspect of limitation is the fact that some processes of CPE which are of essential nature
to this study were still in development. This concerns the CIEN, the CEEX and the CENARE.
Regarding the CIEN two months of ‘operating phase’ could be evaluated. This allowed an
appropriate approximation. For the CEEX the estimations base exclusively on future plans and
expert interviews. In regard to the CENARE the dismantling of CRT monitors could be observed at
first hand. For dismantling the CPU data evaluated under similar conditions was obtained from
Gmünder (2007). Other processes e.g. the detaching of parts of the PWBs data was based on
expert estimations and would have to be further investigated once the process is established.
Continuous evaluation of the actual situation is therefore a crucial.
The third aspect of limitation concerns the used ‘Ecoinvent v2.0’ data. The reflection of specific
processes in the ‘Ecoinvent v2.0’ allows only an approximation if applied under different
circumstances.
CHRISTIAN MARTHALER APRIL 2008 93
CONCLUSION AND OUTLOOK
5 Conclusion and Outlook
This study investigated a previously unexplored field that is of great importance to the decision-
making process regarding the relative viability of strategies for supplying schools in developing
countries with computers. It proves that, in the case of Colombia, use of the existing infrastructure
and resources is integral to the success and sustainability of a scenario.
For Colombia, with its well established program CPE, the refurbishment of computers proved to be
the most sustainable solution. However the supply is inadequate and further investigation, regarding
the best methods to procure larger quantities of donations would have to be carried out.
A solution that guarantees a sufficient supply is the combination of the existing refurbishment
centres, the acquiring of computers from refurbishers abroad and the assembling of new computers.
However, the inclusion of the production of new computers within a scenario has a negative impact
on its overall sustainability. Analyzing the refurbishment process at CPE this study concludes that an
extension of a computer’s lifespan is desirable in any case. The critical stages were identified as the
production for a recycled computer and the ‘XO laptop’; and as the use phase for a refurbished
computer.
The relative unimportance of transport regarding the environmental impacts during the life cycle of a
computer revealed that there is little discrepancy, on the level of sustainability, between obtaining
computers domestically or from abroad.
The success of establishing a direct import channel of used computers from overseas might be
possible in the case of Colombia. With the further development of the CENARE and the existing
infrastructure CPE could soon be able to take care of computers from abroad in an appropriate way.
In other countries where the standard of a CENARE has not yet been reached the risk exists that
such a strategy could turn into the dumping of ‘e-waste’. For these nations it is still assumed that a
pre processing through ‘ComputerAid’ offers a valuable solution. Further research would have to be
conducted to investigate the best synergy between obtaining computers domestically and acquisition
from abroad.
At present an established refurbishment program of the magnitude of CPE is not matched by the
potential of the ‘XO laptop’, the latest developments on the supply market. The ‘XO laptop’ does not
use the existing infrastructure or resources but rather implements a solution from outside. In the
case of Colombia this study concludes that the ‘XO laptop’ shows shortcomings in the social
performance. However, within the scope of this study it was not investigated in relation to a
refurbishment program run on a smaller scale or the total inexistence of it. In Latin America several
programs exist (e.g. TodoChilenter in Chile) that refurbish computers on a smaller scale.
Investigations would have to be made into whether a small scale refurbishment program combined
CHRISTIAN MARTHALER APRIL 2008 94
CONCLUSION AND OUTLOOK
with recent developments, like the ‘XO laptop’, offer a sustainable way to supply schools with
computers. Furthermore the consequences of outsourcing the assembling process should be
investigated regarding the improvement of the social performance.
CHRISTIAN MARTHALER APRIL 2008 95
LITERATURE
6 Literature
Angeli, C. (2005). "Transforming a teacher education method course through technology: effects on preservice teacher's technology competency." Computers & Education 45: 383-398. Baccini, P. and H.-P. Bader (1996). Regionaler Stoffhaushalt: Erfassung, Bewertung und Steuerung. Heidelberg Berlin Oxford, Spektrum Akademischer Verlag. Binder, C. R. (1999). The early recognition of environmental impacts of human activities in developing countries, Dissertation. Zürich, Eidgenössische Technische Hochschule ETH Bray, M. (2006). Review of Computer Energy Consumption and Potential Savings. D. S. S. L. (DssW). Brooks, S., P. Donovan, et al. (2005). "Developing Nations, the Digital Divide and Research Databases." Serials Review 31: 270-278. Brunner, P. H. and H. Rechberger (2004). Practical handbook of material flow analysis. Boca Raton, FL, Lewis Publishers. Chinn, M. D. and R. W. Fairlie (2006). "The determinants of the global digital divide: a cross-country analysis of computer and internet penetration." Oxford Economic Papers 59: 16-44. Clark, R. E. (1985). "Cofounding in educational computign research." Journal of Educational Computing Research 1: 137-147. Commerce, U. D. o. (2002). A Nation online: How Americans are expanding their use of the internet Washington DC, US Government Printing office. Dasgupta, S., S. Lall, et al. (2001). Policy reform, economic growth and the digital divide: an econometric analysis. Working Paper No. 2567. Washington DC, World Bank. ecoinvent Centre (2007) ecoinvent data v2.0. Swiss Centre for Life Cycle Inventories, Dübendorf, CH, Online-Version under: www.ecoinvent.ch. Economist, T. (2005). The Economist, 29.01.05: p. 56. EMPA. (2007). "e-waste guide." from www.ewaste.ch. EMPA and Survey (2004). Draft Final Report 2004 on the Assessment Phase (Phase1)of the Empa/seco Programme in "Knowledge Partnerships with Developing and Transition Countries in e-Waste Recycling" (unpublished report), EMPA, Federal Institute of Material Testing and Research. Fuchs, C. and E. Horak (2006). "Africa and the digital divide." Telematics and Informatics. Gmünder, S. (2007). Recycling - From Waste to Resource. Departement of Environmental Science. Zürich, ETH. Master: 114. Goedkoop, M. and R. Spriensma (2001). The Eco-indicator 99. A damage orientated method for life cycle impact assessment. Methodology Report. Amersfoort. Hayes, J. and C. W. Allison (1998). "Cognitive style and the theory and prctice of individual and collective learning organizations." Human Relations 51: 847-871. Hilty, L., S. Behrendt, et al. (2003). The Precautionary Principle in the Information Society – Impacts of Pervasive Computing on Health and the Environment. Bern, , TA-Swiss.
CHRISTIAN MARTHALER APRIL 2008 96
LITERATURE
Hilty, L. M. (2005). "Electronic waste-an emerging risk?" Environmental Impact Assessment Review 25: 431-435. Hischier, R., P. Wäger, et al. (2005). "Does WEEE recycling make sense from an environmental perspective? The environmental impacts of the Swiss take-back and recycling systems for waste electrical and electronic equipment (WEEE)." Environmental Impact Assessment Review 25: 525-539. Hofer, P. and R. Aehlen (2002). Die Entwicklung des Elektrizitätsverbrauchs. P. AG. Basel, Bundesamt für Energie BFE. Hofstetter (1998). Perspectives in Life Cycle Impact Assessment; A Strucutured Approach to Combine Models of the Technosphere, Ecosphere and Valuesphere. The Netherlands, Kluwer Academic Publisher. IDC. (2007). "IDC Market Intelligence." from www.idc.com. James, J. (2002). "Low-cost information technology in developing countries: current opportunities and emerging possibilities." Habitat International 26: 21-31. Kozma, R. B. (1991). "Learning with media." Review of Educational Research 61: 179-211. Mariscal, J. (2005). "Digital divide in a developing country." Telecommunications Policy 29: 409-428. OECD (2001). Extended Producer Responsibility: a guidance manual for governments. Paris Organisation for Economic Co-operation and Development. OECD (2001). Understanding the Digital Divide. Paris, Organization for Economic Cooperation and Development. OLPC. (2006). "One Laptop per Child OLPC." http://laptop.org/. Ott, D. (2008). Diagnóstico de la Gestión de los Residuos Electrónicos en Colombia. Medellín, EMPA. Pinkett, R. D. (2003). "The Digital Divide." Encyclopedia of Information Systems 1: 615-633. Powell, A. H. (2007). "Access(ing), habits, attitudes, and engagements: Re-thinking access as practice." Computers and Composition 24: 16-35. Puckett, J., L. Byster, et al. (2002). Exporting harm, the high-tech trashing of Asia. Seattle, WA., USA, The Basel Action Network (BAN) Silicon Valley Toxics Coalition (SVTC). Puckett, J., S. Westervelt, et al. (2005). The digital dump, exporting re-use and abuse to Africa. Seattle, WA., USA, The Basel Action Network (BAN). Rao, S. S. (2005). "Bridging digital divide: Efforts in India." Telematics and Informatics 22: 361-375. Rees, W. (1992). "Ecological footprints and appropriated carrying capacity: what urban economics leaves out " Environment and Urbanisation 4. Renshaw, C. E. and H. A. Taylor (2000). "The educational e�ectiveness of computer-based instruction." Computers & Geosciences 26: 677-682. Richards, S., P. Barker, et al. (1997). "Knowledge Sharing Through Electronic Course Delivery." Innovations in Education and Teaching International 34(1): 3-10.
CHRISTIAN MARTHALER APRIL 2008 97
LITERATURE
Rink, J. (2007). Kinderleicht lernen für alle. Magazin für Computer Technik. 7: 139-145. Scholz, R. W. and O. Tietje (2002). Embedded Case Study Methods: Integrating Quantitative and Qualitative Knowledge. California USA, Sage Publications, Inc. Smith, G. R. (2004). "How green is technology? The paradox of online sustainable education." International Journal of Sustainable Development World Ecology 11: 262-270. Sutter C. 2003, Sustainability Assessment of Energy related Projects under the Clean Development Mechanism of the Kyoto Protocol Dissertation submitted to the Swiss Federal Institute of Technology Zurich, Switzerland Sternberg, R. J. (1997). Thinking styles. NY, Cambridge University Press. Streicher-Porte, M., R. Widmer, et al. (2005). "Key drivers of the e-waste recycling system: Assessing and modelling e-waste processing in the informal sector in Delhi." Environmental Impact Assessment Review 25(5): 472-491. SWICO (2006). Batch examination, unpublished work, Swiss Association for Information, Communication and Organisational Technology. UN (1989). Basel Convention on the Control of Transboundary Movements of Hazardous Wastes and their Disposal. Secretariat of the Basel Convention, United Nations Environment Program. van Dijek, J. (2006). "Digital divide research, achievements and shortcomings." Poetics 34(4-5): 221-235. Widmer, R., H. Oswald-Krapf, et al. (2005). "Global perspectives on e-waste." Environmental Impact Assessment Review 25(5): 436. Workman, M. (2004). "Performance and perceived effectiveness in computer-based and computer-aided education: do cognitive styles make a difference?" Computers in Human Behaviour 20: 517-534. World Bank (2006). World development indicators database, World Bank, https://publications.worldbank.org/subscriptions/WDI/SMresult.asp, accessed on the 11.07.2006. Zumbühl, D. (2005). Mass Flow Assessment (MFA) and Assessment of recycling strategies for cathode ray tubes (CRTs) for the Cape Metropolitan Area (CMA), South Africa. Departement of Environmental Science. Zürich, ETH. Master: 122.
CHRISTIAN MARTHALER APRIL 2008 98
LITERATURE
CHRISTIAN MARTHALER APRIL 2008 99
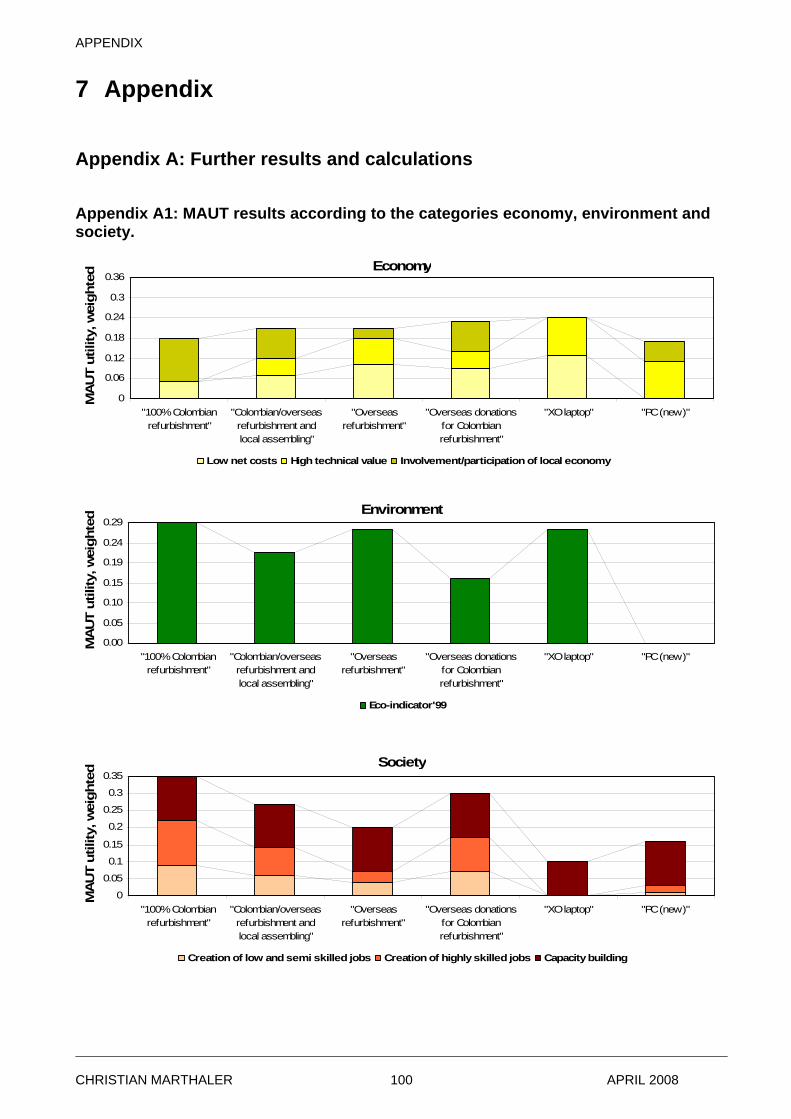
APPENDIX
7 Appendix
Appendix A: Further results and calculations
Appendix A1: MAUT results according to the categories economy, environment and society.
Economy
0
0.06
0.12
0.18
0.24
0.3
0.36
"100% Colombianrefurbishment"
"Colombian/overseasrefurbishment andlocal assembling"
"Overseasrefurbishment"
"Overseas donationsfor Colombianrefurbishment"
"XO laptop" "PC (new)"
MA
UT
utili
ty, w
eigh
ted
Low net costs High technical value Involvement/participation of local economy
Environment
0.00
0.05
0.10
0.15
0.19
0.24
0.29
"100% Colombianrefurbishment"
"Colombian/overseasrefurbishment andlocal assembling"
"Overseasrefurbishment"
"Overseas donationsfor Colombianrefurbishment"
"XO laptop" "PC (new)"
MA
UT
utili
ty, w
eigh
ted
Eco-indicator'99
Society
0
0.05
0.1
0.15
0.2
0.25
0.3
0.35
"100% Colombianrefurbishment"
"Colombian/overseasrefurbishment andlocal assembling"
"Overseasrefurbishment"
"Overseas donationsfor Colombianrefurbishment"
"XO laptop" "PC (new)"
MA
UT
utili
ty, w
eigh
ted
Creation of low and semi skilled jobs Creation of highly skilled jobs Capacity building
CHRISTIAN MARTHALER APRIL 2008 100
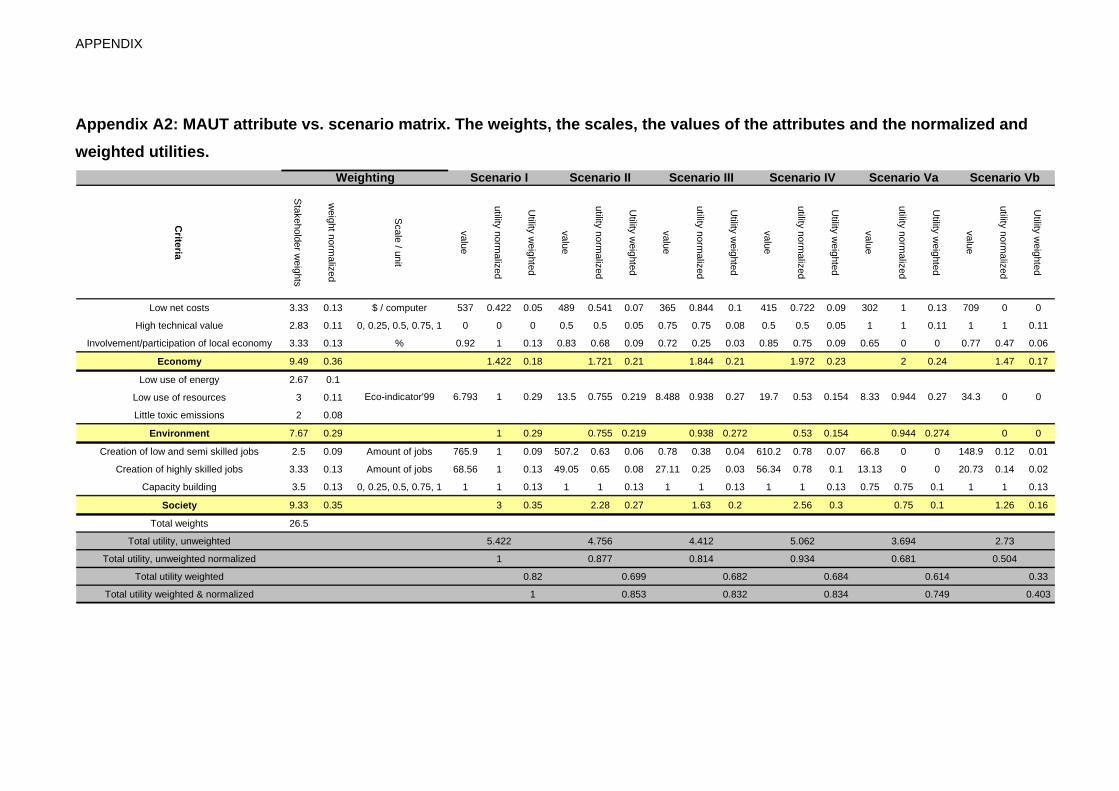
APPENDIX
Appendix A2: MAUT attribute vs. scenario matrix. The weights, the scales, the values of the attributes and the normalized and weighted utilities.
Criteria
Stakeholder w
eights
weight norm
alized
Scale / unit
value
utility normalized
Utility w
eighted
value
utility normalized
Utility w
eighted
value
utility normalized
Utility w
eighted
value
utility normalized
Utility w
eighted
value
utility normalized
Utility w
eighted
value
utility normalized
Utility w
eighted
Low net costs 3.33 0.13 $ / computer 537 0.422 0.05 489 0.541 0.07 365 0.844 0.1 415 0.722 0.09 302 1 0.13 709 0 0
High technical value 2.83 0.11 0, 0.25, 0.5, 0.75, 1 0 0 0 0.5 0.5 0.05 0.75 0.75 0.08 0.5 0.5 0.05 1 1 0.11 1 1 0.11
Involvement/participation of local economy 3.33 0.13 % 0.92 1 0.13 0.83 0.68 0.09 0.72 0.25 0.03 0.85 0.75 0.09 0.65 0 0 0.77 0.47 0.06
Economy 9.49 0.36 1.422 0.18 1.721 0.21 1.844 0.21 1.972 0.23 2 0.24 1.47 0.17
Low use of energy 2.67 0.1
Low use of resources 3 0.11
Little toxic emissions 2 0.08
Environment 7.67 0.29 1 0.29 0.755 0.219 0.938 0.272 0.53 0.154 0.944 0.274 0 0
Creation of low and semi skilled jobs 2.5 0.09 Amount of jobs 765.9 1 0.09 507.2 0.63 0.06 0.78 0.38 0.04 610.2 0.78 0.07 66.8 0 0 148.9 0.12 0.01
Creation of highly skilled jobs 3.33 0.13 Amount of jobs 68.56 1 0.13 49.05 0.65 0.08 27.11 0.25 0.03 56.34 0.78 0.1 13.13 0 0 20.73 0.14 0.02
Capacity building 3.5 0.13 0, 0.25, 0.5, 0.75, 1 1 1 0.13 1 1 0.13 1 1 0.13 1 1 0.13 0.75 0.75 0.1 1 1 0.13
Society 9.33 0.35 3 0.35 2.28 0.27 1.63 0.2 2.56 0.3 0.75 0.1 1.26 0.16
Total weights 26.5
Total utility, unweighted 5.422 4.756 4.412 5.062 3.694 2.73
Total utility, unweighted normalized 1 0.877 0.814 0.934 0.681 0.504
Total utility weighted 0.82 0.699 0.682 0.684 0.614 0.33
Total utility weighted & normalized 1 0.853 0.832 0.834 0.749 0.403
0.27 34.3 0 00.53 0.154 8.33 0.9448.488 0.938 0.27 19.7
Scenario IV Scenario Va Scenario Vb
Eco-indicator'99 6.793 1 0.29 13.5 0.755 0.219
Scenario I Scenario II Scenario IIIWeighting
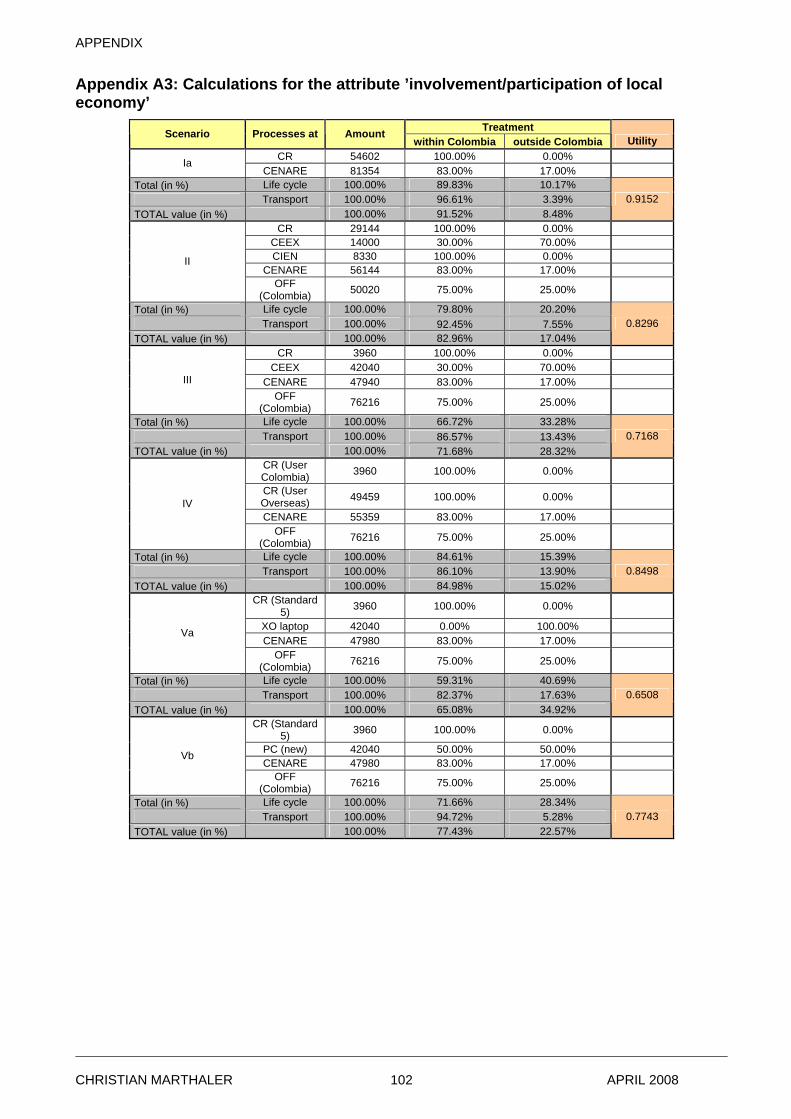
APPENDIX
Appendix A3: Calculations for the attribute ’involvement/participation of local economy’ Treatment Processes at Amount
within Colombia outside Colombia Utility Scenario
CR 54602 100.00% 0.00% Ia CENARE 81354 83.00% 17.00%
Total (in %) Life cycle 100.00% 89.83% 10.17% Transport 100.00% 96.61% 3.39% TOTAL value (in %) 100.00% 91.52% 8.48%
0.9152
CR 29144 100.00% 0.00% CEEX 14000 30.00% 70.00% CIEN 8330 100.00% 0.00%
CENARE 56144 83.00% 17.00% II
OFF (Colombia) 50020 75.00% 25.00%
Total (in %) Life cycle 100.00% 79.80% 20.20% Transport 100.00% 92.45% 7.55% TOTAL value (in %) 100.00% 82.96% 17.04%
0.8296
CR 3960 100.00% 0.00% CEEX 42040 30.00% 70.00%
CENARE 47940 83.00% 17.00% III OFF
(Colombia) 76216 75.00% 25.00% Total (in %) Life cycle 100.00% 66.72% 33.28% Transport 100.00% 86.57% 13.43% TOTAL value (in %) 100.00% 71.68% 28.32%
0.7168
CR (User Colombia) 3960 100.00% 0.00% CR (User Overseas) 49459 100.00% 0.00% CENARE 55359 83.00% 17.00%
IV
OFF (Colombia) 76216 75.00% 25.00%
Total (in %) Life cycle 100.00% 84.61% 15.39% Transport 100.00% 86.10% 13.90% TOTAL value (in %) 100.00% 84.98% 15.02%
0.8498
CR (Standard 5) 3960 100.00% 0.00%
XO laptop 42040 0.00% 100.00% CENARE 47980 83.00% 17.00%
Va
OFF (Colombia) 76216 75.00% 25.00%
Total (in %) Life cycle 100.00% 59.31% 40.69% Transport 100.00% 82.37% 17.63% TOTAL value (in %) 100.00% 65.08% 34.92%
0.6508
CR (Standard 5) 3960 100.00% 0.00%
PC (new) 42040 50.00% 50.00% CENARE 47980 83.00% 17.00%
Vb
OFF (Colombia) 76216 75.00% 25.00%
Total (in %) Life cycle 100.00% 71.66% 28.34% Transport 100.00% 94.72% 5.28% TOTAL value (in %) 100.00% 77.43% 22.57%
0.7743
CHRISTIAN MARTHALER APRIL 2008 102
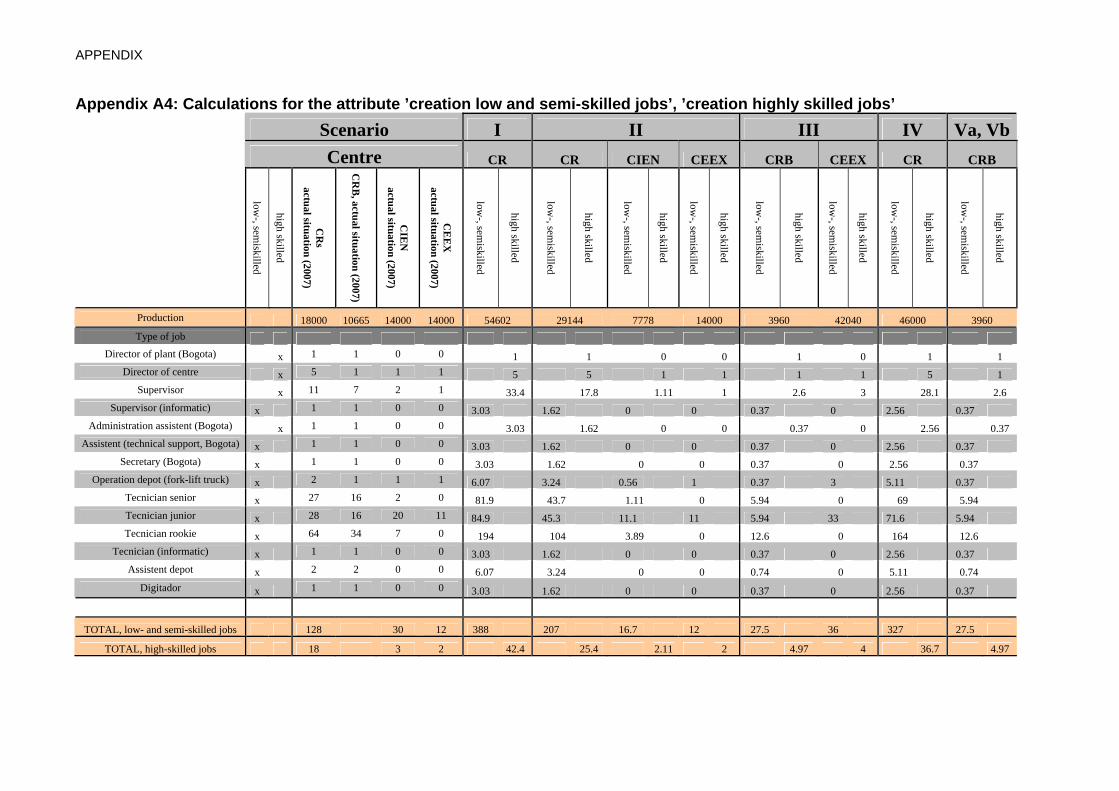
APPENDIX
Appendix A4: Calculations for the attribute ’creation low and semi-skilled jobs’, ’creation highly skilled jobs’ Scenario I II III IV Va, Vb Centre CR CR CIEN CEEX CRB CEEX CR CRB
low-, sem
iskilled
high skilled
CR
s actual situation (2007)
CR
B, actual situation (2007)
CIE
N
actual situation (2007)
CE
EX
actual situation (2007)
low-, sem
iskilled
high skilled
low-, sem
iskilled
high skilled
low-, sem
iskilled
high skilled
low-, sem
iskilled
high skilled
low-, sem
iskilled
high skilled
low-, sem
iskilled
high skilled
low-, sem
iskilled
high skilled
low-, sem
iskilled
high skilled
Production 18000 10665 14000 14000 54602 29144 7778 14000 3960 42040 46000 3960 Type of job
Director of plant (Bogota) x 1 1 0 0 1 1 0 0 1 0 1 1 Director of centre x 5 1 1 1 5 5 1 1 1 1 5 1
Supervisor x 11 7 2 1 33.4 17.8 1.11 1 2.6 3 28.1 2.6 Supervisor (informatic) x 1 1 0 0 3.03 1.62 0 0 0.37 0 2.56 0.37
Administration assistent (Bogota) x 1 1 0 0 3.03 1.62 0 0 0.37 0 2.56 0.37 Assistent (technical support, Bogota) x 1 1 0 0 3.03 1.62 0 0 0.37 0 2.56 0.37
Secretary (Bogota) x 1 1 0 0 3.03 1.62 0 0 0.37 0 2.56 0.37 Operation depot (fork-lift truck) x 2 1 1 1 6.07 3.24 0.56 1 0.37 3 5.11 0.37
Tecnician senior x 27 16 2 0 81.9 43.7 1.11 0 5.94 0 69 5.94 Tecnician junior x 28 16 20 11 84.9 45.3 11.1 11 5.94 33 71.6 5.94 Tecnician rookie x 64 34 7 0 194 104 3.89 0 12.6 0 164 12.6
Tecnician (informatic) x 1 1 0 0 3.03 1.62 0 0 0.37 0 2.56 0.37 Assistent depot x 2 2 0 0 6.07 3.24 0 0 0.74 0 5.11 0.74
Digitador x 1 1 0 0 3.03 1.62 0 0 0.37 0 2.56 0.37
TOTAL, low- and semi-skilled jobs 128 30 12 388 207 16.7 12 27.5 36 327 27.5
TOTAL, high-skilled jobs 18 3 2 42.4 25.4 2.11 2 4.97 4 36.7 4.97
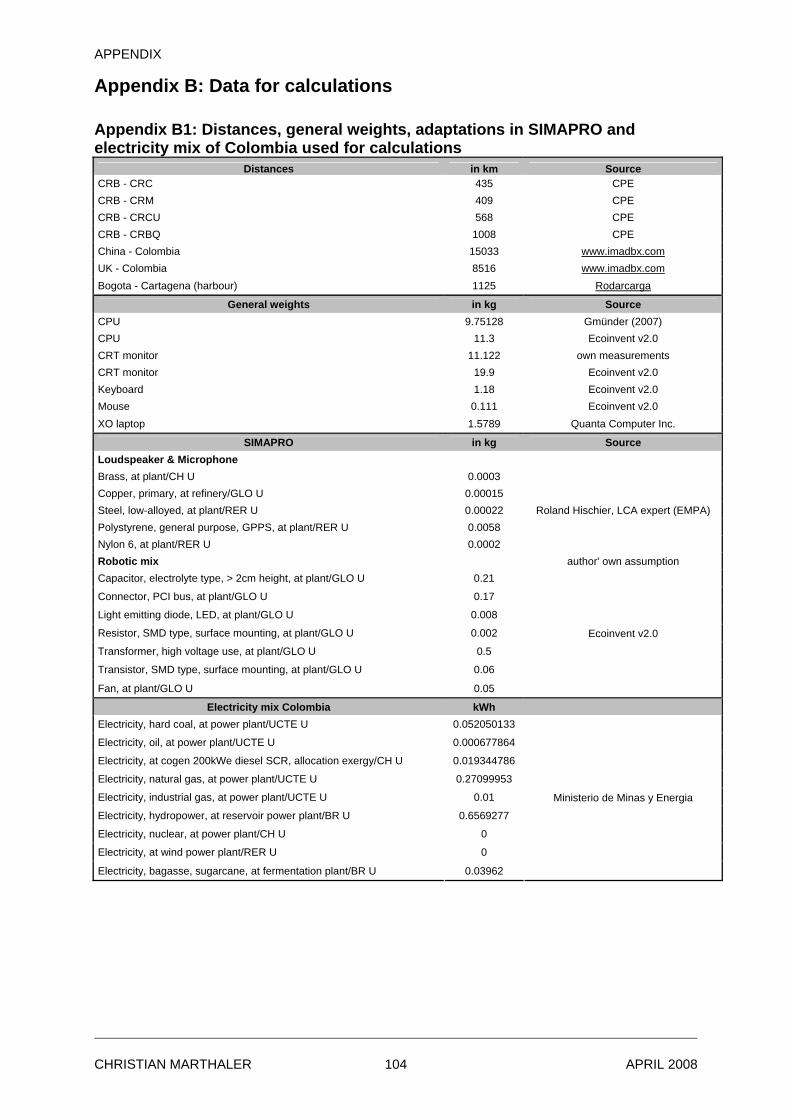
APPENDIX
Appendix B: Data for calculations
Appendix B1: Distances, general weights, adaptations in SIMAPRO and electricity mix of Colombia used for calculations
Distances in km Source CRB - CRC 435 CPE CRB - CRM 409 CPE CRB - CRCU 568 CPE CRB - CRBQ 1008 CPE China - Colombia 15033 www.imadbx.comUK - Colombia 8516 www.imadbx.comBogota - Cartagena (harbour) 1125 Rodarcarga
General weights in kg Source CPU 9.75128 Gmünder (2007) CPU 11.3 Ecoinvent v2.0 CRT monitor 11.122 own measurements CRT monitor 19.9 Ecoinvent v2.0 Keyboard 1.18 Ecoinvent v2.0 Mouse 0.111 Ecoinvent v2.0 XO laptop 1.5789 Quanta Computer Inc.
SIMAPRO in kg Source Loudspeaker & Microphone Brass, at plant/CH U 0.0003 Copper, primary, at refinery/GLO U 0.00015 Steel, low-alloyed, at plant/RER U 0.00022 Polystyrene, general purpose, GPPS, at plant/RER U 0.0058 Nylon 6, at plant/RER U 0.0002
Roland Hischier, LCA expert (EMPA)
Robotic mix author' own assumption Capacitor, electrolyte type, > 2cm height, at plant/GLO U 0.21
Connector, PCI bus, at plant/GLO U 0.17
Light emitting diode, LED, at plant/GLO U 0.008
Resistor, SMD type, surface mounting, at plant/GLO U 0.002
Transformer, high voltage use, at plant/GLO U 0.5
Transistor, SMD type, surface mounting, at plant/GLO U 0.06
Fan, at plant/GLO U 0.05
Ecoinvent v2.0
Electricity mix Colombia kWh Electricity, hard coal, at power plant/UCTE U 0.052050133
Electricity, oil, at power plant/UCTE U 0.000677864
Electricity, at cogen 200kWe diesel SCR, allocation exergy/CH U 0.019344786
Electricity, natural gas, at power plant/UCTE U 0.27099953
Electricity, industrial gas, at power plant/UCTE U 0.01 Ministerio de Minas y Energia
Electricity, hydropower, at reservoir power plant/BR U 0.6569277
Electricity, nuclear, at power plant/CH U 0
Electricity, at wind power plant/RER U 0
Electricity, bagasse, sugarcane, at fermentation plant/BR U 0.03962
CHRISTIAN MARTHALER APRIL 2008 104
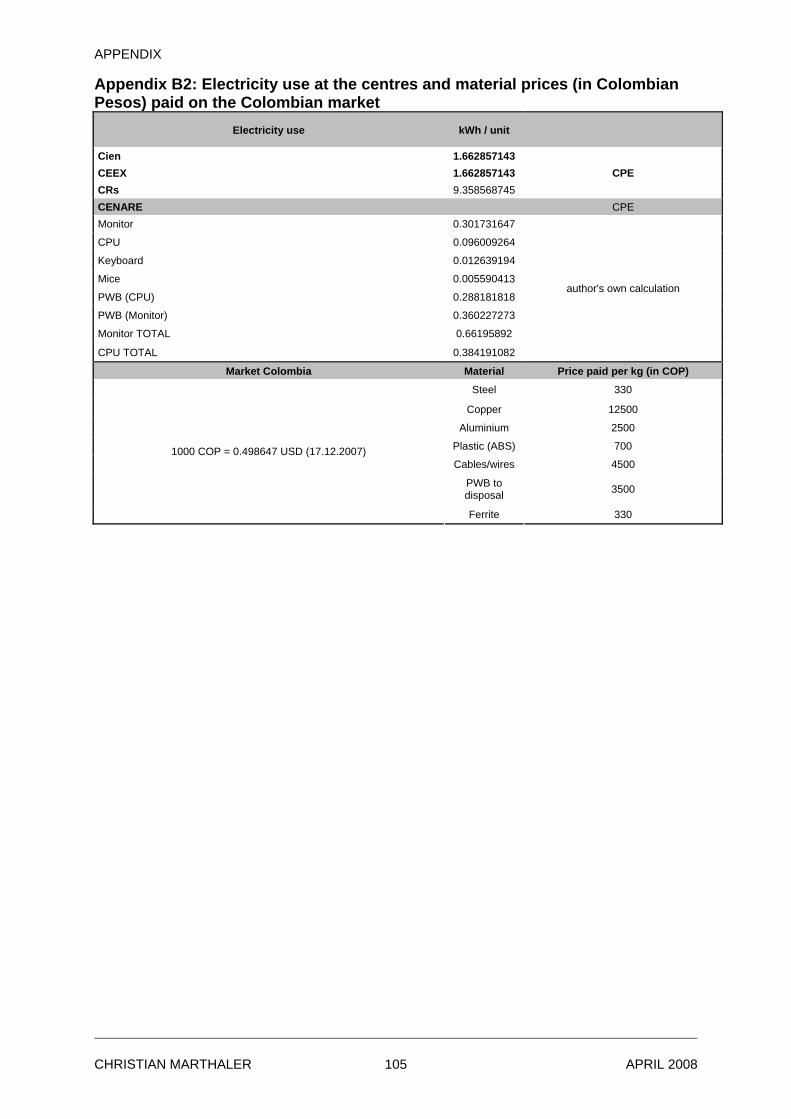
APPENDIX
Appendix B2: Electricity use at the centres and material prices (in Colombian Pesos) paid on the Colombian market
Electricity use kWh / unit
Cien 1.662857143 CEEX 1.662857143 CRs 9.358568745
CPE
CENARE CPE Monitor 0.301731647
CPU 0.096009264
Keyboard 0.012639194
Mice 0.005590413
PWB (CPU) 0.288181818
PWB (Monitor) 0.360227273
Monitor TOTAL 0.66195892
CPU TOTAL 0.384191082
author's own calculation
Market Colombia Material Price paid per kg (in COP)
Steel 330
Copper 12500
Aluminium 2500
Plastic (ABS) 700
Cables/wires 4500 1000 COP = 0.498647 USD (17.12.2007)
PWB to disposal 3500
Ferrite 330
CHRISTIAN MARTHALER APRIL 2008 105
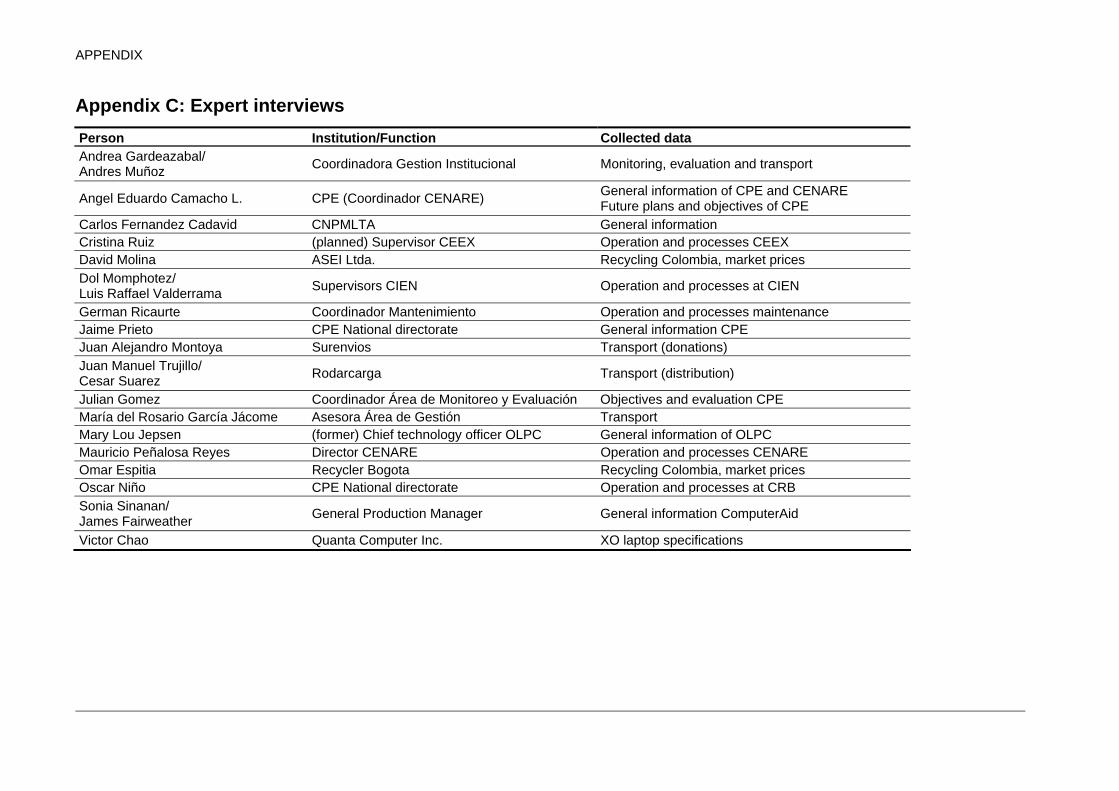
Appendix C: Expert interviews Person Institution/Function Collected data Andrea Gardeazabal/ Andres Muñoz Coordinadora Gestion Institucional Monitoring, evaluation and transport
Angel Eduardo Camacho L. CPE (Coordinador CENARE) General information of CPE and CENARE Future plans and objectives of CPE
Carlos Fernandez Cadavid CNPMLTA General information Cristina Ruiz (planned) Supervisor CEEX Operation and processes CEEX David Molina ASEI Ltda. Recycling Colombia, market prices Dol Momphotez/ Luis Raffael Valderrama Supervisors CIEN Operation and processes at CIEN
German Ricaurte Coordinador Mantenimiento Operation and processes maintenance Jaime Prieto CPE National directorate General information CPE Juan Alejandro Montoya Surenvios Transport (donations) Juan Manuel Trujillo/ Cesar Suarez Rodarcarga Transport (distribution)
Julian Gomez Coordinador Área de Monitoreo y Evaluación Objectives and evaluation CPE María del Rosario García Jácome Asesora Área de Gestión Transport Mary Lou Jepsen (former) Chief technology officer OLPC General information of OLPC Mauricio Peñalosa Reyes Director CENARE Operation and processes CENARE Omar Espitia Recycler Bogota Recycling Colombia, market prices Oscar Niño CPE National directorate Operation and processes at CRB Sonia Sinanan/ James Fairweather General Production Manager General information ComputerAid
Victor Chao Quanta Computer Inc. XO laptop specifications
APPENDIX