Embed Size (px)
Citation preview
NREL is a national laboratory of the U.S. Department of Energy Office of Energy Efficiency & Renewable Energy Operated by the Alliance for Sustainable Energy, LLC
This report is available at no cost from the National Renewable Energy Laboratory (NREL) at www.nrel.gov/publications.
Contract No. DE-AC36-08GO28308
Concentrating Solar Power Gen3 Demonstration Roadmap Mark Mehos, Craig Turchi, Judith Vidal, Michael Wagner, and Zhiwen Ma National Renewable Energy Laboratory Golden, Colorado
Clifford Ho, William Kolb, and Charles Andraka Sandia National Laboratories Albuquerque, New Mexico
Alan Kruizenga Sandia National Laboratories Livermore, California
Technical Report NREL/TP-5500-67464 January 2017
NREL is a national laboratory of the U.S. Department of Energy Office of Energy Efficiency & Renewable Energy Operated by the Alliance for Sustainable Energy, LLC
This report is available at no cost from the National Renewable Energy Laboratory (NREL) at www.nrel.gov/publications.
Contract No. DE-AC36-08GO28308
National Renewable Energy Laboratory 15013 Denver West Parkway Golden, CO 80401 303-275-3000 • www.nrel.gov
Concentrating Solar Power Gen3 Demonstration Roadmap Mark Mehos, Craig Turchi, Judith Vidal, Michael Wagner, and Zhiwen Ma National Renewable Energy Laboratory Golden, Colorado
Clifford Ho, William Kolb, and Charles Andraka Sandia National Laboratories Albuquerque, New Mexico
Alan Kruizenga Sandia National Laboratories Livermore, California
Prepared under Task No. ST6C.0610
Technical Report NREL/TP-5500-67464 January 2017

NOTICE
This report was prepared as an account of work sponsored by an agency of the United States government. Neither the United States government nor any agency thereof, nor any of their employees, makes any warranty, express or implied, or assumes any legal liability or responsibility for the accuracy, completeness, or usefulness of any information, apparatus, product, or process disclosed, or represents that its use would not infringe privately owned rights. Reference herein to any specific commercial product, process, or service by trade name, trademark, manufacturer, or otherwise does not necessarily constitute or imply its endorsement, recommendation, or favoring by the United States government or any agency thereof. The views and opinions of authors expressed herein do not necessarily state or reflect those of the United States government or any agency thereof.
This report is available at no cost from the National Renewable Energy Laboratory (NREL) at www.nrel.gov/publications.
Available electronically at SciTech Connect http:/www.osti.gov/scitech
Available for a processing fee to U.S. Department of Energy and its contractors, in paper, from:
U.S. Department of Energy Office of Scientific and Technical Information P.O. Box 62 Oak Ridge, TN 37831-0062 OSTI http://www.osti.gov Phone: 865.576.8401 Fax: 865.576.5728 Email: [email protected]
Available for sale to the public, in paper, from:
U.S. Department of Commerce National Technical Information Service 5301 Shawnee Road Alexandria, VA 22312 NTIS http://www.ntis.gov Phone: 800.553.6847 or 703.605.6000 Fax: 703.605.6900 Email: [email protected]
Cover Photos: top strip pf photos by Dennis Schroeder: (left to right) NREL 26173, NREL 18302, NREL 19758, NREL 29642, NREL 19795.
Large photo courtesy of SolarReserve
NREL prints on paper that contains recycled content.
iii This report is available at no cost from the National Renewable Energy Laboratory at www.nrel.gov/publications.
Acknowledgments This project was funded by the U.S. Department of Energy Solar Energy Technologies Program. The authors thank the following individuals who provided input to this roadmap. These individuals participated in a DOE-sponsored CSP Gen3 workshop kicking off the roadmap effort as well as follow-on discussions leading to this publication.
The Molten-Salt Technology Pathway working group that met at the workshop included the following: Judith Vidal (NREL), Alan Kruizenga (SNL), Craig Turchi (NREL), Chuck Andraka (SNL), Bill Kolb (SNL), Matthew Walker (SNL), Maxwell Trent (Alstom), Robert Bradshaw (Consultant), Marc Buckler (Flowserve Corporation), Asegun Henry (Georgia Tech), Scott Greenway (Greenway Energy), Daniel Barth (High Temperature System Designs), Justin Raade (Justin Raade Energy Consulting), Brenda Garcia-Diaz (SRNL), Luke Olson (SRNL), Brian Baker (Special Metals Corporation), Peter McIntyre (Texas A&M University), Debjyoti Banerjee (Texas A&M University), Ramana Reddy (University of Alabama), Peiwen (Perry) Li (University of Arizona), and Dominic Gervasio (University of Arizona). Additional input was provided by Nate Siegel (Bucknell University), David Wait (SolarReserve), Vinay Deodeshmukh (Haynes International), Stephen Coryell (Special Metals Corporation), and Mark Anderson (University of Wisconsin).
The Particle Technology Pathway Working Group that met at the workshop included the following: Cliff Ho (SNL), Zhiwen Ma (NREL), Matt Carlson (SNL), Richard McIntosh (Olds Elevator), Jack Gilchrist (Olds Elevator), Dave Minster (Sandia), Tommy Rueckert (DOE, did not vote), Vijay Kumar (DOE), Hany Al-Ansary (KSU), Reiner Buck (DLR), Nate Siegel (Bucknell), Jin-Soo Kim (CSIRO), Bartev Sakajian (B&W), Tom Flynn (B&W), Levi Irwin (DOE), and Daniel Andrew (B&V). Additional input was provided by Bill Kolb (Sandia) and Todd Kennedy (FLSmidth) for this roadmap.
The Gas-Phase Technology Pathway Working Group participants included the following: Mike Wagner (NREL), Shaun Sullivan (Brayton Energy), Kevin Drost (Oregon State), Craig Turchi (NREL), Dileep Singh (ANL), Jesús Ortega (Sandia), Steve Obrey (LANL), and Steve Coryell (Special Metals). Additional input and/or workshop participation was provided by Cliff Ho (Sandia), Judith Vidal (NREL), Mark Lausten (DOE), Mark Anderson (University of Wisconsin), and Omer Dogan (NETL).
Additional thanks to Don Gwinner and Alfred Hicks at NREL for their editing and graphics support. Special thanks also to Subhash Shinde, formally of Sandia, now residing with the Notre Dame University's ND Energy Center. Finally, we acknowledge the Gen3 roadmap Technical Review Committee (TRC) who oversaw the development of this publication, especially Cara Libby of EPRI for providing her leadership and support throughout the roadmapping effort. Additional TRC members included: Brad Albert (APS), Jimmy Daghlian (NV Energy), Jonathan Rumble (SCE), Elaine Sison-Lebrilla (SMUD), Joe Desmond (BrightSource Energy), Frank Wilkins (CSP Alliance), Hank Price (Solar Dynamics, Inc.), Bill Gould (SolarReserve), Fred Morse (Morse Associates, Inc.), Tim Held (Echogen), Doug Hofer (General Electric), Rizaldo Aldas (CEC), Bob Charles (Sargent & Lundy), and Ryan Bowers (WorleyParsons).
iv This report is available at no cost from the National Renewable Energy Laboratory at www.nrel.gov/publications.
Nomenclature or List of Acronyms ANL Argonne National Laboratory APS Arizona Public Service B&V Black & Veatch B&W Babcock & Wilcox CC combined cycle CEC California Energy Commission CFC calcined flint clay CFD computational fluid dynamics CSIRO Commonwealth Scientific and Industrial Research Organisation CSM Colorado School of Mines CSP concentrating solar power CSP-TES concentrating solar power with thermal energy storage CT combustion turbine DLR German Aerospace Center DNI direct normal irradiance DOE U.S. Department of Energy EDM Electric Discharge Machining EJ expansion joint EPRI Electric Power Research Institute FB fluidized bed FOA Funding Opportunity Announcement FOM figure of merit GP gas-phase HTF heat-transfer fluid HTGR high-temperature, gas-cooled reactor IFB insulating fire brick ISCCS integrated solar combined-cycle system ITC investment tax credit KSU King Saud University LANL Los Alamos National Laboratory LCOE levelized cost of electricity MCFC molten carbonate fuel cell MCFR molten chloride fast reactors MENA Middle East and North Africa MS molten salt MSR Microchannel Solar Receiver MSTL Molten Salt Test Loop MT metric ton MTBF mean time between failures ND Notre Dame NETL National Energy Technology Laboratory NG natural gas NREL National Renewable Energy Laboratory NSTTF National Solar Thermal Test Facility ORNL Oak Ridge National Laboratory

v This report is available at no cost from the National Renewable Energy Laboratory at www.nrel.gov/publications.
OSHA Occupational Safety and Health Administration OSU Oregon State University OTPSS On the Path to SunShot PC perlite concrete PCHE printed-circuit heat exchanger PCM phase-change material PNNL Pacific Northwest National Laboratory PPA Power Purchase Agreement PRC perlite-refractory concrete PV photovoltaic R&D research and development RC reinforced concrete RPS renewable portfolio standard SAM System Advisor Model SCE Southern California Edison sCO2 supercritical carbon dioxide SEGS Solar Electric Generating Station SEM scanning electron microscopy SM solar multiple SMUD Sacramento Municipal Utility District SNL Sandia National Laboratories SRNL Savannah River National Laboratory TES thermal energy storage TRC Technical Review Committee UW University of Wisconsin VHTR very high temperature reactor
vi This report is available at no cost from the National Renewable Energy Laboratory at www.nrel.gov/publications.
Executive Summary The U.S. Department of Energy (DOE) launched the SunShot Initiative in 2011 with the goal of making solar electricity cost-competitive with power from conventional generation technologies by 2020. Included in the SunShot Initiative are cost and performance targets for solar photovoltaic (PV) and concentrating solar power (CSP) systems. Unlike PV systems, CSP technology captures and stores the sun’s energy in the form of heat, using materials that are low cost and materially stable for decades. This allows CSP with thermal energy storage (TES) to deliver renewable energy while providing important capacity, reliability and stability attributes to the grid, thereby enabling increased penetration of variable renewable electricity technologies.
Today’s most advanced CSP systems are towers integrated with 2-tank, molten-salt TES, delivering thermal energy at 565°C for integration with conventional steam-Rankine power cycles. These power towers trace their lineage to the 10-MWe pilot demonstration of Solar Two in the 1990s. This design has lowered the cost of CSP electricity by approximately 50% over the prior generation of parabolic trough systems; however, the decrease in cost of CSP technologies has not kept pace with the falling cost of PV systems.
Since the 2011 introduction of SunShot, DOE’s CSP Subprogram has funded research in solar collector field, receiver, TES, and power cycle sub-systems to improve the performance and lower the cost of CSP systems. In August of 2016, DOE hosted a workshop of CSP stakeholders that defined three potential pathways for the next generation CSP plant (CSP Gen3) based on the form of the thermal carrier in the receiver: molten salt, particle, or gaseous. Prior analysis by DOE had selected the supercritical carbon dioxide (sCO2) Brayton cycle as the best-fit power cycle for increasing CSP system thermo-electric conversion efficiency. The research is designed to enable a CSP system that offers the potential to achieve the overall CSP SunShot goals—yet no one approach exists without at least one significant technical, economic, or reliability risk (Figure ES-1).
This roadmap addresses and prioritizes research and development (R&D) gaps and lays out the pathway for a “Gen3 CSP Roadmap.” Throughout the roadmap process, the National Renewable Energy Laboratory (NREL) and Sandia National Laboratories (Sandia) engaged appropriate stakeholders, including the CSP industry and developers, utilities, and the laboratory and university research and development (R&D) community. An industry-led Technical Review Committee (TRC) was established to guide the roadmap activity. Technology gaps for each of the technology pathways were identified, together with research priorities designed to address them. This information will be used by DOE to inform and prioritize R&D activities leading to one or more technology pathways to be successfully demonstrated at a scale appropriate for future commercialization of the technology.
Molten-Salt Pathway. Of the three pathways presented in this roadmap, molten-salt systems represent the most familiar approach. Conceptually there is no change from current state-of-the-art power tower design; however, the increase in hot-salt system temperature from 565°C to approximately 720°C brings significant material challenges. Although the engineering challenges associated with achieving the high receiver outlet temperature required to drive a sCO2 turbine at >700°C are relatively well understood, knowledge around the selection of a high-temperature molten salt is needed, especially with regard to its impact on containment materials that can
vii This report is available at no cost from the National Renewable Energy Laboratory at www.nrel.gov/publications.
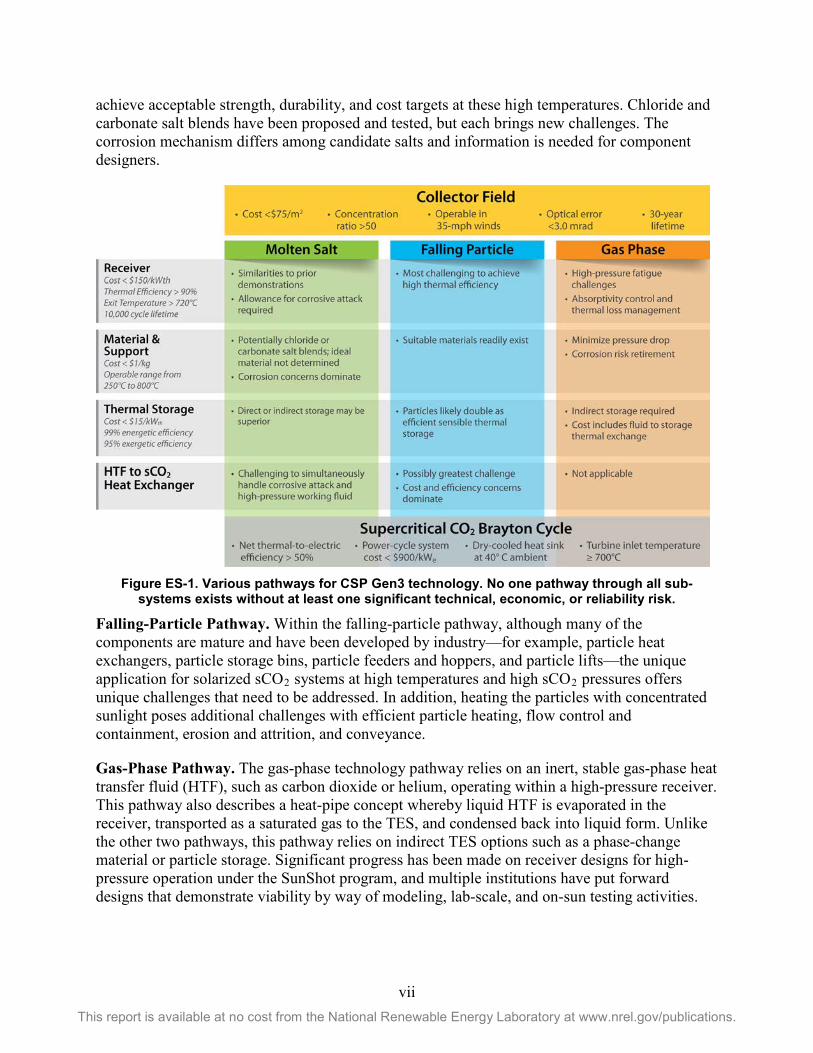
achieve acceptable strength, durability, and cost targets at these high temperatures. Chloride and carbonate salt blends have been proposed and tested, but each brings new challenges. The corrosion mechanism differs among candidate salts and information is needed for component designers.
Figure ES-1. Various pathways for CSP Gen3 technology. No one pathway through all sub-
systems exists without at least one significant technical, economic, or reliability risk. Falling-Particle Pathway. Within the falling-particle pathway, although many of the components are mature and have been developed by industry—for example, particle heat exchangers, particle storage bins, particle feeders and hoppers, and particle lifts—the unique application for solarized sCO2 systems at high temperatures and high sCO2 pressures offers unique challenges that need to be addressed. In addition, heating the particles with concentrated sunlight poses additional challenges with efficient particle heating, flow control and containment, erosion and attrition, and conveyance.
Gas-Phase Pathway. The gas-phase technology pathway relies on an inert, stable gas-phase heat transfer fluid (HTF), such as carbon dioxide or helium, operating within a high-pressure receiver. This pathway also describes a heat-pipe concept whereby liquid HTF is evaporated in the receiver, transported as a saturated gas to the TES, and condensed back into liquid form. Unlike the other two pathways, this pathway relies on indirect TES options such as a phase-change material or particle storage. Significant progress has been made on receiver designs for high-pressure operation under the SunShot program, and multiple institutions have put forward designs that demonstrate viability by way of modeling, lab-scale, and on-sun testing activities.

viii This report is available at no cost from the National Renewable Energy Laboratory at www.nrel.gov/publications.
All three approaches have existing challenges to be solved but retain the potential to achieve the SunShot goal of 6 ¢/kWh. Further development, modeling, and testing are now required to bring the technologies to a stage where integrated system tests and pilot demonstrations are feasible. This report summarizes the perceived areas of greatest need and presents recommendations for future R&D.
Recommended research would also focus on confirming the ability of each technology to address the market requirements defined by the Technical Review Committee, such as ramp rates, reliability, availability, and other market-driven criteria. For any of these technologies to successfully compete in the future marketplace, the needs of the evolving market must be understood, and changes must be incorporated into the technology development process.
ix This report is available at no cost from the National Renewable Energy Laboratory at www.nrel.gov/publications.
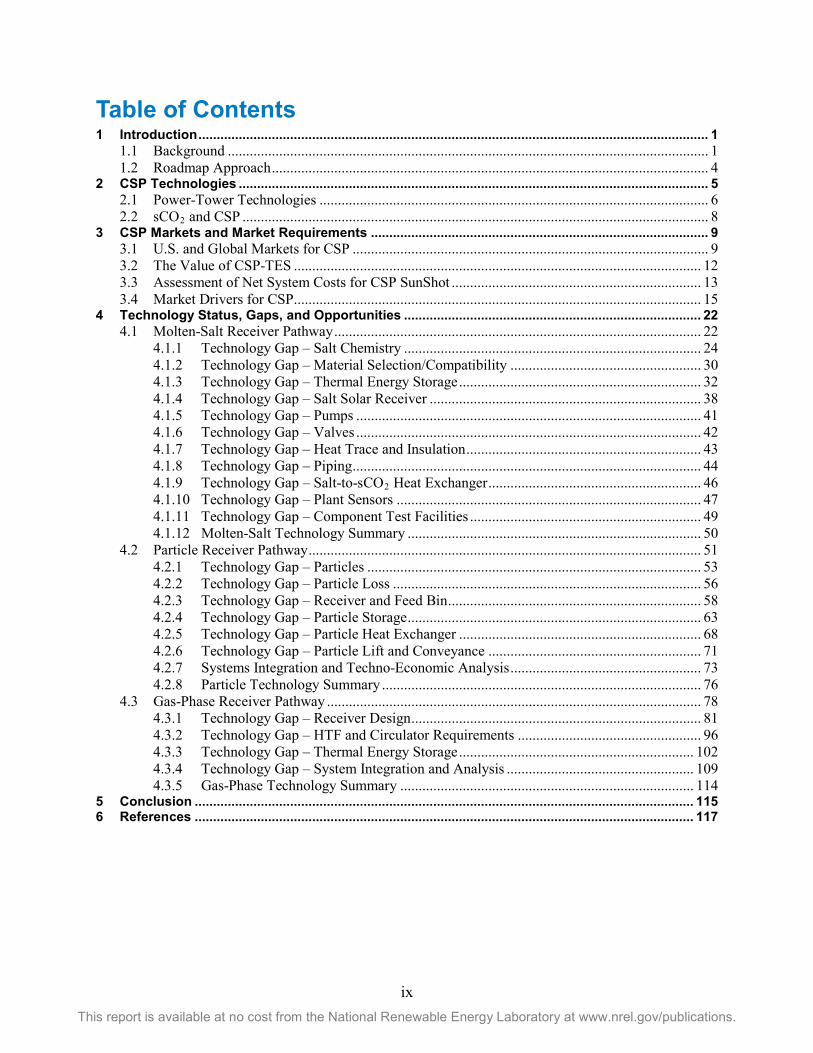
Table of Contents 1 Introduction ........................................................................................................................................... 1
1.1 Background ................................................................................................................................... 1 1.2 Roadmap Approach ....................................................................................................................... 4
2 CSP Technologies ................................................................................................................................ 5 2.1 Power-Tower Technologies .......................................................................................................... 6 2.2 sCO2 and CSP ............................................................................................................................... 8
3 CSP Markets and Market Requirements ............................................................................................ 9 3.1 U.S. and Global Markets for CSP ................................................................................................. 9 3.2 The Value of CSP-TES ............................................................................................................... 12 3.3 Assessment of Net System Costs for CSP SunShot .................................................................... 13 3.4 Market Drivers for CSP ............................................................................................................... 15
4 Technology Status, Gaps, and Opportunities ................................................................................. 22 4.1 Molten-Salt Receiver Pathway .................................................................................................... 22
4.1.1 Technology Gap – Salt Chemistry ................................................................................. 24 4.1.2 Technology Gap – Material Selection/Compatibility .................................................... 30 4.1.3 Technology Gap – Thermal Energy Storage .................................................................. 32 4.1.4 Technology Gap – Salt Solar Receiver .......................................................................... 38 4.1.5 Technology Gap – Pumps .............................................................................................. 41 4.1.6 Technology Gap – Valves .............................................................................................. 42 4.1.7 Technology Gap – Heat Trace and Insulation ................................................................ 43 4.1.8 Technology Gap – Piping ............................................................................................... 44 4.1.9 Technology Gap – Salt-to-sCO2 Heat Exchanger .......................................................... 46 4.1.10 Technology Gap – Plant Sensors ................................................................................... 47 4.1.11 Technology Gap – Component Test Facilities ............................................................... 49 4.1.12 Molten-Salt Technology Summary ................................................................................ 50
4.2 Particle Receiver Pathway ........................................................................................................... 51 4.2.1 Technology Gap – Particles ........................................................................................... 53 4.2.2 Technology Gap – Particle Loss .................................................................................... 56 4.2.3 Technology Gap – Receiver and Feed Bin ..................................................................... 58 4.2.4 Technology Gap – Particle Storage ................................................................................ 63 4.2.5 Technology Gap – Particle Heat Exchanger .................................................................. 68 4.2.6 Technology Gap – Particle Lift and Conveyance .......................................................... 71 4.2.7 Systems Integration and Techno-Economic Analysis .................................................... 73 4.2.8 Particle Technology Summary ....................................................................................... 76
4.3 Gas-Phase Receiver Pathway ...................................................................................................... 78 4.3.1 Technology Gap – Receiver Design ............................................................................... 81 4.3.2 Technology Gap – HTF and Circulator Requirements .................................................. 96 4.3.3 Technology Gap – Thermal Energy Storage ................................................................ 102 4.3.4 Technology Gap – System Integration and Analysis ................................................... 109 4.3.5 Gas-Phase Technology Summary ................................................................................ 114
5 Conclusion ........................................................................................................................................ 115 6 References ........................................................................................................................................ 117
x This report is available at no cost from the National Renewable Energy Laboratory at www.nrel.gov/publications.
List of Figures Figure ES-1. Various pathways for CSP Gen3 technology. No one pathway through all sub-systems exists
without at least one significant technical, economic, or reliability risk. ................................ vii Figure 1. Various pathways show promise for cost-effective, reliable performance. But no one pathway
through all sub-systems exists without at least one significant technical, economic, or reliability risk. .......................................................................................................................... 2
Figure 2. Technical Review Committee members. Cara Libby (EPRI) is the TRC lead. ............................. 5 Figure 3. (source: IEA Technology Roadmap – Solar Thermal Electricity, 2014 edition) .......................... 6 Figure 4. The Ivanpah Solar Electric Generating System (source: BrightSource Energy) ........................... 7 Figure 5. 110-MWe Crescent Dunes Solar Energy Project in Tonopah, Nevada, with 10 hours of thermal
storage. (source: SolarReserve) ................................................................................................ 8 Figure 6. Actual and projected global cumulative growth of CSP capacity (source: IEA). ....................... 10 Figure 7. Cumulative operational CSP capacity by country through 2016 (source: SolarPACES). ........... 10 Figure 8. CSP projects under construction or development (source: SolarPACES). .................................. 11 Figure 9. Total value, which includes operational and capacity value, of CSP with thermal energy storage
and PV under 33% and 40% RPS scenarios. ......................................................................... 13 Figure 10. (Top) Low natural gas and emission cost scenario. (Bottom) High natural gas and emissions
cost scenario. Comparison of net cost for SunShot CSP configurations. Uncertainty bars represent ±10% variation in SunShot parameters. Figure modified from [4] to normalize by capacity. ................................................................................................................................. 14
Figure 11. Annualized net cost results for analysis of current and future cost scenarios for CSP, PV with batteries, and PV with combustion turbines, assuming low natural gas and emissions costs. CSP peaker, intermediate load, and baseload configurations are identical to those shown in Figure 10. Figure modified from [4] to normalize by capacity. ............................................. 15
Figure 12. Molten-salt power tower with direct storage of salt. Current and advanced salt designs are conceptually similar but future designs envision higher salt temperatures with a sCO2-Brayton power cycle. ............................................................................................................. 22
Figure 14. Two-tank TES system cost for the current solar salt [31] and estimates for two higher-temperature salts. ................................................................................................................... 36
Figure 15. Falling-particle receiver system with integrated storage and heat exchange for a power cycle [47]. ........................................................................................................................................ 52
Figure 16. Spherical ceramic particles provide high solar absorptance and durability. ............................. 54 Figure 17. Particle loss from aperture during on-sun tests. ........................................................................ 57 Figure 18. SEM images of ACCUCAST ID50 before (left) and after (right) 187 hours of testing in the on-
sun particle receiver prototype. Average particle diameter was reduced by ~20%. .............. 57 Figure 19. Illustration of particle-receiver designs and feed bins tested on-sun [55]. ................................ 61 Figure 20. Enclosed particle receiver with particles flowing inside an enclosure around tubes whose
interior surfaces are exposed to concentrated sunlight [52]. .................................................. 62 Figure 21. Silo shape and sizing from Marietta Silos for particle-receiver application. ............................. 65 Figure 22. Ground-based cylindrical TES test facility, (a) overall view of the cylindrical TES bin, (b) the
electric heater inserted along the centerline of the TES bin to artificially heat the particles for heat-loss testing. ..................................................................................................................... 67
Figure 23. Effect of velocity on erosion [85]. ............................................................................................. 69 Figure 24. Illustration of commercial particle-to-fluid heat exchanger using a shell-and-plate design from
Solex Thermal Science (www.solexthermal.com). ................................................................ 70 Figure 25. Skip-hoist design from Repole and Jeter [86]. .......................................................................... 72 Figure 26. Black & Veatch drawing of particle-based power-tower system. ............................................. 74 Figure 27. Cavity optical/thermal efficiency performance compared to a generic external receiver with
consistent inlet and outlet temperatures, heat losses, and peak surface temperature. ............ 75
xi This report is available at no cost from the National Renewable Energy Laboratory at www.nrel.gov/publications.
Figure 28. Major components of the particle-based CSP systems and examples of commercially available components. ........................................................................................................................... 77
Figure 29. Conceptual design of gas-phase receiver system with a modular PCM thermal storage system.79 Figure 30. Example of Brayton’s internally supported sCO2 receiver unit cell. Densely packed fins brazed
within the outer shell provide heat-transfer enhancement as well as the tensile support network needed to reach the high internal pressures. ............................................................. 82
Figure 31. Example manifold block, which is used to cap the unit cell...................................................... 83 Figure 32. A pair of manifolded cells. ........................................................................................................ 83 Figure 33. A pair of absorber modules, mounted one atop the other. Inlet flow enters in the middle and
distributes up and down through the modules. ....................................................................... 83 Figure 34. Cutaway of an example surround-field receiver, comprising multiple absorber modules, each
of which in turn comprises multiple unit cells aligned vertically and facing edge-out toward the incoming concentrated solar irradiance. ........................................................................... 83
Figure 35. Rear view of a receiver assembly, showing the vertically mounted absorber cells with interstitially located quartz tubes. .......................................................................................... 84
Figure 36. Cellular cavity receiver concept; unit cells constructed from tubular panels trap incoming light.85 Figure 37. Cellular cavity convective-loss behavior as a function of tilt angle, with (a) horizontal, (b) -15
degrees, and (c) -30 degrees. .................................................................................................. 86 Figure 38. Illustration of 1-m2 panel header concept showing distribution of flow from the global inlet and
outlet to the individual 2-cm × 2-cm unit cells. ..................................................................... 87 Figure 39. Operational principle of thermal transport heat pipe. ................................................................ 89 Figure 40. Vacuum furnace to enable the fabrication of high length/diameter heat pipes with lengths
approaching 40 feet. ............................................................................................................... 90 Figure 41. Thermal imagery of the cold-start of six heat pipes coupled to form an extended heat-pipe
array. ...................................................................................................................................... 90 Figure 42. Thermal profile as a function of time observed during the cold start of the high capacity
counter-gravity heat pipe in a vertical orientation. ................................................................ 90 Figure 43. Semi-optimization of horizontal receiver dimensions for ray-trace optical analysis. ............... 92 Figure 44. Heat flux distribution on case 75, with red being the hottest flux and dark blue being the lowest
flux. ........................................................................................................................................ 92 Figure 45. Bladed receiver in place after on-sun testing. ............................................................................ 92 Figure 46. Thermal efficiency as a function of the incident flux recorded by the flux gauge. The error bars
correspond to the standard deviation from the mean. ............................................................ 92 Figure 47. The temperature increase in an overheated flow path relative to the proportion of heating
imbalance. .............................................................................................................................. 95 Figure 48. Figure of merit for selection of HTF based on thermo-physical properties. Helium ranks above
the common gas-phase candidates, although CO2 is a reasonable alternative. 60 bar is shown as a representative system pressure [93]. ............................................................................... 96
Figure 49. Receiver cost and parasitic efficiency as a function of specified loop pressure (Left), and receiver cost as a function of parasitic efficiency (Right) for helium and CO2. .................. 101
Figure 50. Conceptual design of a multi-layer PCM thermocline (left), and the temperature profiles at 50% and 100% of charge (C) and discharge (DC) cycles (right) [102]. .............................. 103
Figure 51. 180-in. diameter x 60-ft long (4.5-m x 18-m), 90-ton pressure vessel manufactured by Halvorsen for the petrochemical industry [www.halvorsenusa.com]. ................................. 104
Figure 52. Comparison of two basic PCM storage designs suggests the tube-in-tank approach is more cost effective. A tube-in-tank design with tube spacing suggested by Argonne is estimated at $39/kWht. In all cases, a full heat transfer analysis will be required to size the unit. ......... 106
Figure 53. A "two-silo" particle TES system combined with a gas-phase receiver. ................................. 108 Figure 54. Power-cycle efficiency as a function of off-design ambient temperature and hot-side
temperature........................................................................................................................... 110 Figure 55. Heliostat-field layout for the GP concept at 250 MWt. ........................................................... 112
xii This report is available at no cost from the National Renewable Energy Laboratory at www.nrel.gov/publications.
Figure 56. Flux intensity at the GP receiver aperture using smart aiming techniques. ............................. 112 Figure 57. Commercial valve options are rated to 550°C and up to 170 bar with 316SS.
[www.samsoncontrols.com].. ............................................................................................... 113
List of Tables Table 1. Technology pathways and architects .............................................................................................. 4 Table 2. U.S. CSP projects in operation ....................................................................................................... 9 Table 3. CSP tower projects with storage (source: CSP Today Global Tracker) ....................................... 12 Table 4. Modeling scenarios ....................................................................................................................... 14 Table 5. Technology design and performance requirements for Gen3 CSP technology ............................ 16 Table 6. Commercialization requirements for Gen3 CSP technology ........................................................ 19 Table 7. Current state-of-the-art molten-salt power tower represented by Crescent Dunes and the default
case in SAM 2016-03-14. Each plant is designed with 10-hr TES. ....................................... 23 Table 8. Candidate molten-salt heat-transfer fluids and approximate physical properties, or for the pure
components if mixture data are not available ........................................................................ 25 Table 9. Salt prices based on proposed blends and recent commodity prices ............................................ 26 Table 10. Main attributes of the three salt candidates ................................................................................. 27 Table 11. TES cost for two-tank solar salt at 565°C from two industry sources ........................................ 33 Table 12. Parameters and assumptions used for scaling TES cost from current solar salt to the proposed
720°C salts. ............................................................................................................................ 34 Table 13. Estimated cost of TES for 720°C molten-salt systems ............................................................... 35 Table 14. Potential cost of two-tank TES systems with high-temperature salts ......................................... 36 Table 15. Piping and insulation costs associated with the receiver and TES system for a 670-MWt
receiver. Solar-salt case based on [31]. .................................................................................. 45 Table 16. Summary of estimated cost and performance for critical components within the molten-salt
pathway .................................................................................................................................. 51 Table 17. Material properties of some solid particles ................................................................................. 55 Table 18. Summary of particle receiver designs (from Ho [67])* .............................................................. 59 Table 19. List of TES design concepts ....................................................................................................... 66 Table 20. Summary of advantages and disadvantages of heat-exchanger design options. ......................... 70 Table 21. Summary of Estimated Cost and Performance for Critical Components within the Particle
Pathway. ................................................................................................................................. 78 Table 22. Performance metrics for Brayton Energy’s SunShot sCO2 Receiver Program (Note that
although the design-point internal operating pressure of the system is 25 MPa, assemblies were shown to survive up to 80 MPa at their operating temperature.) .................................. 82
Table 23. Helium circulator experience [98] .............................................................................................. 98 Table 24. Case study comparing receiver design for CO2 and helium HTFs ............................................. 99 Table 25. Potential chloride salt blends for PCMs [101]. ......................................................................... 103 Table 26. Encapsulated PCM thermal storage design. Operating pressure is 60 bar. ............................... 105 Table 27. Tube-in-tank PCM thermal storage design. Operating pressure is limited to 27 bar in existing
plate-fin heat exchangers...................................................................................................... 106 Table 28. Summary of heliostat-field design-point performance for a north field at 250 MWt ............... 112 Table 29. Summary of Estimated Cost and Performance for Critical Components within the GP Receiver
Pathway ................................................................................................................................ 115
1 This report is available at no cost from the National Renewable Energy Laboratory at www.nrel.gov/publications.
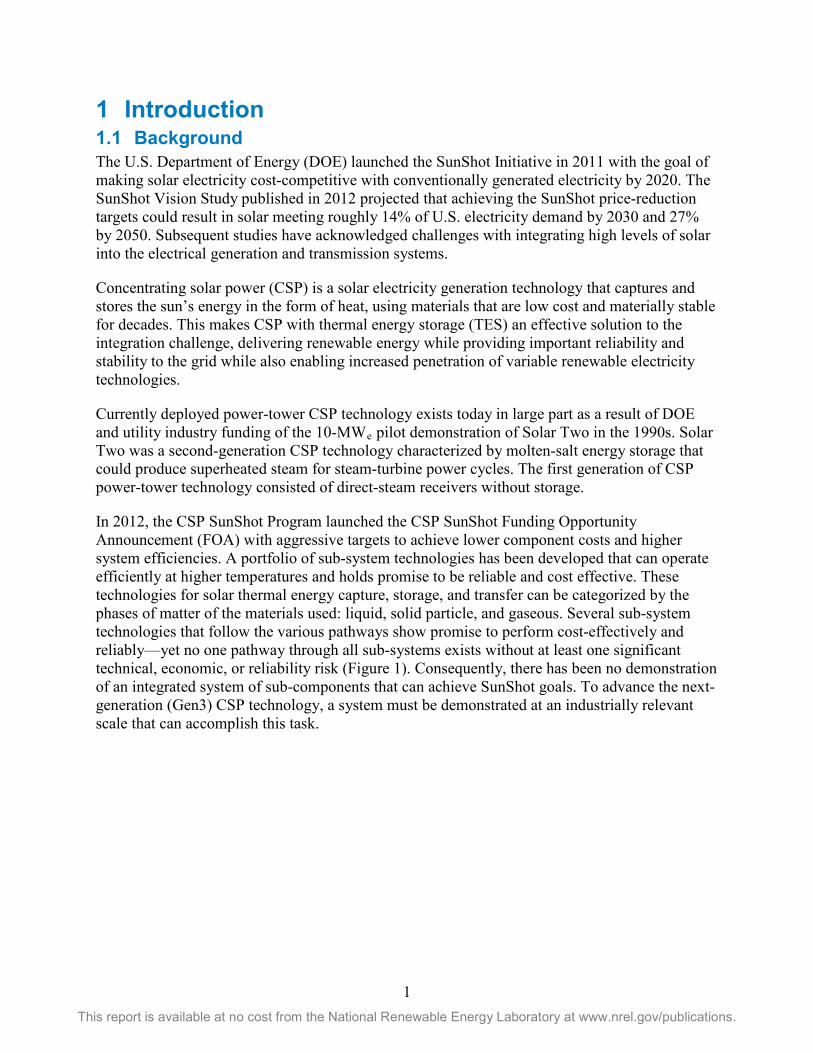
1 Introduction 1.1 Background The U.S. Department of Energy (DOE) launched the SunShot Initiative in 2011 with the goal of making solar electricity cost-competitive with conventionally generated electricity by 2020. The SunShot Vision Study published in 2012 projected that achieving the SunShot price-reduction targets could result in solar meeting roughly 14% of U.S. electricity demand by 2030 and 27% by 2050. Subsequent studies have acknowledged challenges with integrating high levels of solar into the electrical generation and transmission systems.
Concentrating solar power (CSP) is a solar electricity generation technology that captures and stores the sun’s energy in the form of heat, using materials that are low cost and materially stable for decades. This makes CSP with thermal energy storage (TES) an effective solution to the integration challenge, delivering renewable energy while providing important reliability and stability to the grid while also enabling increased penetration of variable renewable electricity technologies.
Currently deployed power-tower CSP technology exists today in large part as a result of DOE and utility industry funding of the 10-MWe pilot demonstration of Solar Two in the 1990s. Solar Two was a second-generation CSP technology characterized by molten-salt energy storage that could produce superheated steam for steam-turbine power cycles. The first generation of CSP power-tower technology consisted of direct-steam receivers without storage.
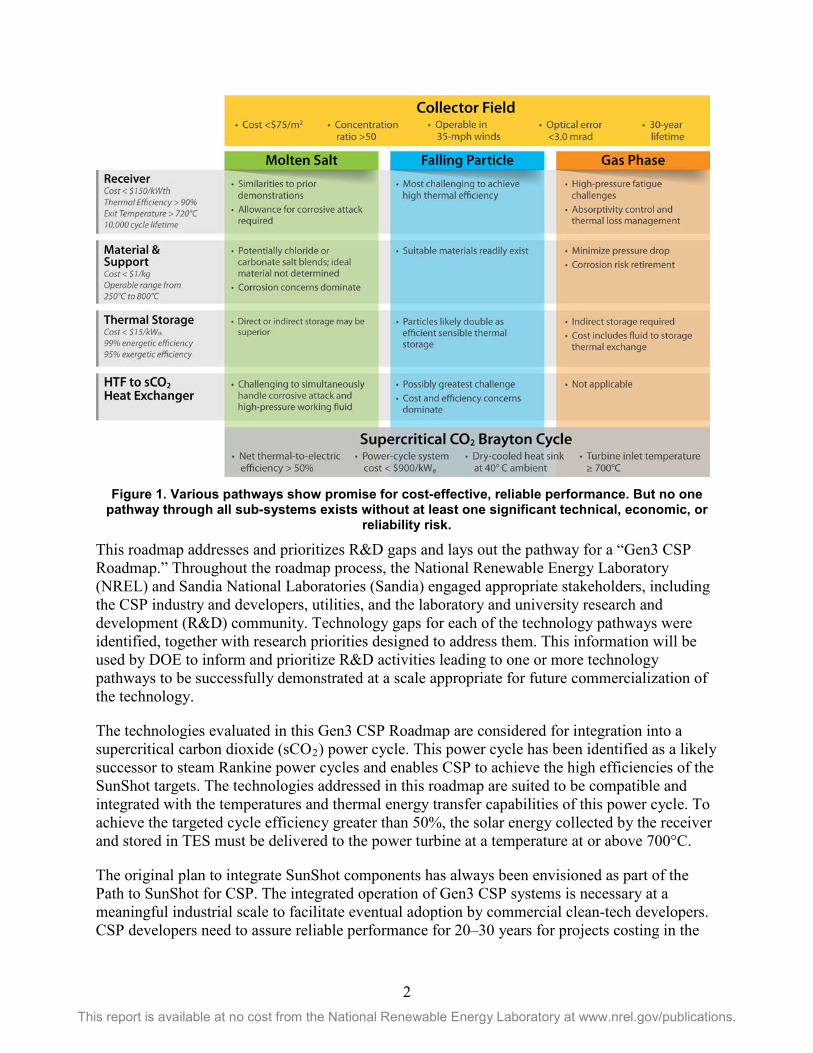
In 2012, the CSP SunShot Program launched the CSP SunShot Funding Opportunity Announcement (FOA) with aggressive targets to achieve lower component costs and higher system efficiencies. A portfolio of sub-system technologies has been developed that can operate efficiently at higher temperatures and holds promise to be reliable and cost effective. These technologies for solar thermal energy capture, storage, and transfer can be categorized by the phases of matter of the materials used: liquid, solid particle, and gaseous. Several sub-system technologies that follow the various pathways show promise to perform cost-effectively and reliably—yet no one pathway through all sub-systems exists without at least one significant technical, economic, or reliability risk (Figure 1). Consequently, there has been no demonstration of an integrated system of sub-components that can achieve SunShot goals. To advance the next-generation (Gen3) CSP technology, a system must be demonstrated at an industrially relevant scale that can accomplish this task.
2 This report is available at no cost from the National Renewable Energy Laboratory at www.nrel.gov/publications.
Figure 1. Various pathways show promise for cost-effective, reliable performance. But no one
pathway through all sub-systems exists without at least one significant technical, economic, or reliability risk.
This roadmap addresses and prioritizes R&D gaps and lays out the pathway for a “Gen3 CSP Roadmap.” Throughout the roadmap process, the National Renewable Energy Laboratory (NREL) and Sandia National Laboratories (Sandia) engaged appropriate stakeholders, including the CSP industry and developers, utilities, and the laboratory and university research and development (R&D) community. Technology gaps for each of the technology pathways were identified, together with research priorities designed to address them. This information will be used by DOE to inform and prioritize R&D activities leading to one or more technology pathways to be successfully demonstrated at a scale appropriate for future commercialization of the technology.
The technologies evaluated in this Gen3 CSP Roadmap are considered for integration into a supercritical carbon dioxide (sCO2) power cycle. This power cycle has been identified as a likely successor to steam Rankine power cycles and enables CSP to achieve the high efficiencies of the SunShot targets. The technologies addressed in this roadmap are suited to be compatible and integrated with the temperatures and thermal energy transfer capabilities of this power cycle. To achieve the targeted cycle efficiency greater than 50%, the solar energy collected by the receiver and stored in TES must be delivered to the power turbine at a temperature at or above 700°C.
The original plan to integrate SunShot components has always been envisioned as part of the Path to SunShot for CSP. The integrated operation of Gen3 CSP systems is necessary at a meaningful industrial scale to facilitate eventual adoption by commercial clean-tech developers. CSP developers need to assure reliable performance for 20–30 years for projects costing in the
3 This report is available at no cost from the National Renewable Energy Laboratory at www.nrel.gov/publications.
range of 100s of millions of dollars. The approach to advancing Gen3 technology to the point of commercial adoption must also consider the perceived risk by financiers, utilities, and public agents. Future development of CSP technology must consider the requirements for the following:
• The scale and duration of integrated operation of new technologies
• Cost and time to develop
• Opportunity for commercial adoption of interim advances, and
• Cost and scalability with deployment.
In the first quarter of FY16, the DOE CSP SunShot Program commissioned Black and Veatch (B&V) to develop concept facility designs and a cost estimate for similar work performed for Solar Two—but considering the materials and operating temperatures of technologies from the program’s research portfolio that hold promise to reach SunShot goals. Through this activity, the broad research community and industrial suppliers were consulted to inform B&V of costs and operating conditions and limits of materials to develop for the concept design.
In April of 2016, the CSP SunShot Program Review and the CSP System Integration Workshop brought together the program’s R&D community, utilities, and industrial manufacturers. B&V’s progress was presented, and turbine developers presented their work on developing supercritical CO2 turbines. Breakout groups brought technology experts together to discuss the state of the various technologies in the three technology pathways. Utilities and regulators spoke of the state of the market with respect to trends in future requirements for electricity cost and reliability, and analysis from NREL on the Path to SunShot was presented, covering the value of energy and storage. The B&V work was completed in June.
The key outcomes up to this point were the following.
1. The cost of a fully integrated solar to electric demonstration facility of the scale similar to Solar Two (10 MW) would cost over $200M, although with considerable uncertainty around this value. This scale of demonstration is appropriate for a pre-commercial demonstration to enable financing and adoption in a large, financed public works project such as a CSP power plant. The cost of such a facility is not tenable for the current CSP industry, and public utilities are no longer structured to bear such R&D costs as they were before deregulation in the 1990s.
2. It would be beneficial to demonstrate key aspects of integrated operation in a multi-MW thermal test if the technology could be incrementally adopted to current systems.
3. There was widely voiced opinion that the state of development of Gen3 technologies is not ready for a 10-MW solar-to-electric demonstration. There is no clear leading choice for a Gen3 energy pathway because each has critical technological barriers that must be overcome to advance it to industrial scale.
4. CSP clearly has value as a flexible renewable energy source that provides grid stability and flexible generation, but there are competing storage technologies that make advancement imperative for higher-efficiency and lower-cost CSP.
4 This report is available at no cost from the National Renewable Energy Laboratory at www.nrel.gov/publications.
As a result of the B&V study and the April workshop, the CSP SunShot program commissioned this study of Gen3 CSP technologies, considering R&D priorities in the three energy pathways. The study involved teaming with various researchers throughout the CSP community, external review of technical and industry experts, and includes input from utility and regulation representatives to identify key desirable performance attributes of future CSP systems.
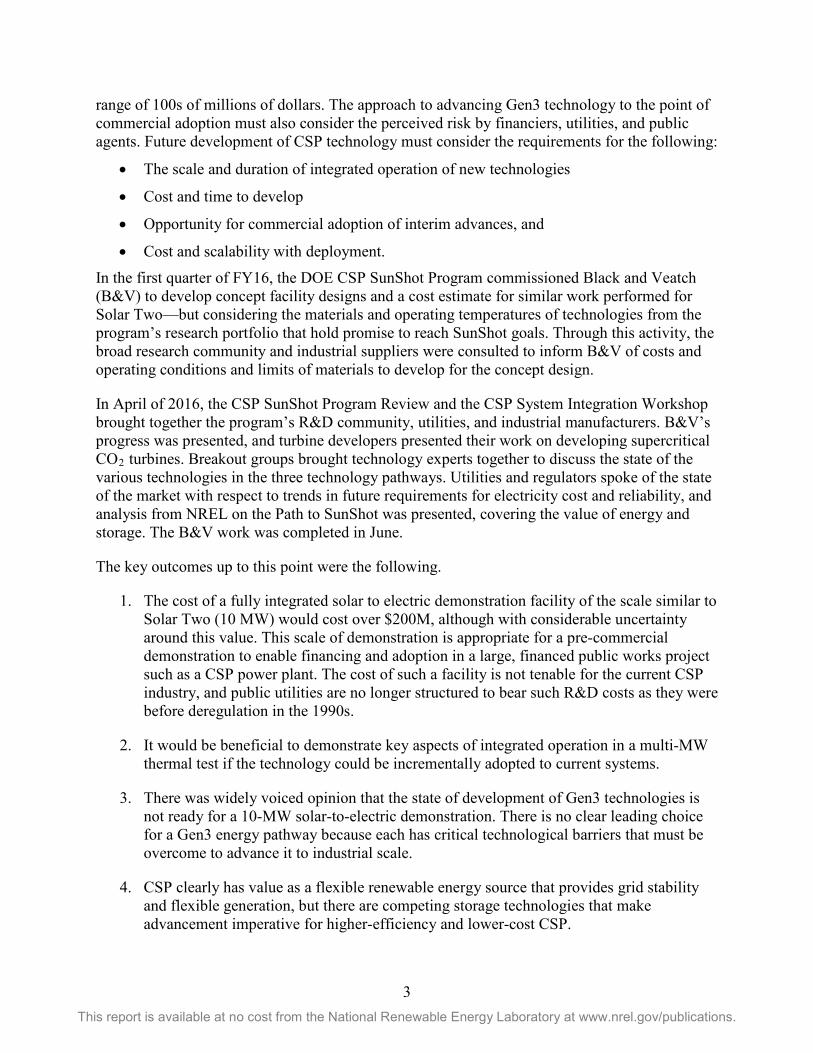
1.2 Roadmap Approach To develop this roadmap, NREL and Sandia assigned Technology Architects (TAs) to form collaborative roadmap teams for the three distinct technology pathways (Table 1). The roadmap teams included representatives from relevant SunShot R&D awards and, as appropriate, other laboratory, university, and industry experts. In August of 2016, NREL and Sandia convened a two-day workshop in Albuquerque, NM, to: 1) review the roadmap vision and timeline, 2) identify and discuss preliminary technology concepts, 3) review and discuss technology feasibility and market success criteria, and 4) begin initial discussions of technology gaps and prioritized R&D activities for each of the technology pathways. Following the initial workshop, each of the TAs convened follow-on discussions and analysis, as appropriate, to further develop and refine technology gaps and research priorities.
Table 1. Technology pathways and architects
Pathway Technology Architect(s)
Molten Salt J. Vidal (NREL), A. Kruizenga (SNL)
Particle C. Ho (SNL)
Gas M. Wagner (NREL)
A Technical Review Committee (TRC) was assembled to participate in roadmap development and provide guidance throughout the process. The primary roles of the TRC were as follows:
• Provide market perspective and insight on critical merit evaluation criteria.
• Facilitate connections to key stakeholders for developing the roadmap.
• Advise on the key messages (and communication channels) of the roadmap.
• Assist in developing a stakeholder engagement plan following publication of the roadmap.
5 This report is available at no cost from the National Renewable Energy Laboratory at www.nrel.gov/publications.
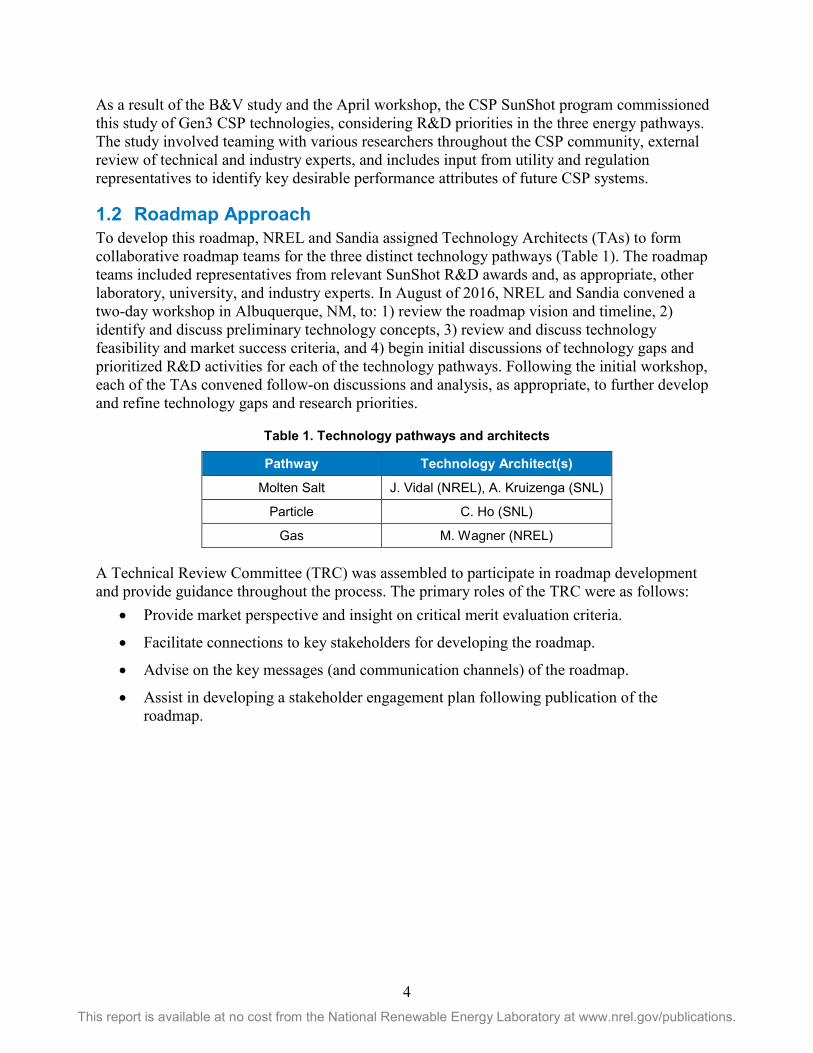
The TRC comprised 14 industry experts from U.S. electric utilities, state commissions, CSP developers, sCO2 power-cycle developers, and engineering firms (Figure 2). They convened twice during the roadmap development process to discuss market requirements for Gen3 technologies and to review materials presented by the technology architects and other industry experts.
Figure 2. Technical Review Committee members. Cara Libby (EPRI) is the TRC lead.
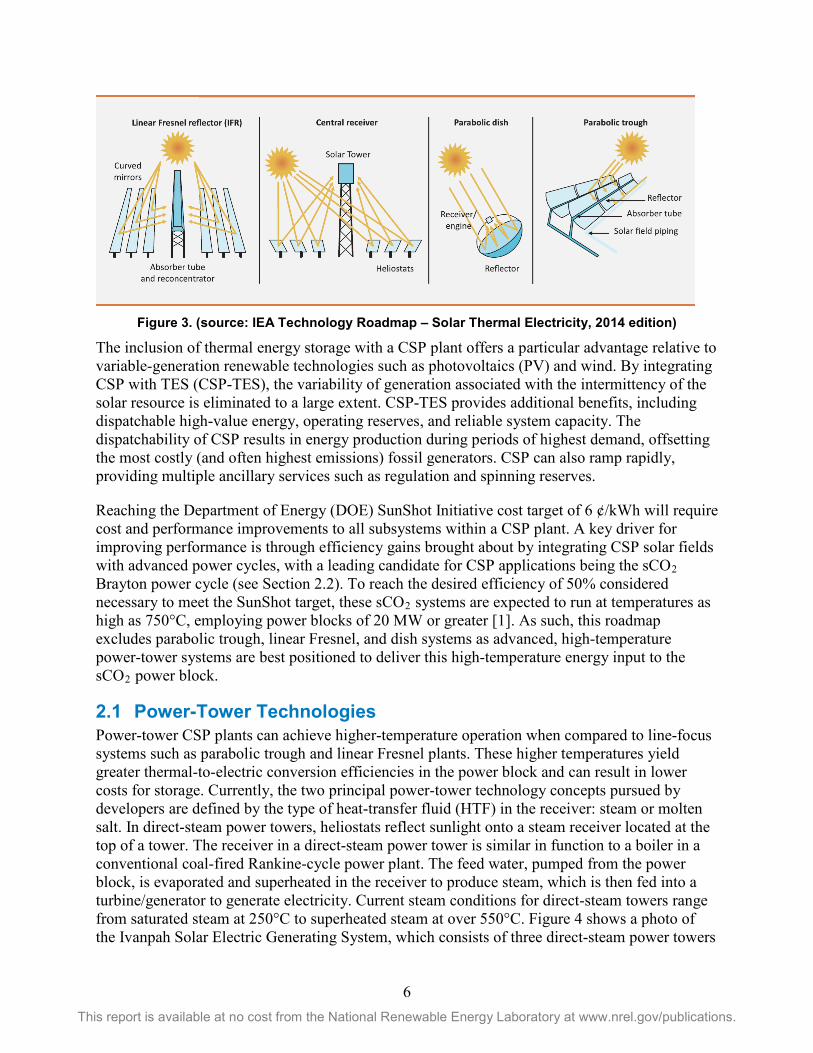
2 CSP Technologies CSP technologies use mirrors to reflect and concentrate sunlight onto receivers that collect the solar energy and convert it to heat. This thermal energy can then be used to produce electricity via a turbine (e.g., steam, air, supercritical carbon dioxide) or other type of heat engine that drives a generator. CSP systems are typically classified by how the various systems collect solar energy. The four main systems described by Figure 3 include linear Fresnel, central receiver (power tower), parabolic dish, and parabolic trough systems. To date, the majority of installed CSP systems consist of parabolic troughs, although, as described in Section 3.1, power-tower systems are beginning to see more widespread commercial deployment.
6 This report is available at no cost from the National Renewable Energy Laboratory at www.nrel.gov/publications.
Figure 3. (source: IEA Technology Roadmap – Solar Thermal Electricity, 2014 edition)
The inclusion of thermal energy storage with a CSP plant offers a particular advantage relative to variable-generation renewable technologies such as photovoltaics (PV) and wind. By integrating CSP with TES (CSP-TES), the variability of generation associated with the intermittency of the solar resource is eliminated to a large extent. CSP-TES provides additional benefits, including dispatchable high-value energy, operating reserves, and reliable system capacity. The dispatchability of CSP results in energy production during periods of highest demand, offsetting the most costly (and often highest emissions) fossil generators. CSP can also ramp rapidly, providing multiple ancillary services such as regulation and spinning reserves.
Reaching the Department of Energy (DOE) SunShot Initiative cost target of 6 ¢/kWh will require cost and performance improvements to all subsystems within a CSP plant. A key driver for improving performance is through efficiency gains brought about by integrating CSP solar fields with advanced power cycles, with a leading candidate for CSP applications being the sCO2 Brayton power cycle (see Section 2.2). To reach the desired efficiency of 50% considered necessary to meet the SunShot target, these sCO2 systems are expected to run at temperatures as high as 750°C, employing power blocks of 20 MW or greater [1]. As such, this roadmap excludes parabolic trough, linear Fresnel, and dish systems as advanced, high-temperature power-tower systems are best positioned to deliver this high-temperature energy input to the sCO2 power block.
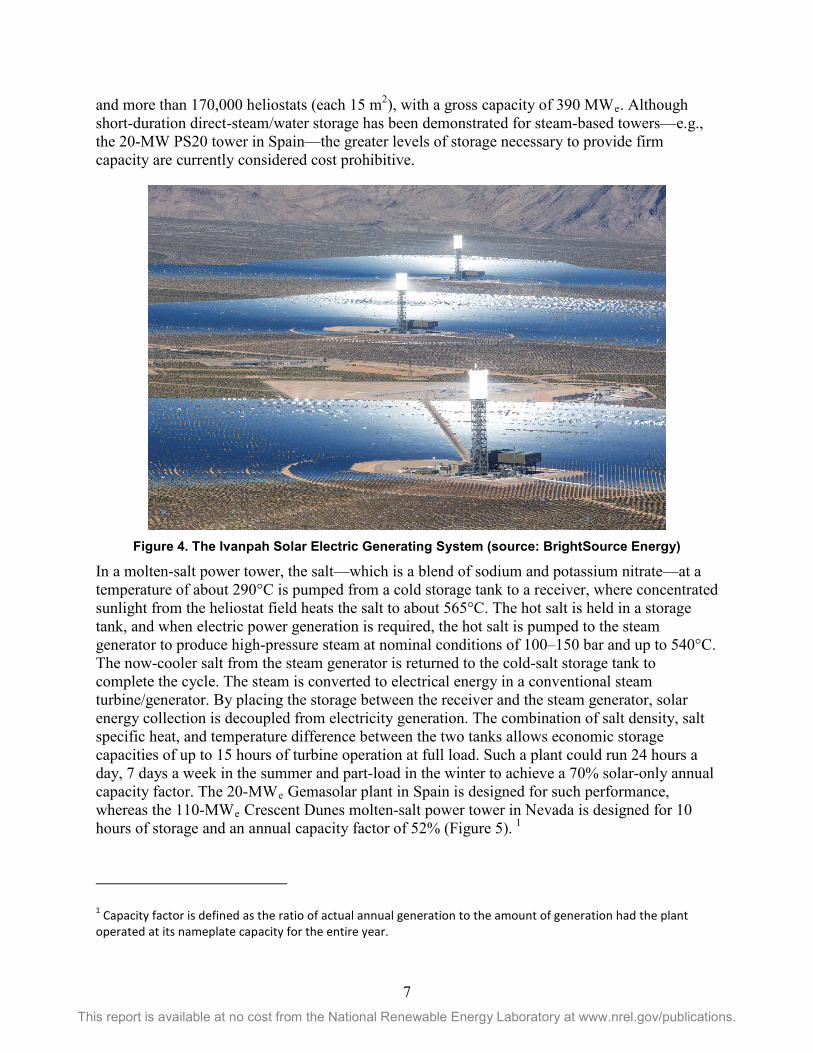
2.1 Power-Tower Technologies Power-tower CSP plants can achieve higher-temperature operation when compared to line-focus systems such as parabolic trough and linear Fresnel plants. These higher temperatures yield greater thermal-to-electric conversion efficiencies in the power block and can result in lower costs for storage. Currently, the two principal power-tower technology concepts pursued by developers are defined by the type of heat-transfer fluid (HTF) in the receiver: steam or molten salt. In direct-steam power towers, heliostats reflect sunlight onto a steam receiver located at the top of a tower. The receiver in a direct-steam power tower is similar in function to a boiler in a conventional coal-fired Rankine-cycle power plant. The feed water, pumped from the power block, is evaporated and superheated in the receiver to produce steam, which is then fed into a turbine/generator to generate electricity. Current steam conditions for direct-steam towers range from saturated steam at 250°C to superheated steam at over 550°C. Figure 4 shows a photo of the Ivanpah Solar Electric Generating System, which consists of three direct-steam power towers
7 This report is available at no cost from the National Renewable Energy Laboratory at www.nrel.gov/publications.
and more than 170,000 heliostats (each 15 m2), with a gross capacity of 390 MWe. Although short-duration direct-steam/water storage has been demonstrated for steam-based towers—e.g., the 20-MW PS20 tower in Spain—the greater levels of storage necessary to provide firm capacity are currently considered cost prohibitive.
Figure 4. The Ivanpah Solar Electric Generating System (source: BrightSource Energy)
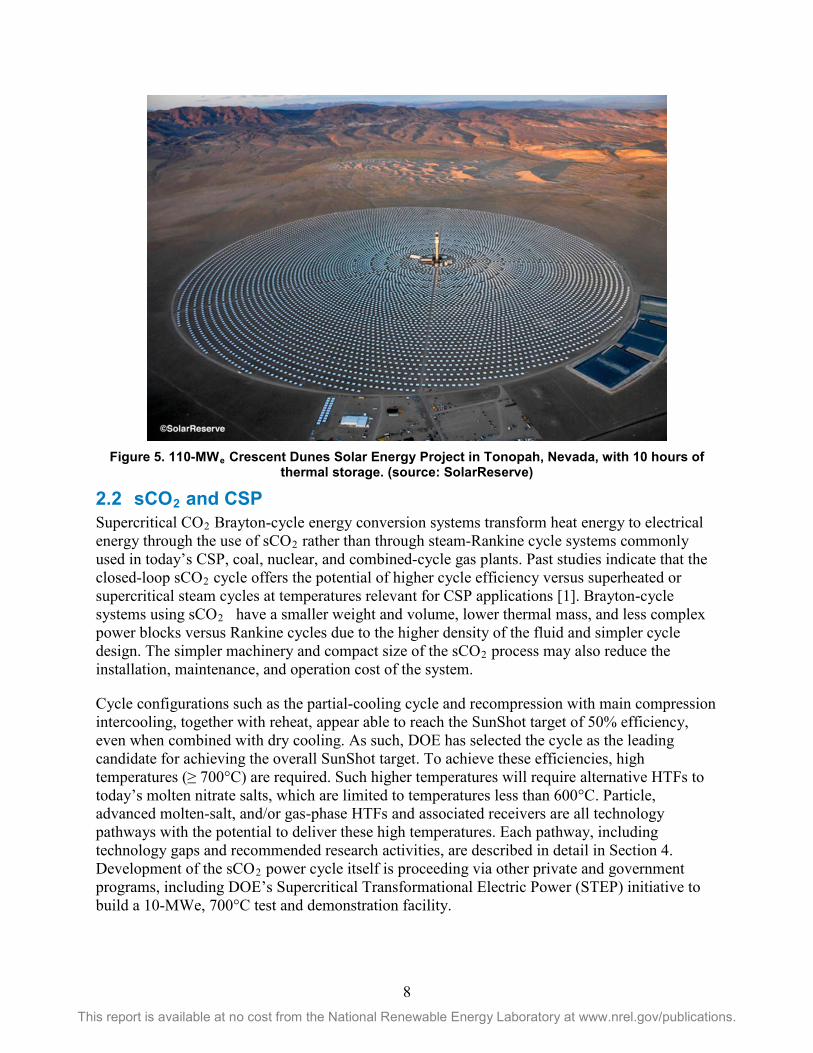
In a molten-salt power tower, the salt—which is a blend of sodium and potassium nitrate—at a temperature of about 290°C is pumped from a cold storage tank to a receiver, where concentrated sunlight from the heliostat field heats the salt to about 565°C. The hot salt is held in a storage tank, and when electric power generation is required, the hot salt is pumped to the steam generator to produce high-pressure steam at nominal conditions of 100–150 bar and up to 540°C. The now-cooler salt from the steam generator is returned to the cold-salt storage tank to complete the cycle. The steam is converted to electrical energy in a conventional steam turbine/generator. By placing the storage between the receiver and the steam generator, solar energy collection is decoupled from electricity generation. The combination of salt density, salt specific heat, and temperature difference between the two tanks allows economic storage capacities of up to 15 hours of turbine operation at full load. Such a plant could run 24 hours a day, 7 days a week in the summer and part-load in the winter to achieve a 70% solar-only annual capacity factor. The 20-MWe Gemasolar plant in Spain is designed for such performance, whereas the 110-MWe Crescent Dunes molten-salt power tower in Nevada is designed for 10 hours of storage and an annual capacity factor of 52% (Figure 5). 1
1 Capacity factor is defined as the ratio of actual annual generation to the amount of generation had the plant operated at its nameplate capacity for the entire year.
8 This report is available at no cost from the National Renewable Energy Laboratory at www.nrel.gov/publications.
Figure 5. 110-MWe Crescent Dunes Solar Energy Project in Tonopah, Nevada, with 10 hours of
thermal storage. (source: SolarReserve)
2.2 sCO2 and CSP Supercritical CO2 Brayton-cycle energy conversion systems transform heat energy to electrical energy through the use of sCO2 rather than through steam-Rankine cycle systems commonly used in today’s CSP, coal, nuclear, and combined-cycle gas plants. Past studies indicate that the closed-loop sCO2 cycle offers the potential of higher cycle efficiency versus superheated or supercritical steam cycles at temperatures relevant for CSP applications [1]. Brayton-cycle systems using sCO2 have a smaller weight and volume, lower thermal mass, and less complex power blocks versus Rankine cycles due to the higher density of the fluid and simpler cycle design. The simpler machinery and compact size of the sCO2 process may also reduce the installation, maintenance, and operation cost of the system.
Cycle configurations such as the partial-cooling cycle and recompression with main compression intercooling, together with reheat, appear able to reach the SunShot target of 50% efficiency, even when combined with dry cooling. As such, DOE has selected the cycle as the leading candidate for achieving the overall SunShot target. To achieve these efficiencies, high temperatures (≥ 700°C) are required. Such higher temperatures will require alternative HTFs to today’s molten nitrate salts, which are limited to temperatures less than 600°C. Particle, advanced molten-salt, and/or gas-phase HTFs and associated receivers are all technology pathways with the potential to deliver these high temperatures. Each pathway, including technology gaps and recommended research activities, are described in detail in Section 4. Development of the sCO2 power cycle itself is proceeding via other private and government programs, including DOE’s Supercritical Transformational Electric Power (STEP) initiative to build a 10-MWe, 700°C test and demonstration facility.
9 This report is available at no cost from the National Renewable Energy Laboratory at www.nrel.gov/publications.
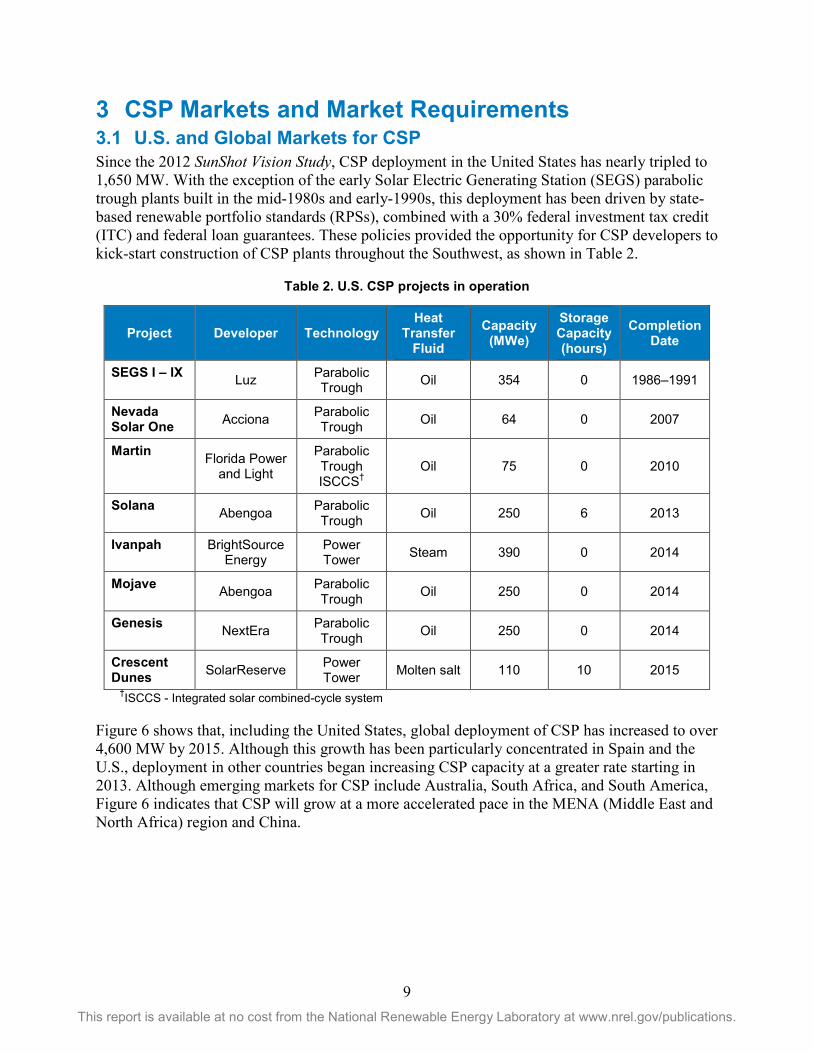
3 CSP Markets and Market Requirements 3.1 U.S. and Global Markets for CSP Since the 2012 SunShot Vision Study, CSP deployment in the United States has nearly tripled to 1,650 MW. With the exception of the early Solar Electric Generating Station (SEGS) parabolic trough plants built in the mid-1980s and early-1990s, this deployment has been driven by state-based renewable portfolio standards (RPSs), combined with a 30% federal investment tax credit (ITC) and federal loan guarantees. These policies provided the opportunity for CSP developers to kick-start construction of CSP plants throughout the Southwest, as shown in Table 2.
Table 2. U.S. CSP projects in operation
†ISCCS - Integrated solar combined-cycle system
Figure 6 shows that, including the United States, global deployment of CSP has increased to over 4,600 MW by 2015. Although this growth has been particularly concentrated in Spain and the U.S., deployment in other countries began increasing CSP capacity at a greater rate starting in 2013. Although emerging markets for CSP include Australia, South Africa, and South America, Figure 6 indicates that CSP will grow at a more accelerated pace in the MENA (Middle East and North Africa) region and China.
Project Developer Technology Heat
Transfer Fluid
Capacity (MWe)
Storage Capacity (hours)
Completion Date
SEGS I – IX Luz Parabolic Trough Oil 354 0 1986–1991
Nevada Solar One Acciona Parabolic
Trough Oil 64 0 2007
Martin Florida Power and Light
Parabolic Trough ISCCS†
Oil 75 0 2010
Solana Abengoa Parabolic Trough Oil 250 6 2013
Ivanpah BrightSource Energy
Power Tower Steam 390 0 2014
Mojave Abengoa Parabolic Trough Oil 250 0 2014
Genesis NextEra Parabolic Trough Oil 250 0 2014
Crescent Dunes SolarReserve Power
Tower Molten salt 110 10 2015
10 This report is available at no cost from the National Renewable Energy Laboratory at www.nrel.gov/publications.
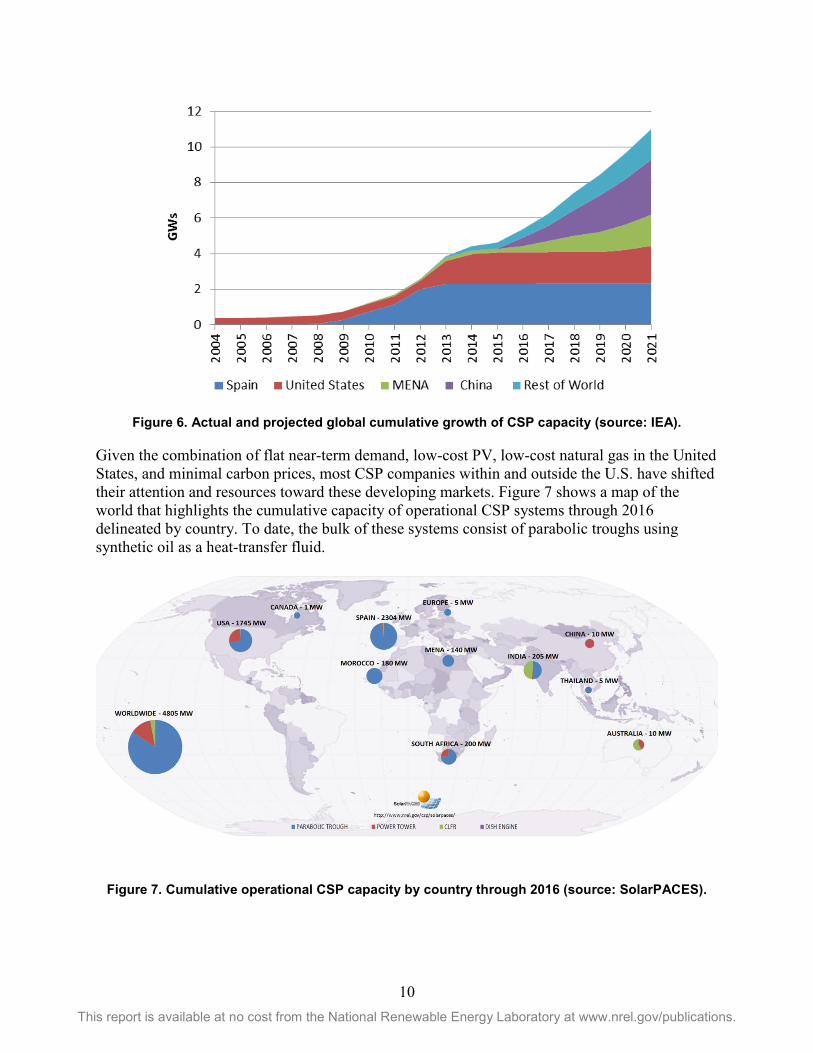
Figure 6. Actual and projected global cumulative growth of CSP capacity (source: IEA).
Given the combination of flat near-term demand, low-cost PV, low-cost natural gas in the United States, and minimal carbon prices, most CSP companies within and outside the U.S. have shifted their attention and resources toward these developing markets. Figure 7 shows a map of the world that highlights the cumulative capacity of operational CSP systems through 2016 delineated by country. To date, the bulk of these systems consist of parabolic troughs using synthetic oil as a heat-transfer fluid.
Figure 7. Cumulative operational CSP capacity by country through 2016 (source: SolarPACES).
11 This report is available at no cost from the National Renewable Energy Laboratory at www.nrel.gov/publications.
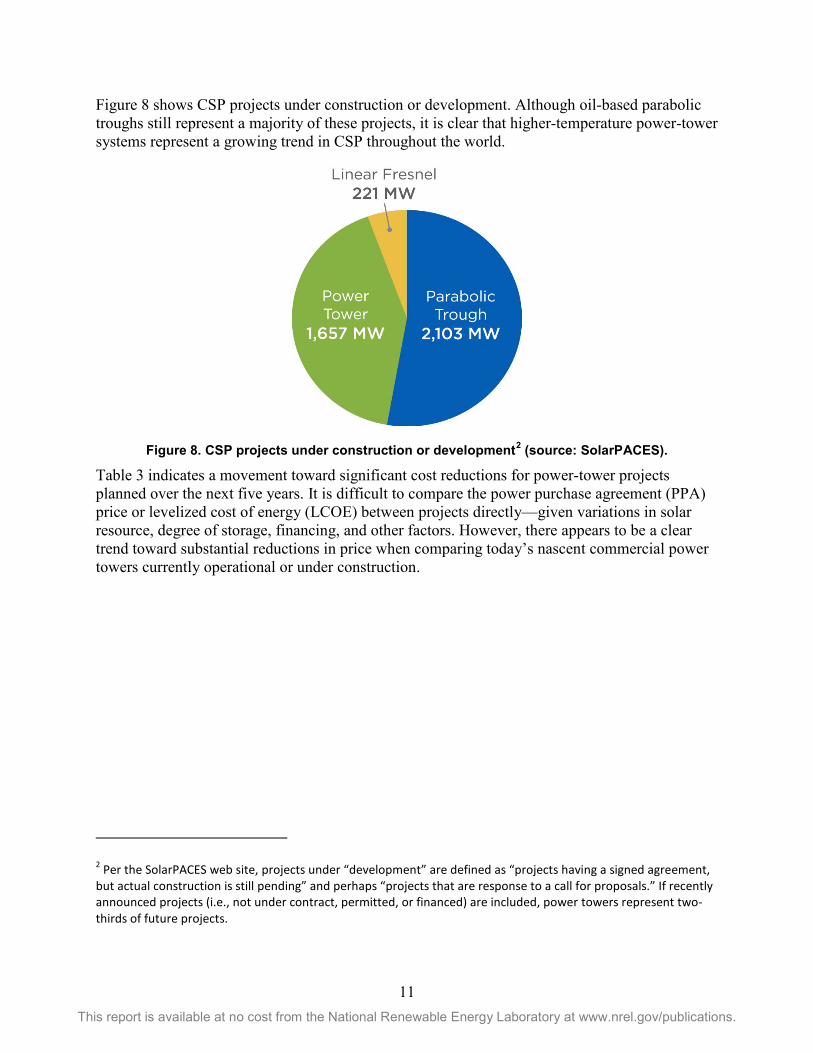
Figure 8 shows CSP projects under construction or development. Although oil-based parabolic troughs still represent a majority of these projects, it is clear that higher-temperature power-tower systems represent a growing trend in CSP throughout the world.
Figure 8. CSP projects under construction or development2 (source: SolarPACES).
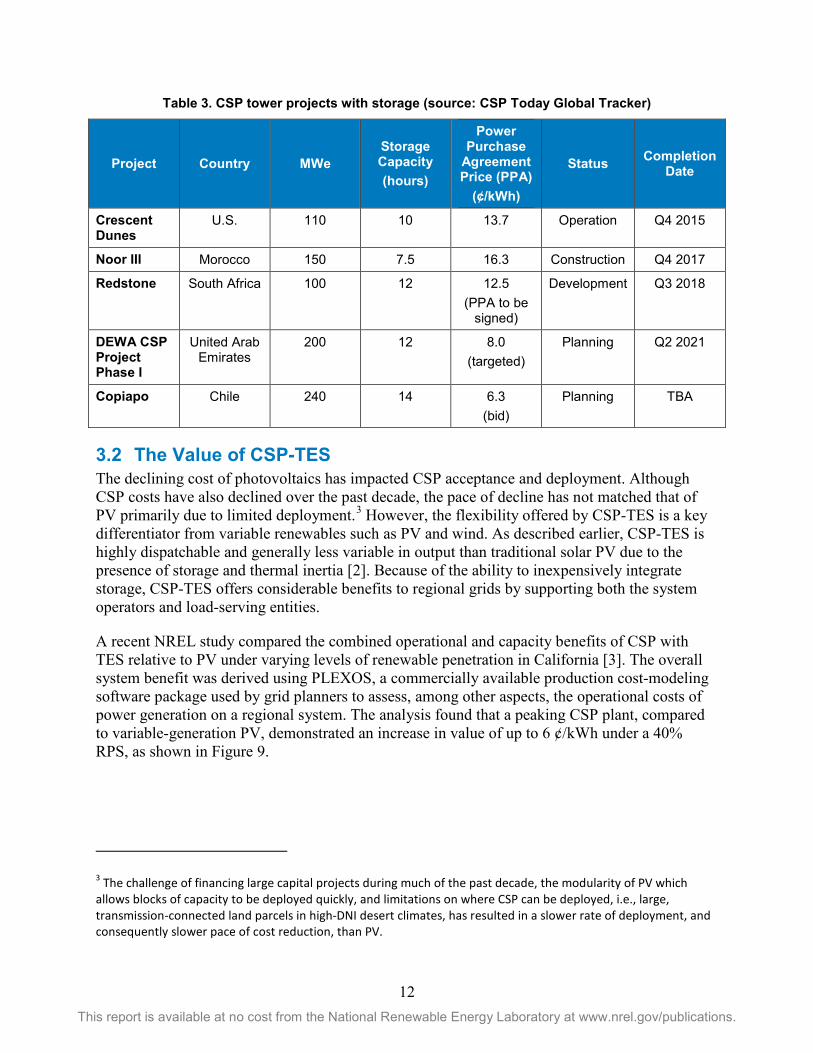
Table 3 indicates a movement toward significant cost reductions for power-tower projects planned over the next five years. It is difficult to compare the power purchase agreement (PPA) price or levelized cost of energy (LCOE) between projects directly—given variations in solar resource, degree of storage, financing, and other factors. However, there appears to be a clear trend toward substantial reductions in price when comparing today’s nascent commercial power towers currently operational or under construction.
2 Per the SolarPACES web site, projects under “development” are defined as “projects having a signed agreement, but actual construction is still pending” and perhaps “projects that are response to a call for proposals.” If recently announced projects (i.e., not under contract, permitted, or financed) are included, power towers represent two-thirds of future projects.
12 This report is available at no cost from the National Renewable Energy Laboratory at www.nrel.gov/publications.
Table 3. CSP tower projects with storage (source: CSP Today Global Tracker)
Project Country MWe Storage Capacity (hours)
Power Purchase
Agreement Price (PPA)
(¢/kWh)
Status Completion Date
Crescent Dunes
U.S. 110 10 13.7 Operation Q4 2015
Noor III Morocco 150 7.5 16.3 Construction Q4 2017
Redstone South Africa 100 12 12.5 (PPA to be
signed)
Development Q3 2018
DEWA CSP Project Phase I
United Arab Emirates
200 12 8.0 (targeted)
Planning Q2 2021
Copiapo Chile 240 14 6.3 (bid)
Planning TBA
3.2 The Value of CSP-TES The declining cost of photovoltaics has impacted CSP acceptance and deployment. Although CSP costs have also declined over the past decade, the pace of decline has not matched that of PV primarily due to limited deployment.3 However, the flexibility offered by CSP-TES is a key differentiator from variable renewables such as PV and wind. As described earlier, CSP-TES is highly dispatchable and generally less variable in output than traditional solar PV due to the presence of storage and thermal inertia [2]. Because of the ability to inexpensively integrate storage, CSP-TES offers considerable benefits to regional grids by supporting both the system operators and load-serving entities.
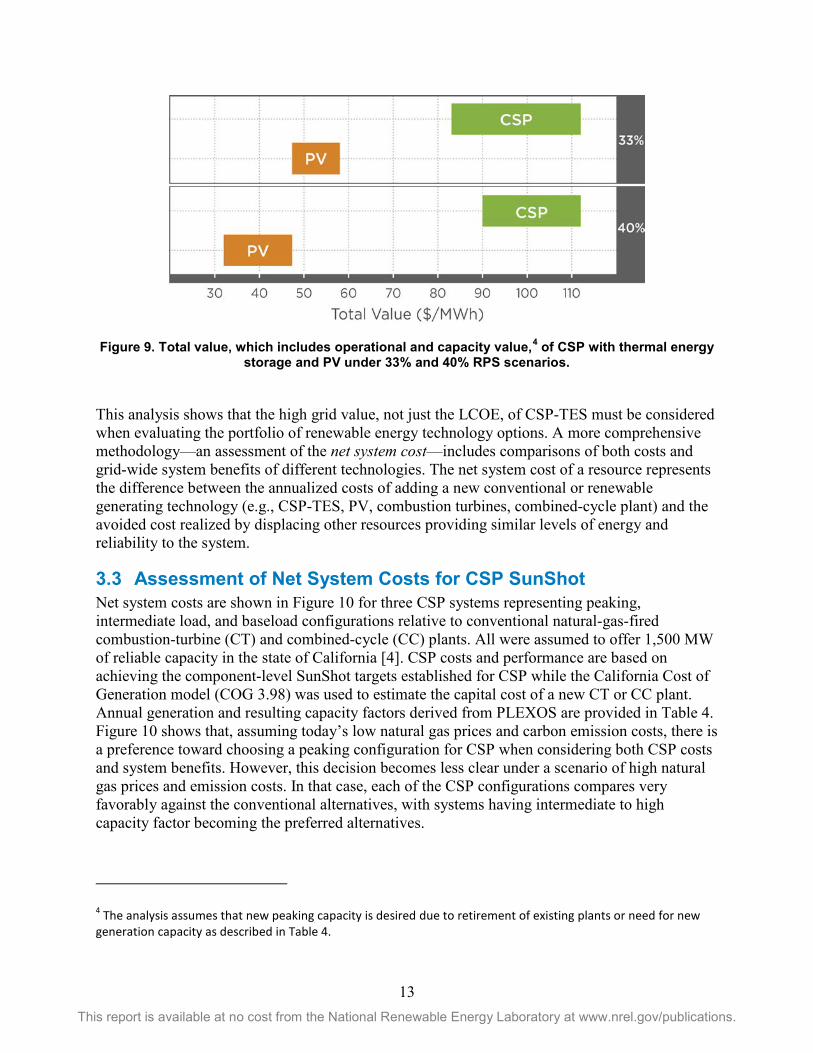
A recent NREL study compared the combined operational and capacity benefits of CSP with TES relative to PV under varying levels of renewable penetration in California [3]. The overall system benefit was derived using PLEXOS, a commercially available production cost-modeling software package used by grid planners to assess, among other aspects, the operational costs of power generation on a regional system. The analysis found that a peaking CSP plant, compared to variable-generation PV, demonstrated an increase in value of up to 6 ¢/kWh under a 40% RPS, as shown in Figure 9.
3 The challenge of financing large capital projects during much of the past decade, the modularity of PV which allows blocks of capacity to be deployed quickly, and limitations on where CSP can be deployed, i.e., large, transmission-connected land parcels in high-DNI desert climates, has resulted in a slower rate of deployment, and consequently slower pace of cost reduction, than PV.
13 This report is available at no cost from the National Renewable Energy Laboratory at www.nrel.gov/publications.
Figure 9. Total value, which includes operational and capacity value,4 of CSP with thermal energy storage and PV under 33% and 40% RPS scenarios.
This analysis shows that the high grid value, not just the LCOE, of CSP-TES must be considered when evaluating the portfolio of renewable energy technology options. A more comprehensive methodology—an assessment of the net system cost—includes comparisons of both costs and grid-wide system benefits of different technologies. The net system cost of a resource represents the difference between the annualized costs of adding a new conventional or renewable generating technology (e.g., CSP-TES, PV, combustion turbines, combined-cycle plant) and the avoided cost realized by displacing other resources providing similar levels of energy and reliability to the system.
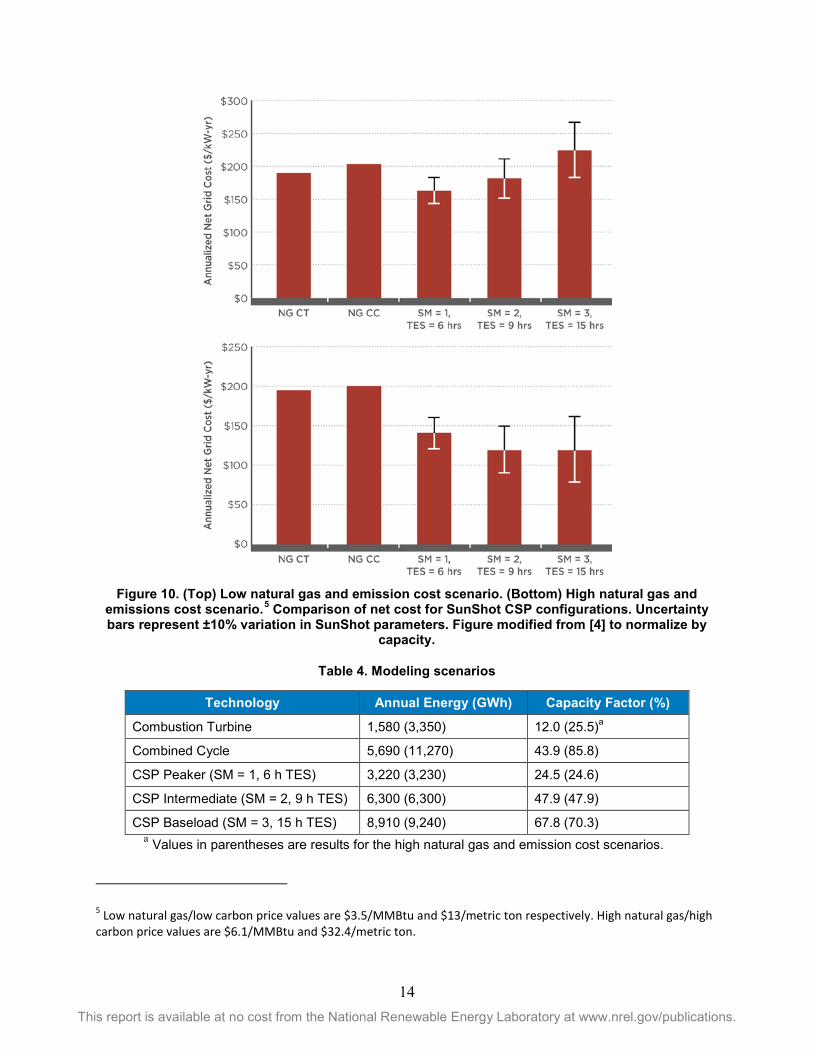
3.3 Assessment of Net System Costs for CSP SunShot Net system costs are shown in Figure 10 for three CSP systems representing peaking, intermediate load, and baseload configurations relative to conventional natural-gas-fired combustion-turbine (CT) and combined-cycle (CC) plants. All were assumed to offer 1,500 MW of reliable capacity in the state of California [4]. CSP costs and performance are based on achieving the component-level SunShot targets established for CSP while the California Cost of Generation model (COG 3.98) was used to estimate the capital cost of a new CT or CC plant. Annual generation and resulting capacity factors derived from PLEXOS are provided in Table 4. Figure 10 shows that, assuming today’s low natural gas prices and carbon emission costs, there is a preference toward choosing a peaking configuration for CSP when considering both CSP costs and system benefits. However, this decision becomes less clear under a scenario of high natural gas prices and emission costs. In that case, each of the CSP configurations compares very favorably against the conventional alternatives, with systems having intermediate to high capacity factor becoming the preferred alternatives.
4 The analysis assumes that new peaking capacity is desired due to retirement of existing plants or need for new generation capacity as described in Table 4.
14 This report is available at no cost from the National Renewable Energy Laboratory at www.nrel.gov/publications.
Figure 10. (Top) Low natural gas and emission cost scenario. (Bottom) High natural gas and
emissions cost scenario.5 Comparison of net cost for SunShot CSP configurations. Uncertainty bars represent ±10% variation in SunShot parameters. Figure modified from [4] to normalize by
capacity.
Table 4. Modeling scenarios
a Values in parentheses are results for the high natural gas and emission cost scenarios.
5 Low natural gas/low carbon price values are $3.5/MMBtu and $13/metric ton respectively. High natural gas/high carbon price values are $6.1/MMBtu and $32.4/metric ton.
Technology Annual Energy (GWh) Capacity Factor (%)
Combustion Turbine 1,580 (3,350) 12.0 (25.5)a
Combined Cycle 5,690 (11,270) 43.9 (85.8)
CSP Peaker (SM = 1, 6 h TES) 3,220 (3,230) 24.5 (24.6)
CSP Intermediate (SM = 2, 9 h TES) 6,300 (6,300) 47.9 (47.9)
CSP Baseload (SM = 3, 15 h TES) 8,910 (9,240) 67.8 (70.3)
15 This report is available at no cost from the National Renewable Energy Laboratory at www.nrel.gov/publications.
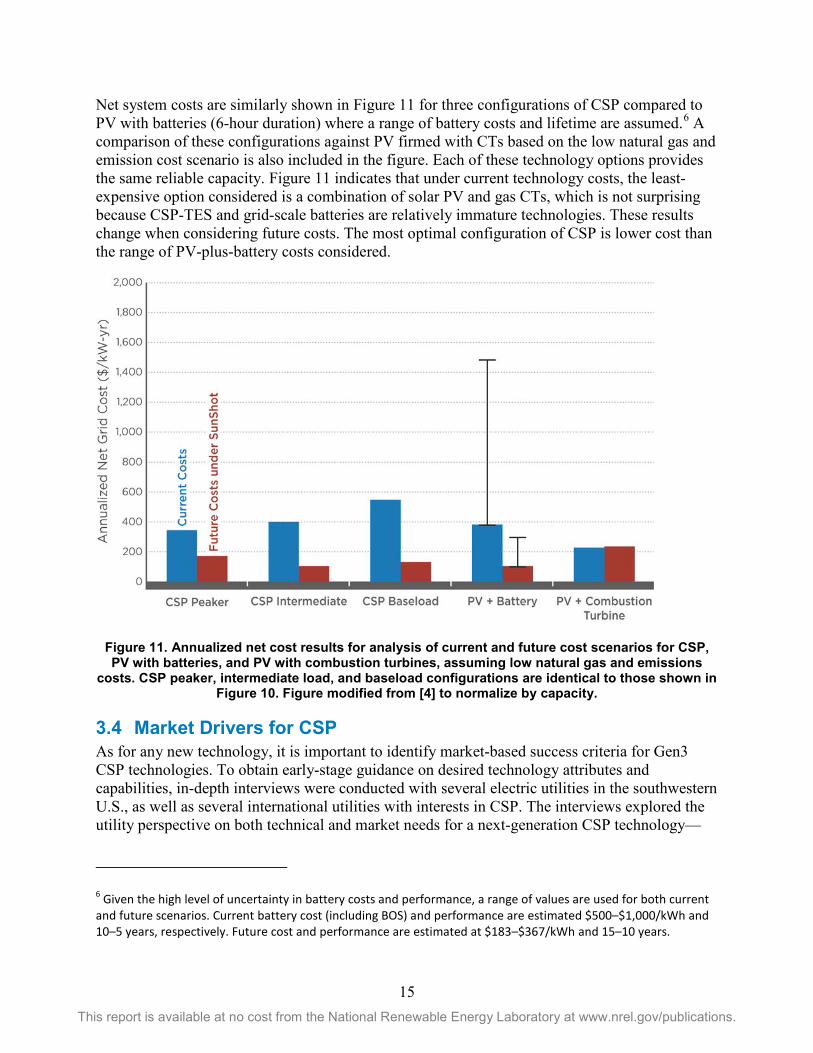
Net system costs are similarly shown in Figure 11 for three configurations of CSP compared to PV with batteries (6-hour duration) where a range of battery costs and lifetime are assumed.6 A comparison of these configurations against PV firmed with CTs based on the low natural gas and emission cost scenario is also included in the figure. Each of these technology options provides the same reliable capacity. Figure 11 indicates that under current technology costs, the least-expensive option considered is a combination of solar PV and gas CTs, which is not surprising because CSP-TES and grid-scale batteries are relatively immature technologies. These results change when considering future costs. The most optimal configuration of CSP is lower cost than the range of PV-plus-battery costs considered.
Figure 11. Annualized net cost results for analysis of current and future cost scenarios for CSP, PV with batteries, and PV with combustion turbines, assuming low natural gas and emissions
costs. CSP peaker, intermediate load, and baseload configurations are identical to those shown in Figure 10. Figure modified from [4] to normalize by capacity.
3.4 Market Drivers for CSP As for any new technology, it is important to identify market-based success criteria for Gen3 CSP technologies. To obtain early-stage guidance on desired technology attributes and capabilities, in-depth interviews were conducted with several electric utilities in the southwestern U.S., as well as several international utilities with interests in CSP. The interviews explored the utility perspective on both technical and market needs for a next-generation CSP technology—
6 Given the high level of uncertainty in battery costs and performance, a range of values are used for both current and future scenarios. Current battery cost (including BOS) and performance are estimated $500–$1,000/kWh and 10–5 years, respectively. Future cost and performance are estimated at $183–$367/kWh and 15–10 years.
16 This report is available at no cost from the National Renewable Energy Laboratory at www.nrel.gov/publications.
such as technology attributes that would ensure market relevancy, technology and performance gaps, and methods for valuing flexible resources.
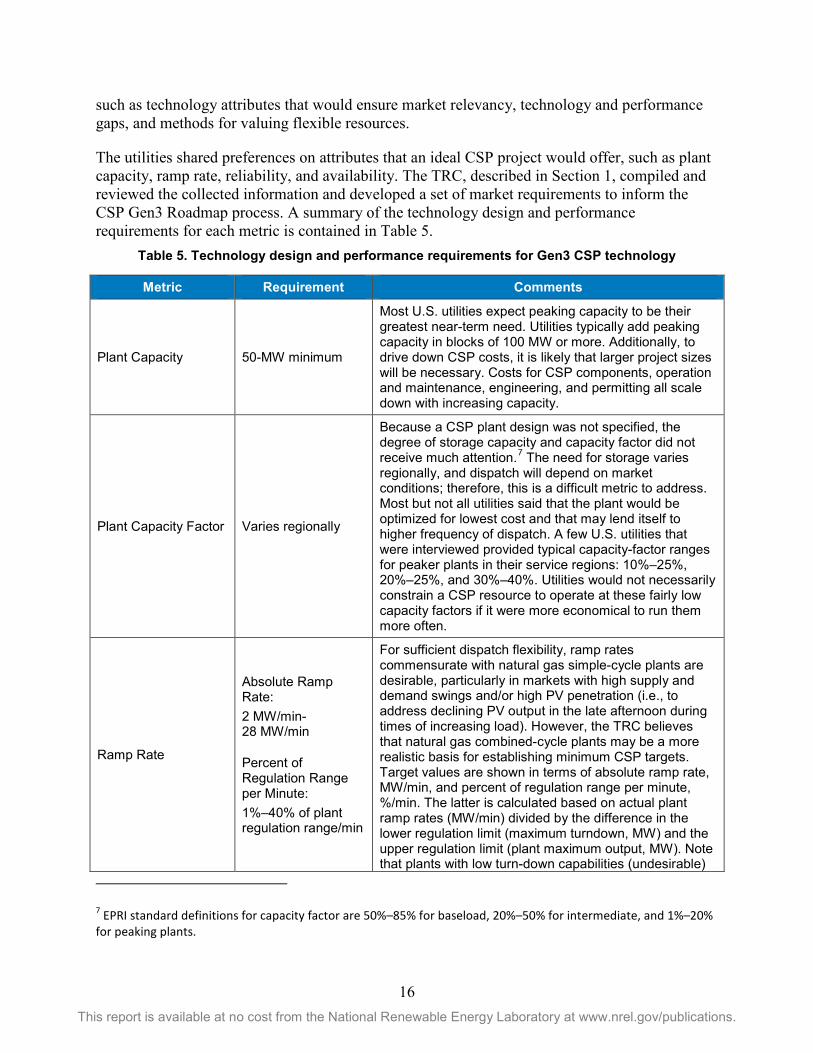
The utilities shared preferences on attributes that an ideal CSP project would offer, such as plant capacity, ramp rate, reliability, and availability. The TRC, described in Section 1, compiled and reviewed the collected information and developed a set of market requirements to inform the CSP Gen3 Roadmap process. A summary of the technology design and performance requirements for each metric is contained in Table 5.
Table 5. Technology design and performance requirements for Gen3 CSP technology
7 EPRI standard definitions for capacity factor are 50%–85% for baseload, 20%–50% for intermediate, and 1%–20% for peaking plants.
Metric Requirement Comments
Plant Capacity 50-MW minimum
Most U.S. utilities expect peaking capacity to be their greatest near-term need. Utilities typically add peaking capacity in blocks of 100 MW or more. Additionally, to drive down CSP costs, it is likely that larger project sizes will be necessary. Costs for CSP components, operation and maintenance, engineering, and permitting all scale down with increasing capacity.
Plant Capacity Factor Varies regionally
Because a CSP plant design was not specified, the degree of storage capacity and capacity factor did not receive much attention.7 The need for storage varies regionally, and dispatch will depend on market conditions; therefore, this is a difficult metric to address. Most but not all utilities said that the plant would be optimized for lowest cost and that may lend itself to higher frequency of dispatch. A few U.S. utilities that were interviewed provided typical capacity-factor ranges for peaker plants in their service regions: 10%–25%, 20%–25%, and 30%–40%. Utilities would not necessarily constrain a CSP resource to operate at these fairly low capacity factors if it were more economical to run them more often.
Ramp Rate
Absolute Ramp Rate: 2 MW/min-28 MW/min
Percent of Regulation Range per Minute: 1%–40% of plant regulation range/min
For sufficient dispatch flexibility, ramp rates commensurate with natural gas simple-cycle plants are desirable, particularly in markets with high supply and demand swings and/or high PV penetration (i.e., to address declining PV output in the late afternoon during times of increasing load). However, the TRC believes that natural gas combined-cycle plants may be a more realistic basis for establishing minimum CSP targets. Target values are shown in terms of absolute ramp rate, MW/min, and percent of regulation range per minute, %/min. The latter is calculated based on actual plant ramp rates (MW/min) divided by the difference in the lower regulation limit (maximum turndown, MW) and the upper regulation limit (plant maximum output, MW). Note that plants with low turn-down capabilities (undesirable)
17 This report is available at no cost from the National Renewable Energy Laboratory at www.nrel.gov/publications.
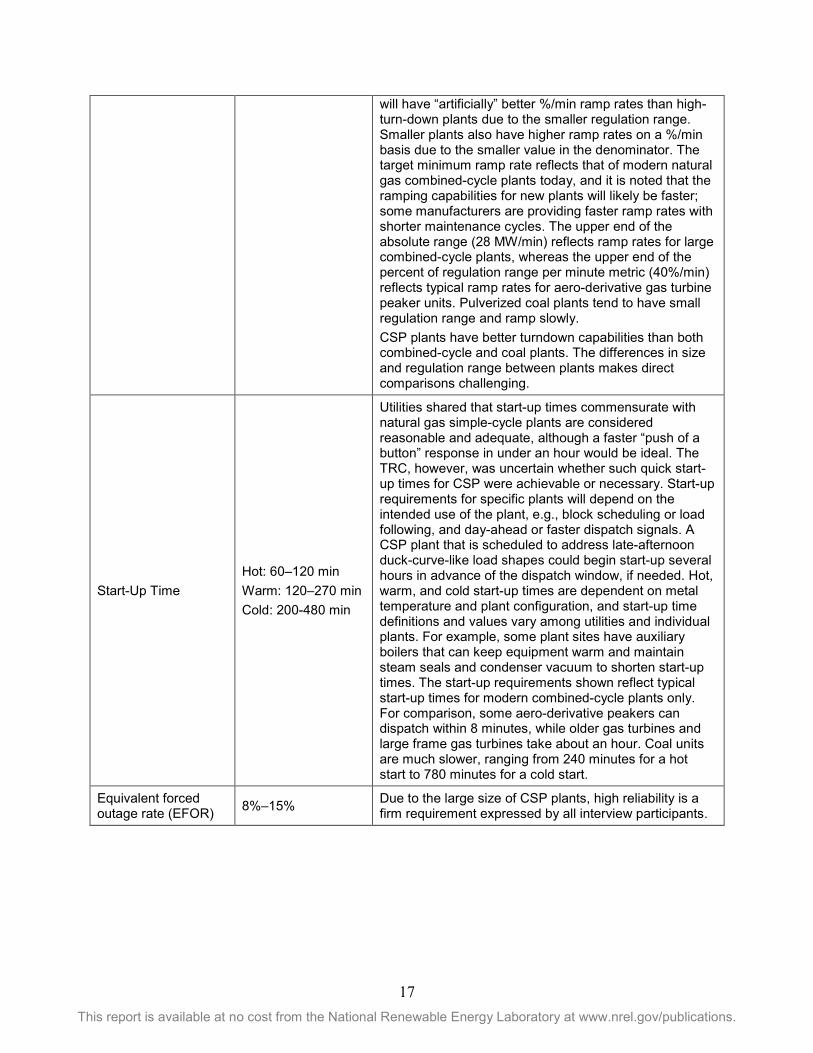
will have “artificially” better %/min ramp rates than high-turn-down plants due to the smaller regulation range. Smaller plants also have higher ramp rates on a %/min basis due to the smaller value in the denominator. The target minimum ramp rate reflects that of modern natural gas combined-cycle plants today, and it is noted that the ramping capabilities for new plants will likely be faster; some manufacturers are providing faster ramp rates with shorter maintenance cycles. The upper end of the absolute range (28 MW/min) reflects ramp rates for large combined-cycle plants, whereas the upper end of the percent of regulation range per minute metric (40%/min) reflects typical ramp rates for aero-derivative gas turbine peaker units. Pulverized coal plants tend to have small regulation range and ramp slowly. CSP plants have better turndown capabilities than both combined-cycle and coal plants. The differences in size and regulation range between plants makes direct comparisons challenging.
Start-Up Time Hot: 60–120 min Warm: 120–270 min Cold: 200-480 min
Utilities shared that start-up times commensurate with natural gas simple-cycle plants are considered reasonable and adequate, although a faster “push of a button” response in under an hour would be ideal. The TRC, however, was uncertain whether such quick start-up times for CSP were achievable or necessary. Start-up requirements for specific plants will depend on the intended use of the plant, e.g., block scheduling or load following, and day-ahead or faster dispatch signals. A CSP plant that is scheduled to address late-afternoon duck-curve-like load shapes could begin start-up several hours in advance of the dispatch window, if needed. Hot, warm, and cold start-up times are dependent on metal temperature and plant configuration, and start-up time definitions and values vary among utilities and individual plants. For example, some plant sites have auxiliary boilers that can keep equipment warm and maintain steam seals and condenser vacuum to shorten start-up times. The start-up requirements shown reflect typical start-up times for modern combined-cycle plants only. For comparison, some aero-derivative peakers can dispatch within 8 minutes, while older gas turbines and large frame gas turbines take about an hour. Coal units are much slower, ranging from 240 minutes for a hot start to 780 minutes for a cold start.
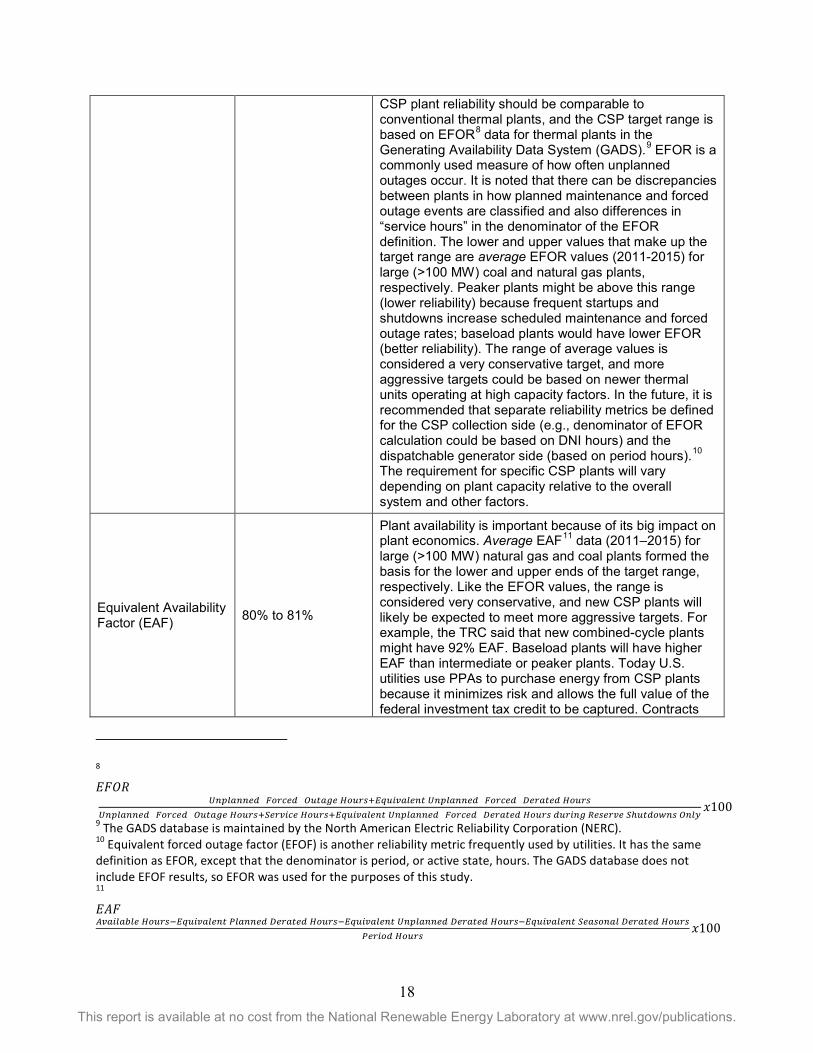
Equivalent forced outage rate (EFOR) 8%–15% Due to the large size of CSP plants, high reliability is a
firm requirement expressed by all interview participants.
18 This report is available at no cost from the National Renewable Energy Laboratory at www.nrel.gov/publications.
8 𝐸𝐸𝐸𝐸𝐸𝐸𝐸𝐸 = 𝑈𝑈𝑈𝑈𝑈𝑈𝑈𝑈𝑈𝑈𝑈𝑈𝑈𝑈𝑈𝑈𝑈𝑈 (𝐹𝐹𝐹𝐹𝐹𝐹𝐹𝐹𝑈𝑈𝑈𝑈) 𝑂𝑂𝑂𝑂𝑂𝑂𝑈𝑈𝑂𝑂𝑈𝑈 𝐻𝐻𝐹𝐹𝑂𝑂𝐹𝐹𝑠𝑠+𝐸𝐸𝐸𝐸𝑂𝑂𝐸𝐸𝐸𝐸𝑈𝑈𝑈𝑈𝑈𝑈𝑈𝑈𝑂𝑂 𝑈𝑈𝑈𝑈𝑈𝑈𝑈𝑈𝑈𝑈𝑈𝑈𝑈𝑈𝑈𝑈𝑈𝑈 (𝐹𝐹𝐹𝐹𝐹𝐹𝐹𝐹𝑈𝑈𝑈𝑈) 𝐷𝐷𝑈𝑈𝐹𝐹𝑈𝑈𝑂𝑂𝑈𝑈𝑈𝑈 𝐻𝐻𝐹𝐹𝑂𝑂𝐹𝐹𝑠𝑠𝑈𝑈𝑈𝑈𝑈𝑈𝑈𝑈𝑈𝑈𝑈𝑈𝑈𝑈𝑈𝑈𝑈𝑈 (𝐹𝐹𝐹𝐹𝐹𝐹𝐹𝐹𝑈𝑈𝑈𝑈) 𝑂𝑂𝑂𝑂𝑂𝑂𝑈𝑈𝑂𝑂𝑈𝑈 𝐻𝐻𝐹𝐹𝑂𝑂𝐹𝐹𝑠𝑠+𝑆𝑆𝑈𝑈𝐹𝐹𝐸𝐸𝐸𝐸𝐹𝐹𝑈𝑈 𝐻𝐻𝐹𝐹𝑂𝑂𝐹𝐹𝑠𝑠+𝐸𝐸𝐸𝐸𝑂𝑂𝐸𝐸𝐸𝐸𝑈𝑈𝑈𝑈𝑈𝑈𝑈𝑈𝑂𝑂 𝑈𝑈𝑈𝑈𝑈𝑈𝑈𝑈𝑈𝑈𝑈𝑈𝑈𝑈𝑈𝑈𝑈𝑈 (𝐹𝐹𝐹𝐹𝐹𝐹𝐹𝐹𝑈𝑈𝑈𝑈) 𝐷𝐷𝑈𝑈𝐹𝐹𝑈𝑈𝑂𝑂𝑈𝑈𝑈𝑈 𝐻𝐻𝐹𝐹𝑂𝑂𝐹𝐹𝑠𝑠 𝑈𝑈𝑂𝑂𝐹𝐹𝐸𝐸𝑈𝑈𝑂𝑂 𝑅𝑅𝑈𝑈𝑠𝑠𝑈𝑈𝐹𝐹𝐸𝐸𝑈𝑈 𝑆𝑆ℎ𝑂𝑂𝑂𝑂𝑈𝑈𝐹𝐹𝑢𝑢𝑈𝑈𝑠𝑠 𝑂𝑂𝑈𝑈𝑈𝑈𝑂𝑂
𝑥𝑥100 9 The GADS database is maintained by the North American Electric Reliability Corporation (NERC). 10 Equivalent forced outage factor (EFOF) is another reliability metric frequently used by utilities. It has the same definition as EFOR, except that the denominator is period, or active state, hours. The GADS database does not include EFOF results, so EFOR was used for the purposes of this study. 11 𝐸𝐸𝐸𝐸𝐸𝐸 =𝐴𝐴𝐸𝐸𝑈𝑈𝐸𝐸𝑈𝑈𝑈𝑈𝐴𝐴𝑈𝑈𝑈𝑈 𝐻𝐻𝐹𝐹𝑂𝑂𝐹𝐹𝑠𝑠−𝐸𝐸𝐸𝐸𝑂𝑂𝐸𝐸𝐸𝐸𝑈𝑈𝑈𝑈𝑈𝑈𝑈𝑈𝑂𝑂 𝑃𝑃𝑈𝑈𝑈𝑈𝑈𝑈𝑈𝑈𝑈𝑈𝑈𝑈 𝐷𝐷𝑈𝑈𝐹𝐹𝑈𝑈𝑂𝑂𝑈𝑈𝑈𝑈 𝐻𝐻𝐹𝐹𝑂𝑂𝐹𝐹𝑠𝑠−𝐸𝐸𝐸𝐸𝑂𝑂𝐸𝐸𝐸𝐸𝑈𝑈𝑈𝑈𝑈𝑈𝑈𝑈𝑂𝑂 𝑈𝑈𝑈𝑈𝑈𝑈𝑈𝑈𝑈𝑈𝑈𝑈𝑈𝑈𝑈𝑈𝑈𝑈 𝐷𝐷𝑈𝑈𝐹𝐹𝑈𝑈𝑂𝑂𝑈𝑈𝑈𝑈 𝐻𝐻𝐹𝐹𝑂𝑂𝐹𝐹𝑠𝑠−𝐸𝐸𝐸𝐸𝑂𝑂𝐸𝐸𝐸𝐸𝑈𝑈𝑈𝑈𝑈𝑈𝑈𝑈𝑂𝑂 𝑆𝑆𝑈𝑈𝑈𝑈𝑠𝑠𝐹𝐹𝑈𝑈𝑈𝑈𝑈𝑈 𝐷𝐷𝑈𝑈𝐹𝐹𝑈𝑈𝑂𝑂𝑈𝑈𝑈𝑈 𝐻𝐻𝐹𝐹𝑂𝑂𝐹𝐹𝑠𝑠
𝑃𝑃𝑈𝑈𝐹𝐹𝐸𝐸𝐹𝐹𝑈𝑈 𝐻𝐻𝐹𝐹𝑂𝑂𝐹𝐹𝑠𝑠𝑥𝑥100
CSP plant reliability should be comparable to conventional thermal plants, and the CSP target range is based on EFOR8 data for thermal plants in the Generating Availability Data System (GADS).9 EFOR is a commonly used measure of how often unplanned outages occur. It is noted that there can be discrepancies between plants in how planned maintenance and forced outage events are classified and also differences in “service hours” in the denominator of the EFOR definition. The lower and upper values that make up the target range are average EFOR values (2011-2015) for large (>100 MW) coal and natural gas plants, respectively. Peaker plants might be above this range (lower reliability) because frequent startups and shutdowns increase scheduled maintenance and forced outage rates; baseload plants would have lower EFOR (better reliability). The range of average values is considered a very conservative target, and more aggressive targets could be based on newer thermal units operating at high capacity factors. In the future, it is recommended that separate reliability metrics be defined for the CSP collection side (e.g., denominator of EFOR calculation could be based on DNI hours) and the dispatchable generator side (based on period hours).10 The requirement for specific CSP plants will vary depending on plant capacity relative to the overall system and other factors.
Equivalent Availability Factor (EAF) 80% to 81%
Plant availability is important because of its big impact on plant economics. Average EAF11 data (2011–2015) for large (>100 MW) natural gas and coal plants formed the basis for the lower and upper ends of the target range, respectively. Like the EFOR values, the range is considered very conservative, and new CSP plants will likely be expected to meet more aggressive targets. For example, the TRC said that new combined-cycle plants might have 92% EAF. Baseload plants will have higher EAF than intermediate or peaker plants. Today U.S. utilities use PPAs to purchase energy from CSP plants because it minimizes risk and allows the full value of the federal investment tax credit to be captured. Contracts
19 This report is available at no cost from the National Renewable Energy Laboratory at www.nrel.gov/publications.
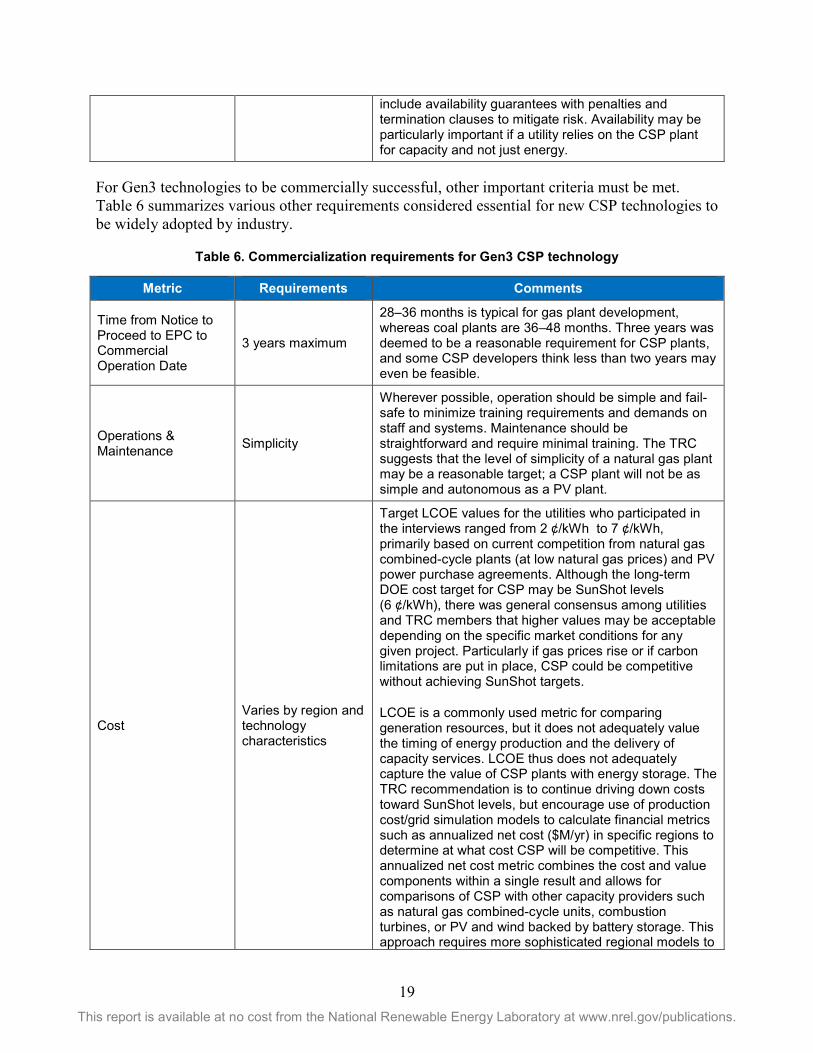
For Gen3 technologies to be commercially successful, other important criteria must be met. Table 6 summarizes various other requirements considered essential for new CSP technologies to be widely adopted by industry.
Table 6. Commercialization requirements for Gen3 CSP technology
include availability guarantees with penalties and termination clauses to mitigate risk. Availability may be particularly important if a utility relies on the CSP plant for capacity and not just energy.
Metric Requirements Comments
Time from Notice to Proceed to EPC to Commercial Operation Date
3 years maximum
28–36 months is typical for gas plant development, whereas coal plants are 36–48 months. Three years was deemed to be a reasonable requirement for CSP plants, and some CSP developers think less than two years may even be feasible.
Operations & Maintenance Simplicity
Wherever possible, operation should be simple and fail-safe to minimize training requirements and demands on staff and systems. Maintenance should be straightforward and require minimal training. The TRC suggests that the level of simplicity of a natural gas plant may be a reasonable target; a CSP plant will not be as simple and autonomous as a PV plant.
Cost Varies by region and technology characteristics
Target LCOE values for the utilities who participated in the interviews ranged from 2 ¢/kWh to 7 ¢/kWh, primarily based on current competition from natural gas combined-cycle plants (at low natural gas prices) and PV power purchase agreements. Although the long-term DOE cost target for CSP may be SunShot levels (6 ¢/kWh), there was general consensus among utilities and TRC members that higher values may be acceptable depending on the specific market conditions for any given project. Particularly if gas prices rise or if carbon limitations are put in place, CSP could be competitive without achieving SunShot targets.
LCOE is a commonly used metric for comparing generation resources, but it does not adequately value the timing of energy production and the delivery of capacity services. LCOE thus does not adequately capture the value of CSP plants with energy storage. The TRC recommendation is to continue driving down costs toward SunShot levels, but encourage use of production cost/grid simulation models to calculate financial metrics such as annualized net cost ($M/yr) in specific regions to determine at what cost CSP will be competitive. This annualized net cost metric combines the cost and value components within a single result and allows for comparisons of CSP with other capacity providers such as natural gas combined-cycle units, combustion turbines, or PV and wind backed by battery storage. This approach requires more sophisticated regional models to
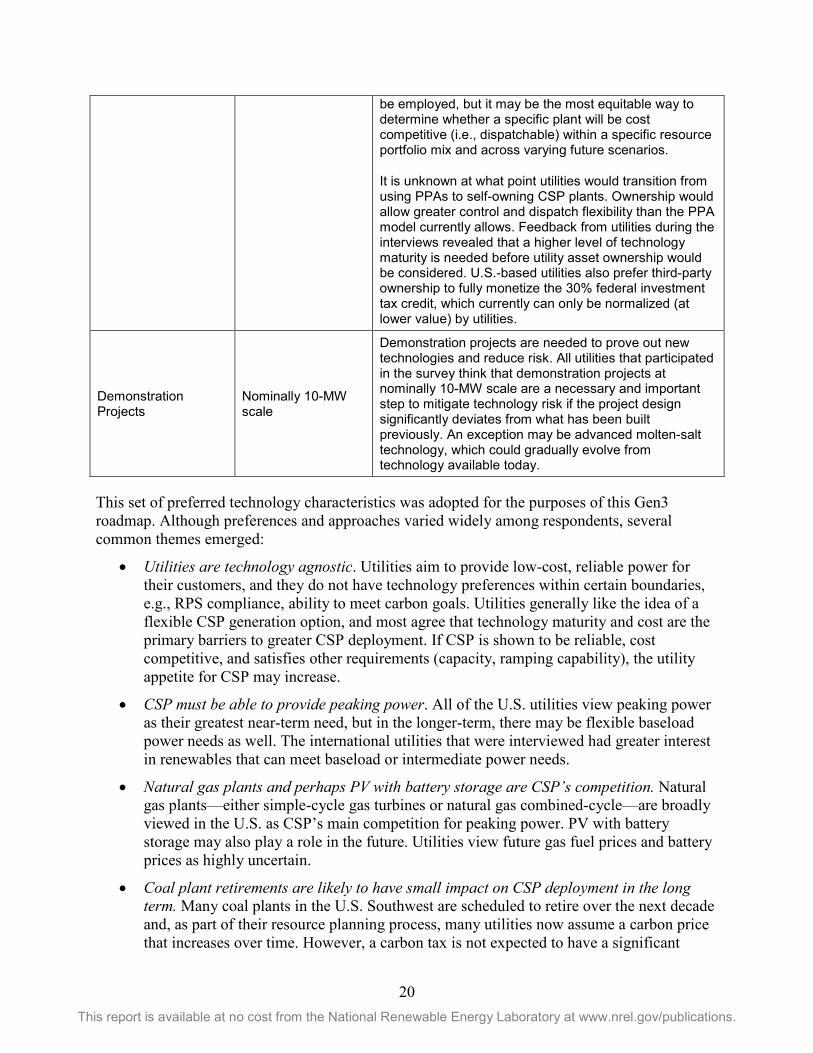
20 This report is available at no cost from the National Renewable Energy Laboratory at www.nrel.gov/publications.
This set of preferred technology characteristics was adopted for the purposes of this Gen3 roadmap. Although preferences and approaches varied widely among respondents, several common themes emerged:
• Utilities are technology agnostic. Utilities aim to provide low-cost, reliable power for their customers, and they do not have technology preferences within certain boundaries, e.g., RPS compliance, ability to meet carbon goals. Utilities generally like the idea of a flexible CSP generation option, and most agree that technology maturity and cost are the primary barriers to greater CSP deployment. If CSP is shown to be reliable, cost competitive, and satisfies other requirements (capacity, ramping capability), the utility appetite for CSP may increase.
• CSP must be able to provide peaking power. All of the U.S. utilities view peaking power as their greatest near-term need, but in the longer-term, there may be flexible baseload power needs as well. The international utilities that were interviewed had greater interest in renewables that can meet baseload or intermediate power needs.
• Natural gas plants and perhaps PV with battery storage are CSP’s competition. Natural gas plants—either simple-cycle gas turbines or natural gas combined-cycle—are broadly viewed in the U.S. as CSP’s main competition for peaking power. PV with battery storage may also play a role in the future. Utilities view future gas fuel prices and battery prices as highly uncertain.
• Coal plant retirements are likely to have small impact on CSP deployment in the long term. Many coal plants in the U.S. Southwest are scheduled to retire over the next decade and, as part of their resource planning process, many utilities now assume a carbon price that increases over time. However, a carbon tax is not expected to have a significant
be employed, but it may be the most equitable way to determine whether a specific plant will be cost competitive (i.e., dispatchable) within a specific resource portfolio mix and across varying future scenarios.
It is unknown at what point utilities would transition from using PPAs to self-owning CSP plants. Ownership would allow greater control and dispatch flexibility than the PPA model currently allows. Feedback from utilities during the interviews revealed that a higher level of technology maturity is needed before utility asset ownership would be considered. U.S.-based utilities also prefer third-party ownership to fully monetize the 30% federal investment tax credit, which currently can only be normalized (at lower value) by utilities.
Demonstration Projects
Nominally 10-MW scale
Demonstration projects are needed to prove out new technologies and reduce risk. All utilities that participated in the survey think that demonstration projects at nominally 10-MW scale are a necessary and important step to mitigate technology risk if the project design significantly deviates from what has been built previously. An exception may be advanced molten-salt technology, which could gradually evolve from technology available today.
21 This report is available at no cost from the National Renewable Energy Laboratory at www.nrel.gov/publications.
impact on CSP’s competitiveness in the near term. If baseload needs increase over the longer term, there may be an opportunity for CSP.
• Next-generation CSP must be flexible. All utility respondents stressed the importance of flexibility. There is a desire for future CSP plants to have greater operational flexibility than currently operating CSP plants, which typically follow predictable patterns. Particularly in markets with “duck curve” load behavior,12 the ability of CSP to decouple the collection of energy from the production of electricity will be an important attribute.
• Transmission is a barrier for CSP. Due to the large land requirements for CSP and the need to locate plants in high direct-normal irradiance regions, transmission can be a limiting factor in siting new projects, similar to large-scale PV and wind. If project developers are required to build new transmission and cover the costs under the project, this will hurt CSP technology competitiveness.
It was acknowledged that market drivers are expected to evolve as Gen3 CSP technologies are developed. The energy industry is in flux, and several potential circumstances could change the competitive landscape for CSP. Examples include the move toward decentralized grids, proliferation of rooftop PV, commercialization of low-cost batteries, emergence of carbon pricing and greenhouse gas limits, natural gas pricing, and success of energy efficiency and demand response efforts. The TRC recommends that market requirements be reassessed periodically throughout the development cycle of Gen3 CSP technologies.
12 The California ISO reports that the grid experiences supply swings of 1,000–1,500 MW over 10–15-minute periods. Ramps of over 13,000 MW are expected in the near future during the 3-hour late-afternoon window when photovoltaic power output declines.
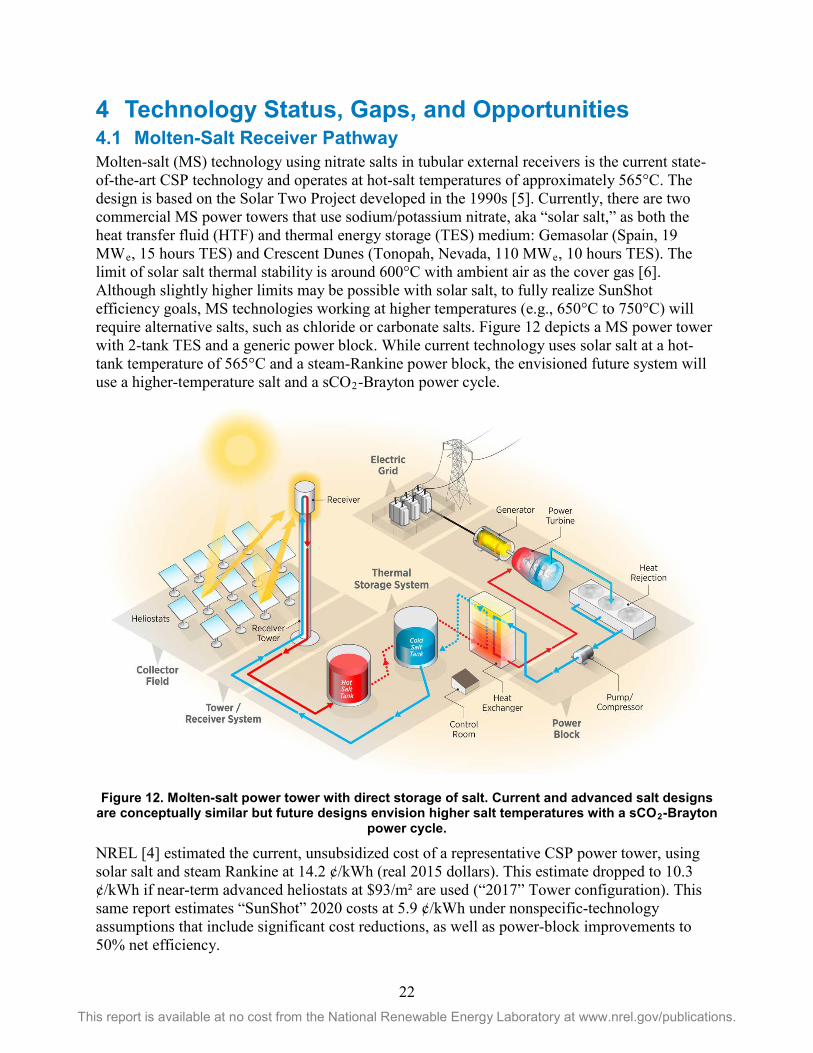
22 This report is available at no cost from the National Renewable Energy Laboratory at www.nrel.gov/publications.
4 Technology Status, Gaps, and Opportunities 4.1 Molten-Salt Receiver Pathway Molten-salt (MS) technology using nitrate salts in tubular external receivers is the current state-of-the-art CSP technology and operates at hot-salt temperatures of approximately 565°C. The design is based on the Solar Two Project developed in the 1990s [5]. Currently, there are two commercial MS power towers that use sodium/potassium nitrate, aka “solar salt,” as both the heat transfer fluid (HTF) and thermal energy storage (TES) medium: Gemasolar (Spain, 19 MWe, 15 hours TES) and Crescent Dunes (Tonopah, Nevada, 110 MWe, 10 hours TES). The limit of solar salt thermal stability is around 600°C with ambient air as the cover gas [6]. Although slightly higher limits may be possible with solar salt, to fully realize SunShot efficiency goals, MS technologies working at higher temperatures (e.g., 650°C to 750°C) will require alternative salts, such as chloride or carbonate salts. Figure 12 depicts a MS power tower with 2-tank TES and a generic power block. While current technology uses solar salt at a hot-tank temperature of 565°C and a steam-Rankine power block, the envisioned future system will use a higher-temperature salt and a sCO2-Brayton power cycle.
Figure 12. Molten-salt power tower with direct storage of salt. Current and advanced salt designs are conceptually similar but future designs envision higher salt temperatures with a sCO2-Brayton
power cycle.
NREL [4] estimated the current, unsubsidized cost of a representative CSP power tower, using solar salt and steam Rankine at 14.2 ¢/kWh (real 2015 dollars). This estimate dropped to 10.3 ¢/kWh if near-term advanced heliostats at $93/m² are used (“2017” Tower configuration). This same report estimates “SunShot” 2020 costs at 5.9 ¢/kWh under nonspecific-technology assumptions that include significant cost reductions, as well as power-block improvements to 50% net efficiency.
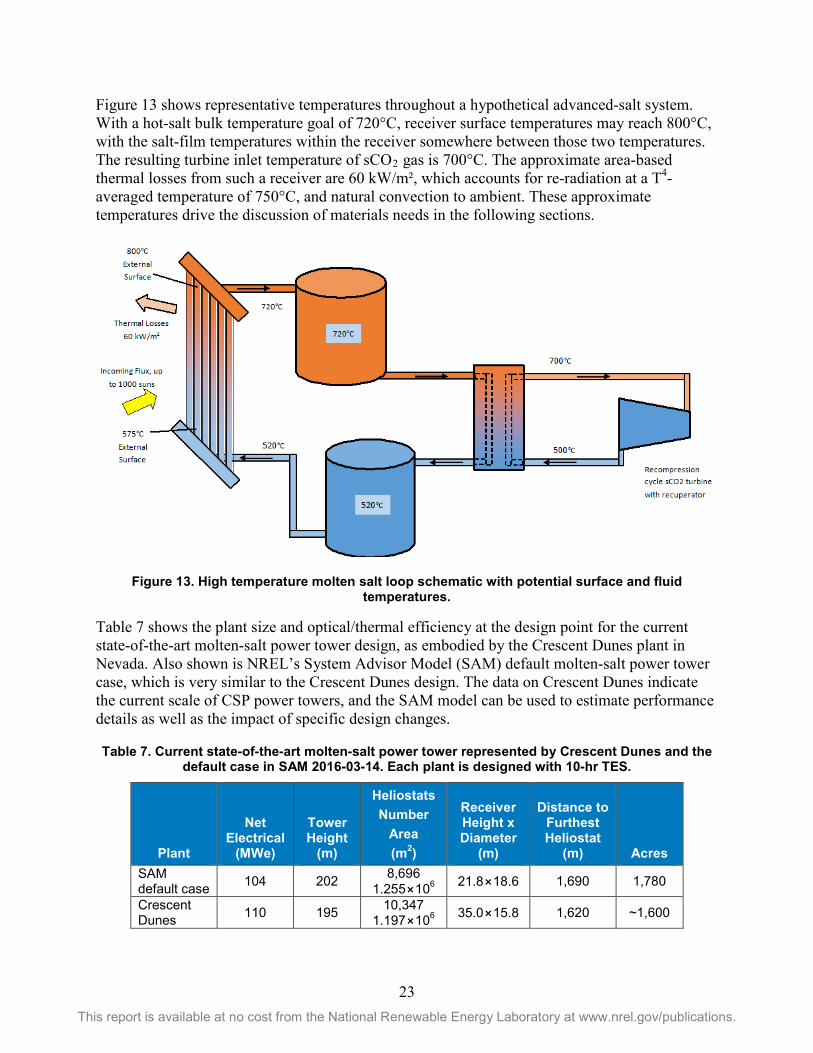
23 This report is available at no cost from the National Renewable Energy Laboratory at www.nrel.gov/publications.
Figure 13 shows representative temperatures throughout a hypothetical advanced-salt system. With a hot-salt bulk temperature goal of 720°C, receiver surface temperatures may reach 800°C, with the salt-film temperatures within the receiver somewhere between those two temperatures. The resulting turbine inlet temperature of sCO2 gas is 700°C. The approximate area-based thermal losses from such a receiver are 60 kW/m², which accounts for re-radiation at a T4-averaged temperature of 750°C, and natural convection to ambient. These approximate temperatures drive the discussion of materials needs in the following sections.
Figure 13. High temperature molten salt loop schematic with potential surface and fluid temperatures.
Table 7 shows the plant size and optical/thermal efficiency at the design point for the current state-of-the-art molten-salt power tower design, as embodied by the Crescent Dunes plant in Nevada. Also shown is NREL’s System Advisor Model (SAM) default molten-salt power tower case, which is very similar to the Crescent Dunes design. The data on Crescent Dunes indicate the current scale of CSP power towers, and the SAM model can be used to estimate performance details as well as the impact of specific design changes.
Table 7. Current state-of-the-art molten-salt power tower represented by Crescent Dunes and the default case in SAM 2016-03-14. Each plant is designed with 10-hr TES.
Plant
Net Electrical
(MWe)
Tower Height
(m)
Heliostats Number
Area (m2)
Receiver Height x Diameter
(m)
Distance to Furthest Heliostat
(m) Acres SAM default case 104 202 8,696
1.255⨯106 21.8⨯18.6 1,690 1,780
Crescent Dunes 110 195 10,347
1.197⨯106 35.0⨯15.8 1,620 ~1,600
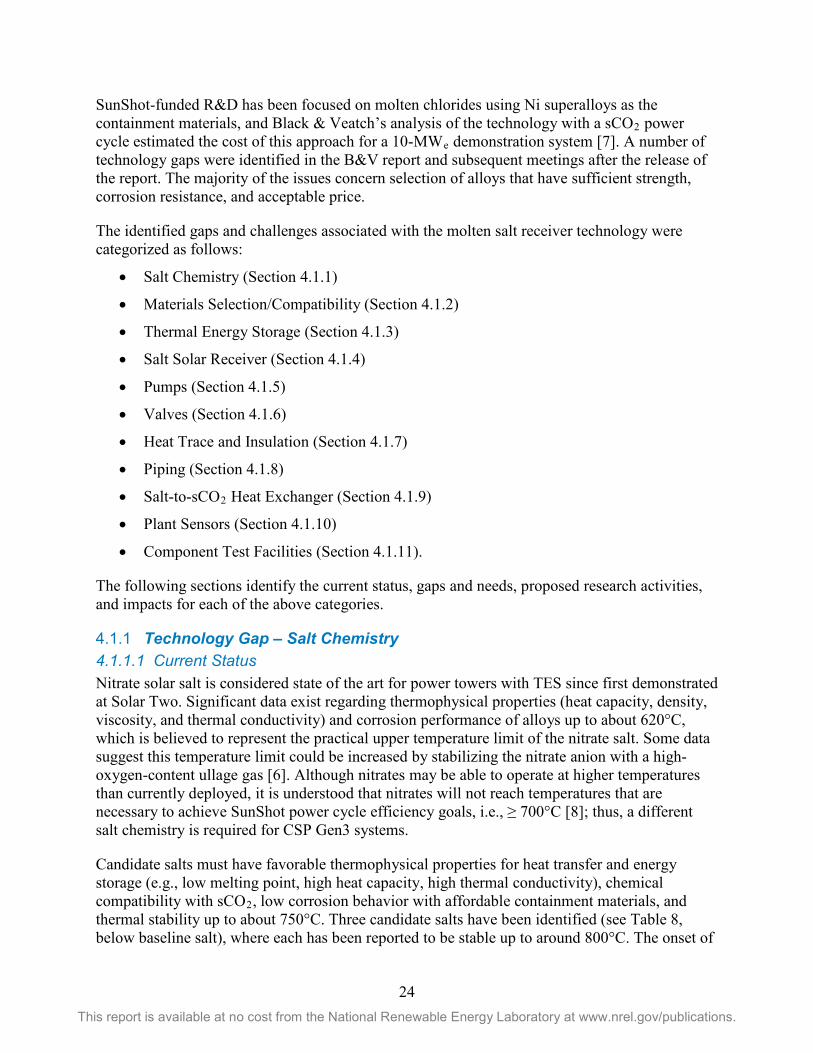
24 This report is available at no cost from the National Renewable Energy Laboratory at www.nrel.gov/publications.
SunShot-funded R&D has been focused on molten chlorides using Ni superalloys as the containment materials, and Black & Veatch’s analysis of the technology with a sCO2 power cycle estimated the cost of this approach for a 10-MWe demonstration system [7]. A number of technology gaps were identified in the B&V report and subsequent meetings after the release of the report. The majority of the issues concern selection of alloys that have sufficient strength, corrosion resistance, and acceptable price.
The identified gaps and challenges associated with the molten salt receiver technology were categorized as follows:
• Salt Chemistry (Section 4.1.1)
• Materials Selection/Compatibility (Section 4.1.2)
• Thermal Energy Storage (Section 4.1.3)
• Salt Solar Receiver (Section 4.1.4)
• Pumps (Section 4.1.5)
• Valves (Section 4.1.6)
• Heat Trace and Insulation (Section 4.1.7)
• Piping (Section 4.1.8)
• Salt-to-sCO2 Heat Exchanger (Section 4.1.9)
• Plant Sensors (Section 4.1.10)
• Component Test Facilities (Section 4.1.11).
The following sections identify the current status, gaps and needs, proposed research activities, and impacts for each of the above categories.
Technology Gap – Salt Chemistry 4.1.14.1.1.1 Current Status Nitrate solar salt is considered state of the art for power towers with TES since first demonstrated at Solar Two. Significant data exist regarding thermophysical properties (heat capacity, density, viscosity, and thermal conductivity) and corrosion performance of alloys up to about 620°C, which is believed to represent the practical upper temperature limit of the nitrate salt. Some data suggest this temperature limit could be increased by stabilizing the nitrate anion with a high-oxygen-content ullage gas [6]. Although nitrates may be able to operate at higher temperatures than currently deployed, it is understood that nitrates will not reach temperatures that are necessary to achieve SunShot power cycle efficiency goals, i.e., ≥ 700°C [8]; thus, a different salt chemistry is required for CSP Gen3 systems.
Candidate salts must have favorable thermophysical properties for heat transfer and energy storage (e.g., low melting point, high heat capacity, high thermal conductivity), chemical compatibility with sCO2, low corrosion behavior with affordable containment materials, and thermal stability up to about 750°C. Three candidate salts have been identified (see Table 8, below baseline salt), where each has been reported to be stable up to around 800°C. The onset of
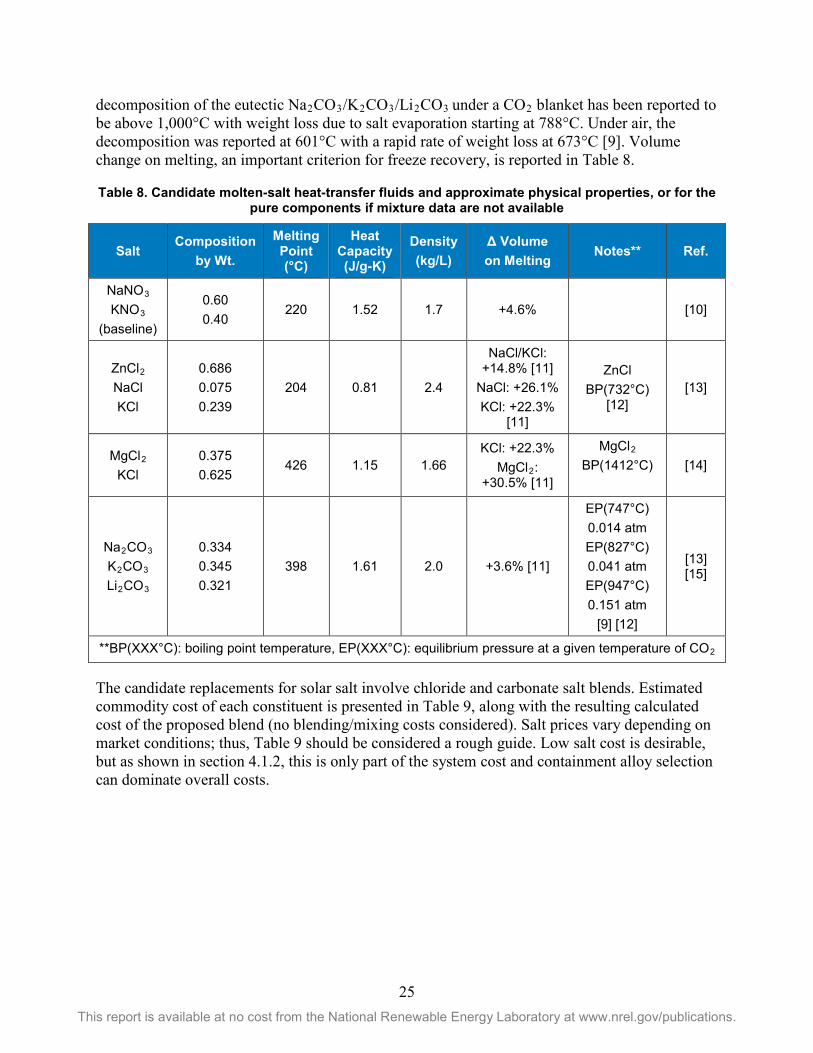
25 This report is available at no cost from the National Renewable Energy Laboratory at www.nrel.gov/publications.
decomposition of the eutectic Na2CO3/K2CO3/Li2CO3 under a CO2 blanket has been reported to be above 1,000°C with weight loss due to salt evaporation starting at 788°C. Under air, the decomposition was reported at 601°C with a rapid rate of weight loss at 673°C [9]. Volume change on melting, an important criterion for freeze recovery, is reported in Table 8.
Table 8. Candidate molten-salt heat-transfer fluids and approximate physical properties, or for the pure components if mixture data are not available
Salt Composition
by Wt.
Melting Point (°C)
Heat Capacity (J/g-K)
Density (kg/L)
Δ Volume on Melting
Notes** Ref.
NaNO3 KNO3
(baseline)
0.60 0.40
220 1.52 1.7 +4.6% [10]
ZnCl2 NaCl KCl
0.686 0.075 0.239
204 0.81 2.4
NaCl/KCl: +14.8% [11]
NaCl: +26.1% KCl: +22.3%
[11]
ZnCl BP(732°C)
[12] [13]
MgCl2 KCl
0.375 0.625
426 1.15 1.66 KCl: +22.3%
MgCl2: +30.5% [11]
MgCl2 BP(1412°C)
[14]
Na2CO3 K2CO3 Li2CO3
0.334 0.345 0.321
398 1.61 2.0 +3.6% [11]
EP(747°C) 0.014 atm EP(827°C) 0.041 atm EP(947°C) 0.151 atm
[9] [12]
[13] [15]
**BP(XXX°C): boiling point temperature, EP(XXX°C): equilibrium pressure at a given temperature of CO2
The candidate replacements for solar salt involve chloride and carbonate salt blends. Estimated commodity cost of each constituent is presented in Table 9, along with the resulting calculated cost of the proposed blend (no blending/mixing costs considered). Salt prices vary depending on market conditions; thus, Table 9 should be considered a rough guide. Low salt cost is desirable, but as shown in section 4.1.2, this is only part of the system cost and containment alloy selection can dominate overall costs.
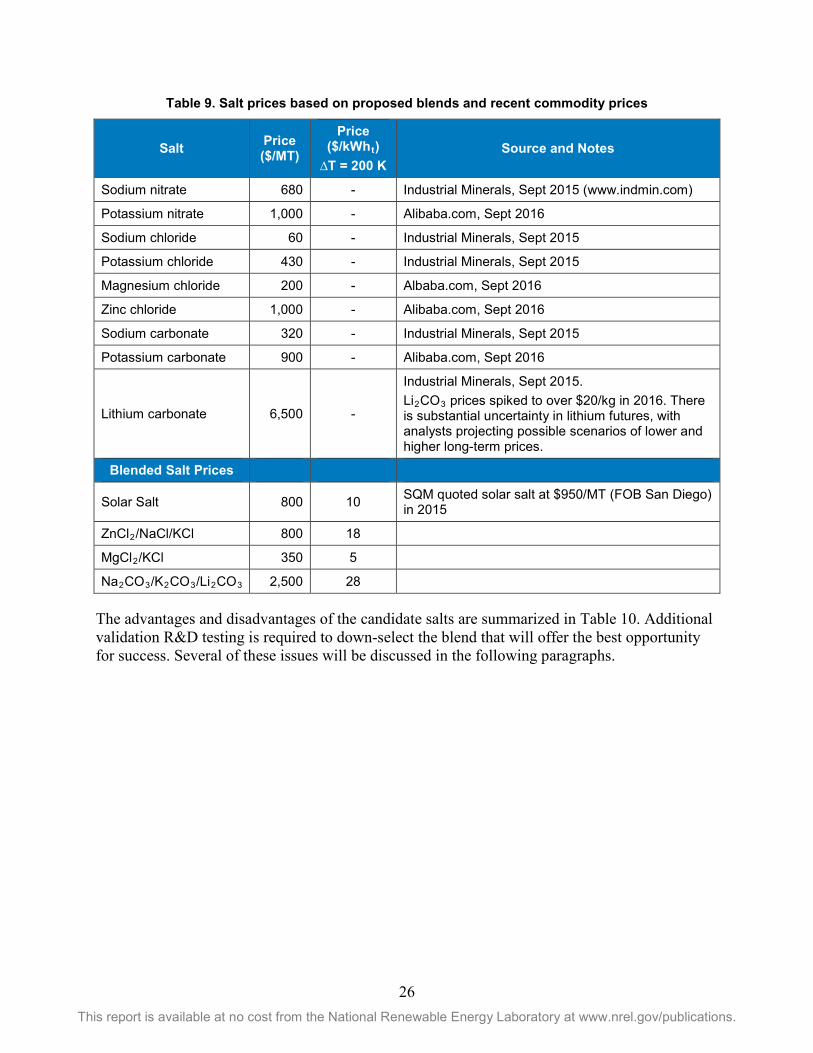
26 This report is available at no cost from the National Renewable Energy Laboratory at www.nrel.gov/publications.
Table 9. Salt prices based on proposed blends and recent commodity prices
Salt Price ($/MT)
Price ($/kWht)
∆T = 200 K Source and Notes
Sodium nitrate 680 - Industrial Minerals, Sept 2015 (www.indmin.com)
Potassium nitrate 1,000 - Alibaba.com, Sept 2016
Sodium chloride 60 - Industrial Minerals, Sept 2015
Potassium chloride 430 - Industrial Minerals, Sept 2015
Magnesium chloride 200 - Albaba.com, Sept 2016
Zinc chloride 1,000 - Alibaba.com, Sept 2016
Sodium carbonate 320 - Industrial Minerals, Sept 2015
Potassium carbonate 900 - Alibaba.com, Sept 2016
Lithium carbonate 6,500 -
Industrial Minerals, Sept 2015. Li2CO3 prices spiked to over $20/kg in 2016. There is substantial uncertainty in lithium futures, with analysts projecting possible scenarios of lower and higher long-term prices.
Blended Salt Prices
Solar Salt 800 10 SQM quoted solar salt at $950/MT (FOB San Diego) in 2015
ZnCl2/NaCl/KCl 800 18
MgCl2/KCl 350 5
Na2CO3/K2CO3/Li2CO3 2,500 28
The advantages and disadvantages of the candidate salts are summarized in Table 10. Additional validation R&D testing is required to down-select the blend that will offer the best opportunity for success. Several of these issues will be discussed in the following paragraphs.
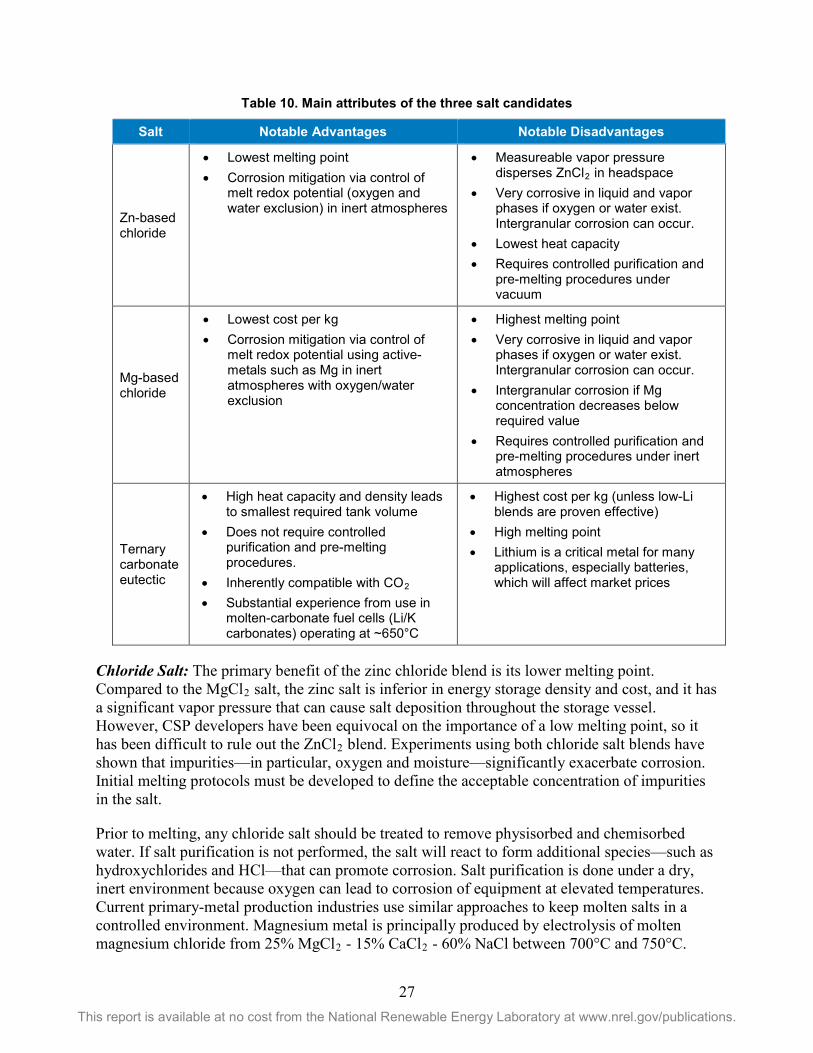
27 This report is available at no cost from the National Renewable Energy Laboratory at www.nrel.gov/publications.
Table 10. Main attributes of the three salt candidates Salt Notable Advantages Notable Disadvantages
Zn-based chloride
• Lowest melting point • Corrosion mitigation via control of
melt redox potential (oxygen and water exclusion) in inert atmospheres
• Measureable vapor pressure disperses ZnCl2 in headspace
• Very corrosive in liquid and vapor phases if oxygen or water exist. Intergranular corrosion can occur.
• Lowest heat capacity • Requires controlled purification and
pre-melting procedures under vacuum
Mg-based chloride
• Lowest cost per kg • Corrosion mitigation via control of
melt redox potential using active-metals such as Mg in inert atmospheres with oxygen/water exclusion
• Highest melting point • Very corrosive in liquid and vapor
phases if oxygen or water exist. Intergranular corrosion can occur.
• Intergranular corrosion if Mg concentration decreases below required value
• Requires controlled purification and pre-melting procedures under inert atmospheres
Ternary carbonate eutectic
• High heat capacity and density leads to smallest required tank volume
• Does not require controlled purification and pre-melting procedures.
• Inherently compatible with CO2 • Substantial experience from use in
molten-carbonate fuel cells (Li/K carbonates) operating at ~650°C
• Highest cost per kg (unless low-Li blends are proven effective)
• High melting point • Lithium is a critical metal for many
applications, especially batteries, which will affect market prices
Chloride Salt: The primary benefit of the zinc chloride blend is its lower melting point. Compared to the MgCl2 salt, the zinc salt is inferior in energy storage density and cost, and it has a significant vapor pressure that can cause salt deposition throughout the storage vessel. However, CSP developers have been equivocal on the importance of a low melting point, so it has been difficult to rule out the ZnCl2 blend. Experiments using both chloride salt blends have shown that impurities—in particular, oxygen and moisture—significantly exacerbate corrosion. Initial melting protocols must be developed to define the acceptable concentration of impurities in the salt.
Prior to melting, any chloride salt should be treated to remove physisorbed and chemisorbed water. If salt purification is not performed, the salt will react to form additional species—such as hydroxychlorides and HCl—that can promote corrosion. Salt purification is done under a dry, inert environment because oxygen can lead to corrosion of equipment at elevated temperatures. Current primary-metal production industries use similar approaches to keep molten salts in a controlled environment. Magnesium metal is principally produced by electrolysis of molten magnesium chloride from 25% MgCl2 - 15% CaCl2 - 60% NaCl between 700°C and 750°C.
28 This report is available at no cost from the National Renewable Energy Laboratory at www.nrel.gov/publications.
Partly dehydrated MgCl2 is produced by isothermal evaporation stages in the Dow process using air up to 185°C followed with chlorine and/or dry hydrochloric acid gases for full dehydration [16].
The majority of the moisture in MgCl2/KCl salt can be removed by thermal treatment of the salt under flowing gas. MgCl2/KCl is best treated through a slow heating to avoid melting of the MgCl2-6H2O, thereby reducing surface area and increasing drying time. Efficient moisture removal through a slow temperature increase can be attained by heating in a stepwise manner with argon purging through the salt powders prior to melting to remove physisorbed moisture. Final removal of water vapor should be confirmed using moisture sensors. Full hydrolysis of remaining moisture in MgCl2-2H2O reacts to form MgO and HCl by ~554°C [17]. Argon sparging augments the step-wise dehydration by removing any remaining HCl [18].
Additional chemical treatment of the salt is recommended to remove remaining impurities and minimize corrosion in piping prior to use of any halide molten salt. Savannah River National Laboratory (SRNL) has proposed a technique that uses magnesium metal as an oxygen scavenger in the melt. After the stepwise heating procedure is performed, Mg is added to the melt and held at a temperature above its melting point with sparging to agitate the Mg/MgCl2/KCl mixture and reduce impurities. The Mg metal will react with remaining water and hydroxide impurities to form MgO. Both residual Mg and MgO settle to the bottom after the sparging is stopped. Some metallic impurities may also be reduced and have a tendency to be found near the top and bottom of the salt. Additional Mg is added for corrosion control after removal of these impurities in the salt [18].
In a CSP plant, prior to introduction into the storage tanks, it is envisioned that the purification of the salt would consist of steps outlined above to remove impurities. This would be followed by filtering of the salt to remove MgO and other impurities that were formed during stepwise heating. Filtration could be followed by the addition of Mg, Mg-alloy, or other metallic corrosion inhibition agents to maintain a low corrosion potential in the heat transfer system [18]. Additions of elemental Mg into the salt pose concerns with regard to forming an Mg-Ni alloy that is liquid at 512°C, and practical implications of this should be understood.
Carbonate Salt: Alkali carbonate salts are used in molten carbonate fuel cells (MCFC) at temperatures around 650°C. In this application they are exposed to oxygen, H2O, and CO2 as part of operation, and they are inherently less corrosive than chloride salts under such conditions. Not requiring an inert headspace provides a distinct advantage. Although corrosion is still an issue of concern, the greatest potential problem with the eutectic carbonate salt blend listed in Table 10 is the cost of lithium carbonate. Low-lithium salt blends may have acceptable physical properties for use as a solar HTF and reduce cost; for example, some researchers have reported carbonate salt blends having only 10% lithium carbonate and maintaining acceptable thermophysical properties [19] [20], although these results need to be validated. The composition of the carbonate blend should be optimized for cost by determining if limiting the lithium salt content will significantly impact other salt properties (e.g., density, heat capacity, melting point).
Related to cost, a major concern with respect to carbonates is the supply of lithium carbonate in view of the demand for lithium in the growing battery market. A 10-MWe demo plant with 10 hours storage would require 350 metric tons (MT) of lithium carbonate, whereas a 100-MWe
29 This report is available at no cost from the National Renewable Energy Laboratory at www.nrel.gov/publications.
plant would require 8,000 MT. Lithium carbonate production in 2015 was ~153,000 MT according to Reuters [21]. The expected increase in lithium demand for batteries, combined with the potential for new lithium production sources, create uncertainty in the future price of lithium carbonate. This potential market spurs pursuit of other sources of lithium and market analysts have projected scenarios leading to increases or decreases in lithium price. For example, mineral recovery from geothermal brines is currently being funded by the DOE’s Geothermal Technologies Office. Some geothermal plants (e.g., John L. Featherstone plant at the Salton Sea, CA) are working to produce lithium compounds as a byproduct [22]. Lithium from these domestic sources could be a significant advantage for greater use of lithium in U.S. industry.
Lastly, physical property data exist for solar salt over the range of its normal operating conditions of 300°C to 600°C [10]. However, a similar level of knowledge is not available for the salts listed in Table 8. Accurate physical property data (e.g., heat capacity, viscosity, density, thermal stability, thermal conductivity) are important for the design of piping and heat exchangers. These data should be developed, validated, and published for the candidate salt compositions.
4.1.1.2 Recommended Research Activities • Develop, validate, and publish thermophysical properties for heat capacity, viscosity,
density, thermal stability, and thermal conductivity for the candidate salt compositions across the range of planned operating temperature using reagent-grade salts. Determine impurity effect on properties from industrial-grade salts.
• Evaluate the ternary MgCl2/KCl/NaCl system (potential melting point of ~380°C–396°C) [14] [23] to determine if it has better characteristics than binary MgCl2/KCl with respect to cost, melting point, heat capacity, stability, and corrosivity.
• Optimize carbonate salt composition with the goal of minimizing (or replacing) lithium content while maintaining acceptable thermophysical properties. This will confirm/refute claims that lithium content can be lowered to 10% to 20% while maintaining favorable melting point and heat capacity.
• Specify baseline melting and purification protocols for commercial salts, ullage gas composition, and any other process requirements (carbonates and chloride-based salts).
• Demonstrate freeze recovery with high-melting salts to determine importance of melting point. If melting points of ~400°C are acceptable, then zinc salts may not be advantageous.
4.1.1.3 Impact Salt chemistry must be addressed first. System and component design hinge on this choice because material choices may differ by the salts identified above. This impacts salt-handling protocols (i.e., melting, purification, and ullage gas), design, and operation of critical subsystems (TES, system sizing, receiver, heat trace, valves, pumps, and primary heat exchanger). Furthermore, design of components is tied to accurate and reliable thermal properties.
Salt selection is viewed as both a technical risk and economic risk if not addressed. Each salt has unique challenges associated with implementing it into a plant and selecting one chemistry to focus on for design is critical.
30 This report is available at no cost from the National Renewable Energy Laboratory at www.nrel.gov/publications.
Technology Gap – Material Selection/Compatibility 4.1.24.1.2.1 Current Status Two issues dominate the selection and cost of the containment alloys: the ability to resist salt corrosion and the requisite tensile strength at the desired operating temperatures. Several alloys have been tested for CSP component applications in molten chlorides and carbonates [24] [25] [26] [27]. Use of very high-strength alloys such as H282 and In740H offers the potential of lesser mass requirements at similar per-kilogram costs; however, there are concerns associated with lack of experience with H282 and In740H. Furthermore, H282 and In740H require heat treatments to develop the high strength; thus, any repair work in the field would require local heat treating similar to post weld heat treatments for grade P91 alloys that are used in high pressure steam systems (P91 is heat treated to increase toughness).
Use of chloride salts requires methods to protect alloys, including surface treatments and insulating materials, along with controlling the redox potential of the salt chemistry. Redox control has been accomplished with zero-valent metal additives, such as Mg, as shown by SRNL with MgCl2/KCl salt melts [18]. Given the melting temperature of magnesium metal (650°C), it is not clear that it will remain in solution throughout a system that cycles from ~520°C to ~720°C. Alternative active metals with a lower melting point, e.g., sodium, may be needed if Mg precipitates from solution under these conditions. In a related example, Zirconium metal was added to a molten fluoride salt, which caused the deposition of a pure Zr layer, followed by interdiffusion to form a Ni/Zr intermetallic phase that acted as a barrier to corrosion [28] [29]. Lastly, it is essential to know that the desired salt-chemistry conditions are being maintained in the melt, so a monitoring method is required.
The ullage gas in the molten chloride system must be maintained at low moisture and oxygen levels. Studies to determine how corrosion rates vary with gas-phase impurity levels have not been performed or publicly reported, and experimentation is needed to determine acceptable levels for both moisture and oxygen. Continuous monitoring of the gas-phase moisture and oxygen content is recommended because these measurements should be straightforward and can help identify deviations from normal conditions. For the use of Mg as a corrosion inhibitor, SRNL has demonstrated the use of electrochemical sensors to monitor the corrosion potential of metallic components exposed to the salt. The online monitoring of corrosion potential is recommended to ensure that the system is maintained in a state where corrosion is not favored [18].
Literature has shown that the corrosivity of zinc chloride salts drops sharply when the melt is kept in a sealed condition with only argon in the gas phase [30]. This requirement of an oxygen- and moisture-free headspace is similar to that made by the SRNL work; however, the Arizona work did not employ a zero-valent metal in the melt. In either case, impurities from commercial-grade salts will have a strong influence on the properties of the fluids and on the corrosion mechanisms, rate, and mitigation. The allowable level of oxygen, moisture, or CO2 intrusion is unknown and must be determined.
Because of chloride’s hygroscopic nature, any leak will form a highly corrosive layer on external metallic surfaces exposed to air. This hot aqueous-chloride film has a potential to rapidly corrode metals from the outer surface. Leaks do occur at CSP plants and a strategy to inspect/detect for leaks is needed, especially if chlorides are used.
31 This report is available at no cost from the National Renewable Energy Laboratory at www.nrel.gov/publications.
In the case of carbonate salts, the use of SS310 is common in MCFC technologies working at 650°C with the alkali carbonates. Based on this knowledge, code-qualified high-strength stainless steels (SS310 and SS347) can be used in the cold side (~550°C) of the plant without any kind of internal barrier coating. As will be shown, the use of 300-series stainless steel for the cold-salt loop is essential for cost reasons. For the hot tank, it is probable that internal insulation will be required for both corrosion and strength reasons regardless of the salt blend. The durability of internal-insulation ceramic systems will need to be developed and tested at a reasonable scale to ensure confidence in full-scale deployment. Further, similar approaches will be needed to insulate and protect the pipe alloys, as well as surfaces within pumps and valves. Continuous flaw-free coatings, surface treatments, or insulation layers on the internal diameter of pipes will be an important development area. The total mass of piping, if low compared with the tank, may allow use of higher-cost corrosion-resistant materials without coatings. However, exposure testing in flowing environments with spatial temperature variation will be required to demonstrate the alloy selection.
4.1.2.2 Recommended Research Activities • Identify and down-select containment alloys (materials required for pressure boundaries).
Alloys must be qualified and in the B31.1 piping code / Boiler Pressure Vessel Code.
• Identify and down-select materials needed for non-containment parts, such as pump impellers or shaft materials. This should be accomplished with help of component vendors.
• Perform isothermal corrosion testing to down-select materials.
• Perform follow-on materials testing as needed (i.e., flowing salt or thermal cycling).
• Determine maximum allowable concentrations of oxygen and moisture in chloride salts based on allowable corrosion/degradation levels of materials exposed to molten and vapor phases of salt.
• Develop and prove an in-situ chemistry monitoring system to identify changes in the melt that may lead to severe material degradation. If chlorides are considered, then chemically bonded water needs to be sensed to determine in-situ water removal procedures.
• Develop melt-moisture removal and water-removal maintenance systems for continuous operation.
• Identify rapid leak-detection and mitigation methods. These techniques will be especially important for chloride salts.
• Characterize corrosion mitigation techniques that allow use of less-expensive alloys—e.g., use of active metals such as Na, Zr, or Mg, to change redox potentials in chloride melts, or use of surface treatments.
o Determine if additions of Mg lead to dissolution of nickel containment by formation of a Mg-Ni binary alloy (melting point of 512°C).
4.1.2.3 Impact SunShot cost targets cannot be met if the entire system is designed from nickel super-alloys such as Haynes 230. Therefore, less-expensive materials or approaches that meet both the high-
32 This report is available at no cost from the National Renewable Energy Laboratory at www.nrel.gov/publications.
temperature mechanical properties along with low corrosion must be identified. This includes alloys, ceramics, graphite, and composite materials (i.e., bearing materials for pumps).
Selecting materials is predicated on the choice of a salt chemistry and directly impacts allowable cover-gas chemistries (e.g., oxygen and moisture impurity level allowed with chlorides or air/CO2 mixtures for carbonates). Corrosion mechanisms vary significantly among salts, and strategies to manage material/salt interactions will be unique to system chemistries. The sheer quantity of containment materials is a strong driver in storage system costs. Other materials required for pumps and valves need to be determined based of selected salt chemistry and operating parameters.
Failure to solve material issues will result in high cost and/or technical risk. Components and overall system design require a trusted set of materials to be selected both for design purposes and for economic considerations.
Technology Gap – Thermal Energy Storage 4.1.34.1.3.1 Current Status Two-tank TES technology at 565°C is used commercially at Gemasolar in Spain and Crescent Dunes in the United States. Although commercial systems exist, the detailed cost of the TES subsystem is not public information for those facilities. Accordingly, NREL’s cost model for SAM’s molten-salt power tower is based on published work by Abengoa Solar [31] and a study commissioned with the WorleyParsons Group [32]. The TES cost model includes subsystem costs for the hot tank, cold tank, storage media, piping and insulation, foundations, and instruments and controls. The analysis presented here starts with NREL’s assessment of the cost of current two-tank TES using solar salt at 565°C and extrapolates those costs to 720°C systems employing MgCl2/KCl and carbonate eutectic salts.
Estimated Cost for Solar-Salt TES at 565°C: The reference study by Abengoa assumed three pairs of solar salt tanks providing a total energy capacity of 8,110 MWht. From this set of data, NREL extracted costs for a single pair of tanks with a corresponding energy capacity of 2,703 MWht. The analysis by WorleyParsons used a single pair of tanks with a capacity of 1,675 MWht. A comparison of the single-tank data set taken from the Abengoa study and the WorleyParsons estimates is provided in Table 11.
NREL applied a scaling exponent of 0.8 to the Abengoa case to account for economy-of-scale benefits in construction, even though the system was downscaled by simply considering one pair, rather than three pairs, of the identical tanks. Note that the resulting TES cost is $20/kWht from Abengoa and $33/kWht from WorleyParsons. Using Abengoa’s salt cost of $1,100/tonne would lower the WorleyParsons cost to $27/kWht, which is essentially the value currently used in SAM’s default case. The cost values presented here are normalized to 2015$ using the Chemical Engineering Plant Cost Index. Following SAM and SunShot convention, these are direct costs for the erected TES system and do not include contingency or project indirect costs.
The level of detail provided by the Abengoa study exceeds that in the WorleyParsons report, and the former is used as the basis for estimating the cost of the two higher-temperature systems. The referenced Abengoa report does predict lower TES costs than NREL believes to be current ($20/kWh vs. $26/kWh). However, the analysis was done in relative terms, so the results can be
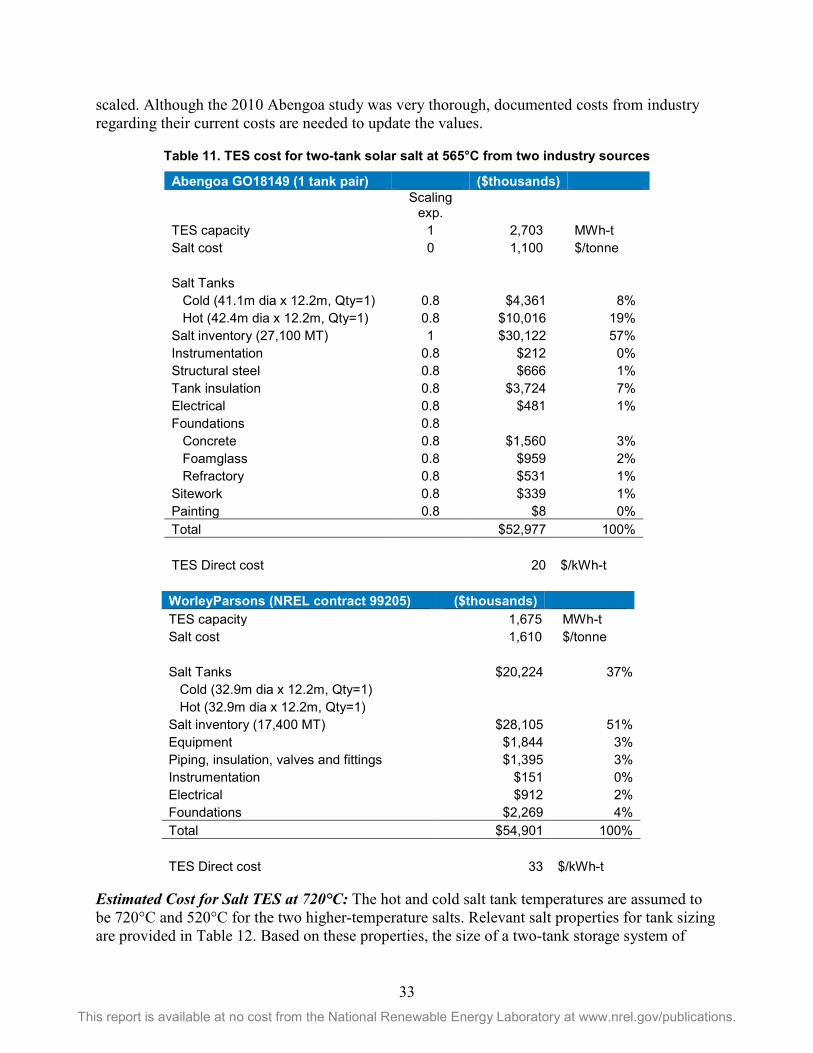
33 This report is available at no cost from the National Renewable Energy Laboratory at www.nrel.gov/publications.
scaled. Although the 2010 Abengoa study was very thorough, documented costs from industry regarding their current costs are needed to update the values.
Table 11. TES cost for two-tank solar salt at 565°C from two industry sources
Abengoa GO18149 (1 tank pair) ($thousands)
Scaling
exp. TES capacity 1 2,703 MWh-t Salt cost 0 1,100 $/tonne Salt Tanks Cold (41.1m dia x 12.2m, Qty=1) 0.8 $4,361 8% Hot (42.4m dia x 12.2m, Qty=1) 0.8 $10,016 19% Salt inventory (27,100 MT) 1 $30,122 57% Instrumentation 0.8 $212 0% Structural steel 0.8 $666 1% Tank insulation 0.8 $3,724 7% Electrical 0.8 $481 1% Foundations 0.8 Concrete 0.8 $1,560 3% Foamglass 0.8 $959 2% Refractory 0.8 $531 1% Sitework 0.8 $339 1% Painting 0.8 $8 0% Total $52,977 100% TES Direct cost 20 $/kWh-t
WorleyParsons (NREL contract 99205) ($thousands) TES capacity 1,675 MWh-t Salt cost 1,610 $/tonne
Salt Tanks $20,224 37% Cold (32.9m dia x 12.2m, Qty=1)
Hot (32.9m dia x 12.2m, Qty=1) Salt inventory (17,400 MT) $28,105 51%
Equipment $1,844 3% Piping, insulation, valves and fittings $1,395 3% Instrumentation $151 0% Electrical $912 2% Foundations $2,269 4% Total $54,901 100%
TES Direct cost 33 $/kWh-t
Estimated Cost for Salt TES at 720°C: The hot and cold salt tank temperatures are assumed to be 720°C and 520°C for the two higher-temperature salts. Relevant salt properties for tank sizing are provided in Table 12. Based on these properties, the size of a two-tank storage system of
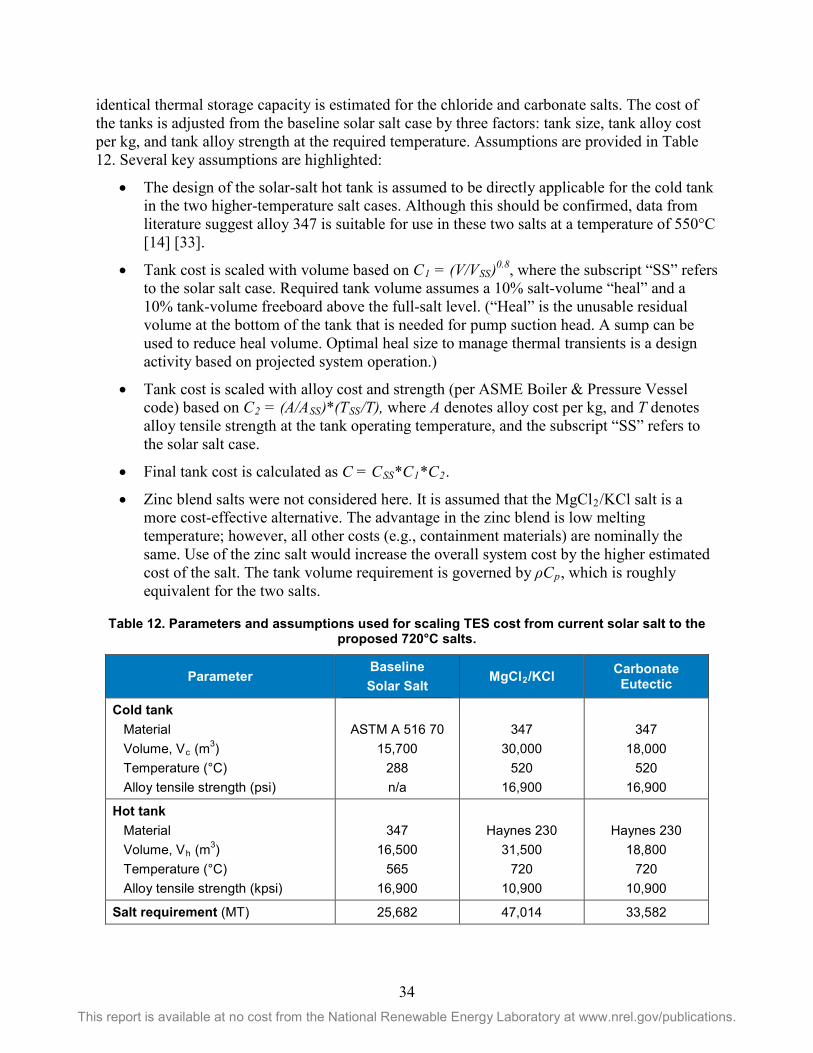
34 This report is available at no cost from the National Renewable Energy Laboratory at www.nrel.gov/publications.
identical thermal storage capacity is estimated for the chloride and carbonate salts. The cost of the tanks is adjusted from the baseline solar salt case by three factors: tank size, tank alloy cost per kg, and tank alloy strength at the required temperature. Assumptions are provided in Table 12. Several key assumptions are highlighted:
• The design of the solar-salt hot tank is assumed to be directly applicable for the cold tank in the two higher-temperature salt cases. Although this should be confirmed, data from literature suggest alloy 347 is suitable for use in these two salts at a temperature of 550°C [14] [33].
• Tank cost is scaled with volume based on C1 = (V/VSS)0.8, where the subscript “SS” refers to the solar salt case. Required tank volume assumes a 10% salt-volume “heal” and a 10% tank-volume freeboard above the full-salt level. (“Heal” is the unusable residual volume at the bottom of the tank that is needed for pump suction head. A sump can be used to reduce heal volume. Optimal heal size to manage thermal transients is a design activity based on projected system operation.)
• Tank cost is scaled with alloy cost and strength (per ASME Boiler & Pressure Vessel code) based on C2 = (A/ASS)*(TSS/T), where A denotes alloy cost per kg, and T denotes alloy tensile strength at the tank operating temperature, and the subscript “SS” refers to the solar salt case.
• Final tank cost is calculated as C = CSS*C1*C2.
• Zinc blend salts were not considered here. It is assumed that the MgCl2/KCl salt is a more cost-effective alternative. The advantage in the zinc blend is low melting temperature; however, all other costs (e.g., containment materials) are nominally the same. Use of the zinc salt would increase the overall system cost by the higher estimated cost of the salt. The tank volume requirement is governed by ρCp, which is roughly equivalent for the two salts.
Table 12. Parameters and assumptions used for scaling TES cost from current solar salt to the proposed 720°C salts.
Parameter Baseline Solar Salt
MgCl2/KCl Carbonate Eutectic
Cold tank Material Volume, Vc (m3) Temperature (°C) Alloy tensile strength (psi)
ASTM A 516 70
15,700 288 n/a
347
30,000 520
16,900
347
18,000 520
16,900
Hot tank Material Volume, Vh (m3) Temperature (°C) Alloy tensile strength (kpsi)
347
16,500 565
16,900
Haynes 230
31,500 720
10,900
Haynes 230
18,800 720
10,900
Salt requirement (MT) 25,682 47,014 33,582
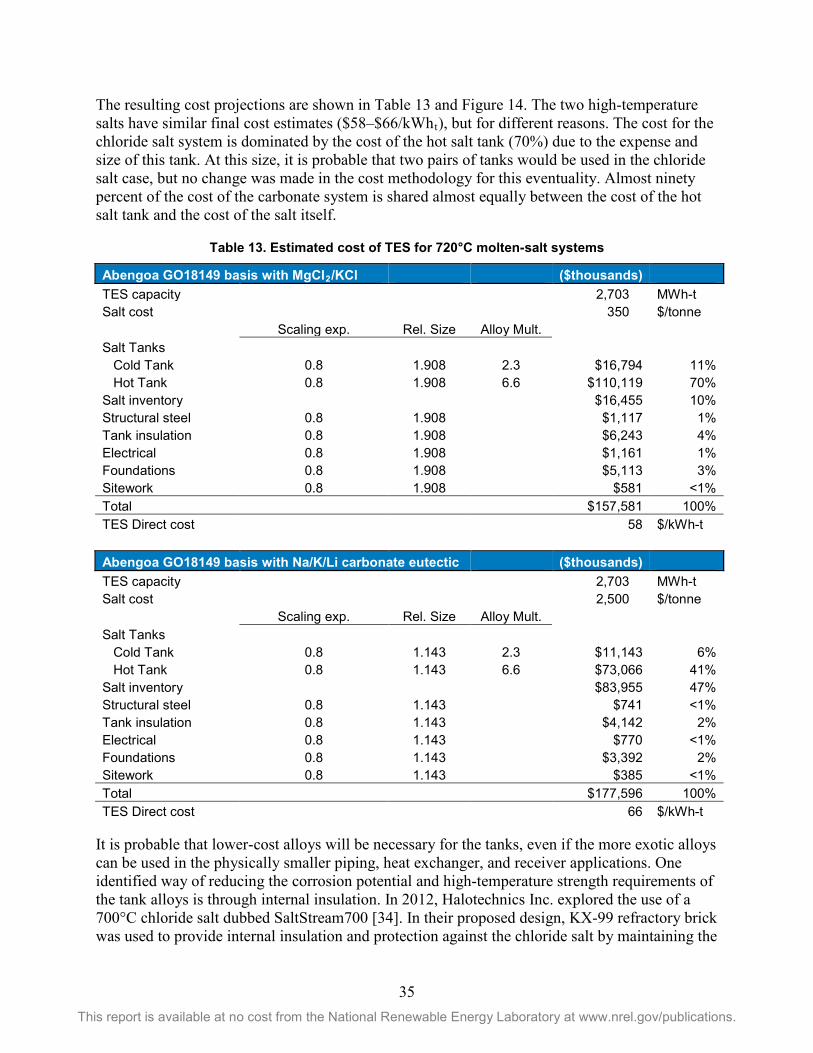
35 This report is available at no cost from the National Renewable Energy Laboratory at www.nrel.gov/publications.
The resulting cost projections are shown in Table 13 and Figure 14. The two high-temperature salts have similar final cost estimates ($58–$66/kWht), but for different reasons. The cost for the chloride salt system is dominated by the cost of the hot salt tank (70%) due to the expense and size of this tank. At this size, it is probable that two pairs of tanks would be used in the chloride salt case, but no change was made in the cost methodology for this eventuality. Almost ninety percent of the cost of the carbonate system is shared almost equally between the cost of the hot salt tank and the cost of the salt itself.
Table 13. Estimated cost of TES for 720°C molten-salt systems
Abengoa GO18149 basis with MgCl2/KCl ($thousands) TES capacity 2,703 MWh-t Salt cost 350 $/tonne Scaling exp. Rel. Size Alloy Mult. Salt Tanks Cold Tank 0.8 1.908 2.3 $16,794 11% Hot Tank 0.8 1.908 6.6 $110,119 70% Salt inventory $16,455 10% Structural steel 0.8 1.908 $1,117 1% Tank insulation 0.8 1.908 $6,243 4% Electrical 0.8 1.908 $1,161 1% Foundations 0.8 1.908 $5,113 3% Sitework 0.8 1.908 $581 <1% Total $157,581 100% TES Direct cost 58 $/kWh-t
Abengoa GO18149 basis with Na/K/Li carbonate eutectic ($thousands)
TES capacity 2,703 MWh-t Salt cost 2,500 $/tonne Scaling exp. Rel. Size Alloy Mult. Salt Tanks Cold Tank 0.8 1.143 2.3 $11,143 6% Hot Tank 0.8 1.143 6.6 $73,066 41% Salt inventory $83,955 47% Structural steel 0.8 1.143 $741 <1% Tank insulation 0.8 1.143 $4,142 2% Electrical 0.8 1.143 $770 <1% Foundations 0.8 1.143 $3,392 2% Sitework 0.8 1.143 $385 <1% Total $177,596 100% TES Direct cost 66 $/kWh-t
It is probable that lower-cost alloys will be necessary for the tanks, even if the more exotic alloys can be used in the physically smaller piping, heat exchanger, and receiver applications. One identified way of reducing the corrosion potential and high-temperature strength requirements of the tank alloys is through internal insulation. In 2012, Halotechnics Inc. explored the use of a 700°C chloride salt dubbed SaltStream700 [34]. In their proposed design, KX-99 refractory brick was used to provide internal insulation and protection against the chloride salt by maintaining the
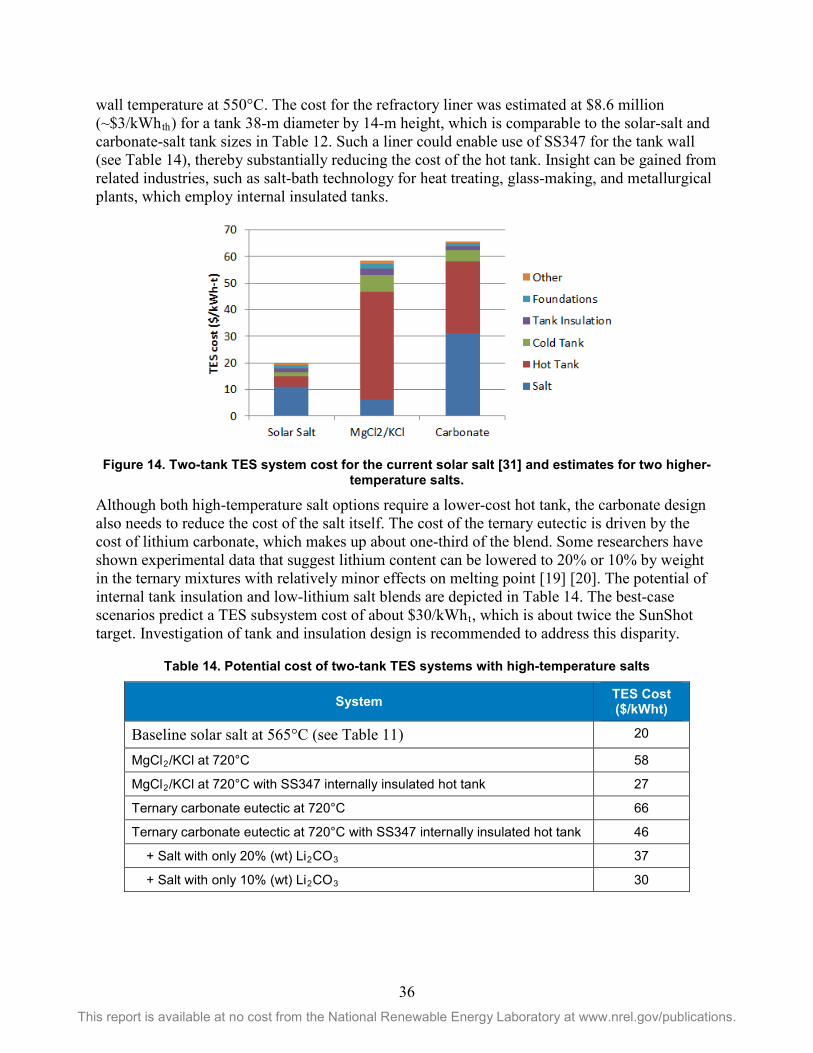
36 This report is available at no cost from the National Renewable Energy Laboratory at www.nrel.gov/publications.
wall temperature at 550°C. The cost for the refractory liner was estimated at $8.6 million (~$3/kWhth) for a tank 38-m diameter by 14-m height, which is comparable to the solar-salt and carbonate-salt tank sizes in Table 12. Such a liner could enable use of SS347 for the tank wall (see Table 14), thereby substantially reducing the cost of the hot tank. Insight can be gained from related industries, such as salt-bath technology for heat treating, glass-making, and metallurgical plants, which employ internal insulated tanks.
Figure 14. Two-tank TES system cost for the current solar salt [31] and estimates for two higher-temperature salts.
Although both high-temperature salt options require a lower-cost hot tank, the carbonate design also needs to reduce the cost of the salt itself. The cost of the ternary eutectic is driven by the cost of lithium carbonate, which makes up about one-third of the blend. Some researchers have shown experimental data that suggest lithium content can be lowered to 20% or 10% by weight in the ternary mixtures with relatively minor effects on melting point [19] [20]. The potential of internal tank insulation and low-lithium salt blends are depicted in Table 14. The best-case scenarios predict a TES subsystem cost of about $30/kWht, which is about twice the SunShot target. Investigation of tank and insulation design is recommended to address this disparity.
Table 14. Potential cost of two-tank TES systems with high-temperature salts
System TES Cost ($/kWht)
Baseline solar salt at 565°C (see Table 11) 20
MgCl2/KCl at 720°C 58
MgCl2/KCl at 720°C with SS347 internally insulated hot tank 27
Ternary carbonate eutectic at 720°C 66
Ternary carbonate eutectic at 720°C with SS347 internally insulated hot tank 46
+ Salt with only 20% (wt) Li2CO3 37
+ Salt with only 10% (wt) Li2CO3 30
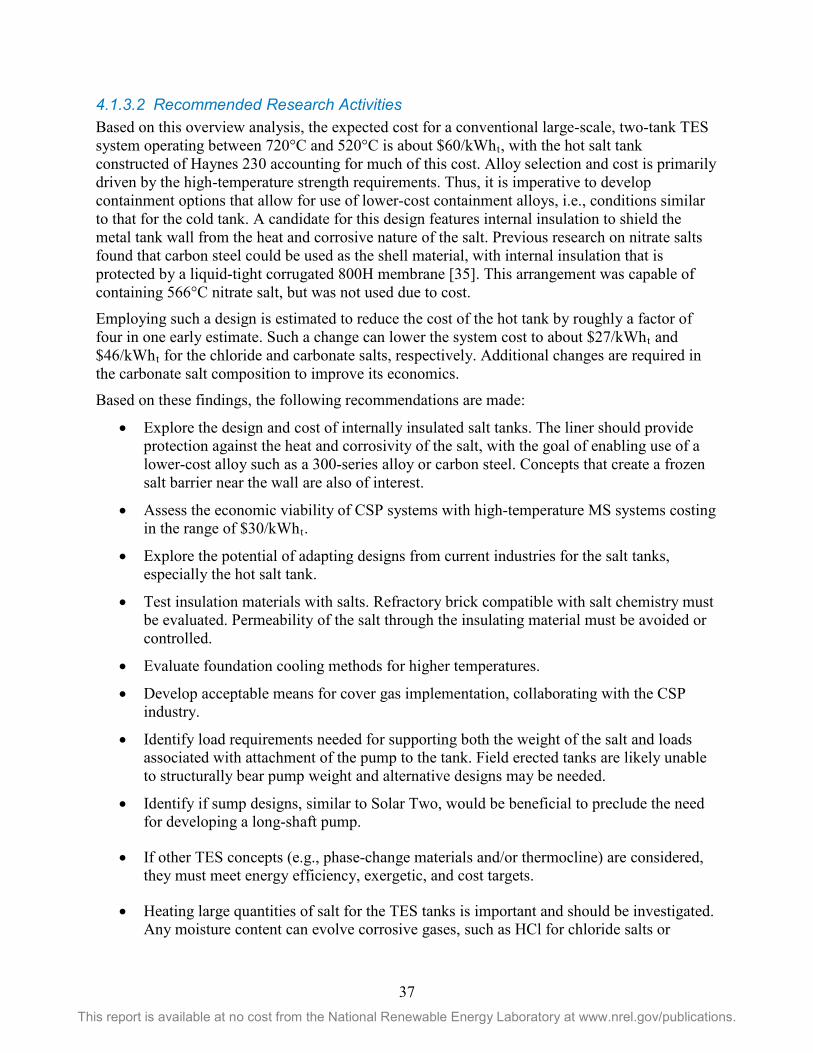
37 This report is available at no cost from the National Renewable Energy Laboratory at www.nrel.gov/publications.
4.1.3.2 Recommended Research Activities Based on this overview analysis, the expected cost for a conventional large-scale, two-tank TES system operating between 720°C and 520°C is about $60/kWht, with the hot salt tank constructed of Haynes 230 accounting for much of this cost. Alloy selection and cost is primarily driven by the high-temperature strength requirements. Thus, it is imperative to develop containment options that allow for use of lower-cost containment alloys, i.e., conditions similar to that for the cold tank. A candidate for this design features internal insulation to shield the metal tank wall from the heat and corrosive nature of the salt. Previous research on nitrate salts found that carbon steel could be used as the shell material, with internal insulation that is protected by a liquid-tight corrugated 800H membrane [35]. This arrangement was capable of containing 566°C nitrate salt, but was not used due to cost.
Employing such a design is estimated to reduce the cost of the hot tank by roughly a factor of four in one early estimate. Such a change can lower the system cost to about $27/kWht and $46/kWht for the chloride and carbonate salts, respectively. Additional changes are required in the carbonate salt composition to improve its economics.
Based on these findings, the following recommendations are made:
• Explore the design and cost of internally insulated salt tanks. The liner should provide protection against the heat and corrosivity of the salt, with the goal of enabling use of a lower-cost alloy such as a 300-series alloy or carbon steel. Concepts that create a frozen salt barrier near the wall are also of interest.
• Assess the economic viability of CSP systems with high-temperature MS systems costing in the range of $30/kWht.
• Explore the potential of adapting designs from current industries for the salt tanks, especially the hot salt tank.
• Test insulation materials with salts. Refractory brick compatible with salt chemistry must be evaluated. Permeability of the salt through the insulating material must be avoided or controlled.
• Evaluate foundation cooling methods for higher temperatures.
• Develop acceptable means for cover gas implementation, collaborating with the CSP industry.
• Identify load requirements needed for supporting both the weight of the salt and loads associated with attachment of the pump to the tank. Field erected tanks are likely unable to structurally bear pump weight and alternative designs may be needed.
• Identify if sump designs, similar to Solar Two, would be beneficial to preclude the need for developing a long-shaft pump.
• If other TES concepts (e.g., phase-change materials and/or thermocline) are considered, they must meet energy efficiency, exergetic, and cost targets.
• Heating large quantities of salt for the TES tanks is important and should be investigated. Any moisture content can evolve corrosive gases, such as HCl for chloride salts or
38 This report is available at no cost from the National Renewable Energy Laboratory at www.nrel.gov/publications.
carbonic acid for carbonate based salts. This is a chemical handling/procedural issue, but must be addressed.
4.1.3.3 Impact Tank functional design is well understood and can be addressed with high-strength alloys. However, an economically viable high-temperature molten-salt TES system will require R&D specific to identifying design options (e.g., internal insulation) and low-cost materials. Due to the large cost associated with the hot tank, it is important to identify pathways toward economic engineering solutions based on experience in industry—specifically, related to metal production and molten-salt heat treating.
Failure to identify design options that include low cost materials will preclude the economic viability of MS technology, primarily an economic risk. Demonstration could be done on designs using materials of higher cost, but this would not retire risk associated with alternative, low-cost designs.
Technology Gap – Salt Solar Receiver 4.1.44.1.4.1 Current Status The receiver configuration envisioned for high-temperature salts is nominally similar to current technology. An external cylindrical receiver consisting of multiple panels of tubes into headers will surround the top of the tower. Flow configuration options are similar to current receivers, with multiple passes in different patterns to minimize the impact of clouds or cosine angles throughout the field.
Established methods have demonstrated freeze recovery in receivers without plastic deformation [36]. Solar Two used SS316 based on data in 1994, but current receivers use nickel alloys [37], which have better low-cycle fatigue and stress-corrosion cracking properties [38]. Current estimated costs for the tower and receiver combined are about $180/kWth [4], presumably using nickel alloys, and need to be reduced to $150/kWth for SunShot. However, the alloy must have suitable strength at temperature, likely requiring higher-cost alloys.
4.1.4.2 Recommended Research Activities The initial concern is materials, both in terms of compatibility and cost. Current MS receivers are made from high-nickel alloys including In625 and H230 alloys. If this alloy is chemically compatible with the salt, there is a natural starting point with regard to industrial experience. Joints to the headers will require redesign to accommodate greater expansion at the higher tube temperatures. In addition, the lower strength at the higher temperatures may require thicker sections, which impacts weight, cost, and thermal performance. Solar salt systems have vents to allow fill and drainback of the tubes by allowing egress/ingress of air. A closed system, which has never been proven into practice with a central receiver, with appropriate cover gas may be necessary to accomplish these operations without air exposure, at least for the chloride salt blends. This may complicate the fill and drain process during start-up and shut-down. Owing to the higher temperatures required in the receiver, alternative approaches for preheating may be required to shorten start up time. Heat losses due to re-radiation must be minimized at higher temperatures. High temperatures may require advanced coating development to maximize absorptivity in a durable coating. Fully oxidized alloy H230 has a solar absorptivity of about 91% [39], so a self-forming coating may simplify design. Selective absorbers have been explored
39 This report is available at no cost from the National Renewable Energy Laboratory at www.nrel.gov/publications.
for CSP applications. However, at these high temperatures, the re-radiation is within the visible band, and therefore, significant selectivity is not likely. If coatings can be developed with emissivity below 50%, while maintaining absorptivity over 90%, they would benefit the plant efficiency.
As temperatures are raised, heat loss to re-radiation strongly impacts plant efficiency. At 94% emissivity, the radiative loss increases from about 18 kW/m² at 600°C to about 50kW/m² at 750°C—or an increase of about 33 MWth on a receiver of 1,130-m² surface area. An attractive option would be to investigate increasing the flux limits on the receiver above the current estimate of 1000 suns, which is limited by the heat transfer into the molten salt. Such an approach would require heat-transfer enhancements to the tube/salt interface (e.g., internal fins, swirl devices), and would likely require improved solar-field accuracy beyond the current estimate of 1.53 mrad total surface slope error. The impact on pump parasitic load would also have to be considered, because increases in heat transfer generally correlate with an increase in pressure drop.
The minimum size of the receiver is limited by the size of the image from the most-distant heliostats, which in turn limits the peak concentration ratio of the field. If the peak flux limitation of the tube/salt interface is substantially increased, further optimization of field optical performance must be undertaken. The SunShot model [4] assumes that the receiver size is reduced by a factor of 2 in area through higher surface-flux limitations. The size of the image at the receiver depends on the heliostat accuracy as well as the effective sun size. The total optical and thermal efficiency is most strongly impacted by heliostat optical quality, because this impacts spillage and receiver size, and therefore, total receiver performance. The losses are impacted somewhat by peak allowable flux, which impacts receiver size. The modeling and optimization assume that heliostats also meet their SunShot goals. In particular, if commercial heliostats do not attain SunShot optical accuracy (1.53 mrad total optical error in each axis), the potential size of the receiver, as well as the practical plant size, may be affected.
Conventional planform receivers can be incorporated in early prototypes, pending resolution of materials compatibility, and should be functional. SunShot receivers will need to limit re-radiation thermal losses while reducing costs to meet SunShot cost/performance targets. This will require exploration of lower-cost materials that are still suitable for salt and air exposure at these elevated temperatures, with sufficient creep strength for long-term durability.
Receiver peak temperatures are expected to approach 800°C for a receiver outlet salt temperature of 720°C. The thermal decomposition of the salts at their temperature limits must be understood under flowing conditions, because nitrates were shown to be more corrosive when tube temperatures increased significantly [8]. Additional recommendations include:
• The impact of freezing salt in the receiver must be evaluated early in the program to allow for down-selection in salt choices. If recovering from freezing at temperatures near 400°C presents undue difficulties, then an emphasis may need to be placed on the lower-melting salts such as ZnCl2 blends.
• Perform techno-economic assessment on cost and compare with other components to prioritize material research and cost savings associated per component.
40 This report is available at no cost from the National Renewable Energy Laboratory at www.nrel.gov/publications.
• Select tube materials to be investigated for receiver designs, based on expected corrosion, creep and ultimate strength at temperature, code-case coverage, thermal and structural loads, and cost.
• Determine if mechanical or chemical degradation occurs in receiver materials because of high temperatures and thermal cycling. Weldment evaluations must be included.
• Determine if freeze/thaw events cause plastic deformation in alloys and identify methods to mitigate damage.
• Develop methods for enhancing heat transfer on the salt side in order to increase receiver limits beyond 1000 suns so that receiver size may be reduced.
• Determine pumping losses and other issues pertaining to the installation of internal fins and swirl devices to enhance heat transfer to meet SunShot size-reduction goals.
• Determine if stress corrosion cracking will occur under operational conditions.
• The feasibility of in-situ heat treatment on finished components (welded) should be determined. The post-treatment is required to age-strengthen H282 and In740H alloys and could potentially be addressed by using induction heating in-situ. Use of H282/In740H may reduce cost by the decreased amount of alloy used. Findings here apply to designs of salt-to-CO2 heat exchangers when using these alloys.
• Determine residence time required at 800°C–830°C to cause decomposition of salts.
• Determine optimum system size, which can then identify if cavity receivers are needed for high-temperature considerations based on thermal-loss calculations and optimization. Complete systems-level analysis to guide development and design efforts.
• Determine if selective absorber coatings can be developed to increase receiver efficiency. Promising results from current research exist, but must be vetted for applicability.
o Determine if oxides developed on nickel alloys provide sufficient absorption properties; if these are inadequate, then determine if Pyromark paint or other suitable coatings retain properties at high temperature and remain attached to the tube.
• Prove fill and drain procedure with cover gas. Develop system to maintain cover gas during drain back for off-sun idle operation.
• Heliostat real-time tracking or real-time flux profile evaluation and control needs to be developed to ensure that the flux distribution will not damage the receiver or cause additional heat radiation. Increased optical performance may not be achievable without closed-loop tracking.
• Determine the impact on thermal performance of thicker receiver pipes, required due to reduced materials strength at the higher operating temperatures.
4.1.4.3 Impact Receiver development is largely understood and is designated as an engineering effort. Specific emphasis is tied to demonstrating the component with a direct tie to bankability and investor confidence. Reaching SunShot performance goals, however, requires substantial control of
41 This report is available at no cost from the National Renewable Energy Laboratory at www.nrel.gov/publications.
thermal losses, which will require cavities, high-temperature selective absorbers, and/or increased flux capabilities. Higher temperatures may require more-expensive materials and thicker sections, which will need to be offset with better performance or smaller footprint.
Failure to address receiver specifications may result in lower overall efficiencies and ultimately raise costs of the MS technology. Current modeling methodologies are suitable for assessing receiver performance assuming materials compatibility is addressed.
Technology Gap – Pumps 4.1.54.1.5.1 Current Status Solar Two used cantilevered pump designs to avoid use of bearings in the 565°C salt; however, this necessitated the use of a sump that added additional cost, complexity, and thermal losses. Sump systems at Solar Two had their own complications, including risk of flooding the sump due to control issues either with level indicators or failures in the control valve responsible for filling the sump. Long-shafted pumps were developed and tested, and they outline the need to develop journal sleeves and bearings for new salt systems [40]. Current plants using nitrate salts were found to be adequately lubricated by the salt. Lubricating qualities of new salts need to be evaluated.
Based on the B&V report, pumps will be a vertical single- or multi-stage sump type, mounted to the roof of the MS tanks. Design and service for MS pumps above 550°C is relatively limited, and at temperatures up to 750°C there is no available design or service experience. Long-shaft pumps that extend to the bottom of the TES tank will require bearing materials that are suitable to the given MS chemistry. Lubricity of proposed salts is unclear and would need to be determined, especially for cold-tank pumps that require multi-stages for lifting the salt to the top of the tower. Materials, design, and maintenance are all major unknowns at this time. Field erected tanks are insufficient to support large pumps, and the option of an external pump and sump may be considered.
4.1.5.2 Recommended Research Activities • Determine best pump designs for the cold tank and for the hot tank. This could be
horizontal designs, long-shafted pumps, or some other advantageous design.
• Perform flow testing of pump technologies at temperature, with salt, to compare lifetime and maintainability.
• Select and test materials for bearings/journals (pumps). Lubricity of salt should be understood.
• Larger systems-level testing will be required to test pumps under plant-like conditions.
4.1.5.3 Impact It is assumed that pump designs, with judicious material selection, will meet requirements specified in plant designs. Reliability, performance, and O&M for a new design (including materials, temperatures, and fluids) must be proven in practice. Sumps could be employed for a 10-MWe Gen3 demonstration plant, but development of journal bearings may be an enabling technology in chloride salts.
42 This report is available at no cost from the National Renewable Energy Laboratory at www.nrel.gov/publications.
Failure to prove out, at minimum, short-term (100s of days) pump reliability in a pilot plant (10-MWe plant or equivalent test loop) would result in a significant technical risk for any commercial application. It is possible to employ a sump-type approach, similar to Solar Two, to minimize both thermal expansion and lubricity challenges. Performance and O&M requirements would be further defined during operation of a Gen3 demonstration and is seen as data that leads to an overall lower risk for commercial financing purposes.
Technology Gap – Valves 4.1.64.1.6.1 Current Status Current systems use packed valves as at Solar Two. Issues with packing have been adequately addressed by appropriate materials selection, but problems still exist regarding uniformly heating thick-walled valve bodies. Above 565°C, there is less information regarding the optimal configuration and design of the valves. Valve vendors indicated that bellows valves may be best suited for these systems to provide hermetic sealing. However, heat trace and valve temperatures are critical with a bellows. Failures occur when salt freezes within the bellow pleats and subsequent valve actuation causes bellow rupture. Replacement of bellows is possible, but is difficult if the bellows are welded to the stem and bonnet. Therefore, packed valves may be preferable if a reliable seal with a compatible packing material can be made.
Packed valves have the advantage of being potentially less expensive and easier to maintain. As with the bellows valve, heat trace and valve temperatures are critical, especially at the packing gland. If the temperature at this area of the stem is below the melting point, then the valve will likely not function as required for plant operations, or the actuator could damage the shaft. If the temperature is too high, then the packing may react to the salt and fail, causing a salt leak. Another concern with the packed type of valve is the tightness of the packing gland. For glands that are too tight, the valve may not function as required for planned operations; but if the gland is too loose, then salt may leak past the packing, potentially leak, and cause damage to heat-trace or other components. Replacement of packing causes down time to the plant, and if other systems are damaged, then these will need to be addressed during the outage.
Packing materials will need to be determined for either a chloride or carbonate system. Typical graphite-based packing may be compatible with a chloride salt [41]. It is unlikely that carbonate-based salts can use graphite, because a combustion reaction will occur (similar to nitrate behavior). Nitrate salt packings use alternating layers of a wire-reinforced graphite-braid packing over a fiberglass core (see [36]). This may be the best starting material for carbonate salts because their chemistry strongly parallels nitrate salts.
The importance of having a reliable, well-performing valve is a necessity for plant start-up, control, operation, and shutdown. The current plant design minimizes valves due to the reliability concerns. New types of valves should be explored. In the 1980s and 1990s, exploratory work was performed on valves having actuators separate from the internal components of the valve such that there would be no physical connection creating a sealed valve.
Valves design, regardless of sealing methodology, needs specifications around the operating conditions for performance, i.e., shock the valve with cold/hot salts, which induces rapid thermal transients.
43 This report is available at no cost from the National Renewable Energy Laboratory at www.nrel.gov/publications.
4.1.6.2 Recommended Research Activities The materials of construction for valves, along with designs, will be directly affected by the salt selected. The final selection of material used for the cold and hot temperatures will require both static and dynamic materials testing. Designs could leverage composite materials with a ceramic lining. Whatever materials are used, they will need to be low-cost, non-exotic engineering materials.
• Determine suitable valve designs (bellows, packed, decoupled valve stem from actuator, sealed valve).
• Perform non-flow testing of valve technologies at temperature, with salt, to compare lifetime and maintainability.
• Perform flow testing of valve technologies at temperature, with salt, to compare lifetime and maintainability.
• Design and evaluate methods of valve heat tracing that maintains acceptable temperature profiles across the valve with and without salt present.
• Larger systems will be required to test valves under plant-like conditions. Valves sized for plant design are large and behave very differently than small valves.
4.1.6.3 Impact It is assumed that valves designs, with judicious material selection, will meet requirements specified in plant designs. Reliability, performance, and O&M for a new design (including materials, temperatures, and fluids) must be proven in practice.
Valves currently have some minor issues in nitrate salt at 565°C in commercial plants. Deficiencies in valve reliability and performance at temperatures over 700°C may be an issue and require plant designs that minimize the reliance of valves at the highest temperatures. Limited use of valves in any system design is recommended due to issues encountered with valves on a daily basis in current plants. This may result in non-conventional plant layouts, such as a separate riser for each of the receiver flow circuits, but makes for a more robust design, while minimizing the impact of valve reliability.
Technology Gap – Heat Trace and Insulation 4.1.74.1.7.1 Current Status Heat trace and insulation are well known for current plants. Heat trace is arguably one of the most critical balance-of-plant areas, because improper heat trace led to many valve and piping problems on Solar Two [36]. Currently, many of the methodologies of heat trace are well understood based on findings of Solar Two and experience gained at the Molten Salt Test Loop (MSTL) and other systems installed at the NSTTF and at new power plants. Mineral-insulated high-temperature heating cables with a watt density of less than 50 W/foot with 600 VAC rating are recommended. Detailed insulation procedures for valves, piping, and other components are available [36]. The heat-trace heater options must be evaluated for higher-temperature continued exposure in terms of sufficient heating capacity to offset losses as well as durability of the heater element.
44 This report is available at no cost from the National Renewable Energy Laboratory at www.nrel.gov/publications.
Insulation for piping and tanks must withstand the highest-temperature environment it is exposed to and meet the Occupational Safety and Health Administration (OSHA) requirement of 120-140°F at the external surface where personnel are exposed. The heat trace is covered with a stainless-steel foil before the first layer of insulation is applied. The foil protects the heat trace from insulation being installed around the entire element causing overheating and eventual failure. Mineral wool, fiberglass, and other materials are currently used. The higher proposed temperatures may necessitate radiation barriers alternating with layers of insulation.
4.1.7.2 Recommended Research Activities Design, construction, and acceptance of the system is critical, but is generally well understood for current system temperatures. Insulation and heat-trace methodologies used in nitrate hot-salt conditions can be used for advanced concepts in cold temperatures, but new approaches will have to be investigated for the hot-side temperatures. Thermal losses will be exacerbated with the increased temperatures of these advanced concept systems and designs/concepts that can minimize these losses are needed.
• Determine best heat-trace and insulation designs for the hot-side temperatures.
• A small system, with selected molten salt present, will be required to test field-like conditions, lifetime, and maintainability. Ensuring thermal uniformity is paramount since hot or cold spots will impact system reliability. Discontinuities in piping, such as valves or components, will require additional effort.
4.1.7.3 Impact It is assumed that heat-trace and insulation solutions exist and that, with appropriate design and selection of materials, requirements specified in plant designs can be met. Reliability, performance, and O&M must be proven in practice. Heat trace represents a significant parasitic loss in current nitrate systems and must be well designed under the more aggressive temperature conditions.
Failures in heat trace would be disastrous for demonstration purposes. Inability to recover from a freeze or to manage thermal transients in the plant could cause unplanned outages, irrecoverable component damage, and freezing problems that would be difficult to recover from.
Technology Gap – Piping 4.1.84.1.8.1 Current Status Solar Two used A106 Grade B carbon steel for cold piping and 304, 304H, 304L were all used for hot piping based on materials tests performed at SNL. The alloys performed well, with the primary issues caused by poorly applied heat trace causing localized overheating and damage (carbon steel corrosion) or stress-corrosion cracking due to the means and methods to flush the system using water. Use of alloy 321 or 347 may mitigate this effect [36]. Cost analysis of a solar-salt power tower assumed use of carbon steel A106 Grade B for the cold-salt loop and 347H for the hot-salt loop [31].
Choice of materials of construction of the piping system will be directly affected by the salt selected. The final selection of material for the cold- and hot-side piping will require both static and dynamic materials testing and a code-case determination before being placed in service.
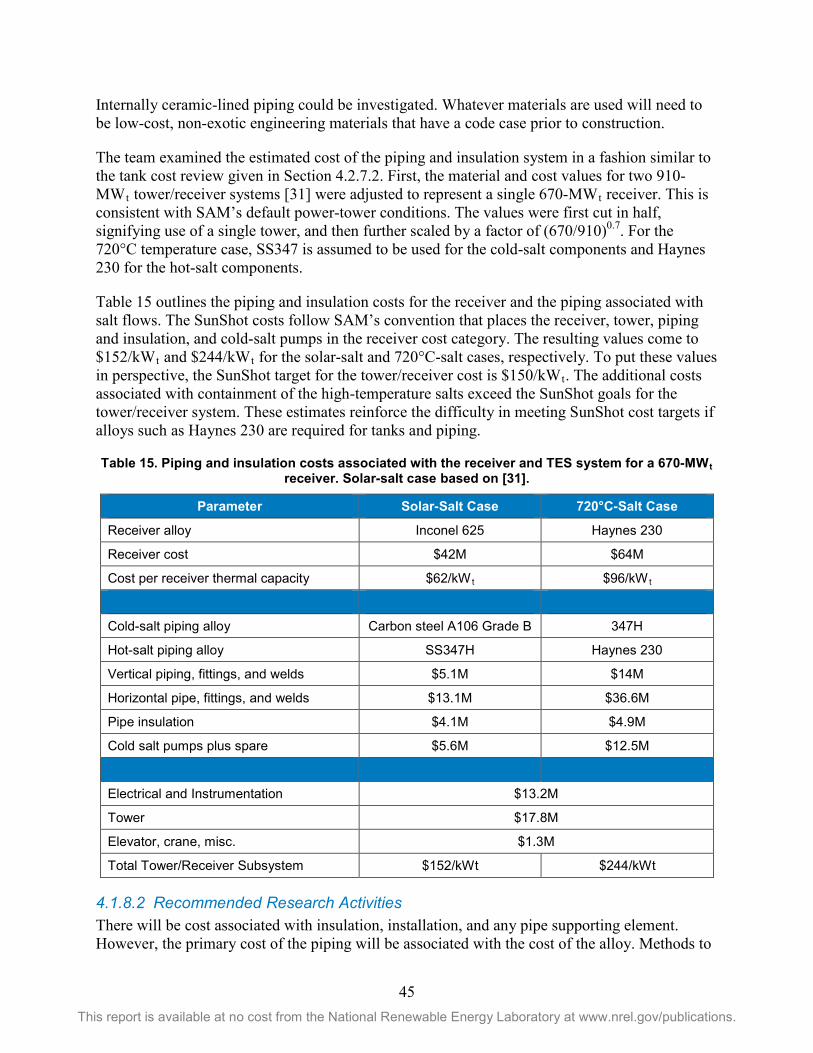
45 This report is available at no cost from the National Renewable Energy Laboratory at www.nrel.gov/publications.
Internally ceramic-lined piping could be investigated. Whatever materials are used will need to be low-cost, non-exotic engineering materials that have a code case prior to construction.
The team examined the estimated cost of the piping and insulation system in a fashion similar to the tank cost review given in Section 4.2.7.2. First, the material and cost values for two 910-MWt tower/receiver systems [31] were adjusted to represent a single 670-MWt receiver. This is consistent with SAM’s default power-tower conditions. The values were first cut in half, signifying use of a single tower, and then further scaled by a factor of (670/910)0.7. For the 720°C temperature case, SS347 is assumed to be used for the cold-salt components and Haynes 230 for the hot-salt components.
Table 15 outlines the piping and insulation costs for the receiver and the piping associated with salt flows. The SunShot costs follow SAM’s convention that places the receiver, tower, piping and insulation, and cold-salt pumps in the receiver cost category. The resulting values come to $152/kWt and $244/kWt for the solar-salt and 720°C-salt cases, respectively. To put these values in perspective, the SunShot target for the tower/receiver cost is $150/kWt. The additional costs associated with containment of the high-temperature salts exceed the SunShot goals for the tower/receiver system. These estimates reinforce the difficulty in meeting SunShot cost targets if alloys such as Haynes 230 are required for tanks and piping.
Table 15. Piping and insulation costs associated with the receiver and TES system for a 670-MWt receiver. Solar-salt case based on [31].
Parameter Solar-Salt Case 720°C-Salt Case
Receiver alloy Inconel 625 Haynes 230
Receiver cost $42M $64M
Cost per receiver thermal capacity $62/kWt $96/kWt
Cold-salt piping alloy Carbon steel A106 Grade B 347H
Hot-salt piping alloy SS347H Haynes 230
Vertical piping, fittings, and welds $5.1M $14M
Horizontal pipe, fittings, and welds $13.1M $36.6M
Pipe insulation $4.1M $4.9M
Cold salt pumps plus spare $5.6M $12.5M
Electrical and Instrumentation $13.2M
Tower $17.8M
Elevator, crane, misc. $1.3M
Total Tower/Receiver Subsystem $152/kWt $244/kWt
4.1.8.2 Recommended Research Activities There will be cost associated with insulation, installation, and any pipe supporting element. However, the primary cost of the piping will be associated with the cost of the alloy. Methods to
46 This report is available at no cost from the National Renewable Energy Laboratory at www.nrel.gov/publications.
minimize the use of high-nickel alloys are imperative to reduce overall cost, with internally insulated piping as one possible suggestion. Internal insulation in itself will likely result in several additional challenges that must be addressed if this concept is pursued.
• Perform relative assessment of piping cost related to the whole system to determine if R&D must be performed to reduce costs.
• Determine the feasibility of using ceramic lined pipe (excluding the receiver). o Methods to heat trace internally insulated piping
o Methods to detect failures in internal insulation as excessive corrosion may occur
• Determine if mechanical properties degradation occur because of high temperatures, and thermal cycling. Weldment evaluations must be included.
• Determine if stress corrosion cracking will occur under operational conditions.
• Implement piping on larger systems to prove in technology in a plant like setting.
• Develop and test strategies for drain back during non-operational hours, as well as recovery from in-pipe freeze events, in order to implement safe restart sequencing.
4.1.8.3 Impact Low-cost piping is another important issue that drives the economic viability of high-temperature molten-salt technology. R&D specific to identifying both design options (i.e., internal insulation) and low-cost materials is critical.
Failure to address a cost effective solution for piping would result in MS technology not being economically feasible. It is assumed that high cost solutions exist with highly alloyed materials.
Technology Gap – Salt-to-sCO2 Heat Exchanger 4.1.94.1.9.1 Current Status Currently, a salt-to-sCO2 heat exchanger does not exist, but designs do exist for salt-to-steam. Micro-channel and printed-circuit heat exchangers (PCHEs) have been proposed for application to sCO2 to minimize stresses by minimizing individual channel size.
4.1.9.2 Recommended Research Activities sCO2 Brayton power blocks require a simplified heat-exchange arrangement because heating the fluid is akin to a superheater for Rankine cycles. Due to recuperation of CO2, the temperature rise in the heat exchanger will be roughly 200°C (e.g., 520°C to 720°C).
Key technical risks unique to the heat exchanger are primarily thermal-related. Strategies need to be developed to avoid thermal shock during start-up by pre-heating, in addition to freeze recovery given the expected use of salt that melts above 400°C. Heat-transfer and pressure-drop values can be determined from empirical correlations for adequate design; but if fouling occurs from either fluid, then heat-transfer performance will decrease.
Solar Two had a tube rupture caused by a freeze/thaw event within the evaporator. Steam was injected into the TES system. sCO2/chloride salt compatibility will need to be understood in case of a leak at the heat exchanger (carbonate salts are inherently stable with CO2).
47 This report is available at no cost from the National Renewable Energy Laboratory at www.nrel.gov/publications.
The unique thermal requirements of the sCO2 cycle require detailed multi-dimensional coupled thermal and structural analysis to guide design and selection decisions. Models need to be developed for each heat-exchanger configuration and run in a systems context to understand potential impact on the power-cycle performance.
• Down-select to a baseline design (three options provided in B&V report).
• Develop strategies pertaining to start up/shut down (thermal ramp, pre-heat, drain, freeze recovery).
• Assess CO2/chloride salt compatibility (carbonate salts are compatible with CO2).
• Demonstrate performance between sCO2 and salt.
4.1.9.3 Impact Advanced heat-exchanger technology is important from both a performance and economic viability standpoint for the technology. Initially, shell-and-tube heat exchangers may be adequate, although they will lack in performance, given the increased wall thickness needed to contain the high pressures required in the sCO2 power block. Reaching SunShot performance and cost goals will require advanced high-pressure, high-performance heat exchangers with very low pressure drop on the CO2 side.
Non-optimal solutions, such as shell and tube, would reduce the economic feasibility of the MS technology. Failure to test an advanced heat exchanger technology would shift risk to any future commercial technology developers.
Technology Gap – Plant Sensors 4.1.10There are many balance-of-plant requirements. Solutions for flow metering, pressure monitoring, tank-level measurement, and flux sensors need to be implemented and proven at these elevated temperatures in a salt environment. Flow metering typically is limited by the high temperature of salts because electronics cannot handle the high temperatures. Although existing plants (Crescent Dunes, Gemasolar) incorporate high-temperature sensors, these are at maximum temperatures of under 600°C, compatible with the cold loop in the proposed plant. Methods or extensions to methods for sensing key elements must be extended to at least 720°C.
4.1.10.1 Current Status Flow Meters: Flow meters used for MS applications are typically an ultrasonic design that operate on the transit-time principle and provide an output directly proportional to the actual MS rate of flow. These devices are usually installed on the cold-salt flow loop. SNL has installed flow meters on several systems up to 585°C and shown that these flow meters can successfully operate at temperature. Current meters have a limited upper temperature range that will not work with the upper temperature of Gen3 systems. The practice of only using flow meters on the cold side with the new salts will need to be investigated.
Pressure Sensors: Currently, there are no known reliable pressure sensors for existing salt systems at the 720°C temperature range. Some sensors use a diaphragm in the salt flow with a NaK-filled flex capillary tube of sufficient length to provide the necessary thermal isolation. NaK has a boiling point of 785°C, so vapor pressure may become an issue at high temperature. The cool side of the capillary tube has a diaphragm with electronics that provides a reading of

48 This report is available at no cost from the National Renewable Energy Laboratory at www.nrel.gov/publications.
pressure. These sensors are temperature-sensitive, will drift with time, and can leak salt from the fitting. Ceramic diaphragm strain gauges also exist for pressure measurement.
Level Sensor: Currently, radar, bubblers, and float-type level sensors are used to measure the hot and cold tanks, emergency vessels, and other tanks. These sensors are susceptible to waves and transients in the salt system and can be unreliable and inaccurate.
Real-Time Flux Feedback: The current need to have real-time flux distribution, uniformity, and levels would improve plant performance and alleviate concerns for overheating and potentially damaging receiver tubes. It would also allow for better control of the heliostat field. Currently, no robust solution exists.
Real-time in situ chemistry monitoring: Develop rapid in situ sensing for critical chemistry systems, including oxide levels, moisture levels, corrosively, ullage gas control, and other sensing as needed for the specified salt system in order to effectively automate control and feedback systems, reducing the critical skills worker requirements.
4.1.10.2 Recommended Research Activities Flow Meter:
• Determine flow meter designs.
• Perform no-flow testing of flow meter technologies at temperature, with salt, to verify that components will support highest-expected temperatures.
• Implement flow meter on larger systems to prove technology in a plant-like setting.
Pressure Sensors:
• Determine pressure-sensor designs.
• Perform no-flow testing of sensor technologies at temperature, with salt, to verify that components will support highest-expected temperatures and ratings.
• Implement pressure sensor on larger systems to prove technology in a plant-like setting.
Level Sensor:
• Determine level-sensor designs.
• Implement level sensor on larger systems to prove technology in a plant-like setting.
Real-Time Flux Feedback:
• Determine sensor designs.
• Develop system and test using a heliostat field.
Chemistry and Corrosion Sensors:
• Corrosion sensors to determine the redox potential of the melts are needed to assess if any chemistry changes are resulting in changes in corrosion mechanisms (i.e., ingress of oxygen or water into chloride melts).
49 This report is available at no cost from the National Renewable Energy Laboratory at www.nrel.gov/publications.
• If internal insulation is developed on the hot tank or hot piping, a sensor is needed to assess insulation failure as acute corrosion will occur on the metal pressure containment.
4.1.10.3 Impact Current sensors exist for temperatures up to 565°–585°C. It is assumed that, with appropriate material choices, sensors would work for the low-temperature portion of the system. Sensors for the high-temperature portions of the system do not currently exist and would be a risk in operation/system reliability if no solutions are determined. It is unclear if active thermal management of sensors would be an adequate solution, an engineering activity, or—if different technologies are required—a research activity. Chemical sensors for chloride melts are imperative because a solution here may be an enabling technology to monitor and control the corrosion potential of the chloride salt.
Technology Gap – Component Test Facilities 4.1.11Component test facilities for molten nitrate salts are relatively limited.
4.1.11.1 Recommended Research Activities Existing facilities may not be capable of supporting representative temperatures and flow rates with the selected salts. If this cannot be done with existing facilities, then test facilities capable of demonstrating valves, pumps, sensors, piping, heat trace, and other ancillary equipment at representative full scale (physical size and flow rates) for extended periods of time must be constructed and commissioned. The flow rates will depend on the optimized commercial deployment plant scale as well as selected salt chemistry, and may need to reach 300 L/s at pressures to 4 MPa.
Smaller-scale and laboratory tests can (and should) qualify materials and guide the design of components and test facilities, but without full-scale representative testing it would be difficult to justify the risk against the cost of a full scale plant. Test programs should be developed with sufficient exposure time, cycling (thermal and flow), and post-test analysis to develop technical and economic confidence in the selected solutions. Repair, replacement, and re-design after deployment can be prohibitively expensive.
A potpourri of small test facilities exists around the United States that pertain to different MS chemistries. Fluoride-based salts, such as FLiNaK or FLiBe, are among the most popular due to their historic use in nuclear reactors.
Several institutions have test equipment for FLiNaK. Oak Ridge National Laboratory (ORNL) has a small test loop for proving out salt-to-salt heat exchangers, pump designs, small valves, and instrumentation. University of Wisconsin -Madison also has some flow capabilities for fluoride salts.
University of Arizona is currently working on a chloride salt test facility flow loop, consisting of a pump, holding tank, and flow segment. Chloride salts could potentially leverage fluoride test facilities by removing FLiNaK and then using a chloride salt, assuming the materials of construction are compatible. Texas A&M is currently intending to build a high-temperature salt test facility, but is in the process of finalizing both design and funding for the project. More
50 This report is available at no cost from the National Renewable Energy Laboratory at www.nrel.gov/publications.
facilities may come on line because Southern Company was awarded up to $40M from the DOE to pursue molten chloride fast reactors (MCFRs).
No facilities currently exist for carbonate salts. Carbonate salts have been shown to be compatible with alloy 347 up 650°C [42], but there is a dependence on the concentration of CO2 to air [43], which highlights the need to specify gas chemistries used. This information may allow a retrofit of existing facilities that currently employ nitrate salts and allow testing of carbonate salt components up to 585°C, which would allow proving in of system sensors (flow, pressure, level), pumps, valves, and heat trace that could be sized for a demonstration system.
• Specify preliminary component requirements and identify type of facilities required. o Previous examples: Long-Shafted Pump experiments [40], Pump and Valve Tests,
Cold Fill, Freeze/Thaw Procedures, Component Tests, and instrumentations tests [44].
• Determine key technical risks and generate prioritized experimental and modeling risk mitigation plan.
• Perform component testing and document lessons learned.
• Determine requirements/needs for test facilities.
o Facilities will need to be varied in both size and complexity. Needs will range from a proof-of-concept bench-scale to intermediate and eventually full-sun testing. The path must be defined by relevant stakeholders.
• Develop associated component models for Gen3 plant.
• Determine if salt melt requirements have any environmental concerns, e.g., off-gas treatment requirements.
• Determine freeze-recovery methodology for salts with melting points over 400°C.
Molten-Salt Technology Summary 4.1.12In summary, molten-salt technology represents the most familiar path toward the Gen3 goals; however, knowledge around the selection of a high-temperature molten salt is needed, especially with regard to materials that achieve acceptable strength, durability, and cost targets at high temperatures (>700°C). Corrosion mechanism differs among candidate salts and information is needed for component designers. Once salt and containment materials are selected, components are expected to have similar design challenges that were observed at the Solar Two project, although some components, such as the hot tank, will require a redesign to accommodate an inexpensive material able to achieve cost metrics.
Critical subsystems are viewed primarily as engineering tasks. For example, heat trace must be proven out such that parasitic heat loads do not impact the profitability of CSP system for the utilities. Demonstrating that subsystem designs meet acceptable cost and reliability will be the primary challenge to be overcome in the demonstration of a 720°C molten-salt system.
Reliability problems in current CSP plants have been due to inadequate construction and poor quality control. At higher temperatures, components and systems need to be as simple as possible
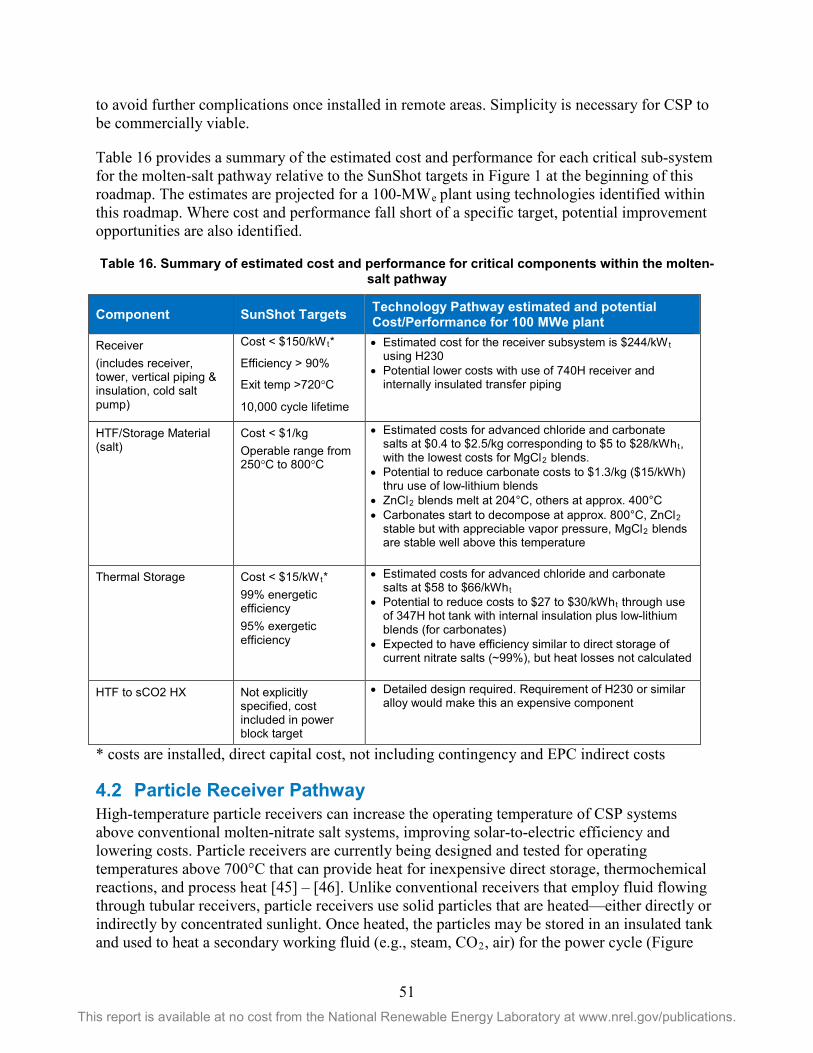
51 This report is available at no cost from the National Renewable Energy Laboratory at www.nrel.gov/publications.
to avoid further complications once installed in remote areas. Simplicity is necessary for CSP to be commercially viable.
Table 16 provides a summary of the estimated cost and performance for each critical sub-system for the molten-salt pathway relative to the SunShot targets in Figure 1 at the beginning of this roadmap. The estimates are projected for a 100-MWe plant using technologies identified within this roadmap. Where cost and performance fall short of a specific target, potential improvement opportunities are also identified.
Table 16. Summary of estimated cost and performance for critical components within the molten-salt pathway
Component SunShot Targets Technology Pathway estimated and potential Cost/Performance for 100 MWe plant
Receiver (includes receiver, tower, vertical piping & insulation, cold salt pump)
Cost < $150/kWt*
Efficiency > 90%
Exit temp >720°C
10,000 cycle lifetime
• Estimated cost for the receiver subsystem is $244/kWt using H230
• Potential lower costs with use of 740H receiver and internally insulated transfer piping
HTF/Storage Material (salt)
Cost < $1/kg Operable range from 250°C to 800°C
• Estimated costs for advanced chloride and carbonate salts at $0.4 to $2.5/kg corresponding to $5 to $28/kWht, with the lowest costs for MgCl2 blends.
• Potential to reduce carbonate costs to $1.3/kg ($15/kWh) thru use of low-lithium blends
• ZnCl2 blends melt at 204°C, others at approx. 400°C • Carbonates start to decompose at approx. 800°C, ZnCl2
stable but with appreciable vapor pressure, MgCl2 blends are stable well above this temperature
Thermal Storage Cost < $15/kWt* 99% energetic efficiency 95% exergetic efficiency
• Estimated costs for advanced chloride and carbonate salts at $58 to $66/kWht
• Potential to reduce costs to $27 to $30/kWht through use of 347H hot tank with internal insulation plus low-lithium blends (for carbonates)
• Expected to have efficiency similar to direct storage of current nitrate salts (~99%), but heat losses not calculated
HTF to sCO2 HX Not explicitly specified, cost included in power block target
• Detailed design required. Requirement of H230 or similar alloy would make this an expensive component
* costs are installed, direct capital cost, not including contingency and EPC indirect costs
4.2 Particle Receiver Pathway High-temperature particle receivers can increase the operating temperature of CSP systems above conventional molten-nitrate salt systems, improving solar-to-electric efficiency and lowering costs. Particle receivers are currently being designed and tested for operating temperatures above 700°C that can provide heat for inexpensive direct storage, thermochemical reactions, and process heat [45] – [46]. Unlike conventional receivers that employ fluid flowing through tubular receivers, particle receivers use solid particles that are heated—either directly or indirectly by concentrated sunlight. Once heated, the particles may be stored in an insulated tank and used to heat a secondary working fluid (e.g., steam, CO2, air) for the power cycle (Figure
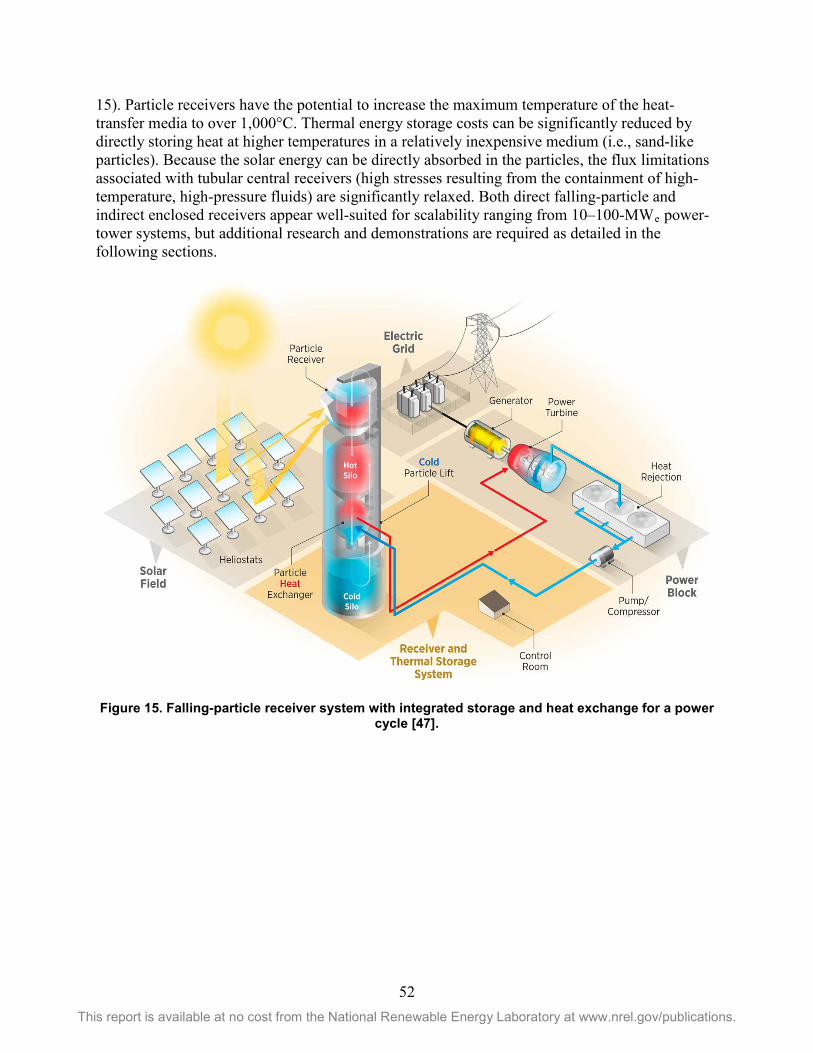
52 This report is available at no cost from the National Renewable Energy Laboratory at www.nrel.gov/publications.
15). Particle receivers have the potential to increase the maximum temperature of the heat-transfer media to over 1,000°C. Thermal energy storage costs can be significantly reduced by directly storing heat at higher temperatures in a relatively inexpensive medium (i.e., sand-like particles). Because the solar energy can be directly absorbed in the particles, the flux limitations associated with tubular central receivers (high stresses resulting from the containment of high-temperature, high-pressure fluids) are significantly relaxed. Both direct falling-particle and indirect enclosed receivers appear well-suited for scalability ranging from 10–100-MWe power-tower systems, but additional research and demonstrations are required as detailed in the following sections.
Figure 15. Falling-particle receiver system with integrated storage and heat exchange for a power cycle [47].
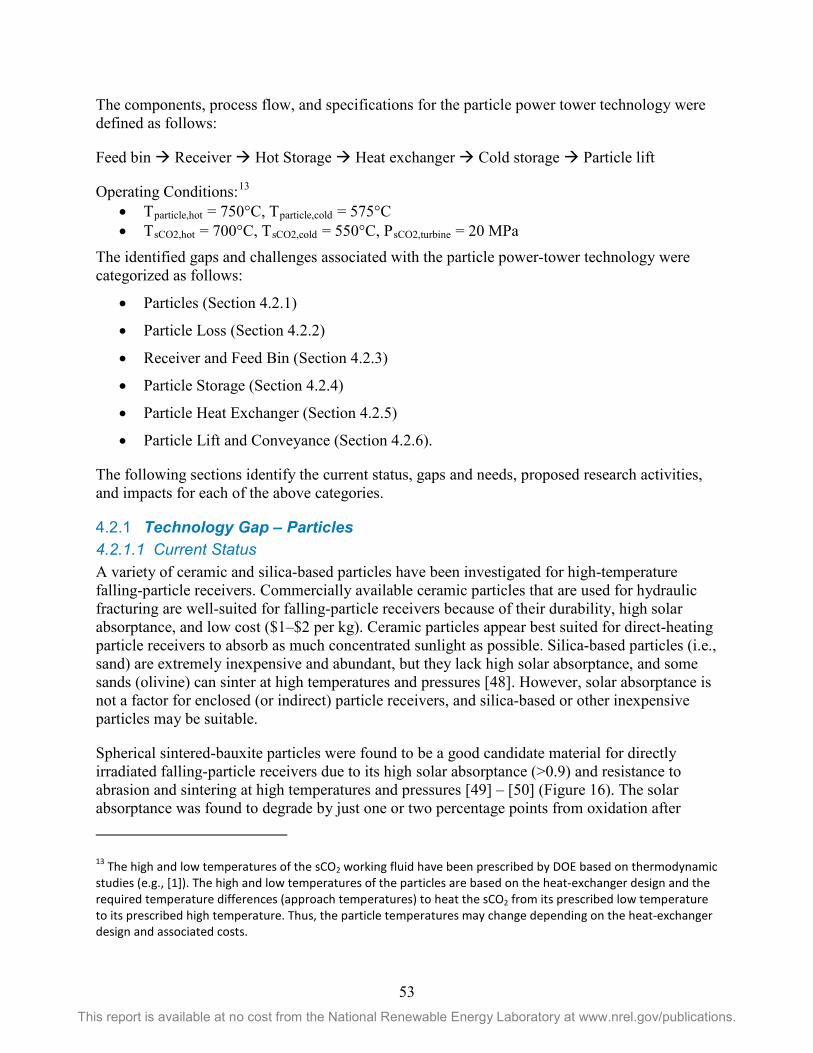
53 This report is available at no cost from the National Renewable Energy Laboratory at www.nrel.gov/publications.
The components, process flow, and specifications for the particle power tower technology were defined as follows:
Feed bin Receiver Hot Storage Heat exchanger Cold storage Particle lift
Operating Conditions:13 • Tparticle,hot = 750°C, Tparticle,cold = 575°C • TsCO2,hot = 700°C, TsCO2,cold = 550°C, PsCO2,turbine = 20 MPa
The identified gaps and challenges associated with the particle power-tower technology were categorized as follows:
• Particles (Section 4.2.1)
• Particle Loss (Section 4.2.2)
• Receiver and Feed Bin (Section 4.2.3)
• Particle Storage (Section 4.2.4)
• Particle Heat Exchanger (Section 4.2.5)
• Particle Lift and Conveyance (Section 4.2.6).
The following sections identify the current status, gaps and needs, proposed research activities, and impacts for each of the above categories.
Technology Gap – Particles 4.2.14.2.1.1 Current Status A variety of ceramic and silica-based particles have been investigated for high-temperature falling-particle receivers. Commercially available ceramic particles that are used for hydraulic fracturing are well-suited for falling-particle receivers because of their durability, high solar absorptance, and low cost ($1–$2 per kg). Ceramic particles appear best suited for direct-heating particle receivers to absorb as much concentrated sunlight as possible. Silica-based particles (i.e., sand) are extremely inexpensive and abundant, but they lack high solar absorptance, and some sands (olivine) can sinter at high temperatures and pressures [48]. However, solar absorptance is not a factor for enclosed (or indirect) particle receivers, and silica-based or other inexpensive particles may be suitable.
Spherical sintered-bauxite particles were found to be a good candidate material for directly irradiated falling-particle receivers due to its high solar absorptance (>0.9) and resistance to abrasion and sintering at high temperatures and pressures [49] – [50] (Figure 16). The solar absorptance was found to degrade by just one or two percentage points from oxidation after
13 The high and low temperatures of the sCO2 working fluid have been prescribed by DOE based on thermodynamic studies (e.g., [1]). The high and low temperatures of the particles are based on the heat-exchanger design and the required temperature differences (approach temperatures) to heat the sCO2 from its prescribed low temperature to its prescribed high temperature. Thus, the particle temperatures may change depending on the heat-exchanger design and associated costs.
54 This report is available at no cost from the National Renewable Energy Laboratory at www.nrel.gov/publications.
continuous heating in air over 700°C for 500 hours, but appeared to stabilize [50]. The particle solar absorptance could be rejuvenated through thermal or chemical reduction. Alternative formulations using dark metal-oxide pigments added to ceramic particles were also evaluated, but none were significantly better than the commercially available products. Simulations and tests were performed to evaluate the impact of particle size and release location on the particle flow dynamics in the presence of wind for direct particle receivers. Results showed that particle sizes between 100 and 700 microns were ideal for maintaining a stable particle flow while maintaining efficient heating by solar radiation. Smaller particles are better for efficient heating and for transferring heat to surfaces (e.g., heat exchangers) due to their greater ratio of surface area to volume. The 1-MWt system deployed at Sandia uses CARBO Accucast ID50 particles with a nominal diameter of ~280 microns.
NREL and Babcock and Wilcox (B&W) compared different particle materials for their enclosed particle receiver and selected Calcined Flint Clay (CFC) mined in Missouri. CFC is calcined fireclay with high refractory. It mainly consists of SiO2 and Al2O3, which are contained in CARBO proppants, as well. This material is used primarily by the refractory industry for manufacturing fire bricks. The material is also used in fluidized-bed boilers as bed filler and is stable at high temperature (sintering tested at 800°C). The primary advantage of CFC is its low cost (about $0.18/kg vs $1–$2/kg for CARBO proppants).
King Saud University has been considering spent catalysts (~1 mm) in cooperation with industry in Saudi Arabia. The spent catalysts are essentially free and may provide a very low-cost option.
Figure 16. Spherical ceramic particles provide high solar absorptance and durability.
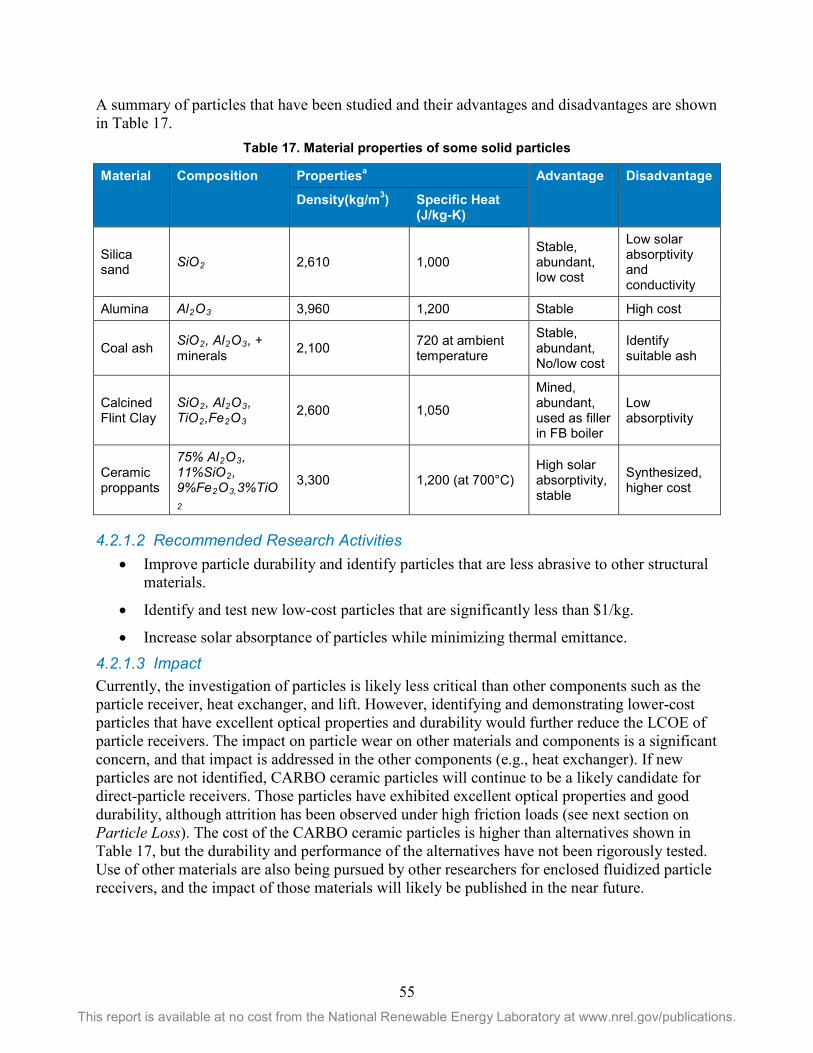
55 This report is available at no cost from the National Renewable Energy Laboratory at www.nrel.gov/publications.
A summary of particles that have been studied and their advantages and disadvantages are shown in Table 17.
Table 17. Material properties of some solid particles
Material Composition Propertiesa Advantage Disadvantage
Density(kg/m3) Specific Heat (J/kg-K)
Silica sand SiO2 2,610 1,000
Stable, abundant, low cost
Low solar absorptivity and conductivity
Alumina Al2O3 3,960 1,200 Stable High cost
Coal ash SiO2, Al2O3, + minerals 2,100 720 at ambient
temperature
Stable, abundant, No/low cost
Identify suitable ash
Calcined Flint Clay
SiO2, Al2O3, TiO2,Fe2O3
2,600 1,050
Mined, abundant, used as filler in FB boiler
Low absorptivity
Ceramic proppants
75% Al2O3, 11%SiO2, 9%Fe2O3,3%TiO2
3,300 1,200 (at 700°C) High solar absorptivity, stable
Synthesized, higher cost
4.2.1.2 Recommended Research Activities • Improve particle durability and identify particles that are less abrasive to other structural
materials.
• Identify and test new low-cost particles that are significantly less than $1/kg.
• Increase solar absorptance of particles while minimizing thermal emittance.
4.2.1.3 Impact Currently, the investigation of particles is likely less critical than other components such as the particle receiver, heat exchanger, and lift. However, identifying and demonstrating lower-cost particles that have excellent optical properties and durability would further reduce the LCOE of particle receivers. The impact on particle wear on other materials and components is a significant concern, and that impact is addressed in the other components (e.g., heat exchanger). If new particles are not identified, CARBO ceramic particles will continue to be a likely candidate for direct-particle receivers. Those particles have exhibited excellent optical properties and good durability, although attrition has been observed under high friction loads (see next section on Particle Loss). The cost of the CARBO ceramic particles is higher than alternatives shown in Table 17, but the durability and performance of the alternatives have not been rigorously tested. Use of other materials are also being pursued by other researchers for enclosed fluidized particle receivers, and the impact of those materials will likely be published in the near future.
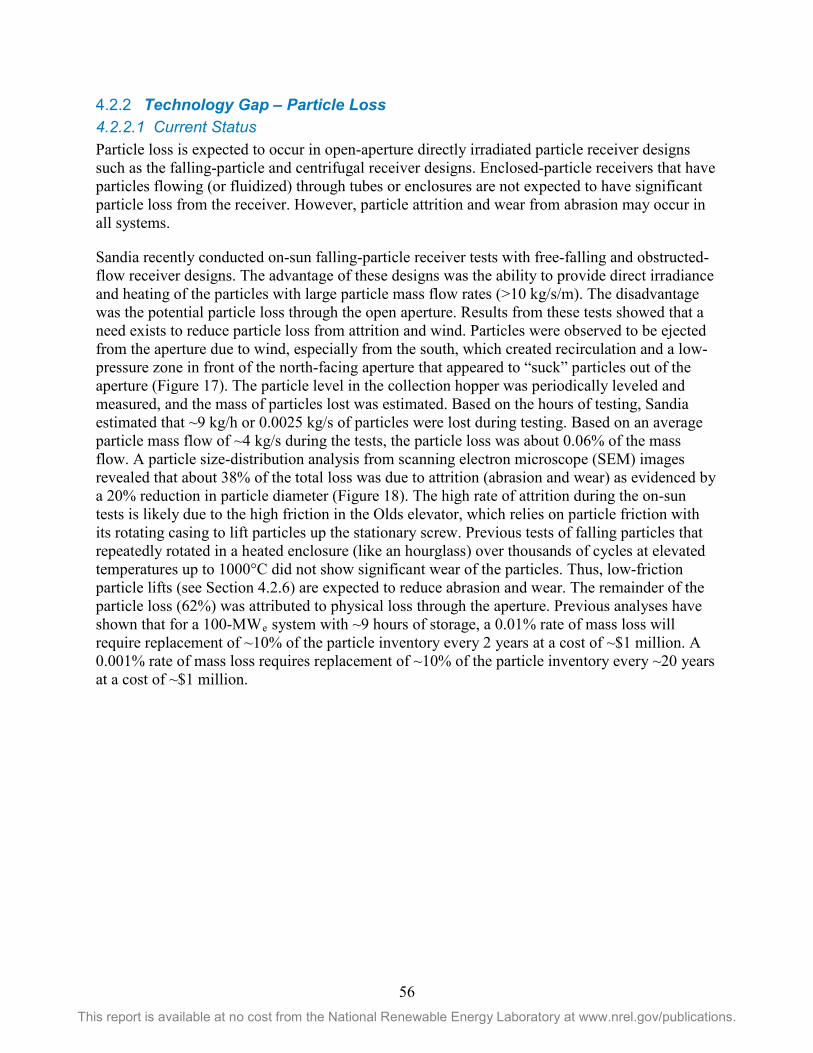
56 This report is available at no cost from the National Renewable Energy Laboratory at www.nrel.gov/publications.
Technology Gap – Particle Loss 4.2.24.2.2.1 Current Status Particle loss is expected to occur in open-aperture directly irradiated particle receiver designs such as the falling-particle and centrifugal receiver designs. Enclosed-particle receivers that have particles flowing (or fluidized) through tubes or enclosures are not expected to have significant particle loss from the receiver. However, particle attrition and wear from abrasion may occur in all systems.
Sandia recently conducted on-sun falling-particle receiver tests with free-falling and obstructed-flow receiver designs. The advantage of these designs was the ability to provide direct irradiance and heating of the particles with large particle mass flow rates (>10 kg/s/m). The disadvantage was the potential particle loss through the open aperture. Results from these tests showed that a need exists to reduce particle loss from attrition and wind. Particles were observed to be ejected from the aperture due to wind, especially from the south, which created recirculation and a low-pressure zone in front of the north-facing aperture that appeared to “suck” particles out of the aperture (Figure 17). The particle level in the collection hopper was periodically leveled and measured, and the mass of particles lost was estimated. Based on the hours of testing, Sandia estimated that ~9 kg/h or 0.0025 kg/s of particles were lost during testing. Based on an average particle mass flow of ~4 kg/s during the tests, the particle loss was about 0.06% of the mass flow. A particle size-distribution analysis from scanning electron microscope (SEM) images revealed that about 38% of the total loss was due to attrition (abrasion and wear) as evidenced by a 20% reduction in particle diameter (Figure 18). The high rate of attrition during the on-sun tests is likely due to the high friction in the Olds elevator, which relies on particle friction with its rotating casing to lift particles up the stationary screw. Previous tests of falling particles that repeatedly rotated in a heated enclosure (like an hourglass) over thousands of cycles at elevated temperatures up to 1000°C did not show significant wear of the particles. Thus, low-friction particle lifts (see Section 4.2.6) are expected to reduce abrasion and wear. The remainder of the particle loss (62%) was attributed to physical loss through the aperture. Previous analyses have shown that for a 100-MWe system with ~9 hours of storage, a 0.01% rate of mass loss will require replacement of ~10% of the particle inventory every 2 years at a cost of ~$1 million. A 0.001% rate of mass loss requires replacement of ~10% of the particle inventory every ~20 years at a cost of ~$1 million.
57 This report is available at no cost from the National Renewable Energy Laboratory at www.nrel.gov/publications.
Figure 17. Particle loss from aperture during on-sun tests.
Figure 18. SEM images of ACCUCAST ID50 before (left) and after (right) 187 hours of testing in the
on-sun particle receiver prototype. Average particle diameter was reduced by ~20%.
Researchers have also looked at enclosed-particle receivers to mitigate particle losses [51] [52]. Fluidized- and flowing-bed tubular designs have been proposed and tested [53]. Attrition of particles in enclosed receiver designs is uncertain. Abrasion of particles along the walls of tubes in which particles are flowing may be greater than in free-falling systems, but the lower velocities may reduce attrition. In fluidized systems, the particle size and fluidization velocity can be controlled to reduce attrition. However, additional challenges for enclosed-particle receivers include maintaining a sufficient wall-to-particle heat-transfer coefficient for suitable wall solar-flux absorption.
Fine particles and dust created from particle abrasion in open-aperture receivers may cause soiling on the heliostats, but evidence of soiling and reduced reflectance was not observed during nearly 200 hours of testing of an open-aperture falling-particle receiver at Sandia (heliostats produced the same power on days with equivalent direct-normal irradiance as measured by a radiometer).
58 This report is available at no cost from the National Renewable Energy Laboratory at www.nrel.gov/publications.
Suspended particulate matter that may be inhaled (PM2.5–PM10 or particle sizes less than 2.5–10 microns) can pose health concerns. Face masks rated for PM2.5 (which are widely available and cheap) can be worn when working near open-aperture particle receivers to reduce these risks. Mechanical screens or filters can be used within the particle receiver system to filter small particulates (say, less than ~50–100 microns) from the system for subsequent containment or disposal.
4.2.2.2 Recommended Research Activities • Reduction of particle loss: Identify and test methods to reduce particle loss in open
falling particle receiver systems.
o Identify amount of particle loss and characterize particulate sizes to assess potential soiling and personal protective equipment requirements.
• Receiver geometry: Design and test improved cavity geometries that minimize particle and heat loss due to convection.
• Enclosed receiver designs: Re-evaluate existing designs for gravity-based and fluidized enclosed receiver designs.
• Low-friction particle lifts: Identify and test particle lifts that do not abrade particles.
4.2.2.3 Impact Reduction of particle loss is important, but not critical, to the scale-up of the particle receiver. Scaling up the particle receiver will naturally increase the volume-to-area ratio of the receiver, which should reduce physical particle loss through the receiver with direct particle heating receivers. Enclosed particle receivers are not expected to have significant particle loss. Also, the use of low-friction skip hoists in larger-scale systems will reduce attrition due to abrasion. However, testing methods to reduce particle loss will provide the additional benefit of reducing convective and radiative losses, which could substantially increase the particle-receiver thermal efficiency. If particle-loss reduction methods are not pursued, additional costs of replacing the particles will be required. Analyses have shown that if the particle loss is 0.01% or 0.001% of the particle mass flow, then replacement costs for 10% of the particle inventory for a 100-MWe plant with 9 hours of storage will have to occur at 2 years or 20 years, respectively, at a particle replacement cost of ~$1–$2 million.
Technology Gap – Receiver and Feed Bin 4.2.34.2.3.1 Current Status Previous studies have considered alternative particle receiver designs including free-falling [54], obstructed flow [55] [56], centrifugal [57] [58] [59] [60], flow in tubes with or without fluidization [61] [62] [46] [51] [52] [53] [63], multi-pass recirculation [47] [64] north- or south-facing [45] [65], and face-down configurations [66]. In general, these particle receivers can be categorized as either direct or enclosed particle-heating receivers. Direct particle-heating receivers irradiate the particles directly as they fall through a receiver, whereas enclosed particle-heating receivers use tubes or other enclosures to convey and heat the particles. A single particle receiver may be used with a directional (e.g., north) heliostat field, or multiple particle receivers facing toward each quadrant (e.g., north, east, south, west) may be implemented to accommodate a surrounding heliostat field.
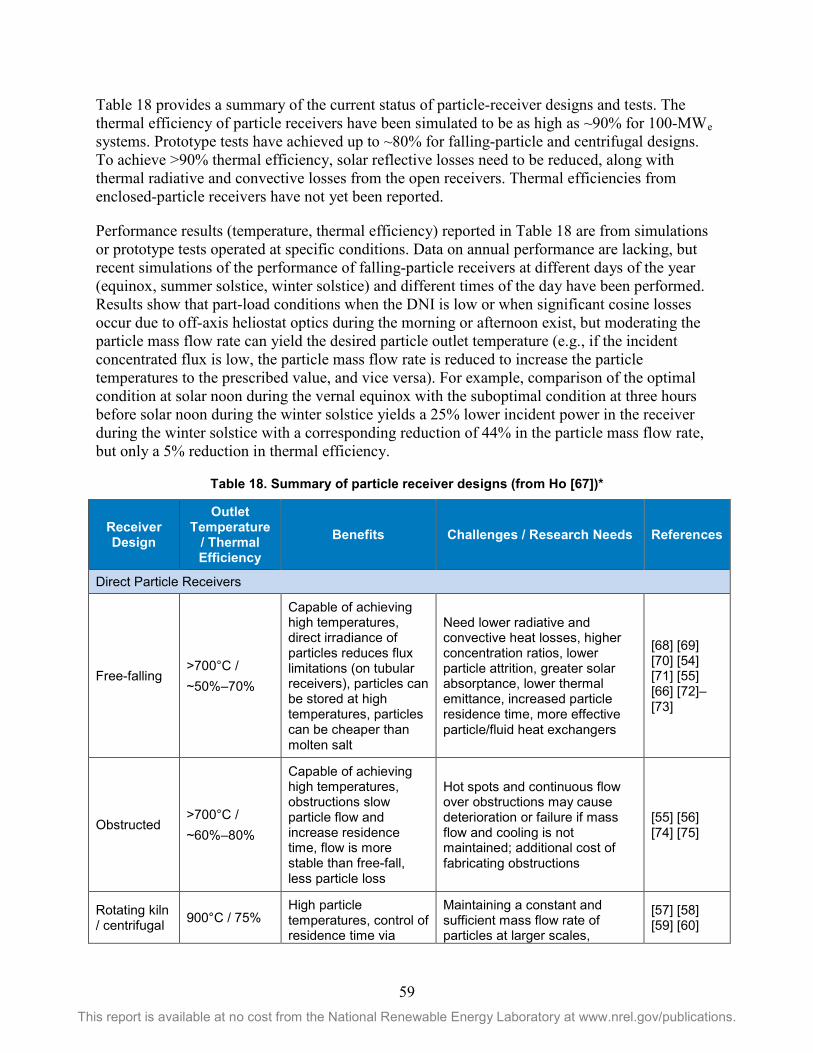
59 This report is available at no cost from the National Renewable Energy Laboratory at www.nrel.gov/publications.
Table 18 provides a summary of the current status of particle-receiver designs and tests. The thermal efficiency of particle receivers have been simulated to be as high as ~90% for 100-MWe systems. Prototype tests have achieved up to ~80% for falling-particle and centrifugal designs. To achieve >90% thermal efficiency, solar reflective losses need to be reduced, along with thermal radiative and convective losses from the open receivers. Thermal efficiencies from enclosed-particle receivers have not yet been reported.
Performance results (temperature, thermal efficiency) reported in Table 18 are from simulations or prototype tests operated at specific conditions. Data on annual performance are lacking, but recent simulations of the performance of falling-particle receivers at different days of the year (equinox, summer solstice, winter solstice) and different times of the day have been performed. Results show that part-load conditions when the DNI is low or when significant cosine losses occur due to off-axis heliostat optics during the morning or afternoon exist, but moderating the particle mass flow rate can yield the desired particle outlet temperature (e.g., if the incident concentrated flux is low, the particle mass flow rate is reduced to increase the particle temperatures to the prescribed value, and vice versa). For example, comparison of the optimal condition at solar noon during the vernal equinox with the suboptimal condition at three hours before solar noon during the winter solstice yields a 25% lower incident power in the receiver during the winter solstice with a corresponding reduction of 44% in the particle mass flow rate, but only a 5% reduction in thermal efficiency.
Table 18. Summary of particle receiver designs (from Ho [67])*
Receiver Design
Outlet Temperature
/ Thermal Efficiency
Benefits Challenges / Research Needs References
Direct Particle Receivers
Free-falling >700°C / ~50%–70%
Capable of achieving high temperatures, direct irradiance of particles reduces flux limitations (on tubular receivers), particles can be stored at high temperatures, particles can be cheaper than molten salt
Need lower radiative and convective heat losses, higher concentration ratios, lower particle attrition, greater solar absorptance, lower thermal emittance, increased particle residence time, more effective particle/fluid heat exchangers
[68] [69] [70] [54] [71] [55] [66] [72]– [73]
Obstructed >700°C / ~60%–80%
Capable of achieving high temperatures, obstructions slow particle flow and increase residence time, flow is more stable than free-fall, less particle loss
Hot spots and continuous flow over obstructions may cause deterioration or failure if mass flow and cooling is not maintained; additional cost of fabricating obstructions
[55] [56] [74] [75]
Rotating kiln / centrifugal 900°C / 75%
High particle temperatures, control of residence time via
Maintaining a constant and sufficient mass flow rate of particles at larger scales,
[57] [58] [59] [60]
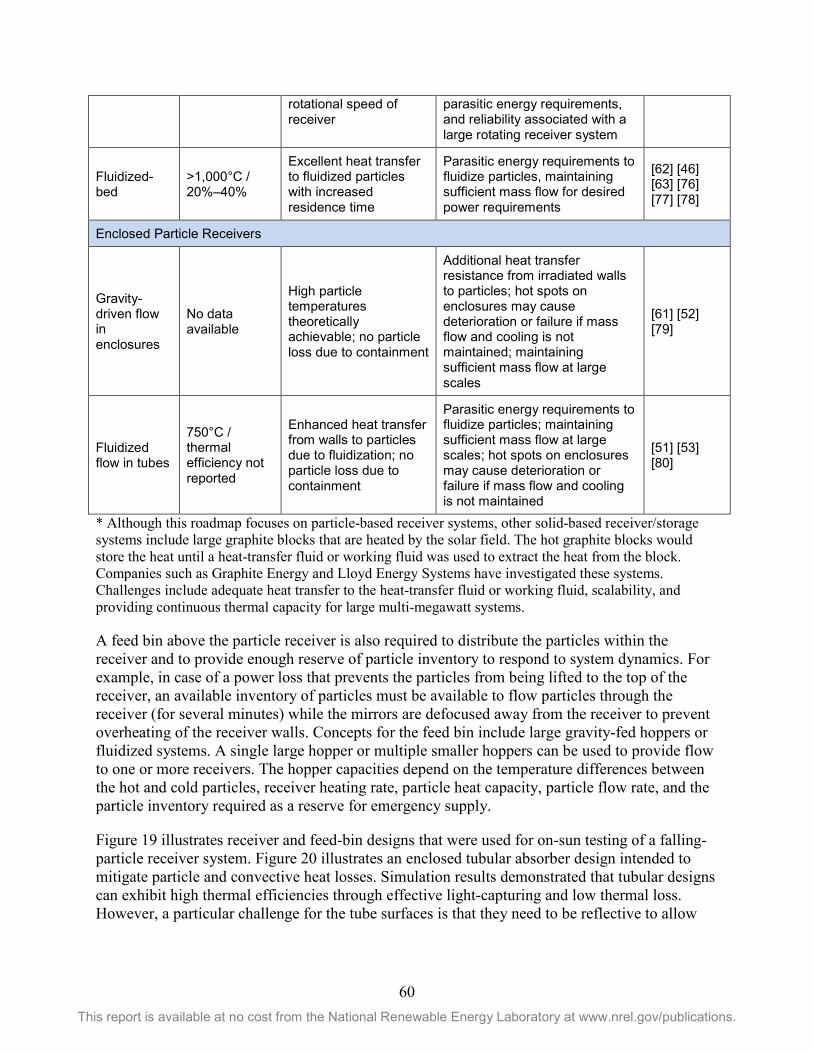
60 This report is available at no cost from the National Renewable Energy Laboratory at www.nrel.gov/publications.
* Although this roadmap focuses on particle-based receiver systems, other solid-based receiver/storage systems include large graphite blocks that are heated by the solar field. The hot graphite blocks would store the heat until a heat-transfer fluid or working fluid was used to extract the heat from the block. Companies such as Graphite Energy and Lloyd Energy Systems have investigated these systems. Challenges include adequate heat transfer to the heat-transfer fluid or working fluid, scalability, and providing continuous thermal capacity for large multi-megawatt systems.
A feed bin above the particle receiver is also required to distribute the particles within the receiver and to provide enough reserve of particle inventory to respond to system dynamics. For example, in case of a power loss that prevents the particles from being lifted to the top of the receiver, an available inventory of particles must be available to flow particles through the receiver (for several minutes) while the mirrors are defocused away from the receiver to prevent overheating of the receiver walls. Concepts for the feed bin include large gravity-fed hoppers or fluidized systems. A single large hopper or multiple smaller hoppers can be used to provide flow to one or more receivers. The hopper capacities depend on the temperature differences between the hot and cold particles, receiver heating rate, particle heat capacity, particle flow rate, and the particle inventory required as a reserve for emergency supply.
Figure 19 illustrates receiver and feed-bin designs that were used for on-sun testing of a falling-particle receiver system. Figure 20 illustrates an enclosed tubular absorber design intended to mitigate particle and convective heat losses. Simulation results demonstrated that tubular designs can exhibit high thermal efficiencies through effective light-capturing and low thermal loss. However, a particular challenge for the tube surfaces is that they need to be reflective to allow
rotational speed of receiver
parasitic energy requirements, and reliability associated with a large rotating receiver system
Fluidized-bed
>1,000°C / 20%–40%
Excellent heat transfer to fluidized particles with increased residence time
Parasitic energy requirements to fluidize particles, maintaining sufficient mass flow for desired power requirements
[62] [46] [63] [76] [77] [78]
Enclosed Particle Receivers
Gravity-driven flow in enclosures
No data available
High particle temperatures theoretically achievable; no particle loss due to containment
Additional heat transfer resistance from irradiated walls to particles; hot spots on enclosures may cause deterioration or failure if mass flow and cooling is not maintained; maintaining sufficient mass flow at large scales
[61] [52] [79]
Fluidized flow in tubes
750°C / thermal efficiency not reported
Enhanced heat transfer from walls to particles due to fluidization; no particle loss due to containment
Parasitic energy requirements to fluidize particles; maintaining sufficient mass flow at large scales; hot spots on enclosures may cause deterioration or failure if mass flow and cooling is not maintained
[51] [53] [80]
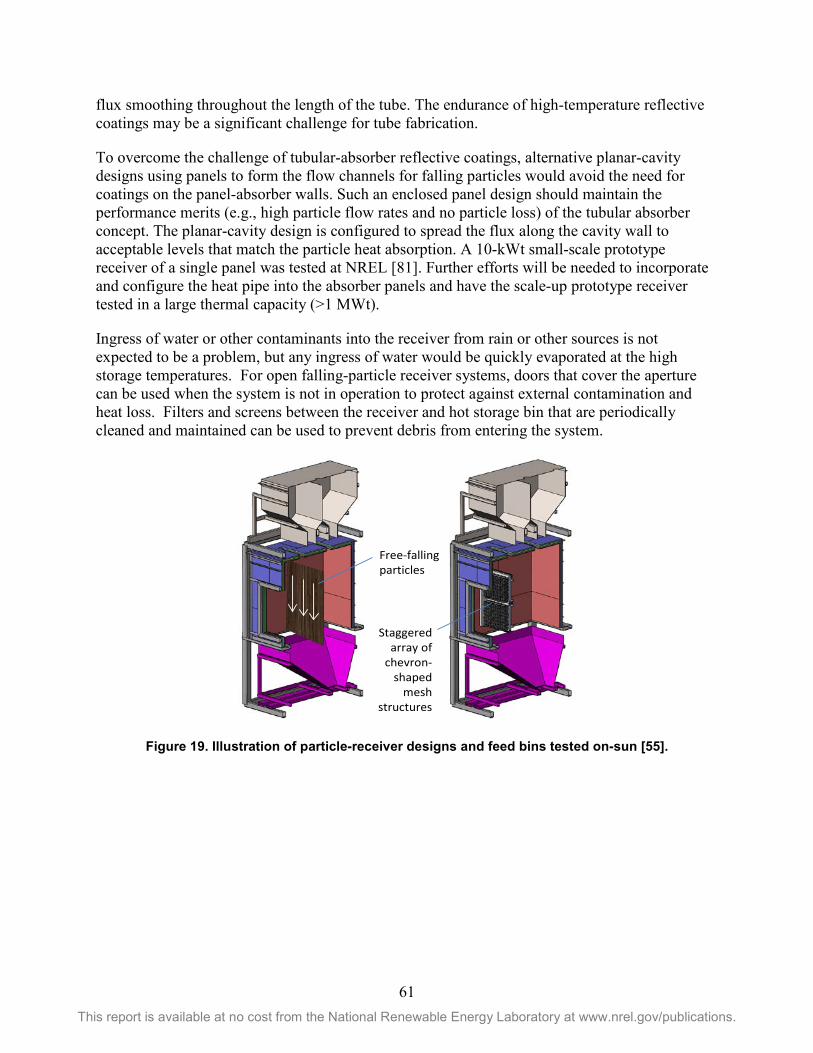
61 This report is available at no cost from the National Renewable Energy Laboratory at www.nrel.gov/publications.
flux smoothing throughout the length of the tube. The endurance of high-temperature reflective coatings may be a significant challenge for tube fabrication.
To overcome the challenge of tubular-absorber reflective coatings, alternative planar-cavity designs using panels to form the flow channels for falling particles would avoid the need for coatings on the panel-absorber walls. Such an enclosed panel design should maintain the performance merits (e.g., high particle flow rates and no particle loss) of the tubular absorber concept. The planar-cavity design is configured to spread the flux along the cavity wall to acceptable levels that match the particle heat absorption. A 10-kWt small-scale prototype receiver of a single panel was tested at NREL [81]. Further efforts will be needed to incorporate and configure the heat pipe into the absorber panels and have the scale-up prototype receiver tested in a large thermal capacity (>1 MWt).
Ingress of water or other contaminants into the receiver from rain or other sources is not expected to be a problem, but any ingress of water would be quickly evaporated at the high storage temperatures. For open falling-particle receiver systems, doors that cover the aperture can be used when the system is not in operation to protect against external contamination and heat loss. Filters and screens between the receiver and hot storage bin that are periodically cleaned and maintained can be used to prevent debris from entering the system.
Figure 19. Illustration of particle-receiver designs and feed bins tested on-sun [55].
Free-falling particles
Staggered array of
chevron-shaped
mesh structures
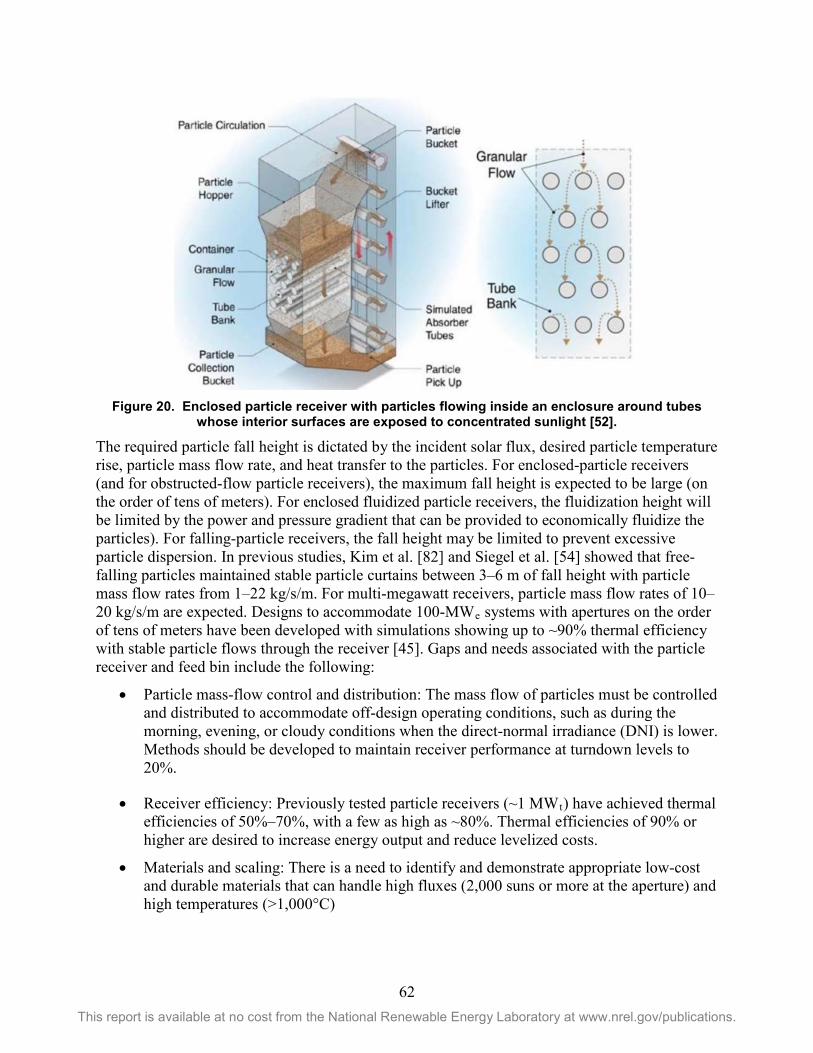
62 This report is available at no cost from the National Renewable Energy Laboratory at www.nrel.gov/publications.
Figure 20. Enclosed particle receiver with particles flowing inside an enclosure around tubes
whose interior surfaces are exposed to concentrated sunlight [52].
The required particle fall height is dictated by the incident solar flux, desired particle temperature rise, particle mass flow rate, and heat transfer to the particles. For enclosed-particle receivers (and for obstructed-flow particle receivers), the maximum fall height is expected to be large (on the order of tens of meters). For enclosed fluidized particle receivers, the fluidization height will be limited by the power and pressure gradient that can be provided to economically fluidize the particles). For falling-particle receivers, the fall height may be limited to prevent excessive particle dispersion. In previous studies, Kim et al. [82] and Siegel et al. [54] showed that free-falling particles maintained stable particle curtains between 3–6 m of fall height with particle mass flow rates from 1–22 kg/s/m. For multi-megawatt receivers, particle mass flow rates of 10–20 kg/s/m are expected. Designs to accommodate 100-MWe systems with apertures on the order of tens of meters have been developed with simulations showing up to ~90% thermal efficiency with stable particle flows through the receiver [45]. Gaps and needs associated with the particle receiver and feed bin include the following:
• Particle mass-flow control and distribution: The mass flow of particles must be controlled and distributed to accommodate off-design operating conditions, such as during the morning, evening, or cloudy conditions when the direct-normal irradiance (DNI) is lower. Methods should be developed to maintain receiver performance at turndown levels to 20%.
• Receiver efficiency: Previously tested particle receivers (~1 MWt) have achieved thermal efficiencies of 50%–70%, with a few as high as ~80%. Thermal efficiencies of 90% or higher are desired to increase energy output and reduce levelized costs.
• Materials and scaling: There is a need to identify and demonstrate appropriate low-cost and durable materials that can handle high fluxes (2,000 suns or more at the aperture) and high temperatures (>1,000°C)
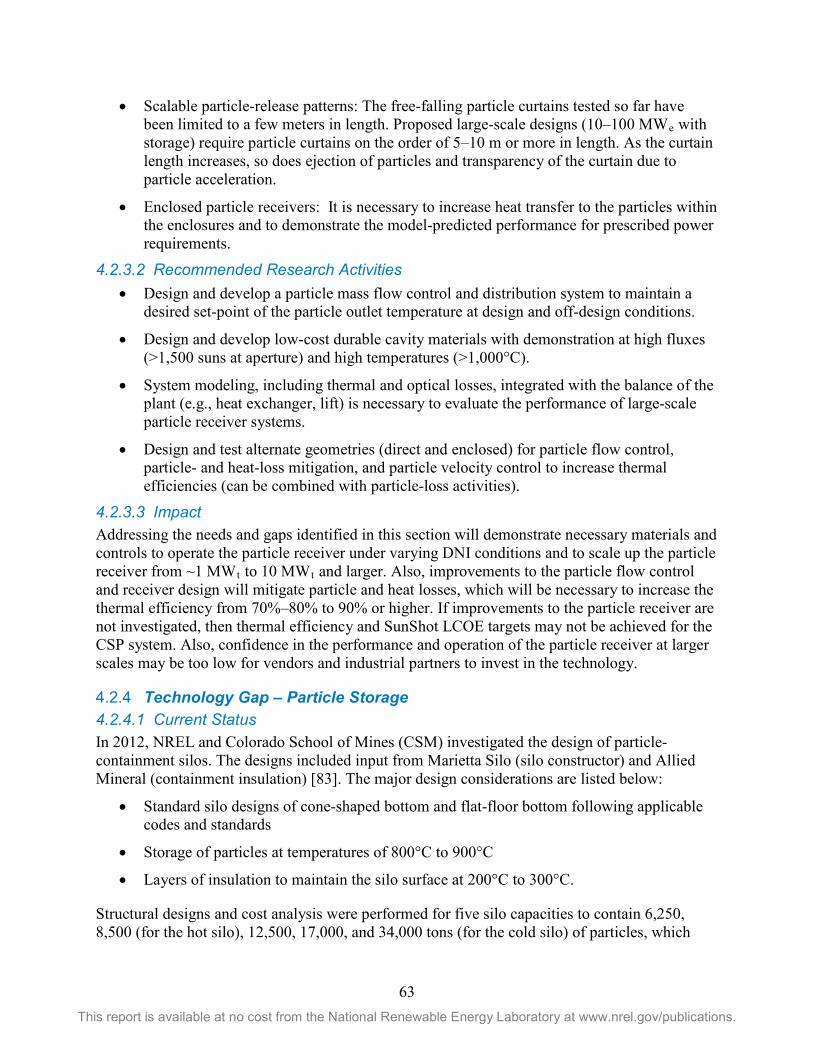
63 This report is available at no cost from the National Renewable Energy Laboratory at www.nrel.gov/publications.
• Scalable particle-release patterns: The free-falling particle curtains tested so far have been limited to a few meters in length. Proposed large-scale designs (10–100 MWe with storage) require particle curtains on the order of 5–10 m or more in length. As the curtain length increases, so does ejection of particles and transparency of the curtain due to particle acceleration.
• Enclosed particle receivers: It is necessary to increase heat transfer to the particles within the enclosures and to demonstrate the model-predicted performance for prescribed power requirements.
4.2.3.2 Recommended Research Activities • Design and develop a particle mass flow control and distribution system to maintain a
desired set-point of the particle outlet temperature at design and off-design conditions.
• Design and develop low-cost durable cavity materials with demonstration at high fluxes (>1,500 suns at aperture) and high temperatures (>1,000°C).
• System modeling, including thermal and optical losses, integrated with the balance of the plant (e.g., heat exchanger, lift) is necessary to evaluate the performance of large-scale particle receiver systems.
• Design and test alternate geometries (direct and enclosed) for particle flow control, particle- and heat-loss mitigation, and particle velocity control to increase thermal efficiencies (can be combined with particle-loss activities).
4.2.3.3 Impact Addressing the needs and gaps identified in this section will demonstrate necessary materials and controls to operate the particle receiver under varying DNI conditions and to scale up the particle receiver from ~1 MWt to 10 MWt and larger. Also, improvements to the particle flow control and receiver design will mitigate particle and heat losses, which will be necessary to increase the thermal efficiency from 70%–80% to 90% or higher. If improvements to the particle receiver are not investigated, then thermal efficiency and SunShot LCOE targets may not be achieved for the CSP system. Also, confidence in the performance and operation of the particle receiver at larger scales may be too low for vendors and industrial partners to invest in the technology.
Technology Gap – Particle Storage 4.2.44.2.4.1 Current Status In 2012, NREL and Colorado School of Mines (CSM) investigated the design of particle-containment silos. The designs included input from Marietta Silo (silo constructor) and Allied Mineral (containment insulation) [83]. The major design considerations are listed below:
• Standard silo designs of cone-shaped bottom and flat-floor bottom following applicable codes and standards
• Storage of particles at temperatures of 800°C to 900°C
• Layers of insulation to maintain the silo surface at 200°C to 300°C.
Structural designs and cost analysis were performed for five silo capacities to contain 6,250, 8,500 (for the hot silo), 12,500, 17,000, and 34,000 tons (for the cold silo) of particles, which
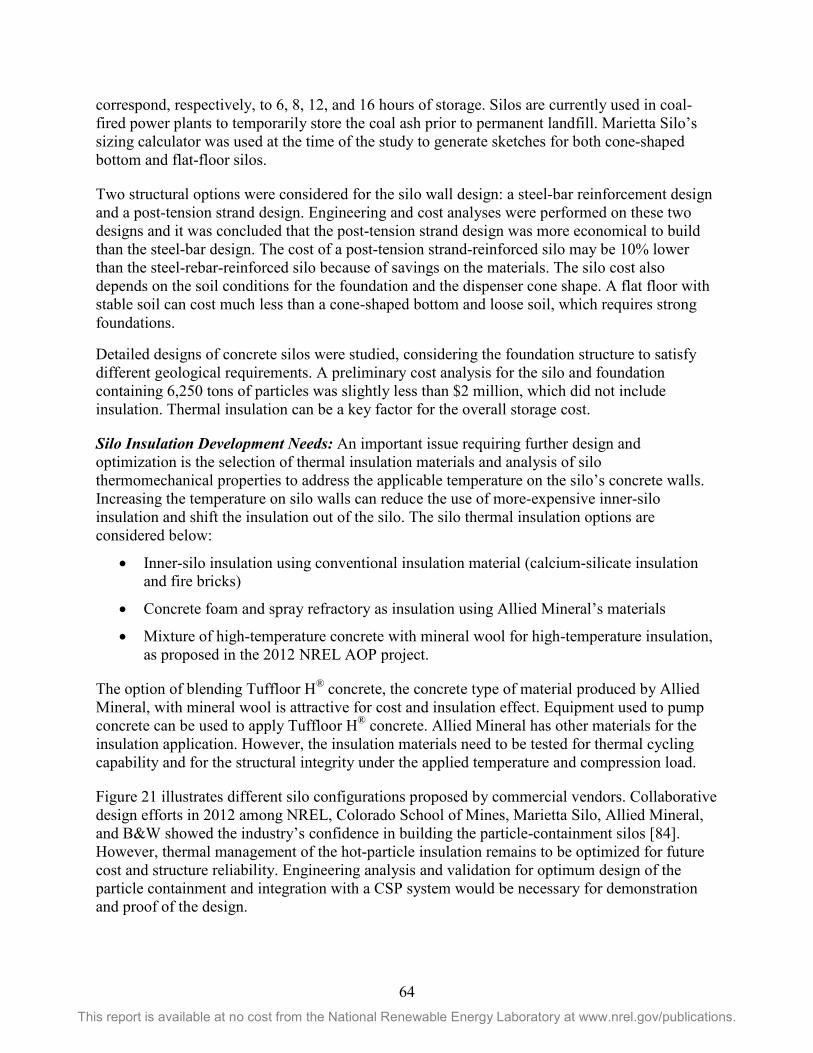
64 This report is available at no cost from the National Renewable Energy Laboratory at www.nrel.gov/publications.
correspond, respectively, to 6, 8, 12, and 16 hours of storage. Silos are currently used in coal-fired power plants to temporarily store the coal ash prior to permanent landfill. Marietta Silo’s sizing calculator was used at the time of the study to generate sketches for both cone-shaped bottom and flat-floor silos.
Two structural options were considered for the silo wall design: a steel-bar reinforcement design and a post-tension strand design. Engineering and cost analyses were performed on these two designs and it was concluded that the post-tension strand design was more economical to build than the steel-bar design. The cost of a post-tension strand-reinforced silo may be 10% lower than the steel-rebar-reinforced silo because of savings on the materials. The silo cost also depends on the soil conditions for the foundation and the dispenser cone shape. A flat floor with stable soil can cost much less than a cone-shaped bottom and loose soil, which requires strong foundations.
Detailed designs of concrete silos were studied, considering the foundation structure to satisfy different geological requirements. A preliminary cost analysis for the silo and foundation containing 6,250 tons of particles was slightly less than $2 million, which did not include insulation. Thermal insulation can be a key factor for the overall storage cost.
Silo Insulation Development Needs: An important issue requiring further design and optimization is the selection of thermal insulation materials and analysis of silo thermomechanical properties to address the applicable temperature on the silo’s concrete walls. Increasing the temperature on silo walls can reduce the use of more-expensive inner-silo insulation and shift the insulation out of the silo. The silo thermal insulation options are considered below:
• Inner-silo insulation using conventional insulation material (calcium-silicate insulation and fire bricks)
• Concrete foam and spray refractory as insulation using Allied Mineral’s materials
• Mixture of high-temperature concrete with mineral wool for high-temperature insulation, as proposed in the 2012 NREL AOP project.
The option of blending Tuffloor H® concrete, the concrete type of material produced by Allied Mineral, with mineral wool is attractive for cost and insulation effect. Equipment used to pump concrete can be used to apply Tuffloor H® concrete. Allied Mineral has other materials for the insulation application. However, the insulation materials need to be tested for thermal cycling capability and for the structural integrity under the applied temperature and compression load.
Figure 21 illustrates different silo configurations proposed by commercial vendors. Collaborative design efforts in 2012 among NREL, Colorado School of Mines, Marietta Silo, Allied Mineral, and B&W showed the industry’s confidence in building the particle-containment silos [84]. However, thermal management of the hot-particle insulation remains to be optimized for future cost and structure reliability. Engineering analysis and validation for optimum design of the particle containment and integration with a CSP system would be necessary for demonstration and proof of the design.
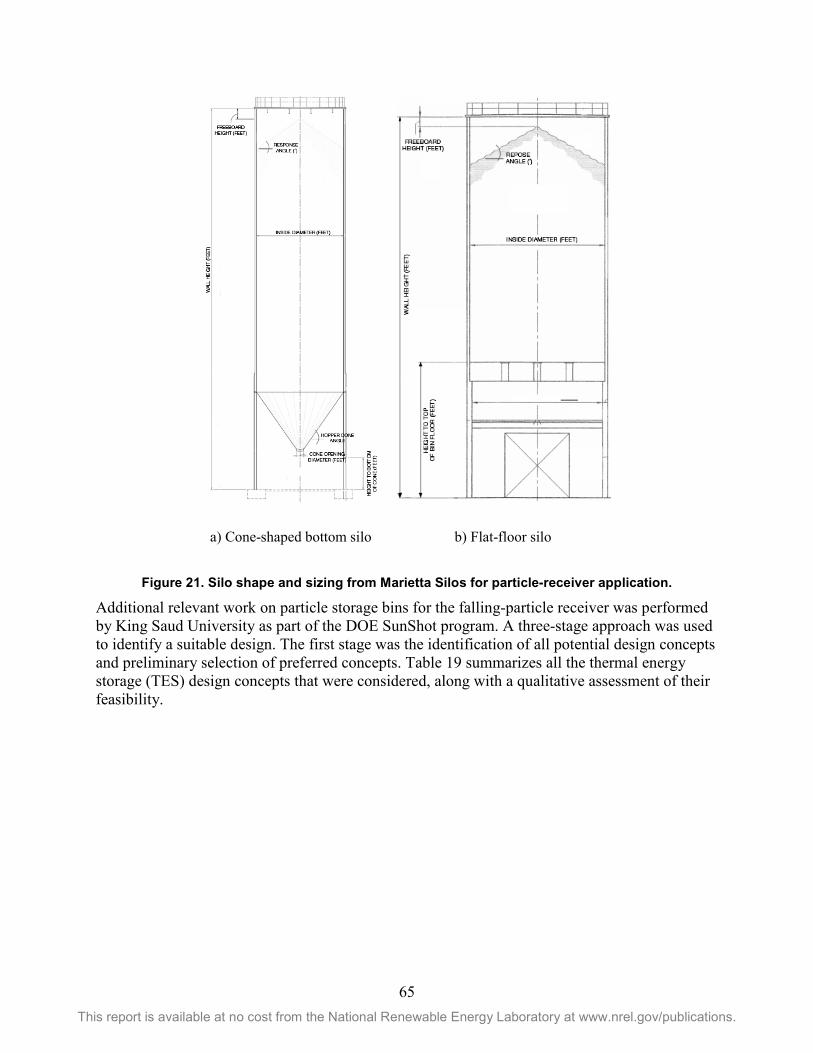
65 This report is available at no cost from the National Renewable Energy Laboratory at www.nrel.gov/publications.
a) Cone-shaped bottom silo b) Flat-floor silo
Figure 21. Silo shape and sizing from Marietta Silos for particle-receiver application.
Additional relevant work on particle storage bins for the falling-particle receiver was performed by King Saud University as part of the DOE SunShot program. A three-stage approach was used to identify a suitable design. The first stage was the identification of all potential design concepts and preliminary selection of preferred concepts. Table 19 summarizes all the thermal energy storage (TES) design concepts that were considered, along with a qualitative assessment of their feasibility.
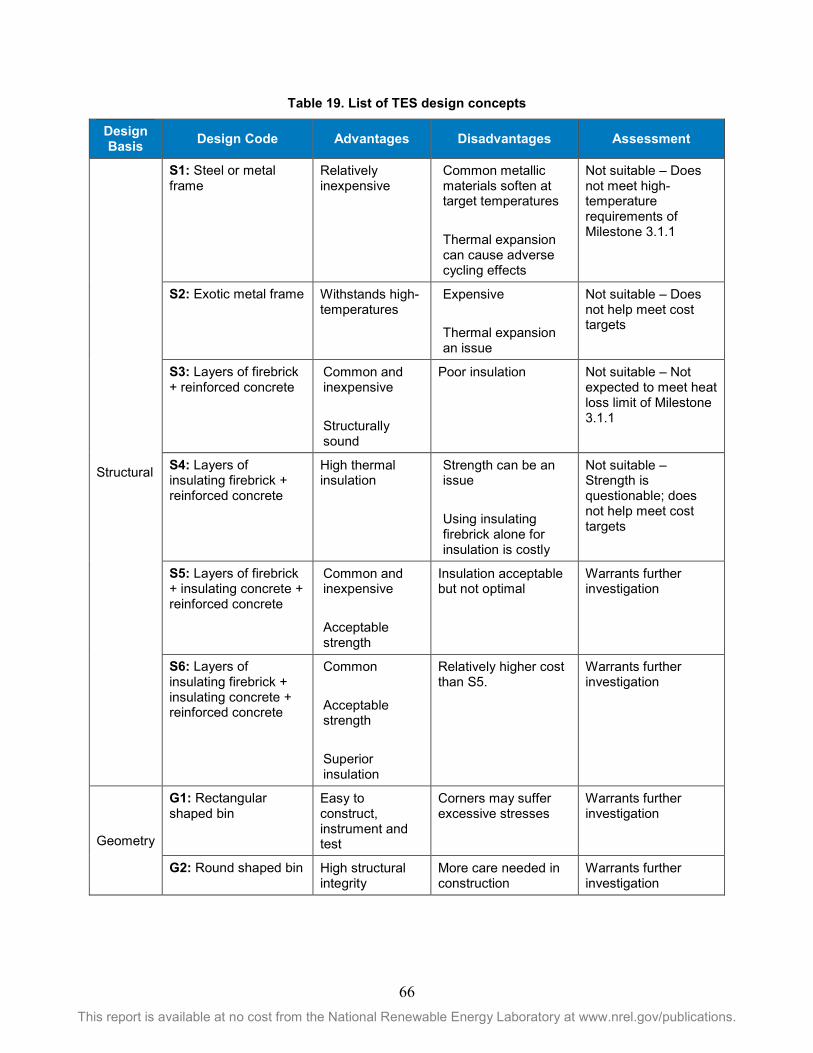
66 This report is available at no cost from the National Renewable Energy Laboratory at www.nrel.gov/publications.
Table 19. List of TES design concepts
Design Basis Design Code Advantages Disadvantages Assessment
Structural
S1: Steel or metal frame
Relatively inexpensive
Common metallic materials soften at target temperatures Thermal expansion can cause adverse cycling effects
Not suitable – Does not meet high-temperature requirements of Milestone 3.1.1
S2: Exotic metal frame Withstands high-temperatures
Expensive Thermal expansion an issue
Not suitable – Does not help meet cost targets
S3: Layers of firebrick + reinforced concrete
Common and inexpensive Structurally sound
Poor insulation Not suitable – Not expected to meet heat loss limit of Milestone 3.1.1
S4: Layers of insulating firebrick + reinforced concrete
High thermal insulation
Strength can be an issue Using insulating firebrick alone for insulation is costly
Not suitable – Strength is questionable; does not help meet cost targets
S5: Layers of firebrick + insulating concrete + reinforced concrete
Common and inexpensive Acceptable strength
Insulation acceptable but not optimal
Warrants further investigation
S6: Layers of insulating firebrick + insulating concrete + reinforced concrete
Common Acceptable strength Superior insulation
Relatively higher cost than S5.
Warrants further investigation
Geometry
G1: Rectangular shaped bin
Easy to construct, instrument and test
Corners may suffer excessive stresses
Warrants further investigation
G2: Round shaped bin High structural integrity
More care needed in construction
Warrants further investigation
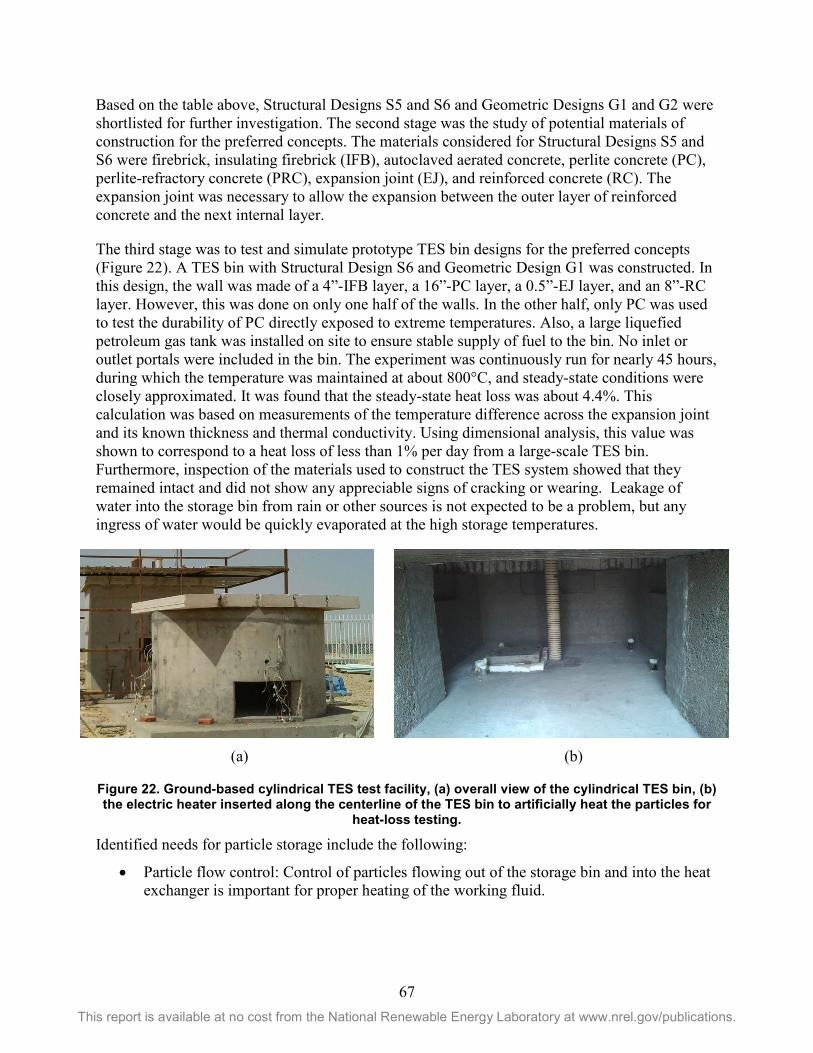
67 This report is available at no cost from the National Renewable Energy Laboratory at www.nrel.gov/publications.
Based on the table above, Structural Designs S5 and S6 and Geometric Designs G1 and G2 were shortlisted for further investigation. The second stage was the study of potential materials of construction for the preferred concepts. The materials considered for Structural Designs S5 and S6 were firebrick, insulating firebrick (IFB), autoclaved aerated concrete, perlite concrete (PC), perlite-refractory concrete (PRC), expansion joint (EJ), and reinforced concrete (RC). The expansion joint was necessary to allow the expansion between the outer layer of reinforced concrete and the next internal layer.
The third stage was to test and simulate prototype TES bin designs for the preferred concepts (Figure 22). A TES bin with Structural Design S6 and Geometric Design G1 was constructed. In this design, the wall was made of a 4”-IFB layer, a 16”-PC layer, a 0.5”-EJ layer, and an 8”-RC layer. However, this was done on only one half of the walls. In the other half, only PC was used to test the durability of PC directly exposed to extreme temperatures. Also, a large liquefied petroleum gas tank was installed on site to ensure stable supply of fuel to the bin. No inlet or outlet portals were included in the bin. The experiment was continuously run for nearly 45 hours, during which the temperature was maintained at about 800°C, and steady-state conditions were closely approximated. It was found that the steady-state heat loss was about 4.4%. This calculation was based on measurements of the temperature difference across the expansion joint and its known thickness and thermal conductivity. Using dimensional analysis, this value was shown to correspond to a heat loss of less than 1% per day from a large-scale TES bin. Furthermore, inspection of the materials used to construct the TES system showed that they remained intact and did not show any appreciable signs of cracking or wearing. Leakage of water into the storage bin from rain or other sources is not expected to be a problem, but any ingress of water would be quickly evaporated at the high storage temperatures.
(a)
(b)
Figure 22. Ground-based cylindrical TES test facility, (a) overall view of the cylindrical TES bin, (b) the electric heater inserted along the centerline of the TES bin to artificially heat the particles for
heat-loss testing.
Identified needs for particle storage include the following:
• Particle flow control: Control of particles flowing out of the storage bin and into the heat exchanger is important for proper heating of the working fluid.
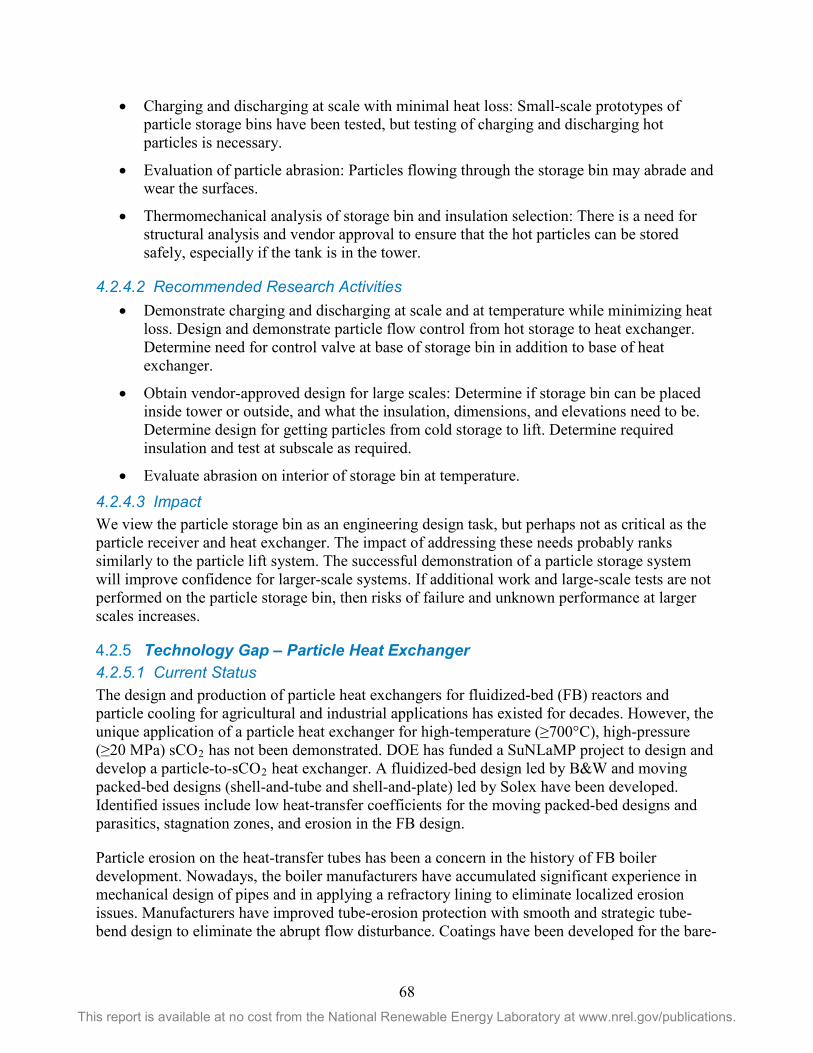
68 This report is available at no cost from the National Renewable Energy Laboratory at www.nrel.gov/publications.
• Charging and discharging at scale with minimal heat loss: Small-scale prototypes of particle storage bins have been tested, but testing of charging and discharging hot particles is necessary.
• Evaluation of particle abrasion: Particles flowing through the storage bin may abrade and wear the surfaces.
• Thermomechanical analysis of storage bin and insulation selection: There is a need for structural analysis and vendor approval to ensure that the hot particles can be stored safely, especially if the tank is in the tower.
4.2.4.2 Recommended Research Activities • Demonstrate charging and discharging at scale and at temperature while minimizing heat
loss. Design and demonstrate particle flow control from hot storage to heat exchanger. Determine need for control valve at base of storage bin in addition to base of heat exchanger.
• Obtain vendor-approved design for large scales: Determine if storage bin can be placed inside tower or outside, and what the insulation, dimensions, and elevations need to be. Determine design for getting particles from cold storage to lift. Determine required insulation and test at subscale as required.
• Evaluate abrasion on interior of storage bin at temperature.
4.2.4.3 Impact We view the particle storage bin as an engineering design task, but perhaps not as critical as the particle receiver and heat exchanger. The impact of addressing these needs probably ranks similarly to the particle lift system. The successful demonstration of a particle storage system will improve confidence for larger-scale systems. If additional work and large-scale tests are not performed on the particle storage bin, then risks of failure and unknown performance at larger scales increases.
Technology Gap – Particle Heat Exchanger 4.2.54.2.5.1 Current Status The design and production of particle heat exchangers for fluidized-bed (FB) reactors and particle cooling for agricultural and industrial applications has existed for decades. However, the unique application of a particle heat exchanger for high-temperature (≥700°C), high-pressure (≥20 MPa) sCO2 has not been demonstrated. DOE has funded a SuNLaMP project to design and develop a particle-to-sCO2 heat exchanger. A fluidized-bed design led by B&W and moving packed-bed designs (shell-and-tube and shell-and-plate) led by Solex have been developed. Identified issues include low heat-transfer coefficients for the moving packed-bed designs and parasitics, stagnation zones, and erosion in the FB design.
Particle erosion on the heat-transfer tubes has been a concern in the history of FB boiler development. Nowadays, the boiler manufacturers have accumulated significant experience in mechanical design of pipes and in applying a refractory lining to eliminate localized erosion issues. Manufacturers have improved tube-erosion protection with smooth and strategic tube-bend design to eliminate the abrupt flow disturbance. Coatings have been developed for the bare-
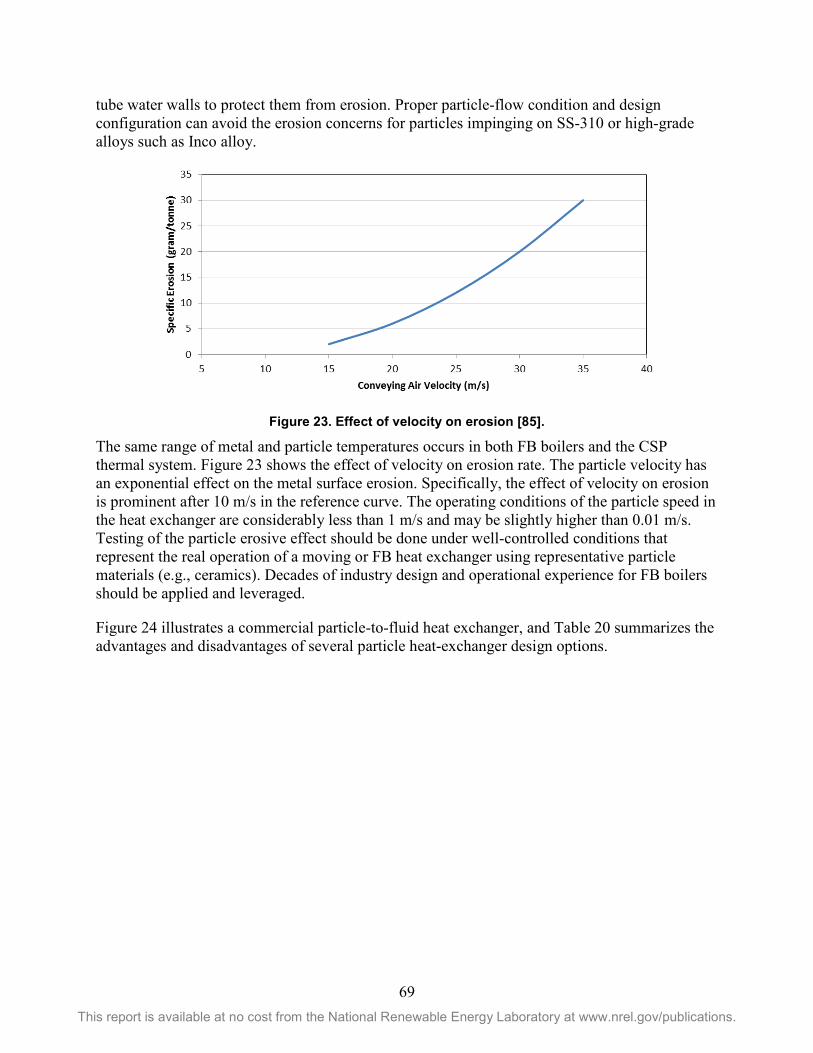
69 This report is available at no cost from the National Renewable Energy Laboratory at www.nrel.gov/publications.
tube water walls to protect them from erosion. Proper particle-flow condition and design configuration can avoid the erosion concerns for particles impinging on SS-310 or high-grade alloys such as Inco alloy.
Figure 23. Effect of velocity on erosion [85].
The same range of metal and particle temperatures occurs in both FB boilers and the CSP thermal system. Figure 23 shows the effect of velocity on erosion rate. The particle velocity has an exponential effect on the metal surface erosion. Specifically, the effect of velocity on erosion is prominent after 10 m/s in the reference curve. The operating conditions of the particle speed in the heat exchanger are considerably less than 1 m/s and may be slightly higher than 0.01 m/s. Testing of the particle erosive effect should be done under well-controlled conditions that represent the real operation of a moving or FB heat exchanger using representative particle materials (e.g., ceramics). Decades of industry design and operational experience for FB boilers should be applied and leveraged.
Figure 24 illustrates a commercial particle-to-fluid heat exchanger, and Table 20 summarizes the advantages and disadvantages of several particle heat-exchanger design options.
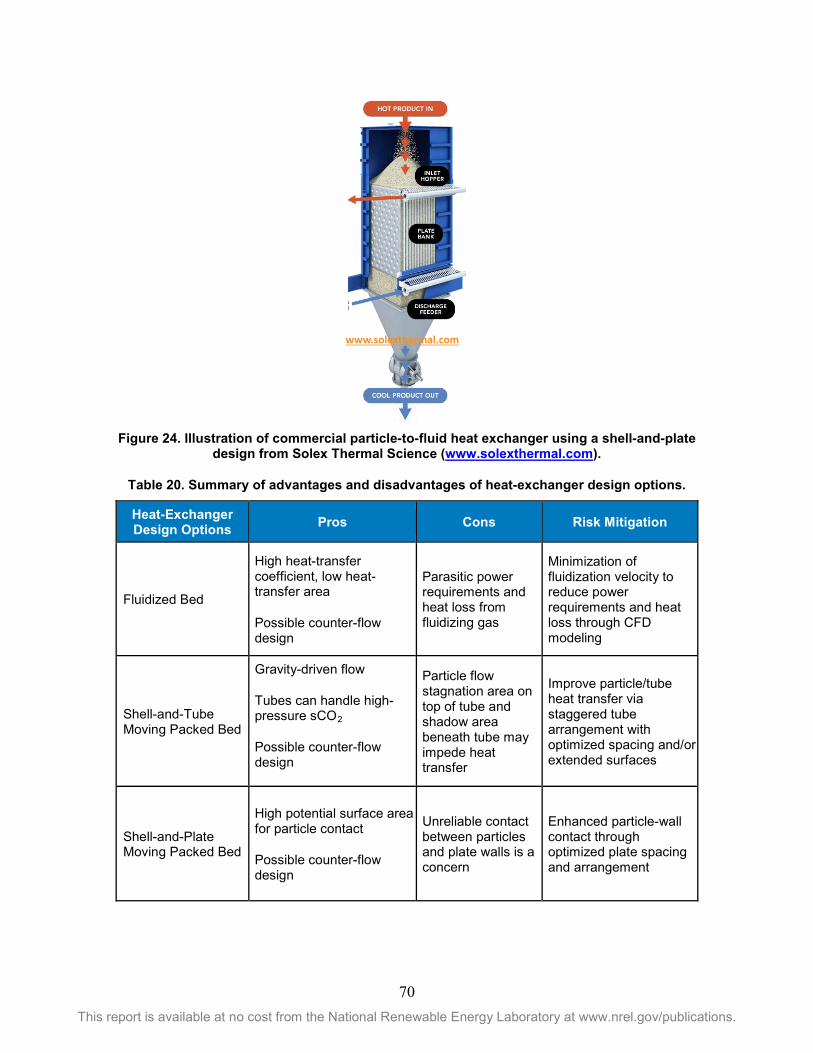
70 This report is available at no cost from the National Renewable Energy Laboratory at www.nrel.gov/publications.
Figure 24. Illustration of commercial particle-to-fluid heat exchanger using a shell-and-plate
design from Solex Thermal Science (www.solexthermal.com).
Table 20. Summary of advantages and disadvantages of heat-exchanger design options.
Heat-Exchanger Design Options Pros Cons Risk Mitigation
Fluidized Bed
High heat-transfer coefficient, low heat-transfer area
Possible counter-flow design
Parasitic power requirements and heat loss from fluidizing gas
Minimization of fluidization velocity to reduce power requirements and heat loss through CFD modeling
Shell-and-Tube Moving Packed Bed
Gravity-driven flow
Tubes can handle high-pressure sCO2
Possible counter-flow design
Particle flow stagnation area on top of tube and shadow area beneath tube may impede heat transfer
Improve particle/tube heat transfer via staggered tube arrangement with optimized spacing and/or extended surfaces
Shell-and-Plate Moving Packed Bed
High potential surface area for particle contact
Possible counter-flow design
Unreliable contact between particles and plate walls is a concern
Enhanced particle-wall contact through optimized plate spacing and arrangement
www.solexthermal.com
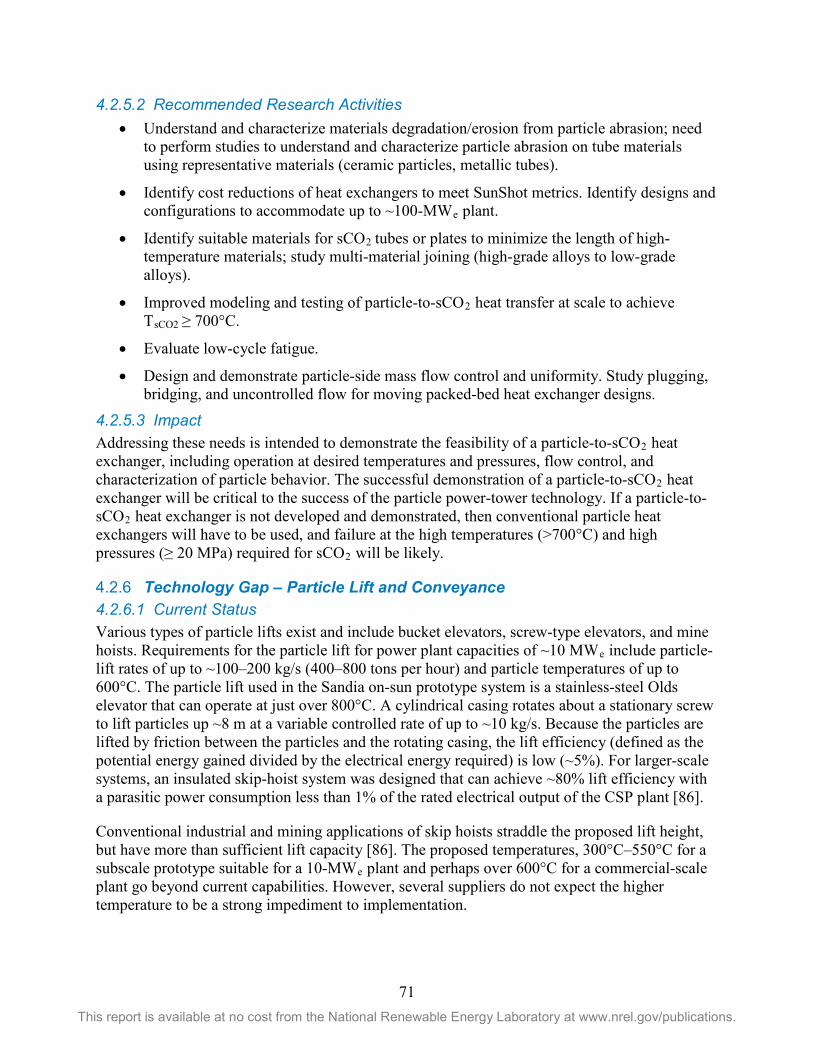
71 This report is available at no cost from the National Renewable Energy Laboratory at www.nrel.gov/publications.
4.2.5.2 Recommended Research Activities • Understand and characterize materials degradation/erosion from particle abrasion; need
to perform studies to understand and characterize particle abrasion on tube materials using representative materials (ceramic particles, metallic tubes).
• Identify cost reductions of heat exchangers to meet SunShot metrics. Identify designs and configurations to accommodate up to ~100-MWe plant.
• Identify suitable materials for sCO2 tubes or plates to minimize the length of high-temperature materials; study multi-material joining (high-grade alloys to low-grade alloys).
• Improved modeling and testing of particle-to-sCO2 heat transfer at scale to achieve TsCO2 ≥ 700°C.
• Evaluate low-cycle fatigue.
• Design and demonstrate particle-side mass flow control and uniformity. Study plugging, bridging, and uncontrolled flow for moving packed-bed heat exchanger designs.
4.2.5.3 Impact Addressing these needs is intended to demonstrate the feasibility of a particle-to-sCO2 heat exchanger, including operation at desired temperatures and pressures, flow control, and characterization of particle behavior. The successful demonstration of a particle-to-sCO2 heat exchanger will be critical to the success of the particle power-tower technology. If a particle-to-sCO2 heat exchanger is not developed and demonstrated, then conventional particle heat exchangers will have to be used, and failure at the high temperatures (>700°C) and high pressures (≥ 20 MPa) required for sCO2 will be likely.
Technology Gap – Particle Lift and Conveyance 4.2.64.2.6.1 Current Status Various types of particle lifts exist and include bucket elevators, screw-type elevators, and mine hoists. Requirements for the particle lift for power plant capacities of ~10 MWe include particle-lift rates of up to ~100–200 kg/s (400–800 tons per hour) and particle temperatures of up to 600°C. The particle lift used in the Sandia on-sun prototype system is a stainless-steel Olds elevator that can operate at just over 800°C. A cylindrical casing rotates about a stationary screw to lift particles up ~8 m at a variable controlled rate of up to ~10 kg/s. Because the particles are lifted by friction between the particles and the rotating casing, the lift efficiency (defined as the potential energy gained divided by the electrical energy required) is low (~5%). For larger-scale systems, an insulated skip-hoist system was designed that can achieve ~80% lift efficiency with a parasitic power consumption less than 1% of the rated electrical output of the CSP plant [86].
Conventional industrial and mining applications of skip hoists straddle the proposed lift height, but have more than sufficient lift capacity [86]. The proposed temperatures, 300°C–550°C for a subscale prototype suitable for a 10-MWe plant and perhaps over 600°C for a commercial-scale plant go beyond current capabilities. However, several suppliers do not expect the higher temperature to be a strong impediment to implementation.
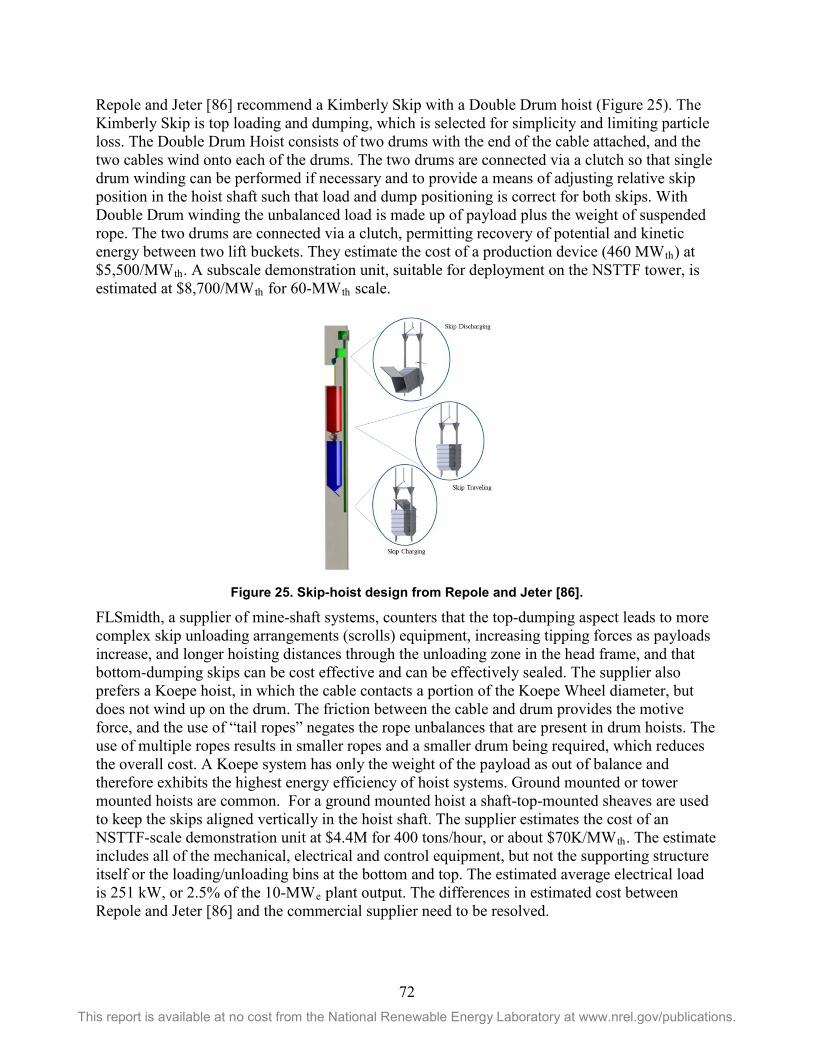
72 This report is available at no cost from the National Renewable Energy Laboratory at www.nrel.gov/publications.
Repole and Jeter [86] recommend a Kimberly Skip with a Double Drum hoist (Figure 25). The Kimberly Skip is top loading and dumping, which is selected for simplicity and limiting particle loss. The Double Drum Hoist consists of two drums with the end of the cable attached, and the two cables wind onto each of the drums. The two drums are connected via a clutch so that single drum winding can be performed if necessary and to provide a means of adjusting relative skip position in the hoist shaft such that load and dump positioning is correct for both skips. With Double Drum winding the unbalanced load is made up of payload plus the weight of suspended rope. The two drums are connected via a clutch, permitting recovery of potential and kinetic energy between two lift buckets. They estimate the cost of a production device (460 MWth) at $5,500/MWth. A subscale demonstration unit, suitable for deployment on the NSTTF tower, is estimated at $8,700/MWth for 60-MWth scale.
Figure 25. Skip-hoist design from Repole and Jeter [86].
FLSmidth, a supplier of mine-shaft systems, counters that the top-dumping aspect leads to more complex skip unloading arrangements (scrolls) equipment, increasing tipping forces as payloads increase, and longer hoisting distances through the unloading zone in the head frame, and that bottom-dumping skips can be cost effective and can be effectively sealed. The supplier also prefers a Koepe hoist, in which the cable contacts a portion of the Koepe Wheel diameter, but does not wind up on the drum. The friction between the cable and drum provides the motive force, and the use of “tail ropes” negates the rope unbalances that are present in drum hoists. The use of multiple ropes results in smaller ropes and a smaller drum being required, which reduces the overall cost. A Koepe system has only the weight of the payload as out of balance and therefore exhibits the highest energy efficiency of hoist systems. Ground mounted or tower mounted hoists are common. For a ground mounted hoist a shaft-top-mounted sheaves are used to keep the skips aligned vertically in the hoist shaft. The supplier estimates the cost of an NSTTF-scale demonstration unit at $4.4M for 400 tons/hour, or about $70K/MWth. The estimate includes all of the mechanical, electrical and control equipment, but not the supporting structure itself or the loading/unloading bins at the bottom and top. The estimated average electrical load is 251 kW, or 2.5% of the 10-MWe plant output. The differences in estimated cost between Repole and Jeter [86] and the commercial supplier need to be resolved.
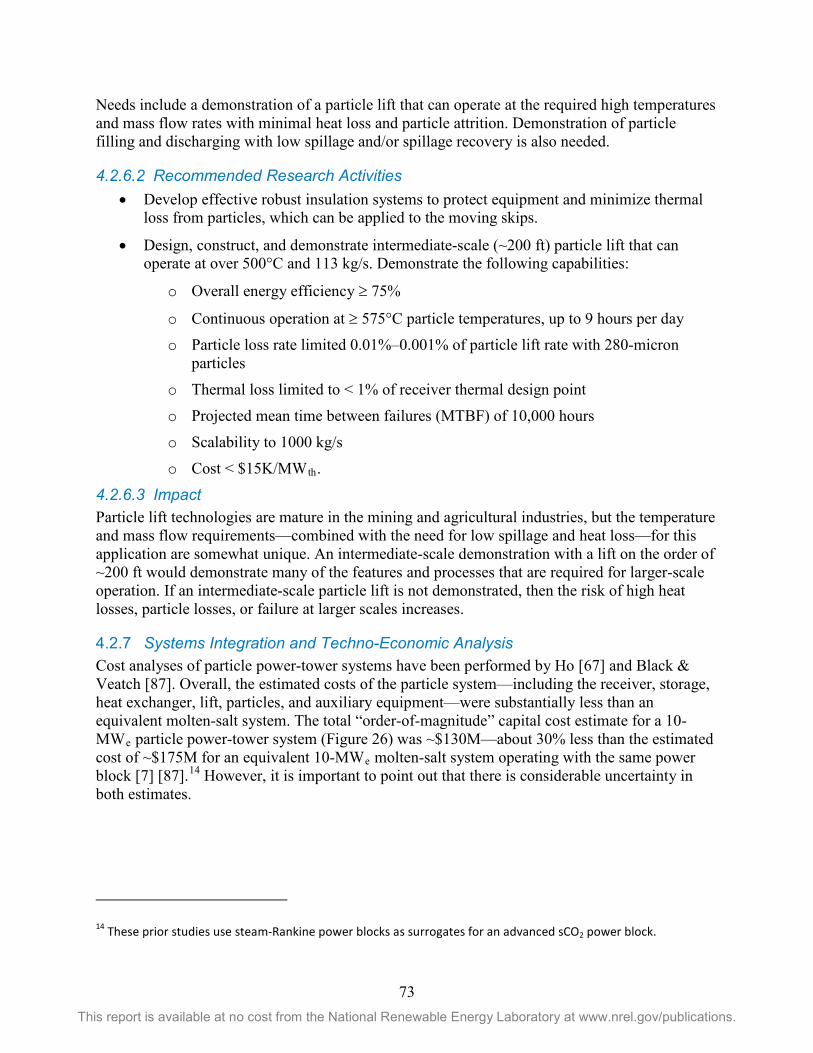
73 This report is available at no cost from the National Renewable Energy Laboratory at www.nrel.gov/publications.
Needs include a demonstration of a particle lift that can operate at the required high temperatures and mass flow rates with minimal heat loss and particle attrition. Demonstration of particle filling and discharging with low spillage and/or spillage recovery is also needed.
4.2.6.2 Recommended Research Activities • Develop effective robust insulation systems to protect equipment and minimize thermal
loss from particles, which can be applied to the moving skips.
• Design, construct, and demonstrate intermediate-scale (~200 ft) particle lift that can operate at over 500°C and 113 kg/s. Demonstrate the following capabilities:
o Overall energy efficiency ≥ 75%
o Continuous operation at ≥ 575°C particle temperatures, up to 9 hours per day o Particle loss rate limited 0.01%–0.001% of particle lift rate with 280-micron
particles
o Thermal loss limited to < 1% of receiver thermal design point
o Projected mean time between failures (MTBF) of 10,000 hours
o Scalability to 1000 kg/s
o Cost < $15K/MWth.
4.2.6.3 Impact Particle lift technologies are mature in the mining and agricultural industries, but the temperature and mass flow requirements—combined with the need for low spillage and heat loss—for this application are somewhat unique. An intermediate-scale demonstration with a lift on the order of ~200 ft would demonstrate many of the features and processes that are required for larger-scale operation. If an intermediate-scale particle lift is not demonstrated, then the risk of high heat losses, particle losses, or failure at larger scales increases.
Systems Integration and Techno-Economic Analysis 4.2.7Cost analyses of particle power-tower systems have been performed by Ho [67] and Black & Veatch [87]. Overall, the estimated costs of the particle system—including the receiver, storage, heat exchanger, lift, particles, and auxiliary equipment—were substantially less than an equivalent molten-salt system. The total “order-of-magnitude” capital cost estimate for a 10-MWe particle power-tower system (Figure 26) was ~$130M—about 30% less than the estimated cost of ~$175M for an equivalent 10-MWe molten-salt system operating with the same power block [7] [87].14 However, it is important to point out that there is considerable uncertainty in both estimates.
14 These prior studies use steam-Rankine power blocks as surrogates for an advanced sCO2 power block.
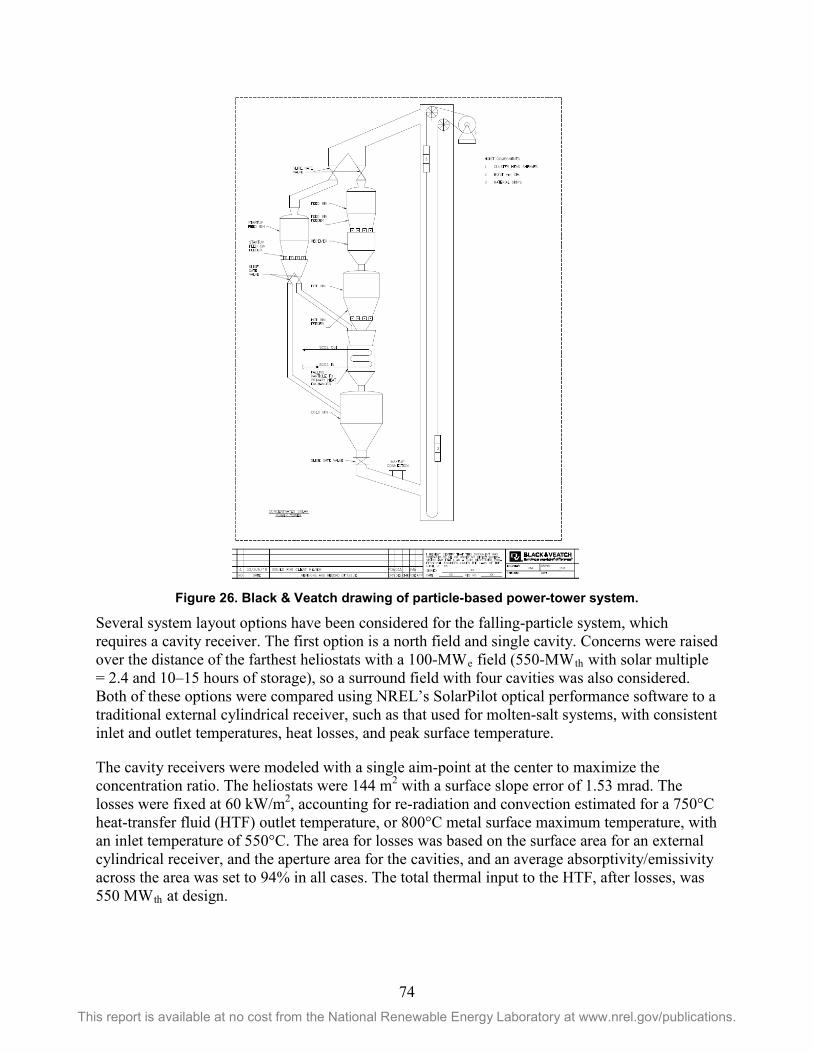
74 This report is available at no cost from the National Renewable Energy Laboratory at www.nrel.gov/publications.
Figure 26. Black & Veatch drawing of particle-based power-tower system.
Several system layout options have been considered for the falling-particle system, which requires a cavity receiver. The first option is a north field and single cavity. Concerns were raised over the distance of the farthest heliostats with a 100-MWe field (550-MWth with solar multiple = 2.4 and 10–15 hours of storage), so a surround field with four cavities was also considered. Both of these options were compared using NREL’s SolarPilot optical performance software to a traditional external cylindrical receiver, such as that used for molten-salt systems, with consistent inlet and outlet temperatures, heat losses, and peak surface temperature.
The cavity receivers were modeled with a single aim-point at the center to maximize the concentration ratio. The heliostats were 144 m2 with a surface slope error of 1.53 mrad. The losses were fixed at 60 kW/m2, accounting for re-radiation and convection estimated for a 750°C heat-transfer fluid (HTF) outlet temperature, or 800°C metal surface maximum temperature, with an inlet temperature of 550°C. The area for losses was based on the surface area for an external cylindrical receiver, and the aperture area for the cavities, and an average absorptivity/emissivity across the area was set to 94% in all cases. The total thermal input to the HTF, after losses, was 550 MWth at design.
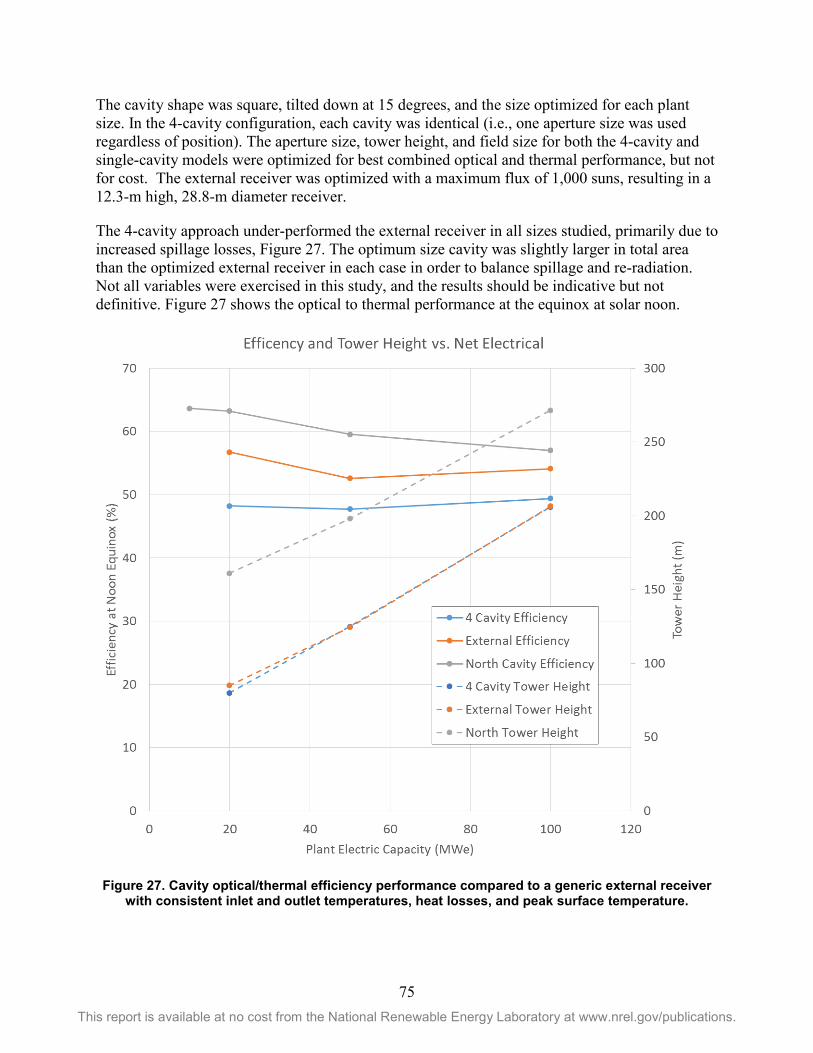
75 This report is available at no cost from the National Renewable Energy Laboratory at www.nrel.gov/publications.
The cavity shape was square, tilted down at 15 degrees, and the size optimized for each plant size. In the 4-cavity configuration, each cavity was identical (i.e., one aperture size was used regardless of position). The aperture size, tower height, and field size for both the 4-cavity and single-cavity models were optimized for best combined optical and thermal performance, but not for cost. The external receiver was optimized with a maximum flux of 1,000 suns, resulting in a 12.3-m high, 28.8-m diameter receiver.
The 4-cavity approach under-performed the external receiver in all sizes studied, primarily due to increased spillage losses, Figure 27. The optimum size cavity was slightly larger in total area than the optimized external receiver in each case in order to balance spillage and re-radiation. Not all variables were exercised in this study, and the results should be indicative but not definitive. Figure 27 shows the optical to thermal performance at the equinox at solar noon.
Figure 27. Cavity optical/thermal efficiency performance compared to a generic external receiver with consistent inlet and outlet temperatures, heat losses, and peak surface temperature.
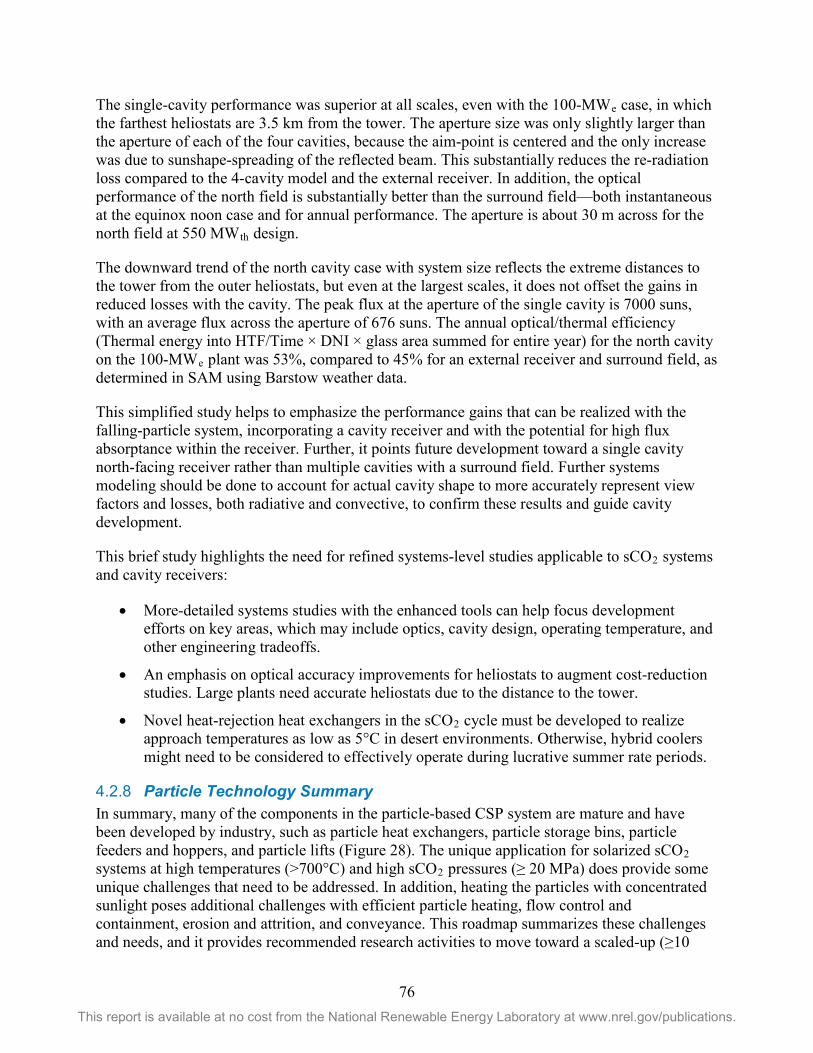
76 This report is available at no cost from the National Renewable Energy Laboratory at www.nrel.gov/publications.
The single-cavity performance was superior at all scales, even with the 100-MWe case, in which the farthest heliostats are 3.5 km from the tower. The aperture size was only slightly larger than the aperture of each of the four cavities, because the aim-point is centered and the only increase was due to sunshape-spreading of the reflected beam. This substantially reduces the re-radiation loss compared to the 4-cavity model and the external receiver. In addition, the optical performance of the north field is substantially better than the surround field—both instantaneous at the equinox noon case and for annual performance. The aperture is about 30 m across for the north field at 550 MWth design.
The downward trend of the north cavity case with system size reflects the extreme distances to the tower from the outer heliostats, but even at the largest scales, it does not offset the gains in reduced losses with the cavity. The peak flux at the aperture of the single cavity is 7000 suns, with an average flux across the aperture of 676 suns. The annual optical/thermal efficiency (Thermal energy into HTF/Time × DNI × glass area summed for entire year) for the north cavity on the 100-MWe plant was 53%, compared to 45% for an external receiver and surround field, as determined in SAM using Barstow weather data.
This simplified study helps to emphasize the performance gains that can be realized with the falling-particle system, incorporating a cavity receiver and with the potential for high flux absorptance within the receiver. Further, it points future development toward a single cavity north-facing receiver rather than multiple cavities with a surround field. Further systems modeling should be done to account for actual cavity shape to more accurately represent view factors and losses, both radiative and convective, to confirm these results and guide cavity development.
This brief study highlights the need for refined systems-level studies applicable to sCO2 systems and cavity receivers:
• More-detailed systems studies with the enhanced tools can help focus development efforts on key areas, which may include optics, cavity design, operating temperature, and other engineering tradeoffs.
• An emphasis on optical accuracy improvements for heliostats to augment cost-reduction studies. Large plants need accurate heliostats due to the distance to the tower.
• Novel heat-rejection heat exchangers in the sCO2 cycle must be developed to realize approach temperatures as low as 5°C in desert environments. Otherwise, hybrid coolers might need to be considered to effectively operate during lucrative summer rate periods.
Particle Technology Summary 4.2.8In summary, many of the components in the particle-based CSP system are mature and have been developed by industry, such as particle heat exchangers, particle storage bins, particle feeders and hoppers, and particle lifts (Figure 28). The unique application for solarized sCO2 systems at high temperatures (>700°C) and high sCO2 pressures (≥ 20 MPa) does provide some unique challenges that need to be addressed. In addition, heating the particles with concentrated sunlight poses additional challenges with efficient particle heating, flow control and containment, erosion and attrition, and conveyance. This roadmap summarizes these challenges and needs, and it provides recommended research activities to move toward a scaled-up (≥10
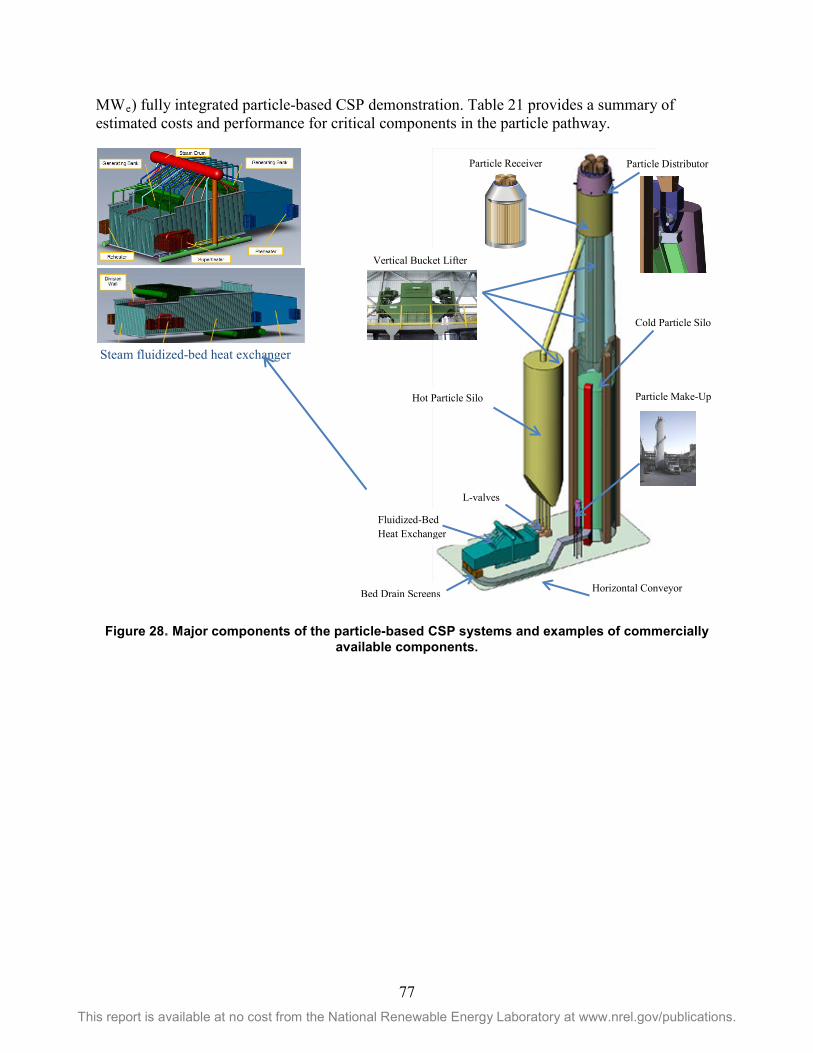
77 This report is available at no cost from the National Renewable Energy Laboratory at www.nrel.gov/publications.
MWe) fully integrated particle-based CSP demonstration. Table 21 provides a summary of estimated costs and performance for critical components in the particle pathway.
Steam fluidized-bed heat exchanger
Figure 28. Major components of the particle-based CSP systems and examples of commercially available components.
Fluidized-Bed Heat Exchanger
Vertical Bucket Lifter
Hot Particle Silo
L-valves
Bed Drain Screens Horizontal Conveyor
Particle Make-Up
Cold Particle Silo
Particle Distributor Particle Receiver
78 This report is available at no cost from the National Renewable Energy Laboratory at www.nrel.gov/publications.
Table 21. Summary of Estimated Cost and Performance for Critical Components within the Particle Pathway.
Component SunShot Targets Technology Pathway estimated and potential Cost/Performance for 100 MWe plant
Receiver (includes receiver, tower, vertical piping & insulation, cold salt pump)
Cost < $150/kWt*
Efficiency > 90%
Exit temp >720°C
10,000 cycle lifetime
• Estimated cost for the receiver subsystem is $125/kWt [67]
• Estimated thermal efficiency for small-scale prototype tests ~50%–90% [67]
• Particle exit temperature reached > 1,000°C [67] • Lifetime of receiver expected to be > 10,000 cycles
HTF/Storage Material (salt)
Cost < $1/kg Operable range from 250°C to 800°C
• Cost of existing ceramic particles ~$1–$2 per kg (quoted) • Cost of sand is << $1/kg • Other high absorptance particles exist that are <$1/kg • Temperature of silica and ceramic particles > 1,000°C
Thermal Storage Cost < $15/kWht* 99% energetic efficiency 95% exergetic efficiency
• Estimated cost of particle storage using insulated steel tanks is $22/kWht [67]
• Estimated cost of particle storage using firebrick and concrete insulating materials is < $15/kWht
• Prototype tests yielded 96% daily energetic efficiency with upscaling estimate to 99% daily energetic efficiency
HTF to sCO2 HX Not explicitly specified, cost included in power block target
• Cost target for particle-to-sCO2 heat exchanger estimated to be < $300/kWe,
2 w [88], which can meet SunShot
power block cost target of <$900/kWe
* Costs are installed, direct capital cost, not including contingency and EPC indirect costs
4.3 Gas-Phase Receiver Pathway Gas-phase (GP) receivers use a stable, intermediate-pressure, heat-transfer fluid (HTF) in a closed-loop configuration to transfer energy to and from thermal storage. In the suggested configuration, a CO2, helium, argon, or mixed GP fluid is circulated at intermediate pressure (on the order of 75 bar) through a receiver with relatively small flow channels—either small-diameter tubes, microchannels, or other geometries (see Section 4.3.1)—and heated to temperatures sufficient to generate the target of 700°C sCO2 after heat exchange into the power cycle (e.g., ~750°C). The hot fluid is transported down the tower to the TES system, which can be one of a variety of technologies (see Section 4.3.3). After charging storage, the cooled fluid is again circulated through the receiver. Power generation is decoupled from thermal energy collection by the TES system. Closed-loop gas circulators are used to transfer energy into and out of TES. Both circulators must overcome the pressure loss in their respective flow circuits, but do not act as compressors because the relative pressure drop is on the order of single percentage points rather than orders of magnitude. One possible system configuration that makes use of phase-change material (PCM) TES is illustrated in Figure 29. Storage integration, including charging and discharging procedures, is discussed in more detail in Section 4.3.3.
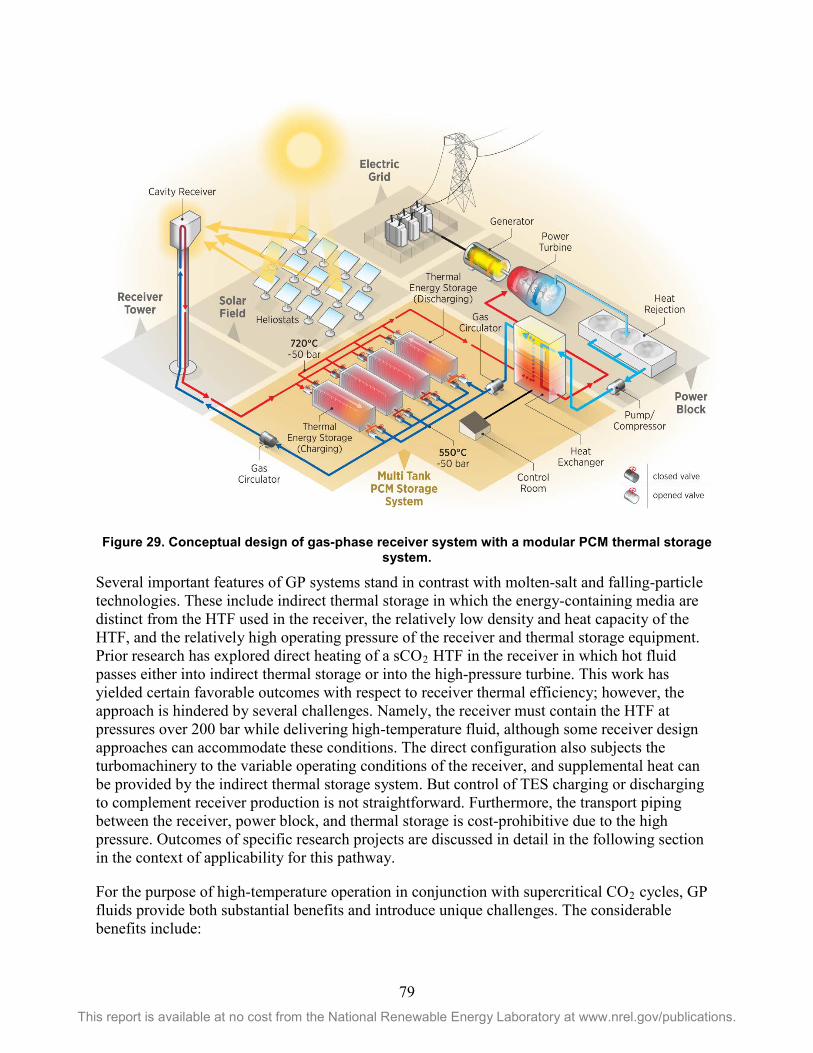
79 This report is available at no cost from the National Renewable Energy Laboratory at www.nrel.gov/publications.
Figure 29. Conceptual design of gas-phase receiver system with a modular PCM thermal storage system.
Several important features of GP systems stand in contrast with molten-salt and falling-particle technologies. These include indirect thermal storage in which the energy-containing media are distinct from the HTF used in the receiver, the relatively low density and heat capacity of the HTF, and the relatively high operating pressure of the receiver and thermal storage equipment. Prior research has explored direct heating of a sCO2 HTF in the receiver in which hot fluid passes either into indirect thermal storage or into the high-pressure turbine. This work has yielded certain favorable outcomes with respect to receiver thermal efficiency; however, the approach is hindered by several challenges. Namely, the receiver must contain the HTF at pressures over 200 bar while delivering high-temperature fluid, although some receiver design approaches can accommodate these conditions. The direct configuration also subjects the turbomachinery to the variable operating conditions of the receiver, and supplemental heat can be provided by the indirect thermal storage system. But control of TES charging or discharging to complement receiver production is not straightforward. Furthermore, the transport piping between the receiver, power block, and thermal storage is cost-prohibitive due to the high pressure. Outcomes of specific research projects are discussed in detail in the following section in the context of applicability for this pathway.
For the purpose of high-temperature operation in conjunction with supercritical CO2 cycles, GP fluids provide both substantial benefits and introduce unique challenges. The considerable benefits include:
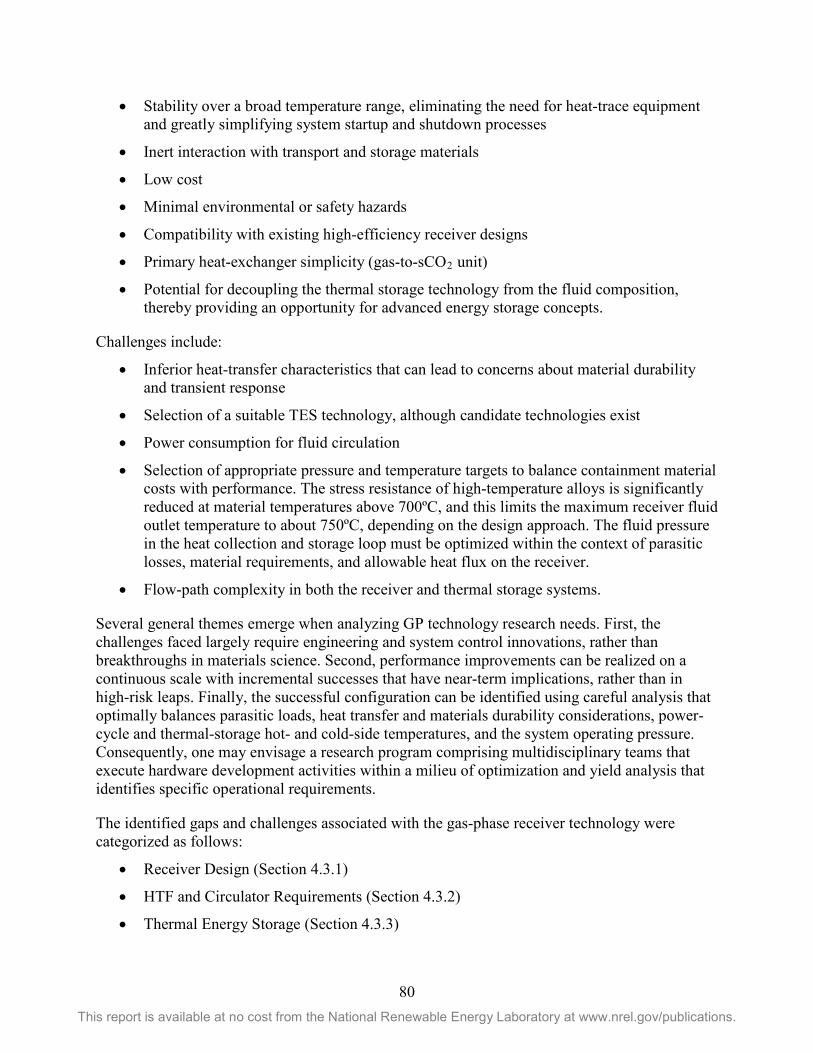
80 This report is available at no cost from the National Renewable Energy Laboratory at www.nrel.gov/publications.
• Stability over a broad temperature range, eliminating the need for heat-trace equipment and greatly simplifying system startup and shutdown processes
• Inert interaction with transport and storage materials
• Low cost
• Minimal environmental or safety hazards
• Compatibility with existing high-efficiency receiver designs
• Primary heat-exchanger simplicity (gas-to-sCO2 unit)
• Potential for decoupling the thermal storage technology from the fluid composition, thereby providing an opportunity for advanced energy storage concepts.
Challenges include:
• Inferior heat-transfer characteristics that can lead to concerns about material durability and transient response
• Selection of a suitable TES technology, although candidate technologies exist
• Power consumption for fluid circulation
• Selection of appropriate pressure and temperature targets to balance containment material costs with performance. The stress resistance of high-temperature alloys is significantly reduced at material temperatures above 700ºC, and this limits the maximum receiver fluid outlet temperature to about 750ºC, depending on the design approach. The fluid pressure in the heat collection and storage loop must be optimized within the context of parasitic losses, material requirements, and allowable heat flux on the receiver.
• Flow-path complexity in both the receiver and thermal storage systems.
Several general themes emerge when analyzing GP technology research needs. First, the challenges faced largely require engineering and system control innovations, rather than breakthroughs in materials science. Second, performance improvements can be realized on a continuous scale with incremental successes that have near-term implications, rather than in high-risk leaps. Finally, the successful configuration can be identified using careful analysis that optimally balances parasitic loads, heat transfer and materials durability considerations, power-cycle and thermal-storage hot- and cold-side temperatures, and the system operating pressure. Consequently, one may envisage a research program comprising multidisciplinary teams that execute hardware development activities within a milieu of optimization and yield analysis that identifies specific operational requirements.
The identified gaps and challenges associated with the gas-phase receiver technology were categorized as follows:
• Receiver Design (Section 4.3.1)
• HTF and Circulator Requirements (Section 4.3.2)
• Thermal Energy Storage (Section 4.3.3)
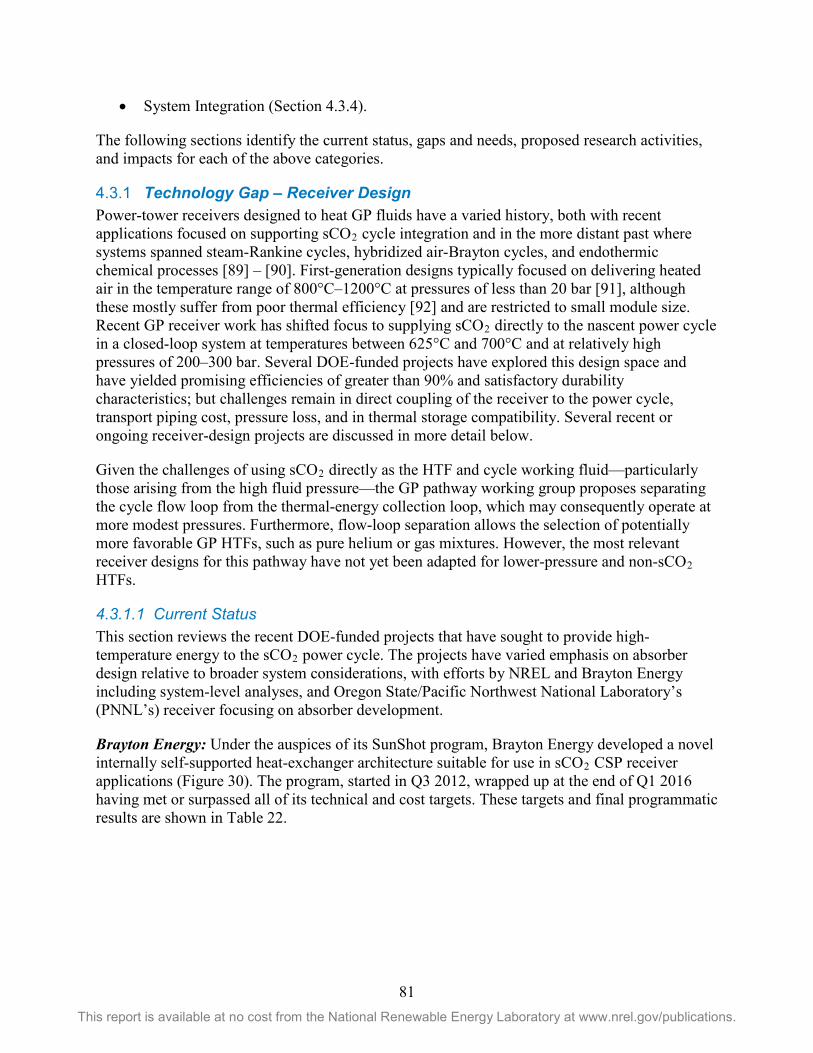
81 This report is available at no cost from the National Renewable Energy Laboratory at www.nrel.gov/publications.
• System Integration (Section 4.3.4).
The following sections identify the current status, gaps and needs, proposed research activities, and impacts for each of the above categories.
Technology Gap – Receiver Design 4.3.1Power-tower receivers designed to heat GP fluids have a varied history, both with recent applications focused on supporting sCO2 cycle integration and in the more distant past where systems spanned steam-Rankine cycles, hybridized air-Brayton cycles, and endothermic chemical processes [89] – [90]. First-generation designs typically focused on delivering heated air in the temperature range of 800°C–1200°C at pressures of less than 20 bar [91], although these mostly suffer from poor thermal efficiency [92] and are restricted to small module size. Recent GP receiver work has shifted focus to supplying sCO2 directly to the nascent power cycle in a closed-loop system at temperatures between 625°C and 700°C and at relatively high pressures of 200–300 bar. Several DOE-funded projects have explored this design space and have yielded promising efficiencies of greater than 90% and satisfactory durability characteristics; but challenges remain in direct coupling of the receiver to the power cycle, transport piping cost, pressure loss, and in thermal storage compatibility. Several recent or ongoing receiver-design projects are discussed in more detail below.
Given the challenges of using sCO2 directly as the HTF and cycle working fluid—particularly those arising from the high fluid pressure—the GP pathway working group proposes separating the cycle flow loop from the thermal-energy collection loop, which may consequently operate at more modest pressures. Furthermore, flow-loop separation allows the selection of potentially more favorable GP HTFs, such as pure helium or gas mixtures. However, the most relevant receiver designs for this pathway have not yet been adapted for lower-pressure and non-sCO2 HTFs.
4.3.1.1 Current Status This section reviews the recent DOE-funded projects that have sought to provide high-temperature energy to the sCO2 power cycle. The projects have varied emphasis on absorber design relative to broader system considerations, with efforts by NREL and Brayton Energy including system-level analyses, and Oregon State/Pacific Northwest National Laboratory’s (PNNL’s) receiver focusing on absorber development.
Brayton Energy: Under the auspices of its SunShot program, Brayton Energy developed a novel internally self-supported heat-exchanger architecture suitable for use in sCO2 CSP receiver applications (Figure 30). The program, started in Q3 2012, wrapped up at the end of Q1 2016 having met or surpassed all of its technical and cost targets. These targets and final programmatic results are shown in Table 22.
82 This report is available at no cost from the National Renewable Energy Laboratory at www.nrel.gov/publications.
Table 22. Performance metrics for Brayton Energy’s SunShot sCO2 Receiver Program (Note that although the design-point internal operating pressure of the system is 25 MPa, assemblies were
shown to survive up to 80 MPa at their operating temperature.)
Performance Metric
SunShot Target Cavity Receiver Results1
External Receiver Results
Receiver creep life (hours) n/a 60,000 90,000
Receiver fatigue life (cycles) ≥10,000 ≥100,000 ≥100,000
Receiver cost ($/kWth) ≤150 ≤120 ≤124
HTF exit temperature (°C) ≥650 750 715
Receiver efficiency 𝜂𝜂𝑂𝑂ℎ𝑈𝑈𝐹𝐹𝑒𝑒𝑈𝑈𝑈𝑈 (%) n/a 94.9 90.6
Annual receiver efficiency (%) ≥90 93.1 88.4
System efficiency gain (%) n/a n/a 30.3 (10.3 pts.)
Quartz window benefit (%) n/a n/a 6.1 (5.5 pts.) 1Results following Phase 2; cost excludes tower; further improvements achieved in Phase 3
To achieve these results, Brayton leveraged its experience with plate-fin-style recuperating heat exchangers for gas-turbine applications. Because traditional brazed-plate architectures are unable to reach the extremely high pressures associated with a sCO2 Brayton cycle (~25 MPa), an encapsulated unit-cell design was developed. Each unit cell consists of a dense set of fins brazed within an enclosed shell. The high-pressure working fluid flows internal to the cell, whereas the concentrated sunlight is incident on its outer surfaces. The network of densely packed fins within the cell serves a dual purpose:
1. It acts as a network of tensile cross-members that provides structural support to the cell. By relying on this internal support to reach the high internal pressure, the shell wall thickness may be thin, thereby reducing the through-wall temperature gradients.
2. It enhances the internal heat transfer from the external surface to the internal flow of sCO2, thereby ensuring that the material temperatures are minimized even under high flux conditions.
Figure 30. Example of Brayton’s internally supported sCO2 receiver unit cell. Densely packed fins brazed within the outer shell provide heat-transfer enhancement as well as
the tensile support network needed to reach the high internal pressures.
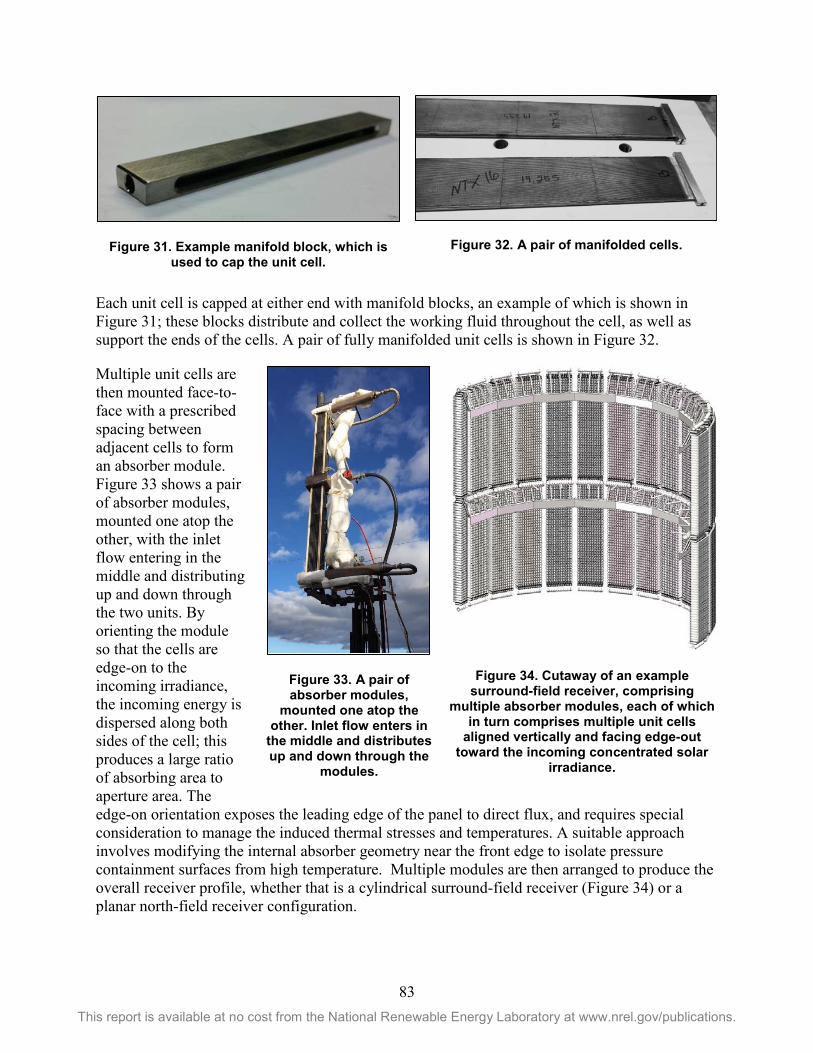
83 This report is available at no cost from the National Renewable Energy Laboratory at www.nrel.gov/publications.
Figure 31. Example manifold block, which is used to cap the unit cell.
Figure 32. A pair of manifolded cells.
Each unit cell is capped at either end with manifold blocks, an example of which is shown in Figure 31; these blocks distribute and collect the working fluid throughout the cell, as well as support the ends of the cells. A pair of fully manifolded unit cells is shown in Figure 32.
Multiple unit cells are then mounted face-to-face with a prescribed spacing between adjacent cells to form an absorber module. Figure 33 shows a pair of absorber modules, mounted one atop the other, with the inlet flow entering in the middle and distributing up and down through the two units. By orienting the module so that the cells are edge-on to the incoming irradiance, the incoming energy is dispersed along both sides of the cell; this produces a large ratio of absorbing area to aperture area. The edge-on orientation exposes the leading edge of the panel to direct flux, and requires special consideration to manage the induced thermal stresses and temperatures. A suitable approach involves modifying the internal absorber geometry near the front edge to isolate pressure containment surfaces from high temperature. Multiple modules are then arranged to produce the overall receiver profile, whether that is a cylindrical surround-field receiver (Figure 34) or a planar north-field receiver configuration.
Figure 33. A pair of absorber modules,
mounted one atop the other. Inlet flow enters in
the middle and distributes up and down through the
modules.
Figure 34. Cutaway of an example surround-field receiver, comprising
multiple absorber modules, each of which in turn comprises multiple unit cells
aligned vertically and facing edge-out toward the incoming concentrated solar
irradiance.
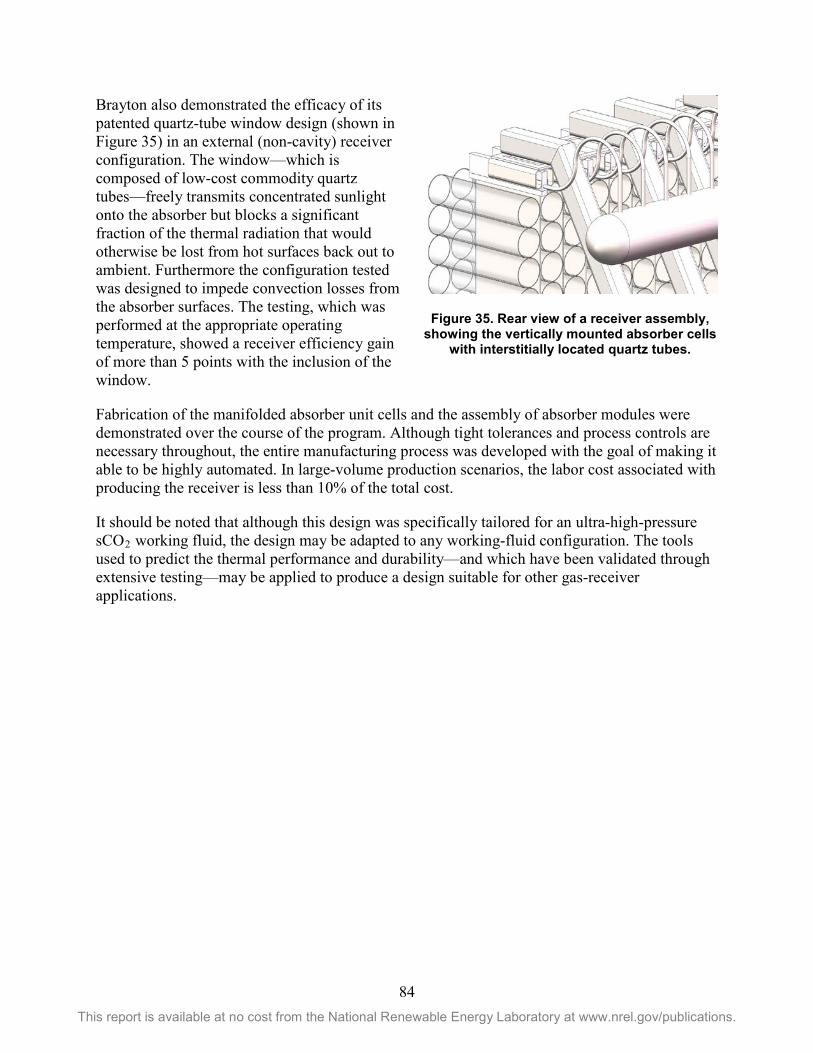
84 This report is available at no cost from the National Renewable Energy Laboratory at www.nrel.gov/publications.
Brayton also demonstrated the efficacy of its patented quartz-tube window design (shown in Figure 35) in an external (non-cavity) receiver configuration. The window—which is composed of low-cost commodity quartz tubes—freely transmits concentrated sunlight onto the absorber but blocks a significant fraction of the thermal radiation that would otherwise be lost from hot surfaces back out to ambient. Furthermore the configuration tested was designed to impede convection losses from the absorber surfaces. The testing, which was performed at the appropriate operating temperature, showed a receiver efficiency gain of more than 5 points with the inclusion of the window.
Fabrication of the manifolded absorber unit cells and the assembly of absorber modules were demonstrated over the course of the program. Although tight tolerances and process controls are necessary throughout, the entire manufacturing process was developed with the goal of making it able to be highly automated. In large-volume production scenarios, the labor cost associated with producing the receiver is less than 10% of the total cost.
It should be noted that although this design was specifically tailored for an ultra-high-pressure sCO2 working fluid, the design may be adapted to any working-fluid configuration. The tools used to predict the thermal performance and durability—and which have been validated through extensive testing—may be applied to produce a design suitable for other gas-receiver applications.
Figure 35. Rear view of a receiver assembly, showing the vertically mounted absorber cells
with interstitially located quartz tubes.
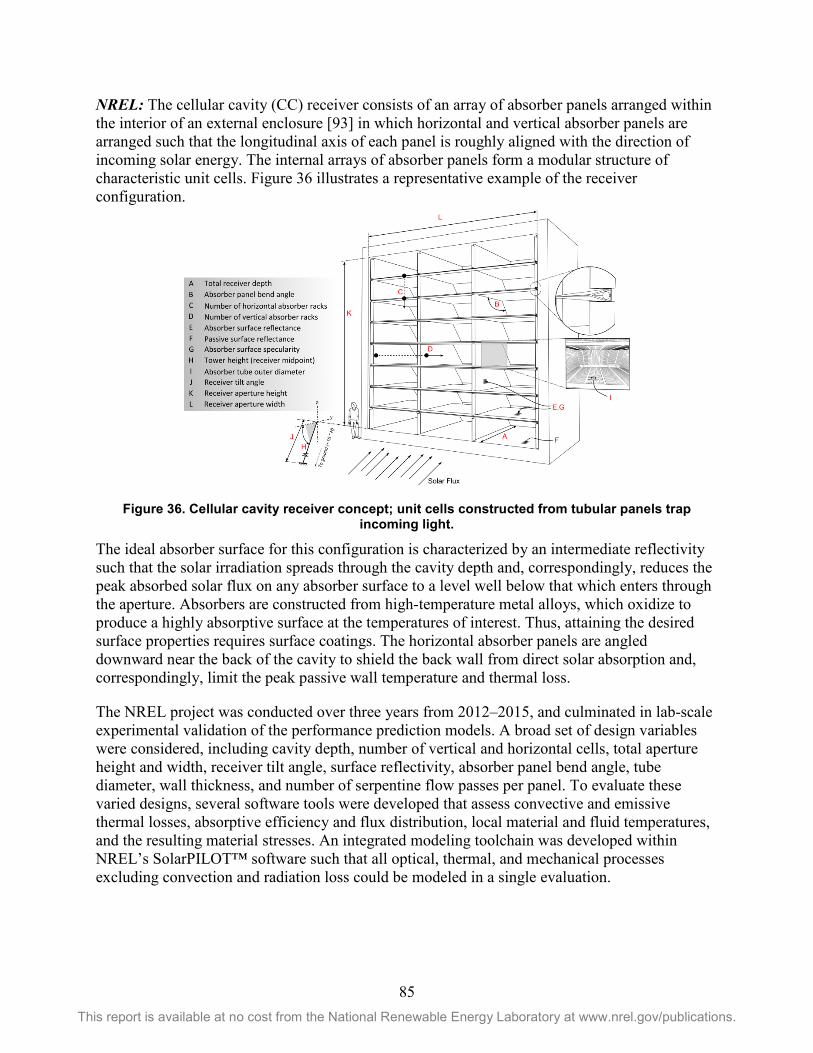
85 This report is available at no cost from the National Renewable Energy Laboratory at www.nrel.gov/publications.
NREL: The cellular cavity (CC) receiver consists of an array of absorber panels arranged within the interior of an external enclosure [93] in which horizontal and vertical absorber panels are arranged such that the longitudinal axis of each panel is roughly aligned with the direction of incoming solar energy. The internal arrays of absorber panels form a modular structure of characteristic unit cells. Figure 36 illustrates a representative example of the receiver configuration.
Figure 36. Cellular cavity receiver concept; unit cells constructed from tubular panels trap incoming light.
The ideal absorber surface for this configuration is characterized by an intermediate reflectivity such that the solar irradiation spreads through the cavity depth and, correspondingly, reduces the peak absorbed solar flux on any absorber surface to a level well below that which enters through the aperture. Absorbers are constructed from high-temperature metal alloys, which oxidize to produce a highly absorptive surface at the temperatures of interest. Thus, attaining the desired surface properties requires surface coatings. The horizontal absorber panels are angled downward near the back of the cavity to shield the back wall from direct solar absorption and, correspondingly, limit the peak passive wall temperature and thermal loss.
The NREL project was conducted over three years from 2012–2015, and culminated in lab-scale experimental validation of the performance prediction models. A broad set of design variables were considered, including cavity depth, number of vertical and horizontal cells, total aperture height and width, receiver tilt angle, surface reflectivity, absorber panel bend angle, tube diameter, wall thickness, and number of serpentine flow passes per panel. To evaluate these varied designs, several software tools were developed that assess convective and emissive thermal losses, absorptive efficiency and flux distribution, local material and fluid temperatures, and the resulting material stresses. An integrated modeling toolchain was developed within NREL’s SolarPILOT™ software such that all optical, thermal, and mechanical processes excluding convection and radiation loss could be modeled in a single evaluation.
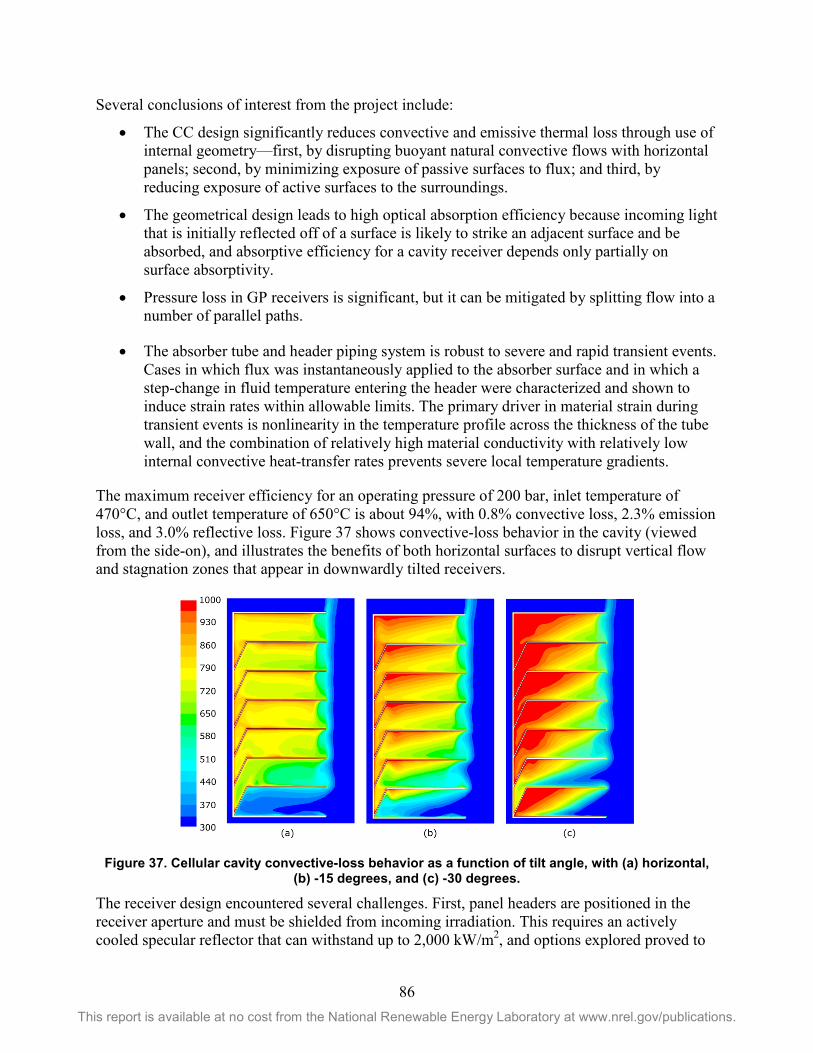
86 This report is available at no cost from the National Renewable Energy Laboratory at www.nrel.gov/publications.
Several conclusions of interest from the project include:
• The CC design significantly reduces convective and emissive thermal loss through use of internal geometry—first, by disrupting buoyant natural convective flows with horizontal panels; second, by minimizing exposure of passive surfaces to flux; and third, by reducing exposure of active surfaces to the surroundings.
• The geometrical design leads to high optical absorption efficiency because incoming light that is initially reflected off of a surface is likely to strike an adjacent surface and be absorbed, and absorptive efficiency for a cavity receiver depends only partially on surface absorptivity.
• Pressure loss in GP receivers is significant, but it can be mitigated by splitting flow into a number of parallel paths.
• The absorber tube and header piping system is robust to severe and rapid transient events. Cases in which flux was instantaneously applied to the absorber surface and in which a step-change in fluid temperature entering the header were characterized and shown to induce strain rates within allowable limits. The primary driver in material strain during transient events is nonlinearity in the temperature profile across the thickness of the tube wall, and the combination of relatively high material conductivity with relatively low internal convective heat-transfer rates prevents severe local temperature gradients.
The maximum receiver efficiency for an operating pressure of 200 bar, inlet temperature of 470°C, and outlet temperature of 650°C is about 94%, with 0.8% convective loss, 2.3% emission loss, and 3.0% reflective loss. Figure 37 shows convective-loss behavior in the cavity (viewed from the side-on), and illustrates the benefits of both horizontal surfaces to disrupt vertical flow and stagnation zones that appear in downwardly tilted receivers.
Figure 37. Cellular cavity convective-loss behavior as a function of tilt angle, with (a) horizontal, (b) -15 degrees, and (c) -30 degrees.
The receiver design encountered several challenges. First, panel headers are positioned in the receiver aperture and must be shielded from incoming irradiation. This requires an actively cooled specular reflector that can withstand up to 2,000 kW/m2, and options explored proved to
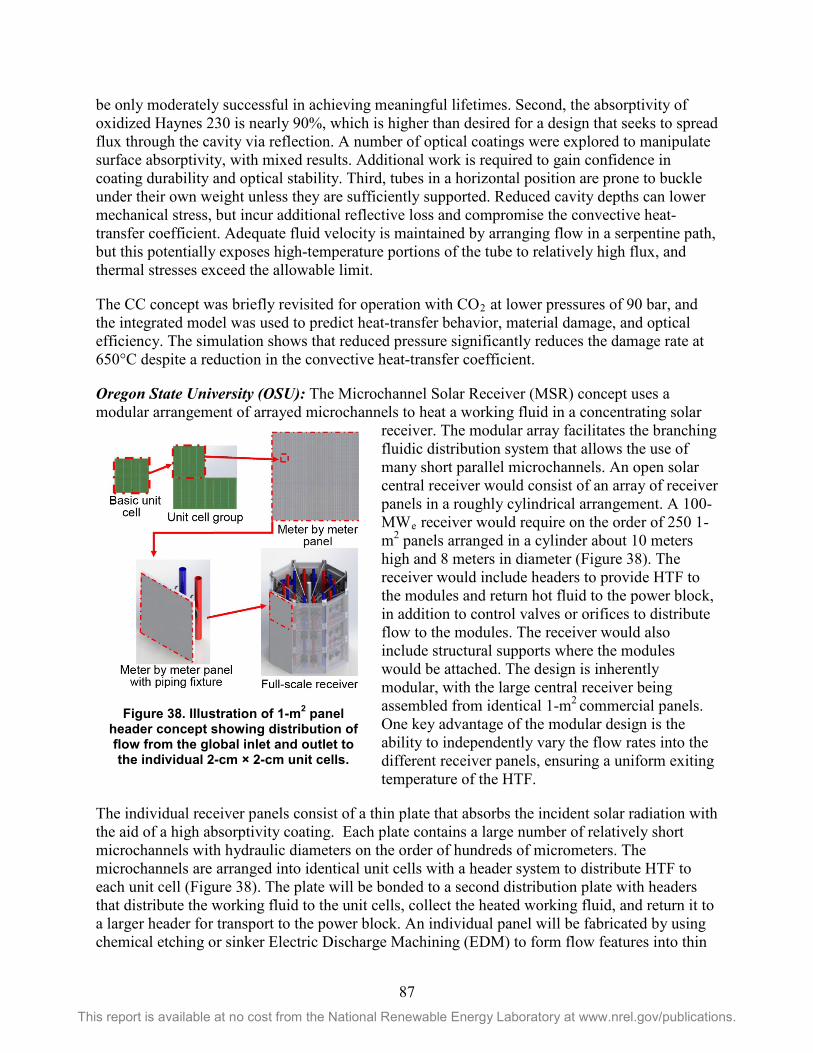
87 This report is available at no cost from the National Renewable Energy Laboratory at www.nrel.gov/publications.
be only moderately successful in achieving meaningful lifetimes. Second, the absorptivity of oxidized Haynes 230 is nearly 90%, which is higher than desired for a design that seeks to spread flux through the cavity via reflection. A number of optical coatings were explored to manipulate surface absorptivity, with mixed results. Additional work is required to gain confidence in coating durability and optical stability. Third, tubes in a horizontal position are prone to buckle under their own weight unless they are sufficiently supported. Reduced cavity depths can lower mechanical stress, but incur additional reflective loss and compromise the convective heat-transfer coefficient. Adequate fluid velocity is maintained by arranging flow in a serpentine path, but this potentially exposes high-temperature portions of the tube to relatively high flux, and thermal stresses exceed the allowable limit.
The CC concept was briefly revisited for operation with CO2 at lower pressures of 90 bar, and the integrated model was used to predict heat-transfer behavior, material damage, and optical efficiency. The simulation shows that reduced pressure significantly reduces the damage rate at 650°C despite a reduction in the convective heat-transfer coefficient.
Oregon State University (OSU): The Microchannel Solar Receiver (MSR) concept uses a modular arrangement of arrayed microchannels to heat a working fluid in a concentrating solar
receiver. The modular array facilitates the branching fluidic distribution system that allows the use of many short parallel microchannels. An open solar central receiver would consist of an array of receiver panels in a roughly cylindrical arrangement. A 100-MWe receiver would require on the order of 250 1-m2 panels arranged in a cylinder about 10 meters high and 8 meters in diameter (Figure 38). The receiver would include headers to provide HTF to the modules and return hot fluid to the power block, in addition to control valves or orifices to distribute flow to the modules. The receiver would also include structural supports where the modules would be attached. The design is inherently modular, with the large central receiver being assembled from identical 1-m2 commercial panels. One key advantage of the modular design is the ability to independently vary the flow rates into the different receiver panels, ensuring a uniform exiting temperature of the HTF.
The individual receiver panels consist of a thin plate that absorbs the incident solar radiation with the aid of a high absorptivity coating. Each plate contains a large number of relatively short microchannels with hydraulic diameters on the order of hundreds of micrometers. The microchannels are arranged into identical unit cells with a header system to distribute HTF to each unit cell (Figure 38). The plate will be bonded to a second distribution plate with headers that distribute the working fluid to the unit cells, collect the heated working fluid, and return it to a larger header for transport to the power block. An individual panel will be fabricated by using chemical etching or sinker Electric Discharge Machining (EDM) to form flow features into thin
Figure 38. Illustration of 1-m2 panel header concept showing distribution of flow from the global inlet and outlet to the individual 2-cm × 2-cm unit cells.
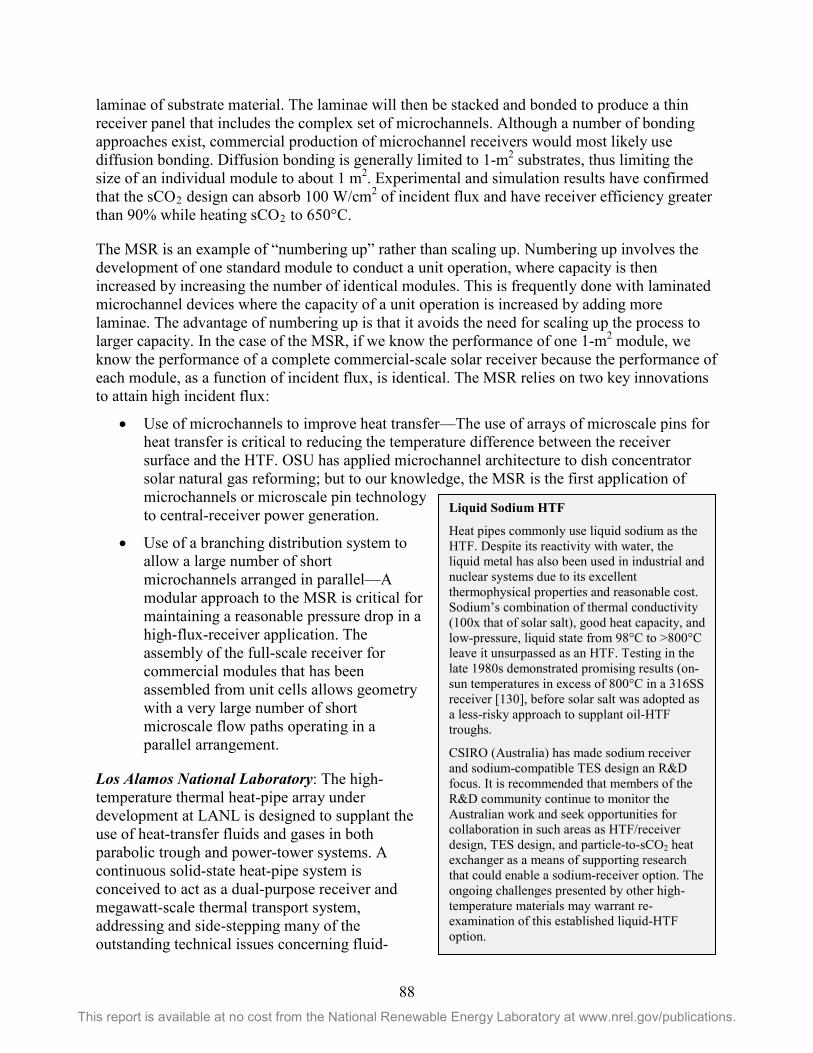
88 This report is available at no cost from the National Renewable Energy Laboratory at www.nrel.gov/publications.
laminae of substrate material. The laminae will then be stacked and bonded to produce a thin receiver panel that includes the complex set of microchannels. Although a number of bonding approaches exist, commercial production of microchannel receivers would most likely use diffusion bonding. Diffusion bonding is generally limited to 1-m2 substrates, thus limiting the size of an individual module to about 1 m2. Experimental and simulation results have confirmed that the sCO2 design can absorb 100 W/cm2 of incident flux and have receiver efficiency greater than 90% while heating sCO2 to 650°C.
The MSR is an example of “numbering up” rather than scaling up. Numbering up involves the development of one standard module to conduct a unit operation, where capacity is then increased by increasing the number of identical modules. This is frequently done with laminated microchannel devices where the capacity of a unit operation is increased by adding more laminae. The advantage of numbering up is that it avoids the need for scaling up the process to larger capacity. In the case of the MSR, if we know the performance of one 1-m2 module, we know the performance of a complete commercial-scale solar receiver because the performance of each module, as a function of incident flux, is identical. The MSR relies on two key innovations to attain high incident flux:
• Use of microchannels to improve heat transfer—The use of arrays of microscale pins for heat transfer is critical to reducing the temperature difference between the receiver surface and the HTF. OSU has applied microchannel architecture to dish concentrator solar natural gas reforming; but to our knowledge, the MSR is the first application of microchannels or microscale pin technology to central-receiver power generation.
• Use of a branching distribution system to allow a large number of short microchannels arranged in parallel—A modular approach to the MSR is critical for maintaining a reasonable pressure drop in a high-flux-receiver application. The assembly of the full-scale receiver for commercial modules that has been assembled from unit cells allows geometry with a very large number of short microscale flow paths operating in a parallel arrangement.
Los Alamos National Laboratory: The high-temperature thermal heat-pipe array under development at LANL is designed to supplant the use of heat-transfer fluids and gases in both parabolic trough and power-tower systems. A continuous solid-state heat-pipe system is conceived to act as a dual-purpose receiver and megawatt-scale thermal transport system, addressing and side-stepping many of the outstanding technical issues concerning fluid-
Liquid Sodium HTF
Heat pipes commonly use liquid sodium as the HTF. Despite its reactivity with water, the liquid metal has also been used in industrial and nuclear systems due to its excellent thermophysical properties and reasonable cost. Sodium’s combination of thermal conductivity (100x that of solar salt), good heat capacity, and low-pressure, liquid state from 98°C to >800°C leave it unsurpassed as an HTF. Testing in the late 1980s demonstrated promising results (on-sun temperatures in excess of 800°C in a 316SS receiver [130], before solar salt was adopted as a less-risky approach to supplant oil-HTF troughs.
CSIRO (Australia) has made sodium receiver and sodium-compatible TES design an R&D focus. It is recommended that members of the R&D community continue to monitor the Australian work and seek opportunities for collaboration in such areas as HTF/receiver design, TES design, and particle-to-sCO2 heat exchanger as a means of supporting research that could enable a sodium-receiver option. The ongoing challenges presented by other high-temperature materials may warrant re-examination of this established liquid-HTF option.
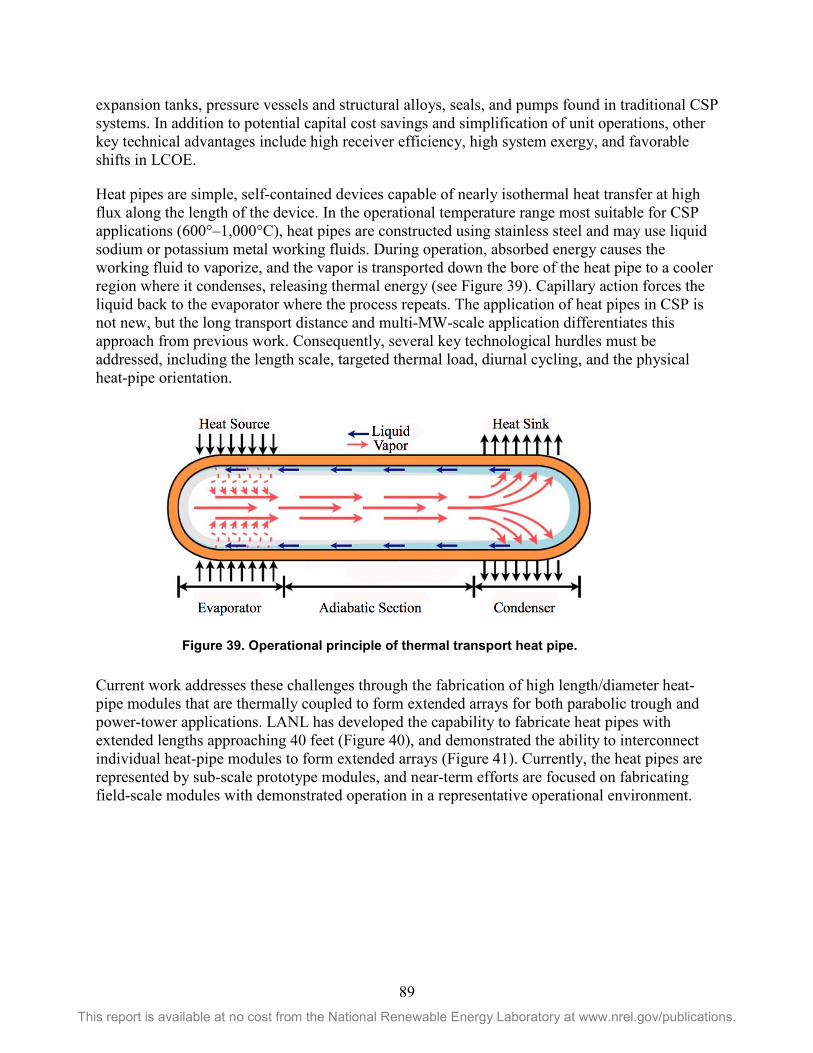
89 This report is available at no cost from the National Renewable Energy Laboratory at www.nrel.gov/publications.
expansion tanks, pressure vessels and structural alloys, seals, and pumps found in traditional CSP systems. In addition to potential capital cost savings and simplification of unit operations, other key technical advantages include high receiver efficiency, high system exergy, and favorable shifts in LCOE.
Heat pipes are simple, self-contained devices capable of nearly isothermal heat transfer at high flux along the length of the device. In the operational temperature range most suitable for CSP applications (600°–1,000°C), heat pipes are constructed using stainless steel and may use liquid sodium or potassium metal working fluids. During operation, absorbed energy causes the working fluid to vaporize, and the vapor is transported down the bore of the heat pipe to a cooler region where it condenses, releasing thermal energy (see Figure 39). Capillary action forces the liquid back to the evaporator where the process repeats. The application of heat pipes in CSP is not new, but the long transport distance and multi-MW-scale application differentiates this approach from previous work. Consequently, several key technological hurdles must be addressed, including the length scale, targeted thermal load, diurnal cycling, and the physical heat-pipe orientation.
Current work addresses these challenges through the fabrication of high length/diameter heat-pipe modules that are thermally coupled to form extended arrays for both parabolic trough and power-tower applications. LANL has developed the capability to fabricate heat pipes with extended lengths approaching 40 feet (Figure 40), and demonstrated the ability to interconnect individual heat-pipe modules to form extended arrays (Figure 41). Currently, the heat pipes are represented by sub-scale prototype modules, and near-term efforts are focused on fabricating field-scale modules with demonstrated operation in a representative operational environment.
Figure 39. Operational principle of thermal transport heat pipe.
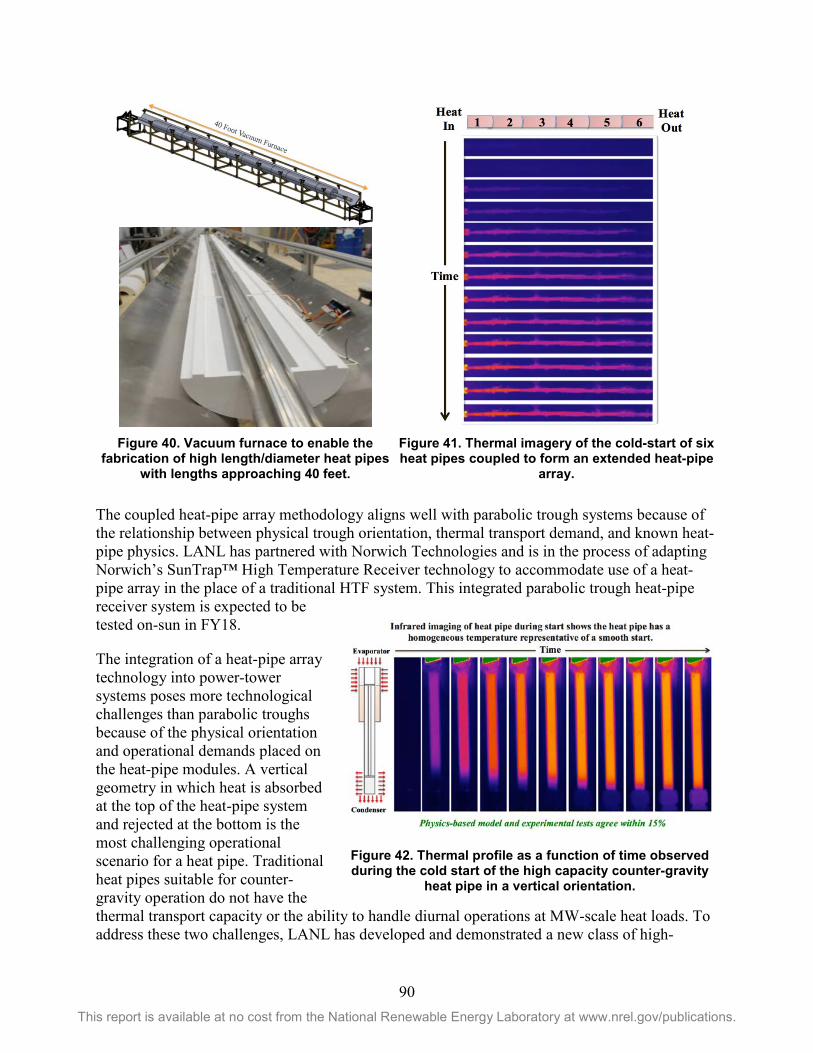
90 This report is available at no cost from the National Renewable Energy Laboratory at www.nrel.gov/publications.
Figure 40. Vacuum furnace to enable the
fabrication of high length/diameter heat pipes with lengths approaching 40 feet.
Figure 41. Thermal imagery of the cold-start of six heat pipes coupled to form an extended heat-pipe
array.
The coupled heat-pipe array methodology aligns well with parabolic trough systems because of the relationship between physical trough orientation, thermal transport demand, and known heat-pipe physics. LANL has partnered with Norwich Technologies and is in the process of adapting Norwich’s SunTrap™ High Temperature Receiver technology to accommodate use of a heat-pipe array in the place of a traditional HTF system. This integrated parabolic trough heat-pipe receiver system is expected to be tested on-sun in FY18.
The integration of a heat-pipe array technology into power-tower systems poses more technological challenges than parabolic troughs because of the physical orientation and operational demands placed on the heat-pipe modules. A vertical geometry in which heat is absorbed at the top of the heat-pipe system and rejected at the bottom is the most challenging operational scenario for a heat pipe. Traditional heat pipes suitable for counter-gravity operation do not have the thermal transport capacity or the ability to handle diurnal operations at MW-scale heat loads. To address these two challenges, LANL has developed and demonstrated a new class of high-
Figure 42. Thermal profile as a function of time observed during the cold start of the high capacity counter-gravity
heat pipe in a vertical orientation.

91 This report is available at no cost from the National Renewable Energy Laboratory at www.nrel.gov/publications.
thermal-capacity heat pipes capable of self-regulated shutdown and restart (Figure 42). This system has been demonstrated at a sub-scale prototype level with supporting physics-based models and operational experimental behavior supporting transition to full-scale modules. Pending work focuses on the transition of the sub-scale prototype to field-scale prototypes and on-sun testing.
Sandia National Laboratories: Novel designs to increase light trapping and thermal efficiency of concentrating solar receivers at multiple length scales have been designed and tested at Sandia using compressed air. The receiver is designed for operation at 15 MPa, delivering CO2 at 650ºC. The bladed receiver (Figure 43) design concept is flexible with respect to number of fins, number of tubes, and the angle of the fins in relation to the vertical direction. To provide favorable receiver geometries for the thermal performance analysis, an algorithm was developed to determine receiver dimensions for a parametric ray-trace analysis. The number of fins, number of tubes, individual panel length, back section length, and panel tilt angle were varied among hundreds of cases in which total surface area was held constant. Each case was then evaluated in SolTrace assuming a 90% optical absorptivity that results from alloy surface oxide formation to determine the receiver absorptive efficiency, and the analysis demonstrated configurations capable of achieving nearly 97% efficiency. The flux intensity profiles generated using SolTrace indicate that the hottest regions will be on the lower half of the back panels (Figure 44) and on the tips of the fins. The latter were painted white to reduce the surface temperature and avoid failure at these tips. Due to the size of the receiver, spillage boards were installed on the front of the receiver to protect the structure and inlet and outlet headers from incident flux (Figure 45).
Sandia constructed an on-sun test for the bladed receiver concept using compressed air at 0.83 MPa and up to 0.071 m3/s (about 35 g/s per receiver flow section) at the compressor outlet with associated sensors to measure temperature, mass flow rate, and pressure. The variation in all the temperatures recorded by the thermocouples was used to determine the steady-state regions where the relative uncertainty of the temperature increase was below 2%. These data were used to compute the thermal efficiencies as a function of the power incident on the receiver (Figure 46). Results showed that the thermal efficiency of the bladed receiver was up to 6% greater than the flat receiver. At higher irradiances, the thermal efficiency decreased because the air mass flow rate was held constant and the tube surface temperatures increased, yielding greater radiative and convective heat losses. For the relatively low air mass flow rate, an optimum average irradiance on the receiver appeared to be between 20 and 30 kW/m2. Future work will include evaluation of allowable flux to ensure testing and operation at higher pressure is feasible.
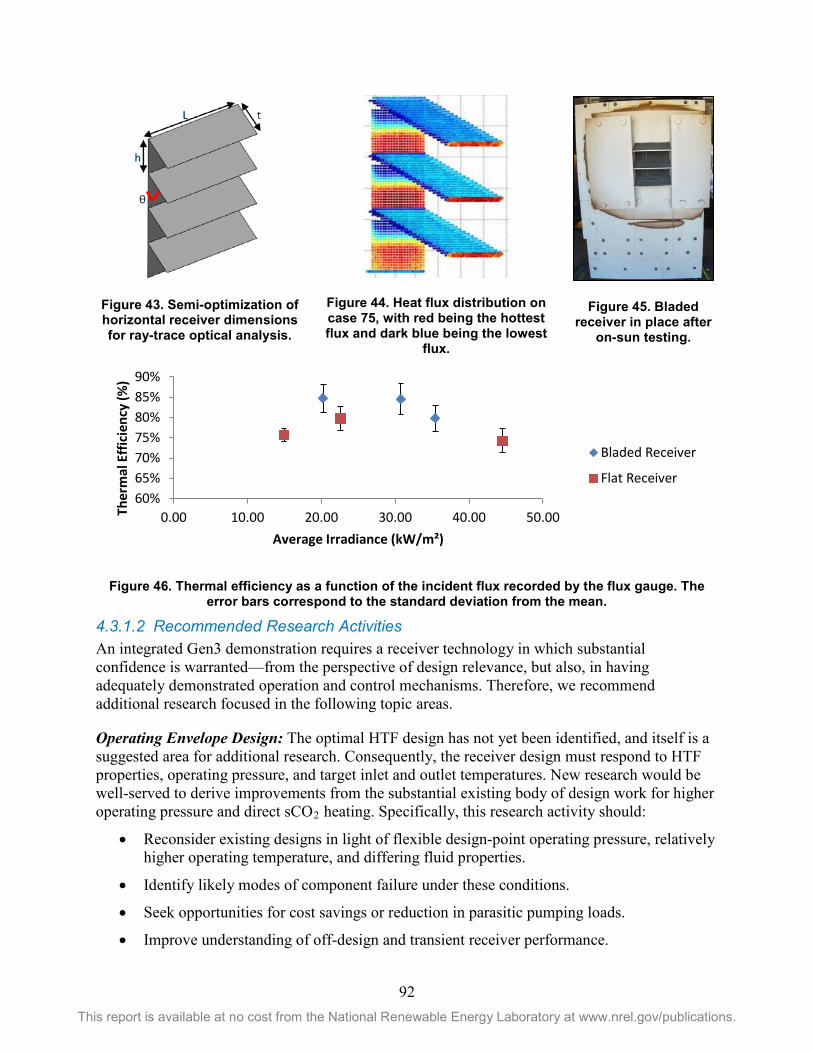
92 This report is available at no cost from the National Renewable Energy Laboratory at www.nrel.gov/publications.
Figure 43. Semi-optimization of horizontal receiver dimensions for ray-trace optical analysis.
Figure 44. Heat flux distribution on case 75, with red being the hottest flux and dark blue being the lowest
flux.
Figure 45. Bladed receiver in place after
on-sun testing.
Figure 46. Thermal efficiency as a function of the incident flux recorded by the flux gauge. The
error bars correspond to the standard deviation from the mean.
4.3.1.2 Recommended Research Activities An integrated Gen3 demonstration requires a receiver technology in which substantial confidence is warranted—from the perspective of design relevance, but also, in having adequately demonstrated operation and control mechanisms. Therefore, we recommend additional research focused in the following topic areas.
Operating Envelope Design: The optimal HTF design has not yet been identified, and itself is a suggested area for additional research. Consequently, the receiver design must respond to HTF properties, operating pressure, and target inlet and outlet temperatures. New research would be well-served to derive improvements from the substantial existing body of design work for higher operating pressure and direct sCO2 heating. Specifically, this research activity should:
• Reconsider existing designs in light of flexible design-point operating pressure, relatively higher operating temperature, and differing fluid properties.
• Identify likely modes of component failure under these conditions.
• Seek opportunities for cost savings or reduction in parasitic pumping loads.
• Improve understanding of off-design and transient receiver performance.
60%65%70%75%80%85%90%
0.00 10.00 20.00 30.00 40.00 50.00Ther
mal
Effi
cien
cy (%
)
Average Irradiance (kW/m²)
Bladed Receiver
Flat Receiver
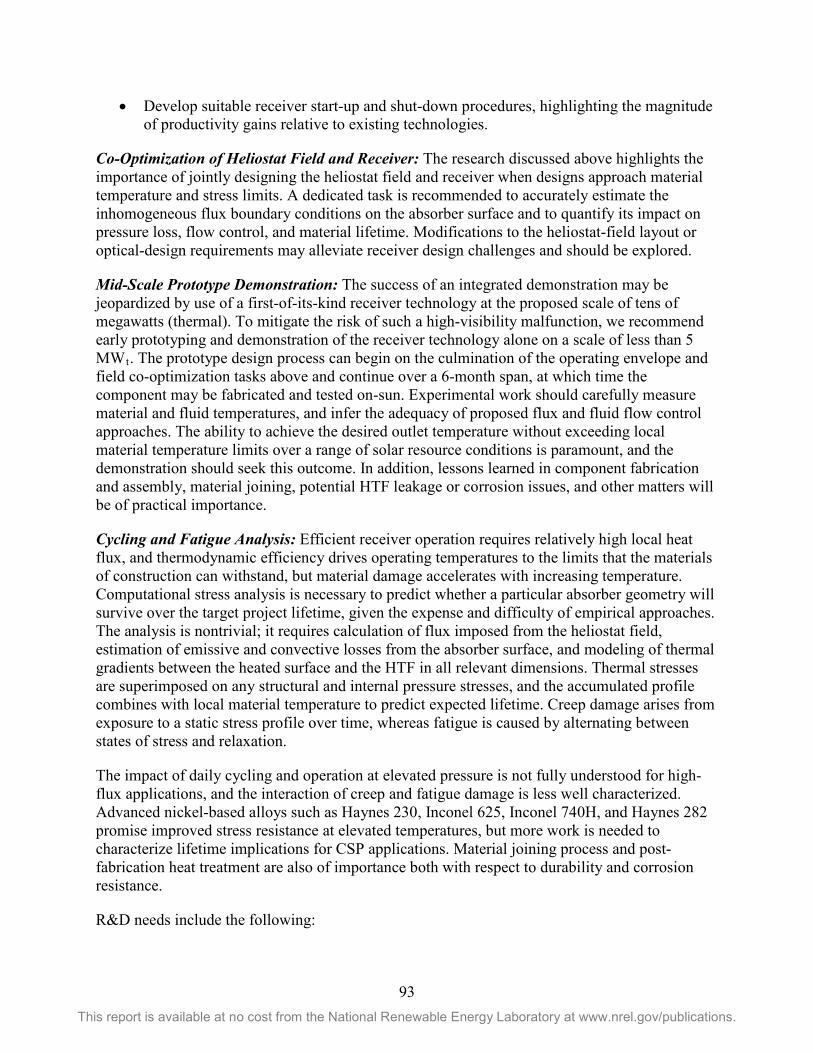
93 This report is available at no cost from the National Renewable Energy Laboratory at www.nrel.gov/publications.
• Develop suitable receiver start-up and shut-down procedures, highlighting the magnitude of productivity gains relative to existing technologies.
Co-Optimization of Heliostat Field and Receiver: The research discussed above highlights the importance of jointly designing the heliostat field and receiver when designs approach material temperature and stress limits. A dedicated task is recommended to accurately estimate the inhomogeneous flux boundary conditions on the absorber surface and to quantify its impact on pressure loss, flow control, and material lifetime. Modifications to the heliostat-field layout or optical-design requirements may alleviate receiver design challenges and should be explored.
Mid-Scale Prototype Demonstration: The success of an integrated demonstration may be jeopardized by use of a first-of-its-kind receiver technology at the proposed scale of tens of megawatts (thermal). To mitigate the risk of such a high-visibility malfunction, we recommend early prototyping and demonstration of the receiver technology alone on a scale of less than 5 MWt. The prototype design process can begin on the culmination of the operating envelope and field co-optimization tasks above and continue over a 6-month span, at which time the component may be fabricated and tested on-sun. Experimental work should carefully measure material and fluid temperatures, and infer the adequacy of proposed flux and fluid flow control approaches. The ability to achieve the desired outlet temperature without exceeding local material temperature limits over a range of solar resource conditions is paramount, and the demonstration should seek this outcome. In addition, lessons learned in component fabrication and assembly, material joining, potential HTF leakage or corrosion issues, and other matters will be of practical importance.
Cycling and Fatigue Analysis: Efficient receiver operation requires relatively high local heat flux, and thermodynamic efficiency drives operating temperatures to the limits that the materials of construction can withstand, but material damage accelerates with increasing temperature. Computational stress analysis is necessary to predict whether a particular absorber geometry will survive over the target project lifetime, given the expense and difficulty of empirical approaches. The analysis is nontrivial; it requires calculation of flux imposed from the heliostat field, estimation of emissive and convective losses from the absorber surface, and modeling of thermal gradients between the heated surface and the HTF in all relevant dimensions. Thermal stresses are superimposed on any structural and internal pressure stresses, and the accumulated profile combines with local material temperature to predict expected lifetime. Creep damage arises from exposure to a static stress profile over time, whereas fatigue is caused by alternating between states of stress and relaxation.
The impact of daily cycling and operation at elevated pressure is not fully understood for high-flux applications, and the interaction of creep and fatigue damage is less well characterized. Advanced nickel-based alloys such as Haynes 230, Inconel 625, Inconel 740H, and Haynes 282 promise improved stress resistance at elevated temperatures, but more work is needed to characterize lifetime implications for CSP applications. Material joining process and post-fabrication heat treatment are also of importance both with respect to durability and corrosion resistance.
R&D needs include the following:
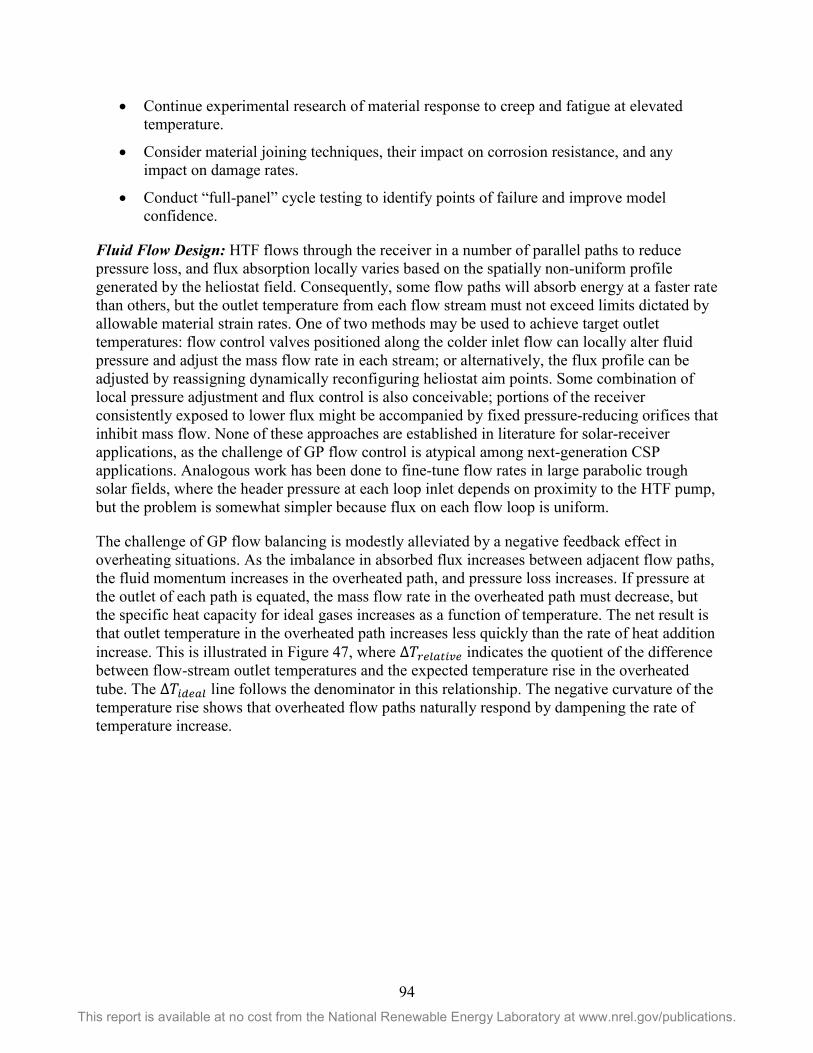
94 This report is available at no cost from the National Renewable Energy Laboratory at www.nrel.gov/publications.
• Continue experimental research of material response to creep and fatigue at elevated temperature.
• Consider material joining techniques, their impact on corrosion resistance, and any impact on damage rates.
• Conduct “full-panel” cycle testing to identify points of failure and improve model confidence.
Fluid Flow Design: HTF flows through the receiver in a number of parallel paths to reduce pressure loss, and flux absorption locally varies based on the spatially non-uniform profile generated by the heliostat field. Consequently, some flow paths will absorb energy at a faster rate than others, but the outlet temperature from each flow stream must not exceed limits dictated by allowable material strain rates. One of two methods may be used to achieve target outlet temperatures: flow control valves positioned along the colder inlet flow can locally alter fluid pressure and adjust the mass flow rate in each stream; or alternatively, the flux profile can be adjusted by reassigning dynamically reconfiguring heliostat aim points. Some combination of local pressure adjustment and flux control is also conceivable; portions of the receiver consistently exposed to lower flux might be accompanied by fixed pressure-reducing orifices that inhibit mass flow. None of these approaches are established in literature for solar-receiver applications, as the challenge of GP flow control is atypical among next-generation CSP applications. Analogous work has been done to fine-tune flow rates in large parabolic trough solar fields, where the header pressure at each loop inlet depends on proximity to the HTF pump, but the problem is somewhat simpler because flux on each flow loop is uniform.
The challenge of GP flow balancing is modestly alleviated by a negative feedback effect in overheating situations. As the imbalance in absorbed flux increases between adjacent flow paths, the fluid momentum increases in the overheated path, and pressure loss increases. If pressure at the outlet of each path is equated, the mass flow rate in the overheated path must decrease, but the specific heat capacity for ideal gases increases as a function of temperature. The net result is that outlet temperature in the overheated path increases less quickly than the rate of heat addition increase. This is illustrated in Figure 47, where Δ𝑇𝑇𝐹𝐹𝑈𝑈𝑈𝑈𝑈𝑈𝑂𝑂𝐸𝐸𝐸𝐸𝑈𝑈 indicates the quotient of the difference between flow-stream outlet temperatures and the expected temperature rise in the overheated tube. The Δ𝑇𝑇𝐸𝐸𝑈𝑈𝑈𝑈𝑈𝑈𝑈𝑈 line follows the denominator in this relationship. The negative curvature of the temperature rise shows that overheated flow paths naturally respond by dampening the rate of temperature increase.
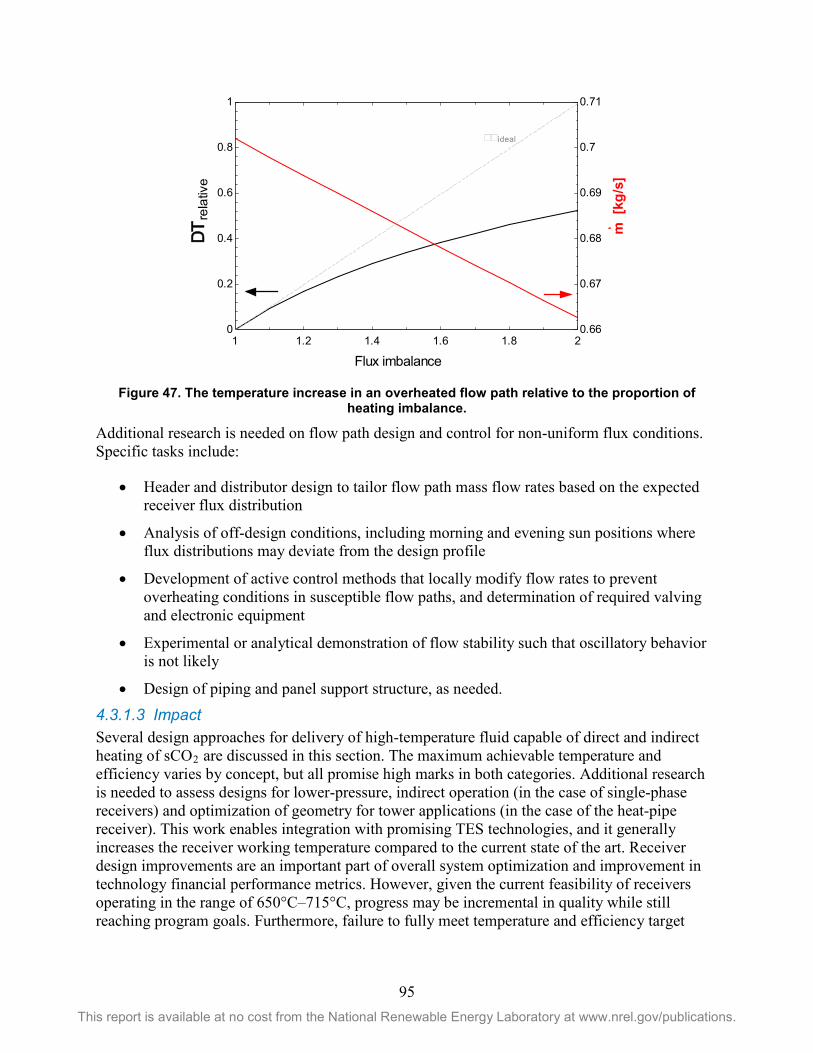
95 This report is available at no cost from the National Renewable Energy Laboratory at www.nrel.gov/publications.
Figure 47. The temperature increase in an overheated flow path relative to the proportion of heating imbalance.
Additional research is needed on flow path design and control for non-uniform flux conditions. Specific tasks include:
• Header and distributor design to tailor flow path mass flow rates based on the expected receiver flux distribution
• Analysis of off-design conditions, including morning and evening sun positions where flux distributions may deviate from the design profile
• Development of active control methods that locally modify flow rates to prevent overheating conditions in susceptible flow paths, and determination of required valving and electronic equipment
• Experimental or analytical demonstration of flow stability such that oscillatory behavior is not likely
• Design of piping and panel support structure, as needed.
4.3.1.3 Impact Several design approaches for delivery of high-temperature fluid capable of direct and indirect heating of sCO2 are discussed in this section. The maximum achievable temperature and efficiency varies by concept, but all promise high marks in both categories. Additional research is needed to assess designs for lower-pressure, indirect operation (in the case of single-phase receivers) and optimization of geometry for tower applications (in the case of the heat-pipe receiver). This work enables integration with promising TES technologies, and it generally increases the receiver working temperature compared to the current state of the art. Receiver design improvements are an important part of overall system optimization and improvement in technology financial performance metrics. However, given the current feasibility of receivers operating in the range of 650°C–715°C, progress may be incremental in quality while still reaching program goals. Furthermore, failure to fully meet temperature and efficiency target
1 1.2 1.4 1.6 1.8 20
0.2
0.4
0.6
0.8
1
0.66
0.67
0.68
0.69
0.7
0.71
Flux imbalance
DTre
lativ
e
m [
kg/s
]
DDideal
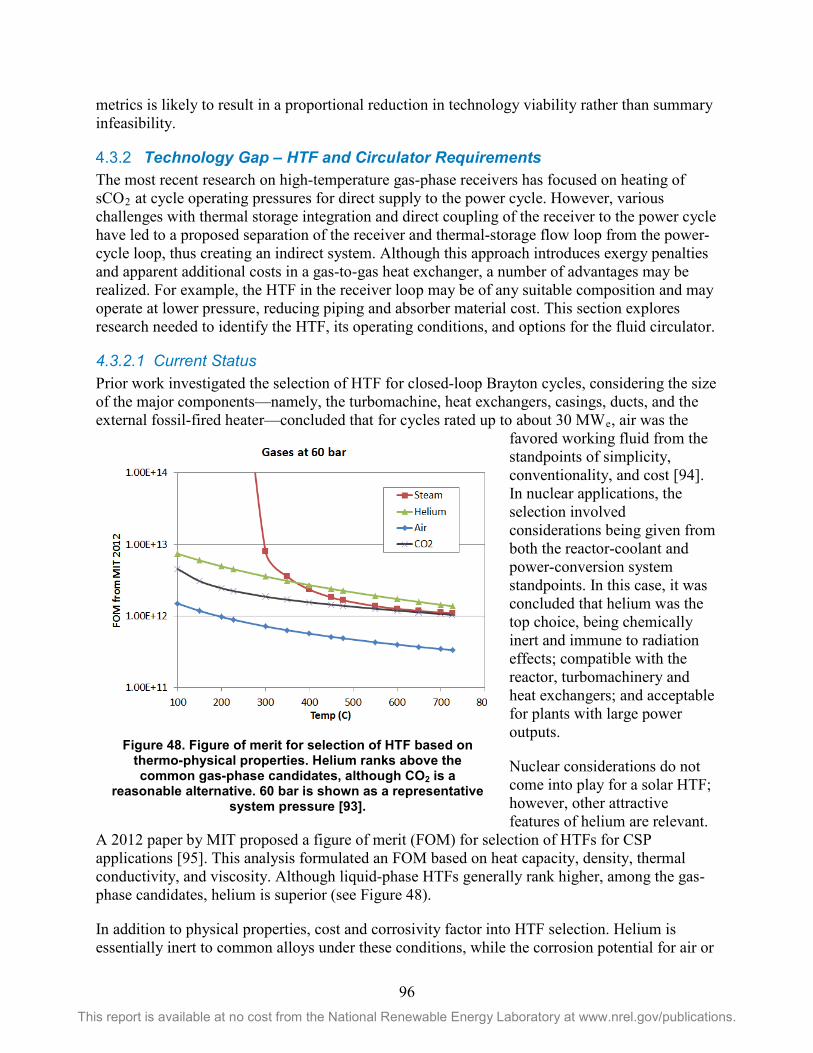
96 This report is available at no cost from the National Renewable Energy Laboratory at www.nrel.gov/publications.
metrics is likely to result in a proportional reduction in technology viability rather than summary infeasibility.
Technology Gap – HTF and Circulator Requirements 4.3.2The most recent research on high-temperature gas-phase receivers has focused on heating of sCO2 at cycle operating pressures for direct supply to the power cycle. However, various challenges with thermal storage integration and direct coupling of the receiver to the power cycle have led to a proposed separation of the receiver and thermal-storage flow loop from the power-cycle loop, thus creating an indirect system. Although this approach introduces exergy penalties and apparent additional costs in a gas-to-gas heat exchanger, a number of advantages may be realized. For example, the HTF in the receiver loop may be of any suitable composition and may operate at lower pressure, reducing piping and absorber material cost. This section explores research needed to identify the HTF, its operating conditions, and options for the fluid circulator.
4.3.2.1 Current Status Prior work investigated the selection of HTF for closed-loop Brayton cycles, considering the size of the major components—namely, the turbomachine, heat exchangers, casings, ducts, and the external fossil-fired heater—concluded that for cycles rated up to about 30 MWe, air was the
favored working fluid from the standpoints of simplicity, conventionality, and cost [94]. In nuclear applications, the selection involved considerations being given from both the reactor-coolant and power-conversion system standpoints. In this case, it was concluded that helium was the top choice, being chemically inert and immune to radiation effects; compatible with the reactor, turbomachinery and heat exchangers; and acceptable for plants with large power outputs.
Nuclear considerations do not come into play for a solar HTF; however, other attractive features of helium are relevant.
A 2012 paper by MIT proposed a figure of merit (FOM) for selection of HTFs for CSP applications [95]. This analysis formulated an FOM based on heat capacity, density, thermal conductivity, and viscosity. Although liquid-phase HTFs generally rank higher, among the gas-phase candidates, helium is superior (see Figure 48).
In addition to physical properties, cost and corrosivity factor into HTF selection. Helium is essentially inert to common alloys under these conditions, while the corrosion potential for air or
Figure 48. Figure of merit for selection of HTF based on thermo-physical properties. Helium ranks above the common gas-phase candidates, although CO2 is a
reasonable alternative. 60 bar is shown as a representative system pressure [93].
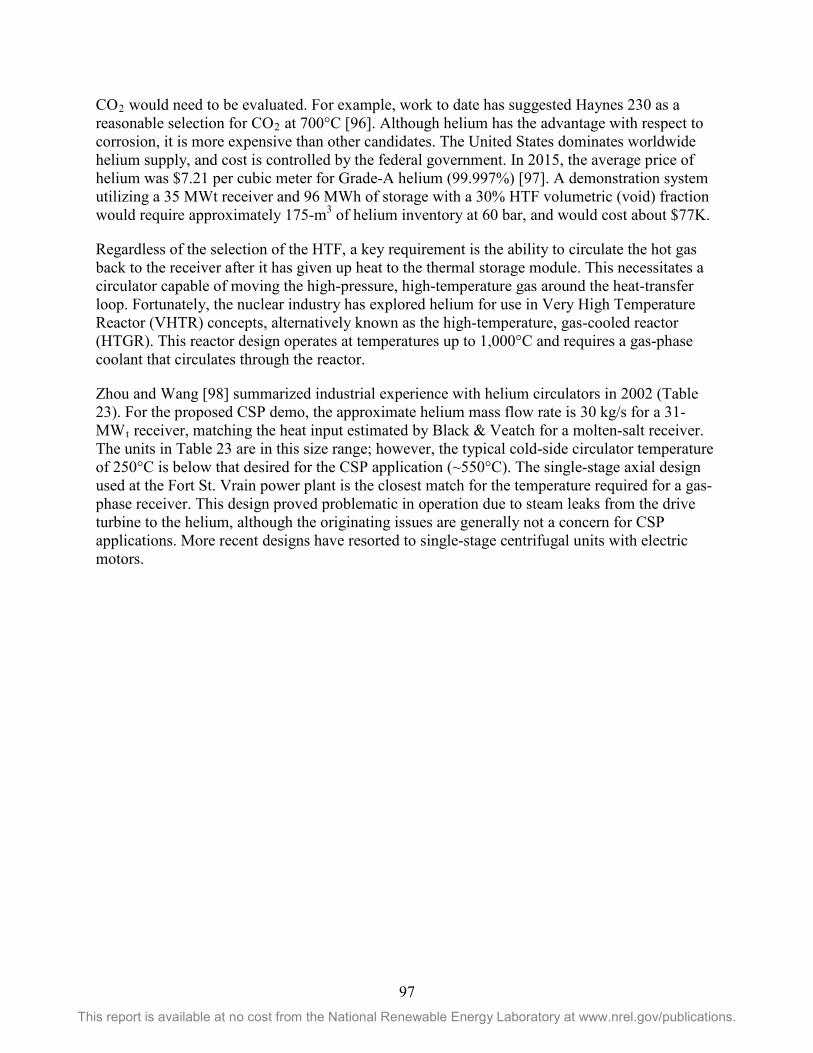
97 This report is available at no cost from the National Renewable Energy Laboratory at www.nrel.gov/publications.
CO2 would need to be evaluated. For example, work to date has suggested Haynes 230 as a reasonable selection for CO2 at 700°C [96]. Although helium has the advantage with respect to corrosion, it is more expensive than other candidates. The United States dominates worldwide helium supply, and cost is controlled by the federal government. In 2015, the average price of helium was $7.21 per cubic meter for Grade-A helium (99.997%) [97]. A demonstration system utilizing a 35 MWt receiver and 96 MWh of storage with a 30% HTF volumetric (void) fraction would require approximately 175-m3 of helium inventory at 60 bar, and would cost about $77K.
Regardless of the selection of the HTF, a key requirement is the ability to circulate the hot gas back to the receiver after it has given up heat to the thermal storage module. This necessitates a circulator capable of moving the high-pressure, high-temperature gas around the heat-transfer loop. Fortunately, the nuclear industry has explored helium for use in Very High Temperature Reactor (VHTR) concepts, alternatively known as the high-temperature, gas-cooled reactor (HTGR). This reactor design operates at temperatures up to 1,000°C and requires a gas-phase coolant that circulates through the reactor.
Zhou and Wang [98] summarized industrial experience with helium circulators in 2002 (Table 23). For the proposed CSP demo, the approximate helium mass flow rate is 30 kg/s for a 31-MWt receiver, matching the heat input estimated by Black & Veatch for a molten-salt receiver. The units in Table 23 are in this size range; however, the typical cold-side circulator temperature of 250°C is below that desired for the CSP application (~550°C). The single-stage axial design used at the Fort St. Vrain power plant is the closest match for the temperature required for a gas-phase receiver. This design proved problematic in operation due to steam leaks from the drive turbine to the helium, although the originating issues are generally not a concern for CSP applications. More recent designs have resorted to single-stage centrifugal units with electric motors.
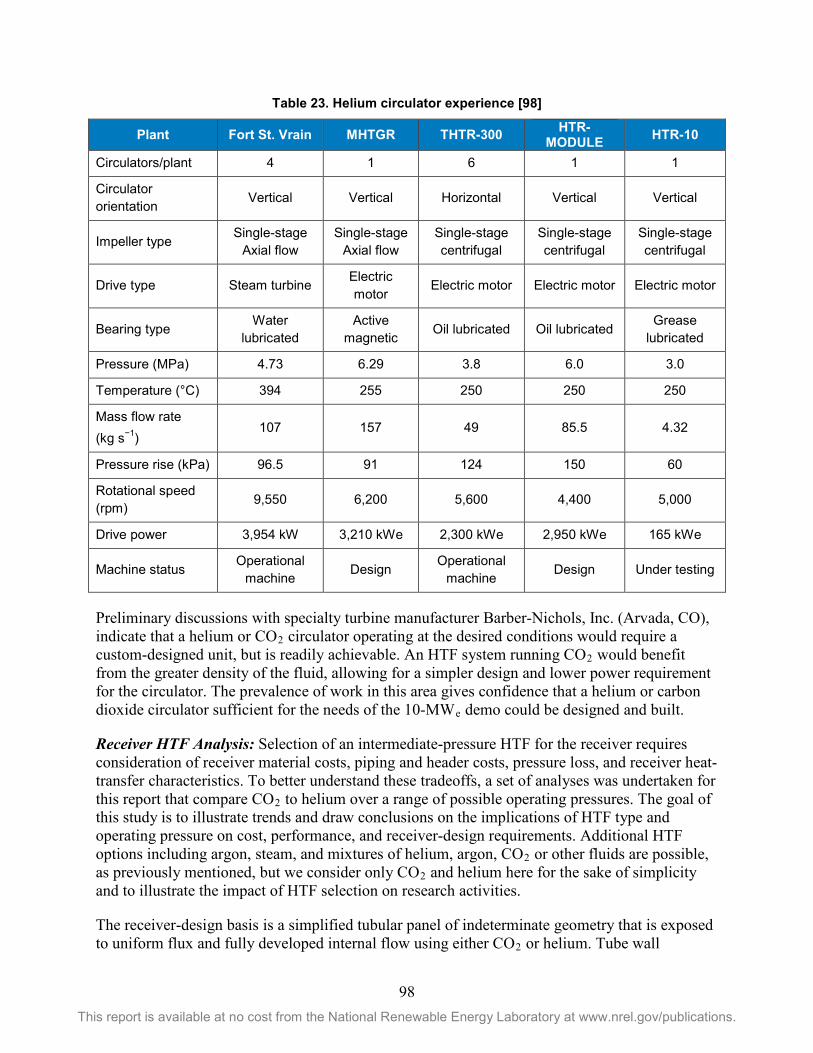
98 This report is available at no cost from the National Renewable Energy Laboratory at www.nrel.gov/publications.
Table 23. Helium circulator experience [98]
Plant Fort St. Vrain MHTGR THTR-300 HTR-MODULE HTR-10
Circulators/plant 4 1 6 1 1
Circulator orientation Vertical Vertical Horizontal Vertical Vertical
Impeller type Single-stage Axial flow
Single-stage Axial flow
Single-stage centrifugal
Single-stage centrifugal
Single-stage centrifugal
Drive type Steam turbine Electric motor
Electric motor Electric motor Electric motor
Bearing type Water lubricated
Active magnetic Oil lubricated Oil lubricated Grease
lubricated
Pressure (MPa) 4.73 6.29 3.8 6.0 3.0
Temperature (°C) 394 255 250 250 250
Mass flow rate (kg s−1)
107 157 49 85.5 4.32
Pressure rise (kPa) 96.5 91 124 150 60
Rotational speed (rpm) 9,550 6,200 5,600 4,400 5,000
Drive power 3,954 kW 3,210 kWe 2,300 kWe 2,950 kWe 165 kWe
Machine status Operational machine Design Operational
machine Design Under testing
Preliminary discussions with specialty turbine manufacturer Barber-Nichols, Inc. (Arvada, CO), indicate that a helium or CO2 circulator operating at the desired conditions would require a custom-designed unit, but is readily achievable. An HTF system running CO2 would benefit from the greater density of the fluid, allowing for a simpler design and lower power requirement for the circulator. The prevalence of work in this area gives confidence that a helium or carbon dioxide circulator sufficient for the needs of the 10-MWe demo could be designed and built.
Receiver HTF Analysis: Selection of an intermediate-pressure HTF for the receiver requires consideration of receiver material costs, piping and header costs, pressure loss, and receiver heat-transfer characteristics. To better understand these tradeoffs, a set of analyses was undertaken for this report that compare CO2 to helium over a range of possible operating pressures. The goal of this study is to illustrate trends and draw conclusions on the implications of HTF type and operating pressure on cost, performance, and receiver-design requirements. Additional HTF options including argon, steam, and mixtures of helium, argon, CO2 or other fluids are possible, as previously mentioned, but we consider only CO2 and helium here for the sake of simplicity and to illustrate the impact of HTF selection on research activities.
The receiver-design basis is a simplified tubular panel of indeterminate geometry that is exposed to uniform flux and fully developed internal flow using either CO2 or helium. Tube wall
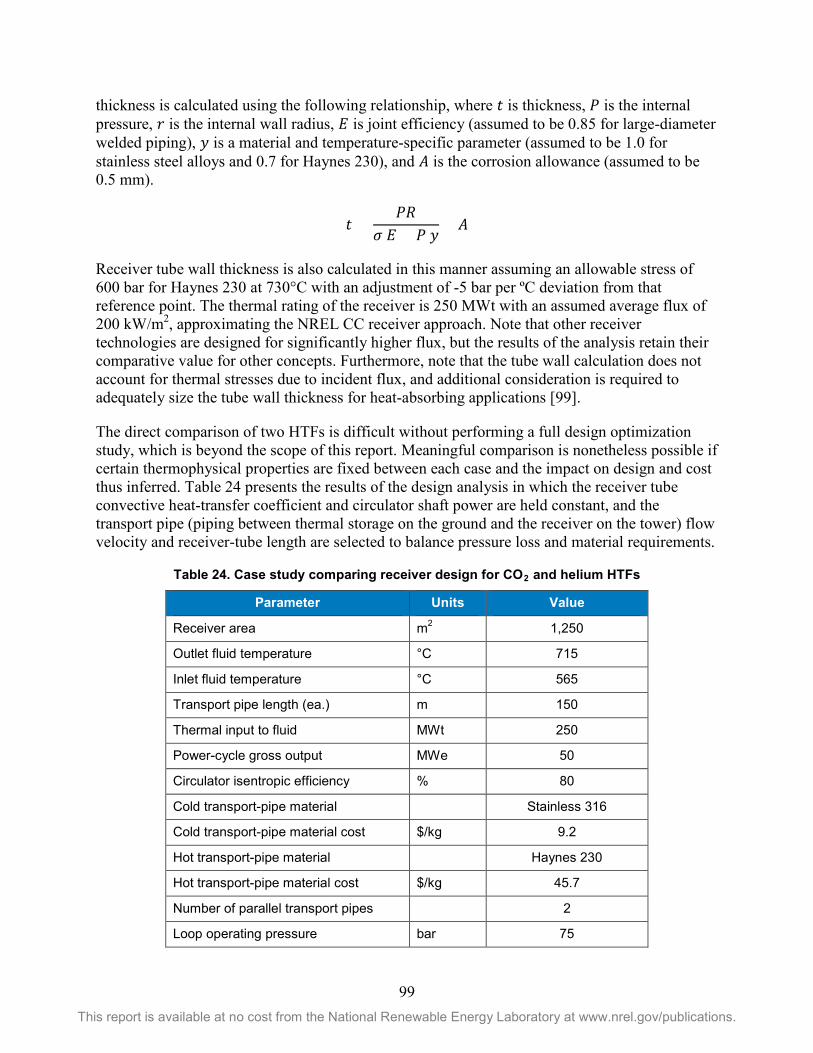
99 This report is available at no cost from the National Renewable Energy Laboratory at www.nrel.gov/publications.
thickness is calculated using the following relationship, where 𝑡𝑡 is thickness, 𝑃𝑃 is the internal pressure, 𝑟𝑟 is the internal wall radius, 𝐸𝐸 is joint efficiency (assumed to be 0.85 for large-diameter welded piping), 𝑦𝑦 is a material and temperature-specific parameter (assumed to be 1.0 for stainless steel alloys and 0.7 for Haynes 230), and 𝐸𝐸 is the corrosion allowance (assumed to be 0.5 mm).
𝑡𝑡 =𝑃𝑃𝐸𝐸
𝜎𝜎 𝐸𝐸 + 𝑃𝑃 𝑦𝑦+ 𝐸𝐸
Receiver tube wall thickness is also calculated in this manner assuming an allowable stress of 600 bar for Haynes 230 at 730°C with an adjustment of -5 bar per ºC deviation from that reference point. The thermal rating of the receiver is 250 MWt with an assumed average flux of 200 kW/m2, approximating the NREL CC receiver approach. Note that other receiver technologies are designed for significantly higher flux, but the results of the analysis retain their comparative value for other concepts. Furthermore, note that the tube wall calculation does not account for thermal stresses due to incident flux, and additional consideration is required to adequately size the tube wall thickness for heat-absorbing applications [99].
The direct comparison of two HTFs is difficult without performing a full design optimization study, which is beyond the scope of this report. Meaningful comparison is nonetheless possible if certain thermophysical properties are fixed between each case and the impact on design and cost thus inferred. Table 24 presents the results of the design analysis in which the receiver tube convective heat-transfer coefficient and circulator shaft power are held constant, and the transport pipe (piping between thermal storage on the ground and the receiver on the tower) flow velocity and receiver-tube length are selected to balance pressure loss and material requirements.
Table 24. Case study comparing receiver design for CO2 and helium HTFs
Parameter Units Value
Receiver area m2 1,250
Outlet fluid temperature °C 715
Inlet fluid temperature °C 565
Transport pipe length (ea.) m 150
Thermal input to fluid MWt 250
Power-cycle gross output MWe 50
Circulator isentropic efficiency % 80
Cold transport-pipe material Stainless 316
Cold transport-pipe material cost $/kg 9.2
Hot transport-pipe material Haynes 230
Hot transport-pipe material cost $/kg 45.7
Number of parallel transport pipes 2
Loop operating pressure bar 75
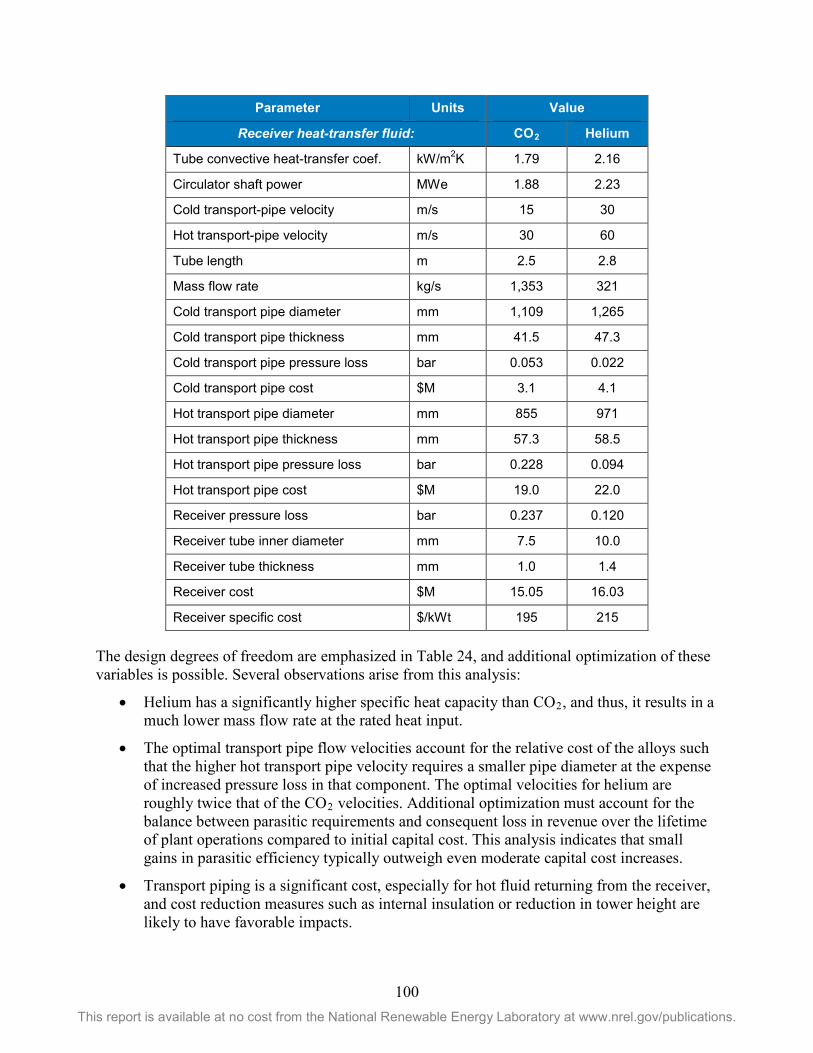
100 This report is available at no cost from the National Renewable Energy Laboratory at www.nrel.gov/publications.
Parameter Units Value
Receiver heat-transfer fluid: CO2 Helium
Tube convective heat-transfer coef. kW/m2K 1.79 2.16
Circulator shaft power MWe 1.88 2.23
Cold transport-pipe velocity m/s 15 30
Hot transport-pipe velocity m/s 30 60
Tube length m 2.5 2.8
Mass flow rate kg/s 1,353 321
Cold transport pipe diameter mm 1,109 1,265
Cold transport pipe thickness mm 41.5 47.3
Cold transport pipe pressure loss bar 0.053 0.022
Cold transport pipe cost $M 3.1 4.1
Hot transport pipe diameter mm 855 971
Hot transport pipe thickness mm 57.3 58.5
Hot transport pipe pressure loss bar 0.228 0.094
Hot transport pipe cost $M 19.0 22.0
Receiver pressure loss bar 0.237 0.120
Receiver tube inner diameter mm 7.5 10.0
Receiver tube thickness mm 1.0 1.4
Receiver cost $M 15.05 16.03
Receiver specific cost $/kWt 195 215
The design degrees of freedom are emphasized in Table 24, and additional optimization of these variables is possible. Several observations arise from this analysis:
• Helium has a significantly higher specific heat capacity than CO2, and thus, it results in a much lower mass flow rate at the rated heat input.
• The optimal transport pipe flow velocities account for the relative cost of the alloys such that the higher hot transport pipe velocity requires a smaller pipe diameter at the expense of increased pressure loss in that component. The optimal velocities for helium are roughly twice that of the CO2 velocities. Additional optimization must account for the balance between parasitic requirements and consequent loss in revenue over the lifetime of plant operations compared to initial capital cost. This analysis indicates that small gains in parasitic efficiency typically outweigh even moderate capital cost increases.
• Transport piping is a significant cost, especially for hot fluid returning from the receiver, and cost reduction measures such as internal insulation or reduction in tower height are likely to have favorable impacts.
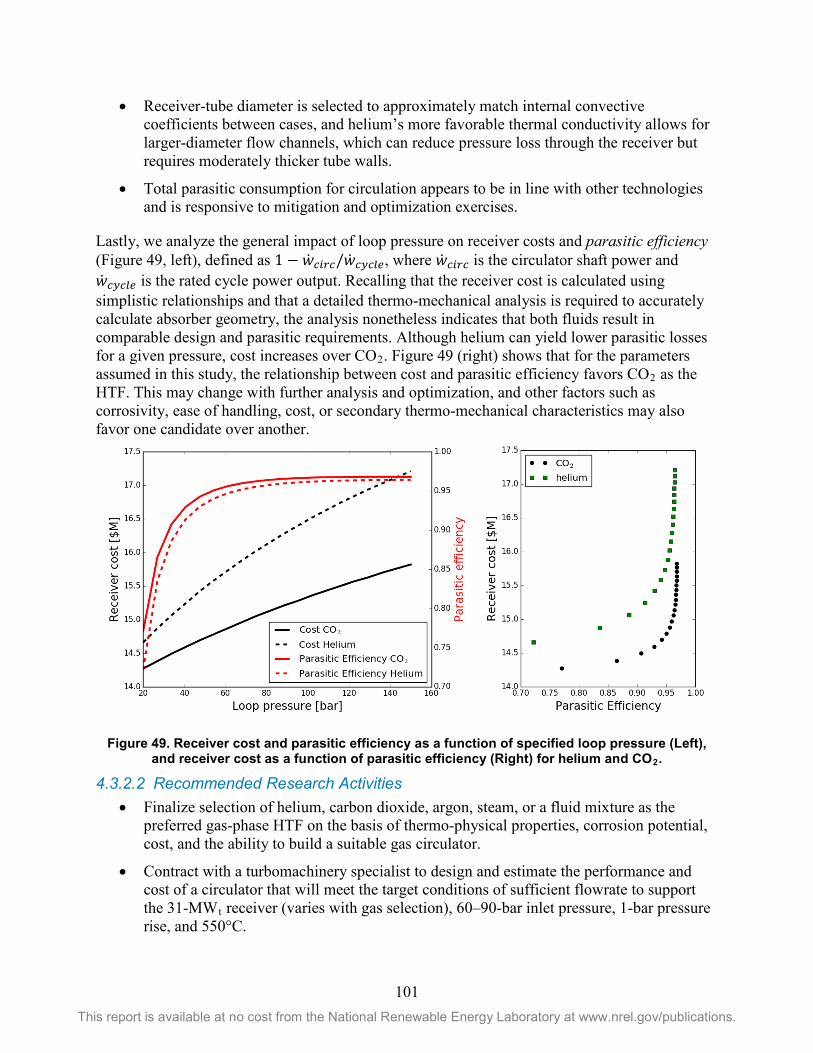
101 This report is available at no cost from the National Renewable Energy Laboratory at www.nrel.gov/publications.
• Receiver-tube diameter is selected to approximately match internal convective coefficients between cases, and helium’s more favorable thermal conductivity allows for larger-diameter flow channels, which can reduce pressure loss through the receiver but requires moderately thicker tube walls.
• Total parasitic consumption for circulation appears to be in line with other technologies and is responsive to mitigation and optimization exercises.
Lastly, we analyze the general impact of loop pressure on receiver costs and parasitic efficiency (Figure 49, left), defined as 1 − �̇�𝑤𝐹𝐹𝐸𝐸𝐹𝐹𝐹𝐹/�̇�𝑤𝐹𝐹𝑂𝑂𝐹𝐹𝑈𝑈𝑈𝑈, where �̇�𝑤𝐹𝐹𝐸𝐸𝐹𝐹𝐹𝐹 is the circulator shaft power and �̇�𝑤𝐹𝐹𝑂𝑂𝐹𝐹𝑈𝑈𝑈𝑈 is the rated cycle power output. Recalling that the receiver cost is calculated using simplistic relationships and that a detailed thermo-mechanical analysis is required to accurately calculate absorber geometry, the analysis nonetheless indicates that both fluids result in comparable design and parasitic requirements. Although helium can yield lower parasitic losses for a given pressure, cost increases over CO2. Figure 49 (right) shows that for the parameters assumed in this study, the relationship between cost and parasitic efficiency favors CO2 as the HTF. This may change with further analysis and optimization, and other factors such as corrosivity, ease of handling, cost, or secondary thermo-mechanical characteristics may also favor one candidate over another.
Figure 49. Receiver cost and parasitic efficiency as a function of specified loop pressure (Left), and receiver cost as a function of parasitic efficiency (Right) for helium and CO2.
4.3.2.2 Recommended Research Activities • Finalize selection of helium, carbon dioxide, argon, steam, or a fluid mixture as the
preferred gas-phase HTF on the basis of thermo-physical properties, corrosion potential, cost, and the ability to build a suitable gas circulator.
• Contract with a turbomachinery specialist to design and estimate the performance and cost of a circulator that will meet the target conditions of sufficient flowrate to support the 31-MWt receiver (varies with gas selection), 60–90-bar inlet pressure, 1-bar pressure rise, and 550°C.
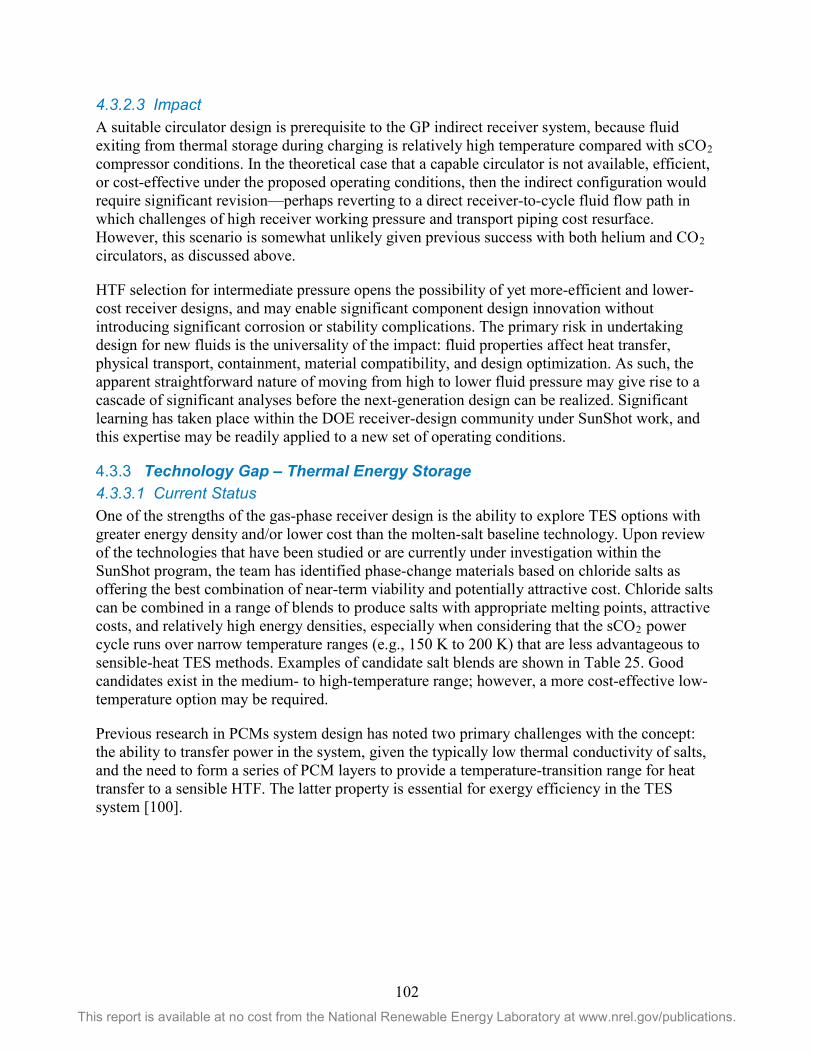
102 This report is available at no cost from the National Renewable Energy Laboratory at www.nrel.gov/publications.
4.3.2.3 Impact A suitable circulator design is prerequisite to the GP indirect receiver system, because fluid exiting from thermal storage during charging is relatively high temperature compared with sCO2 compressor conditions. In the theoretical case that a capable circulator is not available, efficient, or cost-effective under the proposed operating conditions, then the indirect configuration would require significant revision—perhaps reverting to a direct receiver-to-cycle fluid flow path in which challenges of high receiver working pressure and transport piping cost resurface. However, this scenario is somewhat unlikely given previous success with both helium and CO2 circulators, as discussed above.
HTF selection for intermediate pressure opens the possibility of yet more-efficient and lower-cost receiver designs, and may enable significant component design innovation without introducing significant corrosion or stability complications. The primary risk in undertaking design for new fluids is the universality of the impact: fluid properties affect heat transfer, physical transport, containment, material compatibility, and design optimization. As such, the apparent straightforward nature of moving from high to lower fluid pressure may give rise to a cascade of significant analyses before the next-generation design can be realized. Significant learning has taken place within the DOE receiver-design community under SunShot work, and this expertise may be readily applied to a new set of operating conditions.
Technology Gap – Thermal Energy Storage 4.3.34.3.3.1 Current Status One of the strengths of the gas-phase receiver design is the ability to explore TES options with greater energy density and/or lower cost than the molten-salt baseline technology. Upon review of the technologies that have been studied or are currently under investigation within the SunShot program, the team has identified phase-change materials based on chloride salts as offering the best combination of near-term viability and potentially attractive cost. Chloride salts can be combined in a range of blends to produce salts with appropriate melting points, attractive costs, and relatively high energy densities, especially when considering that the sCO2 power cycle runs over narrow temperature ranges (e.g., 150 K to 200 K) that are less advantageous to sensible-heat TES methods. Examples of candidate salt blends are shown in Table 25. Good candidates exist in the medium- to high-temperature range; however, a more cost-effective low-temperature option may be required.
Previous research in PCMs system design has noted two primary challenges with the concept: the ability to transfer power in the system, given the typically low thermal conductivity of salts, and the need to form a series of PCM layers to provide a temperature-transition range for heat transfer to a sensible HTF. The latter property is essential for exergy efficiency in the TES system [100].
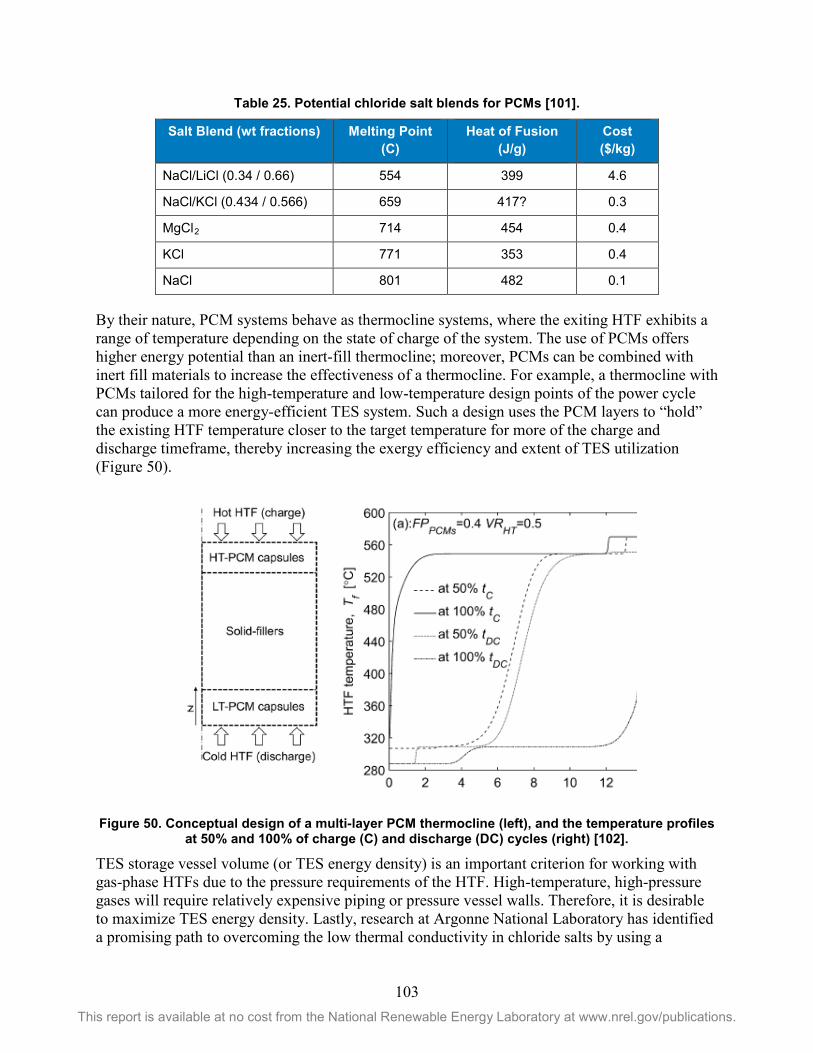
103 This report is available at no cost from the National Renewable Energy Laboratory at www.nrel.gov/publications.
Table 25. Potential chloride salt blends for PCMs [101].
Salt Blend (wt fractions) Melting Point (C)
Heat of Fusion (J/g)
Cost ($/kg)
NaCl/LiCl (0.34 / 0.66) 554 399 4.6
NaCl/KCl (0.434 / 0.566) 659 417? 0.3
MgCl2 714 454 0.4
KCl 771 353 0.4
NaCl 801 482 0.1
By their nature, PCM systems behave as thermocline systems, where the exiting HTF exhibits a range of temperature depending on the state of charge of the system. The use of PCMs offers higher energy potential than an inert-fill thermocline; moreover, PCMs can be combined with inert fill materials to increase the effectiveness of a thermocline. For example, a thermocline with PCMs tailored for the high-temperature and low-temperature design points of the power cycle can produce a more energy-efficient TES system. Such a design uses the PCM layers to “hold” the existing HTF temperature closer to the target temperature for more of the charge and discharge timeframe, thereby increasing the exergy efficiency and extent of TES utilization (Figure 50).
Figure 50. Conceptual design of a multi-layer PCM thermocline (left), and the temperature profiles at 50% and 100% of charge (C) and discharge (DC) cycles (right) [102].
TES storage vessel volume (or TES energy density) is an important criterion for working with gas-phase HTFs due to the pressure requirements of the HTF. High-temperature, high-pressure gases will require relatively expensive piping or pressure vessel walls. Therefore, it is desirable to maximize TES energy density. Lastly, research at Argonne National Laboratory has identified a promising path to overcoming the low thermal conductivity in chloride salts by using a
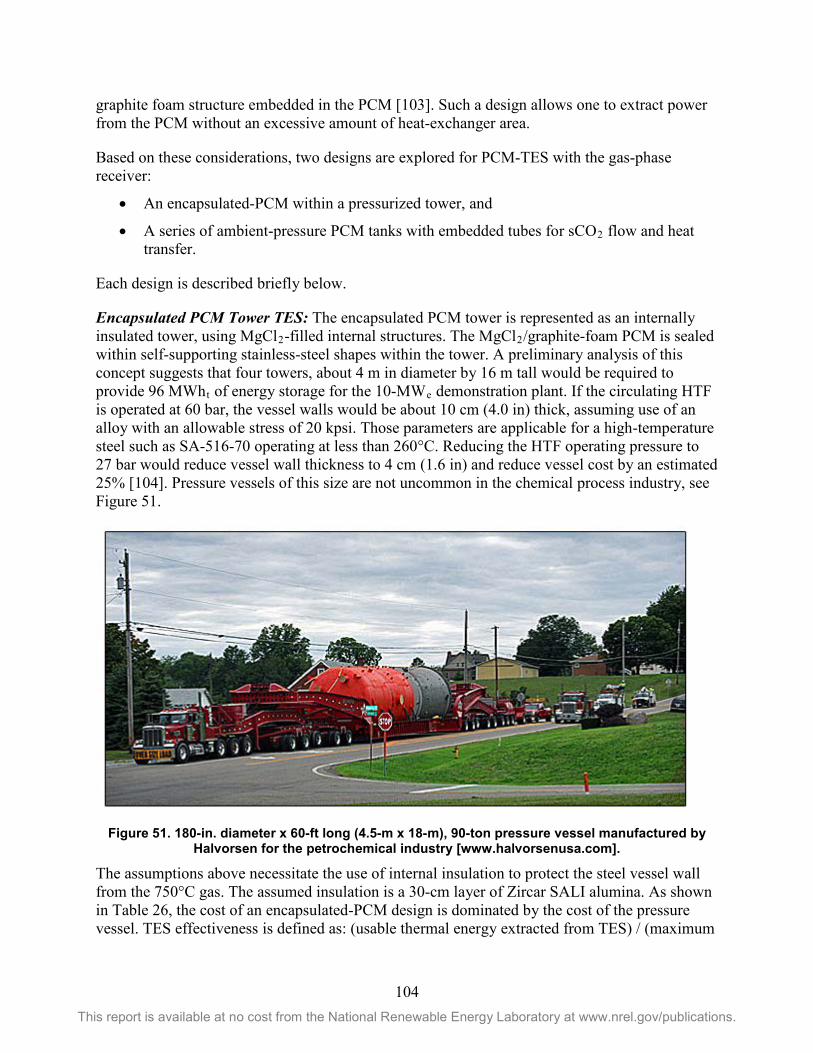
104 This report is available at no cost from the National Renewable Energy Laboratory at www.nrel.gov/publications.
graphite foam structure embedded in the PCM [103]. Such a design allows one to extract power from the PCM without an excessive amount of heat-exchanger area.
Based on these considerations, two designs are explored for PCM-TES with the gas-phase receiver:
• An encapsulated-PCM within a pressurized tower, and
• A series of ambient-pressure PCM tanks with embedded tubes for sCO2 flow and heat transfer.
Each design is described briefly below.
Encapsulated PCM Tower TES: The encapsulated PCM tower is represented as an internally insulated tower, using MgCl2-filled internal structures. The MgCl2/graphite-foam PCM is sealed within self-supporting stainless-steel shapes within the tower. A preliminary analysis of this concept suggests that four towers, about 4 m in diameter by 16 m tall would be required to provide 96 MWht of energy storage for the 10-MWe demonstration plant. If the circulating HTF is operated at 60 bar, the vessel walls would be about 10 cm (4.0 in) thick, assuming use of an alloy with an allowable stress of 20 kpsi. Those parameters are applicable for a high-temperature steel such as SA-516-70 operating at less than 260°C. Reducing the HTF operating pressure to 27 bar would reduce vessel wall thickness to 4 cm (1.6 in) and reduce vessel cost by an estimated 25% [104]. Pressure vessels of this size are not uncommon in the chemical process industry, see Figure 51.
Figure 51. 180-in. diameter x 60-ft long (4.5-m x 18-m), 90-ton pressure vessel manufactured by Halvorsen for the petrochemical industry [www.halvorsenusa.com].
The assumptions above necessitate the use of internal insulation to protect the steel vessel wall from the 750°C gas. The assumed insulation is a 30-cm layer of Zircar SALI alumina. As shown in Table 26, the cost of an encapsulated-PCM design is dominated by the cost of the pressure vessel. TES effectiveness is defined as: (usable thermal energy extracted from TES) / (maximum
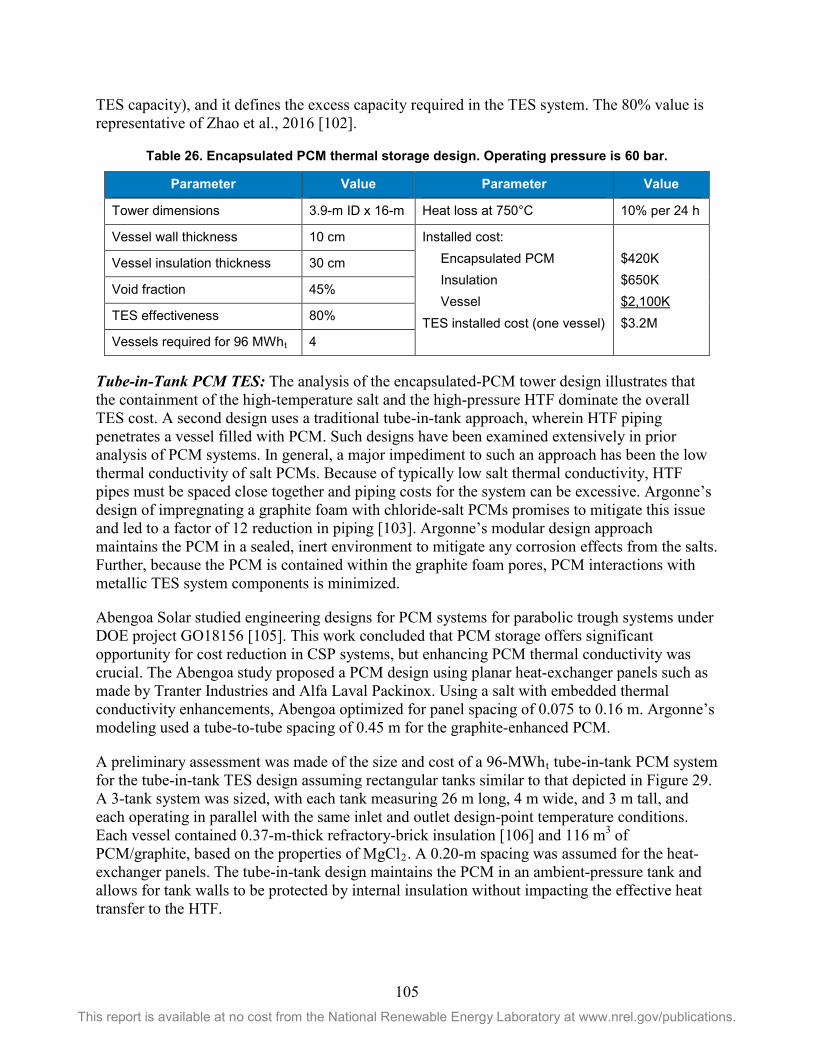
105 This report is available at no cost from the National Renewable Energy Laboratory at www.nrel.gov/publications.
TES capacity), and it defines the excess capacity required in the TES system. The 80% value is representative of Zhao et al., 2016 [102].
Table 26. Encapsulated PCM thermal storage design. Operating pressure is 60 bar.
Parameter Value Parameter Value
Tower dimensions 3.9-m ID x 16-m Heat loss at 750°C 10% per 24 h
Vessel wall thickness 10 cm Installed cost: Encapsulated PCM Insulation Vessel TES installed cost (one vessel)
$420K $650K $2,100K $3.2M
Vessel insulation thickness 30 cm
Void fraction 45%
TES effectiveness 80%
Vessels required for 96 MWht 4
Tube-in-Tank PCM TES: The analysis of the encapsulated-PCM tower design illustrates that the containment of the high-temperature salt and the high-pressure HTF dominate the overall TES cost. A second design uses a traditional tube-in-tank approach, wherein HTF piping penetrates a vessel filled with PCM. Such designs have been examined extensively in prior analysis of PCM systems. In general, a major impediment to such an approach has been the low thermal conductivity of salt PCMs. Because of typically low salt thermal conductivity, HTF pipes must be spaced close together and piping costs for the system can be excessive. Argonne’s design of impregnating a graphite foam with chloride-salt PCMs promises to mitigate this issue and led to a factor of 12 reduction in piping [103]. Argonne’s modular design approach maintains the PCM in a sealed, inert environment to mitigate any corrosion effects from the salts. Further, because the PCM is contained within the graphite foam pores, PCM interactions with metallic TES system components is minimized.
Abengoa Solar studied engineering designs for PCM systems for parabolic trough systems under DOE project GO18156 [105]. This work concluded that PCM storage offers significant opportunity for cost reduction in CSP systems, but enhancing PCM thermal conductivity was crucial. The Abengoa study proposed a PCM design using planar heat-exchanger panels such as made by Tranter Industries and Alfa Laval Packinox. Using a salt with embedded thermal conductivity enhancements, Abengoa optimized for panel spacing of 0.075 to 0.16 m. Argonne’s modeling used a tube-to-tube spacing of 0.45 m for the graphite-enhanced PCM.
A preliminary assessment was made of the size and cost of a 96-MWht tube-in-tank PCM system for the tube-in-tank TES design assuming rectangular tanks similar to that depicted in Figure 29. A 3-tank system was sized, with each tank measuring 26 m long, 4 m wide, and 3 m tall, and each operating in parallel with the same inlet and outlet design-point temperature conditions. Each vessel contained 0.37-m-thick refractory-brick insulation [106] and 116 m3 of PCM/graphite, based on the properties of MgCl2. A 0.20-m spacing was assumed for the heat-exchanger panels. The tube-in-tank design maintains the PCM in an ambient-pressure tank and allows for tank walls to be protected by internal insulation without impacting the effective heat transfer to the HTF.
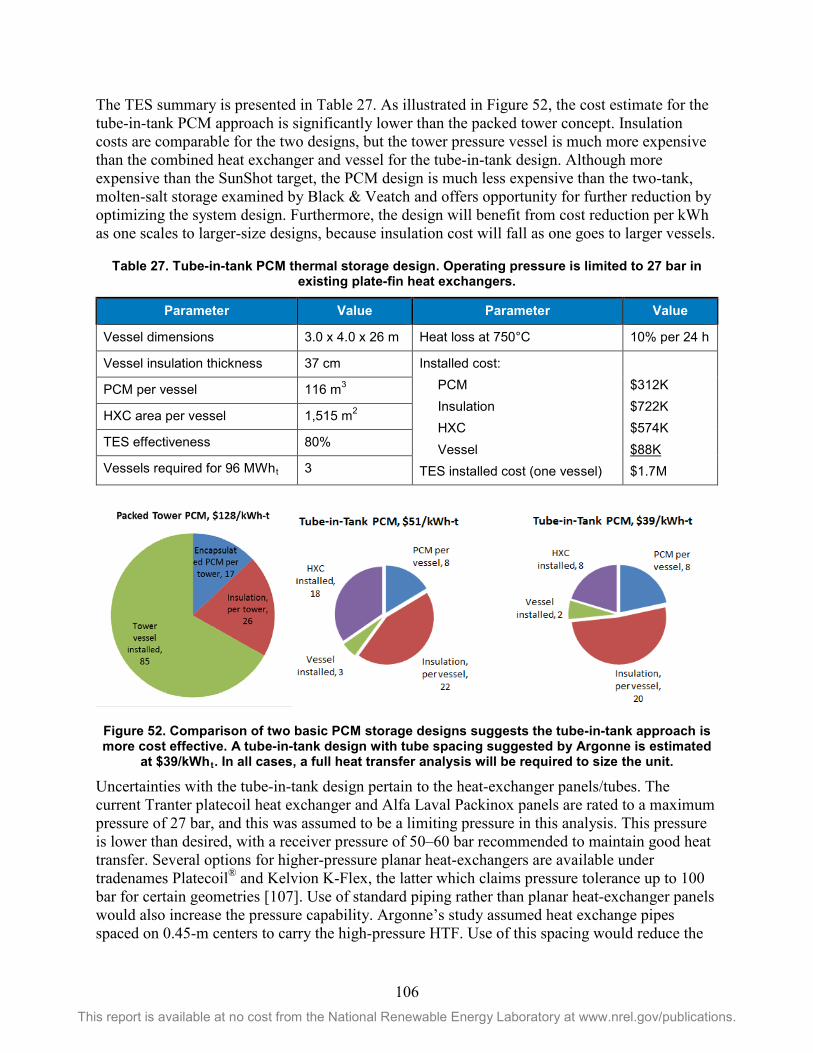
106 This report is available at no cost from the National Renewable Energy Laboratory at www.nrel.gov/publications.
The TES summary is presented in Table 27. As illustrated in Figure 52, the cost estimate for the tube-in-tank PCM approach is significantly lower than the packed tower concept. Insulation costs are comparable for the two designs, but the tower pressure vessel is much more expensive than the combined heat exchanger and vessel for the tube-in-tank design. Although more expensive than the SunShot target, the PCM design is much less expensive than the two-tank, molten-salt storage examined by Black & Veatch and offers opportunity for further reduction by optimizing the system design. Furthermore, the design will benefit from cost reduction per kWh as one scales to larger-size designs, because insulation cost will fall as one goes to larger vessels.
Table 27. Tube-in-tank PCM thermal storage design. Operating pressure is limited to 27 bar in existing plate-fin heat exchangers.
Parameter Value Parameter Value
Vessel dimensions 3.0 x 4.0 x 26 m Heat loss at 750°C 10% per 24 h
Vessel insulation thickness 37 cm Installed cost: PCM Insulation HXC Vessel TES installed cost (one vessel)
$312K $722K $574K $88K $1.7M
PCM per vessel 116 m3
HXC area per vessel 1,515 m2
TES effectiveness 80%
Vessels required for 96 MWht 3
Figure 52. Comparison of two basic PCM storage designs suggests the tube-in-tank approach is more cost effective. A tube-in-tank design with tube spacing suggested by Argonne is estimated
at $39/kWht. In all cases, a full heat transfer analysis will be required to size the unit.
Uncertainties with the tube-in-tank design pertain to the heat-exchanger panels/tubes. The current Tranter platecoil heat exchanger and Alfa Laval Packinox panels are rated to a maximum pressure of 27 bar, and this was assumed to be a limiting pressure in this analysis. This pressure is lower than desired, with a receiver pressure of 50–60 bar recommended to maintain good heat transfer. Several options for higher-pressure planar heat-exchangers are available under tradenames Platecoil® and Kelvion K-Flex, the latter which claims pressure tolerance up to 100 bar for certain geometries [107]. Use of standard piping rather than planar heat-exchanger panels would also increase the pressure capability. Argonne’s study assumed heat exchange pipes spaced on 0.45-m centers to carry the high-pressure HTF. Use of this spacing would reduce the
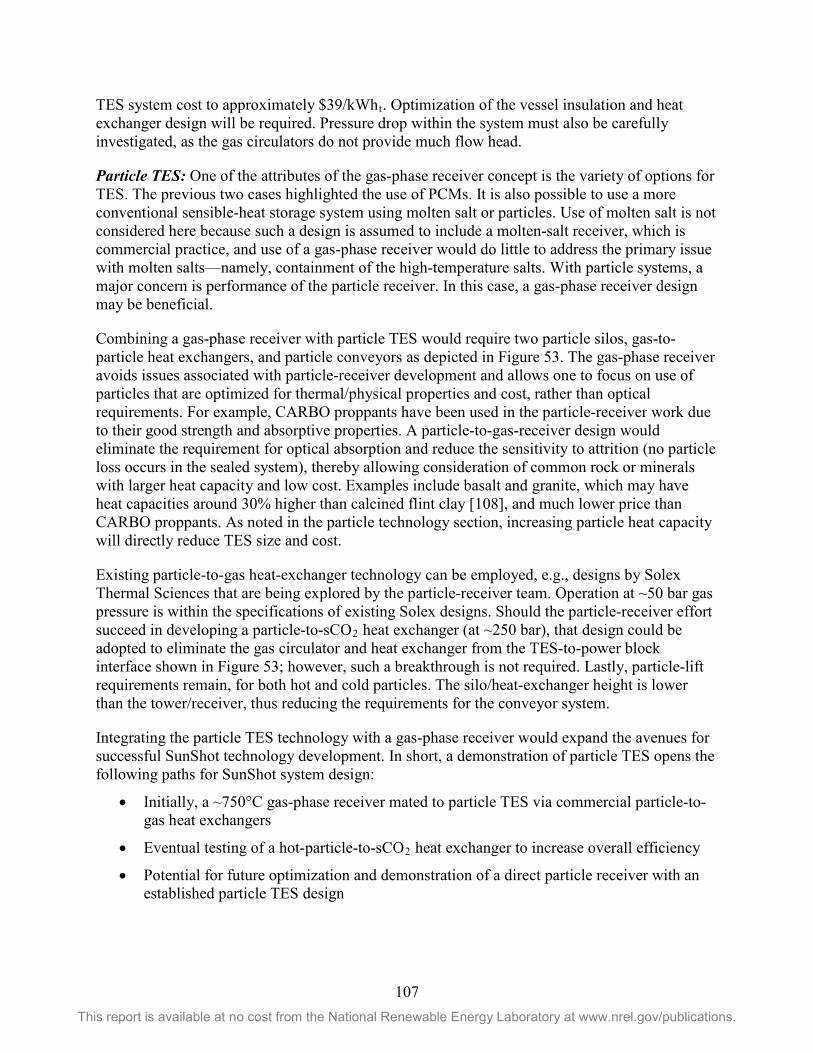
107 This report is available at no cost from the National Renewable Energy Laboratory at www.nrel.gov/publications.
TES system cost to approximately $39/kWht. Optimization of the vessel insulation and heat exchanger design will be required. Pressure drop within the system must also be carefully investigated, as the gas circulators do not provide much flow head.
Particle TES: One of the attributes of the gas-phase receiver concept is the variety of options for TES. The previous two cases highlighted the use of PCMs. It is also possible to use a more conventional sensible-heat storage system using molten salt or particles. Use of molten salt is not considered here because such a design is assumed to include a molten-salt receiver, which is commercial practice, and use of a gas-phase receiver would do little to address the primary issue with molten salts—namely, containment of the high-temperature salts. With particle systems, a major concern is performance of the particle receiver. In this case, a gas-phase receiver design may be beneficial.
Combining a gas-phase receiver with particle TES would require two particle silos, gas-to-particle heat exchangers, and particle conveyors as depicted in Figure 53. The gas-phase receiver avoids issues associated with particle-receiver development and allows one to focus on use of particles that are optimized for thermal/physical properties and cost, rather than optical requirements. For example, CARBO proppants have been used in the particle-receiver work due to their good strength and absorptive properties. A particle-to-gas-receiver design would eliminate the requirement for optical absorption and reduce the sensitivity to attrition (no particle loss occurs in the sealed system), thereby allowing consideration of common rock or minerals with larger heat capacity and low cost. Examples include basalt and granite, which may have heat capacities around 30% higher than calcined flint clay [108], and much lower price than CARBO proppants. As noted in the particle technology section, increasing particle heat capacity will directly reduce TES size and cost.
Existing particle-to-gas heat-exchanger technology can be employed, e.g., designs by Solex Thermal Sciences that are being explored by the particle-receiver team. Operation at ~50 bar gas pressure is within the specifications of existing Solex designs. Should the particle-receiver effort succeed in developing a particle-to-sCO2 heat exchanger (at ~250 bar), that design could be adopted to eliminate the gas circulator and heat exchanger from the TES-to-power block interface shown in Figure 53; however, such a breakthrough is not required. Lastly, particle-lift requirements remain, for both hot and cold particles. The silo/heat-exchanger height is lower than the tower/receiver, thus reducing the requirements for the conveyor system.
Integrating the particle TES technology with a gas-phase receiver would expand the avenues for successful SunShot technology development. In short, a demonstration of particle TES opens the following paths for SunShot system design:
• Initially, a ~750°C gas-phase receiver mated to particle TES via commercial particle-to-gas heat exchangers
• Eventual testing of a hot-particle-to-sCO2 heat exchanger to increase overall efficiency
• Potential for future optimization and demonstration of a direct particle receiver with an established particle TES design
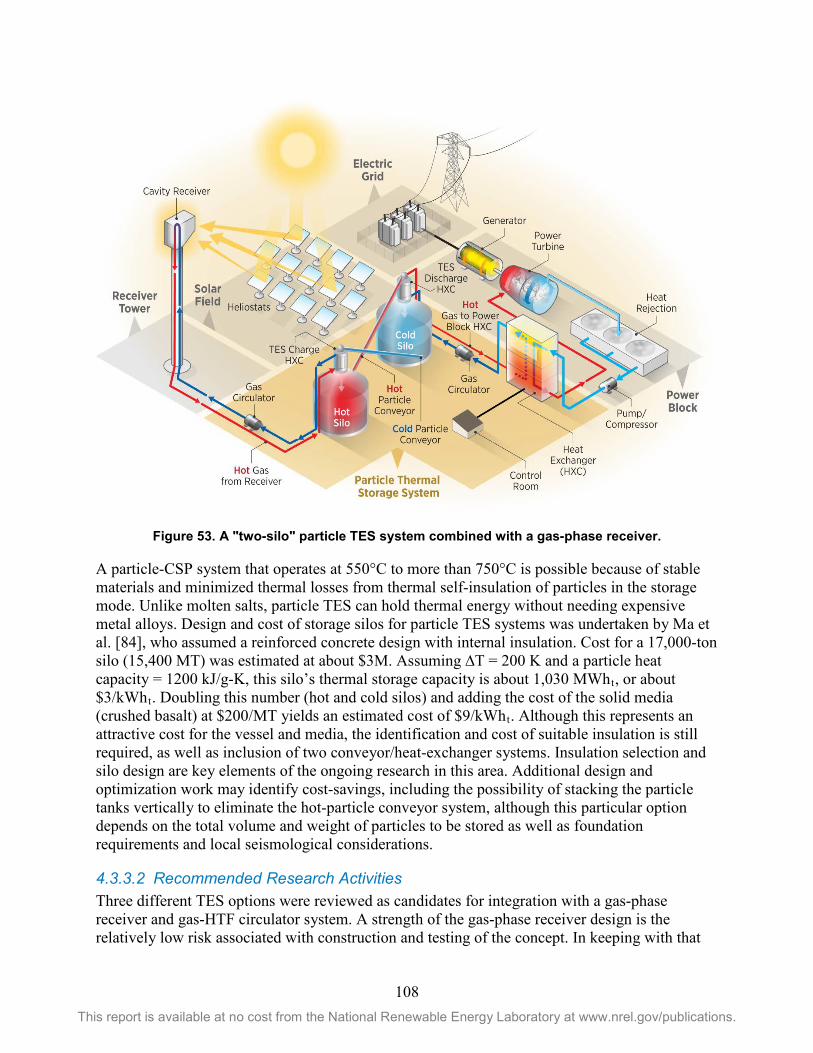
108 This report is available at no cost from the National Renewable Energy Laboratory at www.nrel.gov/publications.
Figure 53. A "two-silo" particle TES system combined with a gas-phase receiver.
A particle-CSP system that operates at 550°C to more than 750°C is possible because of stable materials and minimized thermal losses from thermal self-insulation of particles in the storage mode. Unlike molten salts, particle TES can hold thermal energy without needing expensive metal alloys. Design and cost of storage silos for particle TES systems was undertaken by Ma et al. [84], who assumed a reinforced concrete design with internal insulation. Cost for a 17,000-ton silo (15,400 MT) was estimated at about $3M. Assuming ∆T = 200 K and a particle heat capacity = 1200 kJ/g-K, this silo’s thermal storage capacity is about 1,030 MWht, or about $3/kWht. Doubling this number (hot and cold silos) and adding the cost of the solid media (crushed basalt) at $200/MT yields an estimated cost of $9/kWht. Although this represents an attractive cost for the vessel and media, the identification and cost of suitable insulation is still required, as well as inclusion of two conveyor/heat-exchanger systems. Insulation selection and silo design are key elements of the ongoing research in this area. Additional design and optimization work may identify cost-savings, including the possibility of stacking the particle tanks vertically to eliminate the hot-particle conveyor system, although this particular option depends on the total volume and weight of particles to be stored as well as foundation requirements and local seismological considerations.
4.3.3.2 Recommended Research Activities Three different TES options were reviewed as candidates for integration with a gas-phase receiver and gas-HTF circulator system. A strength of the gas-phase receiver design is the relatively low risk associated with construction and testing of the concept. In keeping with that
109 This report is available at no cost from the National Renewable Energy Laboratory at www.nrel.gov/publications.
goal, and considering the preliminary cost estimates, a tube-in-tank PCM design is the preferred option for TES. The tube-in-tank concept benefits from the high energy density in chloride-salt PCMs to minimize the required size of the insulated vessel. Using a cascade of three chloride-based salt blends increases system efficiency and allows the use of similar corrosion-mitigation approaches—namely, a system sealed from moisture or oxygen—to reduce the risk of salt attack on the heat-exchanger components. Graphite-foam fill is used to enhance heat transfer and internal insulation protects the vessel walls. The design has no freeze-protection requirements, nor does it require movement of the thermal storage media.
The recommendations below are drafted with this design in mind. Additional concepts such as particle TES and thermochemical energy storage would also be compatible with a gas-phase receiver, but these are currently viewed as higher-risk alternatives.
• Determine PCM-embedded piping/heat-exchanger designs to allow for effective heat transfer and minimize pressure drop.
• Identify and characterize the preferred PCM salts for use with a cascaded PCM design.
• Model the behavior of a multi-module PCM design to estimate the thermal effectiveness and overall energy/exergy efficiency of the system throughout annual simulations.
• Select and test internal insulation in contact with PCM salt freeze/thaw cycles.
• Select and test heat-exchanger alloy in contact with salt melt.
• Evaluate scalability of TES tube-in-tank system designs; build and test prototypes to demonstrate long-term performance reliability.
• Undertake design of a gas-phase receiver/particle-TES system to detail potential advantages related to performance and risk of other system designs.
4.3.3.3 Impact Thermal energy storage is essential for CSP technology competitiveness, and GP systems are unique among Gen3 pathways in that the storage approach does not emanate from the properties of the fluid (e.g., particle storage or direct salt storage), but rather encourages incorporation of independent TES concepts. Nonetheless, without a suitable TES companion, the GP pathway is not viable. However, several promising approaches are under development, particularly those using PCMs or inexpensive particle storage with gas-to-particle heat exchangers. Longer-term solutions relying on thermo-chemical mechanisms are also of interest, but likely not within the Gen3 time horizon. PCM storage has been demonstrated at laboratory scale, but additional work assessing cycling, corrosion, and charge/discharge rates will inform viability for commercial deployment. Lower-tech options such as indirect particle storage help to mitigate the risk of emerging PCM technology.
Technology Gap – System Integration and Analysis 4.3.4Gas-phase systems consolidate three subsystems whose performance characteristics may vary with respect to off-design conditions. For thermal storage—if using PCM technology—fluid temperature varies with the state of charge; power-cycle performance fluctuates with thermal load, ambient temperature, and hot-side inlet temperature; and receiver performance depends on power delivered from the solar field, distribution of flux, and inlet temperature, among other
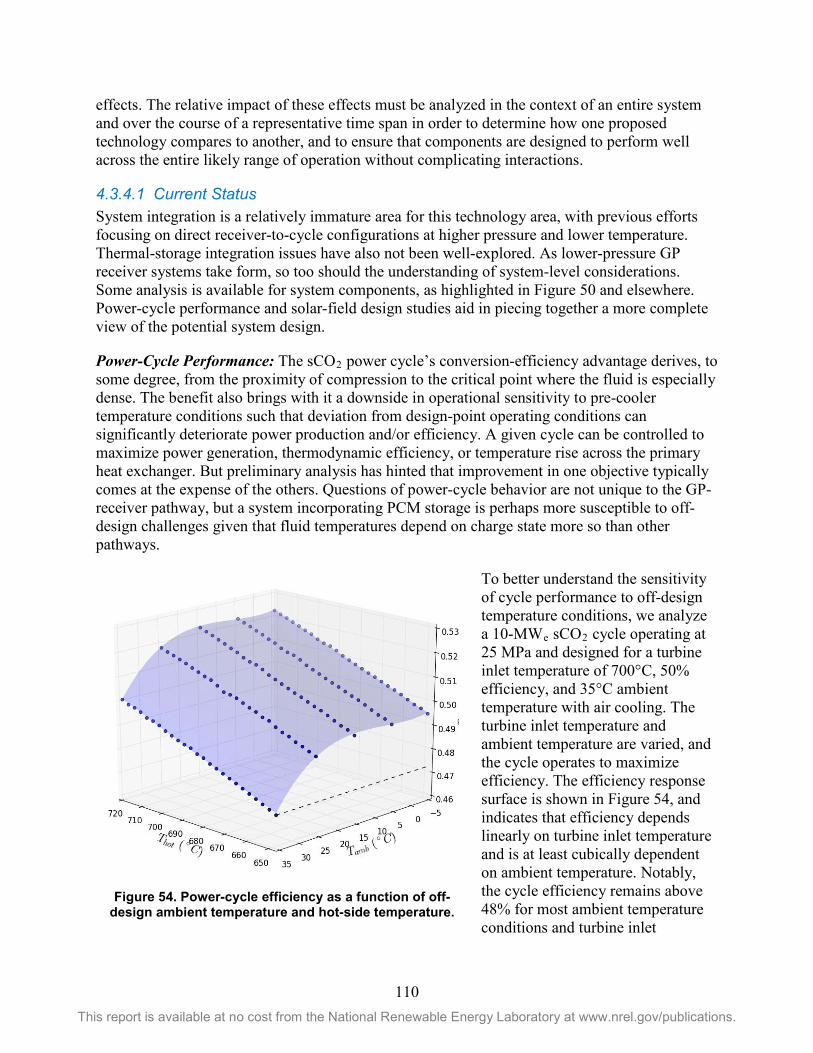
110 This report is available at no cost from the National Renewable Energy Laboratory at www.nrel.gov/publications.
effects. The relative impact of these effects must be analyzed in the context of an entire system and over the course of a representative time span in order to determine how one proposed technology compares to another, and to ensure that components are designed to perform well across the entire likely range of operation without complicating interactions.
4.3.4.1 Current Status System integration is a relatively immature area for this technology area, with previous efforts focusing on direct receiver-to-cycle configurations at higher pressure and lower temperature. Thermal-storage integration issues have also not been well-explored. As lower-pressure GP receiver systems take form, so too should the understanding of system-level considerations. Some analysis is available for system components, as highlighted in Figure 50 and elsewhere. Power-cycle performance and solar-field design studies aid in piecing together a more complete view of the potential system design.
Power-Cycle Performance: The sCO2 power cycle’s conversion-efficiency advantage derives, to some degree, from the proximity of compression to the critical point where the fluid is especially dense. The benefit also brings with it a downside in operational sensitivity to pre-cooler temperature conditions such that deviation from design-point operating conditions can significantly deteriorate power production and/or efficiency. A given cycle can be controlled to maximize power generation, thermodynamic efficiency, or temperature rise across the primary heat exchanger. But preliminary analysis has hinted that improvement in one objective typically comes at the expense of the others. Questions of power-cycle behavior are not unique to the GP-receiver pathway, but a system incorporating PCM storage is perhaps more susceptible to off-design challenges given that fluid temperatures depend on charge state more so than other pathways.
To better understand the sensitivity of cycle performance to off-design temperature conditions, we analyze a 10-MWe sCO2 cycle operating at 25 MPa and designed for a turbine inlet temperature of 700°C, 50% efficiency, and 35°C ambient temperature with air cooling. The turbine inlet temperature and ambient temperature are varied, and the cycle operates to maximize efficiency. The efficiency response surface is shown in Figure 54, and indicates that efficiency depends linearly on turbine inlet temperature and is at least cubically dependent on ambient temperature. Notably, the cycle efficiency remains above 48% for most ambient temperature conditions and turbine inlet
Figure 54. Power-cycle efficiency as a function of off-design ambient temperature and hot-side temperature.
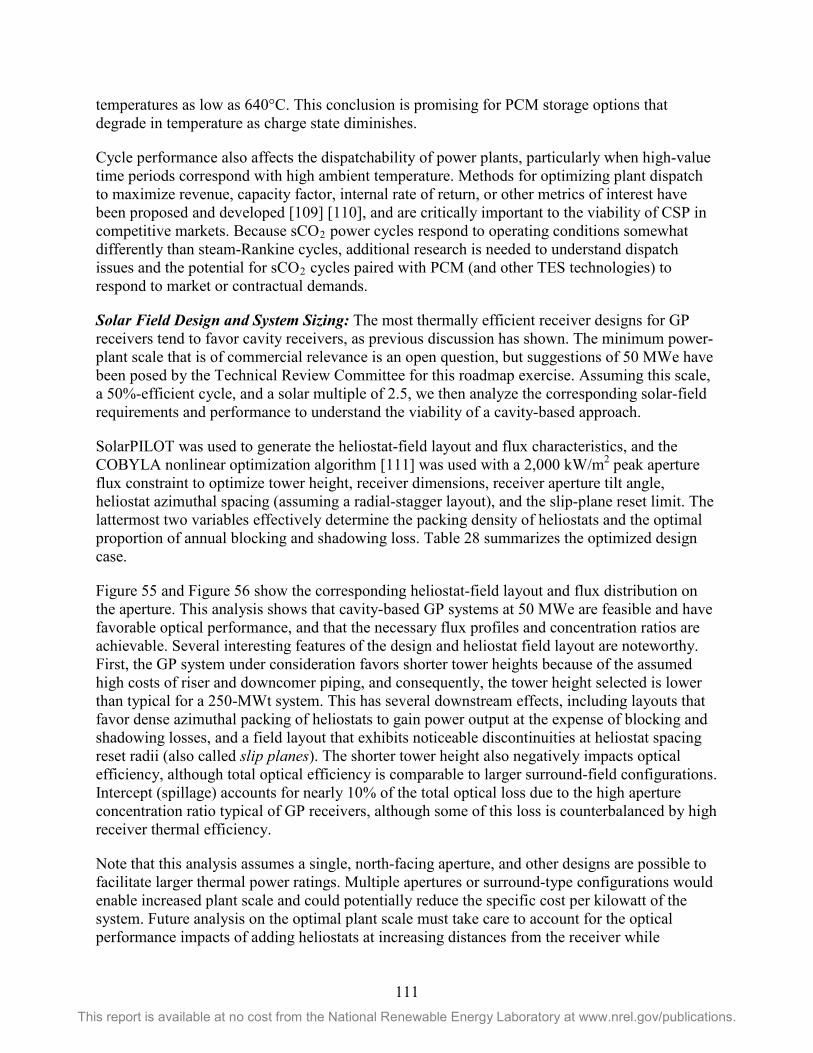
111 This report is available at no cost from the National Renewable Energy Laboratory at www.nrel.gov/publications.
temperatures as low as 640°C. This conclusion is promising for PCM storage options that degrade in temperature as charge state diminishes.
Cycle performance also affects the dispatchability of power plants, particularly when high-value time periods correspond with high ambient temperature. Methods for optimizing plant dispatch to maximize revenue, capacity factor, internal rate of return, or other metrics of interest have been proposed and developed [109] [110], and are critically important to the viability of CSP in competitive markets. Because sCO2 power cycles respond to operating conditions somewhat differently than steam-Rankine cycles, additional research is needed to understand dispatch issues and the potential for sCO2 cycles paired with PCM (and other TES technologies) to respond to market or contractual demands.
Solar Field Design and System Sizing: The most thermally efficient receiver designs for GP receivers tend to favor cavity receivers, as previous discussion has shown. The minimum power-plant scale that is of commercial relevance is an open question, but suggestions of 50 MWe have been posed by the Technical Review Committee for this roadmap exercise. Assuming this scale, a 50%-efficient cycle, and a solar multiple of 2.5, we then analyze the corresponding solar-field requirements and performance to understand the viability of a cavity-based approach.
SolarPILOT was used to generate the heliostat-field layout and flux characteristics, and the COBYLA nonlinear optimization algorithm [111] was used with a 2,000 kW/m2 peak aperture flux constraint to optimize tower height, receiver dimensions, receiver aperture tilt angle, heliostat azimuthal spacing (assuming a radial-stagger layout), and the slip-plane reset limit. The lattermost two variables effectively determine the packing density of heliostats and the optimal proportion of annual blocking and shadowing loss. Table 28 summarizes the optimized design case.
Figure 55 and Figure 56 show the corresponding heliostat-field layout and flux distribution on the aperture. This analysis shows that cavity-based GP systems at 50 MWe are feasible and have favorable optical performance, and that the necessary flux profiles and concentration ratios are achievable. Several interesting features of the design and heliostat field layout are noteworthy. First, the GP system under consideration favors shorter tower heights because of the assumed high costs of riser and downcomer piping, and consequently, the tower height selected is lower than typical for a 250-MWt system. This has several downstream effects, including layouts that favor dense azimuthal packing of heliostats to gain power output at the expense of blocking and shadowing losses, and a field layout that exhibits noticeable discontinuities at heliostat spacing reset radii (also called slip planes). The shorter tower height also negatively impacts optical efficiency, although total optical efficiency is comparable to larger surround-field configurations. Intercept (spillage) accounts for nearly 10% of the total optical loss due to the high aperture concentration ratio typical of GP receivers, although some of this loss is counterbalanced by high receiver thermal efficiency.
Note that this analysis assumes a single, north-facing aperture, and other designs are possible to facilitate larger thermal power ratings. Multiple apertures or surround-type configurations would enable increased plant scale and could potentially reduce the specific cost per kilowatt of the system. Future analysis on the optimal plant scale must take care to account for the optical performance impacts of adding heliostats at increasing distances from the receiver while
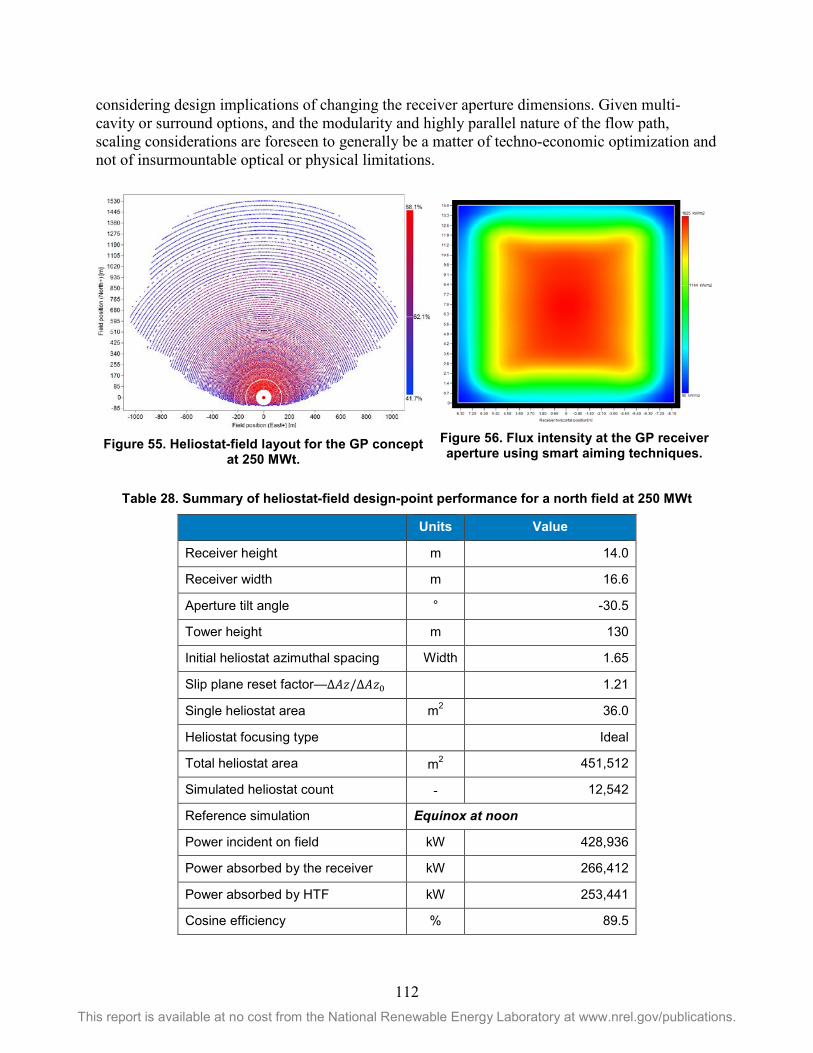
112 This report is available at no cost from the National Renewable Energy Laboratory at www.nrel.gov/publications.
considering design implications of changing the receiver aperture dimensions. Given multi-cavity or surround options, and the modularity and highly parallel nature of the flow path, scaling considerations are foreseen to generally be a matter of techno-economic optimization and not of insurmountable optical or physical limitations.
Table 28. Summary of heliostat-field design-point performance for a north field at 250 MWt
Units Value
Receiver height m 14.0
Receiver width m 16.6
Aperture tilt angle ° -30.5
Tower height m 130
Initial heliostat azimuthal spacing ×Width 1.65
Slip plane reset factor—Δ𝐸𝐸𝐴𝐴/Δ𝐸𝐸𝐴𝐴0 1.21
Single heliostat area m2 36.0
Heliostat focusing type Ideal
Total heliostat area m2 451,512
Simulated heliostat count - 12,542
Reference simulation Equinox at noon
Power incident on field kW 428,936
Power absorbed by the receiver kW 266,412
Power absorbed by HTF kW 253,441
Cosine efficiency % 89.5
Figure 55. Heliostat-field layout for the GP concept
at 250 MWt.
Figure 56. Flux intensity at the GP receiver aperture using smart aiming techniques.
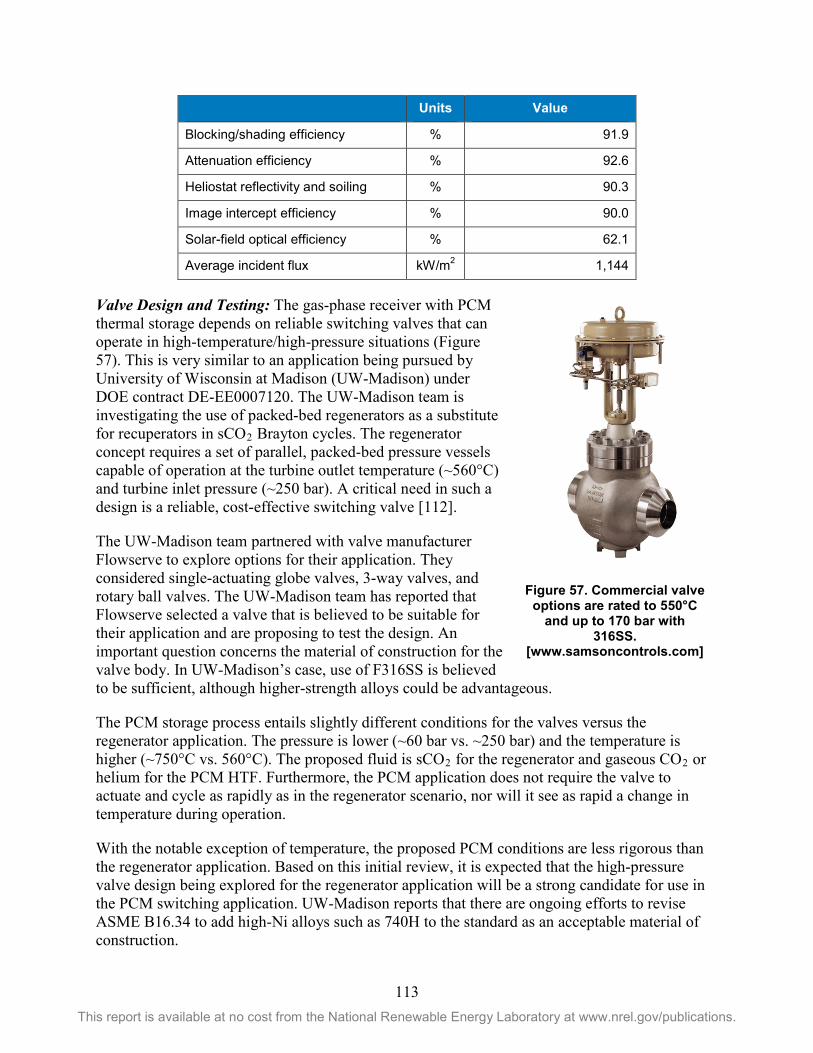
113 This report is available at no cost from the National Renewable Energy Laboratory at www.nrel.gov/publications.
Units Value
Blocking/shading efficiency % 91.9
Attenuation efficiency % 92.6
Heliostat reflectivity and soiling % 90.3
Image intercept efficiency % 90.0
Solar-field optical efficiency % 62.1
Average incident flux kW/m2 1,144
Valve Design and Testing: The gas-phase receiver with PCM thermal storage depends on reliable switching valves that can operate in high-temperature/high-pressure situations (Figure 57). This is very similar to an application being pursued by University of Wisconsin at Madison (UW-Madison) under DOE contract DE-EE0007120. The UW-Madison team is investigating the use of packed-bed regenerators as a substitute for recuperators in sCO2 Brayton cycles. The regenerator concept requires a set of parallel, packed-bed pressure vessels capable of operation at the turbine outlet temperature (~560°C) and turbine inlet pressure (~250 bar). A critical need in such a design is a reliable, cost-effective switching valve [112].
The UW-Madison team partnered with valve manufacturer Flowserve to explore options for their application. They considered single-actuating globe valves, 3-way valves, and rotary ball valves. The UW-Madison team has reported that Flowserve selected a valve that is believed to be suitable for their application and are proposing to test the design. An important question concerns the material of construction for the valve body. In UW-Madison’s case, use of F316SS is believed to be sufficient, although higher-strength alloys could be advantageous.
The PCM storage process entails slightly different conditions for the valves versus the regenerator application. The pressure is lower (~60 bar vs. ~250 bar) and the temperature is higher (~750°C vs. 560°C). The proposed fluid is sCO2 for the regenerator and gaseous CO2 or helium for the PCM HTF. Furthermore, the PCM application does not require the valve to actuate and cycle as rapidly as in the regenerator scenario, nor will it see as rapid a change in temperature during operation.
With the notable exception of temperature, the proposed PCM conditions are less rigorous than the regenerator application. Based on this initial review, it is expected that the high-pressure valve design being explored for the regenerator application will be a strong candidate for use in the PCM switching application. UW-Madison reports that there are ongoing efforts to revise ASME B16.34 to add high-Ni alloys such as 740H to the standard as an acceptable material of construction.
Figure 57. Commercial valve options are rated to 550°C
and up to 170 bar with 316SS.
[www.samsoncontrols.com]
114 This report is available at no cost from the National Renewable Energy Laboratory at www.nrel.gov/publications.
4.3.4.2 Recommended Research Activities • Develop component performance models for both design and off-design conditions that
predict thermodynamic fluid states, heat-transfer behavior, and relevant mechanical considerations, and consolidate into a system-level model that accounts for component interaction; use the model to predict performance over a representative duration and under varying solar resource conditions.
• Determine heliostat-field layout and flux-control methods suitable for GP receivers with a commercially relevant module size.
• Select HTF-to-sCO2 heat-exchanger technology, and characterize expected component cost and lifetime under diurnal operation.
• Select and test high-pressure/high-temperature valve for use in the PCM switching application, building on previous designs and research where possible.
• Assess alloy choices for high-temperature valves, including code status (e.g., ASME B16.34). Use of high-nickel alloy materials (e.g., Inconel 625 or 740H) may be required for valves operating in the desired conditions.
4.3.4.3 Impact An improved understanding of system integration comes as individual components grow from conceptual infancy, and component-focused projects to date have not fully considered methods for GP system control and operation. The transition from high-performing components to market-competitive systems is tentative, requiring careful tradeoff studies and an iterative design approach. Integration is manifestly necessary to realize an operational technology, but failure to successfully integrate does not preclude the transfer of advances into other potential Gen3 systems. For example, progress on TES technology may benefit other pathways if its cost-effectiveness supersedes a simple direct-storage configuration, and improved receiver-design knowledge may apply to particle and molten-salt receivers, resulting in improved efficiency, cost, or lifetime.
Gas-Phase Technology Summary 4.3.5The GP technology pathway seeks to achieve high thermal and thermodynamic system efficiency through the use of inert, stable gas-phase HTF within pressure-containing absorber and thermal storage geometries. The pathway also includes a heat-pipe concept where liquid HTF is evaporated in the receiver, transported as a saturated gas to TES, and condensed back into liquid form. This pathway relies on indirect TES options such as PCM or particle storage, and introduces multi-tank TES valving configurations that allow decoupling of thermal collection from power generation. Significant progress has been made on receiver design for high-pressure operation under the SunShot program, and multiple institutions have put forward designs that demonstrate viability by way of modeling, lab-scale, and on-sun testing activities.
Several receiver designs have been shown to achieve thermal efficiencies in excess of the 90% SunShot target, although the receiver outlet temperature varies by case from 650°–750°C. Phase-change material storage concepts such as that put forward by Argonne National Laboratory are conceptually well-suited for integration with GP systems in which the TES technology is not emergent from the heat-transfer media. The primary benefits of GP systems include 1) HTF
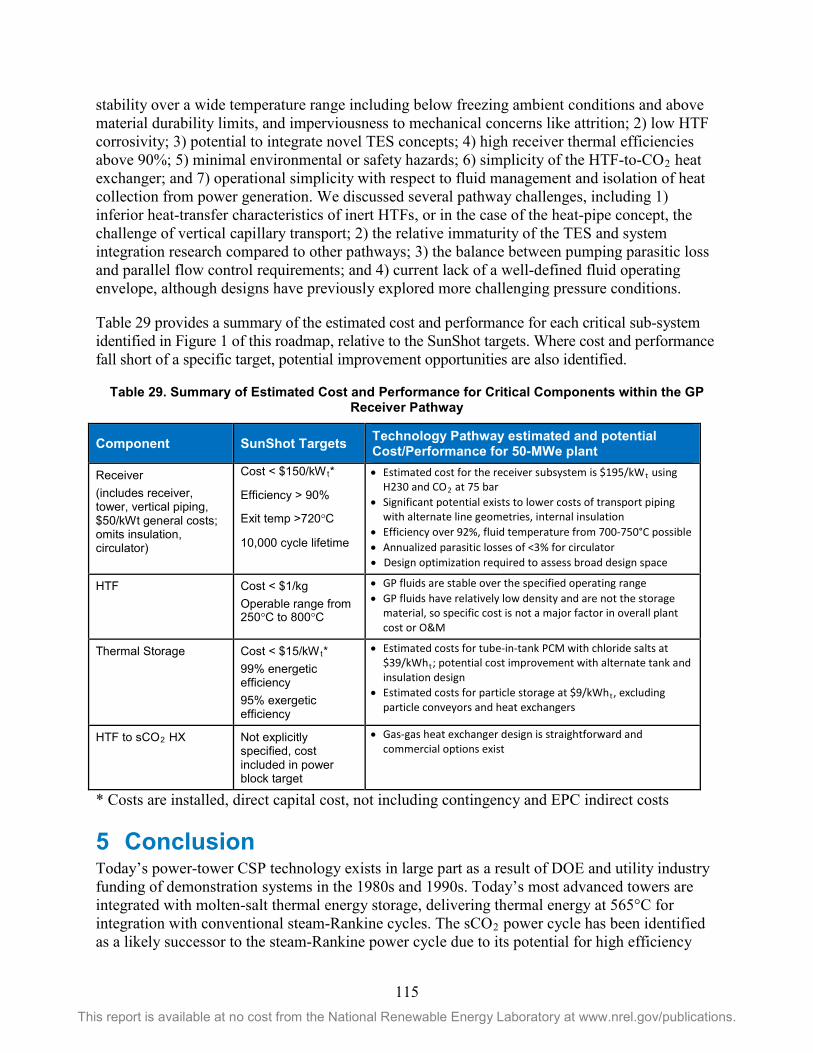
115 This report is available at no cost from the National Renewable Energy Laboratory at www.nrel.gov/publications.
stability over a wide temperature range including below freezing ambient conditions and above material durability limits, and imperviousness to mechanical concerns like attrition; 2) low HTF corrosivity; 3) potential to integrate novel TES concepts; 4) high receiver thermal efficiencies above 90%; 5) minimal environmental or safety hazards; 6) simplicity of the HTF-to-CO2 heat exchanger; and 7) operational simplicity with respect to fluid management and isolation of heat collection from power generation. We discussed several pathway challenges, including 1) inferior heat-transfer characteristics of inert HTFs, or in the case of the heat-pipe concept, the challenge of vertical capillary transport; 2) the relative immaturity of the TES and system integration research compared to other pathways; 3) the balance between pumping parasitic loss and parallel flow control requirements; and 4) current lack of a well-defined fluid operating envelope, although designs have previously explored more challenging pressure conditions.
Table 29 provides a summary of the estimated cost and performance for each critical sub-system identified in Figure 1 of this roadmap, relative to the SunShot targets. Where cost and performance fall short of a specific target, potential improvement opportunities are also identified.
Table 29. Summary of Estimated Cost and Performance for Critical Components within the GP Receiver Pathway
Component SunShot Targets Technology Pathway estimated and potential Cost/Performance for 50-MWe plant
Receiver (includes receiver, tower, vertical piping, $50/kWt general costs; omits insulation, circulator)
Cost < $150/kWt*
Efficiency > 90%
Exit temp >720°C
10,000 cycle lifetime
• Estimated cost for the receiver subsystem is $195/kWt using H230 and CO2 at 75 bar
• Significant potential exists to lower costs of transport piping with alternate line geometries, internal insulation
• Efficiency over 92%, fluid temperature from 700-750°C possible • Annualized parasitic losses of <3% for circulator • Design optimization required to assess broad design space
HTF Cost < $1/kg Operable range from 250°C to 800°C
• GP fluids are stable over the specified operating range • GP fluids have relatively low density and are not the storage
material, so specific cost is not a major factor in overall plant cost or O&M
Thermal Storage Cost < $15/kWt* 99% energetic efficiency 95% exergetic efficiency
• Estimated costs for tube-in-tank PCM with chloride salts at $39/kWht; potential cost improvement with alternate tank and insulation design
• Estimated costs for particle storage at $9/kWht, excluding particle conveyors and heat exchangers
HTF to sCO2 HX Not explicitly specified, cost included in power block target
• Gas-gas heat exchanger design is straightforward and commercial options exist
* Costs are installed, direct capital cost, not including contingency and EPC indirect costs
5 Conclusion Today’s power-tower CSP technology exists in large part as a result of DOE and utility industry funding of demonstration systems in the 1980s and 1990s. Today’s most advanced towers are integrated with molten-salt thermal energy storage, delivering thermal energy at 565°C for integration with conventional steam-Rankine cycles. The sCO2 power cycle has been identified as a likely successor to the steam-Rankine power cycle due to its potential for high efficiency
116 This report is available at no cost from the National Renewable Energy Laboratory at www.nrel.gov/publications.
when operating at elevated temperatures of 700°C or greater. Over the course of the SunShot Initiative, DOE has supported a number of technology pathways that can operate efficiently at these temperatures and that hold promise to be reliable and cost effective.
Three pathways—molten salt, particle, and gaseous—were selected for further investigation based on a two-day workshop held in August of 2016. The information contained in this roadmap identifies R&D challenges and lays out recommended research activities for each of the three pathways. DOE foresees that by successfully addressing the challenges identified in this roadmap, one or more technology pathways will be positioned for demonstration and subsequent commercialization within the next ten years.
Of the three pathways presented in this roadmap, molten-salt systems represent the most mature CSP technology. As such, the engineering challenges associated with achieving the high receiver outlet temperature required to drive a sCO2 turbine at >700°C are relatively well understood. However, knowledge around the selection of a high-temperature molten salt is needed, especially with regard to its impact on containment materials that can achieve acceptable strength, durability, and cost targets at these high temperatures. Corrosion mechanism differs among candidate salts and information is needed for component designers.
Within the particle-based pathway, although many of the components are mature and have been developed by industry—for example, particle heat exchangers, particle storage bins, particle feeders and hoppers, and particle lifts—the unique application for solarized sCO2 systems at high temperatures and high sCO2 pressures offers unique challenges that need to be addressed. In addition, heating the particles with concentrated sunlight poses additional challenges with efficient particle heating, flow control and containment, erosion and attrition, and conveyance.
The gas-phase technology pathway relies on an inert, stable gas-phase heat-transfer fluid operating within a pressure-containing receiver. The pathway also describes a heat-pipe concept where liquid HTF is evaporated in the receiver, transported as a saturated gas to TES, and condensed back into liquid form. Unlike the other two pathways, this pathway relies on indirect TES options such as a phase-change material or particle storage. Significant progress has been made on receiver designs for high-pressure operation under the SunShot program, and multiple institutions have put forward designs that demonstrate viability by way of modeling, lab-scale, and on-sun testing activities.
Based on current knowledge of the three power tower technologies, all three have the potential to achieve the SunShot goal of 6 ¢/kWh. Further development, modeling, and testing is now required to bring the technologies to a stage where integrated system tests and pilot demonstrations are feasible. Research will also focus on confirming the ability of each technology to address the market requirements defined by the Technical Review Committee, such as ramp rates, reliability, availability, and other criteria. For any of these technologies to successfully compete in the future marketplace, the needs of the evolving market must be reviewed often and changes incorporated into the technology development process.
117 This report is available at no cost from the National Renewable Energy Laboratory at www.nrel.gov/publications.
6 References
[1] C. S. Turchi, Z. Ma, T. W. Neises and M. J. Wagner, "Thermodynamic Study of Advanced Supercritical Carbon Dioxide Power Cycles for Concentrating Solar Power Systems," Journal of Solar Energy, vol. 135, 2013.
[2] P. Denholm, Y.-H. Wan, M. Hummon and M. Mehos, "An Analysis of Concentrating Solar Power with Thermal Energy Storage in a California 33% Renewable Scenario," NREL Report No. TP-6A20-58186, National Renewable Energy Laboratory, Golden, CO, 2013.
[3] J. Jorgenson, P. Denholm and M. Mehos, "Estimating the Value of Utility-Scale Solar Technologies in California Under a 40% Renewable Portfolio Standard," NREL Report No. TP-6A20-61685, National Renewable Energy Laboratory, Golden, CO, 2014.
[4] M. Mehos, C. Turchi, J. Jorgensen, P. Denholm, C. Ho and K. Armijo, "On the Path to SunShot: Advancing Concentrating Solar Power Technology, Performance, and Dispatchability," National Renewable Energy Laboratory, Golden, CO, NREL/TP- 5500-65668, 2016.
[5] J. E. Pacheco, "Final Test and Evaluation Results from the Solar Two Project, SAND2002-0120," Sandia, 2002.
[6] R. W. Bradshaw and S. H. Goods, "Accelerated Corrosion Testing of a Nickel-Base Alloy in a Molten Salt, SAND2001-8758," Sandia, 2001.
[7] Black and Veatch, "Molten Salt Concept Definition & Capital Cost Estimate," (Available at www.osti.gov: DOE-B&V-6650-1, OSTI ID 1335150; DOE-B&V-6650-2, OSTI ID 1335152; DOE-B&V-6650-3, OSTI ID 1335155), 2016.
[8] A. M. Kruizenga, W. Kolb, R. J. Briggs, J. Christian, D. Ray, D. Gill, J. Kelton and K. Chisman, "Loop for the Observation of Film Temperature Effects on Decomposition (LOFTED)," Sandia Report SAND2014-18103, September 2014.
[9] R. I. Olivares, C. Chen and S. Wright, "The Thermal Stability of Molten Lithium–Sodium–Potassium Carbonate and the Influence of Additives on the Melting Point," Journal of Solar Energy Engineering, vol. 134, pp. 041002-1 - 041002-8, 2012.
[10] SQM, SQM’s Thermo-Solar Salts (Salt Factsheet), Antwerpen, Belgium: SQM Europe, N.V. (www.sqm.com), 2016.
118 This report is available at no cost from the National Renewable Energy Laboratory at www.nrel.gov/publications.
[11] G. Janz and R. Tomkins, Physical Properties Data Compilations Relevant to Energy Storage, IV. Molten Salts: Data on Additional Single and Multi-Component Salt Systems, N. System, Ed., N.S.R.D. System, 1981.
[12] W. Haynes, CRC Handbook of Chemistry and Physics, 92nd Edition, 92nd Edition ed., W. M. Haynes, Ed., CRC Press, ProQuest Ebook Central, 2011.
[13] Vignarooban et al., "Heat Transfer Fluids for Concentrating Solar Power Systems – A Review," Applied Energy, vol. 146, 2015.
[14] Williams, "Assessment of Candidate Molten Salt Coolants for the NGNP/NHI Heat-Transfer Loop," ORNL/TM-2006/69, Oak Ridge, TN, 2006.
[15] X. An et al., "Determination and Evaluation of the Thermophysical Properties of an Alkali Carbonate Eutectic Molten Salt," Faraday Discuss. , vol. 190, p. 327, 2016.
[16] M. M. Avedesian and H. Baker, in ASM Specialty Handbook: Magnesium and Magnesium Alloys.
[17] H. E. Friedrich and B. L. Mordike, Magnesium Technology: Metallurgy, Design Data, Automotive Applications, Springer ebook collection / Chemistry and Materials Science 2005–2008, Edition illustrated, Springer Science & Business Media. ISBN 3540205993, 9783540205999, p.35, 2006.
[18] Savannah River National Laboratory, personal correspondence.
[19] Y. Wu, N. Ren, T. Wang and C. Ma, "Experimental Study on Optimized Composition of Mixed Carbonate Salt for Sensible Heat Storage in Solar Thermal Power Plant," Solar Energy, vol. 85, pp. 1957-1966, 2011.
[20] N. Ren, Y. Wu and C. Ma, "Preparation and Experimental Study of Mixed Carbonates with High Maximum Using Temperature," in ES2012-91401, Proceedings of the ASME 2012 6th International Conference on Energy Sustainability, July 23–26, 2012, San Diego, CA, 2012.
[21] CRU Group, "Lithium, The Problem With Prices…," June 2016. [Online]. Available: http://www.crugroup.com/about-cru/cruinsight/Lithium-The_Problem_With_Prices.
[22] EnergySource, personal correspondence.
[23] J. C. Gomez, "High-Temperature Materials (PCM) Candidates for Thermal Energy Storage Applications," NREL/TP-5500-51466, 2011.
119 This report is available at no cost from the National Renewable Energy Laboratory at www.nrel.gov/publications.
[24] K. Wang, E. E. Molina, P. Li, D. Gervasio and A. M. Kannan, "Vapor Pressure and Corrosivity of Ternary Metal-Chloride Molten-Salt Based Heat Transfer Fluids for Use in Concentrating Solar Power Systems," Applied Energy, vol. 159, p. 206–2, 2015.
[25] K. Vignarooban, P. Pugazhendhi, C. Tucker, D. Gervasio and A. M. Kannan, "Corrosion Resistance of Hastelloys in Molten Metal-Chloride Heat-Transfer Fluids for Concentrating Solar Power Applications," Solar Energy, vol. 103, p. 62–69, 2014.
[26] J. C. Gomez-Vidal, J. Noel and J. Weber, "Corrosion Evaluation of Alloys and MCrAlX Coatings in Molten Carbonates for Thermal Solar Applications," Solar Energy Materials & Solar Cells, vol. 157, p. 517–525, 2016.
[27] J. C. Gomez-Vidal and R. Tirawat, "Corrosion of Alloys in a Chloride Molten Salt (NaCl‒LiCl) for Solar Thermal Technologies," Solar Energy Materials & Solar Cells, vol. 157, p. 234–244, 2016.
[28] W.-. J. Cheng, M. H. Anderson, R. S. Sellers, K. Sridharan, C.-. J. Wang and T. R. Allen, "Zirconium Effect on the Corrosion Behavior of 316L Stainless Steel Alloy and Hastelloy-N Superalloy in Molten Fluoride Salt," Nuclear Technology, vol. 183, 2013.
[29] M. Anderson, K. Sridharan, D. Morgan, et al., "Heat Transfer Salts for Nuclear Reactor Systems – Chemistry Control, Corrosion Mitigation and Modeling," Nuclear Energy University Programs, Project No. 10-905.
[30] UA, "personal correspondence".
[31] Abengoa Solar, Inc., "Advanced Thermal Storage for Central Receivers with Supercritical Coolants," DOE Contract Report under Grant DE-FG36-08GO18149, June 2010.
[32] C. S. Turchi and G. A. Heath, "Molten Salt Power Tower Cost Model for the System Advisor Model (SAM)," NREL/TP-5500-57625, National Renewable Energy Laboratory, Golden, CO, February 2013.
[33] Grantham and Ferry, "Corrosion in Alkali Metal Carbonate-based Salts," in Proceedings of the International Symposium on Molten Salts, 1976.
[34] M. Jonemann, "Advanced Thermal Storage System with Novel Molten Salt," National Renewable Energy Laboratory, Golden, CO, NREL/SR-5200-58595, 2013.
[35] Martin Marietta Corporation, "Volume II – Molten Salt Thermal Energy Storage Subsystem Research Experiment, SAND80-8192," 1985.
120 This report is available at no cost from the National Renewable Energy Laboratory at www.nrel.gov/publications.
[36] B. Kelly, "Lessons Learned, Project History and Operating Experience of the Solar Two Project," Sandia Report SAND2000-2598, Sandia National Laboratories, 2000.
[37] SolarReserve, [Online]. Available: http://www.solarreserve.com/en/technology/molten-salt-tower-receiver.
[38] R. Z. Litwin, "Receiver System: Lessons Learned from Solar Two," SAND2002-0084, The Boeing Company, Canoga Park, CA, April 2002.
[39] R. B. Diver, "Reflux Solar Receiver Design Considerations," in 1992 ASME-JSES-KSES International Solar Energy Conference, 1992.
[40] D. L. Barth, J. E. Pacheco, W. J. Kolb and E. E. Rush, "Development of a High-Temperature, Long-Shafted, Molten-Salt Pump for Power Tower Applications," ASME. J. Sol. Energy Eng., vol. 124, no. 2, p. 170–175, 2002.
[41] A. R. Shankar et al., "Corrosion Behavior of Candidate Materials in Molten LiCl-KCl Salt Under Argon Atmosphere," Corrosion, vol. 69, no. 7, p. 655–665, 2013.
[42] Univerity of Wisconsin-Madison, personal correspondence.
[43] S. Frangini, "Corrosion Behavior of AISI 316L Stainless Steel and ODS FeAl Aluminide in Eutectic Li2CO3–K2CO3 Molten Carbonates under Flowing CO2–O2 Gas Mixtures," Oxidation of Metals, vol. 53, p. 139–156, 2000.
[44] J. E. Pacheco, M. E. Ralph, J. M. Chavez, S. R. Dunkin, E. E. Rush, C. M. Ghanbari and C. W. Matthews, "Results of Molten Salt Panel and Component Experiments for Solar Central Receivers," Report SAND94-2525, Sandia National Laboratories, Albuquerque, NM, January 1995.
[45] J. M. Christian and C. K. Ho, "Alternative Designs of a High Efficiency, North-Facing Solid Particle Receiver," in SolarPACES 2013, Las Vegas, NV, 2013.
[46] G. Flamant et al., "Experimental Aspects of the Thermochemical Conversion of Solar-Energy - Decarbonation of CaCO3," Solar Energy, vol. 24, no. 4, pp. 385-395, 1980.
[47] C. Ho et al., "Technology advancements for next generation falling particle receivers," in Proceedings of the Solarpaces 2013 International Conference (Energy Procedia), 2014.
[48] R. Knott et al., "Sintering of Solid Particulates under Elevated Temperature and Pressure in Large Storage Bins for Thermal Energy Storage," in Proceedings of the ASME 2014 8th International Conference on Energy Sustainability, Boston, MA, 2014.
121 This report is available at no cost from the National Renewable Energy Laboratory at www.nrel.gov/publications.
[49] H. Al-Ansary et al., "Characterization and Sintering Potential of Solid particles for Use in High Temperature Thermal Energy Storage System," in SolarPACES 2013, Las Vegas, NV, 2013.
[50] N. P. Siegel, M. D. Gross and R. Coury, "The Development of Direct Absorption and Storage Media for Falling Particle Solar Central Receivers," ASME J. Solar Energy Eng., vol. 137, no. 4, pp. 041003-041003-7, 2015.
[51] G. Flamant et al., "A new heat transfer fluid for concentrating solar systems: Particle flow in tubes," Proceedings of the Solarpaces 2013 International Conference, vol. 49, pp. 617-626, 2014.
[52] J. Martinek and Z. Ma, "Granular Flow and Heat-Transfer Study in a Near-Blackbody Enclosed Particle Receiver," Journal of Solar Energy Engineering, vol. 137, no. 5, pp. 051008-051008, 2015.
[53] G. Flamant et al., "Dense suspension of solid particles as a new heat transfer fluid for concentrated solar thermal plants: On-sun proof of concept," Chemical Engineering Science, vol. 102, pp. 567-576, 2013.
[54] N. P. Siegel et al., "Development and Evaluation of a Prototype Solid Particle Receiver: On-Sun Testing and Model Validation," Journal of Solar Energy Engineering-Transactions of the Asme, vol. 132, no. 2, 2010.
[55] C. K. Ho et al., "Performance Evaluation of a High-Temperature Falling Particle Receiver," in ASME Power & Energy Conference, Charlotte, NC, 2016.
[56] C. K. Ho et al., "On Sun Testing of an Advanced Falling Particle Receiver System," in SolarPACES 2015, Cape Town, South Africa, 2015.
[57] W. Wu et al., "Prototype Testing of a Centrifugal Particle Receiver for High-Temperature Concentrating Solar Applications," . Journal of Solar Energy Engineering-Transactions of the Asme, vol. 137, no. 4, 2015.
[58] W. Wu et al., "Numerical Simulation of a Centrifugal Particle Receiver for High-Temperature Concentrating Solar Applications," Numerical Heat Transfer Part a-Applications, vol. 68, no. 2, pp. 133-149, 2015.
[59] W. Wu et al., "Proof of concept test of a centrifugal particle receiver," Proceedings of the Solarpaces 2013 International Conference, vol. 49, pp. 560-568, 2014.
[60] W. Wu et al., "On the influence of rotation on thermal convection in a rotating cavity for
122 This report is available at no cost from the National Renewable Energy Laboratory at www.nrel.gov/publications.
solar receiver applications," Applied Thermal Engineering, vol. 70, no. 1, pp. 694-704, 2014.
[61] Z. W. Ma, G. Glatzmaier and M. Mehos, "Fluidized Bed Technology for Concentrating Solar Power With Thermal Energy Storage," Journal of Solar Energy Engineering-Transactions of the ASME, vol. 136, no. 3, 2014.
[62] G. Flamant, "Theoretical and Experimental-Study of Radiant-Heat Transfer in a Solar Fluidized-Bed Receiver," AICHE Journal, vol. 28, no. 4, pp. 529-535, 1982.
[63] A. Steinfeld, A. Imhof and D. Mischler, "Experimental Investigation of an Atmospheric-Open Cyclone Solar Reactor for Solid-Gas Thermochemical Reactions," Journal of Solar Energy Engineering-Transactions of the ASME, vol. 114, no. 3, pp. 171-174, 1992.
[64] M. Rӧger et al., "Face-Down Solid Particle Receiver Using Recirculation," Journal of Solar Energy Engineering, 2011.
[65] S. S. Khalsa et al., "CFD Simulation and Performance Analaysis of Alternative Designs for High-Temperature Solid Particle Receivers," in ASME International Conference on Energy Sustainability, Washington, DC, 2011.
[66] M. Röger et al., "Face-Down Solid Particle Receiver Using Recirculation," Journal of Solar Energy Engineering-Transactions of the ASME, 2011.
[67] C. K. Ho, "A Review of High-Temperature Particle Receivers for Concentrating Solar Power," Applied Thermal Engineering, 2016.
[68] P. K. Falcone, J. E. Noring and J. M. Hruby, "Assessment of a Solid Particle Receiver for a High Temperature Solar Central Receiver System," Sandia National Laboratories, Livermore, CA, 1985.
[69] J. M. Hruby and B. R. Steele, "A Solid Particle Central Receiver for Solar-Energy," Chemical Engineering Progress, vol. 82, no. 2, pp. 44-47, 1986.
[70] G. Kolb, R. Diver and N. Siegel, "Central-station solar hydrogen power plant," vol. 129, no. 2, pp. 179-183, 2007.
[71] T. D. Tan and Y. T. Chen , "Review of study on solid particle solar receivers," Renewable & Sustainable Energy Reviews, vol. 14, no. 1, pp. 265-276, 2010.
[72] H. J. Chen et al., "Numerical investigation on optimal design of solid particle solar receiver," Proceedings of the Energy Sustainability Conference 2007, pp. 971-979, 2007.
123 This report is available at no cost from the National Renewable Energy Laboratory at www.nrel.gov/publications.
[73] T. D. Tan et al., "Wind effect on the performance of solid particle solar receivers with and without the protection of an aerowindow," Solar Energy, vol. 83, no. 10, pp. 1815-1827, 2009.
[74] H. Al Ansary et al., Solid Particle Receiver with Porous Structure for Flow Regulation and Enhancement of Heat Transfer, US: K.S. University, 2013.
[75] T. Lee et al., "Numerical simulation of particulate flow in interconnected porous media for central particle-heating receiver applications," Solar Energy, vol. 113, pp. 14-24, 2015.
[76] F. Bai et al., "Thermal performance of a quartz tube solid particle air receiver," Proceedings of the Solarpaces 2013 International Conference,, vol. 49, pp. 284-294, 2014.
[77] F. Wang et al., "Numerical simulation of quartz tube solid particle air receiver," International Conference on Concentrating Solar Power and Chemical Energy Systems, Solarpaces 2014, vol. 69, pp. 573-582, 2015.
[78] Y. N. Zhang et al., "Experimental study of a single quartz tube solid particle air receiver," International Conference on Concentrating Solar Power and Chemical Energy Systems, Solarpaces 2014, vol. 69, pp. 600-607, 2015.
[79] Z. Ma and R. Zhang, "Solid Particle Thermal Energy Storage Design for a Fluidized-Bed Concentrating Solar Power Plant," NREL, 2013.
[80] H. Benoit et al., "On-sun demonstration of a 750 degrees C heat transfer fluid for concentrating solar systems: Dense particle suspension in tube," Solar Energy, vol. 118, pp. 622-633, 2015.
[81] Colorado School of Mines, "High Temperature Thermochemical Storage with Redox-Stable Perovskites for Concentrating Solar Power," Department of Energy ELEMENTS Award, https://energy.gov/eere/sunshot/project-profile-high-temperature-thermochemical-storage-redox-stable-perovskites.
[82] K. Kim, N. Siegel, G. Kolb, V. Rangaswamy and S. Moujaes , "A study of solid particle flow characterization in solar particle receiver," Solar Energy, vol. 83, no. 10, pp. 1784-1793, 2009.
[83] Z. Ma, R. Zhang and F. Sawaged, "Design of particle-based thermal energy storage for a concentrating solar power system," in Proceedings of the ASME 2017 Power and Energy Conference, PowerEnergy2017, Charlotte, NC, 2017.
[84] Z. Ma, R. Zhang and F. Sawaged, "Silo Design for Particle-Based Thermal Energy Storage
124 This report is available at no cost from the National Renewable Energy Laboratory at www.nrel.gov/publications.
in Concentrated Solar Power Systems," in ASME Energy Sustainability , Charlotte, NC, 2016.
[85] D. Mills, Pneumatic Conveying Design Guide, London: Butterworths, 1990.
[86] K. D. Repole and S. M. Jeter, "Design and Analysis of a High Temperature Particulate Hoist for Proposed Particle Heating Concentrator Solar Power Systems," in ASME 2016 10th International Conference on Energy Sustainability, ES2016-59619, Charlotte, NC, 2016.
[87] Black and Veatch, "Falling Particles Concept Definition & Capital Cost Estimate," (Available at www.osti.gov: DOE-B&V-6650-1, OSTI ID 1335150; DOE-B&V-6650-2, OSTI ID 1335152; DOE-B&V-6650-3, OSTI ID 1335155), 2016.
[88] C. Ho, M. Carlson, P. Garg and P. Kumar, "Technoeconomic Analysis of Alternative Solarized s-CO2 Brayton Cycle Configurations," J. Solar Energy Engineering, vol. 138, pp. 051008-1, 2016.
[89] J. Karni, A. Kribus, R. Rubin and P. Doron, "The “Porcupine”: A Novel High-Flux Absorber for Volumetric Solar Receivers," J. Sol. Energy Eng., vol. 120, p. 85, 1998.
[90] P. Heller, M. Pfänder, T. Denk, F. Tellez, A. Valverde, J. Fernandez et al., "Test and Evaluation of a Solar Powered Gas Turbine System," Sol. Energy, vol. 80, p. 1225–1230, 2006.
[91] A. L. Ávila-Marín, "Volumetric Receivers in Solar Thermal Power Plants with Central Receiver System Technology: A Review," Sol. Energy, vol. 85, p. 891–910, 2011.
[92] C. K. Ho and B. D. Iverson, "Review of High-Temperature Central Receiver Designs for Concentrating Solar Power," Renew. Sustain. Energy Rev., vol. 29, p. 835–846, 2014.
[93] M. J. Wagner, Z. Ma, J. Martinek, T. W. Neises and C. S. Turchi, "Systems and Methods for Direct Thermal Receivers Using Near Blackbody Configurations". Patent US 2015/0330668A1, 2015.
[94] C. F. McDonald, "Helium Turbomachinery Operating Experience from Gas Turbine Power Plants and Test Facilities," Appl. Therm. Eng., vol. 44, p. 108–142, 2012.
[95] A. Lenert, Y. Nam and E. N. Wang, "Heat Transfer Fluids," Annu. Rev. Heat Transf., vol. 15, p. 93–129, 2012.
[96] Haynes International, Haynes 230 Alloy Technical Data, 2007.
125 This report is available at no cost from the National Renewable Energy Laboratory at www.nrel.gov/publications.
[97] U.S. Geological Survey, "Mineral Commodities Summaries," vol. 202, 2016.
[98] H. Z. Zhou and J. Wang , "Helium Circulator Design and Testing,," Nucl. Eng. Des., vol. 218, p. 189–198.
[99] T. Neises, M. J. Wagner and A. K. Gray, "Structural Design Considerations for Tubular Power Tower Receivers Operating at 650C," in Proceedings of the 8th International Conference on Energy Sustainability, Boston, MA, 2014.
[100] H. Michels and R. Pitz-Paal, "Cascaded Latent Heat Storage for Parabolic Trough Solar Power Plants," Sol. Energy, vol. 81, p. 829–837, 2007.
[101] M. M. Kenisarin, "High-Temperature Phase Change Materials for Thermal Energy Storage," Renew. Sustain. Energy Rev., vol. 14, p. 955–970, 2010.
[102] B. C. Zhao, M. S. Cheng, C. Liu and Z. Min-Dai, "Thermal Performance and Cost Analysis of a Multi-Layered Solid-PCM Thermocline Thermal Energy Storage for CSP Tower Plants," Appl. Energy, vol. 178, p. 84–799, 2016.
[103] D. Singh, W. Zhao, W. Yu, D. M. France and T. Kim, "Analysis of a Graphite Foam-NaCl Latent Heat Storage System for Supercritical CO2 Power Cycles for Concentrated Solar Power," Sol. Energy, vol. 118, p. 232–242, 2015.
[104] EconExpert, "Chemical Process Cost Estimation Tool," 2016. [Online]. Available: http://www.ulrichvasudesign.com/econ.html.
[105] R. Sioshansi, "The Value of Concentrating Solar Power and Thermal Energy Storage," IEEE Trans. Energy, vol. 1, p. 173–183, 2010.
[106] M. Jonemann, Advanced Thermal Storage System with Novel Molten Salt, Contract. 303, 275–3000, 2013.
[107] Kelvion, "Tailor-made Plate Heat Exchanger Solutions," 2016. [Online]. Available: https://www.kelvion.com/products-services/product/kflex/. [Accessed 19 12 2016].
[108] D. W. Waples and J. S. Waples , "A Review and Evaluation of Specific Heat Capacities of Rocks, Minerals, and Subsurface Fluids. Part 1: Minerals and Nonporous Rocks," Nat. Resour. Res., vol. 13, p. 97–122.
[109] R. Sioshansi, "The Value of Concentrating Solar Power and Thermal Energy Storage," IEEE Trans. Energy, vol. 1, p. 173–183, 2010.
126 This report is available at no cost from the National Renewable Energy Laboratory at www.nrel.gov/publications.
[110] P. Denholm, G. Brinkman, D. Lew and M. Hummon, "Operation of Concentrating Solar Power Plants in the Western Wind and Solar Integration Phase 2 Study," 2014.
[111] S. G. Johnson, "The NLopt nonlinear-optimization package," 2014.
[112] J. F. Hinze, G. F. Nellis and M. H. Anderson, "Experimental Testing of s-CO2 Regenerator for Use as a Replacement to High Cost Printed Circuit Recuperators for Use in s-CO2 Recompression Brayton Cycle," in ASME 2016 Power Energy Conf., Charlotte, NC, 2016.
[113] B. Gobereit, B. et al., "Assessment of a Falling Solid Particle Receiver with Numerical Simulation," in SolarPACES 2012, Marrakech, Morrocco, 2012.
[114] S. S. Khalsa and C. K. Ho, "Radiation Boundary Conditions for Computational Fluid Dynamics Models of High-Temperature Cavity Receivers," Journal of Solar Energy Engineering-Transactions of the ASME, vol. 133, no. 3, 2011.
[115] K. Kim, S. F. Moujaes and G. J. Kolb, "Experimental and simulation study on wind affecting particle flow in a solar receiver," Solar Energy, vol. 84, no. 2, pp. 263-270, 2010.
[116] R. Knott et al., "High Temperature Durability of Solid Particles for Use in Particle Heating Concentrator Solar Power Systems," in Proceedings of the ASME 2014 8th International Conference on Energy Sustainability, Boston, MA, 2014.
[117] M. J. Rightley, L. K. Matthews and G. P. Mulholland, "Experimental Characterization of the Heat-Transfer in a Free-Falling-Particle Receiver," Solar Energy, vol. 48, no. 6, pp. 363-374, 1992.
[118] H. J. Chen et al., "Computational fluid dynamics modeling of gas-particle flow within a solid-particle solar receiver," Journal of Solar Energy Engineering-Transactions of the ASME, vol. 129, no. 2, pp. 160-170, 2007.
[119] Z. Q. Chen, Y. T. Chen and T. D. Tan , "Numerical Analysis on the Performance of the Solid Solar Particle Receiver with the Influence of Aerowindow," in Proceedings of the ASME Fluids Engineering Division Summer Conference -2008, Vol 1, Pt A and B, Jacksonville, FL, 2009.
[120] C. K. Ho, M. Roeger, S. S. Khalsa, L. Amsbeck, R. Buck, N. Siegel and G. Kolb, "Experimental Validation of Different Modeling Approaches for Solid Particle Receivers," in SolarPACES 2009, Berlin, Germany, 2009.
[121] C. K. Ho, S. S. Khalsa and N. P. Siegel, "Modeling on-Sun Tests of a Prototype Solid Particle Receiver for Concentrating Solar Power Processes and Storage," in ES2009:
127 This report is available at no cost from the National Renewable Energy Laboratory at www.nrel.gov/publications.
Proceedings of the ASME 3rd International Conference on Energy Sustainability, Vol 2. 2009, San Francisco, CA, 2009.
[122] J. M. Hruby, "A Technical Feasibility Study of a Solid Particle Solar Central Receiver for High Temperature Applications," Sandia National Laboratories, Livermore, CA, 1986.
[123] S. S. Khalsa, J. M. Christian, G. J. Kolb, M. Roger, L. Amsbeck, C. K. Ho, N. P. Siegel and A. C. Moya, "CFD Simulation and Performance Analysis of Alternative Designs for High-Temperature Solid Particle Receivers," in Proceedings of the ASME 2011 Energy Sustainability and Fuel Cell Conference, Washington, DC, 2011.
[124] N. Siegel et al., "Solid particle receiver flow characterization studies," Proceedings of the Energy Sustainability Conference 2007, pp. 877-883, 2007.
[125] T. D. Tan and Y. T. Chen, "Protection of an Aerowindow, One Scheme to Enhance the Cavity Efficiency of a Solid Particle Solar Receiver," in HT2009: Proceedings of the ASME Summer Heat Transfer Conference 2009, Vol 2, San Francisco, CA, 2009.
[126] A. Kribus, P. Doron, R. Rubin, J. Karni, R. Reuve, S. Duchan et al., "A Multistage Solar Receiver : The Route to High Temperature," Sol. Energy, vol. 67, p. 3–11, 2000.
[127] I. Hischier, P. Poživil and A. Steinfeld, "A Modular Ceramic Cavity-Receiver for High-Temperature High-Concentration Solar Applications," J. Sol. Energy Eng., vol. 134, p. 011004, 2012.
[128] A. Steinfeld, "Solar Thermochemical Production of Hydrogen: A Review," Sol. Energy, vol. 78, p. 603–615, 2005.
[129] G. Koll, K. Hennecke, T. Hartz, M. Schmitz, P. Schwarzboezl, K. Hennecke et al., "The Solar Tower JÜLICH – A Research and Demonstration Plant for Central Receiver Systems," in Proc. 2009 SolarPACES Int. Symp., Berlin, Germany, 2009.
[130] R. Sioshansi, "The Value of Concentrating Solar Power and Thermal Energy Storage," IEEE Trans. Energy, vol. 1, p. 173–183, 2010.
[131] J. B. Moreno et al., "Test Results from a Full-Scale Sodium Reflux Pool-Boiler Solar Receiver," in ASME international solar energy conference, Miami, FL, 1990.