Embed Size (px)
Citation preview
STUDY OF FIVE PHOSPHORUS REMOVAL PROCESSES SELECT COMAG™ TO MEET
CONCORD, MASSACHUSETTS’ STRINGENT NEW LIMITS
Hugh G. Tozer, P.E., Woodard & Curran
Woodard & Curran Inc.
41 Hutchins Drive
Portland, Maine 04012
ABSTRACT
Many municipal and industrial wastewater treatment facilities face new stringent permit limits on
phosphorus, with values of 0.2 to 0.05 mg/L being proposed in some watersheds. Most of these
plants will need a tertiary treatment process that fits within a small footprint and limited budget
while providing flexibility to meet both current and future limits.
The Town of Concord, Massachusetts faced these issues at its 4,540 m3/d (1.2 MGD) wastewater
plant. The addition of alum to the secondary clarifiers would not meet the anticipated future
phosphorus limit of 0.1 mg/L or below. Woodard & Curran Inc. evaluated multiple
configurations of five processes (CoMag™, Actiflo®, DensaDeg
®, DualSand™, membrane
biological reactors, or MBR) to help Concord select the best option to provide process flexibility
and reliability on the space-limited site. The peer-reviewed study, which included an extended
trial of the CoMag™ process, concluded that CoMag™ was the optimal solution.
KEYWORDS
Phosphorus treatment, CoMag, High Gradient Magnetic Separation
INTRODUCTION
Many municipal and industrial wastewater treatment facilities face new stringent permit limits on
phosphorus, with values of 0.2 to 0.05 mg/L being proposed in some watersheds. Most of these
plants need a tertiary treatment process that fits within a small footprint and limited budget while
providing flexibility to meet both current and future limits.
The Town of Concord, Massachusetts (Concord) faced these issues at its wastewater plant. It
operated under a National Pollutant Discharge Elimination System (NPDES) permit that had an
interim seasonal phosphorus limit of 0.75 mg/L. The Massachusetts Department of
Environmental Protection and the United States Environmental Protection Agency (USEPA) had
suggested the phosphorus limit could be lowered to 0.2 mg/L, and a limit as low as 0.05 mg/L
was a possibility.
The plant’s existing phosphorus treatment – the addition of alum prior to the secondary clarifiers
– was not expected to meet the future permit limits. Engineers evaluated multiple configurations
of five processes (CoMag™, Actiflo®, DensaDeg
®, DualSand™, and membrane biological
reactors, or MBRs) to help Concord select an option that would provide process flexibility and
reliability on the space-limited site. A panel used a combination of evaluation criteria to screen
the alternatives that merited further evaluation. The study, which included an 18-month trial of
the CoMag™ process, concluded that CoMag™ was the optimal solution.
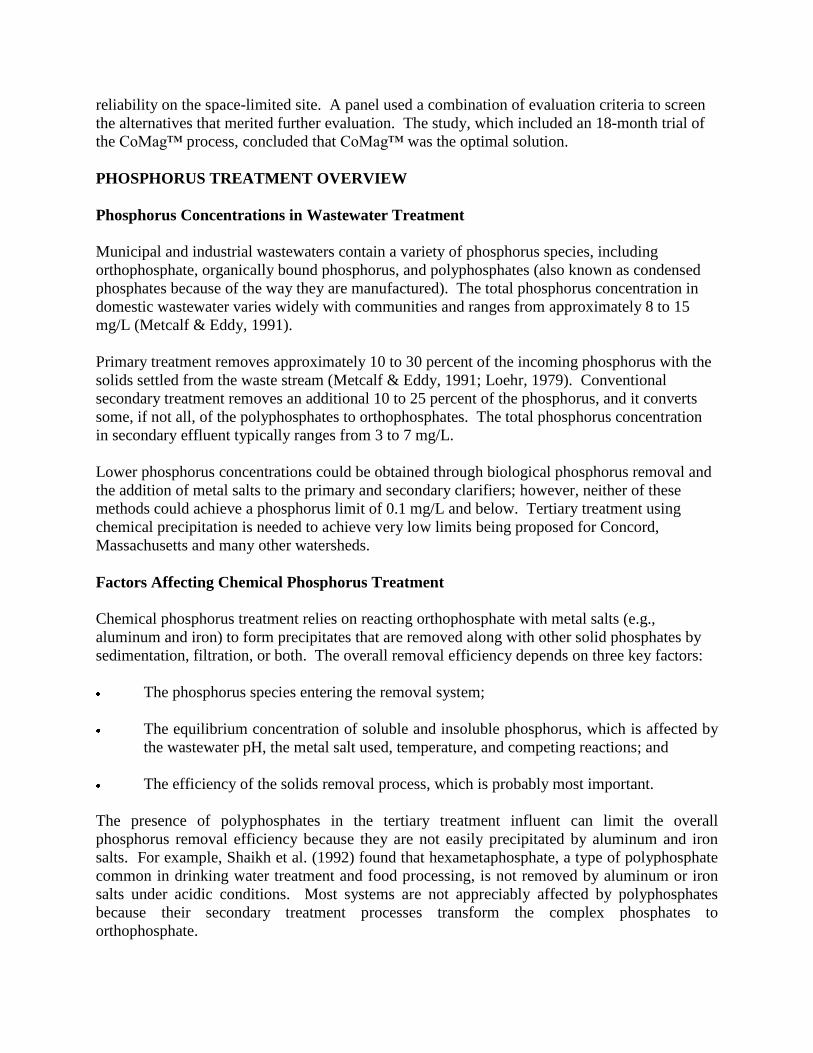
PHOSPHORUS TREATMENT OVERVIEW
Phosphorus Concentrations in Wastewater Treatment
Municipal and industrial wastewaters contain a variety of phosphorus species, including
orthophosphate, organically bound phosphorus, and polyphosphates (also known as condensed
phosphates because of the way they are manufactured). The total phosphorus concentration in
domestic wastewater varies widely with communities and ranges from approximately 8 to 15
mg/L (Metcalf & Eddy, 1991).
Primary treatment removes approximately 10 to 30 percent of the incoming phosphorus with the
solids settled from the waste stream (Metcalf & Eddy, 1991; Loehr, 1979). Conventional
secondary treatment removes an additional 10 to 25 percent of the phosphorus, and it converts
some, if not all, of the polyphosphates to orthophosphates. The total phosphorus concentration
in secondary effluent typically ranges from 3 to 7 mg/L.
Lower phosphorus concentrations could be obtained through biological phosphorus removal and
the addition of metal salts to the primary and secondary clarifiers; however, neither of these
methods could achieve a phosphorus limit of 0.1 mg/L and below. Tertiary treatment using
chemical precipitation is needed to achieve very low limits being proposed for Concord,
Massachusetts and many other watersheds.
Factors Affecting Chemical Phosphorus Treatment
Chemical phosphorus treatment relies on reacting orthophosphate with metal salts (e.g.,
aluminum and iron) to form precipitates that are removed along with other solid phosphates by
sedimentation, filtration, or both. The overall removal efficiency depends on three key factors:
The phosphorus species entering the removal system;
The equilibrium concentration of soluble and insoluble phosphorus, which is affected by
the wastewater pH, the metal salt used, temperature, and competing reactions; and
The efficiency of the solids removal process, which is probably most important.
The presence of polyphosphates in the tertiary treatment influent can limit the overall
phosphorus removal efficiency because they are not easily precipitated by aluminum and iron
salts. For example, Shaikh et al. (1992) found that hexametaphosphate, a type of polyphosphate
common in drinking water treatment and food processing, is not removed by aluminum or iron
salts under acidic conditions. Most systems are not appreciably affected by polyphosphates
because their secondary treatment processes transform the complex phosphates to
orthophosphate.
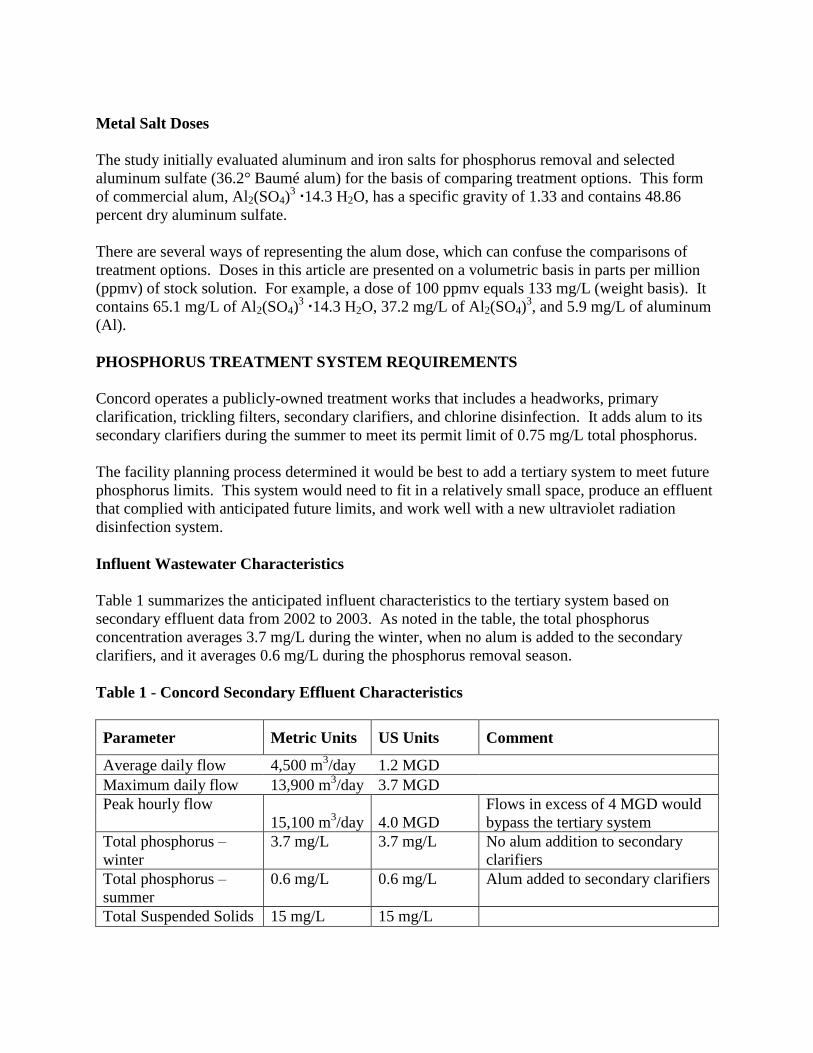
Metal Salt Doses
The study initially evaluated aluminum and iron salts for phosphorus removal and selected
aluminum sulfate (36.2° Baumé alum) for the basis of comparing treatment options. This form
of commercial alum, Al2(SO4)3 14.3 H2O, has a specific gravity of 1.33 and contains 48.86
percent dry aluminum sulfate.
There are several ways of representing the alum dose, which can confuse the comparisons of
treatment options. Doses in this article are presented on a volumetric basis in parts per million
(ppmv) of stock solution. For example, a dose of 100 ppmv equals 133 mg/L (weight basis). It
contains 65.1 mg/L of Al2(SO4)3 14.3 H2O, 37.2 mg/L of Al2(SO4)
3, and 5.9 mg/L of aluminum
(Al).
PHOSPHORUS TREATMENT SYSTEM REQUIREMENTS
Concord operates a publicly-owned treatment works that includes a headworks, primary
clarification, trickling filters, secondary clarifiers, and chlorine disinfection. It adds alum to its
secondary clarifiers during the summer to meet its permit limit of 0.75 mg/L total phosphorus.
The facility planning process determined it would be best to add a tertiary system to meet future
phosphorus limits. This system would need to fit in a relatively small space, produce an effluent
that complied with anticipated future limits, and work well with a new ultraviolet radiation
disinfection system.
Influent Wastewater Characteristics
Table 1 summarizes the anticipated influent characteristics to the tertiary system based on
secondary effluent data from 2002 to 2003. As noted in the table, the total phosphorus
concentration averages 3.7 mg/L during the winter, when no alum is added to the secondary
clarifiers, and it averages 0.6 mg/L during the phosphorus removal season.
Table 1 - Concord Secondary Effluent Characteristics
Parameter Metric Units US Units Comment
Average daily flow 4,500 m3/day 1.2 MGD
Maximum daily flow 13,900 m3/day 3.7 MGD
Peak hourly flow
15,100 m3/day 4.0 MGD
Flows in excess of 4 MGD would
bypass the tertiary system
Total phosphorus –
winter
3.7 mg/L 3.7 mg/L No alum addition to secondary
clarifiers
Total phosphorus –
summer
0.6 mg/L 0.6 mg/L Alum added to secondary clarifiers
Total Suspended Solids 15 mg/L 15 mg/L
Effluent Limits
At the time of the study, regulators had not established the new total phosphorus limit, but they
had suggested it could be 0.2 mg/L and as low as 0.05 mg/L. Without a definite limit, the team
focused on options that could ultimately meet the lower limit, and perhaps be phased in if a more
lenient limit were initially imposed.
To meet a limit of 0.05 mg/L, the study assumed that alum would be added to the secondary
clarifiers. The tertiary treatment system influent phosphorus concentration was assumed to be
approximately 1.0 mg/L, which was well within the past performance of the Concord system.
PHOSPHORUS REMOVAL OPTIONS ANALYSIS
An evaluation team screened five phosphorus removal processes and selected two for more
detailed review. The team included a group of senior engineers and operators (including the
plant manager of the Concord facility) and the Operations Engineer for Concord. Equipment
vendors were not directly involved, but they were contacted.
The screening relied on information available in the marketplace, literature, telephone interviews
of operators using the various technologies, inspections of the treatment systems, and the
experience of the team members. The assessments were specific to the unique circumstances
and issues at the Concord facility and might not apply directly to other facilities.
The treatment processes included in the review are described in the following sections.
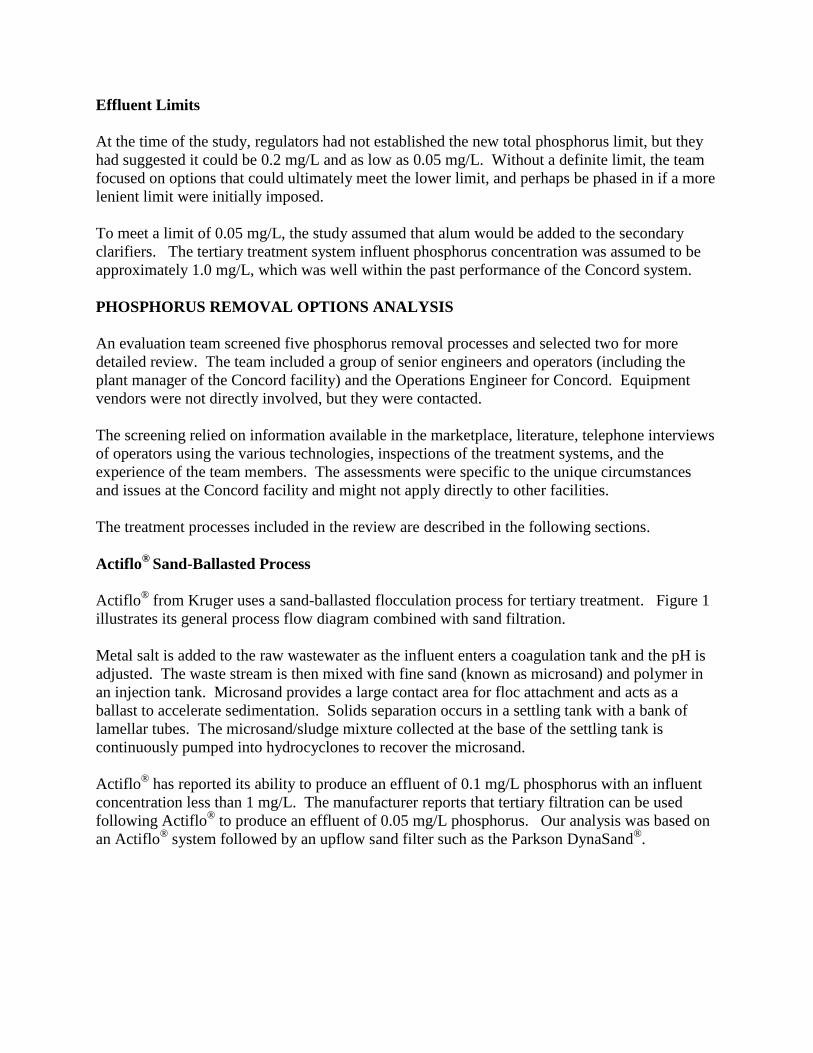
Actiflo®
Sand-Ballasted Process
Actiflo® from Kruger uses a sand-ballasted flocculation process for tertiary treatment. Figure 1
illustrates its general process flow diagram combined with sand filtration.
Metal salt is added to the raw wastewater as the influent enters a coagulation tank and the pH is
adjusted. The waste stream is then mixed with fine sand (known as microsand) and polymer in
an injection tank. Microsand provides a large contact area for floc attachment and acts as a
ballast to accelerate sedimentation. Solids separation occurs in a settling tank with a bank of
lamellar tubes. The microsand/sludge mixture collected at the base of the settling tank is
continuously pumped into hydrocyclones to recover the microsand.
Actiflo® has reported its ability to produce an effluent of 0.1 mg/L phosphorus with an influent
concentration less than 1 mg/L. The manufacturer reports that tertiary filtration can be used
following Actiflo® to produce an effluent of 0.05 mg/L phosphorus. Our analysis was based on
an Actiflo® system followed by an upflow sand filter such as the Parkson DynaSand
®.
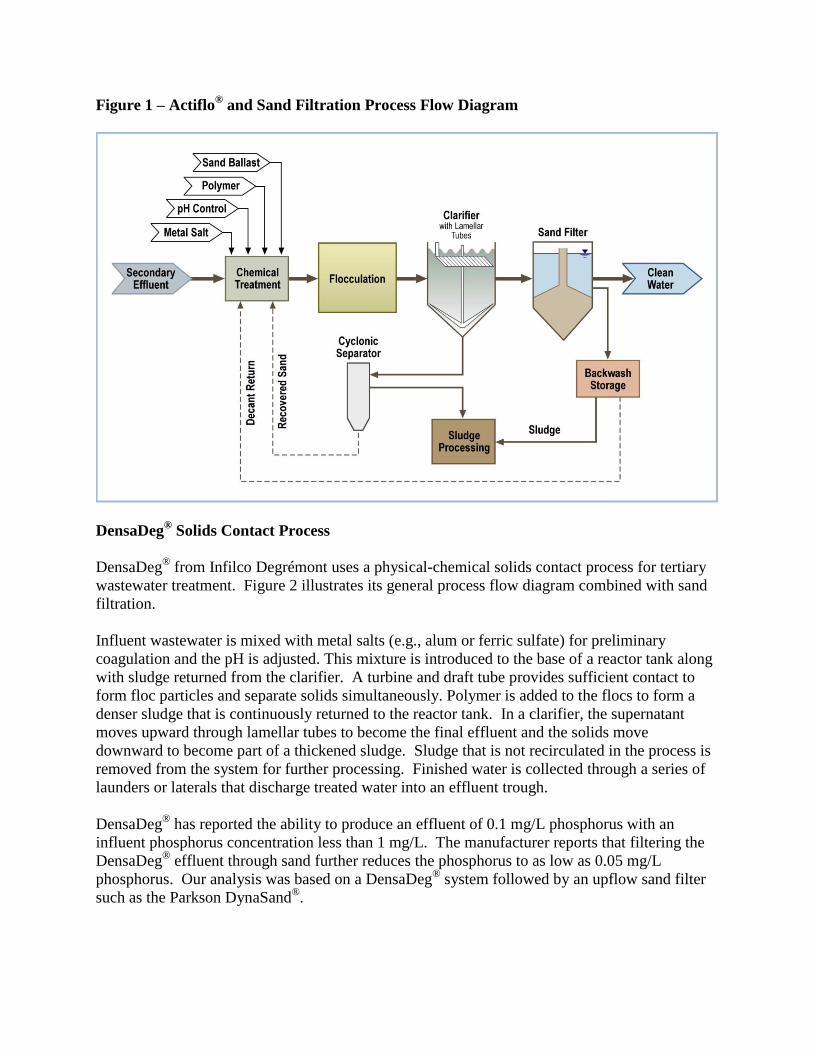
Figure 1 – Actiflo® and Sand Filtration Process Flow Diagram
DensaDeg® Solids Contact Process
DensaDeg® from Infilco Degrémont uses a physical-chemical solids contact process for tertiary
wastewater treatment. Figure 2 illustrates its general process flow diagram combined with sand
filtration.
Influent wastewater is mixed with metal salts (e.g., alum or ferric sulfate) for preliminary
coagulation and the pH is adjusted. This mixture is introduced to the base of a reactor tank along
with sludge returned from the clarifier. A turbine and draft tube provides sufficient contact to
form floc particles and separate solids simultaneously. Polymer is added to the flocs to form a
denser sludge that is continuously returned to the reactor tank. In a clarifier, the supernatant
moves upward through lamellar tubes to become the final effluent and the solids move
downward to become part of a thickened sludge. Sludge that is not recirculated in the process is
removed from the system for further processing. Finished water is collected through a series of
launders or laterals that discharge treated water into an effluent trough.
DensaDeg® has reported the ability to produce an effluent of 0.1 mg/L phosphorus with an
influent phosphorus concentration less than 1 mg/L. The manufacturer reports that filtering the
DensaDeg® effluent through sand further reduces the phosphorus to as low as 0.05 mg/L
phosphorus. Our analysis was based on a DensaDeg® system followed by an upflow sand filter
such as the Parkson DynaSand®.
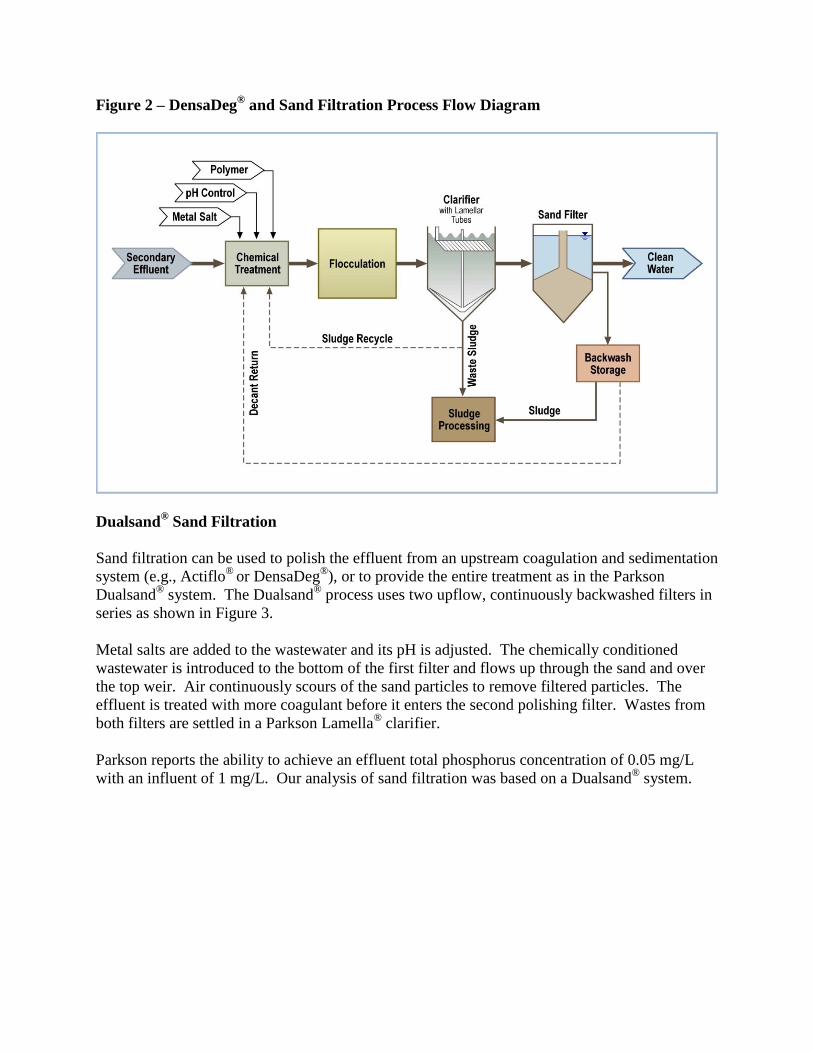
Figure 2 – DensaDeg® and Sand Filtration Process Flow Diagram
Dualsand® Sand Filtration
Sand filtration can be used to polish the effluent from an upstream coagulation and sedimentation
system (e.g., Actiflo®
or DensaDeg®), or to provide the entire treatment as in the Parkson
Dualsand® system. The Dualsand
® process uses two upflow, continuously backwashed filters in
series as shown in Figure 3.
Metal salts are added to the wastewater and its pH is adjusted. The chemically conditioned
wastewater is introduced to the bottom of the first filter and flows up through the sand and over
the top weir. Air continuously scours of the sand particles to remove filtered particles. The
effluent is treated with more coagulant before it enters the second polishing filter. Wastes from
both filters are settled in a Parkson Lamella® clarifier.
Parkson reports the ability to achieve an effluent total phosphorus concentration of 0.05 mg/L
with an influent of 1 mg/L. Our analysis of sand filtration was based on a Dualsand® system.
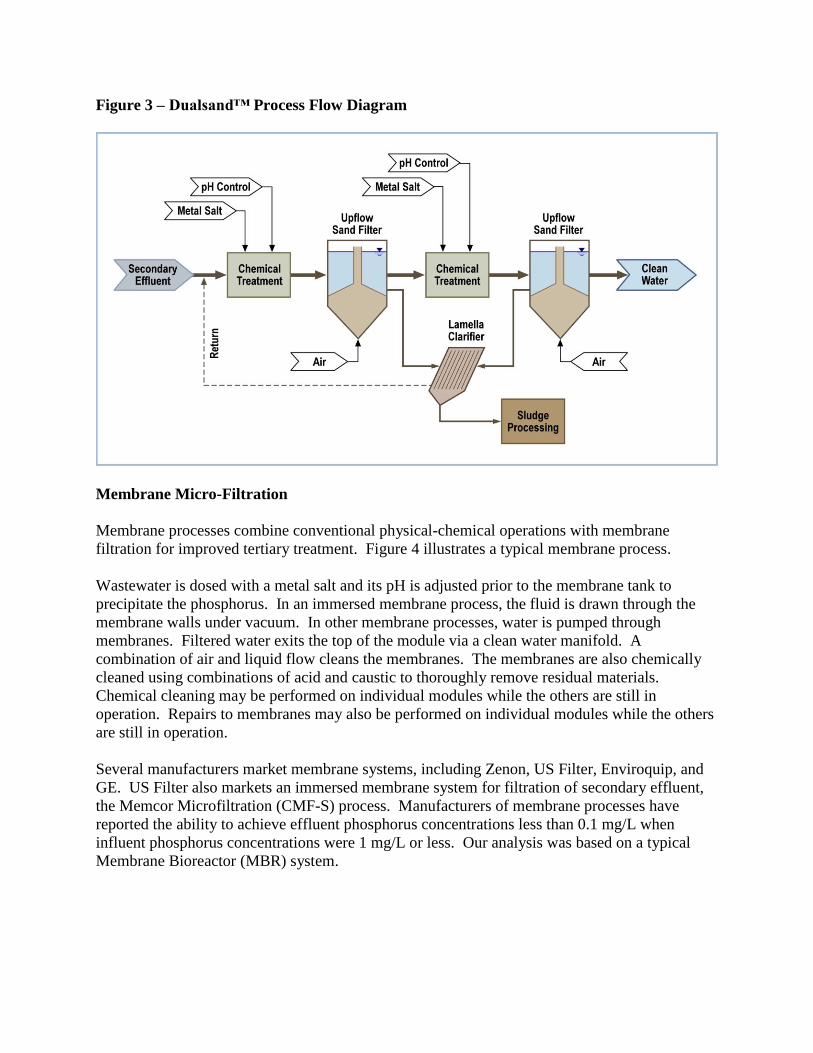
Figure 3 – Dualsand™ Process Flow Diagram
Membrane Micro-Filtration
Membrane processes combine conventional physical-chemical operations with membrane
filtration for improved tertiary treatment. Figure 4 illustrates a typical membrane process.
Wastewater is dosed with a metal salt and its pH is adjusted prior to the membrane tank to
precipitate the phosphorus. In an immersed membrane process, the fluid is drawn through the
membrane walls under vacuum. In other membrane processes, water is pumped through
membranes. Filtered water exits the top of the module via a clean water manifold. A
combination of air and liquid flow cleans the membranes. The membranes are also chemically
cleaned using combinations of acid and caustic to thoroughly remove residual materials.
Chemical cleaning may be performed on individual modules while the others are still in
operation. Repairs to membranes may also be performed on individual modules while the others
are still in operation.
Several manufacturers market membrane systems, including Zenon, US Filter, Enviroquip, and
GE. US Filter also markets an immersed membrane system for filtration of secondary effluent,
the Memcor Microfiltration (CMF-S) process. Manufacturers of membrane processes have
reported the ability to achieve effluent phosphorus concentrations less than 0.1 mg/L when
influent phosphorus concentrations were 1 mg/L or less. Our analysis was based on a typical
Membrane Bioreactor (MBR) system.
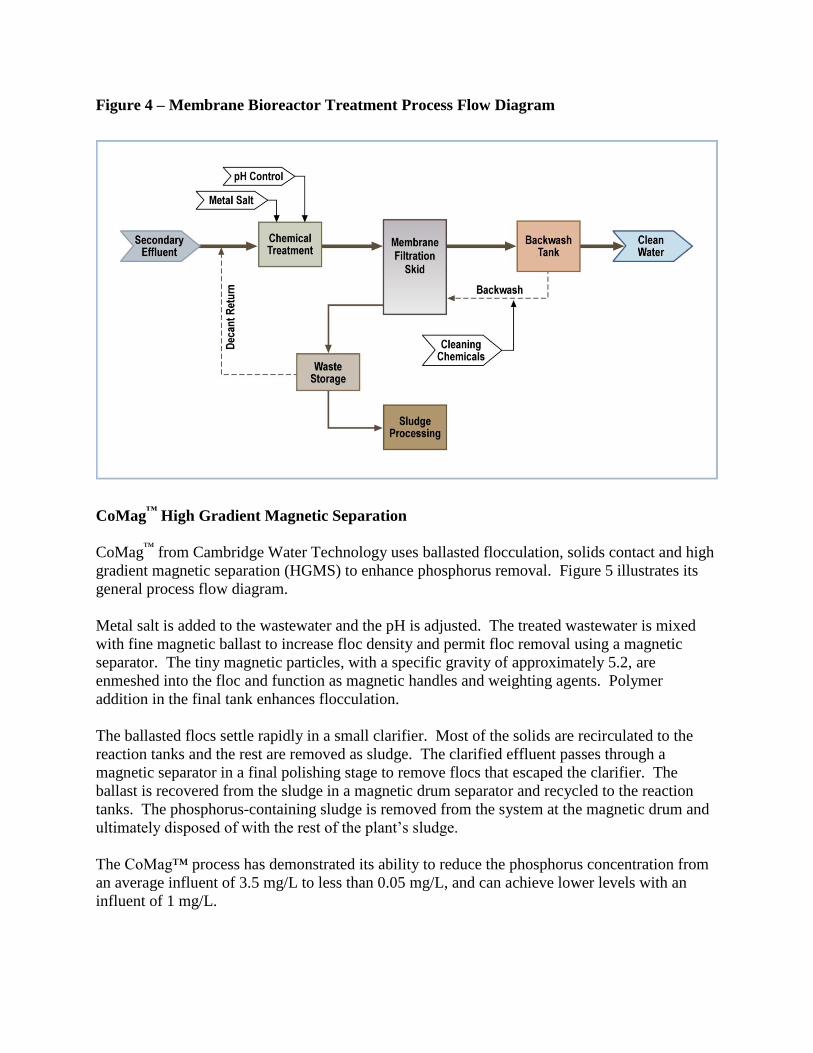
Figure 4 – Membrane Bioreactor Treatment Process Flow Diagram
CoMag™
High Gradient Magnetic Separation
CoMag™
from Cambridge Water Technology uses ballasted flocculation, solids contact and high
gradient magnetic separation (HGMS) to enhance phosphorus removal. Figure 5 illustrates its
general process flow diagram.
Metal salt is added to the wastewater and the pH is adjusted. The treated wastewater is mixed
with fine magnetic ballast to increase floc density and permit floc removal using a magnetic
separator. The tiny magnetic particles, with a specific gravity of approximately 5.2, are
enmeshed into the floc and function as magnetic handles and weighting agents. Polymer
addition in the final tank enhances flocculation.
The ballasted flocs settle rapidly in a small clarifier. Most of the solids are recirculated to the
reaction tanks and the rest are removed as sludge. The clarified effluent passes through a
magnetic separator in a final polishing stage to remove flocs that escaped the clarifier. The
ballast is recovered from the sludge in a magnetic drum separator and recycled to the reaction
tanks. The phosphorus-containing sludge is removed from the system at the magnetic drum and
ultimately disposed of with the rest of the plant’s sludge.
The CoMag™ process has demonstrated its ability to reduce the phosphorus concentration from
an average influent of 3.5 mg/L to less than 0.05 mg/L, and can achieve lower levels with an
influent of 1 mg/L.
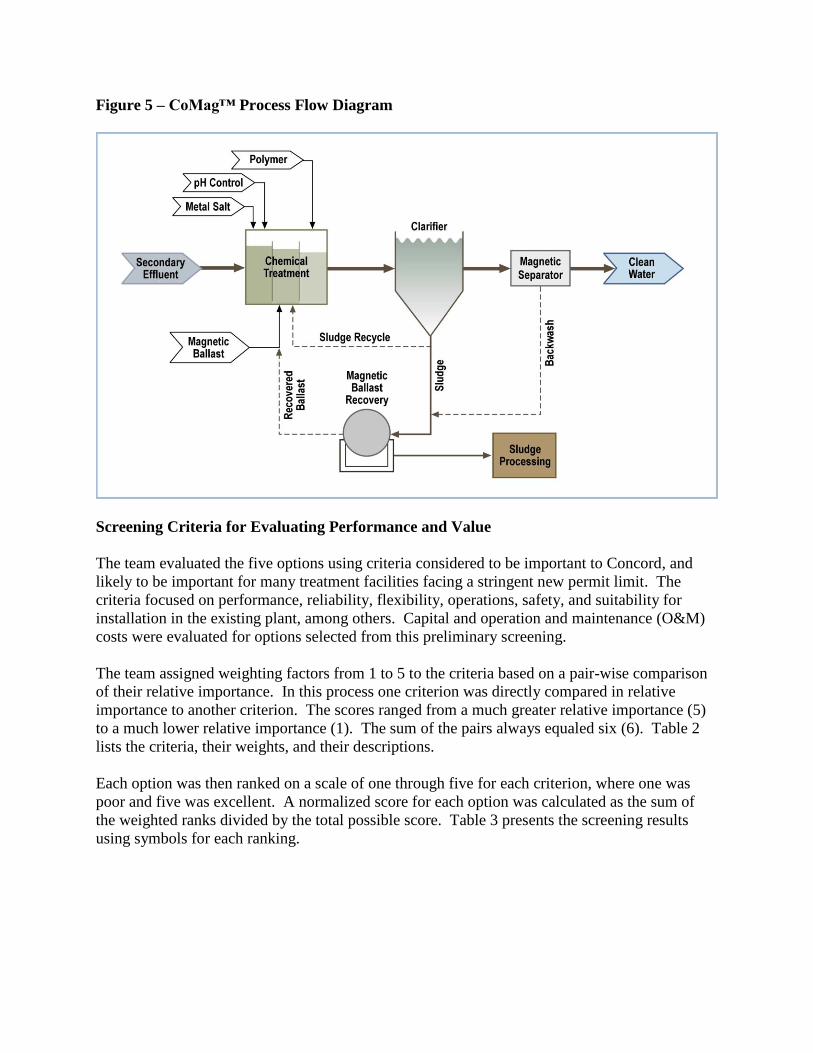
Figure 5 – CoMag™ Process Flow Diagram
Screening Criteria for Evaluating Performance and Value
The team evaluated the five options using criteria considered to be important to Concord, and
likely to be important for many treatment facilities facing a stringent new permit limit. The
criteria focused on performance, reliability, flexibility, operations, safety, and suitability for
installation in the existing plant, among others. Capital and operation and maintenance (O&M)
costs were evaluated for options selected from this preliminary screening.
The team assigned weighting factors from 1 to 5 to the criteria based on a pair-wise comparison
of their relative importance. In this process one criterion was directly compared in relative
importance to another criterion. The scores ranged from a much greater relative importance (5)
to a much lower relative importance (1). The sum of the pairs always equaled six (6). Table 2
lists the criteria, their weights, and their descriptions.
Each option was then ranked on a scale of one through five for each criterion, where one was
poor and five was excellent. A normalized score for each option was calculated as the sum of
the weighted ranks divided by the total possible score. Table 3 presents the screening results
using symbols for each ranking.
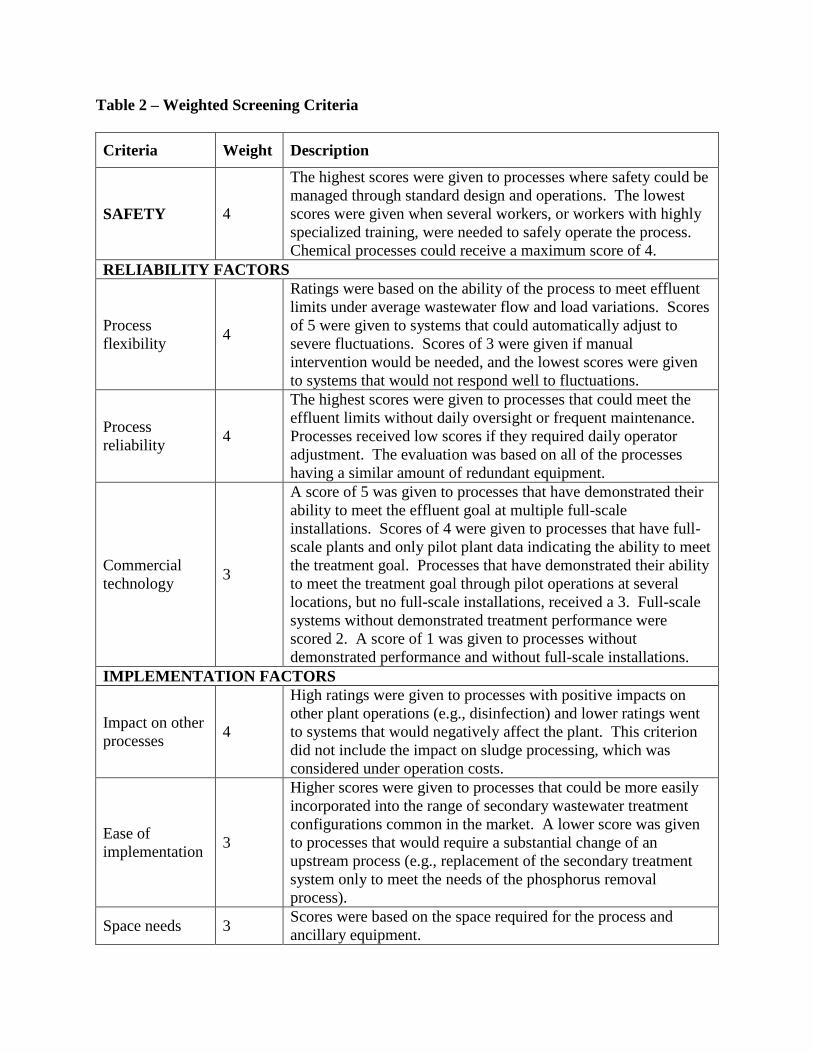
Table 2 – Weighted Screening Criteria
Criteria Weight Description
SAFETY 4
The highest scores were given to processes where safety could be
managed through standard design and operations. The lowest
scores were given when several workers, or workers with highly
specialized training, were needed to safely operate the process.
Chemical processes could receive a maximum score of 4.
RELIABILITY FACTORS
Process
flexibility 4
Ratings were based on the ability of the process to meet effluent
limits under average wastewater flow and load variations. Scores
of 5 were given to systems that could automatically adjust to
severe fluctuations. Scores of 3 were given if manual
intervention would be needed, and the lowest scores were given
to systems that would not respond well to fluctuations.
Process
reliability 4
The highest scores were given to processes that could meet the
effluent limits without daily oversight or frequent maintenance.
Processes received low scores if they required daily operator
adjustment. The evaluation was based on all of the processes
having a similar amount of redundant equipment.
Commercial
technology 3
A score of 5 was given to processes that have demonstrated their
ability to meet the effluent goal at multiple full-scale
installations. Scores of 4 were given to processes that have full-
scale plants and only pilot plant data indicating the ability to meet
the treatment goal. Processes that have demonstrated their ability
to meet the treatment goal through pilot operations at several
locations, but no full-scale installations, received a 3. Full-scale
systems without demonstrated treatment performance were
scored 2. A score of 1 was given to processes without
demonstrated performance and without full-scale installations.
IMPLEMENTATION FACTORS
Impact on other
processes 4
High ratings were given to processes with positive impacts on
other plant operations (e.g., disinfection) and lower ratings went
to systems that would negatively affect the plant. This criterion
did not include the impact on sludge processing, which was
considered under operation costs.
Ease of
implementation 3
Higher scores were given to processes that could be more easily
incorporated into the range of secondary wastewater treatment
configurations common in the market. A lower score was given
to processes that would require a substantial change of an
upstream process (e.g., replacement of the secondary treatment
system only to meet the needs of the phosphorus removal
process).
Space needs 3 Scores were based on the space required for the process and
ancillary equipment.
Criteria Weight Description
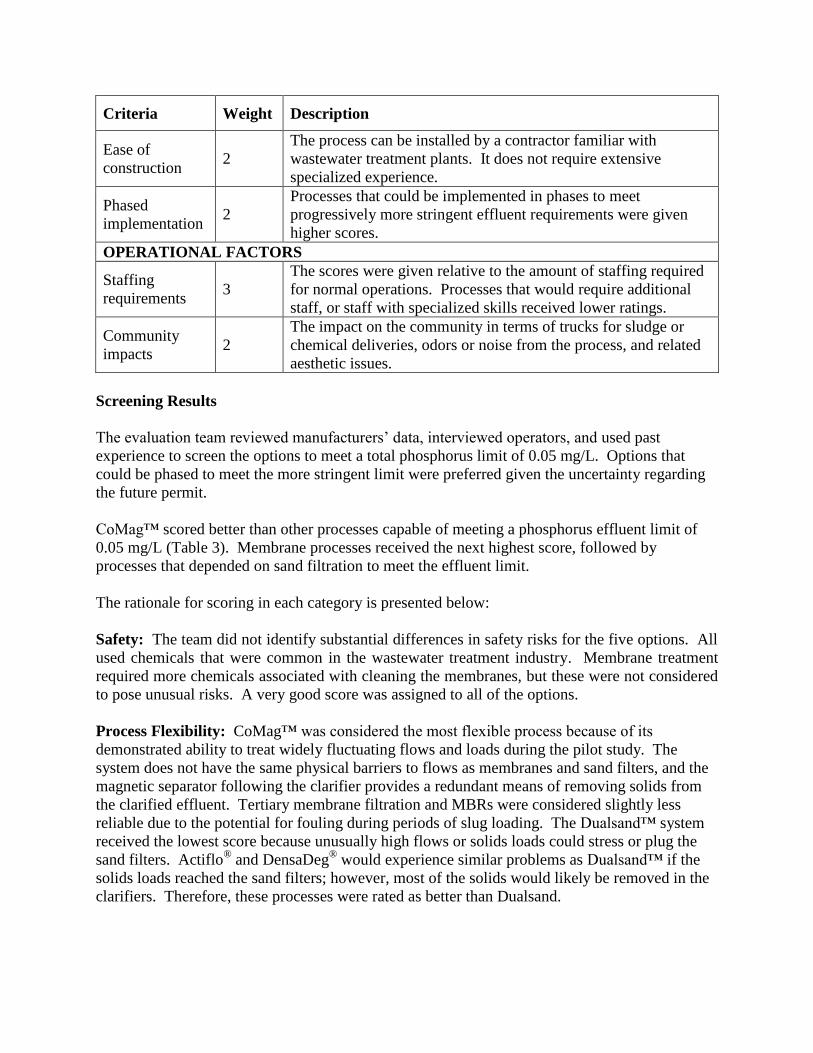
Ease of
construction 2
The process can be installed by a contractor familiar with
wastewater treatment plants. It does not require extensive
specialized experience.
Phased
implementation 2
Processes that could be implemented in phases to meet
progressively more stringent effluent requirements were given
higher scores.
OPERATIONAL FACTORS
Staffing
requirements 3
The scores were given relative to the amount of staffing required
for normal operations. Processes that would require additional
staff, or staff with specialized skills received lower ratings.
Community
impacts 2
The impact on the community in terms of trucks for sludge or
chemical deliveries, odors or noise from the process, and related
aesthetic issues.
Screening Results
The evaluation team reviewed manufacturers’ data, interviewed operators, and used past
experience to screen the options to meet a total phosphorus limit of 0.05 mg/L. Options that
could be phased to meet the more stringent limit were preferred given the uncertainty regarding
the future permit.
CoMag™ scored better than other processes capable of meeting a phosphorus effluent limit of
0.05 mg/L (Table 3). Membrane processes received the next highest score, followed by
processes that depended on sand filtration to meet the effluent limit.
The rationale for scoring in each category is presented below:
Safety: The team did not identify substantial differences in safety risks for the five options. All
used chemicals that were common in the wastewater treatment industry. Membrane treatment
required more chemicals associated with cleaning the membranes, but these were not considered
to pose unusual risks. A very good score was assigned to all of the options.
Process Flexibility: CoMag™ was considered the most flexible process because of its
demonstrated ability to treat widely fluctuating flows and loads during the pilot study. The
system does not have the same physical barriers to flows as membranes and sand filters, and the
magnetic separator following the clarifier provides a redundant means of removing solids from
the clarified effluent. Tertiary membrane filtration and MBRs were considered slightly less
reliable due to the potential for fouling during periods of slug loading. The Dualsand™ system
received the lowest score because unusually high flows or solids loads could stress or plug the
sand filters. Actiflo® and DensaDeg
® would experience similar problems as Dualsand™ if the
solids loads reached the sand filters; however, most of the solids would likely be removed in the
clarifiers. Therefore, these processes were rated as better than Dualsand.
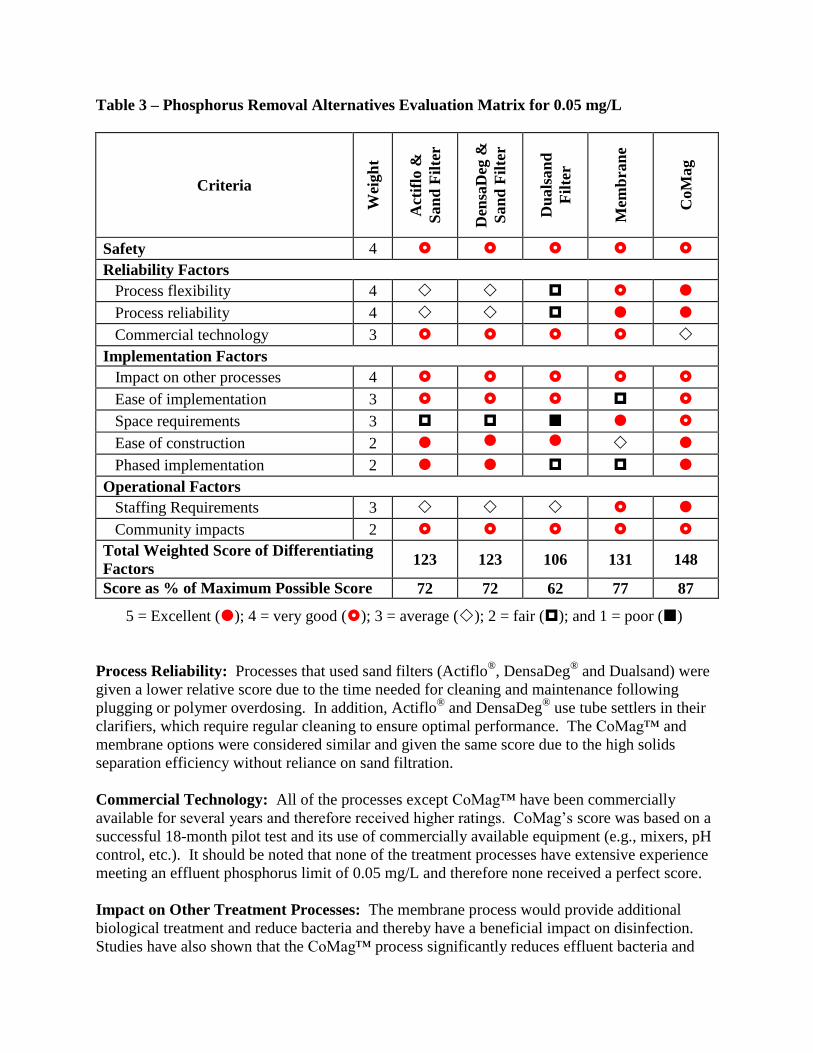
Table 3 – Phosphorus Removal Alternatives Evaluation Matrix for 0.05 mg/L
Criteria
Wei
gh
t
Act
iflo
&
San
d F
ilte
r
Den
saD
eg &
San
d F
ilte
r
Du
als
an
d
Fil
ter
Mem
bra
ne
CoM
ag
Safety 4
Reliability Factors
Process flexibility 4
Process reliability 4
Commercial technology 3
Implementation Factors
Impact on other processes 4
Ease of implementation 3
Space requirements 3
Ease of construction 2
Phased implementation 2
Operational Factors
Staffing Requirements 3
Community impacts 2
Total Weighted Score of Differentiating
Factors 123 123 106 131 148
Score as % of Maximum Possible Score 72 72 62 77 87
5 = Excellent (); 4 = very good (); 3 = average (); 2 = fair (); and 1 = poor ()
Process Reliability: Processes that used sand filters (Actiflo®, DensaDeg
® and Dualsand) were
given a lower relative score due to the time needed for cleaning and maintenance following
plugging or polymer overdosing. In addition, Actiflo®
and DensaDeg® use tube settlers in their
clarifiers, which require regular cleaning to ensure optimal performance. The CoMag™ and
membrane options were considered similar and given the same score due to the high solids
separation efficiency without reliance on sand filtration.
Commercial Technology: All of the processes except CoMag™ have been commercially
available for several years and therefore received higher ratings. CoMag’s score was based on a
successful 18-month pilot test and its use of commercially available equipment (e.g., mixers, pH
control, etc.). It should be noted that none of the treatment processes have extensive experience
meeting an effluent phosphorus limit of 0.05 mg/L and therefore none received a perfect score.
Impact on Other Treatment Processes: The membrane process would provide additional
biological treatment and reduce bacteria and thereby have a beneficial impact on disinfection.
Studies have also shown that the CoMag™ process significantly reduces effluent bacteria and
further reduces BOD. In fact, the designers determined the full scale UV disinfection system
could be smaller due to the high quality of CoMag’s effluent.
Data were not available to confirm the bacterial reduction capability of other tertiary clarification
processes (e.g., Actiflo®). However, they were expected to perform similarly due to the removal
of suspended solids.
Ease of Implementation: All of the options except for membrane treatment were considered
easy to implement with the existing secondary treatment process. The MBR was considered to
be the most difficult option because it would require construction of more tankage and the
decommissioning or demolition of the existing trickling filters.
Space Requirements: The MBR option was given the highest relative score because the system
might be able to be installed within the footprint of the existing trickling filters. The CoMag™
system was scored a 4 because it did not use sand filters, which require large amounts of space.
The space requirements for the sand filters used in the other processes led to lower scores.
Ease of Construction: All of the processes were considered equally easy to construct except for
the MBR process. Construction phasing would be more complex if the MBR were installed in
the existing trickling filters. Because the MBR received a higher “space” score, it received a
corresponding lower construction score.
Phased Implementation: Actiflo®, DensaDeg
®, and CoMag™ could be implemented in phases
to meet progressively more stringent phosphorus limits. This would not be an option for
Dualsand™ or a membrane process.
Staffing Requirements: The daily staffing requirements to operate the CoMag™ process would
be less than the other options due to the relative simplicity of the process and was therefore given
a score of 5. The MBR was assigned a 4 because of the membrane cleaning. The other
processes were scored a 3 because of the maintenance associated with sand filters and cleaning
tube settlers.
Community Impacts: All of the processes were considered to have similar impacts on the
community and all received a score of 4.
CoMag™ and Membrane Treatment Selected for Further Evaluation
Both CoMag™ and membrane treatment scored well during the screening evaluation and were
selected for further review in the second phase. The MBR option outranked the other
alternatives in part because of its ability to enhance biological treatment. Assessments conducted
early in the facility planning process raised concerns that the existing trickling filters might be
unable to handle future BOD loads. An MBR was particularly attractive because it could address
both phosphorus and BOD. Subsequent work found that the trickling filters would provide
adequate treatment for anticipated future loads. As a consequence, the Team elected to evaluate
tertiary membrane filters instead of MBRs because they were expected to be less expensive than
MBR treatment and easier to construct.
Cost Comparison Favored CoMag™
The team developed conceptual designs and cost opinions for CoMag™ and membrane filtration
(based on a Memcor system). The construction costs included building space for housing the
equipment, bonding and other related costs. The construction costs for membrane process were
estimated to be approximately 1.5 times the CoMag™ costs and the O&M costs were estimated
to be 1.3 times higher. The team recommended full scale implementation of the CoMag™
process.
COMAG™ DEMONSTRATION PLANT PERFORMANCE
Concord helped support an 18-month trial of the CoMag™ process, which provided important
design information for the full scale system. This trial began before the screening evaluation and
continued until construction of the full scale system started.
The demonstration plant operated at flows from 160 m3/day to 550 m
3/day (30 to 100 gpm) and
treated secondary effluent with and without alum addition to the secondary clarifiers. Tests were
performed with ferric sulfate and aluminum sulfate. Key findings during the trials are
summarized below.
Aluminum Sulfate Selected Over Ferric Sulfate
Both alum and ferric sulfate effectively removed phosphorus. Alum was preferred for Concord
because its operating pH (around 6.2) was higher than that for ferric sulfate (around 5.5) and
within the plant permit limit for pH. In addition, there was less risk of staining with alum,
which was a concern for the UV disinfection system.
Multi-point Alum Addition Superior to Single-point Addition
Alum addition to both the secondary clarifier and the CoMag™ process (so-called multi-point
addition) used less alum overall than trying to achieve the same effluent phosphorus
concentration adding alum at a single point, the CoMag™ system.
During the 2003 phosphorus season, Concord added approximately 110 ppmv of alum to the
secondary clarifier. This reduced the phosphorus concentration in the CoMag™ influent to
approximately 0.6 mg/L. An additional dose of 55 ppmv added to the CoMag process
consistently produced an effluent phosphorus concentration of 0.05 mg/L or less. The combined
alum dose was 165 ppmv.
Similar performance was achieved when a dose of 205 ppmv alum was added to CoMag™ and
no alum was added to the secondary clarifier. Multi-point addition reduced the overall alum
demand by approximately 20 percent.
Multi-Point Addition Reduces Effluent Total Phosphorus to Less than 0.05 mg/L
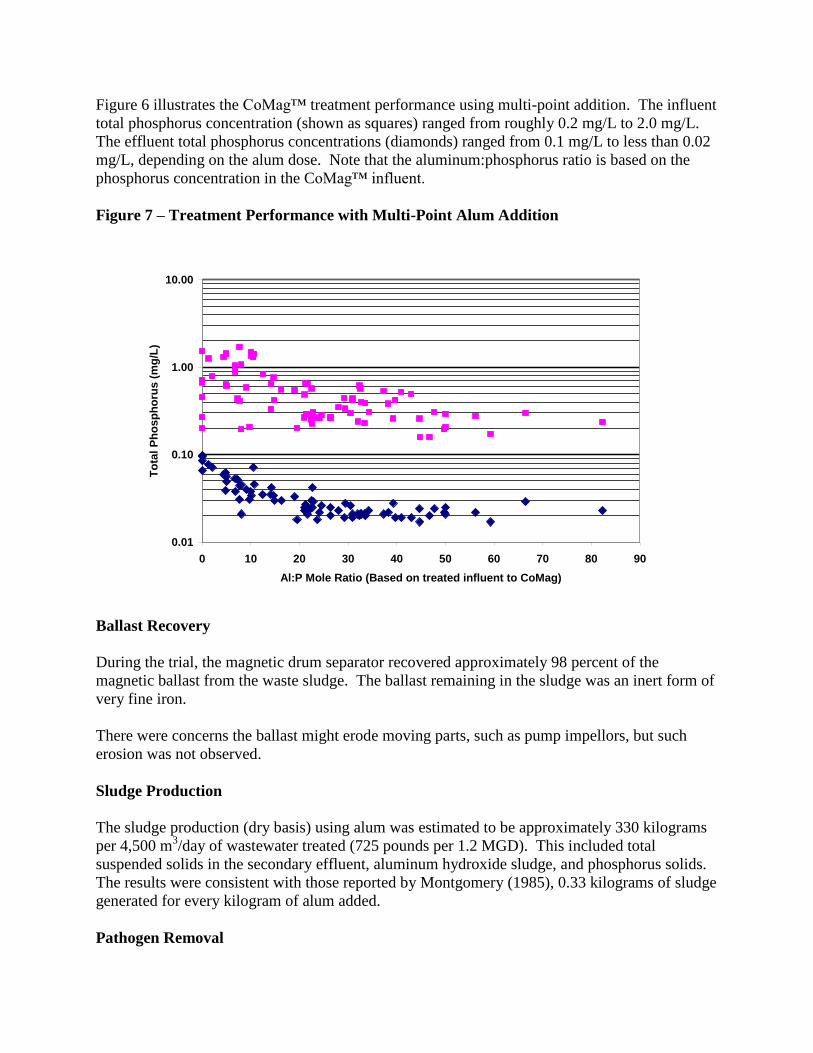
Figure 6 illustrates the CoMag™ treatment performance using multi-point addition. The influent
total phosphorus concentration (shown as squares) ranged from roughly 0.2 mg/L to 2.0 mg/L.
The effluent total phosphorus concentrations (diamonds) ranged from 0.1 mg/L to less than 0.02
mg/L, depending on the alum dose. Note that the aluminum:phosphorus ratio is based on the
phosphorus concentration in the CoMag™ influent.
Figure 7 – Treatment Performance with Multi-Point Alum Addition
0.01
0.10
1.00
10.00
0 10 20 30 40 50 60 70 80 90
Al:P Mole Ratio (Based on treated influent to CoMag)
To
tal
Ph
os
ph
oru
s (
mg
/L)
Ballast Recovery
During the trial, the magnetic drum separator recovered approximately 98 percent of the
magnetic ballast from the waste sludge. The ballast remaining in the sludge was an inert form of
very fine iron.
There were concerns the ballast might erode moving parts, such as pump impellors, but such
erosion was not observed.
Sludge Production
The sludge production (dry basis) using alum was estimated to be approximately 330 kilograms
per 4,500 m3/day of wastewater treated (725 pounds per 1.2 MGD). This included total
suspended solids in the secondary effluent, aluminum hydroxide sludge, and phosphorus solids.
The results were consistent with those reported by Montgomery (1985), 0.33 kilograms of sludge
generated for every kilogram of alum added.
Pathogen Removal
CoMag™ removed 98 percent of the fecal coliforms on average. On 39 days, the influent and
effluent fecal coliform concentrations were measured. The influent averaged 44,000 colonies per
100 milliliters and the effluent average 860 colonies per 100 milliliters. This represented a 2-log
removal of coliforms.
The process also improved the UV transmission (UVT), where UVT measures the amount of
energy absorbing material in the water. A higher UVT translates to a smaller UV system. The
UVT of unfiltered secondary effluent averaged 64 percent and ranged from 60 to 67 percent.
The UVT of the CoMag™ effluent averaged 75 percent and ranged from 73 to 78 percent. There
was little difference between unfiltered and filtered samples of CoMag™ effluent.
CONCORD FULL SCALE COMAG™ SYSTEM
Following a competitive bid process, Concord selected CoMag™ for its full scale treatment
system. The plant is under construction and expected to start operations in late 2007 or early
2008. The CoMag™ system is part of a larger facility upgrade that includes improvements to the
headworks, disinfection system, plant utilities, controls, and other processes. It should be noted
that after testing the CoMag™ effluent, the designers felt confident that a smaller and less
expensive UV disinfection system could be used due to the excellent water quality.
Full Scale System Description
Secondary effluent is pumped to the CoMag™ process from the secondary clarifiers. The
influent flow is measured and used to control coagulant addition and other processes. Alum is
mixed with the wastewater using inline static mixers and caustic is added to adjust the pH.
The treated wastewater flows to two baffled mixed reaction tanks for coagulation, ballast
addition, and flocculation. Each of the stainless steel tanks is 2.3 meters (7.5 feet) wide by 4.5
meters (15 feet) long. The hydraulic residence time (HRT) in these tanks is short because the
fine ballast does not require the development of large well defined flocs, as would be necessary
for conventional coagulation.
The ballasted floc flows to two 3.6-meter (12-foot) square clarifiers that operate in parallel.
Though the clarifiers are small compared to conventional units, they are designed to meet permit
limits at maximum daily flow with one clarifier off-line. The clarifiers have steeply sloped
bottoms which eliminate the need for rakes and their associated drives.
Approximately 80 percent of the solids underflow is recirculated back to the ballast contact tank
to improve flocculation by increasing the mass of solids in contact with the phosphorus
precipitate. Snoeyink (1980) reported similar results for phosphorus removal processes that
included solids recycle.
The rest of the sludge is wasted from the system. A high shear mixer breaks up the floc particles
before the sludge passes over magnetic drum separators, which are mounted above the reaction
tanks. The magnetic ballast is returned to the reaction tanks and the waste sludge is discharged
to the Concord system for further processing.
Clarifier effluent passes through an in-line polishing magnetic separator (M-2) that captures
small floc particles that contain magnetite. The magnetic field is periodically turned off to
release the captured particles, which are then flushed to a sump and pumped back to the reaction
tanks.
Operating Costs
The team estimated operating costs for the full scale system based on the values listed below.
Sludge disposal accounts for approximately 80 percent of the annual costs.
The system would operate 365 days per year at average flow;
Labor rate of $39 per hour (includes the base salary, fringe benefits, and overhead);
Alum at $0.16 per liter;
Caustic at $0.41 per liter;
Polymer at $4.38 per liter;
Ballast at $220 per metric ton;
Power at $0.104 per kilowatt-hour;
Sludge disposal at $403 per dry metric ton (cost includes trucking and all fees);
Contingency of 25 percent.
Table 4 – Estimated Operating Costs for Concord System
Parameter Annual Costs in 2006
Labor $14,200
Treatment Chemicals $75,000
Electricity $16,600
Sludge disposal $460,000
Preventive maintenance $8,000
TOTAL $573,800
REFERENCES
Loehr, Raymond C., et al. (1979) Land Application of Wastes, Volume 1; Van Nostrand
Reinhold, New York.
Metcalf & Eddy (1991) Wastewater Engineering - Treatment, Disposal, and Reuse, 3rd
Ed.;
McGraw-Hill, Inc., New York.
Montgomery Consulting Engineers (1985) Water Treatment Principals and Design; John Wiley
& Sons, New York.
Shaikh, Ahamad M.H.; S.G. Dixit (1992) Removal of Phosphate from Waters by Precipitation
and High Gradient Magnetic Separation. Water Research, Vol. 26, No. 6, 845.
Snoeyink, Vernon L.; D. Jenkins (1980) Water Chemistry; John Wiley & Sons, New York.
Water Environment Federation (1998) Biological and Chemical Systems for Nutrient Removal;
Alexandria, VA