Embed Size (px)
Citation preview
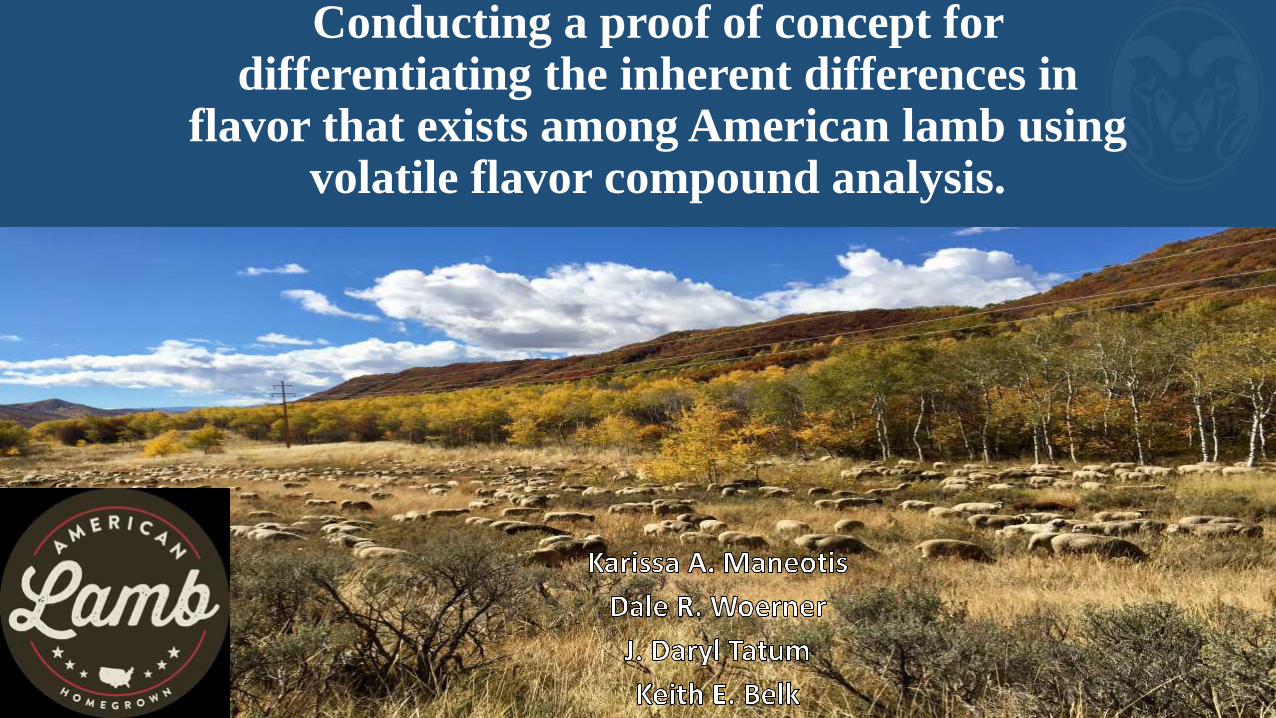
Conducting a proof of concept for differentiating the inherent differences in
flavor that exists among American lamb using volatile flavor compound analysis.
• Research in other countries has demonstrated that consumers differ in
their acceptance of various sheep-specific meat flavor notes
depending upon past eating experiences (Sanudo et al., 2000; Prescott
et al., 2001).
• Consumers who are accustomed to eating lamb or mutton with a
particular flavor profile seem to prefer ovine meat products with a
familiar flavor (Sanudo et al., 2000; Prescott et al., 2001).
• Consumers who seldom eat lamb or mutton tend to exhibit the
greatest aversion to sheep-specific meat flavor notes, sometimes
finding even mildly detectable levels of theses flavors unacceptable
(Prescott et al., 2001; Watkins et al., 2013).
• Lamb may be a growing protein (Gazdziak, 2015).
• Even with increased sales the average consumer is only consuming about 0.4 pounds of lamb a year.
• If we expect consumers to pay more for this specialty protein, consistency has to be a priority in order to continuously satisfy the consumer.
• The 2015 National Lamb Quality Audit identified eating satisfaction as the most prominent factor defining lamb quality.
defined eating satisfaction as flavor or taste of lamb.
of the purchasers of US lamb indicated they are willing to pay a premium for guaranteed eating satisfaction.
• Additionally, they are willing to pay a premium for this guarantee (Hoffman, 2015).
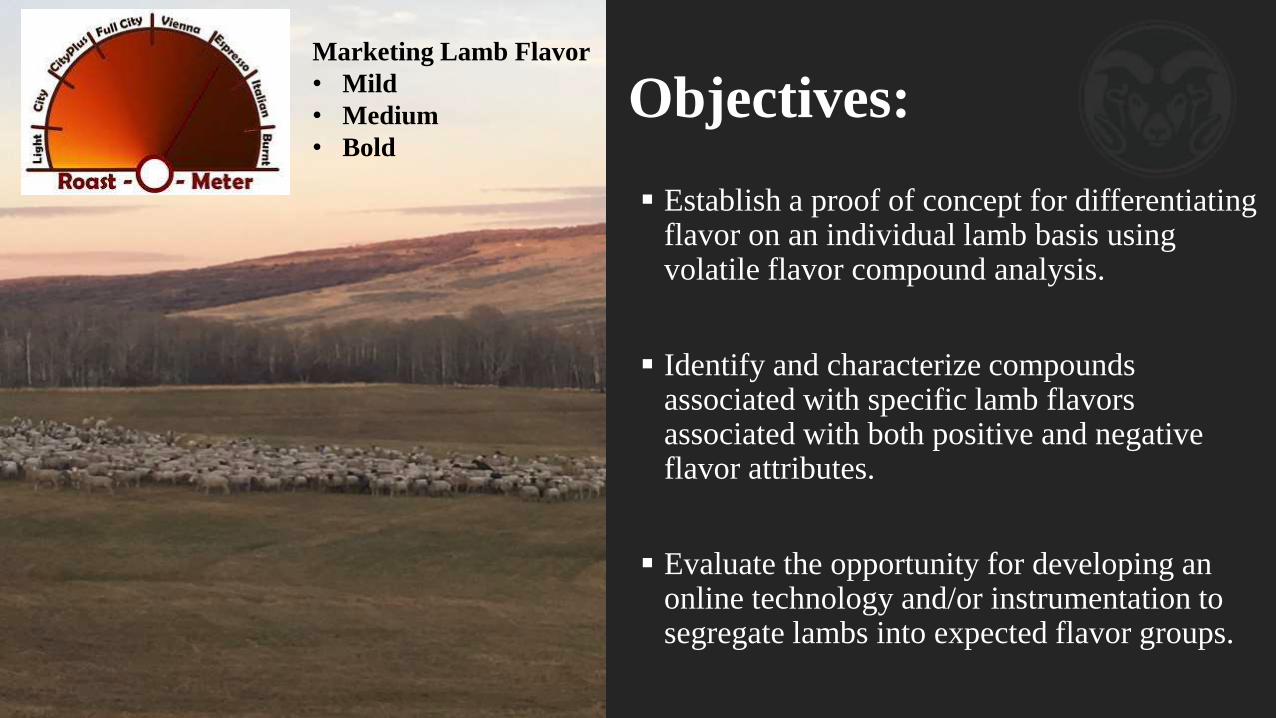
Objectives:
Establish a proof of concept for differentiating flavor on an individual lamb basis using volatile flavor compound analysis.
Identify and characterize compounds associated with specific lamb flavors associated with both positive and negative flavor attributes.
Evaluate the opportunity for developing an online technology and/or instrumentation to segregate lambs into expected flavor groups.
Marketing Lamb Flavor
• Mild
• Medium
• Bold
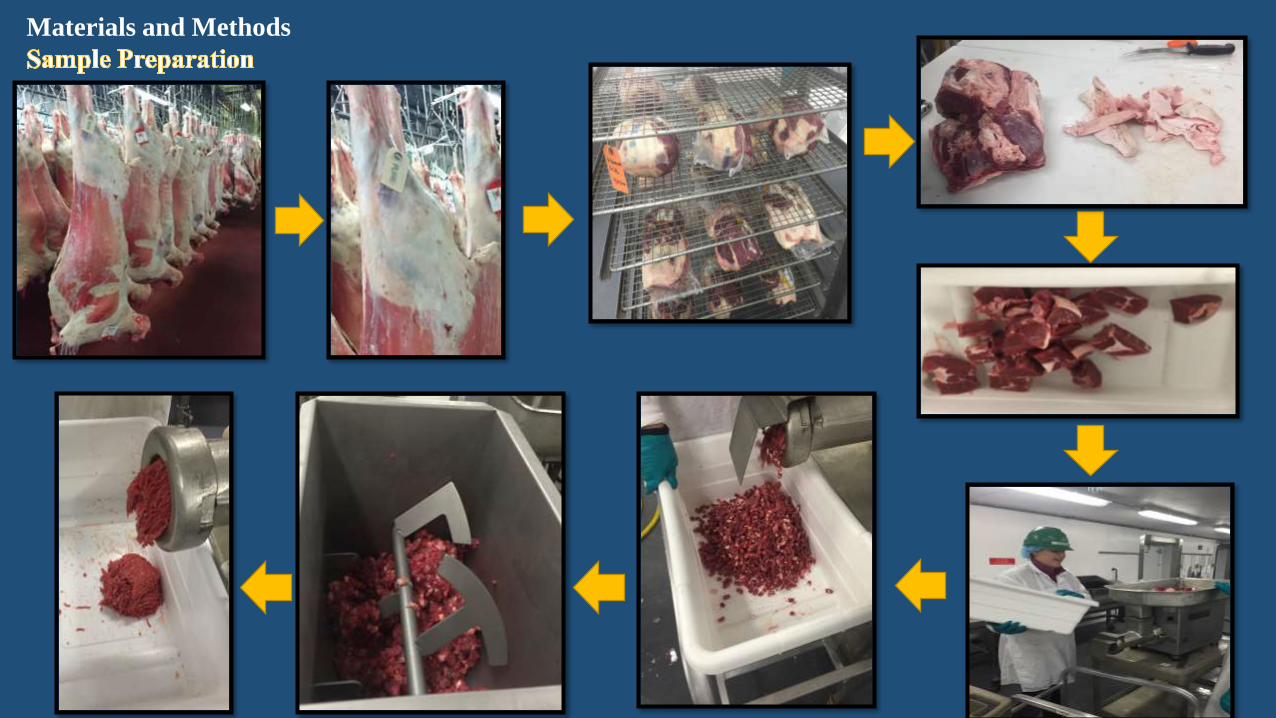
Materials and Methods
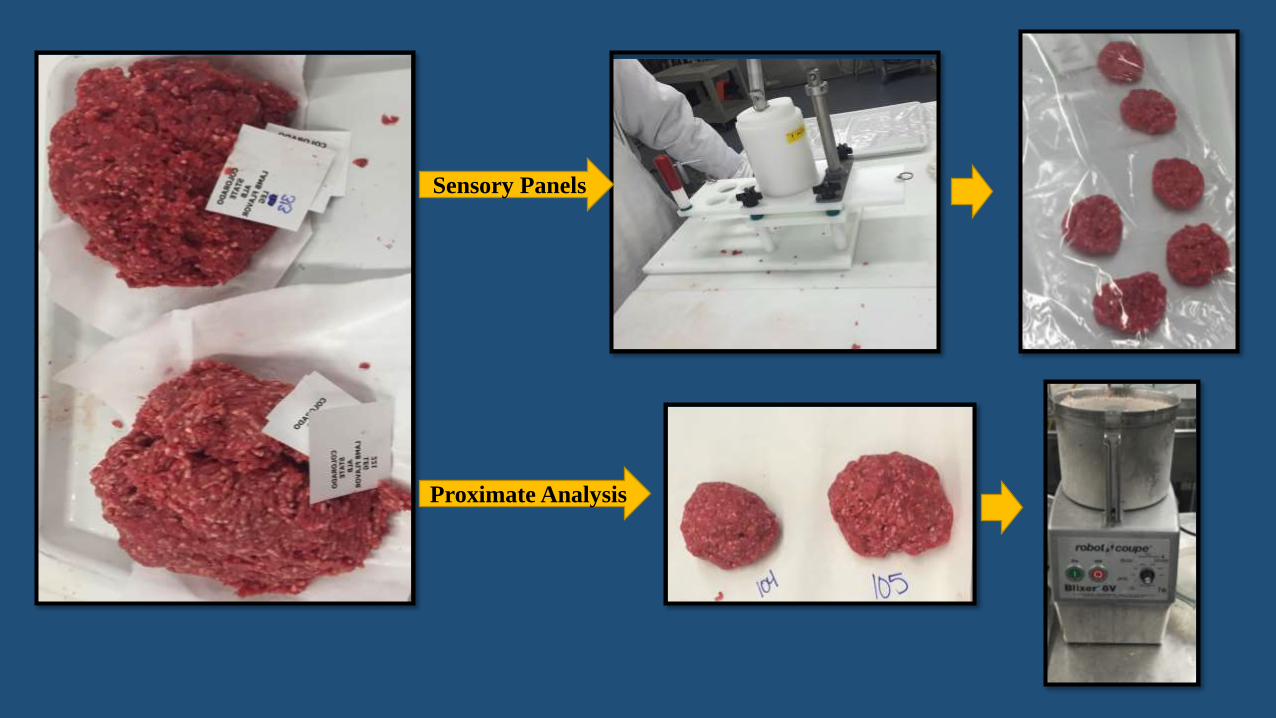
Sensory Panels
Proximate Analysis
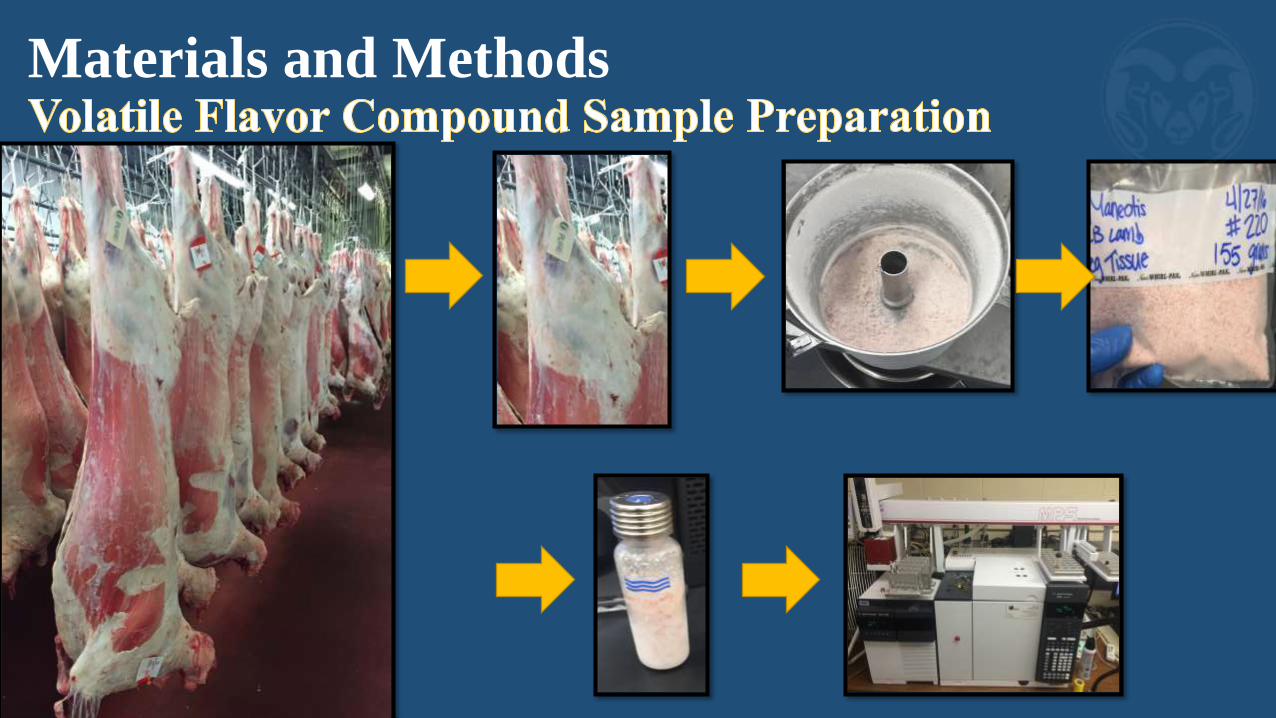
Materials and Methods
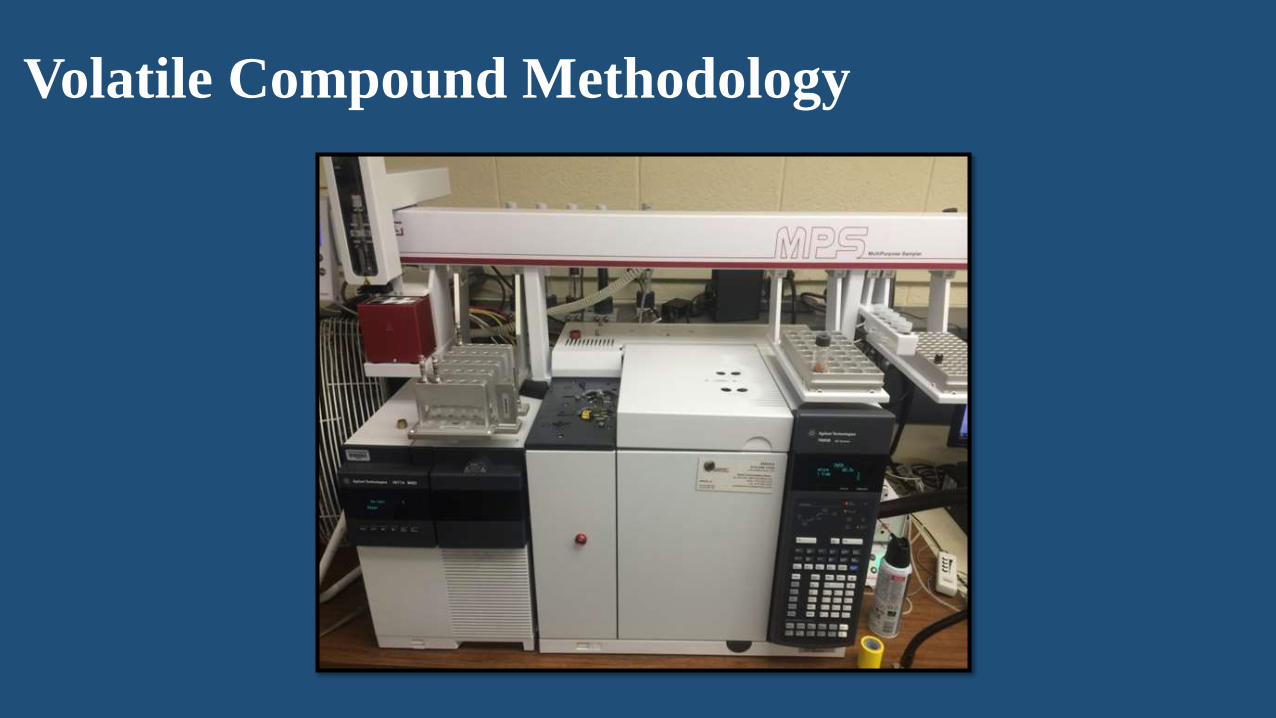
Volatile Compound Methodology
Materials and Methods
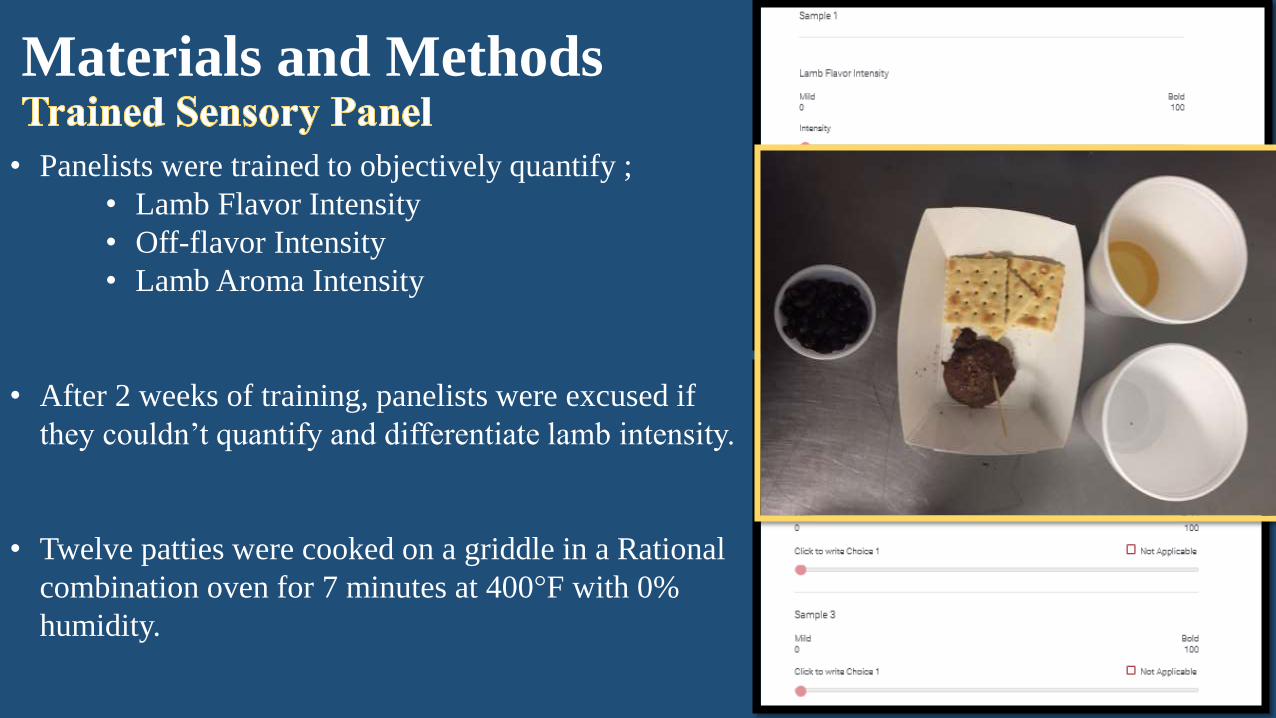
• Panelists were trained to objectively quantify ;
• Lamb Flavor Intensity
• Off-flavor Intensity
• Lamb Aroma Intensity
• After 2 weeks of training, panelists were excused if
they couldn’t quantify and differentiate lamb intensity.
• Twelve patties were cooked on a griddle in a Rational
combination oven for 7 minutes at 400°F with 0%
humidity.
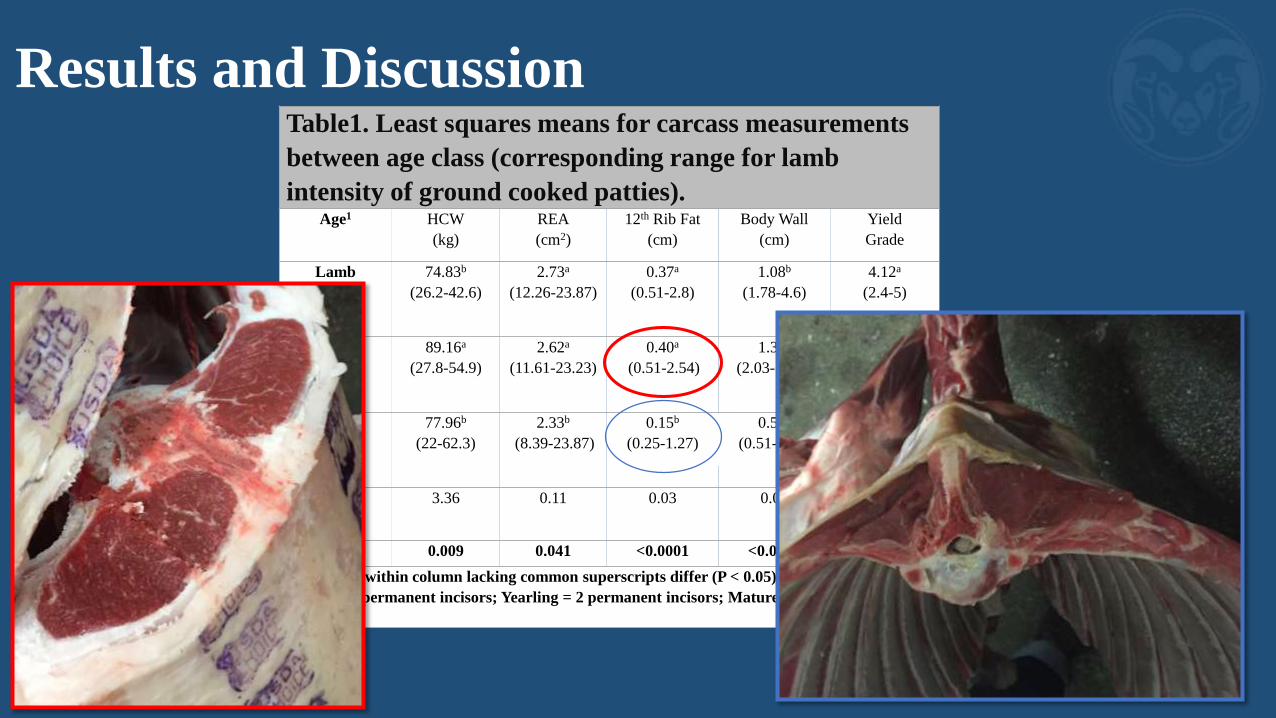
Results and DiscussionTable1. Least squares means for carcass measurements
between age class (corresponding range for lamb
intensity of ground cooked patties).Age1 HCW
(kg)
REA
(cm2)
12th Rib Fat
(cm)
Body Wall
(cm)
Yield
Grade
Lamb 74.83b
(26.2-42.6)
2.73a
(12.26-23.87)
0.37a
(0.51-2.8)
1.08b
(1.78-4.6)
4.12a
(2.4-5)
Yearling 89.16a
(27.8-54.9)
2.62a
(11.61-23.23)
0.40a
(0.51-2.54)
1.38a
(2.03- 5.08)
4.36a
(2.4-5)
Mature 77.96b
(22-62.3)
2.33b
(8.39-23.87)
0.15b
(0.25-1.27)
0.51c
(0.51-2.54)
1.92b
(1.4-3)
SEM 3.36 0.11 0.03 0.05 0.33
P-value 0.009 0.041 <0.0001 <0.0001 0.0003
a, b, c Means within column lacking common superscripts differ (P < 0.05).1 Lamb= o permanent incisors; Yearling = 2 permanent incisors; Mature = 2+ permanent
incisors.
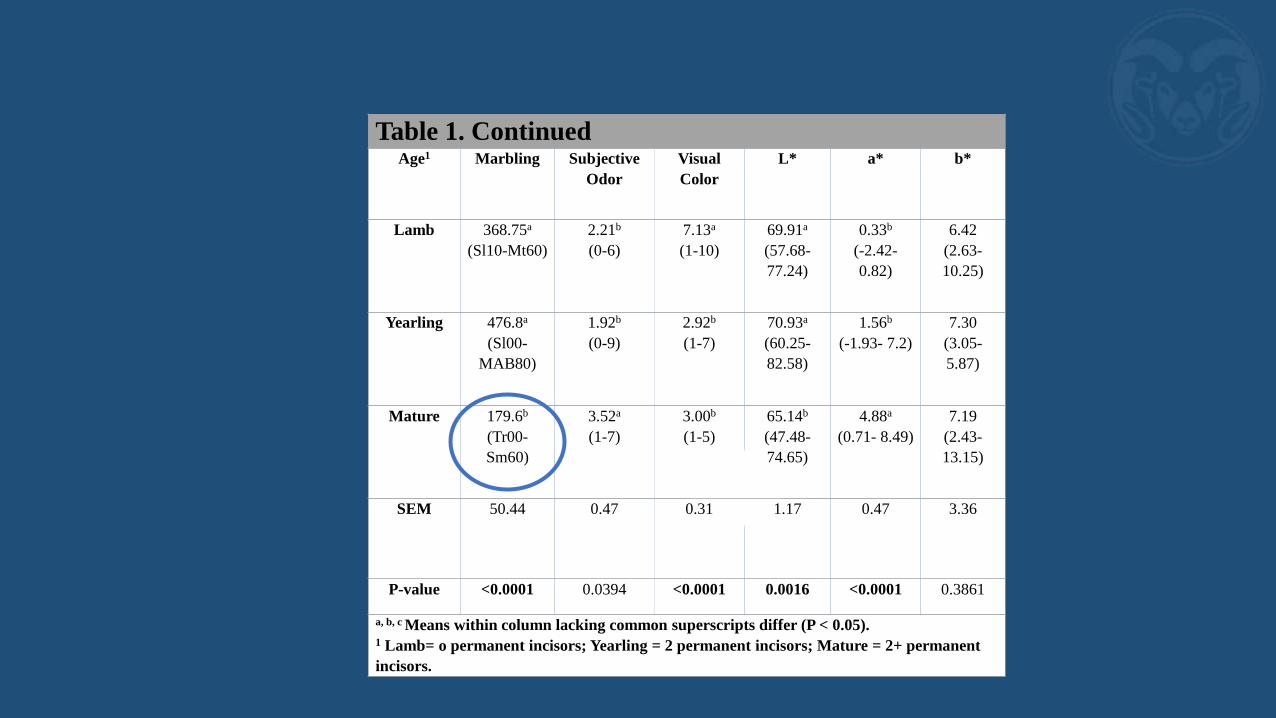
Table 1. ContinuedAge1 Marbling Subjective
Odor
Visual
Color
L* a* b*
Lamb 368.75a
(Sl10-Mt60)
2.21b
(0-6)
7.13a
(1-10)
69.91a
(57.68-
77.24)
0.33b
(-2.42-
0.82)
6.42
(2.63-
10.25)
Yearling 476.8a
(Sl00-
MAB80)
1.92b
(0-9)
2.92b
(1-7)
70.93a
(60.25-
82.58)
1.56b
(-1.93- 7.2)
7.30
(3.05-
5.87)
Mature 179.6b
(Tr00-
Sm60)
3.52a
(1-7)
3.00b
(1-5)
65.14b
(47.48-
74.65)
4.88a
(0.71- 8.49)
7.19
(2.43-
13.15)
SEM 50.44 0.47 0.31 1.17 0.47 3.36
P-value <0.0001 0.0394 <0.0001 0.0016 <0.0001 0.3861
a, b, c Means within column lacking common superscripts differ (P < 0.05).1 Lamb= o permanent incisors; Yearling = 2 permanent incisors; Mature = 2+ permanent
incisors.
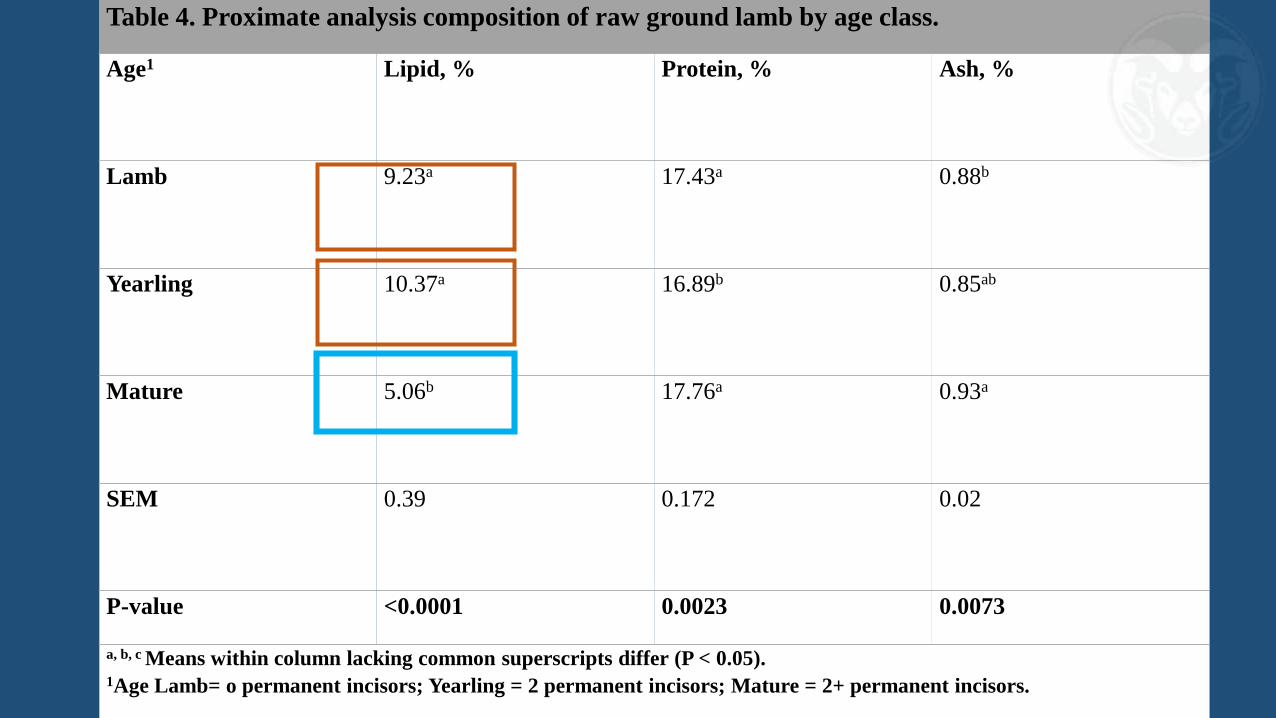
Table 4. Proximate analysis composition of raw ground lamb by age class.
Age1 Lipid, % Protein, % Ash, %
Lamb 9.23a 17.43a 0.88b
Yearling 10.37a 16.89b 0.85ab
Mature 5.06b 17.76a 0.93a
SEM 0.39 0.172 0.02
P-value <0.0001 0.0023 0.0073
a, b, c Means within column lacking common superscripts differ (P < 0.05).1Age Lamb= o permanent incisors; Yearling = 2 permanent incisors; Mature = 2+ permanent incisors.
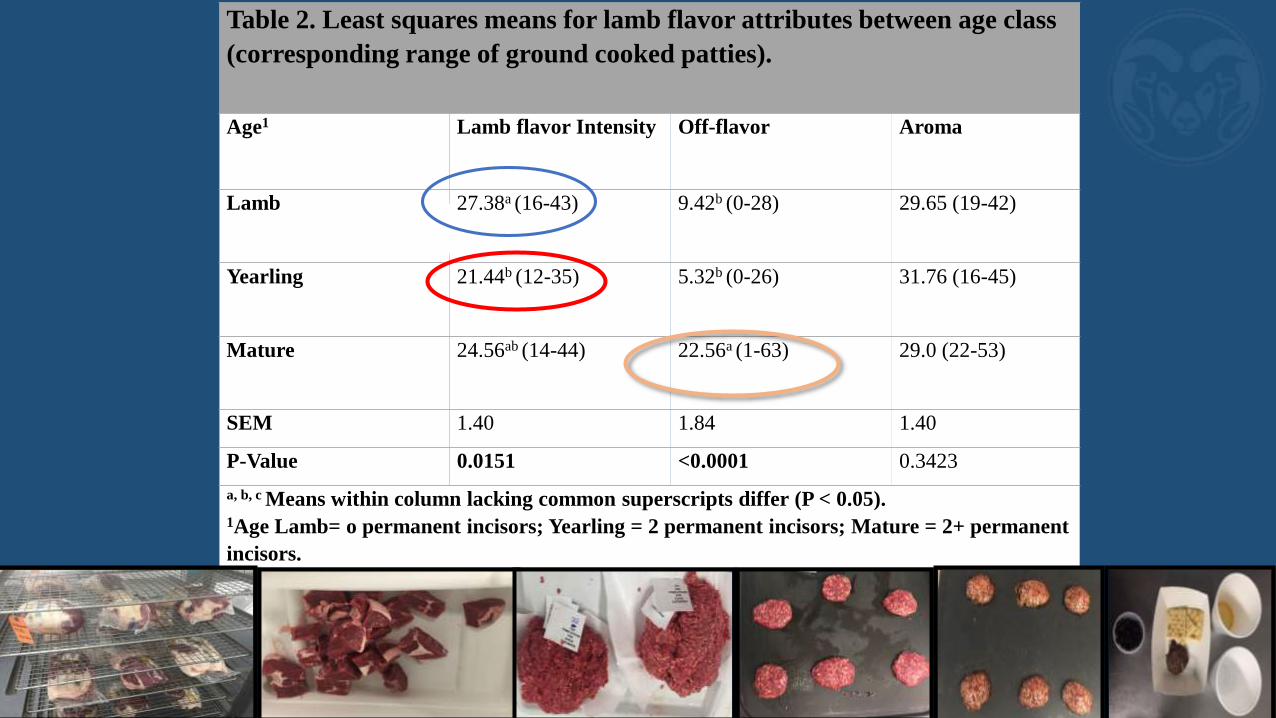
Table 2. Least squares means for lamb flavor attributes between age class
(corresponding range of ground cooked patties).
Age1 Lamb flavor Intensity Off-flavor Aroma
Lamb 27.38a (16-43) 9.42b (0-28) 29.65 (19-42)
Yearling 21.44b (12-35) 5.32b (0-26) 31.76 (16-45)
Mature 24.56ab (14-44) 22.56a (1-63) 29.0 (22-53)
SEM 1.40 1.84 1.40
P-Value 0.0151 <0.0001 0.3423
a, b, c Means within column lacking common superscripts differ (P < 0.05).1Age Lamb= o permanent incisors; Yearling = 2 permanent incisors; Mature = 2+ permanent
incisors.
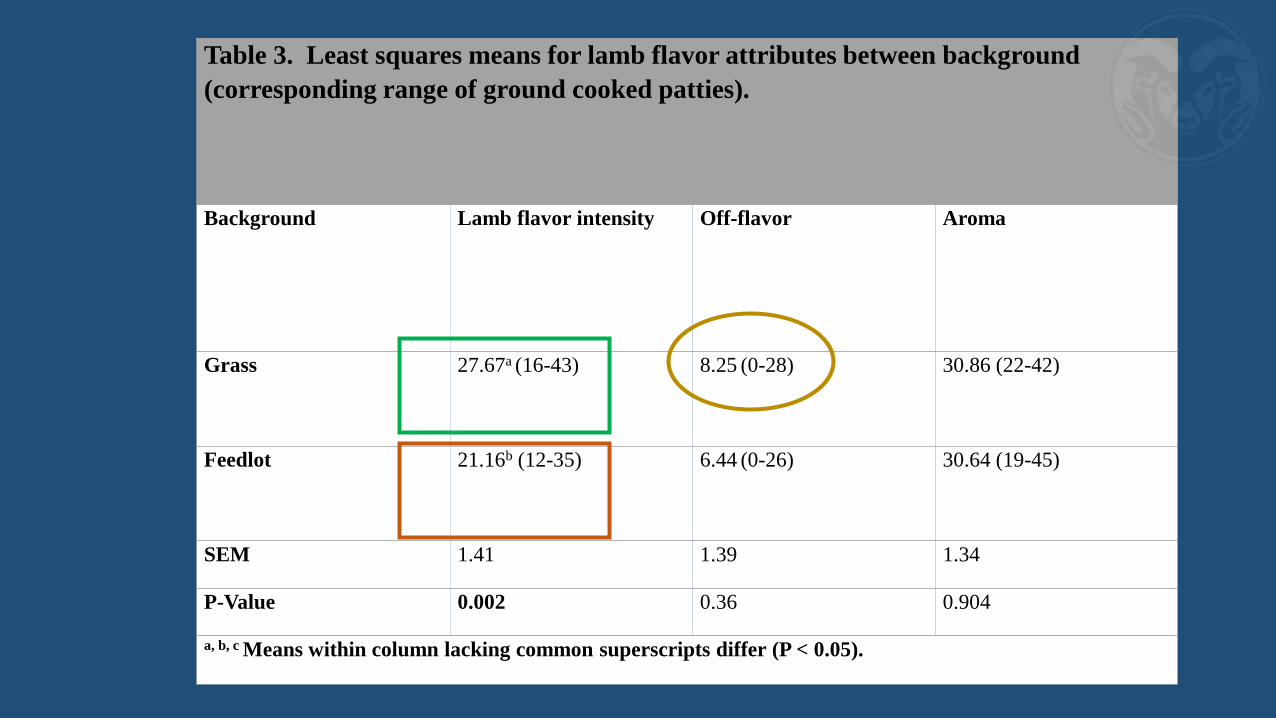
Table 3. Least squares means for lamb flavor attributes between background
(corresponding range of ground cooked patties).
Background Lamb flavor intensity Off-flavor Aroma
Grass 27.67a (16-43) 8.25 (0-28) 30.86 (22-42)
Feedlot 21.16b (12-35) 6.44 (0-26) 30.64 (19-45)
SEM 1.41 1.39 1.34
P-Value 0.002 0.36 0.904
a, b, c Means within column lacking common superscripts differ (P < 0.05).
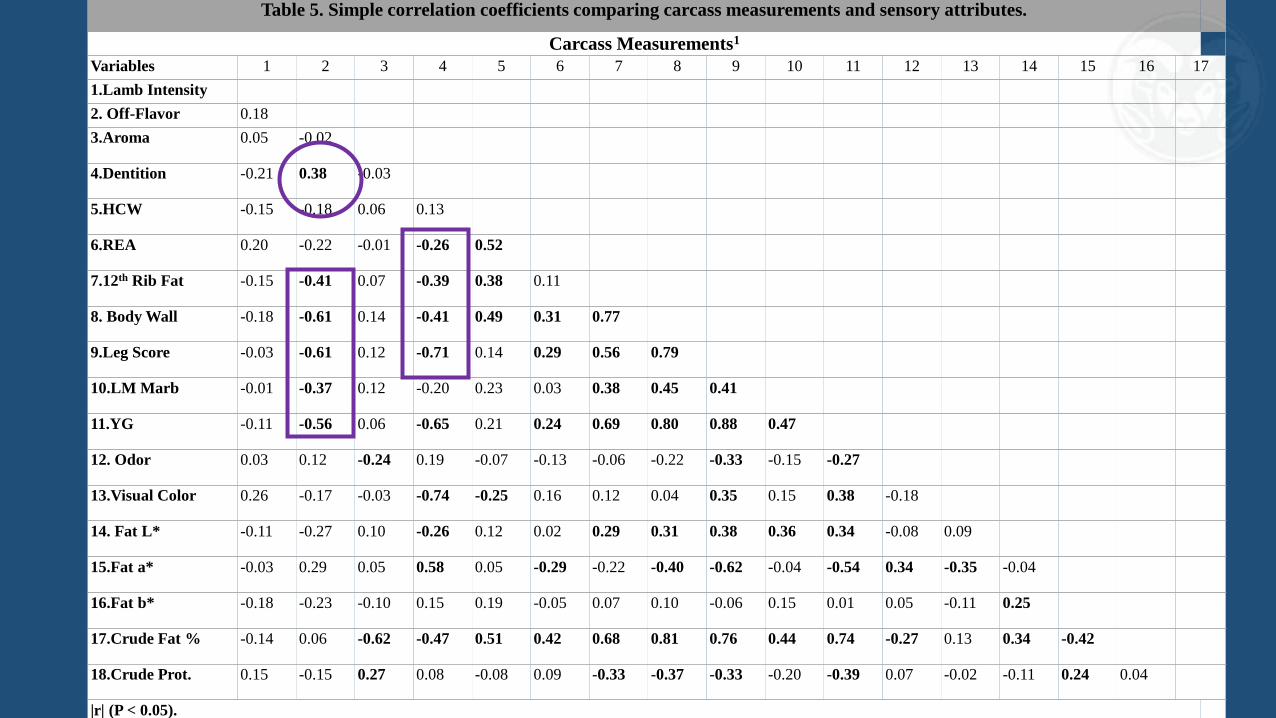
Table 5. Simple correlation coefficients comparing carcass measurements and sensory attributes.
Carcass Measurements1
Variables 1 2 3 4 5 6 7 8 9 10 11 12 13 14 15 16 17
1.Lamb Intensity
2. Off-Flavor 0.18
3.Aroma 0.05 -0.02
4.Dentition -0.21 0.38 -0.03
5.HCW -0.15 -0.18 0.06 0.13
6.REA 0.20 -0.22 -0.01 -0.26 0.52
7.12th Rib Fat -0.15 -0.41 0.07 -0.39 0.38 0.11
8. Body Wall -0.18 -0.61 0.14 -0.41 0.49 0.31 0.77
9.Leg Score -0.03 -0.61 0.12 -0.71 0.14 0.29 0.56 0.79
10.LM Marb -0.01 -0.37 0.12 -0.20 0.23 0.03 0.38 0.45 0.41
11.YG -0.11 -0.56 0.06 -0.65 0.21 0.24 0.69 0.80 0.88 0.47
12. Odor 0.03 0.12 -0.24 0.19 -0.07 -0.13 -0.06 -0.22 -0.33 -0.15 -0.27
13.Visual Color 0.26 -0.17 -0.03 -0.74 -0.25 0.16 0.12 0.04 0.35 0.15 0.38 -0.18
14. Fat L* -0.11 -0.27 0.10 -0.26 0.12 0.02 0.29 0.31 0.38 0.36 0.34 -0.08 0.09
15.Fat a* -0.03 0.29 0.05 0.58 0.05 -0.29 -0.22 -0.40 -0.62 -0.04 -0.54 0.34 -0.35 -0.04
16.Fat b* -0.18 -0.23 -0.10 0.15 0.19 -0.05 0.07 0.10 -0.06 0.15 0.01 0.05 -0.11 0.25
17.Crude Fat % -0.14 0.06 -0.62 -0.47 0.51 0.42 0.68 0.81 0.76 0.44 0.74 -0.27 0.13 0.34 -0.42
18.Crude Prot. 0.15 -0.15 0.27 0.08 -0.08 0.09 -0.33 -0.37 -0.33 -0.20 -0.39 0.07 -0.02 -0.11 0.24 0.04
|r| (P < 0.05).
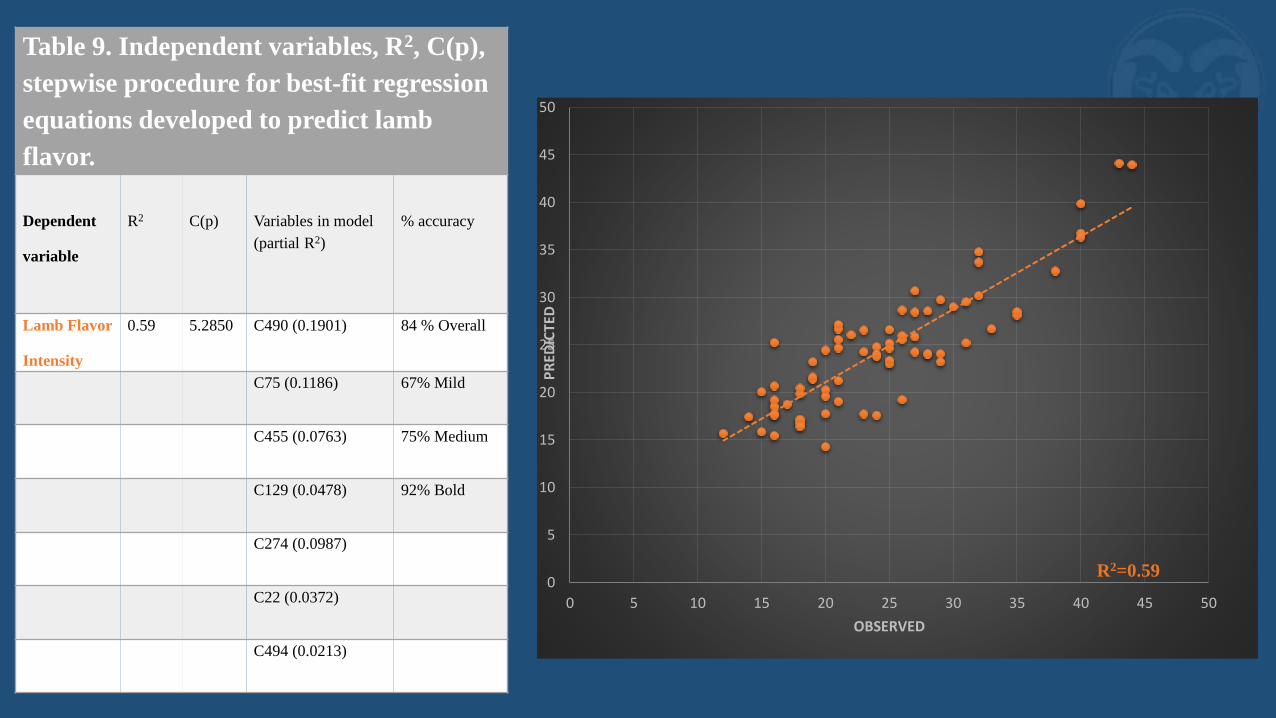
Table 9. Independent variables, R2, C(p),
stepwise procedure for best-fit regression
equations developed to predict lamb
flavor.
Dependent
variable
R2 C(p) Variables in model
(partial R2)
% accuracy
Lamb Flavor
Intensity
0.59 5.2850 C490 (0.1901) 84 % Overall
C75 (0.1186) 67% Mild
C455 (0.0763) 75% Medium
C129 (0.0478) 92% Bold
C274 (0.0987)
C22 (0.0372)
C494 (0.0213)
0
5
10
15
20
25
30
35
40
45
50
0 5 10 15 20 25 30 35 40 45 50
PRED
ICTED
OBSERVED
R2=0.59
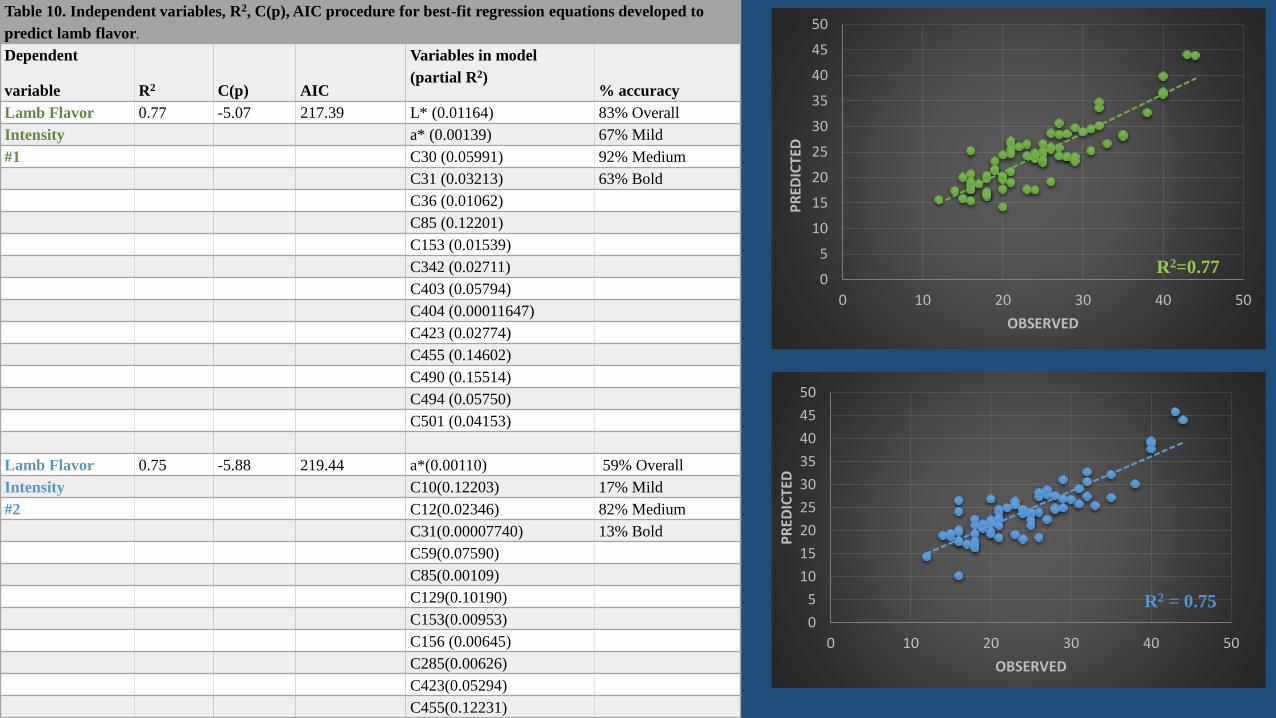
Table 10. Independent variables, R2, C(p), AIC procedure for best-fit regression equations developed to
predict lamb flavor.
Dependent
variable R2 C(p) AIC
Variables in model
(partial R2)% accuracy
Lamb Flavor 0.77 -5.07 217.39 L* (0.01164) 83% Overall
Intensity a* (0.00139) 67% Mild
#1 C30 (0.05991) 92% Medium
C31 (0.03213) 63% Bold
C36 (0.01062)
C85 (0.12201)
C153 (0.01539)
C342 (0.02711)
C403 (0.05794)
C404 (0.00011647)
C423 (0.02774)
C455 (0.14602)
C490 (0.15514)
C494 (0.05750)
C501 (0.04153)
Lamb Flavor 0.75 -5.88 219.44 a*(0.00110) 59% Overall
Intensity C10(0.12203) 17% Mild
#2 C12(0.02346) 82% Medium
C31(0.00007740) 13% Bold
C59(0.07590)
C85(0.00109)
C129(0.10190)
C153(0.00953)
C156 (0.00645)
C285(0.00626)
C423(0.05294)
C455(0.12231)
C490(0.17067)
0
5
10
15
20
25
30
35
40
45
50
0 10 20 30 40 50
PRED
ICTED
OBSERVED
R2=0.77
0
5
10
15
20
25
30
35
40
45
50
0 10 20 30 40 50
PRED
ICTED
OBSERVED
R2 = 0.75
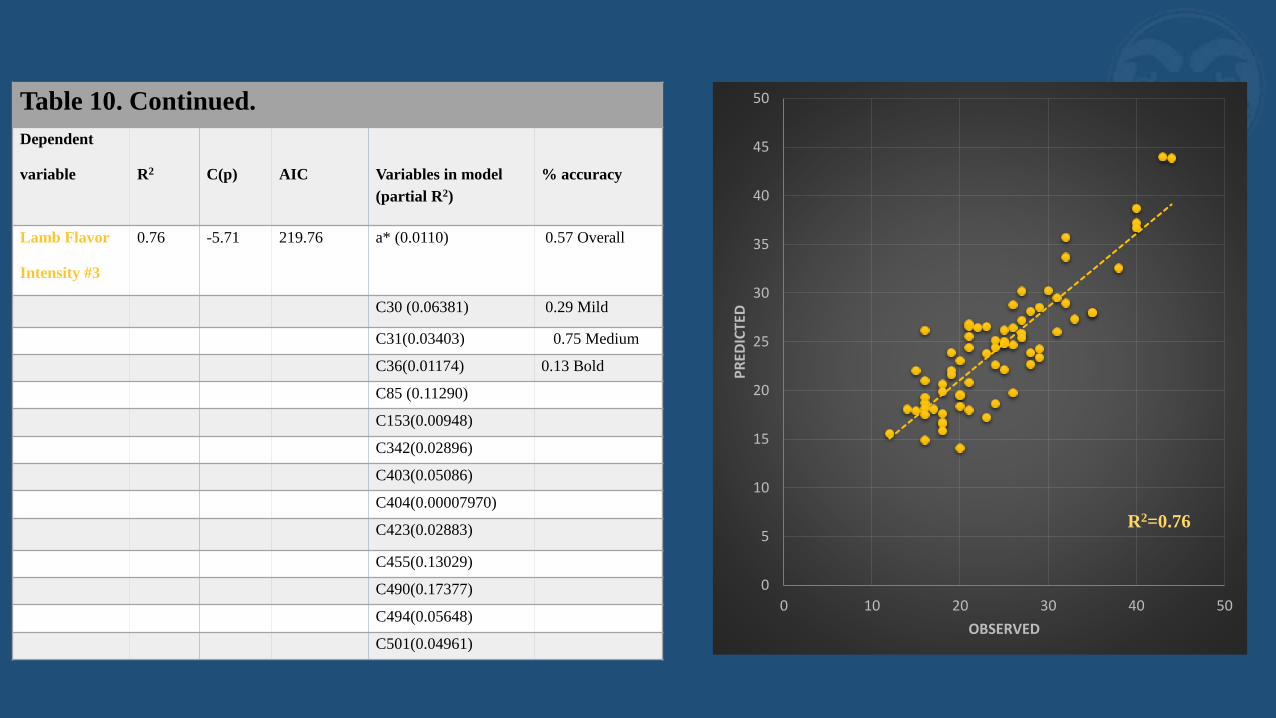
Table 10. Continued.
Dependent
variable R2 C(p) AIC Variables in model
(partial R2)
% accuracy
Lamb Flavor
Intensity #3
0.76 -5.71 219.76 a* (0.0110) 0.57 Overall
C30 (0.06381) 0.29 Mild
C31(0.03403) 0.75 Medium
C36(0.01174) 0.13 Bold
C85 (0.11290)
C153(0.00948)
C342(0.02896)
C403(0.05086)
C404(0.00007970)
C423(0.02883)
C455(0.13029)
C490(0.17377)
C494(0.05648)
C501(0.04961)
0
5
10
15
20
25
30
35
40
45
50
0 10 20 30 40 50
PRED
ICTED
OBSERVED
R2=0.76
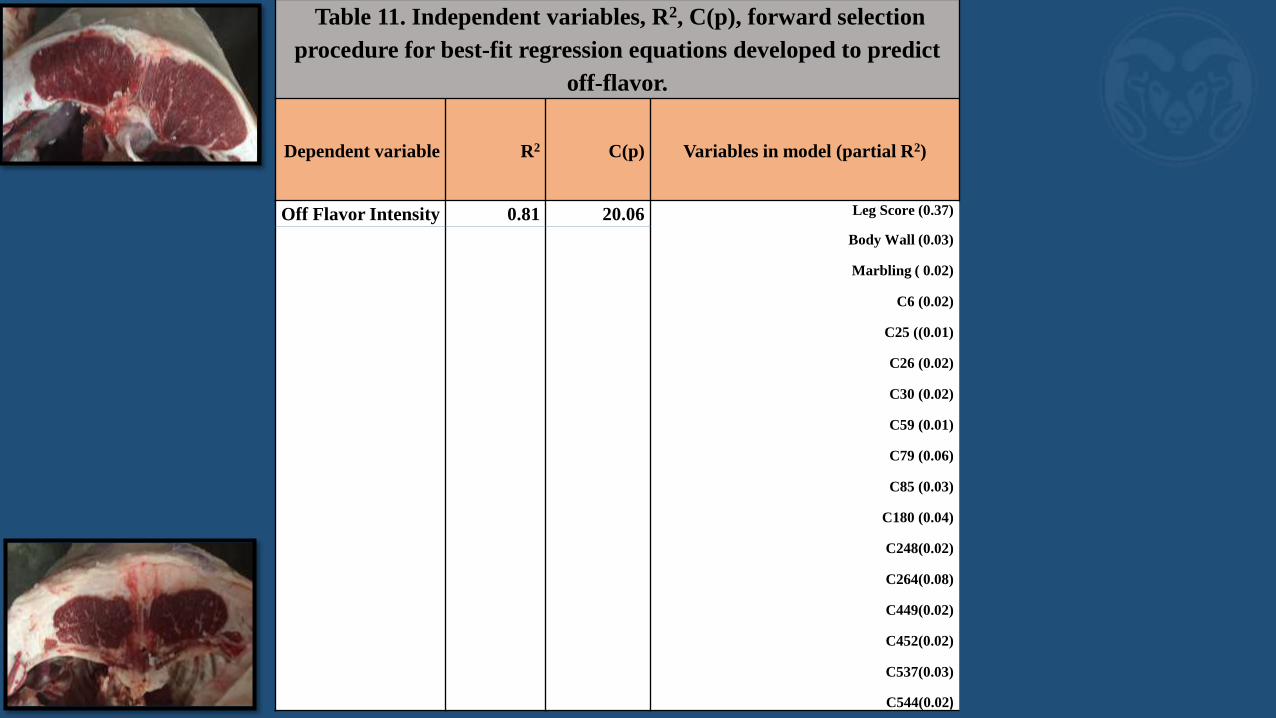
Table 11. Independent variables, R2, C(p), forward selection
procedure for best-fit regression equations developed to predict
off-flavor.
Dependent variable R2 C(p) Variables in model (partial R2)
Off Flavor Intensity 0.81 20.06 Leg Score (0.37)
Body Wall (0.03)
Marbling ( 0.02)
C6 (0.02)
C25 ((0.01)
C26 (0.02)
C30 (0.02)
C59 (0.01)
C79 (0.06)
C85 (0.03)
C180 (0.04)
C248(0.02)
C264(0.08)
C449(0.02)
C452(0.02)
C537(0.03)
C544(0.02)
Conclusions and Industry Implications
• A proof of concept was established for utilizing a tissue sample from the exterior of varying composition and flavor and GS-Ms technology to quantify differences in metabolites contributing to Lamb Flavor Intensity and Off-flavor Intensity.
• Further research is warranted to pursue instrument development for classifying individual carcasses on the basis of flavor.