Embed Size (px)
Citation preview
Office of Higher Education
Connecticut Higher Education
2013 Trends
Funding
Tuition & Fees
Student Financial Aid
Enrollment
March 2014
61 Woodland Street, Hartford, CT 06105-2326
860-947-1801
www.ctohe.org
2013 Connecticut Higher Education Trends
Funding 1-2
Tuition & Fees 3-15
Student Financial Aid 17-19
Enrollment 21-30
Table of Contents
i
This report, produced by the Division of Finance and Administration of the Office of Higher
Education, is an annual publication required by Public Act 12-10.
For questions, please contact Keith Norton or Scott Ciecko, Division of Finance and Administra-
tion, (860)947-1842.
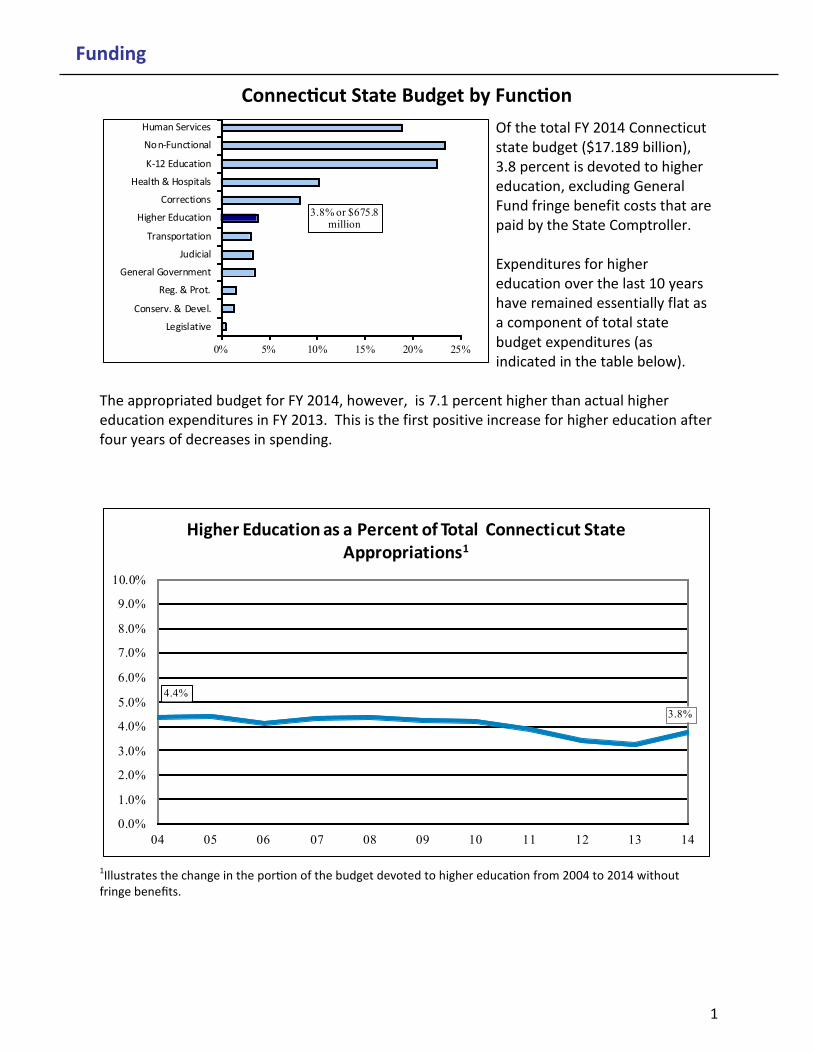
Of the total FY 2014 Connecticut state budget ($17.189 billion), 3.8 percent is devoted to higher education, excluding General Fund fringe benefit costs that are paid by the State Comptroller. Expenditures for higher education over the last 10 years have remained essentially flat as a component of total state budget expenditures (as indicated in the table below).
The appropriated budget for FY 2014, however, is 7.1 percent higher than actual higher education expenditures in FY 2013. This is the first positive increase for higher education after four years of decreases in spending.
Connecticut State Budget by Function
Funding
1Illustrates the change in the portion of the budget devoted to higher education from 2004 to 2014 without fringe benefits.
3.8% or $675.8 million
0% 5% 10% 15% 20% 25%
Legislative
Conserv. & Devel.
Reg. & Prot.
General Government
Judicial
Transportation
Higher Education
Corrections
Health & Hospitals
K-12 Education
Non-Functional
Human Services
4.4%
3.8%
0.0%
1.0%
2.0%
3.0%
4.0%
5.0%
6.0%
7.0%
8.0%
9.0%
10.0%
04 05 06 07 08 09 10 11 12 13 14
Higher Education as a Percent of Total Connecticut State Appropriations1
1
Funding
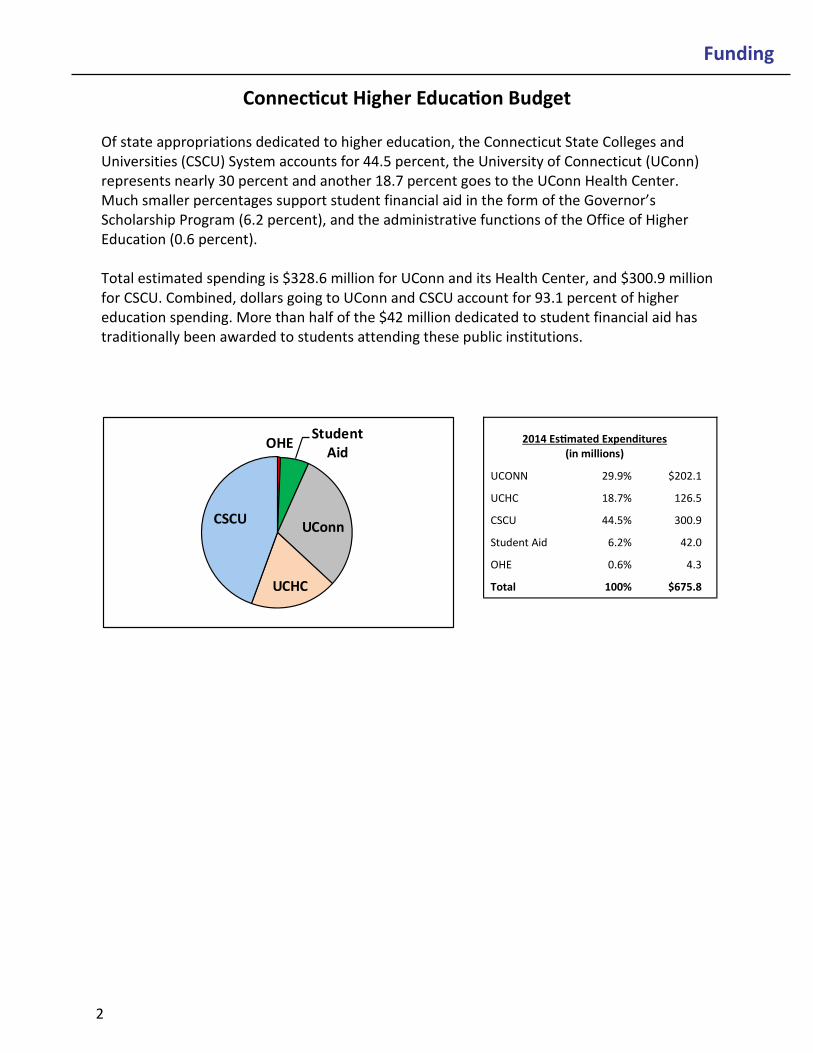
Connecticut Higher Education Budget
2014 Estimated Expenditures (in millions)
UCONN 29.9% $202.1
UCHC 18.7% 126.5
CSCU 44.5% 300.9
Student Aid 6.2% 42.0
OHE 0.6% 4.3
Total 100% $675.8
Of state appropriations dedicated to higher education, the Connecticut State Colleges and Universities (CSCU) System accounts for 44.5 percent, the University of Connecticut (UConn) represents nearly 30 percent and another 18.7 percent goes to the UConn Health Center. Much smaller percentages support student financial aid in the form of the Governor’s Scholarship Program (6.2 percent), and the administrative functions of the Office of Higher Education (0.6 percent). Total estimated spending is $328.6 million for UConn and its Health Center, and $300.9 million for CSCU. Combined, dollars going to UConn and CSCU account for 93.1 percent of higher education spending. More than half of the $42 million dedicated to student financial aid has traditionally been awarded to students attending these public institutions.
OHEStudent
Aid
UConn
UCHC
CSCU
2
In-State Out-of-State
FY 2013 FY 2014 % Change FY 2013 FY 2014 % Change
University of Connecticut
Commuter $11,362 $12,022 5.8% $29,194 $30,960 6.0%
Resident 22,742 23,744 4.4% 40,574 42,682 5.2%
CSCU—State Universities
Commuter 8,543 9,002 5.4% 19,575 20,507 4.8%
Resident 19,063 19,836 4.1% 30,095 31,341 4.1%
CSCU— Community Colleges
3,589
3,786
5.5%
10,754
11,318 5.2%
CSCU—Charter Oak
Associate Degree 3,391 3,096 -8.7% 4,372 4,068 -7.0%
Bachelor’s Degree 6,331 6,192 -2.2% 8,236 8,136 -1.2%
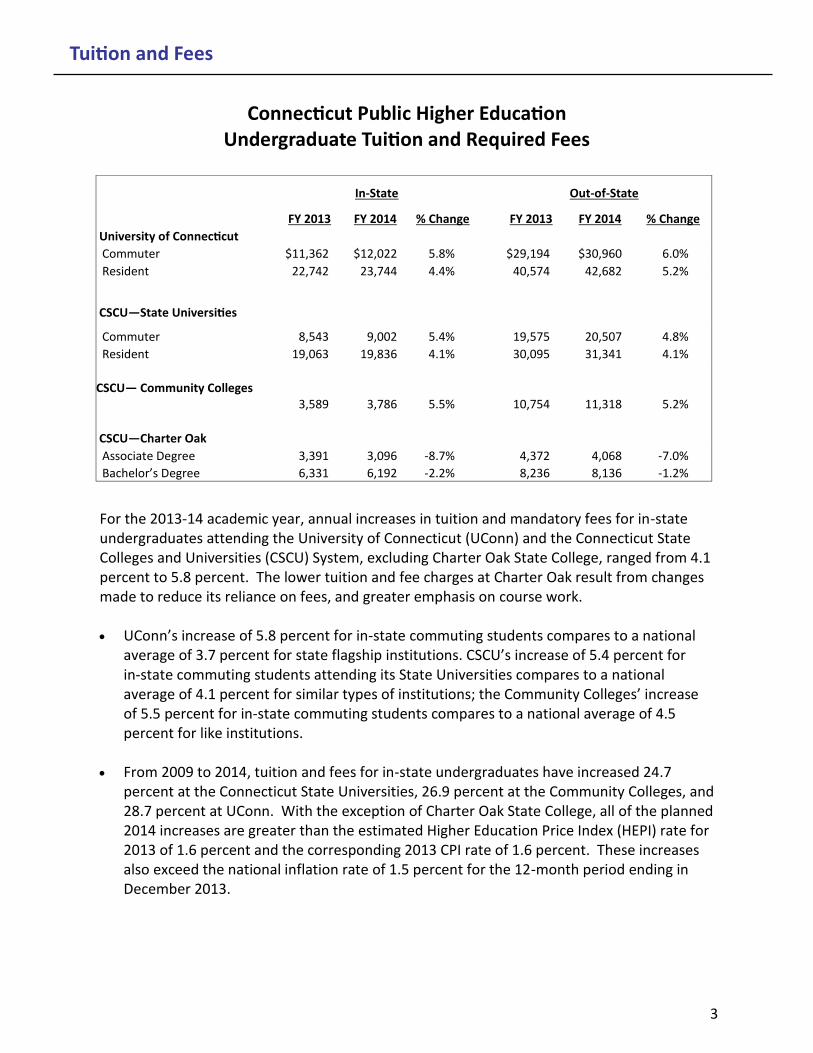
For the 2013-14 academic year, annual increases in tuition and mandatory fees for in-state undergraduates attending the University of Connecticut (UConn) and the Connecticut State Colleges and Universities (CSCU) System, excluding Charter Oak State College, ranged from 4.1 percent to 5.8 percent. The lower tuition and fee charges at Charter Oak result from changes made to reduce its reliance on fees, and greater emphasis on course work. UConn’s increase of 5.8 percent for in-state commuting students compares to a national
average of 3.7 percent for state flagship institutions. CSCU’s increase of 5.4 percent for in-state commuting students attending its State Universities compares to a national average of 4.1 percent for similar types of institutions; the Community Colleges’ increase of 5.5 percent for in-state commuting students compares to a national average of 4.5 percent for like institutions.
From 2009 to 2014, tuition and fees for in-state undergraduates have increased 24.7
percent at the Connecticut State Universities, 26.9 percent at the Community Colleges, and 28.7 percent at UConn. With the exception of Charter Oak State College, all of the planned 2014 increases are greater than the estimated Higher Education Price Index (HEPI) rate for 2013 of 1.6 percent and the corresponding 2013 CPI rate of 1.6 percent. These increases also exceed the national inflation rate of 1.5 percent for the 12-month period ending in December 2013.
Tuition and Fees
Connecticut Public Higher Education Undergraduate Tuition and Required Fees
3
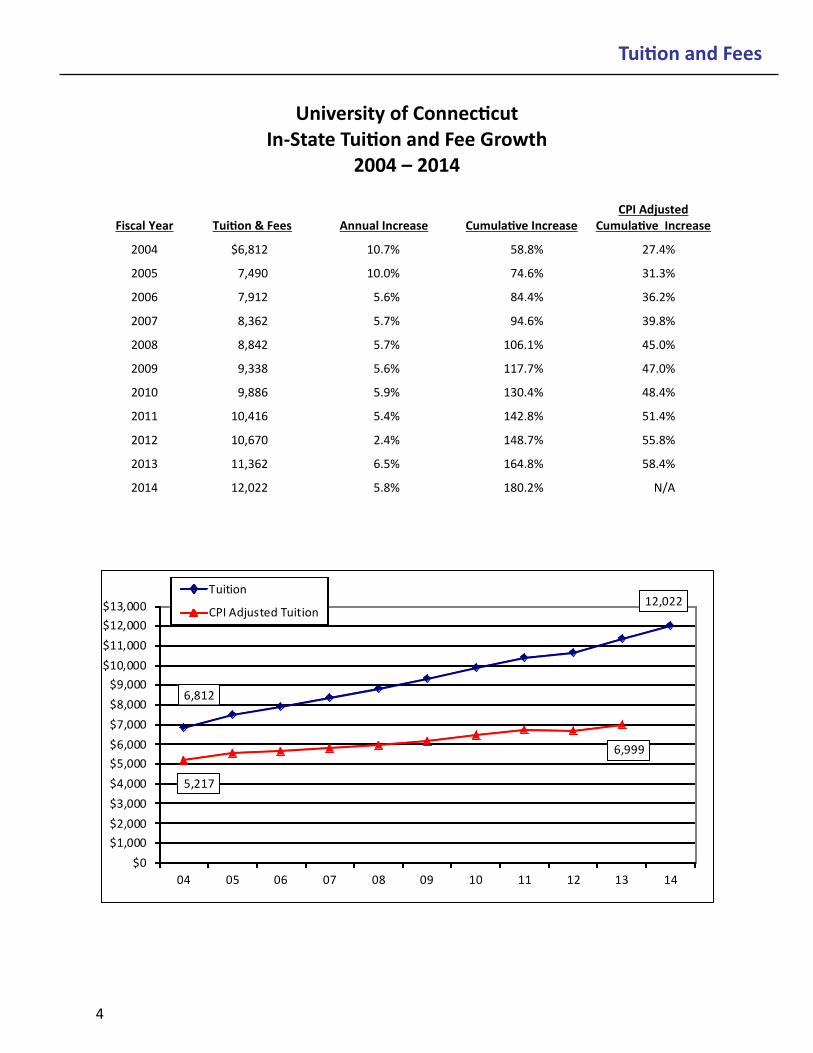
University of Connecticut In-State Tuition and Fee Growth
2004 – 2014
Fiscal Year Tuition & Fees Annual Increase Cumulative Increase CPI Adjusted
Cumulative Increase
2004 $6,812 10.7% 58.8% 27.4%
2005 7,490 10.0% 74.6% 31.3%
2006 7,912 5.6% 84.4% 36.2%
2007 8,362 5.7% 94.6% 39.8%
2008 8,842 5.7% 106.1% 45.0%
2009 9,338 5.6% 117.7% 47.0%
2010 9,886 5.9% 130.4% 48.4%
2011 10,416 5.4% 142.8% 51.4%
2012 10,670 2.4% 148.7% 55.8%
2013 11,362 6.5% 164.8% 58.4%
2014 12,022 5.8% 180.2% N/A
Tuition and Fees
6,812
12,022
5,217
6,999
$0
$1,000
$2,000
$3,000
$4,000
$5,000
$6,000
$7,000
$8,000
$9,000
$10,000
$11,000
$12,000
$13,000
04 05 06 07 08 09 10 11 12 13 14
Tuition
CPI Adjusted Tuition
4
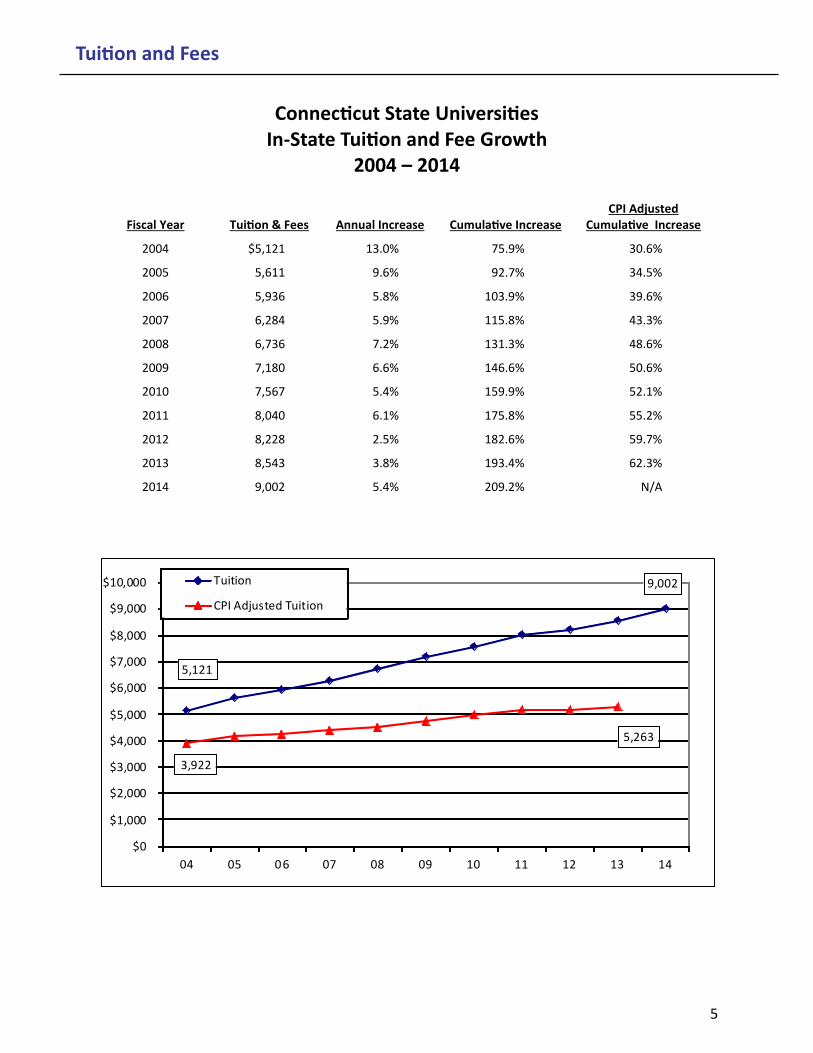
Connecticut State Universities In-State Tuition and Fee Growth
2004 – 2014
Fiscal Year Tuition & Fees Annual Increase Cumulative Increase CPI Adjusted
Cumulative Increase
2004 $5,121 13.0% 75.9% 30.6%
2005 5,611 9.6% 92.7% 34.5%
2006 5,936 5.8% 103.9% 39.6%
2007 6,284 5.9% 115.8% 43.3%
2008 6,736 7.2% 131.3% 48.6%
2009 7,180 6.6% 146.6% 50.6%
2010 7,567 5.4% 159.9% 52.1%
2011 8,040 6.1% 175.8% 55.2%
2012 8,228 2.5% 182.6% 59.7%
2013 8,543 3.8% 193.4% 62.3%
2014 9,002 5.4% 209.2% N/A
Tuition and Fees
5,121
9,002
3,922
5,263
$0
$1,000
$2,000
$3,000
$4,000
$5,000
$6,000
$7,000
$8,000
$9,000
$10,000
04 05 06 07 08 09 10 11 12 13 14
Tuition
CPI Adjusted Tuition
5
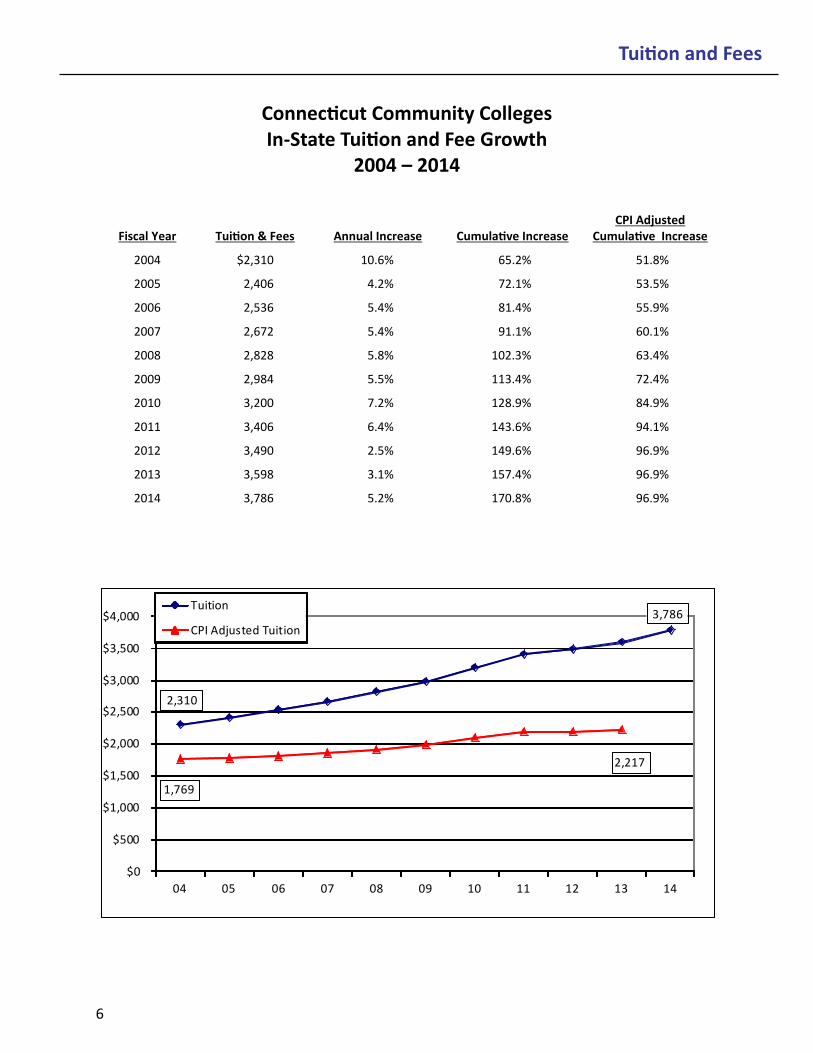
Fiscal Year Tuition & Fees Annual Increase Cumulative Increase CPI Adjusted
Cumulative Increase
2004 $2,310 10.6% 65.2% 51.8%
2005 2,406 4.2% 72.1% 53.5%
2006 2,536 5.4% 81.4% 55.9%
2007 2,672 5.4% 91.1% 60.1%
2008 2,828 5.8% 102.3% 63.4%
2009 2,984 5.5% 113.4% 72.4%
2010 3,200 7.2% 128.9% 84.9%
2011 3,406 6.4% 143.6% 94.1%
2012 3,490 2.5% 149.6% 96.9%
2013 3,598 3.1% 157.4% 96.9%
2014 3,786 5.2% 170.8% 96.9%
Connecticut Community Colleges In-State Tuition and Fee Growth
2004 – 2014
Tuition and Fees
2,310
3,786
1,769
2,217
$0
$500
$1,000
$1,500
$2,000
$2,500
$3,000
$3,500
$4,000
04 05 06 07 08 09 10 11 12 13 14
Tuition
CPI Adjusted Tuition
6
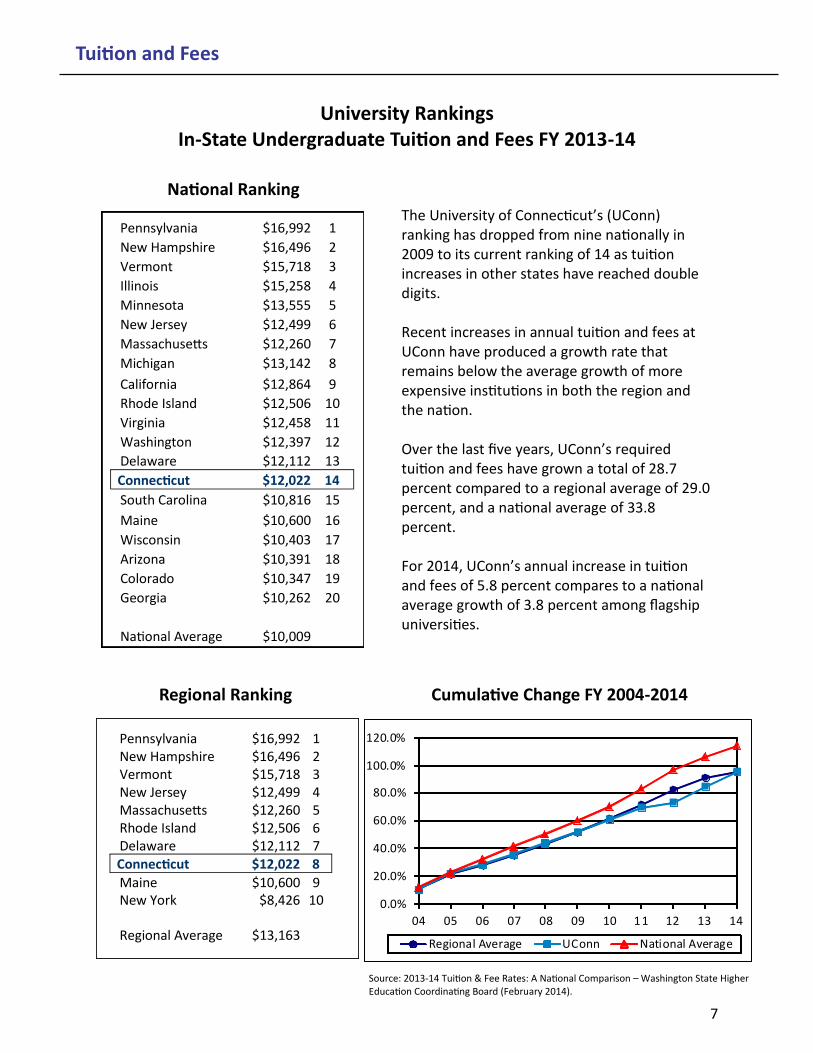
University Rankings In-State Undergraduate Tuition and Fees FY 2013-14
The University of Connecticut’s (UConn) ranking has dropped from nine nationally in 2009 to its current ranking of 14 as tuition increases in other states have reached double digits. Recent increases in annual tuition and fees at UConn have produced a growth rate that remains below the average growth of more expensive institutions in both the region and the nation. Over the last five years, UConn’s required tuition and fees have grown a total of 28.7 percent compared to a regional average of 29.0 percent, and a national average of 33.8 percent. For 2014, UConn’s annual increase in tuition and fees of 5.8 percent compares to a national average growth of 3.8 percent among flagship universities.
Regional Ranking
National Ranking
Tuition and Fees
Source: 2013-14 Tuition & Fee Rates: A National Comparison – Washington State Higher Education Coordinating Board (February 2014).
Cumulative Change FY 2004-2014
Pennsylvania $16,992 1
New Hampshire $16,496 2
Vermont $15,718 3
Illinois $15,258 4
Minnesota $13,555 5
New Jersey $12,499 6
Massachusetts $12,260 7
Michigan $13,142 8
California $12,864 9
Rhode Island $12,506 10
Virginia $12,458 11
Washington $12,397 12
Delaware $12,112 13
Connecticut $12,022 14
South Carolina $10,816 15
Maine $10,600 16
Wisconsin $10,403 17
Arizona $10,391 18
Colorado $10,347 19
Georgia $10,262 20
National Average $10,009
0.0%
20.0%
40.0%
60.0%
80.0%
100.0%
120.0%
04 05 06 07 08 09 10 11 12 13 14
Regional Average UConn National Average
Pennsylvania $16,992 1 New Hampshire $16,496 2 Vermont $15,718 3 New Jersey $12,499 4 Massachusetts $12,260 5 Rhode Island $12,506 6 Delaware $12,112 7 Connecticut $12,022 8
Maine $10,600 9 New York $8,426 10 Regional Average $13,163
7
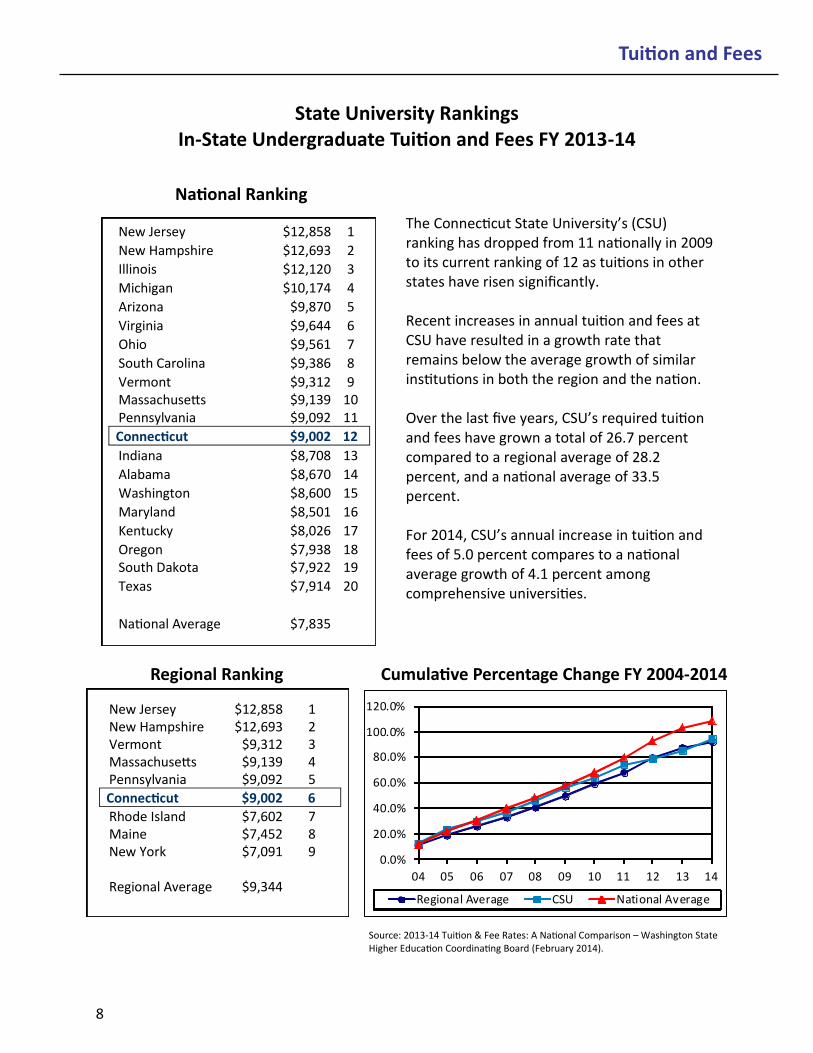
State University Rankings In-State Undergraduate Tuition and Fees FY 2013-14
The Connecticut State University’s (CSU) ranking has dropped from 11 nationally in 2009 to its current ranking of 12 as tuitions in other states have risen significantly. Recent increases in annual tuition and fees at CSU have resulted in a growth rate that remains below the average growth of similar institutions in both the region and the nation. Over the last five years, CSU’s required tuition and fees have grown a total of 26.7 percent compared to a regional average of 28.2 percent, and a national average of 33.5 percent. For 2014, CSU’s annual increase in tuition and fees of 5.0 percent compares to a national average growth of 4.1 percent among comprehensive universities.
Regional Ranking
National Ranking
Tuition and Fees
Source: 2013-14 Tuition & Fee Rates: A National Comparison – Washington State Higher Education Coordinating Board (February 2014).
Cumulative Percentage Change FY 2004-2014
New Jersey $12,858 1
New Hampshire $12,693 2
Illinois $12,120 3
Michigan $10,174 4
Arizona $9,870 5
Virginia $9,644 6
Ohio $9,561 7
South Carolina $9,386 8
Vermont $9,312 9 Massachusetts $9,139 10 Pennsylvania $9,092 11
Connecticut $9,002 12
Indiana $8,708 13
Alabama $8,670 14
Washington $8,600 15
Maryland $8,501 16
Kentucky $8,026 17
Oregon $7,938 18 South Dakota $7,922 19
Texas $7,914 20
National Average $7,835
New Jersey $12,858 1 New Hampshire $12,693 2 Vermont $9,312 3 Massachusetts $9,139 4 Pennsylvania $9,092 5
Connecticut $9,002 6
Rhode Island $7,602 7 Maine $7,452 8 New York $7,091 9 Regional Average $9,344
0.0%
20.0%
40.0%
60.0%
80.0%
100.0%
120.0%
04 05 06 07 08 09 10 11 12 13 14
Regional Average CSU National Average
8
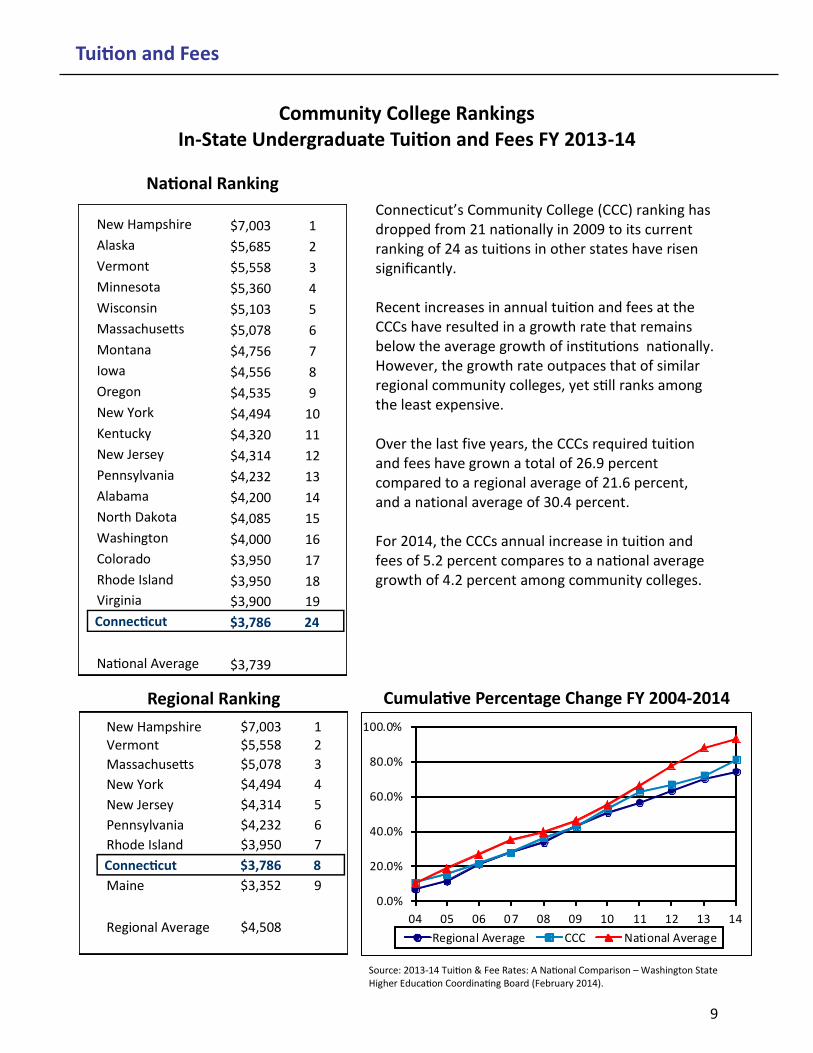
Community College Rankings In-State Undergraduate Tuition and Fees FY 2013-14
Connecticut’s Community College (CCC) ranking has dropped from 21 nationally in 2009 to its current ranking of 24 as tuitions in other states have risen significantly. Recent increases in annual tuition and fees at the CCCs have resulted in a growth rate that remains below the average growth of institutions nationally. However, the growth rate outpaces that of similar regional community colleges, yet still ranks among the least expensive. Over the last five years, the CCCs required tuition and fees have grown a total of 26.9 percent compared to a regional average of 21.6 percent, and a national average of 30.4 percent. For 2014, the CCCs annual increase in tuition and fees of 5.2 percent compares to a national average growth of 4.2 percent among community colleges.
National Ranking
Regional Ranking
Tuition and Fees
Source: 2013-14 Tuition & Fee Rates: A National Comparison – Washington State Higher Education Coordinating Board (February 2014).
Cumulative Percentage Change FY 2004-2014
New Hampshire $7,003 1
Alaska $5,685 2
Vermont $5,558 3
Minnesota $5,360 4
Wisconsin $5,103 5
Massachusetts $5,078 6
Montana $4,756 7
Iowa $4,556 8
Oregon $4,535 9
New York $4,494 10
Kentucky $4,320 11
New Jersey $4,314 12
Pennsylvania $4,232 13
Alabama $4,200 14
North Dakota $4,085 15
Washington $4,000 16
Colorado $3,950 17
Rhode Island $3,950 18
Virginia $3,900 19
Connecticut $3,786 24
National Average $3,739
New Hampshire $7,003 1 Vermont $5,558 2
Massachusetts $5,078 3
New York $4,494 4
New Jersey $4,314 5
Pennsylvania $4,232 6
Rhode Island $3,950 7
Connecticut $3,786 8
Maine $3,352 9
Regional Average $4,508
0.0%
20.0%
40.0%
60.0%
80.0%
100.0%
04 05 06 07 08 09 10 11 12 13 14
Regional Average CCC National Average
9
2009-10
2010-11
2011-12
2012-13
2013-14
1 Year % Change
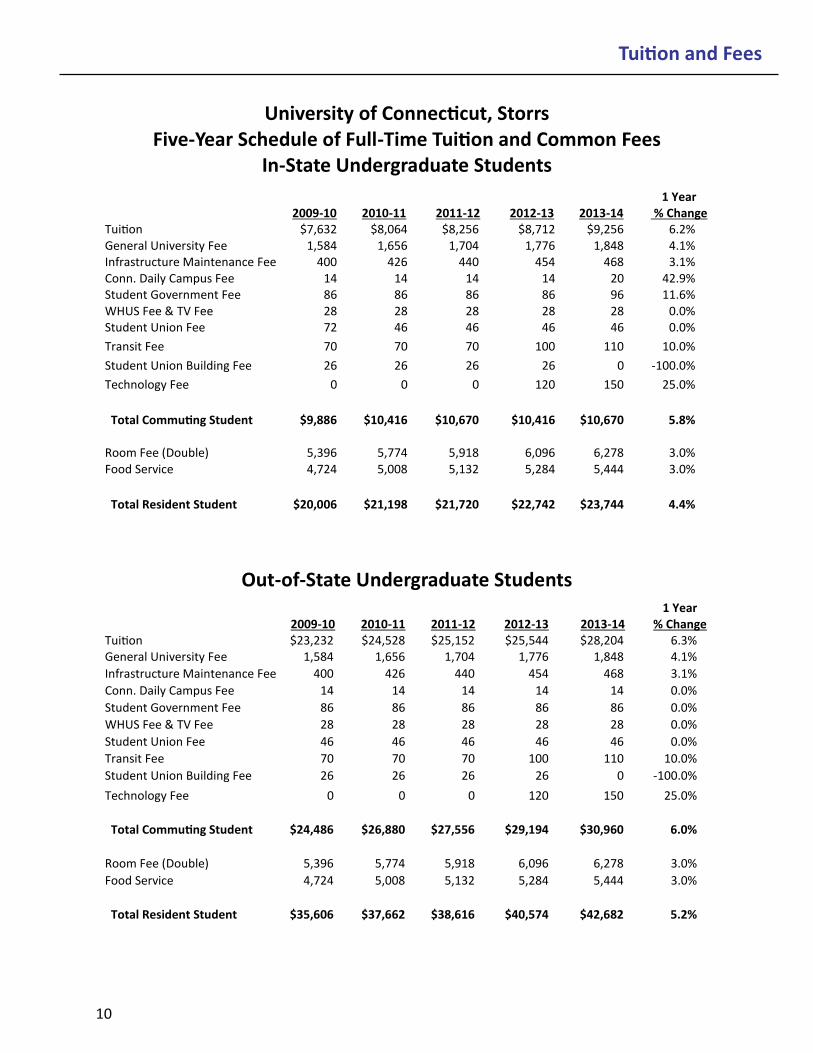
Tuition $7,632 $8,064 $8,256 $8,712 $9,256 6.2% General University Fee 1,584 1,656 1,704 1,776 1,848 4.1% Infrastructure Maintenance Fee 400 426 440 454 468 3.1% Conn. Daily Campus Fee 14 14 14 14 20 42.9% Student Government Fee 86 86 86 86 96 11.6% WHUS Fee & TV Fee 28 28 28 28 28 0.0% Student Union Fee 72 46 46 46 46 0.0%
Transit Fee 70 70 70 100 110 10.0%
Student Union Building Fee 26 26 26 26 0 -100.0%
Technology Fee 0 0 0 120 150 25.0%
Total Commuting Student $9,886 $10,416 $10,670 $10,416 $10,670 5.8%
Room Fee (Double) 5,396 5,774 5,918 6,096 6,278 3.0% Food Service 4,724 5,008 5,132 5,284 5,444 3.0%
Total Resident Student $20,006 $21,198 $21,720 $22,742 $23,744 4.4%
University of Connecticut, Storrs Five-Year Schedule of Full-Time Tuition and Common Fees
In-State Undergraduate Students
2009-10
2010-11
2011-12
2012-13
2013-14
1 Year % Change
Tuition $23,232 $24,528 $25,152 $25,544 $28,204 6.3% General University Fee 1,584 1,656 1,704 1,776 1,848 4.1%
Infrastructure Maintenance Fee 400 426 440 454 468 3.1%
Conn. Daily Campus Fee 14 14 14 14 14 0.0%
Student Government Fee 86 86 86 86 86 0.0%
WHUS Fee & TV Fee 28 28 28 28 28 0.0%
Student Union Fee 46 46 46 46 46 0.0%
Transit Fee 70 70 70 100 110 10.0%
Student Union Building Fee 26 26 26 26 0 -100.0%
Technology Fee 0 0 0 120 150 25.0%
Total Commuting Student $24,486 $26,880 $27,556 $29,194 $30,960 6.0%
Room Fee (Double) 5,396 5,774 5,918 6,096 6,278 3.0%
Food Service 4,724 5,008 5,132 5,284 5,444 3.0%
Total Resident Student $35,606 $37,662 $38,616 $40,574 $42,682 5.2%
Out-of-State Undergraduate Students
Tuition and Fees
10
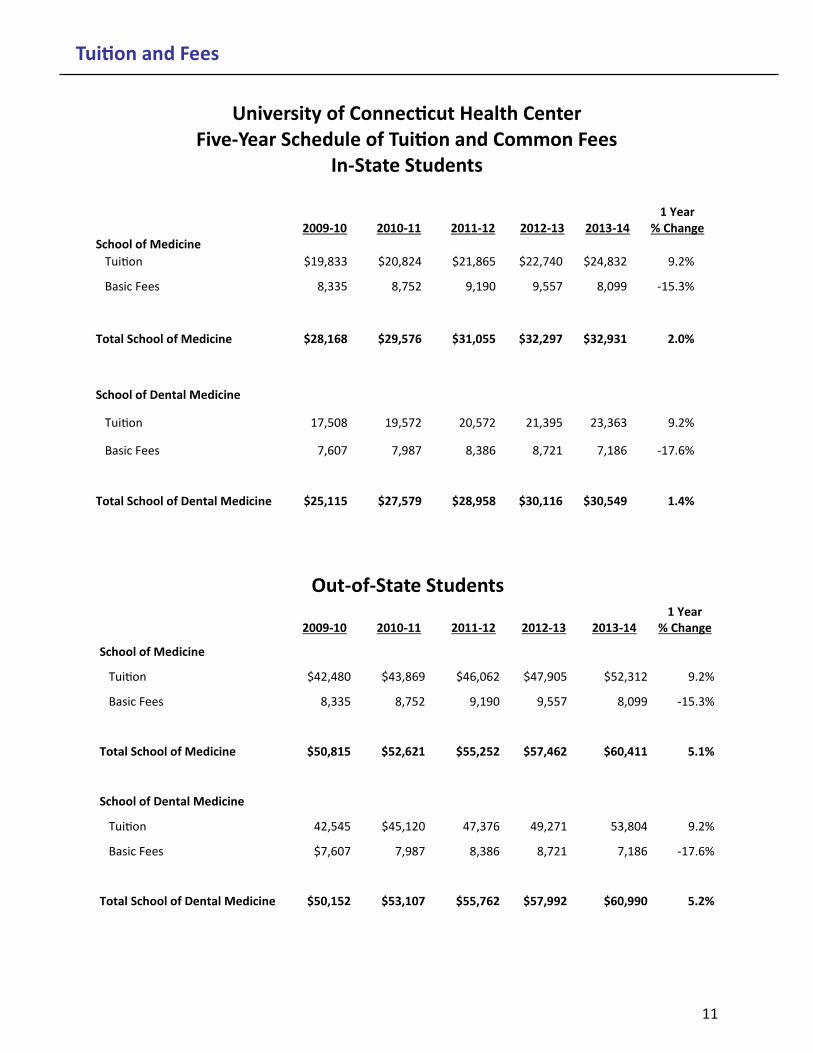
Out-of-State Students
2009-10
2010-11
2011-12
2012-13
2013-14 1 Year
% Change
School of Medicine
Tuition $42,480 $43,869 $46,062 $47,905 $52,312 9.2%
Basic Fees 8,335 8,752 9,190 9,557 8,099 -15.3%
Total School of Medicine $50,815 $52,621 $55,252 $57,462 $60,411 5.1%
School of Dental Medicine
Tuition 42,545 $45,120 47,376 49,271 53,804 9.2%
Basic Fees $7,607 7,987 8,386 8,721 7,186 -17.6%
Total School of Dental Medicine $50,152 $53,107 $55,762 $57,992 $60,990 5.2%
University of Connecticut Health Center Five-Year Schedule of Tuition and Common Fees
In-State Students
2009-10
2010-11
2011-12
2012-13
2013-14
1 Year % Change
School of Medicine
Tuition $19,833 $20,824 $21,865 $22,740 $24,832 9.2%
Basic Fees 8,335 8,752 9,190 9,557 8,099 -15.3%
Total School of Medicine $28,168 $29,576 $31,055 $32,297 $32,931 2.0%
School of Dental Medicine
Tuition 17,508 19,572 20,572 21,395 23,363 9.2%
Basic Fees 7,607 7,987 8,386 8,721 7,186 -17.6%
Total School of Dental Medicine $25,115 $27,579 $28,958 $30,116 $30,549 1.4%
Tuition and Fees
11
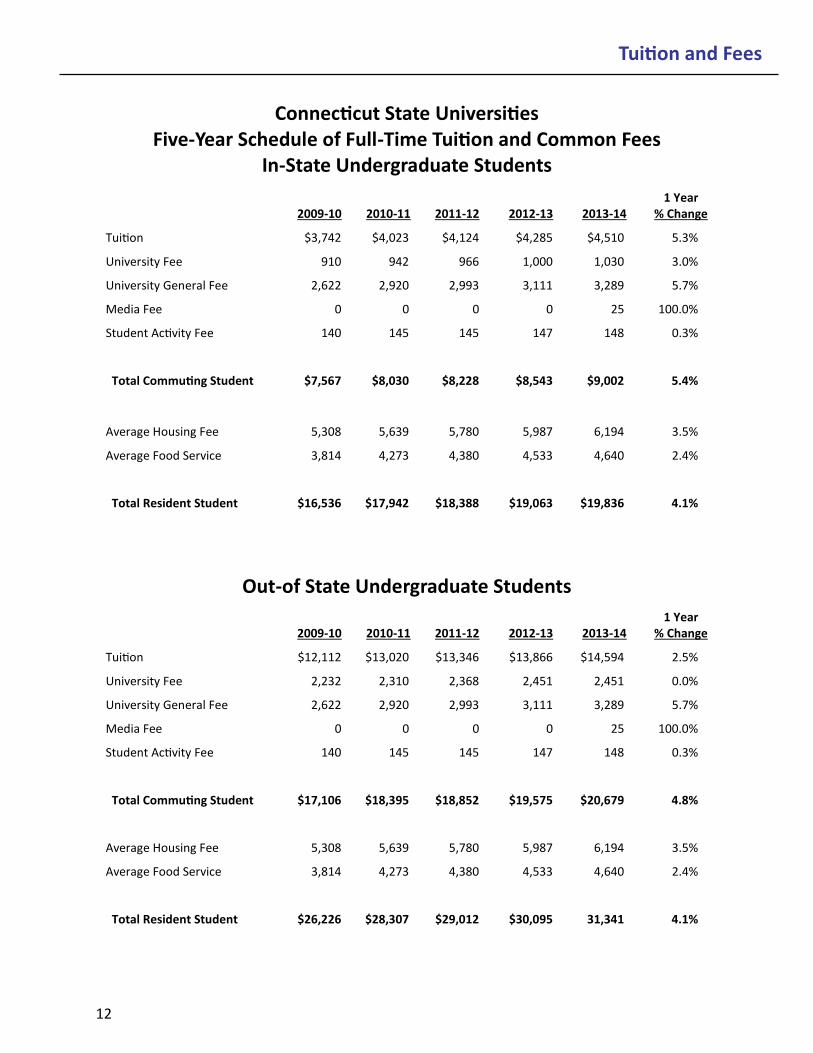
Connecticut State Universities Five-Year Schedule of Full-Time Tuition and Common Fees
In-State Undergraduate Students
Out-of State Undergraduate Students
2009-10
2010-11
2011-12
2012-13
2013-14
1 Year % Change
Tuition $3,742 $4,023 $4,124 $4,285 $4,510 5.3%
University Fee 910 942 966 1,000 1,030 3.0%
University General Fee 2,622 2,920 2,993 3,111 3,289 5.7%
Media Fee 0 0 0 0 25 100.0%
Student Activity Fee 140 145 145 147 148 0.3%
Total Commuting Student $7,567 $8,030 $8,228 $8,543 $9,002 5.4%
Average Housing Fee 5,308 5,639 5,780 5,987 6,194 3.5%
Average Food Service 3,814 4,273 4,380 4,533 4,640 2.4%
Total Resident Student $16,536 $17,942 $18,388 $19,063 $19,836 4.1%
2009-10
2010-11
2011-12
2012-13
2013-14
1 Year % Change
Tuition $12,112 $13,020 $13,346 $13,866 $14,594 2.5%
University Fee 2,232 2,310 2,368 2,451 2,451 0.0%
University General Fee 2,622 2,920 2,993 3,111 3,289 5.7%
Media Fee 0 0 0 0 25 100.0%
Student Activity Fee 140 145 145 147 148 0.3%
Total Commuting Student $17,106 $18,395 $18,852 $19,575 $20,679 4.8%
Average Housing Fee 5,308 5,639 5,780 5,987 6,194 3.5%
Average Food Service 3,814 4,273 4,380 4,533 4,640 2.4%
Total Resident Student $26,226 $28,307 $29,012 $30,095 31,341 4.1%
Tuition and Fees
12
Connecticut Community Colleges Five-Year Schedule of Full-Time Tuition and Common Fees
In-State Undergraduate Students
Out-of-State Undergraduate Students
2009-10
2010-11
2011-12
2012-13
2013-14
1 Year % Change
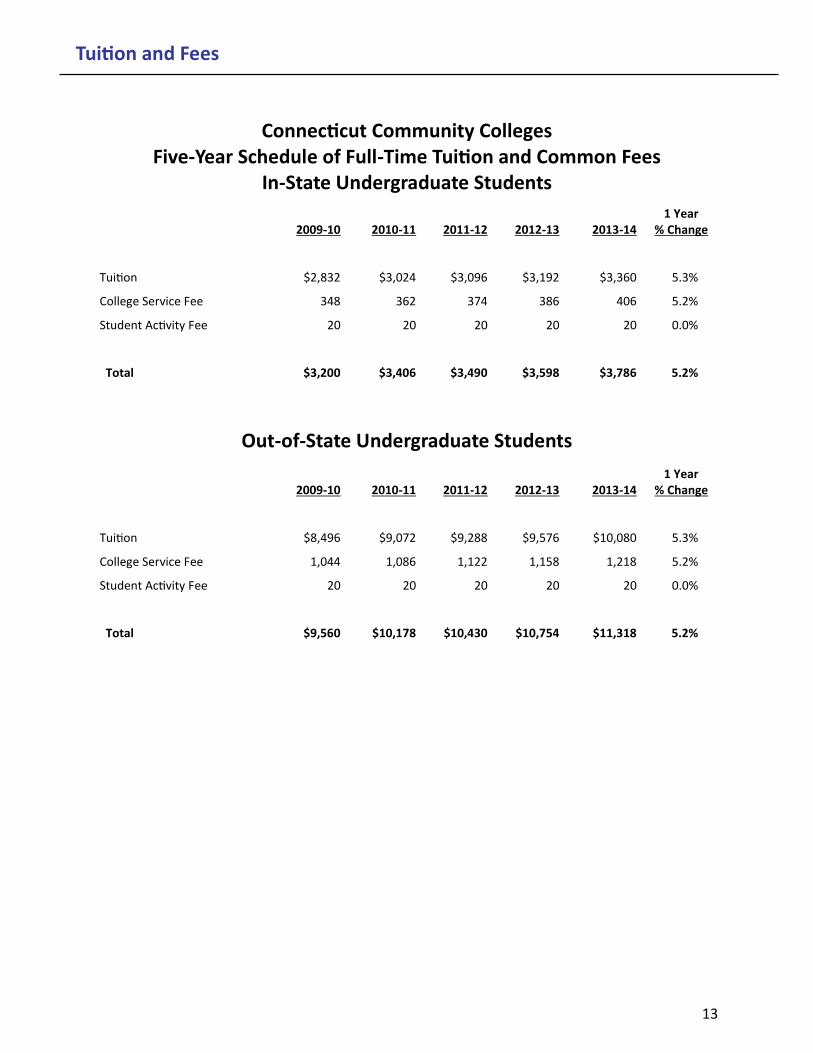
Tuition $2,832 $3,024 $3,096 $3,192 $3,360 5.3%
College Service Fee 348 362 374 386 406 5.2%
Student Activity Fee 20 20 20 20 20 0.0%
Total $3,200 $3,406 $3,490 $3,598 $3,786 5.2%
2009-10
2010-11
2011-12
2012-13
2013-14
1 Year % Change
Tuition $8,496 $9,072 $9,288 $9,576 $10,080 5.3%
College Service Fee 1,044 1,086 1,122 1,158 1,218 5.2%
Student Activity Fee 20 20 20 20 20 0.0%
Total $9,560 $10,178 $10,430 $10,754 $11,318 5.2%
Tuition and Fees
13
Charter Oak State College Five-Year Schedule of Tuition and Common Fees
In-State Students
Out-of-State Students
2009-10
2010-11
2011-12
2012-13
2013-14
1 Year % Change
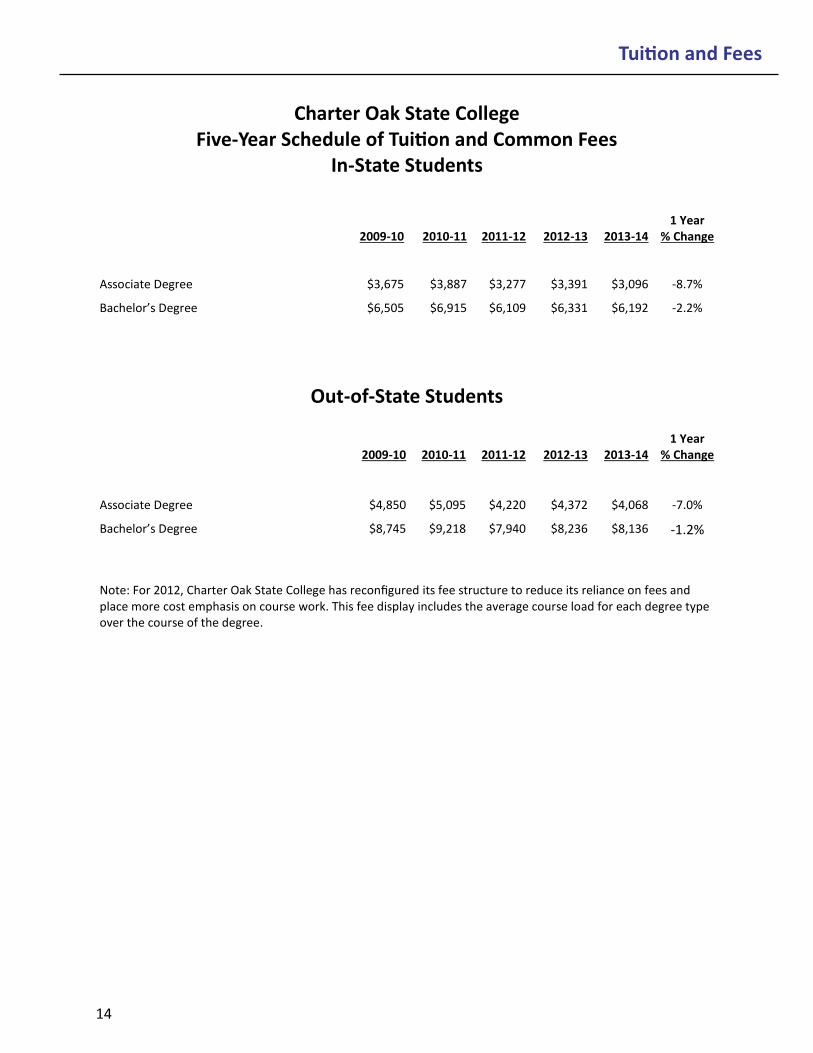
Associate Degree $3,675 $3,887 $3,277 $3,391 $3,096 -8.7%
Bachelor’s Degree $6,505 $6,915 $6,109 $6,331 $6,192 -2.2%
2009-10
2010-11
2011-12
2012-13
2013-14
1 Year % Change
Associate Degree $4,850 $5,095 $4,220 $4,372 $4,068 -7.0%
Bachelor’s Degree $8,745 $9,218 $7,940 $8,236 $8,136 -1.2%
Tuition and Fees
Note: For 2012, Charter Oak State College has reconfigured its fee structure to reduce its reliance on fees and place more cost emphasis on course work. This fee display includes the average course load for each degree type over the course of the degree.
14
Tuition and Fees
Connecticut Independent Institutions Schedule of Tuition and Common Fees
2013-14 One-Year Change
2012-13 2013-14
Independent Institutions
Total Tuition & Required
Fees Room &
Board
Total Tuition & Required
Fees Room &
Board 1 Year
% Change Total Total
National Non-Profit Independents
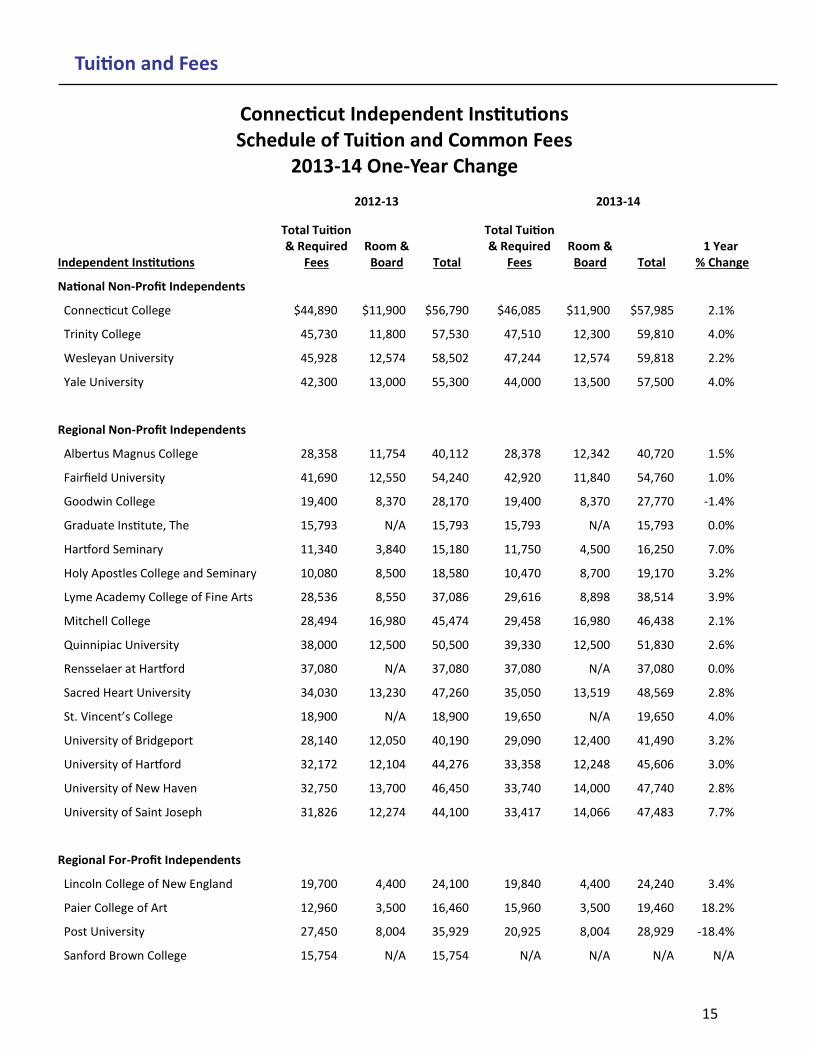
Connecticut College $44,890 $11,900 $46,085 $11,900 2.1% $56,790 $57,985
Trinity College 45,730 11,800 47,510 12,300 4.0% 57,530 59,810
Wesleyan University 45,928 12,574 47,244 12,574 2.2% 58,502 59,818
Yale University 42,300 13,000 44,000 13,500 4.0% 55,300 57,500
Regional Non-Profit Independents
Albertus Magnus College 28,358 11,754 28,378 12,342 1.5% 40,112 40,720
Fairfield University 41,690 12,550 42,920 11,840 1.0% 54,240 54,760
Goodwin College 19,400 8,370 19,400 8,370 -1.4% 28,170 27,770
Graduate Institute, The 15,793 N/A 15,793 N/A 0.0% 15,793 15,793
Hartford Seminary 11,340 3,840 11,750 4,500 7.0% 15,180 16,250
Holy Apostles College and Seminary 10,080 8,500 10,470 8,700 3.2% 18,580 19,170
Lyme Academy College of Fine Arts 28,536 8,550 29,616 8,898 3.9% 37,086 38,514
Mitchell College 28,494 16,980 29,458 16,980 2.1% 45,474 46,438
Quinnipiac University 38,000 12,500 39,330 12,500 2.6% 50,500 51,830
Rensselaer at Hartford 37,080 N/A 37,080 N/A 0.0% 37,080 37,080
Sacred Heart University 34,030 13,230 35,050 13,519 2.8% 47,260 48,569
St. Vincent’s College 18,900 N/A 19,650 N/A 4.0% 18,900 19,650
University of Bridgeport 28,140 12,050 29,090 12,400 3.2% 40,190 41,490
University of Hartford 32,172 12,104 33,358 12,248 3.0% 44,276 45,606
University of New Haven 32,750 13,700 33,740 14,000 2.8% 46,450 47,740
University of Saint Joseph 31,826 12,274 33,417 14,066 7.7% 44,100 47,483
Regional For-Profit Independents
Lincoln College of New England 19,700 4,400 19,840 4,400 3.4% 24,100 24,240
Paier College of Art 12,960 3,500 15,960 3,500 18.2% 16,460 19,460
Post University 27,450 8,004 20,925 8,004 -18.4% 35,929 28,929
Sanford Brown College 15,754 N/A N/A N/A N/A 15,754 N/A
15

16
Connecticut Student Financial Aid
Student Financial Aid
$-
$10,000,000
$20,000,000
$30,000,000
$40,000,000
$50,000,000
$60,000,000
$70,000,000
1999 2004 2005 2006 2007 2008 2009 2010 2011 2012 2013
Appropriated Funds 1999 - 2013State Student Financial Aid
CAPCS CICSG CSP TOTAL
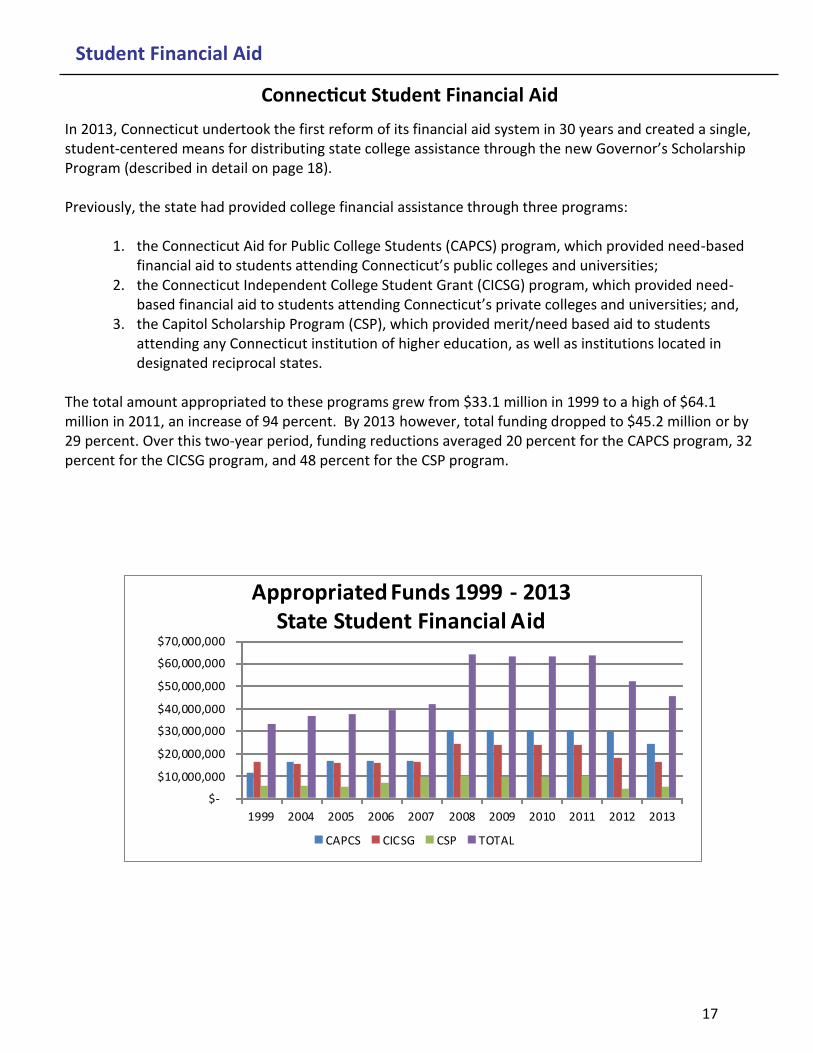
In 2013, Connecticut undertook the first reform of its financial aid system in 30 years and created a single, student-centered means for distributing state college assistance through the new Governor’s Scholarship Program (described in detail on page 18). Previously, the state had provided college financial assistance through three programs:
1. the Connecticut Aid for Public College Students (CAPCS) program, which provided need-based financial aid to students attending Connecticut’s public colleges and universities;
2. the Connecticut Independent College Student Grant (CICSG) program, which provided need-based financial aid to students attending Connecticut’s private colleges and universities; and,
3. the Capitol Scholarship Program (CSP), which provided merit/need based aid to students attending any Connecticut institution of higher education, as well as institutions located in designated reciprocal states.
The total amount appropriated to these programs grew from $33.1 million in 1999 to a high of $64.1 million in 2011, an increase of 94 percent. By 2013 however, total funding dropped to $45.2 million or by 29 percent. Over this two-year period, funding reductions averaged 20 percent for the CAPCS program, 32 percent for the CICSG program, and 48 percent for the CSP program.
17
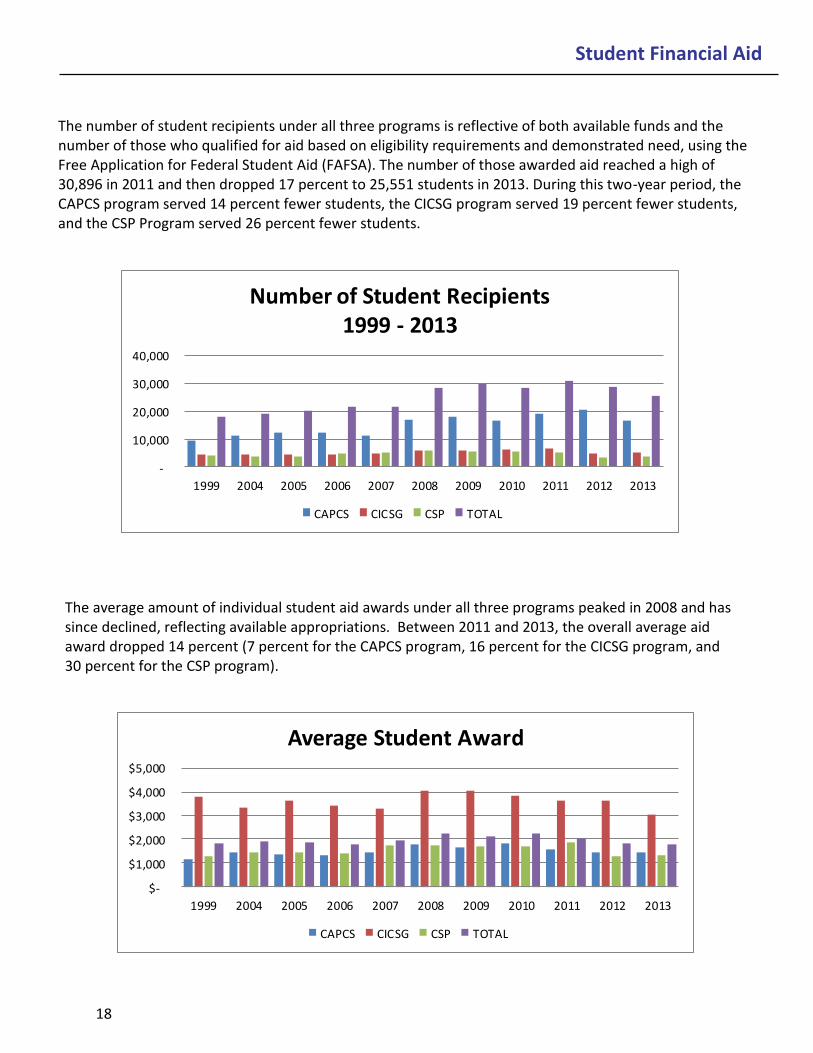
The average amount of individual student aid awards under all three programs peaked in 2008 and has since declined, reflecting available appropriations. Between 2011 and 2013, the overall average aid award dropped 14 percent (7 percent for the CAPCS program, 16 percent for the CICSG program, and 30 percent for the CSP program).
Student Financial Aid
-
10,000
20,000
30,000
40,000
1999 2004 2005 2006 2007 2008 2009 2010 2011 2012 2013
Number of Student Recipients1999 - 2013
CAPCS CICSG CSP TOTAL
$-
$1,000
$2,000
$3,000
$4,000
$5,000
1999 2004 2005 2006 2007 2008 2009 2010 2011 2012 2013
Average Student Award
CAPCS CICSG CSP TOTAL
The number of student recipients under all three programs is reflective of both available funds and the number of those who qualified for aid based on eligibility requirements and demonstrated need, using the Free Application for Federal Student Aid (FAFSA). The number of those awarded aid reached a high of 30,896 in 2011 and then dropped 17 percent to 25,551 students in 2013. During this two-year period, the CAPCS program served 14 percent fewer students, the CICSG program served 19 percent fewer students, and the CSP Program served 26 percent fewer students.
18
The Governor’s Scholarship Program
Student Financial Aid
The Governor’s Scholarship Program (GSP), which became effective on July 1, 2013, combines all non-programmatic, state-funded student financial aid into one student-oriented program administered by the Office of Higher Education. The GSP program supports degree-seeking undergraduates at Connecticut non-profit colleges and universities who attend either full-time or part-time. Applicants must be Connecticut residents, and awards must be used for tuition, fees, books and supplies. GSP is composed of three components:
1. a merit- and need-based scholarship, 2. a need-based only grant which has three attributes: a) a community college grant, b) a four-year
institution grant, and c) a Charter Oak State College grant. 3. an incentive award for students who have sufficient credits to graduate in two or four years, and
who exceed minimum satisfactory academic performance standards. No student may benefit from both the merit/need and need-based only components. Awards are renewable based on satisfactory progress and continuing need, and are available for 1.5 times the minimum time to graduation (3 years for a 2-year college; 6 years for a 4-year college). GSP has several objectives, among them:
Access - awards go to the neediest students first. Retention - awards contribute to students staying in school. Completion - awards encourage students to obtain a degree in the shortest time possible.
In addition, GSP applies the same eligibility and award standards to all students regardless of the college they attend, and targets those students with the greatest need. This approach provides consistency for students, a means of measurability for the state, and the most effective use of funds for taxpayers.
19

20
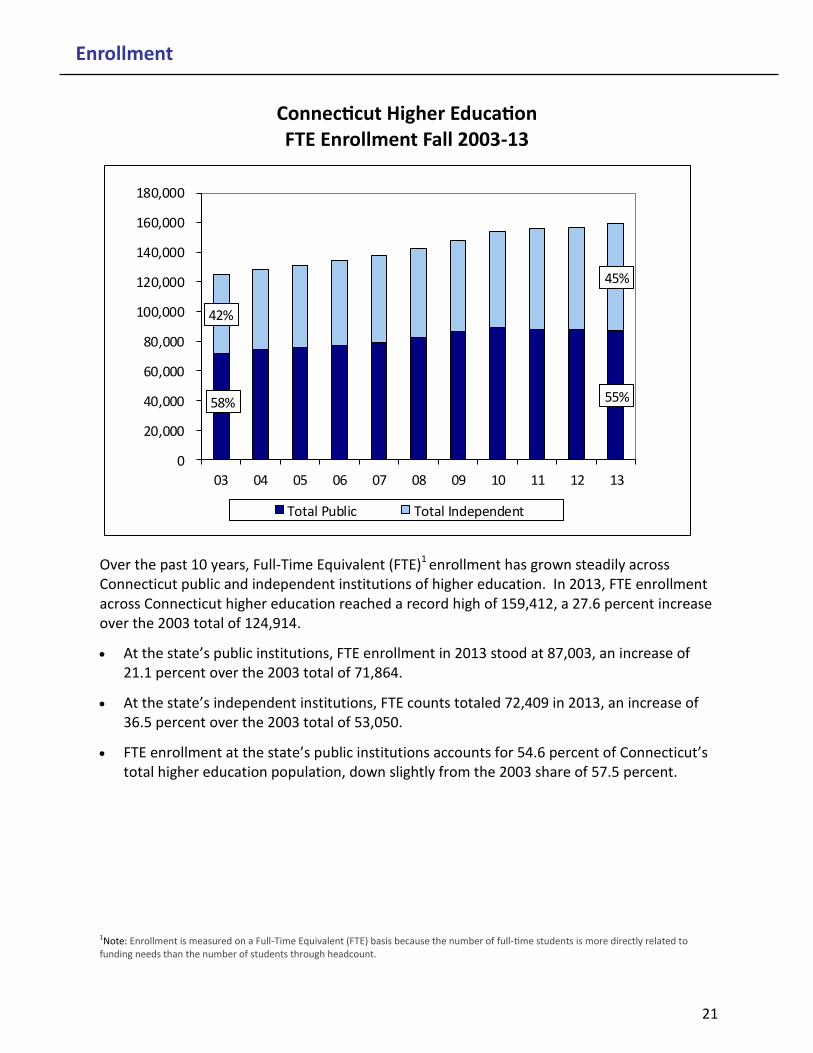
Over the past 10 years, Full-Time Equivalent (FTE)1 enrollment has grown steadily across Connecticut public and independent institutions of higher education. In 2013, FTE enrollment across Connecticut higher education reached a record high of 159,412, a 27.6 percent increase over the 2003 total of 124,914.
At the state’s public institutions, FTE enrollment in 2013 stood at 87,003, an increase of 21.1 percent over the 2003 total of 71,864.
At the state’s independent institutions, FTE counts totaled 72,409 in 2013, an increase of 36.5 percent over the 2003 total of 53,050.
FTE enrollment at the state’s public institutions accounts for 54.6 percent of Connecticut’s total higher education population, down slightly from the 2003 share of 57.5 percent.
Connecticut Higher Education FTE Enrollment Fall 2003-13
Enrollment
58% 55%
42%
45%
0
20,000
40,000
60,000
80,000
100,000
120,000
140,000
160,000
180,000
03 04 05 06 07 08 09 10 11 12 13
Total Public Total Independent
1Note: Enrollment is measured on a Full-Time Equivalent (FTE) basis because the number of full-time students is more directly related to funding needs than the number of students through headcount.
21
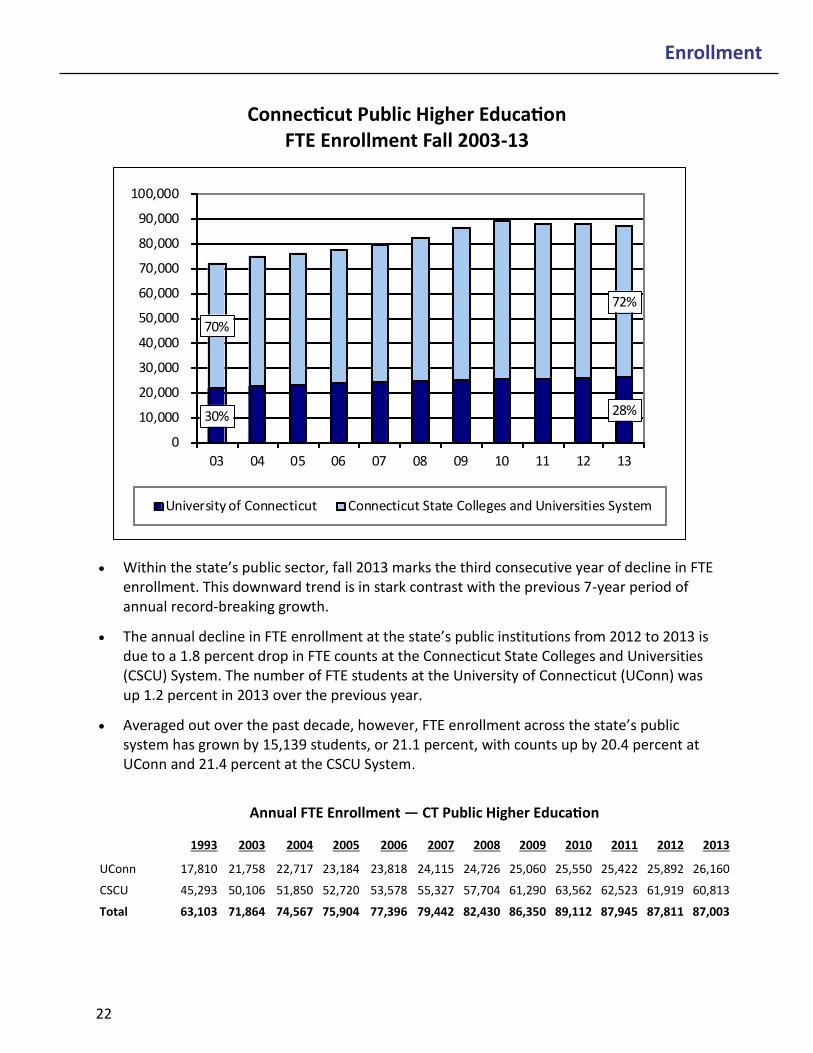
Within the state’s public sector, fall 2013 marks the third consecutive year of decline in FTE enrollment. This downward trend is in stark contrast with the previous 7-year period of annual record-breaking growth.
The annual decline in FTE enrollment at the state’s public institutions from 2012 to 2013 is due to a 1.8 percent drop in FTE counts at the Connecticut State Colleges and Universities (CSCU) System. The number of FTE students at the University of Connecticut (UConn) was up 1.2 percent in 2013 over the previous year.
Averaged out over the past decade, however, FTE enrollment across the state’s public system has grown by 15,139 students, or 21.1 percent, with counts up by 20.4 percent at UConn and 21.4 percent at the CSCU System.
Connecticut Public Higher Education FTE Enrollment Fall 2003-13
1993 2003 2004 2005 2006 2007 2008 2009 2010 2011 2012 2013
UConn 17,810 21,758 22,717 23,184 23,818 24,115 24,726 25,060 25,550 25,422 25,892 26,160
CSCU 45,293 50,106 51,850 52,720 53,578 55,327 57,704 61,290 63,562 62,523 61,919 60,813
Total 63,103 71,864 74,567 75,904 77,396 79,442 82,430 86,350 89,112 87,945 87,811 87,003
Annual FTE Enrollment — CT Public Higher Education
Enrollment
30% 28%
70%
72%
0
10,000
20,000
30,000
40,000
50,000
60,000
70,000
80,000
90,000
100,000
03 04 05 06 07 08 09 10 11 12 13
University of Connecticut Connecticut State Colleges and Universities System
22
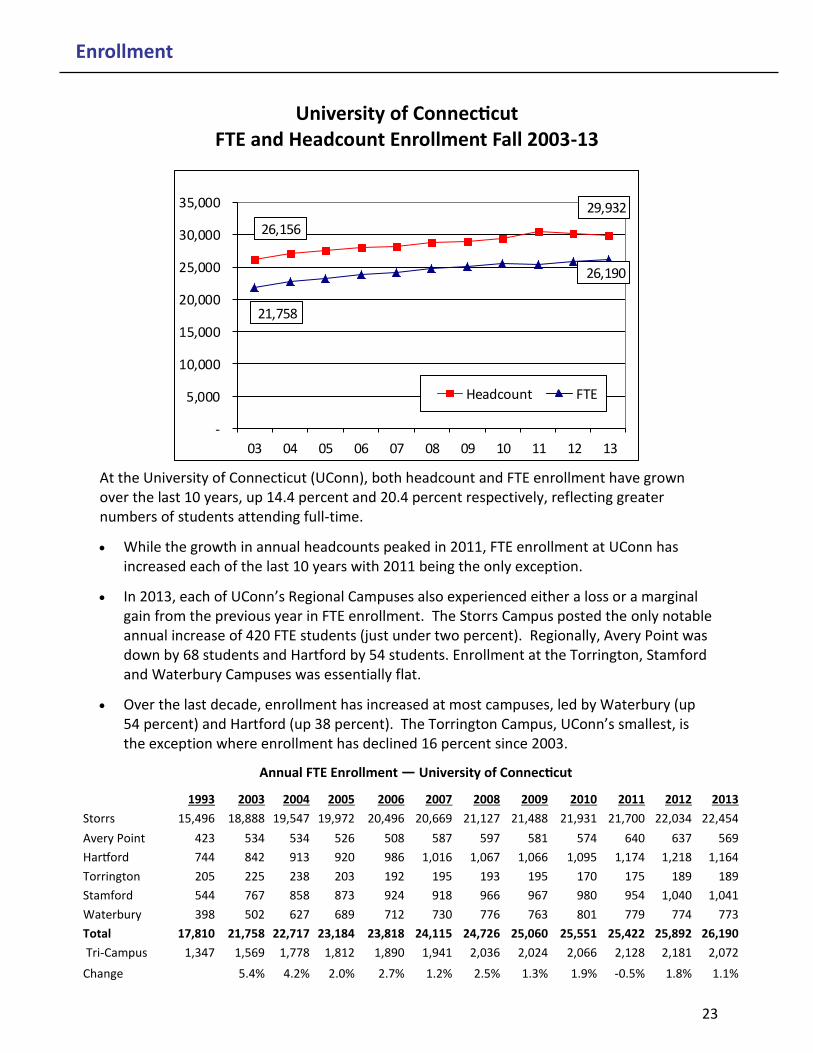
University of Connecticut FTE and Headcount Enrollment Fall 2003-13
At the University of Connecticut (UConn), both headcount and FTE enrollment have grown over the last 10 years, up 14.4 percent and 20.4 percent respectively, reflecting greater numbers of students attending full-time.
While the growth in annual headcounts peaked in 2011, FTE enrollment at UConn has increased each of the last 10 years with 2011 being the only exception.
In 2013, each of UConn’s Regional Campuses also experienced either a loss or a marginal gain from the previous year in FTE enrollment. The Storrs Campus posted the only notable annual increase of 420 FTE students (just under two percent). Regionally, Avery Point was down by 68 students and Hartford by 54 students. Enrollment at the Torrington, Stamford and Waterbury Campuses was essentially flat.
Over the last decade, enrollment has increased at most campuses, led by Waterbury (up 54 percent) and Hartford (up 38 percent). The Torrington Campus, UConn’s smallest, is the exception where enrollment has declined 16 percent since 2003.
1993 2003 2004 2005 2006 2007 2008 2009 2010 2011 2012 2013
Storrs 15,496 18,888 19,547 19,972 20,496 20,669 21,127 21,488 21,931 21,700 22,034 22,454
Avery Point 423 534 534 526 508 587 597 581 574 640 637 569
Hartford 744 842 913 920 986 1,016 1,067 1,066 1,095 1,174 1,218 1,164
Torrington 205 225 238 203 192 195 193 195 170 175 189 189
Stamford 544 767 858 873 924 918 966 967 980 954 1,040 1,041
Waterbury 398 502 627 689 712 730 776 763 801 779 774 773
Total 17,810 21,758 22,717 23,184 23,818 24,115 24,726 25,060 25,551 25,422 25,892 26,190
Tri-Campus 1,347 1,569 1,778 1,812 1,890 1,941 2,036 2,024 2,066 2,128 2,181 2,072
Change 5.4% 4.2% 2.0% 2.7% 1.2% 2.5% 1.3% 1.9% -0.5% 1.8% 1.1%
Annual FTE Enrollment — University of Connecticut
Enrollment
26,156
29,932
21,758
26,190
-
5,000
10,000
15,000
20,000
25,000
30,000
35,000
03 04 05 06 07 08 09 10 11 12 13
Headcount FTE
23
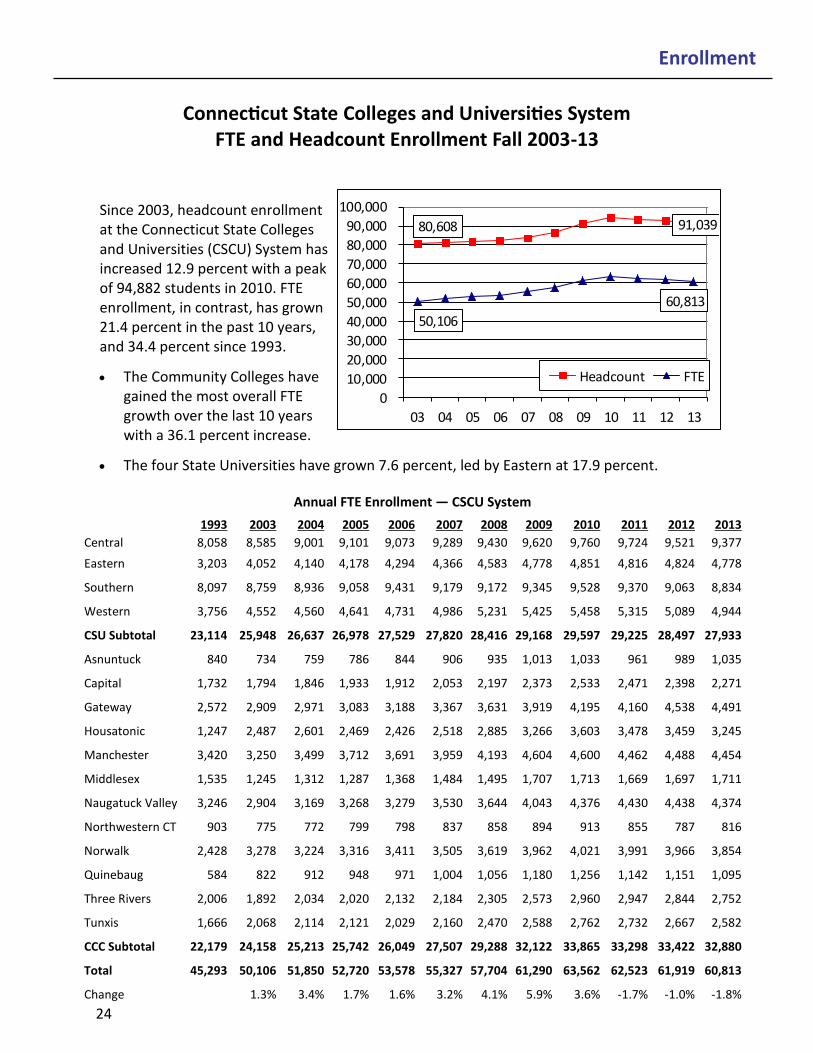
Connecticut State Colleges and Universities System FTE and Headcount Enrollment Fall 2003-13
Since 2003, headcount enrollment at the Connecticut State Colleges and Universities (CSCU) System has increased 12.9 percent with a peak of 94,882 students in 2010. FTE enrollment, in contrast, has grown 21.4 percent in the past 10 years, and 34.4 percent since 1993.
The Community Colleges have gained the most overall FTE growth over the last 10 years with a 36.1 percent increase.
The four State Universities have grown 7.6 percent, led by Eastern at 17.9 percent.
1993 2003 2004 2005 2006 2007 2008 2009 2010 2011 2012 2013
Central 8,058 8,585 9,001 9,101 9,073 9,289 9,430 9,620 9,760 9,724 9,521 9,377
Eastern 3,203 4,052 4,140 4,178 4,294 4,366 4,583 4,778 4,851 4,816 4,824 4,778
Southern 8,097 8,759 8,936 9,058 9,431 9,179 9,172 9,345 9,528 9,370 9,063 8,834
Western 3,756 4,552 4,560 4,641 4,731 4,986 5,231 5,425 5,458 5,315 5,089 4,944
CSU Subtotal 23,114 25,948 26,637 26,978 27,529 27,820 28,416 29,168 29,597 29,225 28,497 27,933
Asnuntuck 840 734 759 786 844 906 935 1,013 1,033 961 989 1,035
Capital 1,732 1,794 1,846 1,933 1,912 2,053 2,197 2,373 2,533 2,471 2,398 2,271
Gateway 2,572 2,909 2,971 3,083 3,188 3,367 3,631 3,919 4,195 4,160 4,538 4,491
Housatonic 1,247 2,487 2,601 2,469 2,426 2,518 2,885 3,266 3,603 3,478 3,459 3,245
Manchester 3,420 3,250 3,499 3,712 3,691 3,959 4,193 4,604 4,600 4,462 4,488 4,454
Middlesex 1,535 1,245 1,312 1,287 1,368 1,484 1,495 1,707 1,713 1,669 1,697 1,711
Naugatuck Valley 3,246 2,904 3,169 3,268 3,279 3,530 3,644 4,043 4,376 4,430 4,438 4,374
Northwestern CT 903 775 772 799 798 837 858 894 913 855 787 816
Norwalk 2,428 3,278 3,224 3,316 3,411 3,505 3,619 3,962 4,021 3,991 3,966 3,854
Quinebaug 584 822 912 948 971 1,004 1,056 1,180 1,256 1,142 1,151 1,095
Three Rivers 2,006 1,892 2,034 2,020 2,132 2,184 2,305 2,573 2,960 2,947 2,844 2,752
Tunxis 1,666 2,068 2,114 2,121 2,029 2,160 2,470 2,588 2,762 2,732 2,667 2,582
CCC Subtotal 22,179 24,158 25,213 25,742 26,049 27,507 29,288 32,122 33,865 33,298 33,422 32,880
Total 45,293 50,106 51,850 52,720 53,578 55,327 57,704 61,290 63,562 62,523 61,919 60,813
Change 1.3% 3.4% 1.7% 1.6% 3.2% 4.1% 5.9% 3.6% -1.7% -1.0% -1.8%
Annual FTE Enrollment — CSCU System
Enrollment
80,608 91,039
50,106
60,813
0
10,000
20,000
30,000
40,000
50,000
60,000
70,000
80,000
90,000
100,000
03 04 05 06 07 08 09 10 11 12 13
Headcount FTE
24
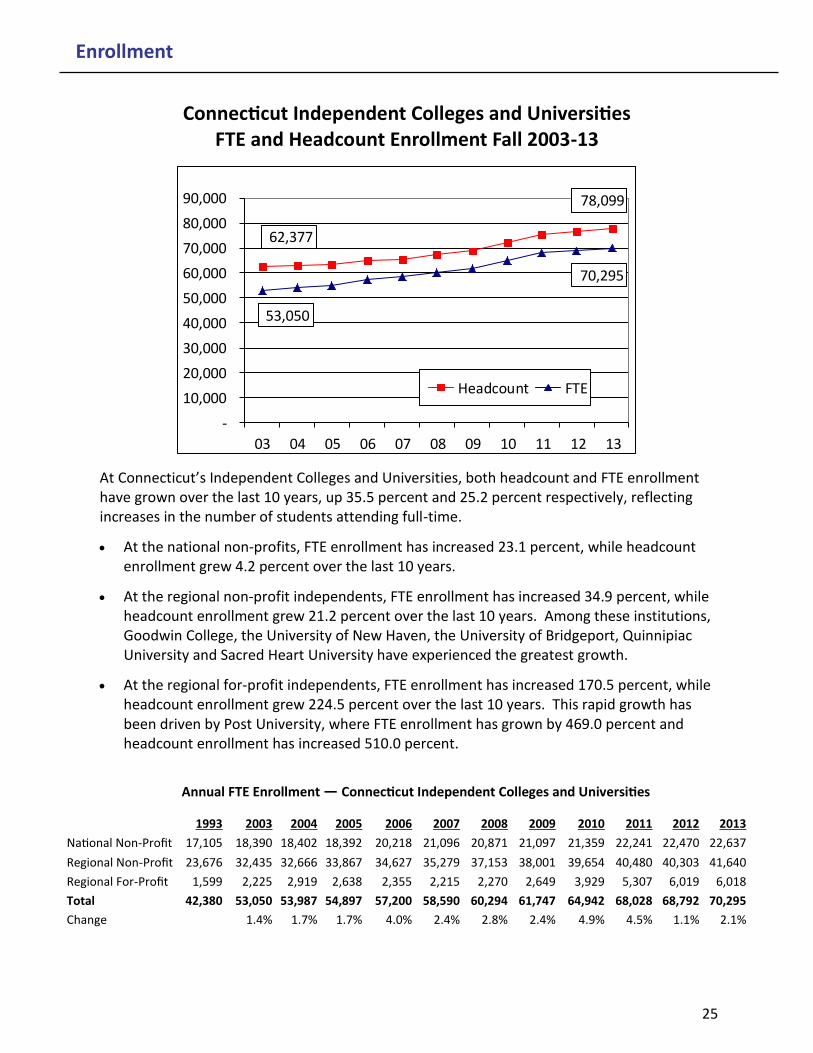
Connecticut Independent Colleges and Universities FTE and Headcount Enrollment Fall 2003-13
At Connecticut’s Independent Colleges and Universities, both headcount and FTE enrollment have grown over the last 10 years, up 35.5 percent and 25.2 percent respectively, reflecting increases in the number of students attending full-time.
At the national non-profits, FTE enrollment has increased 23.1 percent, while headcount enrollment grew 4.2 percent over the last 10 years.
At the regional non-profit independents, FTE enrollment has increased 34.9 percent, while headcount enrollment grew 21.2 percent over the last 10 years. Among these institutions, Goodwin College, the University of New Haven, the University of Bridgeport, Quinnipiac University and Sacred Heart University have experienced the greatest growth.
At the regional for-profit independents, FTE enrollment has increased 170.5 percent, while headcount enrollment grew 224.5 percent over the last 10 years. This rapid growth has been driven by Post University, where FTE enrollment has grown by 469.0 percent and headcount enrollment has increased 510.0 percent.
1993 2003 2004 2005 2006 2007 2008 2009 2010 2011 2012 2013
National Non-Profit 17,105 18,390 18,402 18,392 20,218 21,096 20,871 21,097 21,359 22,241 22,470 22,637
Regional Non-Profit 23,676 32,435 32,666 33,867 34,627 35,279 37,153 38,001 39,654 40,480 40,303 41,640
Regional For-Profit 1,599 2,225 2,919 2,638 2,355 2,215 2,270 2,649 3,929 5,307 6,019 6,018
Total 42,380 53,050 53,987 54,897 57,200 58,590 60,294 61,747 64,942 68,028 68,792 70,295
Change 1.4% 1.7% 1.7% 4.0% 2.4% 2.8% 2.4% 4.9% 4.5% 1.1% 2.1%
Annual FTE Enrollment — Connecticut Independent Colleges and Universities
Enrollment
62,377
78,099
53,050
70,295
-
10,000
20,000
30,000
40,000
50,000
60,000
70,000
80,000
90,000
03 04 05 06 07 08 09 10 11 12 13
Headcount FTE
25
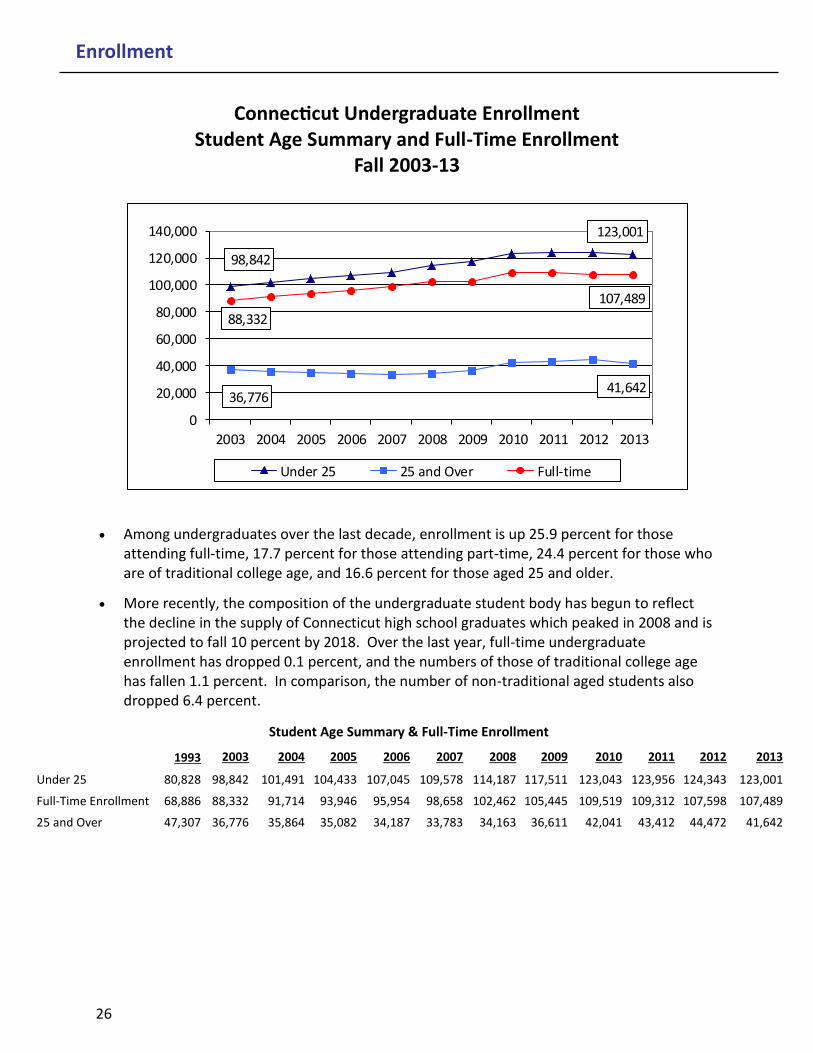
Connecticut Undergraduate Enrollment Student Age Summary and Full-Time Enrollment
Fall 2003-13
Among undergraduates over the last decade, enrollment is up 25.9 percent for those attending full-time, 17.7 percent for those attending part-time, 24.4 percent for those who are of traditional college age, and 16.6 percent for those aged 25 and older.
More recently, the composition of the undergraduate student body has begun to reflect the decline in the supply of Connecticut high school graduates which peaked in 2008 and is projected to fall 10 percent by 2018. Over the last year, full-time undergraduate enrollment has dropped 0.1 percent, and the numbers of those of traditional college age has fallen 1.1 percent. In comparison, the number of non-traditional aged students also dropped 6.4 percent.
1993 2003 2004 2005 2006 2007 2008 2009 2010 2011 2012 2013
Under 25 80,828 98,842 101,491 104,433 107,045 109,578 114,187 117,511 123,043 123,956 124,343 123,001
Full-Time Enrollment 68,886 88,332 91,714 93,946 95,954 98,658 102,462 105,445 109,519 109,312 107,598 107,489
25 and Over 47,307 36,776 35,864 35,082 34,187 33,783 34,163 36,611 42,041 43,412 44,472 41,642
Student Age Summary & Full-Time Enrollment
Enrollment
98,842
123,001
36,77641,642
88,332
107,489
0
20,000
40,000
60,000
80,000
100,000
120,000
140,000
2003 2004 2005 2006 2007 2008 2009 2010 2011 2012 2013
Under 25 25 and Over Full-time
26
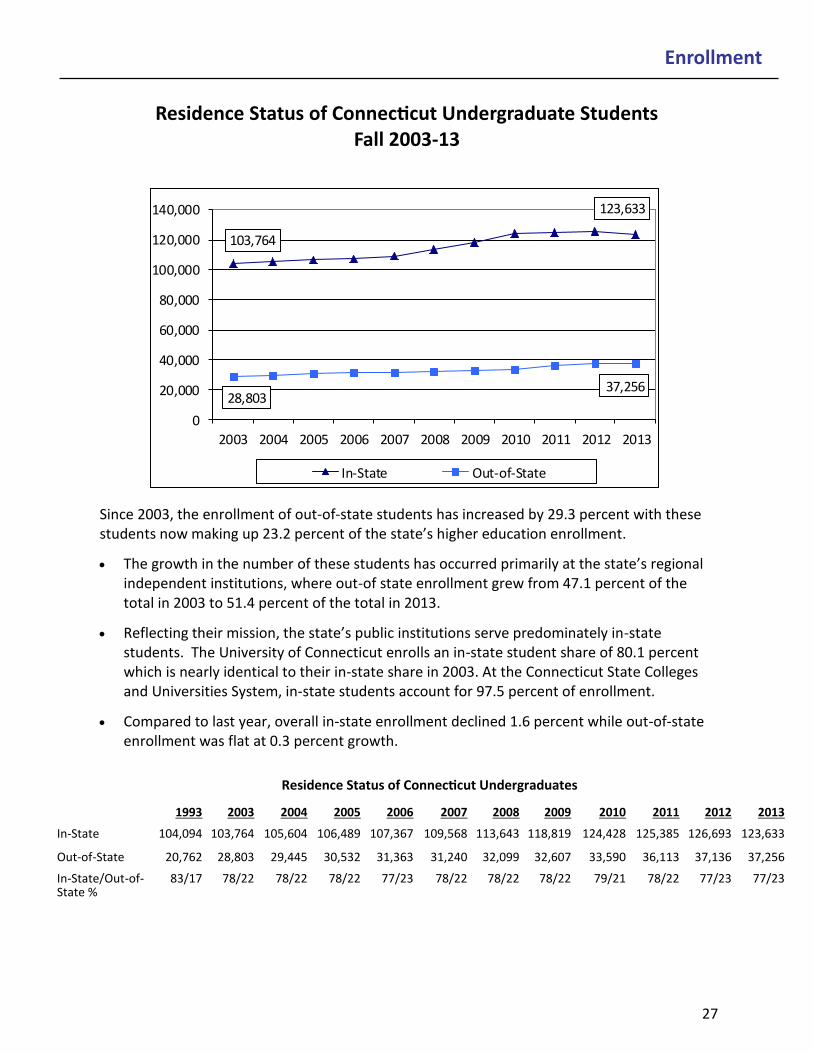
Residence Status of Connecticut Undergraduate Students Fall 2003-13
Since 2003, the enrollment of out-of-state students has increased by 29.3 percent with these students now making up 23.2 percent of the state’s higher education enrollment.
The growth in the number of these students has occurred primarily at the state’s regional independent institutions, where out-of state enrollment grew from 47.1 percent of the total in 2003 to 51.4 percent of the total in 2013.
Reflecting their mission, the state’s public institutions serve predominately in-state students. The University of Connecticut enrolls an in-state student share of 80.1 percent which is nearly identical to their in-state share in 2003. At the Connecticut State Colleges and Universities System, in-state students account for 97.5 percent of enrollment.
Compared to last year, overall in-state enrollment declined 1.6 percent while out-of-state enrollment was flat at 0.3 percent growth.
1993 2003 2004 2005 2006 2007 2008 2009 2010 2011 2012 2013
In-State 104,094 103,764 105,604 106,489 107,367 109,568 113,643 118,819 124,428 125,385 126,693 123,633
Out-of-State 20,762 28,803 29,445 30,532 31,363 31,240 32,099 32,607 33,590 36,113 37,136 37,256
In-State/Out-of-State %
83/17 78/22 78/22 78/22 77/23 78/22 78/22 78/22 79/21 78/22 77/23 77/23
Residence Status of Connecticut Undergraduates
Enrollment
103,764
123,633
28,80337,256
0
20,000
40,000
60,000
80,000
100,000
120,000
140,000
2003 2004 2005 2006 2007 2008 2009 2010 2011 2012 2013
In-State Out-of-State
27
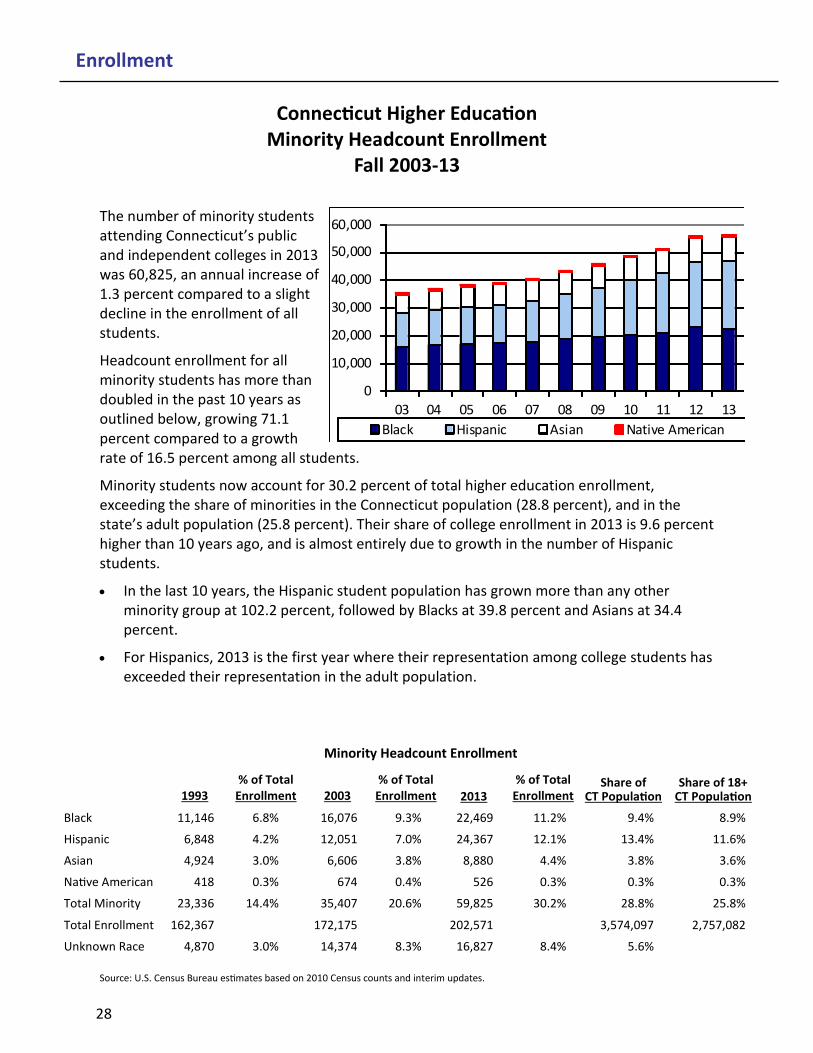
Connecticut Higher Education Minority Headcount Enrollment
Fall 2003-13
The number of minority students attending Connecticut’s public and independent colleges in 2013 was 60,825, an annual increase of 1.3 percent compared to a slight decline in the enrollment of all students.
Headcount enrollment for all minority students has more than doubled in the past 10 years as outlined below, growing 71.1 percent compared to a growth rate of 16.5 percent among all students.
Minority students now account for 30.2 percent of total higher education enrollment, exceeding the share of minorities in the Connecticut population (28.8 percent), and in the state’s adult population (25.8 percent). Their share of college enrollment in 2013 is 9.6 percent higher than 10 years ago, and is almost entirely due to growth in the number of Hispanic students.
In the last 10 years, the Hispanic student population has grown more than any other minority group at 102.2 percent, followed by Blacks at 39.8 percent and Asians at 34.4 percent.
For Hispanics, 2013 is the first year where their representation among college students has exceeded their representation in the adult population.
Minority Headcount Enrollment
1993 % of Total
Enrollment 2003 % of Total
Enrollment 2013
% of Total Enrollment
Share of CT Population
Share of 18+ CT Population
Black 11,146 6.8% 16,076 9.3% 22,469 11.2% 9.4% 8.9%
Hispanic 6,848 4.2% 12,051 7.0% 24,367 12.1% 13.4% 11.6%
Asian 4,924 3.0% 6,606 3.8% 8,880 4.4% 3.8% 3.6%
Native American 418 0.3% 674 0.4% 526 0.3% 0.3% 0.3%
Total Minority 23,336 14.4% 35,407 20.6% 59,825 30.2% 28.8% 25.8%
Total Enrollment 162,367 172,175 202,571 3,574,097 2,757,082
Unknown Race 4,870 3.0% 14,374 8.3% 16,827 8.4% 5.6%
Source: U.S. Census Bureau estimates based on 2010 Census counts and interim updates.
Enrollment
0
10,000
20,000
30,000
40,000
50,000
60,000
03 04 05 06 07 08 09 10 11 12 13
Black Hispanic Asian Native American
28
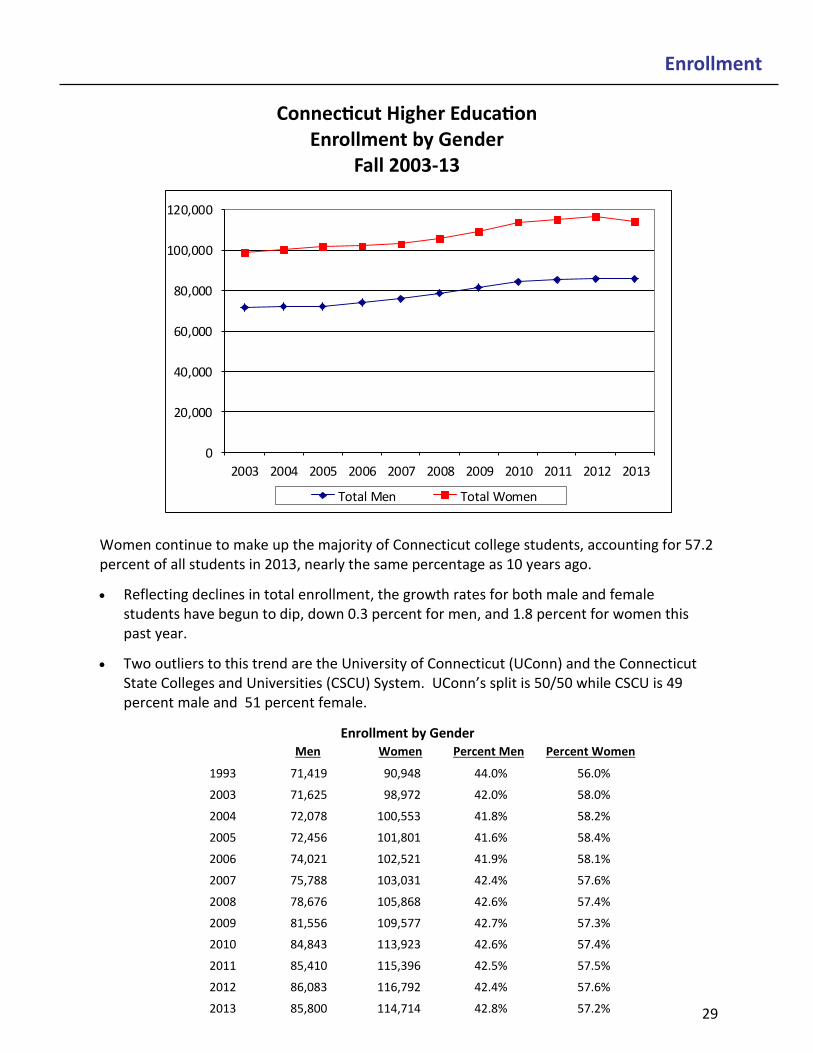
Connecticut Higher Education Enrollment by Gender
Fall 2003-13
Women continue to make up the majority of Connecticut college students, accounting for 57.2 percent of all students in 2013, nearly the same percentage as 10 years ago.
Reflecting declines in total enrollment, the growth rates for both male and female students have begun to dip, down 0.3 percent for men, and 1.8 percent for women this past year.
Two outliers to this trend are the University of Connecticut (UConn) and the Connecticut State Colleges and Universities (CSCU) System. UConn’s split is 50/50 while CSCU is 49 percent male and 51 percent female.
Men Women Percent Men Percent Women
1993 71,419 90,948 44.0% 56.0%
2003 71,625 98,972 42.0% 58.0%
2004 72,078 100,553 41.8% 58.2%
2005 72,456 101,801 41.6% 58.4%
2006 74,021 102,521 41.9% 58.1%
2007 75,788 103,031 42.4% 57.6%
2008 78,676 105,868 42.6% 57.4%
2009 81,556 109,577 42.7% 57.3%
2010 84,843 113,923 42.6% 57.4%
2011 85,410 115,396 42.5% 57.5%
2012 86,083 116,792 42.4% 57.6%
2013 85,800 114,714 42.8% 57.2%
Enrollment
Enrollment by Gender
0
20,000
40,000
60,000
80,000
100,000
120,000
2003 2004 2005 2006 2007 2008 2009 2010 2011 2012 2013
Total Men Total Women
29
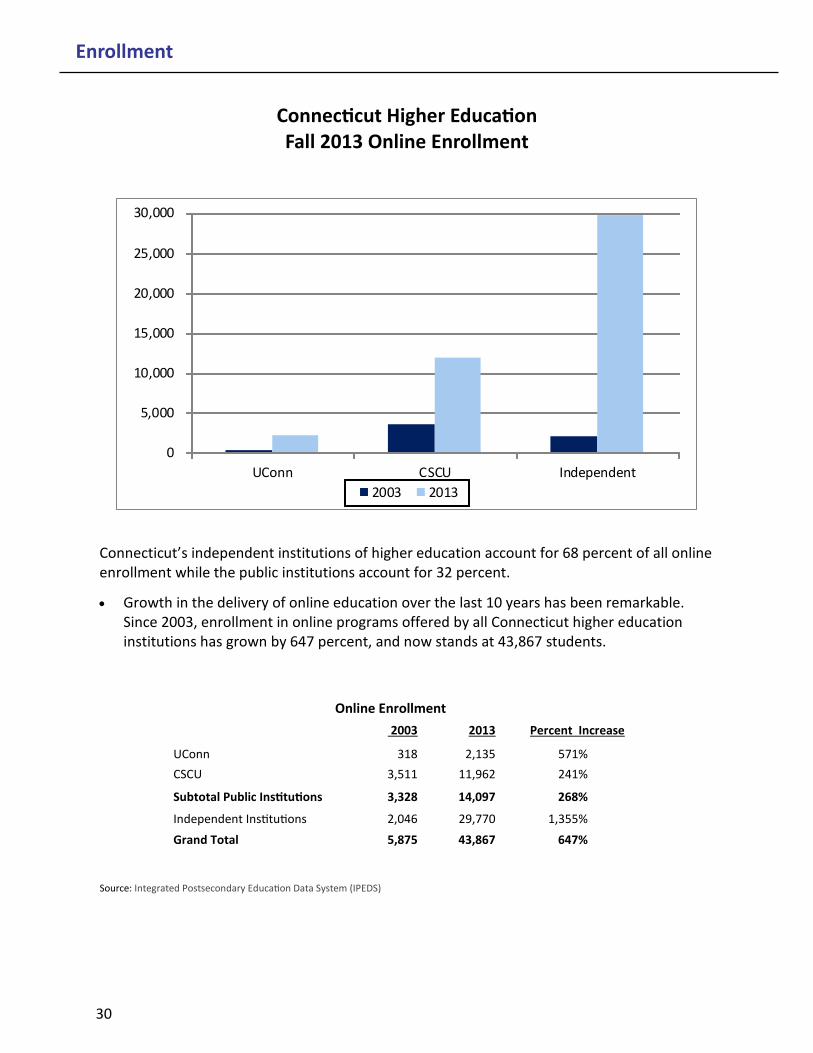
Connecticut Higher Education Fall 2013 Online Enrollment
Connecticut’s independent institutions of higher education account for 68 percent of all online enrollment while the public institutions account for 32 percent.
Growth in the delivery of online education over the last 10 years has been remarkable. Since 2003, enrollment in online programs offered by all Connecticut higher education institutions has grown by 647 percent, and now stands at 43,867 students.
Online Enrollment
2003 2013 Percent Increase
UConn 318 2,135 571%
CSCU 3,511 11,962 241%
Subtotal Public Institutions 3,328 14,097 268%
Independent Institutions 2,046 29,770 1,355%
Grand Total 5,875 43,867 647%
Source: Integrated Postsecondary Education Data System (IPEDS)
Enrollment
0
5,000
10,000
15,000
20,000
25,000
30,000
UConn CSCU Independent
2003 2013
30