Embed Size (px)
Citation preview
Bristol New Britain
Hartford
New London
Norwich
Putnam
Willimantic
Middletown
New Haven
Milford
Meriden
Waterbury
Danbury
Bridgeport
Norwalk
Stamford
Winsted
Canaan
Torrington
Northwestern Connecticut Community College
Asnuntuck Community College
Quinebaug Community College
Three Rivers Community College
Eastern Connecticut State UniversityCentral Connecticut State University
Western Connecticut State University
Southern Connecticut State University
Housatonic Community College
Norwalk Community College
Gateway Community College
Middlesex Community College
Capital Community CollegeManchester Community College
Tunxis Community College
Naugatuck Valley Community College
CONNECTICUT STATE COLLEGES & UNIVERSITIES
ENERGY MASTER PLANAUGUST 2017
VOLUME II: CHAPTERS 6.1 - 6.6

106 ENERGY MASTER PLAN // Connecticut State Colleges & Universities
// 107
04
FINA
NC
ING
/FUN
DIN
G
OP
PO
RTU
NITIE
S
01
INTR
OD
UC
TION
06
CA
MP
US
P
LAN
S
05
SYS
TEM
LEVE
L R
EC
OM
ME
ND
ATION
S
02
SYS
TEN
LEVE
LE
XISTIN
G C
ON
DITIO
NS
03
SYS
TEM
LEVE
L E
NE
RG
Y NE
ED
S6 CAMPUS PLANS

108 ENERGY MASTER PLAN // Connecticut State Colleges & Universities
109
04
FINA
NC
ING
/FUN
DIN
G
OP
PO
RTU
NITIE
S
01
INTR
OD
UC
TION
06
CA
MP
US
P
LAN
S
05
SYS
TEM
LEVE
L R
EC
OM
ME
ND
ATION
S
02
SYS
TEN
LEVE
LE
XISTIN
G C
ON
DITIO
NS
03
SYS
TEM
LEVE
L E
NE
RG
Y NE
ED
S
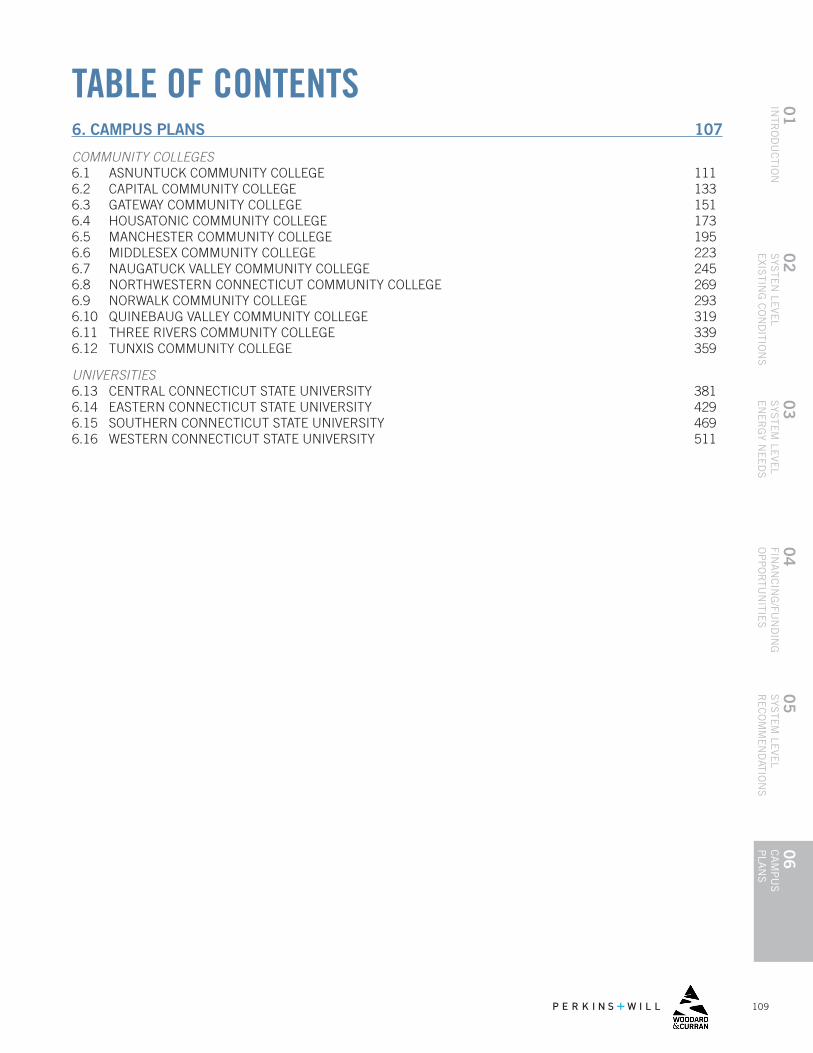
TABLE OF CONTENTS6. CAMPUS PLANS 107
COMMUNITY COLLEGES6.1 ASNUNTUCK COMMUNITY COLLEGE 1116.2 CAPITAL COMMUNITY COLLEGE 1336.3 GATEWAY COMMUNITY COLLEGE 1516.4 HOUSATONIC COMMUNITY COLLEGE 1736.5 MANCHESTER COMMUNITY COLLEGE 1956.6 MIDDLESEX COMMUNITY COLLEGE 2236.7 NAUGATUCK VALLEY COMMUNITY COLLEGE 2456.8 NORTHWESTERN CONNECTICUT COMMUNITY COLLEGE 2696.9 NORWALK COMMUNITY COLLEGE 2936.10 QUINEBAUG VALLEY COMMUNITY COLLEGE 3196.11 THREE RIVERS COMMUNITY COLLEGE 3396.12 TUNXIS COMMUNITY COLLEGE 359
UNIVERSITIES6.13 CENTRAL CONNECTICUT STATE UNIVERSITY 3816.14 EASTERN CONNECTICUT STATE UNIVERSITY 4296.15 SOUTHERN CONNECTICUT STATE UNIVERSITY 4696.16 WESTERN CONNECTICUT STATE UNIVERSITY 511

110 ENERGY MASTER PLAN // Connecticut State Colleges & Universities
// 111
04
FINA
NC
ING
/FUN
DIN
G
OP
PO
RTU
NITIE
S
01
INTR
OD
UC
TION
06
CA
MP
US
P
LAN
S
05
SYS
TEM
LEVE
L R
EC
OM
ME
ND
ATION
S
02
SYS
TEN
LEVE
LE
XISTIN
G C
ON
DITIO
NS
03
SYS
TEM
LEVE
L E
NE
RG
Y NE
ED
S
6.1ASNUNTUCK COMMUNITY
COLLEGE

112 ENERGY MASTER PLAN // Connecticut State Colleges & Universities
EXECUTIVE SUMMARY 114
1. INTRODUCTION 118
1.1 ASNUNTUCK OVERVIEW
1.2 PREVIOUS ENERGY STUDIES & PROJECTS
2. EXISTING CONDITIONS AND RECOMMENDATIONS 120
2.1 FACILITY ENERGY BENCHMARKING AND ENERGY CONSUMPTION
2.2 CAMPUS UTILITIES AND DISTRIBUTION121
2.3 ENERGY PROCUREMENT
2.4 OPERATIONAL AND ENERGY MANAGEMENT PRACTICES 2.4.1 CURRENT CONDITIONS 2.4.2 RECOMMENDATIONS 2.5 EXISTING BUILDING COMMISSIONING 2.5.1 CURRENT CONDITIONS 2.5.2 RECOMMENDATIONS
2.6 MECHANICAL SYSTEMS 2.6.1 CURRENT CONDITIONS 2.6.2 RECOMMENDATIONS
2.7 LIGHTING 2.7.1 CURRENT CONDITIONS 2.7.2 RECOMMENDATIONS
2.8 BUILDING ENVELOPE 2.8.1 CURRENT CONDITIONS 2.8.2 RECOMMENDATIONS
2.9 DISTRICT ENERGY / COGENERATION 2.9.1 CURRENT CONDITIONS 2.9.2 RECOMMENDATIONS
2.10 RENEWABLE ENERGY 2.10.1 CURRENT CONDITIONS 2.10.2 RECOMMENDATIONS
2.11 CAPITAL PLANNING 2.11.1 CURRENT CONDITIONS 2.11.2 RECOMMENDATIONS
2.12 COLLABORATION / PARTNERSHIP 2.12.1 CURRENT CONDITIONS 2.12.2 RECOMMENDATIONS
2.13 SUMMARY OF RECOMMENDED ENERGY EFFICIENCY OPPORTUNITIES
TABLE OF CONTENTS
113
04
FINA
NC
ING
/FUN
DIN
G
OP
PO
RTU
NITIE
S
01
INTR
OD
UC
TION
06
CA
MP
US
P
LAN
S
05
SYS
TEM
LEVE
L R
EC
OM
ME
ND
ATION
S
02
SYS
TEN
LEVE
LE
XISTIN
G C
ON
DITIO
NS
03
SYS
TEM
LEVE
L E
NE
RG
Y NE
ED
S
LIST OF FIGURES FIGURE 1: ASNUNTUCK COMMUNITY COLLEGE ENERGY DASHBOARD 114FIGURE 1.1: BUILDING MAP 2013 118FIGURE 2.1: ASNUNTUCK COMMUNITY COLLEGE ENERGY DASHBOARD 120FIGURE 2.2: BOILER CONTROL SYSTEM 122FIGURE 2.3: YVAA EFFICIENCY VS. ORDINARY CHILLER 123FIGURE 2.4: FUME HOOD 123FIGURE 2.5: LIGHTING SENSOR 124FIGURE 2.6: ASNUNTUCK CAMPUS SOLAR POTENTIAL 126
LIST OF TABLES TABLE 1: ENERGY COST COMPARISON (FY 2014) 115TABLE 2: ASNUNTUCK ENERGY EFFICIENCY MEASURES 116TABLE 2.1: ASNUNTUCK FY 14 ENERGY SPEND COMPARISON 121TABLE 2.2: ASNUNTUCK POTENTIAL AREAS FOR SOLAR PV 125TABLE 2.3: ASNUNTUCK ENERGY EFFICIENCY MEASURES 128
3. ENERGY NEEDS 129
3.1 FUTURE DEVELOPMENT129
3.2 ENERGY RESILIENCY RECOMMENDATIONS129
4. CONCLUSION / NEXT STEPS 130
4.1 CONTACT INFORMATION FOR KEY STAKEHOLDERS
APPENDIX 131APPENDIX A: ASNUNTUCK DATA METHODOLOGY, ASSUMPTIONS AND NOTES
114 ENERGY MASTER PLAN // Connecticut State Colleges & Universities
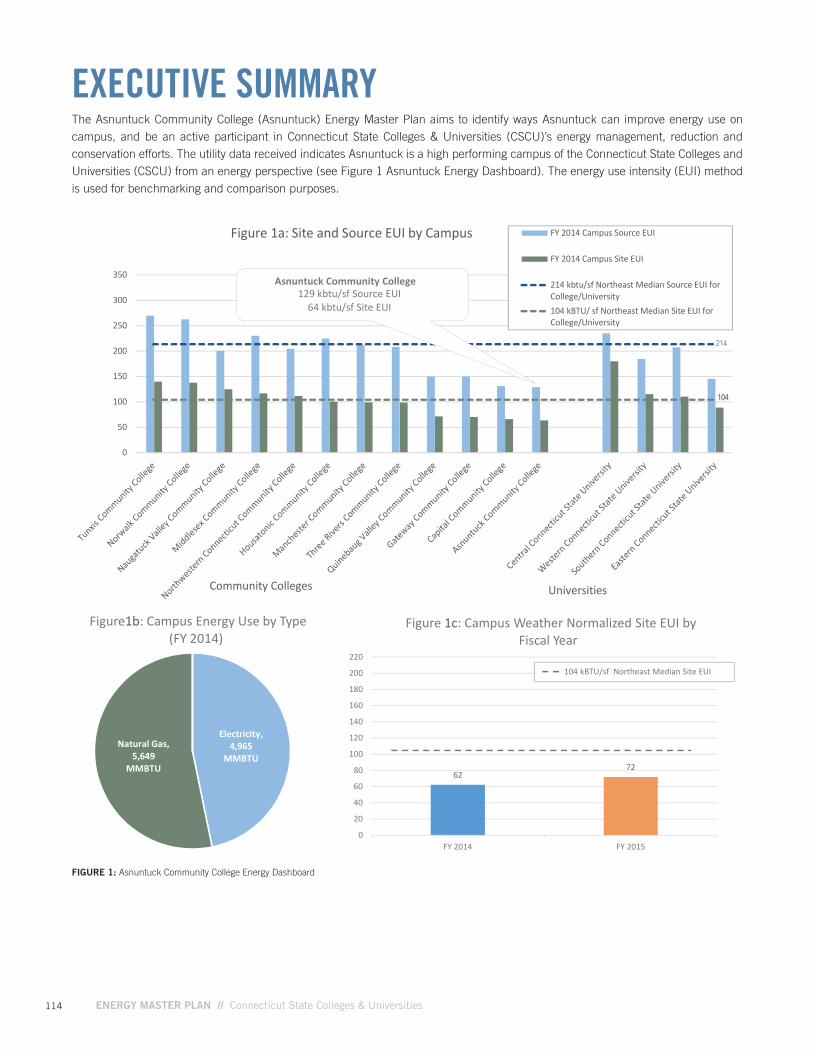
EXECUTIVE SUMMARYThe Asnuntuck Community College (Asnuntuck) Energy Master Plan aims to identify ways Asnuntuck can improve energy use on campus, and be an active participant in Connecticut State Colleges & Universities (CSCU)’s energy management, reduction and conservation efforts. The utility data received indicates Asnuntuck is a high performing campus of the Connecticut State Colleges and Universities (CSCU) from an energy perspective (see Figure 1 Asnuntuck Energy Dashboard). The energy use intensity (EUI) method is used for benchmarking and comparison purposes.
FIGURE 1: Asnuntuck Community College Energy Dashboard
DRAFT Central Dashboard May 2016
Electricity,4,965
MMBTU
Natural Gas,5,649
MMBTU
Figure1b: Campus Energy Use by Type(FY 2014)
6272
0
20
40
60
80
100
120
140
160
180
200
220
FY 2014 FY 2015
Figure 1c: Campus Weather Normalized Site EUI byFiscal Year
104 kBTU/sf Northeast Median Site EUI
* Only buildings with both electricity and fuel submetering data are shown.
0
50
100
150
200
250
300
350
Figure 1a: Site and Source EUI by Campus FY 2014 Campus Source EUI
FY 2014 Campus Site EUI
214 kbtu/sf Northeast Median Source EUI forCollege/University104 kBTU/ sf Northeast Median Site EUI forCollege/University
104104
214
UniversitiesCommunity Colleges
Asnuntuck Community College129 kbtu/sf Source EUI
64 kbtu/sf Site EUI
115
04
FINA
NC
ING
/FUN
DIN
G
OP
PO
RTU
NITIE
S
01
INTR
OD
UC
TION
06
CA
MP
US
P
LAN
S
05
SYS
TEM
LEVE
L R
EC
OM
ME
ND
ATION
S
02
SYS
TEN
LEVE
LE
XISTIN
G C
ON
DITIO
NS
03
SYS
TEM
LEVE
L E
NE
RG
Y NE
ED
S
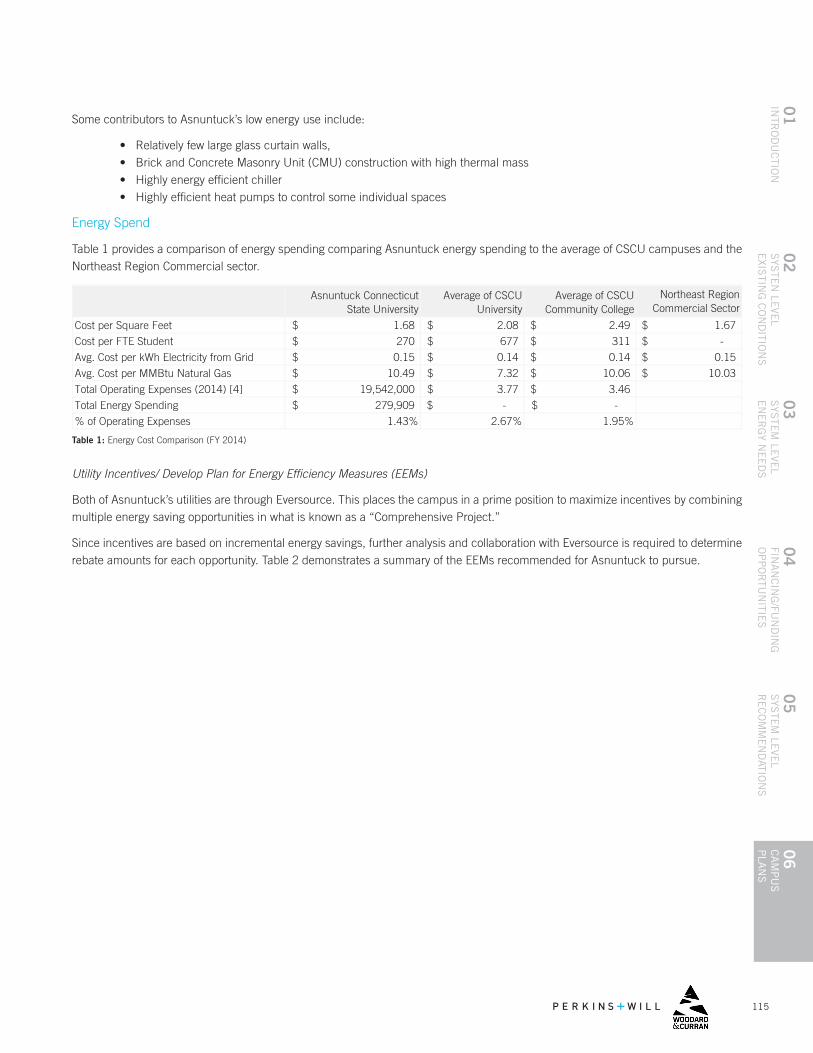
Table 1: Energy Cost Comparison (FY 2014)
Utility Incentives/ Develop Plan for Energy Efficiency Measures (EEMs)
Both of Asnuntuck’s utilities are through Eversource. This places the campus in a prime position to maximize incentives by combining multiple energy saving opportunities in what is known as a “Comprehensive Project.”
Since incentives are based on incremental energy savings, further analysis and collaboration with Eversource is required to determine rebate amounts for each opportunity. Table 2 demonstrates a summary of the EEMs recommended for Asnuntuck to pursue.
Some contributors to Asnuntuck’s low energy use include:
• Relatively few large glass curtain walls, • Brick and Concrete Masonry Unit (CMU) construction with high thermal mass • Highly energy efficient chiller • Highly efficient heat pumps to control some individual spaces
Energy Spend
Table 1 provides a comparison of energy spending comparing Asnuntuck energy spending to the average of CSCU campuses and the Northeast Region Commercial sector.
Northeast Region Commercial Sector
Cost per Square Feet 1.67$
Cost per FTE Student -$
Avg. Cost per kWh Electricity from Grid 0.15$
Avg. Cost per MMBtu Natural Gas 10.03$
Total Operating Expenses (2014) [4]
Total Energy Spending
% of Operating Expenses 1.43%
279,909$
0.15$
10.49$
19,542,000$
270$
Asnuntuck Connecticut State University
1.68$
Average of CSCU University
Average of CSCU Community College
2.08$ 2.49$
677$ 311$
-$ -$
2.67% 1.95%
0.14$ 0.14$
7.32$ 10.06$
3.77$ 3.46$

116 ENERGY MASTER PLAN // Connecticut State Colleges & Universities
TABLE 2: Asnuntuck Community College Energy Efficiency Measures
[1] LED lighting upgrade projects are given a priority 1 designation assuming they are combined with other measures and qualify for a “Comprehensive Project” with Eversource.
Opportunity ID Energy Conservation or Efficiency Opportunity
App. Cost (Before Rebate)
Payback w/rebate (Years) Priority
ACC-1Add variable frequency drives (VFDs) to chilled water pumps and upgrade motors to premium efficiency inverter duty. (20 HP)
$ 45,000 1-2 1
ACC-2 Implement fume hood management program. Varies Varies 1
ACC-3 Add VFDs to hot water pumps. (7.5 HP) $ 25,000 1-2 1
ACC-4Install new door seals to decrease infiltration. (Implement on all doors concurrent with Entry addition project)
$50-100 each door
>1-2 1
ACC-5Review pneumatic controlled heating, ventilation, and air conditioning (HVAC) systems and savings from potential upgrades with Eversource incentives.
Varies Varies 1
ACC-6Install light emitting diode (LED) lighting and controls, indoor and out after lighting audit.
Varies 3-7 1
ACC-7Evaluate and implement renewable energy photovoltaic solar system with 3rd party PPA contract.
0 Instantaneous 1
ACC-8
Decrease compressed air pressure before regulator in small increments as long as system still proves functional. Volume of air tank and requirements of instrumentation & controls (I&C) will determine minimum required pressure.
$0 <1 2
ACC-9
Add zone valves, tertiary loops or upgrade to variable refrigerant flow (VRF) system to control individual space temperature, specifically where area uses change or where sun exposure is different.
Varies Varies 2
ACC-10Install building management system (BMS) to include upgraded HVAC equipment and other existing building energy systems
600,000$ - 1,000,000$
Varies 2
ACC-11
Use temperature self-regulating heat trace tape with increased insulation on areas of piping susceptible to freezing so temperature setbacks can be re-employed on weekends and during colder weather.
Varies >1-2 2
ACC-12Utilize existing work order system for preventative maintenance.
Varies Varies 2
ACC-13
Evaluate annually the economic benefit from participating in a Demand Response program, both from credits provided by the utility and the reduction in electrical demand charges. Enroll if positive.
Varies Varies 3
ACC-14Convert pneumatic controlled HVAC systems to DDC and other upgrades based on future HVAC specific audit with Eversource.
Starting at $4.87/s.f.
Varies 3
117
04
FINA
NC
ING
/FUN
DIN
G
OP
PO
RTU
NITIE
S
01
INTR
OD
UC
TION
06
CA
MP
US
P
LAN
S
05
SYS
TEM
LEVE
L R
EC
OM
ME
ND
ATION
S
02
SYS
TEN
LEVE
LE
XISTIN
G C
ON
DITIO
NS
03
SYS
TEM
LEVE
L E
NE
RG
Y NE
ED
S
Next Steps
In addition to the priority projects, next steps for Asnuntuck are below:
Management
Asnuntuck should continue to review energy bills, including tracking energy use and comparing energy spend to available budgets.
Renewable Energy
Asnuntuck should consider parking lot solar photovoltaic (PV) arrays and ground mounted solar up to 1 MW with a power purchase agreement (PPA) on portions of the recreational fields. While there is limited shading on Asnuntuck’s roof, roof mechanical equipment provides an obstacle to the addition of solar PV on most of Asnuntuck’s roof. There is an estimated 100 kW of solar availability on the east side of the roof, and a small portion of the west side. Solar PV should also be incorporated into future capital planning building design.
By implementing the suggestions of the Energy Master Plan, Asnuntuck has the opportunity to create local and cost-effective power through solar PV, increase energy efficiency operations, and continue to manage energy as the campus evolves in the future.
118 ENERGY MASTER PLAN // Connecticut State Colleges & Universities
As part of the Connecticut State Colleges & Universities (CSCU) Energy Master Plan, Asnuntuck Community College (Asnuntuck)’s building infrastructure, energy use and energy management practices were assessed. The ultimate goal was to determine ways Asnuntuck could improve its energy use on campus, and be an active participant in CSCU energy reduction efforts. This chapter identifies Asnuntuck’s historical energy use, future projected needs and energy recommendations.
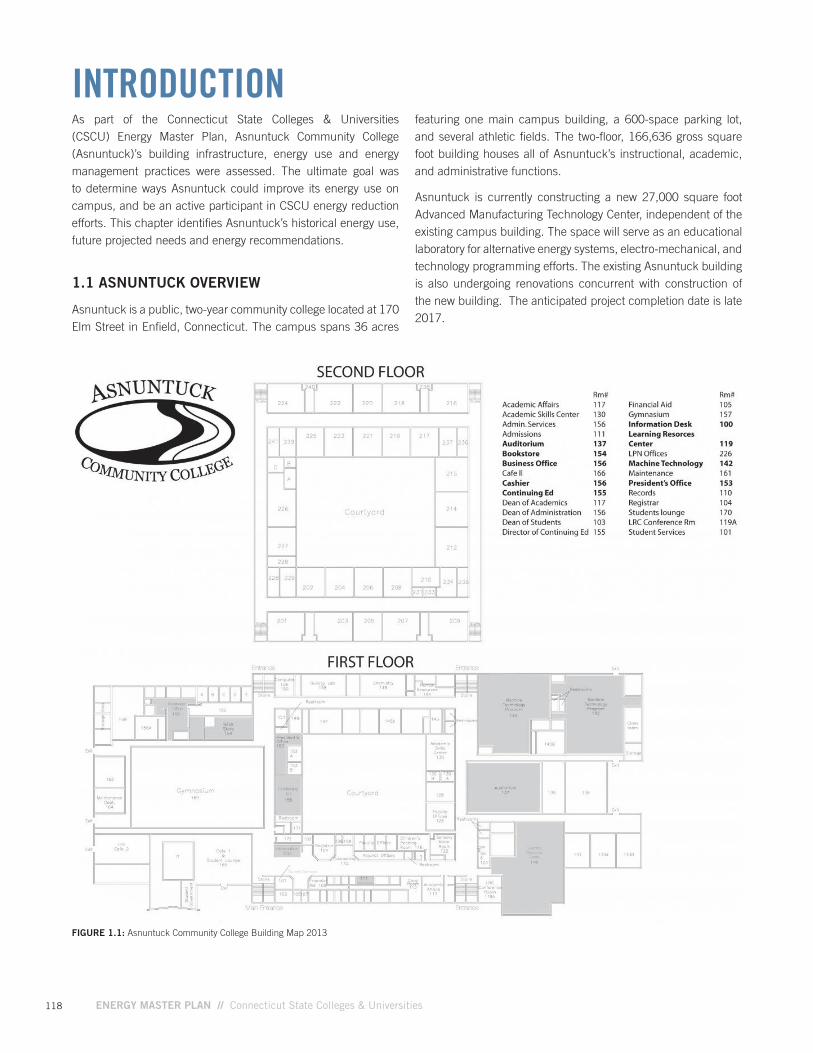
1.1 ASNUNTUCK OVERVIEW
Asnuntuck is a public, two-year community college located at 170 Elm Street in Enfield, Connecticut. The campus spans 36 acres
FIGURE 1.1: Asnuntuck Community College Building Map 2013
INTRODUCTIONfeaturing one main campus building, a 600-space parking lot, and several athletic fields. The two-floor, 166,636 gross square foot building houses all of Asnuntuck’s instructional, academic, and administrative functions.
Asnuntuck is currently constructing a new 27,000 square foot Advanced Manufacturing Technology Center, independent of the existing campus building. The space will serve as an educational laboratory for alternative energy systems, electro-mechanical, and technology programming efforts. The existing Asnuntuck building is also undergoing renovations concurrent with construction of the new building. The anticipated project completion date is late 2017.
119
04
FINA
NC
ING
/FUN
DIN
G
OP
PO
RTU
NITIE
S
01
INTR
OD
UC
TION
06
CA
MP
US
P
LAN
S
05
SYS
TEM
LEVE
L R
EC
OM
ME
ND
ATION
S
02
SYS
TEN
LEVE
LE
XISTIN
G C
ON
DITIO
NS
03
SYS
TEM
LEVE
L E
NE
RG
Y NE
ED
S
1.2 PREVIOUS ENERGY STUDIES & PROJECTS
Asnuntuck has not had any energy studies completed in the past. With aging systems, the campus has needed to spend the majority of time ensuring the operation of existing systems. As standard practice at Asnuntuck, at the end of existing equipment life, equipment is upgraded to have greater efficiency.
Previous energy projects and upgrades include:
• Upgraded lighting from T12 to T8
• Energy Standard ASHRAE 90.1 compliant air cooled chiller
• Various mini-split heat pumps
• New boiler pumps with high efficiency motors
120 ENERGY MASTER PLAN // Connecticut State Colleges & Universities
EXISTING CONDITIONS & RECOMMENDATIONSInformation on Asnuntuck’s existing conditions was captured from campus interviews, energy data and reports provided by the campus. A holistic view of existing practices, material on energy management, energy infrastructure and project implementation processes was reviewed. Analysis of the data and campus walkthroughs helped clarify recommendations with the goal of decreasing energy use, documented after each subheading.
FIGURE 2.1: Energy Dashboard - Asnuntuck Community College
Note: Northeast Median Site and Source EUI for College/University category, per Department of Energy Building Performance Database.
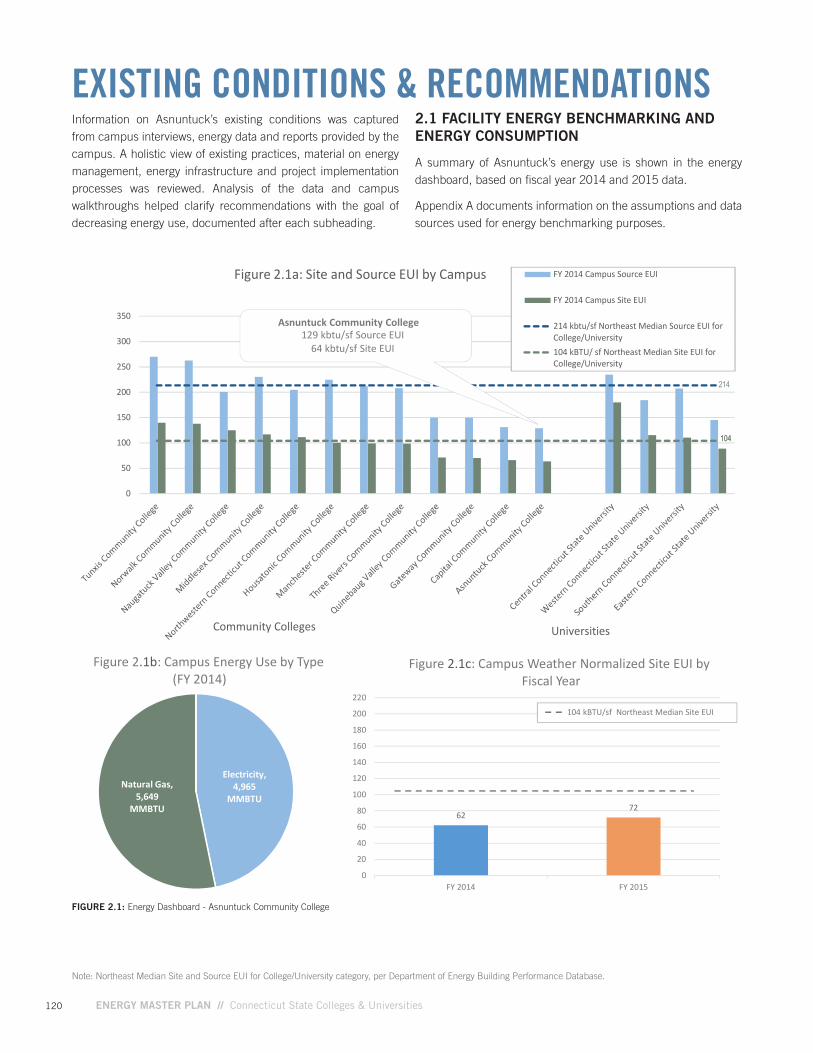
2.1 FACILITY ENERGY BENCHMARKING AND ENERGY CONSUMPTION
A summary of Asnuntuck’s energy use is shown in the energy dashboard, based on fiscal year 2014 and 2015 data.
Appendix A documents information on the assumptions and data sources used for energy benchmarking purposes.
DRAFT Central Dashboard May 2016
Electricity,4,965
MMBTU
Natural Gas,5,649
MMBTU
Figure 2.1b: Campus Energy Use by Type(FY 2014)
6272
0
20
40
60
80
100
120
140
160
180
200
220
FY 2014 FY 2015
Figure 2.1c: Campus Weather Normalized Site EUI byFiscal Year
104 kBTU/sf Northeast Median Site EUI
* Only buildings with both electricity and fuel submetering data are shown.
0
50
100
150
200
250
300
350
Figure 2.1a: Site and Source EUI by Campus FY 2014 Campus Source EUI
FY 2014 Campus Site EUI
214 kbtu/sf Northeast Median Source EUI forCollege/University104 kBTU/ sf Northeast Median Site EUI forCollege/University
104104
214
UniversitiesCommunity Colleges
Asnuntuck Community College129 kbtu/sf Source EUI
64 kbtu/sf Site EUI
121
04
FINA
NC
ING
/FUN
DIN
G
OP
PO
RTU
NITIE
S
01
INTR
OD
UC
TION
06
CA
MP
US
P
LAN
S
05
SYS
TEM
LEVE
L R
EC
OM
ME
ND
ATION
S
02
SYS
TEN
LEVE
LE
XISTIN
G C
ON
DITIO
NS
03
SYS
TEM
LEVE
L E
NE
RG
Y NE
ED
S
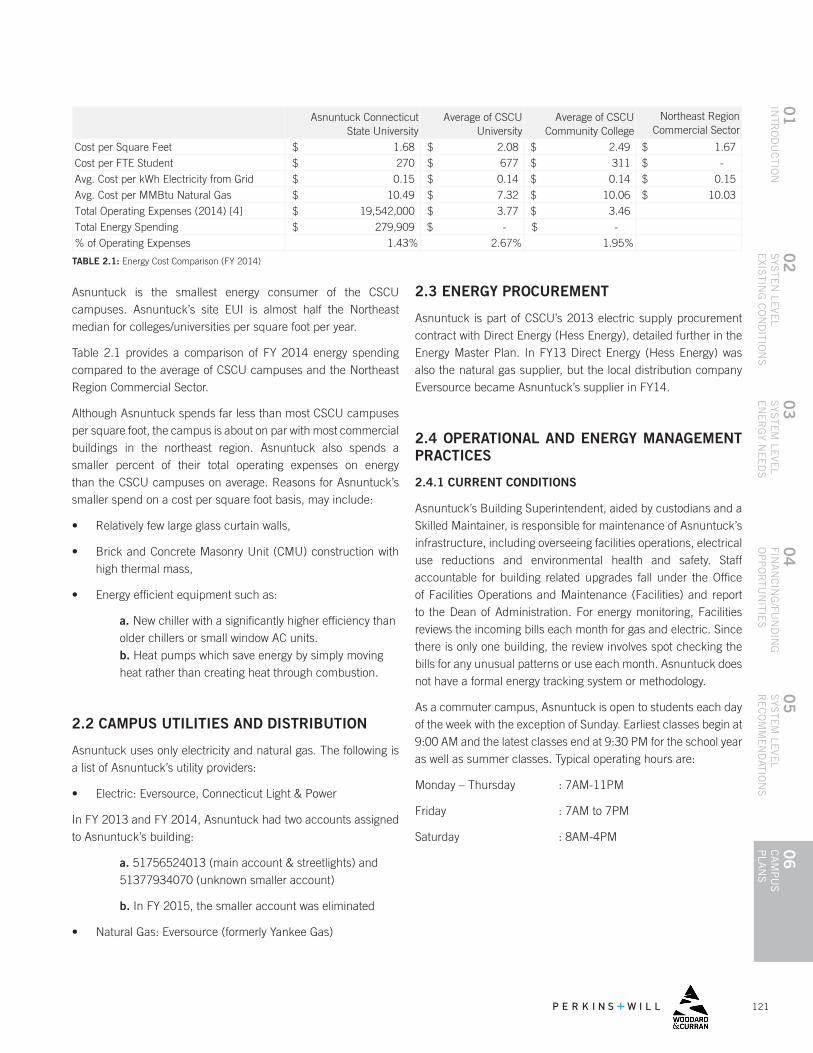
Asnuntuck is the smallest energy consumer of the CSCU campuses. Asnuntuck’s site EUI is almost half the Northeast median for colleges/universities per square foot per year.
Table 2.1 provides a comparison of FY 2014 energy spending compared to the average of CSCU campuses and the Northeast Region Commercial Sector.
Although Asnuntuck spends far less than most CSCU campuses per square foot, the campus is about on par with most commercial buildings in the northeast region. Asnuntuck also spends a smaller percent of their total operating expenses on energy than the CSCU campuses on average. Reasons for Asnuntuck’s smaller spend on a cost per square foot basis, may include:
• Relatively few large glass curtain walls,
• Brick and Concrete Masonry Unit (CMU) construction with high thermal mass,
• Energy efficient equipment such as:
a. New chiller with a significantly higher efficiency than older chillers or small window AC units. b. Heat pumps which save energy by simply moving heat rather than creating heat through combustion.
2.2 CAMPUS UTILITIES AND DISTRIBUTION
Asnuntuck uses only electricity and natural gas. The following is a list of Asnuntuck’s utility providers:
• Electric: Eversource, Connecticut Light & Power
In FY 2013 and FY 2014, Asnuntuck had two accounts assigned to Asnuntuck’s building:
a. 51756524013 (main account & streetlights) and 51377934070 (unknown smaller account)
b. In FY 2015, the smaller account was eliminated
• Natural Gas: Eversource (formerly Yankee Gas)
2.3 ENERGY PROCUREMENT
Asnuntuck is part of CSCU’s 2013 electric supply procurement contract with Direct Energy (Hess Energy), detailed further in the Energy Master Plan. In FY13 Direct Energy (Hess Energy) was also the natural gas supplier, but the local distribution company Eversource became Asnuntuck’s supplier in FY14.
2.4 OPERATIONAL AND ENERGY MANAGEMENT PRACTICES
2.4.1 CURRENT CONDITIONS
Asnuntuck’s Building Superintendent, aided by custodians and a Skilled Maintainer, is responsible for maintenance of Asnuntuck’s infrastructure, including overseeing facilities operations, electrical use reductions and environmental health and safety. Staff accountable for building related upgrades fall under the Office of Facilities Operations and Maintenance (Facilities) and report to the Dean of Administration. For energy monitoring, Facilities reviews the incoming bills each month for gas and electric. Since there is only one building, the review involves spot checking the bills for any unusual patterns or use each month. Asnuntuck does not have a formal energy tracking system or methodology.
As a commuter campus, Asnuntuck is open to students each day of the week with the exception of Sunday. Earliest classes begin at 9:00 AM and the latest classes end at 9:30 PM for the school year as well as summer classes. Typical operating hours are:
Monday – Thursday : 7AM-11PM
Friday : 7AM to 7PM
Saturday : 8AM-4PM
TABLE 2.1: Energy Cost Comparison (FY 2014)
Northeast Region Commercial Sector
Cost per Square Feet 1.67$
Cost per FTE Student -$
Avg. Cost per kWh Electricity from Grid 0.15$
Avg. Cost per MMBtu Natural Gas 10.03$
Total Operating Expenses (2014) [4]
Total Energy Spending
% of Operating Expenses 1.43%
279,909$
0.15$
10.49$
19,542,000$
270$
Asnuntuck Connecticut State University
1.68$
Average of CSCU University
Average of CSCU Community College
2.08$ 2.49$
677$ 311$
-$ -$
2.67% 1.95%
0.14$ 0.14$
7.32$ 10.06$
3.77$ 3.46$
122 ENERGY MASTER PLAN // Connecticut State Colleges & Universities
Facilities use analog and digital timers to control the lighting and setback for most equipment based on operating hours. The heating system is an exception to weekend temperature setbacks. When setbacks for the heating system were used in the past, distribution piping froze, deterring use of this energy saving strategy any further.
ENERGY USE INFORMATION MANAGEMENT SYSTEMS
Asnuntuck manages maintenance upgrades including energy projects with COGZ, its work order system. The system contains information on:
- Preventive Maintenance (PM) work orders - Breakdown work orders - Equipment assets - Inventory control - Vendor list - Purchase orders
Asnuntuck does not have an energy dashboard, or a building management system.
2.4.2 RECOMMENDATIONS
As part of the CSCU Energy Master Plan recommendations in Section 5.2.2, it is recommended that the CSCU create a template for energy tracking applicable to all campuses. Asnuntuck should use this template to track energy over time rather than viewing through bills only. Asnuntuck can also use Eversource’s Customer Engagement Platform to view its energy use. Building Management Systems (BMS), some known as Energy Management Systems (EMS), can offer an excellent way to track energy use of specific equipment such as an air handler, pump, or boiler. The addition of an EMS is recommended with the addition of direct digital controls (DDC) HVAC equipment upgrades.
2.5 EXISTING BUILDING COMMISSIONING
2.5.1 CURRENT CONDITIONS
No recent building commissioning efforts were reported.
2.5.2 RECOMMENDATIONS
Buildings with BMS systems with measurable points stand to benefit the most from recommissioning. Although Asnuntuck does not have a BMS, Asnuntuck may benefit from manually checking all systems, especially actuators and pneumatic valves, to ensure they operate as intended. As a general rule of thumb:
• Recommission existing building systems every 3-5 years.
2.6 MECHANICAL SYSTEMS
2.6.1 CURRENT CONDITIONS
Asnuntuck uses a four pipe heating/cooling system for the building, meaning hot water and chilled water each have their own independent supply and return pipe. Additionally, several smaller heat pumps and AC units are used.
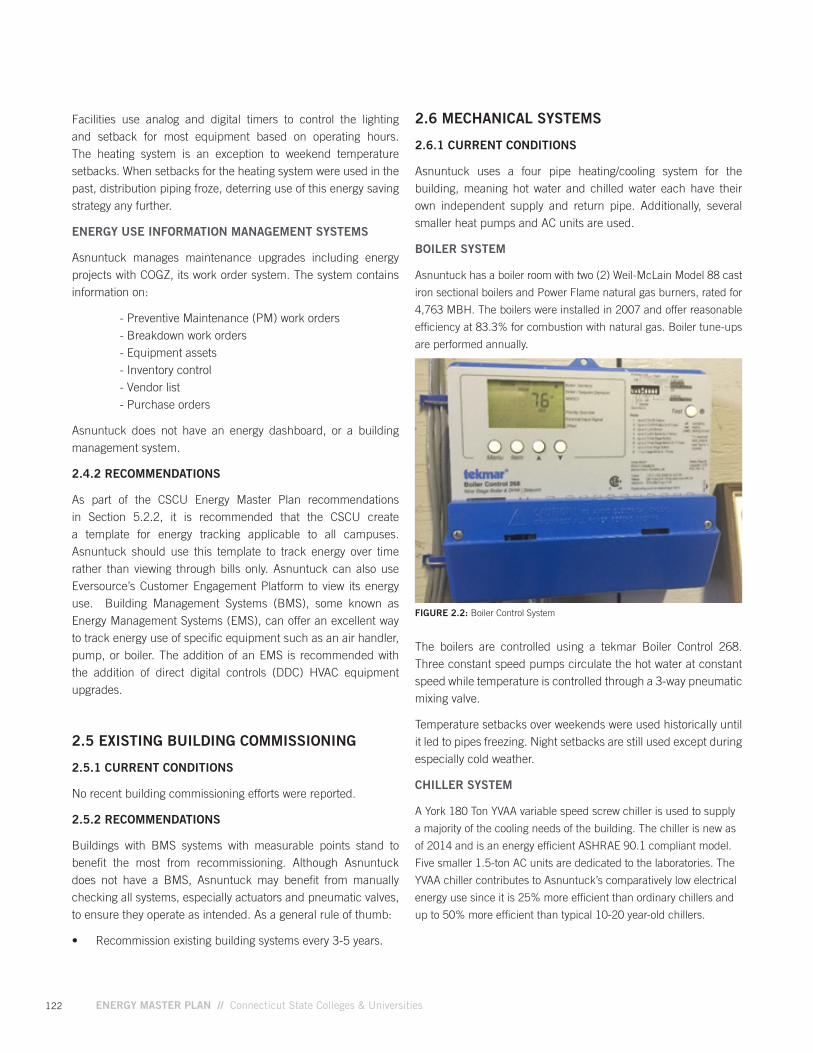
BOILER SYSTEM
Asnuntuck has a boiler room with two (2) Weil-McLain Model 88 cast
iron sectional boilers and Power Flame natural gas burners, rated for
4,763 MBH. The boilers were installed in 2007 and offer reasonable
efficiency at 83.3% for combustion with natural gas. Boiler tune-ups
are performed annually.
FIGURE 2.2: Boiler Control System
The boilers are controlled using a tekmar Boiler Control 268. Three constant speed pumps circulate the hot water at constant speed while temperature is controlled through a 3-way pneumatic mixing valve.
Temperature setbacks over weekends were used historically until it led to pipes freezing. Night setbacks are still used except during especially cold weather.
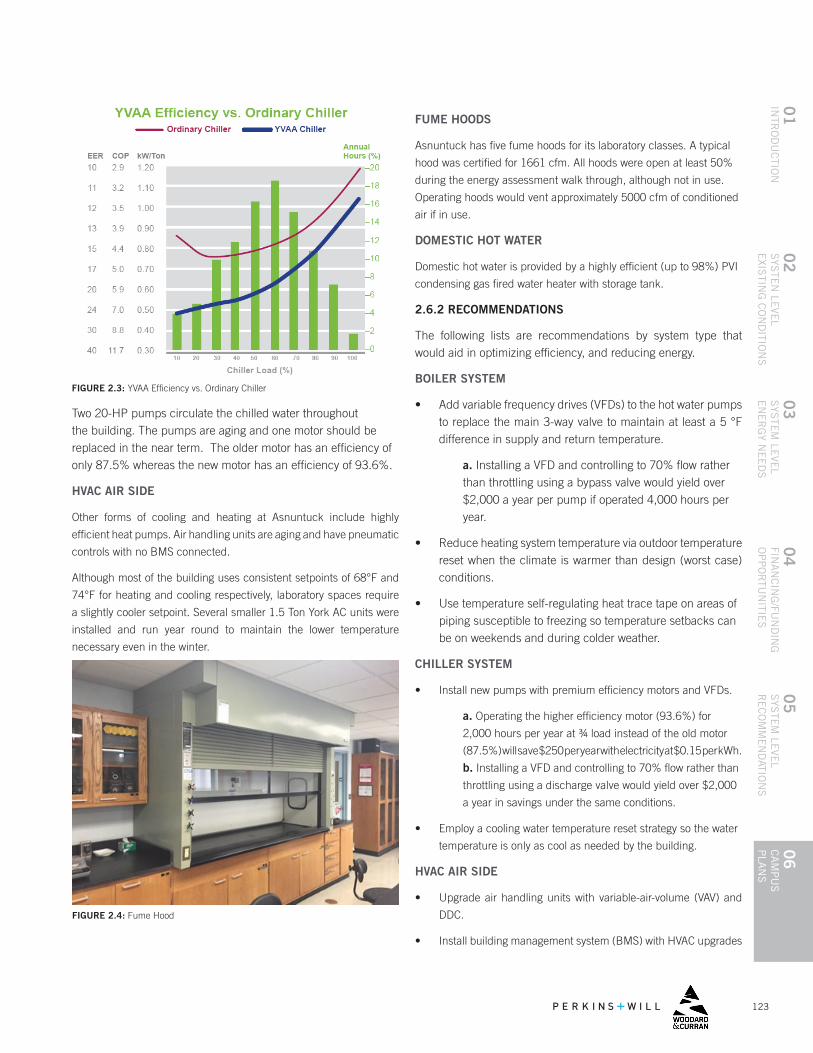
CHILLER SYSTEM
A York 180 Ton YVAA variable speed screw chiller is used to supply
a majority of the cooling needs of the building. The chiller is new as
of 2014 and is an energy efficient ASHRAE 90.1 compliant model.
Five smaller 1.5-ton AC units are dedicated to the laboratories. The
YVAA chiller contributes to Asnuntuck’s comparatively low electrical
energy use since it is 25% more efficient than ordinary chillers and
up to 50% more efficient than typical 10-20 year-old chillers.
123
04
FINA
NC
ING
/FUN
DIN
G
OP
PO
RTU
NITIE
S
01
INTR
OD
UC
TION
06
CA
MP
US
P
LAN
S
05
SYS
TEM
LEVE
L R
EC
OM
ME
ND
ATION
S
02
SYS
TEN
LEVE
LE
XISTIN
G C
ON
DITIO
NS
03
SYS
TEM
LEVE
L E
NE
RG
Y NE
ED
S
FIGURE 2.3: YVAA Efficiency vs. Ordinary Chiller
FIGURE 2.4: Fume Hood
FUME HOODS
Asnuntuck has five fume hoods for its laboratory classes. A typical
hood was certified for 1661 cfm. All hoods were open at least 50%
during the energy assessment walk through, although not in use.
Operating hoods would vent approximately 5000 cfm of conditioned
air if in use.
DOMESTIC HOT WATER
Domestic hot water is provided by a highly efficient (up to 98%) PVI
condensing gas fired water heater with storage tank.
2.6.2 RECOMMENDATIONS
The following lists are recommendations by system type that would aid in optimizing efficiency, and reducing energy.
BOILER SYSTEM
• Add variable frequency drives (VFDs) to the hot water pumps to replace the main 3-way valve to maintain at least a 5 °F difference in supply and return temperature.
a. Installing a VFD and controlling to 70% flow rather than throttling using a bypass valve would yield over $2,000 a year per pump if operated 4,000 hours per year.
• Reduce heating system temperature via outdoor temperature reset when the climate is warmer than design (worst case) conditions.
• Use temperature self-regulating heat trace tape on areas of piping susceptible to freezing so temperature setbacks can be on weekends and during colder weather.
CHILLER SYSTEM
• Install new pumps with premium efficiency motors and VFDs.
a. Operating the higher efficiency motor (93.6%) for
2,000 hours per year at ¾ load instead of the old motor
(87.5%) will save $250 per year with electricity at $0.15 per kWh.
b. Installing a VFD and controlling to 70% flow rather than
throttling using a discharge valve would yield over $2,000
a year in savings under the same conditions.
• Employ a cooling water temperature reset strategy so the water
temperature is only as cool as needed by the building.
HVAC AIR SIDE
• Upgrade air handling units with variable-air-volume (VAV) and
DDC.
• Install building management system (BMS) with HVAC upgrades
Two 20-HP pumps circulate the chilled water throughout the building. The pumps are aging and one motor should be replaced in the near term. The older motor has an efficiency of only 87.5% whereas the new motor has an efficiency of 93.6%.
HVAC AIR SIDE
Other forms of cooling and heating at Asnuntuck include highly
efficient heat pumps. Air handling units are aging and have pneumatic
controls with no BMS connected.
Although most of the building uses consistent setpoints of 68°F and
74°F for heating and cooling respectively, laboratory spaces require
a slightly cooler setpoint. Several smaller 1.5 Ton York AC units were
installed and run year round to maintain the lower temperature
necessary even in the winter.
124 ENERGY MASTER PLAN // Connecticut State Colleges & Universities
• Install zone valves to control the temperature of laboratory
spaces independently and reduce the use of the 1.5 Ton Trane
AC units year round.
FUME HOODS
• Implement a fume hood sash management program to ensure
that hoods are closed and turned off when not in use.
OTHER
• Reduce the compressed air pressure low as possible before
dropping the pressure at the first regulator.
a. Every 2 psig drop in pressure can yield 1% energy
savings. If the 3HP compressor operated 2,000 hours a
year and pressure was reduced from 76 psig to 40 psig,
18% of the energy would be saved, equal to $320.
2.7 LIGHTING
2.7.1 CURRENT CONDITIONS
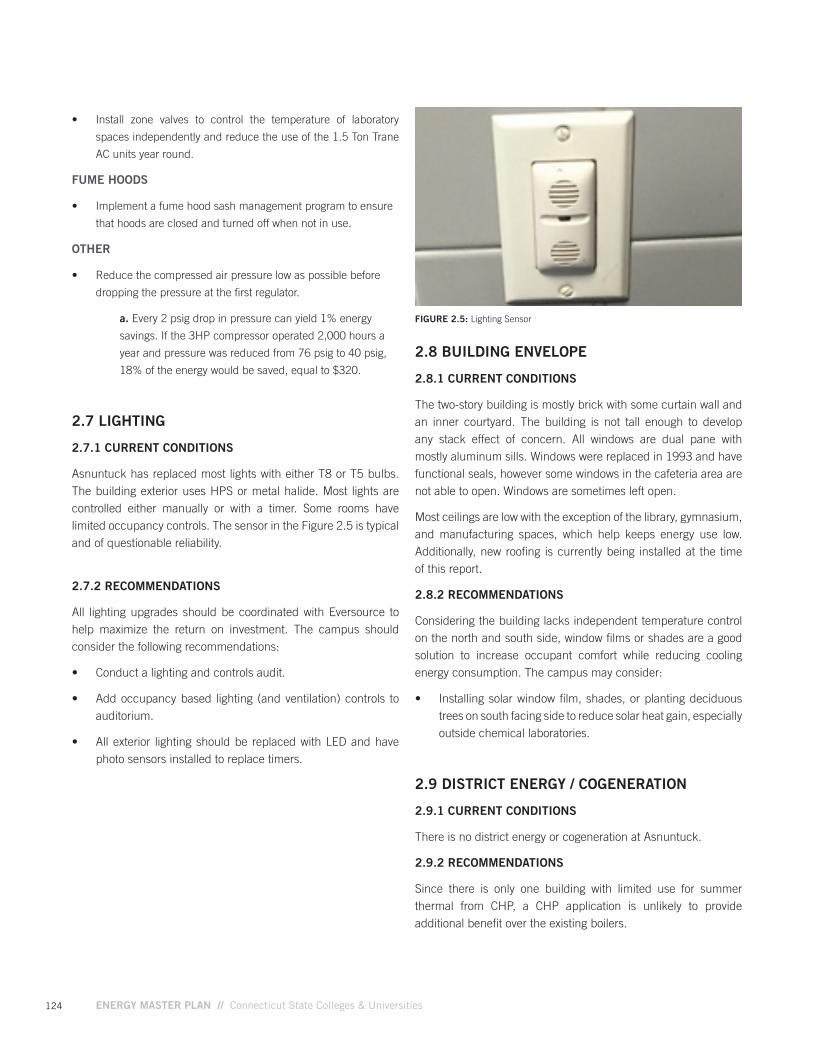
Asnuntuck has replaced most lights with either T8 or T5 bulbs. The building exterior uses HPS or metal halide. Most lights are controlled either manually or with a timer. Some rooms have limited occupancy controls. The sensor in the Figure 2.5 is typical and of questionable reliability.
2.7.2 RECOMMENDATIONS
All lighting upgrades should be coordinated with Eversource to help maximize the return on investment. The campus should consider the following recommendations:
• Conduct a lighting and controls audit.
• Add occupancy based lighting (and ventilation) controls to auditorium.
• All exterior lighting should be replaced with LED and have photo sensors installed to replace timers.
2.8 BUILDING ENVELOPE
2.8.1 CURRENT CONDITIONS
The two-story building is mostly brick with some curtain wall and an inner courtyard. The building is not tall enough to develop any stack effect of concern. All windows are dual pane with mostly aluminum sills. Windows were replaced in 1993 and have functional seals, however some windows in the cafeteria area are not able to open. Windows are sometimes left open.
Most ceilings are low with the exception of the library, gymnasium, and manufacturing spaces, which help keeps energy use low. Additionally, new roofing is currently being installed at the time of this report.
2.8.2 RECOMMENDATIONS
Considering the building lacks independent temperature control on the north and south side, window films or shades are a good solution to increase occupant comfort while reducing cooling energy consumption. The campus may consider:
• Installing solar window film, shades, or planting deciduous trees on south facing side to reduce solar heat gain, especially outside chemical laboratories.
2.9 DISTRICT ENERGY / COGENERATION
2.9.1 CURRENT CONDITIONS
There is no district energy or cogeneration at Asnuntuck.
2.9.2 RECOMMENDATIONS
Since there is only one building with limited use for summer thermal from CHP, a CHP application is unlikely to provide additional benefit over the existing boilers.
FIGURE 2.5: Lighting Sensor
125
04
FINA
NC
ING
/FUN
DIN
G
OP
PO
RTU
NITIE
S
01
INTR
OD
UC
TION
06
CA
MP
US
P
LAN
S
05
SYS
TEM
LEVE
L R
EC
OM
ME
ND
ATION
S
02
SYS
TEN
LEVE
LE
XISTIN
G C
ON
DITIO
NS
03
SYS
TEM
LEVE
L E
NE
RG
Y NE
ED
S
2.10 RENEWABLE ENERGY
2.10.1 CURRENT CONDITIONS
Asnuntuck has not implemented any renewable energy projects on campus.
2.10.2 RECOMMENDATIONS
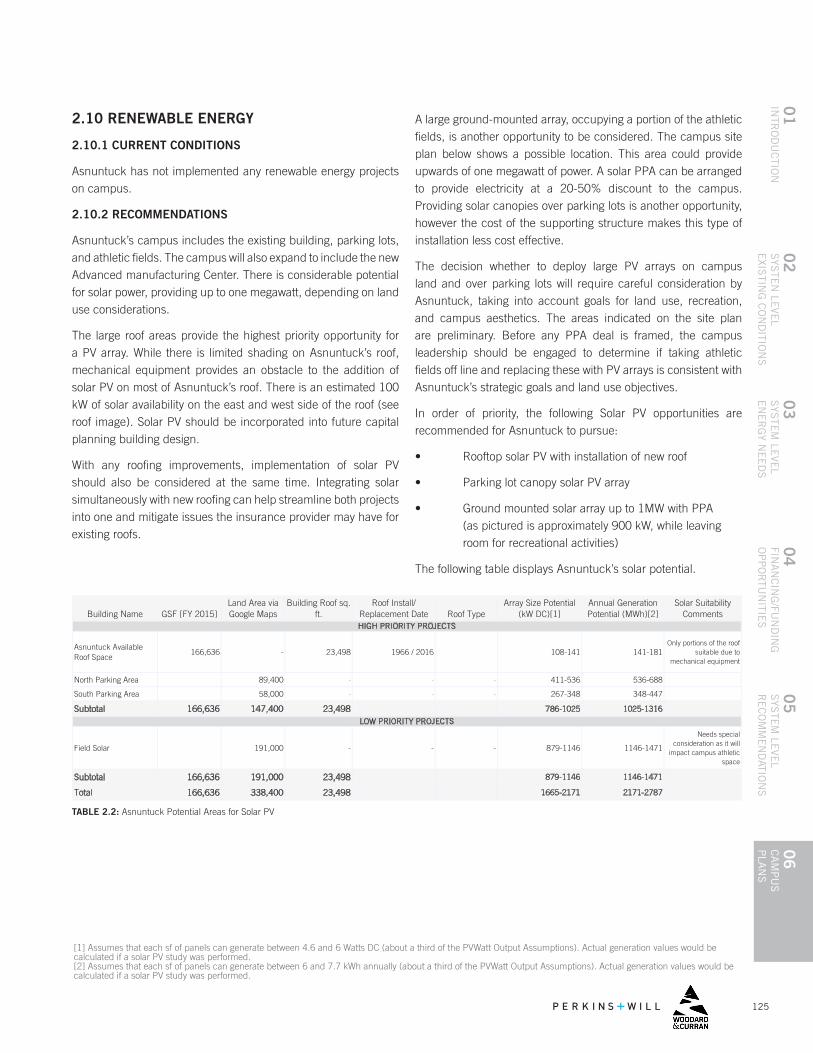
Asnuntuck’s campus includes the existing building, parking lots, and athletic fields. The campus will also expand to include the new Advanced manufacturing Center. There is considerable potential for solar power, providing up to one megawatt, depending on land use considerations.
The large roof areas provide the highest priority opportunity for a PV array. While there is limited shading on Asnuntuck’s roof, mechanical equipment provides an obstacle to the addition of solar PV on most of Asnuntuck’s roof. There is an estimated 100 kW of solar availability on the east and west side of the roof (see roof image). Solar PV should be incorporated into future capital planning building design.
With any roofing improvements, implementation of solar PV should also be considered at the same time. Integrating solar simultaneously with new roofing can help streamline both projects into one and mitigate issues the insurance provider may have for existing roofs.
Building Name GSF [FY 2015]Land Area via Google Maps
Building Roof sq. ft.
Roof Install/ Replacement Date Roof Type
Array Size Potential (kW DC)[1]
Annual Generation Potential (MWh)[2]
Solar Suitability Comments
Asnuntuck Available Roof Space
166,636 - 23,498 1966 / 2016 108-141 141-181Only portions of the roof
suitable due to mechanical equipment
North Parking Area 89,400 - - - 411-536 536-688
South Parking Area 58,000 - - - 267-348 348-447
Subtotal 166,636 147,400 23,498 786-1025 1025-1316
Field Solar 191,000 - - - 879-1146 1146-1471
Needs special consideration as it will
impact campus athletic space
Subtotal 166,636 191,000 23,498 879-1146 1146-1471
Total 166,636 338,400 23,498 1665-2171 2171-2787
HIGH PRIORITY PROJECTS
LOW PRIORITY PROJECTS
[1] Assumes that each sf of panels can generate between 4.6 and 6 Watts DC (about a third of the PVWatt Output Assumptions). Actual generation values would be calculated if a solar PV study was performed.
[2] Assumes that each sf of panels can generate between 6 and 7.7 kWh annually (about a third of the PVWatt Output Assumptions). Actual generation values would be calculated if a solar PV study was performed.
100% area availability assumed, rather than 80%
TABLE 2.2: Asnuntuck Potential Areas for Solar PV
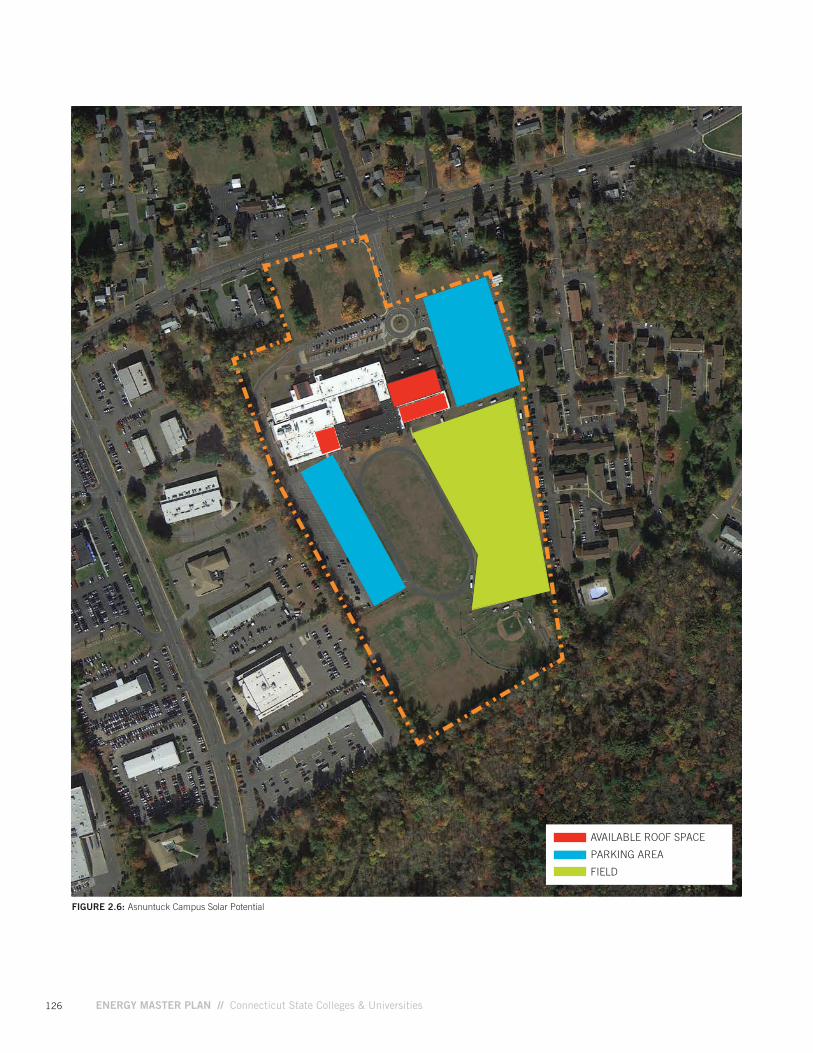
A large ground-mounted array, occupying a portion of the athletic fields, is another opportunity to be considered. The campus site plan below shows a possible location. This area could provide upwards of one megawatt of power. A solar PPA can be arranged to provide electricity at a 20-50% discount to the campus. Providing solar canopies over parking lots is another opportunity, however the cost of the supporting structure makes this type of installation less cost effective.
The decision whether to deploy large PV arrays on campus land and over parking lots will require careful consideration by Asnuntuck, taking into account goals for land use, recreation, and campus aesthetics. The areas indicated on the site plan are preliminary. Before any PPA deal is framed, the campus leadership should be engaged to determine if taking athletic fields off line and replacing these with PV arrays is consistent with Asnuntuck’s strategic goals and land use objectives.
In order of priority, the following Solar PV opportunities are recommended for Asnuntuck to pursue:
• Rooftop solar PV with installation of new roof
• Parking lot canopy solar PV array
• Ground mounted solar array up to 1MW with PPA (as pictured is approximately 900 kW, while leaving room for recreational activities)
The following table displays Asnuntuck’s solar potential.
[1] Assumes that each sf of panels can generate between 4.6 and 6 Watts DC (about a third of the PVWatt Output Assumptions). Actual generation values would be calculated if a solar PV study was performed. [2] Assumes that each sf of panels can generate between 6 and 7.7 kWh annually (about a third of the PVWatt Output Assumptions). Actual generation values would be calculated if a solar PV study was performed.
126 ENERGY MASTER PLAN // Connecticut State Colleges & Universities
FIGURE 2.6: Asnuntuck Campus Solar Potential
AVAILABLE ROOF SPACE
PARKING AREA
FIELD
127
04
FINA
NC
ING
/FUN
DIN
G
OP
PO
RTU
NITIE
S
01
INTR
OD
UC
TION
06
CA
MP
US
P
LAN
S
05
SYS
TEM
LEVE
L R
EC
OM
ME
ND
ATION
S
02
SYS
TEN
LEVE
LE
XISTIN
G C
ON
DITIO
NS
03
SYS
TEM
LEVE
L E
NE
RG
Y NE
ED
S
2.11 CAPITAL PLANNING
2.11.1 CURRENT CONDITIONS
Asnuntuck’s 2005 Campus Master Plan established goals related to campus infrastructure and utility improvements which consisted of mechanical, electrical and plumbing systems upgrades such as the replacement of chillers, upgrades to electrical distribution equipment, domestic water equipment and other supplementary objectives.
To accomplish its energy infrastructure goals, Asnuntuck relies on financing and funding from the CSCU and the State. The CSCU provides annual code compliance and infrastructure funds. Larger capital projects are also funded under CSCU 2020, as of FY 2015. The State Legislature allocates bonds for campus improvement projects, such as Asnuntuck’s Phase 1 Master Plan.
More information on campus expansion projects is found in Section 3.1
2.11.2 RECOMMENDATIONS
Asnuntuck should continue to collaborate with Eversource for all major building renovations, MEP equipment replacement and all new construction.
2.12 COLLABORATION / PARTNERSHIP
2.12.1 CURRENT CONDITIONS
The CSCU Facilities Department is available to provide assistance in budgeting, capital planning and technical support for the community college projects, including Asnuntuck.
2.12.2 RECOMMENDATIONS
Having a partnership with Eversource could benefit Asnuntuck. Asnuntuck should work with Eversource to take advantage of Utility Incentives for the energy efficiency measures (EEMs) presented in this plan. Incentives structures range and Eversource has offered incentives of up to 80% of project costs in the past.
2.13 SUMMARY OF RECOMMENDED ENERGY EFFICIENCY OPPORTUNITIES
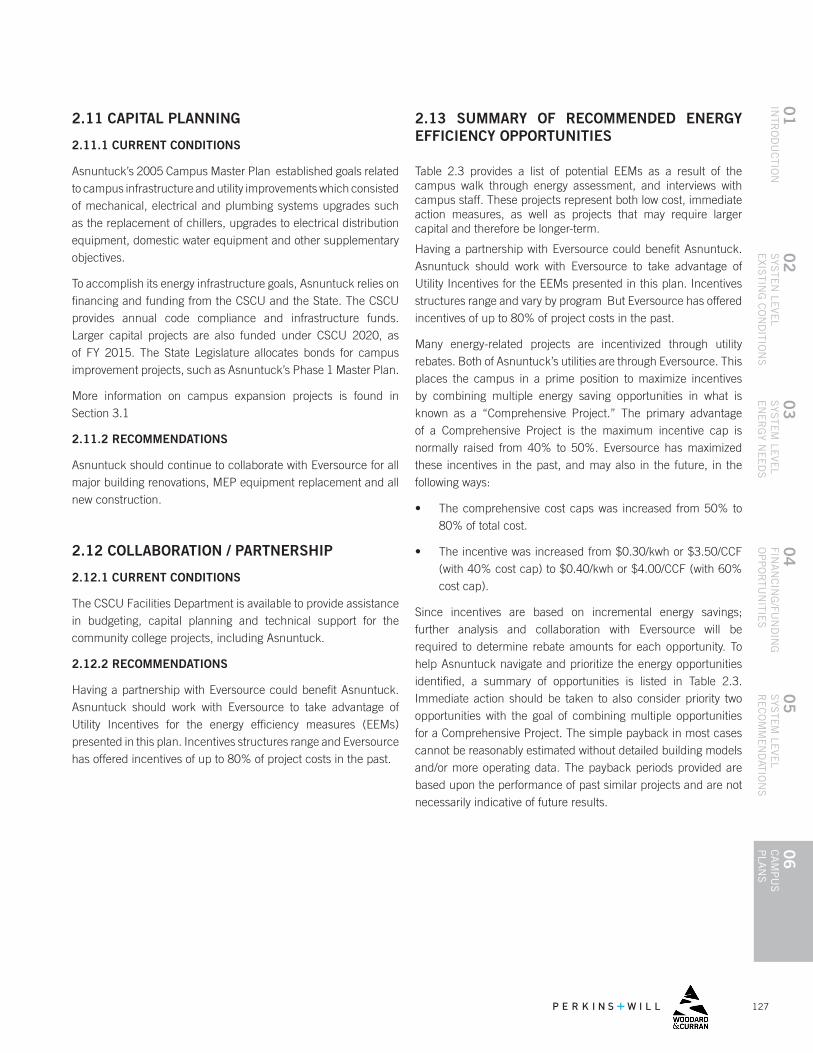
Table 2.3 provides a list of potential EEMs as a result of the campus walk through energy assessment, and interviews with campus staff. These projects represent both low cost, immediate action measures, as well as projects that may require larger capital and therefore be longer-term.
Having a partnership with Eversource could benefit Asnuntuck. Asnuntuck should work with Eversource to take advantage of Utility Incentives for the EEMs presented in this plan. Incentives structures range and vary by program But Eversource has offered incentives of up to 80% of project costs in the past.
Many energy-related projects are incentivized through utility rebates. Both of Asnuntuck’s utilities are through Eversource. This places the campus in a prime position to maximize incentives by combining multiple energy saving opportunities in what is known as a “Comprehensive Project.” The primary advantage of a Comprehensive Project is the maximum incentive cap is normally raised from 40% to 50%. Eversource has maximized these incentives in the past, and may also in the future, in the following ways:
• The comprehensive cost caps was increased from 50% to 80% of total cost.
• The incentive was increased from $0.30/kwh or $3.50/CCF (with 40% cost cap) to $0.40/kwh or $4.00/CCF (with 60% cost cap).
Since incentives are based on incremental energy savings; further analysis and collaboration with Eversource will be required to determine rebate amounts for each opportunity. To help Asnuntuck navigate and prioritize the energy opportunities identified, a summary of opportunities is listed in Table 2.3. Immediate action should be taken to also consider priority two opportunities with the goal of combining multiple opportunities for a Comprehensive Project. The simple payback in most cases cannot be reasonably estimated without detailed building models and/or more operating data. The payback periods provided are based upon the performance of past similar projects and are not necessarily indicative of future results.
128 ENERGY MASTER PLAN // Connecticut State Colleges & Universities
TABLE 2.3: Asnuntuck Community College Energy Efficiency Measures
[1] LED lighting upgrade projects are given a priority 1 designation assuming they are combined with other measures and qualify for a “Comprehensive Project” with Eversource.
Opportunity ID Energy Conservation or Efficiency Opportunity
App. Cost (Before Rebate)
Payback w/rebate (Years) Priority
ACC-1Add variable frequency drives (VFDs) to chilled water pumps and upgrade motors to premium efficiency inverter duty. (20 HP)
$ 45,000 1-2 1
ACC-2 Implement fume hood management program. Varies Varies 1
ACC-3 Add VFDs to hot water pumps. (7.5 HP) $ 25,000 1-2 1
ACC-4Install new door seals to decrease infiltration. (Implement on all doors concurrent with Entry addition project)
$50-100 each door
>1-2 1
ACC-5Review pneumatic controlled heating, ventilation, and air conditioning (HVAC) systems and savings from potential upgrades with Eversource incentives.
Varies Varies 1
ACC-6Install light emitting diode (LED) lighting and controls, indoor and out after lighting audit.
Varies 3-7 1
ACC-7Evaluate and implement renewable energy photovoltaic solar system with 3rd party PPA contract.
0 Instantaneous 1
ACC-8
Decrease compressed air pressure before regulator in small increments as long as system still proves functional. Volume of air tank and requirements of instrumentation & controls (I&C) will determine minimum required pressure.
$0 <1 2
ACC-9
Add zone valves, tertiary loops or upgrade to variable refrigerant flow (VRF) system to control individual space temperature, specifically where area uses change or where sun exposure is different.
Varies Varies 2
ACC-10Install building management system (BMS) to include upgraded HVAC equipment and other existing building energy systems
600,000$ - 1,000,000$
Varies 2
ACC-11
Use temperature self-regulating heat trace tape with increased insulation on areas of piping susceptible to freezing so temperature setbacks can be re-employed on weekends and during colder weather.
Varies >1-2 2
ACC-12Utilize existing work order system for preventative maintenance.
Varies Varies 2
ACC-13
Evaluate annually the economic benefit from participating in a Demand Response program, both from credits provided by the utility and the reduction in electrical demand charges. Enroll if positive.
Varies Varies 3
ACC-14Convert pneumatic controlled HVAC systems to DDC and other upgrades based on future HVAC specific audit with Eversource.
Starting at $4.87/s.f.
Varies 3
129
04
FINA
NC
ING
/FUN
DIN
G
OP
PO
RTU
NITIE
S
01
INTR
OD
UC
TION
06
CA
MP
US
P
LAN
S
05
SYS
TEM
LEVE
L R
EC
OM
ME
ND
ATION
S
02
SYS
TEN
LEVE
LE
XISTIN
G C
ON
DITIO
NS
03
SYS
TEM
LEVE
L E
NE
RG
Y NE
ED
S
ENERGY NEEDS3.1 FUTURE DEVELOPMENT
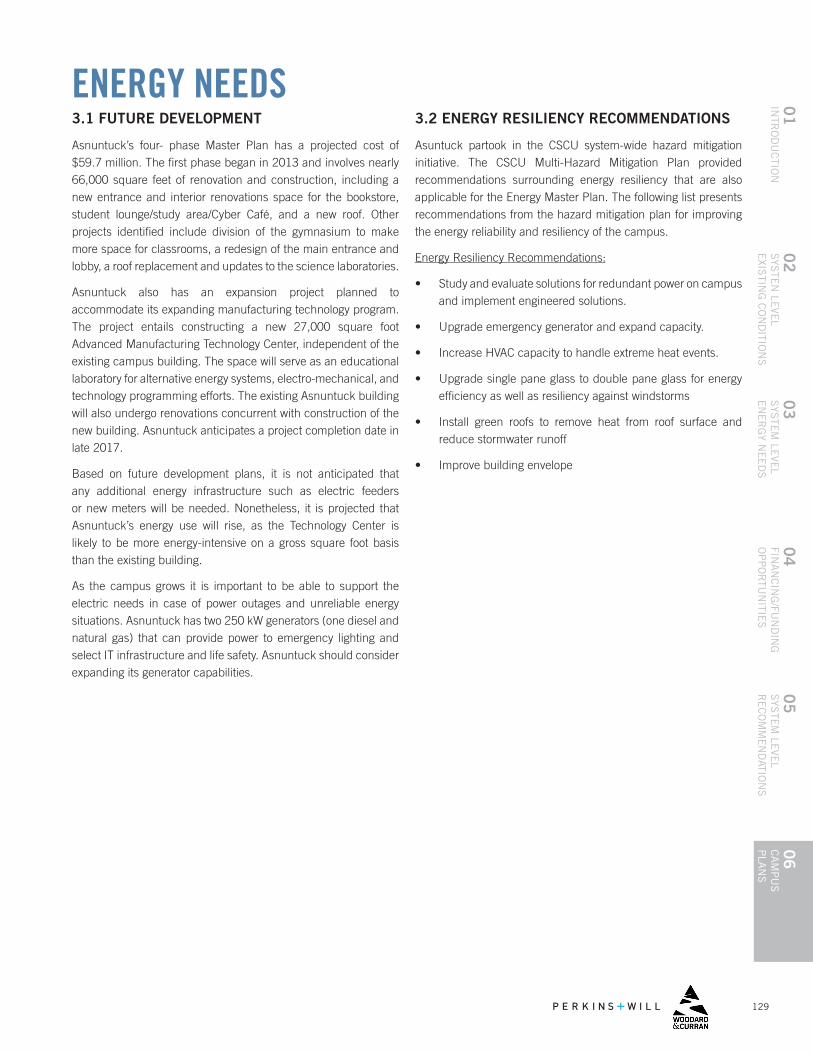
Asnuntuck’s four- phase Master Plan has a projected cost of $59.7 million. The first phase began in 2013 and involves nearly 66,000 square feet of renovation and construction, including a new entrance and interior renovations space for the bookstore, student lounge/study area/Cyber Café, and a new roof. Other projects identified include division of the gymnasium to make more space for classrooms, a redesign of the main entrance and lobby, a roof replacement and updates to the science laboratories.
Asnuntuck also has an expansion project planned to accommodate its expanding manufacturing technology program. The project entails constructing a new 27,000 square foot Advanced Manufacturing Technology Center, independent of the existing campus building. The space will serve as an educational laboratory for alternative energy systems, electro-mechanical, and technology programming efforts. The existing Asnuntuck building will also undergo renovations concurrent with construction of the new building. Asnuntuck anticipates a project completion date in late 2017.
Based on future development plans, it is not anticipated that any additional energy infrastructure such as electric feeders or new meters will be needed. Nonetheless, it is projected that Asnuntuck’s energy use will rise, as the Technology Center is likely to be more energy-intensive on a gross square foot basis than the existing building.
As the campus grows it is important to be able to support the electric needs in case of power outages and unreliable energy situations. Asnuntuck has two 250 kW generators (one diesel and natural gas) that can provide power to emergency lighting and select IT infrastructure and life safety. Asnuntuck should consider expanding its generator capabilities.
3.2 ENERGY RESILIENCY RECOMMENDATIONS
Asuntuck partook in the CSCU system-wide hazard mitigation initiative. The CSCU Multi-Hazard Mitigation Plan provided recommendations surrounding energy resiliency that are also applicable for the Energy Master Plan. The following list presents recommendations from the hazard mitigation plan for improving the energy reliability and resiliency of the campus.
Energy Resiliency Recommendations:
• Study and evaluate solutions for redundant power on campus and implement engineered solutions.
• Upgrade emergency generator and expand capacity.
• Increase HVAC capacity to handle extreme heat events.
• Upgrade single pane glass to double pane glass for energy efficiency as well as resiliency against windstorms
• Install green roofs to remove heat from roof surface and reduce stormwater runoff
• Improve building envelope
130 ENERGY MASTER PLAN // Connecticut State Colleges & Universities
CONCLUSION / NEXT STEPSAsnuntuck has performed a number of energy-related upgrades to date. The utility data received indicates Asnuntuck is the best performing Connecticut State Colleges & Universities (CSCU) campus from an energy perspective from an energy perspective and based on their site EUI. and based on their site EUI. As evident by the relatively low EUI of 64 kBtu/sq.ft., Asnuntuck is doing an excellent job managing energy use with the existing older HVAC systems with limited automation and monitoring capabilities.
The biggest challenge Asnuntuck faces is staying ahead of repairs with preventive maintenance and HVAC upgrades. The largest areas for improvement include more building controls and HVAC zoning, ideally implemented with a BMS, which would also provide more system health status indicators. More easily implemented energy saving opportunities include, VFDs on pumps, a new chilled water pump motor, and LED lighting upgrades. Other top priority initiatives include:
• Management: Asnuntuck should continue to review energy bills, including tracking energy use and comparing energy spend to available budgets.
• Renewable Energy: Explore PPAs for a ground mounted array, a parking canopy, and on portions of the building roof.
• Utility Incentives/ Develop Plan for EEMs: Asnuntuck should maximize incentive funding for EEMs by working with Eversource, and combining multiple energy saving opportunities in what is known as a “Comprehensive Project.” Further analysis and collaboration with Eversource is required to determine rebate amounts for each opportunity
While Asnuntuck has the lowest energy use intensity of CSCU, there are still opportunities to capture savings, decrease energy use and increase energy reliability and sustainability.
4.1 CONTACT INFORMATION FOR KEY STAKEHOLDERS
Collecting all the necessary information for this planning effort required a collaborative effort. Below is the stakeholders that were active in providing their expertise about campus current conditions and future needs, and energy related decisions.
ASNUNTUCK COMMUNITY COLLEGE
GENNARO DEANGELIS Interim Dean of Administration [email protected] or [email protected] 860-253-3048
JOSEPH MULLER Building Superintendent III [email protected] 860-253-3055
EVERSOURCE
JAMES WILLIAMSON Energy Efficiency Consultant [email protected] 860-665-2283
131
04
FINA
NC
ING
/FUN
DIN
G
OP
PO
RTU
NITIE
S
01
INTR
OD
UC
TION
06
CA
MP
US
P
LAN
S
05
SYS
TEM
LEVE
L R
EC
OM
ME
ND
ATION
S
02
SYS
TEN
LEVE
LE
XISTIN
G C
ON
DITIO
NS
03
SYS
TEM
LEVE
L E
NE
RG
Y NE
ED
S
APPENDIX A: ASNUNTUCK DATA METHODOLOGY, ASSUMPTIONS AND NOTESThe following are the data methodology and assumptions that were used when analyzing and benchmarking data for Asnuntuck:
Electricity
• There are two accounts listed under Eversource: 51756524013 (main account & streetlights) and 51377934070 (unknown smaller account). Both accounts are assigned to ACC’s single existing building. The second account was eliminated from use in FY 15.
• Eversource utility bill summary PDFs detailed streetlight consumption and cost (1277.9 kWh and $294) only for FY13. It was assumed that streetlight consumption would be similar every year and subtracted these amounts from the Eversource values for all three years.
• The cost per kWh for FY14 was simply the total cost of the two accounts in FY14 divided by the total consumption in FY14 (all from Eversource). Supply and demand blended cost.
Natural Gas: Hess Utility Bill FY13, Eversource Online Data FY 14 +15
• Eversource gives a slightly larger gas consumption than the Yankee Gas bills.
• The cost per MMBtu for FY14 was simply the total cost in FY14 divided by the total consumption in FY14 (all from Eversource).
Other Assumptions
• Weather Normalizing
Although the building has several reversing heat pumps, weather normalization of the energy consumption is calculated as if the building was cooled electrically and heated only using natural gas.

132 ENERGY MASTER PLAN // Connecticut State Colleges & Universities
6.2
// 133
04
FINA
NC
ING
/FUN
DIN
G
OP
PO
RTU
NITIE
S
01
INTR
OD
UC
TION
06
CA
MP
US
P
LAN
S
05
SYS
TEM
LEVE
L R
EC
OM
ME
ND
ATION
S
02
SYS
TEN
LEVE
LE
XISTIN
G C
ON
DITIO
NS
03
SYS
TEM
LEVE
L E
NE
RG
Y NE
ED
S
6.2CAPITAL
COMMUNITY COLLEGE

134 ENERGY MASTER PLAN // Connecticut State Colleges & Universities
TABLE OF CONTENTSEXECUTIVE SUMMARY 136
1. INTRODUCTION 139
1.1 CAPITAL OVERVIEW
1.2 PREVIOUS ENERGY STUDIES & PROJECTS
2. EXISTING CONDITIONS AND RECOMMENDATIONS 141
2.1 FACILITY ENERGY BENCHMARKING AND ENERGY CONSUMPTION
2.2 CAMPUS UTILITIES AND DISTRIBUTION
2.3 ENERGY PROCUREMENT
2.4 OPERATIONAL AND ENERGY MANAGEMENT PRACTICES 2.4.1 CURRENT CONDITIONS 2.4.2 RECOMMENDATIONS
2.5 EXISTING BUILDING COMMISSIONING 2.5.1 CURRENT CONDITIONS 2.5.2 RECOMMENDATIONS
2.6 MECHANICAL SYSTEMS 2.6.1 CURRENT CONDITIONS 2.6.2 RECOMMENDATIONS
2.7 LIGHTING 2.7.1 CURRENT CONDITIONS 2.7.2 RECOMMENDATIONS
2.8 BUILDING ENVELOPE 2.8.1 CURRENT CONDITIONS 2.8.2 RECOMMENDATIONS
2.9 DISTRICT ENERGY / COGENERATION 2.9.1 CURRENT CONDITIONS 2.9.2 RECOMMENDATIONS
2.10 RENEWABLE ENERGY 2.10.1 CURRENT CONDITIONS 2.10.2 RECOMMENDATIONS
2.11 CAPITAL PLANNING 2.11.1 CURRENT CONDITIONS 2.11.2 RECOMMENDATIONS
2.12 COLLABORATION / PARTNERSHIP 2.12.1 CURRENT CONDITIONS 2.12.2 RECOMMENDATIONS
2.13 SUMMARY OF RECOMMENDED ENERGY EFFICIENCY OPPORTUNITIES
135
04
FINA
NC
ING
/FUN
DIN
G
OP
PO
RTU
NITIE
S
01
INTR
OD
UC
TION
06
CA
MP
US
P
LAN
S
05
SYS
TEM
LEVE
L R
EC
OM
ME
ND
ATION
S
02
SYS
TEN
LEVE
LE
XISTIN
G C
ON
DITIO
NS
03
SYS
TEM
LEVE
L E
NE
RG
Y NE
ED
S
LIST OF FIGURES FIGURE 1: CAPITAL COMMUNITY COLLEGE ENERGY DASHBOARD 136FIGURE 1.1: CAPITAL COMMUNITY COLLEGE 139FIGURE 1.2: FOCUS ON DURABLE PROJECTS IN CAPITAL 140FIGURE 2.1: CAPITAL COMMUNITY COLLEGE ENERGY DASHBOARD 141FIGURE 2.2: CAPITAL - NATURAL DAYLIGHTING 144
LIST OF TABLES TABLE 1: ENERGY COST COMPARISON (FY 2014) 137TABLE 2: CAPITAL ENERGY EFFICIENCY MEASURES 138TABLE 1.1: MANCHESTER BUILDING INFORMATION 139TABLE 2.1: ENERGY COST COMPARISON (FY 2014) 142TABLE 2.2: CAPITAL ENERGY EFFICIENCY MEASURES 146
3. ENERGY NEEDS 147
3.1 FUTURE DEVELOPMENT
3.2 ENERGY RESILIENCY RECOMMENDATIONS
4. CONCLUSION / NEXT STEPS 148
4.1 CONTACT INFORMATION FOR KEY STAKEHOLDERS
APPENDIX 149APPENDIX A: CAPITAL DATA METHODOLOGY, ASSUMPTIONS AND NOTES
136 ENERGY MASTER PLAN // Connecticut State Colleges & Universities
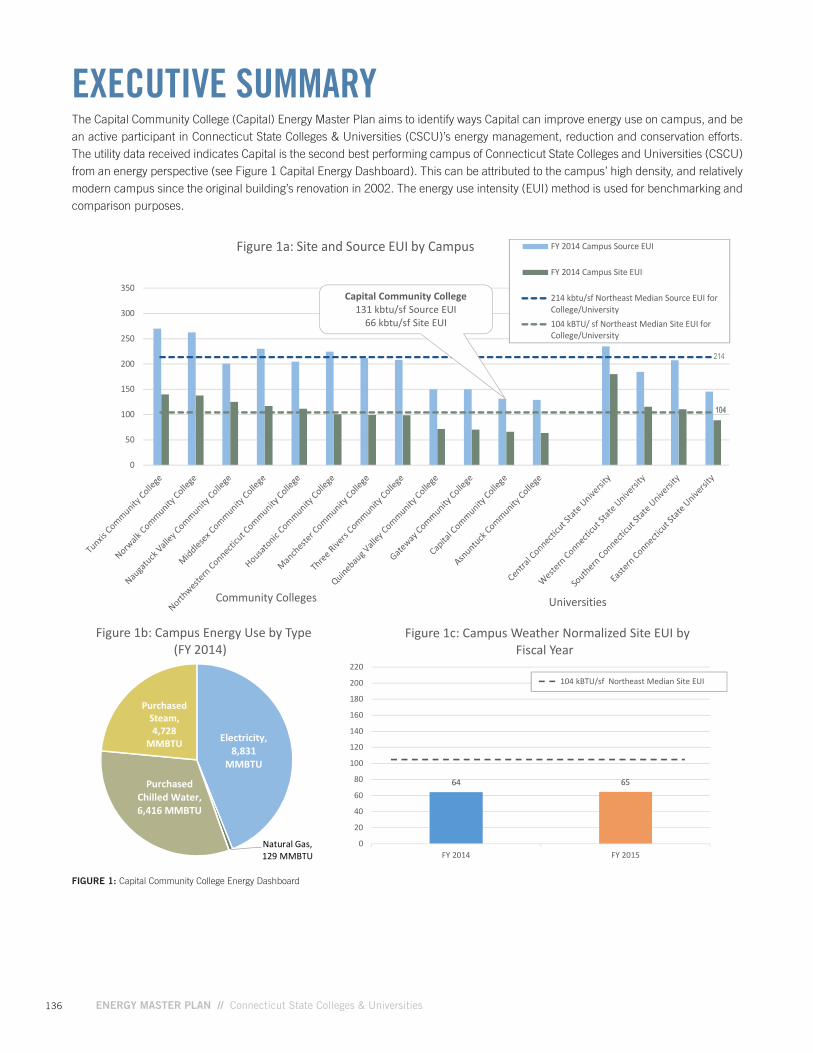
EXECUTIVE SUMMARYThe Capital Community College (Capital) Energy Master Plan aims to identify ways Capital can improve energy use on campus, and be an active participant in Connecticut State Colleges & Universities (CSCU)’s energy management, reduction and conservation efforts. The utility data received indicates Capital is the second best performing campus of Connecticut State Colleges and Universities (CSCU) from an energy perspective (see Figure 1 Capital Energy Dashboard). This can be attributed to the campus’ high density, and relatively modern campus since the original building’s renovation in 2002. The energy use intensity (EUI) method is used for benchmarking and comparison purposes.
FIGURE 1: Capital Community College Energy Dashboard
DRAFT Central Dashboard May 2016
Electricity,8,831
MMBTU
Natural Gas,129 MMBTU
PurchasedChilled Water,6,416 MMBTU
PurchasedSteam,4,728
MMBTU
Figure 1b: Campus Energy Use by Type(FY 2014)
64 65
0
20
40
60
80
100
120
140
160
180
200
220
FY 2014 FY 2015
Figure 1c: Campus Weather Normalized Site EUI byFiscal Year
104 kBTU/sf Northeast Median Site EUI
Capital Community College131 kbtu/sf Source EUI
66 kbtu/sf Site EUI
0
50
100
150
200
250
300
350
Figure 1a: Site and Source EUI by Campus FY 2014 Campus Source EUI
FY 2014 Campus Site EUI
214 kbtu/sf Northeast Median Source EUI forCollege/University104 kBTU/ sf Northeast Median Site EUI forCollege/University
104104
214
UniversitiesCommunity Colleges
Capital Community College131 kbtu/sf Source EUI
66 kbtu/sf Site EUI
137
04
FINA
NC
ING
/FUN
DIN
G
OP
PO
RTU
NITIE
S
01
INTR
OD
UC
TION
06
CA
MP
US
P
LAN
S
05
SYS
TEM
LEVE
L R
EC
OM
ME
ND
ATION
S
02
SYS
TEN
LEVE
LE
XISTIN
G C
ON
DITIO
NS
03
SYS
TEM
LEVE
L E
NE
RG
Y NE
ED
S
TABLE 1: Energy Cost Comparison (FY 2014)
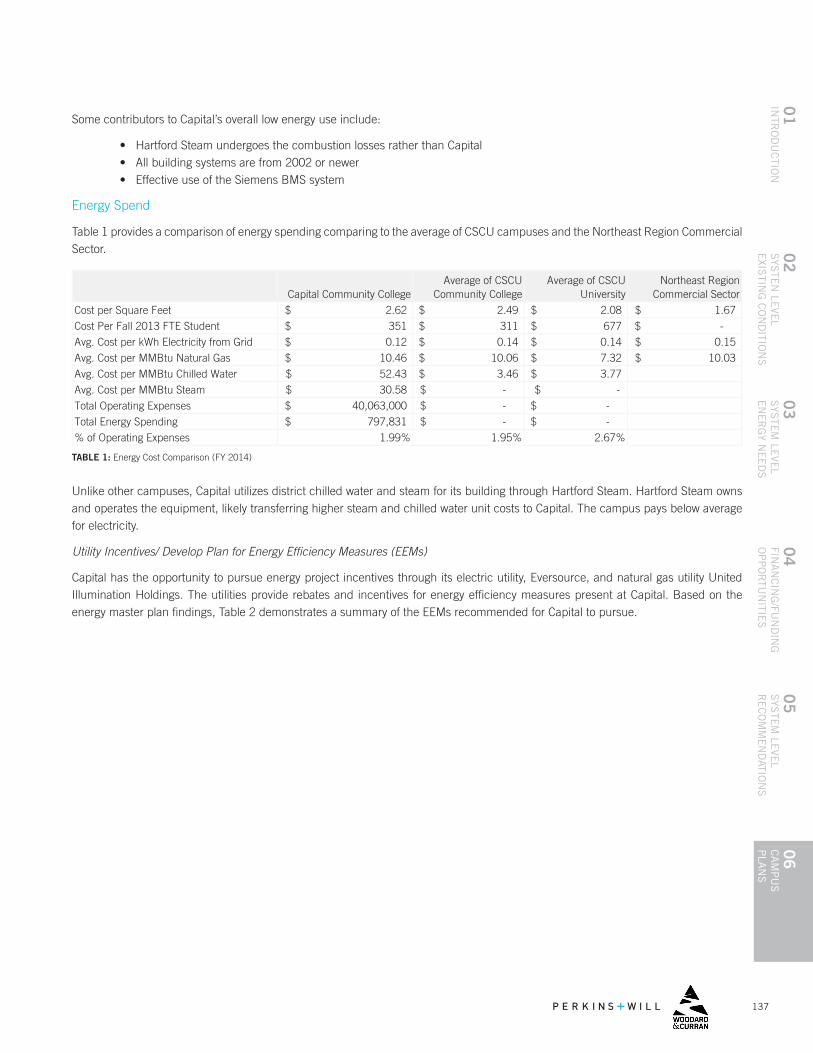
Unlike other campuses, Capital utilizes district chilled water and steam for its building through Hartford Steam. Hartford Steam owns and operates the equipment, likely transferring higher steam and chilled water unit costs to Capital. The campus pays below average for electricity.
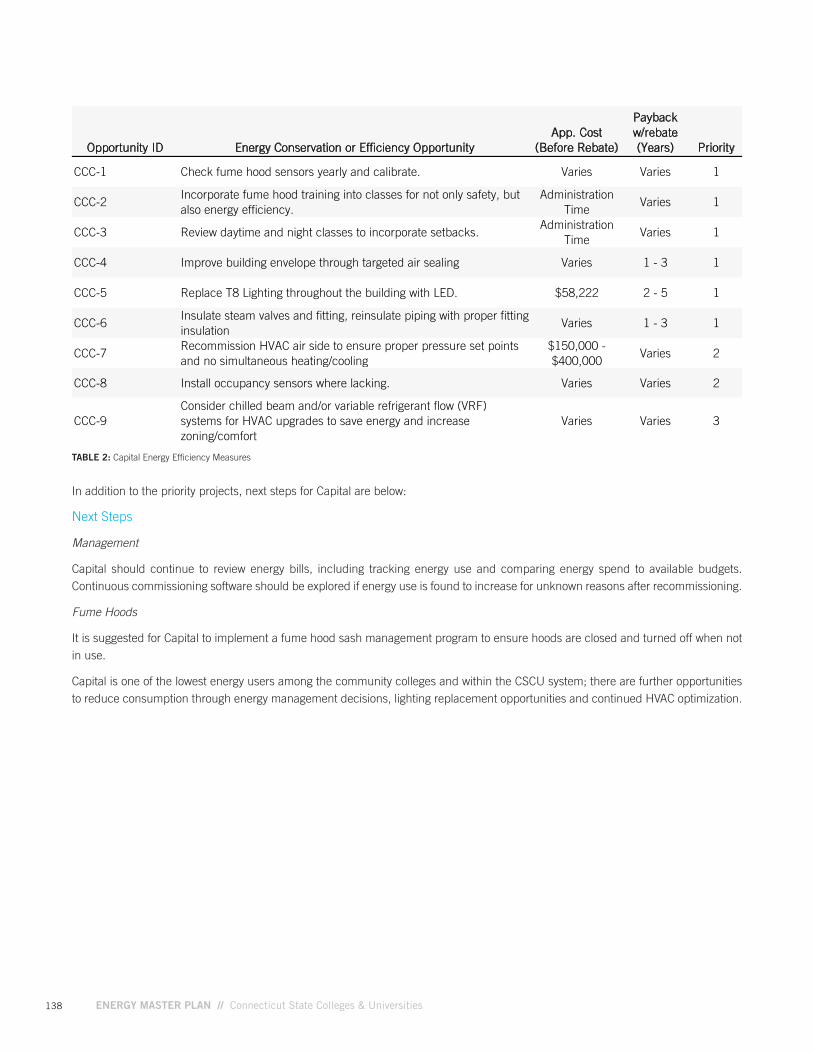
Utility Incentives/ Develop Plan for Energy Efficiency Measures (EEMs)
Capital has the opportunity to pursue energy project incentives through its electric utility, Eversource, and natural gas utility United Illumination Holdings. The utilities provide rebates and incentives for energy efficiency measures present at Capital. Based on the energy master plan findings, Table 2 demonstrates a summary of the EEMs recommended for Capital to pursue.
Some contributors to Capital’s overall low energy use include:
• Hartford Steam undergoes the combustion losses rather than Capital • All building systems are from 2002 or newer • Effective use of the Siemens BMS system
Energy Spend
Table 1 provides a comparison of energy spending comparing to the average of CSCU campuses and the Northeast Region Commercial Sector.
Cost per Square Feet
Cost Per Fall 2013 FTE Student
Avg. Cost per kWh Electricity from Grid
Avg. Cost per MMBtu Natural Gas
Avg. Cost per MMBtu Chilled Water
Avg. Cost per MMBtu Steam
Total Operating Expenses
Total Energy Spending
% of Operating Expenses
Capital Community CollegeAverage of CSCU
Community CollegeAverage of CSCU
UniversityNortheast Region
Commercial Sector
2.62$ 2.49$ 2.08$ 1.67$
351$ 311$ 677$ -$
0.12$ 0.14$ 0.14$ 0.15$
10.46$ 10.06$ 7.32$ 10.03$
52.43$ 3.46$ 3.77$
1.99% 1.95% 2.67%
-$ $ -
40,063,000$ -$ -$
797,831$ -$ -$
30.58$
138 ENERGY MASTER PLAN // Connecticut State Colleges & Universities
Opportunity ID Energy Conservation or Efficiency OpportunityApp. Cost
(Before Rebate)
Payback w/rebate (Years) Priority
CCC-1 Check fume hood sensors yearly and calibrate. Varies Varies 1
CCC-2Incorporate fume hood training into classes for not only safety, but also energy efficiency.
Administration Time
Varies 1
CCC-3 Review daytime and night classes to incorporate setbacks. Administration
TimeVaries 1
CCC-4 Improve building envelope through targeted air sealing Varies 1 - 3 1
CCC-5 Replace T8 Lighting throughout the building with LED. $58,222 2 - 5 1
CCC-6Insulate steam valves and fitting, reinsulate piping with proper fitting insulation
Varies 1 - 3 1
CCC-7Recommission HVAC air side to ensure proper pressure set points and no simultaneous heating/cooling
$150,000 - $400,000
Varies 2
CCC-8 Install occupancy sensors where lacking. Varies Varies 2
CCC-9Consider chilled beam and/or variable refrigerant flow (VRF) systems for HVAC upgrades to save energy and increase zoning/comfort
Varies Varies 3
TABLE 2: Capital Energy Efficiency Measures
In addition to the priority projects, next steps for Capital are below:
Next Steps
Management
Capital should continue to review energy bills, including tracking energy use and comparing energy spend to available budgets. Continuous commissioning software should be explored if energy use is found to increase for unknown reasons after recommissioning.
Fume Hoods
It is suggested for Capital to implement a fume hood sash management program to ensure hoods are closed and turned off when not in use.
Capital is one of the lowest energy users among the community colleges and within the CSCU system; there are further opportunities to reduce consumption through energy management decisions, lighting replacement opportunities and continued HVAC optimization.
139
04
FINA
NC
ING
/FUN
DIN
G
OP
PO
RTU
NITIE
S
01
INTR
OD
UC
TION
06
CA
MP
US
P
LAN
S
05
SYS
TEM
LEVE
L R
EC
OM
ME
ND
ATION
S
02
SYS
TEN
LEVE
LE
XISTIN
G C
ON
DITIO
NS
03
SYS
TEM
LEVE
L E
NE
RG
Y NE
ED
S
INTRODUCTIONAs part of the Connecticut State Colleges & Universities (CSCU) Energy Master Plan, Capital Community College (Capital)’s building infrastructure, energy use and energy management practices were assessed. The ultimate goal was to determine ways Capital could improve its energy use on campus, and be an active participant in CSCU energy reduction efforts. This chapter identifies Capital’s historical energy use, future projected needs and energy recommendations.
1.1 CAPITAL OVERVIEW
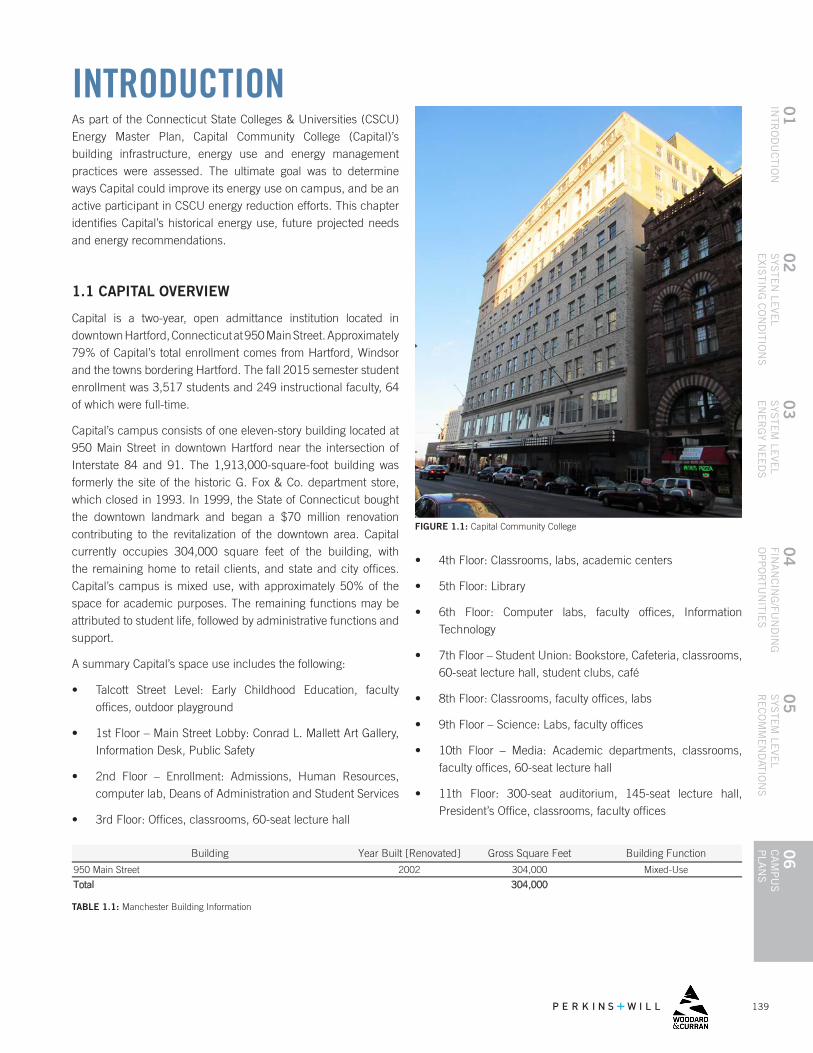
Capital is a two-year, open admittance institution located in downtown Hartford, Connecticut at 950 Main Street. Approximately 79% of Capital’s total enrollment comes from Hartford, Windsor and the towns bordering Hartford. The fall 2015 semester student enrollment was 3,517 students and 249 instructional faculty, 64 of which were full-time.
Capital’s campus consists of one eleven-story building located at 950 Main Street in downtown Hartford near the intersection of Interstate 84 and 91. The 1,913,000-square-foot building was formerly the site of the historic G. Fox & Co. department store, which closed in 1993. In 1999, the State of Connecticut bought the downtown landmark and began a $70 million renovation contributing to the revitalization of the downtown area. Capital currently occupies 304,000 square feet of the building, with the remaining home to retail clients, and state and city offices. Capital’s campus is mixed use, with approximately 50% of the space for academic purposes. The remaining functions may be attributed to student life, followed by administrative functions and support.
A summary Capital’s space use includes the following:
• Talcott Street Level: Early Childhood Education, faculty offices, outdoor playground
• 1st Floor – Main Street Lobby: Conrad L. Mallett Art Gallery, Information Desk, Public Safety
• 2nd Floor – Enrollment: Admissions, Human Resources, computer lab, Deans of Administration and Student Services
• 3rd Floor: Offices, classrooms, 60-seat lecture hall
TABLE 1.1: Manchester Building Information
• 4th Floor: Classrooms, labs, academic centers
• 5th Floor: Library
• 6th Floor: Computer labs, faculty offices, Information Technology
• 7th Floor – Student Union: Bookstore, Cafeteria, classrooms, 60-seat lecture hall, student clubs, café
• 8th Floor: Classrooms, faculty offices, labs
• 9th Floor – Science: Labs, faculty offices
• 10th Floor – Media: Academic departments, classrooms, faculty offices, 60-seat lecture hall
• 11th Floor: 300-seat auditorium, 145-seat lecture hall, President’s Office, classrooms, faculty offices
FIGURE 1.1: Capital Community College
Building Year Built [Renovated] Gross Square Feet Building Function
950 Main Street 2002 304,000 Mixed-Use
Total 304,000
140 ENERGY MASTER PLAN // Connecticut State Colleges & Universities
1.2 PREVIOUS ENERGY STUDIES & PROJECTS
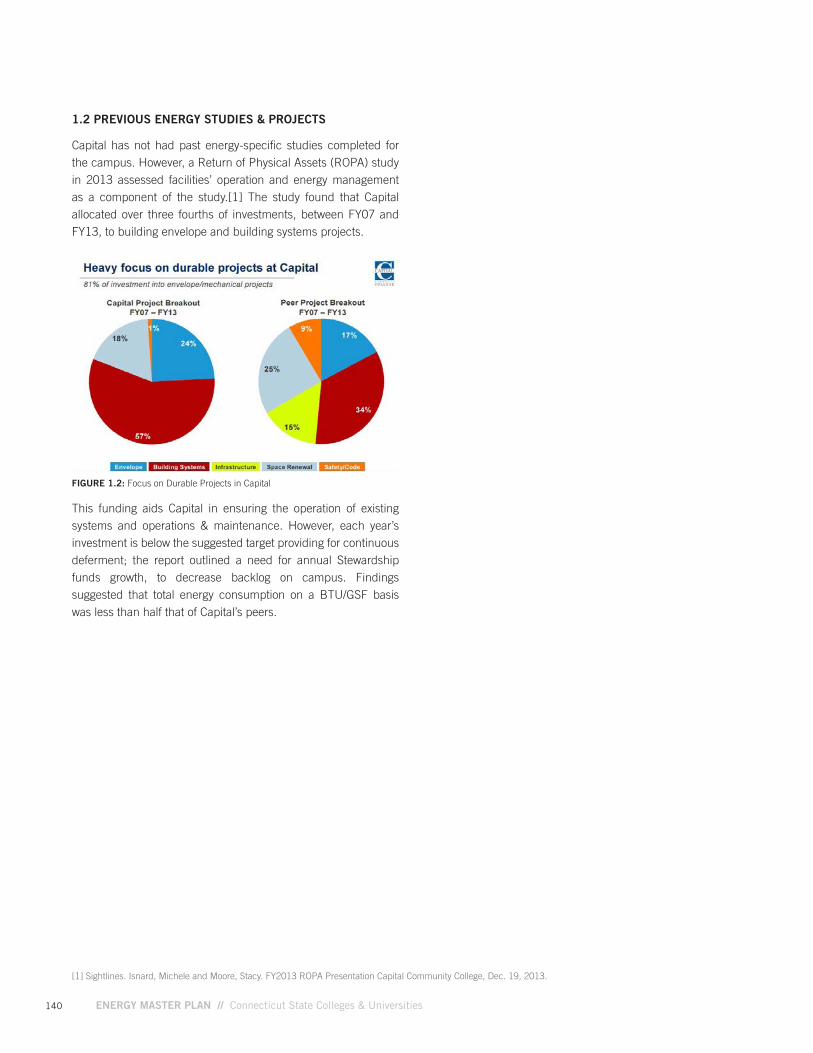
Capital has not had past energy-specific studies completed for the campus. However, a Return of Physical Assets (ROPA) study in 2013 assessed facilities’ operation and energy management as a component of the study.[1] The study found that Capital allocated over three fourths of investments, between FY07 and FY13, to building envelope and building systems projects.
This funding aids Capital in ensuring the operation of existing systems and operations & maintenance. However, each year’s investment is below the suggested target providing for continuous deferment; the report outlined a need for annual Stewardship funds growth, to decrease backlog on campus. Findings suggested that total energy consumption on a BTU/GSF basis was less than half that of Capital’s peers.
FIGURE 1.2: Focus on Durable Projects in Capital
[1] Sightlines. Isnard, Michele and Moore, Stacy. FY2013 ROPA Presentation Capital Community College, Dec. 19, 2013.
141
04
FINA
NC
ING
/FUN
DIN
G
OP
PO
RTU
NITIE
S
01
INTR
OD
UC
TION
06
CA
MP
US
P
LAN
S
05
SYS
TEM
LEVE
L R
EC
OM
ME
ND
ATION
S
02
SYS
TEN
LEVE
LE
XISTIN
G C
ON
DITIO
NS
03
SYS
TEM
LEVE
L E
NE
RG
Y NE
ED
S
EXISTING CONDITIONS & RECOMMENDATIONSInformation on Capital’s existing conditions was captured from campus interviews, energy data and reports provided by the campus. A holistic view of existing practices, material on energy management, energy infrastructure and project implementation processes was reviewed. Analysis of the data and campus walkthroughs helped clarify recommendations with the goal of decreasing energy use, documented after each subheading.
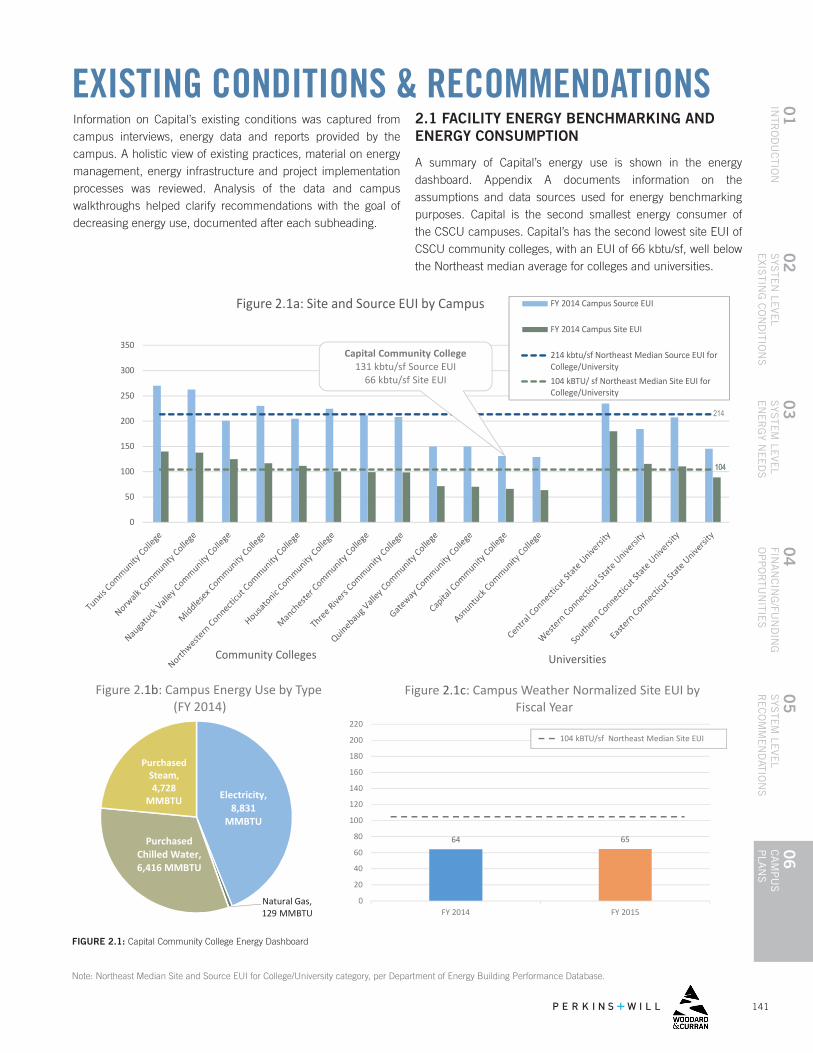
2.1 FACILITY ENERGY BENCHMARKING AND ENERGY CONSUMPTION
A summary of Capital’s energy use is shown in the energy dashboard. Appendix A documents information on the assumptions and data sources used for energy benchmarking purposes. Capital is the second smallest energy consumer of the CSCU campuses. Capital’s has the second lowest site EUI of CSCU community colleges, with an EUI of 66 kbtu/sf, well below the Northeast median average for colleges and universities.
Note: Northeast Median Site and Source EUI for College/University category, per Department of Energy Building Performance Database.
FIGURE 2.1: Capital Community College Energy Dashboard
DRAFT Central Dashboard May 2016
Electricity,8,831
MMBTU
Natural Gas,129 MMBTU
PurchasedChilled Water,6,416 MMBTU
PurchasedSteam,4,728
MMBTU
Figure 2.1b: Campus Energy Use by Type(FY 2014)
64 65
0
20
40
60
80
100
120
140
160
180
200
220
FY 2014 FY 2015
Figure 2.1c: Campus Weather Normalized Site EUI byFiscal Year
104 kBTU/sf Northeast Median Site EUI
Capital Community College131 kbtu/sf Source EUI
66 kbtu/sf Site EUI
0
50
100
150
200
250
300
350
Figure 2.1a: Site and Source EUI by Campus FY 2014 Campus Source EUI
FY 2014 Campus Site EUI
214 kbtu/sf Northeast Median Source EUI forCollege/University104 kBTU/ sf Northeast Median Site EUI forCollege/University
104104
214
UniversitiesCommunity Colleges
Capital Community College131 kbtu/sf Source EUI
66 kbtu/sf Site EUI
142 ENERGY MASTER PLAN // Connecticut State Colleges & Universities
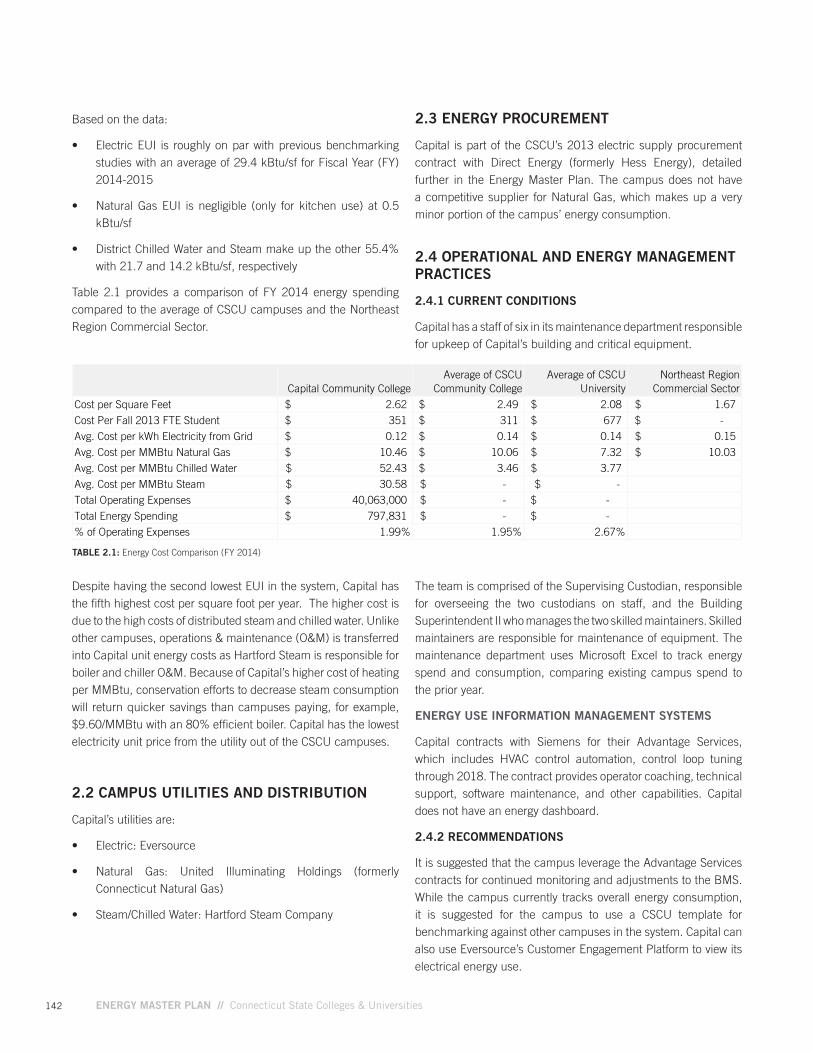
Based on the data:
• Electric EUI is roughly on par with previous benchmarking studies with an average of 29.4 kBtu/sf for Fiscal Year (FY) 2014-2015
• Natural Gas EUI is negligible (only for kitchen use) at 0.5 kBtu/sf
• District Chilled Water and Steam make up the other 55.4% with 21.7 and 14.2 kBtu/sf, respectively
Table 2.1 provides a comparison of FY 2014 energy spending compared to the average of CSCU campuses and the Northeast Region Commercial Sector.
2.3 ENERGY PROCUREMENT
Capital is part of the CSCU’s 2013 electric supply procurement contract with Direct Energy (formerly Hess Energy), detailed further in the Energy Master Plan. The campus does not have a competitive supplier for Natural Gas, which makes up a very minor portion of the campus’ energy consumption.
2.4 OPERATIONAL AND ENERGY MANAGEMENT PRACTICES
2.4.1 CURRENT CONDITIONS
Capital has a staff of six in its maintenance department responsible for upkeep of Capital’s building and critical equipment.
TABLE 2.1: Energy Cost Comparison (FY 2014)
Despite having the second lowest EUI in the system, Capital has the fifth highest cost per square foot per year. The higher cost is due to the high costs of distributed steam and chilled water. Unlike other campuses, operations & maintenance (O&M) is transferred into Capital unit energy costs as Hartford Steam is responsible for boiler and chiller O&M. Because of Capital’s higher cost of heating per MMBtu, conservation efforts to decrease steam consumption will return quicker savings than campuses paying, for example, $9.60/MMBtu with an 80% efficient boiler. Capital has the lowest electricity unit price from the utility out of the CSCU campuses.
2.2 CAMPUS UTILITIES AND DISTRIBUTION
Capital’s utilities are:
• Electric: Eversource
• Natural Gas: United Illuminating Holdings (formerly Connecticut Natural Gas)
• Steam/Chilled Water: Hartford Steam Company
The team is comprised of the Supervising Custodian, responsible for overseeing the two custodians on staff, and the Building Superintendent II who manages the two skilled maintainers. Skilled maintainers are responsible for maintenance of equipment. The maintenance department uses Microsoft Excel to track energy spend and consumption, comparing existing campus spend to the prior year.
ENERGY USE INFORMATION MANAGEMENT SYSTEMS
Capital contracts with Siemens for their Advantage Services, which includes HVAC control automation, control loop tuning through 2018. The contract provides operator coaching, technical support, software maintenance, and other capabilities. Capital does not have an energy dashboard.
2.4.2 RECOMMENDATIONS
It is suggested that the campus leverage the Advantage Services contracts for continued monitoring and adjustments to the BMS. While the campus currently tracks overall energy consumption, it is suggested for the campus to use a CSCU template for benchmarking against other campuses in the system. Capital can also use Eversource’s Customer Engagement Platform to view its electrical energy use.
Cost per Square Feet
Cost Per Fall 2013 FTE Student
Avg. Cost per kWh Electricity from Grid
Avg. Cost per MMBtu Natural Gas
Avg. Cost per MMBtu Chilled Water
Avg. Cost per MMBtu Steam
Total Operating Expenses
Total Energy Spending
% of Operating Expenses
Capital Community CollegeAverage of CSCU
Community CollegeAverage of CSCU
UniversityNortheast Region
Commercial Sector
2.62$ 2.49$ 2.08$ 1.67$
351$ 311$ 677$ -$
0.12$ 0.14$ 0.14$ 0.15$
10.46$ 10.06$ 7.32$ 10.03$
52.43$ 3.46$ 3.77$
1.99% 1.95% 2.67%
-$ $ -
40,063,000$ -$ -$
797,831$ -$ -$
30.58$
143
04
FINA
NC
ING
/FUN
DIN
G
OP
PO
RTU
NITIE
S
01
INTR
OD
UC
TION
06
CA
MP
US
P
LAN
S
05
SYS
TEM
LEVE
L R
EC
OM
ME
ND
ATION
S
02
SYS
TEN
LEVE
LE
XISTIN
G C
ON
DITIO
NS
03
SYS
TEM
LEVE
L E
NE
RG
Y NE
ED
S
2.5 EXISTING BUILDING COMMISSIONING
2.5.1 CURRENT CONDITIONS
No recent building commissioning efforts were reported, although Capital’s contract with Siemens for their Advantage Services appears to include many aspects of existing building commissioning.
2.5.2 RECOMMENDATIONS
Buildings with BMS systems with measurable points stand to benefit the most from recommissioning. Although Capital does not have chiller and boilers systems as other campuses do, building side heating and cooling loops as well as air handling units (AHUs) should be checked and tuned periodically.
Aspects to check specifically may include:
AHU economizer modes and scheduling to take advantage of free cooling at night in order to precool the building before expected cooling intensive days. Some examples of what to look for (in which case adjust lockout setpoints):
a. More than minimum outside air being introduced outside of economizer range b. Economizer locked out below return air temperature (more than 2-3 °F) c. Economizer locked out below 55 °F
• Review all HVAC BMS screens to confirm all controls work properly and there is no simultaneous heating and cooling occurring. Signs indicating this condition include:
a. Look for rise across coils when valves are closed b. Can also be identified by warm discharge air during economizer mode c. May also be caused by: 1.The location of temperature sensors, especially those place directl y below diffusers, in stratified air streams within the AHU (mixed air streams should use averaging temperature sensors), or placed too close to the preheat of cooling coil.
2. BMS heating and cooling ranges are too narrow with no deadband or may even overlap, in which case program setpoints need to be adjusted to include deadband, or a gap between the setpoint ranges.
2.6 MECHANICAL SYSTEMS
2.6.1 CURRENT CONDITIONS
BOILER SYSTEM - N/A
Capital takes advantage of district steam, provided by Hartford Steam and therefore does not own or maintain any boiler systems.
CHILLER SYSTEM - N/A
Similarly, Hartford Steam provides Capital with district chilled water. The company owns and maintains the systems, therefore there is not significant mechanical equipment onsite.
HVAC AIR SIDE
Capital’s air handlers use hot and chilled water.
FUME HOODS
The Laboratory School has fume hoods, many of which were left open and/or have sash position sensors not working.
DOMESTIC HOT WATER
Capital has a few small natural gas distributed heaters.
2.6.2 RECOMMENDATIONS
The following lists are recommendations by system type that would aid in optimizing efficiency, and reducing energy.
HEATING/COOLING WATER/STEAM SIDE
• Insulate steam valves and fittings, reinsulate piping with proper fitting insulation
HVAC AIR SIDE
• Recommissioning air handlers and building exhaust flow rates, add demand control ventilation (DCV) in larger open areas.
• Investigate using variable refrigerant flow (VRF) or chilled beam technology to reduce HVAC fan and pumping costs.
FUME HOODS
• Implement a fume hood sash management program to ensure that hoods are closed and turned off when not in use.
• Recommission fume hood sensors and/or controls
144 ENERGY MASTER PLAN // Connecticut State Colleges & Universities
2.7 LIGHTING
2.7.1 CURRENT CONDITIONS
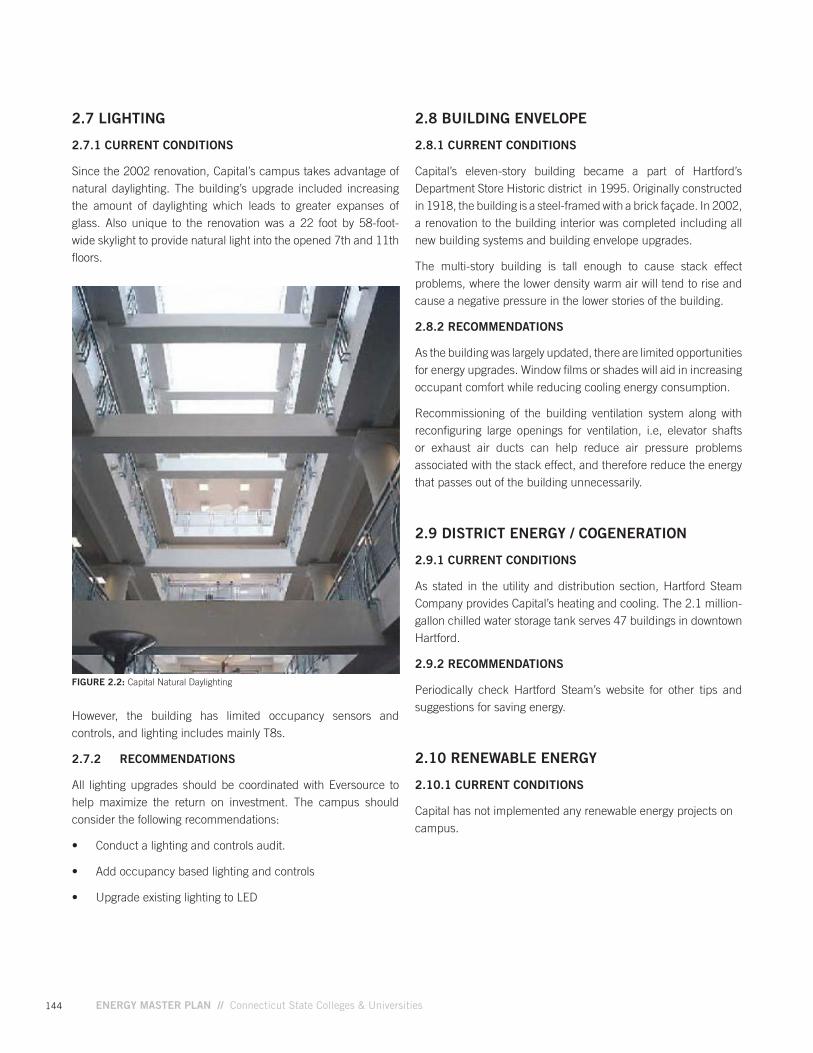
Since the 2002 renovation, Capital’s campus takes advantage of natural daylighting. The building’s upgrade included increasing the amount of daylighting which leads to greater expanses of glass. Also unique to the renovation was a 22 foot by 58-foot-wide skylight to provide natural light into the opened 7th and 11th floors.
FIGURE 2.2: Capital Natural Daylighting
However, the building has limited occupancy sensors and controls, and lighting includes mainly T8s.
2.7.2 RECOMMENDATIONS
All lighting upgrades should be coordinated with Eversource to help maximize the return on investment. The campus should consider the following recommendations:
• Conduct a lighting and controls audit.
• Add occupancy based lighting and controls
• Upgrade existing lighting to LED
2.8 BUILDING ENVELOPE
2.8.1 CURRENT CONDITIONS
Capital’s eleven-story building became a part of Hartford’s Department Store Historic district in 1995. Originally constructed in 1918, the building is a steel-framed with a brick façade. In 2002, a renovation to the building interior was completed including all new building systems and building envelope upgrades.
The multi-story building is tall enough to cause stack effect problems, where the lower density warm air will tend to rise and cause a negative pressure in the lower stories of the building.
2.8.2 RECOMMENDATIONS
As the building was largely updated, there are limited opportunities for energy upgrades. Window films or shades will aid in increasing occupant comfort while reducing cooling energy consumption.
Recommissioning of the building ventilation system along with reconfiguring large openings for ventilation, i.e, elevator shafts or exhaust air ducts can help reduce air pressure problems associated with the stack effect, and therefore reduce the energy that passes out of the building unnecessarily.
2.9 DISTRICT ENERGY / COGENERATION
2.9.1 CURRENT CONDITIONS
As stated in the utility and distribution section, Hartford Steam Company provides Capital’s heating and cooling. The 2.1 million-gallon chilled water storage tank serves 47 buildings in downtown Hartford.
2.9.2 RECOMMENDATIONS
Periodically check Hartford Steam’s website for other tips and suggestions for saving energy.
2.10 RENEWABLE ENERGY
2.10.1 CURRENT CONDITIONS
Capital has not implemented any renewable energy projects on campus.
145
04
FINA
NC
ING
/FUN
DIN
G
OP
PO
RTU
NITIE
S
01
INTR
OD
UC
TION
06
CA
MP
US
P
LAN
S
05
SYS
TEM
LEVE
L R
EC
OM
ME
ND
ATION
S
02
SYS
TEN
LEVE
LE
XISTIN
G C
ON
DITIO
NS
03
SYS
TEM
LEVE
L E
NE
RG
Y NE
ED
S
2.10.2 RECOMMENDATIONS
Capital’s urban setting limits the campus’ solar opportunities. The 11-story building also has mechanical equipment on the roof preventing a feasible solar opportunity. In addition, part of the building is leased by other entities making it unsuitable site for power purchase agreement (PPA), which would need to be coordinated with the property owner. The campus may consider implementing off site renewable energy if the opportunity arises.
2.11 CAPITAL PLANNING
2.11.1 CURRENT CONDITIONS
Capital’s 2005 Campus Master Plan established goals related to campus infrastructure and utility improvements which consisted of mechanical, electrical and plumbing systems upgrades such as the replacement of chillers, upgrades to electrical distribution equipment, domestic water equipment and other supplementary objectives. As indicated by the campus’ spending by the ROPA report, Capital continues to spend on equipment upgrades.
To accomplish its energy infrastructure goals, Capital relies on financing and funding from the System Office and the State. The System Office provides annual code compliance and infrastructure funds. Larger capital projects are also funded under CSCU 2020, as of FY 2015. The State Legislature allocates bonds for campus improvement projects, such as Capital’s Phase 1 Master Plan.
More information on campus expansion projects is found in Section 3.1
2.11.2 RECOMMENDATIONS
Capital should continue to collaborate with its energy utilities for all major building renovations, mechanical, plumbing and electrical equipment, and all new construction.
2.12 COLLABORATION / PARTNERSHIP
2.12.1 CURRENT CONDITIONS
The System Office Facilities Department is available to provide assistance in budgeting, capital planning and technical support for the community college projects, including Capital. Personnel responsible for energy management project and upgrades have limited interaction with other departments or staff.
2.12.2 RECOMMENDATIONS
Having a partnership with Eversource could benefit Capital. Capital should work with Eversource to take advantage of Utility Incentives for the EEMs presented in this plan.
Incentives structures range and vary by program, but Eversource has offered incentives of up to 80% of project costs in the past.
2.13 SUMMARY OF RECOMMENDED ENERGY EFFICIENCY OPPORTUNITIES
As a result of the campus walk through energy assessment, and interviews with campus staff, a list of potential Energy Efficiency Measures (EEMs) is presented in Table 2.2. These projects represent both low cost, immediate action measures, as well as projects that may require larger capital and therefore be longer-term.
Currently, Eversource is offering energy saving incentives by combining multiple energy saving opportunities in what is known as a “Comprehensive Project.” The primary advantage of a Comprehensive Project is the maximum incentive cap is normally raised from 40% to 50%. The incentive increase is from $0.30/kwh or $3.50/CCF (with 40% cost cap) to $0.40/kwh or $4.00/CCF (with 60% cost cap).
Since incentives are based on incremental energy savings, further analysis and collaboration with Eversource is required to determine rebate amounts for each opportunity. To help Capital navigate and prioritize the energy opportunities identified, a summary of energy efficiency measures were identified (see Table 2.2). Immediate action should be taken to consider priority 1 and 2 opportunities with the goal of combining multiple opportunities for a Comprehensive Project with Eversource.
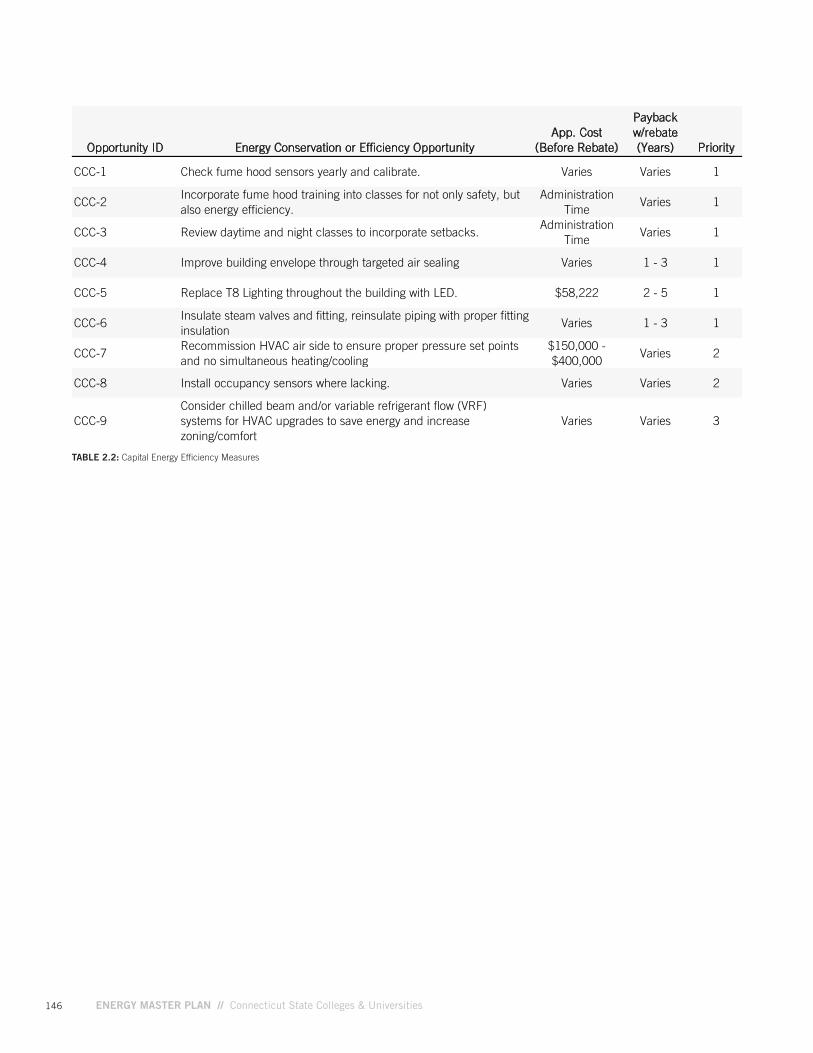
146 ENERGY MASTER PLAN // Connecticut State Colleges & Universities
Opportunity ID Energy Conservation or Efficiency OpportunityApp. Cost
(Before Rebate)
Payback w/rebate (Years) Priority
CCC-1 Check fume hood sensors yearly and calibrate. Varies Varies 1
CCC-2Incorporate fume hood training into classes for not only safety, but also energy efficiency.
Administration Time
Varies 1
CCC-3 Review daytime and night classes to incorporate setbacks. Administration
TimeVaries 1
CCC-4 Improve building envelope through targeted air sealing Varies 1 - 3 1
CCC-5 Replace T8 Lighting throughout the building with LED. $58,222 2 - 5 1
CCC-6Insulate steam valves and fitting, reinsulate piping with proper fitting insulation
Varies 1 - 3 1
CCC-7Recommission HVAC air side to ensure proper pressure set points and no simultaneous heating/cooling
$150,000 - $400,000
Varies 2
CCC-8 Install occupancy sensors where lacking. Varies Varies 2
CCC-9Consider chilled beam and/or variable refrigerant flow (VRF) systems for HVAC upgrades to save energy and increase zoning/comfort
Varies Varies 3
TABLE 2.2: Capital Energy Efficiency Measures
147
04
FINA
NC
ING
/FUN
DIN
G
OP
PO
RTU
NITIE
S
01
INTR
OD
UC
TION
06
CA
MP
US
P
LAN
S
05
SYS
TEM
LEVE
L R
EC
OM
ME
ND
ATION
S
02
SYS
TEN
LEVE
LE
XISTIN
G C
ON
DITIO
NS
03
SYS
TEM
LEVE
L E
NE
RG
Y NE
ED
S
3.1 FUTURE DEVELOPMENT
A campus’ energy consumption and intensity may change depending on its future building development. Capital is in the initial investigation stages of examining the possibility of a satellite campus. It is unknown if there will be further effort to more fully develop this option. There are not currently plans in place for short-term redevelopment, suggesting the campus will not be in need of major energy infrastructure changes in the near future.
While there are not definitive plans for campus growth, assurance of energy reliability for maintenance of campus operations should be a priority. According to Capital stakeholders, the campus currently has limited power backup capabilities, with supplementary supply only for emergency lighting and elevators. The generator is located in the adjacent facility and is not owned by Capital. Information technology systems have twenty-minute battery backup, after which systems are not operational.
3.2 ENERGY RESILIENCY RECOMMENDATIONS
Capital partook in the CSCU system-wide hazard mitigation initiative. The CSCU Multi-Hazard Mitigation Plan provided recommendations surrounding energy resiliency that are also applicable for the Energy Master Plan. The list below provides recommendations from the hazard mitigation plan for improving the energy reliability and resiliency of the campus.
• Upgrade emergency power capabilities to cover critical campus functions, with particular focus on IT capabilities.
• Investigate power redundancy or the addition of a generator on campus
• Add building insulation to walls and around pipes to prevent frozen pipes.
• Install green roofs to remove heat from roof surface and reduce stormwater runoff
• Improve building envelope
ENERGY NEEDS
148 ENERGY MASTER PLAN // Connecticut State Colleges & Universities
CONCLUSION / NEXT STEPSCapital’s newer building and upgrades and use of district energy have served advantageously for the campus, as demonstrated by the second lowest EUI of CSCU’s community colleges. With newer building systems, it is important for the campus to stay ahead of repairs with preventive maintenance. Areas for improvement include upgraded lighting and more building controls and HVAC zoning, ideally implemented with a BMS. Other top priority initiatives include:
• Management: Capital should continue to track energy use and compare energy spend to available budgets. The campus is recommended to leverage the BMS Siemens contract. Capital is suggested to create a fume hood management program as well.
• Utility Incentives/ Develop Plan for EEMs: Capital should maximize incentive funding for EEMs by working with Eversource. Further analysis and collaboration with Eversource is required to determine rebate amounts for each opportunity.
A summary of further projects and priorities for the campus are listed in Table 2.2. While Capital has the second lowest energy use intensity of CSCU, there are still opportunities to capture savings, decrease energy use and increase energy reliability and sustainability.
4.1 CONTACT INFORMATION FOR KEY STAKEHOLDERS
Collecting all the necessary information for this planning effort required a collaborative effort. Below are the stakeholders that were active in providing their expertise about campus current conditions and future needs, and energy related decisions.
CAPITAL COMMUNITY COLLEGE
ORLANDO RODRIGUEZ Building Superintendent [email protected] 860-906-5070
149
04
FINA
NC
ING
/FUN
DIN
G
OP
PO
RTU
NITIE
S
01
INTR
OD
UC
TION
06
CA
MP
US
P
LAN
S
05
SYS
TEM
LEVE
L R
EC
OM
ME
ND
ATION
S
02
SYS
TEN
LEVE
LE
XISTIN
G C
ON
DITIO
NS
03
SYS
TEM
LEVE
L E
NE
RG
Y NE
ED
S
APPENDIX A: CAPITAL DATA METHODOLOGY, ASSUMPTIONS AND NOTESThe following are the data methodology and assumptions that were used when analyzing and benchmarking data for Capital:
All three fiscal years of consumption data are complete. No information to indicate that the campus uses propane or fuel oil.
Electricity: Consumption Reports (FY13,14,15)
• Eversource online data and consumption reports for electric consumption were provided. The numbers were very close between the two sources and the consumption reports were use.
• Cost per kWh are the consumption report’s cost divided by the consumption report’s consumption. Supply and demand blended cost. Consumption reports are also the $/MMBtu source for natural gas, chilled water, and steam.
Natural Gas: Consumption Reports (FY13,14,15)
• The campus provided utility bill scans of natural gas for FY13 only. The consumption reports were used to have consistency across the fiscal years.
Purchased Chilled Water: Consumption Reports (FY13,14,15)
• The campus provided utility bill scans of chilled water for FY13 only (Hartford Steam). The consumption reports were used to have consistency across the fiscal years.
Purchased Steam: Consumption Reports (FY13,14,15)
• The campus provided utility bill scans of steam for FY13 only (Hartford Steam). The consumption reports were used to have consistency across the fiscal years.
Other Assumptions
• Weather Normalizing Building uses steam and chilled water to heat and cool. All natural gas purchased is for the labs and cooking and all electricity is for lights, appliances, computers, etc.
• Buildings Not Included for EUI Lab School – Part of the main building, redundant Fox Elevator – Part of the main building, redundant

150 ENERGY MASTER PLAN // Connecticut State Colleges & Universities
6.3
// 151
04
FINA
NC
ING
/FUN
DIN
G
OP
PO
RTU
NITIE
S
01
INTR
OD
UC
TION
06
CA
MP
US
P
LAN
S
05
SYS
TEM
LEVE
L R
EC
OM
ME
ND
ATION
S
02
SYS
TEN
LEVE
LE
XISTIN
G C
ON
DITIO
NS
03
SYS
TEM
LEVE
L E
NE
RG
Y NE
ED
S
6.3GATEWAY
COMMUNITY COLLEGE
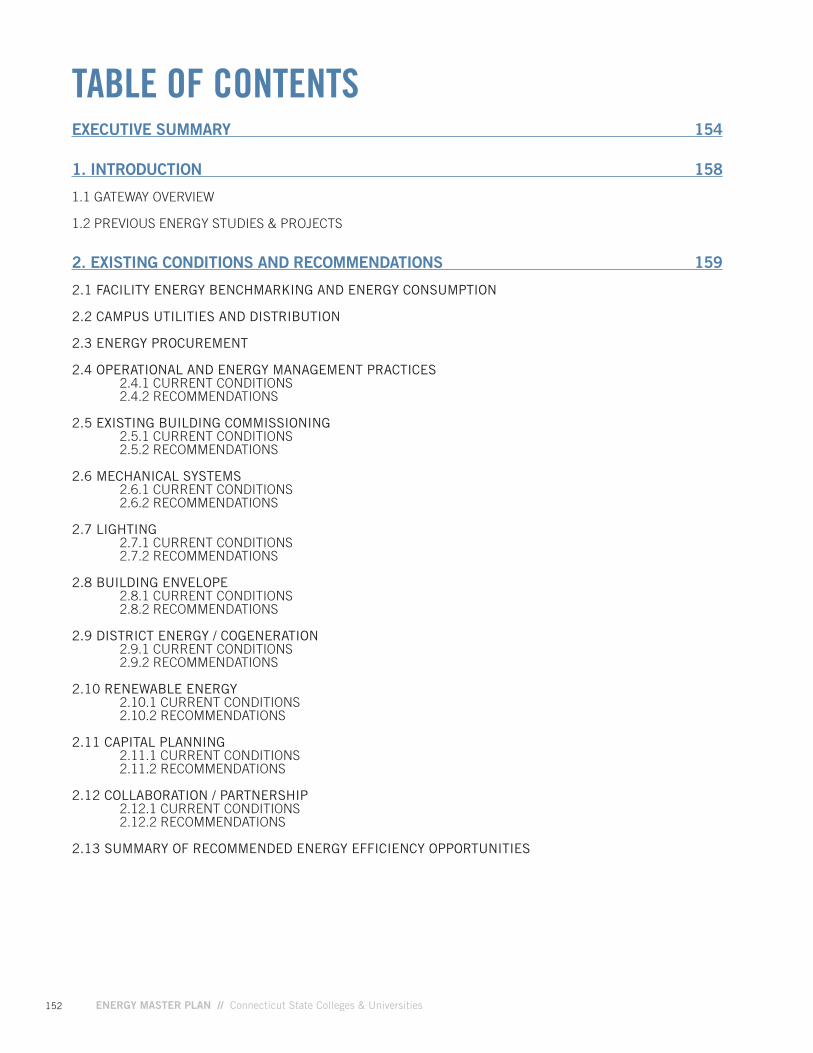
152 ENERGY MASTER PLAN // Connecticut State Colleges & Universities
TABLE OF CONTENTSEXECUTIVE SUMMARY 154
1. INTRODUCTION 158
1.1 GATEWAY OVERVIEW
1.2 PREVIOUS ENERGY STUDIES & PROJECTS
2. EXISTING CONDITIONS AND RECOMMENDATIONS 159
2.1 FACILITY ENERGY BENCHMARKING AND ENERGY CONSUMPTION
2.2 CAMPUS UTILITIES AND DISTRIBUTION
2.3 ENERGY PROCUREMENT
2.4 OPERATIONAL AND ENERGY MANAGEMENT PRACTICES 2.4.1 CURRENT CONDITIONS 2.4.2 RECOMMENDATIONS 2.5 EXISTING BUILDING COMMISSIONING 2.5.1 CURRENT CONDITIONS 2.5.2 RECOMMENDATIONS
2.6 MECHANICAL SYSTEMS 2.6.1 CURRENT CONDITIONS 2.6.2 RECOMMENDATIONS
2.7 LIGHTING 2.7.1 CURRENT CONDITIONS 2.7.2 RECOMMENDATIONS
2.8 BUILDING ENVELOPE 2.8.1 CURRENT CONDITIONS 2.8.2 RECOMMENDATIONS
2.9 DISTRICT ENERGY / COGENERATION 2.9.1 CURRENT CONDITIONS 2.9.2 RECOMMENDATIONS
2.10 RENEWABLE ENERGY 2.10.1 CURRENT CONDITIONS 2.10.2 RECOMMENDATIONS
2.11 CAPITAL PLANNING 2.11.1 CURRENT CONDITIONS 2.11.2 RECOMMENDATIONS
2.12 COLLABORATION / PARTNERSHIP 2.12.1 CURRENT CONDITIONS 2.12.2 RECOMMENDATIONS
2.13 SUMMARY OF RECOMMENDED ENERGY EFFICIENCY OPPORTUNITIES
153
04
FINA
NC
ING
/FUN
DIN
G
OP
PO
RTU
NITIE
S
01
INTR
OD
UC
TION
06
CA
MP
US
P
LAN
S
05
SYS
TEM
LEVE
L R
EC
OM
ME
ND
ATION
S
02
SYS
TEN
LEVE
LE
XISTIN
G C
ON
DITIO
NS
03
SYS
TEM
LEVE
L E
NE
RG
Y NE
ED
SLIST OF FIGURES FIGURE 1: GATEWAY COMMUNITY COLLEGE ENERGY DASHBOARD 154
FIGURE 1.1: GATEWAY COMMUNITY COLLEGE 158
FIGURE 2.1: GATEWAY COMMUNITY COLLEGE ENERGY DASHBOARD 159
FIGURE 2.2: BUILDING MANAGEMENT SYSTEM 161
FIGURE 2.3: HEAT EXCHANGER DEBRIS 162
FIGURE 2.4: BOILER SYSTEM MONITOR 162
FIGURE 2.5: NORTH HAVEN CAMPUS AIR CONDITIONING 163
FIGURE 2.6: NORTH HAVEN HEATING CONTROL 163
FIGURE 2.7: FISH TANK AND FUME HOOD 163
FIGURE 2.8: NORTH HAVEN FUME HOOD 164
FIGURE 2.9: CAMPUS DAYLIGHTING 165
FIGURE 2.10: AUTOMOTIVE TECHNOLOGY CENTER AT NORTH HAVEN 165
FIGURE 2.11: CONNECTING COURTYARD 165
FIGURE 2.12: SOLAR SYSTEM 166
LIST OF TABLES TABLE 1: ENERGY COST COMPARISON (FY 2014) 155
TABLE 2: GATEWAY ENERGY EFFICIENCY MEASURES 156
TABLE 1.1: GATEWAY COMMUNITY COLLEGE BUILDING INFORMATION 158
TABLE 2.1: ENERGY COST COMPARISON (FY 2014) 160
TABLE 2.2: GATEWAY ENERGY EFFICIENCY MEASURES 168
3. ENERGY NEEDS 169
3.1 FUTURE DEVELOPMENT
3.2 ENERGY RESILIENCY RECOMMENDATIONS
4. CONCLUSION / NEXT STEPS 170
4.1 CONTACT INFORMATION FOR KEY STAKEHOLDERS
APPENDIX 171APPENDIX A: GATEWAY DATA METHODOLOGY, ASSUMPTIONS AND NOTES
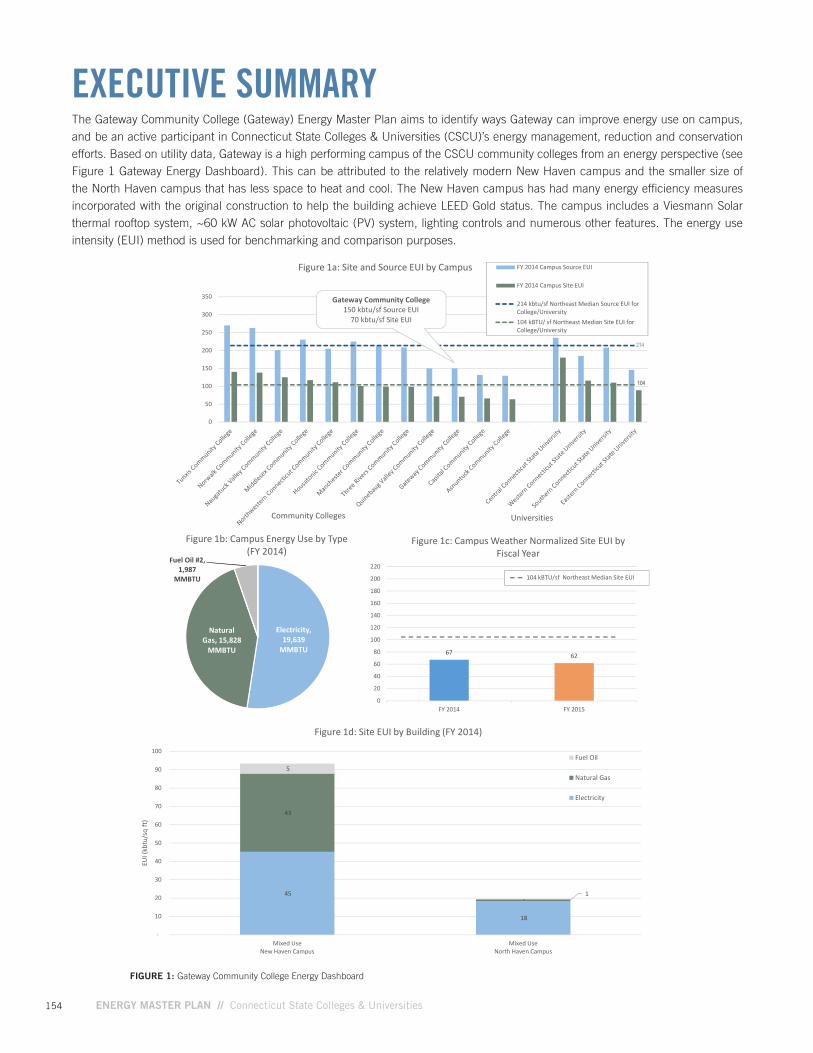
154 ENERGY MASTER PLAN // Connecticut State Colleges & Universities
EXECUTIVE SUMMARYThe Gateway Community College (Gateway) Energy Master Plan aims to identify ways Gateway can improve energy use on campus, and be an active participant in Connecticut State Colleges & Universities (CSCU)’s energy management, reduction and conservation efforts. Based on utility data, Gateway is a high performing campus of the CSCU community colleges from an energy perspective (see Figure 1 Gateway Energy Dashboard). This can be attributed to the relatively modern New Haven campus and the smaller size of the North Haven campus that has less space to heat and cool. The New Haven campus has had many energy efficiency measures incorporated with the original construction to help the building achieve LEED Gold status. The campus includes a Viesmann Solar thermal rooftop system, ~60 kW AC solar photovoltaic (PV) system, lighting controls and numerous other features. The energy use intensity (EUI) method is used for benchmarking and comparison purposes.
FIGURE 1: Gateway Community College Energy Dashboard
DRAFT Central Dashboard May 2016
Electricity, 19,639
MMBTU
Natural Gas, 15,828
MMBTU
Fuel Oil #2, 1,987
MMBTU
Figure 1b: Campus Energy Use by Type(FY 2014)
Gateway Community College150 kbtu/sf Source EUI
70 kbtu/sf Site EUI
0
50
100
150
200
250
300
350
Figure 1a: Site and Source EUI by Campus FY 2014 Campus Source EUI
FY 2014 Campus Site EUI
214 kbtu/sf Northeast Median Source EUI forCollege/University104 kBTU/ sf Northeast Median Site EUI forCollege/University
104104
214
UniversitiesCommunity Colleges
67 62
0
20
40
60
80
100
120
140
160
180
200
220
FY 2014 FY 2015
Figure 1c: Campus Weather Normalized Site EUI byFiscal Year
104 kBTU/sf Northeast Median Site EUI
45
18
43
1
5
-
-
10
20
30
40
50
60
70
80
90
100
Mixed UseNew Haven Campus
Mixed UseNorth Haven Campus
EUI (
kbtu
/sq
ft)
Figure 1d: Site EUI by Building (FY 2014)
Fuel Oil
Natural Gas
Electricity
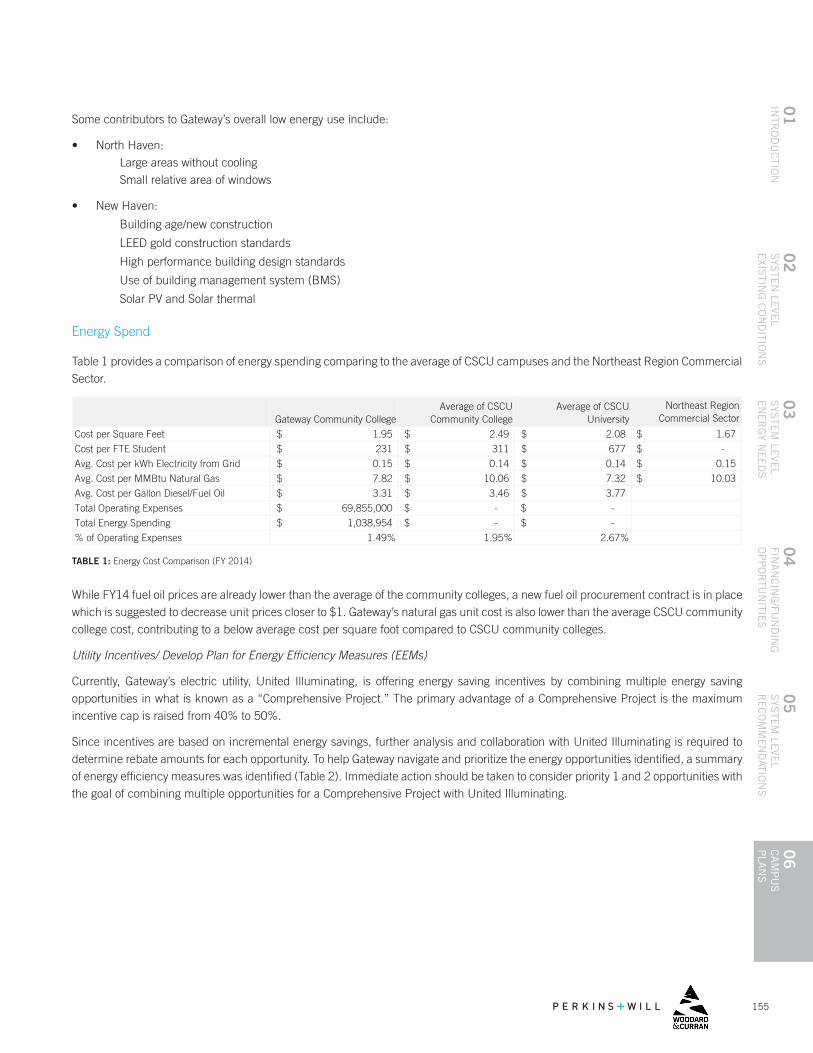
155
04
FINA
NC
ING
/FUN
DIN
G
OP
PO
RTU
NITIE
S
01
INTR
OD
UC
TION
06
CA
MP
US
P
LAN
S
05
SYS
TEM
LEVE
L R
EC
OM
ME
ND
ATION
S
02
SYS
TEN
LEVE
LE
XISTIN
G C
ON
DITIO
NS
03
SYS
TEM
LEVE
L E
NE
RG
Y NE
ED
S
TABLE 1: Energy Cost Comparison (FY 2014)
While FY14 fuel oil prices are already lower than the average of the community colleges, a new fuel oil procurement contract is in place which is suggested to decrease unit prices closer to $1. Gateway’s natural gas unit cost is also lower than the average CSCU community college cost, contributing to a below average cost per square foot compared to CSCU community colleges.
Utility Incentives/ Develop Plan for Energy Efficiency Measures (EEMs)
Currently, Gateway’s electric utility, United Illuminating, is offering energy saving incentives by combining multiple energy saving opportunities in what is known as a “Comprehensive Project.” The primary advantage of a Comprehensive Project is the maximum incentive cap is raised from 40% to 50%.
Since incentives are based on incremental energy savings, further analysis and collaboration with United Illuminating is required to determine rebate amounts for each opportunity. To help Gateway navigate and prioritize the energy opportunities identified, a summary of energy efficiency measures was identified (Table 2). Immediate action should be taken to consider priority 1 and 2 opportunities with the goal of combining multiple opportunities for a Comprehensive Project with United Illuminating.
Some contributors to Gateway’s overall low energy use include:
• North Haven: Large areas without cooling Small relative area of windows
• New Haven:
Building age/new construction
LEED gold construction standards
High performance building design standards
Use of building management system (BMS)
Solar PV and Solar thermal
Energy Spend
Table 1 provides a comparison of energy spending comparing to the average of CSCU campuses and the Northeast Region Commercial Sector.
Northeast Region Commercial Sector
Cost per Square Feet 1.67$
Cost per FTE Student -$
Avg. Cost per kWh Electricity from Grid 0.15$
Avg. Cost per MMBtu Natural Gas 10.03$
Avg. Cost per Gallon Diesel/Fuel Oil
Total Operating Expenses
Total Energy Spending
% of Operating Expenses
Gateway Community CollegeAverage of CSCU
Community CollegeAverage of CSCU
University
1.95$ 2.49$ 2.08$
231$ 311$ 677$
0.15$ 0.14$ 0.14$
7.82$ 10.06$ 7.32$
69,855,000$ -$ -$
3.31$ 3.46$ 3.77$
1,038,954$ -$ -$
1.49% 1.95% 2.67%
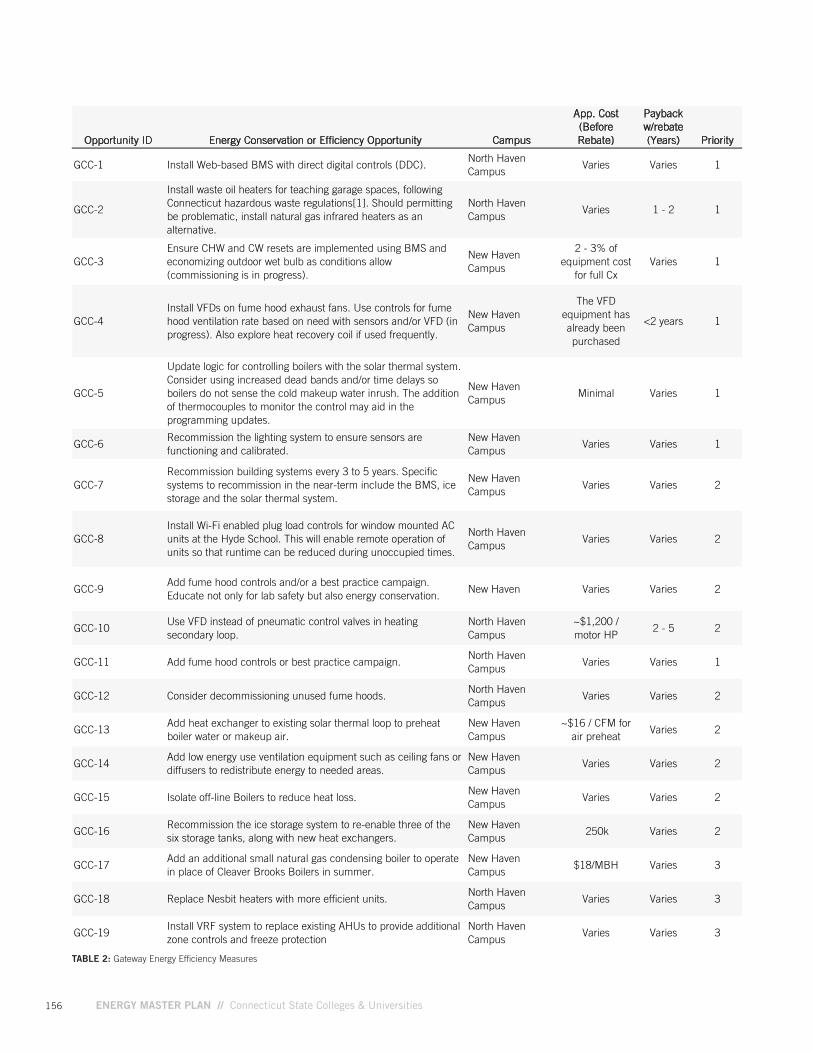
156 ENERGY MASTER PLAN // Connecticut State Colleges & Universities
TABLE 2: Gateway Energy Efficiency Measures
Opportunity ID Energy Conservation or Efficiency Opportunity Campus
App. Cost (Before Rebate)
Payback w/rebate (Years) Priority
GCC-1 Install Web-based BMS with direct digital controls (DDC).North Haven Campus
Varies Varies 1
GCC-2
Install waste oil heaters for teaching garage spaces, following Connecticut hazardous waste regulations[1]. Should permitting be problematic, install natural gas infrared heaters as an alternative.
North Haven Campus
Varies 1 - 2 1
GCC-3Ensure CHW and CW resets are implemented using BMS and economizing outdoor wet bulb as conditions allow (commissioning is in progress).
New Haven Campus
2 - 3% of equipment cost
for full CxVaries 1
GCC-4Install VFDs on fume hood exhaust fans. Use controls for fume hood ventilation rate based on need with sensors and/or VFD (in progress). Also explore heat recovery coil if used frequently.
New Haven Campus
The VFD equipment has already been purchased
<2 years 1
GCC-5
Update logic for controlling boilers with the solar thermal system. Consider using increased dead bands and/or time delays so boilers do not sense the cold makeup water inrush. The addition of thermocouples to monitor the control may aid in the programming updates.
New Haven Campus
Minimal Varies 1
GCC-6Recommission the lighting system to ensure sensors are functioning and calibrated.
New Haven Campus
Varies Varies 1
GCC-7Recommission building systems every 3 to 5 years. Specific systems to recommission in the near-term include the BMS, ice storage and the solar thermal system.
New Haven Campus
Varies Varies 2
GCC-8Install Wi-Fi enabled plug load controls for window mounted AC units at the Hyde School. This will enable remote operation of units so that runtime can be reduced during unoccupied times.
North Haven Campus
Varies Varies 2
GCC-9Add fume hood controls and/or a best practice campaign. Educate not only for lab safety but also energy conservation.
New Haven Varies Varies 2
GCC-10Use VFD instead of pneumatic control valves in heating secondary loop.
North Haven Campus
~$1,200 / motor HP
2 - 5 2
GCC-11 Add fume hood controls or best practice campaign. North Haven Campus
Varies Varies 1
GCC-12 Consider decommissioning unused fume hoods.North Haven Campus
Varies Varies 2
GCC-13Add heat exchanger to existing solar thermal loop to preheat boiler water or makeup air.
New Haven Campus
~$16 / CFM for air preheat
Varies 2
GCC-14Add low energy use ventilation equipment such as ceiling fans or diffusers to redistribute energy to needed areas.
New Haven Campus
Varies Varies 2
GCC-15 Isolate off-line Boilers to reduce heat loss.New Haven Campus
Varies Varies 2
GCC-16Recommission the ice storage system to re-enable three of the six storage tanks, along with new heat exchangers.
New Haven Campus
250k Varies 2
GCC-17Add an additional small natural gas condensing boiler to operate in place of Cleaver Brooks Boilers in summer.
New Haven Campus
$18/MBH Varies 3
GCC-18 Replace Nesbit heaters with more efficient units.North Haven Campus
Varies Varies 3
GCC-19Install VRF system to replace existing AHUs to provide additional zone controls and freeze protection
North Haven Campus
Varies Varies 3
157
04
FINA
NC
ING
/FUN
DIN
G
OP
PO
RTU
NITIE
S
01
INTR
OD
UC
TION
06
CA
MP
US
P
LAN
S
05
SYS
TEM
LEVE
L R
EC
OM
ME
ND
ATION
S
02
SYS
TEN
LEVE
LE
XISTIN
G C
ON
DITIO
NS
03
SYS
TEM
LEVE
L E
NE
RG
Y NE
ED
S
In addition to the priority projects, next steps for Gateway are below:
Next Steps
Management
Gateway should continue to track energy use as well as compare energy spend to available budgets. Gateway should continue to monitor fuel prices, but on an increased basis, such as on a daily or weekly basis, to leverage the most economical fuel for the dual fuel boilers. Fuel oil use is recommended when economical if viable within the context of the campus’ greenhouse gas emissions reduction plans. It is also recommended that staff receive additional training around building mechanical systems, such as with the ice storage system to continue to optimize efficiency. Training around preventative maintenance, particularly with newer buildings and more technologically complex systems, is important for maximizing energy savings. Continuous commissioning software should be explored if energy use is found to increase for unknown reasons after recommissioning.
Fume Hoods
Gateway should implement a fume hood sash management program to ensure hoods are closed and turned off when not in use. In North Haven specifically, Gateway should install the existing variable frequency drivers (VFDs) for better controls.
While Gateway’s New Haven campus includes many state-of-the-art energy features, there is still opportunity for both the North Haven and New Haven campuses to optimize efficiency and decrease energy use with the recommendations in this plan.
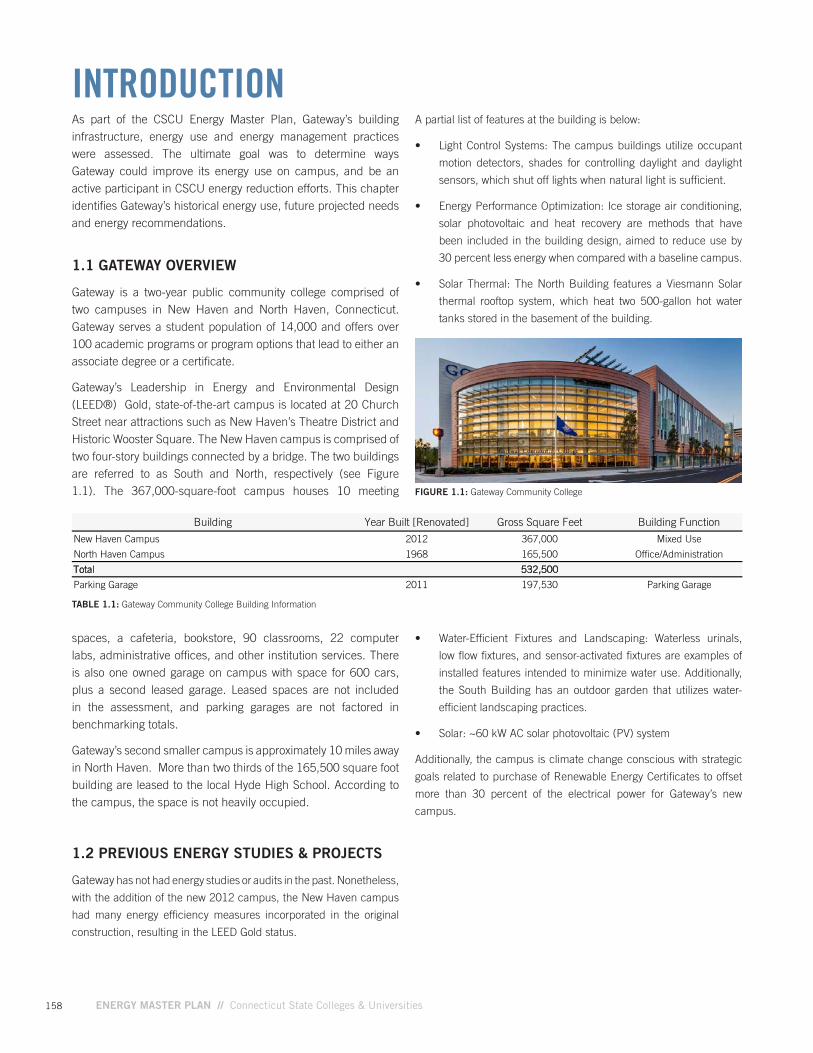
158 ENERGY MASTER PLAN // Connecticut State Colleges & Universities
INTRODUCTIONAs part of the CSCU Energy Master Plan, Gateway’s building infrastructure, energy use and energy management practices were assessed. The ultimate goal was to determine ways Gateway could improve its energy use on campus, and be an active participant in CSCU energy reduction efforts. This chapter identifies Gateway’s historical energy use, future projected needs and energy recommendations.
1.1 GATEWAY OVERVIEW
Gateway is a two-year public community college comprised of two campuses in New Haven and North Haven, Connecticut. Gateway serves a student population of 14,000 and offers over 100 academic programs or program options that lead to either an associate degree or a certificate.
Gateway’s Leadership in Energy and Environmental Design (LEED®) Gold, state-of-the-art campus is located at 20 Church Street near attractions such as New Haven’s Theatre District and Historic Wooster Square. The New Haven campus is comprised of two four-story buildings connected by a bridge. The two buildings are referred to as South and North, respectively (see Figure 1.1). The 367,000-square-foot campus houses 10 meeting FIGURE 1.1: Gateway Community College
Building Year Built [Renovated] Gross Square Feet Building Function
New Haven Campus 2012 367,000 Mixed Use
North Haven Campus 1968 165,500 Office/Administration
Total 532,500
Parking Garage 2011 197,530 Parking Garage
TABLE 1.1: Gateway Community College Building Information
spaces, a cafeteria, bookstore, 90 classrooms, 22 computer labs, administrative offices, and other institution services. There is also one owned garage on campus with space for 600 cars, plus a second leased garage. Leased spaces are not included in the assessment, and parking garages are not factored in benchmarking totals.
Gateway’s second smaller campus is approximately 10 miles away in North Haven. More than two thirds of the 165,500 square foot building are leased to the local Hyde High School. According to the campus, the space is not heavily occupied.
1.2 PREVIOUS ENERGY STUDIES & PROJECTS
Gateway has not had energy studies or audits in the past. Nonetheless,
with the addition of the new 2012 campus, the New Haven campus
had many energy efficiency measures incorporated in the original
construction, resulting in the LEED Gold status.
A partial list of features at the building is below:
• Light Control Systems: The campus buildings utilize occupant
motion detectors, shades for controlling daylight and daylight
sensors, which shut off lights when natural light is sufficient.
• Energy Performance Optimization: Ice storage air conditioning,
solar photovoltaic and heat recovery are methods that have
been included in the building design, aimed to reduce use by
30 percent less energy when compared with a baseline campus.
• Solar Thermal: The North Building features a Viesmann Solar
thermal rooftop system, which heat two 500-gallon hot water
tanks stored in the basement of the building.
• Water-Efficient Fixtures and Landscaping: Waterless urinals,
low flow fixtures, and sensor-activated fixtures are examples of
installed features intended to minimize water use. Additionally,
the South Building has an outdoor garden that utilizes water-
efficient landscaping practices.
• Solar: ~60 kW AC solar photovoltaic (PV) system
Additionally, the campus is climate change conscious with strategic
goals related to purchase of Renewable Energy Certificates to offset
more than 30 percent of the electrical power for Gateway’s new
campus.
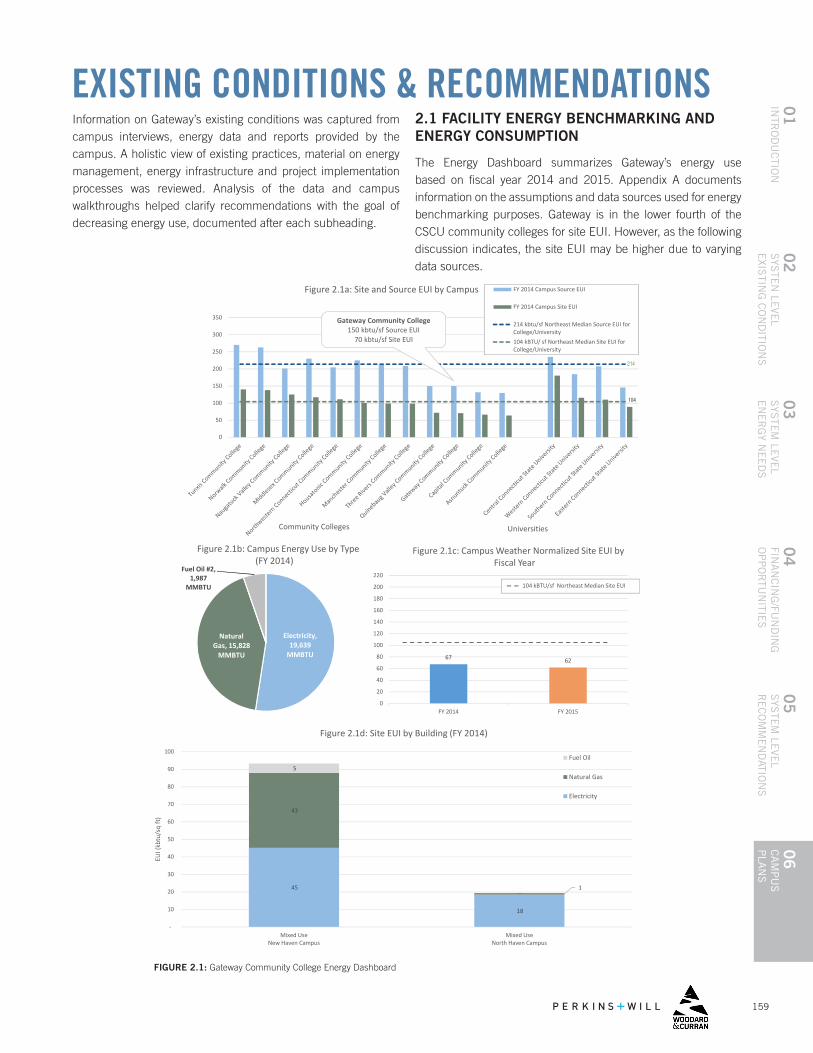
159
04
FINA
NC
ING
/FUN
DIN
G
OP
PO
RTU
NITIE
S
01
INTR
OD
UC
TION
06
CA
MP
US
P
LAN
S
05
SYS
TEM
LEVE
L R
EC
OM
ME
ND
ATION
S
02
SYS
TEN
LEVE
LE
XISTIN
G C
ON
DITIO
NS
03
SYS
TEM
LEVE
L E
NE
RG
Y NE
ED
S
EXISTING CONDITIONS & RECOMMENDATIONSInformation on Gateway’s existing conditions was captured from campus interviews, energy data and reports provided by the campus. A holistic view of existing practices, material on energy management, energy infrastructure and project implementation processes was reviewed. Analysis of the data and campus walkthroughs helped clarify recommendations with the goal of decreasing energy use, documented after each subheading.
2.1 FACILITY ENERGY BENCHMARKING AND ENERGY CONSUMPTION
The Energy Dashboard summarizes Gateway’s energy use based on fiscal year 2014 and 2015. Appendix A documents information on the assumptions and data sources used for energy benchmarking purposes. Gateway is in the lower fourth of the CSCU community colleges for site EUI. However, as the following discussion indicates, the site EUI may be higher due to varying data sources.
FIGURE 2.1: Gateway Community College Energy Dashboard
Electricity, 19,639
MMBTU
Natural Gas, 15,828
MMBTU
Fuel Oil #2, 1,987
MMBTU
Figure 2.1b: Campus Energy Use by Type(FY 2014)
Gateway Community College150 kbtu/sf Source EUI
70 kbtu/sf Site EUI
0
50
100
150
200
250
300
350
Figure 2.1a: Site and Source EUI by Campus FY 2014 Campus Source EUI
FY 2014 Campus Site EUI
214 kbtu/sf Northeast Median Source EUI forCollege/University104 kBTU/ sf Northeast Median Site EUI forCollege/University
104104
214
UniversitiesCommunity Colleges
67 62
0
20
40
60
80
100
120
140
160
180
200
220
FY 2014 FY 2015
Figure 2.1c: Campus Weather Normalized Site EUI byFiscal Year
104 kBTU/sf Northeast Median Site EUI
45
18
43
1
5
-
-
10
20
30
40
50
60
70
80
90
100
Mixed UseNew Haven Campus
Mixed UseNorth Haven Campus
EUI (
kbtu
/sq
ft)
Figure 2.1d: Site EUI by Building (FY 2014)
Fuel Oil
Natural Gas
Electricity
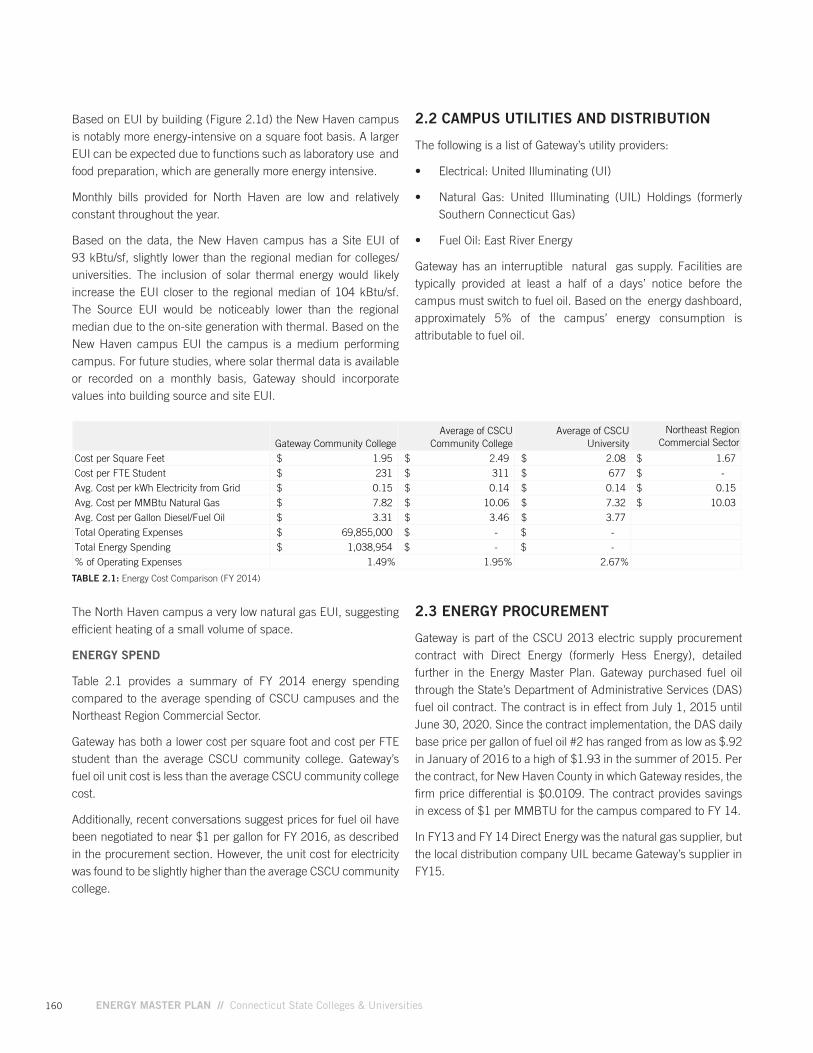
160 ENERGY MASTER PLAN // Connecticut State Colleges & Universities
Based on EUI by building (Figure 2.1d) the New Haven campus is notably more energy-intensive on a square foot basis. A larger EUI can be expected due to functions such as laboratory use and food preparation, which are generally more energy intensive.
Monthly bills provided for North Haven are low and relatively constant throughout the year.
Based on the data, the New Haven campus has a Site EUI of 93 kBtu/sf, slightly lower than the regional median for colleges/universities. The inclusion of solar thermal energy would likely increase the EUI closer to the regional median of 104 kBtu/sf. The Source EUI would be noticeably lower than the regional median due to the on-site generation with thermal. Based on the New Haven campus EUI the campus is a medium performing campus. For future studies, where solar thermal data is available or recorded on a monthly basis, Gateway should incorporate values into building source and site EUI.
The North Haven campus a very low natural gas EUI, suggesting efficient heating of a small volume of space.
ENERGY SPEND
Table 2.1 provides a summary of FY 2014 energy spending compared to the average spending of CSCU campuses and the Northeast Region Commercial Sector.
Gateway has both a lower cost per square foot and cost per FTE student than the average CSCU community college. Gateway’s fuel oil unit cost is less than the average CSCU community college cost.
Additionally, recent conversations suggest prices for fuel oil have been negotiated to near $1 per gallon for FY 2016, as described in the procurement section. However, the unit cost for electricity was found to be slightly higher than the average CSCU community college.
TABLE 2.1: Energy Cost Comparison (FY 2014)
2.2 CAMPUS UTILITIES AND DISTRIBUTION
The following is a list of Gateway’s utility providers:
• Electrical: United Illuminating (UI)
• Natural Gas: United Illuminating (UIL) Holdings (formerly Southern Connecticut Gas)
• Fuel Oil: East River Energy
Gateway has an interruptible natural gas supply. Facilities are typically provided at least a half of a days’ notice before the campus must switch to fuel oil. Based on the energy dashboard, approximately 5% of the campus’ energy consumption is attributable to fuel oil.
2.3 ENERGY PROCUREMENT
Gateway is part of the CSCU 2013 electric supply procurement contract with Direct Energy (formerly Hess Energy), detailed further in the Energy Master Plan. Gateway purchased fuel oil through the State’s Department of Administrative Services (DAS) fuel oil contract. The contract is in effect from July 1, 2015 until June 30, 2020. Since the contract implementation, the DAS daily base price per gallon of fuel oil #2 has ranged from as low as $.92 in January of 2016 to a high of $1.93 in the summer of 2015. Per the contract, for New Haven County in which Gateway resides, the firm price differential is $0.0109. The contract provides savings in excess of $1 per MMBTU for the campus compared to FY 14.
In FY13 and FY 14 Direct Energy was the natural gas supplier, but the local distribution company UIL became Gateway’s supplier in FY15.
Northeast Region Commercial Sector
Cost per Square Feet 1.67$
Cost per FTE Student -$
Avg. Cost per kWh Electricity from Grid 0.15$
Avg. Cost per MMBtu Natural Gas 10.03$
Avg. Cost per Gallon Diesel/Fuel Oil
Total Operating Expenses
Total Energy Spending
% of Operating Expenses
Gateway Community CollegeAverage of CSCU
Community CollegeAverage of CSCU
University
1.95$ 2.49$ 2.08$
231$ 311$ 677$
0.15$ 0.14$ 0.14$
7.82$ 10.06$ 7.32$
69,855,000$ -$ -$
3.31$ 3.46$ 3.77$
1,038,954$ -$ -$
1.49% 1.95% 2.67%
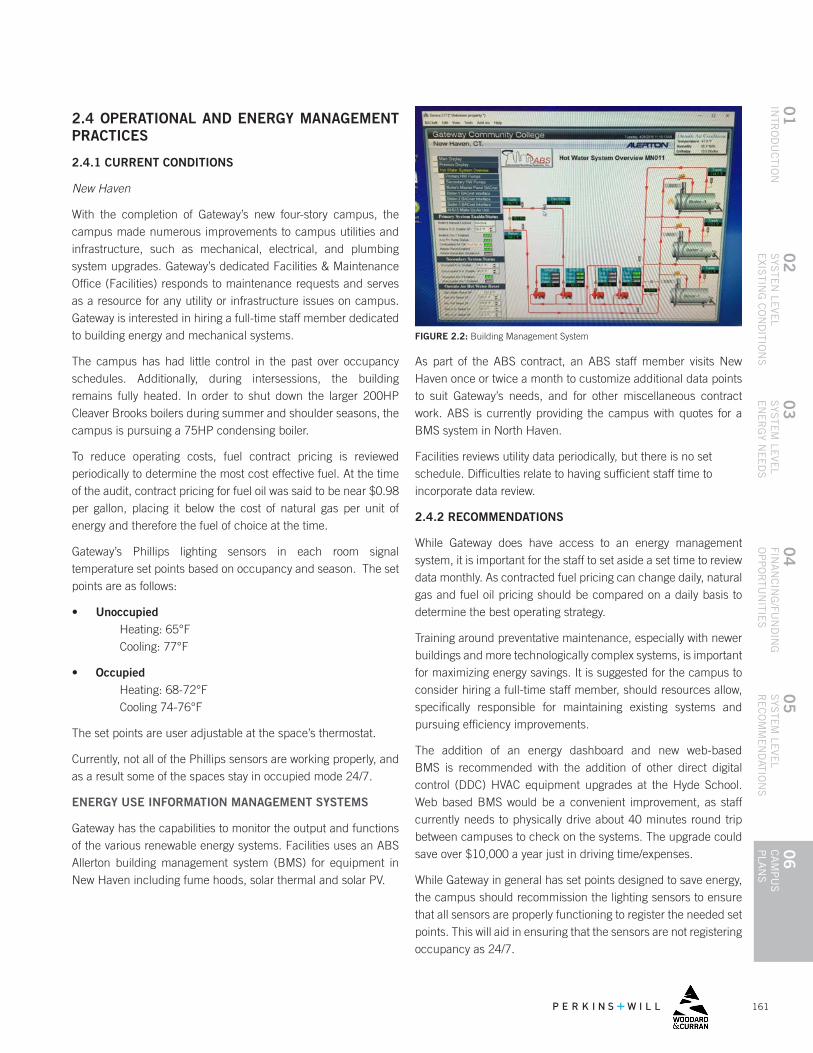
161
04
FINA
NC
ING
/FUN
DIN
G
OP
PO
RTU
NITIE
S
01
INTR
OD
UC
TION
06
CA
MP
US
P
LAN
S
05
SYS
TEM
LEVE
L R
EC
OM
ME
ND
ATION
S
02
SYS
TEN
LEVE
LE
XISTIN
G C
ON
DITIO
NS
03
SYS
TEM
LEVE
L E
NE
RG
Y NE
ED
S
2.4 OPERATIONAL AND ENERGY MANAGEMENT PRACTICES
2.4.1 CURRENT CONDITIONS
New Haven
With the completion of Gateway’s new four-story campus, the campus made numerous improvements to campus utilities and infrastructure, such as mechanical, electrical, and plumbing system upgrades. Gateway’s dedicated Facilities & Maintenance Office (Facilities) responds to maintenance requests and serves as a resource for any utility or infrastructure issues on campus. Gateway is interested in hiring a full-time staff member dedicated to building energy and mechanical systems.
The campus has had little control in the past over occupancy schedules. Additionally, during intersessions, the building remains fully heated. In order to shut down the larger 200HP Cleaver Brooks boilers during summer and shoulder seasons, the campus is pursuing a 75HP condensing boiler.
To reduce operating costs, fuel contract pricing is reviewed periodically to determine the most cost effective fuel. At the time of the audit, contract pricing for fuel oil was said to be near $0.98 per gallon, placing it below the cost of natural gas per unit of energy and therefore the fuel of choice at the time.
Gateway’s Phillips lighting sensors in each room signal temperature set points based on occupancy and season. The set points are as follows:
• Unoccupied Heating: 65°F Cooling: 77°F
• Occupied Heating: 68-72°F Cooling 74-76°F
The set points are user adjustable at the space’s thermostat.
Currently, not all of the Phillips sensors are working properly, and as a result some of the spaces stay in occupied mode 24/7.
ENERGY USE INFORMATION MANAGEMENT SYSTEMS
Gateway has the capabilities to monitor the output and functions of the various renewable energy systems. Facilities uses an ABS Allerton building management system (BMS) for equipment in New Haven including fume hoods, solar thermal and solar PV.
FIGURE 2.2: Building Management System
As part of the ABS contract, an ABS staff member visits New Haven once or twice a month to customize additional data points to suit Gateway’s needs, and for other miscellaneous contract work. ABS is currently providing the campus with quotes for a BMS system in North Haven.
Facilities reviews utility data periodically, but there is no set schedule. Difficulties relate to having sufficient staff time to incorporate data review.
2.4.2 RECOMMENDATIONS
While Gateway does have access to an energy management system, it is important for the staff to set aside a set time to review data monthly. As contracted fuel pricing can change daily, natural gas and fuel oil pricing should be compared on a daily basis to determine the best operating strategy.
Training around preventative maintenance, especially with newer buildings and more technologically complex systems, is important for maximizing energy savings. It is suggested for the campus to consider hiring a full-time staff member, should resources allow, specifically responsible for maintaining existing systems and pursuing efficiency improvements.
The addition of an energy dashboard and new web-based BMS is recommended with the addition of other direct digital control (DDC) HVAC equipment upgrades at the Hyde School. Web based BMS would be a convenient improvement, as staff currently needs to physically drive about 40 minutes round trip between campuses to check on the systems. The upgrade could save over $10,000 a year just in driving time/expenses.
While Gateway in general has set points designed to save energy, the campus should recommission the lighting sensors to ensure that all sensors are properly functioning to register the needed set points. This will aid in ensuring that the sensors are not registering occupancy as 24/7.
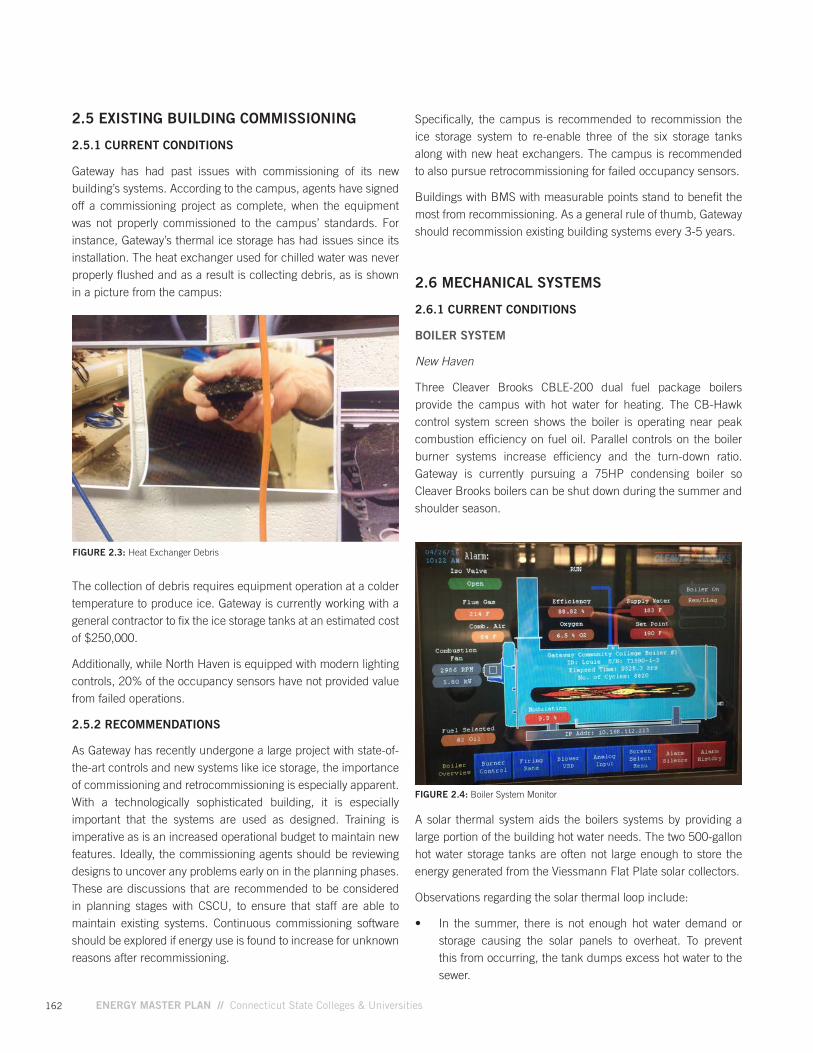
162 ENERGY MASTER PLAN // Connecticut State Colleges & Universities
2.5 EXISTING BUILDING COMMISSIONING
2.5.1 CURRENT CONDITIONS
Gateway has had past issues with commissioning of its new building’s systems. According to the campus, agents have signed off a commissioning project as complete, when the equipment was not properly commissioned to the campus’ standards. For instance, Gateway’s thermal ice storage has had issues since its installation. The heat exchanger used for chilled water was never properly flushed and as a result is collecting debris, as is shown in a picture from the campus:
FIGURE 2.3: Heat Exchanger Debris
The collection of debris requires equipment operation at a colder temperature to produce ice. Gateway is currently working with a general contractor to fix the ice storage tanks at an estimated cost of $250,000.
Additionally, while North Haven is equipped with modern lighting controls, 20% of the occupancy sensors have not provided value from failed operations.
2.5.2 RECOMMENDATIONS
As Gateway has recently undergone a large project with state-of-the-art controls and new systems like ice storage, the importance of commissioning and retrocommissioning is especially apparent. With a technologically sophisticated building, it is especially important that the systems are used as designed. Training is imperative as is an increased operational budget to maintain new features. Ideally, the commissioning agents should be reviewing designs to uncover any problems early on in the planning phases. These are discussions that are recommended to be considered in planning stages with CSCU, to ensure that staff are able to maintain existing systems. Continuous commissioning software should be explored if energy use is found to increase for unknown reasons after recommissioning.
Specifically, the campus is recommended to recommission the ice storage system to re-enable three of the six storage tanks along with new heat exchangers. The campus is recommended to also pursue retrocommissioning for failed occupancy sensors.
Buildings with BMS with measurable points stand to benefit the most from recommissioning. As a general rule of thumb, Gateway should recommission existing building systems every 3-5 years.
2.6 MECHANICAL SYSTEMS
2.6.1 CURRENT CONDITIONS
BOILER SYSTEM
New Haven
Three Cleaver Brooks CBLE-200 dual fuel package boilers provide the campus with hot water for heating. The CB-Hawk control system screen shows the boiler is operating near peak combustion efficiency on fuel oil. Parallel controls on the boiler burner systems increase efficiency and the turn-down ratio. Gateway is currently pursuing a 75HP condensing boiler so Cleaver Brooks boilers can be shut down during the summer and shoulder season.
FIGURE 2.4: Boiler System Monitor
A solar thermal system aids the boilers systems by providing a large portion of the building hot water needs. The two 500-gallon hot water storage tanks are often not large enough to store the energy generated from the Viessmann Flat Plate solar collectors.
Observations regarding the solar thermal loop include:
• In the summer, there is not enough hot water demand or storage causing the solar panels to overheat. To prevent this from occurring, the tank dumps excess hot water to the sewer.
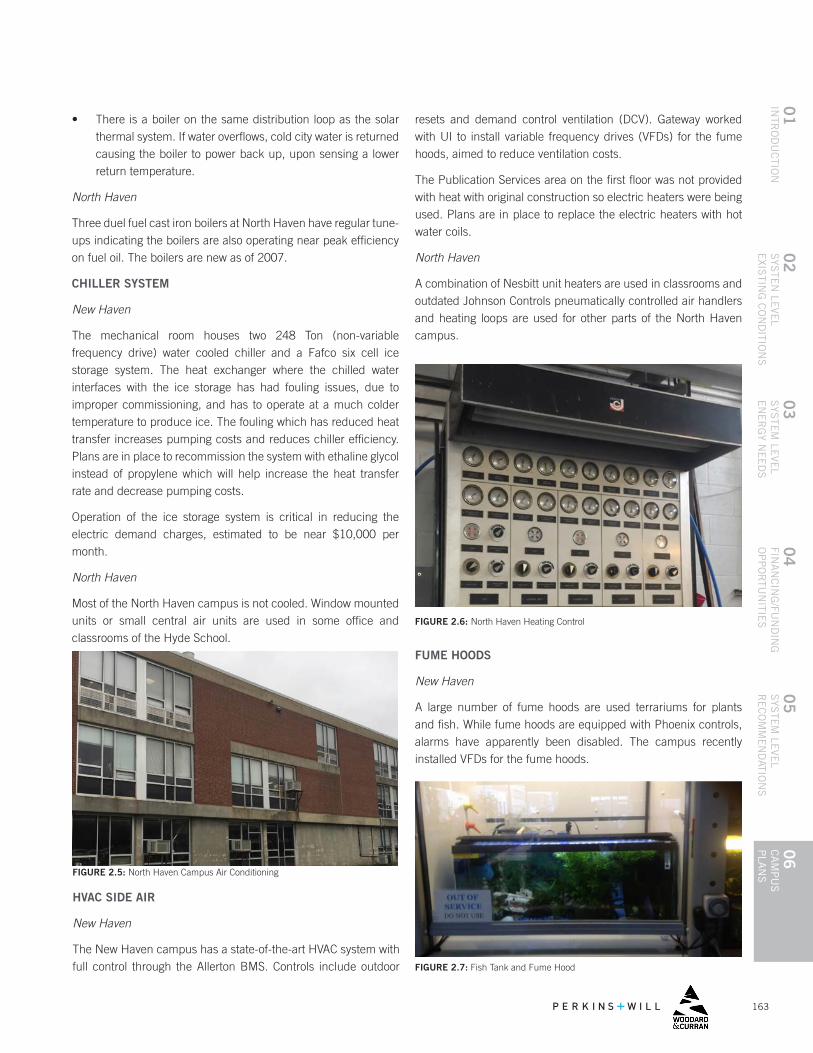
163
04
FINA
NC
ING
/FUN
DIN
G
OP
PO
RTU
NITIE
S
01
INTR
OD
UC
TION
06
CA
MP
US
P
LAN
S
05
SYS
TEM
LEVE
L R
EC
OM
ME
ND
ATION
S
02
SYS
TEN
LEVE
LE
XISTIN
G C
ON
DITIO
NS
03
SYS
TEM
LEVE
L E
NE
RG
Y NE
ED
S
HVAC SIDE AIR
New Haven
The New Haven campus has a state-of-the-art HVAC system with full control through the Allerton BMS. Controls include outdoor
FIGURE 2.5: North Haven Campus Air Conditioning
• There is a boiler on the same distribution loop as the solar thermal system. If water overflows, cold city water is returned causing the boiler to power back up, upon sensing a lower return temperature.
North Haven
Three duel fuel cast iron boilers at North Haven have regular tune-ups indicating the boilers are also operating near peak efficiency on fuel oil. The boilers are new as of 2007.
CHILLER SYSTEM
New Haven
The mechanical room houses two 248 Ton (non-variable frequency drive) water cooled chiller and a Fafco six cell ice storage system. The heat exchanger where the chilled water interfaces with the ice storage has had fouling issues, due to improper commissioning, and has to operate at a much colder temperature to produce ice. The fouling which has reduced heat transfer increases pumping costs and reduces chiller efficiency. Plans are in place to recommission the system with ethaline glycol instead of propylene which will help increase the heat transfer rate and decrease pumping costs.
Operation of the ice storage system is critical in reducing the electric demand charges, estimated to be near $10,000 per month.
North Haven
Most of the North Haven campus is not cooled. Window mounted units or small central air units are used in some office and classrooms of the Hyde School.
FIGURE 2.6: North Haven Heating Control
resets and demand control ventilation (DCV). Gateway worked with UI to install variable frequency drives (VFDs) for the fume hoods, aimed to reduce ventilation costs.
The Publication Services area on the first floor was not provided with heat with original construction so electric heaters were being used. Plans are in place to replace the electric heaters with hot water coils.
North Haven
A combination of Nesbitt unit heaters are used in classrooms and outdated Johnson Controls pneumatically controlled air handlers and heating loops are used for other parts of the North Haven campus.
FUME HOODS
New Haven
A large number of fume hoods are used terrariums for plants and fish. While fume hoods are equipped with Phoenix controls, alarms have apparently been disabled. The campus recently installed VFDs for the fume hoods.
FIGURE 2.7: Fish Tank and Fume Hood
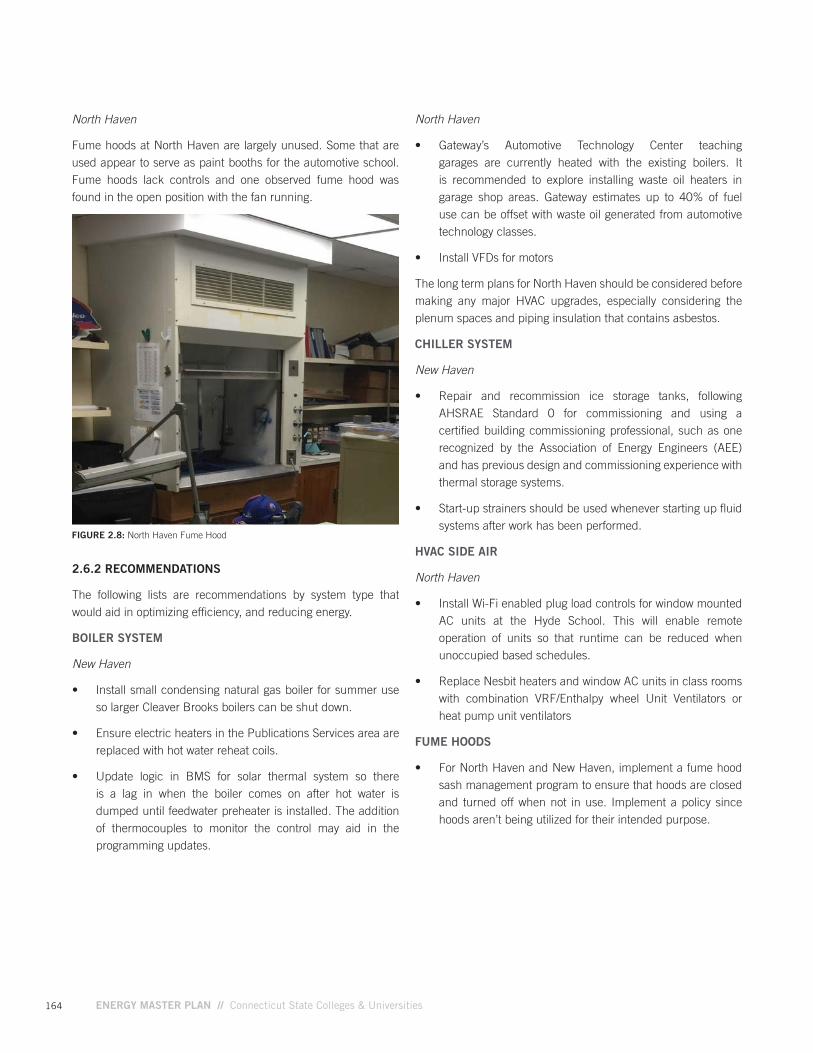
164 ENERGY MASTER PLAN // Connecticut State Colleges & Universities
North Haven
Fume hoods at North Haven are largely unused. Some that are used appear to serve as paint booths for the automotive school. Fume hoods lack controls and one observed fume hood was found in the open position with the fan running.
FIGURE 2.8: North Haven Fume Hood
2.6.2 RECOMMENDATIONS
The following lists are recommendations by system type that would aid in optimizing efficiency, and reducing energy.
BOILER SYSTEM
New Haven
• Install small condensing natural gas boiler for summer use so larger Cleaver Brooks boilers can be shut down.
• Ensure electric heaters in the Publications Services area are replaced with hot water reheat coils.
• Update logic in BMS for solar thermal system so there is a lag in when the boiler comes on after hot water is dumped until feedwater preheater is installed. The addition of thermocouples to monitor the control may aid in the programming updates.
North Haven
• Gateway’s Automotive Technology Center teaching garages are currently heated with the existing boilers. It is recommended to explore installing waste oil heaters in garage shop areas. Gateway estimates up to 40% of fuel use can be offset with waste oil generated from automotive technology classes.
• Install VFDs for motors
The long term plans for North Haven should be considered before making any major HVAC upgrades, especially considering the plenum spaces and piping insulation that contains asbestos.
CHILLER SYSTEM
New Haven
• Repair and recommission ice storage tanks, following AHSRAE Standard 0 for commissioning and using a certified building commissioning professional, such as one recognized by the Association of Energy Engineers (AEE) and has previous design and commissioning experience with thermal storage systems.
• Start-up strainers should be used whenever starting up fluid systems after work has been performed.
HVAC SIDE AIR
North Haven
• Install Wi-Fi enabled plug load controls for window mounted AC units at the Hyde School. This will enable remote operation of units so that runtime can be reduced when unoccupied based schedules.
• Replace Nesbit heaters and window AC units in class rooms with combination VRF/Enthalpy wheel Unit Ventilators or heat pump unit ventilators
FUME HOODS
• For North Haven and New Haven, implement a fume hood sash management program to ensure that hoods are closed and turned off when not in use. Implement a policy since hoods aren’t being utilized for their intended purpose.
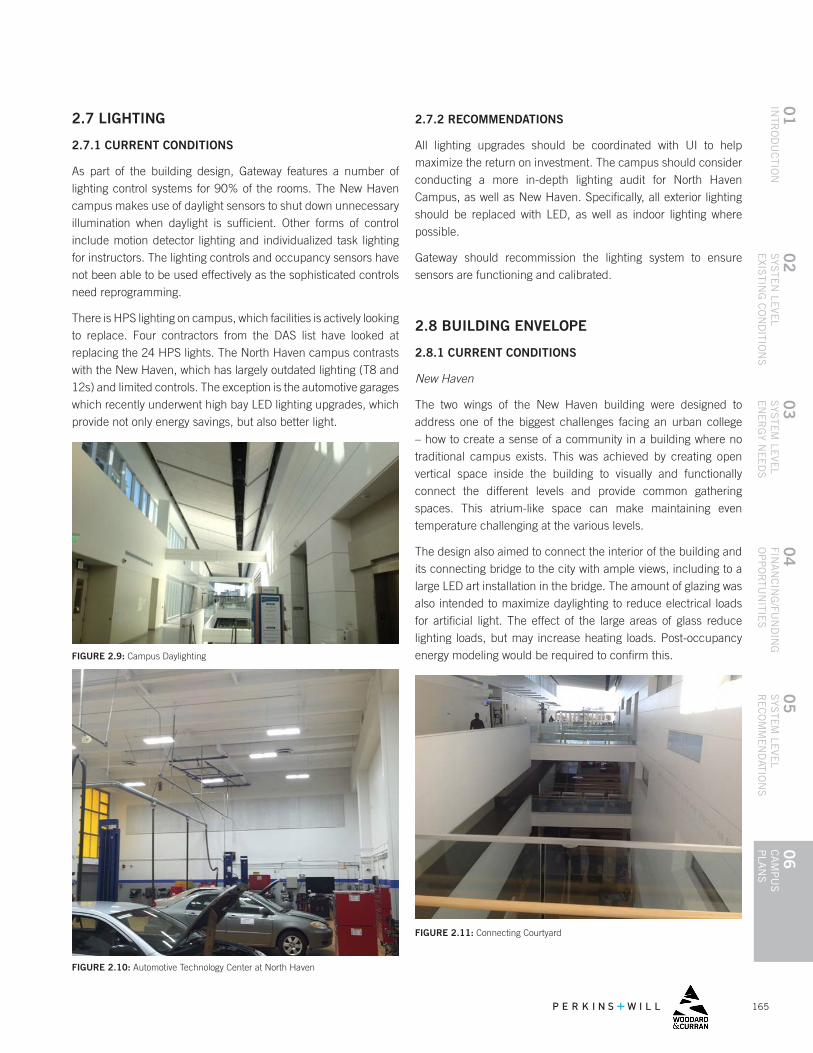
165
04
FINA
NC
ING
/FUN
DIN
G
OP
PO
RTU
NITIE
S
01
INTR
OD
UC
TION
06
CA
MP
US
P
LAN
S
05
SYS
TEM
LEVE
L R
EC
OM
ME
ND
ATION
S
02
SYS
TEN
LEVE
LE
XISTIN
G C
ON
DITIO
NS
03
SYS
TEM
LEVE
L E
NE
RG
Y NE
ED
S
FIGURE 2.10: Automotive Technology Center at North Haven
FIGURE 2.9: Campus Daylighting
2.7.2 RECOMMENDATIONS
All lighting upgrades should be coordinated with UI to help maximize the return on investment. The campus should consider conducting a more in-depth lighting audit for North Haven Campus, as well as New Haven. Specifically, all exterior lighting should be replaced with LED, as well as indoor lighting where possible.
Gateway should recommission the lighting system to ensure sensors are functioning and calibrated.
2.8 BUILDING ENVELOPE
2.8.1 CURRENT CONDITIONS
New Haven
The two wings of the New Haven building were designed to address one of the biggest challenges facing an urban college – how to create a sense of a community in a building where no traditional campus exists. This was achieved by creating open vertical space inside the building to visually and functionally connect the different levels and provide common gathering spaces. This atrium-like space can make maintaining even temperature challenging at the various levels.
The design also aimed to connect the interior of the building and its connecting bridge to the city with ample views, including to a large LED art installation in the bridge. The amount of glazing was also intended to maximize daylighting to reduce electrical loads for artificial light. The effect of the large areas of glass reduce lighting loads, but may increase heating loads. Post-occupancy energy modeling would be required to confirm this.
2.7 LIGHTING
2.7.1 CURRENT CONDITIONS
As part of the building design, Gateway features a number of lighting control systems for 90% of the rooms. The New Haven campus makes use of daylight sensors to shut down unnecessary illumination when daylight is sufficient. Other forms of control include motion detector lighting and individualized task lighting for instructors. The lighting controls and occupancy sensors have not been able to be used effectively as the sophisticated controls need reprogramming.
There is HPS lighting on campus, which facilities is actively looking to replace. Four contractors from the DAS list have looked at replacing the 24 HPS lights. The North Haven campus contrasts with the New Haven, which has largely outdated lighting (T8 and 12s) and limited controls. The exception is the automotive garages which recently underwent high bay LED lighting upgrades, which provide not only energy savings, but also better light.
FIGURE 2.11: Connecting Courtyard
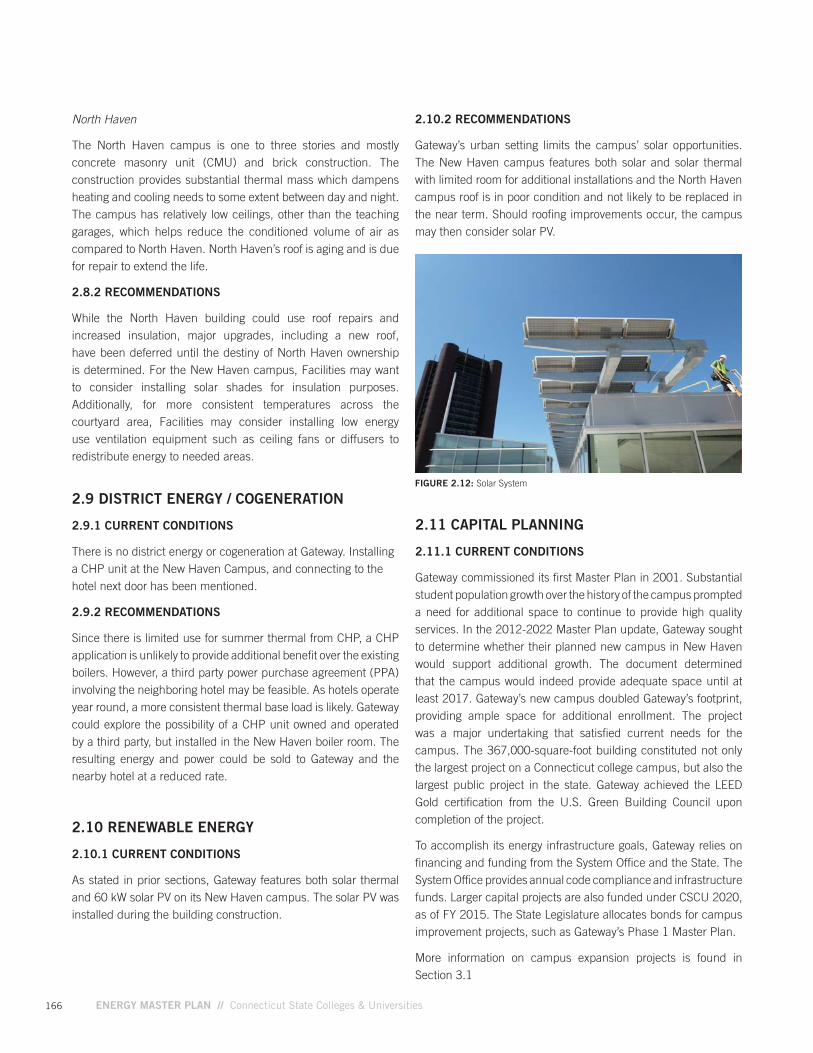
166 ENERGY MASTER PLAN // Connecticut State Colleges & Universities
North Haven
The North Haven campus is one to three stories and mostly concrete masonry unit (CMU) and brick construction. The construction provides substantial thermal mass which dampens heating and cooling needs to some extent between day and night. The campus has relatively low ceilings, other than the teaching garages, which helps reduce the conditioned volume of air as compared to North Haven. North Haven’s roof is aging and is due for repair to extend the life.
2.8.2 RECOMMENDATIONS
While the North Haven building could use roof repairs and increased insulation, major upgrades, including a new roof, have been deferred until the destiny of North Haven ownership is determined. For the New Haven campus, Facilities may want to consider installing solar shades for insulation purposes. Additionally, for more consistent temperatures across the courtyard area, Facilities may consider installing low energy use ventilation equipment such as ceiling fans or diffusers to redistribute energy to needed areas.
2.9 DISTRICT ENERGY / COGENERATION
2.9.1 CURRENT CONDITIONS
There is no district energy or cogeneration at Gateway. Installing a CHP unit at the New Haven Campus, and connecting to the hotel next door has been mentioned.
2.9.2 RECOMMENDATIONS
Since there is limited use for summer thermal from CHP, a CHP application is unlikely to provide additional benefit over the existing boilers. However, a third party power purchase agreement (PPA) involving the neighboring hotel may be feasible. As hotels operate year round, a more consistent thermal base load is likely. Gateway could explore the possibility of a CHP unit owned and operated by a third party, but installed in the New Haven boiler room. The resulting energy and power could be sold to Gateway and the nearby hotel at a reduced rate.
2.10 RENEWABLE ENERGY
2.10.1 CURRENT CONDITIONS
As stated in prior sections, Gateway features both solar thermal and 60 kW solar PV on its New Haven campus. The solar PV was installed during the building construction.
FIGURE 2.12: Solar System
2.11 CAPITAL PLANNING
2.11.1 CURRENT CONDITIONS
Gateway commissioned its first Master Plan in 2001. Substantial student population growth over the history of the campus prompted a need for additional space to continue to provide high quality services. In the 2012-2022 Master Plan update, Gateway sought to determine whether their planned new campus in New Haven would support additional growth. The document determined that the campus would indeed provide adequate space until at least 2017. Gateway’s new campus doubled Gateway’s footprint, providing ample space for additional enrollment. The project was a major undertaking that satisfied current needs for the campus. The 367,000-square-foot building constituted not only the largest project on a Connecticut college campus, but also the largest public project in the state. Gateway achieved the LEED Gold certification from the U.S. Green Building Council upon completion of the project.
To accomplish its energy infrastructure goals, Gateway relies on financing and funding from the System Office and the State. The System Office provides annual code compliance and infrastructure funds. Larger capital projects are also funded under CSCU 2020, as of FY 2015. The State Legislature allocates bonds for campus improvement projects, such as Gateway’s Phase 1 Master Plan.
More information on campus expansion projects is found in Section 3.1
2.10.2 RECOMMENDATIONS
Gateway’s urban setting limits the campus’ solar opportunities. The New Haven campus features both solar and solar thermal with limited room for additional installations and the North Haven campus roof is in poor condition and not likely to be replaced in the near term. Should roofing improvements occur, the campus may then consider solar PV.
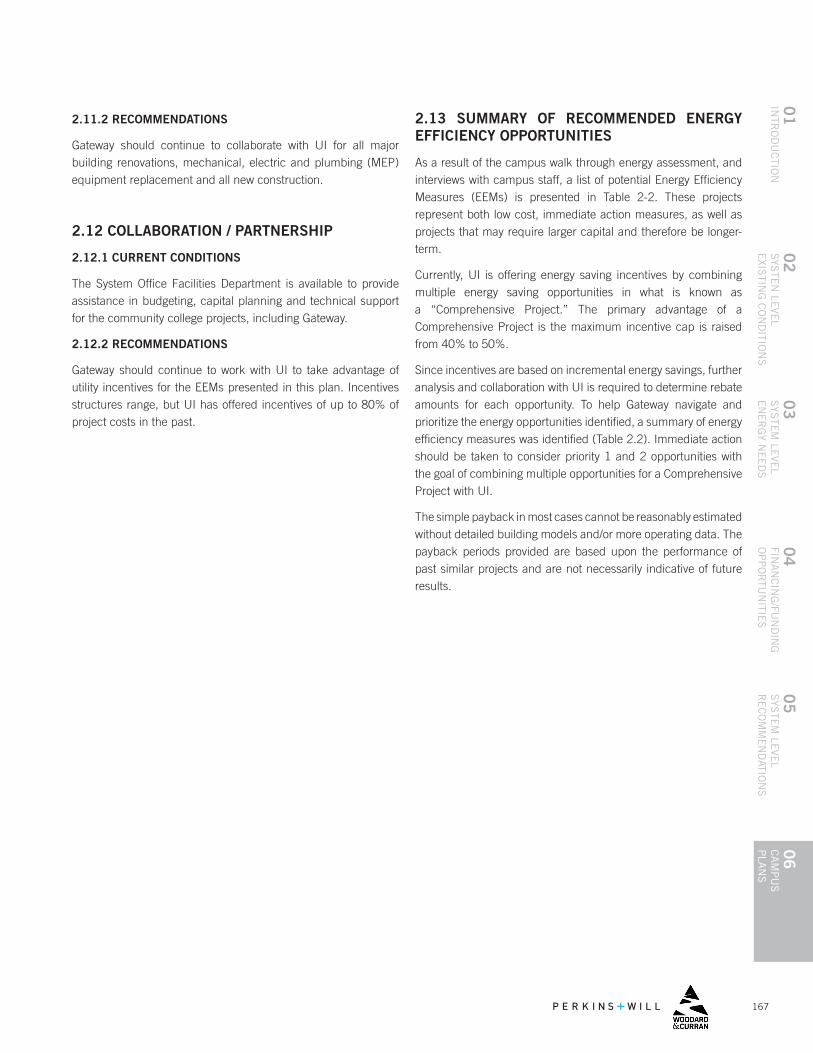
167
04
FINA
NC
ING
/FUN
DIN
G
OP
PO
RTU
NITIE
S
01
INTR
OD
UC
TION
06
CA
MP
US
P
LAN
S
05
SYS
TEM
LEVE
L R
EC
OM
ME
ND
ATION
S
02
SYS
TEN
LEVE
LE
XISTIN
G C
ON
DITIO
NS
03
SYS
TEM
LEVE
L E
NE
RG
Y NE
ED
S
2.11.2 RECOMMENDATIONS
Gateway should continue to collaborate with UI for all major building renovations, mechanical, electric and plumbing (MEP) equipment replacement and all new construction.
2.12 COLLABORATION / PARTNERSHIP
2.12.1 CURRENT CONDITIONS
The System Office Facilities Department is available to provide assistance in budgeting, capital planning and technical support for the community college projects, including Gateway.
2.12.2 RECOMMENDATIONS
Gateway should continue to work with UI to take advantage of utility incentives for the EEMs presented in this plan. Incentives structures range, but UI has offered incentives of up to 80% of project costs in the past.
2.13 SUMMARY OF RECOMMENDED ENERGY EFFICIENCY OPPORTUNITIES
As a result of the campus walk through energy assessment, and interviews with campus staff, a list of potential Energy Efficiency Measures (EEMs) is presented in Table 2-2. These projects represent both low cost, immediate action measures, as well as projects that may require larger capital and therefore be longer-term.
Currently, UI is offering energy saving incentives by combining multiple energy saving opportunities in what is known as a “Comprehensive Project.” The primary advantage of a Comprehensive Project is the maximum incentive cap is raised from 40% to 50%.
Since incentives are based on incremental energy savings, further analysis and collaboration with UI is required to determine rebate amounts for each opportunity. To help Gateway navigate and prioritize the energy opportunities identified, a summary of energy efficiency measures was identified (Table 2.2). Immediate action should be taken to consider priority 1 and 2 opportunities with the goal of combining multiple opportunities for a Comprehensive Project with UI.
The simple payback in most cases cannot be reasonably estimated without detailed building models and/or more operating data. The payback periods provided are based upon the performance of past similar projects and are not necessarily indicative of future results.
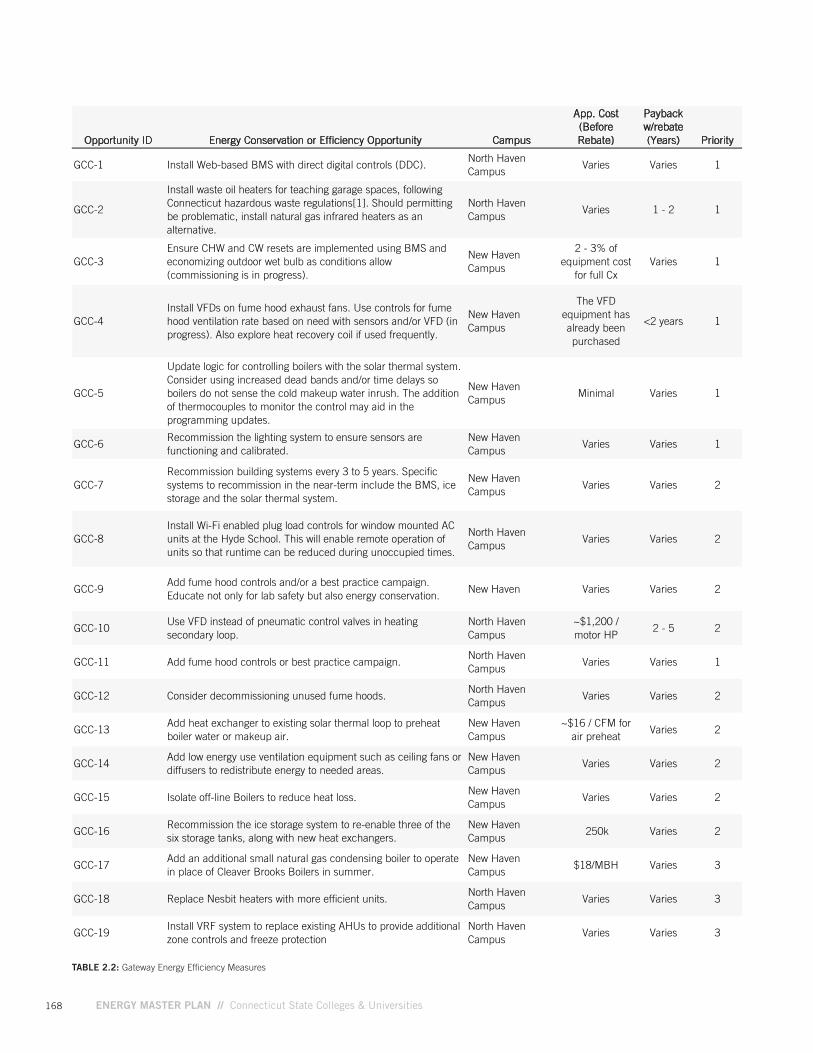
168 ENERGY MASTER PLAN // Connecticut State Colleges & Universities
TABLE 2.2: Gateway Energy Efficiency Measures
Opportunity ID Energy Conservation or Efficiency Opportunity Campus
App. Cost (Before Rebate)
Payback w/rebate (Years) Priority
GCC-1 Install Web-based BMS with direct digital controls (DDC).North Haven Campus
Varies Varies 1
GCC-2
Install waste oil heaters for teaching garage spaces, following Connecticut hazardous waste regulations[1]. Should permitting be problematic, install natural gas infrared heaters as an alternative.
North Haven Campus
Varies 1 - 2 1
GCC-3Ensure CHW and CW resets are implemented using BMS and economizing outdoor wet bulb as conditions allow (commissioning is in progress).
New Haven Campus
2 - 3% of equipment cost
for full CxVaries 1
GCC-4Install VFDs on fume hood exhaust fans. Use controls for fume hood ventilation rate based on need with sensors and/or VFD (in progress). Also explore heat recovery coil if used frequently.
New Haven Campus
The VFD equipment has already been purchased
<2 years 1
GCC-5
Update logic for controlling boilers with the solar thermal system. Consider using increased dead bands and/or time delays so boilers do not sense the cold makeup water inrush. The addition of thermocouples to monitor the control may aid in the programming updates.
New Haven Campus
Minimal Varies 1
GCC-6Recommission the lighting system to ensure sensors are functioning and calibrated.
New Haven Campus
Varies Varies 1
GCC-7Recommission building systems every 3 to 5 years. Specific systems to recommission in the near-term include the BMS, ice storage and the solar thermal system.
New Haven Campus
Varies Varies 2
GCC-8Install Wi-Fi enabled plug load controls for window mounted AC units at the Hyde School. This will enable remote operation of units so that runtime can be reduced during unoccupied times.
North Haven Campus
Varies Varies 2
GCC-9Add fume hood controls and/or a best practice campaign. Educate not only for lab safety but also energy conservation.
New Haven Varies Varies 2
GCC-10Use VFD instead of pneumatic control valves in heating secondary loop.
North Haven Campus
~$1,200 / motor HP
2 - 5 2
GCC-11 Add fume hood controls or best practice campaign. North Haven Campus
Varies Varies 1
GCC-12 Consider decommissioning unused fume hoods.North Haven Campus
Varies Varies 2
GCC-13Add heat exchanger to existing solar thermal loop to preheat boiler water or makeup air.
New Haven Campus
~$16 / CFM for air preheat
Varies 2
GCC-14Add low energy use ventilation equipment such as ceiling fans or diffusers to redistribute energy to needed areas.
New Haven Campus
Varies Varies 2
GCC-15 Isolate off-line Boilers to reduce heat loss.New Haven Campus
Varies Varies 2
GCC-16Recommission the ice storage system to re-enable three of the six storage tanks, along with new heat exchangers.
New Haven Campus
250k Varies 2
GCC-17Add an additional small natural gas condensing boiler to operate in place of Cleaver Brooks Boilers in summer.
New Haven Campus
$18/MBH Varies 3
GCC-18 Replace Nesbit heaters with more efficient units.North Haven Campus
Varies Varies 3
GCC-19Install VRF system to replace existing AHUs to provide additional zone controls and freeze protection
North Haven Campus
Varies Varies 3
169
04
FINA
NC
ING
/FUN
DIN
G
OP
PO
RTU
NITIE
S
01
INTR
OD
UC
TION
06
CA
MP
US
P
LAN
S
05
SYS
TEM
LEVE
L R
EC
OM
ME
ND
ATION
S
02
SYS
TEN
LEVE
LE
XISTIN
G C
ON
DITIO
NS
03
SYS
TEM
LEVE
L E
NE
RG
Y NE
ED
S
3.1 FUTURE DEVELOPMENT
Campus development has the potential to alter energy use patterns and intensity. Given the significant expansion of the New Haven campus in 2012, there are not currently any short-terms plans for campus development and therefore there is not a planned need for a significant change in electrical or natural gas infrastructure. There have been discussions around no longer operating the North Haven campus. Based on EUI, the campus is a smaller user, but the discontinuation of the campus would provide energy consumption cost savings. Improvements made to the North Haven campus with a 5-year or less payback should be considered regardless of the long term use status as any relocation process will likely take in excess of 5-years to complete.
3.2 ENERGY RESILIENCY RECOMMENDATIONS
Gateway partook in the CSCU multi-campus hazard mitigation development. The CSCU Multi-Hazard Mitigation Plan provided recommendations surrounding energy resiliency that are also applicable for the Energy Master Plan. In general, the New Haven campus does not frequently lose power, and has an emergency back-up generator to keep many campus systems functioning. However, the existing generator on the New Haven campus does not support the BMS air handlers, air conditioning, and many IT functions. In addition, Gateway’s North Haven Campus, which houses the campus’ automotive programs, does not have any emergency power backup.
Recommendations from the hazard mitigation plan for improving the energy reliability and resiliency of the campus, include:
• Expand existing emergency generator capacity to tie in additional essential systems and equipment.
• Add redundancy to data center HVAC system
• Install an emergency generator at the North Haven campus.
• Reinforce roof top condenser for IT server room
• Install and maintain surge protection on critical electronic equipment.
• Reinforce roof top solar hot water panels
• Install green roofs to remove heat from roof surface and reduce stormwater runoff
• Improve building envelopes
ENERGY NEEDS
170 ENERGY MASTER PLAN // Connecticut State Colleges & Universities
CONCLUSION / NEXT STEPSGateway’s campuses are contrasted by a highly utilized modern New Haven campus and the limited occupancy of the aged North Haven Campus. While overall EUI of both campuses is good there are opportunities to improve energy management and use practices at both. Recommissioning efforts in the near-term as well as continuous management practices will aid the campus in resolving some of the current issues like faulty lighting and ice storage.
Top priority initiatives include:
• Management: Gateway is recommended to use a BMS at the North Haven campus and include HVAC and lighting controls. The campus is also suggested to have greater granularity in data tracking, and ensure consumption reports are correct. Occupant awareness and savings around energy may be aided with a fume hood program and an energy dashboard.
• Utility Incentives/ Develop Plan for EEMs: Gateway should maximize incentive funding for EEMs by working with UI in particular on North Haven lighting upgrades, and combining multiple energy saving opportunities in what is known as a “Comprehensive Project.” Further analysis and collaboration with UI is required to determine rebate amounts for each opportunity.
A summary of further projects and priorities for the campus are listed in Table 2.2. By fine tuning existing systems, and upgrading older ones, Gateway will further position the campus towards energy efficiency savings and optimization.
4.1 CONTACT INFORMATION FOR KEY STAKEHOLDERS
Collecting all the necessary information for this planning effort required a collaborative effort. Below is the contact information for the Director Facilities who was active in providing expertise about campus current conditions and future needs, and energy related decisions.
GATEWAY COMMUNITY COLLEGE
LU SIMONE Director of Facilities [email protected] 203-285-2223
171
04
FINA
NC
ING
/FUN
DIN
G
OP
PO
RTU
NITIE
S
01
INTR
OD
UC
TION
06
CA
MP
US
P
LAN
S
05
SYS
TEM
LEVE
L R
EC
OM
ME
ND
ATION
S
02
SYS
TEN
LEVE
LE
XISTIN
G C
ON
DITIO
NS
03
SYS
TEM
LEVE
L E
NE
RG
Y NE
ED
S
APPENDIX A: GATEWAY DATA METHODOLOGY, ASSUMPTIONS AND NOTESThe following are the data methodology and assumptions that were used when analyzing and benchmarking data for Gateway:
Fiscal years (FY) 2014 and 2015 are the only complete years of data. No information to indicate that the campus uses propane.
Electricity: UI Utility Bills (FY14,15) and Solar PV Estimates
• Consumption report data was available for FY13 but it was missing the month of August.
• The output of the solar PV panels was not available on a monthly basis , and yearly energy generation was extrapolated to include in the EUI.
Natural Gas: SCG Utility Bills (FY14,15)
Solar Thermal: Not able to be calculated
• Energy attributed to hot water heating from solar thermal was excluded from the analysis, as there was not data available. Building-level EUI and overall New Haven Campus EUI will be higher than the reported values if solar thermal data becomes available.

172 ENERGY MASTER PLAN // Connecticut State Colleges & Universities
6.4
// 173
04
FINA
NC
ING
/FUN
DIN
G
OP
PO
RTU
NITIE
S
01
INTR
OD
UC
TION
06
CA
MP
US
P
LAN
S
05
SYS
TEM
LEVE
L R
EC
OM
ME
ND
ATION
S
02
SYS
TEN
LEVE
LE
XISTIN
G C
ON
DITIO
NS
03
SYS
TEM
LEVE
L E
NE
RG
Y NE
ED
S
6.4HOUSATONIC COMMUNITY
COLLEGE

174 ENERGY MASTER PLAN // Connecticut State Colleges & Universities
TABLE OF CONTENTSEXECUTIVE SUMMARY 176
1. INTRODUCTION 179
1.1 HOUSATONIC OVERVIEW
1.2 PREVIOUS ENERGY STUDIES & PROJECTS
2. EXISTING CONDITIONS AND RECOMMENDATIONS 181
2.1 FACILITY ENERGY BENCHMARKING AND ENERGY CONSUMPTION
2.2 CAMPUS UTILITIES AND DISTRIBUTION
2.3 ENERGY PROCUREMENT
2.4 OPERATIONAL AND ENERGY MANAGEMENT PRACTICES 2.4.1 CURRENT CONDITIONS 2.4.2 RECOMMENDATIONS 2.5 EXISTING BUILDING COMMISSIONING 2.5.1 CURRENT CONDITIONS 2.5.2 RECOMMENDATIONS
2.6 MECHANICAL SYSTEMS 2.6.1 CURRENT CONDITIONS 2.6.2 RECOMMENDATIONS
2.7 LIGHTING 2.7.1 CURRENT CONDITIONS 2.7.2 RECOMMENDATIONS
2.8 BUILDING ENVELOPE 2.8.1 CURRENT CONDITIONS 2.8.2 RECOMMENDATIONS
2.9 DISTRICT ENERGY / COGENERATION 2.9.1 CURRENT CONDITIONS 2.9.2 RECOMMENDATIONS
2.10 RENEWABLE ENERGY 2.10.1 CURRENT CONDITIONS 2.10.2 RECOMMENDATIONS
2.11 CAPITAL PLANNING 2.11.1 CURRENT CONDITIONS 2.11.2 RECOMMENDATIONS
2.12 COLLABORATION / PARTNERSHIP 2.12.1 CURRENT CONDITIONS 2.12.2 RECOMMENDATIONS
2.13 SUMMARY OF RECOMMENDED ENERGY EFFICIENCY OPPORTUNITIES
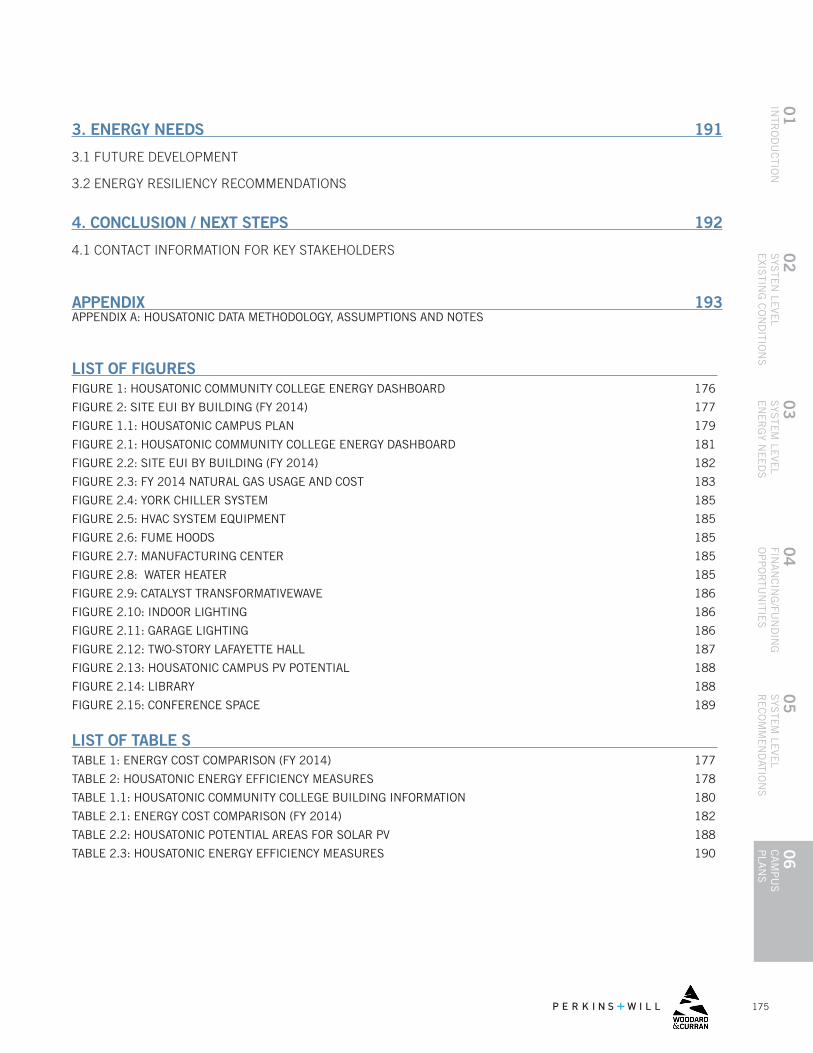
175
04
FINA
NC
ING
/FUN
DIN
G
OP
PO
RTU
NITIE
S
01
INTR
OD
UC
TION
06
CA
MP
US
P
LAN
S
05
SYS
TEM
LEVE
L R
EC
OM
ME
ND
ATION
S
02
SYS
TEN
LEVE
LE
XISTIN
G C
ON
DITIO
NS
03
SYS
TEM
LEVE
L E
NE
RG
Y NE
ED
S
3. ENERGY NEEDS 191
3.1 FUTURE DEVELOPMENT
3.2 ENERGY RESILIENCY RECOMMENDATIONS
4. CONCLUSION / NEXT STEPS 192
4.1 CONTACT INFORMATION FOR KEY STAKEHOLDERS
APPENDIX 193APPENDIX A: HOUSATONIC DATA METHODOLOGY, ASSUMPTIONS AND NOTES
LIST OF FIGURES FIGURE 1: HOUSATONIC COMMUNITY COLLEGE ENERGY DASHBOARD 176
FIGURE 2: SITE EUI BY BUILDING (FY 2014) 177
FIGURE 1.1: HOUSATONIC CAMPUS PLAN 179
FIGURE 2.1: HOUSATONIC COMMUNITY COLLEGE ENERGY DASHBOARD 181
FIGURE 2.2: SITE EUI BY BUILDING (FY 2014) 182
FIGURE 2.3: FY 2014 NATURAL GAS USAGE AND COST 183
FIGURE 2.4: YORK CHILLER SYSTEM 185
FIGURE 2.5: HVAC SYSTEM EQUIPMENT 185
FIGURE 2.6: FUME HOODS 185
FIGURE 2.7: MANUFACTURING CENTER 185
FIGURE 2.8: WATER HEATER 185
FIGURE 2.9: CATALYST TRANSFORMATIVEWAVE 186
FIGURE 2.10: INDOOR LIGHTING 186
FIGURE 2.11: GARAGE LIGHTING 186
FIGURE 2.12: TWO-STORY LAFAYETTE HALL 187
FIGURE 2.13: HOUSATONIC CAMPUS PV POTENTIAL 188
FIGURE 2.14: LIBRARY 188
FIGURE 2.15: CONFERENCE SPACE 189
LIST OF TABLE S TABLE 1: ENERGY COST COMPARISON (FY 2014) 177
TABLE 2: HOUSATONIC ENERGY EFFICIENCY MEASURES 178
TABLE 1.1: HOUSATONIC COMMUNITY COLLEGE BUILDING INFORMATION 180
TABLE 2.1: ENERGY COST COMPARISON (FY 2014) 182
TABLE 2.2: HOUSATONIC POTENTIAL AREAS FOR SOLAR PV 188
TABLE 2.3: HOUSATONIC ENERGY EFFICIENCY MEASURES 190
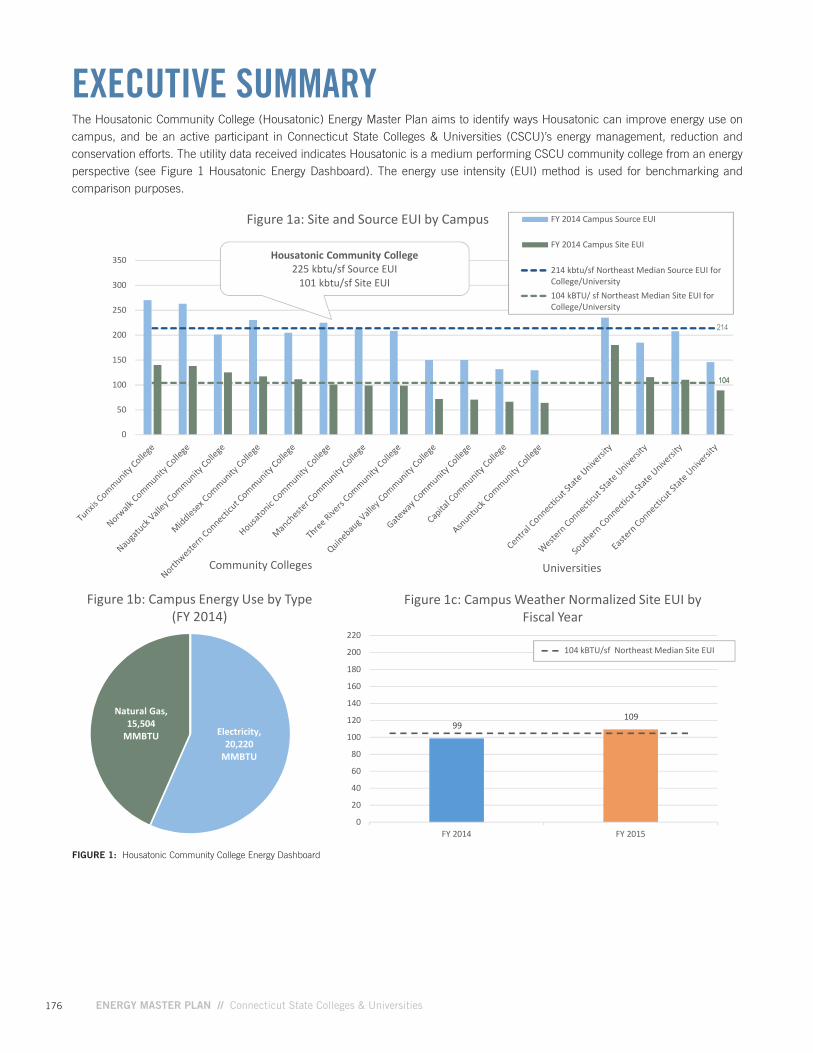
176 ENERGY MASTER PLAN // Connecticut State Colleges & Universities
EXECUTIVE SUMMARYThe Housatonic Community College (Housatonic) Energy Master Plan aims to identify ways Housatonic can improve energy use on campus, and be an active participant in Connecticut State Colleges & Universities (CSCU)’s energy management, reduction and conservation efforts. The utility data received indicates Housatonic is a medium performing CSCU community college from an energy perspective (see Figure 1 Housatonic Energy Dashboard). The energy use intensity (EUI) method is used for benchmarking and comparison purposes.
FIGURE 1: Housatonic Community College Energy Dashboard
DRAFT Central Dashboard May 2016
Electricity, 20,220
MMBTU
Natural Gas, 15,504
MMBTU
Figure 1b: Campus Energy Use by Type(FY 2014)
Housatonic Community College225 kbtu/sf Source EUI
101 kbtu/sf Site EUI
0
50
100
150
200
250
300
350
Figure 1a: Site and Source EUI by Campus FY 2014 Campus Source EUI
FY 2014 Campus Site EUI
214 kbtu/sf Northeast Median Source EUI forCollege/University104 kBTU/ sf Northeast Median Site EUI forCollege/University
104104
214
UniversitiesCommunity Colleges
99109
0
20
40
60
80
100
120
140
160
180
200
220
FY 2014 FY 2015
Figure 1c: Campus Weather Normalized Site EUI byFiscal Year
104 kBTU/sf Northeast Median Site EUI
101 100
-
20
40
60
80
100
120
140
160
Mixed UseLafayette Hall
Mixed UseBeacon Hall
Site
Eui
(kbt
u/sf
)
Figure 1d: Site EUI by Building (FY 2014)
Natural Gas
Electric
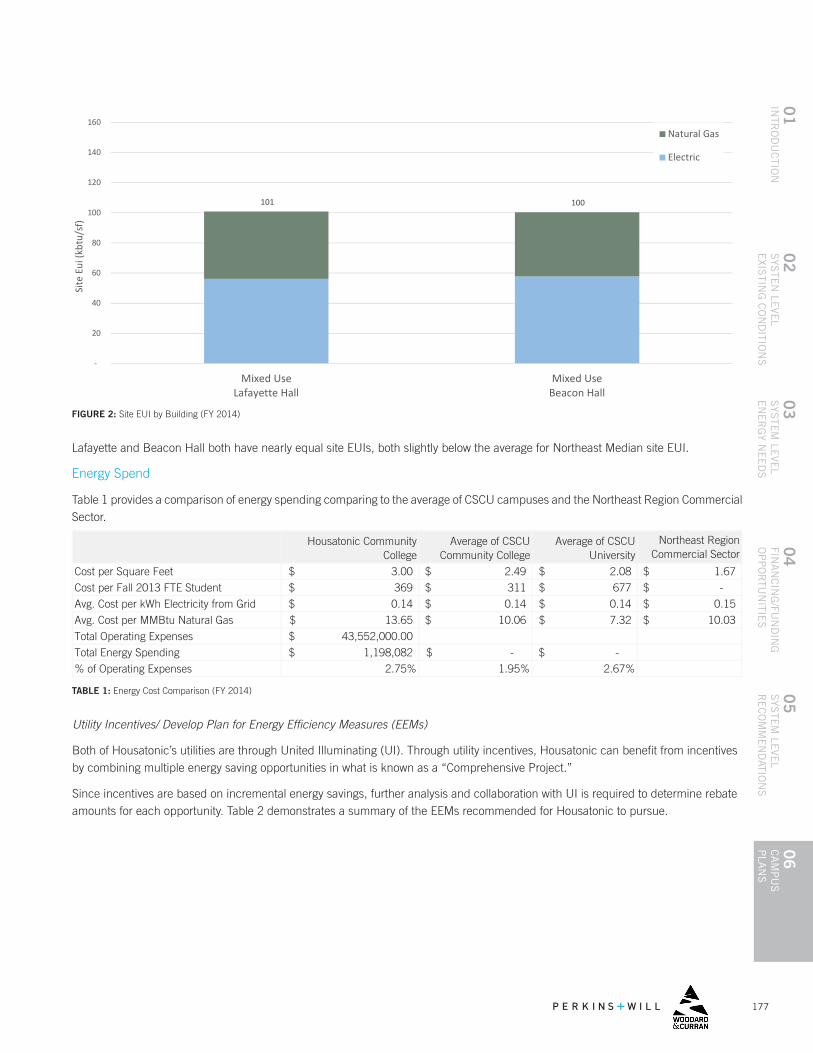
177
04
FINA
NC
ING
/FUN
DIN
G
OP
PO
RTU
NITIE
S
01
INTR
OD
UC
TION
06
CA
MP
US
P
LAN
S
05
SYS
TEM
LEVE
L R
EC
OM
ME
ND
ATION
S
02
SYS
TEN
LEVE
LE
XISTIN
G C
ON
DITIO
NS
03
SYS
TEM
LEVE
L E
NE
RG
Y NE
ED
S
TABLE 1: Energy Cost Comparison (FY 2014)
Utility Incentives/ Develop Plan for Energy Efficiency Measures (EEMs)
Both of Housatonic’s utilities are through United Illuminating (UI). Through utility incentives, Housatonic can benefit from incentives by combining multiple energy saving opportunities in what is known as a “Comprehensive Project.”
Since incentives are based on incremental energy savings, further analysis and collaboration with UI is required to determine rebate amounts for each opportunity. Table 2 demonstrates a summary of the EEMs recommended for Housatonic to pursue.
Lafayette and Beacon Hall both have nearly equal site EUIs, both slightly below the average for Northeast Median site EUI.
Energy Spend
Table 1 provides a comparison of energy spending comparing to the average of CSCU campuses and the Northeast Region Commercial Sector.
Northeast Region Commercial Sector
Cost per Square Feet 1.67$
Cost per Fall 2013 FTE Student -$
Avg. Cost per kWh Electricity from Grid 0.15$
Avg. Cost per MMBtu Natural Gas 10.03$
Total Operating Expenses
Total Energy Spending
% of Operating Expenses
Housatonic Community College
Average of CSCU Community College
Average of CSCU University
3.00$ 2.49$ 2.08$
369$ 311$ 677$
0.14$ 0.14$ 0.14$
13.65$ 10.06$ 7.32$
43,552,000.00$
2.75% 1.95% 2.67%
1,198,082$ -$ -$
FIGURE 2: Site EUI by Building (FY 2014)
DRAFT Central Dashboard May 2016
Electricity, 20,220
MMBTU
Natural Gas, 15,504
MMBTU
Figure 1b: Campus Energy Use by Type(FY 2014)
Housatonic Community College225 kbtu/sf Source EUI
101 kbtu/sf Site EUI
0
50
100
150
200
250
300
350
Figure 1a: Site and Source EUI by Campus FY 2014 Campus Source EUI
FY 2014 Campus Site EUI
214 kbtu/sf Northeast Median Source EUI forCollege/University104 kBTU/ sf Northeast Median Site EUI forCollege/University
104104
214
UniversitiesCommunity Colleges
99109
0
20
40
60
80
100
120
140
160
180
200
220
FY 2014 FY 2015
Figure 1c: Campus Weather Normalized Site EUI byFiscal Year
104 kBTU/sf Northeast Median Site EUI
101 100
-
20
40
60
80
100
120
140
160
Mixed UseLafayette Hall
Mixed UseBeacon Hall
Site
Eui
(kbt
u/sf
)
Figure 1d: Site EUI by Building (FY 2014)
Natural Gas
Electric
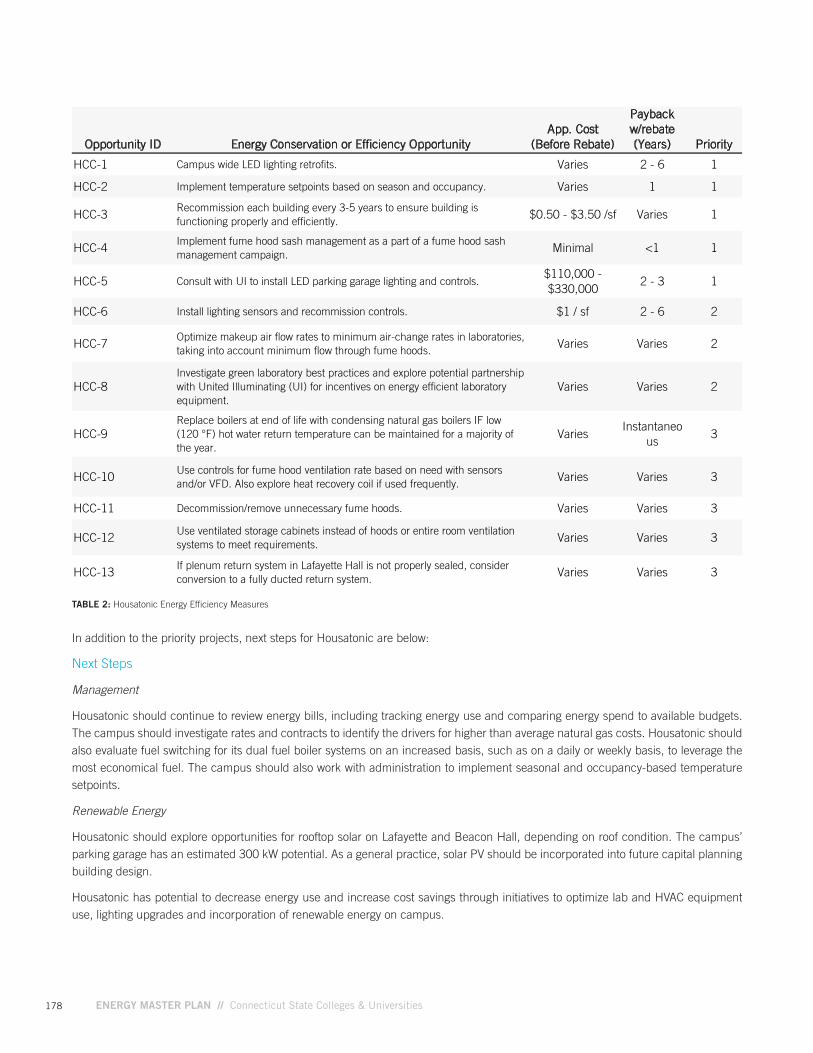
178 ENERGY MASTER PLAN // Connecticut State Colleges & Universities
In addition to the priority projects, next steps for Housatonic are below:
Next Steps
Management
Housatonic should continue to review energy bills, including tracking energy use and comparing energy spend to available budgets. The campus should investigate rates and contracts to identify the drivers for higher than average natural gas costs. Housatonic should also evaluate fuel switching for its dual fuel boiler systems on an increased basis, such as on a daily or weekly basis, to leverage the most economical fuel. The campus should also work with administration to implement seasonal and occupancy-based temperature setpoints.
Renewable Energy
Housatonic should explore opportunities for rooftop solar on Lafayette and Beacon Hall, depending on roof condition. The campus’ parking garage has an estimated 300 kW potential. As a general practice, solar PV should be incorporated into future capital planning building design.
Housatonic has potential to decrease energy use and increase cost savings through initiatives to optimize lab and HVAC equipment use, lighting upgrades and incorporation of renewable energy on campus.
TABLE 2: Housatonic Energy Efficiency Measures
Opportunity ID Energy Conservation or Efficiency OpportunityApp. Cost
(Before Rebate)
Payback w/rebate (Years) Priority
HCC-1 Campus wide LED lighting retrofits. Varies 2 - 6 1
HCC-2 Implement temperature setpoints based on season and occupancy. Varies 1 1
HCC-3Recommission each building every 3-5 years to ensure building is functioning properly and efficiently.
$0.50 - $3.50 /sf Varies 1
HCC-4Implement fume hood sash management as a part of a fume hood sash management campaign.
Minimal <1 1
HCC-5 Consult with UI to install LED parking garage lighting and controls.$110,000 -$330,000
2 - 3 1
HCC-6 Install lighting sensors and recommission controls. $1 / sf 2 - 6 2
HCC-7Optimize makeup air flow rates to minimum air-change rates in laboratories, taking into account minimum flow through fume hoods.
Varies Varies 2
HCC-8Investigate green laboratory best practices and explore potential partnership with United Illuminating (UI) for incentives on energy efficient laboratory equipment.
Varies Varies 2
HCC-9Replace boilers at end of life with condensing natural gas boilers IF low (120 °F) hot water return temperature can be maintained for a majority of the year.
VariesInstantaneo
us3
HCC-10Use controls for fume hood ventilation rate based on need with sensors and/or VFD. Also explore heat recovery coil if used frequently.
Varies Varies 3
HCC-11 Decommission/remove unnecessary fume hoods. Varies Varies 3
HCC-12Use ventilated storage cabinets instead of hoods or entire room ventilation systems to meet requirements.
Varies Varies 3
HCC-13If plenum return system in Lafayette Hall is not properly sealed, consider conversion to a fully ducted return system.
Varies Varies 3
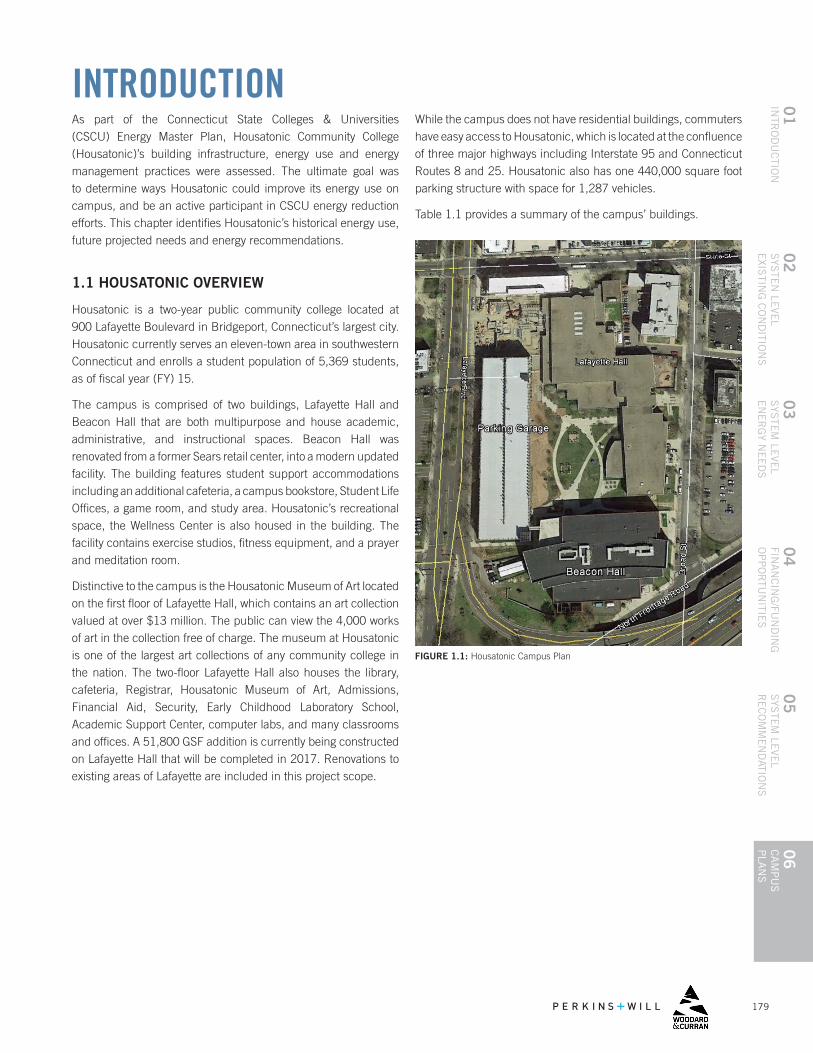
179
04
FINA
NC
ING
/FUN
DIN
G
OP
PO
RTU
NITIE
S
01
INTR
OD
UC
TION
06
CA
MP
US
P
LAN
S
05
SYS
TEM
LEVE
L R
EC
OM
ME
ND
ATION
S
02
SYS
TEN
LEVE
LE
XISTIN
G C
ON
DITIO
NS
03
SYS
TEM
LEVE
L E
NE
RG
Y NE
ED
S
INTRODUCTIONAs part of the Connecticut State Colleges & Universities (CSCU) Energy Master Plan, Housatonic Community College (Housatonic)’s building infrastructure, energy use and energy management practices were assessed. The ultimate goal was to determine ways Housatonic could improve its energy use on campus, and be an active participant in CSCU energy reduction efforts. This chapter identifies Housatonic’s historical energy use, future projected needs and energy recommendations.
1.1 HOUSATONIC OVERVIEW
Housatonic is a two-year public community college located at 900 Lafayette Boulevard in Bridgeport, Connecticut’s largest city. Housatonic currently serves an eleven-town area in southwestern Connecticut and enrolls a student population of 5,369 students, as of fiscal year (FY) 15.
The campus is comprised of two buildings, Lafayette Hall and Beacon Hall that are both multipurpose and house academic, administrative, and instructional spaces. Beacon Hall was renovated from a former Sears retail center, into a modern updated facility. The building features student support accommodations including an additional cafeteria, a campus bookstore, Student Life Offices, a game room, and study area. Housatonic’s recreational space, the Wellness Center is also housed in the building. The facility contains exercise studios, fitness equipment, and a prayer and meditation room.
Distinctive to the campus is the Housatonic Museum of Art located on the first floor of Lafayette Hall, which contains an art collection valued at over $13 million. The public can view the 4,000 works of art in the collection free of charge. The museum at Housatonic is one of the largest art collections of any community college in the nation. The two-floor Lafayette Hall also houses the library, cafeteria, Registrar, Housatonic Museum of Art, Admissions, Financial Aid, Security, Early Childhood Laboratory School, Academic Support Center, computer labs, and many classrooms and offices. A 51,800 GSF addition is currently being constructed on Lafayette Hall that will be completed in 2017. Renovations to existing areas of Lafayette are included in this project scope.
While the campus does not have residential buildings, commuters have easy access to Housatonic, which is located at the confluence of three major highways including Interstate 95 and Connecticut Routes 8 and 25. Housatonic also has one 440,000 square foot parking structure with space for 1,287 vehicles.
Table 1.1 provides a summary of the campus’ buildings.
FIGURE 1.1: Housatonic Campus Plan
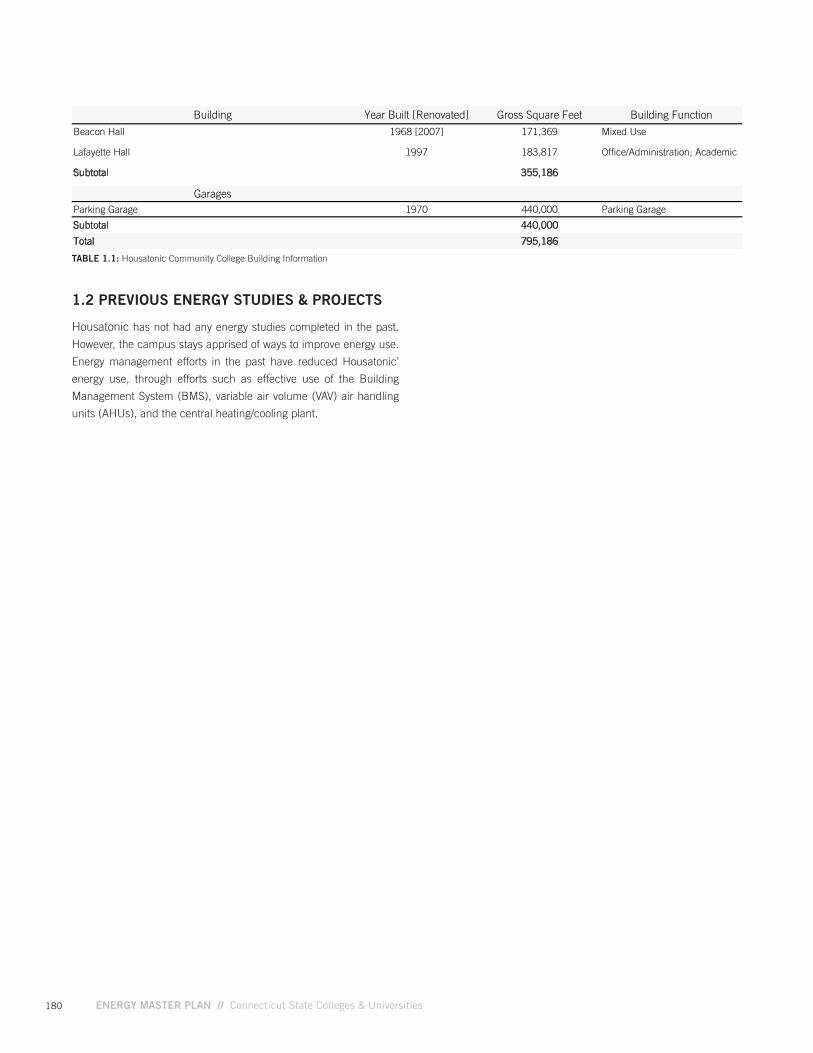
180 ENERGY MASTER PLAN // Connecticut State Colleges & Universities
1.2 PREVIOUS ENERGY STUDIES & PROJECTS
Housatonic has not had any energy studies completed in the past.
However, the campus stays apprised of ways to improve energy use.
Energy management efforts in the past have reduced Housatonic’
energy use, through efforts such as effective use of the Building
Management System (BMS), variable air volume (VAV) air handling
units (AHUs), and the central heating/cooling plant.
Building Year Built [Renovated] Gross Square Feet Building Function
Beacon Hall 1968 [2007] 171,369 Mixed Use
Lafayette Hall 1997 183,817 Office/Administration; Academic
Subtotal 355,186
GaragesParking Garage 1970 440,000 Parking Garage
Subtotal 440,000
Total 795,186
TABLE 1.1: Housatonic Community College Building Information
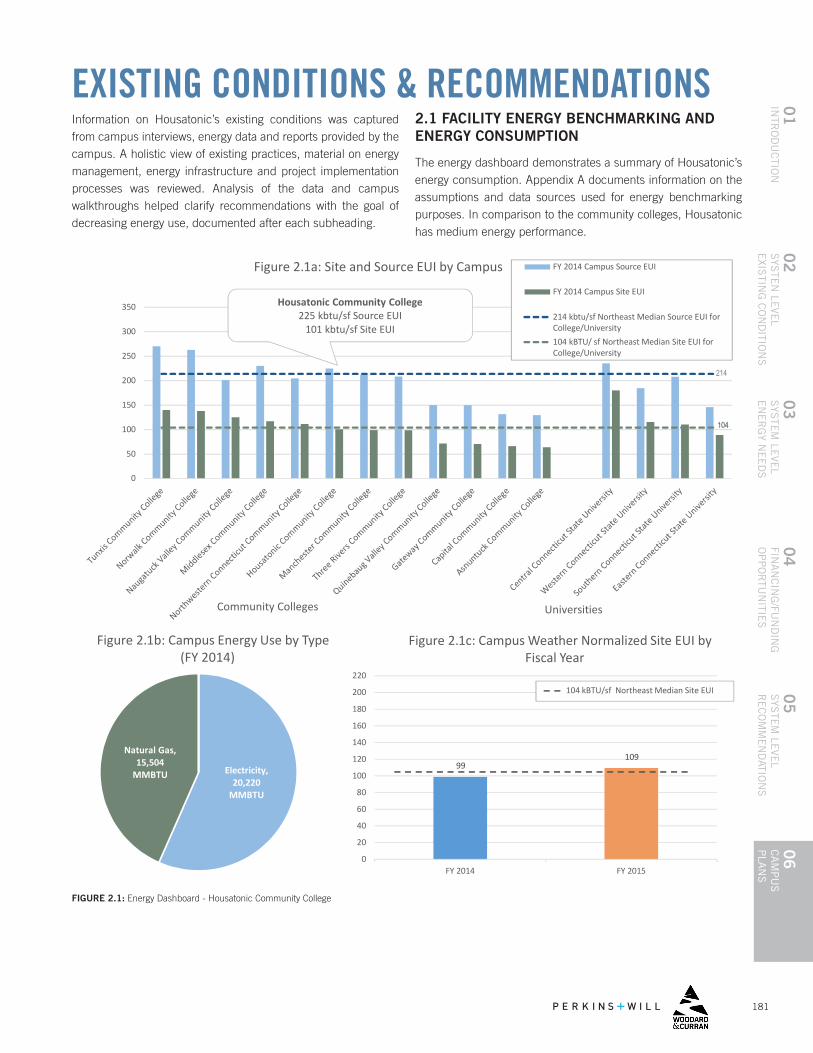
181
04
FINA
NC
ING
/FUN
DIN
G
OP
PO
RTU
NITIE
S
01
INTR
OD
UC
TION
06
CA
MP
US
P
LAN
S
05
SYS
TEM
LEVE
L R
EC
OM
ME
ND
ATION
S
02
SYS
TEN
LEVE
LE
XISTIN
G C
ON
DITIO
NS
03
SYS
TEM
LEVE
L E
NE
RG
Y NE
ED
S
EXISTING CONDITIONS & RECOMMENDATIONSInformation on Housatonic’s existing conditions was captured from campus interviews, energy data and reports provided by the campus. A holistic view of existing practices, material on energy management, energy infrastructure and project implementation processes was reviewed. Analysis of the data and campus walkthroughs helped clarify recommendations with the goal of decreasing energy use, documented after each subheading.
2.1 FACILITY ENERGY BENCHMARKING AND ENERGY CONSUMPTION
The energy dashboard demonstrates a summary of Housatonic’s energy consumption. Appendix A documents information on the assumptions and data sources used for energy benchmarking purposes. In comparison to the community colleges, Housatonic has medium energy performance.
FIGURE 2.1: Energy Dashboard - Housatonic Community College
DRAFT Central Dashboard May 2016
Electricity, 20,220
MMBTU
Natural Gas, 15,504
MMBTU
Figure 2.1b: Campus Energy Use by Type(FY 2014)
Housatonic Community College225 kbtu/sf Source EUI
101 kbtu/sf Site EUI
0
50
100
150
200
250
300
350
Figure 2.1a: Site and Source EUI by Campus FY 2014 Campus Source EUI
FY 2014 Campus Site EUI
214 kbtu/sf Northeast Median Source EUI forCollege/University104 kBTU/ sf Northeast Median Site EUI forCollege/University
104104
214
UniversitiesCommunity Colleges
99109
0
20
40
60
80
100
120
140
160
180
200
220
FY 2014 FY 2015
Figure 2.1c: Campus Weather Normalized Site EUI byFiscal Year
104 kBTU/sf Northeast Median Site EUI
101 100
-
20
40
60
80
100
120
140
160
Mixed UseLafayette Hall
Mixed UseBeacon Hall
Site
Eui
(kbt
u/sf
)
Figure 2.1d: Site EUI by Building (FY 2014)
Natural Gas
Electric
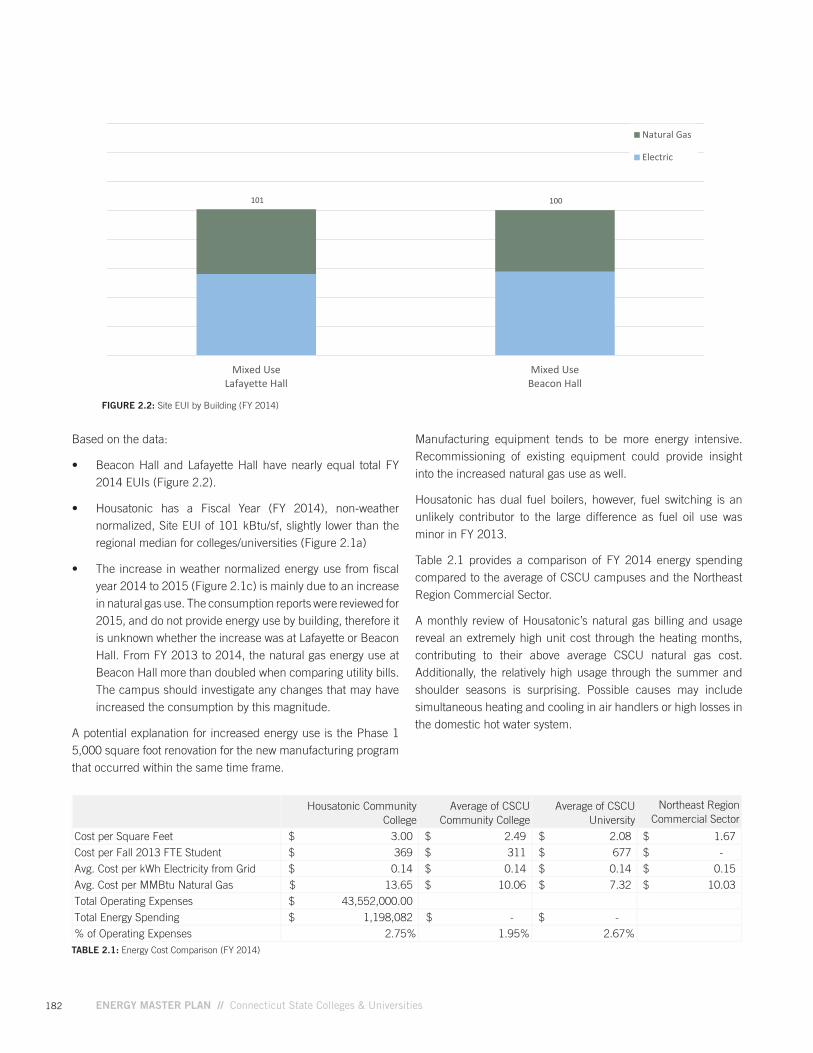
182 ENERGY MASTER PLAN // Connecticut State Colleges & Universities
Based on the data:
• Beacon Hall and Lafayette Hall have nearly equal total FY 2014 EUIs (Figure 2.2).
• Housatonic has a Fiscal Year (FY 2014), non-weather normalized, Site EUI of 101 kBtu/sf, slightly lower than the regional median for colleges/universities (Figure 2.1a)
• The increase in weather normalized energy use from fiscal year 2014 to 2015 (Figure 2.1c) is mainly due to an increase in natural gas use. The consumption reports were reviewed for 2015, and do not provide energy use by building, therefore it is unknown whether the increase was at Lafayette or Beacon Hall. From FY 2013 to 2014, the natural gas energy use at Beacon Hall more than doubled when comparing utility bills. The campus should investigate any changes that may have increased the consumption by this magnitude.
A potential explanation for increased energy use is the Phase 1 5,000 square foot renovation for the new manufacturing program that occurred within the same time frame.
Manufacturing equipment tends to be more energy intensive. Recommissioning of existing equipment could provide insight into the increased natural gas use as well.
Housatonic has dual fuel boilers, however, fuel switching is an unlikely contributor to the large difference as fuel oil use was minor in FY 2013.
Table 2.1 provides a comparison of FY 2014 energy spending compared to the average of CSCU campuses and the Northeast Region Commercial Sector.
A monthly review of Housatonic’s natural gas billing and usage reveal an extremely high unit cost through the heating months, contributing to their above average CSCU natural gas cost. Additionally, the relatively high usage through the summer and shoulder seasons is surprising. Possible causes may include simultaneous heating and cooling in air handlers or high losses in the domestic hot water system.
TABLE 2.1: Energy Cost Comparison (FY 2014)
FIGURE 2.2: Site EUI by Building (FY 2014)
Northeast Region Commercial Sector
Cost per Square Feet 1.67$
Cost per Fall 2013 FTE Student -$
Avg. Cost per kWh Electricity from Grid 0.15$
Avg. Cost per MMBtu Natural Gas 10.03$
Total Operating Expenses
Total Energy Spending
% of Operating Expenses
Housatonic Community College
Average of CSCU Community College
Average of CSCU University
3.00$ 2.49$ 2.08$
369$ 311$ 677$
0.14$ 0.14$ 0.14$
13.65$ 10.06$ 7.32$
43,552,000.00$
2.75% 1.95% 2.67%
1,198,082$ -$ -$
DRAFT Central Dashboard May 2016
Electricity, 20,220
MMBTU
Natural Gas, 15,504
MMBTU
Figure 2.1b: Campus Energy Use by Type(FY 2014)
Housatonic Community College225 kbtu/sf Source EUI
101 kbtu/sf Site EUI
0
50
100
150
200
250
300
350
Figure 2.1a: Site and Source EUI by Campus FY 2014 Campus Source EUI
FY 2014 Campus Site EUI
214 kbtu/sf Northeast Median Source EUI forCollege/University104 kBTU/ sf Northeast Median Site EUI forCollege/University
104104
214
UniversitiesCommunity Colleges
99109
0
20
40
60
80
100
120
140
160
180
200
220
FY 2014 FY 2015
Figure 2.1c: Campus Weather Normalized Site EUI byFiscal Year
104 kBTU/sf Northeast Median Site EUI
101 100
-
20
40
60
80
100
120
140
160
Mixed UseLafayette Hall
Mixed UseBeacon Hall
Site
Eui
(kbt
u/sf
)
Figure 2.1d: Site EUI by Building (FY 2014)
Natural Gas
Electric
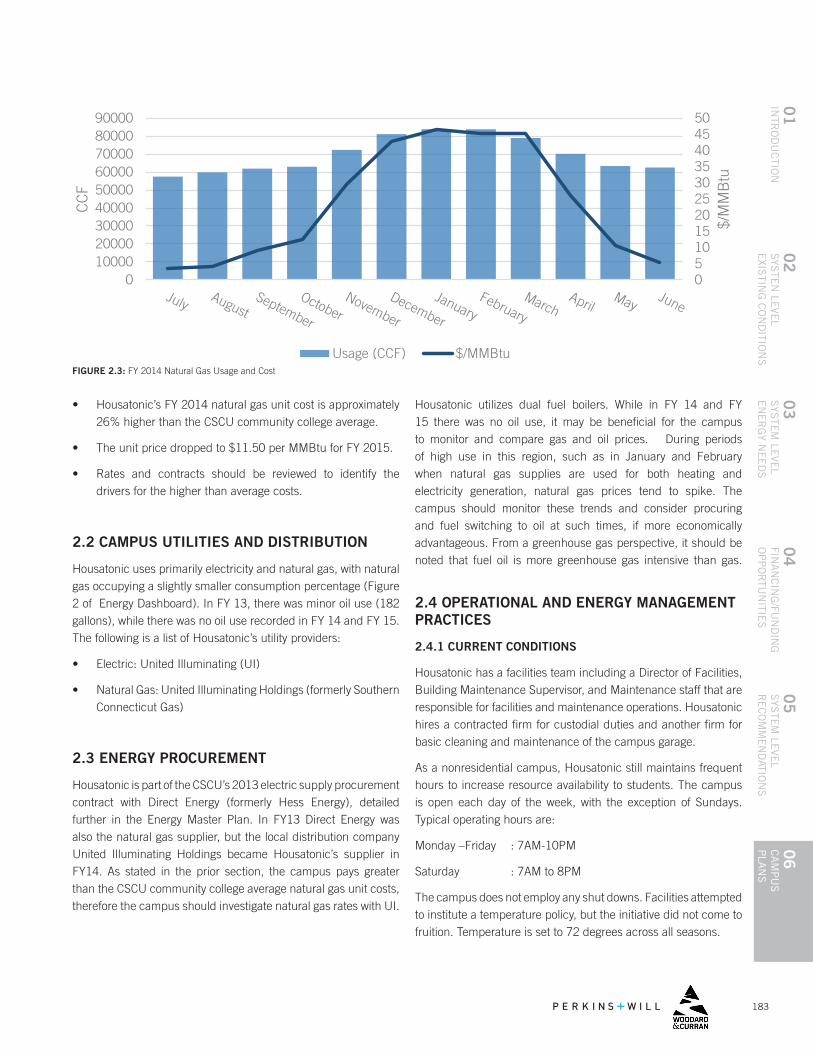
183
04
FINA
NC
ING
/FUN
DIN
G
OP
PO
RTU
NITIE
S
01
INTR
OD
UC
TION
06
CA
MP
US
P
LAN
S
05
SYS
TEM
LEVE
L R
EC
OM
ME
ND
ATION
S
02
SYS
TEN
LEVE
LE
XISTIN
G C
ON
DITIO
NS
03
SYS
TEM
LEVE
L E
NE
RG
Y NE
ED
S
Housatonic utilizes dual fuel boilers. While in FY 14 and FY 15 there was no oil use, it may be beneficial for the campus to monitor and compare gas and oil prices. During periods of high use in this region, such as in January and February when natural gas supplies are used for both heating and electricity generation, natural gas prices tend to spike. The campus should monitor these trends and consider procuring and fuel switching to oil at such times, if more economically advantageous. From a greenhouse gas perspective, it should be noted that fuel oil is more greenhouse gas intensive than gas.
2.4 OPERATIONAL AND ENERGY MANAGEMENT PRACTICES
2.4.1 CURRENT CONDITIONS
Housatonic has a facilities team including a Director of Facilities, Building Maintenance Supervisor, and Maintenance staff that are responsible for facilities and maintenance operations. Housatonic hires a contracted firm for custodial duties and another firm for basic cleaning and maintenance of the campus garage.
As a nonresidential campus, Housatonic still maintains frequent hours to increase resource availability to students. The campus is open each day of the week, with the exception of Sundays. Typical operating hours are:
Monday –Friday : 7AM-10PM
Saturday : 7AM to 8PM
The campus does not employ any shut downs. Facilities attempted to institute a temperature policy, but the initiative did not come to fruition. Temperature is set to 72 degrees across all seasons.
• Housatonic’s FY 2014 natural gas unit cost is approximately 26% higher than the CSCU community college average.
• The unit price dropped to $11.50 per MMBtu for FY 2015.
• Rates and contracts should be reviewed to identify the drivers for the higher than average costs.
2.2 CAMPUS UTILITIES AND DISTRIBUTION
Housatonic uses primarily electricity and natural gas, with natural gas occupying a slightly smaller consumption percentage (Figure 2 of Energy Dashboard). In FY 13, there was minor oil use (182 gallons), while there was no oil use recorded in FY 14 and FY 15. The following is a list of Housatonic’s utility providers:
• Electric: United Illuminating (UI)
• Natural Gas: United Illuminating Holdings (formerly Southern Connecticut Gas)
2.3 ENERGY PROCUREMENT
Housatonic is part of the CSCU’s 2013 electric supply procurement contract with Direct Energy (formerly Hess Energy), detailed further in the Energy Master Plan. In FY13 Direct Energy was also the natural gas supplier, but the local distribution company United Illuminating Holdings became Housatonic’s supplier in FY14. As stated in the prior section, the campus pays greater than the CSCU community college average natural gas unit costs, therefore the campus should investigate natural gas rates with UI.
FIGURE 2.3: FY 2014 Natural Gas Usage and Cost
FY14- TotalMHL- W&C
Vendor Date Received Meter No. Invoice Date Billing Period Amount Usage (CCF) Status8/1/2013 715954 7/25/2013 6/25/13-7/23/13 1,954.78$ 2,2189/5/2013 715954 8/27/2013 7/24/13-8/22/13 2,412.22$ 4,488
Southern CT 10/3/2013 715954 9/26/2013 8/23/13-9/24/13 5,437.23$ 6,58611/4/2013 715954 10/25/2013 9/25/13-10/23/13 7,698.96$ 7,201
12/11/2013 715954 11/26/2013 10/24/13-11/22/13 21,366.13$ 16,2531/14/2014 715954 1/6/2014 11/23/13-12/23/13 34,258.54$ 24,4932/7/2014 715954 1/29/2014 12/24/13-1/24/14 38,319.42$ 26,7883/6/2014 715954 2/27/2014 1/25/14-2/25/14 37,200.29$ 26,1374/3/2014 715954 3/27/2014 2/26/14-3/25/14 35,202.49$ 20,795
4/29/2014 715954 4/24/2014 3/26/14-4/22/14 18,009.07$ 11,7095/30/2014 715954 5/27/2014 4/23/14-5/22/14 6,464.33$ 4,6087/9/2014 715954 6/27/2014 5/23/14-6/23/14 3,314.81$ 3,7658/5/2014 715954 7/25/2014 6/24/14-7/23/14 2,351.31$ 2,319
Total 211,638.27$ 155,040.75 -
kBTU 15,504,075
Vendor Date Received Invoice No. Invoice DateBilling Period Amount Usage (CCF) StatusDirect Energ 8/8/2013 48735343 7/31/2013 6/25/13-7/23/13 49.91 55,263 Paid I067768
9/13/2013 11769819 9/5/2013 7/24/13-8/22/13 50.40 55,314 Paid I06787810/25/2013 73077653 10/2/2013 8/23/13-9/24/13 219.71 55,314 Paid I06828011/13/2013 35188331 10/30/2013 9/25/13-10/23/13 244.39 55,786 Paid I06840312/16/2013 55885260 12/4/2013 10/24/13-11/22/13 77.03 56,089 Paid I0687051/24/2014 71165050 1/9/2014 11/23/13-12/23/13 492.29 56,570 Paid I0689962/18/2014 44125929 2/6/2014 12/24/13-1/24/14 562.74 57,074 Paid I0691813/19/2014 12616345 3/5/2014 1/25/14-2/25/14 817.50 57,699 Paid I0695384/9/2014 65634860 4/3/2014 2/26/14-3/25/14 562.45 58,153 Paid I0696895/8/2014 36875266 4/30/2014 3/26/14-4/22/14 353.24 58,451 Paid I070140
6/10/2014 23599510 5/30/2014 4/23/14-5/22/14 315.53 58,713 Paid I0704887/14/2014 83364345 7/3/2014 5/23/14-6/23/14 95.05 58,793 Paid I070927
Total Date Received Invoice No. Invoice DateBilling Period Amount Usage (CCF) StatusJuly 6/25/13-7/23/13 2,004.69$ 57,481August 7/24/13-8/22/13 2,462.62$ 59,802September 8/23/13-9/24/13 5,656.94$ 61,900October 9/25/13-10/23/13 7,943.35$ 62,987November 10/24/13-11/22/13 21,443.16$ 72,342December 11/23/13-12/23/13 34,750.83$ 81,063January 12/24/13-1/24/14 38,882.16$ 83,862February 1/25/14-2/25/14 38,017.79$ 83,836March 2/26/14-3/25/14 35,764.94$ 78,948
05101520253035404550
0100002000030000400005000060000700008000090000
$/M
MB
tu
CC
F
Usage (CCF) $/MMBtu
184 ENERGY MASTER PLAN // Connecticut State Colleges & Universities
ENERGY USE INFORMATION MANAGEMENT SYSTEMS
The campus uses an Allerton automated building system (ABS), for energy and building needs monitoring.
2.4.2 RECOMMENDATIONS
As part of the CSCU Energy Master Plan recommendations in Section 5.2.2, it is recommended that the System Office create a template for energy tracking applicable to all campuses. Housatonic should use this template to track energy over time rather than viewing through bills only.
Building Management Systems (BMS), some known as Energy Management Systems (EMS), can offer an excellent way to track energy use of specific equipment such as an air handler, pump, or boiler. The addition of an EMS is recommended with the addition of DDC HVAC equipment upgrades.
Housatonic should implement temperature set points based on season and occupancy, rather than maintaining the standard 72°F. Adjusting system set points can have one the quickest returns on investment since little to no capital is needed to realize energy savings. Standard set points for building space/zone settings, per the ASBO International’s School District Energy Manual, are:
• Heating set points 68°F, the lower the more energy efficient
• Cooling set points 78°F, the higher the more energy efficient
Also recommended for CSCU is a system-wide temperature guideline, which would help support Housatonic’s efforts to control campus temperatures on the administration end.
As mentioned in the energy procurement section, there may be financial benefits to regularly monitoring fuel prices, and fuel switching between natural gas and oil depending on price. Housatonic should make sure there is communication of fuel pricing between staff responsible for procurement and operations staff.
2.5 EXISTING BUILDING COMMISSIONING
2.5.1 CURRENT CONDITIONS
No recent building retrocommissioning or commissioning efforts were reported.
2.5.2 RECOMMENDATIONS
Buildings with BMS systems with measurable points stand to benefit the most from recommissioning. A properly commissioned building should be turned over with a thorough commissioning
report, complete with checklists and testing and balancing (TAB) reports for each piece of equipment, even windows and lighting. If this documentation is not available, it is a good indication the building was not properly commissioned. Newer buildings with a higher than average EUI are also indicative of a poorly commissioned building.
As a general rule of thumb:
• Recommission existing building systems every 3-5 years.
2.6 MECHANICAL SYSTEMS
2.6.1 CURRENT CONDITIONS
Housatonic’s two buildings each have a separate heating and cooling system. Lafayette Hall’s systems are original to the building construction in 1996, while Beacon Hall’s systems have been updated at the time of the last major update in 2007.
BOILER SYSTEM
Lafayette Hall
Two dual fuel cast iron Weil-McLain Model 88 boilers are rated at 4.6 MMBtu/hr each and approximately 79% efficient. Tune-ups with fireside cleaning are performed annually.
Beacon Hall
Two dual fuel cast iron Burnham Model PV1120WCP boilers are rated at 4 MMBtu/hr each and approximately 79% efficient. Tune-ups with fireside cleaning are performed annually.
CHILLER SYSTEM
Lafayette Hall
Two 400 Ton McQuay chillers, model PEH 087, chillers are water cooled with centrifugal compressors and offer moderate efficiency compared to current models.
Beacon Hall
Two approximately 600 Ton York chillers are water cooled with screw driven compressors. Screw chillers are generally slightly less efficient than centrifugal chillers. Water cooled chillers, on the other hand, offer better efficiency than air-cooled chillers.
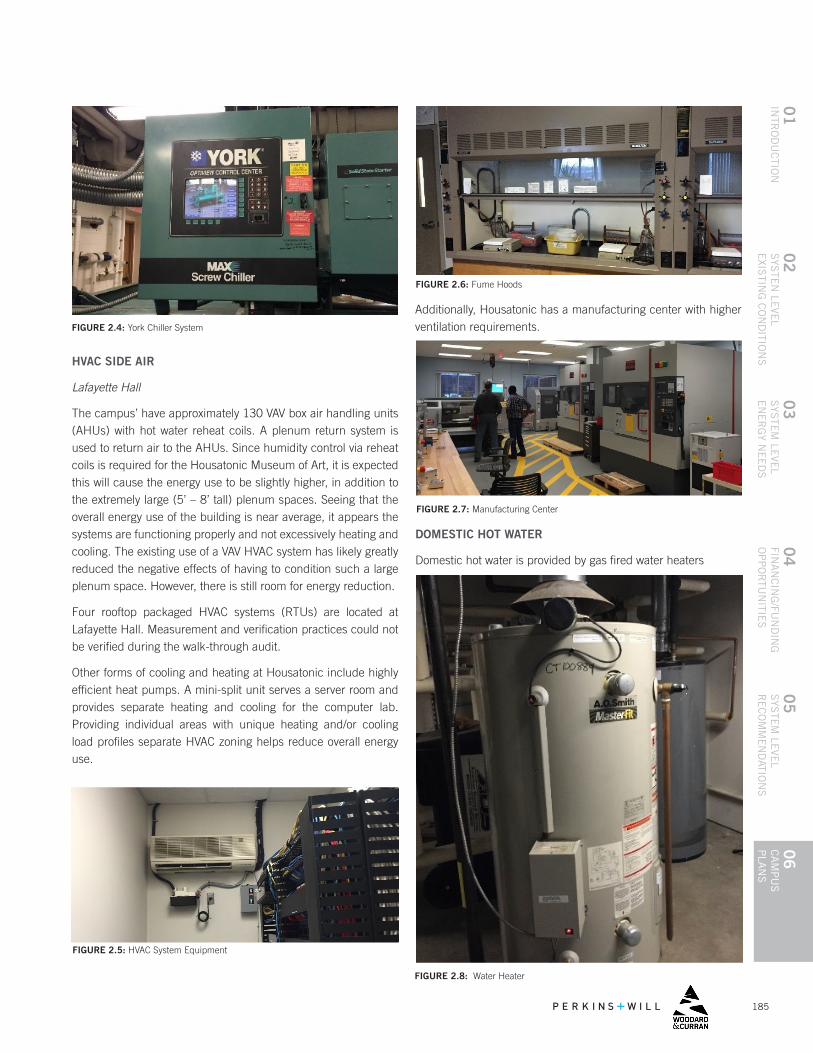
185
04
FINA
NC
ING
/FUN
DIN
G
OP
PO
RTU
NITIE
S
01
INTR
OD
UC
TION
06
CA
MP
US
P
LAN
S
05
SYS
TEM
LEVE
L R
EC
OM
ME
ND
ATION
S
02
SYS
TEN
LEVE
LE
XISTIN
G C
ON
DITIO
NS
03
SYS
TEM
LEVE
L E
NE
RG
Y NE
ED
S
HVAC SIDE AIR
Lafayette Hall
The campus’ have approximately 130 VAV box air handling units (AHUs) with hot water reheat coils. A plenum return system is used to return air to the AHUs. Since humidity control via reheat coils is required for the Housatonic Museum of Art, it is expected this will cause the energy use to be slightly higher, in addition to the extremely large (5’ – 8’ tall) plenum spaces. Seeing that the overall energy use of the building is near average, it appears the systems are functioning properly and not excessively heating and cooling. The existing use of a VAV HVAC system has likely greatly reduced the negative effects of having to condition such a large plenum space. However, there is still room for energy reduction.
Four rooftop packaged HVAC systems (RTUs) are located at Lafayette Hall. Measurement and verification practices could not be verified during the walk-through audit.
Other forms of cooling and heating at Housatonic include highly efficient heat pumps. A mini-split unit serves a server room and provides separate heating and cooling for the computer lab. Providing individual areas with unique heating and/or cooling load profiles separate HVAC zoning helps reduce overall energy use.
FIGURE 2.4: York Chiller System
FIGURE 2.5: HVAC System Equipment
Additionally, Housatonic has a manufacturing center with higher ventilation requirements.
FIGURE 2.6: Fume Hoods
FIGURE 2.7: Manufacturing Center
DOMESTIC HOT WATER
Domestic hot water is provided by gas fired water heaters
FIGURE 2.8: Water Heater
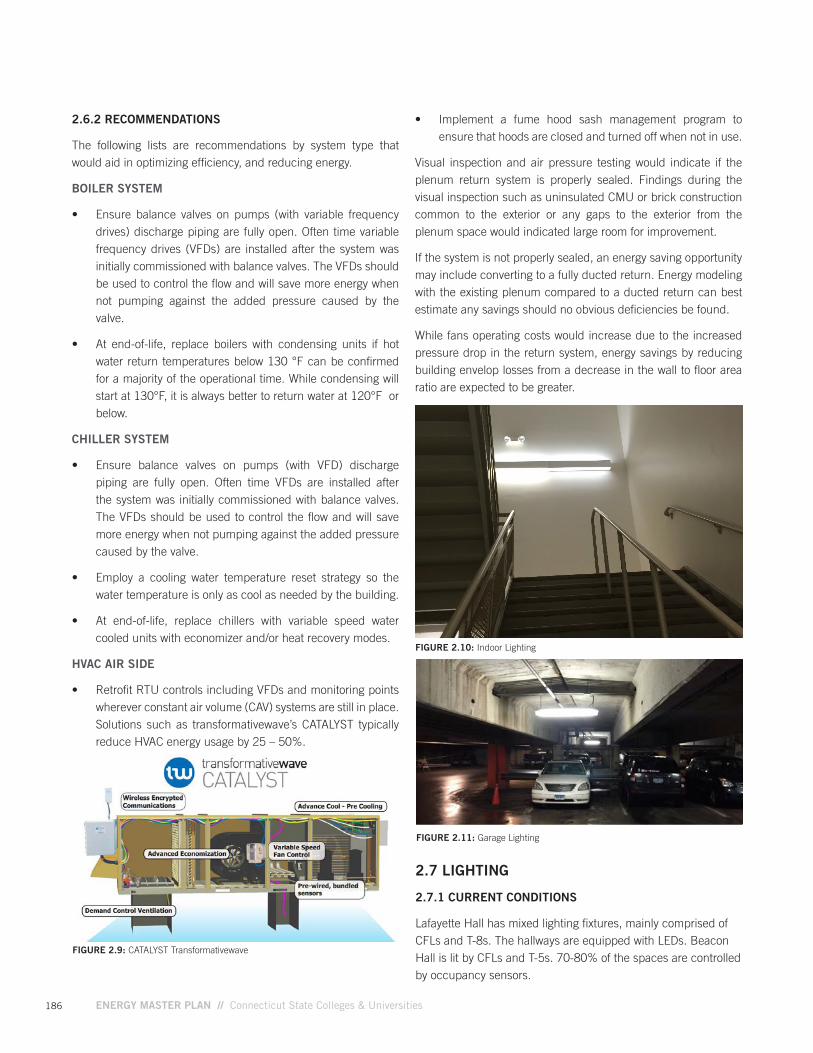
186 ENERGY MASTER PLAN // Connecticut State Colleges & Universities
2.6.2 RECOMMENDATIONS
The following lists are recommendations by system type that would aid in optimizing efficiency, and reducing energy.
BOILER SYSTEM
• Ensure balance valves on pumps (with variable frequency drives) discharge piping are fully open. Often time variable frequency drives (VFDs) are installed after the system was initially commissioned with balance valves. The VFDs should be used to control the flow and will save more energy when not pumping against the added pressure caused by the valve.
• At end-of-life, replace boilers with condensing units if hot water return temperatures below 130 °F can be confirmed for a majority of the operational time. While condensing will start at 130°F, it is always better to return water at 120°F or below.
FIGURE 2.10: Indoor Lighting
• Implement a fume hood sash management program to ensure that hoods are closed and turned off when not in use.
Visual inspection and air pressure testing would indicate if the plenum return system is properly sealed. Findings during the visual inspection such as uninsulated CMU or brick construction common to the exterior or any gaps to the exterior from the plenum space would indicated large room for improvement.
If the system is not properly sealed, an energy saving opportunity may include converting to a fully ducted return. Energy modeling with the existing plenum compared to a ducted return can best estimate any savings should no obvious deficiencies be found.
While fans operating costs would increase due to the increased pressure drop in the return system, energy savings by reducing building envelop losses from a decrease in the wall to floor area ratio are expected to be greater.
FIGURE 2.9: CATALYST Transformativewave
2.7 LIGHTING
2.7.1 CURRENT CONDITIONS
Lafayette Hall has mixed lighting fixtures, mainly comprised of CFLs and T-8s. The hallways are equipped with LEDs. Beacon Hall is lit by CFLs and T-5s. 70-80% of the spaces are controlled by occupancy sensors.
FIGURE 2.11: Garage Lighting
CHILLER SYSTEM
• Ensure balance valves on pumps (with VFD) discharge piping are fully open. Often time VFDs are installed after the system was initially commissioned with balance valves. The VFDs should be used to control the flow and will save more energy when not pumping against the added pressure caused by the valve.
• Employ a cooling water temperature reset strategy so the water temperature is only as cool as needed by the building.
• At end-of-life, replace chillers with variable speed water cooled units with economizer and/or heat recovery modes.
HVAC AIR SIDE
• Retrofit RTU controls including VFDs and monitoring points wherever constant air volume (CAV) systems are still in place. Solutions such as transformativewave’s CATALYST typically reduce HVAC energy usage by 25 – 50%.
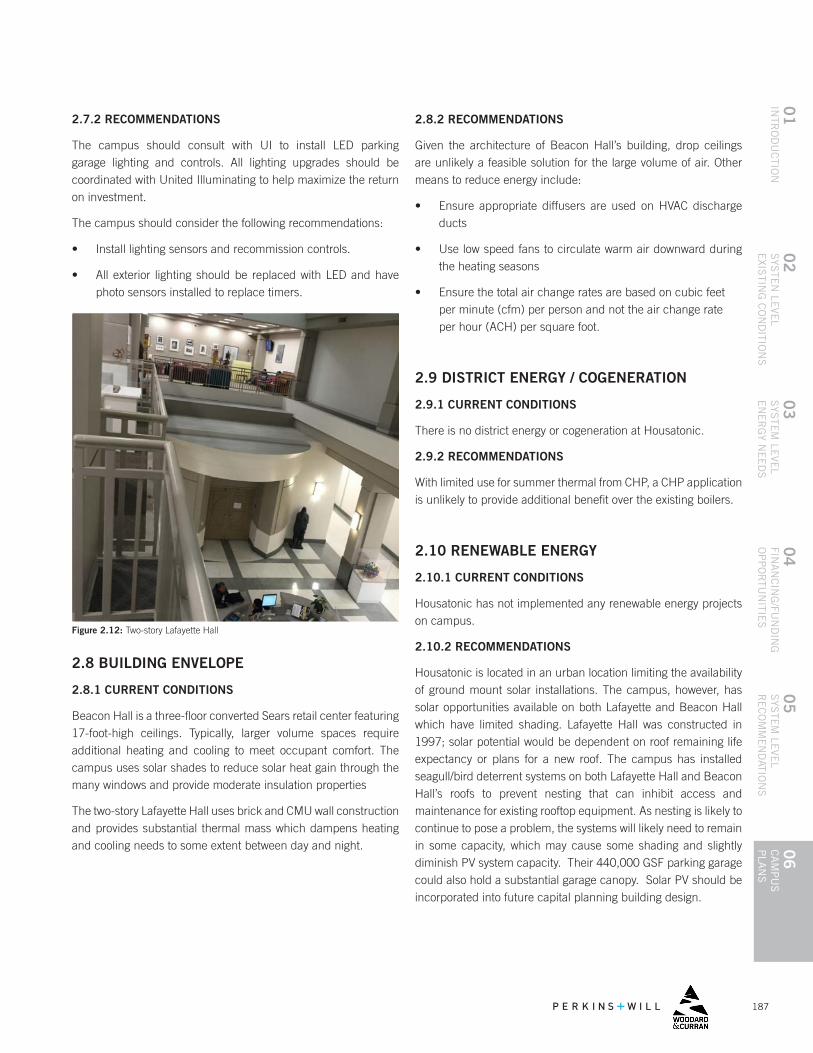
187
04
FINA
NC
ING
/FUN
DIN
G
OP
PO
RTU
NITIE
S
01
INTR
OD
UC
TION
06
CA
MP
US
P
LAN
S
05
SYS
TEM
LEVE
L R
EC
OM
ME
ND
ATION
S
02
SYS
TEN
LEVE
LE
XISTIN
G C
ON
DITIO
NS
03
SYS
TEM
LEVE
L E
NE
RG
Y NE
ED
S
Figure 2.12: Two-story Lafayette Hall
2.8 BUILDING ENVELOPE
2.8.1 CURRENT CONDITIONS
Beacon Hall is a three-floor converted Sears retail center featuring 17-foot-high ceilings. Typically, larger volume spaces require additional heating and cooling to meet occupant comfort. The campus uses solar shades to reduce solar heat gain through the many windows and provide moderate insulation properties
The two-story Lafayette Hall uses brick and CMU wall construction and provides substantial thermal mass which dampens heating and cooling needs to some extent between day and night.
2.7.2 RECOMMENDATIONS
The campus should consult with UI to install LED parking garage lighting and controls. All lighting upgrades should be coordinated with United Illuminating to help maximize the return on investment.
The campus should consider the following recommendations:
• Install lighting sensors and recommission controls.
• All exterior lighting should be replaced with LED and have photo sensors installed to replace timers.
2.8.2 RECOMMENDATIONS
Given the architecture of Beacon Hall’s building, drop ceilings are unlikely a feasible solution for the large volume of air. Other means to reduce energy include:
• Ensure appropriate diffusers are used on HVAC discharge ducts
• Use low speed fans to circulate warm air downward during the heating seasons
• Ensure the total air change rates are based on cubic feet per minute (cfm) per person and not the air change rate per hour (ACH) per square foot.
2.9 DISTRICT ENERGY / COGENERATION
2.9.1 CURRENT CONDITIONS
There is no district energy or cogeneration at Housatonic.
2.9.2 RECOMMENDATIONS
With limited use for summer thermal from CHP, a CHP application is unlikely to provide additional benefit over the existing boilers.
2.10 RENEWABLE ENERGY
2.10.1 CURRENT CONDITIONS
Housatonic has not implemented any renewable energy projects on campus.
2.10.2 RECOMMENDATIONS
Housatonic is located in an urban location limiting the availability of ground mount solar installations. The campus, however, has solar opportunities available on both Lafayette and Beacon Hall which have limited shading. Lafayette Hall was constructed in 1997; solar potential would be dependent on roof remaining life expectancy or plans for a new roof. The campus has installed seagull/bird deterrent systems on both Lafayette Hall and Beacon Hall’s roofs to prevent nesting that can inhibit access and maintenance for existing rooftop equipment. As nesting is likely to continue to pose a problem, the systems will likely need to remain in some capacity, which may cause some shading and slightly diminish PV system capacity. Their 440,000 GSF parking garage could also hold a substantial garage canopy. Solar PV should be incorporated into future capital planning building design.
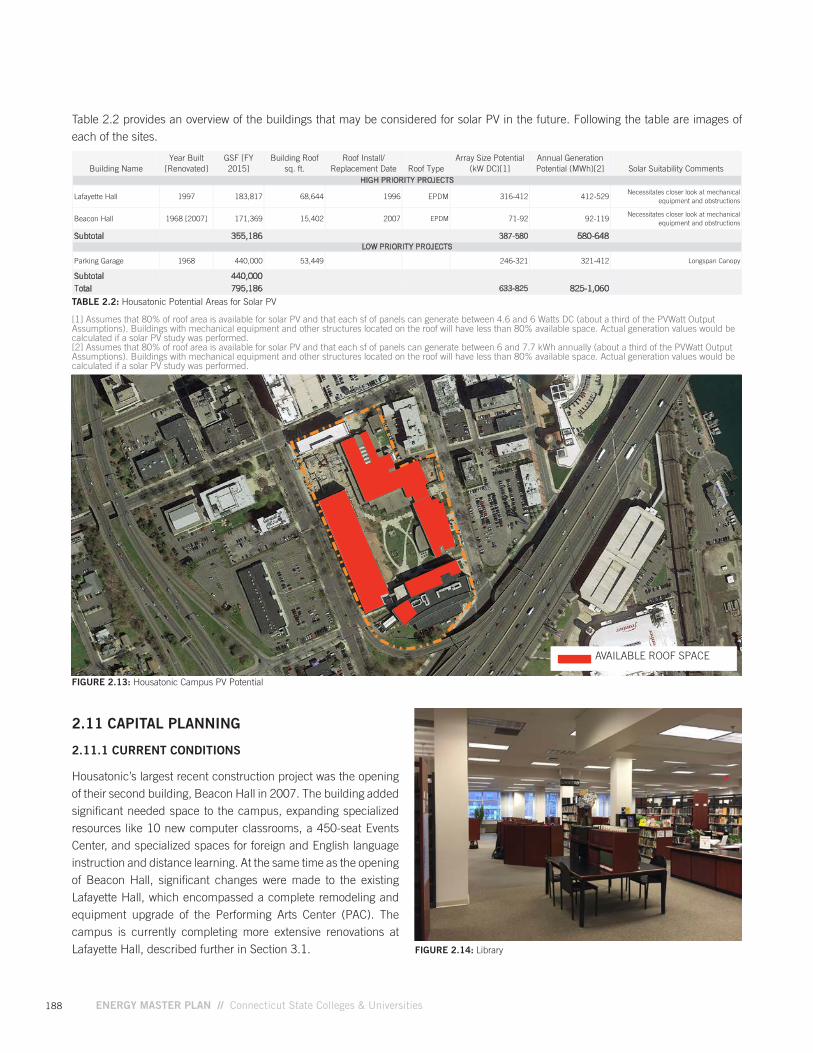
188 ENERGY MASTER PLAN // Connecticut State Colleges & Universities
FIGURE 2.13: Housatonic Campus PV Potential
2.11 CAPITAL PLANNING
2.11.1 CURRENT CONDITIONS
Housatonic’s largest recent construction project was the opening of their second building, Beacon Hall in 2007. The building added significant needed space to the campus, expanding specialized resources like 10 new computer classrooms, a 450-seat Events Center, and specialized spaces for foreign and English language instruction and distance learning. At the same time as the opening of Beacon Hall, significant changes were made to the existing Lafayette Hall, which encompassed a complete remodeling and equipment upgrade of the Performing Arts Center (PAC). The campus is currently completing more extensive renovations at Lafayette Hall, described further in Section 3.1. FIGURE 2.14: Library
AVAILABLE ROOF SPACE
Building NameYear Built
[Renovated]GSF [FY 2015]
Building Roof sq. ft.
Roof Install/ Replacement Date Roof Type
Array Size Potential (kW DC)[1]
Annual Generation Potential (MWh)[2] Solar Suitability Comments
Lafayette Hall 1997 183,817 68,644 1996 EPDM 316-412 412-529Necessitates closer look at mechanical
equipment and obstructions
Beacon Hall 1968 [2007] 171,369 15,402 2007 EPDM 71-92 92-119Necessitates closer look at mechanical
equipment and obstructions
Subtotal 355,186 387-580 580-648
Parking Garage 1968 440,000 53,449 246-321 321-412 Longspan Canopy
Subtotal 440,000
Total 795,186 633-825 825-1,060
HIGH PRIORITY PROJECTS
LOW PRIORITY PROJECTS
[1] Roof Area size based on Google Earth calculated area of solar outlines. Assumes that each sf of panels can generate between 4.6 and 6 Watts DC (about a third of the PVWatt Output Assumptions. Actual generation values would be calculated if a solar PV study was performed.[2] Roof Area size based on Google Earth calculated area of solar outlines. Assumes that each sf of panels can generate between 6 and 7.7 kWh annually (about a third of the PVWatt Output Assumptions). Actual generation values would be calculated if a solar PV study was performed.
TABLE 2.2: Housatonic Potential Areas for Solar PV
[1] Assumes that 80% of roof area is available for solar PV and that each sf of panels can generate between 4.6 and 6 Watts DC (about a third of the PVWatt Output Assumptions). Buildings with mechanical equipment and other structures located on the roof will have less than 80% available space. Actual generation values would be calculated if a solar PV study was performed. [2] Assumes that 80% of roof area is available for solar PV and that each sf of panels can generate between 6 and 7.7 kWh annually (about a third of the PVWatt Output Assumptions). Buildings with mechanical equipment and other structures located on the roof will have less than 80% available space. Actual generation values would be calculated if a solar PV study was performed.
Table 2.2 provides an overview of the buildings that may be considered for solar PV in the future. Following the table are images of each of the sites.
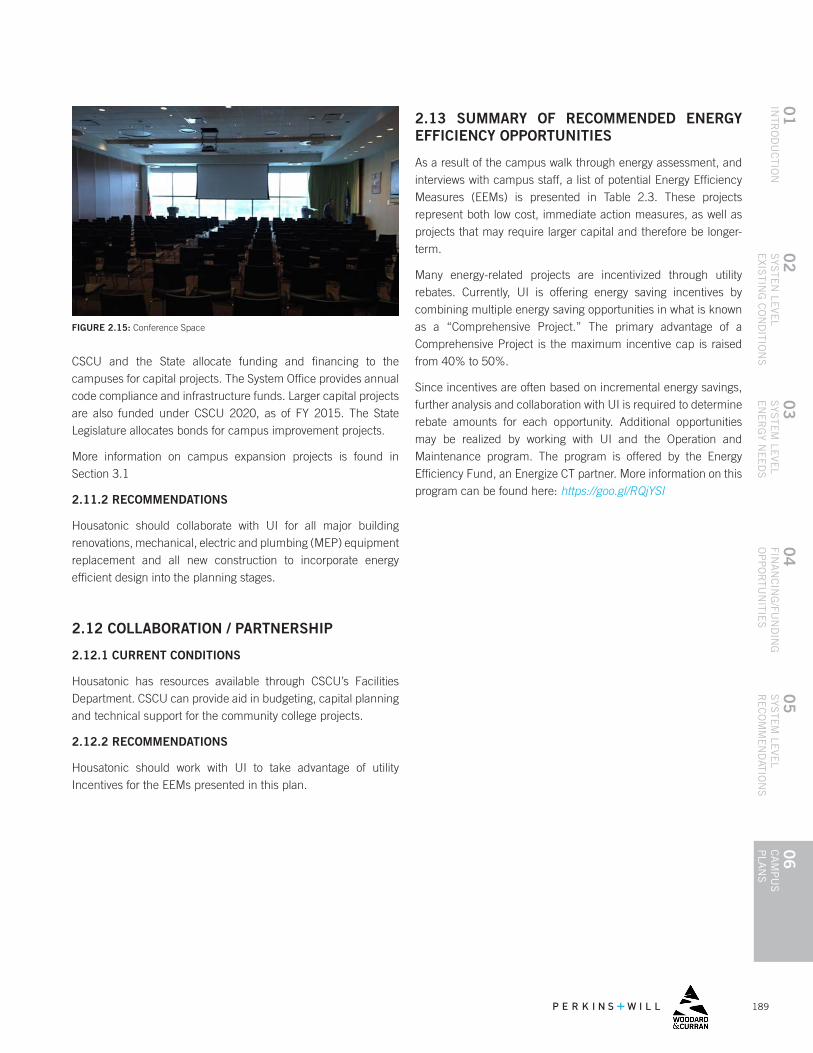
189
04
FINA
NC
ING
/FUN
DIN
G
OP
PO
RTU
NITIE
S
01
INTR
OD
UC
TION
06
CA
MP
US
P
LAN
S
05
SYS
TEM
LEVE
L R
EC
OM
ME
ND
ATION
S
02
SYS
TEN
LEVE
LE
XISTIN
G C
ON
DITIO
NS
03
SYS
TEM
LEVE
L E
NE
RG
Y NE
ED
S
CSCU and the State allocate funding and financing to the campuses for capital projects. The System Office provides annual code compliance and infrastructure funds. Larger capital projects are also funded under CSCU 2020, as of FY 2015. The State Legislature allocates bonds for campus improvement projects.
More information on campus expansion projects is found in Section 3.1
2.11.2 RECOMMENDATIONS
Housatonic should collaborate with UI for all major building renovations, mechanical, electric and plumbing (MEP) equipment replacement and all new construction to incorporate energy efficient design into the planning stages.
2.12 COLLABORATION / PARTNERSHIP
2.12.1 CURRENT CONDITIONS
Housatonic has resources available through CSCU’s Facilities Department. CSCU can provide aid in budgeting, capital planning and technical support for the community college projects.
2.12.2 RECOMMENDATIONS
Housatonic should work with UI to take advantage of utility Incentives for the EEMs presented in this plan.
FIGURE 2.15: Conference Space
2.13 SUMMARY OF RECOMMENDED ENERGY EFFICIENCY OPPORTUNITIES
As a result of the campus walk through energy assessment, and interviews with campus staff, a list of potential Energy Efficiency Measures (EEMs) is presented in Table 2.3. These projects represent both low cost, immediate action measures, as well as projects that may require larger capital and therefore be longer-term.
Many energy-related projects are incentivized through utility rebates. Currently, UI is offering energy saving incentives by combining multiple energy saving opportunities in what is known as a “Comprehensive Project.” The primary advantage of a Comprehensive Project is the maximum incentive cap is raised from 40% to 50%.
Since incentives are often based on incremental energy savings, further analysis and collaboration with UI is required to determine rebate amounts for each opportunity. Additional opportunities may be realized by working with UI and the Operation and Maintenance program. The program is offered by the Energy Efficiency Fund, an Energize CT partner. More information on this program can be found here: https://goo.gl/RQjYSI
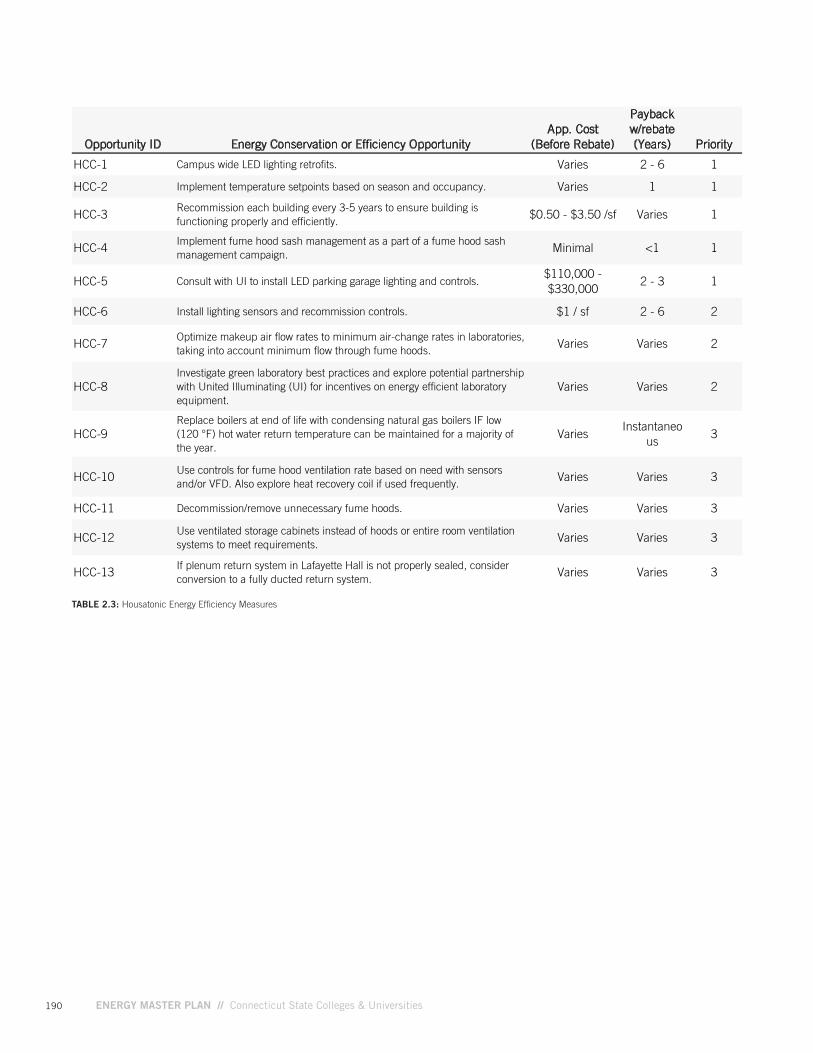
190 ENERGY MASTER PLAN // Connecticut State Colleges & Universities
TABLE 2.3: Housatonic Energy Efficiency Measures
Opportunity ID Energy Conservation or Efficiency OpportunityApp. Cost
(Before Rebate)
Payback w/rebate (Years) Priority
HCC-1 Campus wide LED lighting retrofits. Varies 2 - 6 1
HCC-2 Implement temperature setpoints based on season and occupancy. Varies 1 1
HCC-3Recommission each building every 3-5 years to ensure building is functioning properly and efficiently.
$0.50 - $3.50 /sf Varies 1
HCC-4Implement fume hood sash management as a part of a fume hood sash management campaign.
Minimal <1 1
HCC-5 Consult with UI to install LED parking garage lighting and controls.$110,000 -$330,000
2 - 3 1
HCC-6 Install lighting sensors and recommission controls. $1 / sf 2 - 6 2
HCC-7Optimize makeup air flow rates to minimum air-change rates in laboratories, taking into account minimum flow through fume hoods.
Varies Varies 2
HCC-8Investigate green laboratory best practices and explore potential partnership with United Illuminating (UI) for incentives on energy efficient laboratory equipment.
Varies Varies 2
HCC-9Replace boilers at end of life with condensing natural gas boilers IF low (120 °F) hot water return temperature can be maintained for a majority of the year.
VariesInstantaneo
us3
HCC-10Use controls for fume hood ventilation rate based on need with sensors and/or VFD. Also explore heat recovery coil if used frequently.
Varies Varies 3
HCC-11 Decommission/remove unnecessary fume hoods. Varies Varies 3
HCC-12Use ventilated storage cabinets instead of hoods or entire room ventilation systems to meet requirements.
Varies Varies 3
HCC-13If plenum return system in Lafayette Hall is not properly sealed, consider conversion to a fully ducted return system.
Varies Varies 3
191
04
FINA
NC
ING
/FUN
DIN
G
OP
PO
RTU
NITIE
S
01
INTR
OD
UC
TION
06
CA
MP
US
P
LAN
S
05
SYS
TEM
LEVE
L R
EC
OM
ME
ND
ATION
S
02
SYS
TEN
LEVE
LE
XISTIN
G C
ON
DITIO
NS
03
SYS
TEM
LEVE
L E
NE
RG
Y NE
ED
S
3.1 FUTURE DEVELOPMENT
Building expansions and construction may influence future energy use. Housatonic is undergoing a substantial expansion of Lafayette Hall, as part of the second phase of Housatonic’s Master Plan. At project completion Housatonic will add an additional 51,800 square feet to the existing building, and the new space will feature student services suites, an art department, a “Welcome Center” and a new biology lab. For the future lab, Housatonic is suggested to work with UI on laboratory incentives, to incorporate a new exhaust system with run-around coil heat recovery ventilation.
The project also includes renovation of 36,000 square feet of existing space and will provide for an updated and potentially more efficient central heating and cooling plant. The plant will include two new 400 ton centrifugal chillers and dual fuel boilers. While a larger building footprint can increase overall energy use, an efficient heating and cooling plant will aid in both providing the heating and cooling capacities for the new space and may help to decrease energy use on a per square foot basis. For future boiler replacements, Housatonic may consider a natural gas condensing boiler for an efficiency gain of 5 to 10%.
Depending on enrollment growth, of a projected 1,500 students by 2025, the campus may want to consider an additional chiller or thermal storage system for increased load. A thermal storage system would help maintain a lower peak electrical demand charge despite having increased cooling capacity when needed. Effective thermal storage operation is often dependent on operator training, maintenance, as well as proper commissioning.
With campus expansion, the campus should also consider expanding generator capacity. Beacon Hall currently has a 350 kW Cumin backup generator to support electricity needs in case of power outages and unreliable energy situations.
ENERGY NEEDS3.2 ENERGY RESILIENCY RECOMMENDATIONS
Housatonic partook in the CSCU system-wide hazard mitigation initiative. The CSCU Multi-Hazard Mitigation Plan provided recommendations surrounding energy resiliency that are also applicable for the Energy Master Plan. The list below summarizes recommendations from the hazard mitigation plan for improving the energy reliability and resiliency of the campus.
• Increase emergency power generator capabilities on campus to cover essential services (e.g., IT, boilers, phone, laboratory refrigerators/freezers, alarms, and security cameras, repeaters).
• Study alternative ignition sources in case of natural gas interruption.
• Evaluate Lafayette Hall roof and alternatives/improve roof coverings to remove river rock roofing materials
• Install and maintain surge protection on critical electronic equipment.
• Improve building envelope
192 ENERGY MASTER PLAN // Connecticut State Colleges & Universities
CONCLUSION / NEXT STEPSHousatonic’s FY14 EUI of 101 kbtu/sf indicates that the campus has been operating at an average performance, and slightly better than the Northeast regional average. However, newer energy data suggests an increase in energy consumption for the campus. Energy improvement efforts for the campus are mainly comprised of HVAC air side projects, fume hood controls and lighting opportunities. Other top priority initiatives include:
• Management: Housatonic should continue to track energy use and compare energy spend to available budgets. The campus should also explore natural gas consumption increases in the past few years by reevaluating rates and equipment efficiency. Savings may also be obtained by comparing natural gas and fuel oil rates on a daily or weekly basis to fuel switch to the more financially attractive fuel.
• Renewable Energy: Explore PPAs for building rooftop arrays and a garage parking canopy.
• Utility Incentives/ Develop Plan for EEMs: Housatonic should maximize incentive funding for EEMs by working with UI, and combining multiple energy saving opportunities in what is known as a “Comprehensive Project.” Further analysis and collaboration with UI is required to determine rebate amounts for each opportunity.
A summary of further projects and priorities for the campus are listed in Table 2.3. Through implementation of suggestions in the Energy Master Plan, Housatonic has prospects to capture savings, manage energy consumption and increase energy reliability.
4.1 CONTACT INFORMATION FOR KEY STAKEHOLDERS
Collecting all the necessary information for this planning effort required a collaborative effort. Below are the stakeholders that were active in providing their expertise about campus current conditions and future needs, and energy related decisions
HOUSATONIC COMMUNITY COLLEGE
RICHARD HENNESSEY Director of Facilities [email protected] 203-332-5079
TERESA ORAVETZ Director of Finance and Administrative Services [email protected] 203-332-5014
193
04
FINA
NC
ING
/FUN
DIN
G
OP
PO
RTU
NITIE
S
01
INTR
OD
UC
TION
06
CA
MP
US
P
LAN
S
05
SYS
TEM
LEVE
L R
EC
OM
ME
ND
ATION
S
02
SYS
TEN
LEVE
LE
XISTIN
G C
ON
DITIO
NS
03
SYS
TEM
LEVE
L E
NE
RG
Y NE
ED
S
APPENDIX A: HOUSATONIC DATA METHODOLOGY, ASSUMPTIONS AND NOTESThe following are the data methodology and assumptions that were used when analyzing and benchmarking data for Housatonic:
Fiscal years 2013 and 2014 are the only complete years of data. No information to indicate that the campus uses propane, chilled water, or steam.
Electricity: UI Utility Bills (FY13,14) and Consumption Reports (FY15)
• Only consumption report data was available for FY15 but it appears to line up well with the other years of data so it was accepted to be correct.
Natural Gas: United Illuminating Holdings (Southern Connecticut Gas) Utility Bills (FY13,14)
• Data was also received from Consumption Reports and Direct Energy. Both of these sources seemed to over-report consumption and did not follow a typical monthly trend for a fuel source. For this reason, they were excluded.
• Both buildings at Housatonic had 2 natural gas accounts associated with them. The accounts were summed to get the buildings’ total consumptions.
Fuel Oil: Consumption Reports (FY13,14,15)
• Consumption Reports indicate a small fuel oil use in FY13. The exact building was unknown so it was added to the campus total.

194 ENERGY MASTER PLAN // Connecticut State Colleges & Universities
6.5

// 195
04
FINA
NC
ING
/FUN
DIN
G
OP
PO
RTU
NITIE
S
01
INTR
OD
UC
TION
06
CA
MP
US
P
LAN
S
05
SYS
TEM
LEVE
L R
EC
OM
ME
ND
ATION
S
02
SYS
TEN
LEVE
LE
XISTIN
G C
ON
DITIO
NS
03
SYS
TEM
LEVE
L E
NE
RG
Y NE
ED
S
6.5MANCHESTER COMMUNITY
COLLEGE

196 ENERGY MASTER PLAN // Connecticut State Colleges & Universities
TABLE OF CONTENTSEXECUTIVE SUMMARY 198
1. INTRODUCTION 204
1.1 MANCHESTER OVERVIEW
1.2 PREVIOUS ENERGY STUDIES & PROJECTS
2. EXISTING CONDITIONS AND RECOMMENDATIONS 207
2.1 FACILITY ENERGY BENCHMARKING AND ENERGY CONSUMPTION
2.2 CAMPUS UTILITIES AND DISTRIBUTION
2.3 ENERGY PROCUREMENT
2.4 OPERATIONAL AND ENERGY MANAGEMENT PRACTICES 2.4.1 CURRENT CONDITIONS 2.4.2 RECOMMENDATIONS 2.5 EXISTING BUILDING COMMISSIONING 2.5.1 CURRENT CONDITIONS 2.5.2 RECOMMENDATIONS
2.6 MECHANICAL SYSTEMS 2.6.1 CURRENT CONDITIONS 2.6.2 RECOMMENDATIONS
2.7 LIGHTING 2.7.1 CURRENT CONDITIONS 2.7.2 RECOMMENDATIONS
2.8 BUILDING ENVELOPE 2.8.1 CURRENT CONDITIONS 2.8.2 RECOMMENDATIONS
2.9 DISTRICT ENERGY / COGENERATION 2.9.1 CURRENT CONDITIONS 2.9.2 RECOMMENDATIONS
2.10 RENEWABLE ENERGY 2.10.1 CURRENT CONDITIONS 2.10.2 RECOMMENDATIONS
2.11 CAPITAL PLANNING 2.11.1 CURRENT CONDITIONS 2.11.2 RECOMMENDATIONS
2.12 COLLABORATION / PARTNERSHIP 2.12.1 CURRENT CONDITIONS 2.12.2 RECOMMENDATIONS
2.13 SUMMARY OF RECOMMENDED ENERGY EFFICIENCY OPPORTUNITIES
197
04
FINA
NC
ING
/FUN
DIN
G
OP
PO
RTU
NITIE
S
01
INTR
OD
UC
TION
06
CA
MP
US
P
LAN
S
05
SYS
TEM
LEVE
L R
EC
OM
ME
ND
ATION
S
02
SYS
TEN
LEVE
LE
XISTIN
G C
ON
DITIO
NS
03
SYS
TEM
LEVE
L E
NE
RG
Y NE
ED
S
3. ENERGY NEEDS 219
3.1 FUTURE DEVELOPMENT
3.2 ENERGY RESILIENCY RECOMMENDATIONS
4. CONCLUSION / NEXT STEPS 220
4.1 CONTACT INFORMATION FOR KEY STAKEHOLDERS
APPENDIX 221APPENDIX A: MANCHESTER DATA METHODOLOGY, ASSUMPTIONS AND NOTES
LIST OF FIGURES FIGURE 1: MANCHESTER COMMUNITY COLLEGE ENERGY DASHBOARD 198
FIGURE 1.1: MANCHESTER COMMUNITY COLLEGE ENTRANCE 204
FIGURE 1.2: MANCHESTER CAMPUS PLAN 205
FIGURE 2.1: MANCHESTER COMMUNITY COLLEGE ENERGY DASHBOARD 207
FIGURE 2.2: FY 2014 SITE EUI AND PERCENT OF TOTAL USE COMPARISON 208
FIGURE 2.3: MANCHESTER SPENDING BY ENERGY COMMODITY 209
FIGURE 2.4: MANCHESTER BMS - HOT WATER 210
FIGURE 2.5: MANCHESTER BMS - FUME HOODS 210
FIGURE 2.6: MANCHESTER BMS - HVAC AIR SIDE 211
FIGURE 2.7: MANCHESTER CAMPUS PV POTENTIAL 213
LIST OF TABLES TABLE 1: ENERGY COST COMPARISON (FY 2014) 199
TABLE 2: MANCHESTER COMMUNITY COLLEGE ENERGY EFFICIENCY MEASURES 202
TABLE 1.1: MANCHESTER BUILDING INFORMATION 204
TABLE 1.2: MANCHESTER COMPLETED ENERGY PROJECTS 206
TABLE 2.1: ENERGY COST COMPARISON (FY 2014) 208
TABLE 2.2: MANCHESTER POTENTIAL AREAS FOR SOLAR PV 213
TABLE 2.3: MANCHESTER RECOMMENDED ENERGY-RELATED PROJECTS 218
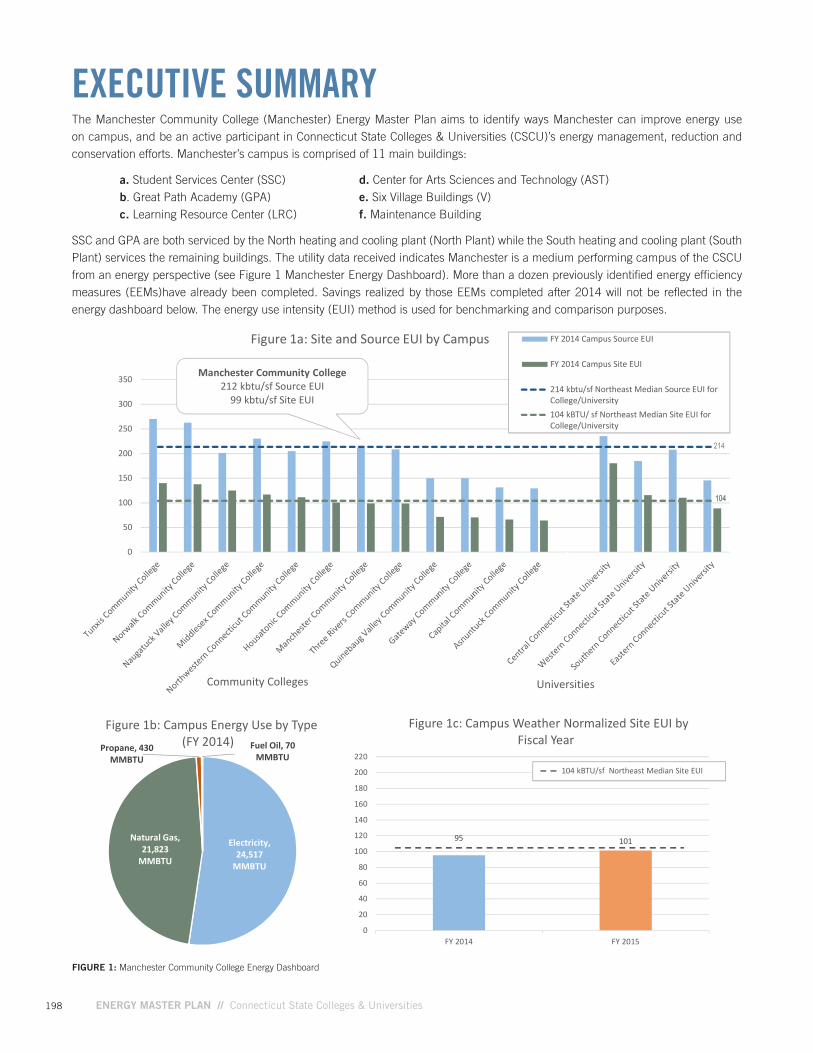
198 ENERGY MASTER PLAN // Connecticut State Colleges & Universities
EXECUTIVE SUMMARYThe Manchester Community College (Manchester) Energy Master Plan aims to identify ways Manchester can improve energy use on campus, and be an active participant in Connecticut State Colleges & Universities (CSCU)’s energy management, reduction and conservation efforts. Manchester’s campus is comprised of 11 main buildings:
a. Student Services Center (SSC) d. Center for Arts Sciences and Technology (AST) b. Great Path Academy (GPA) e. Six Village Buildings (V) c. Learning Resource Center (LRC) f. Maintenance Building
SSC and GPA are both serviced by the North heating and cooling plant (North Plant) while the South heating and cooling plant (South Plant) services the remaining buildings. The utility data received indicates Manchester is a medium performing campus of the CSCU from an energy perspective (see Figure 1 Manchester Energy Dashboard). More than a dozen previously identified energy efficiency measures (EEMs)have already been completed. Savings realized by those EEMs completed after 2014 will not be reflected in the energy dashboard below. The energy use intensity (EUI) method is used for benchmarking and comparison purposes.
FIGURE 1: Manchester Community College Energy Dashboard
DRAFT Central Dashboard May 2016
Electricity,24,517
MMBTU
Natural Gas,21,823
MMBTU
Propane, 430MMBTU
Fuel Oil, 70MMBTU
Figure 1b: Campus Energy Use by Type(FY 2014)
95 101
0
20
40
60
80
100
120
140
160
180
200
220
FY 2014 FY 2015
Figure 1c: Campus Weather Normalized Site EUI byFiscal Year
104 kBTU/sf Northeast Median Site EUI
Manchester Community College212 kbtu/sf Source EUI
99 kbtu/sf Site EUI
0
50
100
150
200
250
300
350
Figure 1a: Site and Source EUI by Campus FY 2014 Campus Source EUI
FY 2014 Campus Site EUI
214 kbtu/sf Northeast Median Source EUI forCollege/University104 kBTU/ sf Northeast Median Site EUI forCollege/University
104104
214
UniversitiesCommunity Colleges
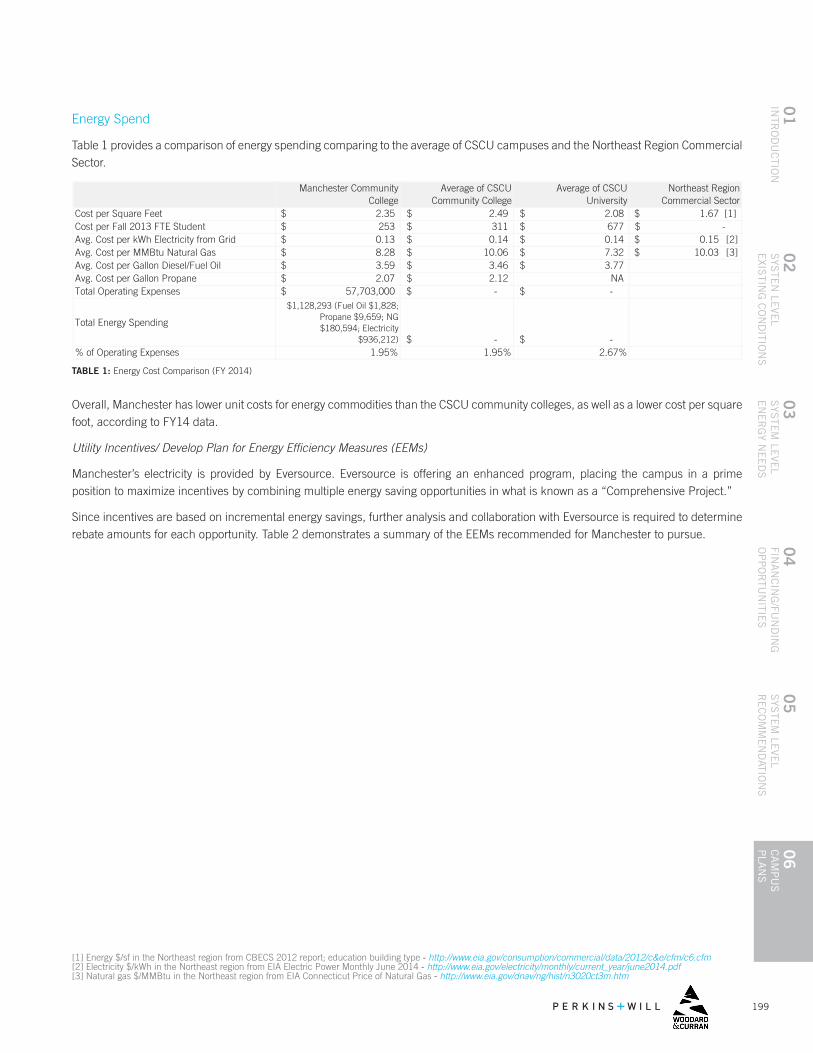
199
04
FINA
NC
ING
/FUN
DIN
G
OP
PO
RTU
NITIE
S
01
INTR
OD
UC
TION
06
CA
MP
US
P
LAN
S
05
SYS
TEM
LEVE
L R
EC
OM
ME
ND
ATION
S
02
SYS
TEN
LEVE
LE
XISTIN
G C
ON
DITIO
NS
03
SYS
TEM
LEVE
L E
NE
RG
Y NE
ED
S
TABLE 1: Energy Cost Comparison (FY 2014)
Overall, Manchester has lower unit costs for energy commodities than the CSCU community colleges, as well as a lower cost per square foot, according to FY14 data.
Utility Incentives/ Develop Plan for Energy Efficiency Measures (EEMs)
Manchester’s electricity is provided by Eversource. Eversource is offering an enhanced program, placing the campus in a prime position to maximize incentives by combining multiple energy saving opportunities in what is known as a “Comprehensive Project.”
Since incentives are based on incremental energy savings, further analysis and collaboration with Eversource is required to determine rebate amounts for each opportunity. Table 2 demonstrates a summary of the EEMs recommended for Manchester to pursue.
Energy Spend
Table 1 provides a comparison of energy spending comparing to the average of CSCU campuses and the Northeast Region Commercial Sector.
Cost per Square Feet 1.67$ [1]Cost per Fall 2013 FTE StudentAvg. Cost per kWh Electricity from Grid 0.15$ [2]Avg. Cost per MMBtu Natural Gas 10.03$ [3]Avg. Cost per Gallon Diesel/Fuel OilAvg. Cost per Gallon PropaneTotal Operating Expenses
Total Energy Spending
% of Operating Expenses
Manchester Community College
Average of CSCU Community College
Average of CSCU University
Northeast Region Commercial Sector
2.35$ 2.49$ 2.08$ 253$ 311$ 677$ -$ 0.13$ 0.14$ 0.14$
2.67%
8.28$ 10.06$ 7.32$
57,703,000$ -$ -$
[1] Energy $/sf in the Northeast region from CBECS 2012 report; education building type http://www.eia.gov/consumption/commercial/data/2012/c&e/cfm/c6.cfm
[2] Electricity $/kWh in the Northeast region from EIA Electric Power Monthly June 2014 http://www.eia.gov/electricity/monthly/current_year/june2014.pdf
[3] Natural gas $/MMBtu in the Northeast region from EIA Connecticut Price of Natural Gas http://www.eia.gov/dnav/ng/hist/n3020ct3m.htm
3.59$ 2.07$
3.46$ 2.12$
3.77$ NA
$1,128,293 (Fuel Oil $1,828; Propane $9,659; NG $180,594; Electricity
$936,212) -$ -$ 1.95% 1.95%
[1] Energy $/sf in the Northeast region from CBECS 2012 report; education building type - http://www.eia.gov/consumption/commercial/data/2012/c&e/cfm/c6.cfm [2] Electricity $/kWh in the Northeast region from EIA Electric Power Monthly June 2014 - http://www.eia.gov/electricity/monthly/current_year/june2014.pdf [3] Natural gas $/MMBtu in the Northeast region from EIA Connecticut Price of Natural Gas - http://www.eia.gov/dnav/ng/hist/n3020ct3m.htm
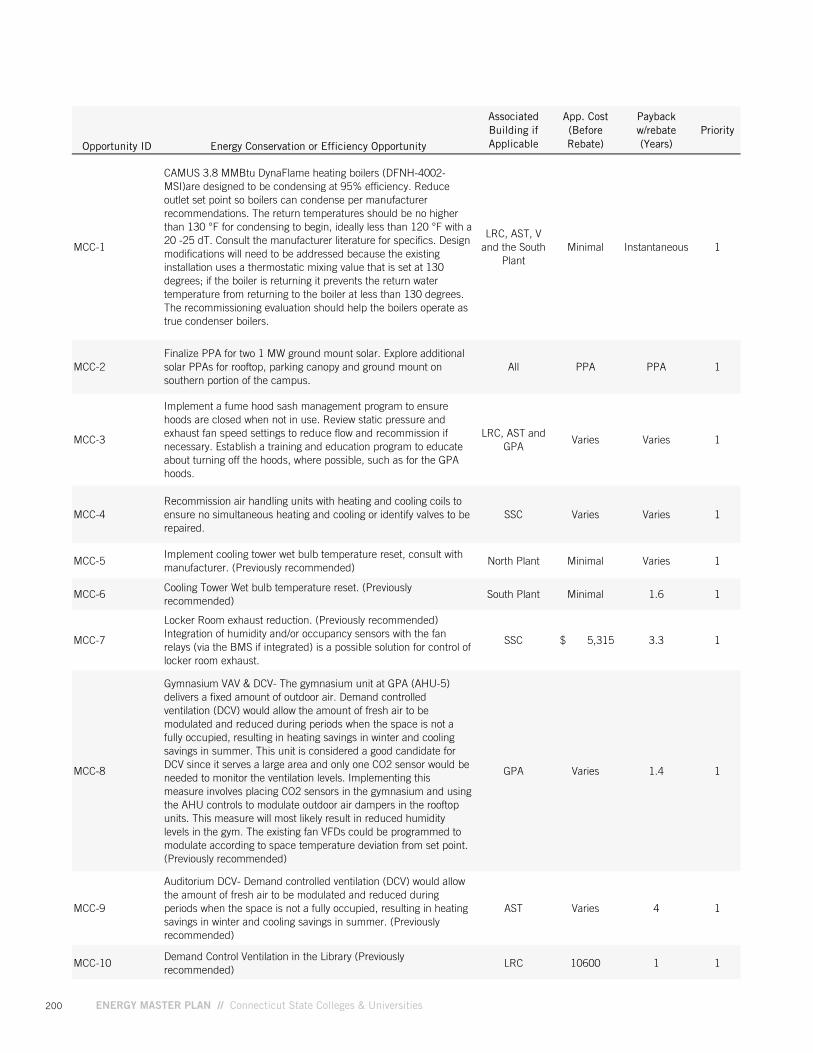
200 ENERGY MASTER PLAN // Connecticut State Colleges & Universities
Opportunity ID Energy Conservation or Efficiency Opportunity
Associated Building if Applicable
App. Cost (Before Rebate)
Payback w/rebate (Years)
Priority
MCC-1
CAMUS 3.8 MMBtu DynaFlame heating boilers (DFNH-4002-MSI)are designed to be condensing at 95% efficiency. Reduce outlet set point so boilers can condense per manufacturer recommendations. The return temperatures should be no higher than 130 °F for condensing to begin, ideally less than 120 °F with a 20 -25 dT. Consult the manufacturer literature for specifics. Design modifications will need to be addressed because the existing installation uses a thermostatic mixing value that is set at 130 degrees; if the boiler is returning it prevents the return water temperature from returning to the boiler at less than 130 degrees. The recommissioning evaluation should help the boilers operate as true condenser boilers.
LRC, AST, V and the South
PlantMinimal Instantaneous 1
MCC-2Finalize PPA for two 1 MW ground mount solar. Explore additional solar PPAs for rooftop, parking canopy and ground mount on southern portion of the campus.
All PPA PPA 1
MCC-3
Implement a fume hood sash management program to ensure hoods are closed when not in use. Review static pressure and exhaust fan speed settings to reduce flow and recommission if necessary. Establish a training and education program to educate about turning off the hoods, where possible, such as for the GPA hoods.
LRC, AST and GPA
Varies Varies 1
MCC-4Recommission air handling units with heating and cooling coils to ensure no simultaneous heating and cooling or identify valves to be repaired.
SSC Varies Varies 1
MCC-5Implement cooling tower wet bulb temperature reset, consult with manufacturer. (Previously recommended)
North Plant Minimal Varies 1
MCC-6Cooling Tower Wet bulb temperature reset. (Previously recommended)
South Plant Minimal 1.6 1
MCC-7
Locker Room exhaust reduction. (Previously recommended) Integration of humidity and/or occupancy sensors with the fan relays (via the BMS if integrated) is a possible solution for control of locker room exhaust.
SSC $ 5,315 3.3 1
MCC-8
Gymnasium VAV & DCV- The gymnasium unit at GPA (AHU-5) delivers a fixed amount of outdoor air. Demand controlled ventilation (DCV) would allow the amount of fresh air to be modulated and reduced during periods when the space is not a fully occupied, resulting in heating savings in winter and cooling savings in summer. This unit is considered a good candidate for DCV since it serves a large area and only one CO2 sensor would be needed to monitor the ventilation levels. Implementing this measure involves placing CO2 sensors in the gymnasium and using the AHU controls to modulate outdoor air dampers in the rooftop units. This measure will most likely result in reduced humidity levels in the gym. The existing fan VFDs could be programmed to modulate according to space temperature deviation from set point. (Previously recommended)
GPA Varies 1.4 1
MCC-9
Auditorium DCV- Demand controlled ventilation (DCV) would allow the amount of fresh air to be modulated and reduced during periods when the space is not a fully occupied, resulting in heating savings in winter and cooling savings in summer. (Previously recommended)
AST Varies 4 1
MCC-10Demand Control Ventilation in the Library (Previously recommended)
LRC 10600 1 1
MCC-11Reduce system flow rates to achieve a dT of 20 -25 °F. Adjustment of heating coil valves may be necessary so they are completely open at low flow conditions.
LRC, AST, V, SSC and GPA
Minimal Varies 1
MCC-12
Filter Pressure Drop Reduction- This measure shows energy reduction through reducing air handling units fan break horse power by removing MERV-13 filters, and hence reducing pressure drop across the supply fan. (Previously recommended) [1]
LRC, AST and V Minimal Instantaneous 1
MCC-13
Filter Pressure Drop Reduction- This measure shows energy reduction through reducing air handling units fan break horse power by removing MERV-13 filters, and hence reducing pressure drop across the supply fan. (Previously recommended) [1]
SSC and GPA Minimal Instantaneous 1
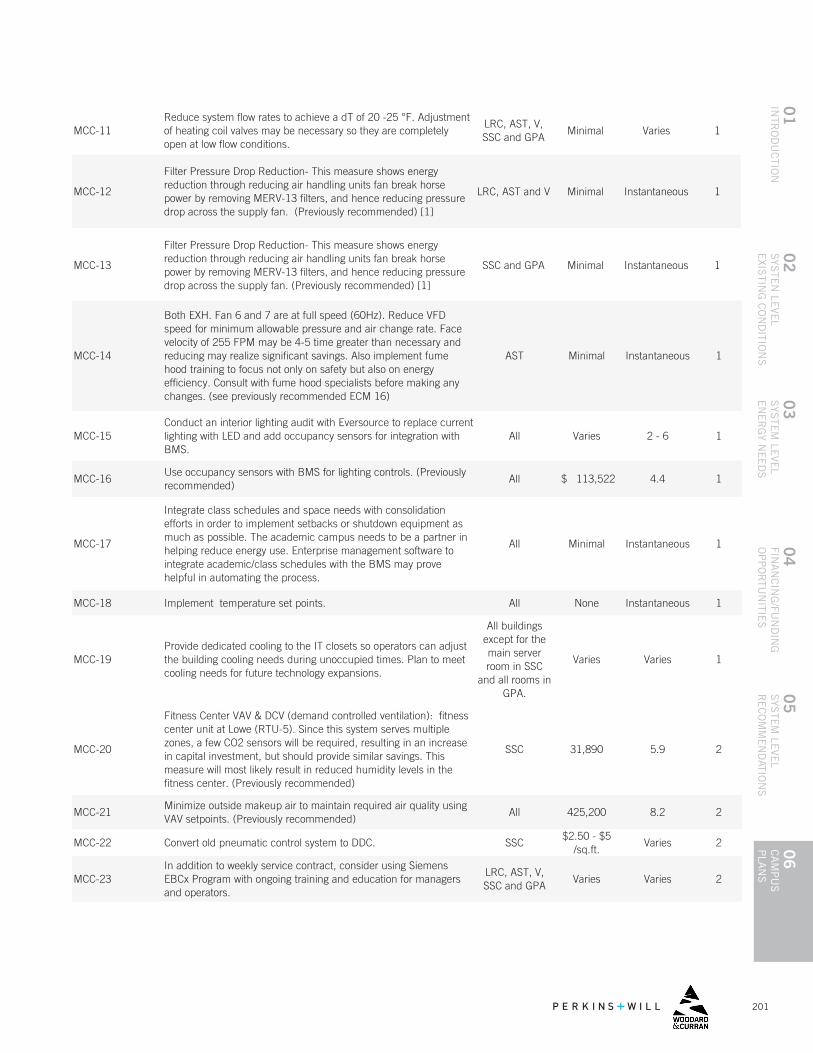
201
04
FINA
NC
ING
/FUN
DIN
G
OP
PO
RTU
NITIE
S
01
INTR
OD
UC
TION
06
CA
MP
US
P
LAN
S
05
SYS
TEM
LEVE
L R
EC
OM
ME
ND
ATION
S
02
SYS
TEN
LEVE
LE
XISTIN
G C
ON
DITIO
NS
03
SYS
TEM
LEVE
L E
NE
RG
Y NE
ED
S
Opportunity ID Energy Conservation or Efficiency Opportunity
Associated Building if Applicable
App. Cost (Before Rebate)
Payback w/rebate (Years)
Priority
MCC-1
CAMUS 3.8 MMBtu DynaFlame heating boilers (DFNH-4002-MSI)are designed to be condensing at 95% efficiency. Reduce outlet set point so boilers can condense per manufacturer recommendations. The return temperatures should be no higher than 130 °F for condensing to begin, ideally less than 120 °F with a 20 -25 dT. Consult the manufacturer literature for specifics. Design modifications will need to be addressed because the existing installation uses a thermostatic mixing value that is set at 130 degrees; if the boiler is returning it prevents the return water temperature from returning to the boiler at less than 130 degrees. The recommissioning evaluation should help the boilers operate as true condenser boilers.
LRC, AST, V and the South
PlantMinimal Instantaneous 1
MCC-2Finalize PPA for two 1 MW ground mount solar. Explore additional solar PPAs for rooftop, parking canopy and ground mount on southern portion of the campus.
All PPA PPA 1
MCC-3
Implement a fume hood sash management program to ensure hoods are closed when not in use. Review static pressure and exhaust fan speed settings to reduce flow and recommission if necessary. Establish a training and education program to educate about turning off the hoods, where possible, such as for the GPA hoods.
LRC, AST and GPA
Varies Varies 1
MCC-4Recommission air handling units with heating and cooling coils to ensure no simultaneous heating and cooling or identify valves to be repaired.
SSC Varies Varies 1
MCC-5Implement cooling tower wet bulb temperature reset, consult with manufacturer. (Previously recommended)
North Plant Minimal Varies 1
MCC-6Cooling Tower Wet bulb temperature reset. (Previously recommended)
South Plant Minimal 1.6 1
MCC-7
Locker Room exhaust reduction. (Previously recommended) Integration of humidity and/or occupancy sensors with the fan relays (via the BMS if integrated) is a possible solution for control of locker room exhaust.
SSC $ 5,315 3.3 1
MCC-8
Gymnasium VAV & DCV- The gymnasium unit at GPA (AHU-5) delivers a fixed amount of outdoor air. Demand controlled ventilation (DCV) would allow the amount of fresh air to be modulated and reduced during periods when the space is not a fully occupied, resulting in heating savings in winter and cooling savings in summer. This unit is considered a good candidate for DCV since it serves a large area and only one CO2 sensor would be needed to monitor the ventilation levels. Implementing this measure involves placing CO2 sensors in the gymnasium and using the AHU controls to modulate outdoor air dampers in the rooftop units. This measure will most likely result in reduced humidity levels in the gym. The existing fan VFDs could be programmed to modulate according to space temperature deviation from set point. (Previously recommended)
GPA Varies 1.4 1
MCC-9
Auditorium DCV- Demand controlled ventilation (DCV) would allow the amount of fresh air to be modulated and reduced during periods when the space is not a fully occupied, resulting in heating savings in winter and cooling savings in summer. (Previously recommended)
AST Varies 4 1
MCC-10Demand Control Ventilation in the Library (Previously recommended)
LRC 10600 1 1
MCC-11Reduce system flow rates to achieve a dT of 20 -25 °F. Adjustment of heating coil valves may be necessary so they are completely open at low flow conditions.
LRC, AST, V, SSC and GPA
Minimal Varies 1
MCC-12
Filter Pressure Drop Reduction- This measure shows energy reduction through reducing air handling units fan break horse power by removing MERV-13 filters, and hence reducing pressure drop across the supply fan. (Previously recommended) [1]
LRC, AST and V Minimal Instantaneous 1
MCC-13
Filter Pressure Drop Reduction- This measure shows energy reduction through reducing air handling units fan break horse power by removing MERV-13 filters, and hence reducing pressure drop across the supply fan. (Previously recommended) [1]
SSC and GPA Minimal Instantaneous 1
MCC-14
Both EXH. Fan 6 and 7 are at full speed (60Hz). Reduce VFD speed for minimum allowable pressure and air change rate. Face velocity of 255 FPM may be 4-5 time greater than necessary and reducing may realize significant savings. Also implement fume hood training to focus not only on safety but also on energy efficiency. Consult with fume hood specialists before making any changes. (see previously recommended ECM 16)
AST Minimal Instantaneous 1
MCC-15Conduct an interior lighting audit with Eversource to replace current lighting with LED and add occupancy sensors for integration with BMS.
All Varies 2 - 6 1
MCC-16Use occupancy sensors with BMS for lighting controls. (Previously recommended)
All $ 113,522 4.4 1
MCC-17
Integrate class schedules and space needs with consolidation efforts in order to implement setbacks or shutdown equipment as much as possible. The academic campus needs to be a partner in helping reduce energy use. Enterprise management software to integrate academic/class schedules with the BMS may prove helpful in automating the process.
All Minimal Instantaneous 1
MCC-18 Implement temperature set points. All None Instantaneous 1
MCC-19Provide dedicated cooling to the IT closets so operators can adjust the building cooling needs during unoccupied times. Plan to meet cooling needs for future technology expansions.
All buildings except for the main server room in SSC
and all rooms in GPA.
Varies Varies 1
MCC-20
Fitness Center VAV & DCV (demand controlled ventilation): fitness center unit at Lowe (RTU-5). Since this system serves multiple zones, a few CO2 sensors will be required, resulting in an increase in capital investment, but should provide similar savings. This measure will most likely result in reduced humidity levels in the fitness center. (Previously recommended)
SSC 31,890 5.9 2
MCC-21Minimize outside makeup air to maintain required air quality using VAV setpoints. (Previously recommended)
All 425,200 8.2 2
MCC-22 Convert old pneumatic control system to DDC. SSC$2.50 - $5
/sq.ft.Varies 2
MCC-23In addition to weekly service contract, consider using Siemens EBCx Program with ongoing training and education for managers and operators.
LRC, AST, V, SSC and GPA
Varies Varies 2
MCC-24
EBCx, Economizer Low Limit- According to building operators economizer controls are needed to prevent overheating in the building when the outside air temperatures are as low as 10°F as opposed to approximately 40°F normally seen in similar buildings. This measure shows the savings of the controls, etc. that would allow the building to operate economizer at the more typical low point (40°F). The programming of the existing AHUs as well as the VAV programming will have to be optimized to reduce cooling loads at low outside air temperatures. (Previously recommended)
All Minimal Varies 2
MCC-25
Variable Flow Kitchen Exhaust -The kitchen hoods are constant flow when they are on and require constant conditioned make up air. It is possible to install a system that measures exhaust temperature and senses exhaust smoke. The system will reduce exhaust flow when the temperatures are low and smoke is not sensed. (Previously recommended) Alternatively, explore integrating on/off fume hood controls with cooking equipment controls.
SSC, GPA Varies Varies 3
MCC-26Integrate an Energy Dashboard into the BMS to increase energy use awareness and foster a culture of energy efficiency.
All Varies Varies 3
MCC-27In the culinary labs and food service area, convert kitchen Propane to Natural Gas. (Previously recommended)
SSC Varies Varies 3
MCC-28
HW Plant Schedule Reduction- Currently the hot water plants stays on year around to take care of the heating and reheat requirements of the building. This measure shows energy reduction by plant shut off during the summer (June — August) months. A small boiler may be necessary to install to handle potential summer time lab reheat loads. (Previously recommended)
South Plant for LRC and AST
Minimal 9.7 3
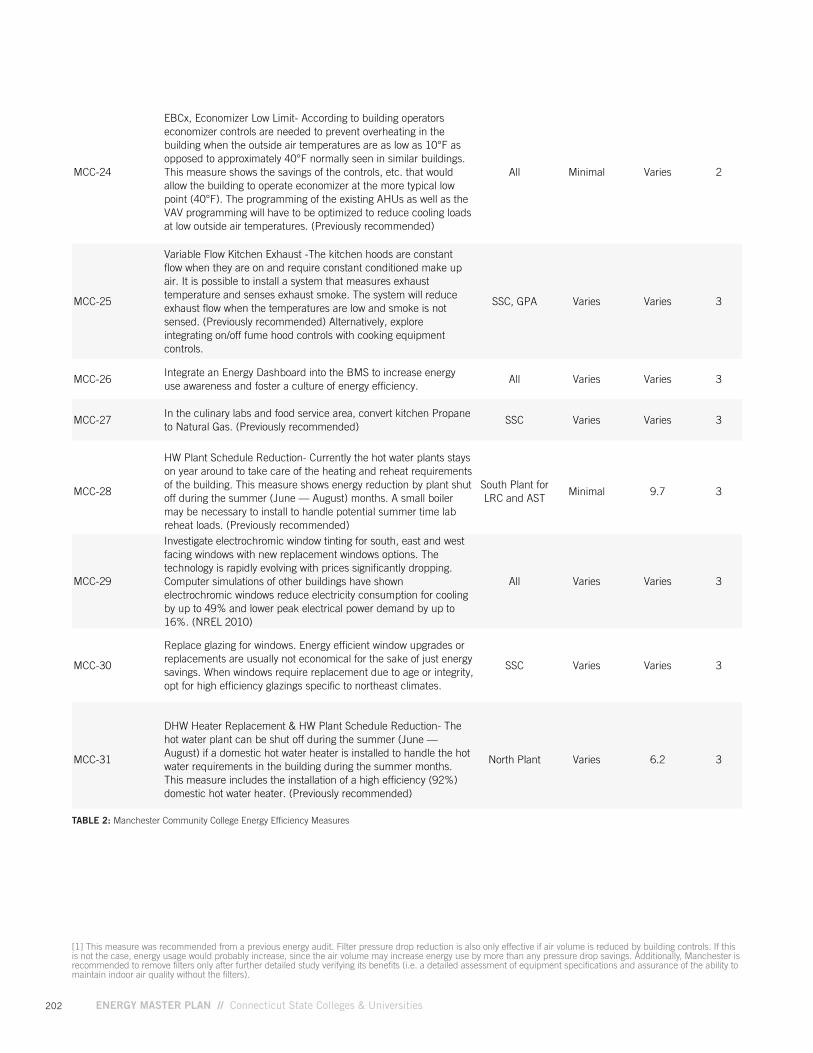
202 ENERGY MASTER PLAN // Connecticut State Colleges & Universities
TABLE 2: Manchester Community College Energy Efficiency Measures
[1] This measure was recommended from a previous energy audit. Filter pressure drop reduction is also only effective if air volume is reduced by building controls. If this is not the case, energy usage would probably increase, since the air volume may increase energy use by more than any pressure drop savings. Additionally, Manchester is recommended to remove filters only after further detailed study verifying its benefits (i.e. a detailed assessment of equipment specifications and assurance of the ability to maintain indoor air quality without the filters).
MCC-29
Investigate electrochromic window tinting for south, east and west facing windows with new replacement windows options. The technology is rapidly evolving with prices significantly dropping. Computer simulations of other buildings have shown electrochromic windows reduce electricity consumption for cooling by up to 49% and lower peak electrical power demand by up to 16%. (NREL 2010)
All Varies Varies 3
MCC-30
Replace glazing for windows. Energy efficient window upgrades or replacements are usually not economical for the sake of just energy savings. When windows require replacement due to age or integrity, opt for high efficiency glazings specific to northeast climates.
SSC Varies Varies 3
MCC-31
DHW Heater Replacement & HW Plant Schedule Reduction- The hot water plant can be shut off during the summer (June — August) if a domestic hot water heater is installed to handle the hot water requirements in the building during the summer months. This measure includes the installation of a high efficiency (92%) domestic hot water heater. (Previously recommended)
North Plant Varies 6.2 3
MCC-14
Both EXH. Fan 6 and 7 are at full speed (60Hz). Reduce VFD speed for minimum allowable pressure and air change rate. Face velocity of 255 FPM may be 4-5 time greater than necessary and reducing may realize significant savings. Also implement fume hood training to focus not only on safety but also on energy efficiency. Consult with fume hood specialists before making any changes. (see previously recommended ECM 16)
AST Minimal Instantaneous 1
MCC-15Conduct an interior lighting audit with Eversource to replace current lighting with LED and add occupancy sensors for integration with BMS.
All Varies 2 - 6 1
MCC-16Use occupancy sensors with BMS for lighting controls. (Previously recommended)
All $ 113,522 4.4 1
MCC-17
Integrate class schedules and space needs with consolidation efforts in order to implement setbacks or shutdown equipment as much as possible. The academic campus needs to be a partner in helping reduce energy use. Enterprise management software to integrate academic/class schedules with the BMS may prove helpful in automating the process.
All Minimal Instantaneous 1
MCC-18 Implement temperature set points. All None Instantaneous 1
MCC-19Provide dedicated cooling to the IT closets so operators can adjust the building cooling needs during unoccupied times. Plan to meet cooling needs for future technology expansions.
All buildings except for the main server room in SSC
and all rooms in GPA.
Varies Varies 1
MCC-20
Fitness Center VAV & DCV (demand controlled ventilation): fitness center unit at Lowe (RTU-5). Since this system serves multiple zones, a few CO2 sensors will be required, resulting in an increase in capital investment, but should provide similar savings. This measure will most likely result in reduced humidity levels in the fitness center. (Previously recommended)
SSC 31,890 5.9 2
MCC-21Minimize outside makeup air to maintain required air quality using VAV setpoints. (Previously recommended)
All 425,200 8.2 2
MCC-22 Convert old pneumatic control system to DDC. SSC$2.50 - $5
/sq.ft.Varies 2
MCC-23In addition to weekly service contract, consider using Siemens EBCx Program with ongoing training and education for managers and operators.
LRC, AST, V, SSC and GPA
Varies Varies 2
MCC-24
EBCx, Economizer Low Limit- According to building operators economizer controls are needed to prevent overheating in the building when the outside air temperatures are as low as 10°F as opposed to approximately 40°F normally seen in similar buildings. This measure shows the savings of the controls, etc. that would allow the building to operate economizer at the more typical low point (40°F). The programming of the existing AHUs as well as the VAV programming will have to be optimized to reduce cooling loads at low outside air temperatures. (Previously recommended)
All Minimal Varies 2
MCC-25
Variable Flow Kitchen Exhaust -The kitchen hoods are constant flow when they are on and require constant conditioned make up air. It is possible to install a system that measures exhaust temperature and senses exhaust smoke. The system will reduce exhaust flow when the temperatures are low and smoke is not sensed. (Previously recommended) Alternatively, explore integrating on/off fume hood controls with cooking equipment controls.
SSC, GPA Varies Varies 3
MCC-26Integrate an Energy Dashboard into the BMS to increase energy use awareness and foster a culture of energy efficiency.
All Varies Varies 3
MCC-27In the culinary labs and food service area, convert kitchen Propane to Natural Gas. (Previously recommended)
SSC Varies Varies 3
MCC-28
HW Plant Schedule Reduction- Currently the hot water plants stays on year around to take care of the heating and reheat requirements of the building. This measure shows energy reduction by plant shut off during the summer (June — August) months. A small boiler may be necessary to install to handle potential summer time lab reheat loads. (Previously recommended)
South Plant for LRC and AST
Minimal 9.7 3
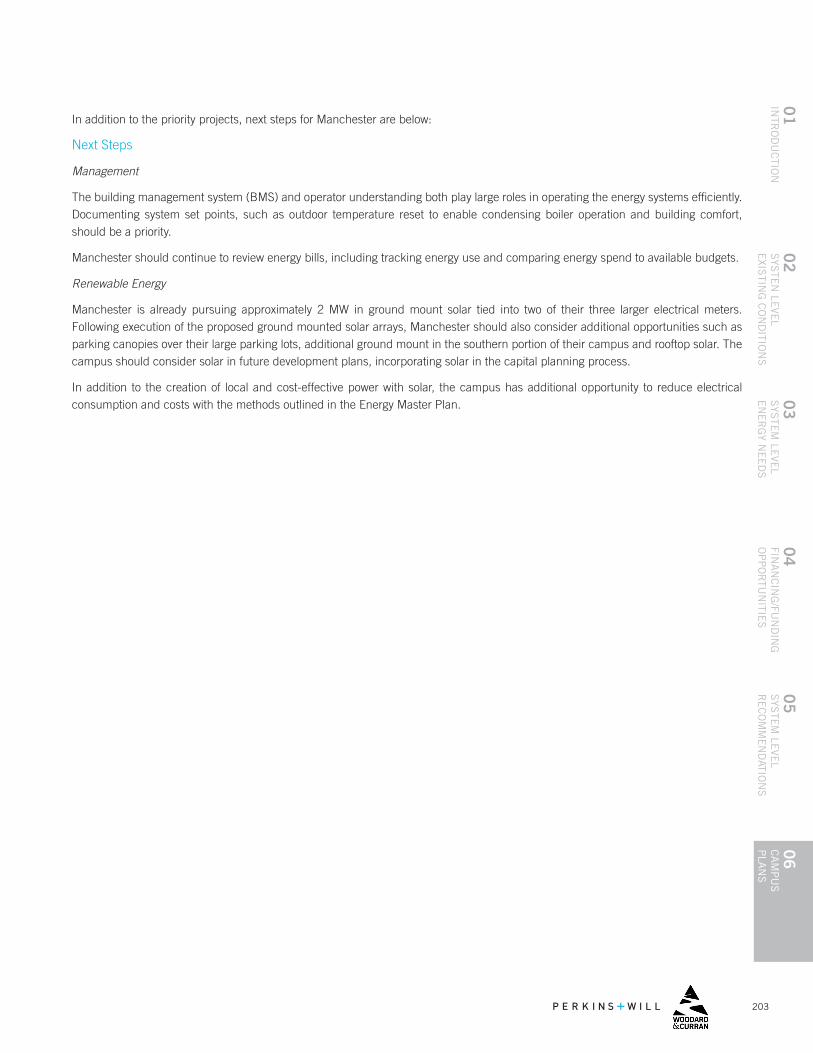
203
04
FINA
NC
ING
/FUN
DIN
G
OP
PO
RTU
NITIE
S
01
INTR
OD
UC
TION
06
CA
MP
US
P
LAN
S
05
SYS
TEM
LEVE
L R
EC
OM
ME
ND
ATION
S
02
SYS
TEN
LEVE
LE
XISTIN
G C
ON
DITIO
NS
03
SYS
TEM
LEVE
L E
NE
RG
Y NE
ED
S
In addition to the priority projects, next steps for Manchester are below:
Next Steps
Management
The building management system (BMS) and operator understanding both play large roles in operating the energy systems efficiently. Documenting system set points, such as outdoor temperature reset to enable condensing boiler operation and building comfort, should be a priority.
Manchester should continue to review energy bills, including tracking energy use and comparing energy spend to available budgets.
Renewable Energy
Manchester is already pursuing approximately 2 MW in ground mount solar tied into two of their three larger electrical meters. Following execution of the proposed ground mounted solar arrays, Manchester should also consider additional opportunities such as parking canopies over their large parking lots, additional ground mount in the southern portion of their campus and rooftop solar. The campus should consider solar in future development plans, incorporating solar in the capital planning process.
In addition to the creation of local and cost-effective power with solar, the campus has additional opportunity to reduce electrical consumption and costs with the methods outlined in the Energy Master Plan.
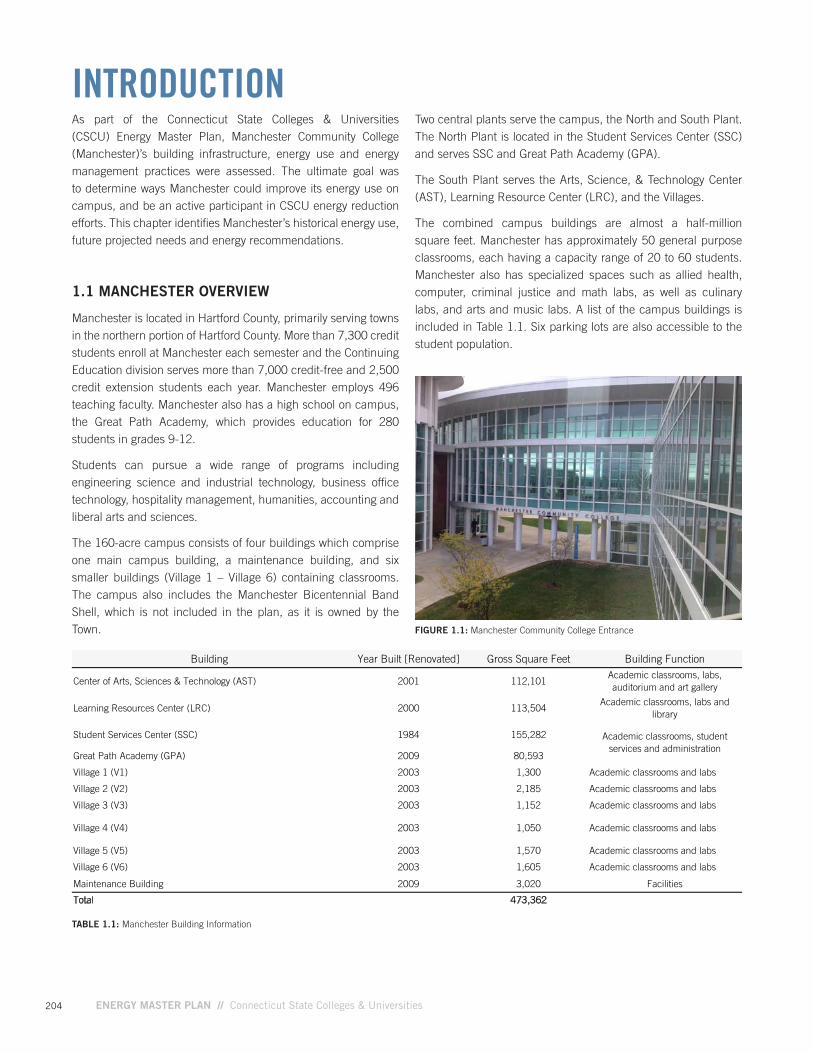
204 ENERGY MASTER PLAN // Connecticut State Colleges & Universities
INTRODUCTIONAs part of the Connecticut State Colleges & Universities (CSCU) Energy Master Plan, Manchester Community College (Manchester)’s building infrastructure, energy use and energy management practices were assessed. The ultimate goal was to determine ways Manchester could improve its energy use on campus, and be an active participant in CSCU energy reduction efforts. This chapter identifies Manchester’s historical energy use, future projected needs and energy recommendations.
1.1 MANCHESTER OVERVIEW
Manchester is located in Hartford County, primarily serving towns in the northern portion of Hartford County. More than 7,300 credit students enroll at Manchester each semester and the Continuing Education division serves more than 7,000 credit-free and 2,500 credit extension students each year. Manchester employs 496 teaching faculty. Manchester also has a high school on campus, the Great Path Academy, which provides education for 280 students in grades 9-12.
Students can pursue a wide range of programs including engineering science and industrial technology, business office technology, hospitality management, humanities, accounting and liberal arts and sciences.
The 160-acre campus consists of four buildings which comprise one main campus building, a maintenance building, and six smaller buildings (Village 1 – Village 6) containing classrooms. The campus also includes the Manchester Bicentennial Band Shell, which is not included in the plan, as it is owned by the Town.
TABLE 1.1: Manchester Building Information
FIGURE 1.1: Manchester Community College Entrance
Building Year Built [Renovated] Gross Square Feet Building Function
Center of Arts, Sciences & Technology (AST) 2001 112,101Academic classrooms, labs, auditorium and art gallery
Learning Resources Center (LRC) 2000 113,504Academic classrooms, labs and
library
Student Services Center (SSC) 1984 155,282
Great Path Academy (GPA) 2009 80,593
Village 1 (V1) 2003 1,300 Academic classrooms and labs
Village 2 (V2) 2003 2,185 Academic classrooms and labs
Village 3 (V3) 2003 1,152 Academic classrooms and labs
Village 4 (V4) 2003 1,050 Academic classrooms and labs
Village 5 (V5) 2003 1,570 Academic classrooms and labs
Village 6 (V6) 2003 1,605 Academic classrooms and labs
Maintenance Building 2009 3,020 Facilities
Total 473,362
Academic classrooms, student services and administration
Two central plants serve the campus, the North and South Plant. The North Plant is located in the Student Services Center (SSC) and serves SSC and Great Path Academy (GPA).
The South Plant serves the Arts, Science, & Technology Center (AST), Learning Resource Center (LRC), and the Villages.
The combined campus buildings are almost a half-million square feet. Manchester has approximately 50 general purpose classrooms, each having a capacity range of 20 to 60 students. Manchester also has specialized spaces such as allied health, computer, criminal justice and math labs, as well as culinary labs, and arts and music labs. A list of the campus buildings is included in Table 1.1. Six parking lots are also accessible to the student population.
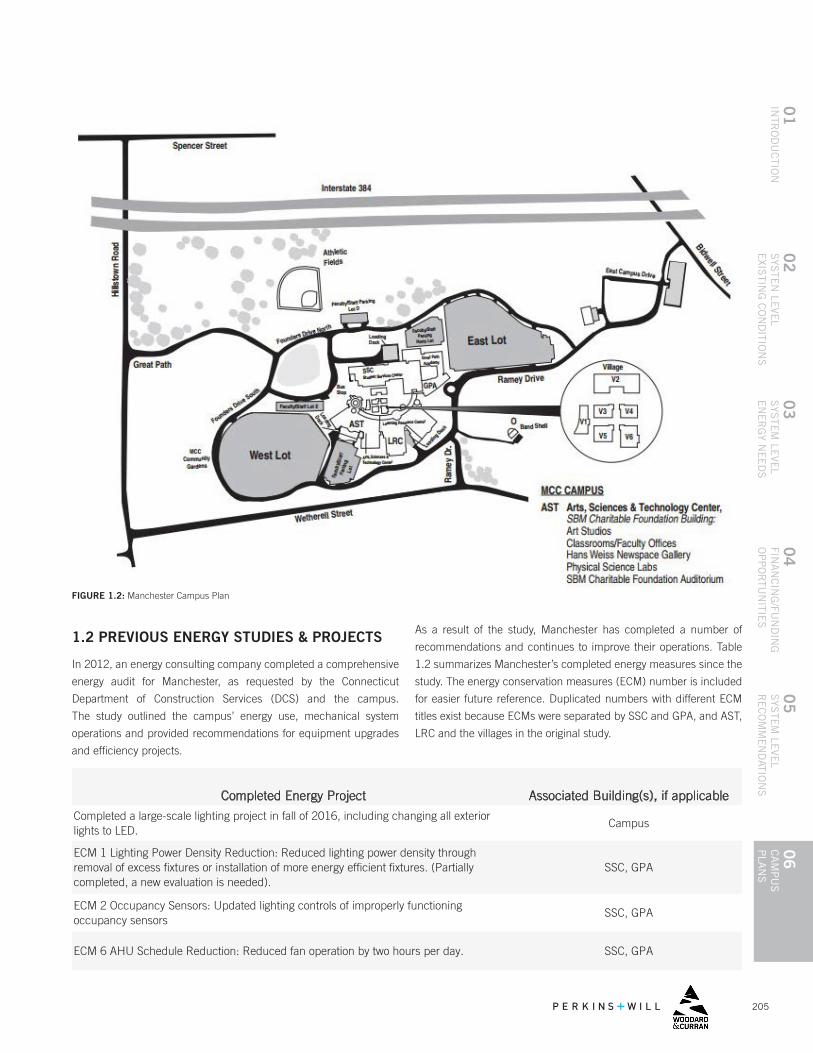
205
04
FINA
NC
ING
/FUN
DIN
G
OP
PO
RTU
NITIE
S
01
INTR
OD
UC
TION
06
CA
MP
US
P
LAN
S
05
SYS
TEM
LEVE
L R
EC
OM
ME
ND
ATION
S
02
SYS
TEN
LEVE
LE
XISTIN
G C
ON
DITIO
NS
03
SYS
TEM
LEVE
L E
NE
RG
Y NE
ED
S
1.2 PREVIOUS ENERGY STUDIES & PROJECTS
In 2012, an energy consulting company completed a comprehensive
energy audit for Manchester, as requested by the Connecticut
Department of Construction Services (DCS) and the campus.
The study outlined the campus’ energy use, mechanical system
operations and provided recommendations for equipment upgrades
and efficiency projects.
FIGURE 1.2: Manchester Campus Plan
As a result of the study, Manchester has completed a number of
recommendations and continues to improve their operations. Table
1.2 summarizes Manchester’s completed energy measures since the
study. The energy conservation measures (ECM) number is included
for easier future reference. Duplicated numbers with different ECM
titles exist because ECMs were separated by SSC and GPA, and AST,
LRC and the villages in the original study.
Completed Energy Project Associated Building(s), if applicable
Completed a large-scale lighting project in fall of 2016, including changing all exterior lights to LED.
Campus
ECM 1 Lighting Power Density Reduction: Reduced lighting power density through removal of excess fixtures or installation of more energy efficient fixtures. (Partially completed, a new evaluation is needed).
SSC, GPA
ECM 2 Occupancy Sensors: Updated lighting controls of improperly functioning occupancy sensors
SSC, GPA
ECM 6 AHU Schedule Reduction: Reduced fan operation by two hours per day. SSC, GPA
ECM 3 Site Lighting Wattage and Schedule Reduction: Manchester relamped existing fixtures and reduced the number of hours that lights were on.
LRC, AST
ECM 5 AHU Schedule Reduction: Air handlers operated prior approximately 17 hours a day on weekdays and elven hours on Saturday. Manchester reduced air handler fan operations by two hours per days (one in the morning and one at night)
LRC, AST
ECM 6 CHW Plant Schedule Reduction: Reduced overall cooling season by two months. The campus no longer cools in March or December.
South Plant
ECM 12 HW Plant Boiler Replacement: Manchester replaced their previous oversized boiler with a high efficient condensing boiler.
South Plant

206 ENERGY MASTER PLAN // Connecticut State Colleges & Universities
TABLE 1.2: Manchester Completed Energy Projects
Completed Energy Project Associated Building(s), if applicable
Completed a large-scale lighting project in fall of 2016, including changing all exterior lights to LED.
Campus
ECM 1 Lighting Power Density Reduction: Reduced lighting power density through removal of excess fixtures or installation of more energy efficient fixtures. (Partially completed, a new evaluation is needed).
SSC, GPA
ECM 2 Occupancy Sensors: Updated lighting controls of improperly functioning occupancy sensors
SSC, GPA
ECM 6 AHU Schedule Reduction: Reduced fan operation by two hours per day. SSC, GPA
ECM 3 Site Lighting Wattage and Schedule Reduction: Manchester relamped existing fixtures and reduced the number of hours that lights were on.
LRC, AST
ECM 5 AHU Schedule Reduction: Air handlers operated prior approximately 17 hours a day on weekdays and elven hours on Saturday. Manchester reduced air handler fan operations by two hours per days (one in the morning and one at night)
LRC, AST
ECM 6 CHW Plant Schedule Reduction: Reduced overall cooling season by two months. The campus no longer cools in March or December.
South Plant
ECM 12 HW Plant Boiler Replacement: Manchester replaced their previous oversized boiler with a high efficient condensing boiler.
South Plant
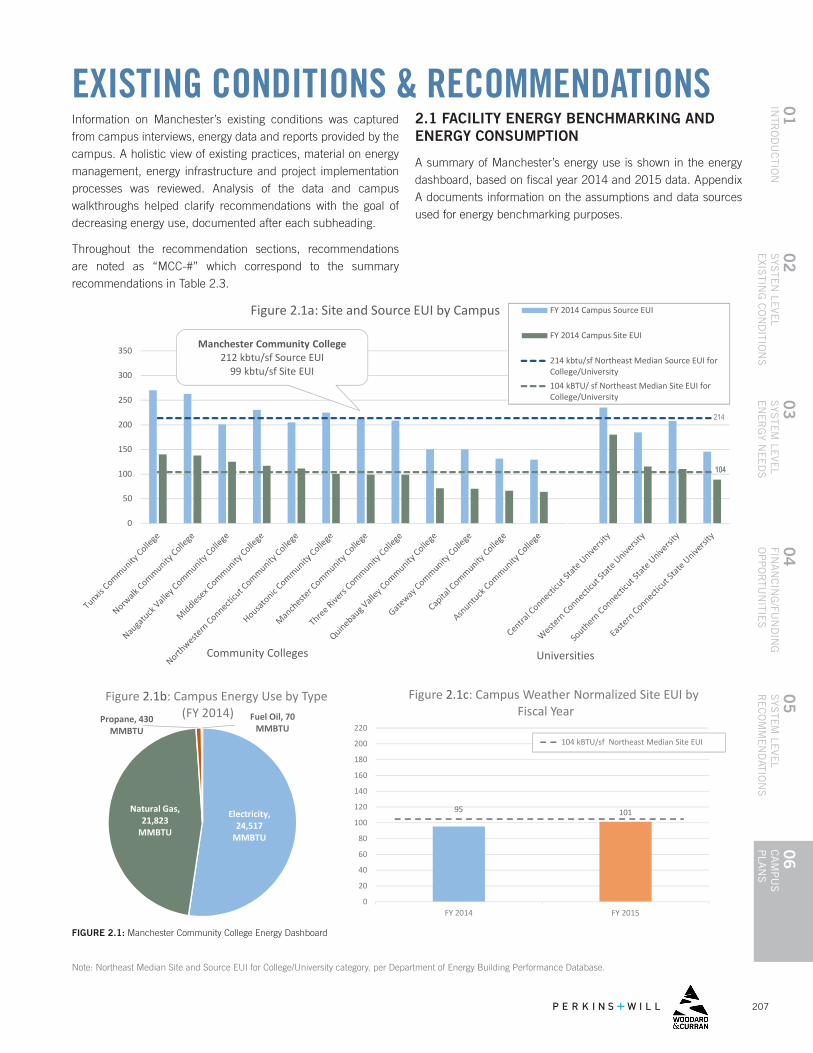
207
04
FINA
NC
ING
/FUN
DIN
G
OP
PO
RTU
NITIE
S
01
INTR
OD
UC
TION
06
CA
MP
US
P
LAN
S
05
SYS
TEM
LEVE
L R
EC
OM
ME
ND
ATION
S
02
SYS
TEN
LEVE
LE
XISTIN
G C
ON
DITIO
NS
03
SYS
TEM
LEVE
L E
NE
RG
Y NE
ED
S
EXISTING CONDITIONS & RECOMMENDATIONSInformation on Manchester’s existing conditions was captured from campus interviews, energy data and reports provided by the campus. A holistic view of existing practices, material on energy management, energy infrastructure and project implementation processes was reviewed. Analysis of the data and campus walkthroughs helped clarify recommendations with the goal of decreasing energy use, documented after each subheading.
Throughout the recommendation sections, recommendations are noted as “MCC-#” which correspond to the summary recommendations in Table 2.3.
2.1 FACILITY ENERGY BENCHMARKING AND ENERGY CONSUMPTION
A summary of Manchester’s energy use is shown in the energy dashboard, based on fiscal year 2014 and 2015 data. Appendix A documents information on the assumptions and data sources used for energy benchmarking purposes.
FIGURE 2.1: Manchester Community College Energy Dashboard
Note: Northeast Median Site and Source EUI for College/University category, per Department of Energy Building Performance Database.
DRAFT Central Dashboard May 2016
Electricity,24,517
MMBTU
Natural Gas,21,823
MMBTU
Propane, 430MMBTU
Fuel Oil, 70MMBTU
Figure 2.1b: Campus Energy Use by Type(FY 2014)
95 101
0
20
40
60
80
100
120
140
160
180
200
220
FY 2014 FY 2015
Figure 2.1c: Campus Weather Normalized Site EUI byFiscal Year
104 kBTU/sf Northeast Median Site EUI
Manchester Community College212 kbtu/sf Source EUI
99 kbtu/sf Site EUI
0
50
100
150
200
250
300
350
Figure 2.1a: Site and Source EUI by Campus FY 2014 Campus Source EUI
FY 2014 Campus Site EUI
214 kbtu/sf Northeast Median Source EUI forCollege/University104 kBTU/ sf Northeast Median Site EUI forCollege/University
104104
214
UniversitiesCommunity Colleges
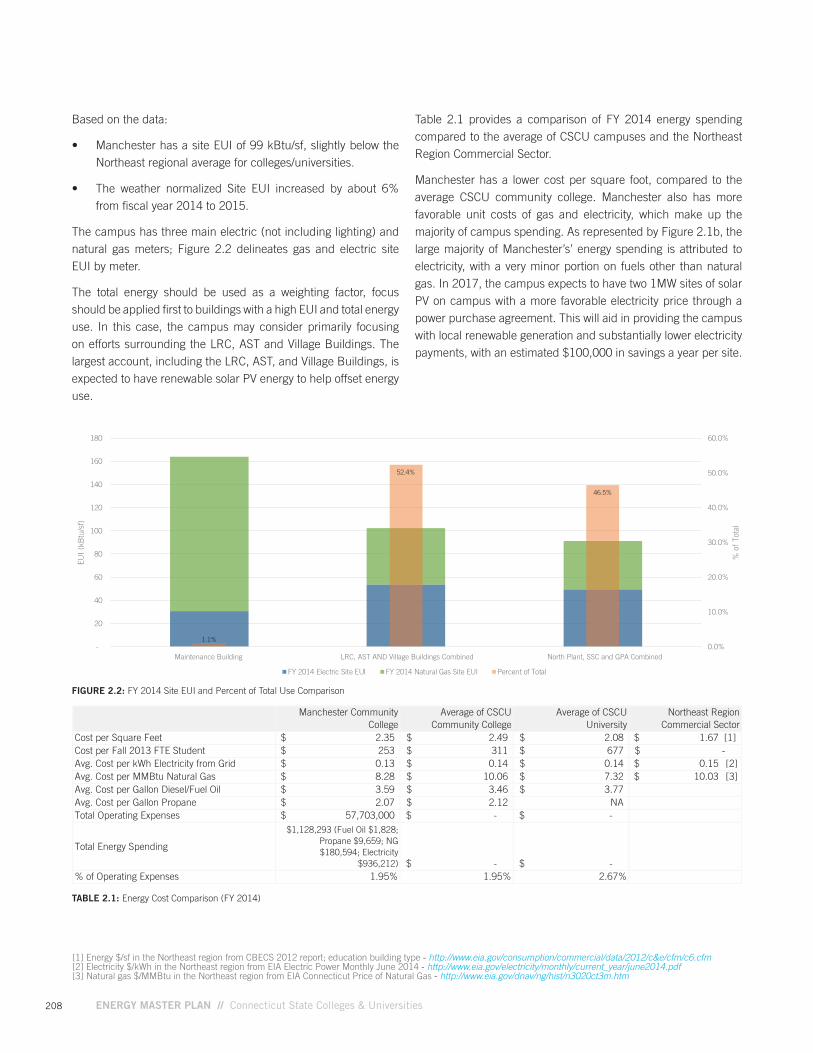
208 ENERGY MASTER PLAN // Connecticut State Colleges & Universities
Based on the data:
• Manchester has a site EUI of 99 kBtu/sf, slightly below the Northeast regional average for colleges/universities.
• The weather normalized Site EUI increased by about 6% from fiscal year 2014 to 2015.
The campus has three main electric (not including lighting) and natural gas meters; Figure 2.2 delineates gas and electric site EUI by meter.
The total energy should be used as a weighting factor, focus should be applied first to buildings with a high EUI and total energy use. In this case, the campus may consider primarily focusing on efforts surrounding the LRC, AST and Village Buildings. The largest account, including the LRC, AST, and Village Buildings, is expected to have renewable solar PV energy to help offset energy use.
School Manchester Community CollegeCode (Multiple Items)
ValuesRow LabelsFY 2014 Ele FY 2014 Na Sum of FY Total FY 20 Percent of TotalMaintenan 31 133 154 495,541 1.1%LRC, AST, a 54 48 99 ####### 52.4%South Plan 49 42 88 ####### 46.5%Grand Tota 134 224 341 #######
Row LabelsFY 2014 Ele FY 2014 Na Sum of FY Total FY 20 Percent of TotalMaintenan 31 133 154 495,541 1.1%LRC, AST, a 54 48 99 ####### 52.4%South Plan 49 42 88 ####### 46.5%
1.1%
52.4%
46.5%
0.0%
10.0%
20.0%
30.0%
40.0%
50.0%
60.0%
-
20
40
60
80
100
120
140
160
180
Maintenance Building LRC, AST, and Village Buildings Combined South Plant, Lowe and GPA Combined
% o
f To
tal
EUI
(kB
tu/s
f)
FY 2014 Electric Site EUI FY 2014 Natural Gas Site EUI Percent of Total
FIGURE 2.2: FY 2014 Site EUI and Percent of Total Use Comparison
Table 2.1 provides a comparison of FY 2014 energy spending compared to the average of CSCU campuses and the Northeast Region Commercial Sector.
Manchester has a lower cost per square foot, compared to the average CSCU community college. Manchester also has more favorable unit costs of gas and electricity, which make up the majority of campus spending. As represented by Figure 2.1b, the large majority of Manchester’s’ energy spending is attributed to electricity, with a very minor portion on fuels other than natural gas. In 2017, the campus expects to have two 1MW sites of solar PV on campus with a more favorable electricity price through a power purchase agreement. This will aid in providing the campus with local renewable generation and substantially lower electricity payments, with an estimated $100,000 in savings a year per site.
TABLE 2.1: Energy Cost Comparison (FY 2014)
[1] Energy $/sf in the Northeast region from CBECS 2012 report; education building type - http://www.eia.gov/consumption/commercial/data/2012/c&e/cfm/c6.cfm [2] Electricity $/kWh in the Northeast region from EIA Electric Power Monthly June 2014 - http://www.eia.gov/electricity/monthly/current_year/june2014.pdf [3] Natural gas $/MMBtu in the Northeast region from EIA Connecticut Price of Natural Gas - http://www.eia.gov/dnav/ng/hist/n3020ct3m.htm
North Plant, SSC and GPA CombinedLRC, AST AND Village Buildings CombinedMaintenance Building
Cost per Square Feet 1.67$ [1]Cost per Fall 2013 FTE StudentAvg. Cost per kWh Electricity from Grid 0.15$ [2]Avg. Cost per MMBtu Natural Gas 10.03$ [3]Avg. Cost per Gallon Diesel/Fuel OilAvg. Cost per Gallon PropaneTotal Operating Expenses
Total Energy Spending
% of Operating Expenses
Manchester Community College
Average of CSCU Community College
Average of CSCU University
Northeast Region Commercial Sector
2.35$ 2.49$ 2.08$ 253$ 311$ 677$ -$ 0.13$ 0.14$ 0.14$
2.67%
8.28$ 10.06$ 7.32$
57,703,000$ -$ -$
[1] Energy $/sf in the Northeast region from CBECS 2012 report; education building type http://www.eia.gov/consumption/commercial/data/2012/c&e/cfm/c6.cfm
[2] Electricity $/kWh in the Northeast region from EIA Electric Power Monthly June 2014 http://www.eia.gov/electricity/monthly/current_year/june2014.pdf
[3] Natural gas $/MMBtu in the Northeast region from EIA Connecticut Price of Natural Gas http://www.eia.gov/dnav/ng/hist/n3020ct3m.htm
3.59$ 2.07$
3.46$ 2.12$
3.77$ NA
$1,128,293 (Fuel Oil $1,828; Propane $9,659; NG $180,594; Electricity
$936,212) -$ -$ 1.95% 1.95%
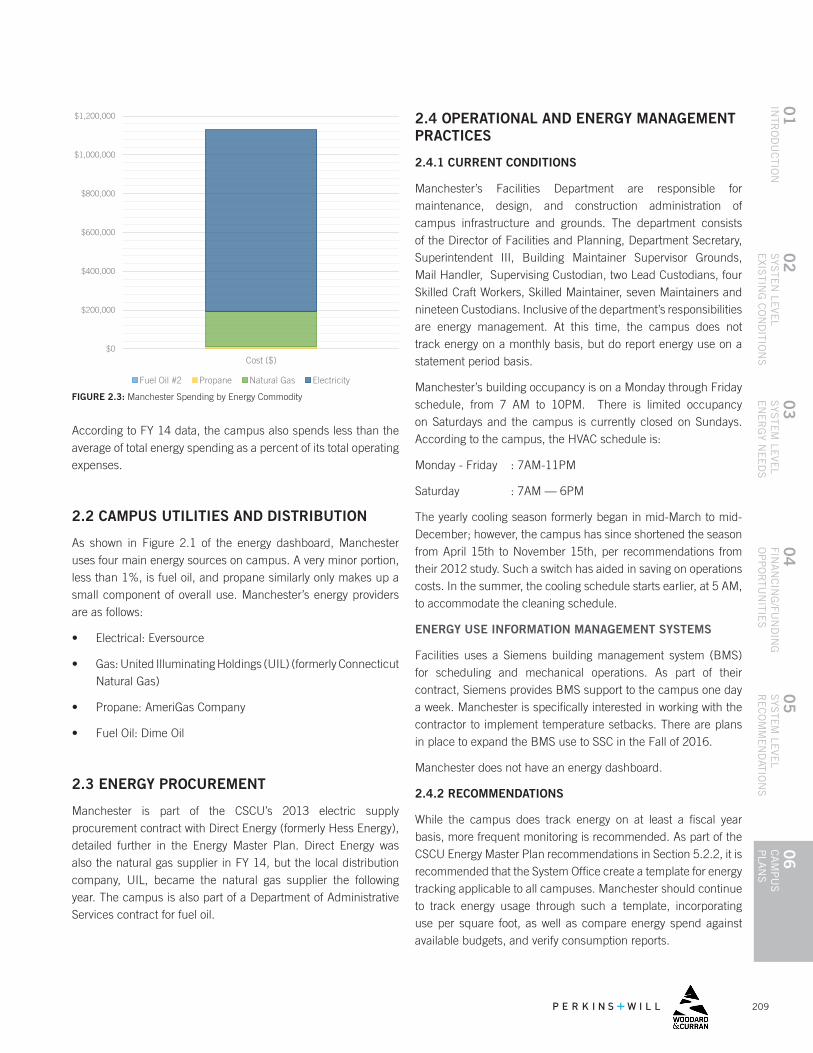
209
04
FINA
NC
ING
/FUN
DIN
G
OP
PO
RTU
NITIE
S
01
INTR
OD
UC
TION
06
CA
MP
US
P
LAN
S
05
SYS
TEM
LEVE
L R
EC
OM
ME
ND
ATION
S
02
SYS
TEN
LEVE
LE
XISTIN
G C
ON
DITIO
NS
03
SYS
TEM
LEVE
L E
NE
RG
Y NE
ED
S
2.4 OPERATIONAL AND ENERGY MANAGEMENT PRACTICES
2.4.1 CURRENT CONDITIONS
Manchester’s Facilities Department are responsible for maintenance, design, and construction administration of campus infrastructure and grounds. The department consists of the Director of Facilities and Planning, Department Secretary, Superintendent III, Building Maintainer Supervisor Grounds, Mail Handler, Supervising Custodian, two Lead Custodians, four Skilled Craft Workers, Skilled Maintainer, seven Maintainers and nineteen Custodians. Inclusive of the department’s responsibilities are energy management. At this time, the campus does not track energy on a monthly basis, but do report energy use on a statement period basis.
Manchester’s building occupancy is on a Monday through Friday schedule, from 7 AM to 10PM. There is limited occupancy on Saturdays and the campus is currently closed on Sundays. According to the campus, the HVAC schedule is:
Monday - Friday : 7AM-11PM
Saturday : 7AM — 6PM
The yearly cooling season formerly began in mid-March to mid-December; however, the campus has since shortened the season from April 15th to November 15th, per recommendations from their 2012 study. Such a switch has aided in saving on operations costs. In the summer, the cooling schedule starts earlier, at 5 AM, to accommodate the cleaning schedule.
ENERGY USE INFORMATION MANAGEMENT SYSTEMS
Facilities uses a Siemens building management system (BMS) for scheduling and mechanical operations. As part of their contract, Siemens provides BMS support to the campus one day a week. Manchester is specifically interested in working with the contractor to implement temperature setbacks. There are plans in place to expand the BMS use to SSC in the Fall of 2016.
Manchester does not have an energy dashboard.
2.4.2 RECOMMENDATIONS
While the campus does track energy on at least a fiscal year basis, more frequent monitoring is recommended. As part of the CSCU Energy Master Plan recommendations in Section 5.2.2, it is recommended that the System Office create a template for energy tracking applicable to all campuses. Manchester should continue to track energy usage through such a template, incorporating use per square foot, as well as compare energy spend against available budgets, and verify consumption reports.
Cost ($)Fuel Oil #2 $1,828Propane $9,659Natural Gas $180,594Electricity $936,212
Fuel Oil #2 Propane Natural Gas ElectricityCost ($) $1,827.70 $9,659.00 $180,594.00 $936,212.00
$0
$200,000
$400,000
$600,000
$800,000
$1,000,000
$1,200,000
Cost ($)
Fuel Oil #2 Propane Natural Gas Electricity
According to FY 14 data, the campus also spends less than the average of total energy spending as a percent of its total operating expenses.
2.2 CAMPUS UTILITIES AND DISTRIBUTION
As shown in Figure 2.1 of the energy dashboard, Manchester uses four main energy sources on campus. A very minor portion, less than 1%, is fuel oil, and propane similarly only makes up a small component of overall use. Manchester’s energy providers are as follows:
• Electrical: Eversource
• Gas: United Illuminating Holdings (UIL) (formerly Connecticut Natural Gas)
• Propane: AmeriGas Company
• Fuel Oil: Dime Oil
2.3 ENERGY PROCUREMENT
Manchester is part of the CSCU’s 2013 electric supply procurement contract with Direct Energy (formerly Hess Energy), detailed further in the Energy Master Plan. Direct Energy was also the natural gas supplier in FY 14, but the local distribution company, UIL, became the natural gas supplier the following year. The campus is also part of a Department of Administrative Services contract for fuel oil.
FIGURE 2.3: Manchester Spending by Energy Commodity
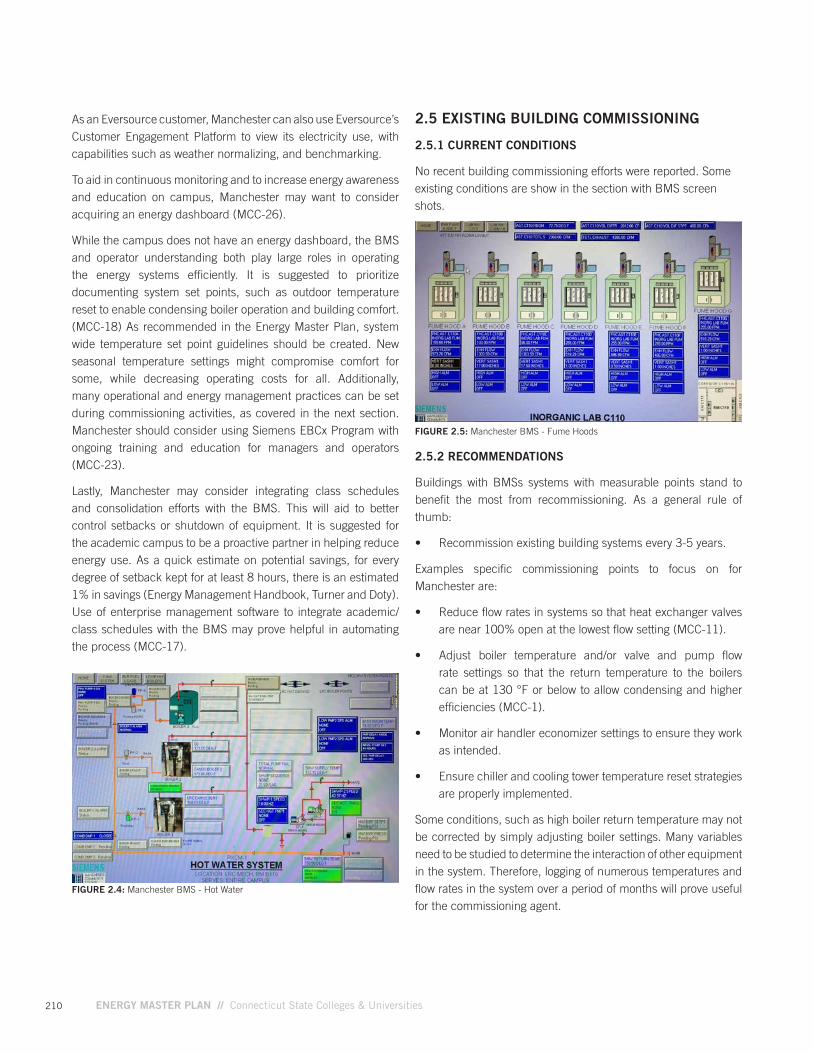
210 ENERGY MASTER PLAN // Connecticut State Colleges & Universities
2.5.2 RECOMMENDATIONS
Buildings with BMSs systems with measurable points stand to benefit the most from recommissioning. As a general rule of thumb:
• Recommission existing building systems every 3-5 years.
Examples specific commissioning points to focus on for Manchester are:
• Reduce flow rates in systems so that heat exchanger valves are near 100% open at the lowest flow setting (MCC-11).
• Adjust boiler temperature and/or valve and pump flow rate settings so that the return temperature to the boilers can be at 130 °F or below to allow condensing and higher efficiencies (MCC-1).
• Monitor air handler economizer settings to ensure they work as intended.
• Ensure chiller and cooling tower temperature reset strategies are properly implemented.
Some conditions, such as high boiler return temperature may not be corrected by simply adjusting boiler settings. Many variables need to be studied to determine the interaction of other equipment in the system. Therefore, logging of numerous temperatures and flow rates in the system over a period of months will prove useful for the commissioning agent.
FIGURE 2.4: Manchester BMS - Hot Water
FIGURE 2.5: Manchester BMS - Fume Hoods
As an Eversource customer, Manchester can also use Eversource’s Customer Engagement Platform to view its electricity use, with capabilities such as weather normalizing, and benchmarking.
To aid in continuous monitoring and to increase energy awareness and education on campus, Manchester may want to consider acquiring an energy dashboard (MCC-26).
While the campus does not have an energy dashboard, the BMS and operator understanding both play large roles in operating the energy systems efficiently. It is suggested to prioritize documenting system set points, such as outdoor temperature reset to enable condensing boiler operation and building comfort. (MCC-18) As recommended in the Energy Master Plan, system wide temperature set point guidelines should be created. New seasonal temperature settings might compromise comfort for some, while decreasing operating costs for all. Additionally, many operational and energy management practices can be set during commissioning activities, as covered in the next section. Manchester should consider using Siemens EBCx Program with ongoing training and education for managers and operators (MCC-23).
Lastly, Manchester may consider integrating class schedules and consolidation efforts with the BMS. This will aid to better control setbacks or shutdown of equipment. It is suggested for the academic campus to be a proactive partner in helping reduce energy use. As a quick estimate on potential savings, for every degree of setback kept for at least 8 hours, there is an estimated 1% in savings (Energy Management Handbook, Turner and Doty). Use of enterprise management software to integrate academic/class schedules with the BMS may prove helpful in automating the process (MCC-17).
2.5 EXISTING BUILDING COMMISSIONING
2.5.1 CURRENT CONDITIONS
No recent building commissioning efforts were reported. Some existing conditions are show in the section with BMS screen shots.
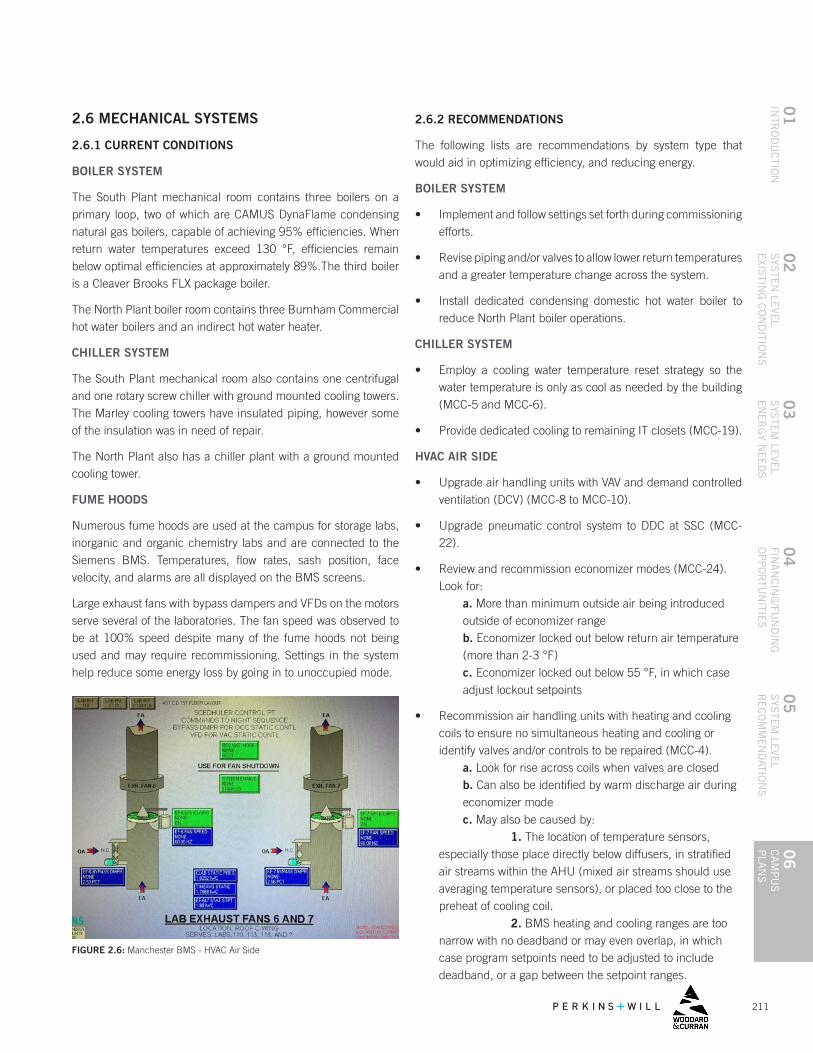
211
04
FINA
NC
ING
/FUN
DIN
G
OP
PO
RTU
NITIE
S
01
INTR
OD
UC
TION
06
CA
MP
US
P
LAN
S
05
SYS
TEM
LEVE
L R
EC
OM
ME
ND
ATION
S
02
SYS
TEN
LEVE
LE
XISTIN
G C
ON
DITIO
NS
03
SYS
TEM
LEVE
L E
NE
RG
Y NE
ED
S
2.6 MECHANICAL SYSTEMS
2.6.1 CURRENT CONDITIONS
BOILER SYSTEM
The South Plant mechanical room contains three boilers on a primary loop, two of which are CAMUS DynaFlame condensing natural gas boilers, capable of achieving 95% efficiencies. When return water temperatures exceed 130 °F, efficiencies remain below optimal efficiencies at approximately 89%.The third boiler is a Cleaver Brooks FLX package boiler.
The North Plant boiler room contains three Burnham Commercial hot water boilers and an indirect hot water heater.
CHILLER SYSTEM
The South Plant mechanical room also contains one centrifugal and one rotary screw chiller with ground mounted cooling towers. The Marley cooling towers have insulated piping, however some of the insulation was in need of repair.
The North Plant also has a chiller plant with a ground mounted cooling tower.
FUME HOODS
Numerous fume hoods are used at the campus for storage labs, inorganic and organic chemistry labs and are connected to the Siemens BMS. Temperatures, flow rates, sash position, face velocity, and alarms are all displayed on the BMS screens.
Large exhaust fans with bypass dampers and VFDs on the motors serve several of the laboratories. The fan speed was observed to be at 100% speed despite many of the fume hoods not being used and may require recommissioning. Settings in the system help reduce some energy loss by going in to unoccupied mode.
FIGURE 2.6: Manchester BMS - HVAC Air Side
2.6.2 RECOMMENDATIONS
The following lists are recommendations by system type that would aid in optimizing efficiency, and reducing energy.
BOILER SYSTEM
• Implement and follow settings set forth during commissioning efforts.
• Revise piping and/or valves to allow lower return temperatures and a greater temperature change across the system.
• Install dedicated condensing domestic hot water boiler to reduce North Plant boiler operations.
CHILLER SYSTEM
• Employ a cooling water temperature reset strategy so the water temperature is only as cool as needed by the building (MCC-5 and MCC-6).
• Provide dedicated cooling to remaining IT closets (MCC-19).
HVAC AIR SIDE
• Upgrade air handling units with VAV and demand controlled ventilation (DCV) (MCC-8 to MCC-10).
• Upgrade pneumatic control system to DDC at SSC (MCC-22).
• Review and recommission economizer modes (MCC-24).Look for: a. More than minimum outside air being introduced outside of economizer range b. Economizer locked out below return air temperature (more than 2-3 °F) c. Economizer locked out below 55 °F, in which case adjust lockout setpoints
• Recommission air handling units with heating and cooling coils to ensure no simultaneous heating and cooling or identify valves and/or controls to be repaired (MCC-4). a. Look for rise across coils when valves are closed b. Can also be identified by warm discharge air during economizer mode c. May also be caused by: 1. The location of temperature sensors, especially those place directly below diffusers, in stratified air streams within the AHU (mixed air streams should use averaging temperature sensors), or placed too close to the preheat of cooling coil. 2. BMS heating and cooling ranges are too narrow with no deadband or may even overlap, in which case program setpoints need to be adjusted to include deadband, or a gap between the setpoint ranges.
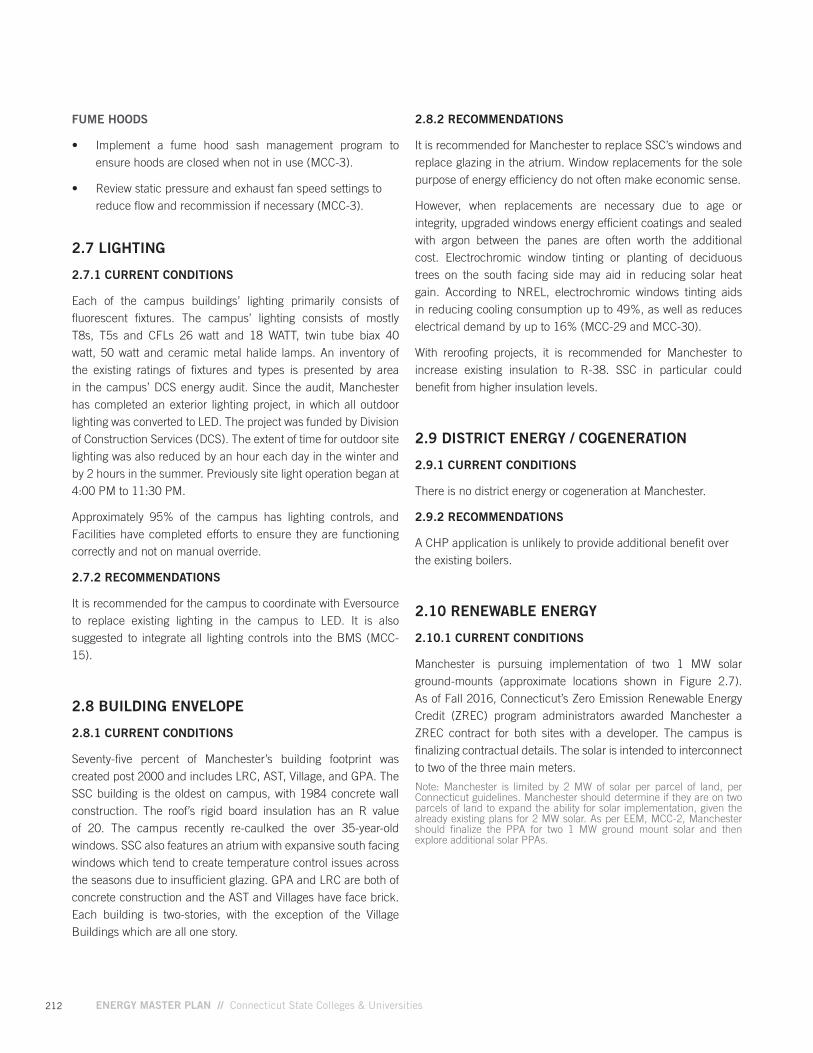
212 ENERGY MASTER PLAN // Connecticut State Colleges & Universities
FUME HOODS
• Implement a fume hood sash management program to ensure hoods are closed when not in use (MCC-3).
• Review static pressure and exhaust fan speed settings to reduce flow and recommission if necessary (MCC-3).
2.7 LIGHTING
2.7.1 CURRENT CONDITIONS
Each of the campus buildings’ lighting primarily consists of fluorescent fixtures. The campus’ lighting consists of mostly T8s, T5s and CFLs 26 watt and 18 WATT, twin tube biax 40 watt, 50 watt and ceramic metal halide lamps. An inventory of the existing ratings of fixtures and types is presented by area in the campus’ DCS energy audit. Since the audit, Manchester has completed an exterior lighting project, in which all outdoor lighting was converted to LED. The project was funded by Division of Construction Services (DCS). The extent of time for outdoor site lighting was also reduced by an hour each day in the winter and by 2 hours in the summer. Previously site light operation began at 4:00 PM to 11:30 PM.
Approximately 95% of the campus has lighting controls, and Facilities have completed efforts to ensure they are functioning correctly and not on manual override.
2.7.2 RECOMMENDATIONS
It is recommended for the campus to coordinate with Eversource to replace existing lighting in the campus to LED. It is also suggested to integrate all lighting controls into the BMS (MCC-15).
2.8 BUILDING ENVELOPE
2.8.1 CURRENT CONDITIONS
Seventy-five percent of Manchester’s building footprint was created post 2000 and includes LRC, AST, Village, and GPA. The SSC building is the oldest on campus, with 1984 concrete wall construction. The roof’s rigid board insulation has an R value of 20. The campus recently re-caulked the over 35-year-old windows. SSC also features an atrium with expansive south facing windows which tend to create temperature control issues across the seasons due to insufficient glazing. GPA and LRC are both of concrete construction and the AST and Villages have face brick. Each building is two-stories, with the exception of the Village Buildings which are all one story.
2.8.2 RECOMMENDATIONS
It is recommended for Manchester to replace SSC’s windows and replace glazing in the atrium. Window replacements for the sole purpose of energy efficiency do not often make economic sense.
However, when replacements are necessary due to age or integrity, upgraded windows energy efficient coatings and sealed with argon between the panes are often worth the additional cost. Electrochromic window tinting or planting of deciduous trees on the south facing side may aid in reducing solar heat gain. According to NREL, electrochromic windows tinting aids in reducing cooling consumption up to 49%, as well as reduces electrical demand by up to 16% (MCC-29 and MCC-30).
With reroofing projects, it is recommended for Manchester to increase existing insulation to R-38. SSC in particular could benefit from higher insulation levels.
2.9 DISTRICT ENERGY / COGENERATION
2.9.1 CURRENT CONDITIONS
There is no district energy or cogeneration at Manchester.
2.9.2 RECOMMENDATIONS
A CHP application is unlikely to provide additional benefit over the existing boilers.
2.10 RENEWABLE ENERGY
2.10.1 CURRENT CONDITIONS
Manchester is pursuing implementation of two 1 MW solar ground-mounts (approximate locations shown in Figure 2.7). As of Fall 2016, Connecticut’s Zero Emission Renewable Energy Credit (ZREC) program administrators awarded Manchester a ZREC contract for both sites with a developer. The campus is finalizing contractual details. The solar is intended to interconnect to two of the three main meters.
Note: Manchester is limited by 2 MW of solar per parcel of land, per Connecticut guidelines. Manchester should determine if they are on two parcels of land to expand the ability for solar implementation, given the already existing plans for 2 MW solar. As per EEM, MCC-2, Manchester should finalize the PPA for two 1 MW ground mount solar and then explore additional solar PPAs.
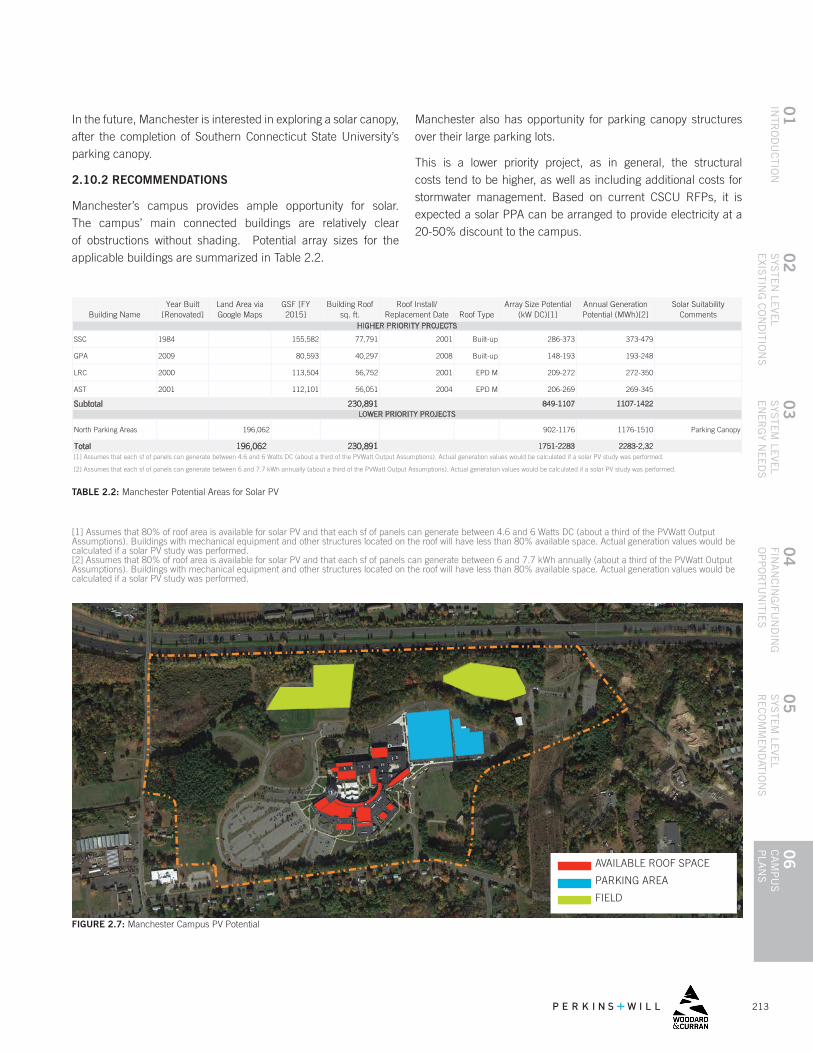
213
04
FINA
NC
ING
/FUN
DIN
G
OP
PO
RTU
NITIE
S
01
INTR
OD
UC
TION
06
CA
MP
US
P
LAN
S
05
SYS
TEM
LEVE
L R
EC
OM
ME
ND
ATION
S
02
SYS
TEN
LEVE
LE
XISTIN
G C
ON
DITIO
NS
03
SYS
TEM
LEVE
L E
NE
RG
Y NE
ED
S
FIELD
PARKING AREA
AVAILABLE ROOF SPACE
Building NameYear Built
[Renovated]Land Area via Google Maps
GSF [FY 2015]
Building Roof sq. ft.
Roof Install/ Replacement Date Roof Type
Array Size Potential (kW DC)[1]
Annual Generation Potential (MWh)[2]
Solar Suitability Comments
SSC 1984 155,582 77,791 2001 Built-up 286-373 373-479
GPA 2009 80,593 40,297 2008 Built-up 148-193 193-248
LRC 2000 113,504 56,752 2001 EPD M 209-272 272-350
AST 2001 112,101 56,051 2004 EPD M 206-269 269-345
Subtotal 230,891 849-1107 1107-1422
North Parking Areas 196,062 902-1176 1176-1510 Parking Canopy
Total 196,062 230,891 1751-2283 2283-2,32
HIGHER PRIORITY PROJECTS
[1] Assumes that each sf of panels can generate between 4.6 and 6 Watts DC (about a third of the PVWatt Output Assumptions). Actual generation values would be calculated if a solar PV study was performed.
[2] Assumes that each sf of panels can generate between 6 and 7.7 kWh annually (about a third of the PVWatt Output Assumptions). Actual generation values would be calculated if a solar PV study was performed.
LOWER PRIORITY PROJECTS
TABLE 2.2: Manchester Potential Areas for Solar PV
FIGURE 2.7: Manchester Campus PV Potential
AVAILABLE ROOF SPACE
PARKING AREA
FIELD
[1] Assumes that 80% of roof area is available for solar PV and that each sf of panels can generate between 4.6 and 6 Watts DC (about a third of the PVWatt Output Assumptions). Buildings with mechanical equipment and other structures located on the roof will have less than 80% available space. Actual generation values would be calculated if a solar PV study was performed. [2] Assumes that 80% of roof area is available for solar PV and that each sf of panels can generate between 6 and 7.7 kWh annually (about a third of the PVWatt Output Assumptions). Buildings with mechanical equipment and other structures located on the roof will have less than 80% available space. Actual generation values would be calculated if a solar PV study was performed.
In the future, Manchester is interested in exploring a solar canopy, after the completion of Southern Connecticut State University’s parking canopy.
2.10.2 RECOMMENDATIONS
Manchester’s campus provides ample opportunity for solar. The campus’ main connected buildings are relatively clear of obstructions without shading. Potential array sizes for the applicable buildings are summarized in Table 2.2.
Manchester also has opportunity for parking canopy structures over their large parking lots.
This is a lower priority project, as in general, the structural costs tend to be higher, as well as including additional costs for stormwater management. Based on current CSCU RFPs, it is expected a solar PPA can be arranged to provide electricity at a 20-50% discount to the campus.
214 ENERGY MASTER PLAN // Connecticut State Colleges & Universities
Manchester should consider solar in future development plans, incorporating solar in the capital planning process (MCC-2).
2.11 CAPITAL PLANNING
2.11.1 CURRENT CONDITIONS
In 2011, Manchester took part in an educational master plan process that included analysis of space needs based on projected campus growth. The Educational and Facilities Master Plan sited campus development projects totaling a potential campus need of an additional 139,400 gross square feet. Projects and initiatives were prioritized based on likeliness to result in job growth and innovative learning opportunities. Primary building priorities identified include:
• Construction of an academic building for Culinary Arts, Allied Health, and general academic needs.
• Expansion of the AST to include a black box theatre, Advanced manufacturing space and additional science classroom space,
• Expansion of library space in the LRC,
• Renovation of SSC,
• Construction of new parking areas and improvement of pedestrian ways, and
• Development of stormwater management solutions to improve water quality as part of the site response.
Between 2004 and 2013, the Facilities Department completed several capital projects. Other improvements the Facilities Department has recently completed are renovations to the Admissions Office, and Culinary Center and relocation of several administrative offices. Completion of capital projects and energy infrastructure improvements is dependent on funding availability.
In the past few years, Manchester has invested in facilities and technology infrastructure using bond funds. In fiscal year 2013, Manchester received bond funds totaling $2.6 million. The bond funds supported academic programs and initiatives through replacement and upgrades of Manchester’s infrastructure, system technology, and new equipment purchases.
The System Office provides annual code compliance and infrastructure funds. Larger capital projects are also funded under CSCU 2020, as of FY 2015. The State Legislature allocates bonds for campus improvement projects. Approximately $16.9 million of Manchester’s funding is provided in appropriations from the State of Connecticut.
More information on current campus expansion projects is found in Section 3.1
2.11.2 RECOMMENDATIONS
In addition to the traditional funding structure, Manchester should consider collaborating with Eversource and UIL for all major building renovations, mechanical, electrical and plumbing equipment upgrades, and all new construction.
2.12 COLLABORATION / PARTNERSHIP
2.12.1 CURRENT CONDITIONS
The System Office Facilities Department is available to provide assistance in budgeting, capital planning and technical support for the community college projects, including Manchester.
2.12.2 RECOMMENDATIONS
It is an opportune time to continue to work with Eversource and UIL to take advantage of Utility Incentives for the EEMs presented in this plan. Incentives structures range, but the utilities have offered incentives of up to 80% of project costs in the past.
In addition to working with outside parties, staff directly related to energy activities are encouraged to work with administration on space use improvements, such as scheduling and consolidating of classrooms.
2.13 SUMMARY OF RECOMMENDED ENERGY
EFFICIENCY OPPORTUNITIES
As a result of the campus walk through energy assessment, and interviews with campus staff, a list of potential Energy Efficiency Measures (EEMs) is presented in Table 2.3. These projects represent both low cost, immediate action measures, as well as projects that may require larger capital and therefore be longer-term.
Note: The Opportunity ID numbers correspond to recommen-dations in the plan. Some EEMs were recommended in a previous energy audit, and are noted as “previously recommended,” and may not have a directly referenceable number in the document.
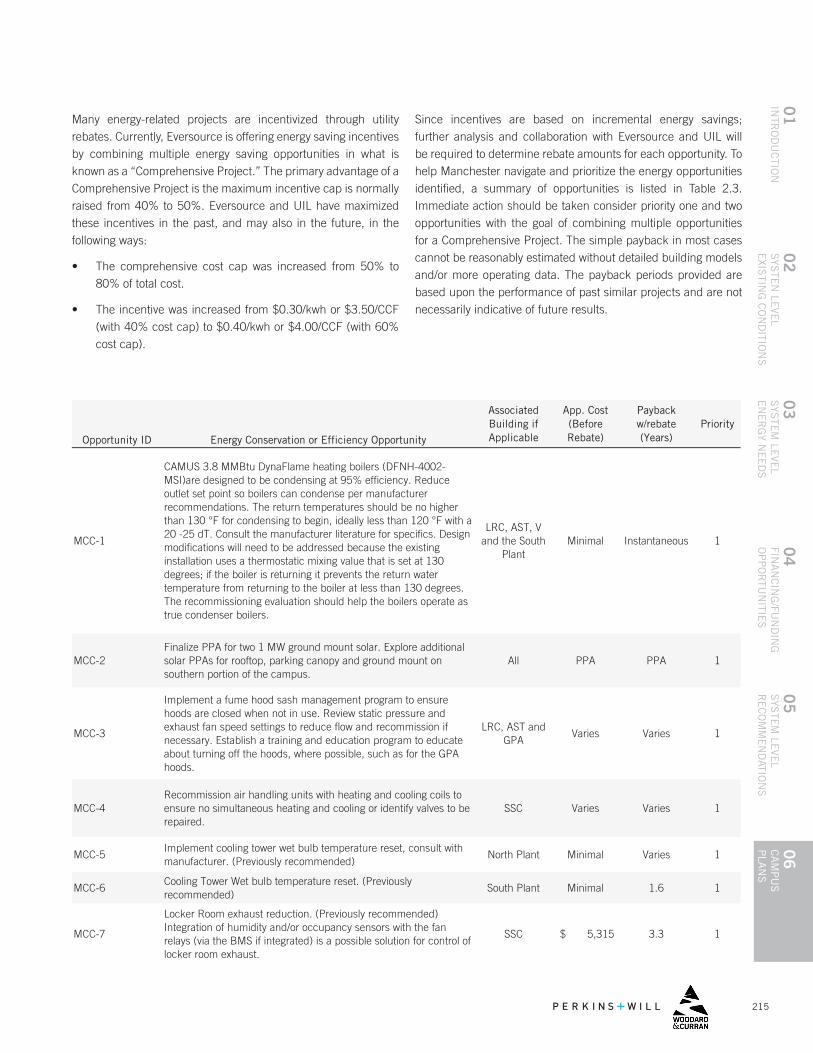
215
04
FINA
NC
ING
/FUN
DIN
G
OP
PO
RTU
NITIE
S
01
INTR
OD
UC
TION
06
CA
MP
US
P
LAN
S
05
SYS
TEM
LEVE
L R
EC
OM
ME
ND
ATION
S
02
SYS
TEN
LEVE
LE
XISTIN
G C
ON
DITIO
NS
03
SYS
TEM
LEVE
L E
NE
RG
Y NE
ED
S
Many energy-related projects are incentivized through utility rebates. Currently, Eversource is offering energy saving incentives by combining multiple energy saving opportunities in what is known as a “Comprehensive Project.” The primary advantage of a Comprehensive Project is the maximum incentive cap is normally raised from 40% to 50%. Eversource and UIL have maximized these incentives in the past, and may also in the future, in the following ways:
• The comprehensive cost cap was increased from 50% to 80% of total cost.
• The incentive was increased from $0.30/kwh or $3.50/CCF (with 40% cost cap) to $0.40/kwh or $4.00/CCF (with 60% cost cap).
Since incentives are based on incremental energy savings; further analysis and collaboration with Eversource and UIL will be required to determine rebate amounts for each opportunity. To help Manchester navigate and prioritize the energy opportunities identified, a summary of opportunities is listed in Table 2.3. Immediate action should be taken consider priority one and two opportunities with the goal of combining multiple opportunities for a Comprehensive Project. The simple payback in most cases cannot be reasonably estimated without detailed building models and/or more operating data. The payback periods provided are based upon the performance of past similar projects and are not necessarily indicative of future results.
Opportunity ID Energy Conservation or Efficiency Opportunity
Associated Building if Applicable
App. Cost (Before Rebate)
Payback w/rebate (Years)
Priority
MCC-1
CAMUS 3.8 MMBtu DynaFlame heating boilers (DFNH-4002-MSI)are designed to be condensing at 95% efficiency. Reduce outlet set point so boilers can condense per manufacturer recommendations. The return temperatures should be no higher than 130 °F for condensing to begin, ideally less than 120 °F with a 20 -25 dT. Consult the manufacturer literature for specifics. Design modifications will need to be addressed because the existing installation uses a thermostatic mixing value that is set at 130 degrees; if the boiler is returning it prevents the return water temperature from returning to the boiler at less than 130 degrees. The recommissioning evaluation should help the boilers operate as true condenser boilers.
LRC, AST, V and the South
PlantMinimal Instantaneous 1
MCC-2Finalize PPA for two 1 MW ground mount solar. Explore additional solar PPAs for rooftop, parking canopy and ground mount on southern portion of the campus.
All PPA PPA 1
MCC-3
Implement a fume hood sash management program to ensure hoods are closed when not in use. Review static pressure and exhaust fan speed settings to reduce flow and recommission if necessary. Establish a training and education program to educate about turning off the hoods, where possible, such as for the GPA hoods.
LRC, AST and GPA
Varies Varies 1
MCC-4Recommission air handling units with heating and cooling coils to ensure no simultaneous heating and cooling or identify valves to be repaired.
SSC Varies Varies 1
MCC-5Implement cooling tower wet bulb temperature reset, consult with manufacturer. (Previously recommended)
North Plant Minimal Varies 1
MCC-6Cooling Tower Wet bulb temperature reset. (Previously recommended)
South Plant Minimal 1.6 1
MCC-7
Locker Room exhaust reduction. (Previously recommended) Integration of humidity and/or occupancy sensors with the fan relays (via the BMS if integrated) is a possible solution for control of locker room exhaust.
SSC $ 5,315 3.3 1
MCC-8
Gymnasium VAV & DCV- The gymnasium unit at GPA (AHU-5) delivers a fixed amount of outdoor air. Demand controlled ventilation (DCV) would allow the amount of fresh air to be modulated and reduced during periods when the space is not a fully occupied, resulting in heating savings in winter and cooling savings in summer. This unit is considered a good candidate for DCV since it serves a large area and only one CO2 sensor would be needed to monitor the ventilation levels. Implementing this measure involves placing CO2 sensors in the gymnasium and using the AHU controls to modulate outdoor air dampers in the rooftop units. This measure will most likely result in reduced humidity levels in the gym. The existing fan VFDs could be programmed to modulate according to space temperature deviation from set point. (Previously recommended)
GPA Varies 1.4 1
MCC-9
Auditorium DCV- Demand controlled ventilation (DCV) would allow the amount of fresh air to be modulated and reduced during periods when the space is not a fully occupied, resulting in heating savings in winter and cooling savings in summer. (Previously recommended)
AST Varies 4 1
MCC-10Demand Control Ventilation in the Library (Previously recommended)
LRC 10600 1 1
MCC-11Reduce system flow rates to achieve a dT of 20 -25 °F. Adjustment of heating coil valves may be necessary so they are completely open at low flow conditions.
LRC, AST, V, SSC and GPA
Minimal Varies 1
MCC-12
Filter Pressure Drop Reduction- This measure shows energy reduction through reducing air handling units fan break horse power by removing MERV-13 filters, and hence reducing pressure drop across the supply fan. (Previously recommended) [1]
LRC, AST and V Minimal Instantaneous 1
MCC-13
Filter Pressure Drop Reduction- This measure shows energy reduction through reducing air handling units fan break horse power by removing MERV-13 filters, and hence reducing pressure drop across the supply fan. (Previously recommended) [1]
SSC and GPA Minimal Instantaneous 1
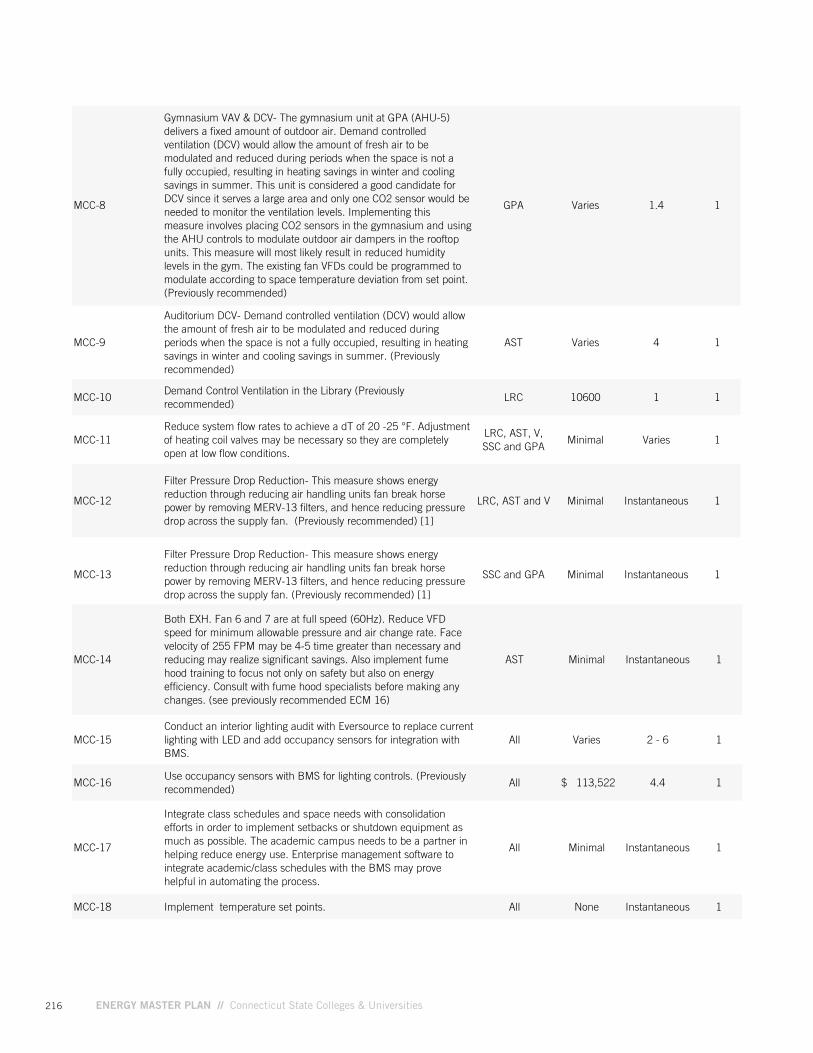
216 ENERGY MASTER PLAN // Connecticut State Colleges & Universities
Opportunity ID Energy Conservation or Efficiency Opportunity
Associated Building if Applicable
App. Cost (Before Rebate)
Payback w/rebate (Years)
Priority
MCC-1
CAMUS 3.8 MMBtu DynaFlame heating boilers (DFNH-4002-MSI)are designed to be condensing at 95% efficiency. Reduce outlet set point so boilers can condense per manufacturer recommendations. The return temperatures should be no higher than 130 °F for condensing to begin, ideally less than 120 °F with a 20 -25 dT. Consult the manufacturer literature for specifics. Design modifications will need to be addressed because the existing installation uses a thermostatic mixing value that is set at 130 degrees; if the boiler is returning it prevents the return water temperature from returning to the boiler at less than 130 degrees. The recommissioning evaluation should help the boilers operate as true condenser boilers.
LRC, AST, V and the South
PlantMinimal Instantaneous 1
MCC-2Finalize PPA for two 1 MW ground mount solar. Explore additional solar PPAs for rooftop, parking canopy and ground mount on southern portion of the campus.
All PPA PPA 1
MCC-3
Implement a fume hood sash management program to ensure hoods are closed when not in use. Review static pressure and exhaust fan speed settings to reduce flow and recommission if necessary. Establish a training and education program to educate about turning off the hoods, where possible, such as for the GPA hoods.
LRC, AST and GPA
Varies Varies 1
MCC-4Recommission air handling units with heating and cooling coils to ensure no simultaneous heating and cooling or identify valves to be repaired.
SSC Varies Varies 1
MCC-5Implement cooling tower wet bulb temperature reset, consult with manufacturer. (Previously recommended)
North Plant Minimal Varies 1
MCC-6Cooling Tower Wet bulb temperature reset. (Previously recommended)
South Plant Minimal 1.6 1
MCC-7
Locker Room exhaust reduction. (Previously recommended) Integration of humidity and/or occupancy sensors with the fan relays (via the BMS if integrated) is a possible solution for control of locker room exhaust.
SSC $ 5,315 3.3 1
MCC-8
Gymnasium VAV & DCV- The gymnasium unit at GPA (AHU-5) delivers a fixed amount of outdoor air. Demand controlled ventilation (DCV) would allow the amount of fresh air to be modulated and reduced during periods when the space is not a fully occupied, resulting in heating savings in winter and cooling savings in summer. This unit is considered a good candidate for DCV since it serves a large area and only one CO2 sensor would be needed to monitor the ventilation levels. Implementing this measure involves placing CO2 sensors in the gymnasium and using the AHU controls to modulate outdoor air dampers in the rooftop units. This measure will most likely result in reduced humidity levels in the gym. The existing fan VFDs could be programmed to modulate according to space temperature deviation from set point. (Previously recommended)
GPA Varies 1.4 1
MCC-9
Auditorium DCV- Demand controlled ventilation (DCV) would allow the amount of fresh air to be modulated and reduced during periods when the space is not a fully occupied, resulting in heating savings in winter and cooling savings in summer. (Previously recommended)
AST Varies 4 1
MCC-10Demand Control Ventilation in the Library (Previously recommended)
LRC 10600 1 1
MCC-11Reduce system flow rates to achieve a dT of 20 -25 °F. Adjustment of heating coil valves may be necessary so they are completely open at low flow conditions.
LRC, AST, V, SSC and GPA
Minimal Varies 1
MCC-12
Filter Pressure Drop Reduction- This measure shows energy reduction through reducing air handling units fan break horse power by removing MERV-13 filters, and hence reducing pressure drop across the supply fan. (Previously recommended) [1]
LRC, AST and V Minimal Instantaneous 1
MCC-13
Filter Pressure Drop Reduction- This measure shows energy reduction through reducing air handling units fan break horse power by removing MERV-13 filters, and hence reducing pressure drop across the supply fan. (Previously recommended) [1]
SSC and GPA Minimal Instantaneous 1
MCC-14
Both EXH. Fan 6 and 7 are at full speed (60Hz). Reduce VFD speed for minimum allowable pressure and air change rate. Face velocity of 255 FPM may be 4-5 time greater than necessary and reducing may realize significant savings. Also implement fume hood training to focus not only on safety but also on energy efficiency. Consult with fume hood specialists before making any changes. (see previously recommended ECM 16)
AST Minimal Instantaneous 1
MCC-15Conduct an interior lighting audit with Eversource to replace current lighting with LED and add occupancy sensors for integration with BMS.
All Varies 2 - 6 1
MCC-16Use occupancy sensors with BMS for lighting controls. (Previously recommended)
All $ 113,522 4.4 1
MCC-17
Integrate class schedules and space needs with consolidation efforts in order to implement setbacks or shutdown equipment as much as possible. The academic campus needs to be a partner in helping reduce energy use. Enterprise management software to integrate academic/class schedules with the BMS may prove helpful in automating the process.
All Minimal Instantaneous 1
MCC-18 Implement temperature set points. All None Instantaneous 1
MCC-19Provide dedicated cooling to the IT closets so operators can adjust the building cooling needs during unoccupied times. Plan to meet cooling needs for future technology expansions.
All buildings except for the main server room in SSC
and all rooms in GPA.
Varies Varies 1
MCC-20
Fitness Center VAV & DCV (demand controlled ventilation): fitness center unit at Lowe (RTU-5). Since this system serves multiple zones, a few CO2 sensors will be required, resulting in an increase in capital investment, but should provide similar savings. This measure will most likely result in reduced humidity levels in the fitness center. (Previously recommended)
SSC 31,890 5.9 2
MCC-21Minimize outside makeup air to maintain required air quality using VAV setpoints. (Previously recommended)
All 425,200 8.2 2
MCC-22 Convert old pneumatic control system to DDC. SSC$2.50 - $5
/sq.ft.Varies 2
MCC-23In addition to weekly service contract, consider using Siemens EBCx Program with ongoing training and education for managers and operators.
LRC, AST, V, SSC and GPA
Varies Varies 2
MCC-24
EBCx, Economizer Low Limit- According to building operators economizer controls are needed to prevent overheating in the building when the outside air temperatures are as low as 10°F as opposed to approximately 40°F normally seen in similar buildings. This measure shows the savings of the controls, etc. that would allow the building to operate economizer at the more typical low point (40°F). The programming of the existing AHUs as well as the VAV programming will have to be optimized to reduce cooling loads at low outside air temperatures. (Previously recommended)
All Minimal Varies 2
MCC-25
Variable Flow Kitchen Exhaust -The kitchen hoods are constant flow when they are on and require constant conditioned make up air. It is possible to install a system that measures exhaust temperature and senses exhaust smoke. The system will reduce exhaust flow when the temperatures are low and smoke is not sensed. (Previously recommended) Alternatively, explore integrating on/off fume hood controls with cooking equipment controls.
SSC, GPA Varies Varies 3
MCC-26Integrate an Energy Dashboard into the BMS to increase energy use awareness and foster a culture of energy efficiency.
All Varies Varies 3
MCC-27In the culinary labs and food service area, convert kitchen Propane to Natural Gas. (Previously recommended)
SSC Varies Varies 3
MCC-28
HW Plant Schedule Reduction- Currently the hot water plants stays on year around to take care of the heating and reheat requirements of the building. This measure shows energy reduction by plant shut off during the summer (June — August) months. A small boiler may be necessary to install to handle potential summer time lab reheat loads. (Previously recommended)
South Plant for LRC and AST
Minimal 9.7 3
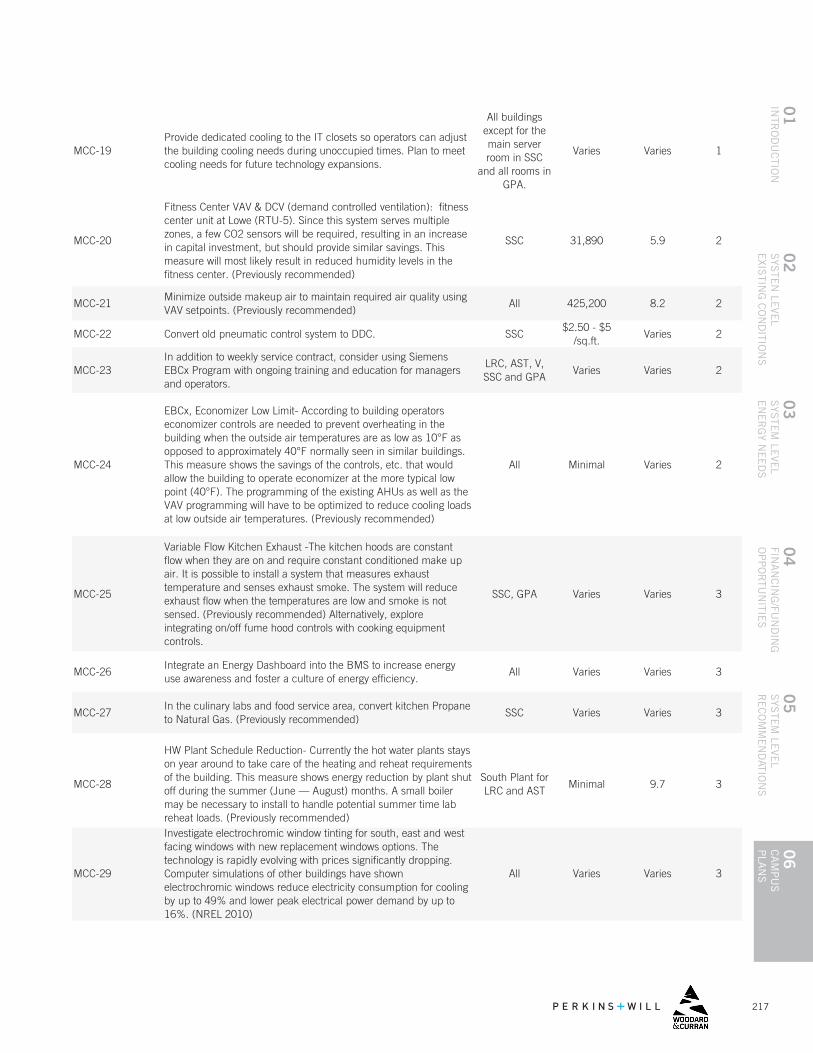
217
04
FINA
NC
ING
/FUN
DIN
G
OP
PO
RTU
NITIE
S
01
INTR
OD
UC
TION
06
CA
MP
US
P
LAN
S
05
SYS
TEM
LEVE
L R
EC
OM
ME
ND
ATION
S
02
SYS
TEN
LEVE
LE
XISTIN
G C
ON
DITIO
NS
03
SYS
TEM
LEVE
L E
NE
RG
Y NE
ED
S
MCC-14
Both EXH. Fan 6 and 7 are at full speed (60Hz). Reduce VFD speed for minimum allowable pressure and air change rate. Face velocity of 255 FPM may be 4-5 time greater than necessary and reducing may realize significant savings. Also implement fume hood training to focus not only on safety but also on energy efficiency. Consult with fume hood specialists before making any changes. (see previously recommended ECM 16)
AST Minimal Instantaneous 1
MCC-15Conduct an interior lighting audit with Eversource to replace current lighting with LED and add occupancy sensors for integration with BMS.
All Varies 2 - 6 1
MCC-16Use occupancy sensors with BMS for lighting controls. (Previously recommended)
All $ 113,522 4.4 1
MCC-17
Integrate class schedules and space needs with consolidation efforts in order to implement setbacks or shutdown equipment as much as possible. The academic campus needs to be a partner in helping reduce energy use. Enterprise management software to integrate academic/class schedules with the BMS may prove helpful in automating the process.
All Minimal Instantaneous 1
MCC-18 Implement temperature set points. All None Instantaneous 1
MCC-19Provide dedicated cooling to the IT closets so operators can adjust the building cooling needs during unoccupied times. Plan to meet cooling needs for future technology expansions.
All buildings except for the main server room in SSC
and all rooms in GPA.
Varies Varies 1
MCC-20
Fitness Center VAV & DCV (demand controlled ventilation): fitness center unit at Lowe (RTU-5). Since this system serves multiple zones, a few CO2 sensors will be required, resulting in an increase in capital investment, but should provide similar savings. This measure will most likely result in reduced humidity levels in the fitness center. (Previously recommended)
SSC 31,890 5.9 2
MCC-21Minimize outside makeup air to maintain required air quality using VAV setpoints. (Previously recommended)
All 425,200 8.2 2
MCC-22 Convert old pneumatic control system to DDC. SSC$2.50 - $5
/sq.ft.Varies 2
MCC-23In addition to weekly service contract, consider using Siemens EBCx Program with ongoing training and education for managers and operators.
LRC, AST, V, SSC and GPA
Varies Varies 2
MCC-24
EBCx, Economizer Low Limit- According to building operators economizer controls are needed to prevent overheating in the building when the outside air temperatures are as low as 10°F as opposed to approximately 40°F normally seen in similar buildings. This measure shows the savings of the controls, etc. that would allow the building to operate economizer at the more typical low point (40°F). The programming of the existing AHUs as well as the VAV programming will have to be optimized to reduce cooling loads at low outside air temperatures. (Previously recommended)
All Minimal Varies 2
MCC-25
Variable Flow Kitchen Exhaust -The kitchen hoods are constant flow when they are on and require constant conditioned make up air. It is possible to install a system that measures exhaust temperature and senses exhaust smoke. The system will reduce exhaust flow when the temperatures are low and smoke is not sensed. (Previously recommended) Alternatively, explore integrating on/off fume hood controls with cooking equipment controls.
SSC, GPA Varies Varies 3
MCC-26Integrate an Energy Dashboard into the BMS to increase energy use awareness and foster a culture of energy efficiency.
All Varies Varies 3
MCC-27In the culinary labs and food service area, convert kitchen Propane to Natural Gas. (Previously recommended)
SSC Varies Varies 3
MCC-28
HW Plant Schedule Reduction- Currently the hot water plants stays on year around to take care of the heating and reheat requirements of the building. This measure shows energy reduction by plant shut off during the summer (June — August) months. A small boiler may be necessary to install to handle potential summer time lab reheat loads. (Previously recommended)
South Plant for LRC and AST
Minimal 9.7 3
MCC-29
Investigate electrochromic window tinting for south, east and west facing windows with new replacement windows options. The technology is rapidly evolving with prices significantly dropping. Computer simulations of other buildings have shown electrochromic windows reduce electricity consumption for cooling by up to 49% and lower peak electrical power demand by up to 16%. (NREL 2010)
All Varies Varies 3
MCC-30
Replace glazing for windows. Energy efficient window upgrades or replacements are usually not economical for the sake of just energy savings. When windows require replacement due to age or integrity, opt for high efficiency glazings specific to northeast climates.
SSC Varies Varies 3
MCC-31
DHW Heater Replacement & HW Plant Schedule Reduction- The hot water plant can be shut off during the summer (June — August) if a domestic hot water heater is installed to handle the hot water requirements in the building during the summer months. This measure includes the installation of a high efficiency (92%) domestic hot water heater. (Previously recommended)
North Plant Varies 6.2 3
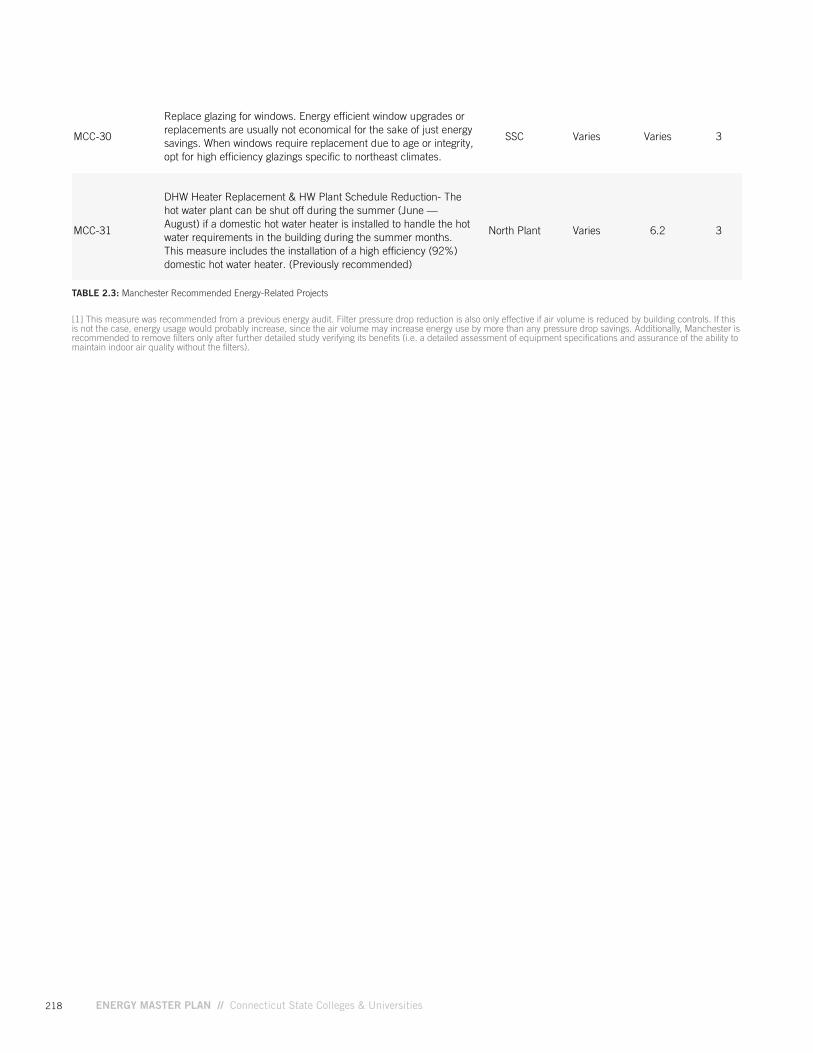
218 ENERGY MASTER PLAN // Connecticut State Colleges & Universities
TABLE 2.3: Manchester Recommended Energy-Related Projects
[1] This measure was recommended from a previous energy audit. Filter pressure drop reduction is also only effective if air volume is reduced by building controls. If this is not the case, energy usage would probably increase, since the air volume may increase energy use by more than any pressure drop savings. Additionally, Manchester is recommended to remove filters only after further detailed study verifying its benefits (i.e. a detailed assessment of equipment specifications and assurance of the ability to maintain indoor air quality without the filters).
MCC-29
Investigate electrochromic window tinting for south, east and west facing windows with new replacement windows options. The technology is rapidly evolving with prices significantly dropping. Computer simulations of other buildings have shown electrochromic windows reduce electricity consumption for cooling by up to 49% and lower peak electrical power demand by up to 16%. (NREL 2010)
All Varies Varies 3
MCC-30
Replace glazing for windows. Energy efficient window upgrades or replacements are usually not economical for the sake of just energy savings. When windows require replacement due to age or integrity, opt for high efficiency glazings specific to northeast climates.
SSC Varies Varies 3
MCC-31
DHW Heater Replacement & HW Plant Schedule Reduction- The hot water plant can be shut off during the summer (June — August) if a domestic hot water heater is installed to handle the hot water requirements in the building during the summer months. This measure includes the installation of a high efficiency (92%) domestic hot water heater. (Previously recommended)
North Plant Varies 6.2 3
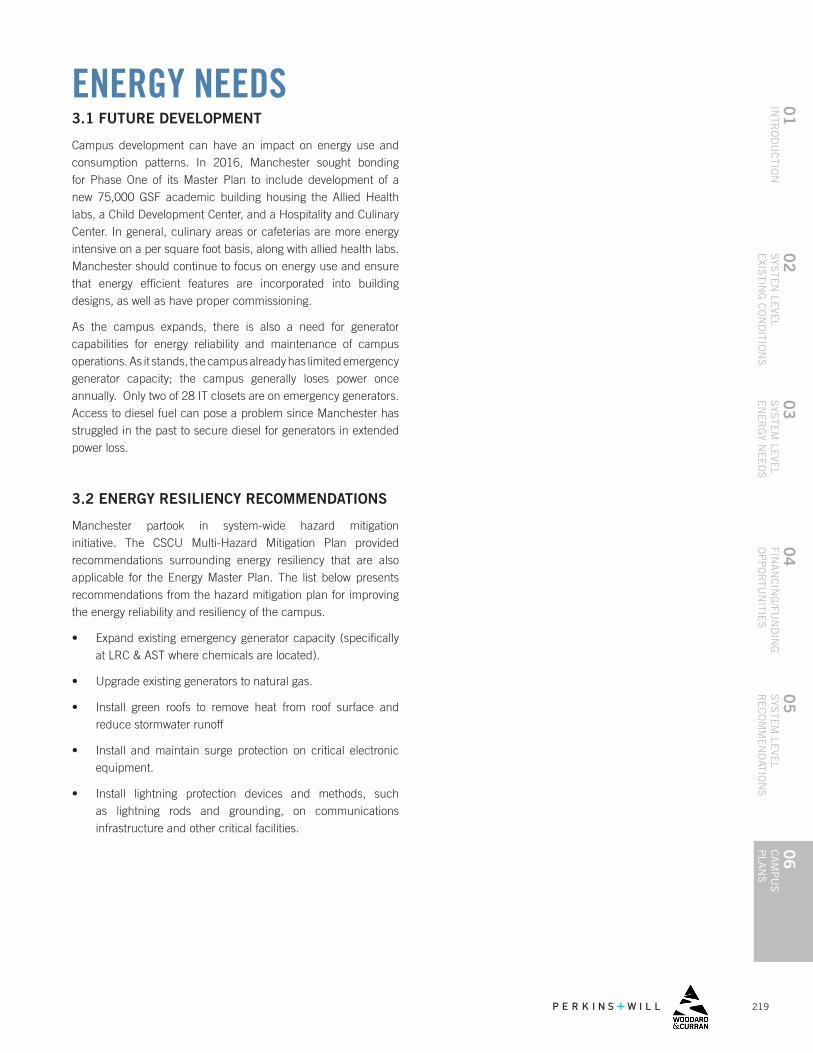
219
04
FINA
NC
ING
/FUN
DIN
G
OP
PO
RTU
NITIE
S
01
INTR
OD
UC
TION
06
CA
MP
US
P
LAN
S
05
SYS
TEM
LEVE
L R
EC
OM
ME
ND
ATION
S
02
SYS
TEN
LEVE
LE
XISTIN
G C
ON
DITIO
NS
03
SYS
TEM
LEVE
L E
NE
RG
Y NE
ED
S
3.1 FUTURE DEVELOPMENT
Campus development can have an impact on energy use and consumption patterns. In 2016, Manchester sought bonding for Phase One of its Master Plan to include development of a new 75,000 GSF academic building housing the Allied Health labs, a Child Development Center, and a Hospitality and Culinary Center. In general, culinary areas or cafeterias are more energy intensive on a per square foot basis, along with allied health labs. Manchester should continue to focus on energy use and ensure that energy efficient features are incorporated into building designs, as well as have proper commissioning.
As the campus expands, there is also a need for generator capabilities for energy reliability and maintenance of campus operations. As it stands, the campus already has limited emergency generator capacity; the campus generally loses power once annually. Only two of 28 IT closets are on emergency generators. Access to diesel fuel can pose a problem since Manchester has struggled in the past to secure diesel for generators in extended power loss.
3.2 ENERGY RESILIENCY RECOMMENDATIONS
Manchester partook in system-wide hazard mitigation initiative. The CSCU Multi-Hazard Mitigation Plan provided recommendations surrounding energy resiliency that are also applicable for the Energy Master Plan. The list below presents recommendations from the hazard mitigation plan for improving the energy reliability and resiliency of the campus.
• Expand existing emergency generator capacity (specifically at LRC & AST where chemicals are located).
• Upgrade existing generators to natural gas.
• Install green roofs to remove heat from roof surface and reduce stormwater runoff
• Install and maintain surge protection on critical electronic equipment.
• Install lightning protection devices and methods, such as lightning rods and grounding, on communications infrastructure and other critical facilities.
ENERGY NEEDS
220 ENERGY MASTER PLAN // Connecticut State Colleges & Universities
CONCLUSION / NEXT STEPSManchester has continued to focus on improving its existing energy conditions. The utility data received indicates Manchester is a medium performing campus, with a potential decrease in EUI in the coming years from the addition of solar. The campus has done a successful job in completing numerous energy management projects, including improving and reducing scheduling times for site lighting and HVAC equipment.
Areas for improvement relate to mechanical systems. More easily implemented energy saving opportunities include LED lighting upgrades. Other top priority initiatives include:
• Management: Manchester should continue to optimize its BMS and expand the campus energy tracking capabilities through an EMS or a dashboard.
• Renewable Energy: Explore additional PPAs for ground mount array, rooftop solar and a parking canopy, not to exceed Connecticut’s 2 MW cap of solar capacity per parcel of land. Explore if Manchester is on more than one parcel of land to expand solar opportunities.
• Utility Incentives/ Develop Plan for EEMs: Manchester should maximize incentive funding for EEMs by working with its utility companies, and combining multiple energy saving opportunities in what is known as a “Comprehensive Project.” Further analysis and collaboration with Eversource is required to determine rebate amounts for each opportunity
A summary of further projects and priorities for the campus are listed in Table 2.3. Manchester has numerous additional opportunities to reduce energy consumption and costs in the years to come.
4.1 CONTACT INFORMATION FOR KEY STAKEHOLDERS
Collecting all the necessary information for this planning effort required a collaborative effort. Below are the stakeholders that were active in providing their expertise about campus current conditions and future needs, and energy related decisions
MANCHESTER COMMUNITY COLLEGE
DARLENE MANCINI-BROWN Director of Facilities Management & Planning [email protected] 860-512-3660 EVERSOURCE
JAMES WILLIAMSON Energy Efficiency Consultant [email protected] 860-665-2283
221
04
FINA
NC
ING
/FUN
DIN
G
OP
PO
RTU
NITIE
S
01
INTR
OD
UC
TION
06
CA
MP
US
P
LAN
S
05
SYS
TEM
LEVE
L R
EC
OM
ME
ND
ATION
S
02
SYS
TEN
LEVE
LE
XISTIN
G C
ON
DITIO
NS
03
SYS
TEM
LEVE
L E
NE
RG
Y NE
ED
S
APPENDIX A: MANCHESTER DATA METHODOLOGY, ASSUMPTIONS AND NOTESThe following are the data methodology and assumptions that were used when analyzing and benchmarking data for Manchester:
All three fiscal years have complete consumption data. No information to indicate that the campus uses purchased chilled water or steam.
Electricity: Campus Energy Use Reports (FY13,14,15)
• As part of the EUI methodology, only building related energy is accounted for and does not including parking lot lighting, leased spaces or parking garages. Electrical consumption data for the East Lot was excluded from the EUI calculations. It is unknown if the other parking lots on campus had unique accounts or if their consumptions are contained within the other building accounts. If the latter is true, some of the parking lot lighting still contributes to the campus EUI. While parking lot lighting was not included in overall the EUI, the cost for lighting is included in campus total costs.
• The account labeled “temporary service” was assigned to the Maintenance Building and the account labeled “seasonal inspection” was assigned to the Band Shell.
Natural Gas: Campus Energy Use Reports (FY13,14,15)
• Natural gas consumption values were reported in units of ccf even though they were labeled as cf.
Propane: Campus Energy Use Reports (FY13,14,15)
Diesel: Campus Energy Use Reports (FY13,14,15)

222 ENERGY MASTER PLAN // Connecticut State Colleges & Universities
6.6
// 223
04
FINA
NC
ING
/FUN
DIN
G
OP
PO
RTU
NITIE
S
01
INTR
OD
UC
TION
06
CA
MP
US
P
LAN
S
05
SYS
TEM
LEVE
L R
EC
OM
ME
ND
ATION
S
02
SYS
TEN
LEVE
LE
XISTIN
G C
ON
DITIO
NS
03
SYS
TEM
LEVE
L E
NE
RG
Y NE
ED
S
6.6MIDDLESEX
COMMUNITY COLLEGE

224 ENERGY MASTER PLAN // Connecticut State Colleges & Universities
TABLE OF CONTENTSEXECUTIVE SUMMARY 226
1. INTRODUCTION 230
1.1 MIDDLESEX OVERVIEW
1.2 PREVIOUS ENERGY STUDIES & PROJECTS
2. EXISTING CONDITIONS AND RECOMMENDATIONS 232
2.1 FACILITY ENERGY BENCHMARKING AND ENERGY CONSUMPTION
2.2 CAMPUS UTILITIES AND DISTRIBUTION
2.3 ENERGY PROCUREMENT
2.4 OPERATIONAL AND ENERGY MANAGEMENT PRACTICES 2.4.1 CURRENT CONDITIONS 2.4.2 RECOMMENDATIONS 2.5 EXISTING BUILDING COMMISSIONING 2.5.1 CURRENT CONDITIONS 2.5.2 RECOMMENDATIONS
2.6 MECHANICAL SYSTEMS 2.6.1 CURRENT CONDITIONS 2.6.2 RECOMMENDATIONS
2.7 LIGHTING 2.7.1 CURRENT CONDITIONS 2.7.2 RECOMMENDATIONS
2.8 BUILDING ENVELOPE 2.8.1 CURRENT CONDITIONS 2.8.2 RECOMMENDATIONS
2.9 DISTRICT ENERGY / COGENERATION 2.9.1 CURRENT CONDITIONS 2.9.2 RECOMMENDATIONS
2.10 RENEWABLE ENERGY 2.10.1 CURRENT CONDITIONS 2.10.2 RECOMMENDATIONS
2.11 CAPITAL PLANNING 2.11.1 CURRENT CONDITIONS 2.11.2 RECOMMENDATIONS
2.12 COLLABORATION / PARTNERSHIP 2.12.1 CURRENT CONDITIONS 2.12.2 RECOMMENDATIONS
2.13 SUMMARY OF RECOMMENDED ENERGY EFFICIENCY OPPORTUNITIES
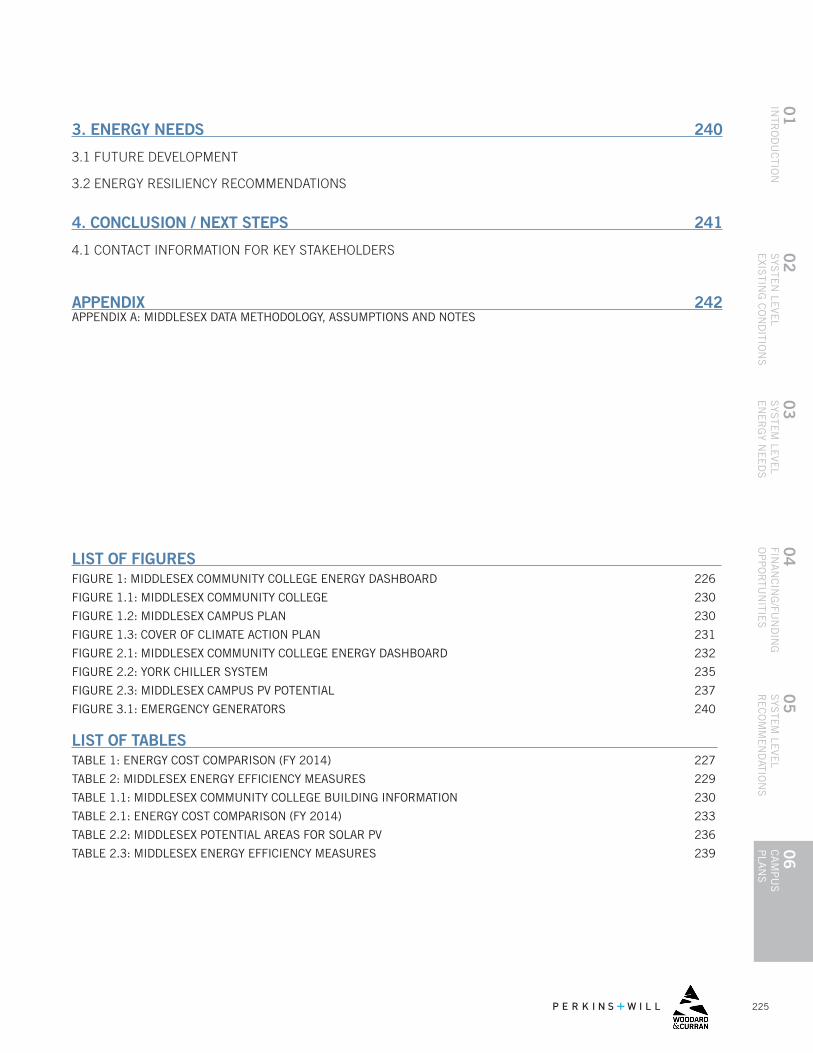
225
04
FINA
NC
ING
/FUN
DIN
G
OP
PO
RTU
NITIE
S
01
INTR
OD
UC
TION
06
CA
MP
US
P
LAN
S
05
SYS
TEM
LEVE
L R
EC
OM
ME
ND
ATION
S
02
SYS
TEN
LEVE
LE
XISTIN
G C
ON
DITIO
NS
03
SYS
TEM
LEVE
L E
NE
RG
Y NE
ED
S
3. ENERGY NEEDS 240
3.1 FUTURE DEVELOPMENT
3.2 ENERGY RESILIENCY RECOMMENDATIONS
4. CONCLUSION / NEXT STEPS 241
4.1 CONTACT INFORMATION FOR KEY STAKEHOLDERS
APPENDIX 242APPENDIX A: MIDDLESEX DATA METHODOLOGY, ASSUMPTIONS AND NOTES
LIST OF FIGURES FIGURE 1: MIDDLESEX COMMUNITY COLLEGE ENERGY DASHBOARD 226
FIGURE 1.1: MIDDLESEX COMMUNITY COLLEGE 230
FIGURE 1.2: MIDDLESEX CAMPUS PLAN 230
FIGURE 1.3: COVER OF CLIMATE ACTION PLAN 231
FIGURE 2.1: MIDDLESEX COMMUNITY COLLEGE ENERGY DASHBOARD 232
FIGURE 2.2: YORK CHILLER SYSTEM 235
FIGURE 2.3: MIDDLESEX CAMPUS PV POTENTIAL 237
FIGURE 3.1: EMERGENCY GENERATORS 240
LIST OF TABLES TABLE 1: ENERGY COST COMPARISON (FY 2014) 227
TABLE 2: MIDDLESEX ENERGY EFFICIENCY MEASURES 229
TABLE 1.1: MIDDLESEX COMMUNITY COLLEGE BUILDING INFORMATION 230
TABLE 2.1: ENERGY COST COMPARISON (FY 2014) 233
TABLE 2.2: MIDDLESEX POTENTIAL AREAS FOR SOLAR PV 236
TABLE 2.3: MIDDLESEX ENERGY EFFICIENCY MEASURES 239
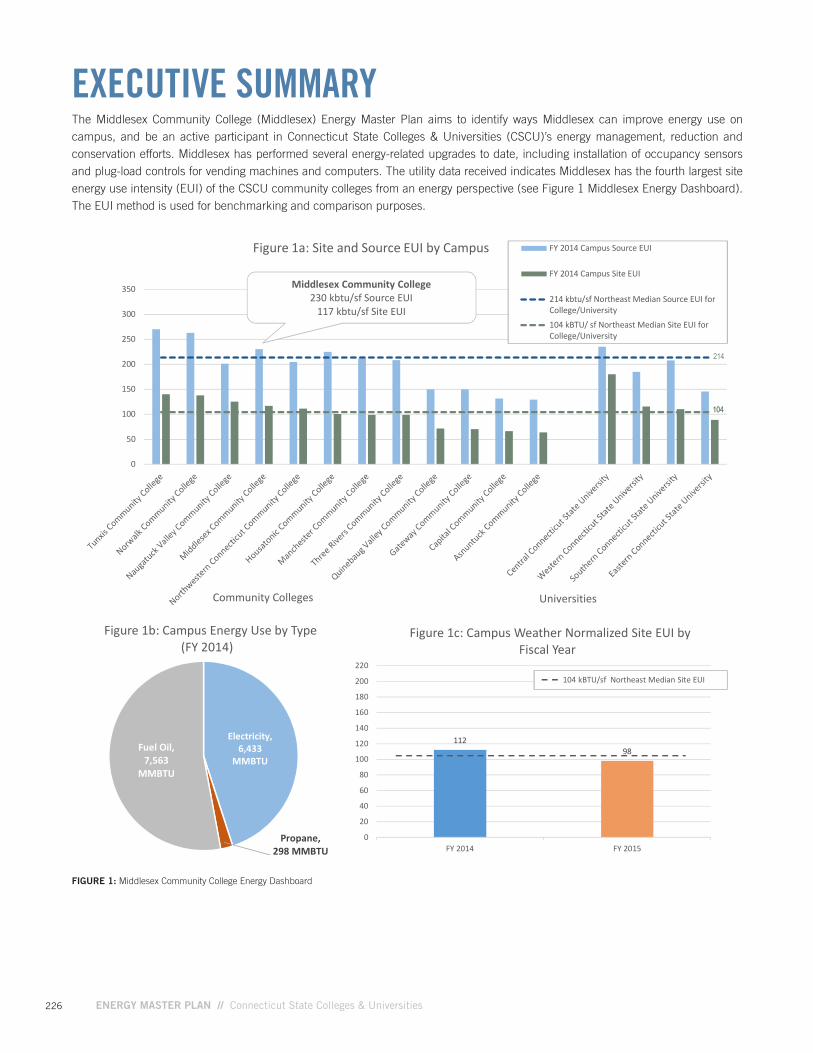
226 ENERGY MASTER PLAN // Connecticut State Colleges & Universities
EXECUTIVE SUMMARYThe Middlesex Community College (Middlesex) Energy Master Plan aims to identify ways Middlesex can improve energy use on campus, and be an active participant in Connecticut State Colleges & Universities (CSCU)’s energy management, reduction and conservation efforts. Middlesex has performed several energy-related upgrades to date, including installation of occupancy sensors and plug-load controls for vending machines and computers. The utility data received indicates Middlesex has the fourth largest site energy use intensity (EUI) of the CSCU community colleges from an energy perspective (see Figure 1 Middlesex Energy Dashboard). The EUI method is used for benchmarking and comparison purposes.
FIGURE 1: Middlesex Community College Energy Dashboard
DRAFT Central Dashboard May 2016
Electricity,6,433
MMBTU
Propane,298 MMBTU
Fuel Oil,7,563
MMBTU
Figure 1b: Campus Energy Use by Type(FY 2014)
112
98
0
20
40
60
80
100
120
140
160
180
200
220
FY 2014 FY 2015
Figure 1c: Campus Weather Normalized Site EUI byFiscal Year
104 kBTU/sf Northeast Median Site EUI
* Only buildings with both electricity and fuel submetering data are shown.
Middlesex Community College230 kbtu/sf Source EUI
117 kbtu/sf Site EUI
0
50
100
150
200
250
300
350
Figure 1a: Site and Source EUI by Campus FY 2014 Campus Source EUI
FY 2014 Campus Site EUI
214 kbtu/sf Northeast Median Source EUI forCollege/University104 kBTU/ sf Northeast Median Site EUI forCollege/University
104104
214
UniversitiesCommunity Colleges
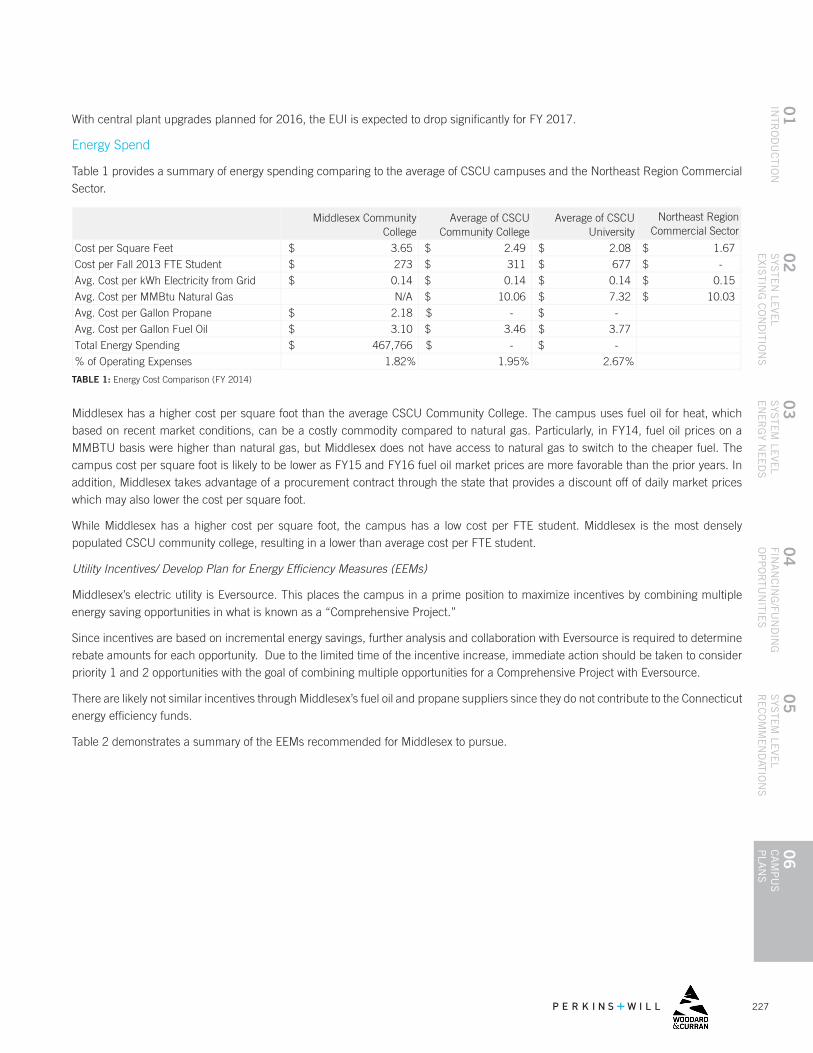
227
04
FINA
NC
ING
/FUN
DIN
G
OP
PO
RTU
NITIE
S
01
INTR
OD
UC
TION
06
CA
MP
US
P
LAN
S
05
SYS
TEM
LEVE
L R
EC
OM
ME
ND
ATION
S
02
SYS
TEN
LEVE
LE
XISTIN
G C
ON
DITIO
NS
03
SYS
TEM
LEVE
L E
NE
RG
Y NE
ED
S
TABLE 1: Energy Cost Comparison (FY 2014)
Middlesex has a higher cost per square foot than the average CSCU Community College. The campus uses fuel oil for heat, which based on recent market conditions, can be a costly commodity compared to natural gas. Particularly, in FY14, fuel oil prices on a MMBTU basis were higher than natural gas, but Middlesex does not have access to natural gas to switch to the cheaper fuel. The campus cost per square foot is likely to be lower as FY15 and FY16 fuel oil market prices are more favorable than the prior years. In addition, Middlesex takes advantage of a procurement contract through the state that provides a discount off of daily market prices which may also lower the cost per square foot.
While Middlesex has a higher cost per square foot, the campus has a low cost per FTE student. Middlesex is the most densely populated CSCU community college, resulting in a lower than average cost per FTE student.
Utility Incentives/ Develop Plan for Energy Efficiency Measures (EEMs)
Middlesex’s electric utility is Eversource. This places the campus in a prime position to maximize incentives by combining multiple energy saving opportunities in what is known as a “Comprehensive Project.”
Since incentives are based on incremental energy savings, further analysis and collaboration with Eversource is required to determine rebate amounts for each opportunity. Due to the limited time of the incentive increase, immediate action should be taken to consider priority 1 and 2 opportunities with the goal of combining multiple opportunities for a Comprehensive Project with Eversource.
There are likely not similar incentives through Middlesex’s fuel oil and propane suppliers since they do not contribute to the Connecticut energy efficiency funds.
Table 2 demonstrates a summary of the EEMs recommended for Middlesex to pursue.
With central plant upgrades planned for 2016, the EUI is expected to drop significantly for FY 2017.
Energy Spend
Table 1 provides a summary of energy spending comparing to the average of CSCU campuses and the Northeast Region Commercial Sector.
Northeast Region Commercial Sector
Cost per Square Feet 1.67$
Cost per Fall 2013 FTE Student -$
Avg. Cost per kWh Electricity from Grid 0.15$
Avg. Cost per MMBtu Natural Gas 10.03$
Avg. Cost per Gallon Propane
Avg. Cost per Gallon Fuel Oil
Total Energy Spending
% of Operating Expenses
Middlesex Community College
Average of CSCU Community College
Average of CSCU University
3.65$ 2.49$ 2.08$
273$ 311$ 677$
0.14$ 0.14$ 0.14$
N/A 10.06$ 7.32$
2.18$
3.10$
-$
3.46$
-$
3.77$
467,766$ -$ -$
1.82% 1.95% 2.67%
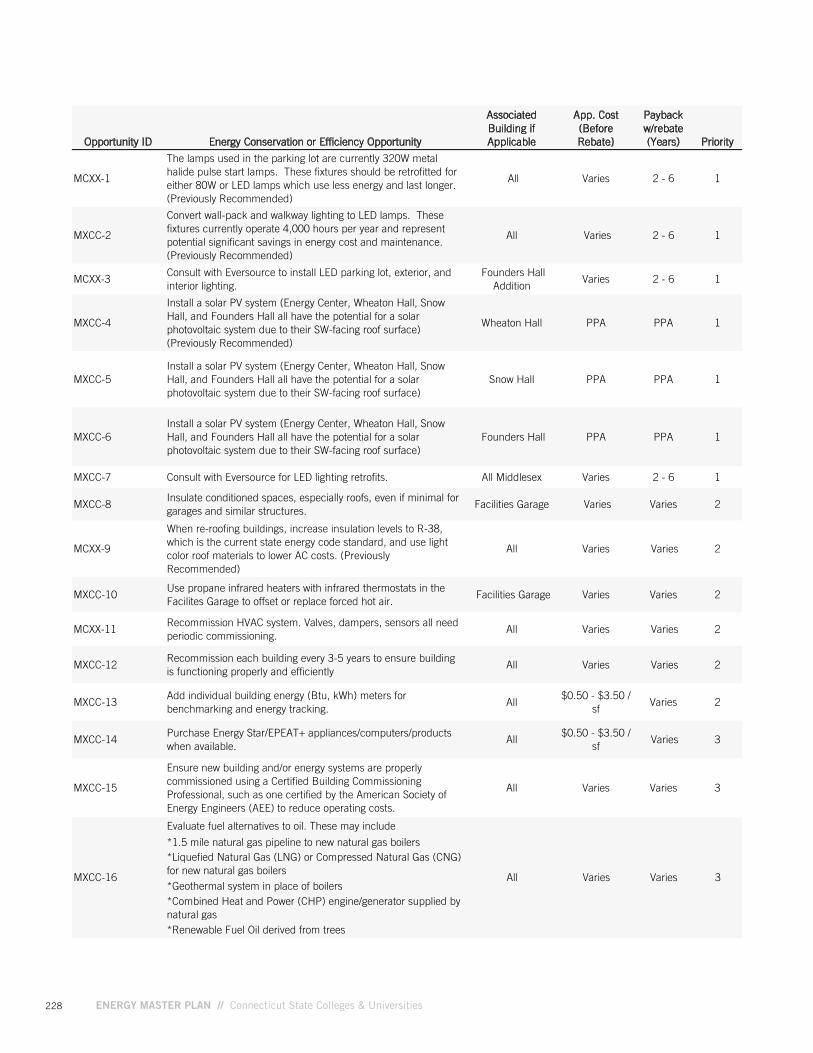
228 ENERGY MASTER PLAN // Connecticut State Colleges & Universities
Opportunity ID Energy Conservation or Efficiency Opportunity
Associated Building if Applicable
App. Cost (Before Rebate)
Payback w/rebate (Years) Priority
MCXX-1
The lamps used in the parking lot are currently 320W metal halide pulse start lamps. These fixtures should be retrofitted for either 80W or LED lamps which use less energy and last longer. (Previously Recommended)
All Varies 2 - 6 1
MXCC-2
Convert wall-pack and walkway lighting to LED lamps. These fixtures currently operate 4,000 hours per year and represent potential significant savings in energy cost and maintenance. (Previously Recommended)
All Varies 2 - 6 1
MCXX-3Consult with Eversource to install LED parking lot, exterior, and interior lighting.
Founders Hall Addition
Varies 2 - 6 1
MXCC-4
Install a solar PV system (Energy Center, Wheaton Hall, Snow Hall, and Founders Hall all have the potential for a solar photovoltaic system due to their SW-facing roof surface) (Previously Recommended)
Wheaton Hall PPA PPA 1
MXCC-5Install a solar PV system (Energy Center, Wheaton Hall, Snow Hall, and Founders Hall all have the potential for a solar photovoltaic system due to their SW-facing roof surface)
Snow Hall PPA PPA 1
MXCC-6Install a solar PV system (Energy Center, Wheaton Hall, Snow Hall, and Founders Hall all have the potential for a solar photovoltaic system due to their SW-facing roof surface)
Founders Hall PPA PPA 1
MXCC-7 Consult with Eversource for LED lighting retrofits. All Middlesex Varies 2 - 6 1
MXCC-8Insulate conditioned spaces, especially roofs, even if minimal for garages and similar structures.
Facilities Garage Varies Varies 2
MCXX-9
When re-roofing buildings, increase insulation levels to R-38, which is the current state energy code standard, and use light color roof materials to lower AC costs. (Previously Recommended)
All Varies Varies 2
MXCC-10Use propane infrared heaters with infrared thermostats in the Facilites Garage to offset or replace forced hot air.
Facilities Garage Varies Varies 2
MCXX-11Recommission HVAC system. Valves, dampers, sensors all need periodic commissioning.
All Varies Varies 2
MXCC-12Recommission each building every 3-5 years to ensure building is functioning properly and efficiently
All Varies Varies 2
MXCC-13Add individual building energy (Btu, kWh) meters for benchmarking and energy tracking.
All$0.50 - $3.50 /
sfVaries 2
MXCC-14Purchase Energy Star/EPEAT+ appliances/computers/products when available.
All$0.50 - $3.50 /
sf Varies 3
MXCC-15
Ensure new building and/or energy systems are properly commissioned using a Certified Building Commissioning Professional, such as one certified by the American Society of Energy Engineers (AEE) to reduce operating costs.
All Varies Varies 3
Evaluate fuel alternatives to oil. These may include
*1.5 mile natural gas pipeline to new natural gas boilers*Liquefied Natural Gas (LNG) or Compressed Natural Gas (CNG) for new natural gas boilers*Geothermal system in place of boilers*Combined Heat and Power (CHP) engine/generator supplied by natural gas*Renewable Fuel Oil derived from trees
MXCC-17Participate as a campus in the EnerNoc demand response program. The meter should be installed at main service entrance of campus. (Previously Recommended)
All Varies Varies 3
MXCC-18Continue adding Time clocks and Vending-misers to all vending machines, especially those that require 24/7 refrigeration.
All Varies Varies 3
MXCC-19Continue to develop an "Energy Dashboard" as data become available.
All Varies Varies 3
MXCC-16 All Varies Varies 3
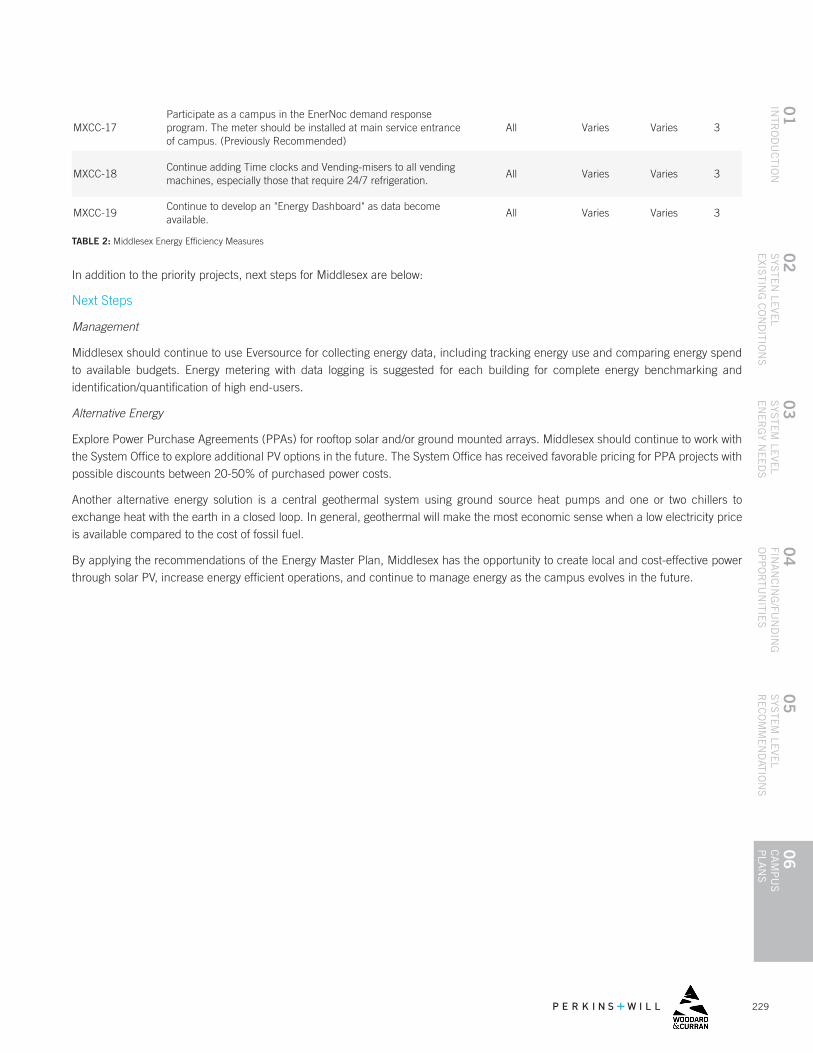
229
04
FINA
NC
ING
/FUN
DIN
G
OP
PO
RTU
NITIE
S
01
INTR
OD
UC
TION
06
CA
MP
US
P
LAN
S
05
SYS
TEM
LEVE
L R
EC
OM
ME
ND
ATION
S
02
SYS
TEN
LEVE
LE
XISTIN
G C
ON
DITIO
NS
03
SYS
TEM
LEVE
L E
NE
RG
Y NE
ED
S
TABLE 2: Middlesex Energy Efficiency Measures
In addition to the priority projects, next steps for Middlesex are below:
Next Steps
Management
Middlesex should continue to use Eversource for collecting energy data, including tracking energy use and comparing energy spend to available budgets. Energy metering with data logging is suggested for each building for complete energy benchmarking and identification/quantification of high end-users.
Alternative Energy
Explore Power Purchase Agreements (PPAs) for rooftop solar and/or ground mounted arrays. Middlesex should continue to work with the System Office to explore additional PV options in the future. The System Office has received favorable pricing for PPA projects with possible discounts between 20-50% of purchased power costs.
Another alternative energy solution is a central geothermal system using ground source heat pumps and one or two chillers to exchange heat with the earth in a closed loop. In general, geothermal will make the most economic sense when a low electricity price is available compared to the cost of fossil fuel.
By applying the recommendations of the Energy Master Plan, Middlesex has the opportunity to create local and cost-effective power through solar PV, increase energy efficient operations, and continue to manage energy as the campus evolves in the future.
Opportunity ID Energy Conservation or Efficiency Opportunity
Associated Building if Applicable
App. Cost (Before Rebate)
Payback w/rebate (Years) Priority
MCXX-1
The lamps used in the parking lot are currently 320W metal halide pulse start lamps. These fixtures should be retrofitted for either 80W or LED lamps which use less energy and last longer. (Previously Recommended)
All Varies 2 - 6 1
MXCC-2
Convert wall-pack and walkway lighting to LED lamps. These fixtures currently operate 4,000 hours per year and represent potential significant savings in energy cost and maintenance. (Previously Recommended)
All Varies 2 - 6 1
MCXX-3Consult with Eversource to install LED parking lot, exterior, and interior lighting.
Founders Hall Addition
Varies 2 - 6 1
MXCC-4
Install a solar PV system (Energy Center, Wheaton Hall, Snow Hall, and Founders Hall all have the potential for a solar photovoltaic system due to their SW-facing roof surface) (Previously Recommended)
Wheaton Hall PPA PPA 1
MXCC-5Install a solar PV system (Energy Center, Wheaton Hall, Snow Hall, and Founders Hall all have the potential for a solar photovoltaic system due to their SW-facing roof surface)
Snow Hall PPA PPA 1
MXCC-6Install a solar PV system (Energy Center, Wheaton Hall, Snow Hall, and Founders Hall all have the potential for a solar photovoltaic system due to their SW-facing roof surface)
Founders Hall PPA PPA 1
MXCC-7 Consult with Eversource for LED lighting retrofits. All Middlesex Varies 2 - 6 1
MXCC-8Insulate conditioned spaces, especially roofs, even if minimal for garages and similar structures.
Facilities Garage Varies Varies 2
MCXX-9
When re-roofing buildings, increase insulation levels to R-38, which is the current state energy code standard, and use light color roof materials to lower AC costs. (Previously Recommended)
All Varies Varies 2
MXCC-10Use propane infrared heaters with infrared thermostats in the Facilites Garage to offset or replace forced hot air.
Facilities Garage Varies Varies 2
MCXX-11Recommission HVAC system. Valves, dampers, sensors all need periodic commissioning.
All Varies Varies 2
MXCC-12Recommission each building every 3-5 years to ensure building is functioning properly and efficiently
All Varies Varies 2
MXCC-13Add individual building energy (Btu, kWh) meters for benchmarking and energy tracking.
All$0.50 - $3.50 /
sfVaries 2
MXCC-14Purchase Energy Star/EPEAT+ appliances/computers/products when available.
All$0.50 - $3.50 /
sf Varies 3
MXCC-15
Ensure new building and/or energy systems are properly commissioned using a Certified Building Commissioning Professional, such as one certified by the American Society of Energy Engineers (AEE) to reduce operating costs.
All Varies Varies 3
Evaluate fuel alternatives to oil. These may include
*1.5 mile natural gas pipeline to new natural gas boilers*Liquefied Natural Gas (LNG) or Compressed Natural Gas (CNG) for new natural gas boilers*Geothermal system in place of boilers*Combined Heat and Power (CHP) engine/generator supplied by natural gas*Renewable Fuel Oil derived from trees
MXCC-17Participate as a campus in the EnerNoc demand response program. The meter should be installed at main service entrance of campus. (Previously Recommended)
All Varies Varies 3
MXCC-18Continue adding Time clocks and Vending-misers to all vending machines, especially those that require 24/7 refrigeration.
All Varies Varies 3
MXCC-19Continue to develop an "Energy Dashboard" as data become available.
All Varies Varies 3
MXCC-16 All Varies Varies 3
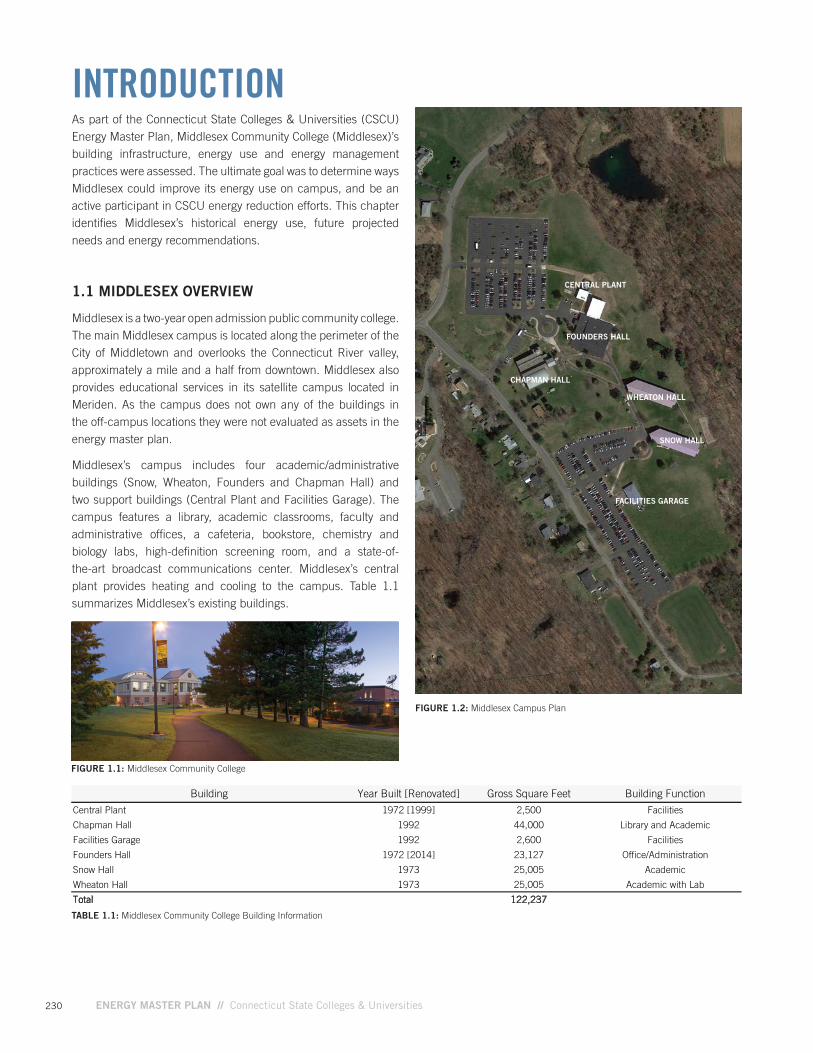
230 ENERGY MASTER PLAN // Connecticut State Colleges & Universities
INTRODUCTIONAs part of the Connecticut State Colleges & Universities (CSCU) Energy Master Plan, Middlesex Community College (Middlesex)’s building infrastructure, energy use and energy management practices were assessed. The ultimate goal was to determine ways Middlesex could improve its energy use on campus, and be an active participant in CSCU energy reduction efforts. This chapter identifies Middlesex’s historical energy use, future projected needs and energy recommendations.
1.1 MIDDLESEX OVERVIEW
Middlesex is a two-year open admission public community college. The main Middlesex campus is located along the perimeter of the City of Middletown and overlooks the Connecticut River valley, approximately a mile and a half from downtown. Middlesex also provides educational services in its satellite campus located in Meriden. As the campus does not own any of the buildings in the off-campus locations they were not evaluated as assets in the energy master plan.
Middlesex’s campus includes four academic/administrative buildings (Snow, Wheaton, Founders and Chapman Hall) and two support buildings (Central Plant and Facilities Garage). The campus features a library, academic classrooms, faculty and administrative offices, a cafeteria, bookstore, chemistry and biology labs, high-definition screening room, and a state-of-the-art broadcast communications center. Middlesex’s central plant provides heating and cooling to the campus. Table 1.1 summarizes Middlesex’s existing buildings.
Building Year Built [Renovated] Gross Square Feet Building Function
Central Plant 1972 [1999] 2,500 Facilities
Chapman Hall 1992 44,000 Library and Academic
Facilities Garage 1992 2,600 Facilities
Founders Hall 1972 [2014] 23,127 Office/Administration
Snow Hall 1973 25,005 Academic
Wheaton Hall 1973 25,005 Academic with Lab
Total 122,237
TABLE 1.1: Middlesex Community College Building Information
FIGURE 1.1: Middlesex Community College
FIGURE 1.2: Middlesex Campus Plan
CENTRAL PLANT
FOUNDERS HALL
CHAPMAN HALL
WHEATON HALL
SNOW HALL
FACILITIES GARAGE
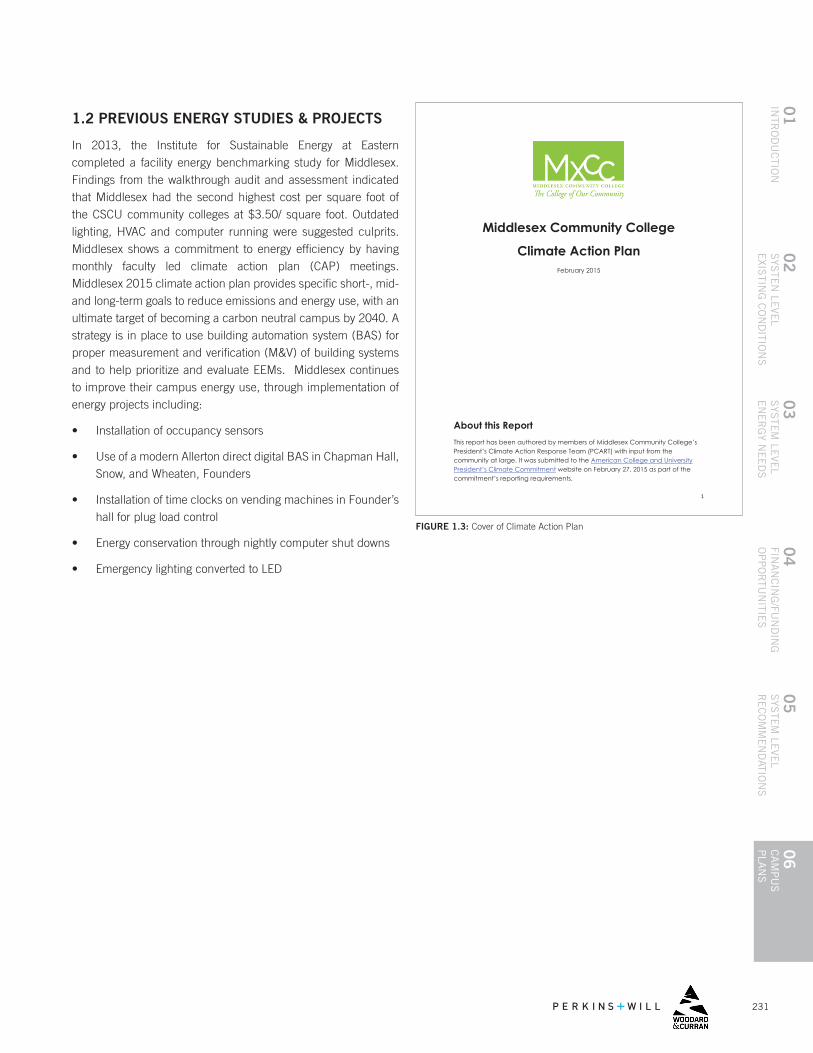
231
04
FINA
NC
ING
/FUN
DIN
G
OP
PO
RTU
NITIE
S
01
INTR
OD
UC
TION
06
CA
MP
US
P
LAN
S
05
SYS
TEM
LEVE
L R
EC
OM
ME
ND
ATION
S
02
SYS
TEN
LEVE
LE
XISTIN
G C
ON
DITIO
NS
03
SYS
TEM
LEVE
L E
NE
RG
Y NE
ED
S
1.2 PREVIOUS ENERGY STUDIES & PROJECTS
In 2013, the Institute for Sustainable Energy at Eastern completed a facility energy benchmarking study for Middlesex. Findings from the walkthrough audit and assessment indicated that Middlesex had the second highest cost per square foot of the CSCU community colleges at $3.50/ square foot. Outdated lighting, HVAC and computer running were suggested culprits. Middlesex shows a commitment to energy efficiency by having monthly faculty led climate action plan (CAP) meetings. Middlesex 2015 climate action plan provides specific short-, mid- and long-term goals to reduce emissions and energy use, with an ultimate target of becoming a carbon neutral campus by 2040. A strategy is in place to use building automation system (BAS) for proper measurement and verification (M&V) of building systems and to help prioritize and evaluate EEMs. Middlesex continues to improve their campus energy use, through implementation of energy projects including:
• Installation of occupancy sensors
• Use of a modern Allerton direct digital BAS in Chapman Hall, Snow, and Wheaten, Founders
• Installation of time clocks on vending machines in Founder’s hall for plug load control
• Energy conservation through nightly computer shut downs
• Emergency lighting converted to LED
1
Middlesex Community College
Climate Action Plan February 2015
About this Report This report has been authored by members of Middlesex Community College’s President’s Climate Action Response Team (PCART) with input from the community at large. It was submitted to the American College and University President’s Climate Commitment website on February 27, 2015 as part of the commitment’s reporting requirements.
FIGURE 1.3: Cover of Climate Action Plan
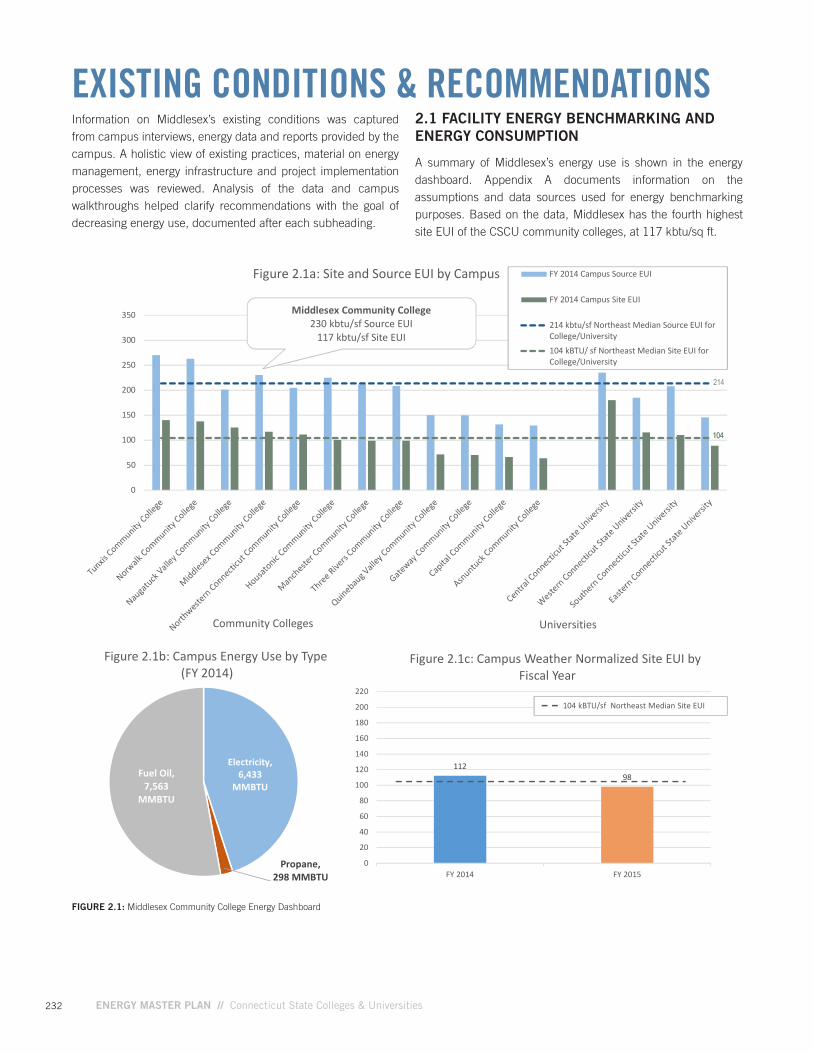
232 ENERGY MASTER PLAN // Connecticut State Colleges & Universities
EXISTING CONDITIONS & RECOMMENDATIONSInformation on Middlesex’s existing conditions was captured from campus interviews, energy data and reports provided by the campus. A holistic view of existing practices, material on energy management, energy infrastructure and project implementation processes was reviewed. Analysis of the data and campus walkthroughs helped clarify recommendations with the goal of decreasing energy use, documented after each subheading.
2.1 FACILITY ENERGY BENCHMARKING AND ENERGY CONSUMPTION
A summary of Middlesex’s energy use is shown in the energy dashboard. Appendix A documents information on the assumptions and data sources used for energy benchmarking purposes. Based on the data, Middlesex has the fourth highest site EUI of the CSCU community colleges, at 117 kbtu/sq ft.
FIGURE 2.1: Middlesex Community College Energy Dashboard
DRAFT Central Dashboard May 2016
Electricity,6,433
MMBTU
Propane,298 MMBTU
Fuel Oil,7,563
MMBTU
Figure 2.1b: Campus Energy Use by Type(FY 2014)
112
98
0
20
40
60
80
100
120
140
160
180
200
220
FY 2014 FY 2015
Figure 2.1c: Campus Weather Normalized Site EUI byFiscal Year
104 kBTU/sf Northeast Median Site EUI
* Only buildings with both electricity and fuel submetering data are shown.
Middlesex Community College230 kbtu/sf Source EUI
117 kbtu/sf Site EUI
0
50
100
150
200
250
300
350
Figure 2.1a: Site and Source EUI by Campus FY 2014 Campus Source EUI
FY 2014 Campus Site EUI
214 kbtu/sf Northeast Median Source EUI forCollege/University104 kBTU/ sf Northeast Median Site EUI forCollege/University
104104
214
UniversitiesCommunity Colleges
233
04
FINA
NC
ING
/FUN
DIN
G
OP
PO
RTU
NITIE
S
01
INTR
OD
UC
TION
06
CA
MP
US
P
LAN
S
05
SYS
TEM
LEVE
L R
EC
OM
ME
ND
ATION
S
02
SYS
TEN
LEVE
LE
XISTIN
G C
ON
DITIO
NS
03
SYS
TEM
LEVE
L E
NE
RG
Y NE
ED
S
Based on the data:
• Middlesex’s EUI is slightly above the Northeast regional median EUI for Fiscal Year (FY) 2014. Although for both the previous and following year, the EUI is just below the median. The three-year average is 107 kBtu/sf/yr.
• Fuel use for FY 2014 was roughly 40% higher than FY 2013 and 30% higher than 2015. Accounting for weather variations, FY 2014 fuel oil use was still about 30% greater than the previous or following year.
A possible contributor to Middlesex’s energy use is the campus’ reliance on fuel oil for heating purposes. The campus does not use natural gas on campus. The campus has several energy-related upgrades planned for completion in 2016, which will likely decrease the campus EUI significantly for FY 2017. Plans include the installation of new boilers, chiller equipment and building envelope improvements for Chapman Hall.
Table 2.1 provides a comparison of FY 2014 energy spending compared to the average of CSCU campuses and the Northeast Region Commercial Sector.
Middlesex’s FY 2014 cost per square foot is $3.65 per square foot. FY 2014 cost per square foot is higher than the average of CSCU campuses due mostly to the campus’ reliance on fuel oil, and the associated high costs. However, Middlesex pays a lower fuel oil cost than the average cost of the campuses that use fuel oil, described further in the procurement section. FY 15 fuel oil costs dropped to approximately $2.00/ gallon based on Portfolio Manager and Middlesex consumption reports. Current and FY 2016 expenses are expected to drop drastically due to the relatively low cost of fuel oil. On a cost per FTE student basis, Middlesex is lower than average as it is the most densely populated community college in CSCU.
TABLE 2.1: Energy Cost Comparison (FY 2014)
2.2 CAMPUS UTILITIES AND DISTRIBUTION
Middlesex’s energy sources for campus are electricity, fuel oil, and propane. Middlesex is the only CSCU campus, with the exception of Western, without natural gas use. The nearest connection to the campus is a mile and half away, proving costly at this point in time to connect to the campus. As shown in Figure 2 of the energy dashboard, the campus is instead primarily heated with fuel oil. The following is a list of Middlesex’s utility providers:
• Electrical: Eversource
• Fuel Oil: Dime Oil
• Propane: AmeriGas
2.3 ENERGY PROCUREMENT
Middlesex is part of the CSCU’s 2013 electric supply procurement contract with Direct Energy (formerly Hess Energy), detailed further in the Energy Master Plan. Middlesex purchases their fuel oil through Connecticut’s Department of Administrative Services (DAS) open contract. Bundling accounts under the DAS open contract with other state agencies in the Middletown area uses economies of scale to lower the overall price for the campus. DAS entered into a new 5-year contract with East River Energy, Santa Buckley Energy and Dime Oil starting in July of 2015*. Dime Oil supplies fuel oil #2 to Middlesex. Under the contract DAS may lock in a fixed price at any time which may help leverage additional savings to the state agencies under the contract.
2.4 OPERATIONAL AND ENERGY MANAGEMENT PRACTICES
2.4.1 CURRENT CONDITIONS
Middlesex’s Facilities staff oversees maintenance of the main campus buildings and utility infrastructure. The campus is open from Monday to Saturday each week.
* http://www.biznet.ct.gov/SCP_Search/ContractDetail.aspx?ID=15590; http://www.biznet.ct.gov/SCP_Documents/Results/15590/15PSX0035CONTRACT%20AWARD.pdf
Northeast Region Commercial Sector
Cost per Square Feet 1.67$
Cost per Fall 2013 FTE Student -$
Avg. Cost per kWh Electricity from Grid 0.15$
Avg. Cost per MMBtu Natural Gas 10.03$
Avg. Cost per Gallon Propane
Avg. Cost per Gallon Fuel Oil
Total Energy Spending
% of Operating Expenses
Middlesex Community College
Average of CSCU Community College
Average of CSCU University
3.65$ 2.49$ 2.08$
273$ 311$ 677$
0.14$ 0.14$ 0.14$
N/A 10.06$ 7.32$
2.18$
3.10$
-$
3.46$
-$
3.77$
467,766$ -$ -$
1.82% 1.95% 2.67%
234 ENERGY MASTER PLAN // Connecticut State Colleges & Universities
Operating hours based on different equipment are as follows:
Monday – Saturday :7AM-11PM for air handling units (AHUs) :7 AM-10PM for fan coil units (FCUs)
Sunday :N/A
The ability to monitor data and energy use is often dependent on granularity of building data. At this point Middlesex does not have any submetering, making it difficult to quantitatively assess which buildings are the largest energy users. The campus is interested in pursuing submetering. Eastern’s Institute for Sustainable Energy (ISE) has input Middlesex’s energy use into EPA’s Portfolio Manager as part of a benchmarking initiative. Additionally, campuses report their energy use to the state at the end of the fiscal year. Middlesex notes that the self-reporting is not perfect, but is improving. Specifically, the campus has had great success working with Eversource to supplement missing energy data. Eversource’s online portal reports higher electricity use than the consumption reports in the past.
ENERGY USE INFORMATION MANAGEMENT SYSTEM
Facilities is largely responsible for energy management on campus through the use of their BAS and BMS. Currently Chapman Hall has a modern Allerton direct digital building automation system. Features of the BAS and BMS include electricity and water usage. Ultimately, individual building energy metering will be included as energy meters are installed as planned.
Middlesex has been interested in developing an energy dashboard to create occupant awareness of building performance data. Resources currently have not been conducive to such an effort.
2.4.2 RECOMMENDATIONS
As part of the CSCU Energy Master Plan recommendations in Section 5.2.2, it is recommended that the System Office create a template for energy tracking applicable to all campuses. Middlesex should continue to collect data directly from Eversource, including through use of Eversource’s Customer Engagement Platform to view its energy use and to supplement reporting to the state. The campus should consider adding individual building energy (Btu, kWh) meters for benchmarking and energy tracking.
Energy Management Systems (EMS), can offer an excellent way to track energy use of specific equipment such as an air handler, pump, or boiler. With the addition of any DDC HVAC equipment upgrades, ensure control points and sensor readings are logged through the software and tracked for any anomalies or poorly tuned settings.
2.5 EXISTING BUILDING COMISSIONING
2.5.1 CURRENT CONDITIONS
No recent building commissioning efforts were reported.
2.5.2 RECOMMENDATIONS
Buildings with BMSs with measurable points stand to benefit the most from recommissioning. Although State buildings built after 2011 are required to have a commissioning agent, it has been observed even new buildings have not been properly and thoroughly commissioned. A properly commissioned building should be turned over with a thorough commissioning report, complete with checklists and testing and balancing (TAB) reports for each piece of equipment, even windows and lighting. If this documentation is not available, it is a good indication the building was not properly commissioned. Newer buildings with a higher than average EUI are also indicative of a poorly commissioned building.
As a general rule of thumb:
• Recommission existing building systems every 3-5 years.
Often building systems are commissioned to just get the building working, not optimizing for reducing energy costs. Ensure a Certified Building Commissioning Professional, such as one recognized by the Association of Energy Engineers (AEE) is selected to perform the commissioning.
2.6 MECHANICAL SYSTEMS
2.6.1 CURRENT CONDITIONS
Middlesex’s Central Plant, located north of Founders Hall, provides heating and cooling to Snow Hall, Wheaton Hall, and Founders Hall. It is the only campus which uses fuel oil as the primary heat source. Chapman Hall, uses electric heat pumps and small fuel oil backup boilers for heat and cooling. About 80% of Chapman’s energy is from electricity. These sources of energy have historically higher cost per unit of energy than natural gas and may attribute to the relatively high cost of operation per square foot as compared to other campuses in the CSCU system.
The chilled water system in the central plant is aged, using inefficient reciprocating chillers, and will be replaced in 2016. There are many opportunities for energy efficiency improvements with the new chilled water plant. Likewise, the boiler systems will also be replaced.While many recommendations can be made to the existing systems at the central plant, focus was not placed on them as they are to be replaced in the near term. The details of the planned replacement systems were not disclosed.
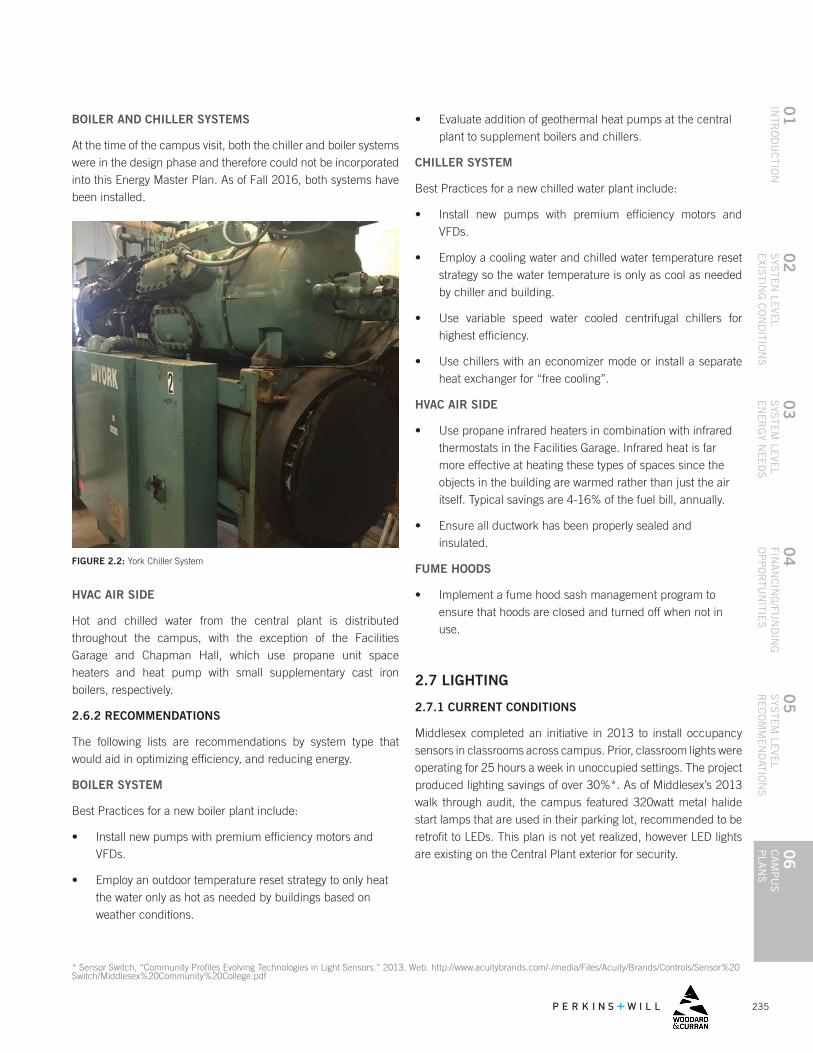
235
04
FINA
NC
ING
/FUN
DIN
G
OP
PO
RTU
NITIE
S
01
INTR
OD
UC
TION
06
CA
MP
US
P
LAN
S
05
SYS
TEM
LEVE
L R
EC
OM
ME
ND
ATION
S
02
SYS
TEN
LEVE
LE
XISTIN
G C
ON
DITIO
NS
03
SYS
TEM
LEVE
L E
NE
RG
Y NE
ED
S
BOILER AND CHILLER SYSTEMS
At the time of the campus visit, both the chiller and boiler systems were in the design phase and therefore could not be incorporated into this Energy Master Plan. As of Fall 2016, both systems have been installed.
• Evaluate addition of geothermal heat pumps at the central plant to supplement boilers and chillers.
CHILLER SYSTEM
Best Practices for a new chilled water plant include:
• Install new pumps with premium efficiency motors and VFDs.
• Employ a cooling water and chilled water temperature reset strategy so the water temperature is only as cool as needed by chiller and building.
• Use variable speed water cooled centrifugal chillers for highest efficiency.
• Use chillers with an economizer mode or install a separate heat exchanger for “free cooling”.
HVAC AIR SIDE
• Use propane infrared heaters in combination with infrared thermostats in the Facilities Garage. Infrared heat is far more effective at heating these types of spaces since the objects in the building are warmed rather than just the air itself. Typical savings are 4-16% of the fuel bill, annually.
• Ensure all ductwork has been properly sealed and insulated.
FUME HOODS
• Implement a fume hood sash management program to ensure that hoods are closed and turned off when not in use.
2.7 LIGHTING
2.7.1 CURRENT CONDITIONS
Middlesex completed an initiative in 2013 to install occupancy sensors in classrooms across campus. Prior, classroom lights were operating for 25 hours a week in unoccupied settings. The project produced lighting savings of over 30%*. As of Middlesex’s 2013 walk through audit, the campus featured 320watt metal halide start lamps that are used in their parking lot, recommended to be retrofit to LEDs. This plan is not yet realized, however LED lights are existing on the Central Plant exterior for security.
HVAC AIR SIDE
Hot and chilled water from the central plant is distributed throughout the campus, with the exception of the Facilities Garage and Chapman Hall, which use propane unit space heaters and heat pump with small supplementary cast iron boilers, respectively.
2.6.2 RECOMMENDATIONS
The following lists are recommendations by system type that would aid in optimizing efficiency, and reducing energy.
BOILER SYSTEM
Best Practices for a new boiler plant include:
• Install new pumps with premium efficiency motors and VFDs.
• Employ an outdoor temperature reset strategy to only heat the water only as hot as needed by buildings based on weather conditions.
FIGURE 2.2: York Chiller System
* Sensor Switch, “Community Profiles Evolving Technologies in Light Sensors.” 2013. Web. http://www.acuitybrands.com/-/media/Files/Acuity/Brands/Controls/Sensor%20Switch/Middlesex%20Community%20College.pdf
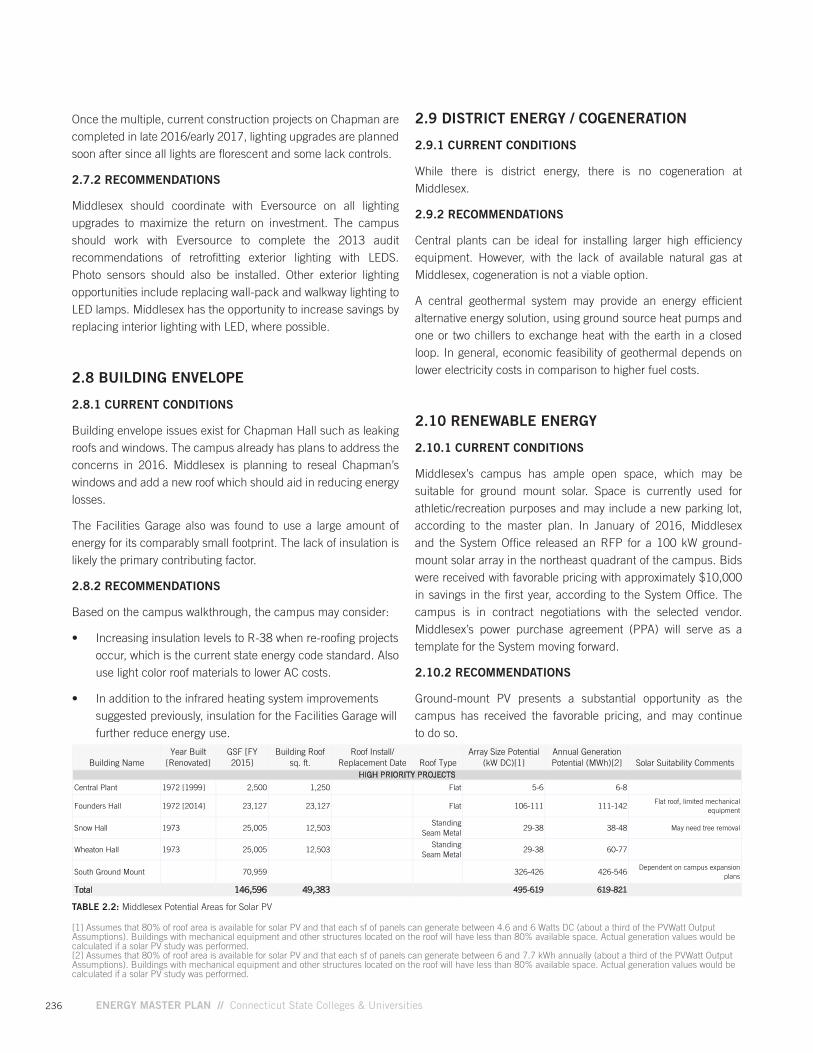
236 ENERGY MASTER PLAN // Connecticut State Colleges & Universities
Once the multiple, current construction projects on Chapman are completed in late 2016/early 2017, lighting upgrades are planned soon after since all lights are florescent and some lack controls.
2.7.2 RECOMMENDATIONS
Middlesex should coordinate with Eversource on all lighting upgrades to maximize the return on investment. The campus should work with Eversource to complete the 2013 audit recommendations of retrofitting exterior lighting with LEDS. Photo sensors should also be installed. Other exterior lighting opportunities include replacing wall-pack and walkway lighting to LED lamps. Middlesex has the opportunity to increase savings by replacing interior lighting with LED, where possible.
2.8 BUILDING ENVELOPE
2.8.1 CURRENT CONDITIONS
Building envelope issues exist for Chapman Hall such as leaking roofs and windows. The campus already has plans to address the concerns in 2016. Middlesex is planning to reseal Chapman’s windows and add a new roof which should aid in reducing energy losses.
The Facilities Garage also was found to use a large amount of energy for its comparably small footprint. The lack of insulation is likely the primary contributing factor.
2.8.2 RECOMMENDATIONS
Based on the campus walkthrough, the campus may consider:
• Increasing insulation levels to R-38 when re-roofing projects occur, which is the current state energy code standard. Also use light color roof materials to lower AC costs.
• In addition to the infrared heating system improvements suggested previously, insulation for the Facilities Garage will further reduce energy use.
2.9 DISTRICT ENERGY / COGENERATION
2.9.1 CURRENT CONDITIONS
While there is district energy, there is no cogeneration at Middlesex.
2.9.2 RECOMMENDATIONS
Central plants can be ideal for installing larger high efficiency equipment. However, with the lack of available natural gas at Middlesex, cogeneration is not a viable option.
A central geothermal system may provide an energy efficient alternative energy solution, using ground source heat pumps and one or two chillers to exchange heat with the earth in a closed loop. In general, economic feasibility of geothermal depends on lower electricity costs in comparison to higher fuel costs.
2.10 RENEWABLE ENERGY
2.10.1 CURRENT CONDITIONS
Middlesex’s campus has ample open space, which may be suitable for ground mount solar. Space is currently used for athletic/recreation purposes and may include a new parking lot, according to the master plan. In January of 2016, Middlesex and the System Office released an RFP for a 100 kW ground-mount solar array in the northeast quadrant of the campus. Bids were received with favorable pricing with approximately $10,000 in savings in the first year, according to the System Office. The campus is in contract negotiations with the selected vendor. Middlesex’s power purchase agreement (PPA) will serve as a template for the System moving forward.
2.10.2 RECOMMENDATIONS
Ground-mount PV presents a substantial opportunity as the campus has received the favorable pricing, and may continue to do so.
Building NameYear Built
[Renovated]GSF [FY 2015]
Building Roof sq. ft.
Roof Install/ Replacement Date Roof Type
Array Size Potential (kW DC)[1]
Annual Generation Potential (MWh)[2] Solar Suitability Comments
Central Plant 1972 [1999] 2,500 1,250 Flat 5-6 6-8
Founders Hall 1972 [2014] 23,127 23,127 Flat 106-111 111-142Flat roof, limited mechanical
equipment
Snow Hall 1973 25,005 12,503 Standing
Seam Metal29-38 38-48 May need tree removal
Wheaton Hall 1973 25,005 12,503 Standing
Seam Metal29-38 60-77
South Ground Mount 70,959 326-426 426-546Dependent on campus expansion
plans
Total 146,596 49,383 495-619 619-821
HIGH PRIORITY PROJECTS
[1] Assumes varying percent of roof area availability depending on roof examined, but a standard 80% available space. Buildings with mechanical equipment and other structures located on the roof will have less than 80% available space. Also assumes that each sf of panels can generate between 4.6 and 6 Watts DC (about a third of the PVWatt Output Assumptions). Actual generation values would be calculated if a solar PV study was performed.
[2] Assumes varying percent of roof area availability depending on roof examined, but a standard 80% available space. Buildings with mechanical equipment and other structures located on the roof will have less than 80% available space. Assumes that each sf of panels can generate between 6 and 7.7 kWh annually (about a third of the PVWatt Output Assumptions). Actual generation values would be calculated if a solar PV study was performed.
TABLE 2.2: Middlesex Potential Areas for Solar PV
[1] Assumes that 80% of roof area is available for solar PV and that each sf of panels can generate between 4.6 and 6 Watts DC (about a third of the PVWatt Output Assumptions). Buildings with mechanical equipment and other structures located on the roof will have less than 80% available space. Actual generation values would be calculated if a solar PV study was performed. [2] Assumes that 80% of roof area is available for solar PV and that each sf of panels can generate between 6 and 7.7 kWh annually (about a third of the PVWatt Output Assumptions). Buildings with mechanical equipment and other structures located on the roof will have less than 80% available space. Actual generation values would be calculated if a solar PV study was performed.
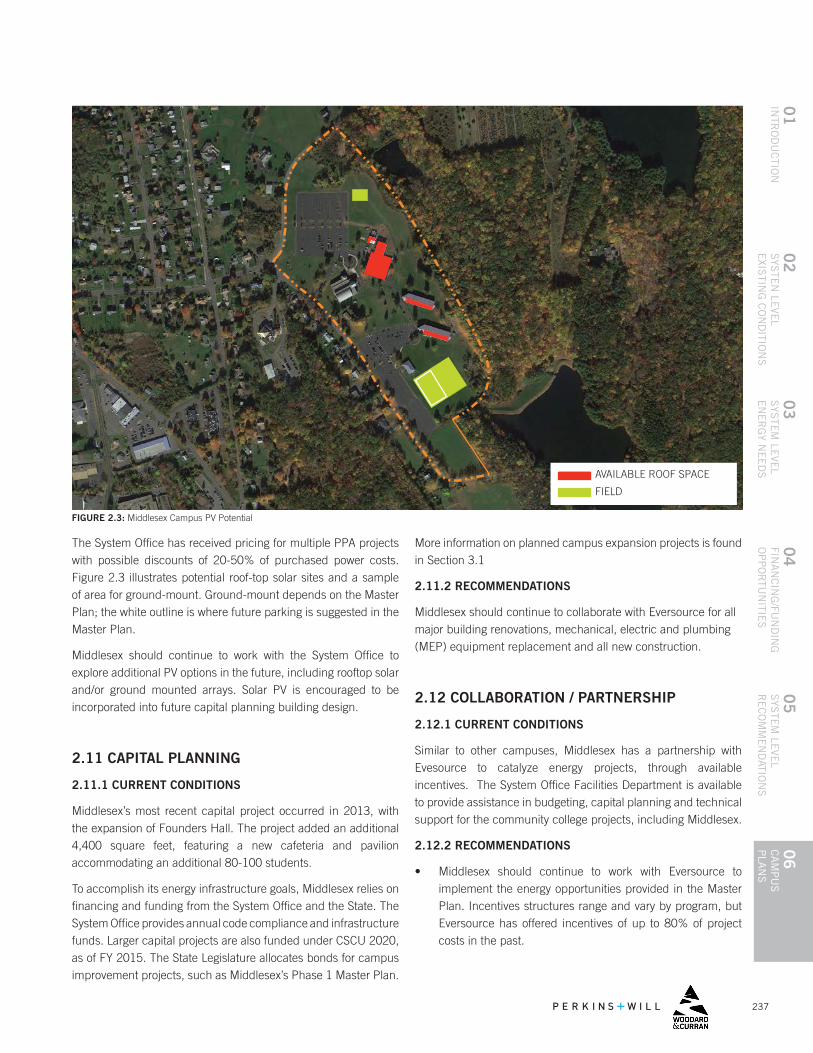
237
04
FINA
NC
ING
/FUN
DIN
G
OP
PO
RTU
NITIE
S
01
INTR
OD
UC
TION
06
CA
MP
US
P
LAN
S
05
SYS
TEM
LEVE
L R
EC
OM
ME
ND
ATION
S
02
SYS
TEN
LEVE
LE
XISTIN
G C
ON
DITIO
NS
03
SYS
TEM
LEVE
L E
NE
RG
Y NE
ED
SAVAILABLE ROOF SPACE
FIELD
FIGURE 2.3: Middlesex Campus PV Potential
The System Office has received pricing for multiple PPA projects with possible discounts of 20-50% of purchased power costs. Figure 2.3 illustrates potential roof-top solar sites and a sample of area for ground-mount. Ground-mount depends on the Master Plan; the white outline is where future parking is suggested in the Master Plan.
Middlesex should continue to work with the System Office to explore additional PV options in the future, including rooftop solar and/or ground mounted arrays. Solar PV is encouraged to be incorporated into future capital planning building design.
2.11 CAPITAL PLANNING
2.11.1 CURRENT CONDITIONS
Middlesex’s most recent capital project occurred in 2013, with the expansion of Founders Hall. The project added an additional 4,400 square feet, featuring a new cafeteria and pavilion accommodating an additional 80-100 students.
To accomplish its energy infrastructure goals, Middlesex relies on financing and funding from the System Office and the State. The System Office provides annual code compliance and infrastructure funds. Larger capital projects are also funded under CSCU 2020, as of FY 2015. The State Legislature allocates bonds for campus improvement projects, such as Middlesex’s Phase 1 Master Plan.
More information on planned campus expansion projects is found in Section 3.1
2.11.2 RECOMMENDATIONS
Middlesex should continue to collaborate with Eversource for all major building renovations, mechanical, electric and plumbing (MEP) equipment replacement and all new construction.
2.12 COLLABORATION / PARTNERSHIP
2.12.1 CURRENT CONDITIONS
Similar to other campuses, Middlesex has a partnership with Evesource to catalyze energy projects, through available incentives. The System Office Facilities Department is available to provide assistance in budgeting, capital planning and technical support for the community college projects, including Middlesex.
2.12.2 RECOMMENDATIONS
• Middlesex should continue to work with Eversource to implement the energy opportunities provided in the Master Plan. Incentives structures range and vary by program, but Eversource has offered incentives of up to 80% of project costs in the past.
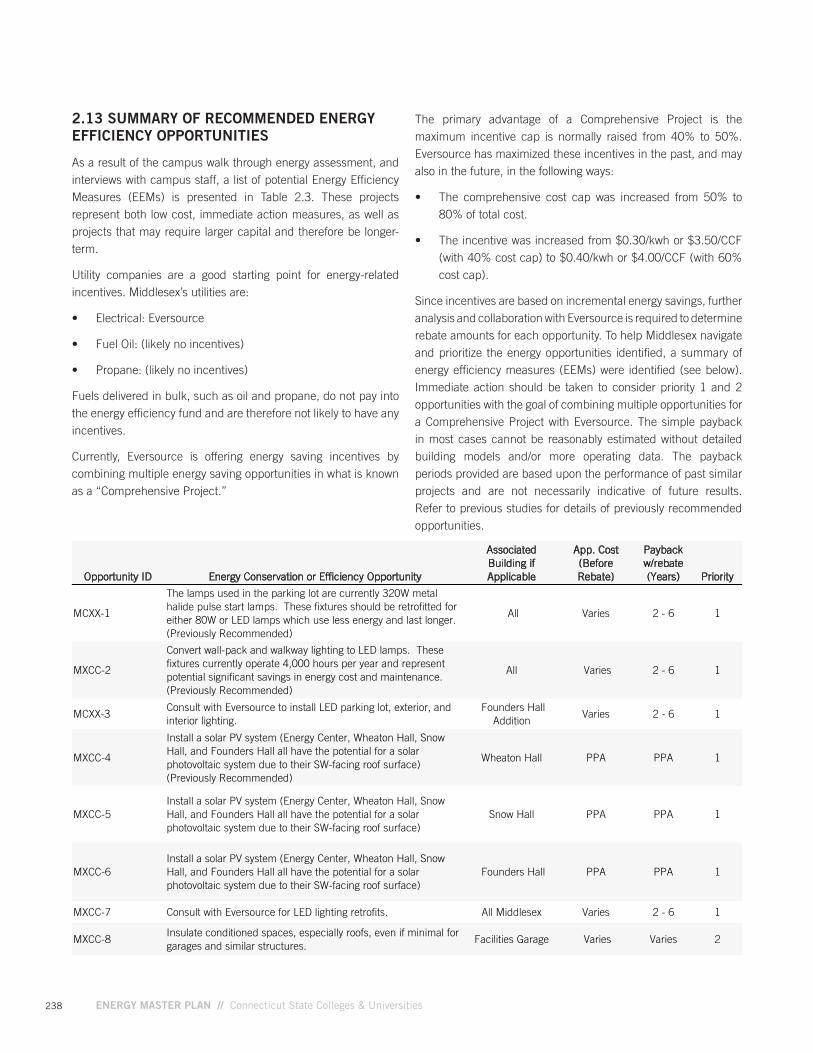
238 ENERGY MASTER PLAN // Connecticut State Colleges & Universities
2.13 SUMMARY OF RECOMMENDED ENERGY EFFICIENCY OPPORTUNITIES
As a result of the campus walk through energy assessment, and interviews with campus staff, a list of potential Energy Efficiency Measures (EEMs) is presented in Table 2.3. These projects represent both low cost, immediate action measures, as well as projects that may require larger capital and therefore be longer-term.
Utility companies are a good starting point for energy-related incentives. Middlesex’s utilities are:
• Electrical: Eversource
• Fuel Oil: (likely no incentives)
• Propane: (likely no incentives)
Fuels delivered in bulk, such as oil and propane, do not pay into the energy efficiency fund and are therefore not likely to have any incentives.
Currently, Eversource is offering energy saving incentives by combining multiple energy saving opportunities in what is known as a “Comprehensive Project.”
The primary advantage of a Comprehensive Project is the maximum incentive cap is normally raised from 40% to 50%. Eversource has maximized these incentives in the past, and may also in the future, in the following ways:
• The comprehensive cost cap was increased from 50% to 80% of total cost.
• The incentive was increased from $0.30/kwh or $3.50/CCF (with 40% cost cap) to $0.40/kwh or $4.00/CCF (with 60% cost cap).
Since incentives are based on incremental energy savings, further analysis and collaboration with Eversource is required to determine rebate amounts for each opportunity. To help Middlesex navigate and prioritize the energy opportunities identified, a summary of energy efficiency measures (EEMs) were identified (see below). Immediate action should be taken to consider priority 1 and 2 opportunities with the goal of combining multiple opportunities for a Comprehensive Project with Eversource. The simple payback in most cases cannot be reasonably estimated without detailed building models and/or more operating data. The payback periods provided are based upon the performance of past similar projects and are not necessarily indicative of future results. Refer to previous studies for details of previously recommended opportunities.
Opportunity ID Energy Conservation or Efficiency Opportunity
Associated Building if Applicable
App. Cost (Before Rebate)
Payback w/rebate (Years) Priority
MCXX-1
The lamps used in the parking lot are currently 320W metal halide pulse start lamps. These fixtures should be retrofitted for either 80W or LED lamps which use less energy and last longer. (Previously Recommended)
All Varies 2 - 6 1
MXCC-2
Convert wall-pack and walkway lighting to LED lamps. These fixtures currently operate 4,000 hours per year and represent potential significant savings in energy cost and maintenance. (Previously Recommended)
All Varies 2 - 6 1
MCXX-3Consult with Eversource to install LED parking lot, exterior, and interior lighting.
Founders Hall Addition
Varies 2 - 6 1
MXCC-4
Install a solar PV system (Energy Center, Wheaton Hall, Snow Hall, and Founders Hall all have the potential for a solar photovoltaic system due to their SW-facing roof surface) (Previously Recommended)
Wheaton Hall PPA PPA 1
MXCC-5Install a solar PV system (Energy Center, Wheaton Hall, Snow Hall, and Founders Hall all have the potential for a solar photovoltaic system due to their SW-facing roof surface)
Snow Hall PPA PPA 1
MXCC-6Install a solar PV system (Energy Center, Wheaton Hall, Snow Hall, and Founders Hall all have the potential for a solar photovoltaic system due to their SW-facing roof surface)
Founders Hall PPA PPA 1
MXCC-7 Consult with Eversource for LED lighting retrofits. All Middlesex Varies 2 - 6 1
MXCC-8Insulate conditioned spaces, especially roofs, even if minimal for garages and similar structures.
Facilities Garage Varies Varies 2
MCXX-9
When re-roofing buildings, increase insulation levels to R-38, which is the current state energy code standard, and use light color roof materials to lower AC costs. (Previously Recommended)
All Varies Varies 2
MXCC-10Use propane infrared heaters with infrared thermostats in the Facilites Garage to offset or replace forced hot air.
Facilities Garage Varies Varies 2
MCXX-11Recommission HVAC system. Valves, dampers, sensors all need periodic commissioning.
All Varies Varies 2
MXCC-12Recommission each building every 3-5 years to ensure building is functioning properly and efficiently
All Varies Varies 2
MXCC-13Add individual building energy (Btu, kWh) meters for benchmarking and energy tracking.
All$0.50 - $3.50 /
sfVaries 2
MXCC-14Purchase Energy Star/EPEAT+ appliances/computers/products when available.
All$0.50 - $3.50 /
sf Varies 3
MXCC-15
Ensure new building and/or energy systems are properly commissioned using a Certified Building Commissioning Professional, such as one certified by the American Society of Energy Engineers (AEE) to reduce operating costs.
All Varies Varies 3
Evaluate fuel alternatives to oil. These may include
*1.5 mile natural gas pipeline to new natural gas boilers*Liquefied Natural Gas (LNG) or Compressed Natural Gas (CNG) for new natural gas boilers*Geothermal system in place of boilers*Combined Heat and Power (CHP) engine/generator supplied by natural gas*Renewable Fuel Oil derived from trees
MXCC-17Participate as a campus in the EnerNoc demand response program. The meter should be installed at main service entrance of campus. (Previously Recommended)
All Varies Varies 3
MXCC-18Continue adding Time clocks and Vending-misers to all vending machines, especially those that require 24/7 refrigeration.
All Varies Varies 3
MXCC-19Continue to develop an "Energy Dashboard" as data become available.
All Varies Varies 3
MXCC-16 All Varies Varies 3
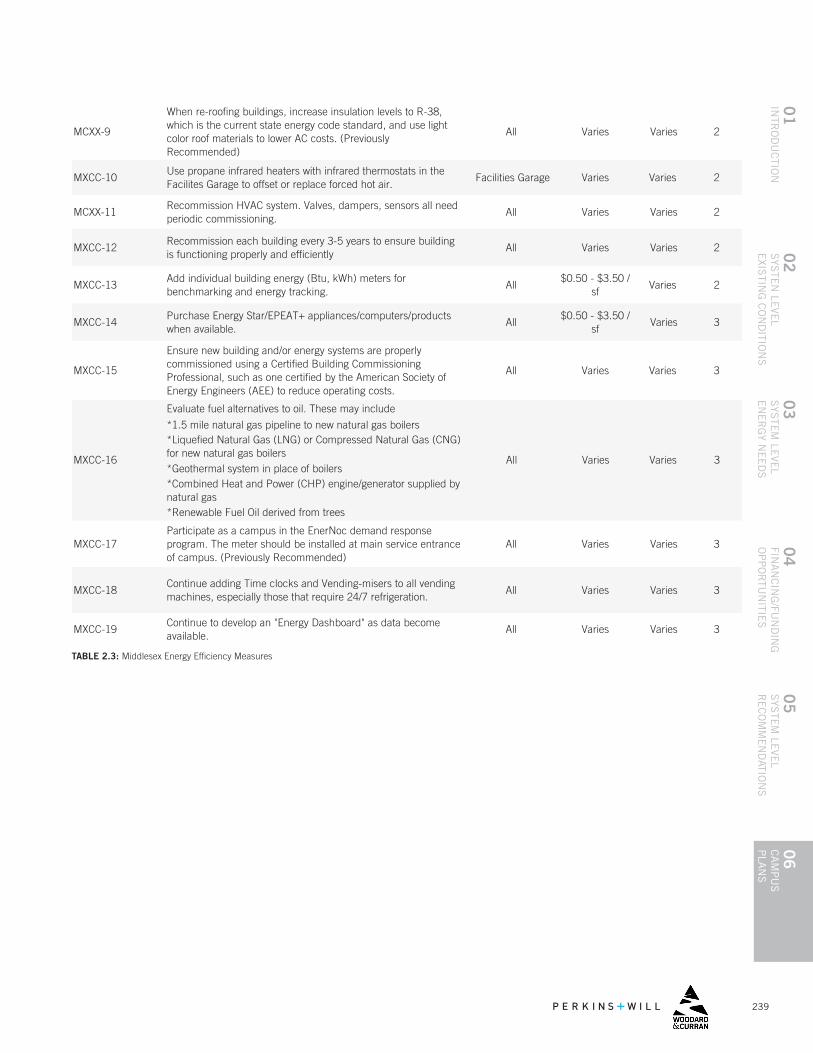
239
04
FINA
NC
ING
/FUN
DIN
G
OP
PO
RTU
NITIE
S
01
INTR
OD
UC
TION
06
CA
MP
US
P
LAN
S
05
SYS
TEM
LEVE
L R
EC
OM
ME
ND
ATION
S
02
SYS
TEN
LEVE
LE
XISTIN
G C
ON
DITIO
NS
03
SYS
TEM
LEVE
L E
NE
RG
Y NE
ED
S
Opportunity ID Energy Conservation or Efficiency Opportunity
Associated Building if Applicable
App. Cost (Before Rebate)
Payback w/rebate (Years) Priority
MCXX-1
The lamps used in the parking lot are currently 320W metal halide pulse start lamps. These fixtures should be retrofitted for either 80W or LED lamps which use less energy and last longer. (Previously Recommended)
All Varies 2 - 6 1
MXCC-2
Convert wall-pack and walkway lighting to LED lamps. These fixtures currently operate 4,000 hours per year and represent potential significant savings in energy cost and maintenance. (Previously Recommended)
All Varies 2 - 6 1
MCXX-3Consult with Eversource to install LED parking lot, exterior, and interior lighting.
Founders Hall Addition
Varies 2 - 6 1
MXCC-4
Install a solar PV system (Energy Center, Wheaton Hall, Snow Hall, and Founders Hall all have the potential for a solar photovoltaic system due to their SW-facing roof surface) (Previously Recommended)
Wheaton Hall PPA PPA 1
MXCC-5Install a solar PV system (Energy Center, Wheaton Hall, Snow Hall, and Founders Hall all have the potential for a solar photovoltaic system due to their SW-facing roof surface)
Snow Hall PPA PPA 1
MXCC-6Install a solar PV system (Energy Center, Wheaton Hall, Snow Hall, and Founders Hall all have the potential for a solar photovoltaic system due to their SW-facing roof surface)
Founders Hall PPA PPA 1
MXCC-7 Consult with Eversource for LED lighting retrofits. All Middlesex Varies 2 - 6 1
MXCC-8Insulate conditioned spaces, especially roofs, even if minimal for garages and similar structures.
Facilities Garage Varies Varies 2
MCXX-9
When re-roofing buildings, increase insulation levels to R-38, which is the current state energy code standard, and use light color roof materials to lower AC costs. (Previously Recommended)
All Varies Varies 2
MXCC-10Use propane infrared heaters with infrared thermostats in the Facilites Garage to offset or replace forced hot air.
Facilities Garage Varies Varies 2
MCXX-11Recommission HVAC system. Valves, dampers, sensors all need periodic commissioning.
All Varies Varies 2
MXCC-12Recommission each building every 3-5 years to ensure building is functioning properly and efficiently
All Varies Varies 2
MXCC-13Add individual building energy (Btu, kWh) meters for benchmarking and energy tracking.
All$0.50 - $3.50 /
sfVaries 2
MXCC-14Purchase Energy Star/EPEAT+ appliances/computers/products when available.
All$0.50 - $3.50 /
sf Varies 3
MXCC-15
Ensure new building and/or energy systems are properly commissioned using a Certified Building Commissioning Professional, such as one certified by the American Society of Energy Engineers (AEE) to reduce operating costs.
All Varies Varies 3
Evaluate fuel alternatives to oil. These may include
*1.5 mile natural gas pipeline to new natural gas boilers*Liquefied Natural Gas (LNG) or Compressed Natural Gas (CNG) for new natural gas boilers*Geothermal system in place of boilers*Combined Heat and Power (CHP) engine/generator supplied by natural gas*Renewable Fuel Oil derived from trees
MXCC-17Participate as a campus in the EnerNoc demand response program. The meter should be installed at main service entrance of campus. (Previously Recommended)
All Varies Varies 3
MXCC-18Continue adding Time clocks and Vending-misers to all vending machines, especially those that require 24/7 refrigeration.
All Varies Varies 3
MXCC-19Continue to develop an "Energy Dashboard" as data become available.
All Varies Varies 3
MXCC-16 All Varies Varies 3
TABLE 2.3: Middlesex Energy Efficiency Measures
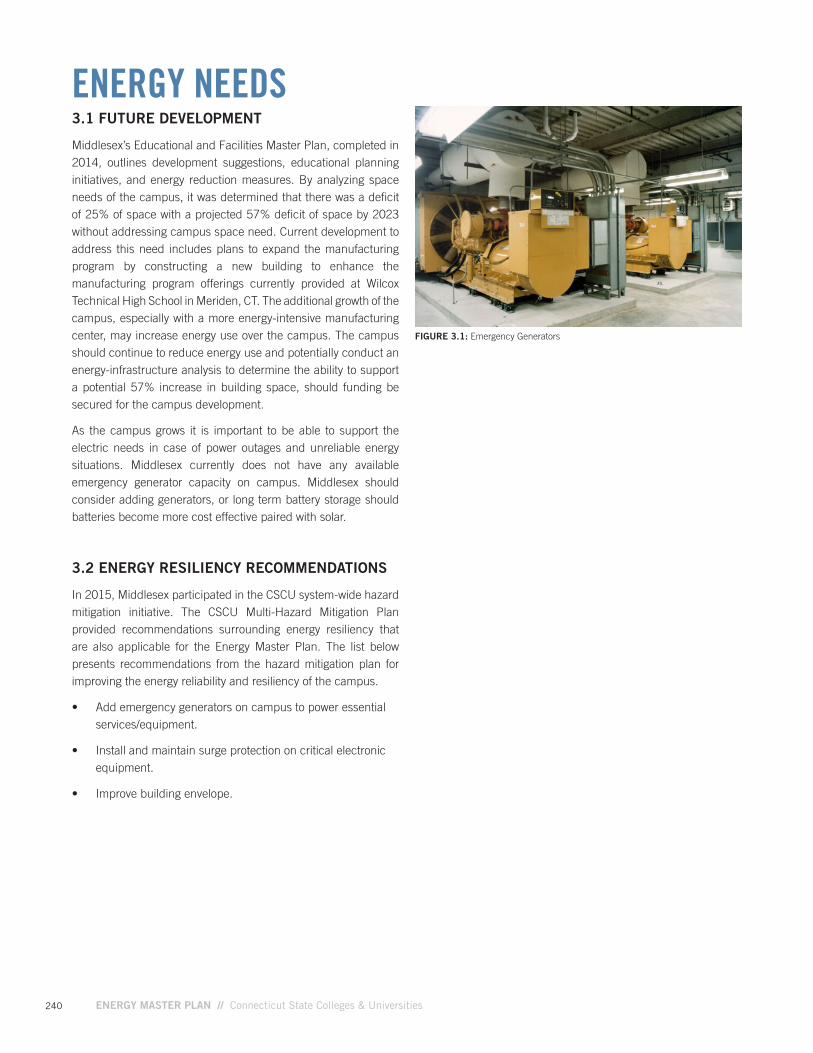
240 ENERGY MASTER PLAN // Connecticut State Colleges & Universities
ENERGY NEEDS3.1 FUTURE DEVELOPMENT
Middlesex’s Educational and Facilities Master Plan, completed in 2014, outlines development suggestions, educational planning initiatives, and energy reduction measures. By analyzing space needs of the campus, it was determined that there was a deficit of 25% of space with a projected 57% deficit of space by 2023 without addressing campus space need. Current development to address this need includes plans to expand the manufacturing program by constructing a new building to enhance the manufacturing program offerings currently provided at Wilcox Technical High School in Meriden, CT. The additional growth of the campus, especially with a more energy-intensive manufacturing center, may increase energy use over the campus. The campus should continue to reduce energy use and potentially conduct an energy-infrastructure analysis to determine the ability to support a potential 57% increase in building space, should funding be secured for the campus development.
As the campus grows it is important to be able to support the electric needs in case of power outages and unreliable energy situations. Middlesex currently does not have any available emergency generator capacity on campus. Middlesex should consider adding generators, or long term battery storage should batteries become more cost effective paired with solar.
3.2 ENERGY RESILIENCY RECOMMENDATIONS
In 2015, Middlesex participated in the CSCU system-wide hazard mitigation initiative. The CSCU Multi-Hazard Mitigation Plan provided recommendations surrounding energy resiliency that are also applicable for the Energy Master Plan. The list below presents recommendations from the hazard mitigation plan for improving the energy reliability and resiliency of the campus.
• Add emergency generators on campus to power essential services/equipment.
• Install and maintain surge protection on critical electronic equipment.
• Improve building envelope.
FIGURE 3.1: Emergency Generators
241
04
FINA
NC
ING
/FUN
DIN
G
OP
PO
RTU
NITIE
S
01
INTR
OD
UC
TION
06
CA
MP
US
P
LAN
S
05
SYS
TEM
LEVE
L R
EC
OM
ME
ND
ATION
S
02
SYS
TEN
LEVE
LE
XISTIN
G C
ON
DITIO
NS
03
SYS
TEM
LEVE
L E
NE
RG
Y NE
ED
S
CONCLUSION / NEXT STEPSMiddlesex has continued to make efforts to improve energy use and provide savings to the campus through their procurement practices and by upgrades such as new more efficient chillers and boilers. The utility data received for FY14 indicates Middlesex has above average energy use. However, as of FY 15 data, energy use has decreased.
The largest area for improvement is at the Central Plant. New higher efficiency equipment along with proper commissioning is expected to significantly reduce energy consumption. More easily implemented energy saving opportunities include LED lighting upgrades. Other top priority initiatives include:
• Management: Middlesex should consider separate submetering for buildings to track energy with more granularity.
• Renewable Energy: Explore additional PPAs for a ground mounted array in the southern portion of the campus, and on portions of the building roof.
• Utility Incentives/ Develop Plan for EEMs: Middlesex should maximize incentive funding for EEMs by working with Eversource, and combining multiple energy saving opportunities in what is known as a “Comprehensive Project.” Further analysis and collaboration with Eversource is required to determine rebate amounts for each opportunity
A summary of further projects and priorities for the campus are listed in Table 2.3. By increased energy tracking, LED lighting upgrades and infrastructure improvements, Middlesex will continue to capitalize on energy savings and become closer to their climate action plan goals.
4.1 CONTACT INFORMATION FOR KEY STAKEHOLDERS
Collecting all the necessary information for this planning effort required a collaborative effort. Below are the stakeholders that were active in providing their expertise about campus current conditions and future needs, and energy related decisions.
MIDDLESEX COMMUNITY COLLEGE
KIMBERLY HOGAN Dean of Administration [email protected] 860-343-5731
EVERSOURCE
JAMES WILLIAMSON Energy Efficiency Consultant [email protected] 860-665-2283
242 ENERGY MASTER PLAN // Connecticut State Colleges & Universities
APPENDIX A: MIDDLESEX DATA METHODOLOGY, ASSUMPTIONS AND NOTESThe following are the data methodology and assumptions that were used when analyzing and benchmarking data for Middlesex:
All three fiscal years have complete consumption data. No information to indicate that the campus uses natural gas, purchased chilled water or steam.
Electricity: Eversource Online (FY13, 14, 15)
Propane: Consumption Reports (FY13,14,15)
• Assumed that the consumption report values do not include the Meriden Center.
Fuel Oil: Consumption Reports (FY13,14,15)
• Assumed that the consumption report values do not include the Meriden Center.

243
04
FINA
NC
ING
/FUN
DIN
G
OP
PO
RTU
NITIE
S
01
INTR
OD
UC
TION
06
CA
MP
US
P
LAN
S
05
SYS
TEM
LEVE
L R
EC
OM
ME
ND
ATION
S
02
SYS
TEN
LEVE
LE
XISTIN
G C
ON
DITIO
NS
03
SYS
TEM
LEVE
L E
NE
RG
Y NE
ED
S