Embed Size (px)
DESCRIPTION
Trabajo de campo en economía sobre el crimen
Citation preview
119
American Economic Journal: Applied Economics 3 (April 2011): 119–136http://www.aeaweb.org/articles.php?doi=10.1257/app.3.2.119
Criminal activity is typically concentrated among young men (Richard B. Freeman 1996; John J. DiIulio Jr. 1996; Steven D. Levitt 2004).1 Most criminals begin
their participation in illegal activities as juvenile or young adult offenders.2 A common proposal in public debates around the world on how to reduce crime is to introduce conscription. For example, in 2007 Labor Minister Membathisi Mdladlana of South Africa proposed army conscription as a response to the high levels of criminality. In the same vein, President Jacques Chirac responded in 2005 to the violent crisis in the Paris suburbs by announcing the creation of a voluntary civil service aimed at young-sters “who failed school and are in the process of social marginalization.” In Argentina, since conscription was halted in 1995, its reimplementation has been repeatedly
1 In the United States, for example, persons aged between 18 and 24 accounted for 28 percent of total property crime arrests, and 77 percent of all arrestees were male (Ann Pastore and Kathleen Maguire 2005). For a Latin American example, see João de Mello and Alexandre Schneider (2010).
2 On the determinants of juvenile crime, see Anne C. Case and Lawrence F. Katz (1991); Levitt (1998); Jeff Grogger (1998); Levitt and Lance Lochner (2001); Brian A. Jacob and Lars Lefgren (2003); Jeffrey R. Kling, Jens Ludwig, and Katz (2005); and Patrick Bayer, Randi Hjalmarsson, and David Pozen (2009).
* Galiani: Department of Economics, Washington University in St. Louis, Campus Box 1208, St Louis, MO 63130-4899 (e-mail: [email protected]); Rossi: Universidad de San Andres, Vito Dumas 284, B1644BID, Victoria, Buenos Aires, Argentina (e-mail: [email protected]); Schargrodsky: Universidad Torcuato Di Tella, Saenz Valiente 1010, C1428BIJ, Buenos Aires, Argentina (e-mail: [email protected]). We thank Horacio Tarelli, Fernando Michelena, Rut Diamint, and the Argentine Army for their cooperation. We are also grateful to Philip Cook, Alexandra Benham, two anonymous referees, and seminar participants at Berkeley, Stanford, Michigan, Northwestern, Birmingham, the Maryland Crime and Population Dynamics Workshop, ESWC, EEA, Fedesarrollo, LACEA, UCEMA, UdeSA, UTDT, and Washington University in St. Louis for helpful comments and suggestions. Maximiliano Appendino, Florencia Borrescio Higa, David Lenis, Andrés Maggi, and Esteban Petruzzello provided excellent research assistance. We acknowledge financial support from the World Bank and the Weidembaum Center at Washington University in St. Louis.
† To comment on this article in the online discussion forum, or to view additional materials, visit the article page at http://www.aeaweb.org/articles.php?doi=10.1257/app.3.2.119.
Conscription and Crime: Evidence from the Argentine Draft Lottery†
By Sebastian Galiani, Martín A. Rossi, and Ernesto Schargrodsky*
We estimate the causal effect of mandatory participation in military service on individuals’ subsequent involvement in criminal activities. To identify this causal effect, we exploit the random assignment of young men to conscription in Argentina through a draft lottery. Using a dataset that includes draft eligibility, participation in military ser-vice, and criminal records, we find that conscription increases the likelihood of developing a criminal record. The effects are significant not only for cohorts that provided military service during wartime, but also for those that served during peacetime. Our results do not support the introduction of conscription for anti-crime purposes. JEL (H56, K42, O17)
ContentsConscription and Crime: Evidence from the Argentine Draft Lottery† 119
I. Military Conscription in Argentina: A Natural Experiment 122II. Data 123III. Results 127A. Main Results 128B. Complementary Results 132IV. Conclusions 134References 135
120 AmEricAn EcOnOmic JOUrnAL: AppLiEd EcOnOmics ApriL 2011
proposed in Congress to address the current crime wave. Similarly, reimplementing conscription in Peru has recently been proposed to reduce violence among youth.3
These policy proposals are based on the assumption that military conscription will reduce young men’s subsequent criminal behavior. For example, military training teaches young men obedience and discipline, which could reduce their rates of crimi-nality. Moreover, by improving health and nutrition and by extending the social net-works of the most deprived to include other socioeconomic groups, military service might enhance labor market prospects, preventing young men from committing property crimes. In addition, military service incapacitates the commission of crime by young men during the time they are serving in military facilities and are thus off the streets.
However, military conscription could instead have a detrimental influence on young men’s criminal behavior. First, by delaying young men’s entry into the labor market, conscription might reduce their future labor market opportunities and thus increase the likelihood that they commit property crimes.4 Second, military ser-vice provides training in the use of weapons, reducing entry costs and potentially increasing participation in armed criminal activity. Finally, conscription may create a social environment prone to violent responses, negative peer effects, and gang for-mation.5 Thus it is not clear a priori whether the overall impact of military service on crime rates is positive or negative. Empirical evidence is needed.
Previous studies have exploited the natural experiment generated by the Vietnam draft lottery in the United States to analyze the impact of serving in the military dur-ing wartime on outcomes such as future earnings (Joshua D. Angrist 1990; Angrist and Stacey H. Chen 2011), alcohol consumption (Jack Goldberg et al. 1991), cig-arette consumption (Daniel Eisenberg and Brian Rowe 2009), health (Angrist et al. 2010; Carlos Dobkin and Reza Shabini 2009), and mortality (Norman Hearst, Thomas B. Newman, and Stephen B. Hulley 1986; Dalton Conley and Jennifer A. Heerwig 2009). In particular, some previous studies have analyzed the relationship between being a war veteran and subsequent criminal behavior (see Thomas Yager, Robert Laufer, and Mark Gallops 1984; Adela Beckerman and Leonard Fontana 1989; Christopher J. Mumola 2000; Leana Allen Bouffard 2003; Margaret E. Noonan and Mumola 2007; Chris Rohlfs 2010). Although the effects are small, the existing evidence shows that exposure to combat is associated with an increase in subsequent number of arrests and likelihood of incarceration.
However, the effects on crime of wartime military service might be quite different from the effects of peacetime conscription. Subjects exposed to combat are likely to suffer from post-traumatic disorders.6 Medical studies document that these patients
3 For South Africa, see News24.com, “Minister moots conscription,” January 30, 2007. For France, see LeMonde.fr, “Jacques Chirac lance le service civil volontaire,” November 17, 2005. For Argentina, see LaNacion.com.ar, “Analizan la restitución de la conscripción,” October 16, 2002; LaNacion.com.ar, “Susana Giménez pidió que vuelva el servicio militar obligatorio,” March 17, 2009; LaNacion.com.ar, “El delito no es prioridad del congreso” December 7, 2009. For Peru, see Peru21.pe, “Polémica por retorno del servicio militar obligatorio,” November 17, 2009.
4 Milton Friedman and other economists stressed the job market costs imposed on draftees in their interven-tions opposing the Vietnam draft in favor of a professional army (see Walter Y. Oi 1967; Sol Tax 1967; and the “Economists’ Statement in Opposition to the Draft”).
5 On violent responses by individuals trained in the use of weapons, see Clifton Bryant (1979). On crime and social interactions, see Edward L. Glaeser, Bruce Sacerdote, and José Scheinkman (1996).
6 In particular, Post-Traumatic Stress Disorder (PTSD), the long-term emotional response to a highly traumatic event, is a diagnosis that was officially identified after the Vietnam War. PTSD is an emotional illness that develops
VOL. 3 nO. 2 121gALiAni ET AL.: cOnscripTiOn And crimE
report different attitudes toward violent crime, higher levels of self-reported aggres-sion, and a higher incidence of potentially dangerous firearm-related behavior than comparison subjects (see Miles McFall et al. 1999, and Thomas Freeman and Vincent Roca 2001). Individuals serving in the military during peacetime are, in principle, not exposed to the kinds of traumatic events that cause these stress disorders.
Thus the impact on crime of serving in the military during peacetime is still an open question and, with it, the validity of those policy recommendations. The main contribution of this paper is to estimate the causal effect of peacetime military con-scription on subsequent criminal behavior.
Our findings have broader policy implications than the existing literature on war veterans’ subsequent criminal behavior. As a public policy, conscription is much more common than is armed conflict, which for most countries is an unwanted and infre-quent occurrence.7 We have been able to find data on conscription for 179 countries, covering 99.8 percent of the world population. Among these 179 countries, 94 have mandatory military service. Among these 94 countries, only 19 are currently involved in some type of armed conflict.8 Thus, over 40 percent of the countries of the world have mandatory military service without being currently involved in armed conflict.
In order to identify the causal effect of conscription on crime, we need to iden-tify a variable that affects participation in conscription but does not affect crime through any other mechanisms. The draft lottery in Argentina offers an opportunity to address this question. The lottery randomly assigned eligibility of all young males to military service based on the last three numbers of their national ID. We exploit this random assignment to identify the causal effect of mandatory military service on the likelihood of later developing a criminal record.
We use a unique set of administrative data that includes draft eligibility, participa-tion in military service, and criminal records for male cohorts born between 1958 and 1962. We complement this with data on draft eligibility and criminal records for male cohorts born between 1929 and 1976. We find that participation in conscription increases the likelihood of developing a subsequent criminal record, particularly for crimes against property and white collar crimes. We also find that conscription has detrimental effects on future job market performance.
Moreover, since our database includes two cohorts that participated in the 1982 Malvinas War between Argentina and the United Kingdom, we are able to iden-tify the difference between being drafted into the military in peacetime versus in wartime. Our results suggest that the effect of conscription on criminal behavior is larger for draftees in the cohorts that participated in the Malvinas War than for other cohorts. However, the effects on crime are also significant for the cohorts that per-formed military service during peacetime. In sum, our results do not encourage the introduction of military conscription to reduce criminal behavior.
as a result of a terribly frightening, life-threatening, or otherwise highly unsafe experience (American Psychiatric Association 1994). For the male population, the highest prevalence rates are found among survivors of military combat. As reported by the National Center for Post-Traumatic Stress Disorder, about 30 percent of Vietnam vet-erans suffer from PTSD.
7 On the practice of military conscription around the world, see War Registers’ International (1998) and Casey B. Mulligan and Andrei Shleifer (2005).
8 See http://www.wri-irg.org/wri.htm (accessed 2007). Out of the 85 countries without conscription, 11 are involved in an armed conflict.
122 AmEricAn EcOnOmic JOUrnAL: AppLiEd EcOnOmics ApriL 2011
The organization of the paper is as follows. Section I describes the natural experiment and the main characteristics of military service in Argentina. Section II discusses the data, and Section III reports the econometric methods and results. Section IV presents our conclusions.
I. Military Conscription in Argentina: A Natural Experiment
From 1901 through 1995, military service in Argentina was mandatory. The length of service was a minimum of one year and a maximum of two years. Service began with a three-month basic instruction period (typically starting in March) dur-ing which recruits learned military norms and were exposed to combat training. After that, conscripts were allocated to a military unit to perform a specific duty, not necessarily related to military training.9
In earlier times, males were called to serve at the age of 21. Later, this was changed to age 18. The cohort born in 1955 was the last cohort starting military ser-vice at age 21. The cohort born in 1958 was the first cohort starting military service at age 18. Because of this change, the cohorts born in 1956 and 1957 were not called at all. Recruits from the cohorts born in 1962 and 1963 participated in the Malvinas War. The cohort born in 1976 faced the draft lottery but eventually was not drafted as conscription was halted.
The eligibility of young males for military service was randomly determined, using the last three digits of their national IDs.10 Each year, for the cohort due to be conscripted the following year, a lottery assigned a number between 1 and 1,000 to each combination of the last three ID digits. The lottery system was run in a public session using a lottery drum filled with a thousand balls number 1–1,000. The first ball released from the lottery drum corresponded to ID number 000, the second released ball to ID number 001, and so on. The lottery was administered by the National Lottery and supervised by the National General Notary in a public session. Results were broadcasted over the radio and published in the main newspapers.
After the lottery, individuals were called for physical and mental examinations. Later on, a cutoff number was announced. Individuals whose ID number had been assigned a lottery number higher than the cutoff number, and who had passed the medical examination, were mandatorily called to military service. Among the ID numbers eligible for conscription, those with the lowest lottery numbers were assigned to the Army, the intermediate numbers to the Air Force, and the highest numbers to the Navy. Conscription in the Army and the Air Force was for one year. Conscription in the Navy was for two years.11
Clerics, seminarians, novitiates, and any individual with family members depen-dent upon him for support were exempted from military service. Deferment to finish high school or attend college was granted up to a maximum of ten years until the
9 On the military service in Argentina, see Ricardo Rodriguez Molas (1983).10 Mandatory national ID numbers were issued at age 18 until 1968 (military service was then served at age 21),
and at birth after that year. During the period of analysis, ID numbers are seven or eight digits long.11 For example, for cohort 1959, the Navy got the individuals who drew 890 to 000, the Air Force got the indi-
viduals who drew 812 to 889, and the Army got the individuals who drew 320 to 811. All the people who drew 1 to 319 were not drafted.
VOL. 3 nO. 2 123gALiAni ET AL.: cOnscripTiOn And crimE
completion of studies (Article 17 of the Law of Military Service). Deferment could also be granted without a particular reason for a maximum of two years (Article 16 of the Law of Military Service). In all cases, the lottery numbers and cutoffs used to decide the outcomes for young men requesting deferment were those of their specific cohort.
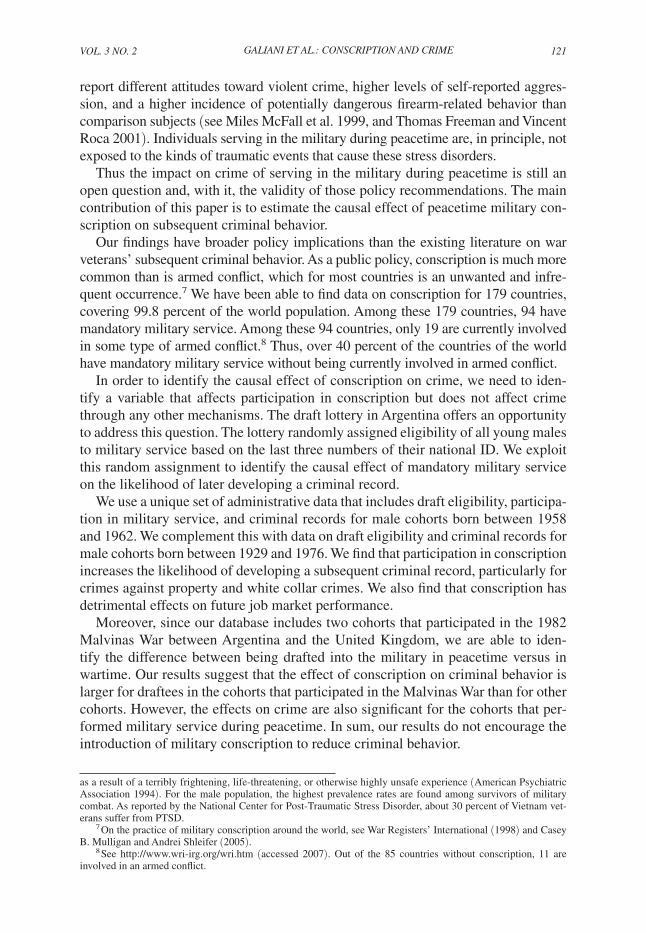
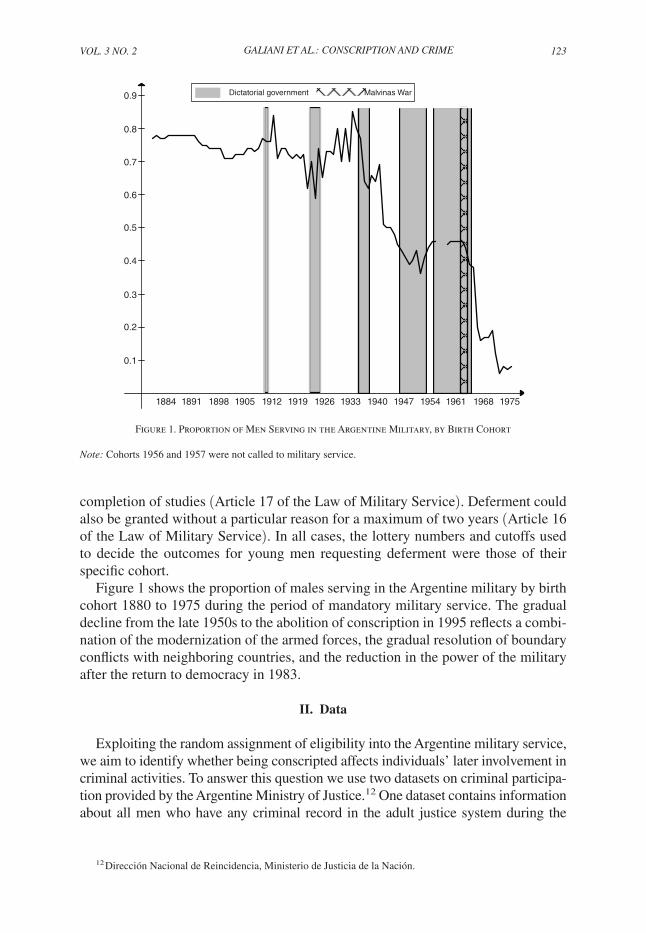
Figure 1 shows the proportion of males serving in the Argentine military by birth cohort 1880 to 1975 during the period of mandatory military service. The gradual decline from the late 1950s to the abolition of conscription in 1995 reflects a combi-nation of the modernization of the armed forces, the gradual resolution of boundary conflicts with neighboring countries, and the reduction in the power of the military after the return to democracy in 1983.
II. Data
Exploiting the random assignment of eligibility into the Argentine military service, we aim to identify whether being conscripted affects individuals’ later involvement in criminal activities. To answer this question we use two datasets on criminal participa-tion provided by the Argentine Ministry of Justice.12 One dataset contains information about all men who have any criminal record in the adult justice system during the
12 Dirección Nacional de Reincidencia, Ministerio de Justicia de la Nación.
Malvinas WarDictatorial government
1884 1891 1898 1905 1912 1919 1926 1933 1940 1947 1954 1961 1968 1975
0.9
0.8
0.7
0.6
0.5
0.4
0.3
0.2
0.1
Figure 1. Proportion of Men Serving in the Argentine Military, by Birth Cohort
note: Cohorts 1956 and 1957 were not called to military service.
124 AmEricAn EcOnOmic JOUrnAL: AppLiEd EcOnOmics ApriL 2011
period 1934–2005, about 1 million observations. An individual has a criminal record if he was ever prosecuted for or convicted of a crime. The dataset does not specify the type, number, or year of crimes involved, so it does not indicate whether an individual committed one or more offences. The dataset also contains the year of birth and the last three digits of the national ID number for every individual included.
Our unit of observation is the set of individuals in the same birth cohort who share the same last three digits of their national ID. For confidentiality reasons, complete ID numbers were not provided. Nevertheless, since the instrument exploited for identification varies only at the birth cohort-ID digits level, this is not a problem for our econometric analysis. For each birth cohort-ID digits combination, we calculate the crime rate as the number of individuals with criminal records divided by the total number of individuals (the population size of the birth cohorts was obtained from census data).
The second database contains detailed information on all adult men who have gone through a criminal process in the adult civil justice system during the period 2000 to 2005 (about 250,000 observations). For each individual the data include birth year, last three digits of ID, and the types of crime committed: use of weap-ons, crime against property, sexual attack, threat, murder, drug trafficking, and white collar crime. This dataset does not indicate the number of specific offences that an individual committed, but it does indicate all the categories of crimes he committed.13
These data come from the civil justice system and do not include crimes commit-ted before adulthood or during conscription, or failure to report for induction into the military. These are accounted for by the juvenile judicial system and the military justice system.14
In addition to crime rates, we will also analyze whether participation in military ser-vice affects labor market prospects. In particular, we consider the impact of conscrip-tion on participation in the formal labor market, unemployment rates, and earnings. Participation in the formal economy was obtained from the social security database which registers social security contributions for each individual, and includes the national ID and year of birth.15 For unemployment and income data, we first identi-fied the occupation declared by each individual in the 2003 national ballot registry. We then imputed, for each occupation, the associated employment status and average hourly earnings, using the official household survey of May 2003.16 Unemployment rates (calculated as the share of unemployed over the active population) and average
13 A limitation of this alternative database is that the type of crime is only specified for 37 percent of the cases. Eligibility into the military service, however, is not correlated with missing crime types in the database. All results mentioned, but not shown, are available from the authors upon request.
14 As our datasets register adult criminal processes of individuals since 18 years of age, for the period when conscripts were called to serve at the age of 21, the database could potentially include crimes committed by indi-viduals before being drafted. This, nevertheless, poses no threat to our identification strategy since, by virtue of ran-domization, crimes committed between 18 and 21 years of age will be balanced between intention-to-treat groups. This cannot happen for cohorts serving at the age of 18 as the lottery was performed the year before incorporation. Regarding contamination of the crime data with failure to report for induction into the military, that is not possible for the second dataset which includes the type of crime.
15 Sistema Integrado de Jubilaciones y Pensiones (SIJP) as of October of 2004. Again, for confidentiality rea-sons, the complete national ID number was not provided. We obtained the rate of participation in the formal econ-omy for each cohort and last three ID digits.
16 Encuesta Permanente de Hogares, INDEC.
VOL. 3 nO. 2 125gALiAni ET AL.: cOnscripTiOn And crimE
hourly earnings (in Argentine pesos) were then calculated for each set of individuals with the same birth cohort and the same last three digits of national ID.
We obtained lottery draft results, military service status, and cutoff numbers from the Argentine Army.17 Using the lottery draft results and the cutoff numbers by cohort, we then defined the dummy variable draft Eligible, which equals one if the lottery number randomly assigned to cohort c and ID i was above the cutoff and therefore draft-eligible, and zero otherwise. This draft Eligible variable identifies the intention-to-treat for the population. Because of the lottery design, it is randomly assigned. We also constructed the treatment variable conscription as the number of men of cohort c and ID i who actually served in the military divided by the total number of men of cohort c and ID i.
Our analysis focuses initially on the cohorts 1958–1962, for whom we have measures of both intention-to-treat and treatment status at the cohort-ID unit level. The average size of these cohorts is 236,330 men, so there are approximately 236 males in each cohort-ID combination. For these cohorts we also obtained data on a set of pre-treatment characteristics, including origin (Argentine-born indigenous, Argentine-born nonindigenous, and naturalized citizens) and province of residence. Data availability by cohort is summarized in Table 1.
We also have the data to construct the intention-to-treat variable draft Eligible for the cohorts of 1929–1955 and 1963–1975.18 For the cohorts of 1955 and 1965, however, the cutoff numbers differed for the five Army corps—cuerpos de ejér-cito—in the country, and the assignment to these Army corps was by place of resi-dence. Our data do not allow us to associate each individual with a particular Army corp. Therefore, in order to avoid measurement errors when we include the 1955 and 1965 cohorts in our sample, we exclude all ID numbers whose lottery numbers lay between the maximum and the minimum cutoffs across the Army corps.19 This problem becomes more severe for the cohorts of 1966–1975, as the cutoff numbers then differed very substantially across the 29 military districts in the country, and the assignment to military district was also geographically determined. Since our data do not allow us to associate each individual with a specific military district, we exclude the cohorts of 1966–1975 from the main analysis. When we do report results for these cohorts, we exclude all ID numbers whose lottery numbers lay between the maximum and the minimum cutoffs.
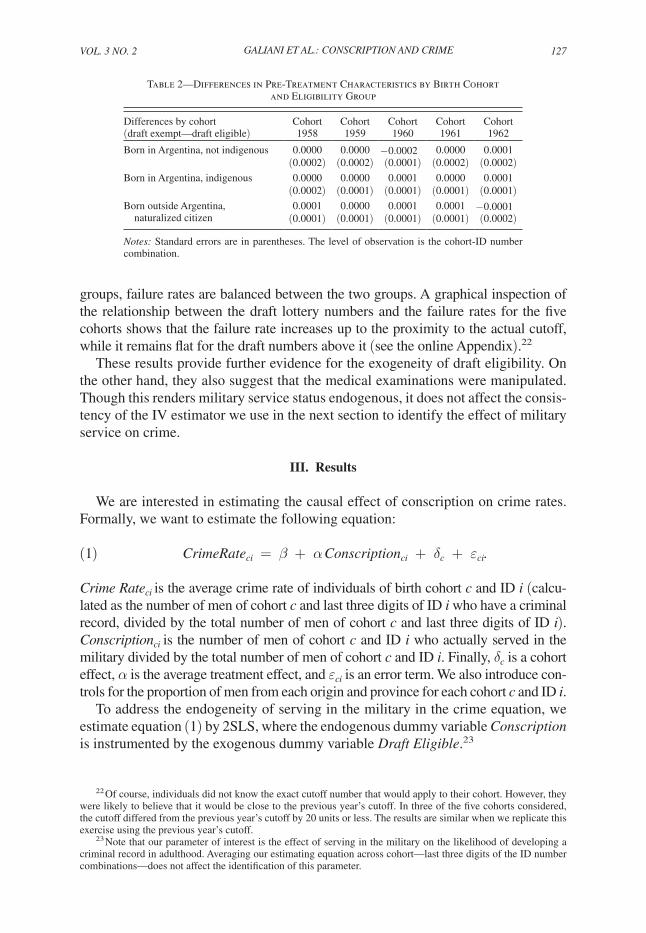
Although eligibility to serve was randomly determined, it is useful to examine whether individuals’ pre-treatment characteristics are balanced across the draft- eligible and the draft-exempted groups. For our available pre-treatment variables, there are no statistically significant differences between the two groups (see Table 2). This suggests that the randomization of draft eligibility allows us to ignore treatment assignment for post-treatment outcomes of interest.20 In addition, the results of the
17 Oficina de Reclutamiento y Movilización, Estado Mayor del Ejército Argentino.18 For cohorts of 1931–1933, 1935–1936, 1938, and 1941 the cutoff number was equal to zero (i.e., the whole
cohort was assigned to provide military service).19 For example, if for a given cohort the cutoff number was 460 in Army corp 1 and 480 in Army corp 2, we
exclude from the analysis the ID numbers in those cohorts that were assigned lottery numbers between 460 and 480 as we are uncertain about their eligibility status.
20 We also test the balancing of pre-treatment province of residence (the country is divided into 24 provinces), and in more than 90 percent of the tests there are no statistically significant differences in these variables across
126 AmEricAn EcOnOmic JOUrnAL: AppLiEd EcOnOmics ApriL 2011
paper do not change when we include all these pre-treatment characteristics as con-trol variables in the regression function.
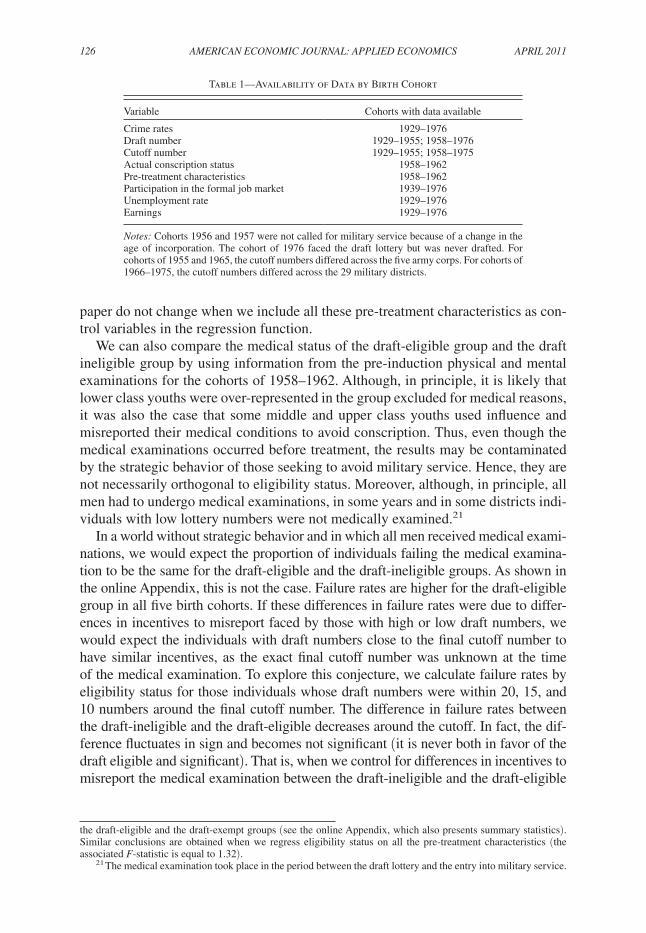
We can also compare the medical status of the draft-eligible group and the draft ineligible group by using information from the pre-induction physical and mental examinations for the cohorts of 1958–1962. Although, in principle, it is likely that lower class youths were over-represented in the group excluded for medical reasons, it was also the case that some middle and upper class youths used influence and misreported their medical conditions to avoid conscription. Thus, even though the medical examinations occurred before treatment, the results may be contaminated by the strategic behavior of those seeking to avoid military service. Hence, they are not necessarily orthogonal to eligibility status. Moreover, although, in principle, all men had to undergo medical examinations, in some years and in some districts indi-viduals with low lottery numbers were not medically examined.21
In a world without strategic behavior and in which all men received medical exami-nations, we would expect the proportion of individuals failing the medical examina-tion to be the same for the draft-eligible and the draft-ineligible groups. As shown in the online Appendix, this is not the case. Failure rates are higher for the draft-eligible group in all five birth cohorts. If these differences in failure rates were due to differ-ences in incentives to misreport faced by those with high or low draft numbers, we would expect the individuals with draft numbers close to the final cutoff number to have similar incentives, as the exact final cutoff number was unknown at the time of the medical examination. To explore this conjecture, we calculate failure rates by eligibility status for those individuals whose draft numbers were within 20, 15, and 10 numbers around the final cutoff number. The difference in failure rates between the draft-ineligible and the draft-eligible decreases around the cutoff. In fact, the dif-ference fluctuates in sign and becomes not significant (it is never both in favor of the draft eligible and significant). That is, when we control for differences in incentives to misreport the medical examination between the draft-ineligible and the draft-eligible
the draft-eligible and the draft-exempt groups (see the online Appendix, which also presents summary statistics). Similar conclusions are obtained when we regress eligibility status on all the pre-treatment characteristics (the associated F-statistic is equal to 1.32).
21 The medical examination took place in the period between the draft lottery and the entry into military service.
Table 1—Availability of Data by Birth Cohort
Variable Cohorts with data available
Crime rates 1929–1976Draft number 1929–1955; 1958–1976Cutoff number 1929–1955; 1958–1975Actual conscription status 1958–1962Pre-treatment characteristics 1958–1962Participation in the formal job market 1939–1976Unemployment rate 1929–1976Earnings 1929–1976
notes: Cohorts 1956 and 1957 were not called for military service because of a change in the age of incorporation. The cohort of 1976 faced the draft lottery but was never drafted. For cohorts of 1955 and 1965, the cutoff numbers differed across the five army corps. For cohorts of 1966–1975, the cutoff numbers differed across the 29 military districts.
VOL. 3 nO. 2 127gALiAni ET AL.: cOnscripTiOn And crimE
groups, failure rates are balanced between the two groups. A graphical inspection of the relationship between the draft lottery numbers and the failure rates for the five cohorts shows that the failure rate increases up to the proximity to the actual cutoff, while it remains flat for the draft numbers above it (see the online Appendix).22
These results provide further evidence for the exogeneity of draft eligibility. On the other hand, they also suggest that the medical examinations were manipulated. Though this renders military service status endogenous, it does not affect the consis-tency of the IV estimator we use in the next section to identify the effect of military service on crime.
III. Results
We are interested in estimating the causal effect of conscription on crime rates. Formally, we want to estimate the following equation:
(1) crimerat e ci = β + α conscriptio n ci + δ c + ε ci .
crime rateci is the average crime rate of individuals of birth cohort c and ID i (calcu-lated as the number of men of cohort c and last three digits of ID i who have a criminal record, divided by the total number of men of cohort c and last three digits of ID i). conscriptionci is the number of men of cohort c and ID i who actually served in the military divided by the total number of men of cohort c and ID i. Finally, δ c is a cohort effect, α is the average treatment effect, and ε ci is an error term. We also introduce con-trols for the proportion of men from each origin and province for each cohort c and ID i.
To address the endogeneity of serving in the military in the crime equation, we estimate equation (1) by 2SLS, where the endogenous dummy variable conscription is instrumented by the exogenous dummy variable draft Eligible.23
22 Of course, individuals did not know the exact cutoff number that would apply to their cohort. However, they were likely to believe that it would be close to the previous year’s cutoff. In three of the five cohorts considered, the cutoff differed from the previous year’s cutoff by 20 units or less. The results are similar when we replicate this exercise using the previous year’s cutoff.
23 Note that our parameter of interest is the effect of serving in the military on the likelihood of developing a criminal record in adulthood. Averaging our estimating equation across cohort—last three digits of the ID number combinations—does not affect the identification of this parameter.
Table 2—Differences in Pre-Treatment Characteristics by Birth Cohort and Eligibility Group
Differences by cohort (draft exempt—draft eligible)
Cohort 1958
Cohort 1959
Cohort 1960
Cohort 1961
Cohort 1962
Born in Argentina, not indigenous 0.0000 0.0000 −0.0002 0.0000 0.0001(0.0002) (0.0002) (0.0001) (0.0002) (0.0002)
Born in Argentina, indigenous 0.0000 0.0000 0.0001 0.0000 0.0001(0.0002) (0.0001) (0.0001) (0.0001) (0.0001)
Born outside Argentina, 0.0001 0.0000 0.0001 0.0001 −0.0001 naturalized citizen (0.0001) (0.0001) (0.0001) (0.0001) (0.0002)
notes: Standard errors are in parentheses. The level of observation is the cohort-ID number combination.
128 AmEricAn EcOnOmic JOUrnAL: AppLiEd EcOnOmics ApriL 2011
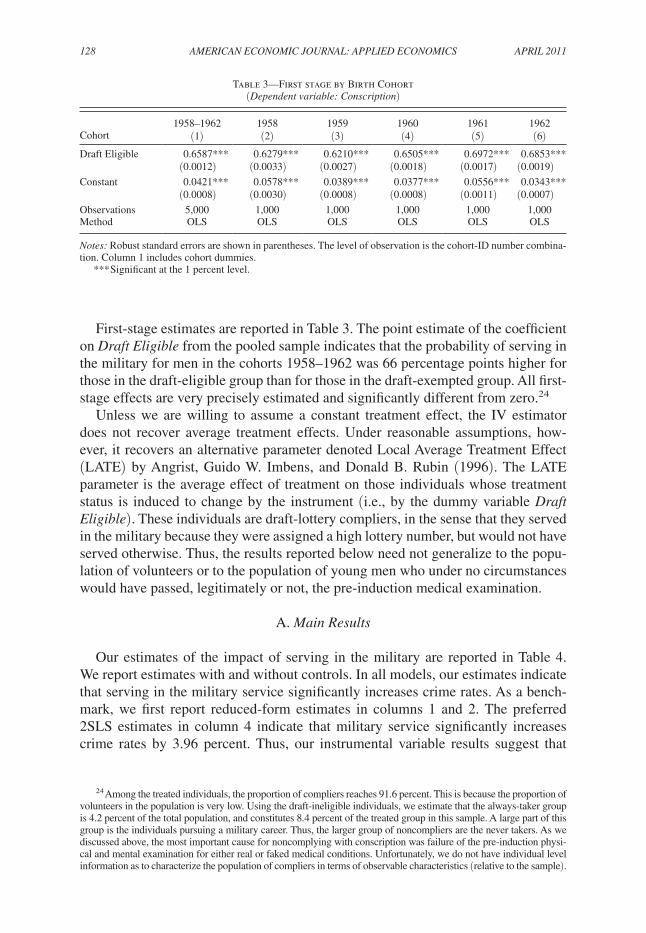
First-stage estimates are reported in Table 3. The point estimate of the coefficient on draft Eligible from the pooled sample indicates that the probability of serving in the military for men in the cohorts 1958–1962 was 66 percentage points higher for those in the draft-eligible group than for those in the draft-exempted group. All first-stage effects are very precisely estimated and significantly different from zero.24
Unless we are willing to assume a constant treatment effect, the IV estimator does not recover average treatment effects. Under reasonable assumptions, how-ever, it recovers an alternative parameter denoted Local Average Treatment Effect (LATE) by Angrist, Guido W. Imbens, and Donald B. Rubin (1996). The LATE parameter is the average effect of treatment on those individuals whose treatment status is induced to change by the instrument (i.e., by the dummy variable draft Eligible). These individuals are draft-lottery compliers, in the sense that they served in the military because they were assigned a high lottery number, but would not have served otherwise. Thus, the results reported below need not generalize to the popu-lation of volunteers or to the population of young men who under no circumstances would have passed, legitimately or not, the pre-induction medical examination.
A. main results
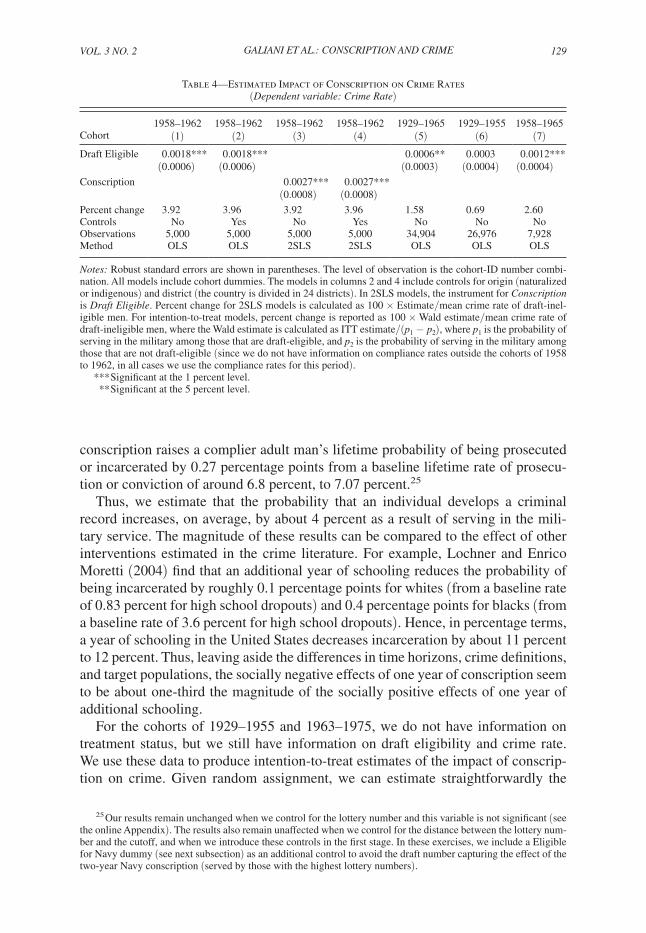
Our estimates of the impact of serving in the military are reported in Table 4. We report estimates with and without controls. In all models, our estimates indicate that serving in the military service significantly increases crime rates. As a bench-mark, we first report reduced-form estimates in columns 1 and 2. The preferred 2SLS estimates in column 4 indicate that military service significantly increases crime rates by 3.96 percent. Thus, our instrumental variable results suggest that
24 Among the treated individuals, the proportion of compliers reaches 91.6 percent. This is because the proportion of volunteers in the population is very low. Using the draft-ineligible individuals, we estimate that the always-taker group is 4.2 percent of the total population, and constitutes 8.4 percent of the treated group in this sample. A large part of this group is the individuals pursuing a military career. Thus, the larger group of noncompliers are the never takers. As we discussed above, the most important cause for noncomplying with conscription was failure of the pre-induction physi-cal and mental examination for either real or faked medical conditions. Unfortunately, we do not have individual level information as to characterize the population of compliers in terms of observable characteristics (relative to the sample).
Table 3—First stage by Birth Cohort (dependent variable: conscription)
1958–1962 1958 1959 1960 1961 1962Cohort (1) (2) (3) (4) (5) (6)Draft Eligible 0.6587*** 0.6279*** 0.6210*** 0.6505*** 0.6972*** 0.6853***
(0.0012) (0.0033) (0.0027) (0.0018) (0.0017) (0.0019)Constant 0.0421*** 0.0578*** 0.0389*** 0.0377*** 0.0556*** 0.0343***
(0.0008) (0.0030) (0.0008) (0.0008) (0.0011) (0.0007)Observations 5,000 1,000 1,000 1,000 1,000 1,000Method OLS OLS OLS OLS OLS OLS
notes: Robust standard errors are shown in parentheses. The level of observation is the cohort-ID number combina-tion. Column 1 includes cohort dummies.
*** Significant at the 1 percent level.
VOL. 3 nO. 2 129gALiAni ET AL.: cOnscripTiOn And crimE
conscription raises a complier adult man’s lifetime probability of being prosecuted or incarcerated by 0.27 percentage points from a baseline lifetime rate of prosecu-tion or conviction of around 6.8 percent, to 7.07 percent.25
Thus, we estimate that the probability that an individual develops a criminal record increases, on average, by about 4 percent as a result of serving in the mili-tary service. The magnitude of these results can be compared to the effect of other interventions estimated in the crime literature. For example, Lochner and Enrico Moretti (2004) find that an additional year of schooling reduces the probability of being incarcerated by roughly 0.1 percentage points for whites (from a baseline rate of 0.83 percent for high school dropouts) and 0.4 percentage points for blacks (from a baseline rate of 3.6 percent for high school dropouts). Hence, in percentage terms, a year of schooling in the United States decreases incarceration by about 11 percent to 12 percent. Thus, leaving aside the differences in time horizons, crime definitions, and target populations, the socially negative effects of one year of conscription seem to be about one-third the magnitude of the socially positive effects of one year of additional schooling.
For the cohorts of 1929–1955 and 1963–1975, we do not have information on treatment status, but we still have information on draft eligibility and crime rate. We use these data to produce intention-to-treat estimates of the impact of conscrip-tion on crime. Given random assignment, we can estimate straightforwardly the
25 Our results remain unchanged when we control for the lottery number and this variable is not significant (see the online Appendix). The results also remain unaffected when we control for the distance between the lottery num-ber and the cutoff, and when we introduce these controls in the first stage. In these exercises, we include a Eligible for Navy dummy (see next subsection) as an additional control to avoid the draft number capturing the effect of the two-year Navy conscription (served by those with the highest lottery numbers).
Table 4—Estimated Impact of Conscription on Crime Rates (dependent variable: crime rate)
1958–1962 1958–1962 1958–1962 1958–1962 1929–1965 1929–1955 1958–1965Cohort (1) (2) (3) (4) (5) (6) (7)Draft Eligible 0.0018*** 0.0018*** 0.0006** 0.0003 0.0012***
(0.0006) (0.0006) (0.0003) (0.0004) (0.0004)Conscription 0.0027*** 0.0027***
(0.0008) (0.0008)Percent change 3.92 3.96 3.92 3.96 1.58 0.69 2.60Controls No Yes No Yes No No NoObservations 5,000 5,000 5,000 5,000 34,904 26,976 7,928Method OLS OLS 2SLS 2SLS OLS OLS OLS
notes: Robust standard errors are shown in parentheses. The level of observation is the cohort-ID number combi-nation. All models include cohort dummies. The models in columns 2 and 4 include controls for origin (naturalized or indigenous) and district (the country is divided in 24 districts). In 2SLS models, the instrument for conscription is draft Eligible. Percent change for 2SLS models is calculated as 100 × Estimate/mean crime rate of draft-inel-igible men. For intention-to-treat models, percent change is reported as 100 × Wald estimate/mean crime rate of draft-ineligible men, where the Wald estimate is calculated as ITT estimate/(p1 − p2), where p1 is the probability of serving in the military among those that are draft-eligible, and p2 is the probability of serving in the military among those that are not draft-eligible (since we do not have information on compliance rates outside the cohorts of 1958 to 1962, in all cases we use the compliance rates for this period).
*** Significant at the 1 percent level. ** Significant at the 5 percent level.
130 AmEricAn EcOnOmic JOUrnAL: AppLiEd EcOnOmics ApriL 2011
intention-to-treat causal effect of military service on crime by estimating the follow-ing reduced-form regression:
(2) crimerat e ci = β + γ draftEligibl e ci + δ c + ε ci ,
where γ is the intention-to-treat effect, and everything else is as in equation (1).26
As shown in columns 5 to 7 of Table 4, we consistently find higher crime rates associated with ID numbers that were eligible for military service because of the lot-tery.27 In column 5, we present the regression for the cohorts of 1929–1965, where we estimate that military service significantly increases the crime rates of draft-eligible individuals by 1.58 percent.28 In columns 6 and 7, we separate the sample by the time when the age of starting military service changed from 21 years old to 18 years old. The effect is larger in the later period, reaching a rate of 2.60 percent. It is smaller and not significant for the earlier period.
That the effect of conscription on crime is larger for the cohorts starting military service at age 18 could be the result of the military service being particularly harmful on individuals just entering the labor market. It is well documented in the literature that early experiences in the labor market, particularly unemployment, have long-lasting effects on individuals’ labor market performance (Marvin M. Smith 1985). For the cohorts enrolled at age 21, the effect of military service on criminal behavior channeled through their labor market experience could be less severe, especially since firms were required to keep their jobs open and to give them a license period to serve in the military. It is also possible that younger people are just more sensitive to this treatment. However, the differential impact cannot be attributed solely to the change in the age of enrollment, as several conditions, including secular increases in crime and data recording, could have changed for the cohorts of 1958–1965 relative to the cohorts of 1929–1955.
Even though our study relies on well-documented randomization, we try three additional experiments to test further the exogeneity of our instrument. First, we restrict the sample to observations receiving a low number in the lottery (i.e., not eligible). We sort the low numbers for each cohort and divide them by their median, assigning a false treatment status to the IDs above the median. As it should be if the lottery was truly random, we do not find differences between the crime rates of these groups. This is particularly relevant since, as explained above, the failure rate for medical examinations was increasing up to the proximity to the actual cutoff, while it remained flat for the draft lottery numbers above that. Thus, although the two
26 In all the regressions, population size was obtained from census data, assigning an equal number of individu-als to each cohort-ID combination (that is, the size of each cohort-ID combination was calculated as the size of the cohort divided by 1,000). For the cohorts 1958–1962, we can estimate precisely the size of each cohort-ID combina-tion. Conclusions remain unchanged when we use this alternative source for these cohorts.
27 As explained above, for the cohorts 1966–1975, the cutoff numbers differed across the 29 military districts. The results show no change if we still include in the regressions the cohort-ID combinations from these cohorts for which we are positive there is no measurement error on their eligibility status.
28 Although, of course, the effect of eligibility on actual provision of military service could have varied over time, for ease of comparison of results across cohorts, we transform ITT estimates into percentages using the com-pliance rates of cohorts 1958–1962 for which that information is available.
VOL. 3 nO. 2 131gALiAni ET AL.: cOnscripTiOn And crimE
noneligible groups created by this procedure show different conscription-avoidance activity, there are no differences in their crime rates.
Second, we exploit the change in the draft age from 21 years old to 18 years old. This change meant that the cohorts 1956 and 1957 fully skipped military service (cohort 1955 was drafted in 1975 and served in 1976, and cohort 1958 was drafted in 1976 and served in 1977). The individuals from cohorts 1956 and 1957 were aware well in advance of their exemption, as the age change had been approved by Congress in 1973. We impute to these cohorts the draft lottery results corresponding to cohorts 1958 and 1959, which they would have obtained given their national ID numbers if the age requirement had not changed. Since these two cohorts were actu-ally not drafted, we should not observe any significant crime differences between the two groups, and this is indeed what we find.
Third, we take advantage of the fact that the cohort of 1976 faced the draft lottery but eventually was not drafted.29 We create a fake cutoff number for this cohort using the cutoff number for the cohort of 1975. When we compare crime rates for those with “high” and “low” numbers, we find no differences in crime rates between the two groups. The coefficient for the fake dummy for being draft-eligible has the opposite sign and it is not significant (the point estimate is −0.0012 with a standard error of 0.0009). This experiment also addresses the potential concern that the outcome of the lottery could have a direct effect on crime through mechanisms other than military service. Draft avoidance activity could have a direct effect, or the lottery result could directly depress the morale of young men. For the 1976 cohort, the instrument could directly affect crime rates through the “avoidance” or “depression” effects but not through the effect on actual military service. However, we find no differences in crime rates between those who were and were not at risk of being drafted.
In Table 5, we explore the differential effects of military service in peacetime versus in wartime. The two birth cohorts that participated in the Malvinas War were those of 1962 and 1963. Although only a small fraction of the draftees in these cohorts were exposed to actual combat (out of the 202,500 men incorporated from these cohorts, approximately 12,500 conscripts actually participated in the war and had some level of combat exposure), most of those drafted were mobilized to the conflict region of Patagonia and the South Atlantic. Results in columns 1 and 2 indicate that the effect of military service on crime is larger for draftees in the two cohorts serving during the Malvinas War. It is noteworthy that the effect is also significant for the cohorts that provided military service during peacetime, which comprise most of our sample.
We show in columns 3 and 4 of Table 5 that the effect of conscription on crime was larger for those who served in the Navy and thus did two years of service, rather than one year for the Army and the Air Force.30,31 This result is consistent with the
29 The lottery took place on May 27, 1994, but conscription was later abolished by Presidential Decree on August 31, 1994 and validated by Congress on December 14, 1994.
30 Of course, serving in the Navy can be thought of as a different treatment compared to serving in the Army or in the Air Force. For instance, young men serving in the Navy may have been exposed to a more violent environ-ment since ports are usually places with high levels of criminal activity.
31 We estimate the regressions in columns 1 and 2 of Table 5 in reduced form as we do not have treatment sta-tus information to identify the individuals who actually participated in the Malvinas War out of the men from the 1962 and 1963 cohorts. Similarly, we estimate the regressions in columns 3 and 4 in reduced form as we know the
132 AmEricAn EcOnOmic JOUrnAL: AppLiEd EcOnOmics ApriL 2011
notion that early differences in the labor market experience is a channel through which military service affects criminal behavior.32
B. complementary results
Our main results suggest that conscription increases the likelihood of develop-ing a criminal record during adulthood. One possible explanation is that military service delays young men’s entry into the labor market and thereby affects their future opportunities. This argument is consistent with our finding that serving for two years in the Navy, rather than one year in the Army and Air Force, has additional deleterious effects.
To explore further the channels through which military service may affect crimi-nal behavior, we use an alternative dataset that includes specific types of crime. The database used so far includes information on all criminal records since the mid 1930s. This second database has information on all men who have gone through the adult criminal justice system from 2000 to 2005, by specific type of crime.
In Table 6, we estimate the effect of military service on subsequent criminal behavior by type of crime. If participation in the military service negatively affects the labor market prospects of young men by delaying their entry into the labor mar-ket, it should particularly induce them to commit crimes which have a pecuniary
Navy/Air Force/Army cutoff numbers, but we do not have actual treatment information by the armed force of incor-poration. If we combine the intention-to-treat Eligible during Malvinas War and Eligible for Navy variables with the treatment variable Conscription in 2SLS regressions for the 1958–1962 cohorts, the Eligible during Malvinas War and Eligible for Navy coefficients are positive but not statistically significant, whereas Conscription remains highly significant.
32 We also explore the interaction of conscription and dictatorial (military) government. The effect of conscrip-tion on crime seems to have been homogeneous for draftees providing military service during democratic and dicta-torial governments. The participation of conscripts in violations of human rights during the military dictatorship of 1976–1983 was minimal, and there are no cases of conscripts being prosecuted for those types of crime.
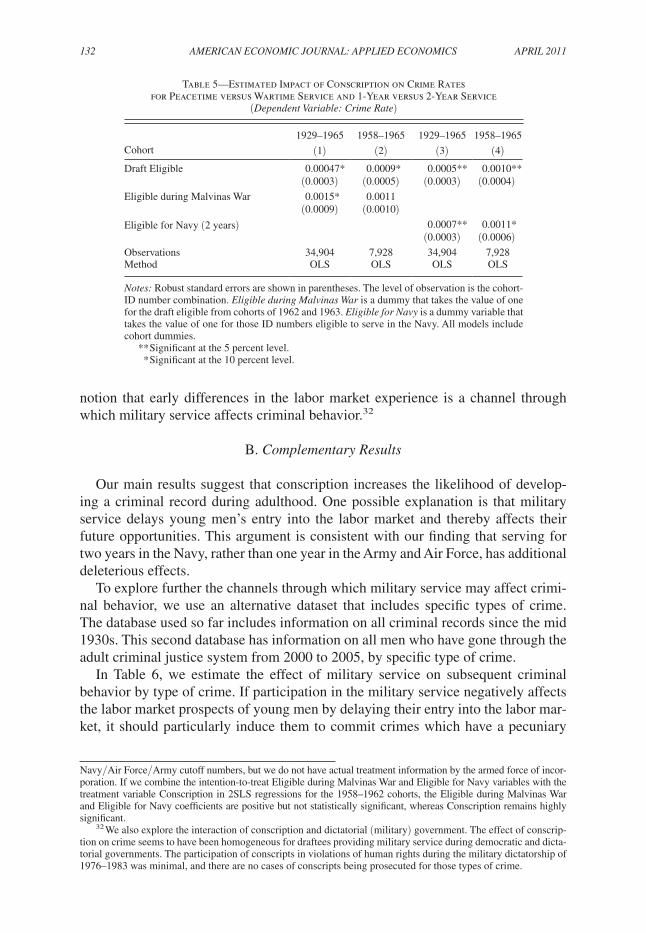
Table 5—Estimated Impact of Conscription on Crime Rates for Peacetime versus Wartime Service and 1-Year versus 2-Year Service
(dependent Variable: crime rate)
1929–1965 1958–1965 1929–1965 1958–1965Cohort (1) (2) (3) (4)Draft Eligible 0.00047* 0.0009* 0.0005** 0.0010**
(0.0003) (0.0005) (0.0003) (0.0004)Eligible during Malvinas War 0.0015* 0.0011
(0.0009) (0.0010)Eligible for Navy (2 years) 0.0007** 0.0011*
(0.0003) (0.0006)Observations 34,904 7,928 34,904 7,928Method OLS OLS OLS OLS
notes: Robust standard errors are shown in parentheses. The level of observation is the cohort-ID number combination. Eligible during malvinas War is a dummy that takes the value of one for the draft eligible from cohorts of 1962 and 1963. Eligible for navy is a dummy variable that takes the value of one for those ID numbers eligible to serve in the Navy. All models include cohort dummies.
** Significant at the 5 percent level. * Significant at the 10 percent level.
VOL. 3 nO. 2 133gALiAni ET AL.: cOnscripTiOn And crimE
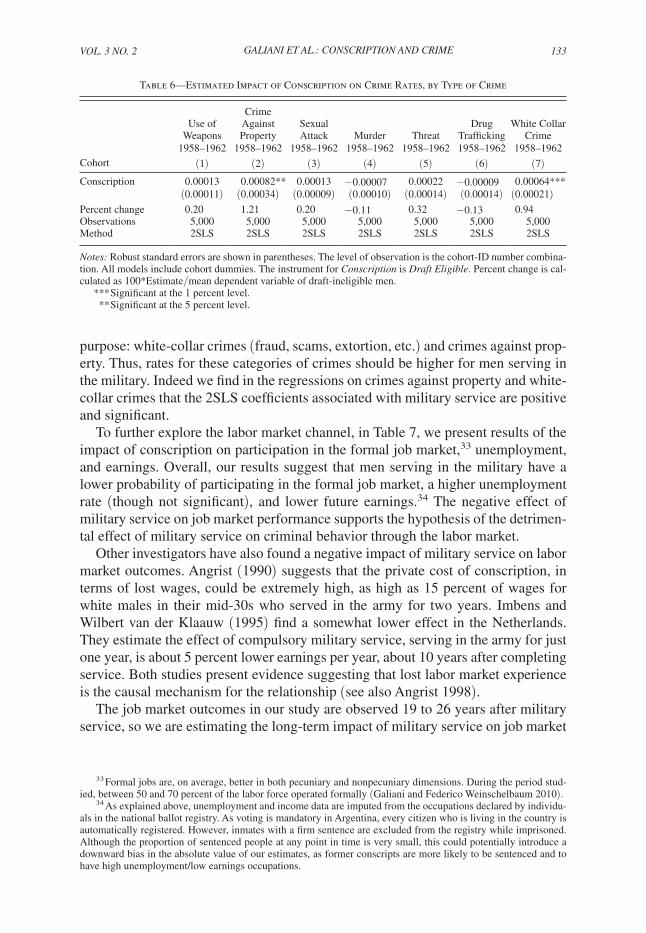
purpose: white-collar crimes (fraud, scams, extortion, etc.) and crimes against prop-erty. Thus, rates for these categories of crimes should be higher for men serving in the military. Indeed we find in the regressions on crimes against property and white-collar crimes that the 2SLS coefficients associated with military service are positive and significant.
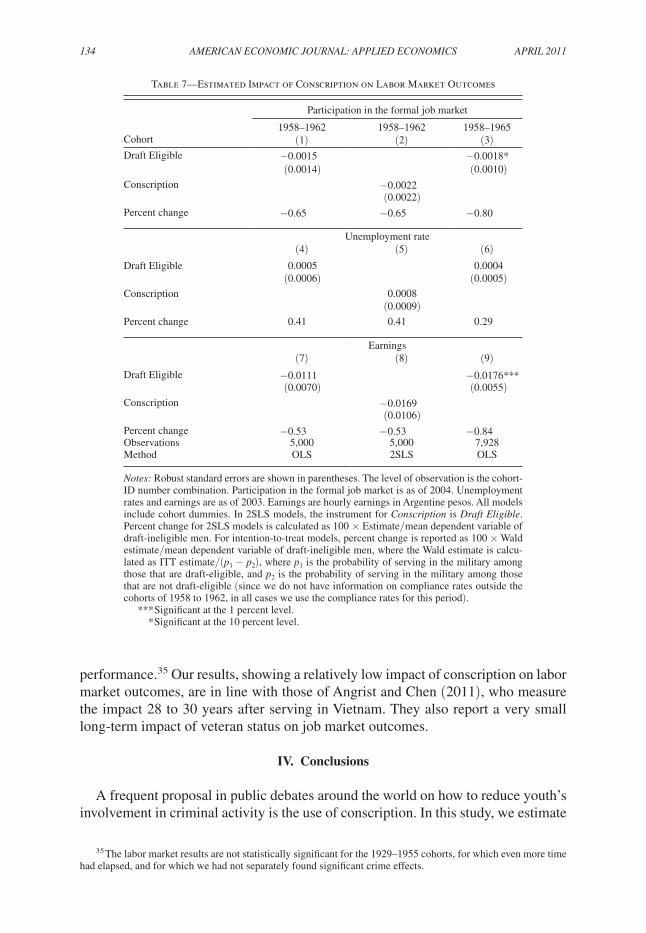
To further explore the labor market channel, in Table 7, we present results of the impact of conscription on participation in the formal job market,33 unemployment, and earnings. Overall, our results suggest that men serving in the military have a lower probability of participating in the formal job market, a higher unemployment rate (though not significant), and lower future earnings.34 The negative effect of military service on job market performance supports the hypothesis of the detrimen-tal effect of military service on criminal behavior through the labor market.
Other investigators have also found a negative impact of military service on labor market outcomes. Angrist (1990) suggests that the private cost of conscription, in terms of lost wages, could be extremely high, as high as 15 percent of wages for white males in their mid-30s who served in the army for two years. Imbens and Wilbert van der Klaauw (1995) find a somewhat lower effect in the Netherlands. They estimate the effect of compulsory military service, serving in the army for just one year, is about 5 percent lower earnings per year, about 10 years after completing service. Both studies present evidence suggesting that lost labor market experience is the causal mechanism for the relationship (see also Angrist 1998).
The job market outcomes in our study are observed 19 to 26 years after military service, so we are estimating the long-term impact of military service on job market
33 Formal jobs are, on average, better in both pecuniary and nonpecuniary dimensions. During the period stud-ied, between 50 and 70 percent of the labor force operated formally (Galiani and Federico Weinschelbaum 2010).
34 As explained above, unemployment and income data are imputed from the occupations declared by individu-als in the national ballot registry. As voting is mandatory in Argentina, every citizen who is living in the country is automatically registered. However, inmates with a firm sentence are excluded from the registry while imprisoned. Although the proportion of sentenced people at any point in time is very small, this could potentially introduce a downward bias in the absolute value of our estimates, as former conscripts are more likely to be sentenced and to have high unemployment/low earnings occupations.
Table 6—Estimated Impact of Conscription on Crime Rates, by Type of Crime
Use of Weapons
Crime Against Property
Sexual Attack Murder Threat
Drug Trafficking
White Collar Crime
1958–1962 1958–1962 1958–1962 1958–1962 1958–1962 1958–1962 1958–1962Cohort (1) (2) (3) (4) (5) (6) (7)Conscription 0.00013 0.00082** 0.00013 −0.00007 0.00022 −0.00009 0.00064***
(0.00011) (0.00034) (0.00009) (0.00010) (0.00014) (0.00014) (0.00021)Percent change 0.20 1.21 0.20 −0.11 0.32 −0.13 0.94Observations 5,000 5,000 5,000 5,000 5,000 5,000 5,000Method 2SLS 2SLS 2SLS 2SLS 2SLS 2SLS 2SLS
notes: Robust standard errors are shown in parentheses. The level of observation is the cohort-ID number combina-tion. All models include cohort dummies. The instrument for conscription is draft Eligible. Percent change is cal-culated as 100*Estimate/mean dependent variable of draft-ineligible men.
*** Significant at the 1 percent level. ** Significant at the 5 percent level.
134 AmEricAn EcOnOmic JOUrnAL: AppLiEd EcOnOmics ApriL 2011
performance.35 Our results, showing a relatively low impact of conscription on labor market outcomes, are in line with those of Angrist and Chen (2011), who measure the impact 28 to 30 years after serving in Vietnam. They also report a very small long-term impact of veteran status on job market outcomes.
IV. Conclusions
A frequent proposal in public debates around the world on how to reduce youth’s involvement in criminal activity is the use of conscription. In this study, we estimate
35 The labor market results are not statistically significant for the 1929–1955 cohorts, for which even more time had elapsed, and for which we had not separately found significant crime effects.
Table 7—Estimated Impact of Conscription on Labor Market Outcomes
Participation in the formal job market
1958–1962 1958–1962 1958–1965Cohort (1) (2) (3)Draft Eligible −0.0015 −0.0018*
(0.0014) (0.0010)Conscription −0.0022
(0.0022)Percent change −0.65 −0.65 −0.80
Unemployment rate(4) (5) (6)
Draft Eligible 0.0005 0.0004(0.0006) (0.0005)
Conscription 0.0008(0.0009)
Percent change 0.41 0.41 0.29
Earnings(7) (8) (9)
Draft Eligible −0.0111 −0.0176***(0.0070) (0.0055)
Conscription −0.0169(0.0106)
Percent change −0.53 −0.53 −0.84Observations 5,000 5,000 7,928Method OLS 2SLS OLS
notes: Robust standard errors are shown in parentheses. The level of observation is the cohort-ID number combination. Participation in the formal job market is as of 2004. Unemployment rates and earnings are as of 2003. Earnings are hourly earnings in Argentine pesos. All models include cohort dummies. In 2SLS models, the instrument for conscription is draft Eligible. Percent change for 2SLS models is calculated as 100 × Estimate/mean dependent variable of draft-ineligible men. For intention-to-treat models, percent change is reported as 100 × Wald estimate/mean dependent variable of draft-ineligible men, where the Wald estimate is calcu-lated as ITT estimate/(p1 − p2), where p1 is the probability of serving in the military among those that are draft-eligible, and p2 is the probability of serving in the military among those that are not draft-eligible (since we do not have information on compliance rates outside the cohorts of 1958 to 1962, in all cases we use the compliance rates for this period).
*** Significant at the 1 percent level. * Significant at the 10 percent level.
VOL. 3 nO. 2 135gALiAni ET AL.: cOnscripTiOn And crimE
the causal effect of serving in the military on subsequent criminal behavior. We exploit the random assignment of young men to military conscription in Argentina through a draft lottery to identify this causal effect. Our results suggest that, even though military conscription may prevent some crime by keeping young men off the streets and potentially improving their subsequent inclusion into society, mecha-nisms operating in the opposite direction are such that the overall impact of serving in the military is to increase the likelihood of having a subsequent criminal record. The effect is stronger for the birth cohorts who participated in the Malvinas War, but we also show a deleterious effect of peacetime conscription on subsequent criminal participation. The effect is small but precisely estimated.
One channel through which military service could operate is by delaying con-scripts’ entry into the labor market. We find that military service has detrimental effects on future job market performance, and that the effects are stronger for crimes against property and white collar crimes, and for the individuals who served longer. These ancillary results are consistent with this hypothesis.
We conclude that appeals for the use of military conscription to reduce criminal behavior are not warranted. Further research would be necessary to gauge the gen-eralization of our findings to other countries.
REFERENCES
American Psychiatric Association. 1994. diagnostic and statistical manual of mental disorders. fourth ed. Washington, DC: American Psychiatric Association.
Angrist, Joshua D. 1990. “Lifetime Earnings and the Vietnam Era Draft Lottery: Evidence from Social Security Administrative Records.” American Economic review, 80(3): 313–36.
Angrist, Joshua D. 1998. “Estimating the Labor Market Impact of Voluntary Military Service Using Social Security Data on Military Applicants.” Econometrica, 66(2): 249–88.
Angrist, Joshua D., and Stacey H. Chen. 2011. “Long-Term Economic Consequences of Vietnam-Era Conscription: Schooling, Experience, and Earnings.” American Economic Journal: Applied Eco-nomics, 3(2): 96–118.
Angrist, Joshua, Stacey H. Chen, and Brigham R. Frandsen. 2010. “Did Vietnam Veterans Get Sicker in the 1990s? The Complicated Effects of Military Service on Self-Reported Health.” Journal of public Economics, 94(11–12): 824–37.
Angrist, Joshua D., Guido W. Imbens, and Donald B. Rubin. 1996. “Identification of Causal Effects Using Instrumental Variables.” Journal of the American statistical Association, 91(434): 444–55.
Bayer, Patrick, Randi Hjalmarsson, and David Pozen. 2009. “Building Criminal Capital behind Bars: Peer Effects in Juvenile Corrections.” Quarterly Journal of Economics, 124(1): 105–47.
Beckerman, Adela, and Leonard Fontana. 1989. “Vietnam Veterans and the Criminal Justice System: A Selected Review.” criminal Justice and Behavior, 16(4): 412–28.
Bouffard, Leana Allen. 2003. “Examining the Relationship between Military Service and Criminal Behavior during the Vietnam Era: A Research Note.” criminology, 41(2): 491–510.
Bryant, Clifton. 1979. Khaki-collar crime: deviant Behavior in the military context. New York: Free Press.
Case, Anne C., and Lawrence F. Katz. 1991. “The Company You Keep: The Effects of Family and Neigh-borhood on Disadvantaged Youths.” National Bureau of Economic Research Working Paper 3705.
Conley, Dalton, and Jennifer A. Heerwig. 2009. “The Long-Term Effects of Military Conscription on Mortality: Estimates from the Vietnam-era Draft Lottery.” National Bureau of Economic Research Working Paper 15105.
de Mello, João M. P., and Alexandre Schneider. 2010. “Assessing São Paulo’s Large Drop in Homi-cides: The Role of Demography and Policy Interventions.” In The Economics of crime: Lessons for and from Latin America, ed. Rafael Di Tella, Sebastian Edwards, and Ernesto Schargrodsky, 207–35. Chicago: University of Chicago Press.
DiIulio, John J., Jr. 1996. “Help Wanted: Economists, Crime and Public Policy.” Journal of Economic perspectives, 10(1): 3–24.
136 AmEricAn EcOnOmic JOUrnAL: AppLiEd EcOnOmics ApriL 2011
Dobkin, Carlos, and Reza Shabini. 2009. “The Health Effects of Military Service: Evidence from the Vietnam Draft.” Economic inquiry, 47 (1): 69–80.
Eisenberg, Daniel, and Brian Rowe. 2009. “The Effect of Smoking in Young Adulthood on Smoking Later in Life: Evidence Based on the Vietnam Era Draft Lottery.” Forum for Health Economics and policy, 12(2).
Freeman, Richard B. 1996. “Why Do So Many Young American Men Commit Crimes and What Might We Do about It?” Journal of Economic perspectives, 10(1): 25–42.
Freeman, Thomas, and Vincent Roca. 2001. “Gun Use, Attitudes toward Violence, and Aggression among Combat Veterans with Chronic Posttraumatic Stress Disorder.” Journal of nervous and mental disease, 189(5): 317–20.
Galiani, Sebastian, and Federico Weinschelbaum. 2010. “Modelling Informality Formally: House-holds and Firms.” Unpublished.
Glaeser, Edward L., Bruce Sacerdote, and José A. Scheinkman. 1996. “Crime and Social Interactions.” Quarterly Journal of Economics, 111(2): 507–48.
Goldberg, Jack, Margaret S. Richards, Robert J. Anderson, and Miriam B. Rodin. 1991. “Alcohol Consumption in Men Exposed to the Military Draft Lottery: A Natural Experiment.” Journal of substance Abuse, 3(3): 307–13.
Grogger, Jeff. 1998. “Market Wages and Youth Crime.” Journal of Labor Economics, 16(4): 756–91.Hearst, Norman, Thomas B. Newman, and Stephen B. Hulley. 1986. “Delayed Effects of the Mili-
tary Draft on Mortality. A Randomized Natural Experiment.” new England Journal of medicine, 314(10): 620–24.
Imbens, Guido, and Wilbert van der Klaauw. 1995. “Evaluating the Cost of Conscription in The Neth-erlands.” Journal of Business and Economic statistics, 13(2): 207–15.
Jacob, Brian A., and Lars Lefgren. 2003. “Are Idle Hands the Devil’s Workshop? Incapacitation, Con-centration, and Juvenile Crime.” American Economic review, 93(5): 1560–77.
Kling, Jeffrey R., Jens Ludwig, and Lawrence F. Katz. 2005. “Neighborhood Effects on Crime for Female and Male Youth: Evidence from a Randomized Housing Voucher Experiment.” Quarterly Journal of Economics, 120(1): 87–130.
Levitt, Steven D. 1998. “Juvenile Crime and Punishment.” Journal of political Economy, 106(6): 1156–85.
Levitt, Steven D. 2004. “Understanding Why Crime Fell in the 1990s: Four Factors That Explain the Decline and Six That Do Not.” Journal of Economic perspectives, 18(1): 163–90.
Levitt, Steven D., and Lance Lochner. 2001. “The Determinants of Juvenile Crime.” In risky Behavior among Youths: An Economic Analysis, ed. Jonathan Gruber, 327–74. Chicago: University of Chicago Press.
Lochner, Lance, and Enrico Moretti. 2004. “The Effect of Education on Crime: Evidence from Prison Inmates, Arrests, and Self-Reports.” American Economic review, 94(1): 155–89.
McFall, Miles, Alan Fontana, Murray Raskind, and Robert Rosenheck. 1999. “Analysis of Violent Behavior in Vietnam Combat Veteran Psychiatric Inpatients with Posttraumatic Stress Disorder.” Journal of Traumatic stress, 12(3): 501–17.
Mulligan, Casey B., and Andrei Shleifer. 2005. “Conscription as Regulation.” American Law and Eco-nomics review, 7(1): 85–111.
Mumola, Christopher J. 2000. “Veterans in Prison or Jail.” Department of Justice, Office of Justice Programs, Bureau of Justice Statistics Special Report. Washington, DC, January.
Noonan, Margaret E., and Christopher J. Mumola. 2007. “Veterans in State and Federal Prison, 2004.” US Department of Justice, Office of Justice Programs, Bureau of Justice Statistics Special Report. Washington, DC, May.
Oi, Walter Y. 1967. “The Economic Cost of the Draft.” American Economic review, 57(2): 39–62.Pastore, Ann, and Kathleen Maguire. 2005. sourcebook of criminal Justice statistics, 2003. Washing-
ton, DC: Bureau of Justice Statistics.Rodríguez Molas, Ricardo. 1983. El servicio militar Obligatorio. Buenos Aires: CEAL.Rohlfs, Chris. 2010. “Does Combat Exposure Make You a More Violent or Criminal Person? Evidence
from the Vietnam Draft.” Journal of Human resources, 45(2): 271–300.Smith, Marvin M. 1985. “Early Labor Market Experiences of Youth and Subsequent Wages.” Ameri-
can Journal of Economics and sociology, 44(4): 391–400.Tax, Sol, ed. 1967. The draft: A Handbook of Facts and Alternatives. Chicago: University of Chicago
Press.War Resisters’ International. 1998. “Refusing to Bear Arms: A Worldwide Survey of Conscription and
Conscientious Objection to Military Service.” London: War Resisters’ International.Yager, Thomas, Robert Laufer, and Mark Gallops. 1984. “Some Problems Associated With War Expe-
rience in Men of the Vietnam Generation.” Archives of general psychiatry, 41(4): 327–33.