Embed Size (px)
Citation preview
CONSERVATION GENETICS OF PANTHERA PARDUS IN
SOUTH AFRICA: PHYLOGEOGRAPHY OF
MITOCHONDRIAL LINEAGES
NICOLE MARTINS
Supervisors:
Assoc. Professor Lawrence Kirkendall (University of Bergen, Norway)
Assoc. Professor Conrad Matthee (University of Stellenbosch, South Africa)
Dissertation presented for the Degree of Master of Philosophy (Zoology)
at the University of Bergen
SEPTEMBER 2006

2
DECLARATION
I, the undersigned, hereby declare that the work contained in this dissertation is my own
original work and that I have not previously in its entirety or in part submitted it at any
university for a degree.
Signature: ………………..
Date: ………………..
3
ABSTRACT
Leopards (Panthera pardus) are one of the most adaptable cats, having a wider distribution
than any other large felid. In South Africa some populations are currently threatened, existing
as heavily fragmented or isolated entities due to human expansion, habitat loss and direct
persecution. Using 309 base pairs of the mitochondrial DNA control region (mtDNA CR), the
population structure, population history and genetic diversity of leopards in South Africa was
investigated. Segments revealed 7 variable sites, resulting in 7 mtDNA haplotypes. Analyses
by AMOVA revealed two distinct mtDNA genetic assemblages, the first corresponding to the
Western Cape; and the second comprising the Eastern Cape, Kwazulu Natal, Limpopo and
Mpumalanga regions. Clades were estimated to have diverged during the Pleistocene, between
66,500 and 112,000 years ago. The leopard population in South Africa appears to have been
stable for a long period of time and overall displays high levels of mtDNA genetic diversity.
Genetic diversity estimates for leopards in the Western Cape, however, were exceptionally low
(π = 0.16%), comparable to that found in inbred cheetah populations. This suggests that
Western Cape clade may have suffered genetic impoverishment due to having undergone a
recent demographic change. Although our data only reflects maternal phylogeography and rely
on small sample sizes, it can nonetheless be used as a framework for developing future
management strategies for leopards in South Africa.

4
ACKNOWLEDGEMENTS
Firstly, I wish to thank my supervisors, Associate Professor Lawrence Kirkendall and
Associate Professor Conrad A. Matthee, for their intellectual input, encouragement, support
and invaluable advice. I also wish to thank all individuals affiliated with the Evolutionary
Genomics Group at Stellenbosch University, especially Sandi-Willows Munrow, Liezl
Mortimer, Hanneline Smit, Jane Sakwa, Dr. Bettine Jansen van Vuuren and Dr. Sophie von der
Heyden for providing expertise, laboratory training and countless useful suggestions.
I wish to thank all individuals and organizations who contributed and collected leopard
specimens, without which this study would have been impossible. In this regard, I wish to
thank members of Cape Nature, Jaco van Deventer, Peter Lloyd, Guy Palmer and Rika du
Plessis, for collecting samples on a continual basis throughout this study and for providing the
necessary permits, logistical support and field assistance during the trapping of leopards in the
Cederberg. I wish to thank Lodolozi Game Reserve and C. C. Africa for allowing me to
collect samples on their reserve and for their fantastic hospitality. I also wish to thank Hennie
Swanevelder (Eastern Cape Nature Conservation), Adrian Armstrong, Graham Kearley
(University of Port Elizabeth), Gerrie Camacho (Mpumalanga Parks Board), Cailey Owen
(K.E.R.I. Research), Villiers Steyn (The Tuli Leopard Project), Iziko Museum, Amathole
Museum and Pretoria Museum for providing samples from their collections.
Many thanks, to all institutions and companies for providing financial support over the past
two and a half years. I wish to thank Bergen University, for providing funding required to
complete this project and Masters degree. I also wish to thank Africa Geographic and the Cape
Leopard Trust for providing supplementary financial support.
Special thanks to my husband, Quinton Martins (The Cape Leopard Trust) for spending
countless hours out in the Cederberg mountains trying to catch these elusive creatures and for
his encouragement throughout my studies.
Lastly, I wish to thank my parents, Raymond and Velma Baatjes for their constant love and
support throughout my life.

5
TABLE OF CONTENTS
DECLARATION..........................................................................................................................2
ABSTRACT .................................................................................................................................3
ACKNOWLEDGEMENTS .........................................................................................................4
TABLE OF CONTENTS .............................................................................................................5
GENERAL INTRODUCTION ....................................................................................................6
Felidae Phylogeny ....................................................................................................................7
Origin and Systematics of Panthera pardus ............................................................................7
The origin of modern leopards .............................................................................................7
Taxonomy of Panthera pardus ............................................................................................8
Life history characteristics of Panthera pardus .......................................................................8
Distribution of Panthera pardus ..............................................................................................9
Aims .......................................................................................................................................11
MATERIALS AND METHODS ...............................................................................................12
Samples...................................................................................................................................12
Molecular Analysis.................................................................................................................15
DNA extraction, amplification and sequencing .................................................................15
Sequence alignment and data analysis ...............................................................................16
RESULTS...................................................................................................................................19
DISCUSSION.............................................................................................................................25
Population structure and gene flow ........................................................................................25
Population History..................................................................................................................26
Implications for the conservation of leopards in South Africa...............................................28
REFERENCES ...........................................................................................................................30
Appendix 1 .................................................................................................................................37
Appendix 2 .................................................................................................................................38
Appendix 3 .................................................................................................................................39
Appendix 4 .................................................................................................................................41
Appendix 5 .................................................................................................................................46
Appendix 6 .................................................................................................................................48
6
GENERAL INTRODUCTION
In Africa, the leopard’s (Panthera pardus) historic range spanned the entire continent. Today,
although its’ geographic range is still extensive, many leopard populations now exist as heavily
fragmented or isolated entities. This has largely been due to anthropogenic factors such as,
human population expansion, habitat reduction, hunting, poaching and ‘problem-animal’
control (Norton, 1986; Uphyrkina et al., 2001). In South Africa, a severe threat to the
leopards’ continued survival is ‘leopard-farmer’ conflict. In the former Cape Province, bounty
systems were implemented as early as 1658, as leopards’ and other predators, posed a serious
threat to the livelihood of the Dutch settlers (Skead, 1980; Norton, 1986). Three hundred years
of persecution followed with bounty systems abolished in the 1960’s. By the time leopards
were declared a “protected wild animal” in 1974, population numbers and distributional range
had been severely reduced (Norton, 1986). In the Cape, dwindling leopard populations cling to
survival within key refuges in the Cape Fold Mountains.
An important component of current management strategies to conserve threatened or
endangered species is not only to maintain viable population sizes, but also to preserve genetic
diversity. Populations in the southern part of South Africa (Western and Eastern Cape) have
long been recognized as morphologically different due to their smaller stature, being only half
the size of their northern counterparts (Skinner and Smithers, 1990). Recent taxonomic and
phylogeographic research identified only one subspecies, P. p. pardus, occurring throughout
Africa (Miththapala et al. 1996; Uphyrkina et al. 2001). This study, however, was able to
collect only 5 samples from one population in the Kruger National Park, South Africa. It is
generally assumed that leopards in sub-Saharan Africa comprise one continuous population
with little or no population structuring, as they are able to disperse over large distances and are
highly adaptable. This, however may not be true for South African populations, as leopards
appear to be absent from the central region (Fig. 1), thereby making any north-south migration
unlikely. Uphyrkina’s (2001) study therefore can not be used as an accurate representation of
the phylogeographic partitioning of leopards in South Africa. This study therefore is an
attempt to elucidate the genetic diversity and population structuring of leopards in South
Africa. It will also determine whether the smaller leopards of the ‘Cape’ should be recognized
as a separate management unit. This in turn will have important implications for the
7
conservation status of these leopards as well as for future management and translocation
policies.
Felidae Phylogeny
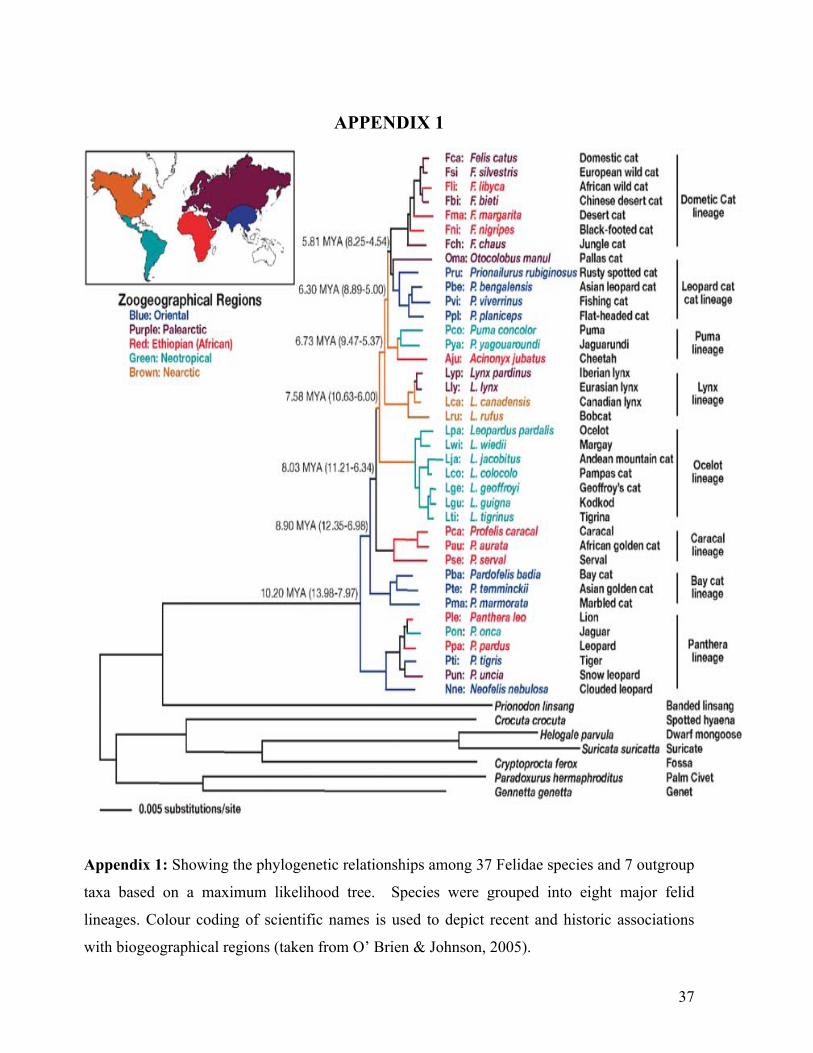
The Felidae is represented by 37 extant species, which diverged from a common ancestor
during the Miocene, 10-15 million years ago (O’Brien & Johnson, 2005). Recent phylogenetic
research reveals the separation of this family into eight distinct lineages (Appendix 1), the
domestic cat, the leopard cat (Asian), the pumas, the Lynx, the ocelot, the Pantherine group,
the caracal and the bay cat lineage (Johnson & O’Brien, 1997; Johnson, et al. 2005, as cited in
O’Brien & Johnson, 2005).
Origin and Systematics of Panthera pardus
The origin of modern leopards
Based on fossil records, the lion and the leopard occurred simultaneously in Tanzania, Africa,
approximately 3.5 million years ago while fossils of a jaguar-like leopard, approximately 2
million years old, were found in the Indian Siwaliks (Hemmer, 1976; Turner & Anton, 1997).
Divergence between lion and leopards should therefore pre-date these fossil remains.
Genetic markers, together with the fossil record, argue for an African origin for modern
leopard subspecies dating between 470,000 and 825,000 years ago, with a more recent
migration into Asia approximately 169,000 to 400,000 years ago (Uphyrkina et al. 2001,
O'Brien & Johnson, 2005). Using DNA sequences from the control region (CR) and NADH-5
of mitochondrial DNA (mtDNA), and 25 polymorphic microsatellite loci, Uphyrkina et al.
(2001), established that African leopards, Panthera pardus pardus (Linneaus, 1758), possessed
the highest genetic diversity in both mtDNA and microsatellite loci than any other population
(Appendix 2). African leopards were also shown to have more mtDNA sites in common with
outgroups, P. leo (lion); P. tigris (tiger); P. onca (jaguar); and P. uncia (snow leopard), than
other populations sampled.

8
Taxonomy of Panthera pardus
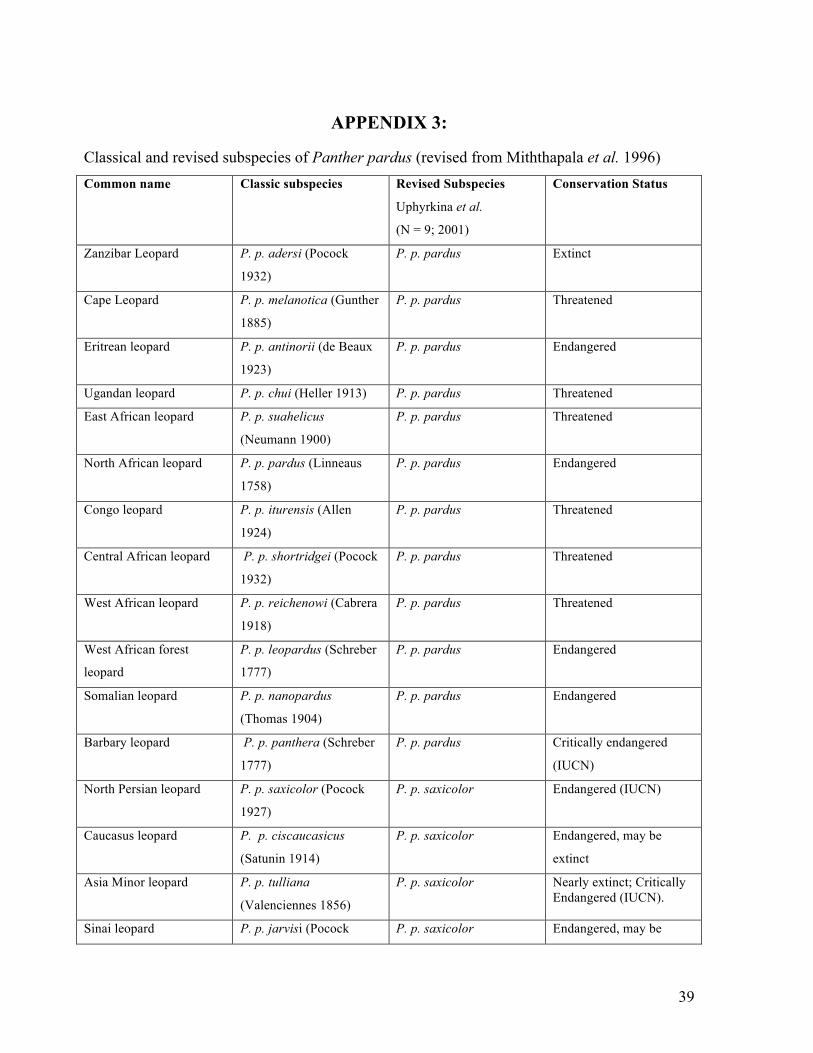
Pocock (1932) described 27 subspecies of the leopard, based on global variation in
morphology, pelage colour and patterning (Appendix 3). Thirteen subspecies were recognised
in Africa alone with P. p. melanotica and P. p. shortridgei occurring in the sub-Saharan region
(Smithers, 1971; Skinner and Smithers, 1990). P. p. melanotica was, however, later regarded
as a melanistic form rather than a separate subspecies (Dobroruka, 1966). Melanism in
leopards can be found throughout their range and is inherited as a recessive trait (Eizirik et al.,
2003). New research employing molecular genetic tools has led to the taxonomic revision of
the leopard into nine distinct subspecies worldwide (Miththapala et al., 1996; Uphyrkina et al.,
2001), with only one, P. p. pardus, occurring throughout Africa. Uphyrkina et al. (2001),
however, states that “this may be an underestimate of modern phylogeographic population
structure” due to inadequate sampling of populations in Africa: only 17 leopards from 7
populations throughout Africa were included in these analyses, presumably due to the logistical
difficulties of obtaining DNA samples.
Life history characteristics of Panthera pardus
Leopards are generalist predators, preferring to hunt at night. They will prey on anything from
large antelope (Le Roux & Skinner, 1989), to rodents (Norton et al., 1986), fish or even dung
beetles (Fey, 1964). Their adaptable diet has allowed leopard populations to extend their
range, occupy diverse habitats, and so become one of the most widespread cat species in the
world. Where leopards co-habit agricultural regions, they are occasionally responsible for
depredation of livestock such as sheep, goats or cattle. Such ‘leopard-farmer’ conflict often
results in the local extermination of the species (Stuart, 1981).
Leopards are secretive, solitary cats, making demographic studies of populations virtually
impossible. Current studies utilizing camera traps or GPS collars are costly and generally only
assess one particular population. Populations, however, can vary drastically in ecological
characteristics, depending on food availability and terrain. In South Africa, leopards were
found to have home range sizes of approximately 400 km2 in the Kgalagadi National Park
(Bothma & le Riche, 1984), between 388 to 487 km2 in the Jonkershoek mountains (Norton &
9
Lawson, 1985), but an order of magnitude smaller (40 to 69 km2) in the Cederberg mountains
(Norton & Henley, 1987). This variation between populations often makes demographic
studies less revealing as the information is not always generalizable.
Both male and female leopards are territorial, scent marking by spraying urine and protecting
their territories against individuals of the same sex (Skinner and Smithers, 1990). Territories
of males are generally larger than those of females, while the territories of several females may
overlap that of one male. Sub-adults disperse at roughly 13-18 months of age (Skinner and
Smithers, 1990). Young males will usually disperse further in search of territories as they
require larger home ranges, and this could affect the genetic structuring of a population.
Leopards also have short generation times, reaching reproductive maturity between 2-4 years
of age (Skinner and Smithers, 1990).
Morphological differences in leopards from various habitats in South Africa have been
observed (Pocock, 1932; Norton, 1984; Skinner & Smithers, 1990), the most apparent
difference being the significantly smaller size (mass) of leopards occurring in the Cape region.
“Bushveld” leopards of the savanna regions have an average weight of 50-60 kg for males, and
30-40 kg for females, while leopards in the Cape average 30-40 kg for males and 20-28 kg for
females (Norton, 1984; Skinner & Smithers, 1990). Differences in size have long been
attributed to variation in nutrition. In the Cederberg mountains of the Western Cape, South
Africa and the Matopo hills of Zimbabwe, leopards were found to prey predominantly on rock
hyrax (Procavia capensis) and smaller antelope species, such as klipspringer (Oreotragus
oreatragus) (Norton et al., 1986; Grobler & Wilson, 1972), while feeding mainly on medium
sized mammals and antelope species in the Kalahari (Bothma & le Riche, 1984). This factor,
however, has never been studied or shown to cause the variation in size of leopards.
Distribution of Panthera pardus
Leopards are one of the most adaptable cats, having a wider distribution than any other large
carnivore. Globally their range spans both hemispheres, where they can be found in at least 80
countries (Turnbull-Kemp, 1967). Leopards can occupy mountainous, forested, or semi-desert
10
areas (Skinner & Smithers, 1990), occurring at elevations ranging from sea level to 5700m –
recorded on Mount Kilimanjaro (Guggisberg, 1975). Their ability to inhabit such a diverse
range of habitats is attributed primarily to their flexible diet. In South Africa, their distribution
includes the mountains of the Cape Fold Belt, the Magaliesberg, Waterberg, Soutpansberg,
Drakensberg, lowveld areas of Mpumalanga, northern KwazuluNatal as well as along the
Orange river (Fig. 1). The fact that leopards are so ubiquitous throughout Africa, has led to a
degree of complacency amongst conservation bodies to better manage and protect the species.
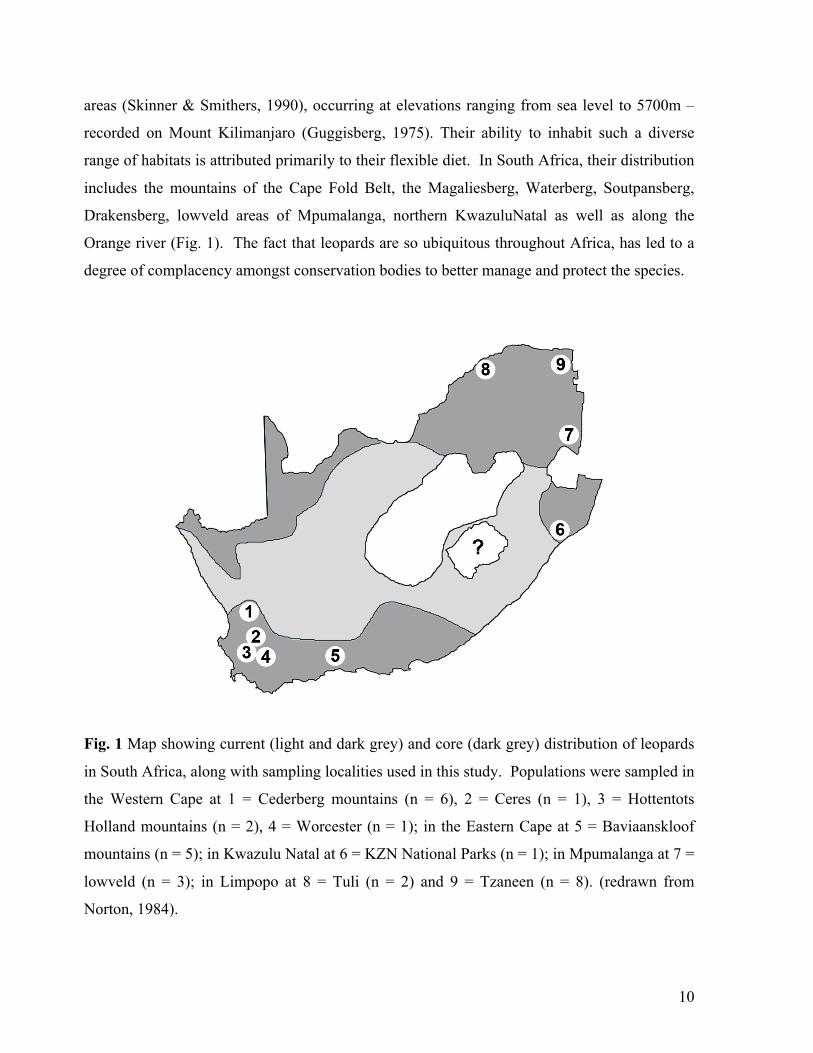
Fig. 1 Map showing current (light and dark grey) and core (dark grey) distribution of leopards
in South Africa, along with sampling localities used in this study. Populations were sampled in
the Western Cape at 1 = Cederberg mountains (n = 6), 2 = Ceres (n = 1), 3 = Hottentots
Holland mountains (n = 2), 4 = Worcester (n = 1); in the Eastern Cape at 5 = Baviaanskloof
mountains (n = 5); in Kwazulu Natal at 6 = KZN National Parks (n = 1); in Mpumalanga at 7 =
lowveld (n = 3); in Limpopo at 8 = Tuli (n = 2) and 9 = Tzaneen (n = 8). (redrawn from
Norton, 1984).

11
Aims
The aims of this project were to:
1. Collect as many genetic samples from leopards, throughout their South African range,
as possible. These will be available for planned future genetic studies undertaken, as an
important component of conservation strategies for South African leopards.
2. To attain preliminary estimates of gene flow and genetic relatedness amongst South
African populations by analyzing a segment of the mtDNA CR.
3. To test the hypothesis that the Cape population is a unique genetic unit.

12
MATERIALS AND METHODS
Samples
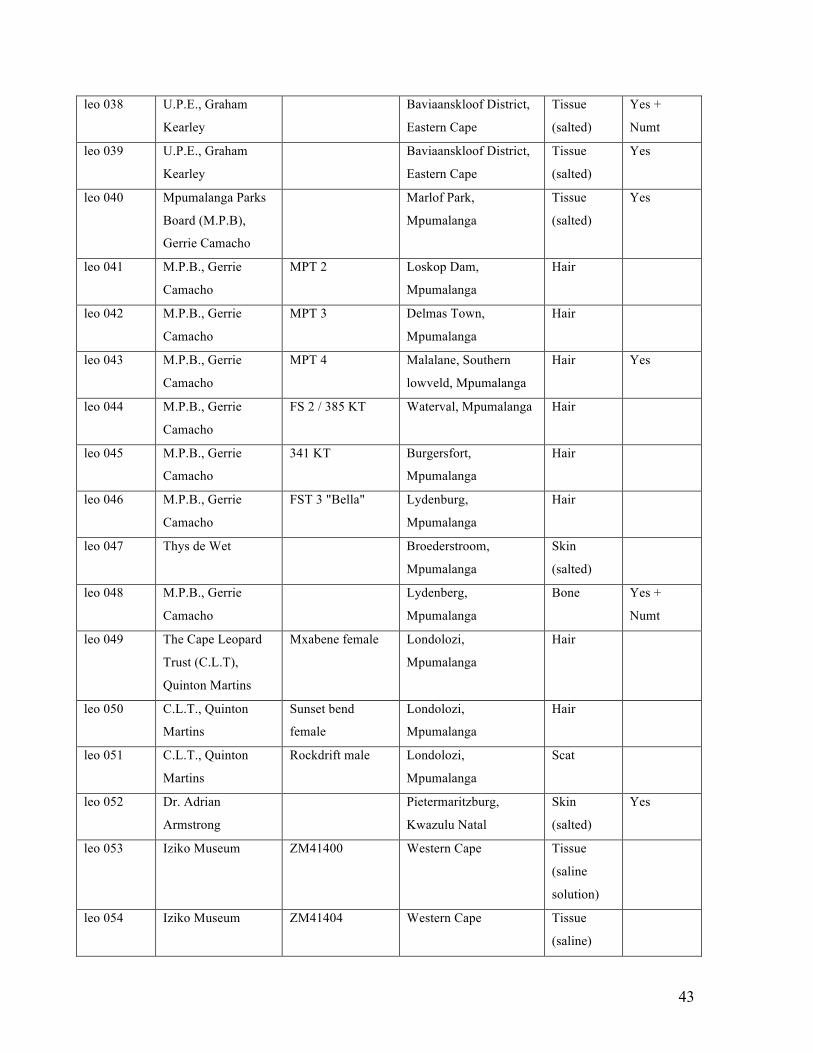
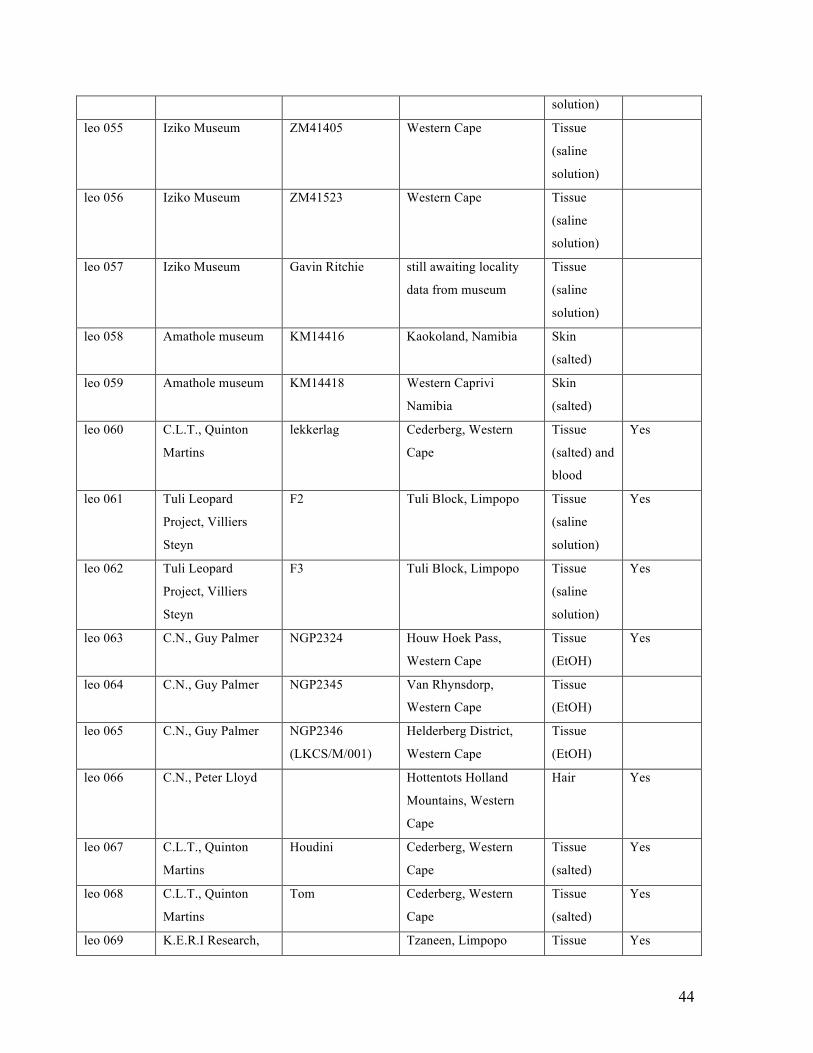
Samples of 82 individual leopards were obtained from various localities within South Africa
(Appendix 4). Nature conservation officials and private researchers provided most of the
specimens used to construct the phylogeography of leopards in South Africa. It should be noted
that none of the individuals sampled, were from captive populations or from breeding projects.
Hair, tissue and pelt samples were preserved by collectors in ethanol, saline solutions or by
drying. Tissue samples received in solution were dehydrated with the use of salts before DNA
extraction. Due to the poor quality of DNA in some of the samples, not all successfully
amplified the mtDNA CR. A total of 29 samples were eventually used in this investigation
(Table 1).
Table 1: Leopard sample collection used in this study, including region of origin, sampling
code, assigned mtDNA haplotype and source of specimens.
Geographical
Area
Number of
Individuals
Sample Code
mtDNA
Haplotype
Sample Sources
Western Cape:
Cederberg 6 CED001 1 Cape Nature – Rika du
Plessis
CED002 1 Cape Nature – Rika du
Plessis
CED009 1 Amathole museum
CED060 1 The Cape Leopard Trust -
Quinton Martins
CED067 1 The Cape Leopard Trust -
Quinton Martins
CED068 1 The Cape Leopard Trust -
Quinton Martins

13
Ceres 1 CER019 1 Amathole museum
Worcester 1 WOR020 1 Amathole museum
Hottentots
Holland
mountains
2 HOT066 1 Cape Nature – Peter Lloyd
HOT063 2 Cape Nature – Guy Palmer
Eastern Cape:
Baviaanskloof
mountains
5 BAV003 3 Eastern Cape Nature
Conservation - Hennie
Swanevelder
BAV004 3 Eastern Cape Nature
Conservation - Hennie
Swanevelder
BAV037 3 University of Port Elizabeth
- Graham Kearley
BAV038 3 University of Port Elizabeth
- Graham Kearley
BAV039 3 University of Port Elizabeth
- Graham Kearley
Kwazulu Natal
(KZN):
KZN Parks 1 KZN052 4 KZN Parks - Dr. Adrian
Armstrong
Mpumalanga:
Lowveld 3 MPU040 6 Mpumalanga Parks Board -
Gerrie Camacho

14
MPU043 6 Mpumalanga Parks Board -
Gerrie Camacho
MPU048 5 Mpumalanga Parks Board -
Gerrie Camacho
Limpopo:
Tuli Block 2 TUL061 6 Tuli Leopard Project -
Villiers Steyn
TUL062 6 Tuli Leopard Project -
Villiers Steyn
Tzaneen 8 TZA069 5 K.E.R.I Research - Cailey
Owen
TZA070 5 K.E.R.I Research - Cailey
Owen
TZA071 5 K.E.R.I Research - Cailey
Owen
TZA073 5 K.E.R.I Research - Cailey
Owen
TZA074 7 K.E.R.I Research - Cailey
Owen
TZA075 5 K.E.R.I Research - Cailey
Owen
TZA076 5 K.E.R.I Research - Cailey
Owen
TZA077 5 K.E.R.I Research - Cailey
Owen
15
Molecular Analysis
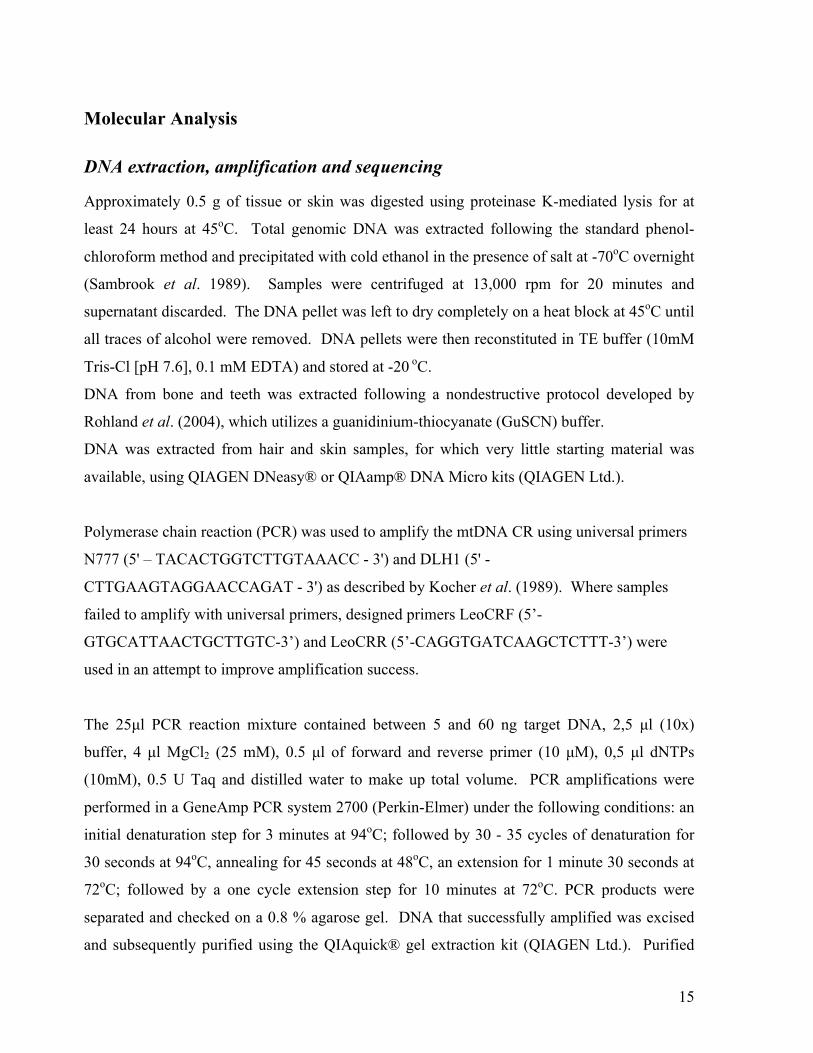
DNA extraction, amplification and sequencing
Approximately 0.5 g of tissue or skin was digested using proteinase K-mediated lysis for at
least 24 hours at 45oC. Total genomic DNA was extracted following the standard phenol-
chloroform method and precipitated with cold ethanol in the presence of salt at -70oC overnight
(Sambrook et al. 1989). Samples were centrifuged at 13,000 rpm for 20 minutes and
supernatant discarded. The DNA pellet was left to dry completely on a heat block at 45oC until
all traces of alcohol were removed. DNA pellets were then reconstituted in TE buffer (10mM
Tris-Cl [pH 7.6], 0.1 mM EDTA) and stored at -20 oC.
DNA from bone and teeth was extracted following a nondestructive protocol developed by
Rohland et al. (2004), which utilizes a guanidinium-thiocyanate (GuSCN) buffer.
DNA was extracted from hair and skin samples, for which very little starting material was
available, using QIAGEN DNeasy® or QIAamp® DNA Micro kits (QIAGEN Ltd.).
Polymerase chain reaction (PCR) was used to amplify the mtDNA CR using universal primers
N777 (5' – TACACTGGTCTTGTAAACC - 3') and DLH1 (5' -
CTTGAAGTAGGAACCAGAT - 3') as described by Kocher et al. (1989). Where samples
failed to amplify with universal primers, designed primers LeoCRF (5’-
GTGCATTAACTGCTTGTC-3’) and LeoCRR (5’-CAGGTGATCAAGCTCTTT-3’) were
used in an attempt to improve amplification success.
The 25µl PCR reaction mixture contained between 5 and 60 ng target DNA, 2,5 µl (10x)
buffer, 4 µl MgCl2 (25 mM), 0.5 µl of forward and reverse primer (10 µM), 0,5 µl dNTPs
(10mM), 0.5 U Taq and distilled water to make up total volume. PCR amplifications were
performed in a GeneAmp PCR system 2700 (Perkin-Elmer) under the following conditions: an
initial denaturation step for 3 minutes at 94oC; followed by 30 - 35 cycles of denaturation for
30 seconds at 94oC, annealing for 45 seconds at 48oC, an extension for 1 minute 30 seconds at
72oC; followed by a one cycle extension step for 10 minutes at 72oC. PCR products were
separated and checked on a 0.8 % agarose gel. DNA that successfully amplified was excised
and subsequently purified using the QIAquick® gel extraction kit (QIAGEN Ltd.). Purified

16
products were cycle sequenced using BigDye sequencing kit (Applied Biosystems) and
analysed on an ABI 3100 automated sequencer.
A long repetitive G-C rich region, similar to that found in jaguars and other felid species
(Eizirik et al. 2001) was identified within the mtDNA control region of leopards. Only partial
DNA fragments flanking these repeats could be sequenced. Sequences obtained using both
forward and reverse primers showed no or very little overlap and therefore only reverse
sequencing was performed as it produced the largest usable nucleotide fragment.
Some problematic samples only amplified once 3µl bovine serum albumin (BSA) was added to
the reaction mixture. DNA amplification may be improved by BSA as it acts to bind potential
polymerase inhibitors during PCR reactions (Sensabaugh, 1994; Satoh et al., 1998).
Sequence alignment and data analysis
A homologous region of 309 nucleotides of the mtDNA CR, was obtained for most individuals
sequenced (Appendix 5). DNA sequences were edited and aligned using CLUSTALX
(Thompson et al., 1997). Some individuals had ambiguous base calls (double peaks on the
chromatogram) at specific positions along the mtDNA sequence. Given that mtDNA is
uniparentally inherited, the presence of multiple bases at a specific site is unexpected. The
ambiguities were attributed to having co-amplified and sequenced a numt (mt copy present in
the nuclear genome) (Appendix 6). Numts have been reported in many vertebrates including,
primates, birds and cats (Schmitz et al., 2005, Grosso et al., 2006, Kim et al., 2006). Pertinent
to the focus of the present study, a large nuclear mitochondrial pseudogene was found in at
least five Panthera species, the tiger, jaguar, leopard, lion and the snow leopard (Kim et al.,
2006). This transposed element consisted of at least 12,536 base pairs (bp), representing 74%
of the mitochondrial genome and is one of the largest numts found in eukaryotes.
A consensus mtDNA sequence was created in CLUSTALX from samples which showed no
ambiguities. Ambiguities were then scored based on this consensus sequence and extra peaks
which were attributable to the numt were disregarded. No additional changes were made to
sequences, i.e. if a site showed ambiguities which were not present in the mtDNA consensus
sequence, it was not scored.

17
The program TCS version 1.06 (Clement et al., 2000) was used to identify mtDNA haplotypes
(Table 1) and to construct an unrooted haplotype network (Fig.2).
Measures of genetic variability within populations (haplotype diversity, h and nucleotide
diversity, π) were calculated from the mtDNA data set using ARLEQUIN 3.01 (Excoffier et
al., 2006). Haplotype diversity is described as the probability that two mtDNA sequences
randomly selected from a sample will be different, while nucleotide diversity is the probability
that two homologous nucleotides randomly selected from a sample will be different (Nei,
1987).
An Analysis of Molecular Variance (AMOVA) (Excoffier et al., 2006) was used to investigate
population structuring of leopards within South Africa. FST and ФST values were calculated in
order to assess genetic divergence between populations. FST estimates the amount of diversity
between populations based on observed haplotype frequencies, while ФST utilizes both
haplotype frequencies and nucleotide diversity. The statistical significance of these values
were tested in ARLEQUIN using 10 000 permutations. The Tamura-Nei model (Tamura and
Nei, 1993) was used to construct a distance matrix, while the gamma shape distribution
parameter was calculated using maximum likelihood in PAUP* version 4.
The divergence time between genetically distinct clades was estimated by applying the
equation:
T = τ/2u… (Rogers and Harpending, 1992)
Where: T = time since divergence
τ = mutational time, measured in 1/2u generations
u = mutation rate of sequenced DNA segment.
If the substitution rate (µ) for a region of DNA is known, the mutation rate (u) can be
calculated, as u = µ x the number of bases sequenced x generation time
To investigate whether populations showed signs of expansion, the Harpending’s raggedness
statistic (Harpending, 1994) was calculated and a mismatch distribution analysis performed.
Mismatch distribution analysis compares the distribution between the observed and expected
18
pairwise nucleotide site differences among haplotypes (Rogers and Harpending, 1992).
Populations which have been expanding show nearly unimodal (Poisson) distributions,
whereas populations which have been stable for longer periods generally show multi-modal
distributions.
Tajima’s D and Fu’s F were calculated to test for deviations from Hardy-Weinberg
equilibrium. In populations where an excess of rare alleles and a decline in common alleles is
detected, both Tajima’s D and Fu’s F will have statistically significant negative values (Fu,
1997, Excoffier et al., 2006). This departure from equilibrium is indicative of a recent
demographic change such as a population expansion or contraction or, alternatively, selection
(van Hooft et al., 2002). Both the raggedness statistic and neutrality tests were performed using
ARLEQUIN.
19
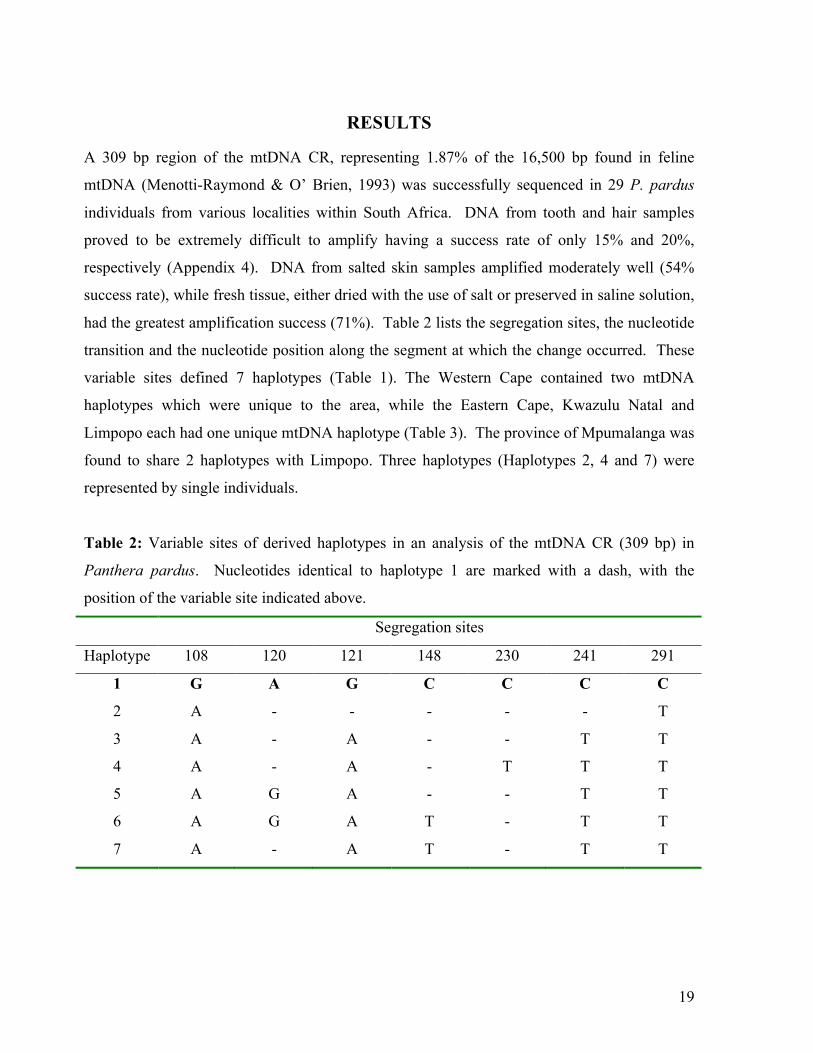
RESULTS
A 309 bp region of the mtDNA CR, representing 1.87% of the 16,500 bp found in feline
mtDNA (Menotti-Raymond & O’ Brien, 1993) was successfully sequenced in 29 P. pardus
individuals from various localities within South Africa. DNA from tooth and hair samples
proved to be extremely difficult to amplify having a success rate of only 15% and 20%,
respectively (Appendix 4). DNA from salted skin samples amplified moderately well (54%
success rate), while fresh tissue, either dried with the use of salt or preserved in saline solution,
had the greatest amplification success (71%). Table 2 lists the segregation sites, the nucleotide
transition and the nucleotide position along the segment at which the change occurred. These
variable sites defined 7 haplotypes (Table 1). The Western Cape contained two mtDNA
haplotypes which were unique to the area, while the Eastern Cape, Kwazulu Natal and
Limpopo each had one unique mtDNA haplotype (Table 3). The province of Mpumalanga was
found to share 2 haplotypes with Limpopo. Three haplotypes (Haplotypes 2, 4 and 7) were
represented by single individuals.
Table 2: Variable sites of derived haplotypes in an analysis of the mtDNA CR (309 bp) in
Panthera pardus. Nucleotides identical to haplotype 1 are marked with a dash, with the
position of the variable site indicated above.
Segregation sites
Haplotype 108 120 121 148 230 241 291
1 G A G C C C C
2 A - - - - - T
3 A - A - - T T
4 A - A - T T T
5 A G A - - T T
6 A G A T - T T
7 A - A T - T T

20
Table 3: Frequency of occurrence of Panthera pardus haplotypes in the five sampled
provinces in South Africa. The number of sampled individuals (n) differed at each site.
n
Haplotype Western
Cape
Eastern Cape Kwazulu
Natal
Mpumalanga Limpopo
1 9 0 0 0 0
2 1 0 0 0 0
3 0 5 0 0 0
4 0 0 1 0 0
5 0 0 0 1 7
6 0 0 0 2 2
7 0 0 0 0 1
The haplotype network constructed using TCS revealed significant phylogeographic
structuring of the leopard population in South Africa and clustered the individuals into two
assemblages/clades. Clade A corresponds to the Western Cape haplotypes (1 and 2), while
Clade B is composed of the Eastern Cape, Kwazulu Natal, Limpopo and Mpumalanga
haplotypes (3, 4, 5, 6 and 7) (Fig. 2). The network also indicates that haplotypes belonging to
these two clades are 2 - 4 mutational steps apart.

21
WESTERN CAPE
MPUMALANGA
EASTERN CAPE
LIMPOPO
KWAZULU NATAL
Fig. 2: Network of CR mtDNA haplotypes of Panthera pardus. Haplotypes are represented by
circles, the area of which is proportional to the haplotype frequency. Colours represent
different geographic regions (provinces) sampled, while subdivision of haplotypes represents
the proportion of haplotypes found in each region. Connecting lines indicate a single
nucleotide substitution, with a ≥95% probability of being correct. A solid square indicates an
internal node absent from the sample. Network drawn to depict the approximate geographic
origin of haplotypes (North, South, East, West).
22
Samples were assigned to two phylogeographic groups, clades A and B. Samples from the
Western Cape, corresponding to haplotypes 1 and 2, were assigned to Clade A. Samples from
the Eastern Cape, Kwazulu Natal, Mpumalanga and Limpopo, corresponding to haplotypes 3,
4, 5, 6 and 7, were assigned to Clade B. The division of samples into these 2 clades was based
on haplotype clustering in the minimum spanning network (Fig. 2) as well as a neighbour-
joining tree (not shown) which indicated 78% bootstrap support for the separation of
haplotypes into these two clades. Samples from these two clades were pooled to obtain
indications of genetic variation and population structuring and also to establish whether
populations were in Hardy-Weinberg equilibrium. AMOVA analysis based on this separation
revealed significant structuring among haplotypes, with an FST value of 0.478 and ФST value of
0.826 (p < 0). The significant separation among haplotypes was also confirmed when the two
clades were compared and separated into southern (Western Cape and Eastern Cape) and
northern (Kwazulu Natal, Mpumalanga and Limpopo) clades, as FST values decreased to 0.406,
while ФST decreased to 0.614 (p < 0).
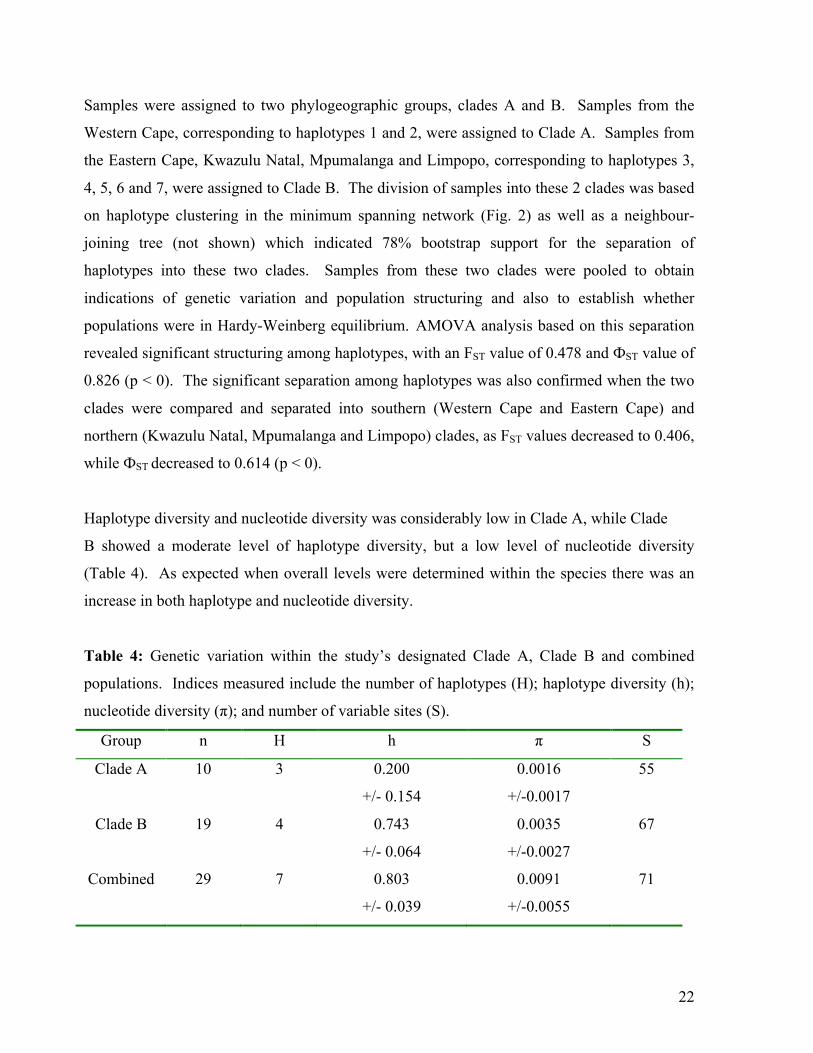
Haplotype diversity and nucleotide diversity was considerably low in Clade A, while Clade
B showed a moderate level of haplotype diversity, but a low level of nucleotide diversity
(Table 4). As expected when overall levels were determined within the species there was an
increase in both haplotype and nucleotide diversity.
Table 4: Genetic variation within the study’s designated Clade A, Clade B and combined
populations. Indices measured include the number of haplotypes (H); haplotype diversity (h);
nucleotide diversity (π); and number of variable sites (S).
Group n H h π S
Clade A
10 3 0.200
+/- 0.154
0.0016
+/-0.0017
55
Clade B 19 4 0.743
+/- 0.064
0.0035
+/-0.0027
67
Combined 29 7 0.803
+/- 0.039
0.0091
+/-0.0055
71
23
The divergence time between genetically distinct clades was estimated by applying the Rogers
and Harpending (1992) equation, as stated in methodology. The substitution rate for a similar
segment of the mtDNA CR of leopards was previously estimated to range between
0.0142/site/Myr (+/- 1.4% per Myr) and 0.024/site/Myr (+/- 2.5% per Myr) (Uphyrkina et al.,
2001). By applying these substitution rates, a generation time of 2 years and a τ value of 5.911
obtained from ARLEQUIN, the estimated coalescence date of southern African leopard
mtDNA haplotypes is between 199,265 and 336,786 years ago. Clades A and B were
estimated to have diverged between 66,500 and 112,000 years ago.
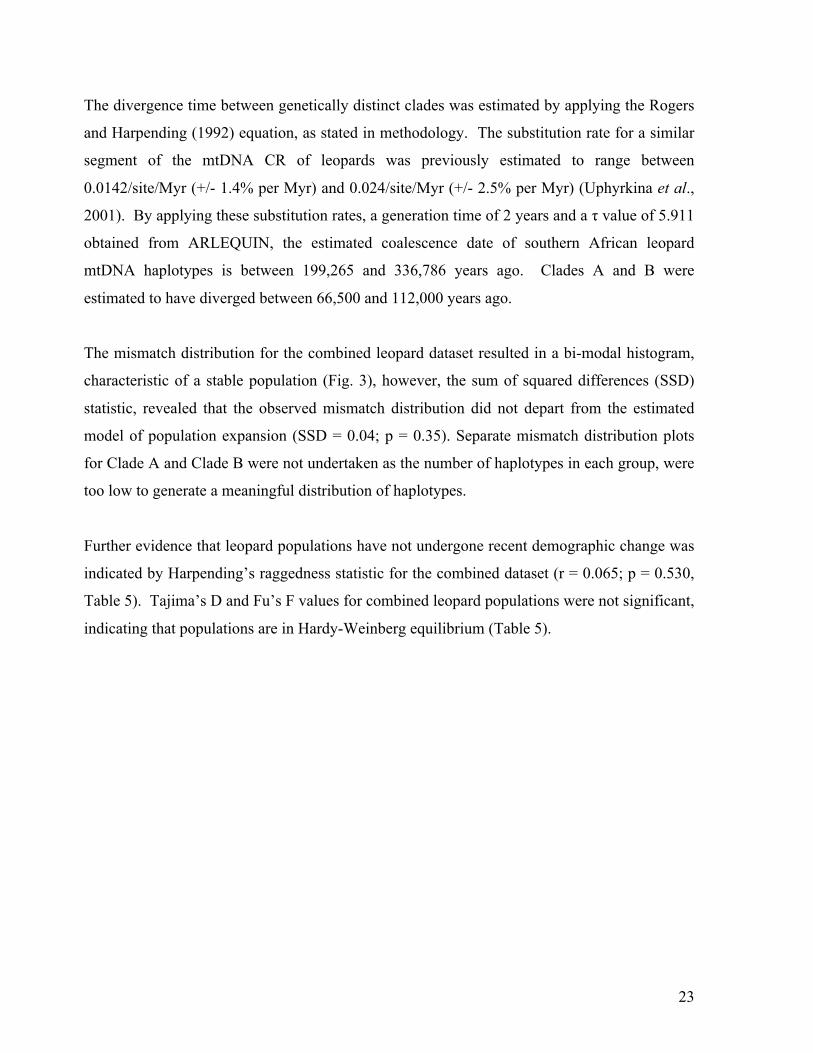
The mismatch distribution for the combined leopard dataset resulted in a bi-modal histogram,
characteristic of a stable population (Fig. 3), however, the sum of squared differences (SSD)
statistic, revealed that the observed mismatch distribution did not depart from the estimated
model of population expansion (SSD = 0.04; p = 0.35). Separate mismatch distribution plots
for Clade A and Clade B were not undertaken as the number of haplotypes in each group, were
too low to generate a meaningful distribution of haplotypes.
Further evidence that leopard populations have not undergone recent demographic change was
indicated by Harpending’s raggedness statistic for the combined dataset (r = 0.065; p = 0.530,
Table 5). Tajima’s D and Fu’s F values for combined leopard populations were not significant,
indicating that populations are in Hardy-Weinberg equilibrium (Table 5).

24
Fig. 3: Mismatch distribution plot of the combined leopard dataset. Columns indicate the
observed frequency distribution for the number of pair-wise differences, while the line
indicates the expected distribution under a model of population expansion.
Table 5: Results of tests for raggedness and selective neutrality (Tajima’s D and Fu’s F) for
Clade A, Clade B and the combined leopard dataset.
Group Harpending’s
Raggedness
(p-value)
Tajima’s D
(p-value)
Fu’s F
(p-value)
Clade A 0.720 (0.960) -1.401 (0.080) 12.032 (1.00)
Clade B 0.172 (0.460) 0.467 (0.704) 6.123 (0.990)
Combined 0.065 (0.530) 1.516 (0.940) 7.625 (0.989)
25
DISCUSSION
Population structure and gene flow
Two distinct mtDNA genetic assemblages were present among south African P. pardus
individuals. One is located in the Eastern Cape, Kwazulu Natal, Mpumalanga and Limpopo
and these locations contained mtDNA haplotypes 3, 4, 5, 6 and 7. The second mtDNA clade is
confined to the Western Cape and contained two unique haplotypes (haplotypes 1 and 2; Table
3). Given the limited sampling it is possible that some haplotypes were not represented by the
data set, however, if the results hold up against more intensive sampling it is important to
realize that there are no or low levels of current female gene flow and major geographical
partitioning within the South African leopard population. This conclusion is based on both the
haplotype network (Fig. 2) and a neighbour-joining tree (not shown). The network indicates an
absence of female migration between the western and eastern Cape regions, and between the
southern and northern regions of South Africa. It should be noted, however, that a previous
study on jaguar (P. onca) found significant structure in mtDNA phylogenies, yet higher levels
of gene flow when examining microsatellite data (Eizirik et al., 2001). This is most likely due
to differences in dispersal patterns between females and males, where young males usually
disperse further in search of territories, while females are generally philopatric. Alternatively, it
could be that the separation among jaguar populations was too recent for the multilocus nuclear
markers to detect the isolation.
My data shows some level of gene flow via female migration between Mpumalanga and
Limpopo. Kwazulu Natal was represented by only a single individual and therefore no
inferences could be made with regards to female migration into or out of this population.
Phylogeographic partitioning among the two clades was further supported by AMOVA
analysis, as both FST and ФST estimates were significant when samples were separated into
clades A and B. This genetic clustering, however, does not agree with the distribution pattern
observed in leopard populations in South Africa (Fig. 1), as one would expect leopards to be
able to migrate the entire length of the Cape Fold mountains, which extend all along the
southern and eastern coast. It also appears incongruent with previously recorded
26
morphological data, as leopards in the southern parts of South Africa (Western and Eastern
Cape) exhibit smaller body sizes and mass when compared to their northern counterparts
(Pocock, 1932; Norton, 1984; Skinner & Smithers, 1990). These results could imply that
variation in body size is possibly due to selection caused by external factors such as the
environment (terrain, prey availability or prey size), and that the small body size is not a
synapomorphic characteristic. The smaller stature of leopards in the southern region may also
be due to the lack of interspecific competition with other predators. In the north, leopards are
sympatric with lion (Panthera leo), hyena (Crocuta crocuta), and wild dog (Lycaon pictus),
whereas in the southern regions leopards occupy the role of apex predator.
The Mantel Test (Mantel, 1967) was not used to investigate isolation by distance as a possible
cause for population structuring. This was due to sample sizes for each province being too
small to calculate accurate FST values. The overall pattern of mtDNA genetic structuring,
however, does not appear to be due to isolation by distance as the Western-Eastern Cape
divergence appears more defined than between any two other populations (Fig. 2).
Population History
Observed levels of mtDNA genetic diversity within leopard populations in South Africa ranged
from 0.200 (± 0.154) to 0.803 (±0.039) (Table 4). In Clade A (Western Cape), both π and h
diversity estimates were low, indicating that this population could recently have undergone a
demographic change which may have led to genetic impoverishment. Genetic diversity
estimates for this study can not be directly compared with data from other studies, as
homologous segments for other species are not available. However, when compared to mtDNA
diversity estimated using RFLP’s, the π diversity within this clade (π = 0.16%) was comparable
to that estimated for inbred cheetah populations (π = 0.182%, Menotti-Raymond & O’ Brien,
1993). It should be noted, however, that diversity estimates for Clade A were based on a small
sample size and may be an underestimate for this population.
Clade B shows moderate levels of π diversity and high levels of h diversity, indicative of a
more stable population.

27
When clades were combined, both π and h diversity estimates were higher (π = 0.91%; h =
0.803). Compared to results obtained for similar regions in the mtDNA CR, or from composite
CR and NADH-5 segments (Appendix 2), genetic variation of leopards within South Africa is
comparable to, or higher than, that found in jaguar populations or other leopard subspecies
(Eizirik et al., 2001; Uphyrkina et al., 2001).
The intraspecific mtDNA haplotype network (Fig. 2), generated by TCS showed very little
divergence between haplotypes. All haplotypes were 1 – 6 mutational steps apart. This pattern
is suggestive of a fairly common history, however, enough time has passed to allow for
regional differentiation within populations.
Mismatch distribution analysis for combined populations showed a bi-modal distribution (Fig.
3), suggesting that in South Africa as a whole, the leopard population has not undergone recent
demographic change. Sample sizes for each province, or separate clades, were too small to
interpret using mismatch distribution. The sum of squares deviation indicated that the
distribution did not diverge significantly from a model of population expansion. This test,
however, may not be sensitive enough as sample size was low.
The inference of a stable population was supported by Fu’s F and Tajima’s D (Table 5) which
suggests that the South African population is in Hardy-Weinberg equilibrium and has been
stable for some time. Fu’s F has been shown to be a more sensitive test than mismatch
distribution analysis, in testing for demographic change under a variety of different
circumstances (Ramos- Onsins & Rozas, 2002, Excoffier et al., 2006).
Based on previously reported estimates of mtDNA CR substitution rates, the estimated
coalescence date of leopard mtDNA haplotypes in South Africa, is between 199,000 and
337,000 years ago (Uphyrkina et al., 2001). This is in agreement with the findings above,
which indicate that the South African leopard population has been relatively stable for a long
period of time. The Western Cape population is estimated to have diverged from Clade B
between 66,500 and 112,000 years ago. Divergence dates coupled with the absence of shared
haplotypes between clades, suggests long-standing restriction of maternal gene flow.
28
Separation of these two clades may have been caused by the expansion and contraction of
suitable habitat due to temperature fluctuations during the Pleistocene (Brain, 1985). The last
1 Myr have been marked by a chain of major glacial periods which led to a series of climatic
and habitat fluctuations on the African continent (DeMenocal, 1995). Changes within the
western region of the continent appear to have been more severe, while the eastern region
remained more stable (Deacon & Lancaster, 1988; Matthee & Flemming, 2002). These
climatic fluctuations and its associated habitat changes may have resulted in the west-east
population structuring of leopards in South Africa. Recently other studies on Mesamphisopus
(freshwater isopods), Pedioplanus (sand lizards), Agama atra (Rock agama) and Myosorex
(shrews) have uncovered similar west-east population fragmentation within the Cape Fold
Mountain range (Gouws et al., 2005, Makokha, 2006, Swart, 2006, Willows-Munrow pers.
comm.).
Implications for the conservation of leopards in South Africa
Anthropogenic factors (hunting, poaching, human expansion, habitat loss and ‘problem-
animal’ control) have led to marked declines in population numbers and range distribution of
southern African leopards (Norton, 1986; Uphyrkina et al., 2001) Populations in the Cape
were the most hard-hit because this was the first region to be colonized by Dutch settlers. In
the Cederberg mountains of the Western Cape, current research indicates that previous
estimates of leopard population densities were vastly overestimated and that leopards occur in
very low densities within the Cape Fold Belt (Martins, pers comm.). Their continued survival
as small populations consequently relies on the ability of conservation bodies to make
informed management decisions. Results presented in this study therefore have important
implications for future conservation and management strategies of leopards in South Africa.
Our mtDNA data suggests the presence of two distinct mtDNA genetic assemblages, one
comprising the Western Cape, while the other comprising the Eastern Cape, Kwazulu Natal,
Limpopo and Mpumalanga provinces. Although the structuring of the leopard population is
based on female genetic separation only, we follow Ryder and Moritz (Ryder, 1986, Moritz,
1994) and recommend that these clades be viewed as separate Management Units.
29
Translocation of leopards between these two clades should therefore be avoided. Within the
larger genetic assemblage (Clade B) it would be advisable for translocation to occur between
neighbouring groups or to mimic naturally occurring gene flow, as leopards may be adapted to
local environments.
On the whole, the South African leopard population appears not to have undergone any recent
demographic change and to have been stable for a long period of time. The Western Cape
population alternatively, may have suffered recent genetic impoverishment. This small,
remnant population shows genetic diversity comparative to that of inbred cheetah populations
and may require special conservation strategies to ensure its survival.
In closing, we advise that future genetic testing include nuclear markers in order to assess the
effects of male dispersal on the population structuring of leopards in South Africa as well as
more extensive sampling in order to improve the accuracy of genetic testing.

30
REFERENCES
Applied Biosystems. Inc. 1994. Sequence Navigator DNA and Protein sequence
comparison Software, Perkin-Elmer Corp., Forster City, CA.
Bothma J. D. P. & le Riche, E. A. N., 1984. Aspects of the ecology and the behaviour of the
leopard, Panthera pardus, in the Kalahari desert. Koedoe 27: 259 – 279.
Brain, C. K., 1985. Temperature-induced environmental changes as biological isolating
mechanisms in southern Africa. Species and Speciation (ed. E. S. Vrba). Transvaal
Museum, Pretoria, South Africa, pp 45 – 52.
Clement, M., Posada, D. & Crandall, K. A., 2000. TCS: a computer program to estimate
gene genealogies. Molecular Ecology 9: 1657 – 1660.
Deacon, H. J. & Lancaster, N., 1988. Late Quaternary paleoenvironments of Southern
Africa. Claredon Press, Oxford.
DeMenocal, P. B., 1995. Plio-pleistocene African climate. Science 270: 53 – 59.
Eizirik, E., Kim, J., Menotti-Raymond, M., Crawshaw, P. G., O’Brien, S. J. & Johnson,
W. E., 2001. Phylogeography, population history and conservation genetics of jaguars
(Panthera onca, Mammalia, Felidae). Molecular Ecology 10: 65 – 79.
Eizirik, E., Yuhki, N., Johnson, W. E., Menotti-Raymond, M., Hannah, S. S., O’ Brien, S.
J., 2003. Molecular genetics and evolution of melanism in the cat family. Current
Biology 13: 448 – 453.
Excoffier, L., Laval, G. & Schneider, S., 2006. Arlequin version 3.01: An integrated
software package for population genetics data analysis. Computational and Molecular
Population Genetics Lab, Switzerland.
31
Fey, V., 1964. The diet of leopards. African Wildlife 18: 105 – 109.
Fu, Y. X. 1997. Statistical tests of neutrality of mutations against population growth,
hitchhiking and background selection. Genetics 147: 915 – 925.
Gouws, G., Stewart, B. A., Matthee, C. A., 2005. Lack of taxonomic differentiation in an
apparently widespread freshwater isopod morphotype (Phreatoicidea:
Mesamphisopidae: Mesamphisopus) from South Africa. Molecular Phylogenetics and
Evolution 37: 289 – 305.
Grobler, J. H. & Wilson, V. J., 1972. Food of the leopard Panthera pardus (Linn.) in the
Rhodes Matopos National Park, Rhodesia, as determined by faecal analysis. Arnoldia
5(35): 1 – 10.
Grosso, A. R., Bastos-Silveira, C., Coelho, M. M., Dias, D., 2006. Columba palumbus Cyt b-
like Numt sequence: comparison with functional homologue and the use of universal
primers. Folia Zoologica 55(2): 131 – 144.
Harpending, H. C., 1994. Signature of ancient population growth in a low-resolution
mitochondrial DNA mismatch distribution. Human Biology 66: 591 – 600.
Hemmer, H., 1976. Fossil history of living Felidae. The World’s Cat (ed. Eaton R. L.).
Carnivore Research Institute, Burke Museum, Seattle, pp. 1- 14.
Hunt, M. H., 1996. Biogeography of the order Carnivora. Carnivore behaviour, ecology,
and evolution, vol. 2 (ed. Gittleman J. L). Cornell University Press, Ithaca, NY, pp. 485
– 541.
Johnson, W. E., Eizirik, E., Murphy W. J., Pecon-Slattery J., Antunes A., O’ Brien, S. J.,
2005. The explosive late Miocene radiation of the Felidae. In press.

32
Johnson W. E. & O’ Brien S. J., 1997. Phylogenetic reconstruction of the Felidae using
16S rRNA and NADH-5 mitochondrial genes. Journal of Molecular Evolution
44(Suppl 1): S98 – S116.
Kim, J. H., Antunes, A., Luo, S. J., Menninger, J., Nash, W. G., O’ Brien, S. J., Johnson, W.
E., 2006. Evolutionary analysis of a large mtDNA translocation (numt) into the nuclear
genome of the Panthera genus species. Gene 366(2): 292 – 302.
Kocher, T. D., Thomas, W. K., Meyer, A. et al., 1989. Dynamics of mitochondrial DNA
evolution in animals: Amplification with conserved primers. Proceedings of the
National Academy of Sciences 86: 6196 – 6200.
Le Roux, P. G. & Skinner, J. D., 1989. A note on the ecology of the leopard (Panthera
pardus Linneaus) in the Londolozi Game Reserve, South Africa. African Journal of
Ecology 27: 167 – 171.
Linneaus, C., 1758. System Naturae (1), 10th Edition. British Museum of Natural
History, London.
Makokha, J. S., 2006. Molecular phylogenetics and phylogeography of sand lizards,
Pedioplanis (Sauria: Lacertidae) in southern Africa. MSc. Thesis, University of
Stellenbosch.
Mantel, N., 1967. The detection of disease clustering and a generalized regression
approach. Cancer Research 27: 209 – 220.
Martin, R. B. & de Meulenaer, T., 1988. Survey of the status of the leopard (Panthera
pardus) in sub-Saharan Africa. CITES Secretariat, Lausanne.
Matthee, C. A. & Flemming, A. F., 2002. Population fragmentation in the southern rock
33
agama, Agama atra: more evidence for vicariance in Southern Africa. Molecular
Ecology 11: 465 – 471.
Menotti-Raymond, M. & O’ Brien, S. J., 1993. Dating the genetic bottleneck of the
African cheetah. Proceedings of the National Academy of Sciences USA 90: 3172 –
3176.
Miththapala, S., Seidensticker, J. and O’ Brien, S. J., 1996. Phylogeographic subspecies
recognition in leopards (Panthera pardus): Molecular genetic variation. Conservation
Biology 10 (4): 1115 – 1132.
Moritz, C., 1994. Defining ‘Evolutionary Significant Units’ for conservation. Trends in
Ecology and Evolution 9: 373 – 375.
Nei, M., 1987. Molecular Evolutionary Genetics. Columbia University Press, New York.
Norton, P. M., 1984. Leopard conservation in South Africa. African Wildlife 38: 191 –
196.
Norton, P. M., 1986. Historical changes in the distribution of leopards in the Cape
Province, South Africa. Bontebok 5: 1 – 9.
Norton, P. M. & Henley, S. R., 1987. Home range and movements of male leopards in
the Cedarberg Wilderness Area, Cape Province. S. Afri. J. Wildl. Res. 17: 41 – 48.
Norton, P. M. & Lawson, A. B., 1985. Radio tracking of leopards and caracal in the
Stellenbosch area, Cape Province. South African Journal of Wildlife Research 15: 17 –
24.
Norton, P. M., Lawson, A. B., Henley, S. R. & Avery, G., 1986. Prey of leopards in. four

34
mountainous areas of the south-western Cape Province. South African Journal of
Wildlife Research 16 (2): 47 – 52.
O’Brien, S. J., 1994. A role of molecular genetics in biological conservation. Proceedings
of the National Academy of Sciences USA 91: 5748 – 5755.
O’ Brien, S. J., Johnson, W. E., 2005. Big cat genomics. Annu. Rev. Genomics Hum.
Genet. 6: 407 – 429.
Pocock, R. I., 1932. The leopards of Africa. Proceedings of the Zoological Society,
London , pp. 543 – 591.
Ramos-Onsins, S. E. & Rozas, J., 2002. Statistical properties of new neutrality tests against
population growth. Molecular Biology and Evolution 19(12): 2092 – 2100.
Rogers, A. R. & Harpending, H., 1992. Population growth makes waves in the
distribution of pairwise genetic differences. Molecular Biology and Evolution 9: 552 –
569.
Rohland, N., Siedel, H., Hofreiter, M., 2004. Nondestructive DNA extraction method for
mitochondrial DNA analyses of museum specimens. BioTechniques 36: 814 – 821.
Ryder, O. A., 1986. Species conservation and systematics: The dilemma of subspecies.
Trends in Ecology and Evolution 1: 9 – 10.
Satoh, Y., Takasaka, N., Hoshikawa, Y., et. al.,1998. Pretreatment with restriction enzyme or
bovine serum albumin for effective PCR amplification of Epstein-Barr virus DNA in
DNA extracted from paraffin-embedded gastric carcinoma tissue. Journal of clinical
Microbiology 36(11): 3423 – 3425.
Sambrook, J., Fritsch, E. F., Maniatis, T., 1989. Molecular cloning: A laboratory
35
manual. 2nd Edition. Cold Habour Laboratory Press, New York.
Schmitz, J., Piskurek, O., Zischler, H., 2005. Forty million years of independent evolution: A
mitochondrial gene and its corresponding nuclear pseudogene in primates. Journal of
Molecular Evolution 61(1): 1 – 11.
Sensabaugh, G. F., 1994. DNA typing of biological evidence material. Ancient DNA,
(eds) B. Herrman & S. Hummel. Springer Verlag, New York, pp. 141 – 148.
Skead, C.J., 1980. Historical Mammal incidence in the Cape Province, vol.1 : The
Western and Northern Cape. Cape Dept. of Nature & Environmental Conservation,
Cape Town.
Skinner, J. D. & Smithers, R. H. N., 1990. The mammals of the Southern African
Subregion. University of Pretoria, Pretoria.
Smithers, R. H. N., 1971. The mammals of Botswana. Mus. mem. Natl Mus. Monum.
Rhod. 4: 1- 340.
Stuart, C.T., 1981. Notes on the mammalian carnivores of the Cape Province, South
Africa. Bontebok 1: 1 – 58.
Swart, B.L., 2006. The phylogeography of Southern rock Agama (Agama atra) in the Cape
Fold Mountains South Africa. MSc. Thesis, University of Stellenbosch.
Tamura, K. & Nei, M., 1993. Estimation of the number of nucleotide substitutions in the
control region of mitochondrial DNA in humans and chimpanzees. Molecular Biology
and Evolution 10: 512 – 526.

36
Thompson, J. D., Gibson, T. J., Plewniak, F., Jeanmougin, F. & Higgins, D. G., 1997.
The ClustalX windows interface: Flexible strategies for multiple sequence alignment
aided by quality analysis tools. Nucleic Acids Research 24: 4876 – 4882.
Turnbull-Kemp, P., 1967. The Leopard. Timmins, Cape Town.
Turner, A. & Anton, M., 1997. The Big Cats and Their Fossil Relatives. Columbia
University Press, New York.
Uphyrkina, O., Johnson, W., Quigley, H., Miquelle, D., O’ Brien, S. J., 2001.
Phylogenetics, genome diversity and the origin of modern leopard. Panthera pardus.
Mol. Ecol. 10: 2617 – 33.
Van Hooft, W. F., Groen, A. F. & Prins, H. H. T., 2002. Phylogeography of the African
buffalo based on mitochondrial and Y-chromosomal loci: Pleistocene origin and
population expansion of the Cape Buffalo subspecies. Molecular Ecology 11: 267 –
279.
37
APPENDIX 1
Appendix 1: Showing the phylogenetic relationships among 37 Felidae species and 7 outgroup
taxa based on a maximum likelihood tree. Species were grouped into eight major felid
lineages. Colour coding of scientific names is used to depict recent and historic associations
with biogeographical regions (taken from O’ Brien & Johnson, 2005).

38
APPENDIX 2:
Genetic variation across NADH-5 and CR of mtDNA and 25 microsatellite loci (as cited in
Uphyrkina et al. 2001)
mtDNA Microsatellites
Subspecies Number of
leopards
mtDNA/µsat
Number
variable
sites
Mean
number of
pairwise
differences
(SE)
Π x
102
(SE)
%
Polymorphic
loci
Average
HE (SE)
Average
number
alleles/locus
Average
range
repeat/locus
Microsat
variance
P.p.
pardus
(I+II)
15/17 21 8.77 (4.29) 1.22
(0.67)
100 0.803
(0.076)
8.52 9.72 7.28
P. p.
saxicolor
8/10 2 0.50 (0.47) 0.07
(0.07)
100 0.616
(0.083)
4.24 5.12 4.28
P. p. fusca 9/9 8 2.61 (1.54) 0.36
(0.24)
100 0.696
(0.144)
5.52 6.2 5.38
P. p.
kotiya
10/11 2 0.56 (0.50) 0.08
(0.08)
96 0.485
(0.202)
3.52 4.58 4.25
P. p.
japonensis
3/4 5 3.41 (2.37) 0.48
(0.41)
100 0.674
(0.126)
4.20 5.56 5.70
P. p.
orientalis
9/11 1 0.95 (0.71) 0.21
(0.15)
100 0.549
(0.171)
3.76 4.44 2.70
12/12 1 0.17(0.24) 0.02
(0.04)
92 0.356
(0.222)
2.60 2.84 1.71
39
APPENDIX 3:
Classical and revised subspecies of Panther pardus (revised from Miththapala et al. 1996) Common name Classic subspecies Revised Subspecies
Uphyrkina et al.
(N = 9; 2001)
Conservation Status
Zanzibar Leopard P. p. adersi (Pocock
1932)
P. p. pardus Extinct
Cape Leopard P. p. melanotica (Gunther
1885)
P. p. pardus Threatened
Eritrean leopard P. p. antinorii (de Beaux
1923)
P. p. pardus Endangered
Ugandan leopard P. p. chui (Heller 1913) P. p. pardus Threatened
East African leopard P. p. suahelicus
(Neumann 1900)
P. p. pardus Threatened
North African leopard P. p. pardus (Linneaus
1758)
P. p. pardus Endangered
Congo leopard P. p. iturensis (Allen
1924)
P. p. pardus Threatened
Central African leopard P. p. shortridgei (Pocock
1932)
P. p. pardus Threatened
West African leopard P. p. reichenowi (Cabrera
1918)
P. p. pardus Threatened
West African forest
leopard
P. p. leopardus (Schreber
1777)
P. p. pardus Endangered
Somalian leopard P. p. nanopardus
(Thomas 1904)
P. p. pardus Endangered
Barbary leopard P. p. panthera (Schreber
1777)
P. p. pardus Critically endangered
(IUCN)
North Persian leopard P. p. saxicolor (Pocock
1927)
P. p. saxicolor Endangered (IUCN)
Caucasus leopard P. p. ciscaucasicus
(Satunin 1914)
P. p. saxicolor Endangered, may be
extinct
Asia Minor leopard P. p. tulliana
(Valenciennes 1856)
P. p. saxicolor Nearly extinct; Critically Endangered (IUCN).
Sinai leopard P. p. jarvisi (Pocock P. p. saxicolor Endangered, may be

40
1932) extinct
Central Persian leopard P. p. dathei (Zukowsky
1964)
P. p. saxicolor Endangered
Baluchistan leopard P. p. sindica (Pocock
1930a)
P. p. saxicolor Endangered
South Arabian leopard P. p. nimr (Ehrenberg &
Hemprich 1833)
P. p. nimr Critically endangered
(IUCN)
Indian leopard P. p. fusca (Meyer 1794) P. p. fusca Endangered
Kashmir leopard P. p. millardi (Pocock 1930)
P. p. fusca Endangered
Nepal leopard P. p. pernigra (Hodgson
1863)
P. p. fusca Endangered
Javan leopard P. p. melas (Cuvier 1809) P. p. melas Endangered (IUCN)
Sri Lankan leopard P. p. kotiya (Deraniyagala
1956)
P. p. kotiya Endangered and almost
extinct; Endangered
(IUCN)
South Chinese leopard P. p. delacouri (Pocock
1930)
P. p. delacouri Endangered
North Chinese leopard P. p. japonensis (Gray
1862)
P. p. japonensis Endangered (IUCN)
Amur leopard P. p. orientalis (Schlegel
1857)
P. p. orientalis Critically endangered
(IUCN)

41
APPENDIX 4:
Geographic location of specimens used in this study, along with collector or institution which
provided samples, collector’s reference number, sample description and preservation method. Sample
number
Collector Collectors
reference number
Locality data Sample
Type
Amplified
mtDNA
CR
leo 001 Cape Nature (CN),
Rika du Plesis
Cederberg, Western
Cape
Skin
(salted)
Yes
leo 002 CN, Rika du Plesis Cederberg, Western
Cape
Skin
(salted)
Yes
leo 003 Eastern Cape Nature
Conservation
(ECNC), Hennie
Swanevelder
Baviaanskloof District,
Eastern Cape
Skin
(salted)
Yes
leo 004 ECNC, Hennie
Swanevelder
Baviaanskloof District,
Eastern Cape
Skin
(salted)
Yes
leo 005 Amathole museum KM14422 Kakamas Upington
District, Northern Cape
Skin
(salted)
leo 006 Amathole museum KM14423 East London, Eastern
Cape
Tooth
leo 007 Amathole museum KM18876 Uitenhage District,
Eastern Cape
Skin
(salted)
leo 008 Amathole museum KM18978 Phalaborwa District,
Northern Province
Tooth
leo 009 Amathole museum KM24203 Clanwilliam District,
Western Cape
Skin
(salted)
Yes
leo 010 Amathole museum KM24204 Ladismith District,
Western Cape
Tooth Numt
leo 011 Amathole museum KM24206 Worcester, Western
Cape
Skin
(salted)
leo 012 Amathole museum KM24211 Gordonia, Northern
Cape
Tooth
leo 013 Amathole museum KM24214 Ceres, Western Cape Tooth
leo 014 Amathole museum KM24228 Caledon, Western Cape Tooth Numt
leo 015 Amathole museum KM24229 Clanwilliam, Western Tooth

42
Cape
leo 016 Amathole museum KM24233 Tulbagh, Western Cape Tooth
leo 017 Amathole museum KM24234 Caledon, Western Cape Tooth
leo 018 Amathole museum KM24236 Van Rynsdorp, Western
Cape
Tooth
leo 019 Amathole museum KM24237 Ceres, Western Cape Tooth Yes +
Numt
leo 020 Amathole museum KM24238 Worcester, Western
Cape
Skin
(salted)
Yes +
Numt
leo 021 Amathole museum KM24245 Ceres, Western Cape Tooth
leo 022 Amathole museum KM24247 Worcester, Western
Cape
Tooth
(canine)
leo 023 Amathole museum KM24250 Caledon, Western Cape Tooth
leo 024 Amathole museum KM24252 Ceres, Western Cape Tooth
leo 025 Amathole museum KM24253 Ceres, Western Cape Tooth
leo 026 Amathole museum KM24257 Ceres, Western Cape Tooth
leo 027 Amathole museum KM24260 Tulbagh, Western Cape Tooth
leo 028 Amathole museum KM24263 Robertson, Western
Cape
Tooth
leo 029 Amathole museum KM24269 Kimberley, Northern
Cape
Tooth
leo 030 Amathole museum KM28025 Humansdorp, Eastern
Cape
Tooth
leo 031 Amathole museum KM28026 Knysna, Eastern Cape Tooth
leo 032 Amathole museum KM28027 Knysna, Eastern Cape Tooth
leo 033 Amathole museum OAM 5813 Alexandria, Eastern
Cape
Tooth
leo 034 Amathole museum OAM 6228 Kowie Bush - Wolf's
Crag, Eastern Cape
Tooth
leo 035 Amathole museum OAM 6590 (1057) Albany District, Eastern
Cape
Tooth
leo 036 Amathole museum OAM 6590 (1060) Albany District, Eastern
Cape
Tooth
leo 037 University of Port
Elizabeth (U.P.E.),
Graham Kearley
Baviaanskloof District,
Eastern Cape
Tissue
(salted)
Yes
43
leo 038 U.P.E., Graham
Kearley
Baviaanskloof District,
Eastern Cape
Tissue
(salted)
Yes +
Numt
leo 039 U.P.E., Graham
Kearley
Baviaanskloof District,
Eastern Cape
Tissue
(salted)
Yes
leo 040 Mpumalanga Parks
Board (M.P.B),
Gerrie Camacho
Marlof Park,
Mpumalanga
Tissue
(salted)
Yes
leo 041 M.P.B., Gerrie
Camacho
MPT 2 Loskop Dam,
Mpumalanga
Hair
leo 042 M.P.B., Gerrie
Camacho
MPT 3 Delmas Town,
Mpumalanga
Hair
leo 043 M.P.B., Gerrie
Camacho
MPT 4 Malalane, Southern
lowveld, Mpumalanga
Hair Yes
leo 044 M.P.B., Gerrie
Camacho
FS 2 / 385 KT Waterval, Mpumalanga Hair
leo 045 M.P.B., Gerrie
Camacho
341 KT Burgersfort,
Mpumalanga
Hair
leo 046 M.P.B., Gerrie
Camacho
FST 3 "Bella" Lydenburg,
Mpumalanga
Hair
leo 047 Thys de Wet Broederstroom,
Mpumalanga
Skin
(salted)
leo 048 M.P.B., Gerrie
Camacho
Lydenberg,
Mpumalanga
Bone Yes +
Numt
leo 049 The Cape Leopard
Trust (C.L.T),
Quinton Martins
Mxabene female Londolozi,
Mpumalanga
Hair
leo 050 C.L.T., Quinton
Martins
Sunset bend
female
Londolozi,
Mpumalanga
Hair
leo 051 C.L.T., Quinton
Martins
Rockdrift male Londolozi,
Mpumalanga
Scat
leo 052 Dr. Adrian
Armstrong
Pietermaritzburg,
Kwazulu Natal
Skin
(salted)
Yes
leo 053 Iziko Museum ZM41400 Western Cape Tissue
(saline
solution)
leo 054 Iziko Museum ZM41404 Western Cape Tissue
(saline)
44
solution)
leo 055 Iziko Museum ZM41405 Western Cape Tissue
(saline
solution)
leo 056 Iziko Museum ZM41523 Western Cape Tissue
(saline
solution)
leo 057 Iziko Museum Gavin Ritchie still awaiting locality
data from museum
Tissue
(saline
solution)
leo 058 Amathole museum KM14416 Kaokoland, Namibia Skin
(salted)
leo 059 Amathole museum KM14418 Western Caprivi
Namibia
Skin
(salted)
leo 060 C.L.T., Quinton
Martins
lekkerlag Cederberg, Western
Cape
Tissue
(salted) and
blood
Yes
leo 061 Tuli Leopard
Project, Villiers
Steyn
F2 Tuli Block, Limpopo Tissue
(saline
solution)
Yes
leo 062 Tuli Leopard
Project, Villiers
Steyn
F3 Tuli Block, Limpopo Tissue
(saline
solution)
Yes
leo 063 C.N., Guy Palmer NGP2324 Houw Hoek Pass,
Western Cape
Tissue
(EtOH)
Yes
leo 064 C.N., Guy Palmer NGP2345 Van Rhynsdorp,
Western Cape
Tissue
(EtOH)
leo 065 C.N., Guy Palmer NGP2346
(LKCS/M/001)
Helderberg District,
Western Cape
Tissue
(EtOH)
leo 066 C.N., Peter Lloyd Hottentots Holland
Mountains, Western
Cape
Hair Yes
leo 067 C.L.T., Quinton
Martins
Houdini Cederberg, Western
Cape
Tissue
(salted)
Yes
leo 068 C.L.T., Quinton
Martins
Tom Cederberg, Western
Cape
Tissue
(salted)
Yes
leo 069 K.E.R.I Research, Tzaneen, Limpopo Tissue Yes

45
Cailey Owen (EtOH)
leo 070 K.E.R.I Research,
Cailey Owen
Tzaneen, Limpopo Tissue
(EtOH)
Yes
leo 071 K.E.R.I Research,
Cailey Owen
Tzaneen, Limpopo Tissue
(EtOH)
Yes
leo 072 K.E.R.I Research,
Cailey Owen
Tzaneen, Limpopo Tissue
(EtOH)
Numt
leo 073 K.E.R.I Research,
Cailey Owen
Tzaneen, Limpopo Tissue
(EtOH)
Yes
leo 074 K.E.R.I Research,
Cailey Owen
Tzaneen, Limpopo Tissue
(EtOH)
Yes
leo 075 K.E.R.I Research,
Cailey Owen
Tzaneen, Limpopo Tissue
(EtOH)
Yes
leo 076 K.E.R.I Research,
Cailey Owen
Tzaneen, Limpopo Tissue
(EtOH)
Yes
leo 077 K.E.R.I Research,
Cailey Owen
Tzaneen, Limpopo Tissue
(EtOH)
Yes
leo 078 C.N., Jaco van
Deventer
Du Toits Kloof,
Western Cape
Tissue
(salted)
Numt
leo 079 C.N., Peter Lloyd Caledon, Western Cape Tissue
(salted)
Numt
leo 080 C.N., Jaco van
Deventer
Porterville, Western
Cape
Tooth Numt
leo 081 C.L.T., Quinton
Martins
Max Cederberg, Western
Cape
Tissue
(salted)
Numt
leo 082 C.N., Jaco van
Deventer
Porterville, Western
Cape
Hair
46
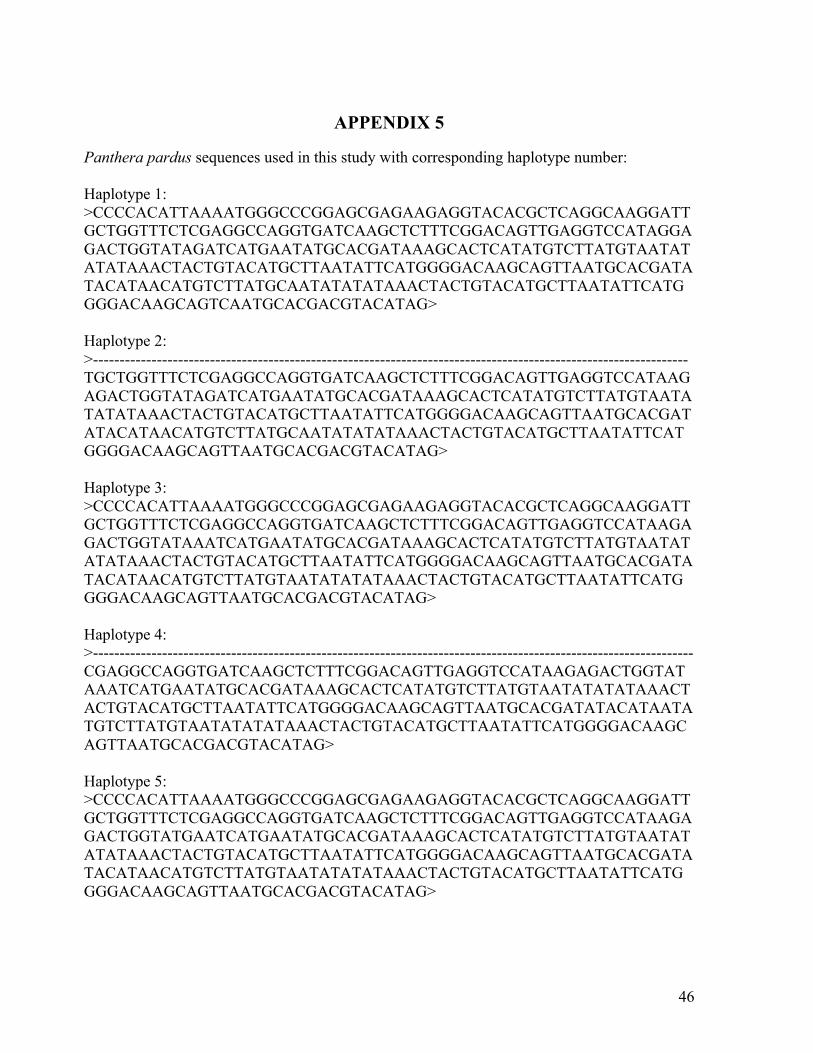
APPENDIX 5
Panthera pardus sequences used in this study with corresponding haplotype number: Haplotype 1: >CCCCACATTAAAATGGGCCCGGAGCGAGAAGAGGTACACGCTCAGGCAAGGATTGCTGGTTTCTCGAGGCCAGGTGATCAAGCTCTTTCGGACAGTTGAGGTCCATAGGAGACTGGTATAGATCATGAATATGCACGATAAAGCACTCATATGTCTTATGTAATATATATAAACTACTGTACATGCTTAATATTCATGGGGACAAGCAGTTAATGCACGATATACATAACATGTCTTATGCAATATATATAAACTACTGTACATGCTTAATATTCATGGGGACAAGCAGTCAATGCACGACGTACATAG> Haplotype 2: >----------------------------------------------------------------------------------------------------------------TGCTGGTTTCTCGAGGCCAGGTGATCAAGCTCTTTCGGACAGTTGAGGTCCATAAGAGACTGGTATAGATCATGAATATGCACGATAAAGCACTCATATGTCTTATGTAATATATATAAACTACTGTACATGCTTAATATTCATGGGGACAAGCAGTTAATGCACGATATACATAACATGTCTTATGCAATATATATAAACTACTGTACATGCTTAATATTCATGGGGACAAGCAGTTAATGCACGACGTACATAG> Haplotype 3: >CCCCACATTAAAATGGGCCCGGAGCGAGAAGAGGTACACGCTCAGGCAAGGATTGCTGGTTTCTCGAGGCCAGGTGATCAAGCTCTTTCGGACAGTTGAGGTCCATAAGAGACTGGTATAAATCATGAATATGCACGATAAAGCACTCATATGTCTTATGTAATATATATAAACTACTGTACATGCTTAATATTCATGGGGACAAGCAGTTAATGCACGATATACATAACATGTCTTATGTAATATATATAAACTACTGTACATGCTTAATATTCATGGGGACAAGCAGTTAATGCACGACGTACATAG> Haplotype 4: >-----------------------------------------------------------------------------------------------------------------CGAGGCCAGGTGATCAAGCTCTTTCGGACAGTTGAGGTCCATAAGAGACTGGTATAAATCATGAATATGCACGATAAAGCACTCATATGTCTTATGTAATATATATAAACTACTGTACATGCTTAATATTCATGGGGACAAGCAGTTAATGCACGATATACATAATATGTCTTATGTAATATATATAAACTACTGTACATGCTTAATATTCATGGGGACAAGCAGTTAATGCACGACGTACATAG> Haplotype 5: >CCCCACATTAAAATGGGCCCGGAGCGAGAAGAGGTACACGCTCAGGCAAGGATTGCTGGTTTCTCGAGGCCAGGTGATCAAGCTCTTTCGGACAGTTGAGGTCCATAAGAGACTGGTATGAATCATGAATATGCACGATAAAGCACTCATATGTCTTATGTAATATATATAAACTACTGTACATGCTTAATATTCATGGGGACAAGCAGTTAATGCACGATATACATAACATGTCTTATGTAATATATATAAACTACTGTACATGCTTAATATTCATGGGGACAAGCAGTTAATGCACGACGTACATAG>

47
Haplotype 6: >CCCCACATTAAAATGGGCCCGGAGCGAGAAGAGGTACACGCTCAGGCAAGGATTGCTGGTTTCTCGAGGCCAGGTGATCAAGCTCTTTCGGACAGTTGAGGTCCATAAGAGACTGGTATGAATCATGAATATGCACGATAAAGCACTTATATGTCTTATGTAATATATATAAACTACTGTACATGCTTAATATTCATGGGGACAAGCAGTTAATGCACGATATACATAACATGTCTTATGTAATATATATAAACTACTGTACATGCTTAATATTCATGGGGACAAGCAGTTAATGCACGACGTACATAG> Haplotype 7: >CCCCACATTAAAATGGGCCCGGAGCGAGAAGAGGTACACGCTCAGGCAAGGATTGCTGGTTTCTCGAGGCCAGGTGATCAAGCTCTTTCGGACAGTTGAGGTCCATAAGAGACTGGTATAAATCATGAATATGCACGATAAAGCACTTATATGTCTTATGTAATATATATAAACTACTGTACATGCTTAATATTCATGGGGACAAGCAGTTAATGCACGATATACATAACATGTCTTATGTAATATATATAAACTACTGTACATGCTTAATATTCATGGGGACAAGCAGTTAATGCACGACGTACATAG>

48
APPENDIX 6
Consensus Numt sequence: >CCCCACGTTAGAATGGGCCCGGAGCGAGAAGAGGTACACGCTCAGGCAAG GGTTGCTGGTTTCTCGAGGCCAGGTGATTAAGCTCTTTCGGACAGTTGAG GTCCATAGAGGACTGTTATAGATCATGGATATGCACGATTAAGCACTATT ATGTCTTATGTAATATATATAAACTACTGTACATGCTTAATATTCATGGG GACAAGCAATTAATGCACGATATACATAGTATGTCTTATGTAATATATAT AAACTATTGTACATGCTTAATATTCATGGGGACAAGCAGTTAATGCACGA TATACATAGTATGTCTGGGGGGGG>