Embed Size (px)
Citation preview
Fiscal Year Ended March 31, 2019
(April 1, 2018 - March 31, 2019)
May 10, 2019
DAIFUKU CO., LTD.
Consolidated Financial Results
© 2019 Daifuku Co., Ltd.
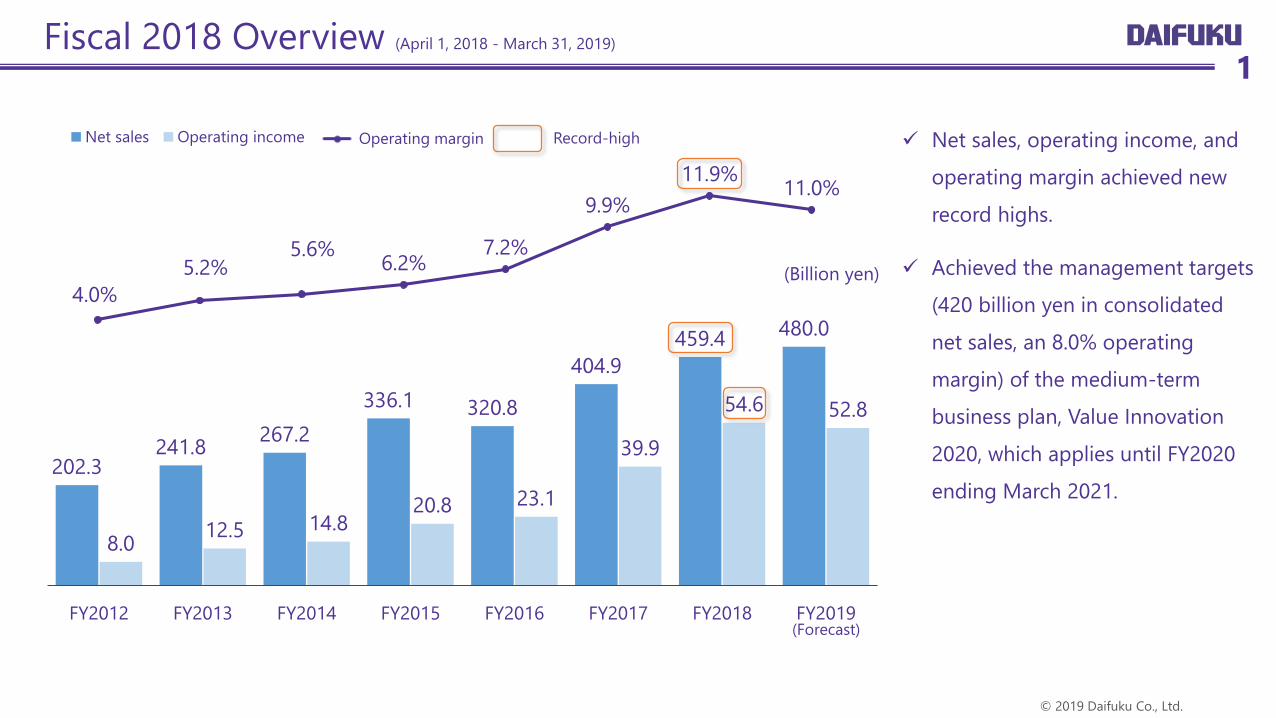
202.3241.8
267.2
336.1 320.8
404.9
459.4480.0
8.012.5 14.8
20.8 23.1
39.9
54.6 52.8
FY2012 FY2013 FY2014 FY2015 FY2016 FY2017 FY2018 FY2019
Net sales Operating income
Fiscal 2018 Overview (April 1, 2018 - March 31, 2019)
✓ Net sales, operating income, and
operating margin achieved new
record highs.
✓ Achieved the management targets
(420 billion yen in consolidated
net sales, an 8.0% operating
margin) of the medium-term
business plan, Value Innovation
2020, which applies until FY2020
ending March 2021.
4.0%
5.2%5.6%
6.2%7.2%
9.9%
11.9%11.0%
(Billion yen)
Operating margin Record-high
(Forecast)
1
© 2019 Daifuku Co., Ltd.
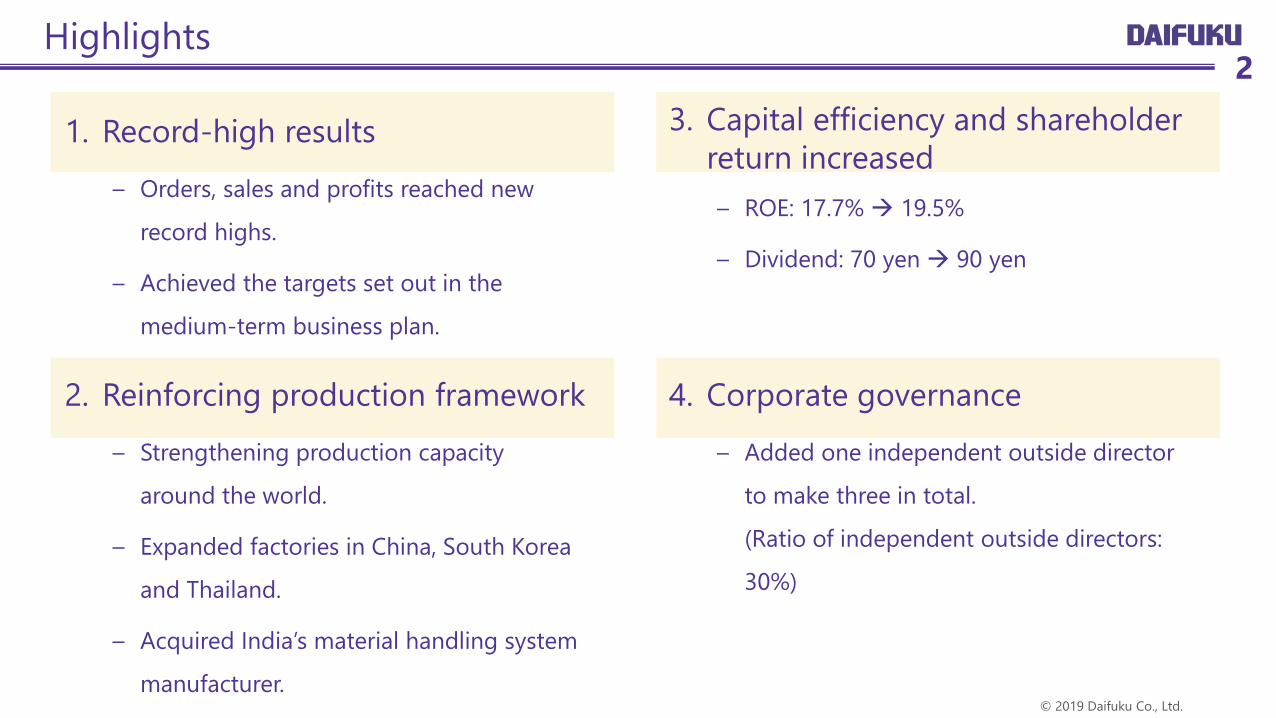
Highlights
1. Record-high results
– Orders, sales and profits reached new
record highs.
– Achieved the targets set out in the
medium-term business plan.
3. Capital efficiency and shareholder
return increased
– ROE: 17.7% → 19.5%
– Dividend: 70 yen → 90 yen
2. Reinforcing production framework
– Strengthening production capacity
around the world.
– Expanded factories in China, South Korea
and Thailand.
– Acquired India’s material handling system
manufacturer.
4. Corporate governance
– Added one independent outside director
to make three in total.
(Ratio of independent outside directors:
30%)
2
© 2019 Daifuku Co., Ltd.
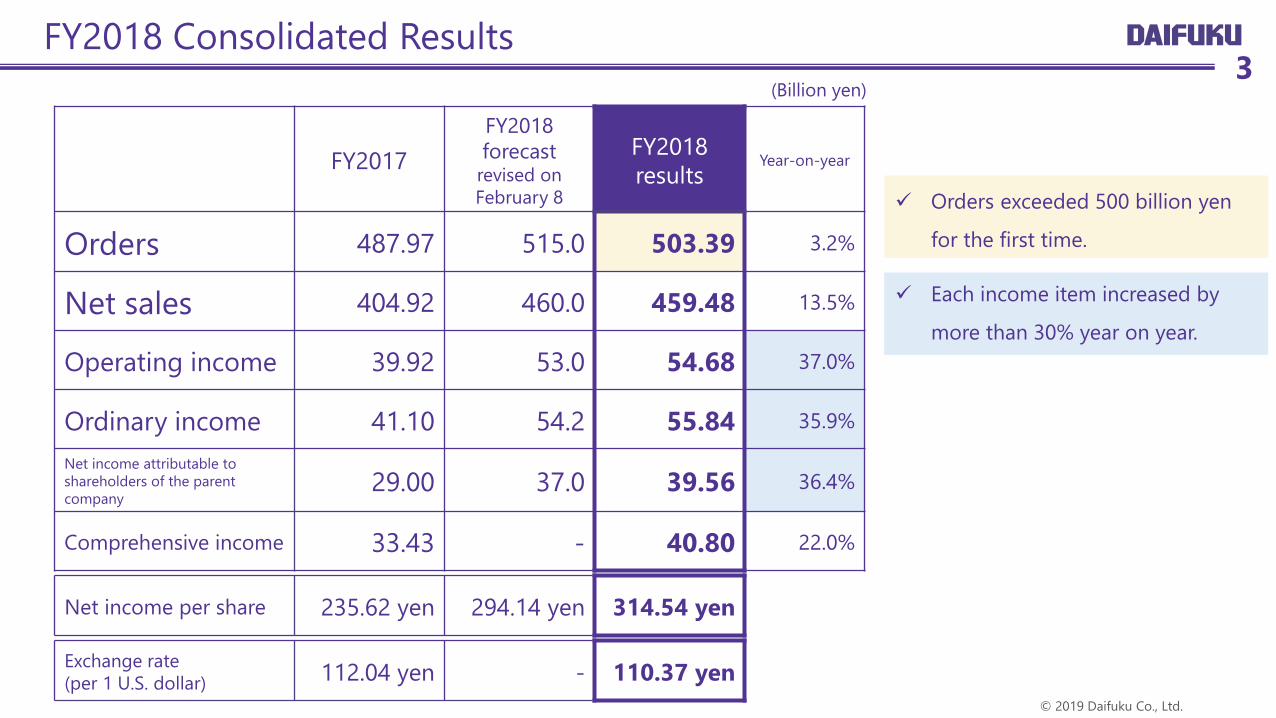
✓ Orders exceeded 500 billion yen
for the first time.
✓ Each income item increased by
more than 30% year on year.
FY2017
FY2018
forecastrevised on
February 8
FY2018
resultsYear-on-year
Orders 487.97 515.0 503.39 3.2%
Net sales 404.92 460.0 459.48 13.5%
Operating income 39.92 53.0 54.68 37.0%
Ordinary income 41.10 54.2 55.84 35.9%
Net income attributable to
shareholders of the parent
company29.00 37.0 39.56 36.4%
Comprehensive income 33.43 - 40.80 22.0%
FY2018 Consolidated Results
Net income per share 235.62 yen 294.14 yen 314.54 yen
Exchange rate
(per 1 U.S. dollar)112.04 yen - 110.37 yen
(Billion yen)3
© 2019 Daifuku Co., Ltd.
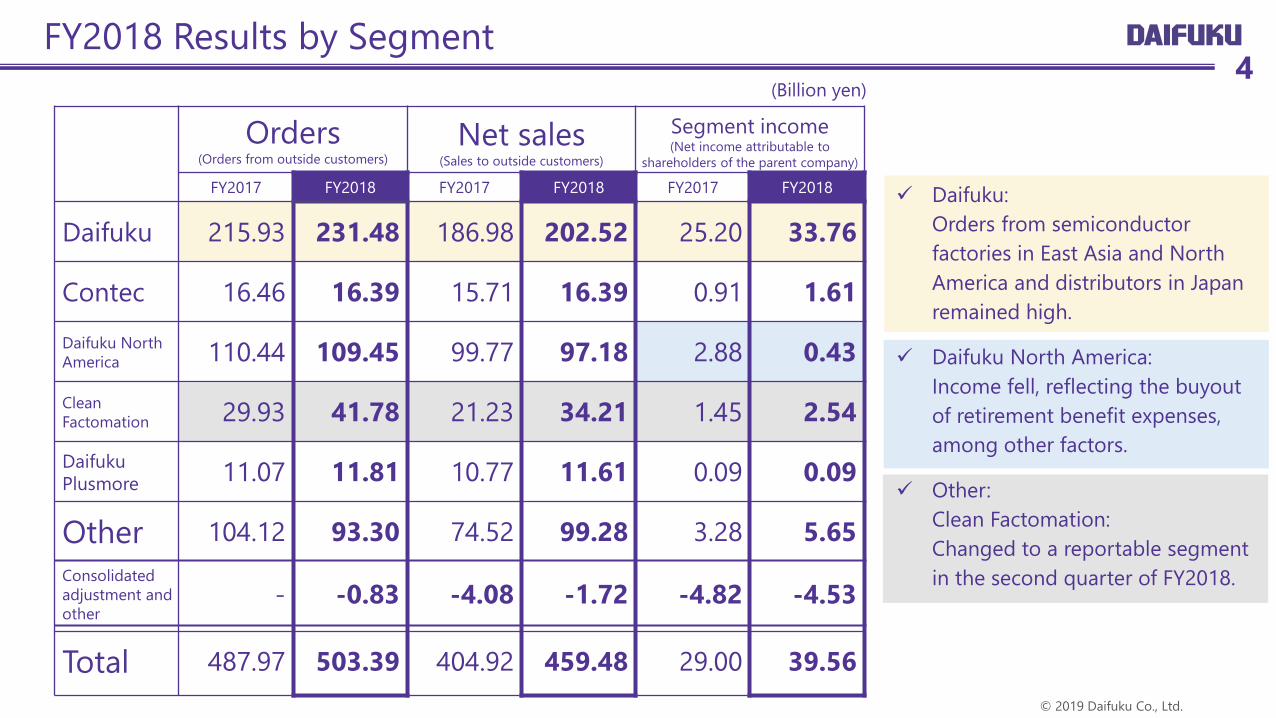
✓ Daifuku:
Orders from semiconductor
factories in East Asia and North
America and distributors in Japan
remained high.
✓ Daifuku North America:
Income fell, reflecting the buyout
of retirement benefit expenses,
among other factors.
✓ Other:
Clean Factomation:
Changed to a reportable segment
in the second quarter of FY2018.
FY2018 Results by Segment
Orders(Orders from outside customers)
Net sales(Sales to outside customers)
Segment income(Net income attributable to
shareholders of the parent company)
FY2017 FY2018 FY2017 FY2018 FY2017 FY2018
Daifuku 215.93 231.48 186.98 202.52 25.20 33.76
Contec 16.46 16.39 15.71 16.39 0.91 1.61
Daifuku North
America 110.44 109.45 99.77 97.18 2.88 0.43
Clean
Factomation 29.93 41.78 21.23 34.21 1.45 2.54
Daifuku
Plusmore11.07 11.81 10.77 11.61 0.09 0.09
Other 104.12 93.30 74.52 99.28 3.28 5.65
Consolidated
adjustment and
other- -0.83 -4.08 -1.72 -4.82 -4.53
Total 487.97 503.39 404.92 459.48 29.00 39.56
(Billion yen)4
© 2019 Daifuku Co., Ltd.
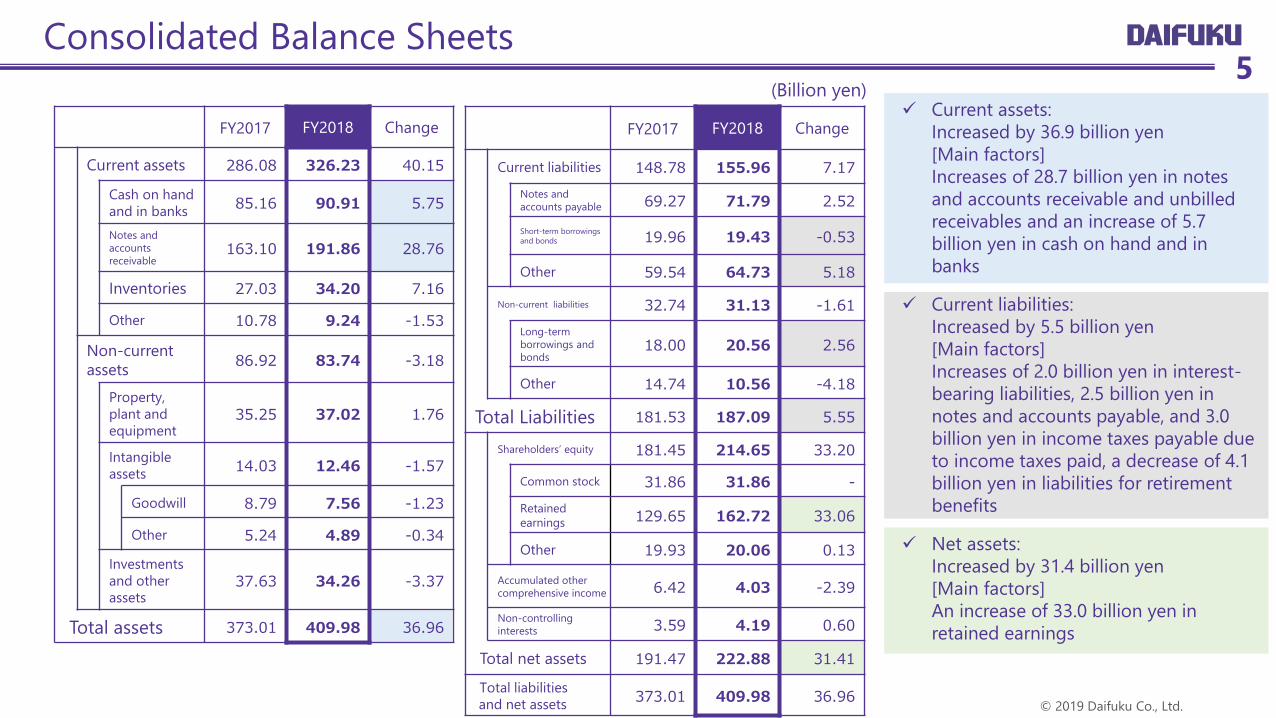
✓ Current assets:
Increased by 36.9 billion yen
[Main factors]
Increases of 28.7 billion yen in notes
and accounts receivable and unbilled
receivables and an increase of 5.7
billion yen in cash on hand and in
banks
✓ Current liabilities:
Increased by 5.5 billion yen
[Main factors]
Increases of 2.0 billion yen in interest-
bearing liabilities, 2.5 billion yen in
notes and accounts payable, and 3.0
billion yen in income taxes payable due
to income taxes paid, a decrease of 4.1
billion yen in liabilities for retirement
benefits
✓ Net assets:
Increased by 31.4 billion yen
[Main factors]
An increase of 33.0 billion yen in
retained earnings
Consolidated Balance Sheets
(Billion yen)
FY2017 FY2018 Change
Current assets 286.08 326.23 40.15
Cash on hand
and in banks85.16 90.91 5.75
Notes and
accounts
receivable163.10 191.86 28.76
Inventories 27.03 34.20 7.16
Other 10.78 9.24 -1.53
Non-current
assets86.92 83.74 -3.18
Property,
plant and
equipment35.25 37.02 1.76
Intangible
assets14.03 12.46 -1.57
Goodwill 8.79 7.56 -1.23
Other 5.24 4.89 -0.34
Investments
and other
assets37.63 34.26 -3.37
Total assets 373.01 409.98 36.96
FY2017 FY2018 Change
Current liabilities 148.78 155.96 7.17
Notes and
accounts payable 69.27 71.79 2.52
Short-term borrowings
and bonds 19.96 19.43 -0.53
Other 59.54 64.73 5.18
Non-current liabilities 32.74 31.13 -1.61
Long-term
borrowings and
bonds18.00 20.56 2.56
Other 14.74 10.56 -4.18
Total Liabilities 181.53 187.09 5.55
Shareholders’ equity 181.45 214.65 33.20
Common stock 31.86 31.86 -
Retained
earnings 129.65 162.72 33.06
Other 19.93 20.06 0.13
Accumulated other
comprehensive income 6.42 4.03 -2.39
Non-controlling
interests 3.59 4.19 0.60
Total net assets 191.47 222.88 31.41
Total liabilities
and net assets373.01 409.98 36.96
5
© 2019 Daifuku Co., Ltd.
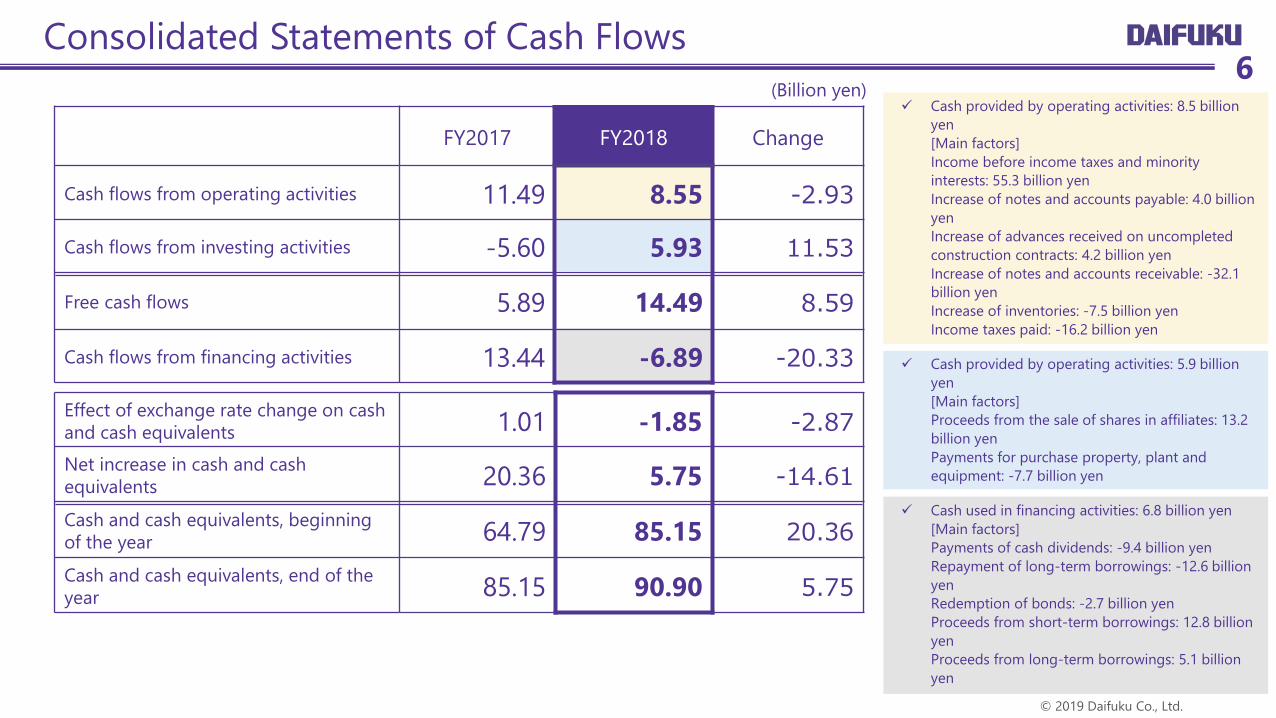
✓ Cash provided by operating activities: 8.5 billion
yen
[Main factors]
Income before income taxes and minority
interests: 55.3 billion yen
Increase of notes and accounts payable: 4.0 billion
yen
Increase of advances received on uncompleted
construction contracts: 4.2 billion yen
Increase of notes and accounts receivable: -32.1
billion yen
Increase of inventories: -7.5 billion yen
Income taxes paid: -16.2 billion yen
✓ Cash provided by operating activities: 5.9 billion
yen
[Main factors]
Proceeds from the sale of shares in affiliates: 13.2
billion yen
Payments for purchase property, plant and
equipment: -7.7 billion yen
✓ Cash used in financing activities: 6.8 billion yen
[Main factors]
Payments of cash dividends: -9.4 billion yen
Repayment of long-term borrowings: -12.6 billion
yen
Redemption of bonds: -2.7 billion yen
Proceeds from short-term borrowings: 12.8 billion
yen
Proceeds from long-term borrowings: 5.1 billion
yen
Consolidated Statements of Cash Flows
FY2017 FY2018 Change
Cash flows from operating activities 11.49 8.55 -2.93
Cash flows from investing activities -5.60 5.93 11.53
Free cash flows 5.89 14.49 8.59
Cash flows from financing activities 13.44 -6.89 -20.33
Effect of exchange rate change on cash
and cash equivalents 1.01 -1.85 -2.87
Net increase in cash and cash
equivalents 20.36 5.75 -14.61
Cash and cash equivalents, beginning
of the year 64.79 85.15 20.36
Cash and cash equivalents, end of the
year 85.15 90.90 5.75
(Billion yen)6
© 2019 Daifuku Co., Ltd.
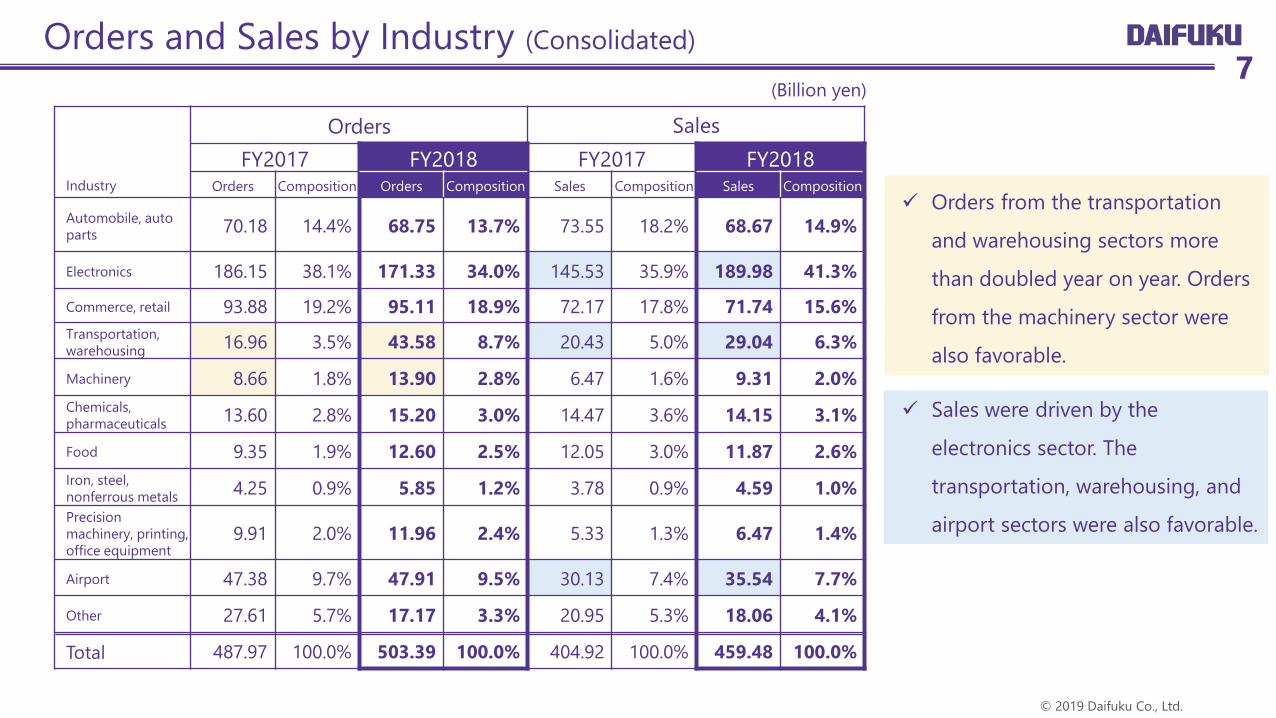
✓ Orders from the transportation
and warehousing sectors more
than doubled year on year. Orders
from the machinery sector were
also favorable.
✓ Sales were driven by the
electronics sector. The
transportation, warehousing, and
airport sectors were also favorable.
Orders and Sales by Industry (Consolidated)
(Billion yen)
Industry
Orders Sales
FY2017 FY2018 FY2017 FY2018Orders Composition Orders Composition Sales Composition Sales Composition
Automobile, auto
parts70.18 14.4% 68.75 13.7% 73.55 18.2% 68.67 14.9%
Electronics 186.15 38.1% 171.33 34.0% 145.53 35.9% 189.98 41.3%
Commerce, retail 93.88 19.2% 95.11 18.9% 72.17 17.8% 71.74 15.6%
Transportation,
warehousing16.96 3.5% 43.58 8.7% 20.43 5.0% 29.04 6.3%
Machinery 8.66 1.8% 13.90 2.8% 6.47 1.6% 9.31 2.0%
Chemicals,
pharmaceuticals13.60 2.8% 15.20 3.0% 14.47 3.6% 14.15 3.1%
Food 9.35 1.9% 12.60 2.5% 12.05 3.0% 11.87 2.6%
Iron, steel,
nonferrous metals4.25 0.9% 5.85 1.2% 3.78 0.9% 4.59 1.0%
Precision
machinery, printing,
office equipment9.91 2.0% 11.96 2.4% 5.33 1.3% 6.47 1.4%
Airport 47.38 9.7% 47.91 9.5% 30.13 7.4% 35.54 7.7%
Other 27.61 5.7% 17.17 3.3% 20.95 5.3% 18.06 4.1%
Total 487.97 100.0% 503.39 100.0% 404.92 100.0% 459.48 100.0%
7
© 2019 Daifuku Co., Ltd.
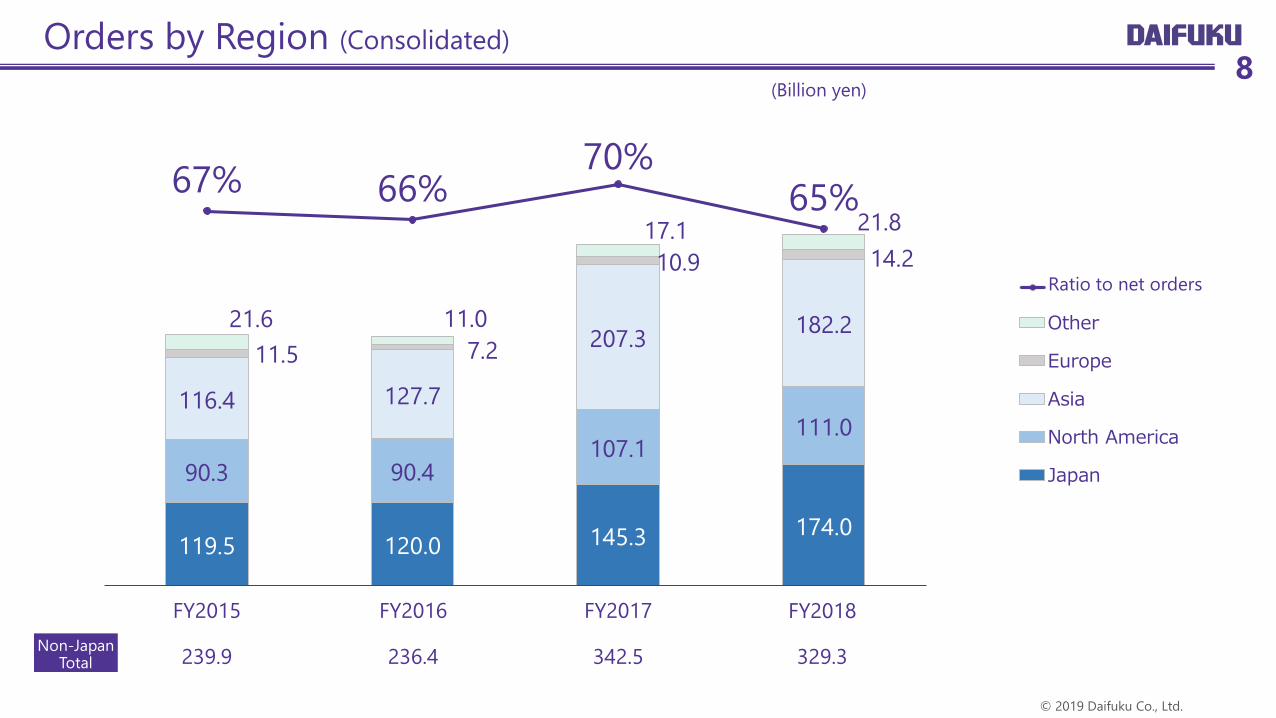
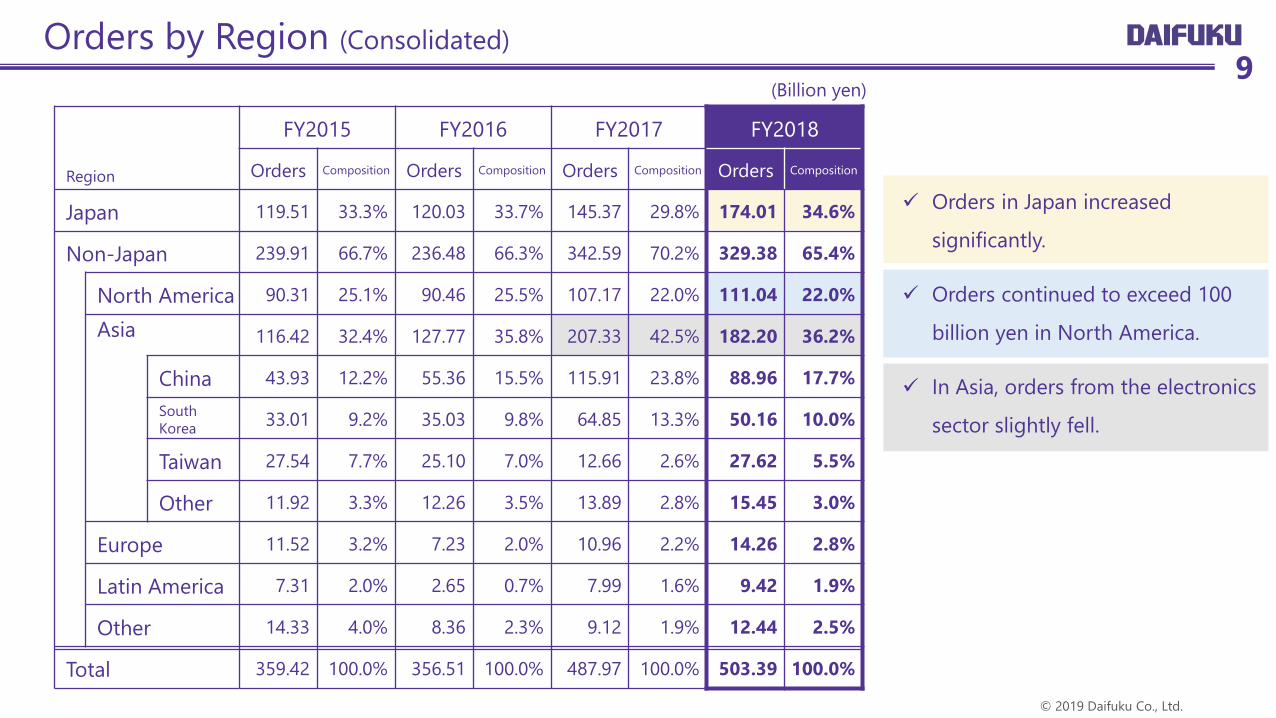
Orders by Region (Consolidated)
FY2015
239.9
FY2016
236.4
119.5 120.0 145.3 174.0
90.3 90.4 107.1
111.0 116.4 127.7
207.3 182.2
11.5 7.2
10.9 14.2
21.6 11.0
17.1 21.8
67% 66%70%
65%
Other
Europe
Asia
North America
Japan
Ratio to net orders
FY2018
329.3
FY2017
342.5
Ratio to net orders
(Billion yen)
Non-Japan Total
8
© 2019 Daifuku Co., Ltd.
Orders by Region (Consolidated)
Region
FY2015 FY2016 FY2017 FY2018
Orders Composition Orders Composition Orders Composition Orders Composition
Japan 119.51 33.3% 120.03 33.7% 145.37 29.8% 174.01 34.6%
Non-Japan 239.91 66.7% 236.48 66.3% 342.59 70.2% 329.38 65.4%
North America 90.31 25.1% 90.46 25.5% 107.17 22.0% 111.04 22.0%
Asia 116.42 32.4% 127.77 35.8% 207.33 42.5% 182.20 36.2%
China 43.93 12.2% 55.36 15.5% 115.91 23.8% 88.96 17.7%
South
Korea33.01 9.2% 35.03 9.8% 64.85 13.3% 50.16 10.0%
Taiwan 27.54 7.7% 25.10 7.0% 12.66 2.6% 27.62 5.5%
Other 11.92 3.3% 12.26 3.5% 13.89 2.8% 15.45 3.0%
Europe 11.52 3.2% 7.23 2.0% 10.96 2.2% 14.26 2.8%
Latin America 7.31 2.0% 2.65 0.7% 7.99 1.6% 9.42 1.9%
Other 14.33 4.0% 8.36 2.3% 9.12 1.9% 12.44 2.5%
Total 359.42 100.0% 356.51 100.0% 487.97 100.0% 503.39 100.0%
(Billion yen)
✓ Orders in Japan increased
significantly.
✓ Orders continued to exceed 100
billion yen in North America.
✓ In Asia, orders from the electronics
sector slightly fell.
9
© 2019 Daifuku Co., Ltd.
(Billion yen)
Sales by Region (Consolidated)
114.2 110.6 132.4 127.6
83.1 76.6 95.5 99.1
109.7 107.0
150.5 204.6
9.9 8.5
9.6
12.8
19.0 17.9
16.7
15.2 66% 65% 67%
72%
Other
Europe
Asia
North America
Japan
Ratio to net sales
Ratio to net sales
Non-Japan Total
FY2015
221.9
FY2016
210.1
FY2017
272.4
FY2018
331.8
10
© 2019 Daifuku Co., Ltd.
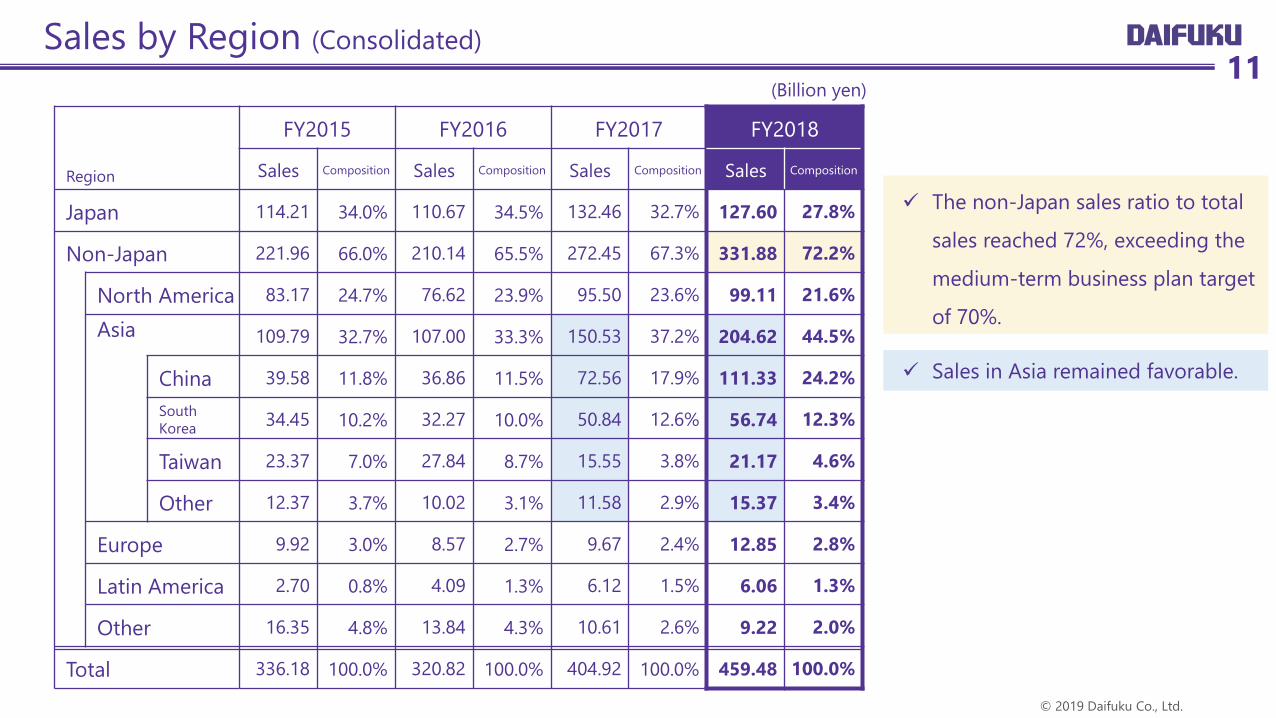
✓ The non-Japan sales ratio to total
sales reached 72%, exceeding the
medium-term business plan target
of 70%.
✓ Sales in Asia remained favorable.
Sales by Region (Consolidated)
Region
FY2015 FY2016 FY2017 FY2018
Sales Composition Sales Composition Sales Composition Sales Composition
Japan 114.21 34.0% 110.67 34.5% 132.46 32.7% 127.60 27.8%
Non-Japan 221.96 66.0% 210.14 65.5% 272.45 67.3% 331.88 72.2%
North America 83.17 24.7% 76.62 23.9% 95.50 23.6% 99.11 21.6%
Asia 109.79 32.7% 107.00 33.3% 150.53 37.2% 204.62 44.5%
China 39.58 11.8% 36.86 11.5% 72.56 17.9% 111.33 24.2%
South
Korea34.45 10.2% 32.27 10.0% 50.84 12.6% 56.74 12.3%
Taiwan 23.37 7.0% 27.84 8.7% 15.55 3.8% 21.17 4.6%
Other 12.37 3.7% 10.02 3.1% 11.58 2.9% 15.37 3.4%
Europe 9.92 3.0% 8.57 2.7% 9.67 2.4% 12.85 2.8%
Latin America 2.70 0.8% 4.09 1.3% 6.12 1.5% 6.06 1.3%
Other 16.35 4.8% 13.84 4.3% 10.61 2.6% 9.22 2.0%
Total 336.18 100.0% 320.82 100.0% 404.92 100.0% 459.48 100.0%
(Billion yen)11
© 2019 Daifuku Co., Ltd.
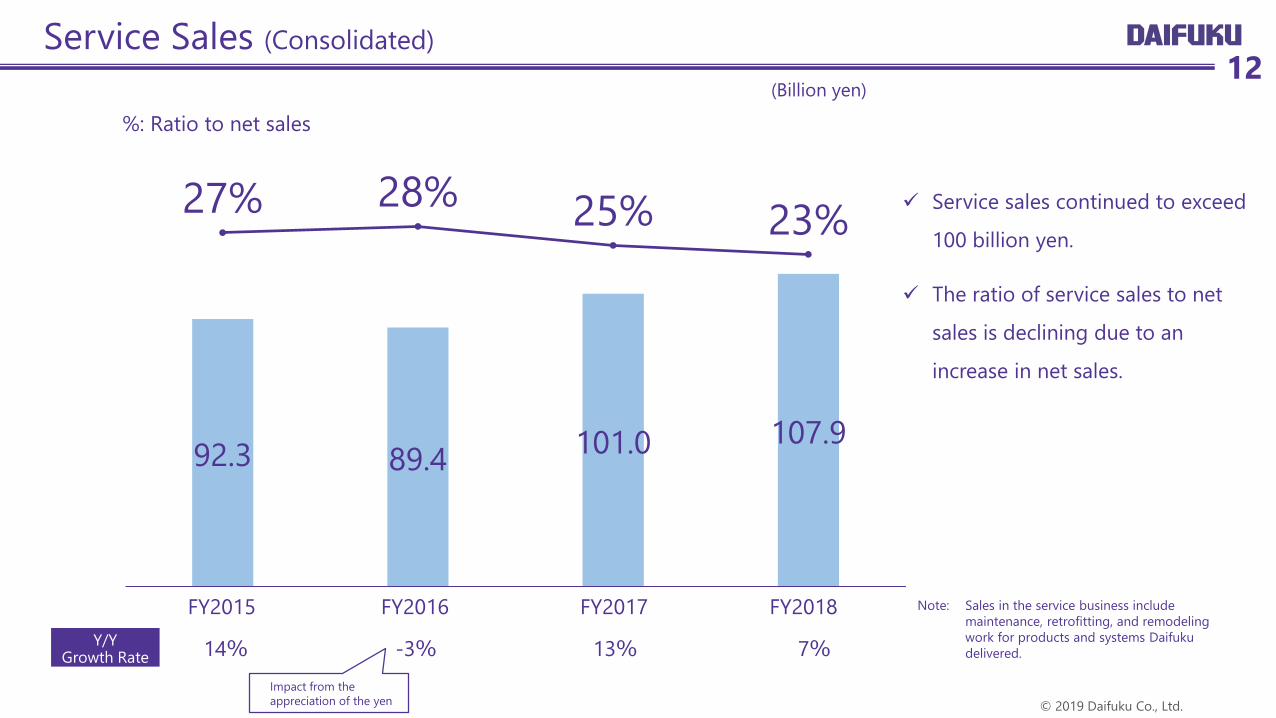
Service Sales (Consolidated)
-3%14%
92.3 89.4101.0 107.9
27% 28% 25% 23%
13%
FY2015 FY2016 FY2017
✓ Service sales continued to exceed
100 billion yen.
✓ The ratio of service sales to net
sales is declining due to an
increase in net sales.
FY2018
7%
Impact from the
appreciation of the yen
(Billion yen)
%: Ratio to net sales
Y/Y Growth Rate
Note: Sales in the service business include
maintenance, retrofitting, and remodeling
work for products and systems Daifuku
delivered.
12
© 2019 Daifuku Co., Ltd.
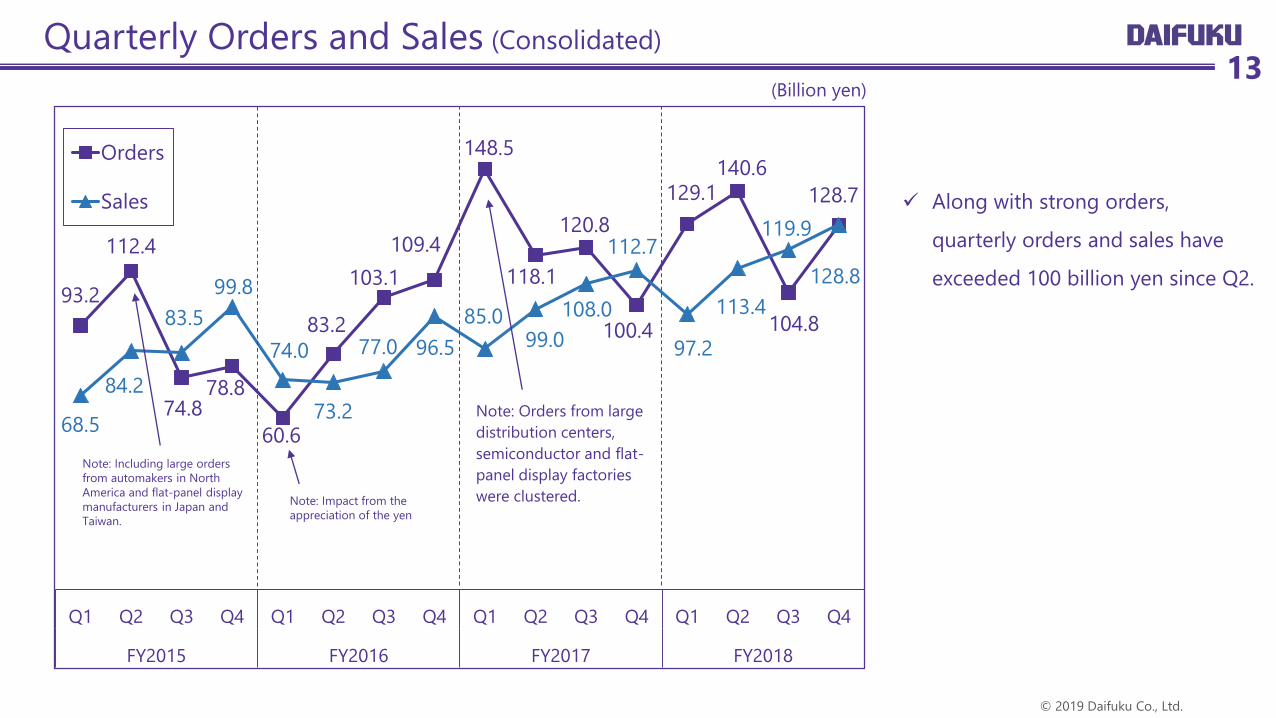
Quarterly Orders and Sales (Consolidated)
93.2
112.4
74.8 78.8
60.6
83.2
103.1
109.4
148.5
118.1
120.8
100.4
129.1 140.6
104.8
128.7
68.5
84.2
83.5
99.8
74.0
73.2
77.0 96.5
85.0 99.0
108.0
112.7
97.2
113.4
119.9
128.8
Q1 Q2 Q3 Q4 Q1 Q2 Q3 Q4 Q1 Q2 Q3 Q4 Q1 Q2 Q3 Q4
FY2015 FY2016 FY2017 FY2018
Orders
Sales
Note: Impact from the
appreciation of the yen
✓ Along with strong orders,
quarterly orders and sales have
exceeded 100 billion yen since Q2.
Note: Orders from large
distribution centers,
semiconductor and flat-
panel display factories
were clustered.
(Billion yen)
Note: Including large orders
from automakers in North
America and flat-panel display
manufacturers in Japan and
Taiwan.
13
© 2019 Daifuku Co., Ltd.
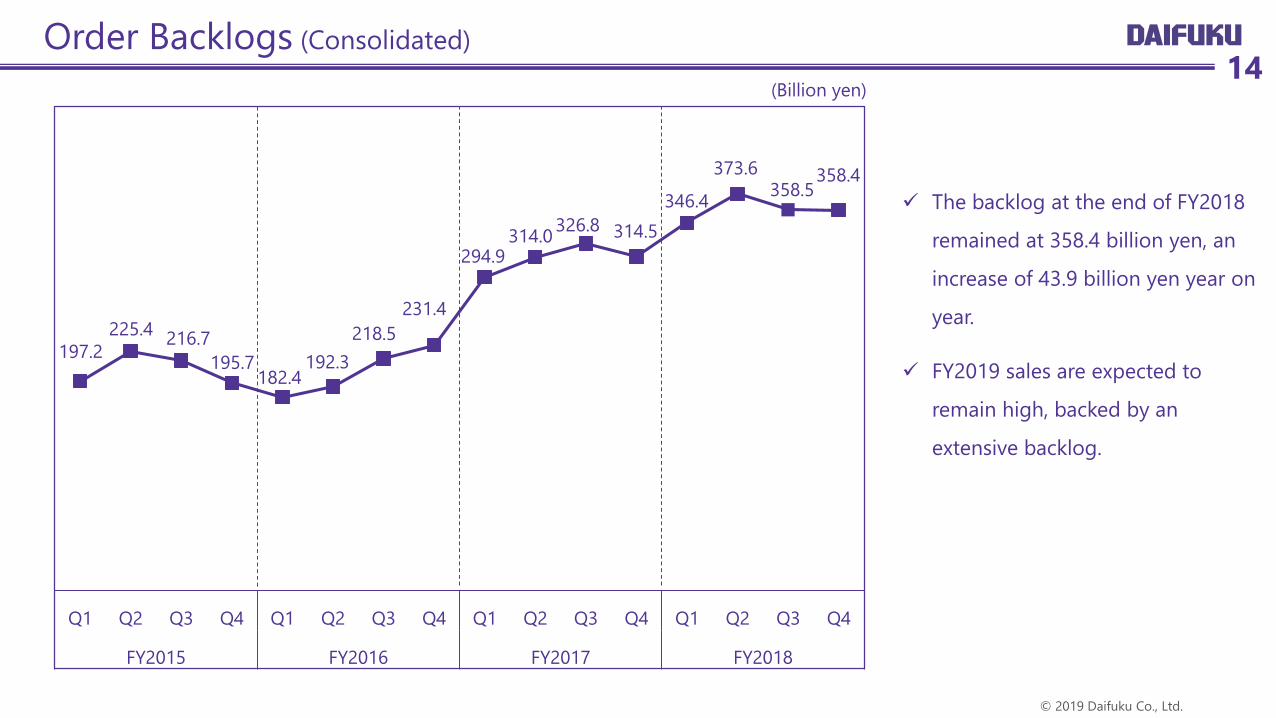
Order Backlogs (Consolidated)
✓ The backlog at the end of FY2018
remained at 358.4 billion yen, an
increase of 43.9 billion yen year on
year.
✓ FY2019 sales are expected to
remain high, backed by an
extensive backlog.
(Billion yen)
197.2
225.4 216.7
195.7 182.4
192.3
218.5
231.4
294.9 314.0
326.8 314.5
346.4
373.6 358.4
Q1 Q2 Q3 Q4 Q1 Q2 Q3 Q4 Q1 Q2 Q3 Q4 Q1 Q2 Q3 Q4
FY2015 FY2016 FY2017 FY2018
358.5
14
© 2019 Daifuku Co., Ltd.
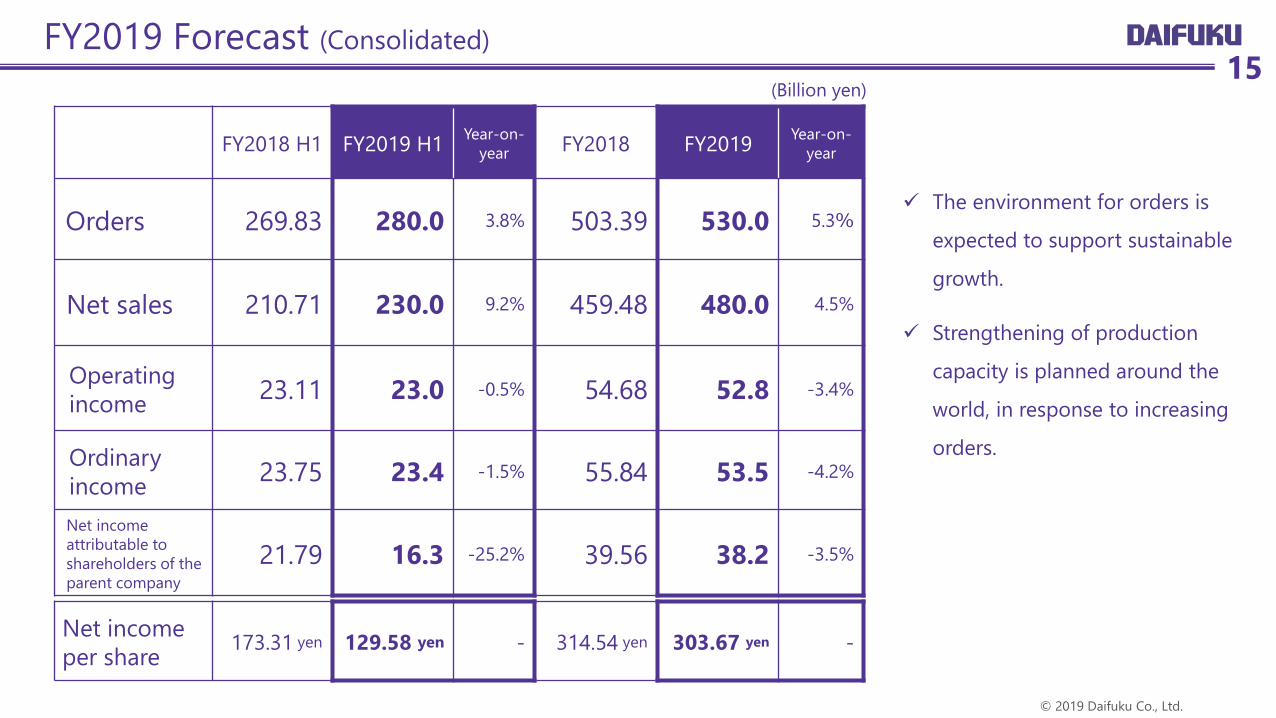
FY2019 Forecast (Consolidated)
FY2018 H1 FY2019 H1Year-on-
year FY2018 FY2019Year-on-
year
Orders 269.83 280.0 3.8% 503.39 530.0 5.3%
Net sales 210.71 230.0 9.2% 459.48 480.0 4.5%
Operating
income23.11 23.0 -0.5% 54.68 52.8 -3.4%
Ordinary
income23.75 23.4 -1.5% 55.84 53.5 -4.2%
Net income
attributable to
shareholders of the
parent company
21.79 16.3 -25.2% 39.56 38.2 -3.5%
✓ The environment for orders is
expected to support sustainable
growth.
✓ Strengthening of production
capacity is planned around the
world, in response to increasing
orders.
Net income
per share 173.31 yen 129.58 yen - 314.54 yen 303.67 yen -
(Billion yen)15
© 2019 Daifuku Co., Ltd.
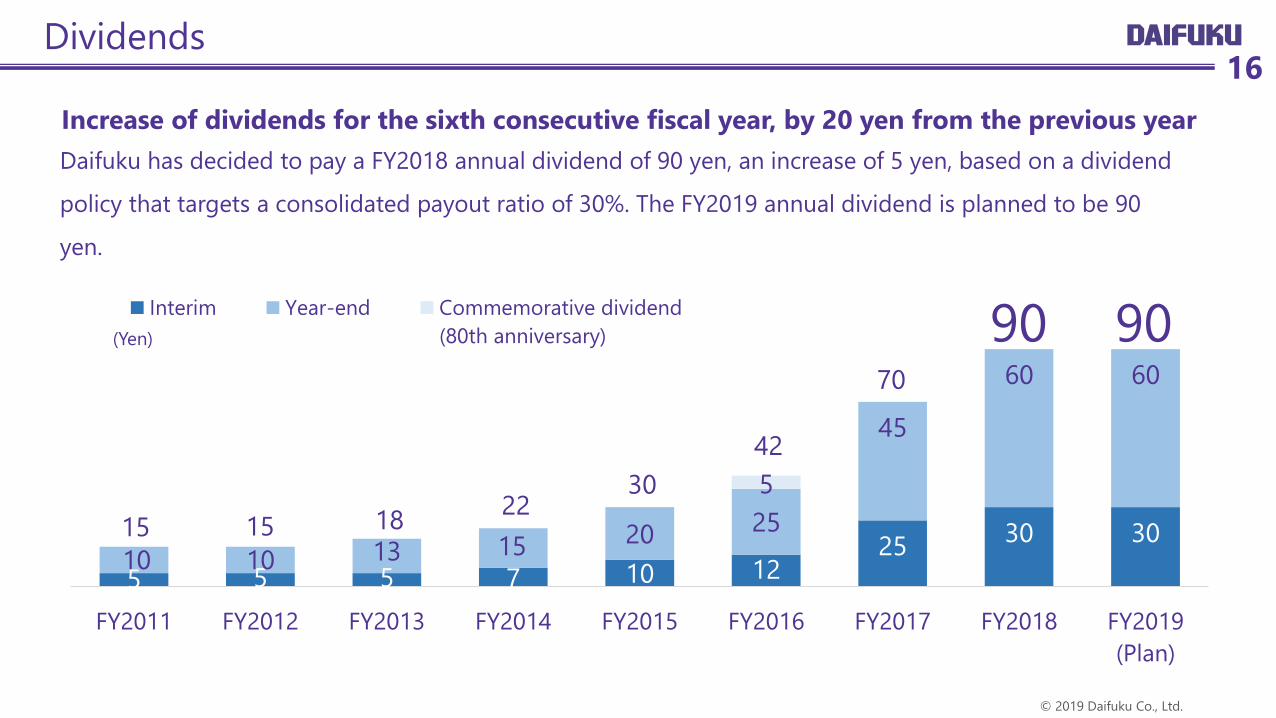
5 5 5 7 10 1225
30 3010 10 13 15 20 25
45
60 60
5
FY2011 FY2012 FY2013 FY2014 FY2015 FY2016 FY2017 FY2018 FY2019
(Plan)
Interim Year-end Commemorative dividend
(80th anniversary)
Dividends
3022
18
42
90
Increase of dividends for the sixth consecutive fiscal year, by 20 yen from the previous year
Daifuku has decided to pay a FY2018 annual dividend of 90 yen, an increase of 5 yen, based on a dividend
policy that targets a consolidated payout ratio of 30%. The FY2019 annual dividend is planned to be 90
yen.
70
15 15
90
16
(Yen)
© 2019 Daifuku Co., Ltd.
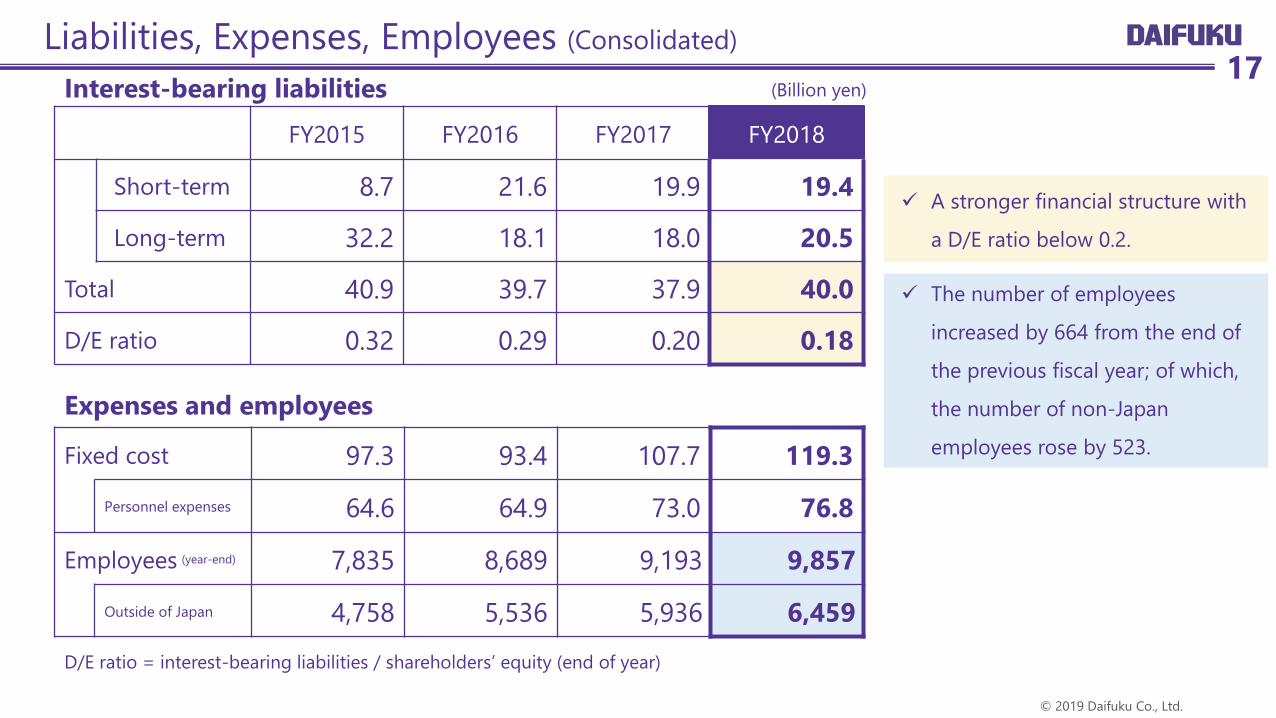
✓ A stronger financial structure with
a D/E ratio below 0.2.
✓ The number of employees
increased by 664 from the end of
the previous fiscal year; of which,
the number of non-Japan
employees rose by 523.
Liabilities, Expenses, Employees (Consolidated)
FY2015 FY2016 FY2017 FY2018
Short-term 8.7 21.6 19.9 19.4
Long-term 32.2 18.1 18.0 20.5
Total 40.9 39.7 37.9 40.0
D/E ratio 0.32 0.29 0.20 0.18
Fixed cost 97.3 93.4 107.7 119.3
Personnel expenses 64.6 64.9 73.0 76.8
Employees (year-end) 7,835 8,689 9,193 9,857
Outside of Japan 4,758 5,536 5,936 6,459
(Billion yen)Interest-bearing liabilities
Expenses and employees
D/E ratio = interest-bearing liabilities / shareholders’ equity (end of year)
17
© 2019 Daifuku Co., Ltd.
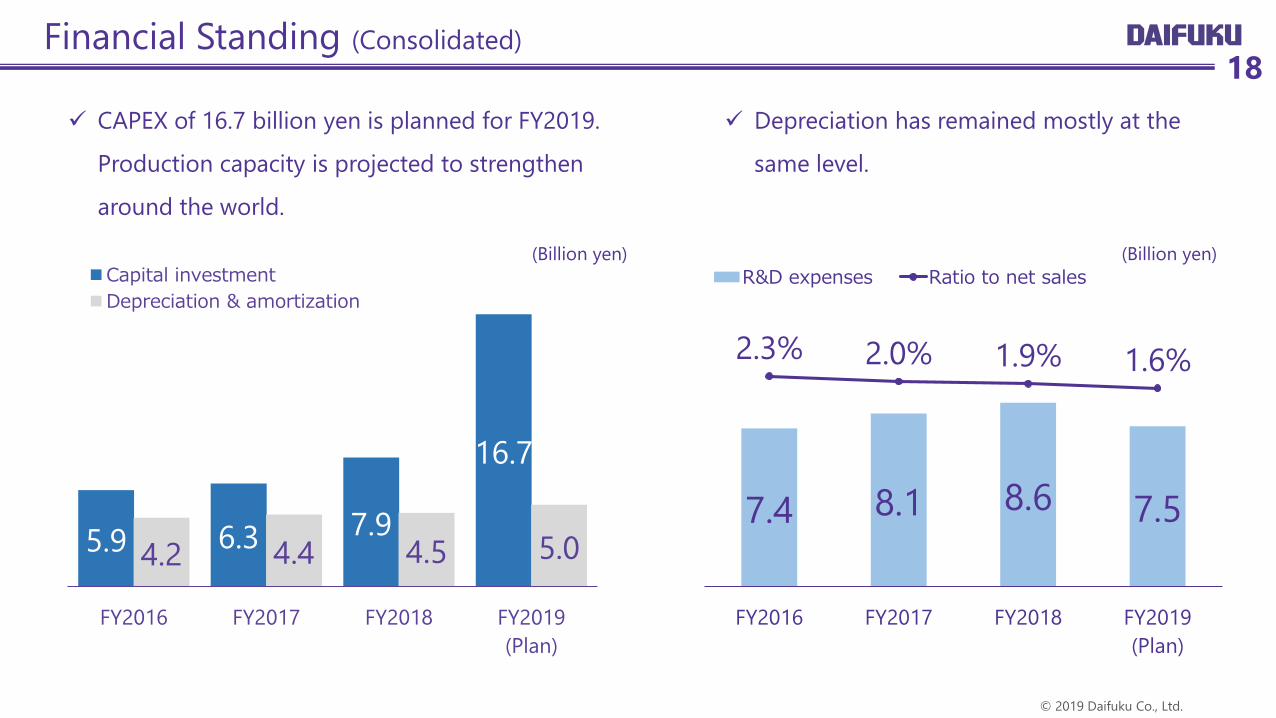
Financial Standing (Consolidated)
(Billion yen)
5.9 6.3 7.9
16.7
4.2 4.4 4.5 5.0
FY2016 FY2017 FY2018 FY2019
(Plan)
Capital investment
Depreciation & amortization
7.4 8.1 8.6 7.5
2.3% 2.0% 1.9% 1.6%
FY2016 FY2017 FY2018 FY2019
(Plan)
R&D expenses Ratio to net sales
✓ CAPEX of 16.7 billion yen is planned for FY2019.
Production capacity is projected to strengthen
around the world.
✓ Depreciation has remained mostly at the
same level.
(Billion yen)
18
© 2019 Daifuku Co., Ltd.
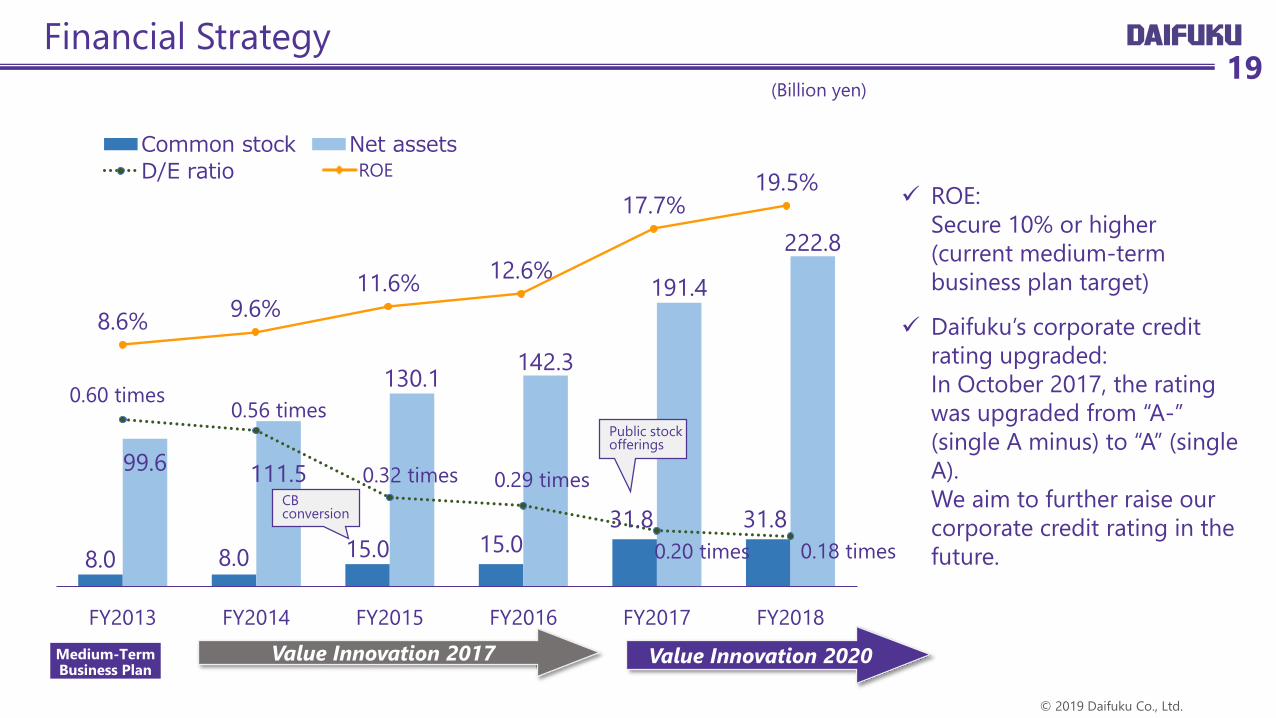
8.0 8.0 15.0 15.0 31.8 31.8
99.6 111.5
130.1 142.3
191.4
222.8
0.60 times0.56 times
0.32 times 0.29 times
0.20 times 0.18 times
FY2013 FY2014 FY2015 FY2016 FY2017 FY2018
Common stock Net assets
D/E ratio
8.6%9.6%
11.6%12.6%
17.7%19.5%
Financial Strategy
ROE
✓ ROE:
Secure 10% or higher
(current medium-term
business plan target)
✓ Daifuku’s corporate credit
rating upgraded:
In October 2017, the rating
was upgraded from “A-”
(single A minus) to “A” (single
A).
We aim to further raise our
corporate credit rating in the
future.
Medium-Term Business Plan
(Billion yen)
Value Innovation 2017 Value Innovation 2020
CB conversion
Public stock offerings
19
© 2019 Daifuku Co., Ltd.
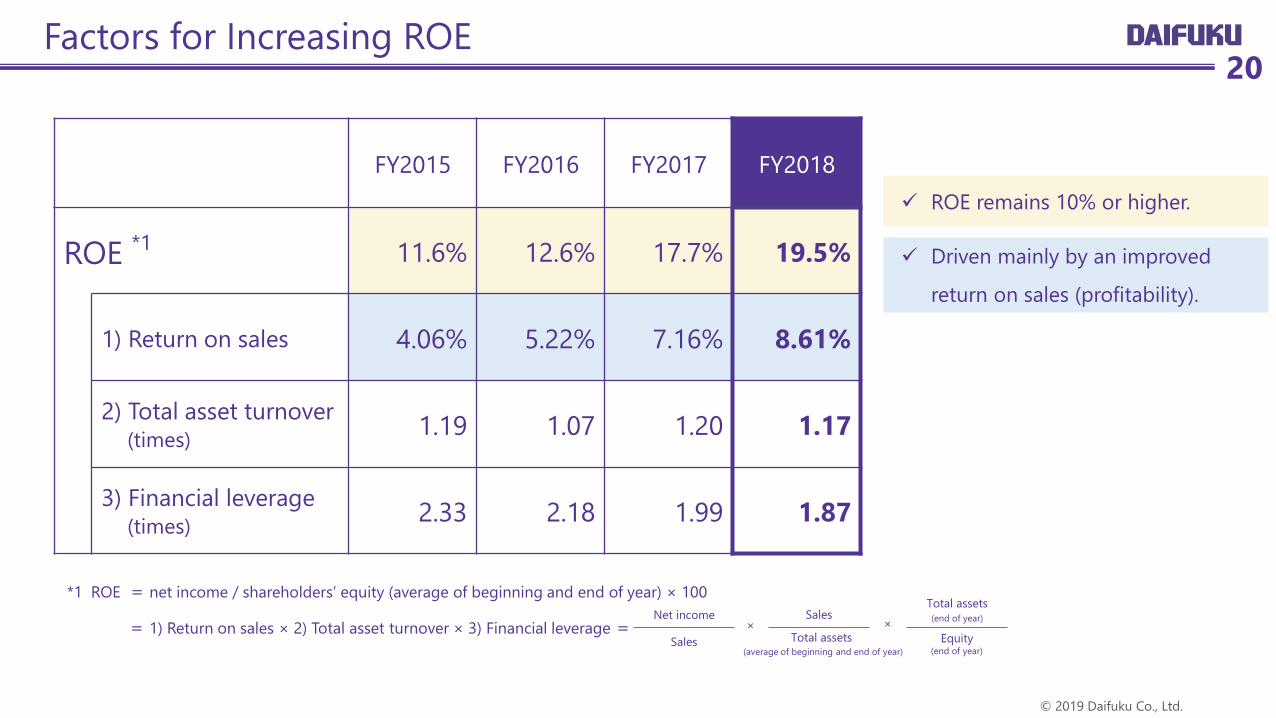
✓ ROE remains 10% or higher.
✓ Driven mainly by an improved
return on sales (profitability).
Factors for Increasing ROE
FY2015 FY2016 FY2017 FY2018
ROE *1 11.6% 12.6% 17.7% 19.5%
1) Return on sales 4.06% 5.22% 7.16% 8.61%
2) Total asset turnover (times)
1.19 1.07 1.20 1.17
3) Financial leverage (times)
2.33 2.18 1.99 1.87
*1 ROE = net income / shareholders’ equity (average of beginning and end of year) × 100
= 1) Return on sales × 2) Total asset turnover × 3) Financial leverage =Sales
Net income
Total assets (average of beginning and end of year)
Sales
Equity (end of year)
Total assets
(end of year) ××
20
© 2019 Daifuku Co., Ltd.
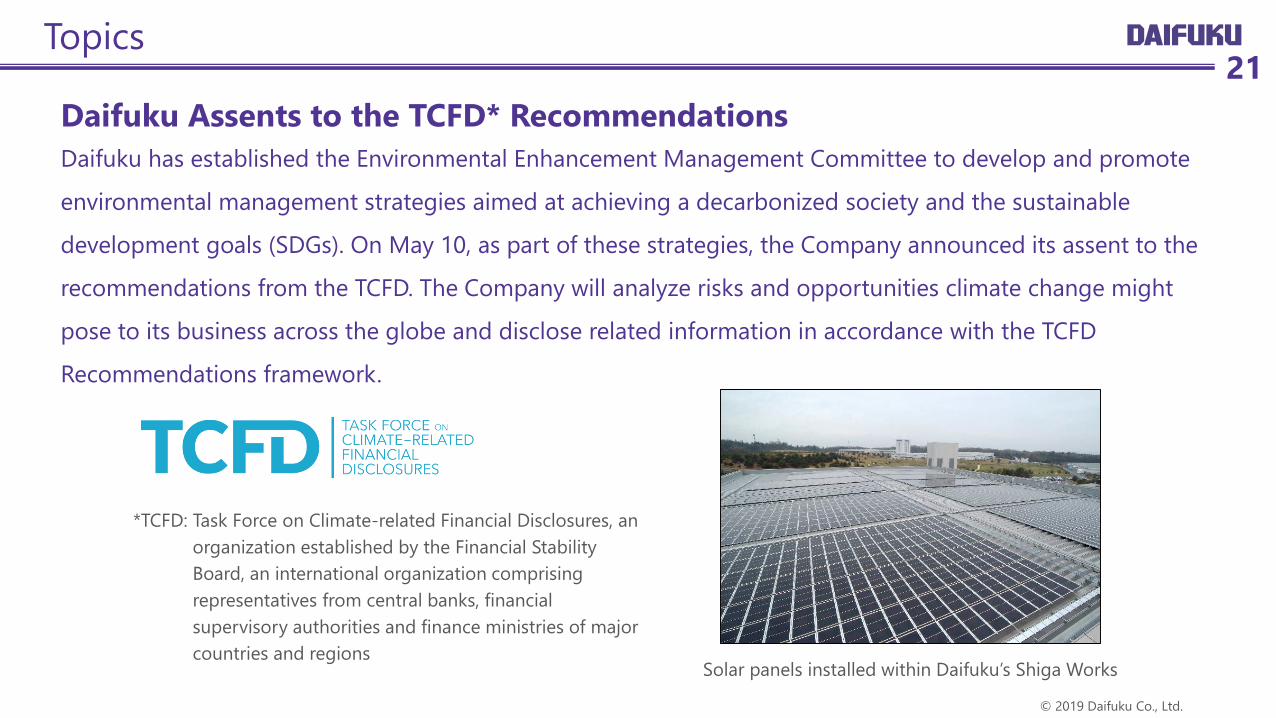
Daifuku has established the Environmental Enhancement Management Committee to develop and promote
environmental management strategies aimed at achieving a decarbonized society and the sustainable
development goals (SDGs). On May 10, as part of these strategies, the Company announced its assent to the
recommendations from the TCFD. The Company will analyze risks and opportunities climate change might
pose to its business across the globe and disclose related information in accordance with the TCFD
Recommendations framework.
Topics
Daifuku Assents to the TCFD* Recommendations
21
*TCFD: Task Force on Climate-related Financial Disclosures, an
organization established by the Financial Stability
Board, an international organization comprising
representatives from central banks, financial
supervisory authorities and finance ministries of major
countries and regionsSolar panels installed within Daifuku’s Shiga Works
© 2019 Daifuku Co., Ltd.
Topics
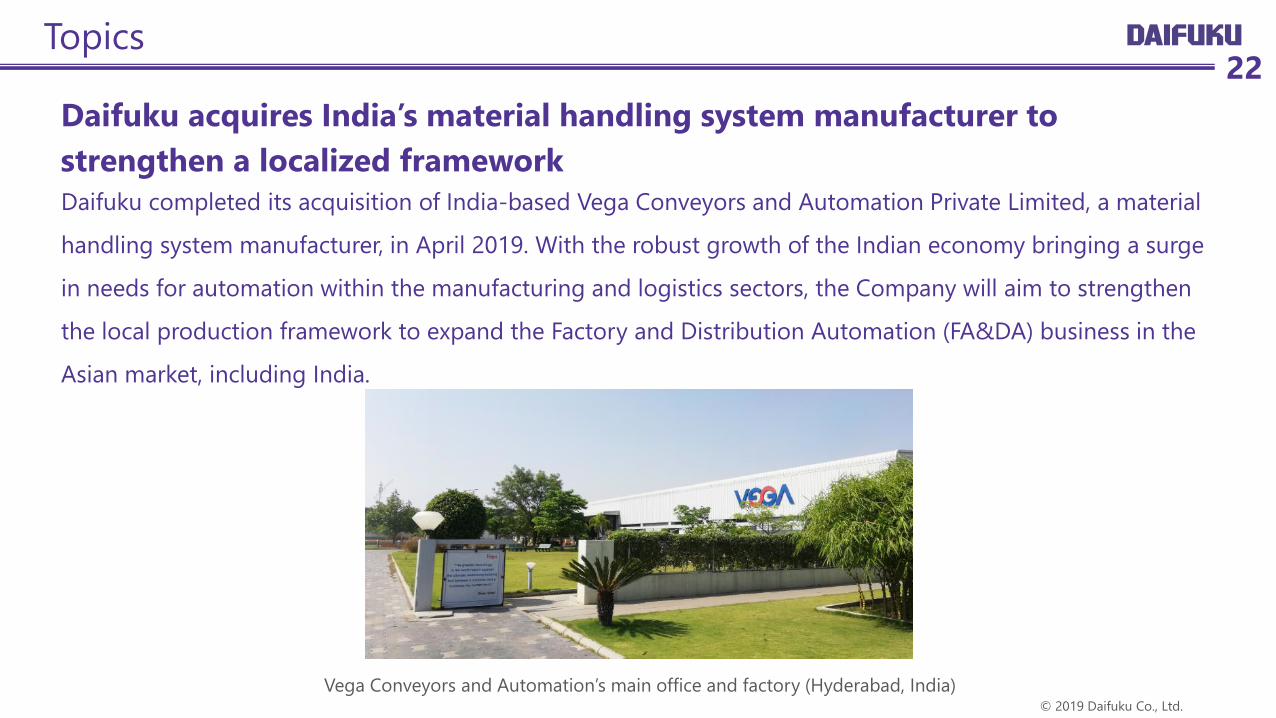
Daifuku acquires India’s material handling system manufacturer to
strengthen a localized framework
22
Vega Conveyors and Automation’s main office and factory (Hyderabad, India)
Daifuku completed its acquisition of India-based Vega Conveyors and Automation Private Limited, a material
handling system manufacturer, in April 2019. With the robust growth of the Indian economy bringing a surge
in needs for automation within the manufacturing and logistics sectors, the Company will aim to strengthen
the local production framework to expand the Factory and Distribution Automation (FA&DA) business in the
Asian market, including India.
© 2019 Daifuku Co., Ltd.
Cautionary Statement with Respect to Forward-Looking Statements
The strategies, beliefs and plans related to future business performance as described in this document are not established facts. They are business prospects based on the assumptions and beliefs of themanagement team judging from the most current information, and therefore, these prospects are subject to potential risks and uncertainties. Due to various crucial factors, actual results may differmaterially from these forward-looking statements. These crucial factors that may adversely affect performance include 1) consumer trends and economic conditions in the Daifuku Group's operatingenvironment; 2) the effect of yen exchange rates on sales, assets and liabilities denominated in U.S. dollars and other currencies; 3) the tightening of laws and regulations regarding safety and othermatters that may lead to higher costs or sales restrictions; and 4) the impact of natural disasters and intentional threats, war, acts of terrorism, strikes, and plagues. Moreover, there are other factors thatmay adversely affect the Group's performance.


![© 2020 Daifuku Co., Ltd./Media/daifukucom/ir/... · Consolidated Balance Sheets (Billion yen) 4 Total assets: Increased by ¥0.9 billion [Factors] Increases: ¥10.8 billion in notes](https://img.pdfslide.net/doc/110x75/5fc63a432908640ded75f026/-2020-daifuku-co-ltd-mediadaifukucomir-consolidated-balance-sheets.jpg)