Embed Size (px)
Citation preview
Consolidated Financial Statements and Management
Report for the Parent Company and the Group 2016
Rocket Internet SE, Berlin
Non-binding convenience translation from German
Table of Contents
Consolidated Financial Statements for 2016 (prepared in accordance with IFRS as endorsed in the EU) comprising:
• Consolidated Statement of Comprehensive Income
• Consolidated Balance Sheet
• Consolidated Statement of Changes in Equity
• Consolidated Statement of Cash Flows
• Notes to the Consolidated Financial Statements
Management Report for the Parent Company and the Group 2016 (Combined Management Report)
Audit Opinion
Responsibility Statement
Consolidated Financial Statements 2016
(prepared in accordance with IFRS as endorsed in the EU)
Rocket Internet SE, Berlin
Non-binding convenience translation from German
Rocket Internet SE
Consolidated Financial Statements (IFRS)
1
Consolidated Financial Statements Consolidated Statement of Comprehensive Income ...................................................................................................... 2 Consolidated Balance Sheet ......................................................................................................................................... 3 Consolidated Statement of Changes in Equity .............................................................................................................. 4 Consolidated Statement of Cash Flows ......................................................................................................................... 5 Notes to the Consolidated Financial Statements
1 Corporate and Group Information ....................................................................................................................... 6
2 Basis of Preparation ........................................................................................................................................... 8
3 Summary of Significant Accounting Policies ...................................................................................................... 9
4 Critical Accounting Judgments, Estimates and Assumptions in Applying Accounting Policies ......................... 22
5 New Accounting Pronouncements ................................................................................................................... 26
6 Segment Information ........................................................................................................................................ 28
7 Capital Management ........................................................................................................................................ 31
8 Principal Subsidiaries ....................................................................................................................................... 32
9 Business Combinations and Similar Transactions............................................................................................ 38
10 Investments in Associates and Joint Ventures ................................................................................................. 39
11 Investments in Structured Entities .................................................................................................................... 47
12 Revenue ........................................................................................................................................................... 49
13 Internally Produced and Capitalized Assets ..................................................................................................... 49
14 Other Operating Income ................................................................................................................................... 49
15 Result from Deconsolidation of Subsidiaries .................................................................................................... 49
16 Purchased Merchandise and Purchased Services ........................................................................................... 50
17 Employee Benefit Expenses ............................................................................................................................ 50
18 Other Operating Expenses ............................................................................................................................... 51
19 Share of Profit/Loss of Associates and Joint Ventures ..................................................................................... 51
20 Depreciation and Amortization ......................................................................................................................... 51
21 Financial Result ................................................................................................................................................ 52
22 Income Tax ...................................................................................................................................................... 52
23 Earnings per Share .......................................................................................................................................... 55
24 Property, Plant and Equipment ........................................................................................................................ 57
25 Intangible Assets .............................................................................................................................................. 58
26 Non-Current Financial Assets .......................................................................................................................... 60
27 Inventories ........................................................................................................................................................ 60
28 Trade Receivables ........................................................................................................................................... 60
29 Other Current Financial Assets ........................................................................................................................ 61
30 Non-Financial Assets ....................................................................................................................................... 62
31 Cash and Cash Equivalents / Consolidated Statement of Cash Flows ............................................................ 62
32 Assets Classified as Held for Sale and Liabilities Associated with Assets Classified as Held for Sale ............. 63
33 Subscribed Capital and Reserves .................................................................................................................... 64
34 Distributions Made and Proposed .................................................................................................................... 66
35 Non-Current Financial Liabilities....................................................................................................................... 66
36 Trade Payables ................................................................................................................................................ 67
37 Other Current Financial Liabilities .................................................................................................................... 67
38 Non-Financial Liabilities ................................................................................................................................... 67
39 Share-Based Compensation ............................................................................................................................ 68
40 Financial Risk Management ............................................................................................................................. 71
41 Financial Instruments ....................................................................................................................................... 74
42 Balances and Transactions with Related Parties ............................................................................................. 84
43 Contingent Liabilities and other Contractual Obligations .................................................................................. 87
44 Auditor’s Fees .................................................................................................................................................. 88
45 Events after the Reporting Period .................................................................................................................... 88
46 List of Group shareholdings pursuant to Sec. 313 (2) HGB ............................................................................. 89
47 Number of Employees pursuant to Sec. 314 (1) No. 4 HGB ............................................................................ 95
48 Declaration of compliance with German Corporate Governance Code ............................................................ 95
49 Authorization of the Financial Statements for Issue ......................................................................................... 96
Rocket Internet SE, Berlin
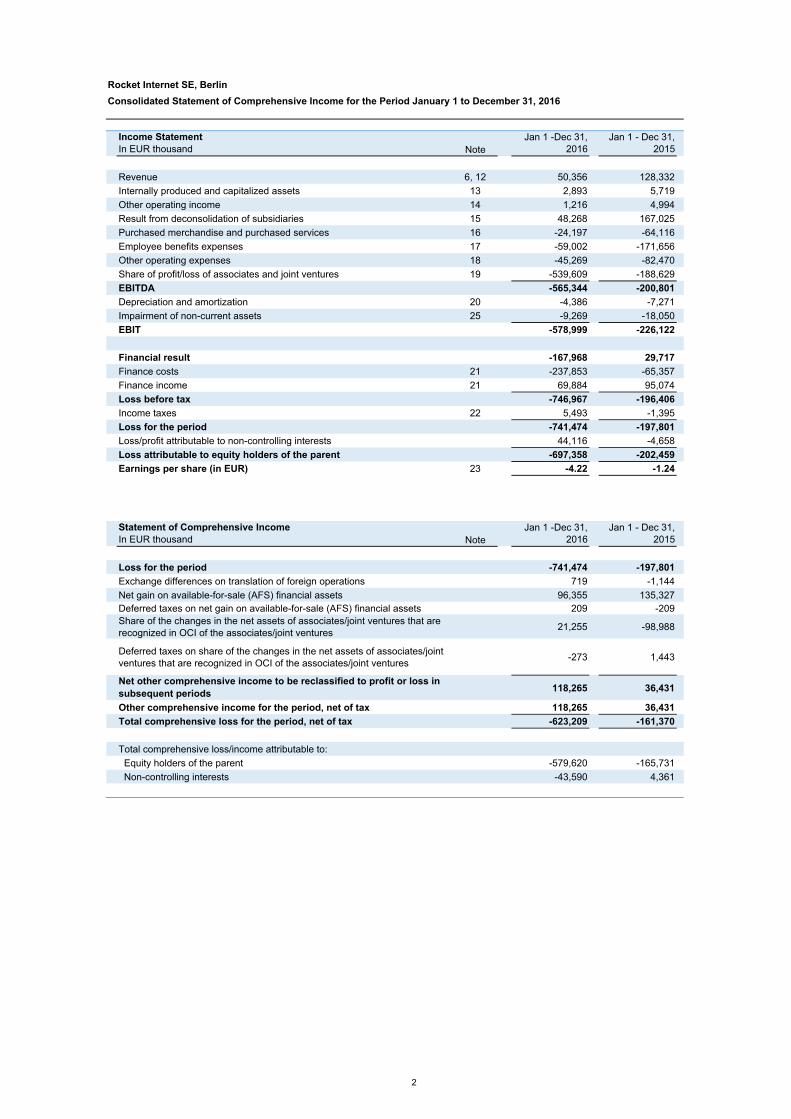
Consolidated Statement of Comprehensive Income for the Period January 1 to December 31, 2016
Income Statement
In EUR thousand Note
Jan 1 -Dec 31,
2016
Jan 1 - Dec 31,
2015
Revenue 6, 12 50,356 128,332
Internally produced and capitalized assets 13 2,893 5,719
Other operating income 14 1,216 4,994
Result from deconsolidation of subsidiaries 15 48,268 167,025
Purchased merchandise and purchased services 16 -24,197 -64,116
Employee benefits expenses 17 -59,002 -171,656
Other operating expenses 18 -45,269 -82,470
Share of profit/loss of associates and joint ventures 19 -539,609 -188,629
EBITDA -565,344 -200,801
Depreciation and amortization 20 -4,386 -7,271
Impairment of non-current assets 25 -9,269 -18,050
EBIT -578,999 -226,122
Financial result -167,968 29,717
Finance costs 21 -237,853 -65,357
Finance income 21 69,884 95,074
Loss before tax -746,967 -196,406
Income taxes 22 5,493 -1,395
Loss for the period -741,474 -197,801
Loss/profit attributable to non-controlling interests 44,116 -4,658
Loss attributable to equity holders of the parent -697,358 -202,459
Earnings per share (in EUR) 23 -4.22 -1.24
Statement of Comprehensive Income
In EUR thousand Note
Jan 1 -Dec 31,
2016
Jan 1 - Dec 31,
2015
Loss for the period -741,474 -197,801
Exchange differences on translation of foreign operations 719 -1,144
Net gain on available-for-sale (AFS) financial assets 96,355 135,327
Deferred taxes on net gain on available-for-sale (AFS) financial assets 209 -209
Share of the changes in the net assets of associates/joint ventures that are
recognized in OCI of the associates/joint ventures21,255 -98,988
Deferred taxes on share of the changes in the net assets of associates/joint
ventures that are recognized in OCI of the associates/joint ventures-273 1,443
Net other comprehensive income to be reclassified to profit or loss in
subsequent periods118,265 36,431
Other comprehensive income for the period, net of tax 118,265 36,431
Total comprehensive loss for the period, net of tax -623,209 -161,370
Total comprehensive loss/income attributable to:
Equity holders of the parent -579,620 -165,731
Non-controlling interests -43,590 4,361
2
Ro
cket
Inte
rnet
SE
, B
erl
in
Co
nso
lid
ate
d B
ala
nce S
heet
as o
f D
ecem
ber
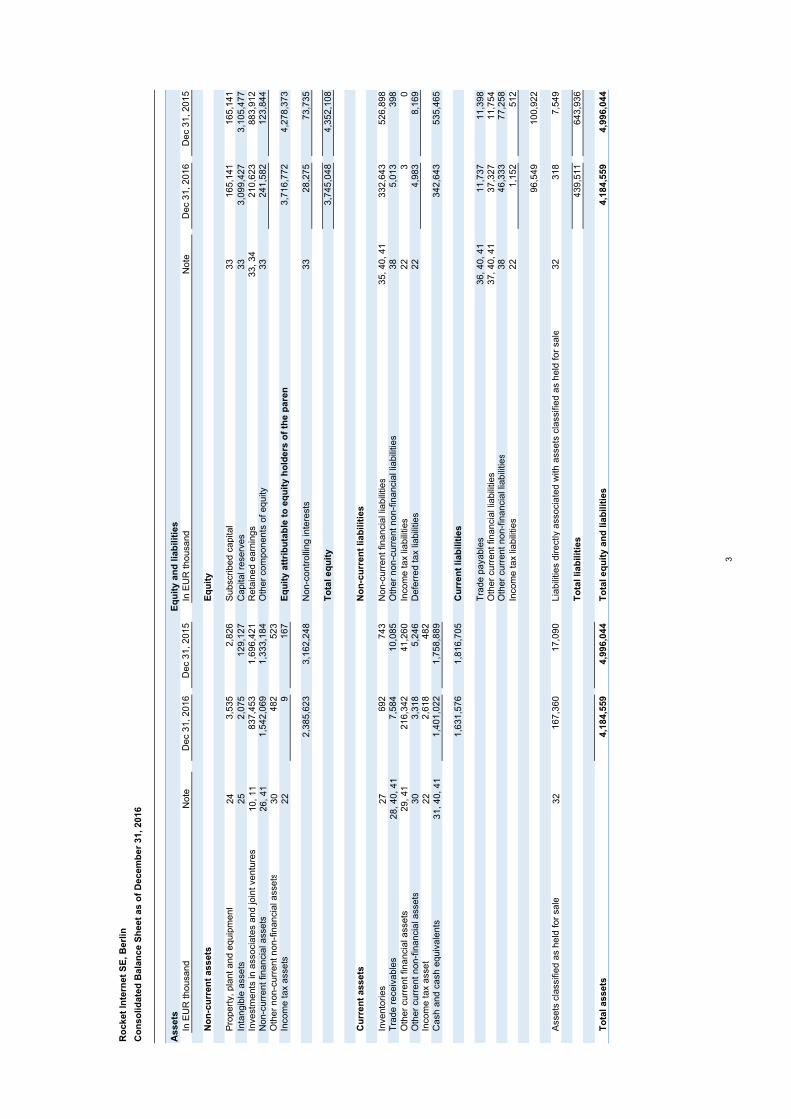
31, 2016
Assets
Eq
uit
y a
nd
lia
bilit
ies
In E
UR
thousand
Note
Dec 3
1, 2016
Dec 3
1, 2015
In E
UR
thousand
Note
Dec 3
1, 2016
Dec 3
1, 2015
No
n-c
urr
en
t assets
Eq
uit
y
Pro
pert
y, pla
nt and e
quip
ment
24
3,5
35
2,8
26
Subscribed c
apital
33
165,1
41
165,1
41
Inta
ngib
le a
ssets
25
2,0
75
129,1
27
Capital re
serv
es
33
3,0
99,4
27
3,1
05,4
77
Investm
ents
in a
ssocia
tes a
nd join
t ventu
res
10, 11
837,4
53
1,6
96,4
21
Reta
ined e
arn
ings
33, 34
210,6
23
883,9
12
Non-c
urr
ent financia
l assets
26, 41
1,5
42,0
69
1,3
33,1
84
Oth
er
com
ponents
of equity
33
241,5
82
123,8
44
Oth
er
non-c
urr
ent non-f
inancia
l assets
30
482
523
Incom
e tax a
ssets
22
9167
Eq
uit
y a
ttri
bu
tab
le t
o e
qu
ity h
old
ers
of
the p
are
nt
3,7
16,7
72
4,2
78,3
73
2,3
85,6
23
3,1
62,2
48
Non-c
ontr
olli
ng inte
rests
33
28,2
75
73,7
35
To
tal eq
uit
y
3,7
45,0
48
4,3
52,1
08
Cu
rren
t assets
No
n-c
urr
en
t liab
ilit
ies
Invento
ries
27
692
743
Non-c
urr
ent financia
l lia
bili
ties
35, 40, 41
332,6
43
526,8
98
Tra
de r
eceiv
able
s28, 40, 41
7,5
84
10,0
85
Oth
er
non-c
urr
ent non-f
inancia
l lia
bili
ties
38
5,0
13
398
Oth
er
curr
ent financia
l assets
29, 41
216,3
42
41,2
60
Incom
e tax lia
bili
ties
22
30
Oth
er
curr
ent non-f
inancia
l assets
30
3,3
18
5,2
46
Defe
rred tax lia
bili
ties
22
4,9
83
8,1
69
Incom
e tax a
sset
22
2,6
18
482
Cash a
nd c
ash e
quiv
ale
nts
31, 40, 41
1,4
01,0
22
1,7
58,8
89
342,6
43
535,4
65
1,6
31,5
76
1,8
16,7
05
Cu
rren
t liab
ilit
ies
Tra
de p
ayable
s
36, 40, 41
11,7
37
11,3
98
Oth
er
curr
ent financia
l lia
bili
ties
37, 40, 41
37,3
27
11,7
54
Oth
er
curr
ent non-f
inancia
l lia
bili
ties
38
46,3
33
77,2
58
Incom
e tax lia
bili
ties
22
1,1
52
512
96,5
49
100,9
22
Assets
cla
ssifie
d a
s h
eld
for
sale
32
167,3
60
17,0
90
Lia
bili
ties d
irectly a
ssocia
ted w
ith a
ssets
cla
ssifie
d a
s h
eld
for
sale
32
318
7,5
49
To
tal liab
ilit
ies
439,5
11
643,9
36
To
tal assets
4,1
84,5
59
4,9
96,0
44
To
tal eq
uit
y a
nd
lia
bilit
ies
4,1
84,5
59
4,9
96,0
44
3
Ro
cket
Inte
rnet
SE
, B
erl
in
Co
nso
lid
ate
d S
tate
men
t o
f C
han
ges in
Eq
uit
y f
or
the P
eri
od
Jan
uary
1 t
o D
ecem
ber
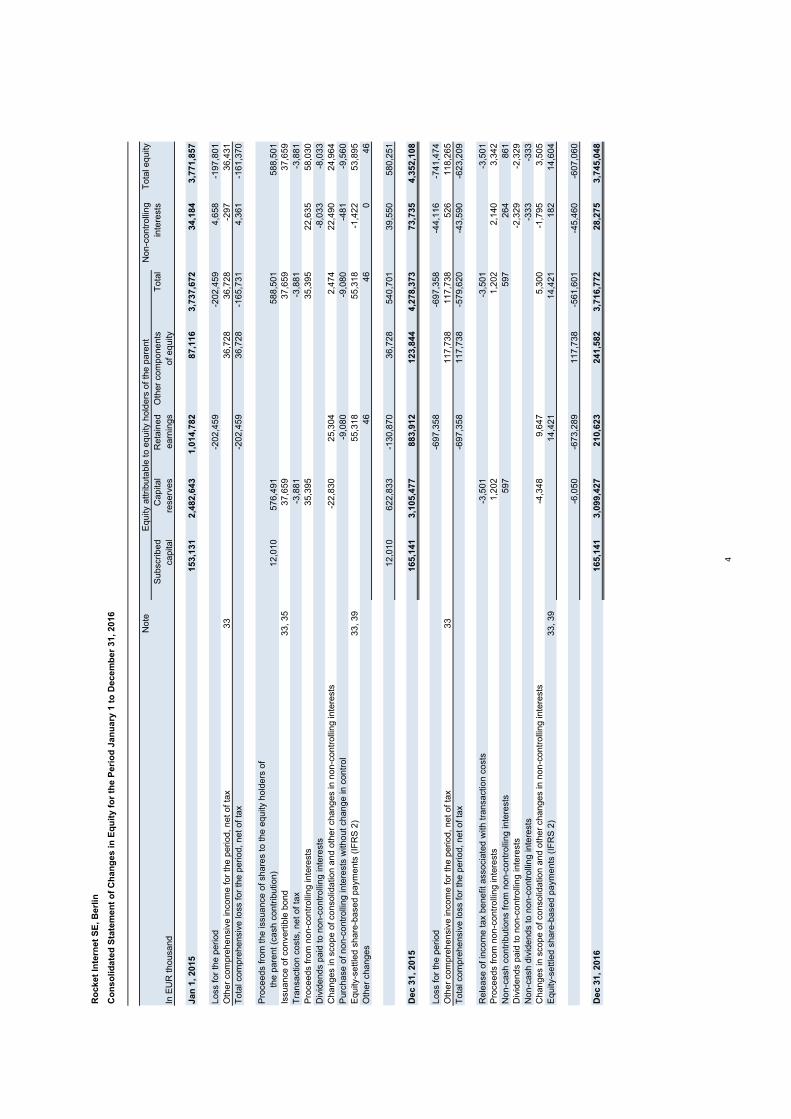
31, 2016
Non-c
ontr
olli
ng
Tota
l equity
Subscribed
Capital
Reta
ined
Oth
er
com
ponents
Tota
lin
tere
sts
In E
UR
thousand
capital
reserv
es
earn
ings
of equity
Jan
1, 2015
153,1
31
2,4
82,6
43
1,0
14,7
82
87,1
16
3,7
37,6
72
34,1
84
3,7
71,8
57
Loss for
the p
eriod
-202,4
59
-202,4
59
4,6
58
-197,8
01
Oth
er
com
pre
hensiv
e incom
e for
the p
eriod, net of ta
x33
36,7
28
36,7
28
-297
36,4
31
Tota
l com
pre
hensiv
e loss for
the p
eriod, net of ta
x-2
02,4
59
36,7
28
-165,7
31
4,3
61
-161,3
70
Pro
ceeds fro
m the issuance o
f share
s to the e
quity h
old
ers
of
the p
are
nt (c
ash c
ontr
ibution)
12,0
10
576,4
91
588,5
01
588,5
01
Issuance o
f convert
ible
bond
33, 35
37,6
59
37,6
59
37,6
59
Tra
nsaction c
osts
, net of ta
x-3
,881
-3,8
81
-3,8
81
Pro
ceeds fro
m n
on-c
ontr
olli
ng inte
rests
35,3
95
35,3
95
22,6
35
58,0
30
Div
idends p
aid
to n
on-c
ontr
olli
ng inte
rests
-8,0
33
-8,0
33
Changes in s
cope o
f consolid
ation a
nd o
ther
changes in n
on-c
ontr
olli
ng inte
rests
-22,8
30
25,3
04
2,4
74
22,4
90
24,9
64
Purc
hase o
f non-c
ontr
olli
ng inte
rests
without change in c
ontr
ol
-9,0
80
-9,0
80
-481
-9,5
60
Equity-s
ettle
d s
hare
-based p
aym
ents
(IF
RS
2)
33, 39
55,3
18
55,3
18
-1,4
22
53,8
95
Oth
er
changes
46
46
046
12,0
10
622,8
33
-130,8
70
36,7
28
540,7
01
39,5
50
580,2
51
Dec 3
1, 2015
165,1
41
3,1
05,4
77
883,9
12
123,8
44
4,2
78,3
73
73,7
35
4,3
52,1
08
Loss for
the p
eriod
-697,3
58
-697,3
58
-44,1
16
-741,4
74
Oth
er
com
pre
hensiv
e incom
e for
the p
eriod, net of ta
x33
117,7
38
117,7
38
526
118,2
65
Tota
l com
pre
hensiv
e loss for
the p
eriod, net of ta
x-6
97,3
58
117,7
38
-579,6
20
-43,5
90
-623,2
09
Rele
ase o
f in
com
e tax b
enefit associa
ted w
ith tra
nsaction c
osts
-3,5
01
-3,5
01
-3,5
01
Pro
ceeds fro
m n
on-c
ontr
olli
ng inte
rests
1,2
02
1,2
02
2,1
40
3,3
42
Non-c
ash c
ontr
ibutions fro
m n
on-c
ontr
olli
ng inte
rests
597
597
264
861
Div
idends p
aid
to n
on-c
ontr
olli
ng inte
rests
-2,3
29
-2,3
29
Non-c
ash d
ivid
ends to n
on-c
ontr
olli
ng inte
rests
-333
-333
Changes in s
cope o
f consolid
ation a
nd o
ther
changes in n
on-c
ontr
olli
ng inte
rests
-4,3
48
9,6
47
5,3
00
-1,7
95
3,5
05
Equity-s
ettle
d s
hare
-based p
aym
ents
(IF
RS
2)
33, 39
14,4
21
14,4
21
182
14,6
04
-6,0
50
-673,2
89
117,7
38
-561,6
01
-45,4
60
-607,0
60
Dec 3
1, 2016
165,1
41
3,0
99,4
27
210,6
23
241,5
82
3,7
16,7
72
28,2
75
3,7
45,0
48
Note
Equity a
ttributa
ble
to e
quity h
old
ers
of th
e p
are
nt
4
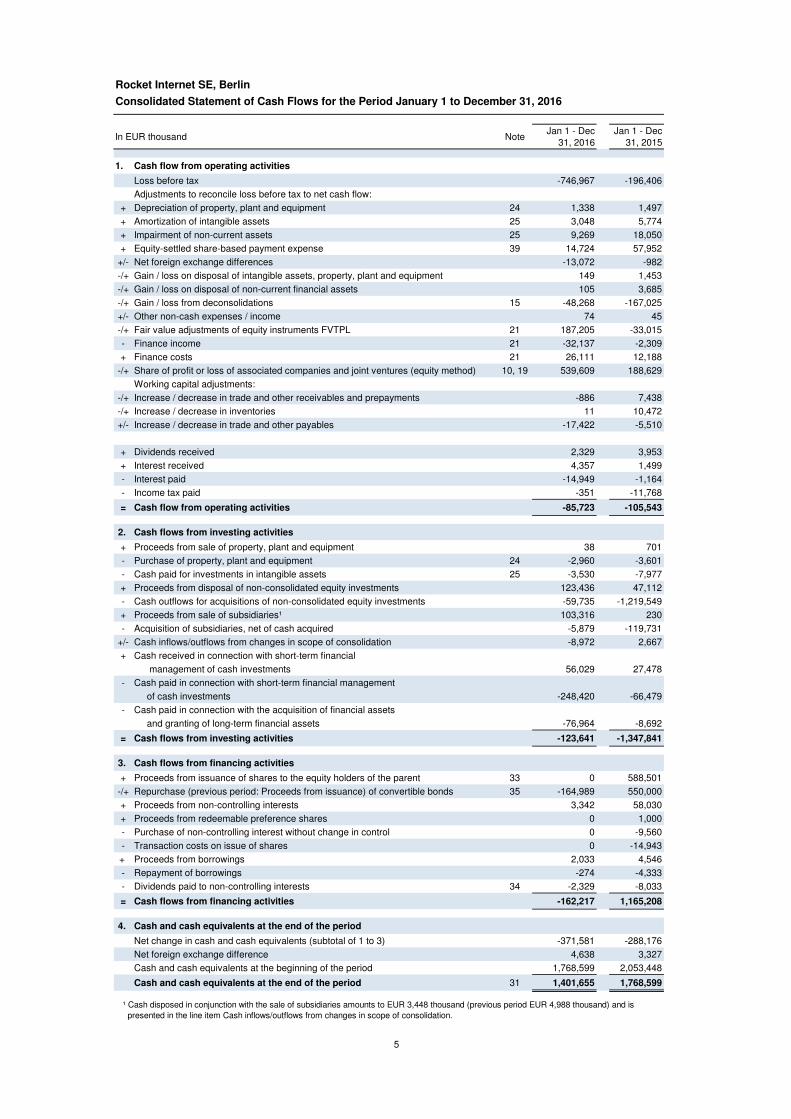
Rocket Internet SE, Berlin
Consolidated Statement of Cash Flows for the Period January 1 to December 31, 2016
In EUR thousand NoteJan 1 - Dec
31, 2016
Jan 1 - Dec
31, 2015
1. Cash flow from operating activities
Loss before tax -746,967 -196,406
Adjustments to reconcile loss before tax to net cash flow:
+ Depreciation of property, plant and equipment 24 1,338 1,497
+ Amortization of intangible assets 25 3,048 5,774
+ Impairment of non-current assets 25 9,269 18,050
+ Equity-settled share-based payment expense 39 14,724 57,952
+/- Net foreign exchange differences -13,072 -982
-/+ Gain / loss on disposal of intangible assets, property, plant and equipment 149 1,453
-/+ Gain / loss on disposal of non-current financial assets 105 3,685
-/+ Gain / loss from deconsolidations 15 -48,268 -167,025
+/- Other non-cash expenses / income 74 45
-/+ Fair value adjustments of equity instruments FVTPL 21 187,205 -33,015
- Finance income 21 -32,137 -2,309
+ Finance costs 21 26,111 12,188
-/+ Share of profit or loss of associated companies and joint ventures (equity method) 10, 19 539,609 188,629
Working capital adjustments:
-/+ Increase / decrease in trade and other receivables and prepayments -886 7,438
-/+ Increase / decrease in inventories 11 10,472
+/- Increase / decrease in trade and other payables -17,422 -5,510
+ Dividends received 2,329 3,953
+ Interest received 4,357 1,499
- Interest paid -14,949 -1,164
- Income tax paid -351 -11,768
= Cash flow from operating activities -85,723 -105,543
2. Cash flows from investing activities
+ Proceeds from sale of property, plant and equipment 38 701
- Purchase of property, plant and equipment 24 -2,960 -3,601
- Cash paid for investments in intangible assets 25 -3,530 -7,977
+ Proceeds from disposal of non-consolidated equity investments 123,436 47,112
- Cash outflows for acquisitions of non-consolidated equity investments -59,735 -1,219,549
+ Proceeds from sale of subsidiaries¹ 103,316 230
- Acquisition of subsidiaries, net of cash acquired -5,879 -119,731
+/- Cash inflows/outflows from changes in scope of consolidation -8,972 2,667
+ Cash received in connection with short-term financial
management of cash investments 56,029 27,478
- Cash paid in connection with short-term financial management
of cash investments -248,420 -66,479
- Cash paid in connection with the acquisition of financial assets
and granting of long-term financial assets -76,964 -8,692
= Cash flows from investing activities -123,641 -1,347,841
3. Cash flows from financing activities
+ Proceeds from issuance of shares to the equity holders of the parent 33 0 588,501
-/+ Repurchase (previous period: Proceeds from issuance) of convertible bonds 35 -164,989 550,000
+ Proceeds from non-controlling interests 3,342 58,030
+ Proceeds from redeemable preference shares 0 1,000
- Purchase of non-controlling interest without change in control 0 -9,560
- Transaction costs on issue of shares 0 -14,943
+ Proceeds from borrowings 2,033 4,546
- Repayment of borrowings -274 -4,333
- Dividends paid to non-controlling interests 34 -2,329 -8,033
= Cash flows from financing activities -162,217 1,165,208
4. Cash and cash equivalents at the end of the period
Net change in cash and cash equivalents (subtotal of 1 to 3) -371,581 -288,176
Net foreign exchange difference 4,638 3,327
Cash and cash equivalents at the beginning of the period 1,768,599 2,053,448
Cash and cash equivalents at the end of the period 31 1,401,655 1,768,599
¹ Cash disposed in conjunction with the sale of subsidiaries amounts to EUR 3,448 thousand (previous period EUR 4,988 thousand) and is
presented in the line item Cash inflows/outflows from changes in scope of consolidation.
5
Rocket Internet SE
Notes to the Consolidated Financial Statements 2016 (IFRS)
6
1 Corporate and Group Information
General Information
Rocket Internet SE, hereinafter also referred to as “Rocket Internet“, the “Company“ or “parent Company“, is registered in the commercial register Charlottenburg of the district court in Berlin (Registration No.: HRB 165662). Rocket Internet SE registered office is at Charlottenstraße 4, 10969 Berlin, Germany.
Rocket Internet SE is the ultimate parent company of directly and indirectly held subsidiaries and holds directly or indirectly interests in associates and joint ventures, hereinafter together also referred to as the “Rocket Internet Group“ or the “Group“. Since September 26, 2016, the shares of Rocket Internet SE are admitted to trading in the Prime Standard (the regulated market segment with additional post-admission obligations) of the Frankfurt Stock Exchange. Until September 26, 2016, the shares of the Company were included in the non-regulated Entry Standard of the Frankfurt Stock Exchange. The admission to the non-regulated Entry Standard did not represent a stock listing pursuant to Sec. 3 (2) AktG.
Subsidiaries, associated companies, joint ventures as well as the other companies in which the Group holds equity interests not providing control, significant influence or joint control herein are summarized as “network companies”.
Business Activities
Rocket Internet incubates and invests in Internet companies with proven business models. On both incubation and investment, we currently focus on four industry sectors of online and mobile retail and services that make up a significant share of consumer spending: Food & Groceries, Fashion, General Merchandise and Home & Living. A detailed description of the nature of the Group’s operations and its principal activities are disclosed in section 1.1 Business Model of the Combined Management Report.
Information about the Consolidated Group
Rocket Internet has a large number of network companies in countries that are particularly relevant for online and mobile business.
While Rocket Internet as well as some service center subsidiaries focus on providing services along the different functional areas of an Internet business, the operational business is carried out exclusively by Rocket Internet’s subsidiaries, associated companies and joint ventures under the umbrella of specifically created consumer brands.
In its role as group holding, Rocket Internet fulfils central functions including operational investment management, group controlling, accounting and group financial reporting, press and investor relations, risk management and internal audit as well as human resources.
Rocket Internet typically owns directly or indirectly ca. 80% of its companies1 at the time of launch, with the remainder set aside for equity participations of the management of the respective network company. In subsequent financing rounds, the companies attract the equity financing necessary to expand their business from Rocket Internet and other external investors. The external equity financing is provided by strategic partners and other strategic and financial investors, including existing Rocket Internet shareholders. These investments are either made directly into the company or indirectly into an intermediate holding company or a Regional Internet Group (Jumia Group (Africa Internet Holding GmbH), Asia Internet Holding S.à r.l. or Middle East Internet Holding S.à r.l.). In practice, this has meant that the direct and indirect stakes of Rocket Internet in a company have diluted over time to less than 50%. Furthermore, for several companies in which Rocket Internet holds a participation of more than 50%, shareholder agreements exist that lead to ongoing restrictions of Rocket Internet’s control over those network companies. As of December 31, 2016 Rocket Internet does not consolidate most of its significant network companies but accounts for them using the equity method. The most 1 All participation quotas for the network companies shown in the financial statements are based on the Group’s ownership
calculated pursuant to the respective accounting rules (e.g. reflecting the transaction closing dates, dates of change in control, considering trust shares allocated to the Group, excluding stakes indirectly held via RICP etc.) and may therefore differ from the respective information (beneficial interest including RICP) published on the Company’s website which is based on the signing dates.
Rocket Internet SE
Notes to the Consolidated Financial Statements 2016 (IFRS)
7
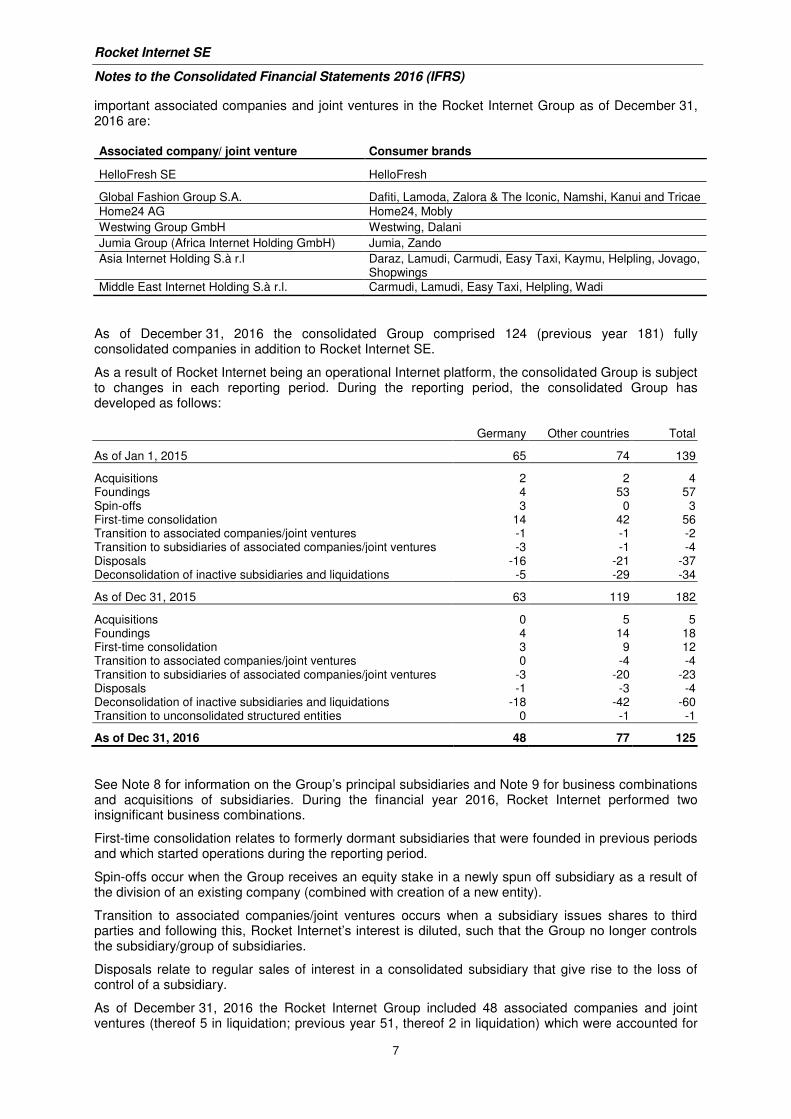
important associated companies and joint ventures in the Rocket Internet Group as of December 31, 2016 are:
Associated company/ joint venture Consumer brands
HelloFresh SE HelloFresh
Global Fashion Group S.A. Dafiti, Lamoda, Zalora & The Iconic, Namshi, Kanui and Tricae
Home24 AG Home24, Mobly
Westwing Group GmbH Westwing, Dalani
Jumia Group (Africa Internet Holding GmbH) Jumia, Zando
Asia Internet Holding S.à r.l Daraz, Lamudi, Carmudi, Easy Taxi, Kaymu, Helpling, Jovago, Shopwings
Middle East Internet Holding S.à r.l. Carmudi, Lamudi, Easy Taxi, Helpling, Wadi
As of December 31, 2016 the consolidated Group comprised 124 (previous year 181) fully consolidated companies in addition to Rocket Internet SE.
As a result of Rocket Internet being an operational Internet platform, the consolidated Group is subject to changes in each reporting period. During the reporting period, the consolidated Group has developed as follows:
Germany Other countries Total
As of Jan 1, 2015 65 74 139
Acquisitions 2 2 4 Foundings 4 53 57 Spin-offs 3 0 3 First-time consolidation 14 42 56 Transition to associated companies/joint ventures -1 -1 -2 Transition to subsidiaries of associated companies/joint ventures -3 -1 -4 Disposals -16 -21 -37 Deconsolidation of inactive subsidiaries and liquidations -5 -29 -34
As of Dec 31, 2015 63 119 182
Acquisitions 0 5 5 Foundings 4 14 18 First-time consolidation 3 9 12 Transition to associated companies/joint ventures 0 -4 -4 Transition to subsidiaries of associated companies/joint ventures -3 -20 -23 Disposals -1 -3 -4 Deconsolidation of inactive subsidiaries and liquidations -18 -42 -60 Transition to unconsolidated structured entities 0 -1 -1
As of Dec 31, 2016 48 77 125
See Note 8 for information on the Group’s principal subsidiaries and Note 9 for business combinations and acquisitions of subsidiaries. During the financial year 2016, Rocket Internet performed two insignificant business combinations.
First-time consolidation relates to formerly dormant subsidiaries that were founded in previous periods and which started operations during the reporting period.
Spin-offs occur when the Group receives an equity stake in a newly spun off subsidiary as a result of the division of an existing company (combined with creation of a new entity).
Transition to associated companies/joint ventures occurs when a subsidiary issues shares to third parties and following this, Rocket Internet’s interest is diluted, such that the Group no longer controls the subsidiary/group of subsidiaries.
Disposals relate to regular sales of interest in a consolidated subsidiary that give rise to the loss of control of a subsidiary.
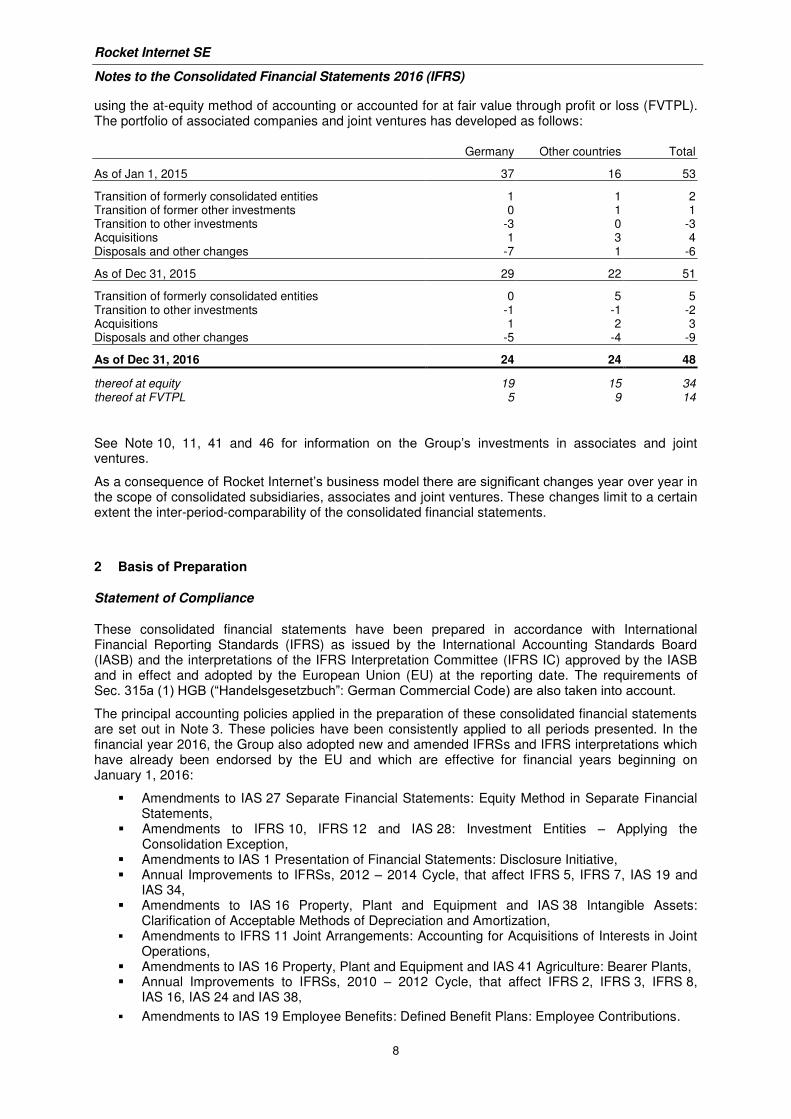
As of December 31, 2016 the Rocket Internet Group included 48 associated companies and joint ventures (thereof 5 in liquidation; previous year 51, thereof 2 in liquidation) which were accounted for
Rocket Internet SE
Notes to the Consolidated Financial Statements 2016 (IFRS)
8
using the at-equity method of accounting or accounted for at fair value through profit or loss (FVTPL). The portfolio of associated companies and joint ventures has developed as follows:
Germany Other countries Total
As of Jan 1, 2015 37 16 53
Transition of formerly consolidated entities 1 1 2 Transition of former other investments 0 1 1 Transition to other investments -3 0 -3 Acquisitions 1 3 4 Disposals and other changes -7 1 -6
As of Dec 31, 2015 29 22 51
Transition of formerly consolidated entities 0 5 5 Transition to other investments -1 -1 -2 Acquisitions 1 2 3 Disposals and other changes -5 -4 -9
As of Dec 31, 2016 24 24 48
thereof at equity 19 15 34 thereof at FVTPL 5 9 14
See Note 10, 11, 41 and 46 for information on the Group’s investments in associates and joint ventures.
As a consequence of Rocket Internet’s business model there are significant changes year over year in the scope of consolidated subsidiaries, associates and joint ventures. These changes limit to a certain extent the inter-period-comparability of the consolidated financial statements.
2 Basis of Preparation
Statement of Compliance
These consolidated financial statements have been prepared in accordance with International Financial Reporting Standards (IFRS) as issued by the International Accounting Standards Board (IASB) and the interpretations of the IFRS Interpretation Committee (IFRS IC) approved by the IASB and in effect and adopted by the European Union (EU) at the reporting date. The requirements of Sec. 315a (1) HGB (“Handelsgesetzbuch”: German Commercial Code) are also taken into account.
The principal accounting policies applied in the preparation of these consolidated financial statements are set out in Note 3. These policies have been consistently applied to all periods presented. In the financial year 2016, the Group also adopted new and amended IFRSs and IFRS interpretations which have already been endorsed by the EU and which are effective for financial years beginning on January 1, 2016:
Amendments to IAS 27 Separate Financial Statements: Equity Method in Separate Financial Statements,
Amendments to IFRS 10, IFRS 12 and IAS 28: Investment Entities – Applying the Consolidation Exception,
Amendments to IAS 1 Presentation of Financial Statements: Disclosure Initiative, Annual Improvements to IFRSs, 2012 – 2014 Cycle, that affect IFRS 5, IFRS 7, IAS 19 and
IAS 34, Amendments to IAS 16 Property, Plant and Equipment and IAS 38 Intangible Assets:
Clarification of Acceptable Methods of Depreciation and Amortization, Amendments to IFRS 11 Joint Arrangements: Accounting for Acquisitions of Interests in Joint
Operations, Amendments to IAS 16 Property, Plant and Equipment and IAS 41 Agriculture: Bearer Plants, Annual Improvements to IFRSs, 2010 – 2012 Cycle, that affect IFRS 2, IFRS 3, IFRS 8,
IAS 16, IAS 24 and IAS 38,
Amendments to IAS 19 Employee Benefits: Defined Benefit Plans: Employee Contributions.
Rocket Internet SE
Notes to the Consolidated Financial Statements 2016 (IFRS)
9
These amendments did not have any significant effect on the Group’s consolidated financial statements.
Standards issued but not yet effective up to the date of issuance of the Group’s financial statements are set out in Note 5.
General Information
The consolidated financial statements have been prepared on a historical cost basis, except for investments in available-for-sale financial assets, financial assets and associates under fair value option, derivative financial instruments, liabilities for cash-settled share-based payments, contingent considerations of an acquirer in a business combination and contingent contractual payment obligations that have been measured at fair value.
The profit or loss statement is prepared using the nature of expense method.
Assets and liabilities are presented using the current and non-current classification.
In the Statement of Cash Flows the cash flow from operating activities is derived using the indirect method, whereas the cash flows from investing and financing activities are determined using the direct method.
The consolidated financial statements provide comparative information in respect of the previous period.
The consolidated statements are presented in Euro (EUR). Unless otherwise indicated, all values are rounded up or down to the nearest thousand in accordance with a commercial rounding approach, which may result in rounding differences and percentage figures presented may not exactly reflect the absolute figures they relate to.
The Company’s financial year is the calendar year.
3 Summary of Significant Accounting Policies
Basis of Consolidation
The consolidated financial statements comprise the financial statements of the Company and its directly or indirectly controlled network companies (subsidiaries) as of December 31, 2016.
Specifically, the Group controls a network company if and only if the Group has:
Power over the network company (i.e. existing rights that give the Group the current ability to direct the relevant activities of the network company),
Exposure, or rights, to variable returns from its involvement with the network company, and The ability to use its power over the network company to affect its returns.
When the Group has less than the majority of the voting or similar rights of a network company, the Group considers all relevant facts and circumstances in assessing whether it has power over a network company, including:
Contractual agreements with the other shareholders with voting rights of the network company, Rights arising from other contractual agreements, and The Group's voting rights and potential voting rights.
The Group re-assesses whether or not it controls a network company if facts and circumstances indicate that there are changes to one or more of the three criteria of control. Consolidation of a subsidiary begins when the Group obtains control over the subsidiary and ceases when the Group loses control of the subsidiary. Assets, liabilities, income and expenses of a subsidiary acquired or disposed of during the year are included in the consolidated balance sheet and the statement of comprehensive income from the date the Group gains control until the date the Group ceases to control the subsidiary.
Rocket Internet SE
Notes to the Consolidated Financial Statements 2016 (IFRS)
10
Profit or loss and each component of other comprehensive income (OCI) are attributed to the equity holders of the parent Company and to non-controlling interests, even if this results in the non-controlling interests having a deficit balance. When necessary, adjustments are made to the financial statements of subsidiaries to bring their accounting policies in line with the Group's accounting policies. All intra-group assets and liabilities, equity, income, expenses and cash flows relating to transactions between members of the Group are eliminated fully on consolidation.
A change in the ownership interest of a subsidiary, without a loss of control, is accounted for as an equity transaction.
If the Group loses control over a subsidiary, the following steps apply:
Derecognition of the assets (including goodwill) and liabilities of the subsidiary, Derecognition of the carrying amount of any non-controlling interests, Recognition of the fair value of the consideration received, Recognition of the fair value of any investment retained, Reclassification of the parent's share of components previously recognized in OCI to profit or
loss or retained earnings, as appropriate, as would be required if the Group had directly disposed of the related assets or liabilities and
Recognition of any resulting difference as a gain or loss in profit or loss.
The financial statements of the subsidiaries are prepared for the same reporting period as the parent Company.
Business combinations
The acquisition method of accounting is used to account for the acquisition of subsidiaries. Identifiable assets acquired and liabilities and contingent liabilities assumed in a business combination are measured at their fair value at the acquisition date, irrespective of the extent of any non-controlling interest.
The Group measures non-controlling interest that represents present ownership interest and entitles the holder to a proportionate share of net assets in the event of liquidation on a transaction by transaction basis, either at (a) fair value or (b) the non-controlling interest's proportionate share of net assets of the acquiree. Non-controlling interests that are not present ownership interests are measured at fair value.
Goodwill is measured by deducting the net assets of the acquiree from the aggregate of the consideration transferred for the acquiree, the amount of non-controlling interest in the acquiree and fair value of an interest in the acquiree held immediately before the acquisition date. Any negative amount (negative goodwill, bargain purchase) is recognized in profit or loss, after management re-assesses whether it identified all the assets acquired and all liabilities and contingent liabilities assumed and reviews appropriateness of their measurement.
The cost of acquisition for the acquiree is measured at the fair value of the consideration transferred, equity instruments issued and liabilities incurred to former owners, including fair value of assets or liabilities from contingent consideration arrangements but excludes acquisition-related costs such as legal, advisory, valuation and similar professional services. Transaction costs related to the acquisition and incurred for issuing equity instruments are deducted from equity. Transaction costs incurred for issuing debt as part of the business combination are deducted from the carrying amount of the debt. All other transaction costs associated with the acquisition are expensed.
Investment in associates and joint ventures
An associate is an entity over which the Group has significant influence. Significant influence is the power to participate in the financial and operating policy decisions of the network company, but is not control or joint control over those policies.
A joint venture is a type of joint arrangement whereby the parties that have joint control of the arrangement have rights to the net assets of the joint venture. Joint control is the contractually agreed sharing of control of an arrangement, which exists only when decisions about the relevant activities require unanimous consent of the parties sharing control. The considerations made in determining joint control are similar to those necessary to determine control over subsidiaries.
Rocket Internet SE
Notes to the Consolidated Financial Statements 2016 (IFRS)
11
The Group’s investments in its associates and joint ventures are accounted for
a) using the equity method or
b) at fair value through profit or loss (FVTPL).
Investment in associates and joint ventures – Equity method
The equity method is applied for network companies with operations that are incubated or actively developed by Rocket Internet. The network companies are often former subsidiaries of the Group, where Rocket Internet has the power to participate in the financial and operating policy decisions. In such network companies Rocket Internet is mostly intensely involved in the strategic leadership and implementation of the business plans.
An investment is accounted for using the equity method from the date it becomes an associate or joint venture. Under the equity method, the investment in an associate or joint venture is initially recognized at cost (including transaction costs and the initial fair value of any contingent consideration agreement). The concepts underlying the procedures used in accounting for the acquisition of a subsidiary are also adopted for the acquisition of an associate and joint venture (including situations where the equity method is to be applied following a loss of control). Goodwill relating to the associate or joint venture is included in the carrying amount of the investment and is not tested for impairment individually.
In case the Group acquires additional interests in an associate or joint venture and the equity method is still applied (step acquisitions) the additional interest is initially recognized at cost (including transaction costs and the initial fair value of any contingent consideration agreement). The concepts underlying the procedures used in accounting for the acquisition of a subsidiary are also adopted for the acquisition of additional interests in an associate or joint venture. The carrying amount of the investment is adjusted to recognize changes in the Group’s share of net assets of the associate or joint venture since the acquisition date.
The statement of comprehensive income reflects the Group’s share of the net income of the associate or joint venture. Any change in OCI of those investees is presented as part of the Group’s OCI. In addition, when there has been a change recognized directly in the equity of the associate or the joint venture, the Group recognizes its share of any changes, when applicable, in the statement of changes in equity. Unrealized gains and losses resulting from transactions between the Group and the associate or joint venture are eliminated to the extent of the interest in the associate.
The proportionate share of expenses resulting from equity-settled share-based payments of associates and joint ventures are offset by the corresponding increase in equity of associates and joint ventures. Therefore the equity-settled share-based payments at the level of associates and joint ventures do not have an impact on both, the subsequent measurement of associates and joint ventures in the Group’s balance sheet as well as on the share of profit/loss of associates and joint ventures recognized in the statement of comprehensive income.
Rocket Internet accounts for a dilution of its investment caused by a share issuance by an equity method investee to a third party as if the Group had sold a proportionate share of its investment (deemed disposal). Besides deemed disposals, the share of profit or loss of associates and joint ventures also includes gains or losses from regular disposals of Rocket Internet’s direct or indirect interests in associated companies and joint ventures.
The aggregate of the Group’s share of profit or loss of an associate or joint venture is shown on the statement of profit or loss within operating profit and represents profit or loss after tax and non-controlling interests in the subsidiaries of the associate or joint venture including adjustments made by the Group under the equity method, such as adjustments to the fair value that occurred at the time of acquisition or for adjustments to group-wide accounting policies.
The financial statements of the associate or joint venture are prepared for the same reporting period as the Group. When necessary, adjustments are made to bring the accounting policies in line with those of the Group.
After application of the equity method, the Group determines whether it is necessary to recognize an impairment loss on its investment in its associate or joint venture. At each reporting date, the Group determines whether there is objective evidence that the investment in the associate or joint venture is impaired. If there is such evidence, the Group calculates the amount of impairment as the difference between the recoverable amount of the associate or joint venture and its carrying value, and then
Rocket Internet SE
Notes to the Consolidated Financial Statements 2016 (IFRS)
12
recognizes the loss as ‘Share of profit/loss of associates and joint ventures’ in the statement of profit or loss.
Upon loss of significant influence over the associate or joint control over the joint venture, the Group measures and recognizes any retained investment at its fair value. Any difference between the carrying amount of the associate upon loss of significant influence or joint venture upon loss of joint control and the fair value of the retained investment and proceeds from disposal is recognized in profit or loss.
The shareholders’ agreements for associates and joint ventures to which Rocket Internet is a party are important instruments for steering the economic interests among the various investors in these entities and are designed to protect shareholders and to facilitate corporate and transaction issues. In the event of a network company’s IPO the shareholders’ agreements shall, as from the commencement of trading of the network company’s shares on a stock exchange, cease to have effect. The shareholders’ agreements include certain waterfall provisions, which stipulate the order for distributing proceeds from a transfer of shares that result in, or is deemed to be, a change of control or in case of liquidation to the shareholders (“liquidation preferences”). Typically, if triggered, the liquidation preference entitles investors who invested in later financing rounds, which generally means at a higher valuation, to recoup their investment before other shareholders are paid out. Investors who invested in the early stage of a company are usually paid out last. As Rocket Internet is typically among the first investors in a network company, Rocket Internet will generally be able to recoup its investments if the transfer or liquidation proceeds equal or exceed the sum of the investments made by all investors in the company. Any remainder over the sum of the investments of all investors is shared among all shareholders of the company pro rata to their shareholdings or – in the case of a share transfer – to the shares transferred by them. Any amount received by an investor prior to the pro rata allocation is typically deducted from such investor’s stake in the pro rata allocation. When valuing the shares in associates and joint ventures, the Group carefully assesses the accounting implications of the regulations in the shareholders’ agreements. The valuations consider the preferential rights the owned shares have in case of liquidation or sale of the entire network company.
Investment in associates and joint ventures – At fair value through profit or loss (FVTPL)
This method is applied for investees where Rocket Internet is acting as an investor within the meaning of IAS 28.18. Please, refer to the accounting policies for financial assets at fair value through profit or loss (FVTPL).
Investment in structured entities
Structured entities are entities where voting or similar rights are not the dominant factor in determining control, such as when the voting rights relate to administrative tasks only and the relevant activities are directed by means of contractual arrangements.
As for other entities, Rocket Internet has to examine whether it exerts control, significant influence or joint control over the structured entity. Correspondingly, the structured entity is consolidated as subsidiary or accounted as associate or joint venture.
When assessing whether to consolidate or not consolidate a structured entity, the Group evaluates a range of control factors, namely:
‒ the purpose and design of the entity,
‒ the relevant activities and how these are managed,
‒ whether the Group’s rights result in the ability to direct the relevant activities,
‒ whether the Group has exposure or rights to variable returns,
‒ whether the Group has the ability to use its power to affect the amount of its returns, as well as
‒ whether an investor that has power over an investee, the decision-maker, is acting as a principal or an agent, including (i) scope of decision-making authority, (ii) rights held by other parties, (iii) remuneration to which the decision-maker is entitled and (iv) exposure to variability of returns.
Unconsolidated structured entities are entities, which are not consolidated because the Group does not control them through voting rights, contracts, funding agreements, or other means. Unconsolidated structured entities under significant influence of the Group are accounted for using the equity method.
Rocket Internet SE
Notes to the Consolidated Financial Statements 2016 (IFRS)
13
Revenue recognition
The Group generates revenues primarily from the sale of goods (online and mobile trade / eCommerce), from rendering intermediation services (specialized online and mobile transaction platforms for goods and services / marketplaces) and from rendering other services including consulting services provided for network companies and other customers.
Revenue is recognized to the extent that it is probable that the economic benefits will flow to the Group and the revenue can be reliably measured, regardless of when the payment is being made. Revenue is measured at the fair value of the consideration received or receivable, taking into account contractually defined terms of payment and excluding taxes or duty.
Revenue from the sale of goods is recognized when the significant risks and rewards of ownership of the goods have passed to the buyer, usually upon delivery of the goods.
Revenue from the sale of goods is measured at the fair value of the consideration received or receivable, net of returns, allowances, trade discounts and volume rebates.
In case the customer has the right to return goods, revenues are only recognized before the return period expires, if reliable estimates about the expected returns can be derived from past experience taking into consideration the type of customer, the type of transaction and the specifics of each arrangement. The expected return of goods are presented on a gross basis in the profit or loss statement. Rocket Internet reduces revenue by the full amount of sales that it estimates will be returned. The reduction of goods that is expensed in full upon shipping is then corrected by the estimated amount of returns. Rocket Internet also shows the gross figure for the return of goods in the balance sheet. The right to recover the possession of goods from expected sales returns is recognized under other non-financial assets. The amount of the assets corresponds to the cost of the goods delivered for which a return is expected, taking into account the costs incurred for processing the returns and the losses resulting from disposing of these goods. Trade receivables that have not yet been paid and that have underlying transactions that are not expected to be closed due to the goods being returned are derecognized. For customer receivables already paid and for which returns are expected in the future, Rocket Internet recognizes a refund obligation vis-à-vis the customer within other current financial liabilities.
The Group evaluates whether it is appropriate to record the gross amount of product sales and related costs. When the Group is primarily obligated in a transaction, is subject to inventory risk, has latitude in establishing prices and selecting suppliers, or has several but not all of these indicators, revenue is recorded at the gross sales price. The Group records the net amounts as commissions earned if the Group is not primarily obligated and does not have latitude in establishing prices. Such amounts earned are determined using a fixed percentage, a fixed-payment schedule, or a combination of the two.
Revenue from commissions is earned and recognized at the point of order fulfilment to the customers. This is the point at which an intermediation service is successfully processed and the Group has no remaining transactional obligations.
Revenue from services is recognized by reference to the stage of completion. Stage of completion is measured by reference to labor hours incurred until the reporting date as a percentage of the total estimated labor hours for each contract. When the contract outcome cannot be measured reliably, revenue is recognized only to the extent that the expenses incurred are eligible to be recovered.
Transactions are settled by prepayments, credit card, invoicing, PayPal and further country specific payment methods.
Dividends
Dividends are recognized when the Group’s right to receive the payment is established, which is generally when shareholders approve the dividend.
Interest Income
For all financial instruments measured at amortized cost interest income is recorded using the effective interest rate (EIR). EIR is the rate that exactly discounts the estimated future cash payments or receipts over the expected life of the financial instrument or a shorter period, where appropriate, to
Rocket Internet SE
Notes to the Consolidated Financial Statements 2016 (IFRS)
14
the net carrying amount of the financial asset or liability. Interest income is included in finance income in the statement of profit or loss.
Sales tax (VAT and similar taxes)
Expenses and assets are recognized net of the amount of sales tax, except:
When the sales tax incurred on a purchase of assets or services is not recoverable from the taxation authority, in which case, the sales tax is recognized as part of the cost of acquisition of the asset or as part of the expense item, as applicable, or
When receivables and payables are stated with the amount of sales tax included.
The net amount of sales tax recoverable from, or payable to, the taxation authority is included as part of other non-financial receivables or payables in the balance sheet.
Foreign currency transactions and translation
The financial statements of each of the Group entities are prepared using the currency of the primary economic environment in which the entity operates (‘the functional currency’). The Group financial statements are presented in Euro (EUR), which is also the parent Company’s functional currency.
Foreign currency transactions are translated into the functional currency using the exchange rate prevailing at the date of the respective transaction. Foreign exchange gains and losses resulting from the settlement of such transactions and from the translation at the balance sheet date exchange rates of monetary assets and liabilities denominated in foreign currencies are recognized in the income statement. Foreign exchange gains and losses that relate to loans as well as to cash and cash equivalents are presented net in the income statement within financial result. All other foreign exchange gains and losses are presented in the income statement within other operating income or expenses.
The results and balance sheets of all the Group entities that have a functional currency different from the presentation currency are translated into the presentation currency as follows:
(a) assets and liabilities for each balance sheet presented are translated at the closing rate at the date of that balance sheet;
(b) income and expenses for each income statement are translated at average exchange rates (unless this average is not a reasonable approximation of the cumulative effect of the rates prevailing on the transaction dates, in which case income and expenses are translated at the rate on the dates of the transactions); and
(c) all resulting exchange differences are recognized in other comprehensive income.
Equity-settled share-based payments
The Group operates a number of equity-settled share-based compensation arrangements, under which the Company and its subsidiaries receive services from eligible and selected directors or employees and others providing similar services as consideration for the following equity instruments:
share options in the Company, ordinary shares in subsidiaries (“share awards”) or share options in subsidiaries.
The total amount to be expensed for services received is determined by reference to the grant date fair value of the share-based payment award made. For share awards, the Group analyses whether the price paid by a participant, if any, is in line with the estimated market price of the underlying shares at the grant date. If a positive difference exists between (i) the estimated market value of the shares and (ii) the purchase price; this results in a fair value to be reported and recognized as a share-based payment expense. For share options granted, the grant date fair value is determined using the Black Scholes option valuation formula.
The fair value determined at the grant date is expensed on a straight-line basis over the respective vesting period, based on the Group’s estimate of the number of shares that will eventually vest, with a corresponding credit to equity.
Rocket Internet SE
Notes to the Consolidated Financial Statements 2016 (IFRS)
15
The total expense is recognized over the vesting period, which is the period over which all of the specified vesting conditions are to be satisfied. The vesting period usually starts with the grant date of the award. However, the recognition of expense may start at an earlier service commencement date when awards need to be formally approved after the employee has started providing services.
The Group recognizes compensation expense from the beginning of the service period, even when the grant date is subsequent to the service commencement date. During the period between service commencement date and grant date, the share-based payment expense recognized is based on the estimated grant date fair value of the award. Once the grant date has been established, the estimated fair value is revised so that the expense is recognized prospectively based on the actual grant date fair value of the equity instruments granted.
For awards with graded-vesting features, each instalment of the award is treated as a separate grant. This means that each instalment is separately recorded as an expense over the related vesting period. Some instalments vest only upon the occurrence of a specified exit event (e.g. IPO) of the subsidiary or upon the employee still being employed with or providing services to a group entity 12 months after such an event. These instalments are expensed over the expected time to such a vesting event. The share-based payment expenses would be reversed if no such event occurs by the time the awards elapse. Non-market performance and service conditions are included in the assumptions about the number of options and shares that are expected to vest.
No expense is recognized for awards that do not ultimately vest, except for equity-settled transactions for which vesting is conditional upon a market or non-vesting condition. These are treated as vested irrespective of whether or not the market or non-vesting condition is satisfied, provided that all other performance or service conditions are satisfied.
At the end of each reporting period, the Group revises its estimates of the number of options and shares that are expected to vest based on the non-market vesting conditions. It recognizes the impact of the revision to original estimates, if any, in the income statement, with a corresponding adjustment to equity.
When the terms of equity-settled awards are modified, as a minimum, the expenses recognized are measured at the grant date fair value, to the extent the non-market vesting conditions attached to the awards are met. An additional expense is recognized for any modification that increases the total fair value of the share-based payment transaction, or is otherwise beneficial to the employee as measured at the date of modification.
The expenses related to equity-settled share-based compensation arrangements are recognized as employee benefit expenses.
Application of the equity method of accounting – Equity-settled share-based payments at the level of associates/joint ventures
The expenses resulting from equity-settled share-based payments of associates and joint ventures are offset by the corresponding increase in equity of associates and joint ventures. As a result the total equity of the respective network company remains unchanged.
As there is no change in the Group’s share in the equity of the equity method investee, the proportionate share of expenses resulting from the equity-settled share-based payments at the level of associates and joint ventures do not have an impact on either, the subsequent measurement of associates and joint ventures in the Group’s balance sheet or on the share of profit/loss of associates and joint ventures recognized in the Group’s statement of comprehensive income. As presently there is no clear guidance from the IASB on this topic, the accounting policy applied currently by Rocket Internet may be subject to change in the future.
Share-based compensation – cash-settled
The Group recognizes a liability for the services received from its employees in cash-settled share-based payment transactions. The Group re-measures the fair value of the liability at each reporting date and at the date of settlement, with any changes in fair value recognized in profit or loss for the period as employee benefit expenses. The liability is recognized over the vesting period (if applicable).
Rocket Internet SE
Notes to the Consolidated Financial Statements 2016 (IFRS)
16
Property, plant and equipment
Property, plant and equipment are stated at cost less accumulated depreciation and accumulated impairment losses, where required.
Costs of minor repairs and maintenance are expensed when incurred.
Gains and losses on disposals are determined by comparing proceeds with the carrying amount and are recognized in profit or loss for the year within other operating income or expenses.
Depreciation of property, plant and equipment is calculated using the straight-line method to allocate their cost to their residual values over their estimated useful lives between 1 to 15 years. Leasehold improvements are depreciated over their estimated useful lives or the shorter lease term.
The residual value of an asset is the estimated amount that the Company would currently obtain from disposal of the asset less the estimated costs of disposal, if the asset was already of the age and in the condition expected at the end of its useful life. The assets’ residual values and useful lives are reviewed, and adjusted if appropriate, at the end of each reporting period.
Operating leases
Where the Company is a lessee in a lease which does not transfer substantially all the risks and rewards incidental to ownership from the lessor to the Company, the total lease payments are charged to profit or loss on a straight-line basis over the lease term. The lease term is the non-cancellable period for which the Company has contracted to lease the asset together with any further terms for which the lessee has the option to continue to lease the asset, with or without further payment, when at the inception of the lease it is reasonably certain that the lessee will exercise the option.
Goodwill
Goodwill is initially measured at acquisition cost. Goodwill is allocated to the cash-generating units, or groups of cash-generating units, that are expected to benefit from the synergies of the business combination. Such units or groups of units represent the lowest level at which the Company monitors goodwill and are not larger than an operating segment.
After initial recognition, goodwill is measured at cost less accumulated impairment losses. The Group tests goodwill for impairment at least annually and whenever there are indications that goodwill may be impaired. The carrying value of goodwill is compared to the recoverable amount, which is the higher of the value in use and the fair value less costs to sell. Any impairment is recognized immediately as an expense and is not subsequently reversed.
Gains or losses on the disposal of an operation within a cash generating unit to which goodwill has been allocated, include the carrying amount of goodwill associated with the disposed operation.
Other intangible assets
The Group‘s intangible assets have definite useful lives and primarily include trademarks, customer bases, acquired computer software and other licenses, and internally developed software.
Acquired computer software and other licenses are capitalized on the basis of the costs incurred to acquire and bring them to use.
Costs associated with maintaining computer software programs are recognized as an expense as incurred.
Costs that are directly attributable to the design, development and testing of identifiable and unique software products controlled by the Company are recognized as internally developed software when the following criteria are met:
it is technically feasible to complete the software product so that it will be available for use; management intends to complete the software product and use or sell it; there is an ability to use or sell the software product; it can be demonstrated how the software product will generate probable future economic
benefits; there are adequate technical, financial and other resources to complete the development and
Rocket Internet SE
Notes to the Consolidated Financial Statements 2016 (IFRS)
17
the expenditure attributable to the software product during its development can be reliably measured.
Directly attributable costs that are capitalized as part of the software product mainly include the software development employee cost. Other development expenditures that do not meet these criteria are recognized as an expense as incurred. Development costs previously recognized as an expense are not recognized as an asset in subsequent periods.
Intangible assets are amortized using the straight-line method over their useful lives:
Useful lives in years
Trademarks 11 - 15 years Customer base 2 - 13 years Internally developed software 3 - 5 years Acquired other intangible assets 1 - 15 years
Impairment of property, plant and equipment and intangible assets
Whenever events or changes in market or business conditions indicate a risk of impairment of property, plant and equipment or intangible assets or a cash generating unit (“CGU”), if applicable, management estimates the recoverable amount, which is determined as the higher of an asset or CGU’s fair value less costs to sell and its value in use. A CGU is defined as the lowest level of identifiable cash inflows. The carrying amount is reduced to the recoverable amount and the impairment loss is recognized in profit or loss for the year.
Inventories
Inventories are valued at the lower of cost and net realizable value. Cost of inventory is determined based on the weighted average cost. The cost of inventory includes the costs of purchase or production and costs incurred to bring the inventories to their present location and condition such as shipping and handling.
Write-down expenses due to obsolete and slow moving inventory are deducted from the carrying amount of the inventories.
Cash and cash equivalents
Cash and cash equivalents include cash at hand, deposits held on demand with banks, and other short-term highly liquid investments with original maturities of three months or less, for which the risk of changes in value is considered to be insignificant.
Financial instruments
A financial instrument is any contract that gives rise to a financial asset of one entity and a financial liability or equity instrument of another entity.
Rocket Internet SE
Notes to the Consolidated Financial Statements 2016 (IFRS)
18
Financial assets
Initial recognition and measurement of financial assets
A financial asset is recognized when the Group becomes a party to the contractual provisions of the instrument. The Group initially recognizes loans and receivables on the date on which they are originated. Purchases or sales of financial assets that require delivery of assets within a time frame established by regulation or convention in the marketplace (regular way trades) are recognized on the trade date, i.e. the date that the Group commits to purchase or sell the asset.
Financial assets held by the Group are classified, at initial recognition, as financial assets at fair value through profit or loss, loans and receivables, and available-for-sale financial assets. Transaction costs are recognized as well, except in the case of financial assets at fair value through profit or loss. The Group did not make use of the held-to-maturity category, during the years ended December 31, 2016 and 2015.
Subsequent measurement of financial assets
The subsequent measurement of financial assets depends on its category:
Financial assets at fair value through profit or loss Loans and receivables Available-for-sale financial assets (AFS financial assets)
Financial assets at fair value through profit or loss
The fair value through profit or loss category comprises the following subcategories: financial assets that are initially designated into this category (”Fair value option”), contingent consideration of an acquirer in a business combination, and held-for-trading financial assets.
Rocket Internet’s financial assets in this category include equity investments where Rocket Internet is acting as an investor within the meaning of IAS 28.18 and elects to measure these investments at fair value through profit or loss or which Rocket Internet designates as financial assets at fair value through profit or loss because the investments are managed and measured on the basis of fair values in accordance with risk management and investment strategies. In addition, Rocket Internet designated employee loans into this category, for which settlement amounts could be partly influenced in some circumstances by the performance of shares in certain associated companies and thus include embedded derivatives. Financial assets at fair value through profit or loss are recognized in the balance sheet at fair value with net changes in fair value presented as finance costs (negative net changes in fair value) or finance income (positive net changes in fair value) in the statement of profit or loss.
Even though the Group enters from time to time foreign currency derivatives to mitigate foreign currency risk, it does not make use of hedge accounting. Therefore, such derivatives are deemed to be as held for trading. The Group is not engaged in trading with financial instruments and it does not have any other held-for-trading financial assets.
See Note 41 for information on the Group’s equity investments at fair value through profit or loss.
Loans and receivables
Loans and receivables are non-derivative financial assets with fixed or determinable payments that are not quoted in an active market. After initial recognition, such financial assets are measured at amortized cost using the effective interest rate (EIR) method, less impairment. Amortized cost is calculated by taking into account any discount or premium on acquisition and fees or costs that are an integral part of the EIR. The EIR amortization is included in finance income in the statement of profit or loss. Trade receivables are initially recognized at fair value which primarily represents the original invoice amount. The losses arising from impairment are recognized in the statement of profit or loss in finance costs for loans and in other operating expenses for receivables.
Loans and receivables are included in current assets, except for those having maturities greater than 12 months at the end of the reporting period. These are classified as non-current assets. The Group’s loans and receivables comprise loans, trade receivables and other financial assets.

Rocket Internet SE
Notes to the Consolidated Financial Statements 2016 (IFRS)
19
When there is objective evidence that the Group may not be able to collect the trade receivables, the loss is recognized in other operating expenses and reflected in the allowances for doubtful accounts. Balances are written off when recoverability is assessed as being remote.
AFS financial assets
AFS financial assets of the Group comprise equity investments that are not designated at fair value through profit or loss. This category includes investments intended to be held for the long-term.
After initial recognition, AFS financial assets are measured at fair value with unrealized gains or losses recognized in OCI until the investment is derecognized or impaired, at which time the cumulative gain or loss is recognized in finance income/costs.
Impairment of financial assets
The Group assesses, at each reporting date, whether there is objective evidence that a financial asset or a group of financial assets is impaired. An impairment exists if one or more events that has occurred since the initial recognition of the asset (an incurred ‘loss event’), has an impact on the estimated future cash flows of the financial asset or the group of financial assets that can be reliably estimated. Evidence of impairment may include indications that the debtors or a group of debtors is experiencing significant financial difficulty, default or delinquency in interest or principal payments, the probability that they will enter bankruptcy or other financial reorganization and observable data indicating that there is a measurable decrease in the estimated future cash flows, such as changes in arrears or economic conditions that correlate with defaults.
If, in a subsequent year, the amount of the estimated impairment loss of financial assets recognized at amortized costs increases or decreases because of an event occurring after the impairment was recognized, the previously recognized impairment loss is increased or reduced by adjusting the allowance account. If a write-off is later recovered due to an event after the impairment was recognized, the recovery is credited in the statement of profit or loss.
In the case of equity investments classified as AFS, objective evidence of impairment would include a significant or prolonged decline in the fair value of the investment below its cost. ‘Significant’ is evaluated against the original cost of the investment and ‘prolonged’ against the period in which the fair value has been below its original cost. When there is evidence of impairment, the cumulative loss – measured as the difference between the acquisition cost and the current fair value, less any impairment loss on that investment previously recognized in the statement of profit or loss – is removed from OCI and recognized in the statement of profit or loss. Impairment losses on equity investments are not reversed through profit or loss; increases in their fair value after impairment are recognized in OCI.
Derecognition of financial assets
The Group derecognizes a financial asset when the contractual rights to the cash flows from the asset expire, or it transfers the rights to receive the contractual cash flows in a transaction in which substantially all of the risks and rewards of ownership of the financial asset are transferred.
Financial liabilities
Initial recognition and measurement of financial liabilities
Financial liabilities are recognized when the Group becomes a party to the contractual provisions of the instrument and classified, at initial recognition, as financial liabilities at fair value through profit or loss or other financial liabilities.
All financial liabilities are recognized initially at fair value and, in the case of other financial liabilities, net of directly attributable transaction costs.
The Group’s financial liabilities include convertible bonds, trade and other payables, loans and borrowings including bank overdrafts, contingent considerations of an acquirer in a business combination, contingent contractual payment obligations and liabilities from mandatorily redeemable preference shares issued by a consolidated subsidiary.
Rocket Internet SE
Notes to the Consolidated Financial Statements 2016 (IFRS)
20
Subsequent measurement of financial liabilities
The measurement of financial liabilities depends on their classification, as described below.
Financial liabilities at fair value through profit or loss
Financial liabilities at fair value through profit or loss include financial liabilities held for trading, contingent considerations of an acquirer in a business combination, and financial liabilities designated upon initial recognition as at fair value through profit or loss.
Financial liabilities at fair value through profit or loss of the Group contain only contingent contractual payment obligations.
The Group’s policy does not permit any trading with financial instruments.
Financial liabilities designated upon initial recognition at fair value through profit or loss are designated at the initial date of recognition, and only if the criteria in IAS 39 are satisfied. The Group has not designated any financial liability as at fair value through profit or loss.
Other financial liabilities
This is the category of financial liabilities most relevant to the Group. It includes convertible bonds, trade and other financial payables, loans and borrowings including bank overdrafts, and liabilities from mandatorily redeemable preference shares issued by a consolidated subsidiary.
After initial recognition, other financial liabilities are measured at amortized cost using the EIR method. Gains and losses are recognized in profit or loss when the liabilities are derecognized as well as the result of the revision of estimated cash flows and through the EIR amortization process
Trade payables are obligations to pay for goods or services that have been acquired in the ordinary course of business from suppliers.
Loans and borrowings are classified as current liabilities if payment is due within one year or less. If not, they are presented as non-current liabilities.
Other financial liabilities also contained liabilities from mandatorily redeemable preference shares issued by one of the consolidated subsidiaries to a third party investor (minority shareholder). The mandatorily redeemable preference shares took the legal form of equity but are liabilities pursuant to IAS 32.18(a) requirements.
Convertible bonds
Convertible bonds issued by the Group are separated into liability and equity components based on the terms of the contract. On issuance of the convertible bonds, the fair value of the liability component is determined using a market rate for an equivalent non-convertible instrument. This amount is classified as a financial liability measured at amortized cost (net of the relevant portion of the transaction costs) until it is expired on conversion or redemption. The remainder of the proceeds is allocated to the conversion option that is recognized and included in equity. The relevant portion of the transaction costs are deducted from equity, net of associated income tax. The carrying amount of the conversion option recognized in equity is not remeasured in subsequent years.
Transaction costs are apportioned between the liability and equity components of the convertible preference shares based on the allocation of proceeds to the liability and equity components when the instruments are initially recognized.
Derecognition of financial liabilities
The Group derecognizes a financial liability when its contractual obligations are discharged, cancelled or expired.
Subscribed capital and capital reserves
Ordinary shares are classified as equity. Incremental costs directly attributable to the issue of new equity instruments are shown, net of taxes, in equity as a deduction from the proceeds.
Rocket Internet SE
Notes to the Consolidated Financial Statements 2016 (IFRS)
21
Any excess of the fair value of consideration received over the par value of shares issued is recorded as share premium in the capital reserves.
Dividends
Cash or non-cash distributions are recorded as a liability and deducted from equity in the period in which they are declared and approved by the shareholders and the distribution is no longer at the discretion of the Company.
Non-cash distributions are measured at the fair value of the assets to be distributed with fair value remeasurement recognized directly in equity. Upon distribution of non-cash assets, any difference between the carrying amount of the liability and the carrying amount of the assets distributed is recognized in the statement of profit or loss.
Provisions
Provisions are non-financial liabilities of uncertain timing or amount. They are accrued when the Company has a present legal or constructive obligation as a result of past events, it is probable that an outflow of resources embodying economic benefits will be required to settle the obligation, and a reliable estimate of the amount of the obligation can be made. The amount recognized as a provision is the best estimate of the consideration required to settle the present obligation at the reporting date, taking into account the risks and uncertainties surrounding the obligation.
Income taxes
Income taxes have been provided for in the financial statements in accordance with legislation enacted or substantively enacted by the end of the reporting period. The income tax charge or credit comprises current tax and deferred tax and is recognized in profit or loss for the year, except if it is recognized in other comprehensive income or directly in equity because it relates to transactions that are also recognized, in the same or a different period, in other comprehensive income or directly in equity.
Current tax is the amount expected to be paid to or recovered from the taxation authorities in respect of taxable profits or losses for the current and prior periods. Taxable profits or losses are based on estimates if financial statements are authorized prior to filing relevant tax returns. Taxes other than on income are recorded within operating expenses.
Deferred income tax is recognized on temporary differences arising between the tax bases of assets and liabilities and their carrying amounts in the financial statements. However, in accordance with the initial recognition exemption, deferred taxes are not recorded for temporary differences on initial recognition of an asset or a liability in a transaction other than a business combination if the transaction, when initially recorded, affected neither book nor taxable profit.
Deferred tax balances are measured at tax rates enacted or substantively enacted at the end of the reporting period, which are expected to apply to the period when the temporary differences will reverse or the tax loss carry forwards will be utilized.
Deferred tax assets for deductible temporary differences and tax loss carry forwards are recorded only to the extent that it is probable that future taxable profit will be available against which the deductions can be utilized.
The Company controls the reversal of temporary differences relating to taxes chargeable on dividends from subsidiaries or on gains upon their disposal (“outside basis differences”). Deferred tax liabilities are not recognized on such temporary differences except to the extent that management expects the temporary differences to reverse in the foreseeable future.
Earnings per share
The Company presents basic and diluted earnings (loss) per share (EPS) data for its ordinary shares. Basic EPS is calculated by dividing the profit or loss attributable to ordinary shareholders of the Company by the weighted average number of ordinary shares outstanding during the period. Diluted EPS is determined by adjusting the profit or loss attributable to ordinary shareholders and the weighted average number of ordinary shares outstanding to reflect the effects of all potential dilutive
Rocket Internet SE
Notes to the Consolidated Financial Statements 2016 (IFRS)
22
ordinary shares, which comprise convertible and redeemable preference shares and share options granted to employees. For more information see Note 23.
Segment reporting
In accordance with IFRS 8 Operating Segments, segment reporting is constructed on the basis of internal management data used for performance analysis of businesses and for the allocation of resources. An operating segment is a distinct component of the Group which is engaged in the supply of distinct products and services and which is exposed to risks and returns different from the risks and the returns of other operating segments. See Note 6 for further information.
4 Critical Accounting Judgments, Estimates and Assumptions in Applying Accounting Policies
The preparation of the Group’s consolidated financial statements requires management to make judgements, estimates and assumptions that affect the reported amounts of revenues, expenses, assets and liabilities, and the accompanying disclosures as well as the disclosure of contingent liabilities. Uncertainty about these assumptions and estimates could result in outcomes that require a material adjustment to the carrying amount of assets or liabilities affected in future periods.
Estimates and judgements are continually evaluated and are based on management’s experience and other factors, including expectations of future events that are believed to be reasonable under the circumstances. The Group based its assumptions and estimates on parameters available when the consolidated financial statements were prepared. Existing circumstances and assumptions about future developments, however, may change due to market fluctuations or circumstances arising that are beyond the control of the Group. Such changes are reflected in the assumptions when they occur.
Management also makes certain judgements, apart from those involving estimations, in the process of applying the accounting policies.
Judgements that have the most significant effect on the amounts recognized in the financial statements and estimates that can cause a significant adjustment to the carrying amount of assets and liabilities within the next financial year have been discussed below and are also described in the individual notes of the related financial statement line items.
Significant Accounting Judgement
Classification of shares in Delivery Hero GmbH as AFS financial assets
During the 1st half of 2015, the Group successively purchased 157,679 shares in Delivery Hero GmbH (DH) which represented back then approximately 44% (prior to dilutive effects of convertible instruments issued by DH) of the total outstanding subscribed capital of DH as of June 30, 2015. Due to the capital increases performed by DH after June 30, 2015 Rocket Internet’s share decreased to 40% until March 31, 2017 (prior to dilutive effects of convertible instruments issued by DH). Under the terms of the DH Shareholders’ Agreement, the Group’s voting rights are limited to 30%.
The Group did not obtain representation on the DH’s supervisory board (as specified in the DH’s articles of incorporation) which precludes Rocket Internet from participating in the policy-making processes of DH.
In light of the lack of significant influence during the financial years 2016 and 2015, the Group classified its equity investment in DH as available-for-sale financial assets. This category includes investments intended to be held for the long-term. As of December 31, 2016 the carrying amount of the shares in DH amounted to EUR 1,271,748 thousand. During the financial year 2016, the Group recognized an unrealized gain for its DH investment in OCI. For more information reference is made to Note 41.
Classification of remaining shares in Lazada as asset held for sale
On April 12, 2016, Rocket Internet concluded a partial disposal of Lazada. Rocket Internet’s remaining stake after the partial sale of Lazada shares is 9.3% (fully diluted 8.8%). Shareholders, including
Rocket Internet SE
Notes to the Consolidated Financial Statements 2016 (IFRS)
23
Rocket Internet, have also entered into a put-call arrangement with the buyer, giving the buyer the right to purchase, and the shareholders the right to sell collectively, the remaining stakes at fair market value within a 12 to 18 month period post-closing after the first sale of shares. The remaining shareholdings in Lazada are classified as assets held for sale. For more information reference is made to Note 32.
Shareholders’ agreements – Assessment of control, joint control or significant influence over network companies
The shareholders’ agreements to which Rocket Internet is a party are important instruments for steering the corporate governance of network companies. The shareholders’ agreements typically specify that a number of important decisions need to be resolved by the shareholders. These important decisions are referred to as reserved matters. The shareholders’ agreements often require a qualified majority of investors and, in certain cases, an unanimous vote of the investors for decisions regarding reserved matters. Sometimes the decision on reserved matters is conferred on an advisory board. This means that the Company typically cannot make or block decisions on reserved matters alone, but needs the support of one or more other investors. The reserved matters include fundamental decisions about the relevant entities, its operative and strategic plans and important transactions that exceed certain thresholds.
Based on the regulations in the shareholders’ agreements the Company assesses whether
it controls a network company particularly when it is exposed, or has rights, to variable returns from its involvement with the network company and has the ability to affect those returns through its power over the network company,
it is a party of an arrangement in which two or more parties have joint control or it has the power to participate in the financial and operating policy decisions of the network
company but is not in control or joint control of those policies (significant influence).
Whether or not the Group controls a network company depends on an evaluation of a number of factors, including, among others, representation on its board of directors, voting rights and other rights of other investors, including their participation in significant decisions made in the ordinary course of business (e.g. approval of the annual operating budget), as well as the Group’s ownership level of the outstanding voting rights of the subsidiary. For more information reference is made to Note 8.
Designation of equity instruments as financial assets at fair value through profit or loss
The Group has designated certain associated companies and other equity investments that are not incubated or actively developed by Rocket Internet as financial assets at fair value through profit or loss. Rocket Internet is acting as an investor within the meaning of IAS 28.18 and the Group is not intensely involved in the strategic leadership and tactical implementation of the business plans of such companies. Furthermore, Rocket Internet usually does not perform significant commercial and technical consulting services for these companies. Those associated companies and other equity investments are managed and measured on the basis of fair values.
Amongst others, this category includes the portfolio of investments in several Internet companies acquired in August 2014 by a way of an exchange of shares held by United Internet and Global Founders GmbH in the Global Founders Capital Fund for shares in Rocket Internet (the so-called “GFC Investments”). In 2016 further GFC investments were made, such as Ace & Tate, Marley Spoon, Thermondo, Pets Deli, Goldbely, NatureBox and Sonovate. Moreover, the Group designated the remaining stake in Zalando SE as financial assets at fair value through profit or loss. See Note 41 for information on the Group’s equity investments measured at fair value through profit or loss.
Classification of investments in Rocket Internet Capital Partners Fund as unconsolidated structured entities accounted for as associates under the equity method
When deciding whether or not to consolidate a company, Rocket Internet reviews a range of factors such as voting rights, the object and structure of the entity and the ability to exert influence. The Group does not consolidate the Fund, because the general partner is deemed an agent. The Group does not control it through voting rights, contracts, funding agreements, or other means. The general partner acts as an agent and only exercises decision-making powers, which have been delegated by the passive investors (limited partners of the Fund).
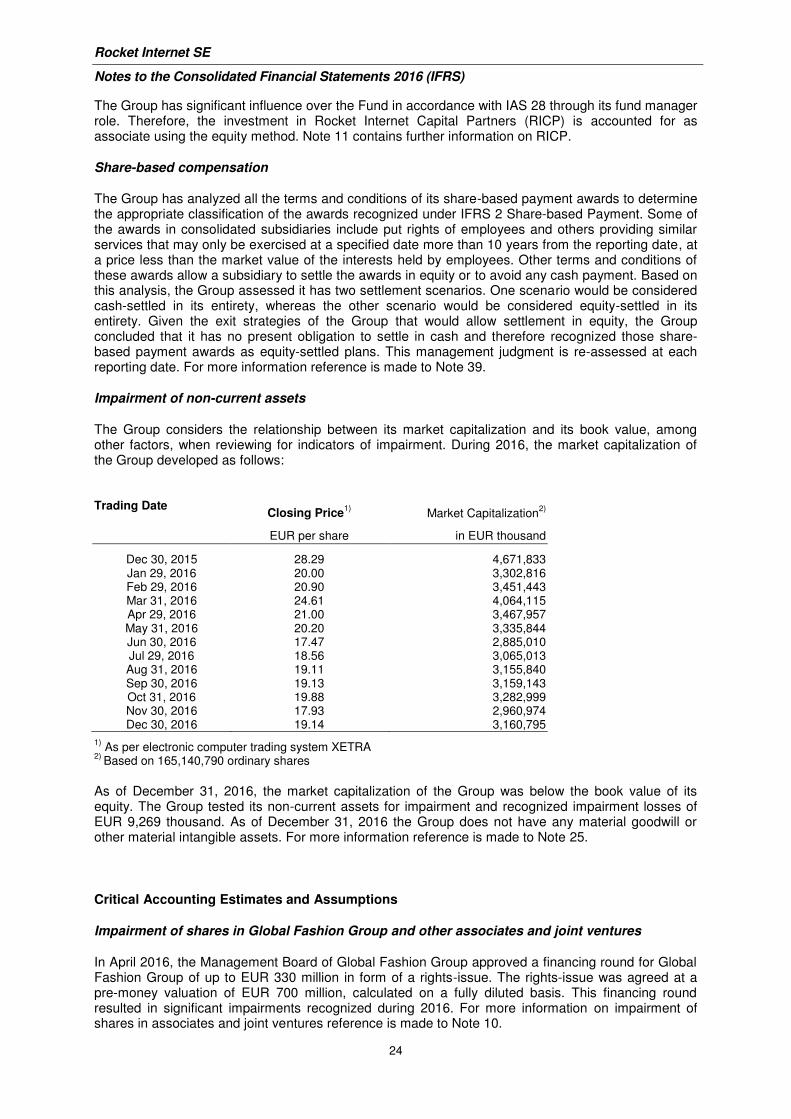
Rocket Internet SE
Notes to the Consolidated Financial Statements 2016 (IFRS)
24
The Group has significant influence over the Fund in accordance with IAS 28 through its fund manager role. Therefore, the investment in Rocket Internet Capital Partners (RICP) is accounted for as associate using the equity method. Note 11 contains further information on RICP.
Share-based compensation
The Group has analyzed all the terms and conditions of its share-based payment awards to determine the appropriate classification of the awards recognized under IFRS 2 Share-based Payment. Some of the awards in consolidated subsidiaries include put rights of employees and others providing similar services that may only be exercised at a specified date more than 10 years from the reporting date, at a price less than the market value of the interests held by employees. Other terms and conditions of these awards allow a subsidiary to settle the awards in equity or to avoid any cash payment. Based on this analysis, the Group assessed it has two settlement scenarios. One scenario would be considered cash-settled in its entirety, whereas the other scenario would be considered equity-settled in its entirety. Given the exit strategies of the Group that would allow settlement in equity, the Group concluded that it has no present obligation to settle in cash and therefore recognized those share-based payment awards as equity-settled plans. This management judgment is re-assessed at each reporting date. For more information reference is made to Note 39.
Impairment of non-current assets
The Group considers the relationship between its market capitalization and its book value, among other factors, when reviewing for indicators of impairment. During 2016, the market capitalization of the Group developed as follows:
Trading Date Closing Price
1) Market Capitalization
2)
EUR per share in EUR thousand
Dec 30, 2015 28.29 4,671,833 Jan 29, 2016 20.00 3,302,816 Feb 29, 2016 20.90 3,451,443 Mar 31, 2016 24.61 4,064,115 Apr 29, 2016 21.00 3,467,957 May 31, 2016 20.20 3,335,844 Jun 30, 2016 17.47 2,885,010 Jul 29, 2016 18.56 3,065,013 Aug 31, 2016 19.11 3,155,840 Sep 30, 2016 19.13 3,159,143 Oct 31, 2016 19.88 3,282,999 Nov 30, 2016 17.93 2,960,974 Dec 30, 2016 19.14 3,160,795
1) As per electronic computer trading system XETRA
2) Based on 165,140,790 ordinary shares
As of December 31, 2016, the market capitalization of the Group was below the book value of its equity. The Group tested its non-current assets for impairment and recognized impairment losses of EUR 9,269 thousand. As of December 31, 2016 the Group does not have any material goodwill or other material intangible assets. For more information reference is made to Note 25.
Critical Accounting Estimates and Assumptions
Impairment of shares in Global Fashion Group and other associates and joint ventures
In April 2016, the Management Board of Global Fashion Group approved a financing round for Global Fashion Group of up to EUR 330 million in form of a rights-issue. The rights-issue was agreed at a pre-money valuation of EUR 700 million, calculated on a fully diluted basis. This financing round resulted in significant impairments recognized during 2016. For more information on impairment of shares in associates and joint ventures reference is made to Note 10.
Rocket Internet SE
Notes to the Consolidated Financial Statements 2016 (IFRS)
25
Measuring the fair value of financial assets
When the fair values of financial assets recognized in the balance sheet (especially of not listed equity instruments) cannot be measured based on quoted prices in active markets, their fair value is measured using valuation techniques including the discounted cash flow (DCF) model. The inputs to these models are taken from observable markets as far as possible, but where this is not feasible a degree of management judgement is required in establishing fair values. Judgements include considerations of the input used. Changes in assumptions about these factors could affect the reported fair value of financial instruments. See Note 41 for further disclosures.
Deemed disposals of subsidiaries – Fair value measurement of interest retained
A deemed disposal occurs where the proportionate interest of a parent company in a subsidiary is reduced other than by an actual disposal, for example, by the issuance of shares to a third party investor by the subsidiary. When the Group no longer has control, the remaining interest is measured at fair value as at the date the control was lost. When determining the fair value, the Group takes into account all the facts and circumstances surrounding the transactions such as timing, transaction size, transaction frequency, and motivations of the investors. The Group considers whether such a transaction has been made at arm’s length. For new share issues, the Group also considers whether, in the event of liquidation or sale, the newly issued shares have preferences to the investee’s assets over earlier issued shares. We refer to Note 15.
Deferred income taxes
We consider many factors when assessing the likelihood of future realization of our deferred tax assets, including our recent earnings experience by jurisdiction, expectations of future taxable income, and the carry forward periods available to us for tax reporting purposes, as well as other relevant factors. Due to inherent complexities arising from the nature of our businesses, future changes in income tax laws or variances between our actual and anticipated operating results, we assess the likelihood of future realization of our deferred tax assets based on our judgments and estimates. Therefore, actual income taxes could materially vary from these judgments and estimates. For further information we refer to Note 22.
Share-based compensation – Equity-settled transactions at parent company level
The Group measures the costs of granting share options of the company to employees by using their fair value at the moment they were granted. Estimating fair value for share-based payment transactions requires determination of the most appropriate valuation model (Black-Scholes-option pricing model), which is dependent on the terms and conditions of the grant. This estimate also requires determination of the most appropriate inputs to the valuation model including especially the expected volatility calculated using data of peer groups and furthermore the anticipated option term, dividend yield and risk-free interest rate. The assumptions and models used for estimating fair value are disclosed in Note 39.
Share-based compensation – Equity-settled transactions at subsidiary level
The Group measures the cost of equity-settled transactions with employees by reference to the fair value of the equity instruments at the date at which they are granted. This grant date fair value remains unchanged throughout the life of the award. As the consolidated subsidiaries of the Group are unlisted, estimating fair value for share-based payment transactions (ordinary shares and options) requires the use of the most appropriate valuation model, which is dependent on the terms and conditions of the grant.
In determining the fair values of a consolidated subsidiary’s ordinary shares, as of each award grant date, three generally accepted approaches were considered: income approach, market approach and cost approach.
We have employed the “prior sale of company stock” method, a form of the market approach, to estimate the aggregate enterprise value at the level of some consolidated intermediate holding subsidiaries of the Company. The prior sale of company stock method considers any prior arm’s length sales of the Group subsidiary’s equity securities. Considerations factored into the analysis include: the type and amount of equity sold, the estimated volatility, the estimated time to liquidity, the
Rocket Internet SE
Notes to the Consolidated Financial Statements 2016 (IFRS)
26
relationship of the parties involved, the risk-free rate, the timing compared to the ordinary shares valuation date, and the financial condition and structure of the company at the time of the sale. As such, we have benchmarked the value per share to the external transactions of subsidiary shares and external financing rounds. Throughout 2015 and 2016, the respective subsidiaries held a number of financing rounds which resulted in the issuance of new shares. The new shares were transacted with numerous existing and new investors, and therefore we consider the pricing a strong indication of fair value.
We have applied the income approach to estimate the enterprise value of subsidiaries of an intermediate holding subsidiary. The income approach is a technique by which fair value is estimated based on cash flows expected to be generated in the future. The principle behind this approach is that the value of the subsidiary is equal to its earnings potential. The future cash flows are discounted using a weighted average cost of capital that takes into consideration the stage of development of the business and the industry and geographies in which it operate. The total sum of all equity values based on discounted cash flows of the operating companies were reconciled to the total equity value of the Holding Company on the basis of financing rounds (i.e. “prior sale of company stock” method).
Given that there are multiple classes of equity at the subsidiary level, we employed the hybrid method in order to measure these different categories. The Hybrid method is a hybrid between the probability-weighted expected return method (“PWERM”) and the Option Pricing Method (“OPM”), which estimates the probability weighted value across certain exit scenarios, but uses the OPM to estimate the remaining unknown potential exit scenarios.
A discount for lack of marketability (“DLOM”) was applied, corresponding to the time to exit under the various scenarios, to reflect the increased risk arising from the inability to readily sell the shares. When applying the DLOM, the Finnerty option pricing model was used. Under this method, the cost of the put option, which can hedge the price change before the not publicly traded shares can be sold, was considered as the basis to determine the DLOM.
In addition, we are required to estimate share-based compensation expense net of estimated forfeitures. In determining the estimated forfeiture rates for share-based awards, we periodically conduct an assessment of the actual number of equity awards that have been forfeited to date as well as those expected to be forfeited in the future. We consider many factors when estimating expected forfeitures, including the type of award, the employee class and historical experience. If our actual forfeiture rate is materially different from our estimate, the share-based compensation expense could be significantly different from what we have recorded in the current period.
The assumptions and models used for estimating fair value for share-based payment transactions are disclosed in Note 39.
5 New Accounting Pronouncements
New standards and amendments to existing standards issued but not yet effective up to the date of authorization for issue of the Group’s financial statements which are relevant for the Group are listed below. The Group intends to adopt those standards when they become effective within the EU.
IFRS 9 Financial Instruments: Classification and Measurement (issued on July 24, 2014). IFRS 9 will replace IAS 39 “Financial Instruments: Classification and Measurement”. IFRS 9 provides new guidance on the classification and measurement of financial assets and liabilities, introduces a new impairment model for financial assets as well as new rules on hedge accounting.
IFRS 9 takes into account to the characteristics of the contractual cash flows and the business model by which these cash flows are managed. The standard also provides a new risk provision model that now also accounts for anticipated losses for the calculation of the risk provision. However, since presently the majority of the Company’s financial instruments are equity investments measured at fair value through profit or loss or OCI and plain vanilla other financial instruments, the impact is not expected to be significant. The Company will start to apply IFRS 9 starting January 1, 2018.
IFRS 15 Revenues from Contracts with Customers (issued on May 28, 2014) including amendments to IFRS 15 (issued on September 11, 2015) and clarifications to IFRS 15 (issued on April 12, 2016). IFRS 15 establishes a comprehensive model for determining whether, how much and when revenue is recognized. It supersedes current revenue recognition guidance including IAS 18 Revenue, IAS 11 Construction Contracts and related interpretations.
Rocket Internet SE
Notes to the Consolidated Financial Statements 2016 (IFRS)
27
IFRS 15 governs recognition of revenue by the entity reflecting the transfer of goods or services to customers at such amount that represents the consideration the entity expects to receive. The entity recognizes revenue when the customer obtains control over the goods or services. IFRS 15 also contains guidance on the presentation of contract assets or contract liabilities. The standard also calls for additional disclosures, including a disaggregation of total revenue, on performance obligations, on reconciliations of opening and closing balances of net contract assets and contract liabilities as well as on significant judgments and estimates.
The application of IFRS 15 is most likely not going to have any material effect on the consolidated financial statements of Rocket Internet. Presently, there are no differences in the point in time when performance obligations are satisfied and also no differences in the pattern of how performance obligations are satisfied. The Company will start to apply IFRS 15 starting January 1, 2018.
IFRS 16 Leases (issued on January 13, 2016). IFRS 16 establishes new rules for lease accounting. This standard obliges lessees to recognize essentially all leases in the balance sheet. In future, there will be no accounting difference between leases and purchases financed by loans. The new standard will lead to an increase in property, plant and equipment and intangible assets in the consolidated balance sheet (for the rights of use), and at the same time an increase in financial liabilities (due to the payment obligations). Thus, every leasing or rental arrangement will be shown in the balance sheet. In the income statement, this leads to increased depreciation and interest expense. While the depreciation charge is typically evenly spread, the interest expense reduces over the life of the lease as lease payments are made. This results, in comparison to straight-line operating lease expense recognition under the current IAS 17, in a reduction of the total expense as an individual lease matures. However, EBITDA will not improve proportionately to the increase in financial liabilities. As a consequence, the ratio of net financial liabilities to adjusted EBITDA (relative indebtedness) will deteriorate although there has been no economic change. There are operational exemptions for short-term leases and leases of low value items. Rocket Internet is predominantly a lessee accounting for the lease contract as operating leases at present. Operating leases of the Group are mainly rental obligations. The effects of IFRS 16 on the consolidated financial statements of Rocket Internet are therefore likely to be mainly in the amount of operating lease obligations and the resulting depreciation and interest effects (see Note 43). IFRS 16 is effective for annual reporting periods beginning on or after January 1, 2019.
Amendments to IFRS 10 and IAS 28: Sale or Contribution of Assets between an Investor and its Associate or Joint Venture (issued on September 11, 2014). These narrow-scope amendments address an inconsistency between the requirements in IFRS 10 and those in IAS 28 (2011), in dealing with the sale or contribution of assets between an investor and its associate or joint venture. In December 2015, the IASB decided to postpone the effective date of these amendments indefinitely. As a consequence EU postponed its endorsement.
Amendments to IAS 7: Disclosure Initiative (issued on January 29, 2016). According to these amendments entities shall provide disclosures that enable users of financial statements to evaluate changes in liabilities arising from financing activities. The IASB requires that the following changes in liabilities arising from financing activities are disclosed (to the extent necessary): (i) changes from financing cash flows; (ii) changes arising from obtaining or losing control of subsidiaries or other businesses; (iii) the effect of changes in foreign exchange rates; (iv) changes in fair values; and (v) other changes. One way to fulfil the new disclosure requirement is to provide a reconciliation between the opening and closing balances in the statement of financial position for liabilities arising from financing activities. The Company plans to apply the amendments to IAS 7 in periods starting January 1, 2017, insofar an endorsement from the EU will have been passed in time. The amendments to IAS 7 only refer to disclosure requirements and have no quantitative impact on the financial statements of Rocket Internet.
Amendments to IAS 12: Recognition of Deferred Tax Assets for Unrealised Losses (issued on January 19, 2016) According to these amendments the decreases below cost in the carrying amount of debt instruments measured at fair value resulting from a change in market interest rates give rise to deductible temporary differences. The Group plans to apply the amendments of IAS 12 in periods starting January 1, 2017, insofar an endorsement from the EU will have been passed. Rocket Internet does not expect a material impact on its financial statements through the amendments.
Amendments to IFRS 2: Classification and Measurement of Share-based Payment Transactions (issued on June 20, 2016). The amendments to IFRS 2 address the following three issues: the accounting for cash-settled share-based payment transactions that include a performance condition; the classification of share-based payment transactions with net settlement features; and the
Rocket Internet SE
Notes to the Consolidated Financial Statements 2016 (IFRS)
28
accounting for modifications of share-based payment transactions from cash-settled to equity-settled. The Company plans to apply the amendments to IFRS 2 in periods starting January 1, 2018, insofar an endorsement from the EU will have been passed. Rocket Internet does not expect a material impact on its financial statements through the amendments.
Annual Improvements to IFRS Standards 2014-2016 Cycle (issued on December 8, 2016). The improvements affect IFRS 1, IFRS 12 and IAS 28. The Company plans to apply the amendments in periods starting January 1, 2017 respectively January 1, 2018, insofar an endorsement from the EU will have been passed. Rocket Internet does not expect a material impact on its financial statements through the improvements.
Unless otherwise described above, the new standards and interpretations issued by the IASB and to be adopted for the first time in the future are not expected to significantly affect the Group’s financial statements.
6 Segment Information
Operating segments are components that engage in business activities that may earn revenues or incur expenses, whose operating results are regularly reviewed by the chief operating decision maker (CODM), and for which discrete financial information is available. The CODM is the person or group of persons who allocates resources and assesses the performance of the segments. The function of the CODM is performed by the Board of Management of Rocket Internet SE.
Each network company represents an operating segment. In case such network company represents an intermediate holding company for a single or multiple Internet business models, each Internet business model represents an operating segment.
The amounts provided to the CODM are primarily measured in a manner consistent with that of the financial statements. The CODM assesses the performance of the operating segments based on a number of financial metrics including revenue, EBITDA, and cash and cash equivalents. One-off effects from legal and capital reorganization at the level of intermediate holding companies are not reflected on the operating network company level and therefore not included in the segment information provided below.
Sales between segments are carried out at arm’s length.
The following six reportable segments could be identified: HelloFresh (formerly referred to as Food 1), foodpanda (formerly referred to as Food 2), GFG (formerly referred to as Fashion), Jumia, Home & Living and General Merchandise. The reportable segments reflect the most mature business activities of Rocket Internet SE. Other network companies do not meet the thresholds for reportable segments. Other investments where Rocket Internet SE cannot exercise significant influence neither qualify as reportable nor as operating segments.
Comparability of the reportable segments in 2016 with the prior period is affected by the following transactions:
- The reportable segment GFG disposed Jabong (operations in India) in August 2016.
- The new reportable segment Jumia was established following the merger of the general merchandise business activities with the other African marketplace and classifieds businesses combined in Africa Internet Holding GmbH.
HelloFresh is a leading global online provider of personalized fresh food at home. The company delivers recipes and fresh, pre-portioned ingredients to its subscribers to conveniently prepare healthy and delicious home-cooked meals. Founded in 2011, the company is currently active in nine markets including the United States, the United Kingdom, the Netherlands, Australia, Germany, Belgium, Canada, Austria and Switzerland.
foodpanda operates the leading emerging economies online marketplace for food delivery and takeaway. Effective December 31, 2016, foodpanda was sold to Delivery Hero, thus, ceasing to represent an operating segment starting from 2017.
GFG is a leading online fashion destination focused on emerging markets. The company is active in 24 countries across four continents and operates through four branded platforms, uniting the leading fashion eCommerce companies Lamoda (Russia/CIS), Dafiti (Brazil/Latin America), Namshi (Middle
Rocket Internet SE
Notes to the Consolidated Financial Statements 2016 (IFRS)
29
East) and Zalora (Southeast Asia) including The Iconic (Australia and New Zealand). During 2016, the segment GFG excludes Jabong (operations in India), which was disposed of in August 2016.
Jumia is a leading online shopping portal in Africa. Customers across the continent can shop from the widest assortment of high quality products with everything from fashion, consumer electronics and home appliances to beauty products on offer at affordable prices. The company’s goal is to offer a platform for merchants, brands and SMEs (small and medium-sized entities) to connect and transact with African consumers.
Home & Living includes the business of Home24, a leading online retailer for home and living products operating in Europe and Latin America, and Westwing, an online retailer offering a frequently changing, curated selection of home design products in Europe, CIS and Latin America.
Historically, the Group reported the segment General Merchandise which included operations of Linio, Jumia (AEH) and Lazada.
In April 2016, Lazada was partially sold to Alibaba Group Services Limited, Hong Kong (Alibaba) and ceased to represent an operating segment due to the loss of significant influence from thereon. Accordingly, Lazada was only presented as part of the reportable segment General Merchandise until its partial disposal in April 2016.
Starting from July 1, 2016 Linio ceased to represent an operating segment, due to the loss of significant influence as a result of non-participation of Rocket Internet SE in the most recent financing round. Accordingly, in the Group’s consolidated financial statements for 2016 Linio was only presented as part of the reportable segment General Merchandise until July 1, 2016.
On August 30, 2016 the former operating segment Jumia, that represented the general merchandise business by the Group under Africa eCommerce Holding GmbH (AEH), was merged into Africa Internet Holding GmbH (AIG). Starting from September 30, 2016 the performance of the entire African operations (Jumia general merchandise businesses together with other marketplace and classifieds businesses in Africa) is reviewed at AIG-level solely and is subsumed within the new operating segment Jumia. For comparability the financial information of the former operating segment Jumia for 2015 was reclassified from the segment General Merchandise into the new reportable segment Jumia.
Rocket Internet’s available-for-sale investment in Delivery Hero (DH) is not considered as an operating segment due to Rocket Internet’s restriction to exercise significant influence, i.e. to affect the resource allocation, as well as due to its inability to obtain adequate financial information (see also Significant Accounting Judgements in Note 4). Accordingly, DH is not presented within the segment report.
The segment Other includes the business activities of Rocket Internet SE (headquarters), the joint ventures Asia Internet Holding and Middle East Internet Holding, as well as advanced businesses such as Lendico, Helpling, Traveloka, Global Savings Group, Zanui, Spotcap and Carspring, which are not separately reportable. Rocket Internet SE renders a range of IT, marketing and other services, in particular commercial and technical consulting services to its network companies and holds cash and cash equivalents for new investments and funding purposes. In 2016, Rocket Internet SE generated service revenue from not consolidated companies of EUR 20,605 thousand (previous year EUR 27,870 thousand) which is included in the revenue of the segment “Other”. Cash and cash equivalents held by Rocket Internet SE as of December 31, 2016 amount to EUR 653,572 thousand (previous year EUR 1,720,010 thousand). In addition, subsidiaries which do not meet the definition of an operating segment have cash and cash equivalents of EUR 910,876 thousand (previous year EUR 38,879 thousand). These cash and cash equivalents are included in the "Reconciliation" column.
Despite not having control of some of its network companies throughout 2016 and 2015, the chief operating decision maker of the Group reviewed the operating results of the respective operating segments on a 100% basis (i.e. 100% of the revenues, expenses and segment results and cash and cash equivalents) to make decisions about resource allocation and to assess performance. Accordingly, in order to arrive at total consolidated revenues and expenses for 2016 and 2015, the “reconciliation” column reflects, besides consolidation adjustments for inter-segment business relations, adjustments between aggregated segment revenue and expenses and consolidated revenue and expenses.
Rocket Internet SE
Notes to the Consolidated Financial Statements 2016 (IFRS)
30
Segment information for the reportable segments for the year ended December 31, 2016 is set out
below (in EUR thousand):
Hello Fresh
food-panda
GFG Jumia Home & Living
General Merchan-
dise Other
Re-conciliation
2
Total
2016
Revenue 596,992 50,572 1,023,081 84,364 494,178 89,703 209,607 -2,498,141 50,356
EBITDA -86,151 -70,566 -145,980 -104,512 -64,093 -94,023 -58,482 58,464 -565,344
Cash and cash equivalents
3
57,455 n/a 244,212 29,495 51,878 n/a 851,982 166,000 1,401,022
Segment information for the reportable segments for the year ended December 31, 2015 is set out
below (in EUR thousand):
Hello Fresh
food-panda
GFG Jumia Home & Living
General Merchan-
dise Other
Re- conciliation
4
Total
2015
Revenue 304,952 31,544 930,082 134,639 452,844 315,297 200,969 -2,241,995 128,332
EBITDA -109,506 -108,663 -318,613 -118,862 -131,693 -357,054 -229,456 1,173,046 -200,801
Cash and cash equivalents
5
109,235 97,906 75,181 9,477 64,609 101,474 1,901,486 -600,479 1,758,889
Revenues for each country for which the revenues are material are reported separately as follows:
Revenue by country In EUR thousand
2016 2015
Germany 22,695 32,913
United Kingdom 12,761 4,115
Brazil 1,585 67,408
Other 13,315 23,896
Total 50,356 128,332
Revenues are attributed to countries on the basis of the customer’s location.
2 The reconciliation column includes the elimination of EUR 2,511,088 thousand revenues and adjustments of EBITDA of EUR 700,677 thousand from non-consolidated network companies. Moreover, the effects from consolidation are included in the reconciliation column.
3 Except for cash and cash equivalents included in the assets held for sale amounting to EUR 632 thousand in Rocket Internet Group.
4 The reconciliation column includes the elimination of EUR 2,272,242 thousand revenues and adjustments of EBITDA of EUR 1,304,484 thousand from non-consolidated network companies. Moreover, the effects from consolidation are included in the reconciliation column.
5 Except for cash and cash equivalents included in the assets held for sale amounting to EUR 9,710 thousand in Rocket Internet Group as well as to EUR 1,466 thousand in the Fashion segment.
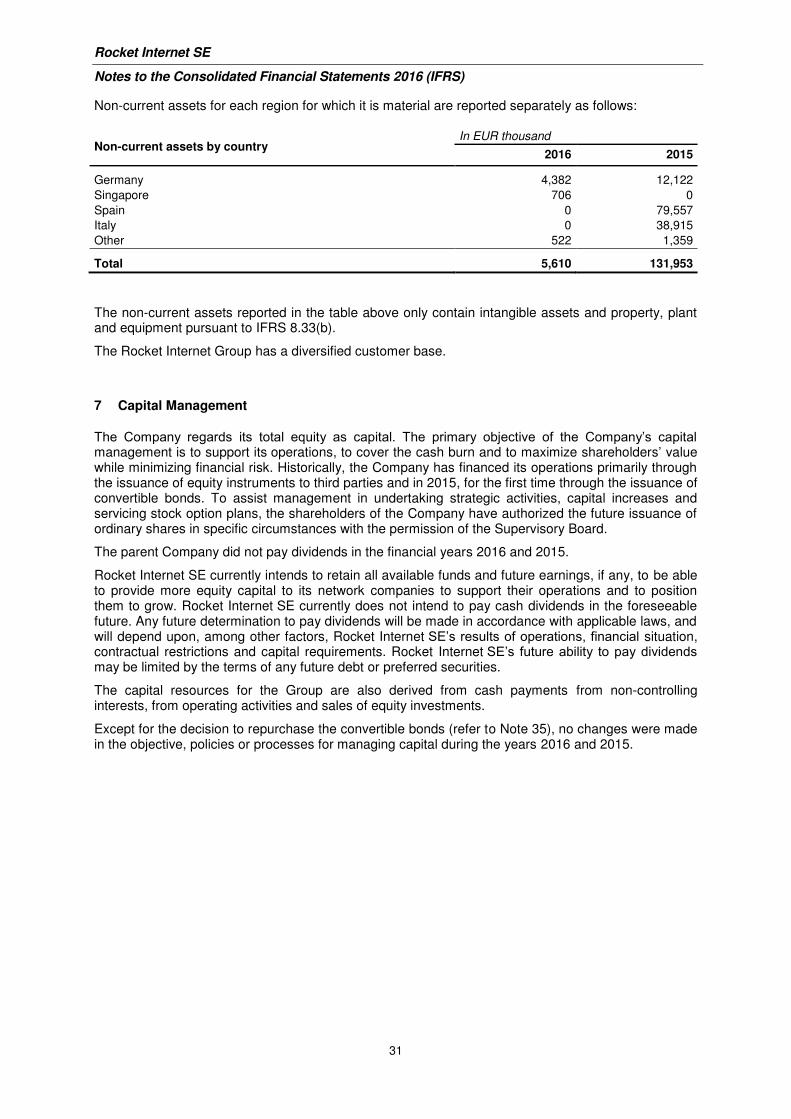
Rocket Internet SE
Notes to the Consolidated Financial Statements 2016 (IFRS)
31
Non-current assets for each region for which it is material are reported separately as follows:
Non-current assets by country In EUR thousand
2016 2015
Germany 4,382 12,122
Singapore 706 0
Spain 0 79,557
Italy 0 38,915
Other 522 1,359
Total 5,610 131,953
The non-current assets reported in the table above only contain intangible assets and property, plant and equipment pursuant to IFRS 8.33(b).
The Rocket Internet Group has a diversified customer base.
7 Capital Management
The Company regards its total equity as capital. The primary objective of the Company’s capital management is to support its operations, to cover the cash burn and to maximize shareholders’ value while minimizing financial risk. Historically, the Company has financed its operations primarily through the issuance of equity instruments to third parties and in 2015, for the first time through the issuance of convertible bonds. To assist management in undertaking strategic activities, capital increases and servicing stock option plans, the shareholders of the Company have authorized the future issuance of ordinary shares in specific circumstances with the permission of the Supervisory Board.
The parent Company did not pay dividends in the financial years 2016 and 2015.
Rocket Internet SE currently intends to retain all available funds and future earnings, if any, to be able to provide more equity capital to its network companies to support their operations and to position them to grow. Rocket Internet SE currently does not intend to pay cash dividends in the foreseeable future. Any future determination to pay dividends will be made in accordance with applicable laws, and will depend upon, among other factors, Rocket Internet SE’s results of operations, financial situation, contractual restrictions and capital requirements. Rocket Internet SE’s future ability to pay dividends may be limited by the terms of any future debt or preferred securities.
The capital resources for the Group are also derived from cash payments from non-controlling interests, from operating activities and sales of equity investments.
Except for the decision to repurchase the convertible bonds (refer to Note 35), no changes were made in the objective, policies or processes for managing capital during the years 2016 and 2015.
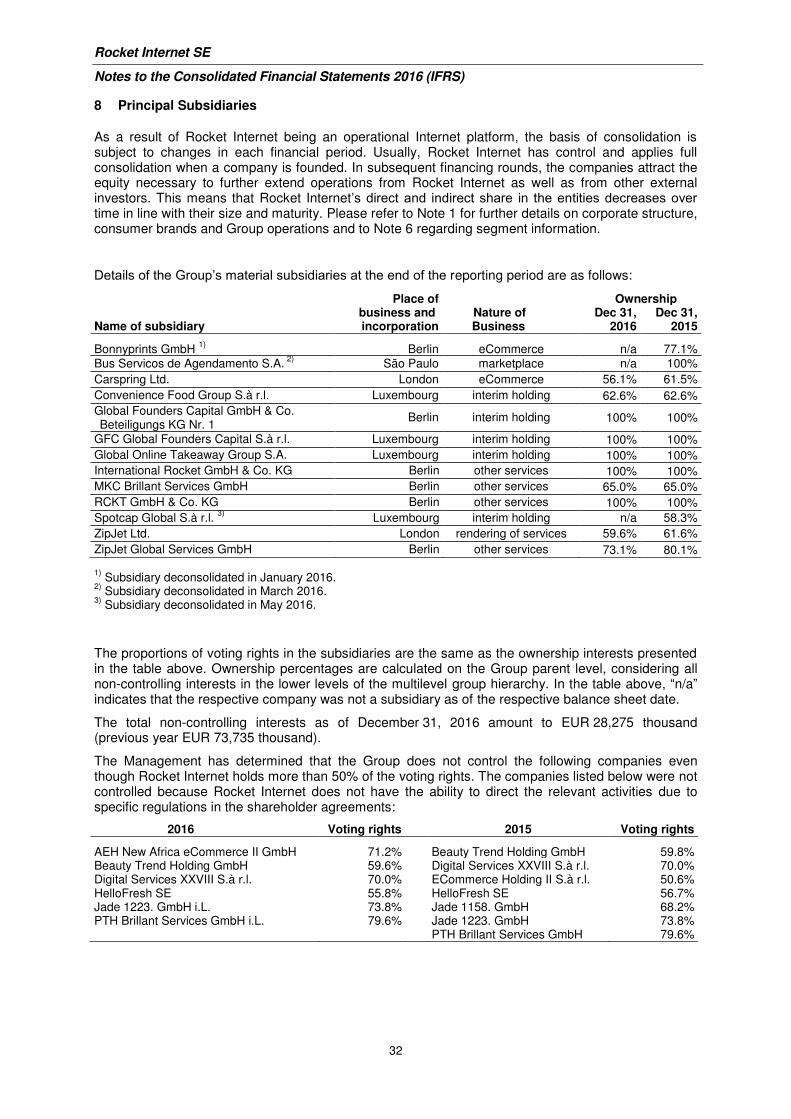
Rocket Internet SE
Notes to the Consolidated Financial Statements 2016 (IFRS)
32
8 Principal Subsidiaries
As a result of Rocket Internet being an operational Internet platform, the basis of consolidation is subject to changes in each financial period. Usually, Rocket Internet has control and applies full consolidation when a company is founded. In subsequent financing rounds, the companies attract the equity necessary to further extend operations from Rocket Internet as well as from other external investors. This means that Rocket Internet’s direct and indirect share in the entities decreases over time in line with their size and maturity. Please refer to Note 1 for further details on corporate structure, consumer brands and Group operations and to Note 6 regarding segment information.
Details of the Group’s material subsidiaries at the end of the reporting period are as follows:
Place of Ownership
Name of subsidiary business and incorporation
Nature of Business
Dec 31, 2016
Dec 31, 2015
Bonnyprints GmbH 1)
Berlin eCommerce n/a 77.1%
Bus Servicos de Agendamento S.A. 2)
São Paulo marketplace n/a 100%
Carspring Ltd. London eCommerce 56.1% 61.5%
Convenience Food Group S.à r.l. Luxembourg interim holding 62.6% 62.6%
Global Founders Capital GmbH & Co. Beteiligungs KG Nr. 1
Berlin interim holding 100% 100%
GFC Global Founders Capital S.à r.l. Luxembourg interim holding 100% 100%
Global Online Takeaway Group S.A. Luxembourg interim holding 100% 100%
International Rocket GmbH & Co. KG Berlin other services 100% 100%
MKC Brillant Services GmbH Berlin other services 65.0% 65.0%
RCKT GmbH & Co. KG Berlin other services 100% 100%
Spotcap Global S.à r.l. 3)
Luxembourg interim holding n/a 58.3%
ZipJet Ltd. London rendering of services 59.6% 61.6%
ZipJet Global Services GmbH Berlin other services 73.1% 80.1%
1) Subsidiary deconsolidated in January 2016.
2) Subsidiary deconsolidated in March 2016.
3) Subsidiary deconsolidated in May 2016.
The proportions of voting rights in the subsidiaries are the same as the ownership interests presented in the table above. Ownership percentages are calculated on the Group parent level, considering all non-controlling interests in the lower levels of the multilevel group hierarchy. In the table above, “n/a” indicates that the respective company was not a subsidiary as of the respective balance sheet date.
The total non-controlling interests as of December 31, 2016 amount to EUR 28,275 thousand (previous year EUR 73,735 thousand).
The Management has determined that the Group does not control the following companies even though Rocket Internet holds more than 50% of the voting rights. The companies listed below were not controlled because Rocket Internet does not have the ability to direct the relevant activities due to specific regulations in the shareholder agreements:
2016 Voting rights 2015 Voting rights
AEH New Africa eCommerce II GmbH 71.2% Beauty Trend Holding GmbH 59.8% Beauty Trend Holding GmbH 59.6% Digital Services XXVIII S.à r.l. 70.0% Digital Services XXVIII S.à r.l. 70.0% ECommerce Holding II S.à r.l. 50.6% HelloFresh SE 55.8% HelloFresh SE 56.7% Jade 1223. GmbH i.L. 73.8% Jade 1158. GmbH 68.2% PTH Brillant Services GmbH i.L. 79.6% Jade 1223. GmbH 73.8% PTH Brillant Services GmbH 79.6%
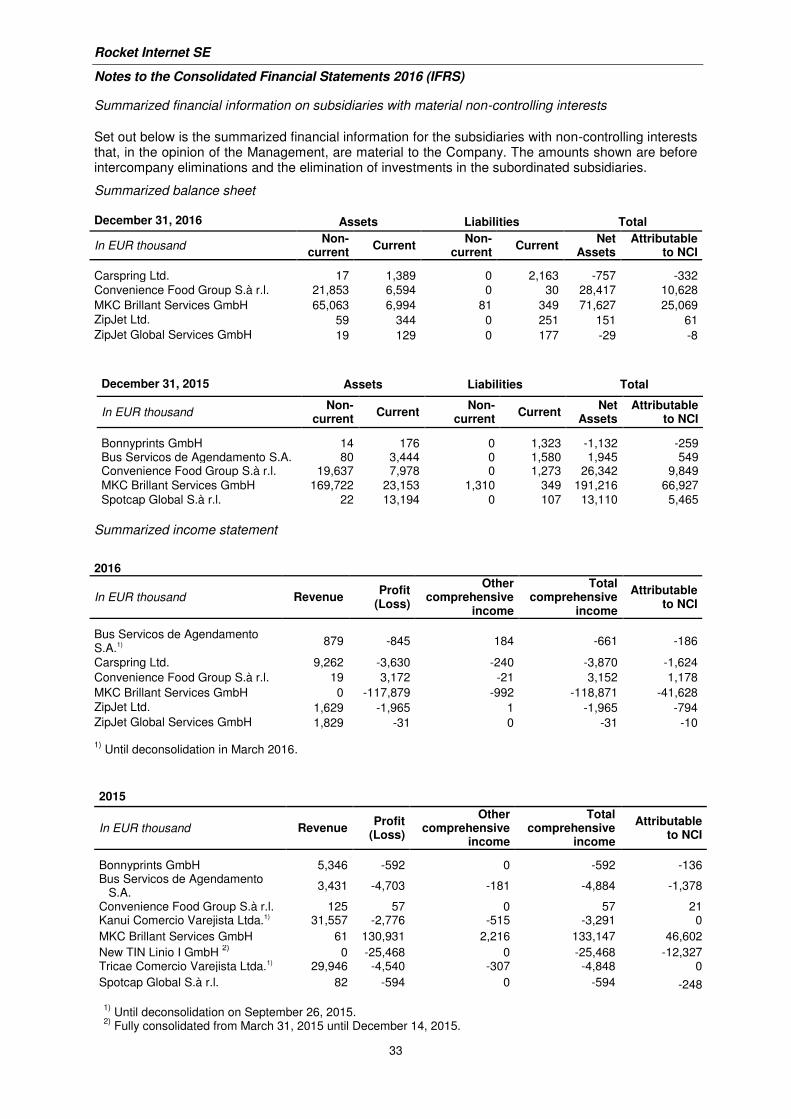
Rocket Internet SE
Notes to the Consolidated Financial Statements 2016 (IFRS)
33
Summarized financial information on subsidiaries with material non-controlling interests
Set out below is the summarized financial information for the subsidiaries with non-controlling interests that, in the opinion of the Management, are material to the Company. The amounts shown are before intercompany eliminations and the elimination of investments in the subordinated subsidiaries.
Summarized balance sheet December 31, 2016
Assets Liabilities Total
In EUR thousand Non-
current Current
Non-current
Current Net
Assets Attributable
to NCI
Carspring Ltd. 17 1,389 0 2,163 -757 -332
Convenience Food Group S.à r.l. 21,853 6,594 0 30 28,417 10,628
MKC Brillant Services GmbH 65,063 6,994 81 349 71,627 25,069
ZipJet Ltd. 59 344 0 251 151 61
ZipJet Global Services GmbH 19 129 0 177 -29 -8
December 31, 2015
Assets Liabilities Total
In EUR thousand Non-
current Current
Non-current
Current Net
Assets Attributable
to NCI
Bonnyprints GmbH 14 176 0 1,323 -1,132 -259 Bus Servicos de Agendamento S.A. 80 3,444 0 1,580 1,945 549 Convenience Food Group S.à r.l. 19,637 7,978 0 1,273 26,342 9,849
MKC Brillant Services GmbH 169,722 23,153 1,310 349 191,216 66,927
Spotcap Global S.à r.l. 22 13,194 0 107 13,110 5,465
Summarized income statement
2016
In EUR thousand Revenue Profit
(Loss)
Other comprehensive
income
Total comprehensive
income
Attributable to NCI
Bus Servicos de Agendamento S.A.1)
879 -845 184 -661 -186
Carspring Ltd. 9,262 -3,630 -240 -3,870 -1,624
Convenience Food Group S.à r.l. 19 3,172 -21 3,152 1,178
MKC Brillant Services GmbH 0 -117,879 -992 -118,871 -41,628
ZipJet Ltd. 1,629 -1,965 1 -1,965 -794
ZipJet Global Services GmbH 1,829 -31 0 -31 -10 1)
Until deconsolidation in March 2016.
2015
In EUR thousand Revenue Profit
(Loss)
Other comprehensive
income
Total comprehensive
income
Attributable to NCI
Bonnyprints GmbH 5,346 -592 0 -592 -136 Bus Servicos de Agendamento
S.A. 3,431 -4,703 -181 -4,884 -1,378
Convenience Food Group S.à r.l. 125 57 0 57 21 Kanui Comercio Varejista Ltda.1) 31,557 -2,776 -515 -3,291 0
MKC Brillant Services GmbH 61 130,931 2,216 133,147 46,602
New TIN Linio I GmbH 2)
0 -25,468 0 -25,468 -12,327 Tricae Comercio Varejista Ltda.1) 29,946 -4,540 -307 -4,848 0
Spotcap Global S.à r.l. 82 -594 0 -594 -248
1) Until deconsolidation on September 26, 2015.
2) Fully consolidated from March 31, 2015 until December 14, 2015.
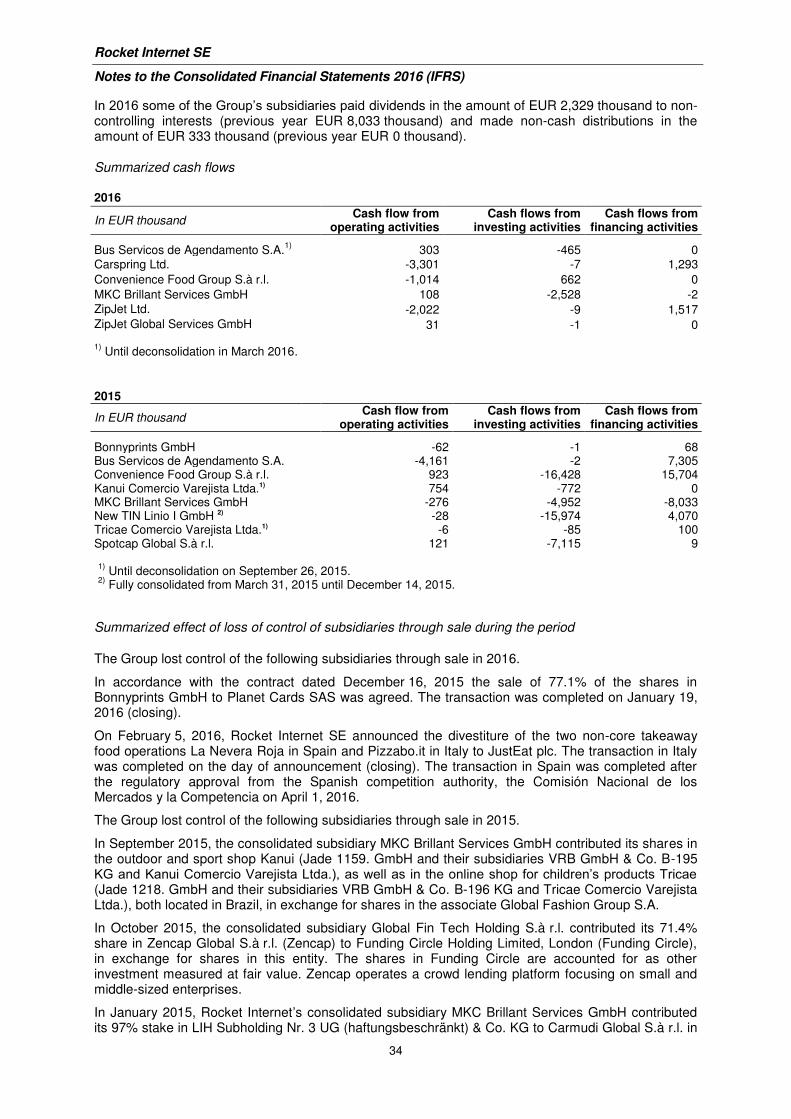
Rocket Internet SE
Notes to the Consolidated Financial Statements 2016 (IFRS)
34
In 2016 some of the Group’s subsidiaries paid dividends in the amount of EUR 2,329 thousand to non-controlling interests (previous year EUR 8,033 thousand) and made non-cash distributions in the amount of EUR 333 thousand (previous year EUR 0 thousand).
Summarized cash flows
2016
In EUR thousand Cash flow from
operating activities Cash flows from
investing activities Cash flows from
financing activities
Bus Servicos de Agendamento S.A.1)
303 -465 0
Carspring Ltd. -3,301 -7 1,293
Convenience Food Group S.à r.l. -1,014 662 0
MKC Brillant Services GmbH 108 -2,528 -2
ZipJet Ltd. -2,022 -9 1,517
ZipJet Global Services GmbH 31 -1 0
1) Until deconsolidation in March 2016.
2015
In EUR thousand Cash flow from
operating activities Cash flows from
investing activities Cash flows from
financing activities
Bonnyprints GmbH -62 -1 68 Bus Servicos de Agendamento S.A. -4,161 -2 7,305 Convenience Food Group S.à r.l. 923 -16,428 15,704 Kanui Comercio Varejista Ltda.1) 754 -772 0 MKC Brillant Services GmbH -276 -4,952 -8,033 New TIN Linio I GmbH 2) -28 -15,974 4,070 Tricae Comercio Varejista Ltda.1) -6 -85 100 Spotcap Global S.à r.l. 121 -7,115 9 1)
Until deconsolidation on September 26, 2015. 2)
Fully consolidated from March 31, 2015 until December 14, 2015.
Summarized effect of loss of control of subsidiaries through sale during the period
The Group lost control of the following subsidiaries through sale in 2016.
In accordance with the contract dated December 16, 2015 the sale of 77.1% of the shares in Bonnyprints GmbH to Planet Cards SAS was agreed. The transaction was completed on January 19, 2016 (closing).
On February 5, 2016, Rocket Internet SE announced the divestiture of the two non-core takeaway food operations La Nevera Roja in Spain and Pizzabo.it in Italy to JustEat plc. The transaction in Italy was completed on the day of announcement (closing). The transaction in Spain was completed after the regulatory approval from the Spanish competition authority, the Comisión Nacional de los Mercados y la Competencia on April 1, 2016.
The Group lost control of the following subsidiaries through sale in 2015.
In September 2015, the consolidated subsidiary MKC Brillant Services GmbH contributed its shares in the outdoor and sport shop Kanui (Jade 1159. GmbH and their subsidiaries VRB GmbH & Co. B-195 KG and Kanui Comercio Varejista Ltda.), as well as in the online shop for children’s products Tricae (Jade 1218. GmbH and their subsidiaries VRB GmbH & Co. B-196 KG and Tricae Comercio Varejista Ltda.), both located in Brazil, in exchange for shares in the associate Global Fashion Group S.A.
In October 2015, the consolidated subsidiary Global Fin Tech Holding S.à r.l. contributed its 71.4% share in Zencap Global S.à r.l. (Zencap) to Funding Circle Holding Limited, London (Funding Circle), in exchange for shares in this entity. The shares in Funding Circle are accounted for as other investment measured at fair value. Zencap operates a crowd lending platform focusing on small and middle-sized enterprises.
In January 2015, Rocket Internet’s consolidated subsidiary MKC Brillant Services GmbH contributed its 97% stake in LIH Subholding Nr. 3 UG (haftungsbeschränkt) & Co. KG to Carmudi Global S.à r.l. in
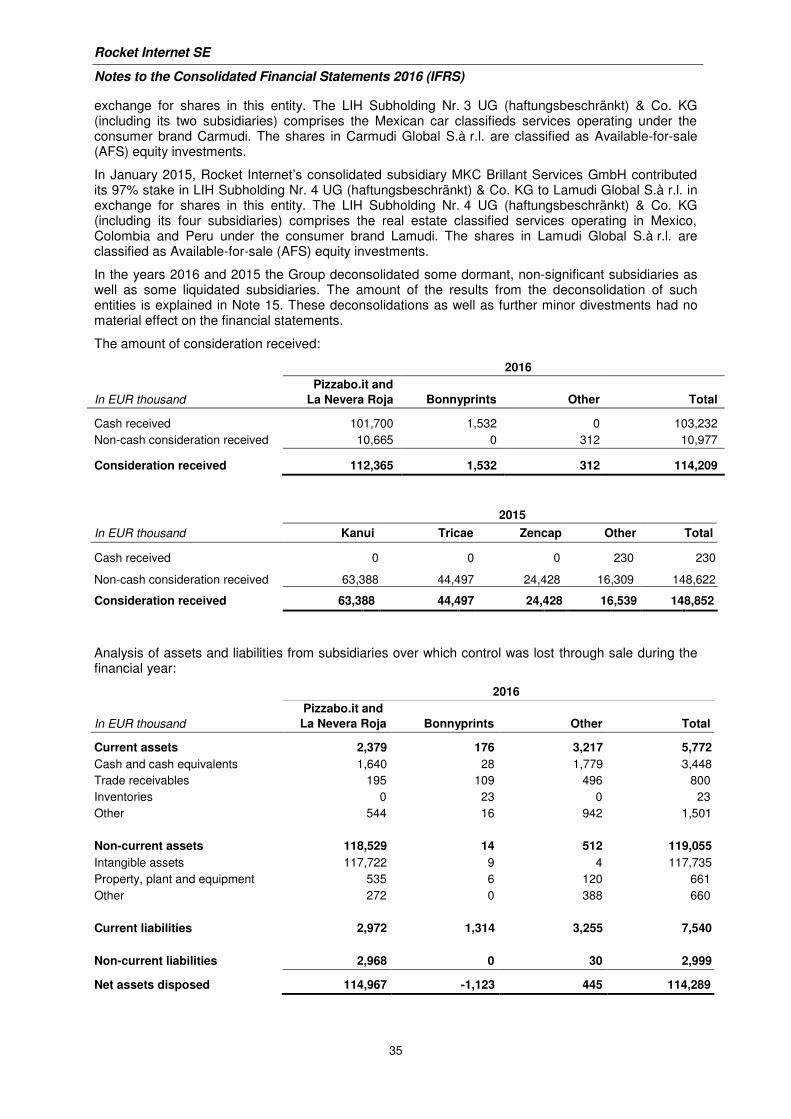
Rocket Internet SE
Notes to the Consolidated Financial Statements 2016 (IFRS)
35
exchange for shares in this entity. The LIH Subholding Nr. 3 UG (haftungsbeschränkt) & Co. KG (including its two subsidiaries) comprises the Mexican car classifieds services operating under the consumer brand Carmudi. The shares in Carmudi Global S.à r.l. are classified as Available-for-sale (AFS) equity investments.
In January 2015, Rocket Internet’s consolidated subsidiary MKC Brillant Services GmbH contributed its 97% stake in LIH Subholding Nr. 4 UG (haftungsbeschränkt) & Co. KG to Lamudi Global S.à r.l. in exchange for shares in this entity. The LIH Subholding Nr. 4 UG (haftungsbeschränkt) & Co. KG (including its four subsidiaries) comprises the real estate classified services operating in Mexico, Colombia and Peru under the consumer brand Lamudi. The shares in Lamudi Global S.à r.l. are classified as Available-for-sale (AFS) equity investments.
In the years 2016 and 2015 the Group deconsolidated some dormant, non-significant subsidiaries as well as some liquidated subsidiaries. The amount of the results from the deconsolidation of such entities is explained in Note 15. These deconsolidations as well as further minor divestments had no material effect on the financial statements.
The amount of consideration received:
2016
In EUR thousand
Pizzabo.it and
La Nevera Roja Bonnyprints Other Total
Cash received 101,700 1,532 0 103,232
Non-cash consideration received 10,665 0 312 10,977
Consideration received 112,365 1,532 312 114,209
2015
In EUR thousand Kanui Tricae Zencap Other Total
Cash received 0 0 0 230 230
Non-cash consideration received 63,388 44,497 24,428 16,309 148,622
Consideration received 63,388 44,497 24,428 16,539 148,852
Analysis of assets and liabilities from subsidiaries over which control was lost through sale during the financial year:
2016
In EUR thousand
Pizzabo.it and
La Nevera Roja Bonnyprints Other Total
Current assets 2,379 176 3,217 5,772
Cash and cash equivalents 1,640 28 1,779 3,448
Trade receivables 195 109 496 800
Inventories 0 23 0 23
Other 544 16 942 1,501
Non-current assets 118,529 14 512 119,055
Intangible assets 117,722 9 4 117,735
Property, plant and equipment 535 6 120 661
Other 272 0 388 660
Current liabilities 2,972 1,314 3,255 7,540
Non-current liabilities 2,968 0 30 2,999
Net assets disposed 114,967 -1,123 445 114,289
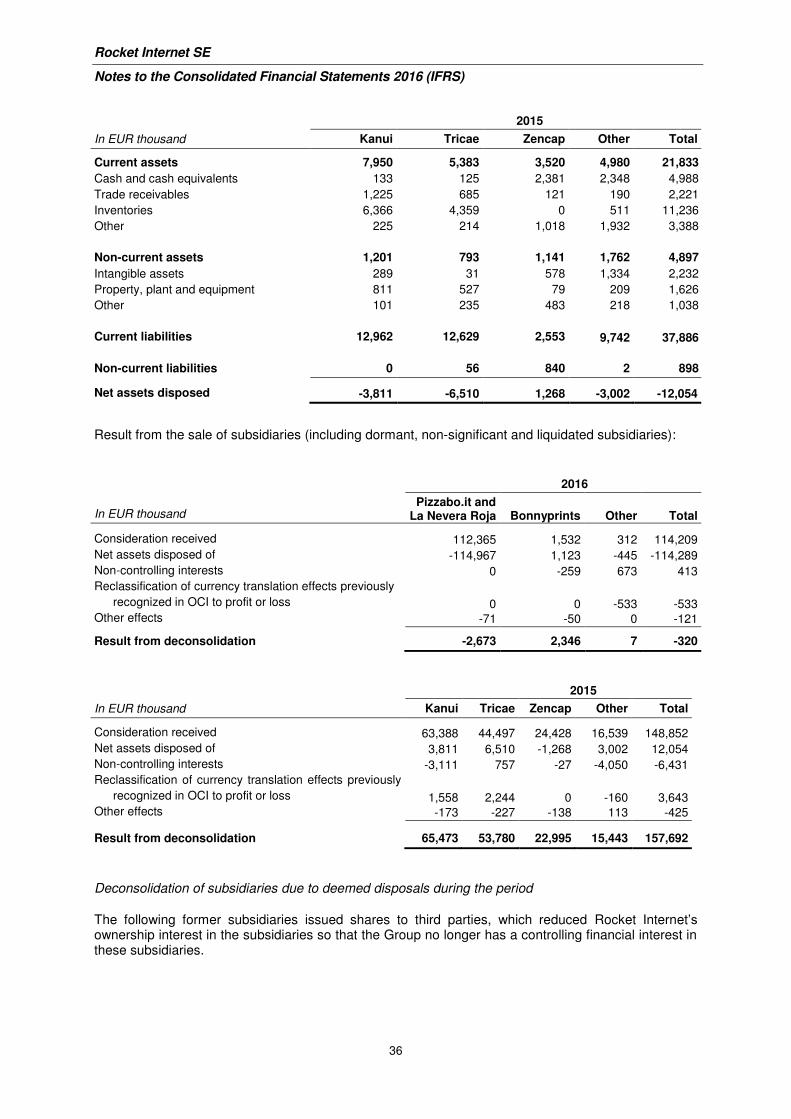
Rocket Internet SE
Notes to the Consolidated Financial Statements 2016 (IFRS)
36
2015
In EUR thousand Kanui Tricae Zencap Other Total
Current assets 7,950 5,383 3,520 4,980 21,833
Cash and cash equivalents 133 125 2,381 2,348 4,988
Trade receivables 1,225 685 121 190 2,221
Inventories 6,366 4,359 0 511 11,236
Other 225 214 1,018 1,932 3,388
Non-current assets 1,201 793 1,141 1,762 4,897
Intangible assets 289 31 578 1,334 2,232
Property, plant and equipment 811 527 79 209 1,626
Other 101 235 483 218 1,038
Current liabilities 12,962 12,629 2,553 9,742 37,886
Non-current liabilities 0 56 840 2 898
Net assets disposed -3,811 -6,510 1,268 -3,002 -12,054
Result from the sale of subsidiaries (including dormant, non-significant and liquidated subsidiaries):
2016
In EUR thousand Pizzabo.it and
La Nevera Roja Bonnyprints Other Total
Consideration received 112,365 1,532 312 114,209
Net assets disposed of -114,967 1,123 -445 -114,289
Non-controlling interests 0 -259 673 413
Reclassification of currency translation effects previously
recognized in OCI to profit or loss 0 0 -533 -533 Other effects -71 -50 0 -121
Result from deconsolidation -2,673 2,346 7 -320
2015
In EUR thousand Kanui Tricae Zencap Other Total
Consideration received 63,388 44,497 24,428 16,539 148,852
Net assets disposed of 3,811 6,510 -1,268 3,002 12,054
Non-controlling interests -3,111 757 -27 -4,050 -6,431
Reclassification of currency translation effects previously
recognized in OCI to profit or loss 1,558 2,244 0 -160 3,643 Other effects -173 -227 -138 113 -425
Result from deconsolidation 65,473 53,780 22,995 15,443 157,692
Deconsolidation of subsidiaries due to deemed disposals during the period
The following former subsidiaries issued shares to third parties, which reduced Rocket Internet’s ownership interest in the subsidiaries so that the Group no longer has a controlling financial interest in these subsidiaries.
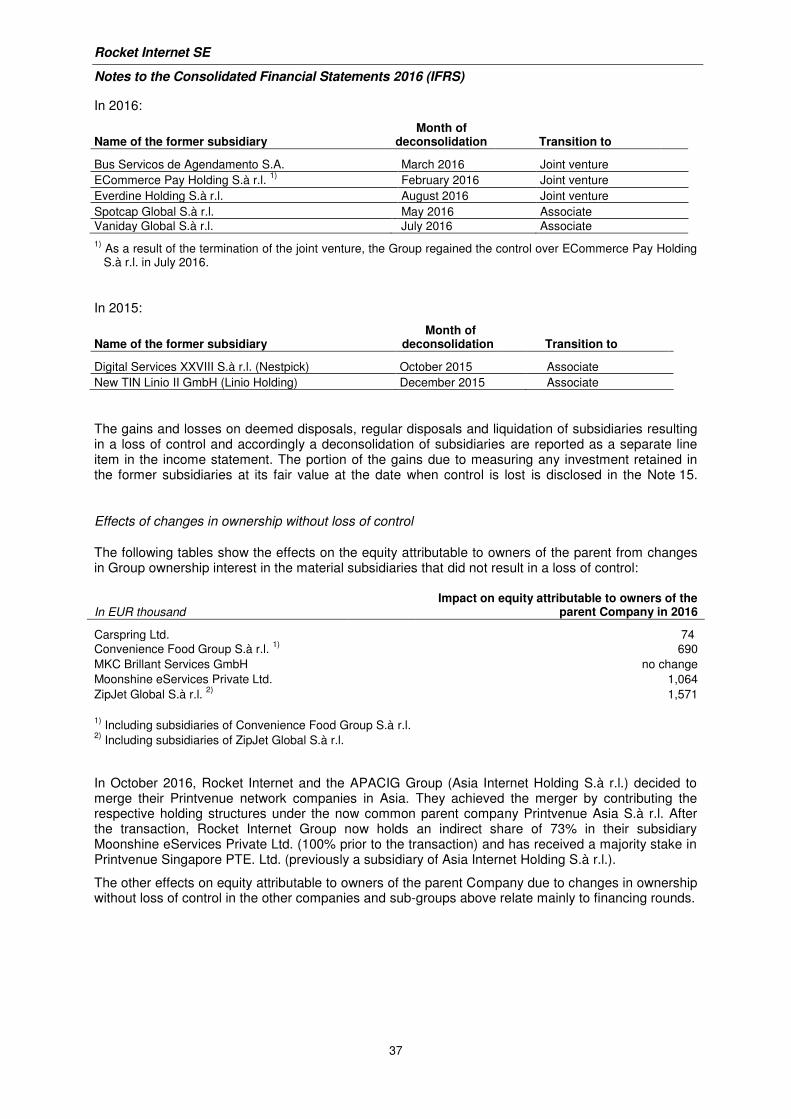
Rocket Internet SE
Notes to the Consolidated Financial Statements 2016 (IFRS)
37
In 2016:
Name of the former subsidiary Month of
deconsolidation Transition to
Bus Servicos de Agendamento S.A. March 2016 Joint venture
ECommerce Pay Holding S.à r.l. 1)
February 2016 Joint venture
Everdine Holding S.à r.l. August 2016 Joint venture
Spotcap Global S.à r.l. May 2016 Associate
Vaniday Global S.à r.l. July 2016 Associate
1) As a result of the termination of the joint venture, the Group regained the control over ECommerce Pay Holding S.à r.l. in July 2016.
In 2015:
Name of the former subsidiary Month of
deconsolidation Transition to
Digital Services XXVIII S.à r.l. (Nestpick) October 2015 Associate
New TIN Linio II GmbH (Linio Holding) December 2015 Associate
The gains and losses on deemed disposals, regular disposals and liquidation of subsidiaries resulting in a loss of control and accordingly a deconsolidation of subsidiaries are reported as a separate line item in the income statement. The portion of the gains due to measuring any investment retained in the former subsidiaries at its fair value at the date when control is lost is disclosed in the Note 15.
Effects of changes in ownership without loss of control
The following tables show the effects on the equity attributable to owners of the parent from changes in Group ownership interest in the material subsidiaries that did not result in a loss of control:
In EUR thousand Impact on equity attributable to owners of the
parent Company in 2016
Carspring Ltd. 74
Convenience Food Group S.à r.l. 1)
690
MKC Brillant Services GmbH no change
Moonshine eServices Private Ltd. 1,064
ZipJet Global S.à r.l. 2)
1,571
1)
Including subsidiaries of Convenience Food Group S.à r.l. 2)
Including subsidiaries of ZipJet Global S.à r.l.
In October 2016, Rocket Internet and the APACIG Group (Asia Internet Holding S.à r.l.) decided to merge their Printvenue network companies in Asia. They achieved the merger by contributing the respective holding structures under the now common parent company Printvenue Asia S.à r.l. After the transaction, Rocket Internet Group now holds an indirect share of 73% in their subsidiary Moonshine eServices Private Ltd. (100% prior to the transaction) and has received a majority stake in Printvenue Singapore PTE. Ltd. (previously a subsidiary of Asia Internet Holding S.à r.l.).
The other effects on equity attributable to owners of the parent Company due to changes in ownership without loss of control in the other companies and sub-groups above relate mainly to financing rounds.
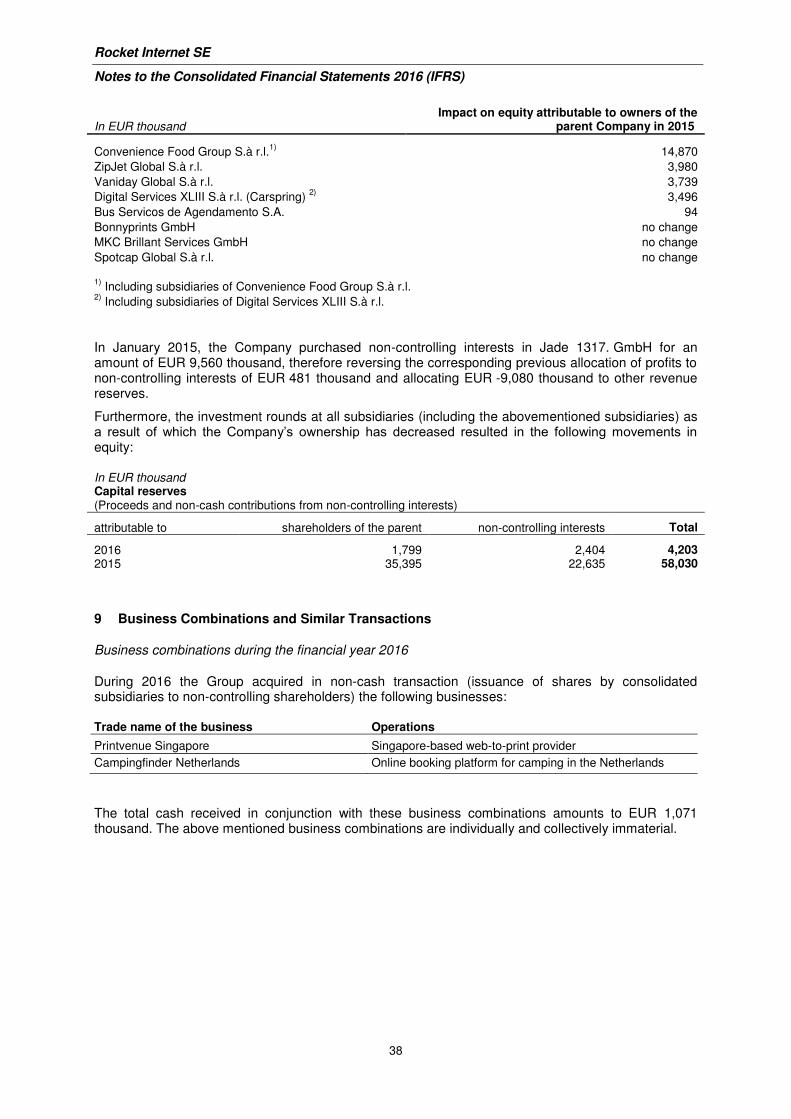
Rocket Internet SE
Notes to the Consolidated Financial Statements 2016 (IFRS)
38
In EUR thousand Impact on equity attributable to owners of the
parent Company in 2015
Convenience Food Group S.à r.l.1)
14,870
ZipJet Global S.à r.l. 3,980
Vaniday Global S.à r.l. 3,739
Digital Services XLIII S.à r.l. (Carspring) 2)
3,496
Bus Servicos de Agendamento S.A. 94
Bonnyprints GmbH no change
MKC Brillant Services GmbH no change
Spotcap Global S.à r.l. no change 1)
Including subsidiaries of Convenience Food Group S.à r.l. 2)
Including subsidiaries of Digital Services XLIII S.à r.l.
In January 2015, the Company purchased non-controlling interests in Jade 1317. GmbH for an amount of EUR 9,560 thousand, therefore reversing the corresponding previous allocation of profits to non-controlling interests of EUR 481 thousand and allocating EUR -9,080 thousand to other revenue reserves.
Furthermore, the investment rounds at all subsidiaries (including the abovementioned subsidiaries) as a result of which the Company’s ownership has decreased resulted in the following movements in equity:
In EUR thousand Capital reserves (Proceeds and non-cash contributions from non-controlling interests)
attributable to shareholders of the parent non-controlling interests Total
2016 1,799 2,404 4,203 2015 35,395 22,635 58,030
9 Business Combinations and Similar Transactions
Business combinations during the financial year 2016
During 2016 the Group acquired in non-cash transaction (issuance of shares by consolidated subsidiaries to non-controlling shareholders) the following businesses:
Trade name of the business Operations
Printvenue Singapore Singapore-based web-to-print provider
Campingfinder Netherlands Online booking platform for camping in the Netherlands
The total cash received in conjunction with these business combinations amounts to EUR 1,071 thousand. The above mentioned business combinations are individually and collectively immaterial.
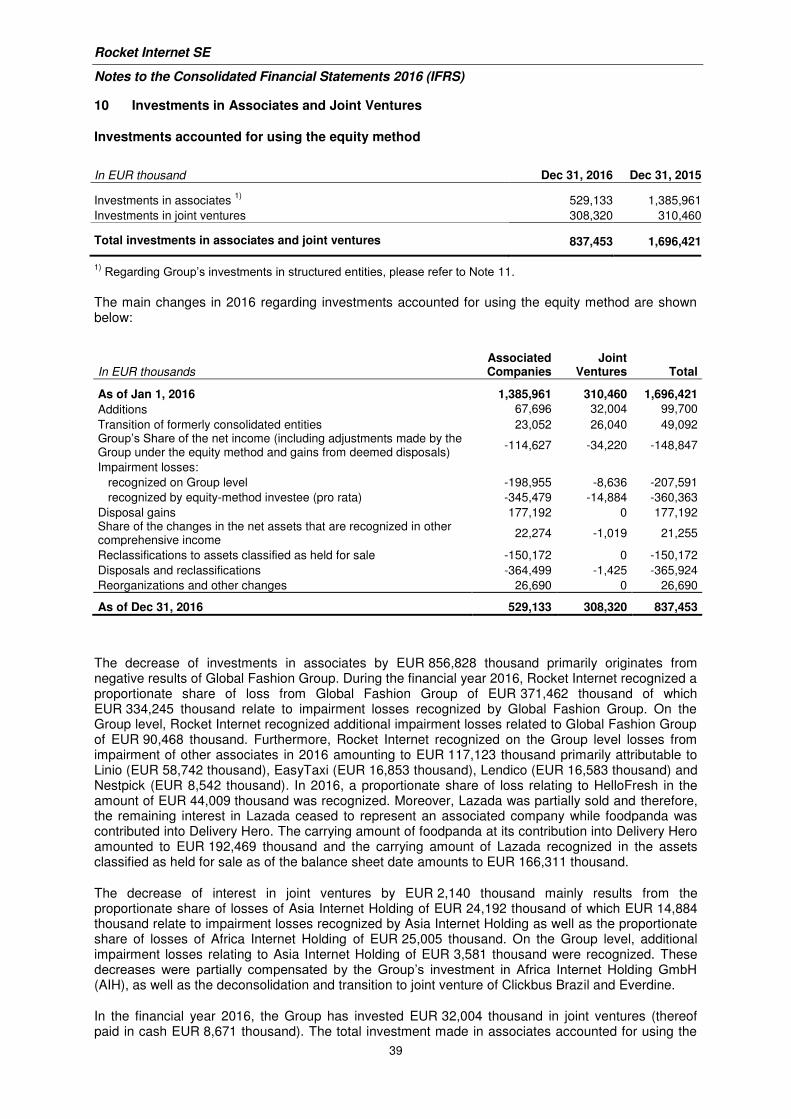
Rocket Internet SE
Notes to the Consolidated Financial Statements 2016 (IFRS)
39
10 Investments in Associates and Joint Ventures
Investments accounted for using the equity method
In EUR thousand Dec 31, 2016 Dec 31, 2015
Investments in associates 1)
529,133 1,385,961
Investments in joint ventures 308,320 310,460
Total investments in associates and joint ventures 837,453 1,696,421
1) Regarding Group’s investments in structured entities, please refer to Note 11.
The main changes in 2016 regarding investments accounted for using the equity method are shown below:
In EUR thousands Associated Companies
Joint Ventures Total
As of Jan 1, 2016 1,385,961 310,460 1,696,421
Additions 67,696 32,004 99,700
Transition of formerly consolidated entities 23,052 26,040 49,092 Group’s Share of the net income (including adjustments made by the Group under the equity method and gains from deemed disposals) -114,627 -34,220 -148,847
Impairment losses:
recognized on Group level -198,955 -8,636 -207,591
recognized by equity-method investee (pro rata) -345,479 -14,884 -360,363
Disposal gains 177,192 0 177,192 Share of the changes in the net assets that are recognized in other comprehensive income
22,274 -1,019 21,255
Reclassifications to assets classified as held for sale -150,172 0 -150,172
Disposals and reclassifications -364,499 -1,425 -365,924
Reorganizations and other changes 26,690 0 26,690
As of Dec 31, 2016 529,133 308,320 837,453
The decrease of investments in associates by EUR 856,828 thousand primarily originates from negative results of Global Fashion Group. During the financial year 2016, Rocket Internet recognized a proportionate share of loss from Global Fashion Group of EUR 371,462 thousand of which EUR 334,245 thousand relate to impairment losses recognized by Global Fashion Group. On the Group level, Rocket Internet recognized additional impairment losses related to Global Fashion Group of EUR 90,468 thousand. Furthermore, Rocket Internet recognized on the Group level losses from impairment of other associates in 2016 amounting to EUR 117,123 thousand primarily attributable to Linio (EUR 58,742 thousand), EasyTaxi (EUR 16,853 thousand), Lendico (EUR 16,583 thousand) and Nestpick (EUR 8,542 thousand). In 2016, a proportionate share of loss relating to HelloFresh in the amount of EUR 44,009 thousand was recognized. Moreover, Lazada was partially sold and therefore, the remaining interest in Lazada ceased to represent an associated company while foodpanda was contributed into Delivery Hero. The carrying amount of foodpanda at its contribution into Delivery Hero amounted to EUR 192,469 thousand and the carrying amount of Lazada recognized in the assets classified as held for sale as of the balance sheet date amounts to EUR 166,311 thousand.
The decrease of interest in joint ventures by EUR 2,140 thousand mainly results from the proportionate share of losses of Asia Internet Holding of EUR 24,192 thousand of which EUR 14,884 thousand relate to impairment losses recognized by Asia Internet Holding as well as the proportionate share of losses of Africa Internet Holding of EUR 25,005 thousand. On the Group level, additional impairment losses relating to Asia Internet Holding of EUR 3,581 thousand were recognized. These decreases were partially compensated by the Group’s investment in Africa Internet Holding GmbH (AIH), as well as the deconsolidation and transition to joint venture of Clickbus Brazil and Everdine.
In the financial year 2016, the Group has invested EUR 32,004 thousand in joint ventures (thereof paid in cash EUR 8,671 thousand). The total investment made in associates accounted for using the
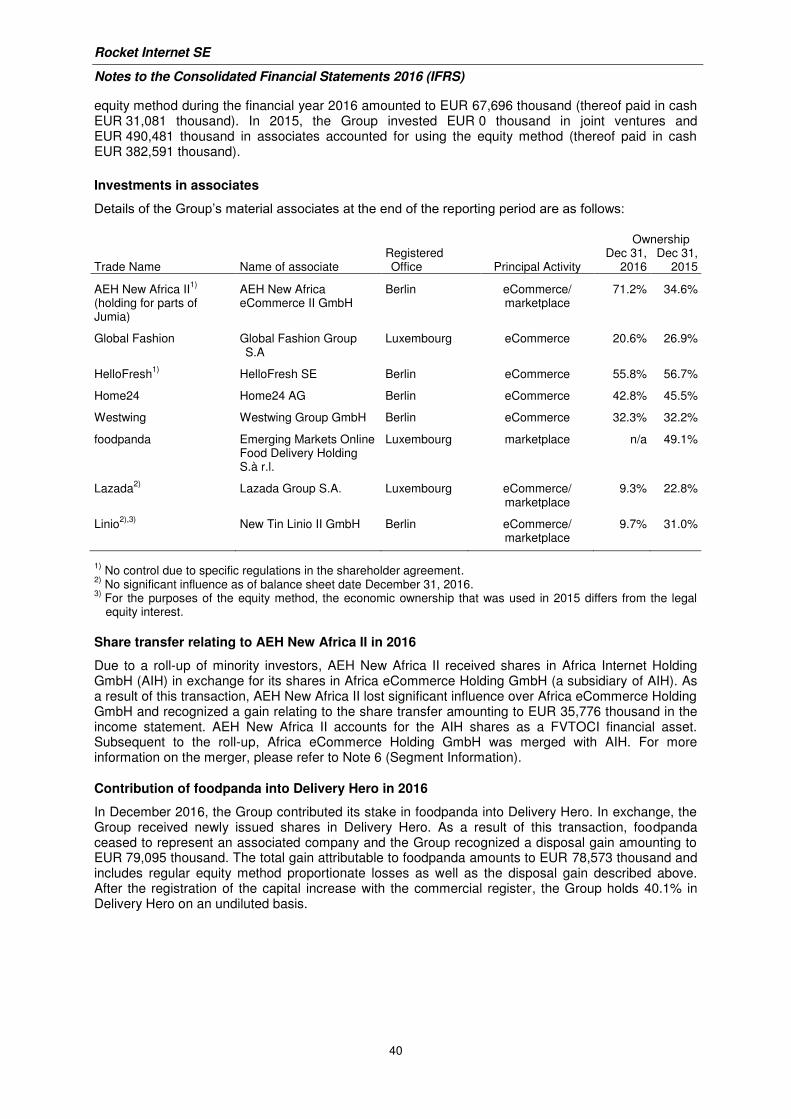
Rocket Internet SE
Notes to the Consolidated Financial Statements 2016 (IFRS)
40
equity method during the financial year 2016 amounted to EUR 67,696 thousand (thereof paid in cash EUR 31,081 thousand). In 2015, the Group invested EUR 0 thousand in joint ventures and EUR 490,481 thousand in associates accounted for using the equity method (thereof paid in cash EUR 382,591 thousand).
Investments in associates
Details of the Group’s material associates at the end of the reporting period are as follows:
Ownership
Trade Name Name of associate Registered Office Principal Activity
Dec 31, 2016
Dec 31, 2015
AEH New Africa II1)
(holding for parts of Jumia)
AEH New Africa eCommerce II GmbH
Berlin eCommerce/ marketplace
71.2% 34.6%
Global Fashion Global Fashion Group S.A
Luxembourg eCommerce 20.6% 26.9%
HelloFresh1)
HelloFresh SE Berlin eCommerce 55.8% 56.7%
Home24 Home24 AG Berlin eCommerce 42.8% 45.5%
Westwing Westwing Group GmbH Berlin eCommerce 32.3% 32.2%
foodpanda Emerging Markets Online Food Delivery Holding S.à r.l.
Luxembourg marketplace n/a 49.1%
Lazada2)
Lazada Group S.A. Luxembourg eCommerce/ marketplace
9.3% 22.8%
Linio2),3)
New Tin Linio II GmbH Berlin eCommerce/ marketplace
9.7% 31.0%
1)
No control due to specific regulations in the shareholder agreement. 2)
No significant influence as of balance sheet date December 31, 2016. 3)
For the purposes of the equity method, the economic ownership that was used in 2015 differs from the legal equity interest.
Share transfer relating to AEH New Africa II in 2016
Due to a roll-up of minority investors, AEH New Africa II received shares in Africa Internet Holding GmbH (AIH) in exchange for its shares in Africa eCommerce Holding GmbH (a subsidiary of AIH). As a result of this transaction, AEH New Africa II lost significant influence over Africa eCommerce Holding GmbH and recognized a gain relating to the share transfer amounting to EUR 35,776 thousand in the income statement. AEH New Africa II accounts for the AIH shares as a FVTOCI financial asset. Subsequent to the roll-up, Africa eCommerce Holding GmbH was merged with AIH. For more information on the merger, please refer to Note 6 (Segment Information).
Contribution of foodpanda into Delivery Hero in 2016
In December 2016, the Group contributed its stake in foodpanda into Delivery Hero. In exchange, the Group received newly issued shares in Delivery Hero. As a result of this transaction, foodpanda ceased to represent an associated company and the Group recognized a disposal gain amounting to EUR 79,095 thousand. The total gain attributable to foodpanda amounts to EUR 78,573 thousand and includes regular equity method proportionate losses as well as the disposal gain described above. After the registration of the capital increase with the commercial register, the Group holds 40.1% in Delivery Hero on an undiluted basis.
Rocket Internet SE
Notes to the Consolidated Financial Statements 2016 (IFRS)
41
Reorganization of Big Commerce in 2015
Prior to reorganization, the Linio and Lazada businesses were operated via the intermediate holding company TIN Brillant Services GmbH (associated company of Rocket Internet):
Associated company of Rocket Internet
Trade name of the associated company
Business operated by the associate prior to reorganization
TIN Brillant Services GmbH Big Commerce Linio and Lazada
During the financial year 2015, Rocket Internet together with co-investors dissolved Big Commerce and established the following holding entities, in which the two businesses are now operated separately:
Trade name of the associated company New holding entity after reorganization
Lazada Lazada Group S.A.
Linio New TIN Linio II GmbH
In the course of the reorganization, New TIN Linio II was split off from Big Commerce in the first quarter of 2015. Big Commerce recognized the split off as a distribution in kind through profit or loss (one-time effect) in accordance with IFRIC 17. As a result of the split off, fair value changes amounting to EUR 29,452 thousand which have previously been recognized in OCI have been recycled through profit or loss.
In the second quarter of 2015, Big Commerce was contributed into the new holding company Lazada Group S.A. In the context of this contribution, no one-time effects were recognized in profit or loss.
Summarized financial information
Summarized financial information in respect of the Group’s material associates is set out below. The summarized financial information below represents amounts shown in the associate’s financial statements and adjusted by the Group for equity accounting purposes. All of the material associated companies prepare consolidated financial information in accordance with IFRS. Summarized financial information is presented for both, the Groups direct investments in associates being operating network companies (e.g. Home24, HelloFresh, Westwing, foodpanda) as well as for associates being intermediate holding companies (e.g. AEH New Africa II, Big Commerce, Global Fashion). During the financial years 2015 and 2016, the intermediate holding companies did not fully consolidate all of their operating network companies for the whole period. Furthermore, the effects of legal reorganizations on the intermediate holding company level reflected in their statutory financial statements do not allow a direct reconciliation between segment information as presented in Note 6 and the summarized financial information provided below.
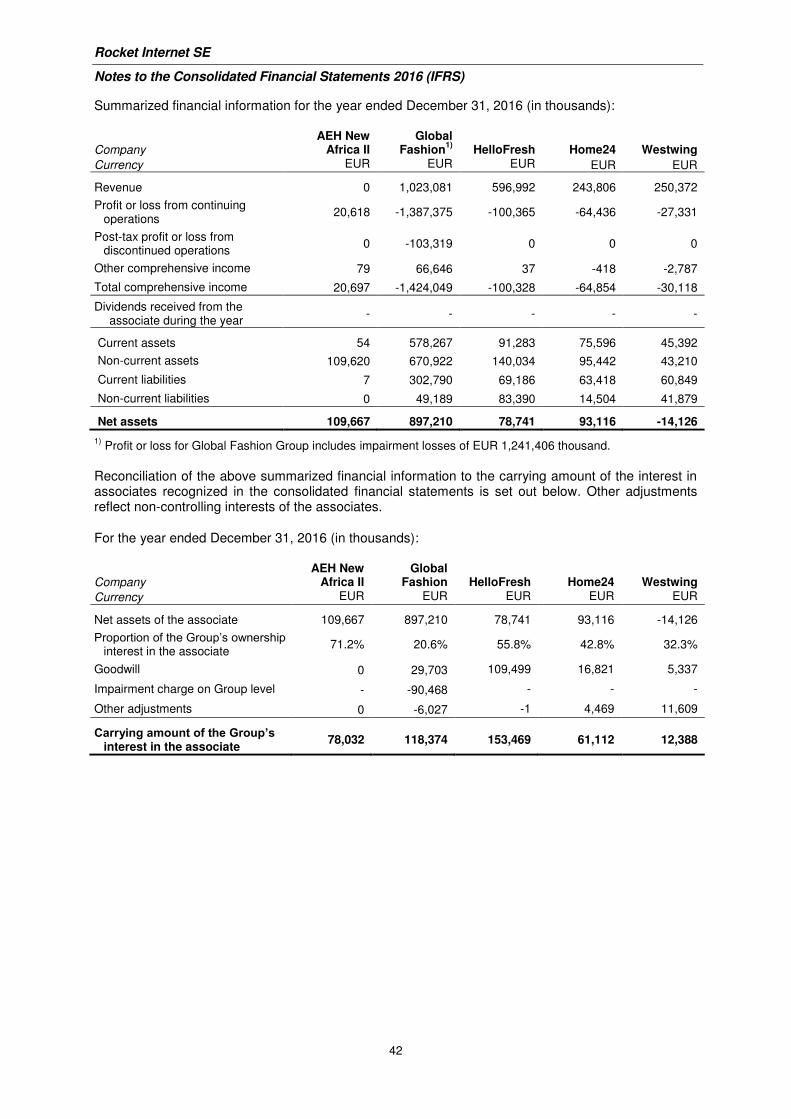
Rocket Internet SE
Notes to the Consolidated Financial Statements 2016 (IFRS)
42
Summarized financial information for the year ended December 31, 2016 (in thousands):
Company AEH New
Africa II Global
Fashion1)
HelloFresh Home24 Westwing
Currency EUR EUR EUR EUR EUR
Revenue 0 1,023,081 596,992 243,806 250,372
Profit or loss from continuing operations
20,618 -1,387,375 -100,365 -64,436 -27,331
Post-tax profit or loss from discontinued operations
0 -103,319 0 0 0
Other comprehensive income 79 66,646 37 -418 -2,787
Total comprehensive income 20,697 -1,424,049 -100,328 -64,854 -30,118
Dividends received from the associate during the year
- - - - -
Current assets 54 578,267 91,283 75,596 45,392
Non-current assets 109,620 670,922 140,034 95,442 43,210
Current liabilities 7 302,790 69,186 63,418 60,849
Non-current liabilities 0 49,189 83,390 14,504 41,879
Net assets 109,667 897,210 78,741 93,116 -14,126
1) Profit or loss for Global Fashion Group includes impairment losses of EUR 1,241,406 thousand.
Reconciliation of the above summarized financial information to the carrying amount of the interest in associates recognized in the consolidated financial statements is set out below. Other adjustments reflect non-controlling interests of the associates.
For the year ended December 31, 2016 (in thousands):
Company AEH New
Africa II Global
Fashion HelloFresh Home24 Westwing
Currency EUR EUR EUR EUR EUR
Net assets of the associate 109,667 897,210 78,741 93,116 -14,126
Proportion of the Group’s ownership interest in the associate
71.2% 20.6% 55.8% 42.8% 32.3%
Goodwill 0 29,703 109,499 16,821 5,337
Impairment charge on Group level - -90,468 - - -
Other adjustments 0 -6,027 -1 4,469 11,609
Carrying amount of the Group’s interest in the associate
78,032 118,374 153,469 61,112 12,388
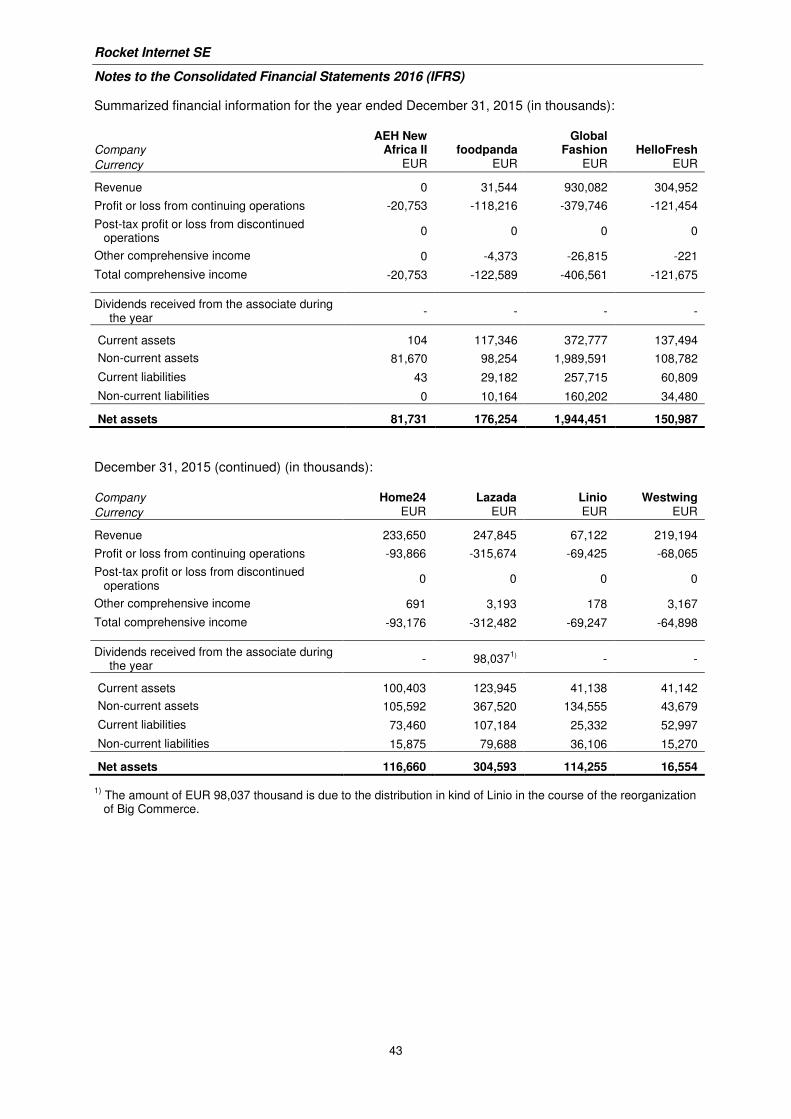
Rocket Internet SE
Notes to the Consolidated Financial Statements 2016 (IFRS)
43
Summarized financial information for the year ended December 31, 2015 (in thousands):
Company AEH New
Africa II foodpanda Global
Fashion HelloFresh
Currency EUR EUR EUR EUR
Revenue 0 31,544 930,082 304,952
Profit or loss from continuing operations -20,753 -118,216 -379,746 -121,454
Post-tax profit or loss from discontinued operations
0 0 0 0
Other comprehensive income 0 -4,373 -26,815 -221
Total comprehensive income -20,753 -122,589 -406,561 -121,675
Dividends received from the associate during the year
- - - -
Current assets 104 117,346 372,777 137,494
Non-current assets 81,670 98,254 1,989,591 108,782
Current liabilities 43 29,182 257,715 60,809
Non-current liabilities 0 10,164 160,202 34,480
Net assets 81,731 176,254 1,944,451 150,987
December 31, 2015 (continued) (in thousands):
Company Home24 Lazada Linio Westwing
Currency EUR EUR EUR EUR
Revenue 233,650 247,845 67,122 219,194
Profit or loss from continuing operations -93,866 -315,674 -69,425 -68,065
Post-tax profit or loss from discontinued operations
0 0 0 0
Other comprehensive income 691 3,193 178 3,167
Total comprehensive income -93,176 -312,482 -69,247 -64,898
Dividends received from the associate during the year
- 98,0371) - -
Current assets 100,403 123,945 41,138 41,142
Non-current assets 105,592 367,520 134,555 43,679
Current liabilities 73,460 107,184 25,332 52,997
Non-current liabilities 15,875 79,688 36,106 15,270
Net assets 116,660 304,593 114,255 16,554
1)
The amount of EUR 98,037 thousand is due to the distribution in kind of Linio in the course of the reorganization of Big Commerce.
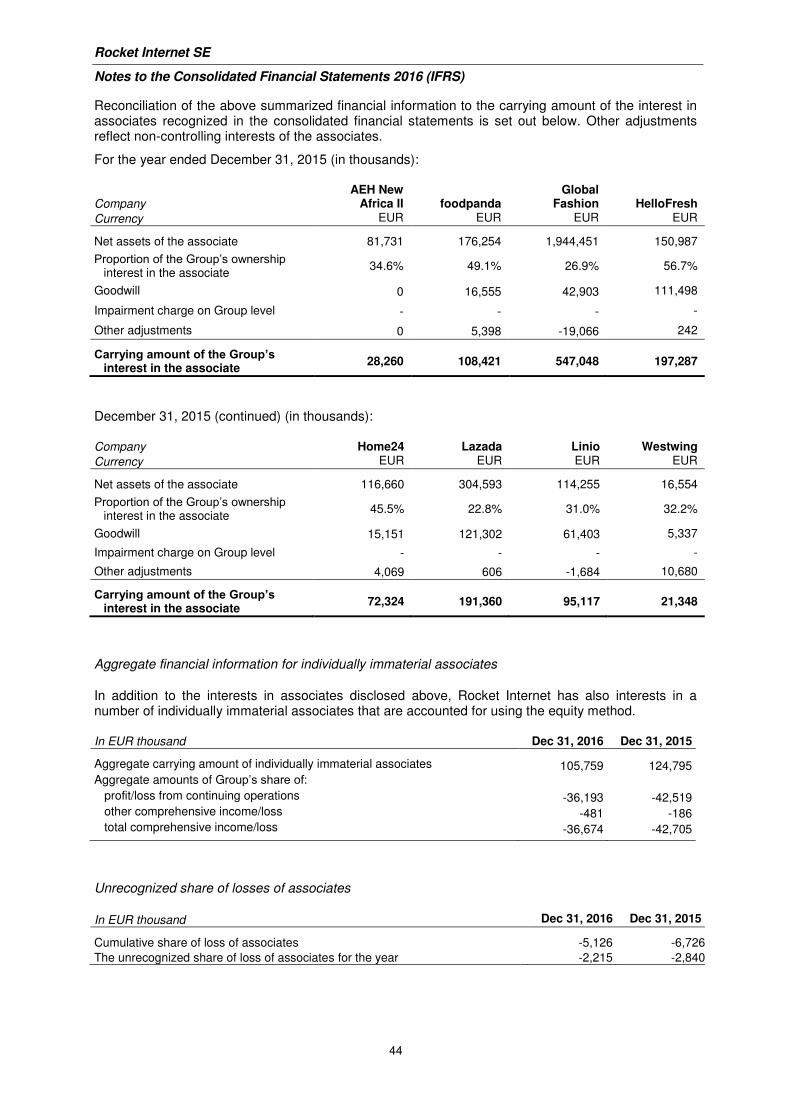
Rocket Internet SE
Notes to the Consolidated Financial Statements 2016 (IFRS)
44
Reconciliation of the above summarized financial information to the carrying amount of the interest in associates recognized in the consolidated financial statements is set out below. Other adjustments reflect non-controlling interests of the associates.
For the year ended December 31, 2015 (in thousands):
Company AEH New
Africa II foodpanda Global
Fashion HelloFresh
Currency EUR EUR EUR EUR
Net assets of the associate 81,731 176,254 1,944,451 150,987
Proportion of the Group’s ownership interest in the associate
34.6% 49.1% 26.9% 56.7%
Goodwill 0 16,555 42,903 111,498
Impairment charge on Group level - - - -
Other adjustments 0 5,398 -19,066 242
Carrying amount of the Group’s interest in the associate
28,260 108,421 547,048 197,287
December 31, 2015 (continued) (in thousands):
Company Home24 Lazada Linio Westwing
Currency EUR EUR EUR EUR
Net assets of the associate 116,660 304,593 114,255 16,554
Proportion of the Group’s ownership interest in the associate
45.5% 22.8% 31.0% 32.2%
Goodwill 15,151 121,302 61,403 5,337
Impairment charge on Group level - - - -
Other adjustments 4,069 606 -1,684 10,680
Carrying amount of the Group’s interest in the associate
72,324 191,360 95,117 21,348
Aggregate financial information for individually immaterial associates
In addition to the interests in associates disclosed above, Rocket Internet has also interests in a number of individually immaterial associates that are accounted for using the equity method.
In EUR thousand Dec 31, 2016 Dec 31, 2015
Aggregate carrying amount of individually immaterial associates 105,759 124,795 Aggregate amounts of Group’s share of: profit/loss from continuing operations -36,193 -42,519 other comprehensive income/loss -481 -186 total comprehensive income/loss -36,674 -42,705
Unrecognized share of losses of associates
In EUR thousand Dec 31, 2016 Dec 31, 2015
Cumulative share of loss of associates -5,126 -6,726
The unrecognized share of loss of associates for the year -2,215 -2,840
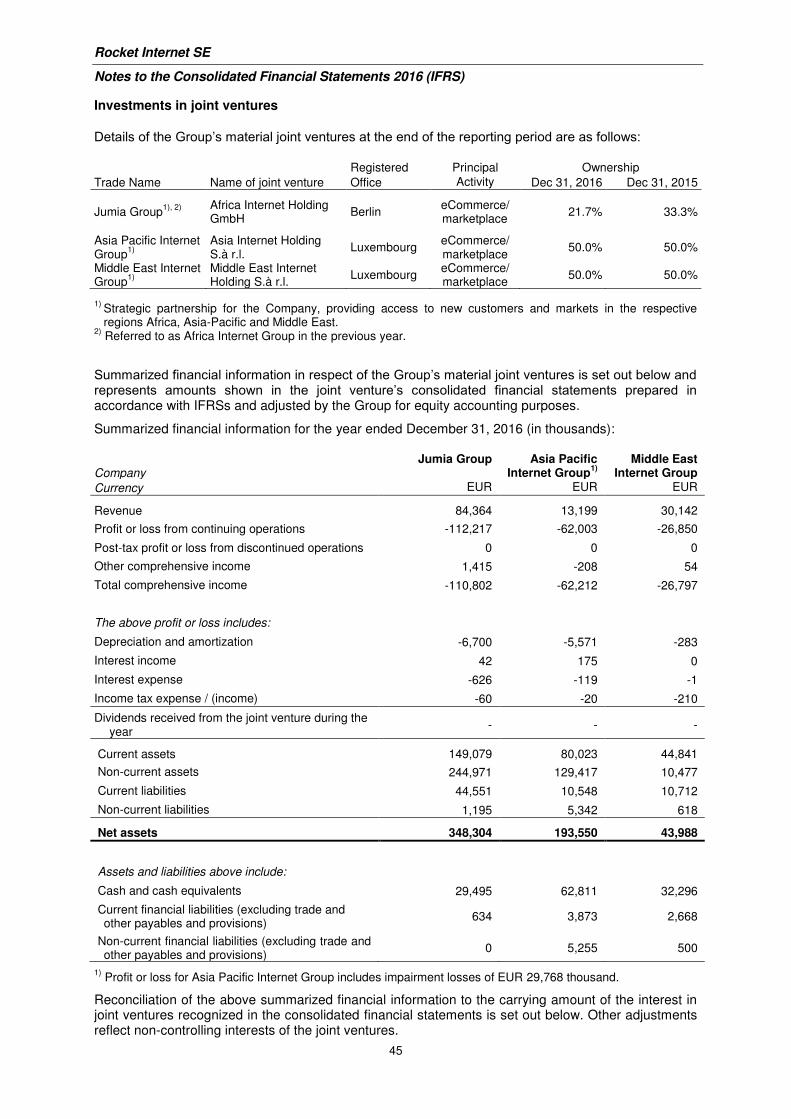
Rocket Internet SE
Notes to the Consolidated Financial Statements 2016 (IFRS)
45
Investments in joint ventures
Details of the Group’s material joint ventures at the end of the reporting period are as follows:
Registered Principal Ownership
Trade Name Name of joint venture Office Activity Dec 31, 2016 Dec 31, 2015
Jumia Group1), 2)
Africa Internet Holding GmbH
Berlin eCommerce/ marketplace
21.7% 33.3%
Asia Pacific Internet Group
1)
Asia Internet Holding S.à r.l.
Luxembourg eCommerce/ marketplace
50.0% 50.0%
Middle East Internet Group
1)
Middle East Internet Holding S.à r.l.
Luxembourg eCommerce/ marketplace
50.0% 50.0%
1)
Strategic partnership for the Company, providing access to new customers and markets in the respective regions Africa, Asia-Pacific and Middle East.
2) Referred to as Africa Internet Group in the previous year.
Summarized financial information in respect of the Group’s material joint ventures is set out below and represents amounts shown in the joint venture’s consolidated financial statements prepared in accordance with IFRSs and adjusted by the Group for equity accounting purposes.
Summarized financial information for the year ended December 31, 2016 (in thousands):
Company Jumia Group Asia Pacific
Internet Group1)
Middle East
Internet Group
Currency EUR EUR EUR
Revenue 84,364 13,199 30,142
Profit or loss from continuing operations -112,217 -62,003 -26,850
Post-tax profit or loss from discontinued operations 0 0 0
Other comprehensive income 1,415 -208 54
Total comprehensive income -110,802 -62,212 -26,797
The above profit or loss includes:
Depreciation and amortization -6,700 -5,571 -283
Interest income 42 175 0
Interest expense -626 -119 -1
Income tax expense / (income) -60 -20 -210
Dividends received from the joint venture during the year
- - -
Current assets 149,079 80,023 44,841
Non-current assets 244,971 129,417 10,477
Current liabilities 44,551 10,548 10,712
Non-current liabilities 1,195 5,342 618
Net assets 348,304 193,550 43,988
Assets and liabilities above include:
Cash and cash equivalents 29,495 62,811 32,296
Current financial liabilities (excluding trade and other payables and provisions)
634 3,873 2,668
Non-current financial liabilities (excluding trade and other payables and provisions)
0 5,255 500
1) Profit or loss for Asia Pacific Internet Group includes impairment losses of EUR 29,768 thousand.
Reconciliation of the above summarized financial information to the carrying amount of the interest in joint ventures recognized in the consolidated financial statements is set out below. Other adjustments reflect non-controlling interests of the joint ventures.
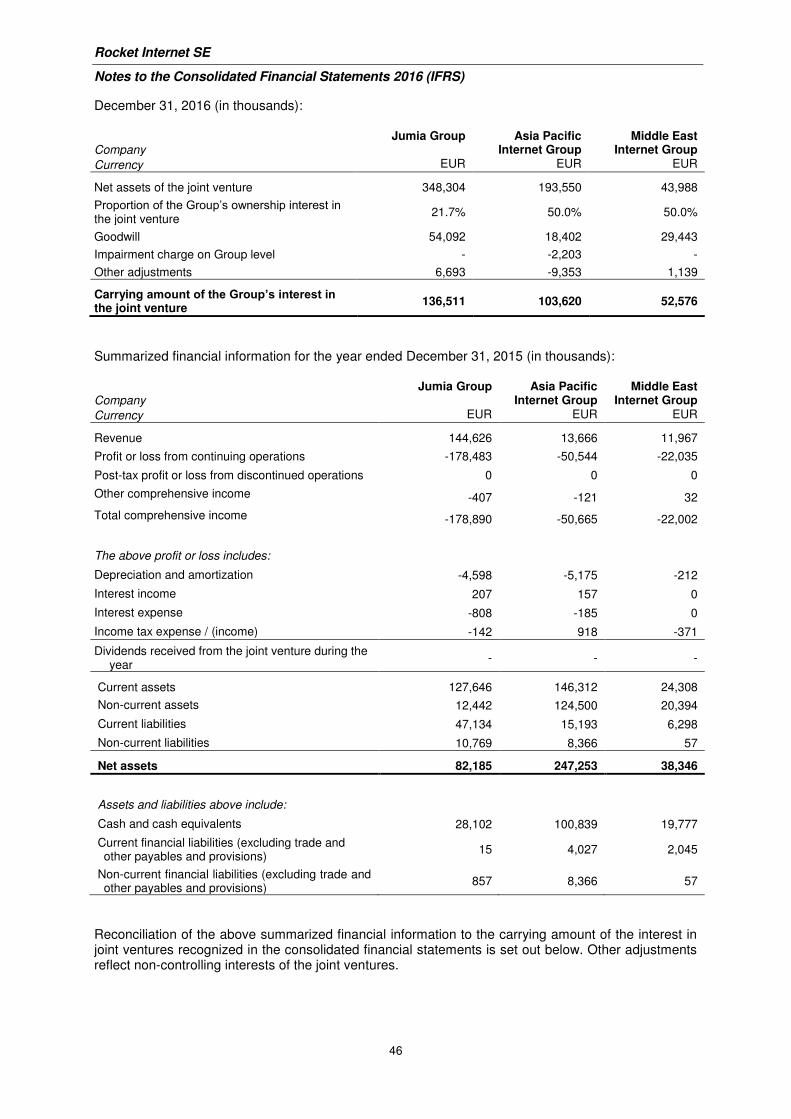
Rocket Internet SE
Notes to the Consolidated Financial Statements 2016 (IFRS)
46
December 31, 2016 (in thousands):
Company Jumia Group Asia Pacific
Internet Group Middle East
Internet Group
Currency EUR EUR EUR
Net assets of the joint venture 348,304 193,550 43,988
Proportion of the Group’s ownership interest in the joint venture
21.7% 50.0% 50.0%
Goodwill 54,092 18,402 29,443
Impairment charge on Group level - -2,203 -
Other adjustments 6,693 -9,353 1,139
Carrying amount of the Group’s interest in the joint venture
136,511 103,620 52,576
Summarized financial information for the year ended December 31, 2015 (in thousands):
Company Jumia Group Asia Pacific
Internet Group Middle East
Internet Group
Currency EUR EUR EUR
Revenue 144,626 13,666 11,967
Profit or loss from continuing operations -178,483 -50,544 -22,035
Post-tax profit or loss from discontinued operations 0 0 0
Other comprehensive income -407 -121 32
Total comprehensive income -178,890 -50,665 -22,002
The above profit or loss includes:
Depreciation and amortization -4,598 -5,175 -212
Interest income 207 157 0
Interest expense -808 -185 0
Income tax expense / (income) -142 918 -371
Dividends received from the joint venture during the year
- - -
Current assets 127,646 146,312 24,308
Non-current assets 12,442 124,500 20,394
Current liabilities 47,134 15,193 6,298
Non-current liabilities 10,769 8,366 57
Net assets 82,185 247,253 38,346
Assets and liabilities above include:
Cash and cash equivalents 28,102 100,839 19,777
Current financial liabilities (excluding trade and other payables and provisions)
15 4,027 2,045
Non-current financial liabilities (excluding trade and other payables and provisions)
857 8,366 57
Reconciliation of the above summarized financial information to the carrying amount of the interest in joint ventures recognized in the consolidated financial statements is set out below. Other adjustments reflect non-controlling interests of the joint ventures.
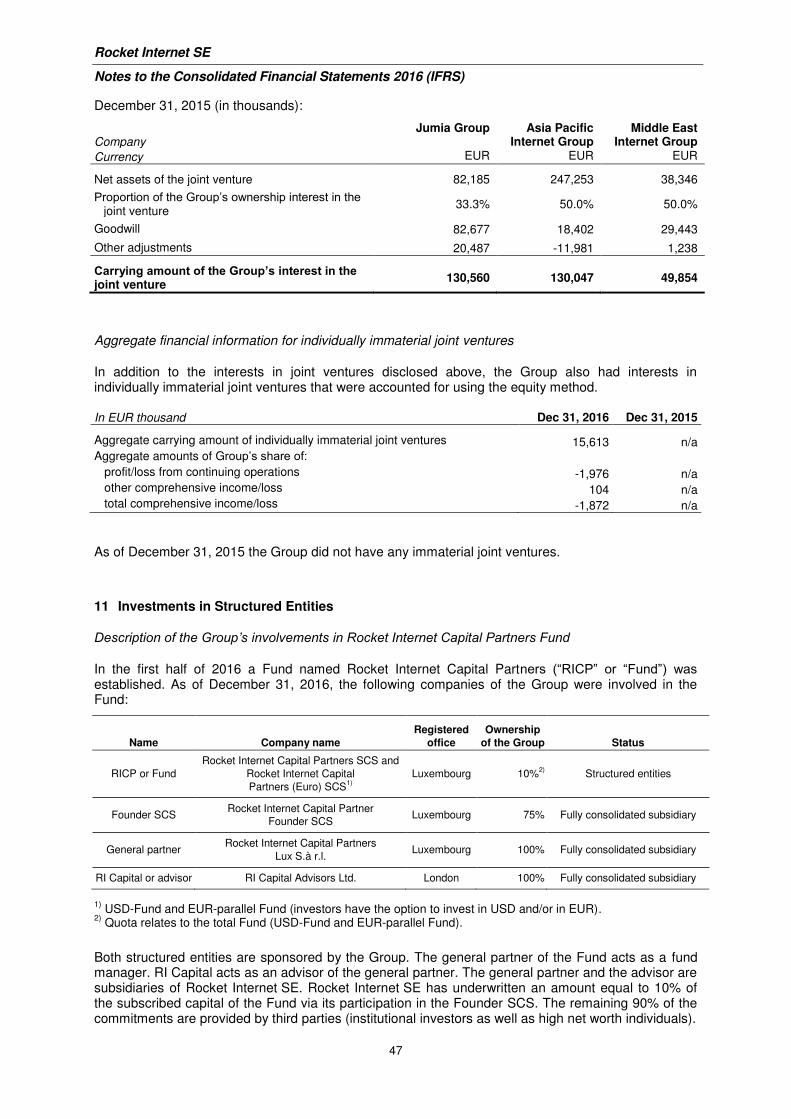
Rocket Internet SE
Notes to the Consolidated Financial Statements 2016 (IFRS)
47
December 31, 2015 (in thousands):
Company Jumia Group Asia Pacific
Internet Group Middle East
Internet Group
Currency EUR EUR EUR
Net assets of the joint venture 82,185 247,253 38,346
Proportion of the Group’s ownership interest in the joint venture
33.3% 50.0% 50.0%
Goodwill 82,677 18,402 29,443
Other adjustments 20,487 -11,981 1,238
Carrying amount of the Group’s interest in the joint venture
130,560 130,047 49,854
Aggregate financial information for individually immaterial joint ventures
In addition to the interests in joint ventures disclosed above, the Group also had interests in individually immaterial joint ventures that were accounted for using the equity method.
In EUR thousand Dec 31, 2016 Dec 31, 2015
Aggregate carrying amount of individually immaterial joint ventures 15,613 n/a Aggregate amounts of Group’s share of: profit/loss from continuing operations -1,976 n/a other comprehensive income/loss 104 n/a total comprehensive income/loss -1,872 n/a
As of December 31, 2015 the Group did not have any immaterial joint ventures.
11 Investments in Structured Entities
Description of the Group’s involvements in Rocket Internet Capital Partners Fund
In the first half of 2016 a Fund named Rocket Internet Capital Partners (“RICP” or “Fund”) was established. As of December 31, 2016, the following companies of the Group were involved in the Fund:
Name Company name
Registered
office
Ownership
of the Group Status
RICP or Fund
Rocket Internet Capital Partners SCS and
Rocket Internet Capital
Partners (Euro) SCS1)
Luxembourg 10%2) Structured entities
Founder SCS Rocket Internet Capital Partner
Founder SCS Luxembourg 75% Fully consolidated subsidiary
General partner Rocket Internet Capital Partners
Lux S.à r.l. Luxembourg 100% Fully consolidated subsidiary
RI Capital or advisor RI Capital Advisors Ltd. London 100% Fully consolidated subsidiary
1)
USD-Fund and EUR-parallel Fund (investors have the option to invest in USD and/or in EUR). 2)
Quota relates to the total Fund (USD-Fund and EUR-parallel Fund).
Both structured entities are sponsored by the Group. The general partner of the Fund acts as a fund manager. RI Capital acts as an advisor of the general partner. The general partner and the advisor are subsidiaries of Rocket Internet SE. Rocket Internet SE has underwritten an amount equal to 10% of the subscribed capital of the Fund via its participation in the Founder SCS. The remaining 90% of the commitments are provided by third parties (institutional investors as well as high net worth individuals).
Rocket Internet SE
Notes to the Consolidated Financial Statements 2016 (IFRS)
48
The Fund invests jointly with Rocket Internet (co-investment ratio: 80% RICP; 20% Rocket Internet). The Fund duration is at least nine years.
The total commitment of the Founder SCS amounts to USD 89,499 thousand (approx. EUR 84,906 thousand) of which a total amount of EUR 9,292 thousand was drawn-down during 2016.
Interests in unconsolidated structured entities
The Group’s interests in RICP refer to contractual and non-contractual involvement that exposes the Group to variable returns from the performance of the unconsolidated structured entities. The Group’s interests in unconsolidated structured entities solely include equity investments.
Maximum credit risk of unconsolidated structured entities
The maximum exposure to loss is determined by considering the nature of the interest in the unconsolidated structured entity. The maximum exposure for equity investments is reflected by their carrying amounts in the consolidated balance sheet. The structured entities are shown in the balance sheet item Investments in associates and joint ventures. The Group is not absorbing any risk arising from the variability of returns from the structured entities via other interests such as debt investments, liquidity facilities, guarantees, derivatives, etc. As an administrator of the Fund, the general partner will bear various administrative expenses. Rocket Internet SE has pledged short-term financial assets amounting to EUR 163,379 thousand as collateral for RICP’s short-term credit facility. As of December 31, 2016, RICP has drawn down EUR 106,206 thousand of that credit facility. Rocket Internet did not provide further non-contractual support during the financial year 2016 to unconsolidated structured entities. The Group is not contractually obliged to provide financial support to these entities in any form.
Profit entitlements derived from involvement with structured entities
The Founder SCS is entitled to an increased share in profits (carry) for its services in relation to the Fund.
Size of structured entities
The size of the Fund (USD-Fund and EUR-parallel Fund) is determined by the total combined commitments of its investors, which were equal to USD 869,173 thousand as of December 31, 2016. The Fund’s investments are measured at fair value through profit or loss.
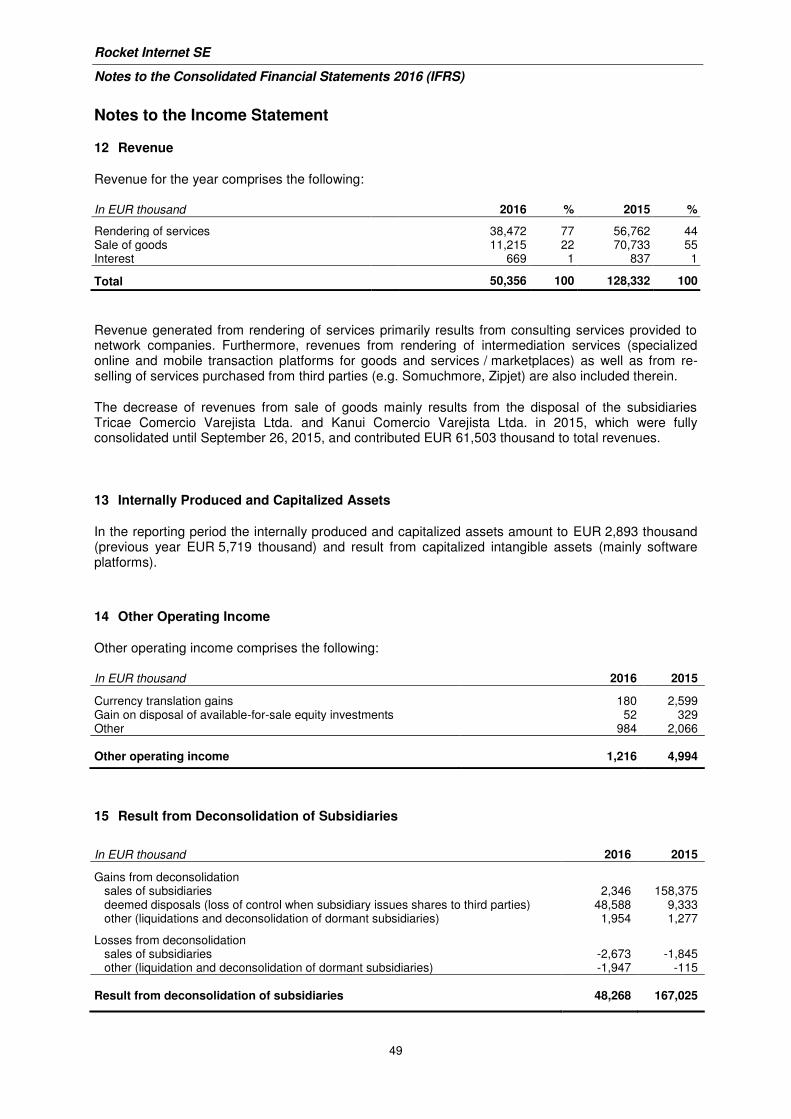
Rocket Internet SE
Notes to the Consolidated Financial Statements 2016 (IFRS)
49
Notes to the Income Statement
12 Revenue
Revenue for the year comprises the following:
Revenue generated from rendering of services primarily results from consulting services provided to network companies. Furthermore, revenues from rendering of intermediation services (specialized online and mobile transaction platforms for goods and services / marketplaces) as well as from re-selling of services purchased from third parties (e.g. Somuchmore, Zipjet) are also included therein.
The decrease of revenues from sale of goods mainly results from the disposal of the subsidiaries Tricae Comercio Varejista Ltda. and Kanui Comercio Varejista Ltda. in 2015, which were fully consolidated until September 26, 2015, and contributed EUR 61,503 thousand to total revenues.
13 Internally Produced and Capitalized Assets
In the reporting period the internally produced and capitalized assets amount to EUR 2,893 thousand (previous year EUR 5,719 thousand) and result from capitalized intangible assets (mainly software platforms).
14 Other Operating Income
Other operating income comprises the following:
In EUR thousand 2016 2015
Currency translation gains 180 2,599 Gain on disposal of available-for-sale equity investments 52 329 Other 984 2,066 Other operating income 1,216 4,994
15 Result from Deconsolidation of Subsidiaries
In EUR thousand 2016 2015
Gains from deconsolidation sales of subsidiaries 2,346 158,375 deemed disposals (loss of control when subsidiary issues shares to third parties) 48,588 9,333 other (liquidations and deconsolidation of dormant subsidiaries) 1,954 1,277
Losses from deconsolidation sales of subsidiaries -2,673 -1,845 other (liquidation and deconsolidation of dormant subsidiaries) -1,947 -115 Result from deconsolidation of subsidiaries 48,268 167,025
In EUR thousand 2016 % 2015 %
Rendering of services 38,472 77 56,762 44 Sale of goods 11,215 22 70,733 55 Interest 669 1 837 1
Total 50,356 100 128,332 100
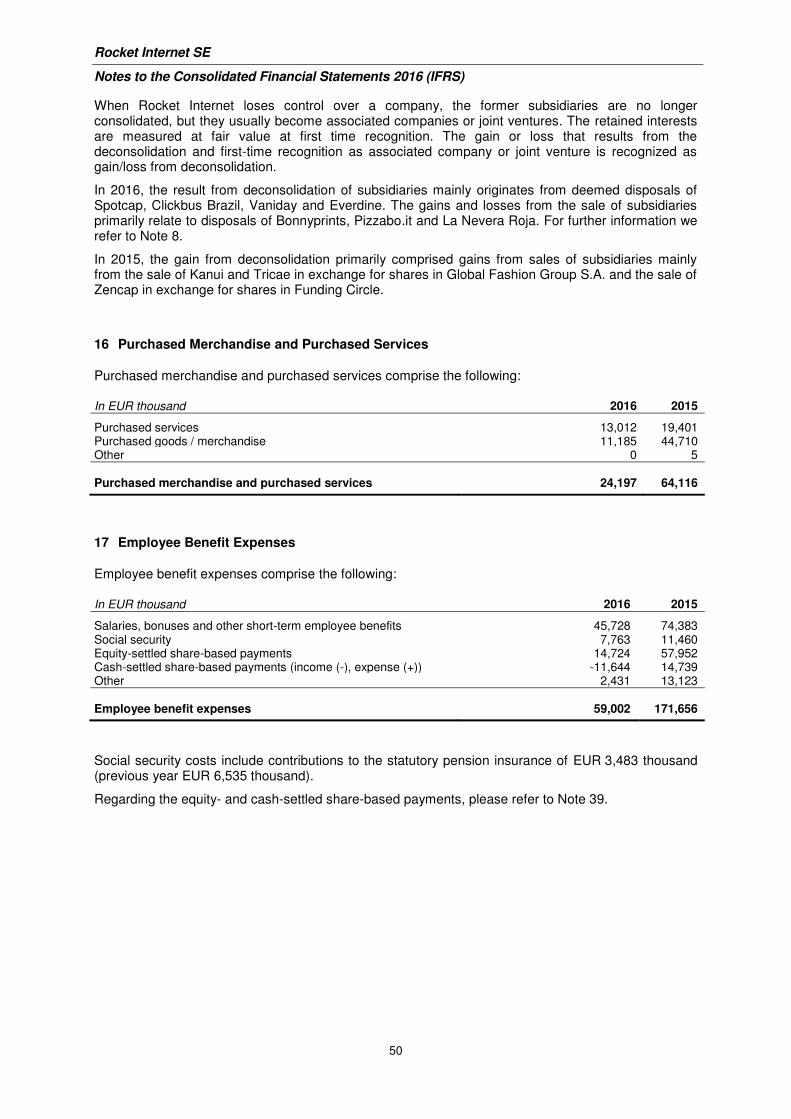
Rocket Internet SE
Notes to the Consolidated Financial Statements 2016 (IFRS)
50
When Rocket Internet loses control over a company, the former subsidiaries are no longer consolidated, but they usually become associated companies or joint ventures. The retained interests are measured at fair value at first time recognition. The gain or loss that results from the deconsolidation and first-time recognition as associated company or joint venture is recognized as gain/loss from deconsolidation.
In 2016, the result from deconsolidation of subsidiaries mainly originates from deemed disposals of Spotcap, Clickbus Brazil, Vaniday and Everdine. The gains and losses from the sale of subsidiaries primarily relate to disposals of Bonnyprints, Pizzabo.it and La Nevera Roja. For further information we refer to Note 8.
In 2015, the gain from deconsolidation primarily comprised gains from sales of subsidiaries mainly from the sale of Kanui and Tricae in exchange for shares in Global Fashion Group S.A. and the sale of Zencap in exchange for shares in Funding Circle.
16 Purchased Merchandise and Purchased Services
Purchased merchandise and purchased services comprise the following:
In EUR thousand 2016 2015
Purchased services 13,012 19,401 Purchased goods / merchandise 11,185 44,710 Other 0 5 Purchased merchandise and purchased services 24,197 64,116
17 Employee Benefit Expenses
Employee benefit expenses comprise the following:
In EUR thousand 2016 2015
Salaries, bonuses and other short-term employee benefits 45,728 74,383 Social security 7,763 11,460 Equity-settled share-based payments 14,724 57,952 Cash-settled share-based payments (income (-), expense (+)) -11,644 14,739 Other 2,431 13,123 Employee benefit expenses 59,002 171,656
Social security costs include contributions to the statutory pension insurance of EUR 3,483 thousand (previous year EUR 6,535 thousand).
Regarding the equity- and cash-settled share-based payments, please refer to Note 39.
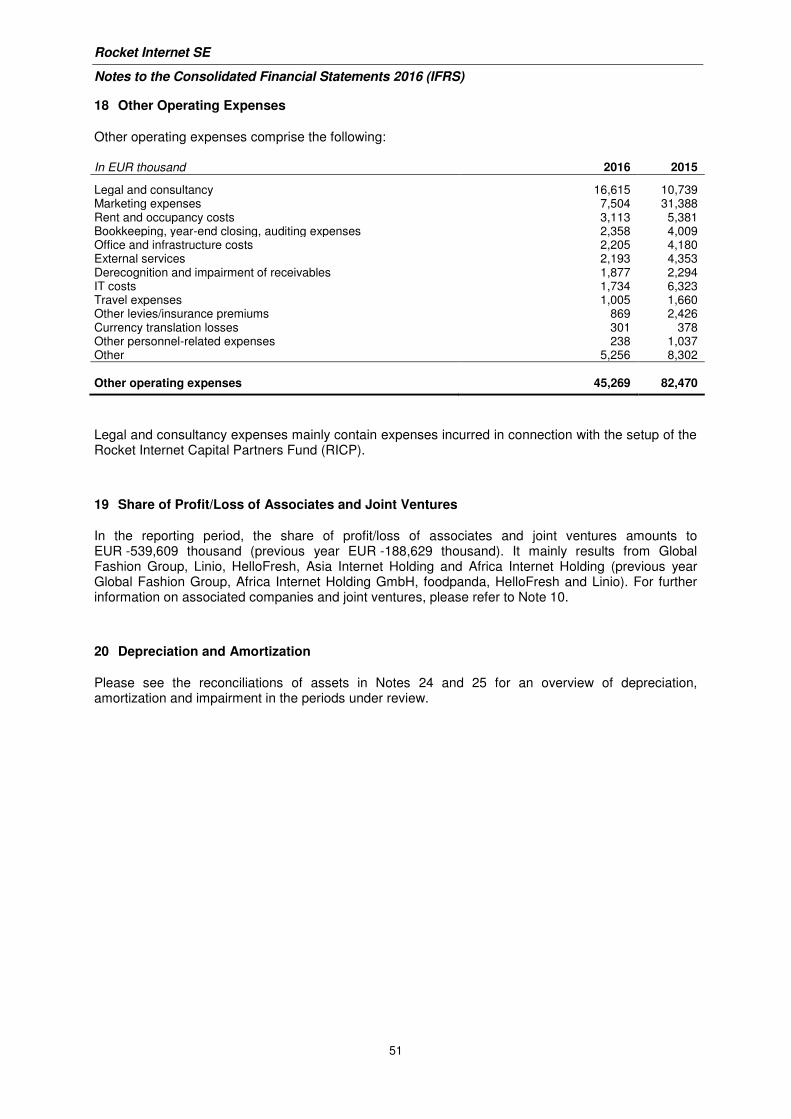
Rocket Internet SE
Notes to the Consolidated Financial Statements 2016 (IFRS)
51
18 Other Operating Expenses
Other operating expenses comprise the following:
In EUR thousand 2016 2015
Legal and consultancy 16,615 10,739 Marketing expenses 7,504 31,388 Rent and occupancy costs 3,113 5,381 Bookkeeping, year-end closing, auditing expenses 2,358 4,009 Office and infrastructure costs 2,205 4,180 External services 2,193 4,353 Derecognition and impairment of receivables 1,877 2,294 IT costs 1,734 6,323 Travel expenses 1,005 1,660 Other levies/insurance premiums 869 2,426 Currency translation losses 301 378 Other personnel-related expenses 238 1,037 Other 5,256 8,302 Other operating expenses 45,269 82,470
Legal and consultancy expenses mainly contain expenses incurred in connection with the setup of the Rocket Internet Capital Partners Fund (RICP).
19 Share of Profit/Loss of Associates and Joint Ventures
In the reporting period, the share of profit/loss of associates and joint ventures amounts to EUR -539,609 thousand (previous year EUR -188,629 thousand). It mainly results from Global Fashion Group, Linio, HelloFresh, Asia Internet Holding and Africa Internet Holding (previous year Global Fashion Group, Africa Internet Holding GmbH, foodpanda, HelloFresh and Linio). For further information on associated companies and joint ventures, please refer to Note 10.
20 Depreciation and Amortization
Please see the reconciliations of assets in Notes 24 and 25 for an overview of depreciation, amortization and impairment in the periods under review.
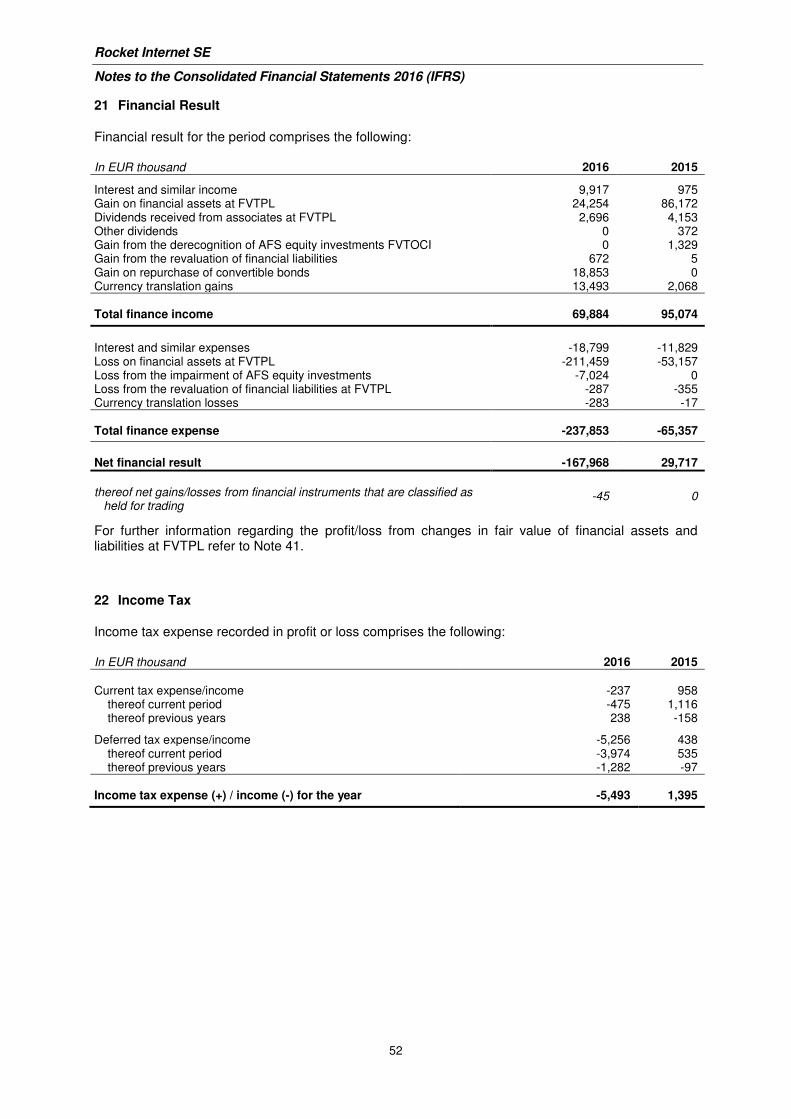
Rocket Internet SE
Notes to the Consolidated Financial Statements 2016 (IFRS)
52
21 Financial Result
Financial result for the period comprises the following:
In EUR thousand 2016 2015
Interest and similar income 9,917 975 Gain on financial assets at FVTPL 24,254 86,172 Dividends received from associates at FVTPL 2,696 4,153 Other dividends 0 372 Gain from the derecognition of AFS equity investments FVTOCI 0 1,329 Gain from the revaluation of financial liabilities 672 5 Gain on repurchase of convertible bonds 18,853 0 Currency translation gains 13,493 2,068 Total finance income 69,884 95,074 Interest and similar expenses -18,799 -11,829 Loss on financial assets at FVTPL -211,459 -53,157 Loss from the impairment of AFS equity investments -7,024 0 Loss from the revaluation of financial liabilities at FVTPL -287 -355 Currency translation losses -283 -17 Total finance expense -237,853 -65,357 Net financial result -167,968 29,717
thereof net gains/losses from financial instruments that are classified as
held for trading -45 0
For further information regarding the profit/loss from changes in fair value of financial assets and liabilities at FVTPL refer to Note 41.
22 Income Tax
Income tax expense recorded in profit or loss comprises the following:
In EUR thousand 2016 2015
Current tax expense/income -237 958 thereof current period -475 1,116 thereof previous years 238 -158
Deferred tax expense/income -5,256 438 thereof current period -3,974 535 thereof previous years -1,282 -97 Income tax expense (+) / income (-) for the year -5,493 1,395
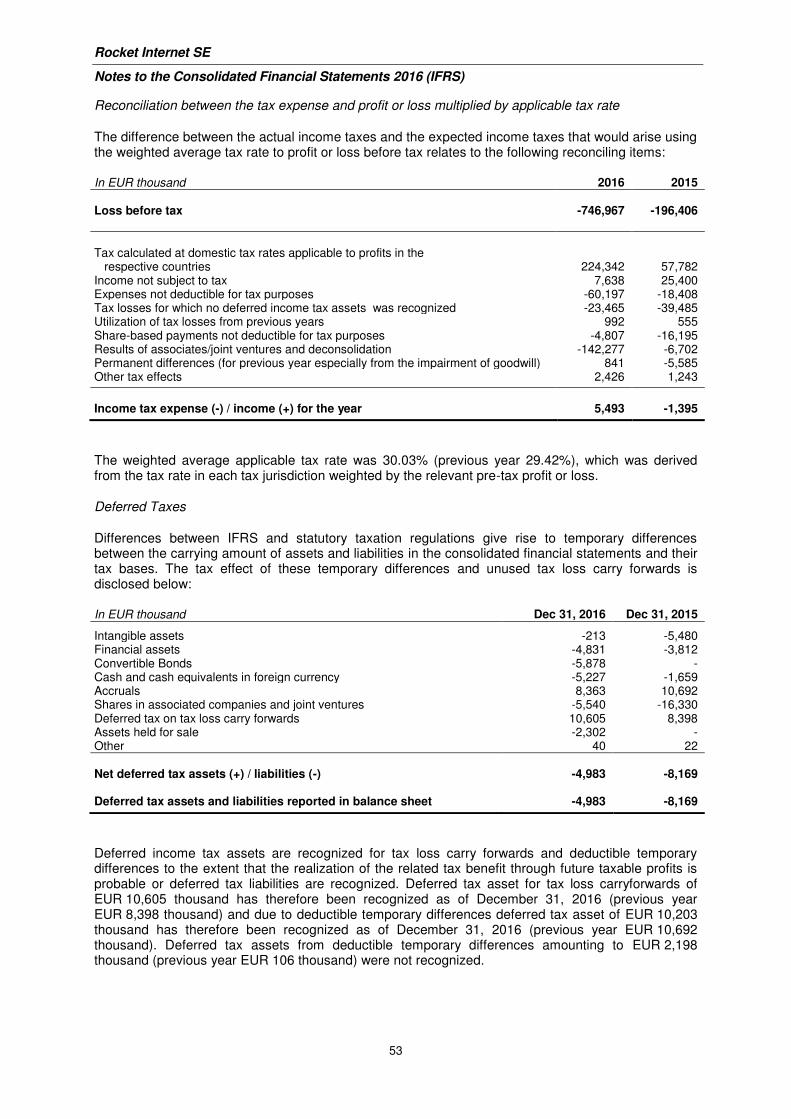
Rocket Internet SE
Notes to the Consolidated Financial Statements 2016 (IFRS)
53
Reconciliation between the tax expense and profit or loss multiplied by applicable tax rate
The difference between the actual income taxes and the expected income taxes that would arise using the weighted average tax rate to profit or loss before tax relates to the following reconciling items:
In EUR thousand 2016 2015
Loss before tax -746,967 -196,406
Tax calculated at domestic tax rates applicable to profits in the respective countries 224,342 57,782 Income not subject to tax 7,638 25,400 Expenses not deductible for tax purposes -60,197 -18,408 Tax losses for which no deferred income tax assets was recognized -23,465 -39,485 Utilization of tax losses from previous years 992 555 Share-based payments not deductible for tax purposes -4,807 -16,195 Results of associates/joint ventures and deconsolidation -142,277 -6,702 Permanent differences (for previous year especially from the impairment of goodwill) 841 -5,585 Other tax effects 2,426 1,243 Income tax expense (-) / income (+) for the year 5,493 -1,395
The weighted average applicable tax rate was 30.03% (previous year 29.42%), which was derived from the tax rate in each tax jurisdiction weighted by the relevant pre-tax profit or loss.
Deferred Taxes
Differences between IFRS and statutory taxation regulations give rise to temporary differences between the carrying amount of assets and liabilities in the consolidated financial statements and their tax bases. The tax effect of these temporary differences and unused tax loss carry forwards is disclosed below:
In EUR thousand Dec 31, 2016 Dec 31, 2015
Intangible assets -213 -5,480 Financial assets -4,831 -3,812 Convertible Bonds -5,878 - Cash and cash equivalents in foreign currency -5,227 -1,659 Accruals 8,363 10,692 Shares in associated companies and joint ventures -5,540 -16,330 Deferred tax on tax loss carry forwards 10,605 8,398 Assets held for sale -2,302 - Other 40 22 Net deferred tax assets (+) / liabilities (-) -4,983 -8,169 Deferred tax assets and liabilities reported in balance sheet -4,983 -8,169
Deferred income tax assets are recognized for tax loss carry forwards and deductible temporary differences to the extent that the realization of the related tax benefit through future taxable profits is probable or deferred tax liabilities are recognized. Deferred tax asset for tax loss carryforwards of EUR 10,605 thousand has therefore been recognized as of December 31, 2016 (previous year EUR 8,398 thousand) and due to deductible temporary differences deferred tax asset of EUR 10,203 thousand has therefore been recognized as of December 31, 2016 (previous year EUR 10,692 thousand). Deferred tax assets from deductible temporary differences amounting to EUR 2,198 thousand (previous year EUR 106 thousand) were not recognized.
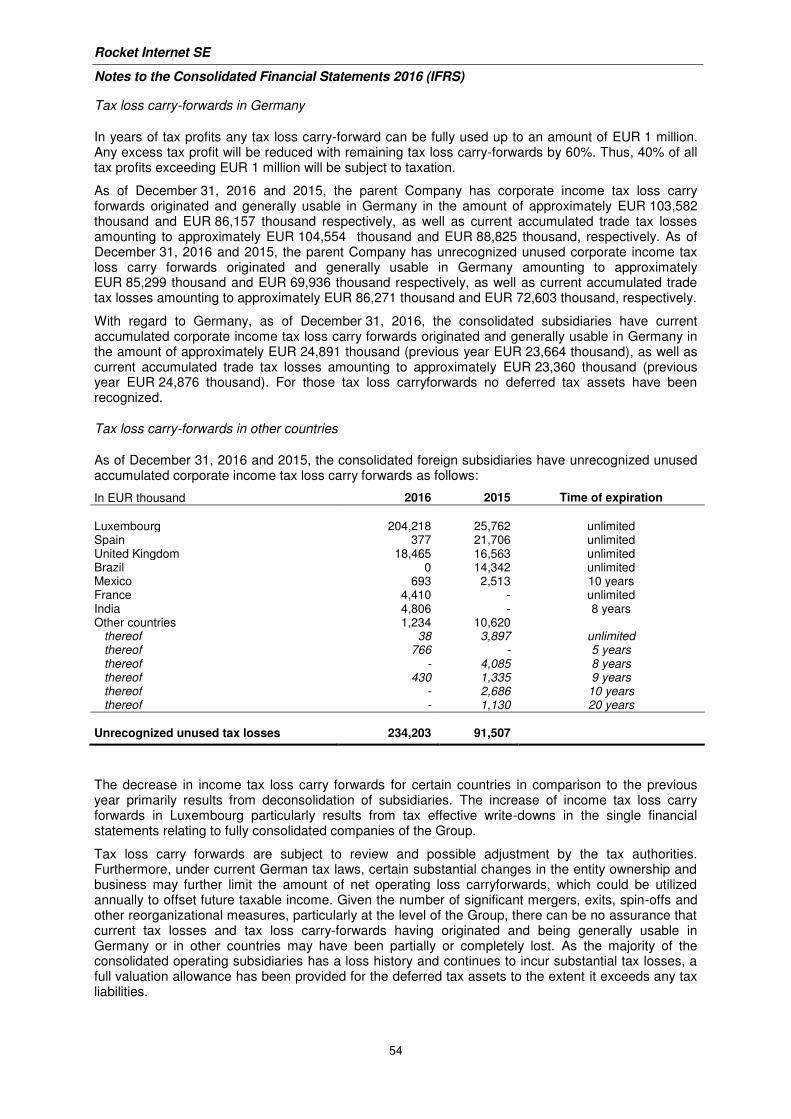
Rocket Internet SE
Notes to the Consolidated Financial Statements 2016 (IFRS)
54
Tax loss carry-forwards in Germany
In years of tax profits any tax loss carry-forward can be fully used up to an amount of EUR 1 million. Any excess tax profit will be reduced with remaining tax loss carry-forwards by 60%. Thus, 40% of all tax profits exceeding EUR 1 million will be subject to taxation.
As of December 31, 2016 and 2015, the parent Company has corporate income tax loss carry forwards originated and generally usable in Germany in the amount of approximately EUR 103,582 thousand and EUR 86,157 thousand respectively, as well as current accumulated trade tax losses amounting to approximately EUR 104,554 thousand and EUR 88,825 thousand, respectively. As of December 31, 2016 and 2015, the parent Company has unrecognized unused corporate income tax loss carry forwards originated and generally usable in Germany amounting to approximately EUR 85,299 thousand and EUR 69,936 thousand respectively, as well as current accumulated trade tax losses amounting to approximately EUR 86,271 thousand and EUR 72,603 thousand, respectively.
With regard to Germany, as of December 31, 2016, the consolidated subsidiaries have current accumulated corporate income tax loss carry forwards originated and generally usable in Germany in the amount of approximately EUR 24,891 thousand (previous year EUR 23,664 thousand), as well as current accumulated trade tax losses amounting to approximately EUR 23,360 thousand (previous year EUR 24,876 thousand). For those tax loss carryforwards no deferred tax assets have been recognized.
Tax loss carry-forwards in other countries
As of December 31, 2016 and 2015, the consolidated foreign subsidiaries have unrecognized unused accumulated corporate income tax loss carry forwards as follows:
In EUR thousand 2016 2015 Time of expiration
Luxembourg 204,218 25,762 unlimited Spain 377 21,706 unlimited United Kingdom 18,465 16,563 unlimited Brazil 0 14,342 unlimited Mexico 693 2,513 10 years France 4,410 - unlimited India 4,806 - 8 years Other countries 1,234 10,620 thereof 38 3,897 unlimited thereof 766 - 5 years thereof - 4,085 8 years thereof 430 1,335 9 years thereof - 2,686 10 years thereof - 1,130 20 years
Unrecognized unused tax losses 234,203 91,507
The decrease in income tax loss carry forwards for certain countries in comparison to the previous year primarily results from deconsolidation of subsidiaries. The increase of income tax loss carry forwards in Luxembourg particularly results from tax effective write-downs in the single financial statements relating to fully consolidated companies of the Group.
Tax loss carry forwards are subject to review and possible adjustment by the tax authorities. Furthermore, under current German tax laws, certain substantial changes in the entity ownership and business may further limit the amount of net operating loss carryforwards, which could be utilized annually to offset future taxable income. Given the number of significant mergers, exits, spin-offs and other reorganizational measures, particularly at the level of the Group, there can be no assurance that current tax losses and tax loss carry-forwards having originated and being generally usable in Germany or in other countries may have been partially or completely lost. As the majority of the consolidated operating subsidiaries has a loss history and continues to incur substantial tax losses, a full valuation allowance has been provided for the deferred tax assets to the extent it exceeds any tax liabilities.
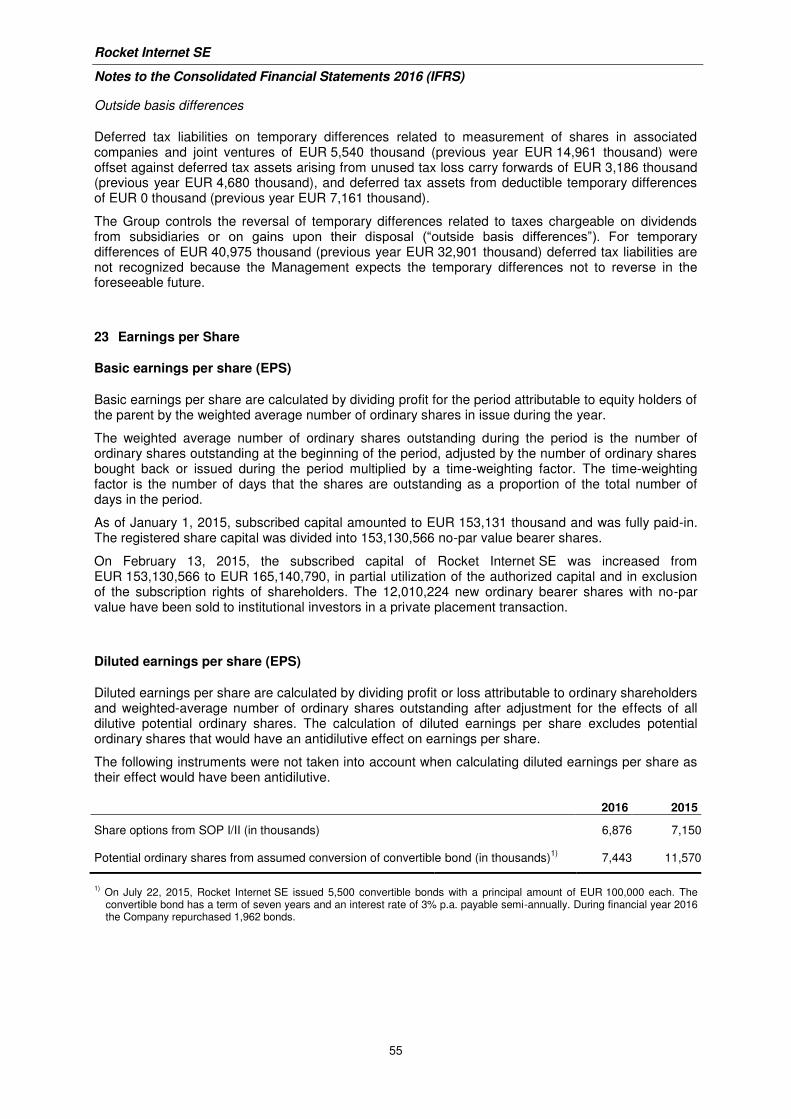
Rocket Internet SE
Notes to the Consolidated Financial Statements 2016 (IFRS)
55
Outside basis differences
Deferred tax liabilities on temporary differences related to measurement of shares in associated companies and joint ventures of EUR 5,540 thousand (previous year EUR 14,961 thousand) were offset against deferred tax assets arising from unused tax loss carry forwards of EUR 3,186 thousand (previous year EUR 4,680 thousand), and deferred tax assets from deductible temporary differences of EUR 0 thousand (previous year EUR 7,161 thousand).
The Group controls the reversal of temporary differences related to taxes chargeable on dividends from subsidiaries or on gains upon their disposal (“outside basis differences”). For temporary differences of EUR 40,975 thousand (previous year EUR 32,901 thousand) deferred tax liabilities are not recognized because the Management expects the temporary differences not to reverse in the foreseeable future.
23 Earnings per Share
Basic earnings per share (EPS)
Basic earnings per share are calculated by dividing profit for the period attributable to equity holders of the parent by the weighted average number of ordinary shares in issue during the year.
The weighted average number of ordinary shares outstanding during the period is the number of ordinary shares outstanding at the beginning of the period, adjusted by the number of ordinary shares bought back or issued during the period multiplied by a time-weighting factor. The time-weighting factor is the number of days that the shares are outstanding as a proportion of the total number of days in the period.
As of January 1, 2015, subscribed capital amounted to EUR 153,131 thousand and was fully paid-in. The registered share capital was divided into 153,130,566 no-par value bearer shares.
On February 13, 2015, the subscribed capital of Rocket Internet SE was increased from EUR 153,130,566 to EUR 165,140,790, in partial utilization of the authorized capital and in exclusion of the subscription rights of shareholders. The 12,010,224 new ordinary bearer shares with no-par value have been sold to institutional investors in a private placement transaction.
Diluted earnings per share (EPS)
Diluted earnings per share are calculated by dividing profit or loss attributable to ordinary shareholders and weighted-average number of ordinary shares outstanding after adjustment for the effects of all dilutive potential ordinary shares. The calculation of diluted earnings per share excludes potential ordinary shares that would have an antidilutive effect on earnings per share.
The following instruments were not taken into account when calculating diluted earnings per share as their effect would have been antidilutive.
2016 2015
Share options from SOP I/II (in thousands) 6,876 7,150 Potential ordinary shares from assumed conversion of convertible bond (in thousands)
1) 7,443 11,570
1) On July 22, 2015, Rocket Internet SE issued 5,500 convertible bonds with a principal amount of EUR 100,000 each. The convertible bond has a term of seven years and an interest rate of 3% p.a. payable semi-annually. During financial year 2016 the Company repurchased 1,962 bonds.
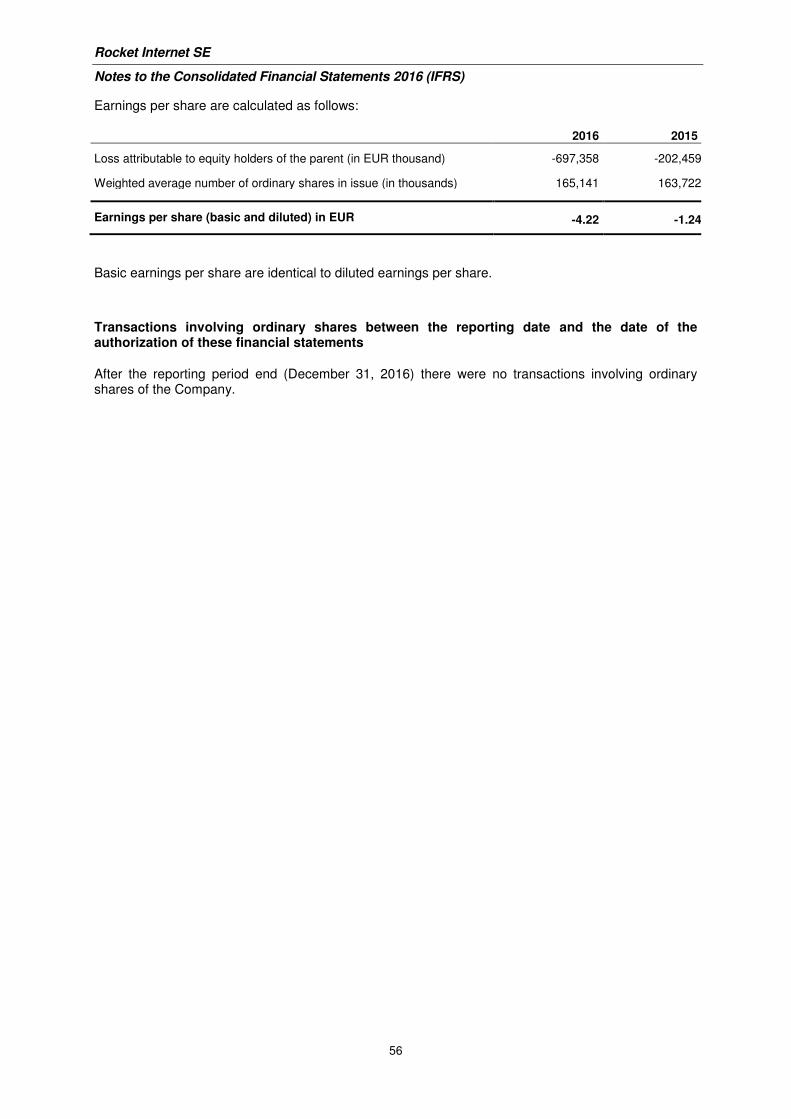
Rocket Internet SE
Notes to the Consolidated Financial Statements 2016 (IFRS)
56
Earnings per share are calculated as follows:
2016 2015
Loss attributable to equity holders of the parent (in EUR thousand) -697,358 -202,459
Weighted average number of ordinary shares in issue (in thousands) 165,141 163,722
Earnings per share (basic and diluted) in EUR -4.22 -1.24
Basic earnings per share are identical to diluted earnings per share.
Transactions involving ordinary shares between the reporting date and the date of the authorization of these financial statements
After the reporting period end (December 31, 2016) there were no transactions involving ordinary shares of the Company.
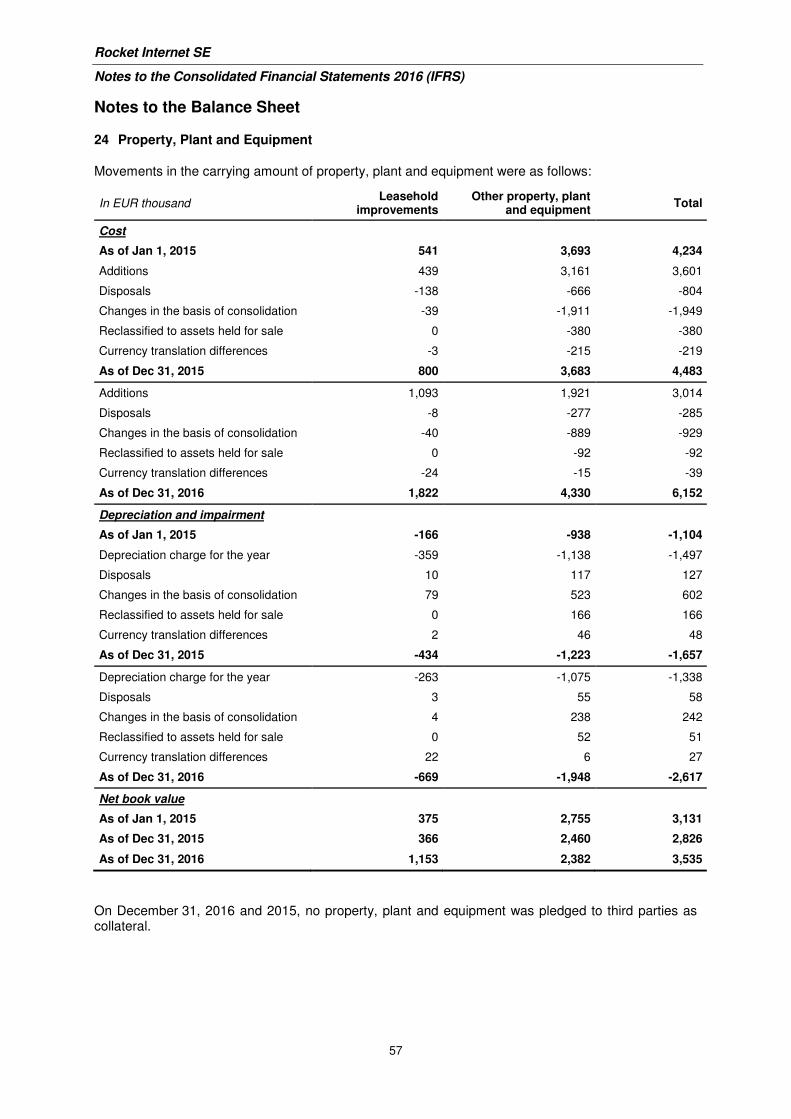
Rocket Internet SE
Notes to the Consolidated Financial Statements 2016 (IFRS)
57
Notes to the Balance Sheet
24 Property, Plant and Equipment
Movements in the carrying amount of property, plant and equipment were as follows:
In EUR thousand Leasehold
improvements Other property, plant
and equipment Total
Cost
As of Jan 1, 2015 541 3,693 4,234
Additions 439 3,161 3,601
Disposals -138 -666 -804
Changes in the basis of consolidation -39 -1,911 -1,949
Reclassified to assets held for sale 0 -380 -380
Currency translation differences -3 -215 -219
As of Dec 31, 2015 800 3,683 4,483
Additions 1,093 1,921 3,014
Disposals -8 -277 -285
Changes in the basis of consolidation -40 -889 -929
Reclassified to assets held for sale 0 -92 -92
Currency translation differences -24 -15 -39
As of Dec 31, 2016 1,822 4,330 6,152
Depreciation and impairment
As of Jan 1, 2015 -166 -938 -1,104
Depreciation charge for the year -359 -1,138 -1,497
Disposals 10 117 127
Changes in the basis of consolidation 79 523 602
Reclassified to assets held for sale 0 166 166
Currency translation differences 2 46 48
As of Dec 31, 2015 -434 -1,223 -1,657
Depreciation charge for the year -263 -1,075 -1,338
Disposals 3 55 58
Changes in the basis of consolidation 4 238 242
Reclassified to assets held for sale 0 52 51
Currency translation differences 22 6 27
As of Dec 31, 2016 -669 -1,948 -2,617
Net book value
As of Jan 1, 2015 375 2,755 3,131
As of Dec 31, 2015 366 2,460 2,826
As of Dec 31, 2016 1,153 2,382 3,535
On December 31, 2016 and 2015, no property, plant and equipment was pledged to third parties as collateral.
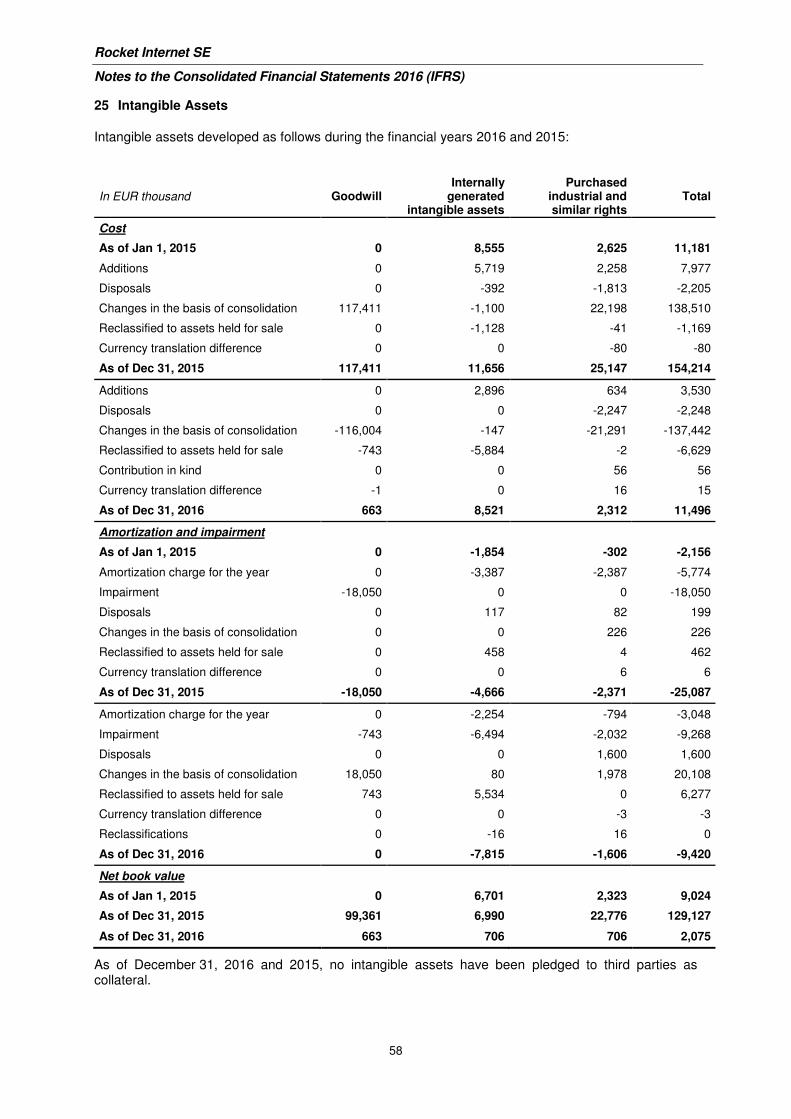
Rocket Internet SE
Notes to the Consolidated Financial Statements 2016 (IFRS)
58
25 Intangible Assets
Intangible assets developed as follows during the financial years 2016 and 2015:
In EUR thousand Goodwill Internally
generated intangible assets
Purchased industrial and similar rights
Total
Cost
As of Jan 1, 2015 0 8,555 2,625 11,181
Additions 0 5,719 2,258 7,977
Disposals 0 -392 -1,813 -2,205
Changes in the basis of consolidation 117,411 -1,100 22,198 138,510
Reclassified to assets held for sale 0 -1,128 -41 -1,169
Currency translation difference 0 0 -80 -80
As of Dec 31, 2015 117,411 11,656 25,147 154,214
Additions 0 2,896 634 3,530
Disposals 0 0 -2,247 -2,248
Changes in the basis of consolidation -116,004 -147 -21,291 -137,442
Reclassified to assets held for sale -743 -5,884 -2 -6,629
Contribution in kind 0 0 56 56
Currency translation difference -1 0 16 15
As of Dec 31, 2016 663 8,521 2,312 11,496
Amortization and impairment
As of Jan 1, 2015 0 -1,854 -302 -2,156
Amortization charge for the year 0 -3,387 -2,387 -5,774
Impairment -18,050 0 0 -18,050
Disposals 0 117 82 199
Changes in the basis of consolidation 0 0 226 226
Reclassified to assets held for sale 0 458 4 462
Currency translation difference 0 0 6 6
As of Dec 31, 2015 -18,050 -4,666 -2,371 -25,087
Amortization charge for the year 0 -2,254 -794 -3,048
Impairment -743 -6,494 -2,032 -9,268
Disposals 0 0 1,600 1,600
Changes in the basis of consolidation 18,050 80 1,978 20,108
Reclassified to assets held for sale 743 5,534 0 6,277
Currency translation difference 0 0 -3 -3
Reclassifications 0 -16 16 0
As of Dec 31, 2016 0 -7,815 -1,606 -9,420
Net book value
As of Jan 1, 2015 0 6,701 2,323 9,024
As of Dec 31, 2015 99,361 6,990 22,776 129,127
As of Dec 31, 2016 663 706 706 2,075
As of December 31, 2016 and 2015, no intangible assets have been pledged to third parties as collateral.
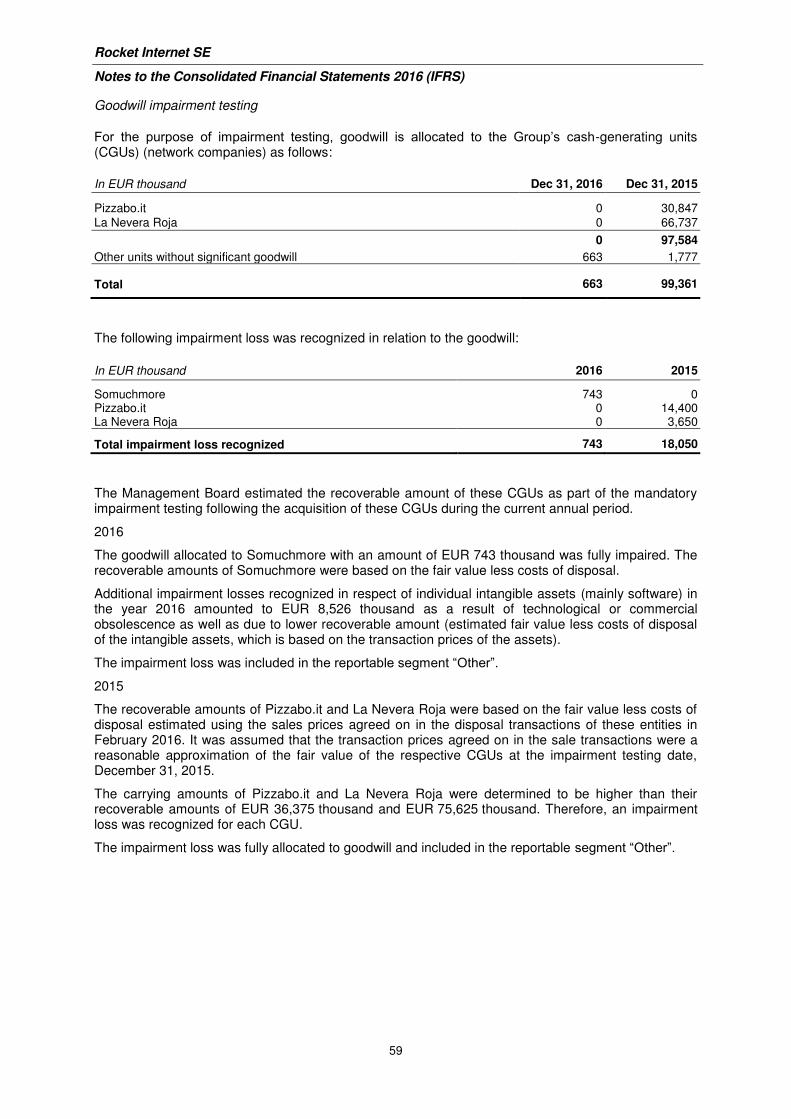
Rocket Internet SE
Notes to the Consolidated Financial Statements 2016 (IFRS)
59
Goodwill impairment testing
For the purpose of impairment testing, goodwill is allocated to the Group’s cash-generating units (CGUs) (network companies) as follows:
In EUR thousand Dec 31, 2016 Dec 31, 2015
Pizzabo.it 0 30,847
La Nevera Roja 0 66,737
0 97,584
Other units without significant goodwill 663 1,777
Total 663 99,361
The following impairment loss was recognized in relation to the goodwill:
In EUR thousand 2016 2015
Somuchmore 743 0 Pizzabo.it 0 14,400 La Nevera Roja 0 3,650
Total impairment loss recognized 743 18,050
The Management Board estimated the recoverable amount of these CGUs as part of the mandatory impairment testing following the acquisition of these CGUs during the current annual period.
2016
The goodwill allocated to Somuchmore with an amount of EUR 743 thousand was fully impaired. The recoverable amounts of Somuchmore were based on the fair value less costs of disposal.
Additional impairment losses recognized in respect of individual intangible assets (mainly software) in the year 2016 amounted to EUR 8,526 thousand as a result of technological or commercial obsolescence as well as due to lower recoverable amount (estimated fair value less costs of disposal of the intangible assets, which is based on the transaction prices of the assets).
The impairment loss was included in the reportable segment “Other”.
2015
The recoverable amounts of Pizzabo.it and La Nevera Roja were based on the fair value less costs of disposal estimated using the sales prices agreed on in the disposal transactions of these entities in February 2016. It was assumed that the transaction prices agreed on in the sale transactions were a reasonable approximation of the fair value of the respective CGUs at the impairment testing date, December 31, 2015.
The carrying amounts of Pizzabo.it and La Nevera Roja were determined to be higher than their recoverable amounts of EUR 36,375 thousand and EUR 75,625 thousand. Therefore, an impairment loss was recognized for each CGU.
The impairment loss was fully allocated to goodwill and included in the reportable segment “Other”.
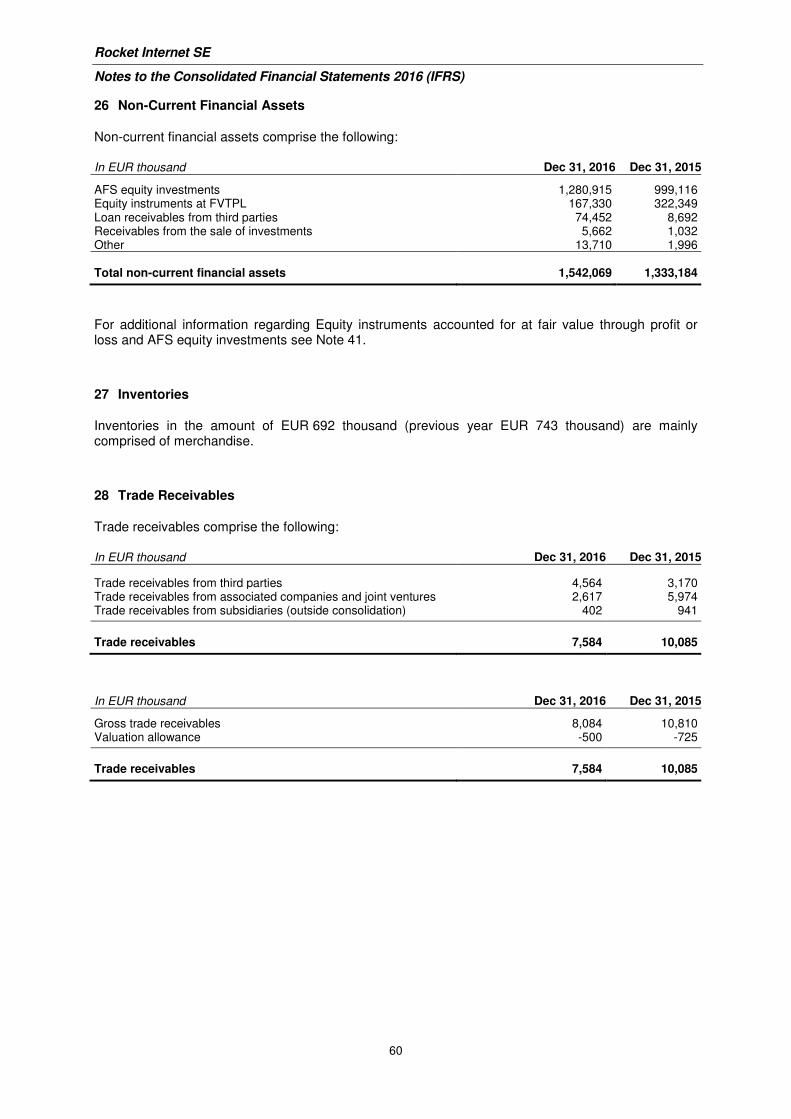
Rocket Internet SE
Notes to the Consolidated Financial Statements 2016 (IFRS)
60
26 Non-Current Financial Assets
Non-current financial assets comprise the following:
In EUR thousand Dec 31, 2016 Dec 31, 2015
AFS equity investments 1,280,915 999,116 Equity instruments at FVTPL 167,330 322,349 Loan receivables from third parties 74,452 8,692 Receivables from the sale of investments 5,662 1,032 Other 13,710 1,996
Total non-current financial assets 1,542,069 1,333,184
For additional information regarding Equity instruments accounted for at fair value through profit or loss and AFS equity investments see Note 41.
27 Inventories
Inventories in the amount of EUR 692 thousand (previous year EUR 743 thousand) are mainly comprised of merchandise.
28 Trade Receivables
Trade receivables comprise the following:
In EUR thousand Dec 31, 2016 Dec 31, 2015
Trade receivables from third parties 4,564 3,170 Trade receivables from associated companies and joint ventures 2,617 5,974 Trade receivables from subsidiaries (outside consolidation) 402 941 Trade receivables 7,584 10,085
In EUR thousand Dec 31, 2016 Dec 31, 2015
Gross trade receivables 8,084 10,810 Valuation allowance -500 -725 Trade receivables 7,584 10,085
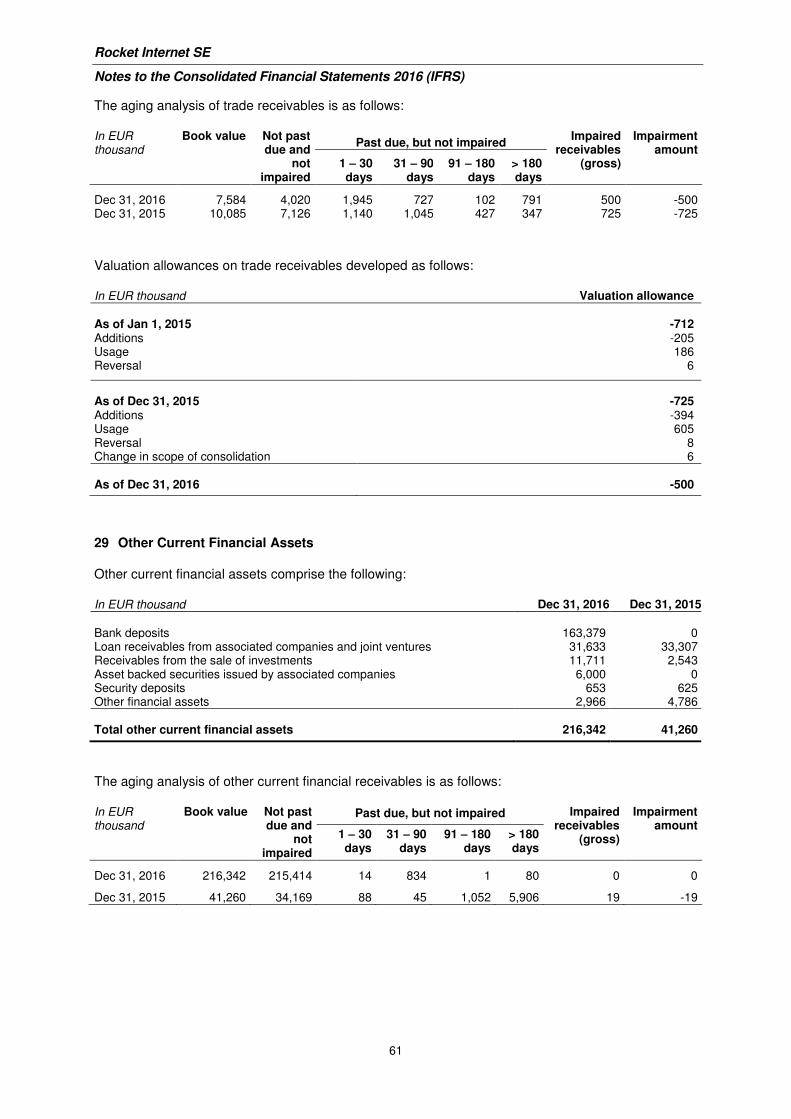
Rocket Internet SE
Notes to the Consolidated Financial Statements 2016 (IFRS)
61
The aging analysis of trade receivables is as follows:
In EUR thousand
Book value Not past due and
not impaired
Past due, but not impaired Impaired
receivables (gross)
Impairment amount
1 – 30 days
31 – 90 days
91 – 180 days
> 180 days
Dec 31, 2016 7,584 4,020 1,945 727 102 791 500 -500 Dec 31, 2015 10,085 7,126 1,140 1,045 427 347 725 -725
Valuation allowances on trade receivables developed as follows:
In EUR thousand Valuation allowance As of Jan 1, 2015 -712 Additions -205 Usage 186 Reversal 6
As of Dec 31, 2015 -725 Additions -394 Usage 605 Reversal 8 Change in scope of consolidation 6
As of Dec 31, 2016 -500
29 Other Current Financial Assets
Other current financial assets comprise the following:
In EUR thousand Dec 31, 2016 Dec 31, 2015
Bank deposits 163,379 0 Loan receivables from associated companies and joint ventures 31,633 33,307 Receivables from the sale of investments 11,711 2,543 Asset backed securities issued by associated companies 6,000 0 Security deposits 653 625 Other financial assets 2,966 4,786
Total other current financial assets 216,342 41,260
The aging analysis of other current financial receivables is as follows:
In EUR thousand
Book value Not past due and
not impaired
Past due, but not impaired Impaired receivables
(gross)
Impairment amount
1 – 30 days
31 – 90 days
91 – 180 days
> 180 days
Dec 31, 2016 216,342 215,414 14 834 1 80 0 0
Dec 31, 2015 41,260 34,169 88 45 1,052 5,906 19 -19
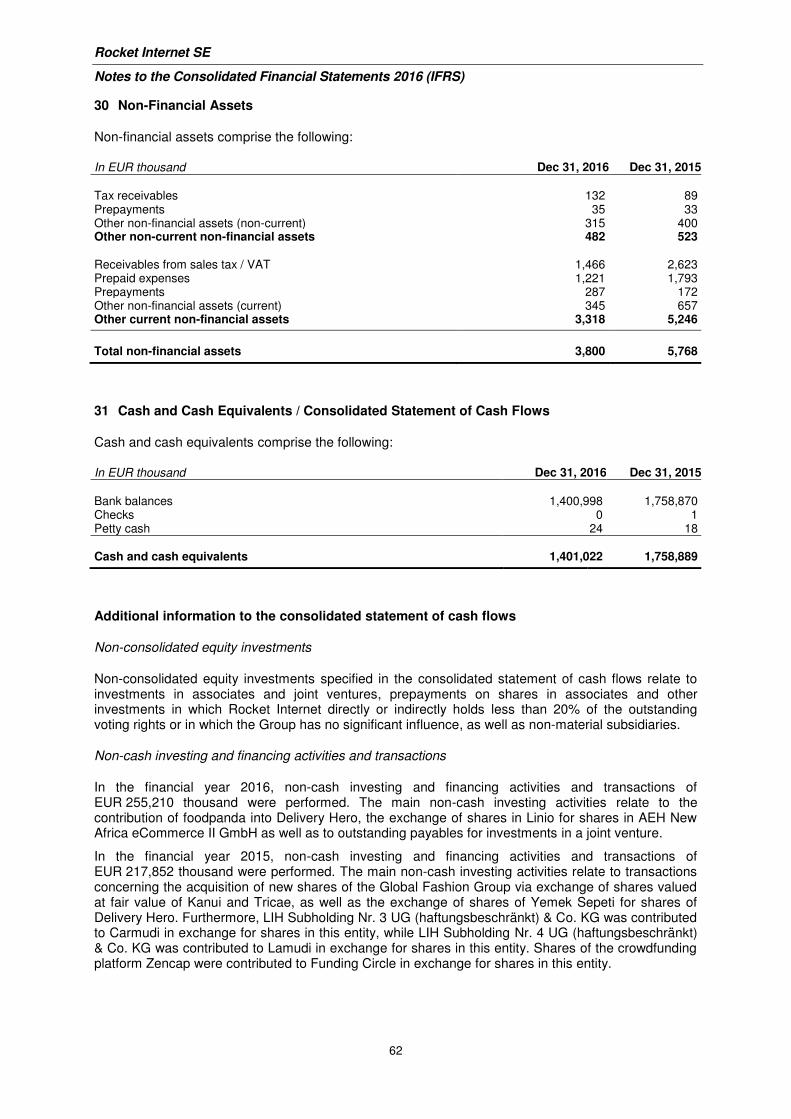
Rocket Internet SE
Notes to the Consolidated Financial Statements 2016 (IFRS)
62
30 Non-Financial Assets
Non-financial assets comprise the following:
In EUR thousand Dec 31, 2016 Dec 31, 2015
Tax receivables 132 89 Prepayments 35 33 Other non-financial assets (non-current) 315 400 Other non-current non-financial assets 482 523 Receivables from sales tax / VAT 1,466 2,623 Prepaid expenses 1,221 1,793 Prepayments 287 172 Other non-financial assets (current) 345 657 Other current non-financial assets 3,318 5,246 Total non-financial assets 3,800 5,768
31 Cash and Cash Equivalents / Consolidated Statement of Cash Flows
Cash and cash equivalents comprise the following:
In EUR thousand Dec 31, 2016 Dec 31, 2015
Bank balances 1,400,998 1,758,870 Checks 0 1 Petty cash 24 18
Cash and cash equivalents 1,401,022 1,758,889
Additional information to the consolidated statement of cash flows
Non-consolidated equity investments
Non-consolidated equity investments specified in the consolidated statement of cash flows relate to investments in associates and joint ventures, prepayments on shares in associates and other investments in which Rocket Internet directly or indirectly holds less than 20% of the outstanding voting rights or in which the Group has no significant influence, as well as non-material subsidiaries.
Non-cash investing and financing activities and transactions
In the financial year 2016, non-cash investing and financing activities and transactions of EUR 255,210 thousand were performed. The main non-cash investing activities relate to the contribution of foodpanda into Delivery Hero, the exchange of shares in Linio for shares in AEH New Africa eCommerce II GmbH as well as to outstanding payables for investments in a joint venture.
In the financial year 2015, non-cash investing and financing activities and transactions of EUR 217,852 thousand were performed. The main non-cash investing activities relate to transactions concerning the acquisition of new shares of the Global Fashion Group via exchange of shares valued at fair value of Kanui and Tricae, as well as the exchange of shares of Yemek Sepeti for shares of Delivery Hero. Furthermore, LIH Subholding Nr. 3 UG (haftungsbeschränkt) & Co. KG was contributed to Carmudi in exchange for shares in this entity, while LIH Subholding Nr. 4 UG (haftungsbeschränkt) & Co. KG was contributed to Lamudi in exchange for shares in this entity. Shares of the crowdfunding platform Zencap were contributed to Funding Circle in exchange for shares in this entity.
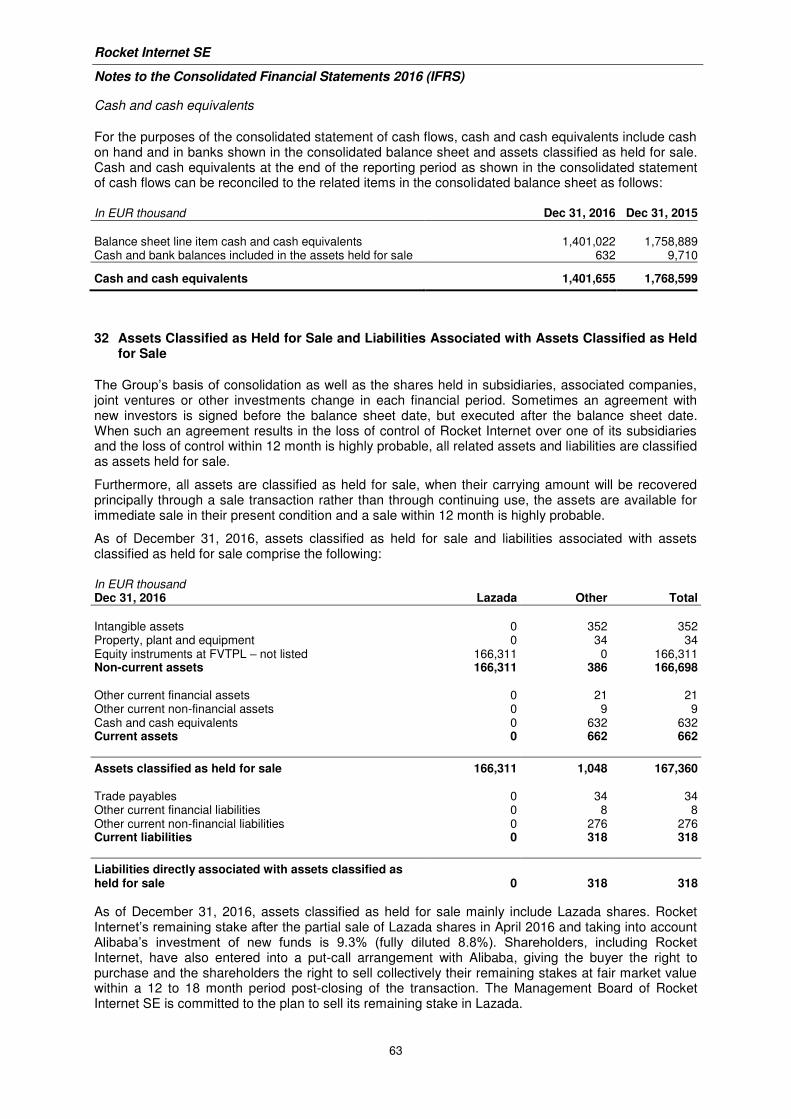
Rocket Internet SE
Notes to the Consolidated Financial Statements 2016 (IFRS)
63
Cash and cash equivalents
For the purposes of the consolidated statement of cash flows, cash and cash equivalents include cash on hand and in banks shown in the consolidated balance sheet and assets classified as held for sale. Cash and cash equivalents at the end of the reporting period as shown in the consolidated statement of cash flows can be reconciled to the related items in the consolidated balance sheet as follows:
In EUR thousand Dec 31, 2016 Dec 31, 2015
Balance sheet line item cash and cash equivalents 1,401,022 1,758,889 Cash and bank balances included in the assets held for sale 632 9,710
Cash and cash equivalents 1,401,655 1,768,599
32 Assets Classified as Held for Sale and Liabilities Associated with Assets Classified as Held for Sale
The Group’s basis of consolidation as well as the shares held in subsidiaries, associated companies, joint ventures or other investments change in each financial period. Sometimes an agreement with new investors is signed before the balance sheet date, but executed after the balance sheet date. When such an agreement results in the loss of control of Rocket Internet over one of its subsidiaries and the loss of control within 12 month is highly probable, all related assets and liabilities are classified as assets held for sale.
Furthermore, all assets are classified as held for sale, when their carrying amount will be recovered principally through a sale transaction rather than through continuing use, the assets are available for immediate sale in their present condition and a sale within 12 month is highly probable.
As of December 31, 2016, assets classified as held for sale and liabilities associated with assets classified as held for sale comprise the following:
In EUR thousand Dec 31, 2016 Lazada Other Total
Intangible assets 0 352 352 Property, plant and equipment 0 34 34 Equity instruments at FVTPL – not listed 166,311 0 166,311 Non-current assets 166,311 386 166,698 Other current financial assets 0 21 21 Other current non-financial assets 0 9 9 Cash and cash equivalents 0 632 632 Current assets 0 662 662
Assets classified as held for sale 166,311 1,048 167,360 Trade payables 0 34 34 Other current financial liabilities 0 8 8 Other current non-financial liabilities 0 276 276 Current liabilities 0 318 318
Liabilities directly associated with assets classified as held for sale 0 318 318
As of December 31, 2016, assets classified as held for sale mainly include Lazada shares. Rocket Internet’s remaining stake after the partial sale of Lazada shares in April 2016 and taking into account Alibaba’s investment of new funds is 9.3% (fully diluted 8.8%). Shareholders, including Rocket Internet, have also entered into a put-call arrangement with Alibaba, giving the buyer the right to purchase and the shareholders the right to sell collectively their remaining stakes at fair market value within a 12 to 18 month period post-closing of the transaction. The Management Board of Rocket Internet SE is committed to the plan to sell its remaining stake in Lazada.
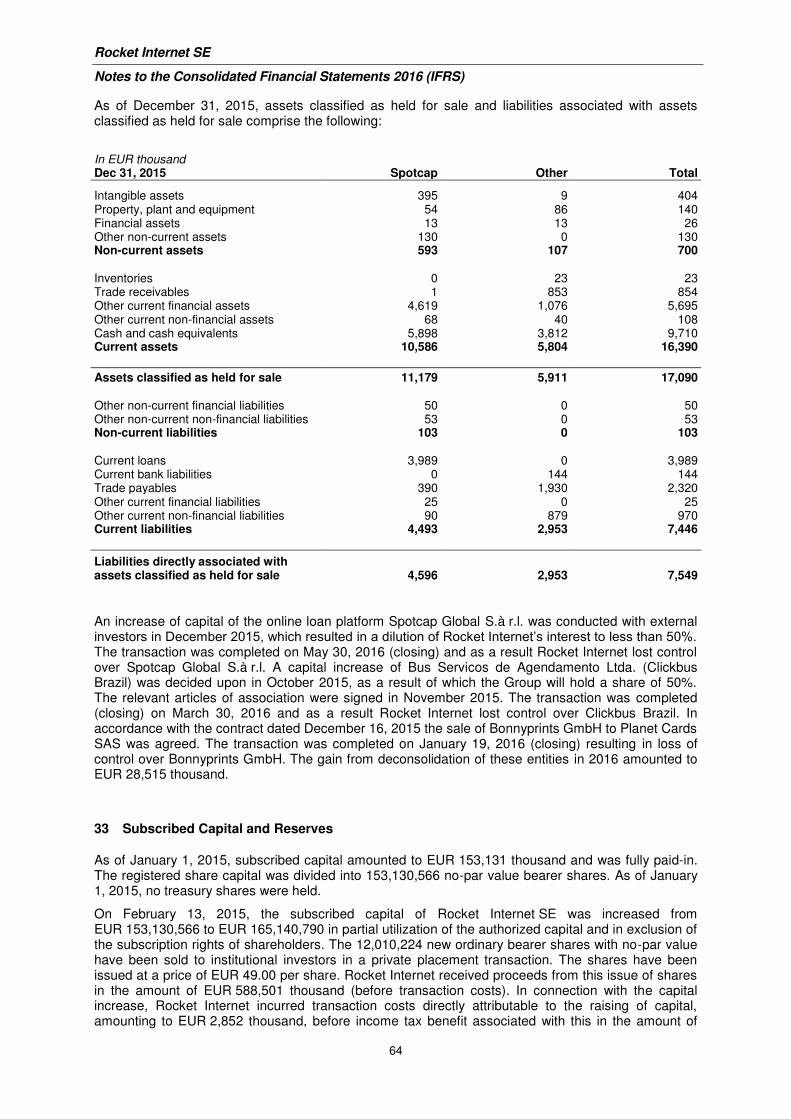
Rocket Internet SE
Notes to the Consolidated Financial Statements 2016 (IFRS)
64
As of December 31, 2015, assets classified as held for sale and liabilities associated with assets classified as held for sale comprise the following:
In EUR thousand Dec 31, 2015 Spotcap Other Total
Intangible assets 395 9 404 Property, plant and equipment 54 86 140 Financial assets 13 13 26 Other non-current assets 130 0 130 Non-current assets 593 107 700 Inventories 0 23 23 Trade receivables 1 853 854 Other current financial assets 4,619 1,076 5,695 Other current non-financial assets 68 40 108 Cash and cash equivalents 5,898 3,812 9,710 Current assets 10,586 5,804 16,390
Assets classified as held for sale 11,179 5,911 17,090 Other non-current financial liabilities 50 0 50 Other non-current non-financial liabilities 53 0 53 Non-current liabilities 103 0 103 Current loans 3,989 0 3,989 Current bank liabilities 0 144 144 Trade payables 390 1,930 2,320 Other current financial liabilities 25 0 25 Other current non-financial liabilities 90 879 970 Current liabilities 4,493 2,953 7,446
Liabilities directly associated with assets classified as held for sale 4,596 2,953 7,549
An increase of capital of the online loan platform Spotcap Global S.à r.l. was conducted with external investors in December 2015, which resulted in a dilution of Rocket Internet’s interest to less than 50%. The transaction was completed on May 30, 2016 (closing) and as a result Rocket Internet lost control over Spotcap Global S.à r.l. A capital increase of Bus Servicos de Agendamento Ltda. (Clickbus Brazil) was decided upon in October 2015, as a result of which the Group will hold a share of 50%. The relevant articles of association were signed in November 2015. The transaction was completed (closing) on March 30, 2016 and as a result Rocket Internet lost control over Clickbus Brazil. In accordance with the contract dated December 16, 2015 the sale of Bonnyprints GmbH to Planet Cards SAS was agreed. The transaction was completed on January 19, 2016 (closing) resulting in loss of control over Bonnyprints GmbH. The gain from deconsolidation of these entities in 2016 amounted to EUR 28,515 thousand.
33 Subscribed Capital and Reserves
As of January 1, 2015, subscribed capital amounted to EUR 153,131 thousand and was fully paid-in. The registered share capital was divided into 153,130,566 no-par value bearer shares. As of January 1, 2015, no treasury shares were held.
On February 13, 2015, the subscribed capital of Rocket Internet SE was increased from EUR 153,130,566 to EUR 165,140,790 in partial utilization of the authorized capital and in exclusion of the subscription rights of shareholders. The 12,010,224 new ordinary bearer shares with no-par value have been sold to institutional investors in a private placement transaction. The shares have been issued at a price of EUR 49.00 per share. Rocket Internet received proceeds from this issue of shares in the amount of EUR 588,501 thousand (before transaction costs). In connection with the capital increase, Rocket Internet incurred transaction costs directly attributable to the raising of capital, amounting to EUR 2,852 thousand, before income tax benefit associated with this in the amount of
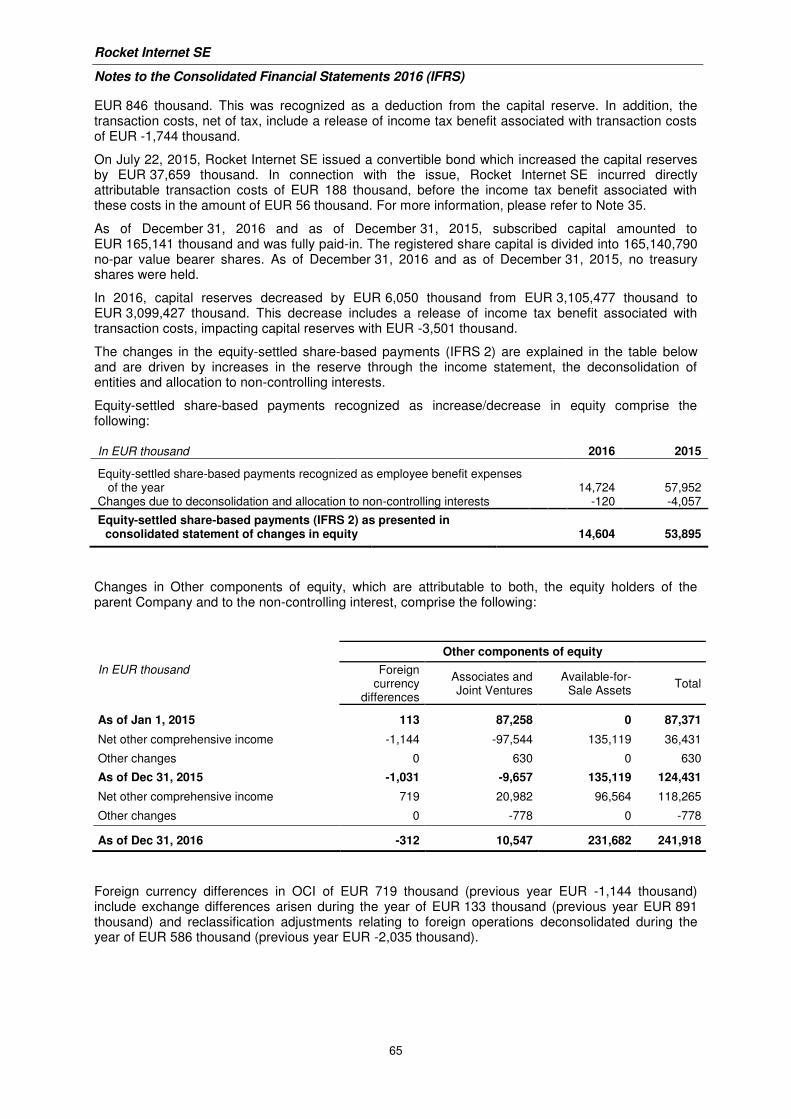
Rocket Internet SE
Notes to the Consolidated Financial Statements 2016 (IFRS)
65
EUR 846 thousand. This was recognized as a deduction from the capital reserve. In addition, the transaction costs, net of tax, include a release of income tax benefit associated with transaction costs of EUR -1,744 thousand.
On July 22, 2015, Rocket Internet SE issued a convertible bond which increased the capital reserves by EUR 37,659 thousand. In connection with the issue, Rocket Internet SE incurred directly attributable transaction costs of EUR 188 thousand, before the income tax benefit associated with these costs in the amount of EUR 56 thousand. For more information, please refer to Note 35.
As of December 31, 2016 and as of December 31, 2015, subscribed capital amounted to EUR 165,141 thousand and was fully paid-in. The registered share capital is divided into 165,140,790 no-par value bearer shares. As of December 31, 2016 and as of December 31, 2015, no treasury shares were held.
In 2016, capital reserves decreased by EUR 6,050 thousand from EUR 3,105,477 thousand to EUR 3,099,427 thousand. This decrease includes a release of income tax benefit associated with transaction costs, impacting capital reserves with EUR -3,501 thousand.
The changes in the equity-settled share-based payments (IFRS 2) are explained in the table below and are driven by increases in the reserve through the income statement, the deconsolidation of entities and allocation to non-controlling interests.
Equity-settled share-based payments recognized as increase/decrease in equity comprise the following:
In EUR thousand 2016 2015
Equity-settled share-based payments recognized as employee benefit expenses of the year 14,724 57,952 Changes due to deconsolidation and allocation to non-controlling interests -120 -4,057
Equity-settled share-based payments (IFRS 2) as presented in consolidated statement of changes in equity 14,604 53,895
Changes in Other components of equity, which are attributable to both, the equity holders of the parent Company and to the non-controlling interest, comprise the following:
Other components of equity
In EUR thousand Foreign currency
differences
Associates and Joint Ventures
Available-for-Sale Assets
Total
As of Jan 1, 2015 113 87,258 0 87,371
Net other comprehensive income -1,144 -97,544 135,119 36,431
Other changes 0 630 0 630
As of Dec 31, 2015 -1,031 -9,657 135,119 124,431
Net other comprehensive income 719 20,982 96,564 118,265
Other changes 0 -778 0 -778
As of Dec 31, 2016 -312 10,547 231,682 241,918
Foreign currency differences in OCI of EUR 719 thousand (previous year EUR -1,144 thousand) include exchange differences arisen during the year of EUR 133 thousand (previous year EUR 891 thousand) and reclassification adjustments relating to foreign operations deconsolidated during the year of EUR 586 thousand (previous year EUR -2,035 thousand).
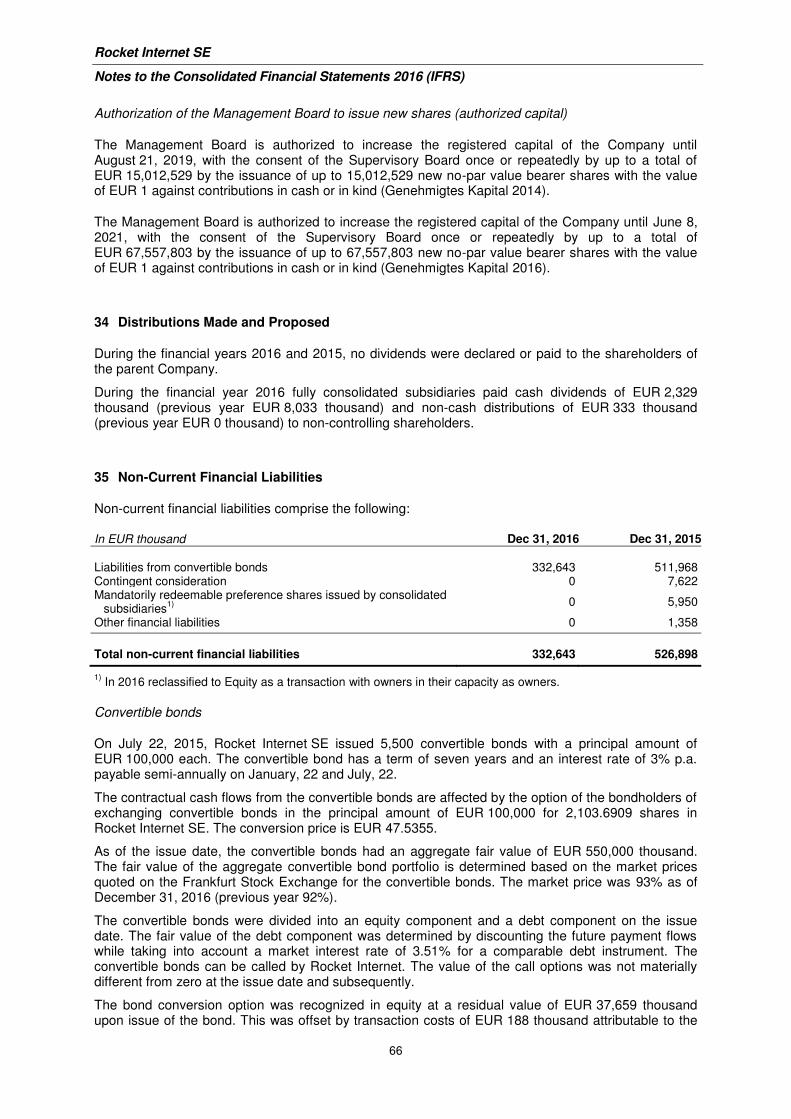
Rocket Internet SE
Notes to the Consolidated Financial Statements 2016 (IFRS)
66
Authorization of the Management Board to issue new shares (authorized capital)
The Management Board is authorized to increase the registered capital of the Company until August 21, 2019, with the consent of the Supervisory Board once or repeatedly by up to a total of EUR 15,012,529 by the issuance of up to 15,012,529 new no-par value bearer shares with the value of EUR 1 against contributions in cash or in kind (Genehmigtes Kapital 2014).
The Management Board is authorized to increase the registered capital of the Company until June 8, 2021, with the consent of the Supervisory Board once or repeatedly by up to a total of EUR 67,557,803 by the issuance of up to 67,557,803 new no-par value bearer shares with the value of EUR 1 against contributions in cash or in kind (Genehmigtes Kapital 2016).
34 Distributions Made and Proposed
During the financial years 2016 and 2015, no dividends were declared or paid to the shareholders of the parent Company.
During the financial year 2016 fully consolidated subsidiaries paid cash dividends of EUR 2,329 thousand (previous year EUR 8,033 thousand) and non-cash distributions of EUR 333 thousand (previous year EUR 0 thousand) to non-controlling shareholders.
35 Non-Current Financial Liabilities
Non-current financial liabilities comprise the following:
In EUR thousand Dec 31, 2016 Dec 31, 2015
Liabilities from convertible bonds 332,643 511,968 Contingent consideration 0 7,622 Mandatorily redeemable preference shares issued by consolidated
subsidiaries1)
0 5,950
Other financial liabilities 0 1,358 Total non-current financial liabilities 332,643 526,898 1)
In 2016 reclassified to Equity as a transaction with owners in their capacity as owners.
Convertible bonds
On July 22, 2015, Rocket Internet SE issued 5,500 convertible bonds with a principal amount of EUR 100,000 each. The convertible bond has a term of seven years and an interest rate of 3% p.a. payable semi-annually on January, 22 and July, 22.
The contractual cash flows from the convertible bonds are affected by the option of the bondholders of exchanging convertible bonds in the principal amount of EUR 100,000 for 2,103.6909 shares in Rocket Internet SE. The conversion price is EUR 47.5355.
As of the issue date, the convertible bonds had an aggregate fair value of EUR 550,000 thousand. The fair value of the aggregate convertible bond portfolio is determined based on the market prices quoted on the Frankfurt Stock Exchange for the convertible bonds. The market price was 93% as of December 31, 2016 (previous year 92%).
The convertible bonds were divided into an equity component and a debt component on the issue date. The fair value of the debt component was determined by discounting the future payment flows while taking into account a market interest rate of 3.51% for a comparable debt instrument. The convertible bonds can be called by Rocket Internet. The value of the call options was not materially different from zero at the issue date and subsequently.
The bond conversion option was recognized in equity at a residual value of EUR 37,659 thousand upon issue of the bond. This was offset by transaction costs of EUR 188 thousand attributable to the
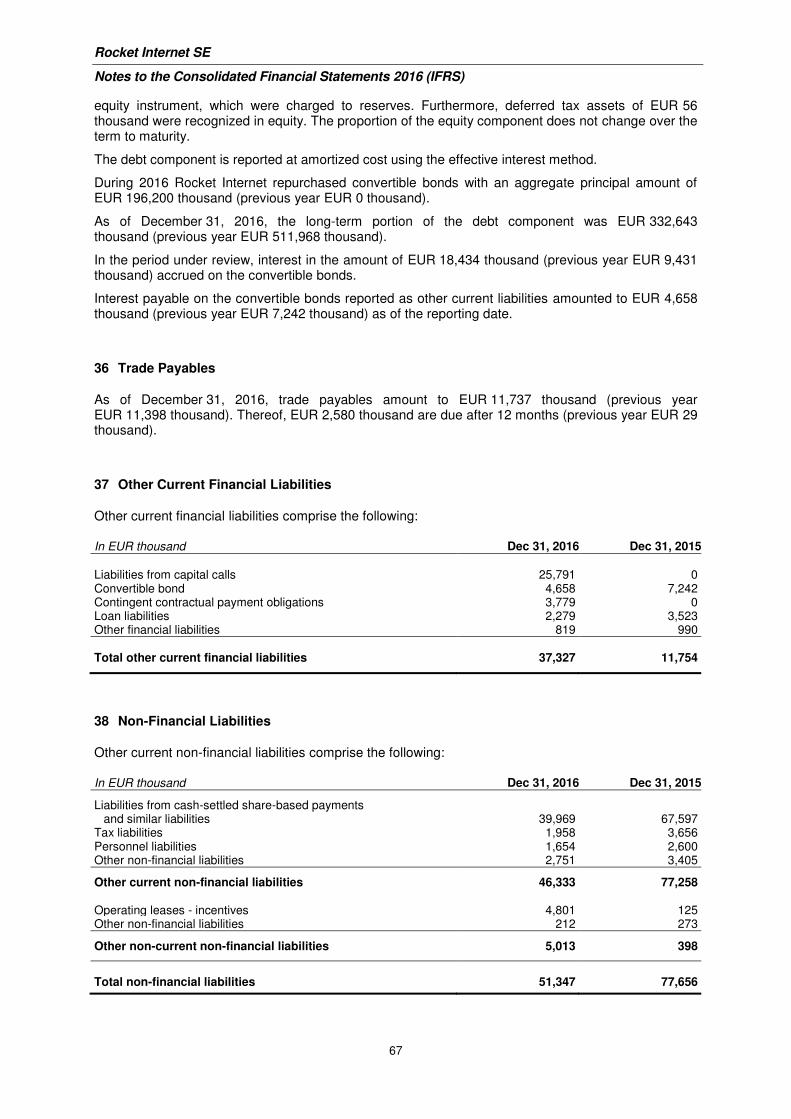
Rocket Internet SE
Notes to the Consolidated Financial Statements 2016 (IFRS)
67
equity instrument, which were charged to reserves. Furthermore, deferred tax assets of EUR 56 thousand were recognized in equity. The proportion of the equity component does not change over the term to maturity.
The debt component is reported at amortized cost using the effective interest method.
During 2016 Rocket Internet repurchased convertible bonds with an aggregate principal amount of EUR 196,200 thousand (previous year EUR 0 thousand).
As of December 31, 2016, the long-term portion of the debt component was EUR 332,643 thousand (previous year EUR 511,968 thousand).
In the period under review, interest in the amount of EUR 18,434 thousand (previous year EUR 9,431 thousand) accrued on the convertible bonds.
Interest payable on the convertible bonds reported as other current liabilities amounted to EUR 4,658 thousand (previous year EUR 7,242 thousand) as of the reporting date.
36 Trade Payables
As of December 31, 2016, trade payables amount to EUR 11,737 thousand (previous year EUR 11,398 thousand). Thereof, EUR 2,580 thousand are due after 12 months (previous year EUR 29 thousand).
37 Other Current Financial Liabilities
Other current financial liabilities comprise the following:
In EUR thousand Dec 31, 2016 Dec 31, 2015
Liabilities from capital calls 25,791 0 Convertible bond 4,658 7,242 Contingent contractual payment obligations 3,779 0 Loan liabilities 2,279 3,523 Other financial liabilities 819 990
Total other current financial liabilities 37,327 11,754
38 Non-Financial Liabilities
Other current non-financial liabilities comprise the following:
In EUR thousand Dec 31, 2016 Dec 31, 2015
Liabilities from cash-settled share-based payments and similar liabilities 39,969 67,597
Tax liabilities 1,958 3,656 Personnel liabilities 1,654 2,600 Other non-financial liabilities 2,751 3,405
Other current non-financial liabilities 46,333 77,258 Operating leases - incentives 4,801 125 Other non-financial liabilities 212 273
Other non-current non-financial liabilities 5,013 398
Total non-financial liabilities 51,347 77,656
Rocket Internet SE
Notes to the Consolidated Financial Statements 2016 (IFRS)
68
Liabilities from cash-settled share-based payments relate to employees as well as to others providing similar services (as defined in IFRS 2 and IAS 19).
39 Share-Based Compensation
The Group operates share-based compensation arrangements for eligible and selected directors, employees or others providing similar services to the Group (“a participant” or “participants”). These arrangements consist of four different types of awards:
- I. Share options in the Company,
- II. Ordinary shares in subsidiaries,
- III. Share options in subsidiaries or
- IV. Cash-settled awards.
I. Share options in the Company (Stock Option Programs 2014)
Under the Stock Option Programs 2014 (“SOP I” and “SOP II”), one share option grants the holder the right to subscribe for one share of the Company. Rocket Internet has the right, without any obligation, to pay the entitlements in cash instead of in shares.
All share options under the SOP I were granted to the Company’s CEO after the listing of the Company’s shares on the Open Market of the Frankfurt Stock Exchange (Frankfurter Wertpapierbörse or the ‘Open Market’) on October 2, 2014. These share options have an exercise price of EUR 42.63 per share option and will vest in monthly installments over a five-year vesting period and can be, subject to certain conditions, exercised after a waiting period of four years commencing on the date the share options were granted.
The options granted under the SOP I can only be exercised if among others:
(i) the Company successfully launches an average of at least four companies per year during the four-year waiting period; and
(ii) the stock price reflects, on at least one single trading day within the waiting period, a Company valuation of EUR 4 billion plus the total of all amounts paid in through capital increases or payments into the capital reserves since May 27, 2014 until the relevant trading day.
Under the SOP II, the Supervisory Board is authorized to grant up to 1,201,022 share options to each of the other two members of the Managing Board (i.e. the CFO and the General Managing Director), up to 1,201,023 share options to certain employees of the Company, up to 3,002,557 share options to members of the management of affiliated companies, and up to 600,511 share options to certain employees of affiliated companies. In 2016, a total of 725,180 options (2015: 80.000 options) were granted under SOP II.
The SOP II provides for an overall ten-year vesting period with a certain number of share options vesting after an initial four-year vesting term and the remaining share options vesting in yearly installments thereafter. The share options can be, subject to their vesting and certain other conditions, exercised after a four-year waiting period commencing on the date the respective share options are granted.
The exercise price of the share options granted prior to listing of the Company’s shares in the Open Market amounts to EUR 26.14 per share option. For share options granted subsequent to the listing of the Company’s shares in the Open Market the exercise price per share option corresponds to the volume-weighted average closing price of the shares twenty consecutive trading days prior to the relevant grant date.
The exercise of share options under the SOP II requires that:
(i) the shares of the Company are included in the Open Market until October 31, 2014; and
(ii) the Company successfully launches an average of at least four companies per year during the four-year waiting period.
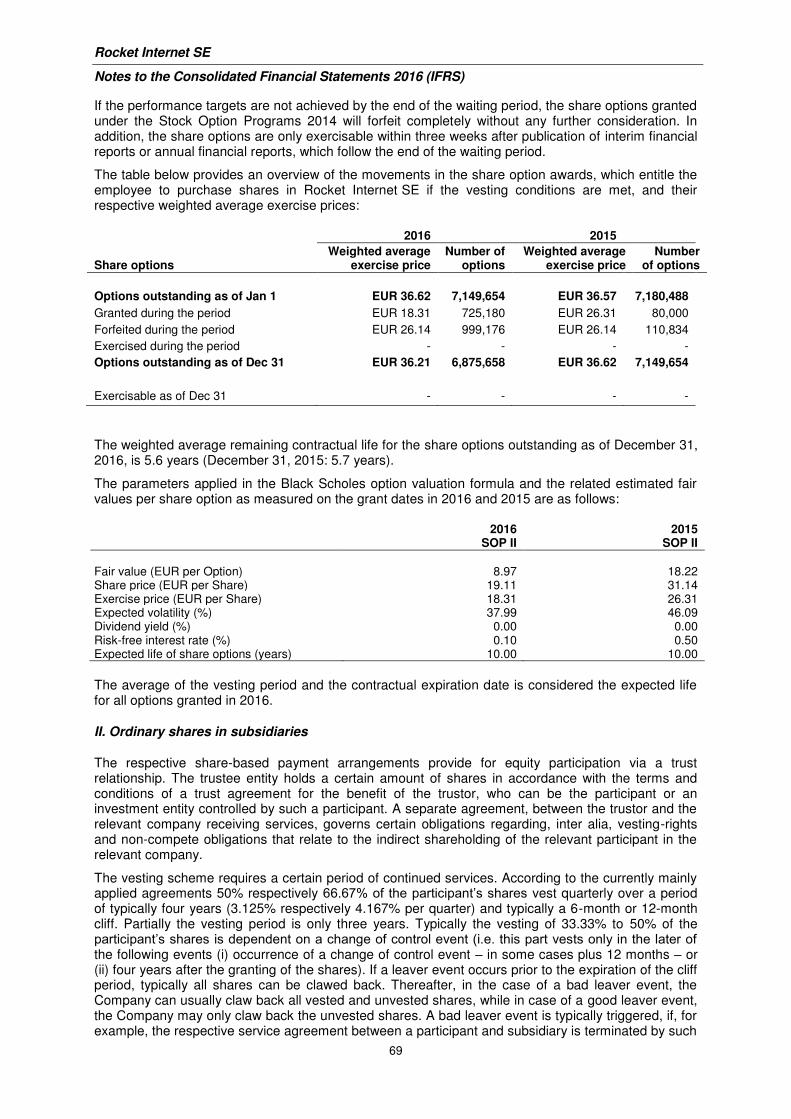
Rocket Internet SE
Notes to the Consolidated Financial Statements 2016 (IFRS)
69
If the performance targets are not achieved by the end of the waiting period, the share options granted under the Stock Option Programs 2014 will forfeit completely without any further consideration. In addition, the share options are only exercisable within three weeks after publication of interim financial reports or annual financial reports, which follow the end of the waiting period.
The table below provides an overview of the movements in the share option awards, which entitle the employee to purchase shares in Rocket Internet SE if the vesting conditions are met, and their respective weighted average exercise prices:
2016 2015
Share options Weighted average
exercise price Number of
options Weighted average
exercise price Number
of options
Options outstanding as of Jan 1 EUR 36.62 7,149,654 EUR 36.57 7,180,488
Granted during the period EUR 18.31 725,180 EUR 26.31 80,000
Forfeited during the period EUR 26.14 999,176 EUR 26.14 110,834
Exercised during the period - - - -
Options outstanding as of Dec 31 EUR 36.21 6,875,658 EUR 36.62 7,149,654
Exercisable as of Dec 31 - - - -
The weighted average remaining contractual life for the share options outstanding as of December 31, 2016, is 5.6 years (December 31, 2015: 5.7 years).
The parameters applied in the Black Scholes option valuation formula and the related estimated fair values per share option as measured on the grant dates in 2016 and 2015 are as follows:
2016
SOP II 2015
SOP II
Fair value (EUR per Option) 8.97 18.22 Share price (EUR per Share) 19.11 31.14 Exercise price (EUR per Share) 18.31 26.31 Expected volatility (%) 37.99 46.09 Dividend yield (%) 0.00 0.00 Risk-free interest rate (%) 0.10 0.50 Expected life of share options (years) 10.00 10.00
The average of the vesting period and the contractual expiration date is considered the expected life for all options granted in 2016.
II. Ordinary shares in subsidiaries
The respective share-based payment arrangements provide for equity participation via a trust relationship. The trustee entity holds a certain amount of shares in accordance with the terms and conditions of a trust agreement for the benefit of the trustor, who can be the participant or an investment entity controlled by such a participant. A separate agreement, between the trustor and the relevant company receiving services, governs certain obligations regarding, inter alia, vesting-rights and non-compete obligations that relate to the indirect shareholding of the relevant participant in the relevant company.
The vesting scheme requires a certain period of continued services. According to the currently mainly applied agreements 50% respectively 66.67% of the participant’s shares vest quarterly over a period of typically four years (3.125% respectively 4.167% per quarter) and typically a 6-month or 12-month cliff. Partially the vesting period is only three years. Typically the vesting of 33.33% to 50% of the participant’s shares is dependent on a change of control event (i.e. this part vests only in the later of the following events (i) occurrence of a change of control event – in some cases plus 12 months – or (ii) four years after the granting of the shares). If a leaver event occurs prior to the expiration of the cliff period, typically all shares can be clawed back. Thereafter, in the case of a bad leaver event, the Company can usually claw back all vested and unvested shares, while in case of a good leaver event, the Company may only claw back the unvested shares. A bad leaver event is typically triggered, if, for example, the respective service agreement between a participant and subsidiary is terminated by such
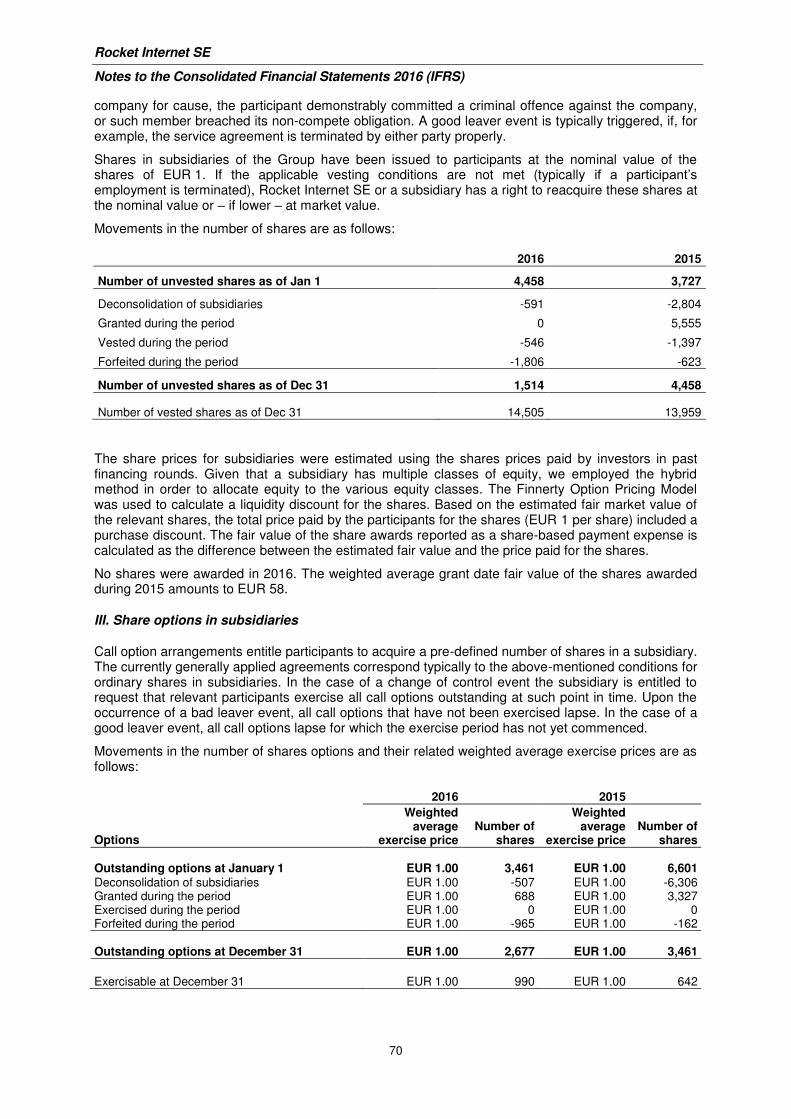
Rocket Internet SE
Notes to the Consolidated Financial Statements 2016 (IFRS)
70
company for cause, the participant demonstrably committed a criminal offence against the company, or such member breached its non-compete obligation. A good leaver event is typically triggered, if, for example, the service agreement is terminated by either party properly.
Shares in subsidiaries of the Group have been issued to participants at the nominal value of the shares of EUR 1. If the applicable vesting conditions are not met (typically if a participant’s employment is terminated), Rocket Internet SE or a subsidiary has a right to reacquire these shares at the nominal value or – if lower – at market value.
Movements in the number of shares are as follows:
2016 2015
Number of unvested shares as of Jan 1 4,458 3,727
Deconsolidation of subsidiaries -591 -2,804
Granted during the period 0 5,555
Vested during the period -546 -1,397
Forfeited during the period -1,806 -623
Number of unvested shares as of Dec 31 1,514 4,458
Number of vested shares as of Dec 31 14,505 13,959
The share prices for subsidiaries were estimated using the shares prices paid by investors in past financing rounds. Given that a subsidiary has multiple classes of equity, we employed the hybrid method in order to allocate equity to the various equity classes. The Finnerty Option Pricing Model was used to calculate a liquidity discount for the shares. Based on the estimated fair market value of the relevant shares, the total price paid by the participants for the shares (EUR 1 per share) included a purchase discount. The fair value of the share awards reported as a share-based payment expense is calculated as the difference between the estimated fair value and the price paid for the shares.
No shares were awarded in 2016. The weighted average grant date fair value of the shares awarded during 2015 amounts to EUR 58.
III. Share options in subsidiaries
Call option arrangements entitle participants to acquire a pre-defined number of shares in a subsidiary. The currently generally applied agreements correspond typically to the above-mentioned conditions for ordinary shares in subsidiaries. In the case of a change of control event the subsidiary is entitled to request that relevant participants exercise all call options outstanding at such point in time. Upon the occurrence of a bad leaver event, all call options that have not been exercised lapse. In the case of a good leaver event, all call options lapse for which the exercise period has not yet commenced.
Movements in the number of shares options and their related weighted average exercise prices are as follows:
2016 2015
Options
Weighted average
exercise price Number of
shares
Weighted average
exercise price Number of
shares
Outstanding options at January 1 EUR 1.00 3,461 EUR 1.00 6,601 Deconsolidation of subsidiaries EUR 1.00 -507 EUR 1.00 -6,306 Granted during the period EUR 1.00 688 EUR 1.00 3,327 Exercised during the period EUR 1.00 0 EUR 1.00 0 Forfeited during the period EUR 1.00 -965 EUR 1.00 -162
Outstanding options at December 31 EUR 1.00 2,677 EUR 1.00 3,461
Exercisable at December 31 EUR 1.00 990 EUR 1.00 642
Rocket Internet SE
Notes to the Consolidated Financial Statements 2016 (IFRS)
71
The contractual lives for the options are not specified in the option agreements. As a result, the weighted average remaining contractual life for the options outstanding at the reporting date is dependent on future exit events. In accordance with individual agreements, the outstanding options have an exercise price of EUR 1 per share.
As the options granted have an exercise price of EUR 1 per share, the fair values of the options are equal to their intrinsic values. Accordingly, the main parameters applied are as follows:
2016 2015
Range of share prices (EUR per share) 0 - 45,072 0 - 28,759 Exercise price (EUR per share) 1.00 1.00 The weighted average grant date fair value of the options granted during 2016 amounts to EUR 8,828 (previous year EUR 1,890) per share. In some cases, the grant date fair values have been estimated because the option agreements have not yet been finalized.
The consolidated subsidiaries’ share prices were estimated using the share price paid by investors in past financing rounds. Given that a subsidiary has multiple classes of equity, we employed the hybrid method in order to allocate equity to the various equity classes. The Finnerty Option Pricing Model was used to calculate a liquidity discount for the shares.
IV. Cash-settled awards
This type of share-based payment award granted by certain Group companies allows the participants to participate in exit-related cash payments via call option arrangements. The notional value and the actual distribution of the relevant call options to the participants are determined by the relevant company’s management and are subject to certain shareholders’ approvals. The participants are entitled to a cash payment amounting to the difference between the exercise price of the call options and the exit proceeds allocated to each share underlying the call options in case of a change of control or listing of the subsidiary on a stock exchange.
The carrying amount of the liability from cash-settled awards as of December 31, 2016 was EUR 35,054 thousand (December 31, 2015: EUR 64,141 thousand). All cash-settled awards had vested as of December 31, 2016 and 2015, respectively.
Total expense arising from share-based payment transactions
The expense recognized for employee services received during the year is shown in the following table:
In EUR thousand 2016 2015
Equity-settled share-based payments 14,724 57,952 Cash-settled share-based payments (income (-), expense (+)) -11,644 14,739 Total share-based payment expense 3,080 72,691
40 Financial Risk Management
The risk management function within the Company is carried out in respect of financial risks, operational risks and legal risks. The Group’s main risks arising from existing financial instruments relate to credit risk, liquidity risk, currency risk and share price risk.
The major financial instruments of Rocket Internet Group are cash (33% of total assets; previous year 35%) and short-term bank deposits (4% of total assets; previous year 0%), available-for-sale equity investments (31% of total assets; previous year 20%), equity instruments at fair value through profit or loss (FVTPL) (8% of total assets; previous year 6%) and other non-current financial assets (2% of total assets; previous year <1%), as well as liabilities from convertible bonds (8% of total assets; previous year 10%). The Group also records trade receivables and trade liabilities as well as loan receivables and loan liabilities mainly from associated companies and joint ventures, which arise in the ordinary course of business.
Rocket Internet SE
Notes to the Consolidated Financial Statements 2016 (IFRS)
72
The Group places available funds in current accounts seeking to ensure both liquidity and security of principal. The Group’s policy does not permit any trading with financial instruments.
The risk associated with financial assets is controlled through a sophisticated system of operational monitoring. This applies, in particular, to the equity holdings of Rocket Internet Group, which are accounted for either as available-for-sale equity investments (AFS) or at fair value through profit or loss (FVTPL).
Financial risk comprises credit risk, liquidity risk and market risk (currency risk, interest rate risk and share price risk). The primary objectives of the financial risk management function are to establish risk limits, and ensure that exposure to risks stays within these limits. The operational and legal risk management functions are intended to ensure proper functioning of internal policies and procedures, in order to minimize operational and legal risks.
Risk management is carried out by a central treasury department under control of Management Board. The Management Board establishes the principles for overall risk management, as well as policies covering specific areas, such as foreign exchange risk, interest rate risk and investment of excess liquidity.
Credit Risk
Credit risk is defined as the risk that our business partners do not meet their contractual payment obligations and this leads to a loss for Rocket Internet Group. The credit risk comprises the direct risk of a default and the decrease in the credit worthiness as well as the concentration of credit risks.
The credit risk exists for all financial assets in particular for cash and cash equivalents, receivables from associates and trade receivables. The Group’s receivables are unsecured. The maximum credit risk corresponds to the book value of the financial assets that are subject to this risk.
The investment of liquidity that is not needed for operational purposes is carried out according to criteria defined by Group policy. Rocket Internet Group, in general, only maintains business relationships with banks of outstanding credit rating. Diversification is another means to minimize risk. The credit worthiness is constantly monitored and evaluated by the Group. The investment of term deposits takes place with banks that are members of the respective bank deposit protection funds and/or that are rated with minimum investment grade rating BBB- (S&P) and Baa3 (Moody’s), respectively. Interest rate management focuses on optimized distribution of cash between different banks in order to avoid negative deposit rates.
The control and mitigation of credit risk of receivables from associates is carried out by the investment control function. Trade receivables mainly relate to the Group’s eCommerce activities. In the eCommerce sector, credit risk is mitigated through a careful review of customer credit ratings in the course of the online order process. In the event of deterioration in the payment habits or in case of other factors that indicate a requirement for impairment, the receivables management function either initiates measures aimed at the collection of the outstanding customer payments or at the return of the delivered merchandise. Customers’ credit rating is monitored on a continuous basis. The concentration of credit risks is limited because of the broad and heterogeneous structure of the customer base.
Any customer credit risks that are identified, e.g. in the case of discontinued payments, are taken into account through appropriate value adjustments.
The Company’s maximum exposure to credit risk by class of financial assets is as follows:
In EUR thousand Dec 31, 2016 Dec 31, 2015
Trade and other financial receivables 313,305 67,666 Cash and cash equivalents 1,401,655 1,768,599 Maximum exposure to credit risk 1,714,959 1,836,264
Liquidity Risk
Liquidity risk is the risk that an entity will encounter difficulty in meeting obligations associated with financial liabilities. The Company is exposed to daily calls on its available cash resources. Liquidity risk
Rocket Internet SE
Notes to the Consolidated Financial Statements 2016 (IFRS)
73
is managed by the Management of the Company. The Management Board monitors the Company’s cash flows based on monthly rolling forecasts.
The liquidity balance and compliance with cash budgets are controlled at regular intervals. In the process, the development of liquidity balances and important movement factors are communicated and discussed internally.
The Group’s capital requirements relate, inter alia, to the financing of new and existing companies and the current capital requirements of the Group’s operating business. Rocket Internet Group monitors the risk of liquidity shortages (liquidity risk) on a continuous basis through cash budgets and reforecasts taking into consideration the maturities of financial investments and financial assets (e.g. receivables and other financial assets), as well as expected cash flows from operating activities. In addition to cash and cash equivalents as well as income from the sale of financial assets, future cash flows from operating activities represent another source of liquidity.
As of December 31, 2016, the Company’s current assets, including assets classified as held for sale in the amount of EUR 1,798,936 thousand (previous year EUR 1,833,796 thousand) exceeded current liabilities in the amount of EUR 96,868 thousand (previous year EUR 108,471 thousand) by an amount of EUR 1,702,068 thousand (previous year EUR 1,725,325 thousand). The Company invests the funds almost entirely in demand deposits, in order to be able to respond quickly and smoothly to unforeseen liquidity requirements. The Company’s liquidity portfolio comprises cash and cash equivalents.
The maturity analysis of financial liabilities is as follows:
Dec 31, 2015 Carrying amount
Cash flows < 1 year Cash flows 1 - 5 years Cash flows > 5 years
In EUR thousand Principal Interest Principal Interest Principal Interest
Convertible bond 519,210 0 -16,500 0 -66,000 -550,000 -33,000 Interest-bearing loans
and borrowings 4,746 -3,577 -10 -1,161 -8 -7 0
Other non-current financial liabilities
13,719 0 0 -13,719 0 0 0
Other current financial liabilities
978 -978 0 0 0 0 0
Trade payables 11,398 -11,369 0 -29 0 0 0
The amounts disclosed in the tables are the contractual undiscounted cash flows.
Market risks
Currency risk
The Group is exposed to currency risks due to its international business activities outside of the Eurozone. Changes in exchange rates can therefore have an impact on the consolidated financial statements. To the extent possible and feasible, hedging is not performed by way of financial engineering measures, but rather through the structuring of existing economic conditions (“natural hedging”). The Group occasionally enters into foreign currency derivative contracts to mitigate certain foreign currency exposures. Effects of exchange rate fluctuations resulting from the translation of the financial statements of subsidiaries having a different functional currency into the reporting currency are recognized in equity in the consolidated financial statements. Foreign exchange differences that
Dec 31, 2016 Carrying amount
Cash flows < 1 year Cash flows 1 - 5 years Cash flows > 5 years
In EUR thousand Principal Interest Principal Interest Principal Interest
Convertible bond 337,302 0 -10,614 0 -42,456 -353,800 -10,614 Interest-bearing loans
and borrowings 2,280 -2,280 -7 0 0 0 0
Other current financial liabilities
30,389 -30,389 0 0 0 0 0
Trade payables 11,737 -9,079 0 -1,280 0 -1,762 0
Rocket Internet SE
Notes to the Consolidated Financial Statements 2016 (IFRS)
74
result from exchange rate changes when translating monetary balance sheet items in foreign currency are recognized in the income statement in other operating expenses or income.
The individual Group companies mainly operate in their functional currency. Therefore, there are no material foreign currency risks for the companies themselves.
In accordance with IFRS 7, currency risks are depicted using sensitivity analyses. These analyses portray the impact of upward/downward revaluations of the euro in relation to all foreign currencies on earnings before income taxes and, if applicable, on equity. These analyses are based on financial instruments that are denominated in a currency different from the local functional currency and are of a monetary nature. In accordance with the requirements of IFRS 7, exchange rate-related differences from the translation of financial statements into the Group currency (euro) are not stated. There was no separate impact on equity.
Rocket Internet has bank accounts in US Dollar (USD) with a credit of USD 134,922 thousand (previous year USD 137,708 thousand) and other net financial assets in the amount of USD 134,931 thousand (previous year USD 2,280 thousand).
The following table demonstrates the sensitivity to a reasonably possible change in US Dollar (USD) exchange rates, with all other variables remaining unchanged. The Group’s exposure to foreign currency changes for all other currencies is not material.
In EUR thousand Dec 31, 2016 Dec 31, 2015
Effect on the balance sheet and profit before tax
Change in USD rate + 10% 25,600 12,858 Change in USD rate - 10% -25,600 -12,858
In financial year 2016, a net foreign exchange gain of EUR 13,089 thousand (previous year net gain of
EUR 4,272 thousand) was recognized.
In EUR thousand Dec 31, 2016 Dec 31, 2015
Net Foreign Exchange Gain - Operational 180 2,599 Net Foreign Exchange Gain - Financial 13,493 2,068 Net Foreign Exchange Loss - Operational -301 -378 Net Foreign Exchange Loss - Financial -283 -17
Net Foreign Exchange Gain 13,089 4,272
Interest Rate Risk
Interest rate risk is the risk that the fair value or future cash flow of a financial instrument will fluctuate due to changes in market interest rates.
The Group enters in general only into fixed-rate instrument contracts. The Group does not account for fixed-rate financial instruments at fair value through profit or loss except for employee loans that are designated at fair value through profit or loss. A reasonably possible change in the interest rates does not have a material effect on profit or loss from fair value changes of these instruments.
Share price risk
The Group is exposed to share price risks which are described in Note 41.
41 Financial Instruments
The following table shows the carrying amounts and fair values of all financial instruments recognized in the consolidated financial statements as well as their measurement category of IAS 39 and the hierarchy for the determination of fair value according to IFRS 13.
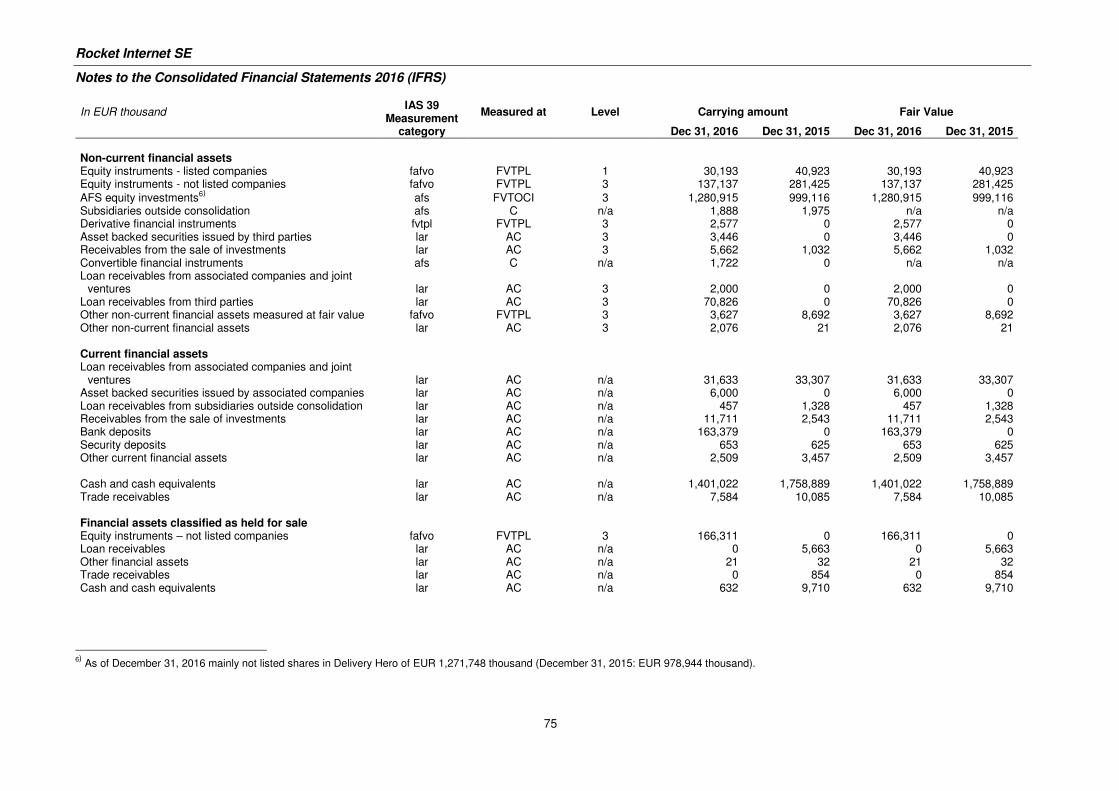
Rocket Internet SE
Notes to the Consolidated Financial Statements 2016 (IFRS)
75
In EUR thousand IAS 39
Measurement Measured at Level Carrying amount Fair Value
category
Dec 31, 2016 Dec 31, 2015 Dec 31, 2016 Dec 31, 2015
Non-current financial assets Equity instruments - listed companies fafvo FVTPL 1 30,193 40,923 30,193 40,923 Equity instruments - not listed companies fafvo FVTPL 3 137,137 281,425 137,137 281,425
AFS equity investments6) afs FVTOCI 3 1,280,915 999,116 1,280,915 999,116
Subsidiaries outside consolidation afs C n/a 1,888 1,975 n/a n/a Derivative financial instruments fvtpl FVTPL 3 2,577 0 2,577 0 Asset backed securities issued by third parties lar AC 3 3,446 0 3,446 0 Receivables from the sale of investments lar AC 3 5,662 1,032 5,662 1,032 Convertible financial instruments afs C n/a 1,722 0 n/a n/a Loan receivables from associated companies and joint
ventures lar AC 3 2,000 0 2,000 0 Loan receivables from third parties lar AC 3 70,826 0 70,826 0 Other non-current financial assets measured at fair value fafvo FVTPL 3 3,627 8,692 3,627 8,692 Other non-current financial assets lar AC 3 2,076 21 2,076 21 Current financial assets Loan receivables from associated companies and joint
ventures lar AC n/a 31,633 33,307 31,633 33,307 Asset backed securities issued by associated companies lar AC n/a 6,000 0 6,000 0 Loan receivables from subsidiaries outside consolidation lar AC n/a 457 1,328 457 1,328 Receivables from the sale of investments lar AC n/a 11,711 2,543 11,711 2,543 Bank deposits lar AC n/a 163,379 0 163,379 0 Security deposits lar AC n/a 653 625 653 625 Other current financial assets lar AC n/a 2,509 3,457 2,509 3,457 Cash and cash equivalents lar AC n/a 1,401,022 1,758,889 1,401,022 1,758,889 Trade receivables lar AC n/a 7,584 10,085 7,584 10,085 Financial assets classified as held for sale Equity instruments – not listed companies fafvo FVTPL 3 166,311 0 166,311 0 Loan receivables lar AC n/a 0 5,663 0 5,663 Other financial assets lar AC n/a 21 32 21 32 Trade receivables lar AC n/a 0 854 0 854 Cash and cash equivalents lar AC n/a 632 9,710 632 9,710
6)
As of December 31, 2016 mainly not listed shares in Delivery Hero of EUR 1,271,748 thousand (December 31, 2015: EUR 978,944 thousand).
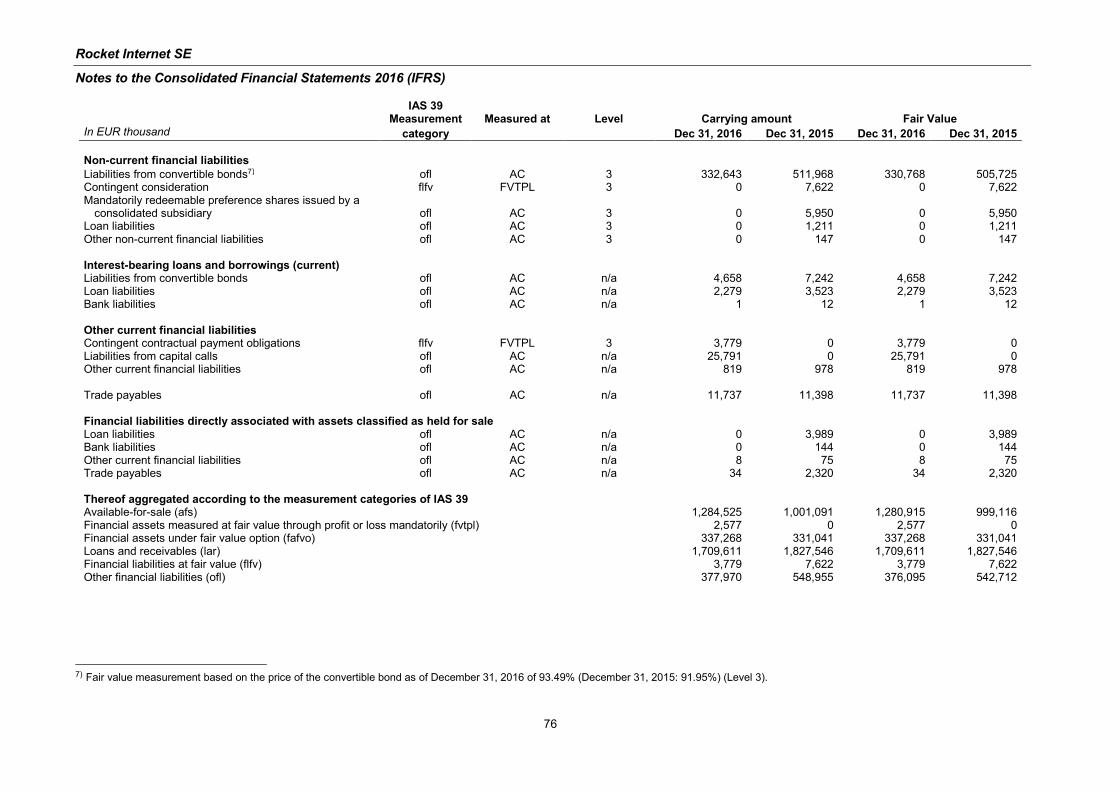
Rocket Internet SE
Notes to the Consolidated Financial Statements 2016 (IFRS)
76
IAS 39
Measurement Measured at Level Carrying amount Fair Value In EUR thousand category Dec 31, 2016 Dec 31, 2015 Dec 31, 2016 Dec 31, 2015
Non-current financial liabilities
Liabilities from convertible bonds7) ofl AC 3 332,643 511,968 330,768 505,725 Contingent consideration flfv FVTPL 3 0 7,622 0 7,622 Mandatorily redeemable preference shares issued by a
consolidated subsidiary ofl AC 3 0 5,950 0 5,950 Loan liabilities ofl AC 3 0 1,211 0 1,211 Other non-current financial liabilities ofl AC 3 0 147 0 147
Interest-bearing loans and borrowings (current) Liabilities from convertible bonds ofl AC n/a 4,658 7,242 4,658 7,242 Loan liabilities ofl AC n/a 2,279 3,523 2,279 3,523 Bank liabilities ofl AC n/a 1 12 1 12
Other current financial liabilities Contingent contractual payment obligations flfv FVTPL 3 3,779 0 3,779 0 Liabilities from capital calls ofl AC n/a 25,791 0 25,791 0 Other current financial liabilities ofl AC n/a 819 978 819 978 Trade payables ofl AC n/a 11,737 11,398 11,737 11,398
Financial liabilities directly associated with assets classified as held for sale Loan liabilities ofl AC n/a 0 3,989 0 3,989 Bank liabilities ofl AC n/a 0 144 0 144 Other current financial liabilities ofl AC n/a 8 75 8 75 Trade payables ofl AC n/a 34 2,320 34 2,320 Thereof aggregated according to the measurement categories of IAS 39 Available-for-sale (afs) 1,284,525 1,001,091 1,280,915 999,116 Financial assets measured at fair value through profit or loss mandatorily (fvtpl) 2,577 0 2,577 0 Financial assets under fair value option (fafvo) 337,268 331,041 337,268 331,041 Loans and receivables (lar) 1,709,611 1,827,546 1,709,611 1,827,546 Financial liabilities at fair value (flfv) 3,779 7,622 3,779 7,622 Other financial liabilities (ofl) 377,970 548,955 376,095 542,712
7) Fair value measurement based on the price of the convertible bond as of December 31, 2016 of 93.49% (December 31, 2015: 91.95%) (Level 3).
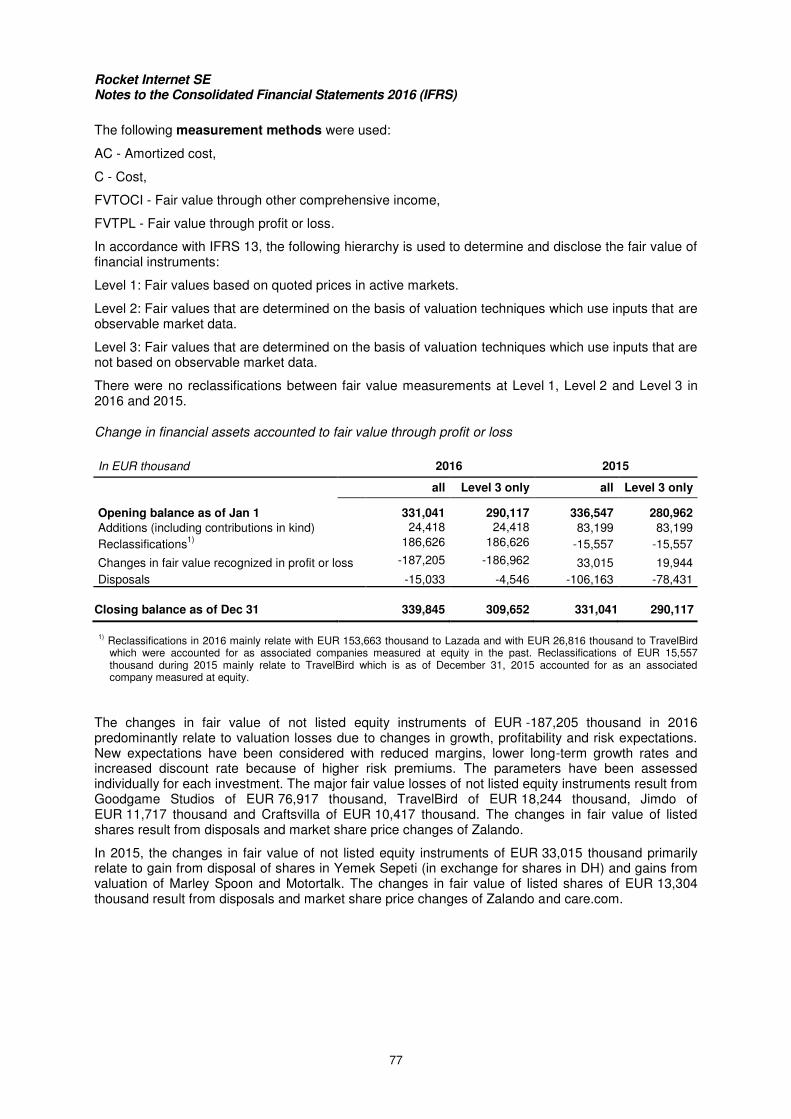
Rocket Internet SE Notes to the Consolidated Financial Statements 2016 (IFRS)
77
The following measurement methods were used:
AC - Amortized cost,
C - Cost,
FVTOCI - Fair value through other comprehensive income,
FVTPL - Fair value through profit or loss.
In accordance with IFRS 13, the following hierarchy is used to determine and disclose the fair value of financial instruments:
Level 1: Fair values based on quoted prices in active markets.
Level 2: Fair values that are determined on the basis of valuation techniques which use inputs that are observable market data.
Level 3: Fair values that are determined on the basis of valuation techniques which use inputs that are not based on observable market data.
There were no reclassifications between fair value measurements at Level 1, Level 2 and Level 3 in 2016 and 2015.
Change in financial assets accounted to fair value through profit or loss
In EUR thousand 2016 2015
all Level 3 only all Level 3 only
Opening balance as of Jan 1 331,041 290,117 336,547 280,962
Additions (including contributions in kind) 24,418 24,418 83,199 83,199
Reclassifications1)
186,626 186,626 -15,557 -15,557
Changes in fair value recognized in profit or loss -187,205 -186,962 33,015 19,944
Disposals -15,033 -4,546 -106,163 -78,431
Closing balance as of Dec 31 339,845 309,652 331,041 290,117 1) Reclassifications in 2016 mainly relate with EUR 153,663 thousand to Lazada and with EUR 26,816 thousand to TravelBird which were accounted for as associated companies measured at equity in the past. Reclassifications of EUR 15,557 thousand during 2015 mainly relate to TravelBird which is as of December 31, 2015 accounted for as an associated company measured at equity.
The changes in fair value of not listed equity instruments of EUR -187,205 thousand in 2016 predominantly relate to valuation losses due to changes in growth, profitability and risk expectations. New expectations have been considered with reduced margins, lower long-term growth rates and increased discount rate because of higher risk premiums. The parameters have been assessed individually for each investment. The major fair value losses of not listed equity instruments result from Goodgame Studios of EUR 76,917 thousand, TravelBird of EUR 18,244 thousand, Jimdo of EUR 11,717 thousand and Craftsvilla of EUR 10,417 thousand. The changes in fair value of listed shares result from disposals and market share price changes of Zalando.
In 2015, the changes in fair value of not listed equity instruments of EUR 33,015 thousand primarily relate to gain from disposal of shares in Yemek Sepeti (in exchange for shares in DH) and gains from valuation of Marley Spoon and Motortalk. The changes in fair value of listed shares of EUR 13,304 thousand result from disposals and market share price changes of Zalando and care.com.
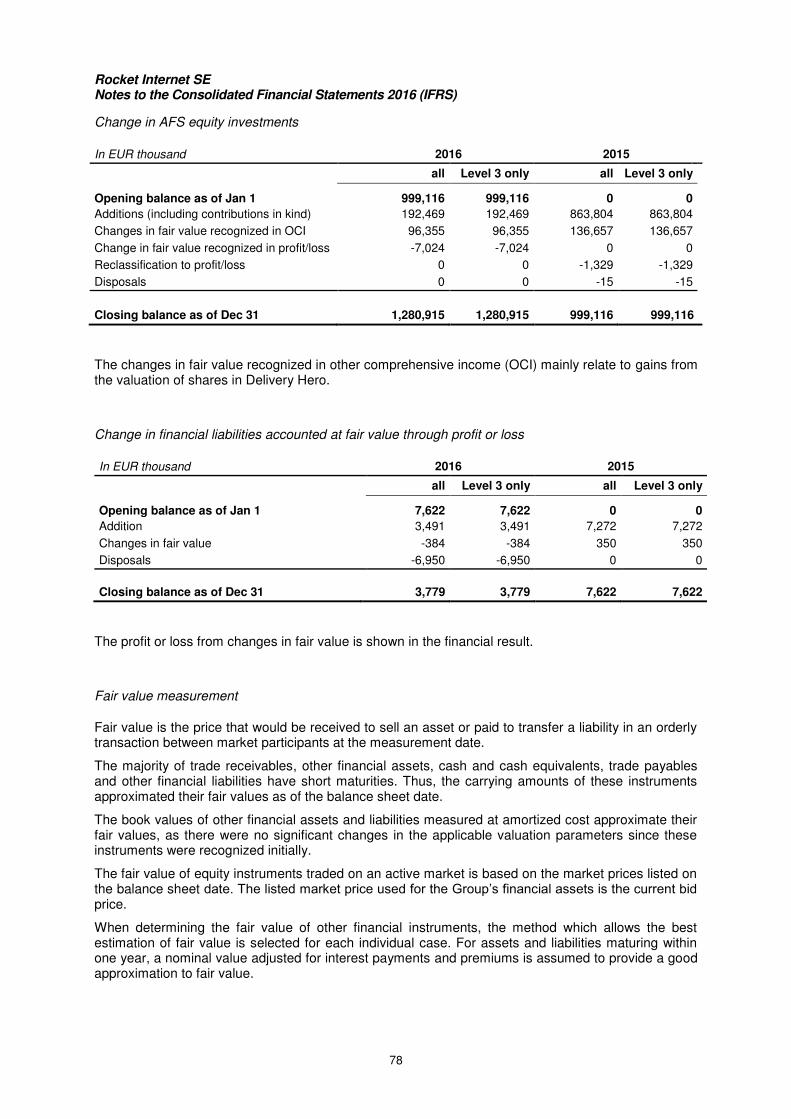
Rocket Internet SE Notes to the Consolidated Financial Statements 2016 (IFRS)
78
Change in AFS equity investments
In EUR thousand 2016 2015
all Level 3 only all Level 3 only
Opening balance as of Jan 1 999,116 999,116 0 0
Additions (including contributions in kind) 192,469 192,469 863,804 863,804
Changes in fair value recognized in OCI 96,355 96,355 136,657 136,657
Change in fair value recognized in profit/loss -7,024 -7,024 0 0
Reclassification to profit/loss 0 0 -1,329 -1,329
Disposals 0 0 -15 -15
Closing balance as of Dec 31 1,280,915 1,280,915 999,116 999,116
The changes in fair value recognized in other comprehensive income (OCI) mainly relate to gains from the valuation of shares in Delivery Hero.
Change in financial liabilities accounted at fair value through profit or loss
In EUR thousand 2016 2015
all Level 3 only all Level 3 only
Opening balance as of Jan 1 7,622 7,622 0 0
Addition 3,491 3,491 7,272 7,272
Changes in fair value -384 -384 350 350
Disposals -6,950 -6,950 0 0
Closing balance as of Dec 31 3,779 3,779 7,622 7,622
The profit or loss from changes in fair value is shown in the financial result.
Fair value measurement
Fair value is the price that would be received to sell an asset or paid to transfer a liability in an orderly transaction between market participants at the measurement date.
The majority of trade receivables, other financial assets, cash and cash equivalents, trade payables and other financial liabilities have short maturities. Thus, the carrying amounts of these instruments approximated their fair values as of the balance sheet date.
The book values of other financial assets and liabilities measured at amortized cost approximate their fair values, as there were no significant changes in the applicable valuation parameters since these instruments were recognized initially.
The fair value of equity instruments traded on an active market is based on the market prices listed on the balance sheet date. The listed market price used for the Group’s financial assets is the current bid price.
When determining the fair value of other financial instruments, the method which allows the best estimation of fair value is selected for each individual case. For assets and liabilities maturing within one year, a nominal value adjusted for interest payments and premiums is assumed to provide a good approximation to fair value.
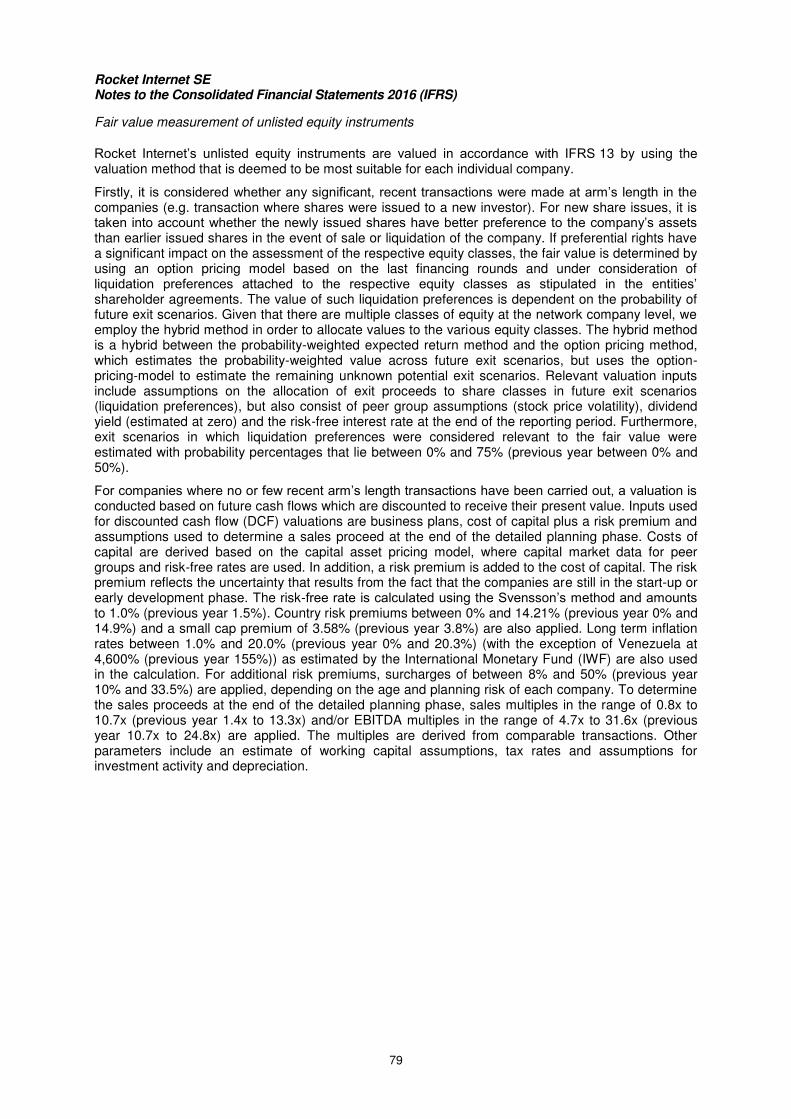
Rocket Internet SE Notes to the Consolidated Financial Statements 2016 (IFRS)
79
Fair value measurement of unlisted equity instruments
Rocket Internet’s unlisted equity instruments are valued in accordance with IFRS 13 by using the valuation method that is deemed to be most suitable for each individual company.
Firstly, it is considered whether any significant, recent transactions were made at arm’s length in the companies (e.g. transaction where shares were issued to a new investor). For new share issues, it is taken into account whether the newly issued shares have better preference to the company’s assets than earlier issued shares in the event of sale or liquidation of the company. If preferential rights have a significant impact on the assessment of the respective equity classes, the fair value is determined by using an option pricing model based on the last financing rounds and under consideration of liquidation preferences attached to the respective equity classes as stipulated in the entities’ shareholder agreements. The value of such liquidation preferences is dependent on the probability of future exit scenarios. Given that there are multiple classes of equity at the network company level, we employ the hybrid method in order to allocate values to the various equity classes. The hybrid method is a hybrid between the probability-weighted expected return method and the option pricing method, which estimates the probability-weighted value across future exit scenarios, but uses the option-pricing-model to estimate the remaining unknown potential exit scenarios. Relevant valuation inputs include assumptions on the allocation of exit proceeds to share classes in future exit scenarios (liquidation preferences), but also consist of peer group assumptions (stock price volatility), dividend yield (estimated at zero) and the risk-free interest rate at the end of the reporting period. Furthermore, exit scenarios in which liquidation preferences were considered relevant to the fair value were estimated with probability percentages that lie between 0% and 75% (previous year between 0% and 50%).
For companies where no or few recent arm’s length transactions have been carried out, a valuation is conducted based on future cash flows which are discounted to receive their present value. Inputs used for discounted cash flow (DCF) valuations are business plans, cost of capital plus a risk premium and assumptions used to determine a sales proceed at the end of the detailed planning phase. Costs of capital are derived based on the capital asset pricing model, where capital market data for peer groups and risk-free rates are used. In addition, a risk premium is added to the cost of capital. The risk premium reflects the uncertainty that results from the fact that the companies are still in the start-up or early development phase. The risk-free rate is calculated using the Svensson’s method and amounts to 1.0% (previous year 1.5%). Country risk premiums between 0% and 14.21% (previous year 0% and 14.9%) and a small cap premium of 3.58% (previous year 3.8%) are also applied. Long term inflation rates between 1.0% and 20.0% (previous year 0% and 20.3%) (with the exception of Venezuela at 4,600% (previous year 155%)) as estimated by the International Monetary Fund (IWF) are also used in the calculation. For additional risk premiums, surcharges of between 8% and 50% (previous year 10% and 33.5%) are applied, depending on the age and planning risk of each company. To determine the sales proceeds at the end of the detailed planning phase, sales multiples in the range of 0.8x to 10.7x (previous year 1.4x to 13.3x) and/or EBITDA multiples in the range of 4.7x to 31.6x (previous year 10.7x to 24.8x) are applied. The multiples are derived from comparable transactions. Other parameters include an estimate of working capital assumptions, tax rates and assumptions for investment activity and depreciation.
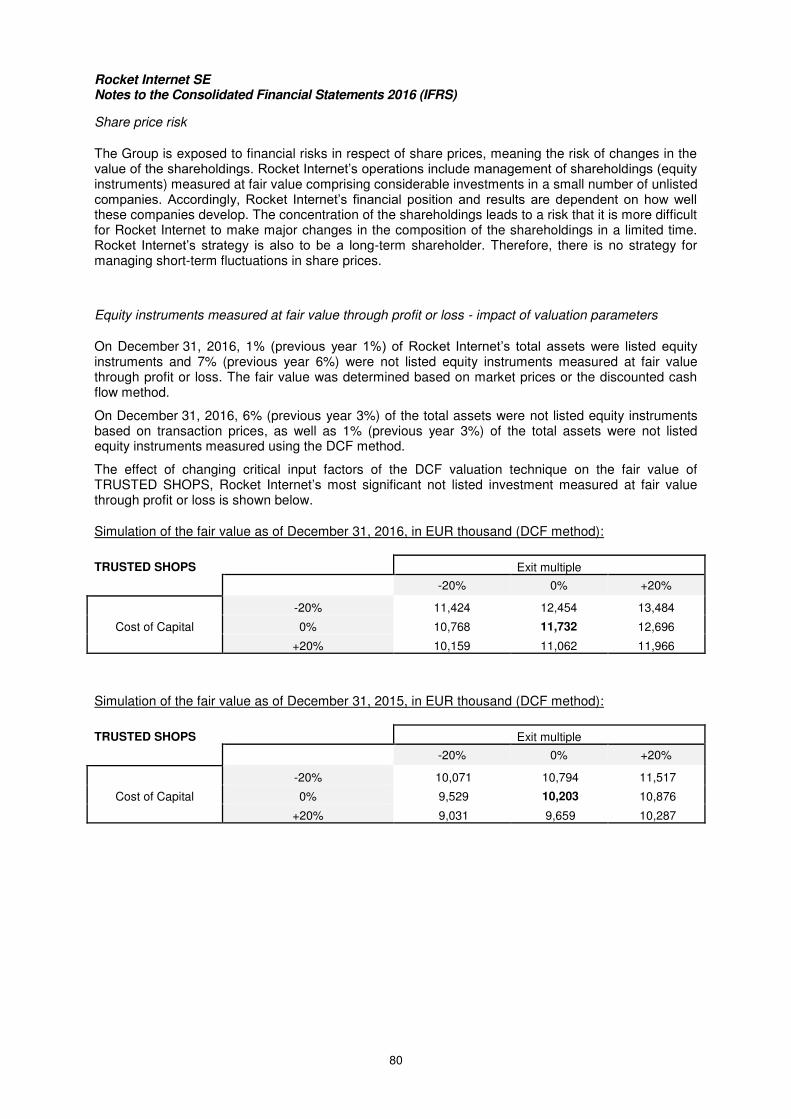
Rocket Internet SE Notes to the Consolidated Financial Statements 2016 (IFRS)
80
Share price risk
The Group is exposed to financial risks in respect of share prices, meaning the risk of changes in the value of the shareholdings. Rocket Internet’s operations include management of shareholdings (equity instruments) measured at fair value comprising considerable investments in a small number of unlisted companies. Accordingly, Rocket Internet’s financial position and results are dependent on how well these companies develop. The concentration of the shareholdings leads to a risk that it is more difficult for Rocket Internet to make major changes in the composition of the shareholdings in a limited time. Rocket Internet’s strategy is also to be a long-term shareholder. Therefore, there is no strategy for managing short-term fluctuations in share prices.
Equity instruments measured at fair value through profit or loss - impact of valuation parameters
On December 31, 2016, 1% (previous year 1%) of Rocket Internet’s total assets were listed equity instruments and 7% (previous year 6%) were not listed equity instruments measured at fair value through profit or loss. The fair value was determined based on market prices or the discounted cash flow method.
On December 31, 2016, 6% (previous year 3%) of the total assets were not listed equity instruments
based on transaction prices, as well as 1% (previous year 3%) of the total assets were not listed equity instruments measured using the DCF method.
The effect of changing critical input factors of the DCF valuation technique on the fair value of TRUSTED SHOPS, Rocket Internet’s most significant not listed investment measured at fair value through profit or loss is shown below.
Simulation of the fair value as of December 31, 2016, in EUR thousand (DCF method):
TRUSTED SHOPS Exit multiple
-20% 0% +20%
Cost of Capital
-20% 11,424 12,454 13,484
0% 10,768 11,732 12,696
+20% 10,159 11,062 11,966
Simulation of the fair value as of December 31, 2015, in EUR thousand (DCF method):
TRUSTED SHOPS Exit multiple
-20% 0% +20%
Cost of Capital
-20% 10,071 10,794 11,517
0% 9,529 10,203 10,876
+20% 9,031 9,659 10,287
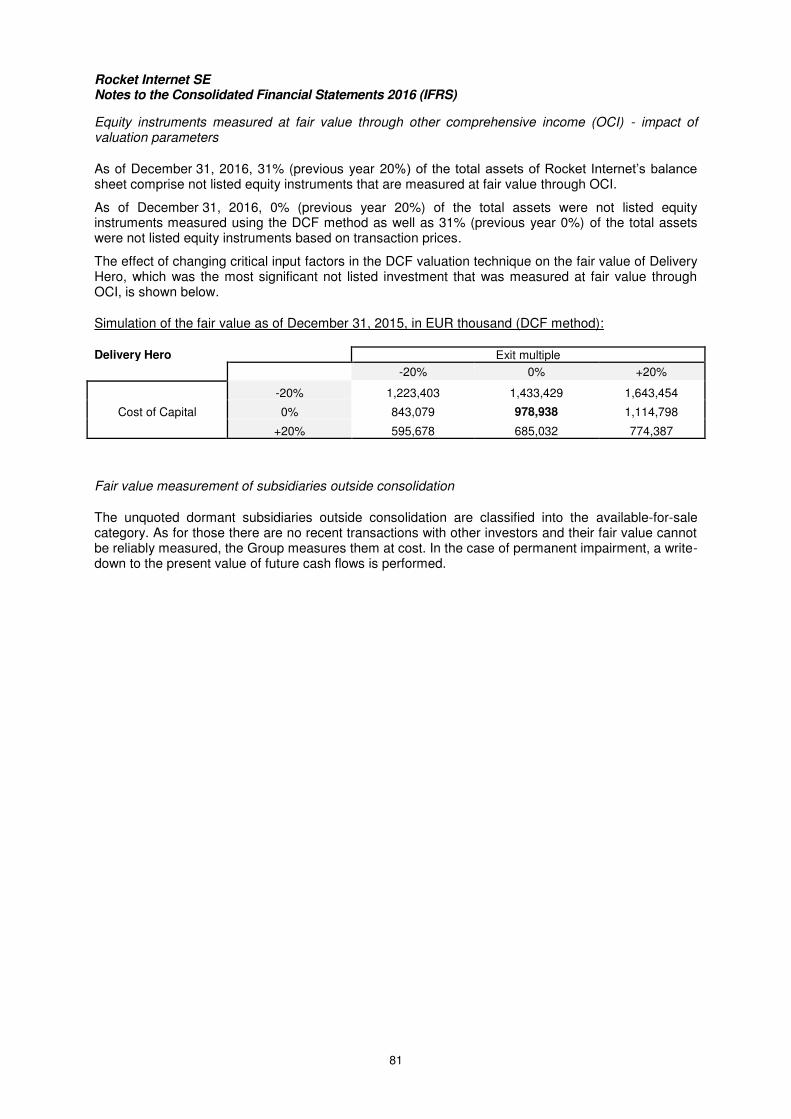
Rocket Internet SE Notes to the Consolidated Financial Statements 2016 (IFRS)
81
Equity instruments measured at fair value through other comprehensive income (OCI) - impact of valuation parameters
As of December 31, 2016, 31% (previous year 20%) of the total assets of Rocket Internet’s balance sheet comprise not listed equity instruments that are measured at fair value through OCI.
As of December 31, 2016, 0% (previous year 20%) of the total assets were not listed equity instruments measured using the DCF method as well as 31% (previous year 0%) of the total assets were not listed equity instruments based on transaction prices.
The effect of changing critical input factors in the DCF valuation technique on the fair value of Delivery Hero, which was the most significant not listed investment that was measured at fair value through OCI, is shown below.
Simulation of the fair value as of December 31, 2015, in EUR thousand (DCF method):
Delivery Hero Exit multiple
-20% 0% +20%
Cost of Capital
-20% 1,223,403 1,433,429 1,643,454
0% 843,079 978,938 1,114,798
+20% 595,678 685,032 774,387
Fair value measurement of subsidiaries outside consolidation
The unquoted dormant subsidiaries outside consolidation are classified into the available-for-sale category. As for those there are no recent transactions with other investors and their fair value cannot be reliably measured, the Group measures them at cost. In the case of permanent impairment, a write-down to the present value of future cash flows is performed.
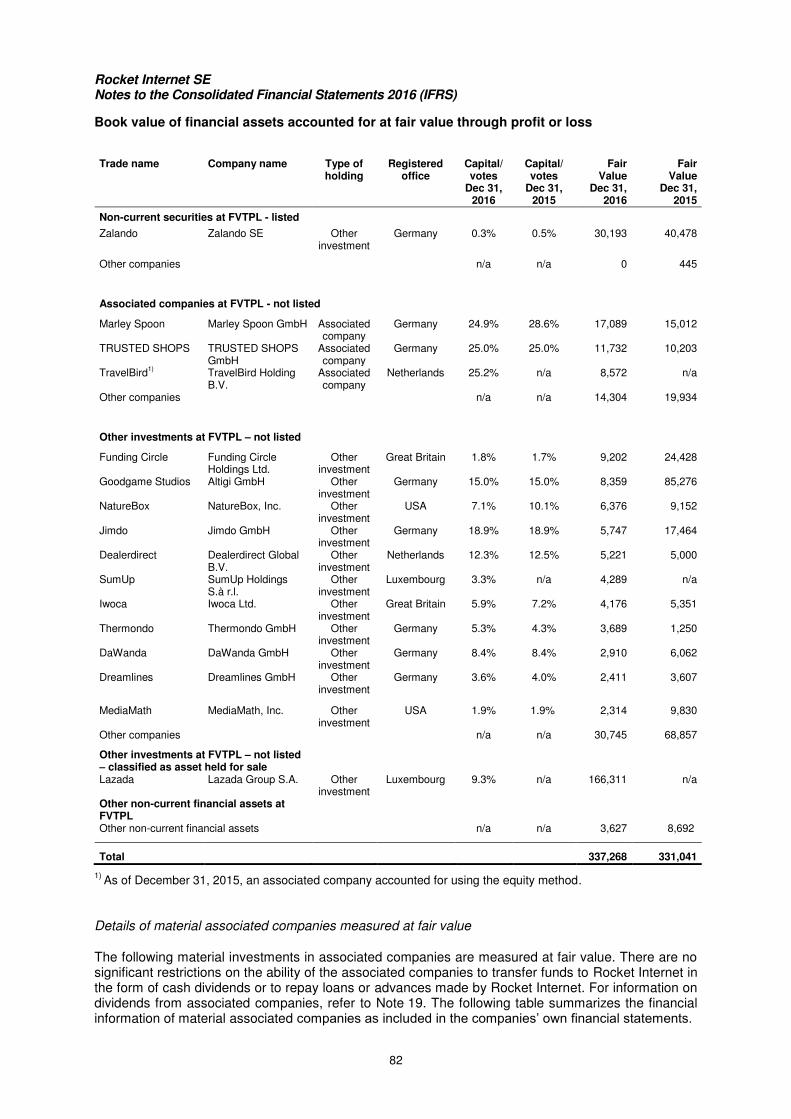
Rocket Internet SE Notes to the Consolidated Financial Statements 2016 (IFRS)
82
Book value of financial assets accounted for at fair value through profit or loss
Trade name Company name Type of holding
Registered office
Capital/ votes
Capital/ votes
Fair Value
Fair Value
Dec 31, 2016
Dec 31, 2015
Dec 31, 2016
Dec 31, 2015
Non-current securities at FVTPL - listed
Zalando Zalando SE Other investment
Germany 0.3% 0.5%
30,193 40,478
Other companies n/a n/a 0 445
Associated companies at FVTPL - not listed
Marley Spoon Marley Spoon GmbH Associated company
Germany 24.9% 28.6% 17,089 15,012
TRUSTED SHOPS TRUSTED SHOPS GmbH
Associated company
Germany 25.0% 25.0% 11,732 10,203
TravelBird1) TravelBird Holding
B.V. Associated company
Netherlands 25.2% n/a 8,572 n/a
Other companies n/a n/a 14,304 19,934
Other investments at FVTPL – not listed
Funding Circle Funding Circle Holdings Ltd.
Other investment
Great Britain 1.8% 1.7% 9,202 24,428
Goodgame Studios Altigi GmbH Other investment
Germany 15.0% 15.0% 8,359 85,276
NatureBox NatureBox, Inc. Other investment
USA 7.1% 10.1% 6,376 9,152
Jimdo Jimdo GmbH Other investment
Germany 18.9% 18.9% 5,747 17,464
Dealerdirect Dealerdirect Global B.V.
Other investment
Netherlands 12.3% 12.5% 5,221 5,000
SumUp SumUp Holdings S.à r.l.
Other investment
Luxembourg 3.3% n/a 4,289 n/a
Iwoca Iwoca Ltd. Other investment
Great Britain 5.9% 7.2% 4,176 5,351
Thermondo Thermondo GmbH Other investment
Germany 5.3% 4.3% 3,689 1,250
DaWanda DaWanda GmbH Other investment
Germany 8.4% 8.4% 2,910 6,062
Dreamlines Dreamlines GmbH Other investment
Germany 3.6% 4.0% 2,411 3,607
MediaMath MediaMath, Inc. Other investment
USA 1.9% 1.9% 2,314 9,830
Other companies n/a n/a 30,745 68,857
Other investments at FVTPL – not listed – classified as asset held for sale
Lazada Lazada Group S.A. Other investment
Luxembourg 9.3% n/a 166,311 n/a
Other non-current financial assets at FVTPL
Other non-current financial assets n/a n/a 3,627 8,692
Total 337,268 331,041
1) As of December 31, 2015, an associated company accounted for using the equity method.
Details of material associated companies measured at fair value
The following material investments in associated companies are measured at fair value. There are no significant restrictions on the ability of the associated companies to transfer funds to Rocket Internet in the form of cash dividends or to repay loans or advances made by Rocket Internet. For information on dividends from associated companies, refer to Note 19. The following table summarizes the financial information of material associated companies as included in the companies’ own financial statements.
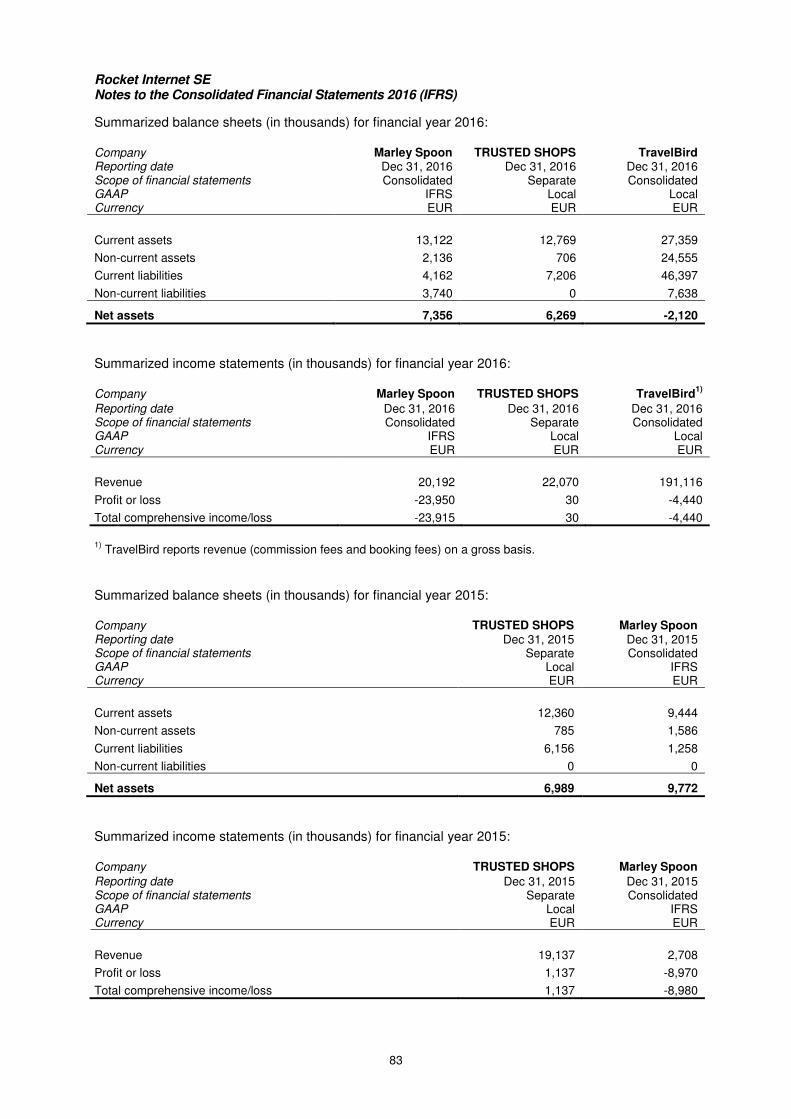
Rocket Internet SE Notes to the Consolidated Financial Statements 2016 (IFRS)
83
Summarized balance sheets (in thousands) for financial year 2016:
Company Marley Spoon TRUSTED SHOPS TravelBird Reporting date Dec 31, 2016 Dec 31, 2016 Dec 31, 2016 Scope of financial statements Consolidated Separate Consolidated GAAP IFRS Local Local Currency EUR EUR EUR
Current assets 13,122 12,769 27,359
Non-current assets 2,136 706 24,555
Current liabilities 4,162 7,206 46,397
Non-current liabilities 3,740 0 7,638
Net assets 7,356 6,269 -2,120
Summarized income statements (in thousands) for financial year 2016:
Company Marley Spoon TRUSTED SHOPS TravelBird1)
Reporting date Dec 31, 2016 Dec 31, 2016 Dec 31, 2016 Scope of financial statements Consolidated Separate Consolidated GAAP IFRS Local Local Currency EUR EUR EUR
Revenue 20,192 22,070 191,116
Profit or loss -23,950 30 -4,440
Total comprehensive income/loss -23,915 30 -4,440
1) TravelBird reports revenue (commission fees and booking fees) on a gross basis.
Summarized balance sheets (in thousands) for financial year 2015:
Company TRUSTED SHOPS Marley Spoon Reporting date Dec 31, 2015 Dec 31, 2015 Scope of financial statements Separate Consolidated GAAP Local IFRS Currency EUR EUR
Current assets 12,360 9,444
Non-current assets 785 1,586
Current liabilities 6,156 1,258
Non-current liabilities 0 0
Net assets 6,989 9,772
Summarized income statements (in thousands) for financial year 2015:
Company TRUSTED SHOPS Marley Spoon
Reporting date Dec 31, 2015 Dec 31, 2015 Scope of financial statements Separate Consolidated GAAP Local IFRS Currency EUR EUR
Revenue 19,137 2,708
Profit or loss 1,137 -8,970
Total comprehensive income/loss 1,137 -8,980
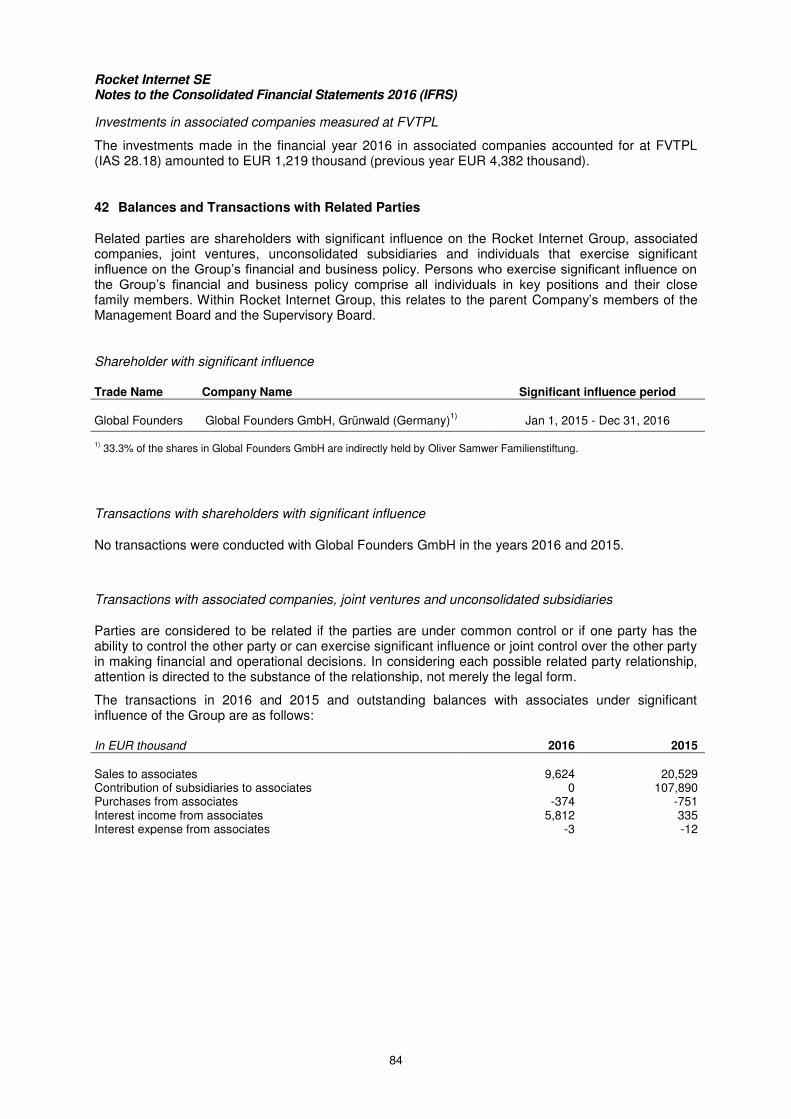
Rocket Internet SE Notes to the Consolidated Financial Statements 2016 (IFRS)
84
Investments in associated companies measured at FVTPL
The investments made in the financial year 2016 in associated companies accounted for at FVTPL (IAS 28.18) amounted to EUR 1,219 thousand (previous year EUR 4,382 thousand).
42 Balances and Transactions with Related Parties
Related parties are shareholders with significant influence on the Rocket Internet Group, associated companies, joint ventures, unconsolidated subsidiaries and individuals that exercise significant influence on the Group’s financial and business policy. Persons who exercise significant influence on the Group’s financial and business policy comprise all individuals in key positions and their close family members. Within Rocket Internet Group, this relates to the parent Company’s members of the Management Board and the Supervisory Board.
Shareholder with significant influence
Trade Name Company Name Significant influence period
Global Founders Global Founders GmbH, Grünwald (Germany)
1) Jan 1, 2015 - Dec 31, 2016
1) 33.3% of the shares in Global Founders GmbH are indirectly held by Oliver Samwer Familienstiftung.
Transactions with shareholders with significant influence
No transactions were conducted with Global Founders GmbH in the years 2016 and 2015.
Transactions with associated companies, joint ventures and unconsolidated subsidiaries
Parties are considered to be related if the parties are under common control or if one party has the ability to control the other party or can exercise significant influence or joint control over the other party in making financial and operational decisions. In considering each possible related party relationship, attention is directed to the substance of the relationship, not merely the legal form.
The transactions in 2016 and 2015 and outstanding balances with associates under significant influence of the Group are as follows:
In EUR thousand 2016 2015
Sales to associates 9,624 20,529 Contribution of subsidiaries to associates 0 107,890 Purchases from associates -374 -751 Interest income from associates 5,812 335 Interest expense from associates -3 -12
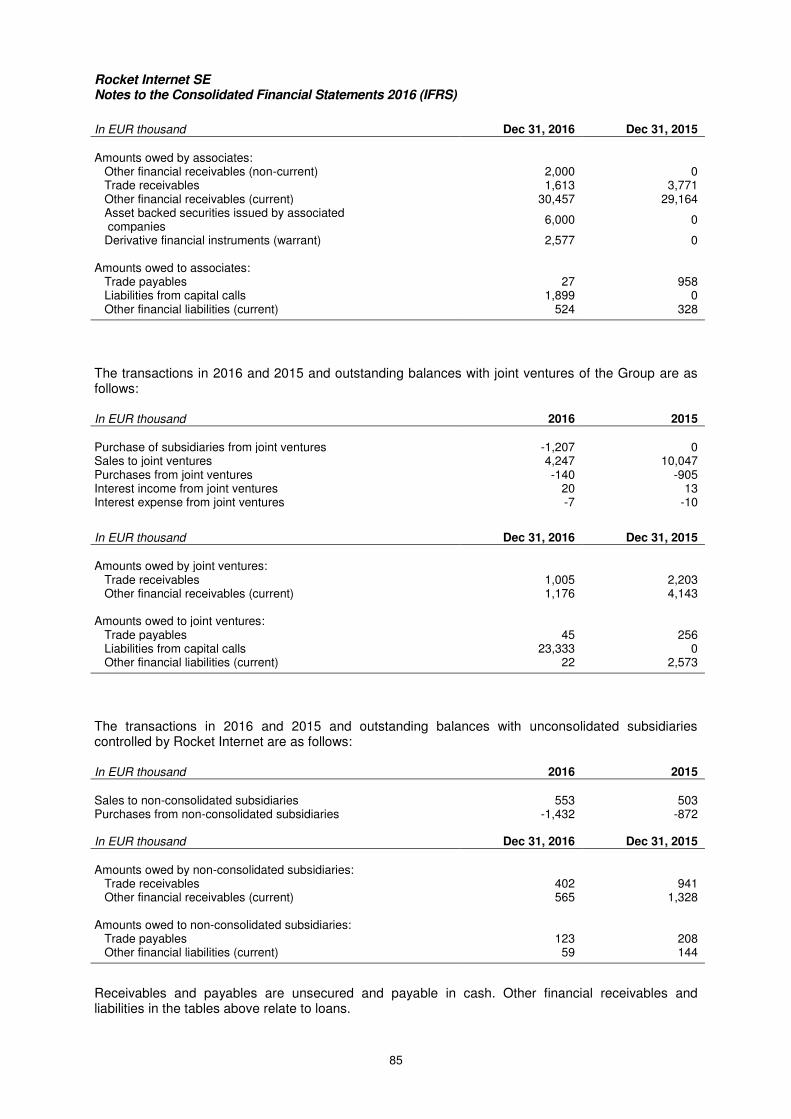
Rocket Internet SE Notes to the Consolidated Financial Statements 2016 (IFRS)
85
In EUR thousand Dec 31, 2016 Dec 31, 2015
Amounts owed by associates: Other financial receivables (non-current) 2,000 0 Trade receivables 1,613 3,771 Other financial receivables (current) 30,457 29,164 Asset backed securities issued by associated companies
6,000 0
Derivative financial instruments (warrant) 2,577 0 Amounts owed to associates: Trade payables 27 958 Liabilities from capital calls 1,899 0 Other financial liabilities (current) 524 328
The transactions in 2016 and 2015 and outstanding balances with joint ventures of the Group are as follows:
In EUR thousand 2016 2015
Purchase of subsidiaries from joint ventures -1,207 0 Sales to joint ventures 4,247 10,047 Purchases from joint ventures -140 -905 Interest income from joint ventures 20 13 Interest expense from joint ventures -7 -10
In EUR thousand Dec 31, 2016 Dec 31, 2015
Amounts owed by joint ventures: Trade receivables 1,005 2,203 Other financial receivables (current) 1,176 4,143 Amounts owed to joint ventures: Trade payables 45 256 Liabilities from capital calls 23,333 0 Other financial liabilities (current) 22 2,573
The transactions in 2016 and 2015 and outstanding balances with unconsolidated subsidiaries controlled by Rocket Internet are as follows:
In EUR thousand 2016 2015
Sales to non-consolidated subsidiaries 553 503 Purchases from non-consolidated subsidiaries -1,432 -872 In EUR thousand Dec 31, 2016 Dec 31, 2015
Amounts owed by non-consolidated subsidiaries: Trade receivables 402 941 Other financial receivables (current) 565 1,328 Amounts owed to non-consolidated subsidiaries: Trade payables 123 208 Other financial liabilities (current) 59 144
Receivables and payables are unsecured and payable in cash. Other financial receivables and liabilities in the tables above relate to loans.
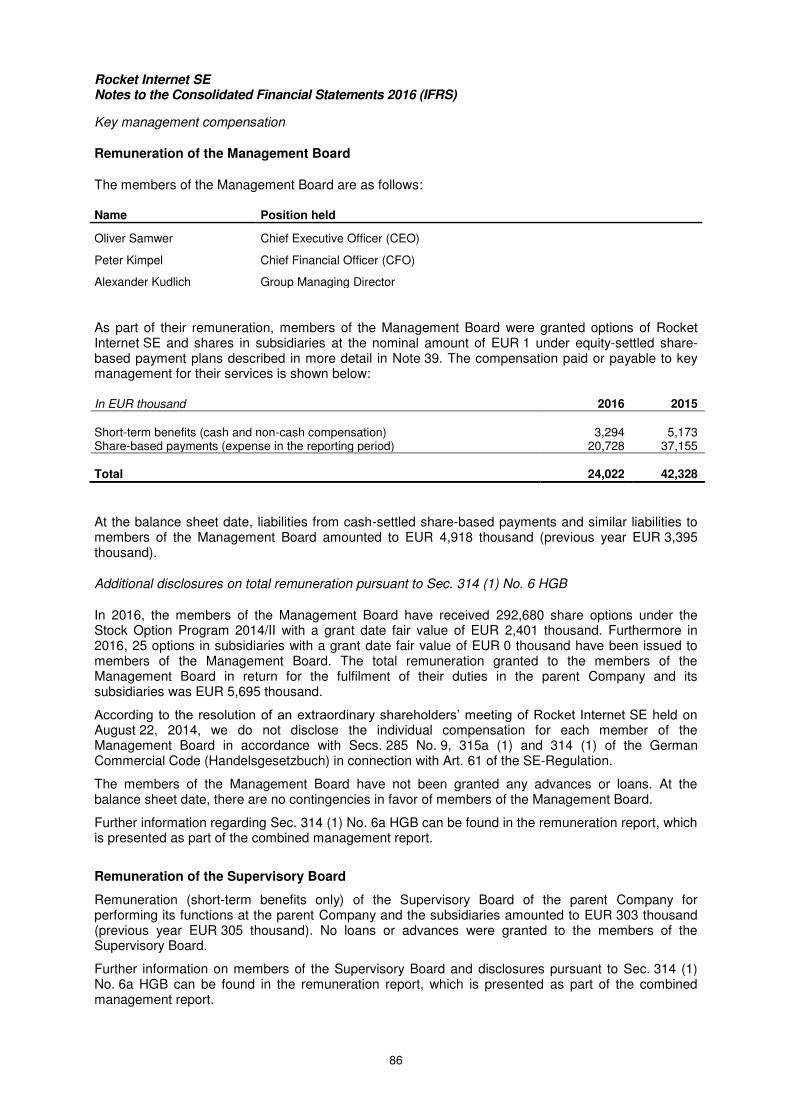
Rocket Internet SE Notes to the Consolidated Financial Statements 2016 (IFRS)
86
Key management compensation
Remuneration of the Management Board
The members of the Management Board are as follows:
Name Position held
Oliver Samwer Chief Executive Officer (CEO)
Peter Kimpel Chief Financial Officer (CFO)
Alexander Kudlich Group Managing Director
As part of their remuneration, members of the Management Board were granted options of Rocket Internet SE and shares in subsidiaries at the nominal amount of EUR 1 under equity-settled share-based payment plans described in more detail in Note 39. The compensation paid or payable to key management for their services is shown below:
In EUR thousand 2016 2015
Short-term benefits (cash and non-cash compensation) 3,294 5,173 Share-based payments (expense in the reporting period) 20,728 37,155
Total 24,022 42,328
At the balance sheet date, liabilities from cash-settled share-based payments and similar liabilities to members of the Management Board amounted to EUR 4,918 thousand (previous year EUR 3,395 thousand).
Additional disclosures on total remuneration pursuant to Sec. 314 (1) No. 6 HGB
In 2016, the members of the Management Board have received 292,680 share options under the Stock Option Program 2014/II with a grant date fair value of EUR 2,401 thousand. Furthermore in 2016, 25 options in subsidiaries with a grant date fair value of EUR 0 thousand have been issued to members of the Management Board. The total remuneration granted to the members of the Management Board in return for the fulfilment of their duties in the parent Company and its subsidiaries was EUR 5,695 thousand.
According to the resolution of an extraordinary shareholders’ meeting of Rocket Internet SE held on August 22, 2014, we do not disclose the individual compensation for each member of the Management Board in accordance with Secs. 285 No. 9, 315a (1) and 314 (1) of the German Commercial Code (Handelsgesetzbuch) in connection with Art. 61 of the SE-Regulation.
The members of the Management Board have not been granted any advances or loans. At the balance sheet date, there are no contingencies in favor of members of the Management Board.
Further information regarding Sec. 314 (1) No. 6a HGB can be found in the remuneration report, which is presented as part of the combined management report.
Remuneration of the Supervisory Board
Remuneration (short-term benefits only) of the Supervisory Board of the parent Company for performing its functions at the parent Company and the subsidiaries amounted to EUR 303 thousand (previous year EUR 305 thousand). No loans or advances were granted to the members of the Supervisory Board.
Further information on members of the Supervisory Board and disclosures pursuant to Sec. 314 (1) No. 6a HGB can be found in the remuneration report, which is presented as part of the combined management report.
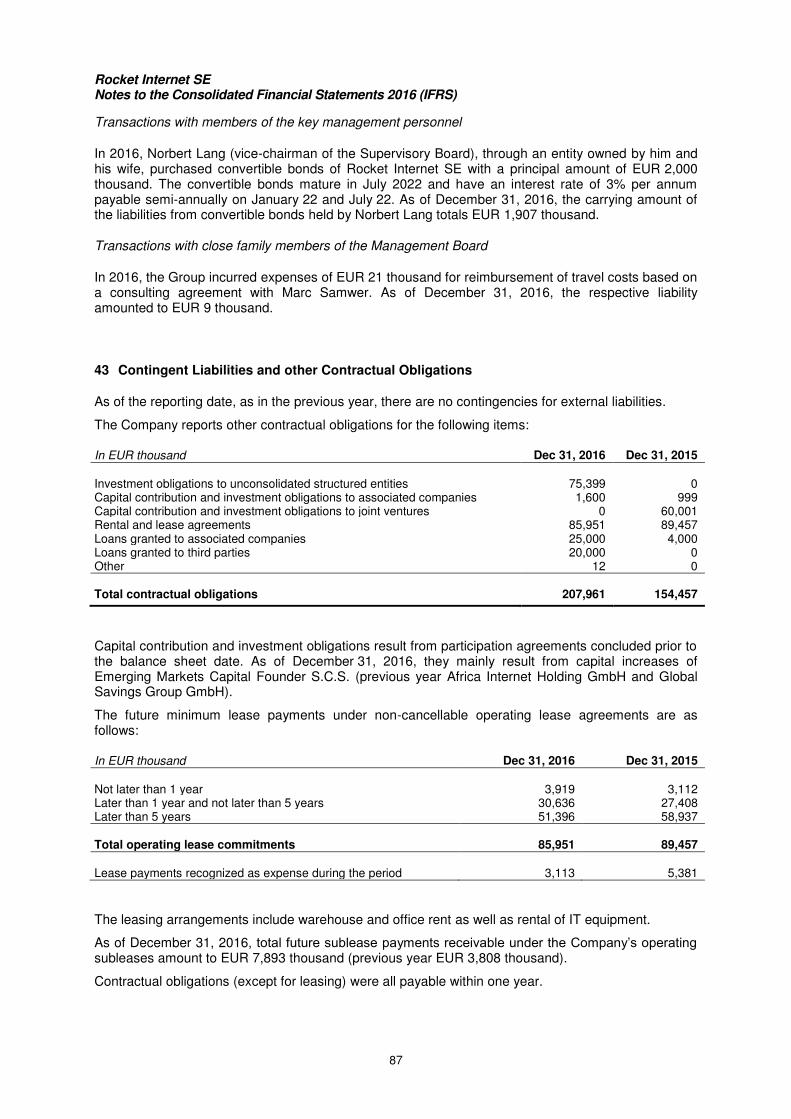
Rocket Internet SE Notes to the Consolidated Financial Statements 2016 (IFRS)
87
Transactions with members of the key management personnel
In 2016, Norbert Lang (vice-chairman of the Supervisory Board), through an entity owned by him and his wife, purchased convertible bonds of Rocket Internet SE with a principal amount of EUR 2,000 thousand. The convertible bonds mature in July 2022 and have an interest rate of 3% per annum payable semi-annually on January 22 and July 22. As of December 31, 2016, the carrying amount of the liabilities from convertible bonds held by Norbert Lang totals EUR 1,907 thousand.
Transactions with close family members of the Management Board
In 2016, the Group incurred expenses of EUR 21 thousand for reimbursement of travel costs based on a consulting agreement with Marc Samwer. As of December 31, 2016, the respective liability amounted to EUR 9 thousand.
43 Contingent Liabilities and other Contractual Obligations
As of the reporting date, as in the previous year, there are no contingencies for external liabilities.
The Company reports other contractual obligations for the following items:
In EUR thousand Dec 31, 2016 Dec 31, 2015
Investment obligations to unconsolidated structured entities 75,399 0 Capital contribution and investment obligations to associated companies 1,600 999 Capital contribution and investment obligations to joint ventures 0 60,001 Rental and lease agreements 85,951 89,457 Loans granted to associated companies 25,000 4,000 Loans granted to third parties 20,000 0 Other 12 0 Total contractual obligations 207,961 154,457
Capital contribution and investment obligations result from participation agreements concluded prior to the balance sheet date. As of December 31, 2016, they mainly result from capital increases of Emerging Markets Capital Founder S.C.S. (previous year Africa Internet Holding GmbH and Global Savings Group GmbH).
The future minimum lease payments under non-cancellable operating lease agreements are as follows:
In EUR thousand Dec 31, 2016 Dec 31, 2015
Not later than 1 year 3,919 3,112 Later than 1 year and not later than 5 years 30,636 27,408 Later than 5 years 51,396 58,937
Total operating lease commitments 85,951 89,457 Lease payments recognized as expense during the period 3,113 5,381
The leasing arrangements include warehouse and office rent as well as rental of IT equipment.
As of December 31, 2016, total future sublease payments receivable under the Company’s operating subleases amount to EUR 7,893 thousand (previous year EUR 3,808 thousand).
Contractual obligations (except for leasing) were all payable within one year.
Rocket Internet SE Notes to the Consolidated Financial Statements 2016 (IFRS)
88
Tax Contingencies
Rocket Internet SE’s tax audit started in October 2016 covering the fiscal years 2010 to 2015. In addition, in the second half-year 2016 further tax audits and special VAT audits started on the level of other companies in the Rocket Internet network with comparable audit periods. Given that Rocket Internet SE’s fiscal years from 2010 onwards as well as most of the companies in the Rocket Internet network have not yet been audited by the relevant tax authorities, we cannot rule out being required to pay significant additional taxes following tax audits. In addition, as some of the companies in the Rocket Internet network have historically been late in filing their tax declarations, no tax assessments have been received for some of these companies in recent years. Any tax assessments that deviate from our expectations could lead to an increase in the tax obligations of Rocket Internet SE and the companies in the Rocket Internet network and, additionally, could give rise to interest payable on the additional amount of taxes as well as late filing charges.
It is not practicable to disclose an estimate of financial effects, uncertainties relating to the amount or timing of any cash outflow, and the possibility of any reimbursement for the tax contingencies.
44 Auditor’s Fees
Total fees charged for the financial year by the Group’s auditor (Ernst & Young GmbH Wirtschaftsprüfungsgesellschaft) amount to EUR 1.2 million (previous year EUR 1.6 million) and comprise EUR 0.9 million (previous year EUR 1.2 million) for audit services and EUR 0.3 million (previous year EUR 0.4 million) for other audit-related services.
45 Events after the Reporting Period
The Rocket Internet Capital Partners fund held its final close on January 18, 2017, which took total combined commitments to USD 1.0 billion (hard cap). The USD 131 million new commitments were subscribed by third party investors and Rocket Internet. Overall, Rocket Internet has subscribed about 14% of the total commitments of the fund.
No other events of special significance occurred after the end of the financial year.
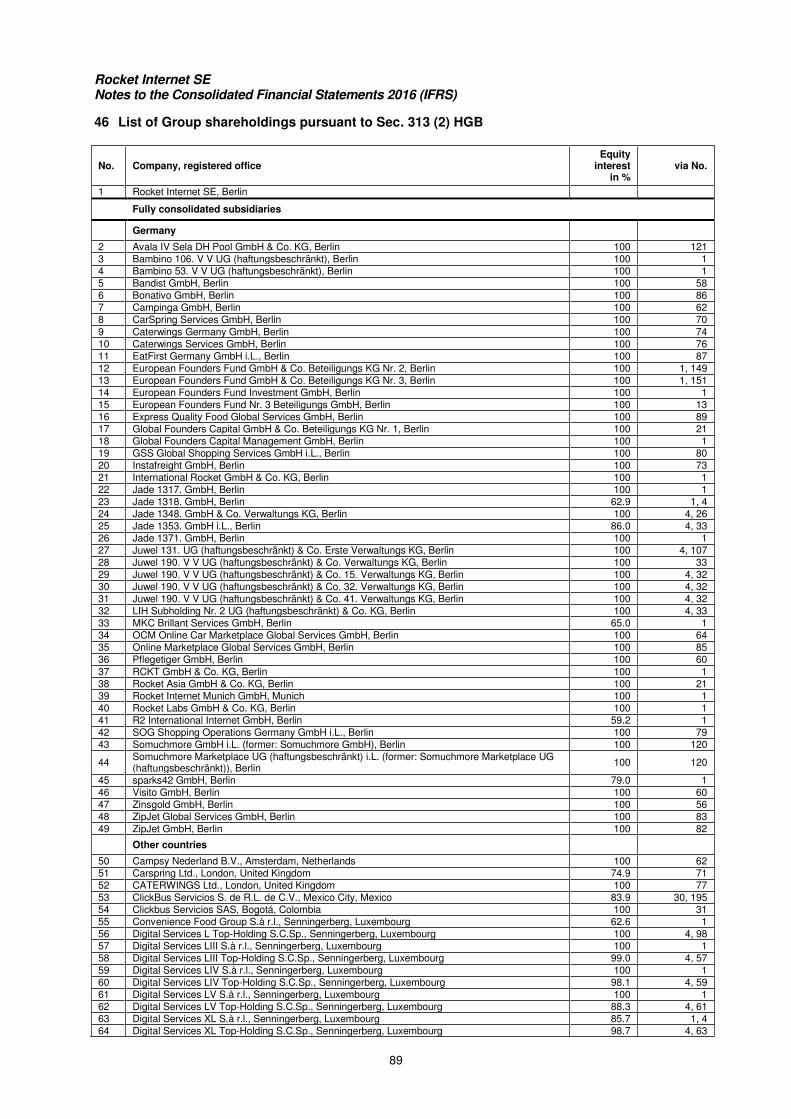
Rocket Internet SE Notes to the Consolidated Financial Statements 2016 (IFRS)
89
46 List of Group shareholdings pursuant to Sec. 313 (2) HGB
No. Company, registered office Equity
interest in %
via No.
1 Rocket Internet SE, Berlin
Fully consolidated subsidiaries
Germany
2 Avala IV Sela DH Pool GmbH & Co. KG, Berlin 100 121
3 Bambino 106. V V UG (haftungsbeschränkt), Berlin 100 1
4 Bambino 53. V V UG (haftungsbeschränkt), Berlin 100 1
5 Bandist GmbH, Berlin 100 58
6 Bonativo GmbH, Berlin 100 86
7 Campinga GmbH, Berlin 100 62
8 CarSpring Services GmbH, Berlin 100 70
9 Caterwings Germany GmbH, Berlin 100 74
10 Caterwings Services GmbH, Berlin 100 76
11 EatFirst Germany GmbH i.L., Berlin 100 87
12 European Founders Fund GmbH & Co. Beteiligungs KG Nr. 2, Berlin 100 1, 149
13 European Founders Fund GmbH & Co. Beteiligungs KG Nr. 3, Berlin 100 1, 151
14 European Founders Fund Investment GmbH, Berlin 100 1
15 European Founders Fund Nr. 3 Beteiligungs GmbH, Berlin 100 13
16 Express Quality Food Global Services GmbH, Berlin 100 89
17 Global Founders Capital GmbH & Co. Beteiligungs KG Nr. 1, Berlin 100 21
18 Global Founders Capital Management GmbH, Berlin 100 1
19 GSS Global Shopping Services GmbH i.L., Berlin 100 80
20 Instafreight GmbH, Berlin 100 73
21 International Rocket GmbH & Co. KG, Berlin 100 1
22 Jade 1317. GmbH, Berlin 100 1
23 Jade 1318. GmbH, Berlin 62.9 1, 4
24 Jade 1348. GmbH & Co. Verwaltungs KG, Berlin 100 4, 26
25 Jade 1353. GmbH i.L., Berlin 86.0 4, 33
26 Jade 1371. GmbH, Berlin 100 1
27 Juwel 131. UG (haftungsbeschränkt) & Co. Erste Verwaltungs KG, Berlin 100 4, 107
28 Juwel 190. V V UG (haftungsbeschränkt) & Co. Verwaltungs KG, Berlin 100 33
29 Juwel 190. V V UG (haftungsbeschränkt) & Co. 15. Verwaltungs KG, Berlin 100 4, 32
30 Juwel 190. V V UG (haftungsbeschränkt) & Co. 32. Verwaltungs KG, Berlin 100 4, 32
31 Juwel 190. V V UG (haftungsbeschränkt) & Co. 41. Verwaltungs KG, Berlin 100 4, 32
32 LIH Subholding Nr. 2 UG (haftungsbeschränkt) & Co. KG, Berlin 100 4, 33
33 MKC Brillant Services GmbH, Berlin 65.0 1
34 OCM Online Car Marketplace Global Services GmbH, Berlin 100 64
35 Online Marketplace Global Services GmbH, Berlin 100 85
36 Pflegetiger GmbH, Berlin 100 60
37 RCKT GmbH & Co. KG, Berlin 100 1
38 Rocket Asia GmbH & Co. KG, Berlin 100 21
39 Rocket Internet Munich GmbH, Munich 100 1
40 Rocket Labs GmbH & Co. KG, Berlin 100 1
41 R2 International Internet GmbH, Berlin 59.2 1
42 SOG Shopping Operations Germany GmbH i.L., Berlin 100 79
43 Somuchmore GmbH i.L. (former: Somuchmore GmbH), Berlin 100 120
44 Somuchmore Marketplace UG (haftungsbeschränkt) i.L. (former: Somuchmore Marketplace UG (haftungsbeschränkt)), Berlin
100 120
45 sparks42 GmbH, Berlin 79.0 1
46 Visito GmbH, Berlin 100 60
47 Zinsgold GmbH, Berlin 100 56
48 ZipJet Global Services GmbH, Berlin 100 83
49 ZipJet GmbH, Berlin 100 82
Other countries
50 Campsy Nederland B.V., Amsterdam, Netherlands 100 62
51 Carspring Ltd., London, United Kingdom 74.9 71
52 CATERWINGS Ltd., London, United Kingdom 100 77
53 ClickBus Servicios S. de R.L. de C.V., Mexico City, Mexico 83.9 30, 195
54 Clickbus Servicios SAS, Bogotá, Colombia 100 31
55 Convenience Food Group S.à r.l., Senningerberg, Luxembourg 62.6 1
56 Digital Services L Top-Holding S.C.Sp., Senningerberg, Luxembourg 100 4, 98
57 Digital Services LIII S.à r.l., Senningerberg, Luxembourg 100 1
58 Digital Services LIII Top-Holding S.C.Sp., Senningerberg, Luxembourg 99.0 4, 57
59 Digital Services LIV S.à r.l., Senningerberg, Luxembourg 100 1
60 Digital Services LIV Top-Holding S.C.Sp., Senningerberg, Luxembourg 98.1 4, 59
61 Digital Services LV S.à r.l., Senningerberg, Luxembourg 100 1
62 Digital Services LV Top-Holding S.C.Sp., Senningerberg, Luxembourg 88.3 4, 61
63 Digital Services XL S.à r.l., Senningerberg, Luxembourg 85.7 1, 4
64 Digital Services XL Top-Holding S.C.Sp., Senningerberg, Luxembourg 98.7 4, 63
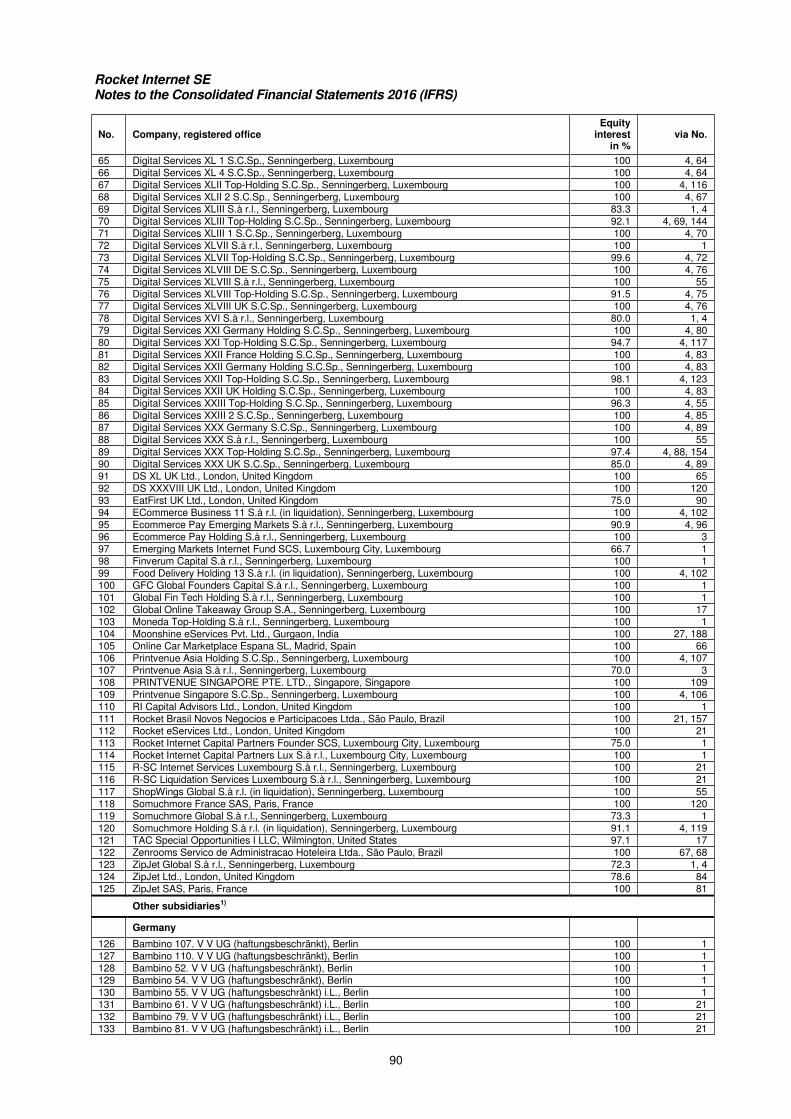
Rocket Internet SE Notes to the Consolidated Financial Statements 2016 (IFRS)
90
No. Company, registered office Equity
interest in %
via No.
65 Digital Services XL 1 S.C.Sp., Senningerberg, Luxembourg 100 4, 64
66 Digital Services XL 4 S.C.Sp., Senningerberg, Luxembourg 100 4, 64
67 Digital Services XLII Top-Holding S.C.Sp., Senningerberg, Luxembourg 100 4, 116
68 Digital Services XLII 2 S.C.Sp., Senningerberg, Luxembourg 100 4, 67
69 Digital Services XLIII S.à r.l., Senningerberg, Luxembourg 83.3 1, 4
70 Digital Services XLIII Top-Holding S.C.Sp., Senningerberg, Luxembourg 92.1 4, 69, 144
71 Digital Services XLIII 1 S.C.Sp., Senningerberg, Luxembourg 100 4, 70
72 Digital Services XLVII S.à r.l., Senningerberg, Luxembourg 100 1
73 Digital Services XLVII Top-Holding S.C.Sp., Senningerberg, Luxembourg 99.6 4, 72
74 Digital Services XLVIII DE S.C.Sp., Senningerberg, Luxembourg 100 4, 76
75 Digital Services XLVIII S.à r.l., Senningerberg, Luxembourg 100 55
76 Digital Services XLVIII Top-Holding S.C.Sp., Senningerberg, Luxembourg 91.5 4, 75
77 Digital Services XLVIII UK S.C.Sp., Senningerberg, Luxembourg 100 4, 76
78 Digital Services XVI S.à r.l., Senningerberg, Luxembourg 80.0 1, 4
79 Digital Services XXI Germany Holding S.C.Sp., Senningerberg, Luxembourg 100 4, 80
80 Digital Services XXI Top-Holding S.C.Sp., Senningerberg, Luxembourg 94.7 4, 117
81 Digital Services XXII France Holding S.C.Sp., Senningerberg, Luxembourg 100 4, 83
82 Digital Services XXII Germany Holding S.C.Sp., Senningerberg, Luxembourg 100 4, 83
83 Digital Services XXII Top-Holding S.C.Sp., Senningerberg, Luxembourg 98.1 4, 123
84 Digital Services XXII UK Holding S.C.Sp., Senningerberg, Luxembourg 100 4, 83
85 Digital Services XXIII Top-Holding S.C.Sp., Senningerberg, Luxembourg 96.3 4, 55
86 Digital Services XXIII 2 S.C.Sp., Senningerberg, Luxembourg 100 4, 85
87 Digital Services XXX Germany S.C.Sp., Senningerberg, Luxembourg 100 4, 89
88 Digital Services XXX S.à r.l., Senningerberg, Luxembourg 100 55
89 Digital Services XXX Top-Holding S.C.Sp., Senningerberg, Luxembourg 97.4 4, 88, 154
90 Digital Services XXX UK S.C.Sp., Senningerberg, Luxembourg 85.0 4, 89
91 DS XL UK Ltd., London, United Kingdom 100 65
92 DS XXXVIII UK Ltd., London, United Kingdom 100 120
93 EatFirst UK Ltd., London, United Kingdom 75.0 90
94 ECommerce Business 11 S.à r.l. (in liquidation), Senningerberg, Luxembourg 100 4, 102
95 Ecommerce Pay Emerging Markets S.à r.l., Senningerberg, Luxembourg 90.9 4, 96
96 Ecommerce Pay Holding S.à r.l., Senningerberg, Luxembourg 100 3
97 Emerging Markets Internet Fund SCS, Luxembourg City, Luxembourg 66.7 1
98 Finverum Capital S.à r.l., Senningerberg, Luxembourg 100 1
99 Food Delivery Holding 13 S.à r.l. (in liquidation), Senningerberg, Luxembourg 100 4, 102
100 GFC Global Founders Capital S.à r.l., Senningerberg, Luxembourg 100 1
101 Global Fin Tech Holding S.à r.l., Senningerberg, Luxembourg 100 1
102 Global Online Takeaway Group S.A., Senningerberg, Luxembourg 100 17
103 Moneda Top-Holding S.à r.l., Senningerberg, Luxembourg 100 1
104 Moonshine eServices Pvt. Ltd., Gurgaon, India 100 27, 188
105 Online Car Marketplace Espana SL, Madrid, Spain 100 66
106 Printvenue Asia Holding S.C.Sp., Senningerberg, Luxembourg 100 4, 107
107 Printvenue Asia S.à r.l., Senningerberg, Luxembourg 70.0 3
108 PRINTVENUE SINGAPORE PTE. LTD., Singapore, Singapore 100 109
109 Printvenue Singapore S.C.Sp., Senningerberg, Luxembourg 100 4, 106
110 RI Capital Advisors Ltd., London, United Kingdom 100 1
111 Rocket Brasil Novos Negocios e Participacoes Ltda., São Paulo, Brazil 100 21, 157
112 Rocket eServices Ltd., London, United Kingdom 100 21
113 Rocket Internet Capital Partners Founder SCS, Luxembourg City, Luxembourg 75.0 1
114 Rocket Internet Capital Partners Lux S.à r.l., Luxembourg City, Luxembourg 100 1
115 R-SC Internet Services Luxembourg S.à r.l., Senningerberg, Luxembourg 100 21
116 R-SC Liquidation Services Luxembourg S.à r.l., Senningerberg, Luxembourg 100 21
117 ShopWings Global S.à r.l. (in liquidation), Senningerberg, Luxembourg 100 55
118 Somuchmore France SAS, Paris, France 100 120
119 Somuchmore Global S.à r.l., Senningerberg, Luxembourg 73.3 1
120 Somuchmore Holding S.à r.l. (in liquidation), Senningerberg, Luxembourg 91.1 4, 119
121 TAC Special Opportunities I LLC, Wilmington, United States 97.1 17
122 Zenrooms Servico de Administracao Hoteleira Ltda., São Paulo, Brazil 100 67, 68
123 ZipJet Global S.à r.l., Senningerberg, Luxembourg 72.3 1, 4
124 ZipJet Ltd., London, United Kingdom 78.6 84
125 ZipJet SAS, Paris, France 100 81
Other subsidiaries1)
Germany
126 Bambino 107. V V UG (haftungsbeschränkt), Berlin 100 1
127 Bambino 110. V V UG (haftungsbeschränkt), Berlin 100 1
128 Bambino 52. V V UG (haftungsbeschränkt), Berlin 100 1
129 Bambino 54. V V UG (haftungsbeschränkt), Berlin 100 1
130 Bambino 55. V V UG (haftungsbeschränkt) i.L., Berlin 100 1
131 Bambino 61. V V UG (haftungsbeschränkt) i.L., Berlin 100 21
132 Bambino 79. V V UG (haftungsbeschränkt) i.L., Berlin 100 21
133 Bambino 81. V V UG (haftungsbeschränkt) i.L., Berlin 100 21
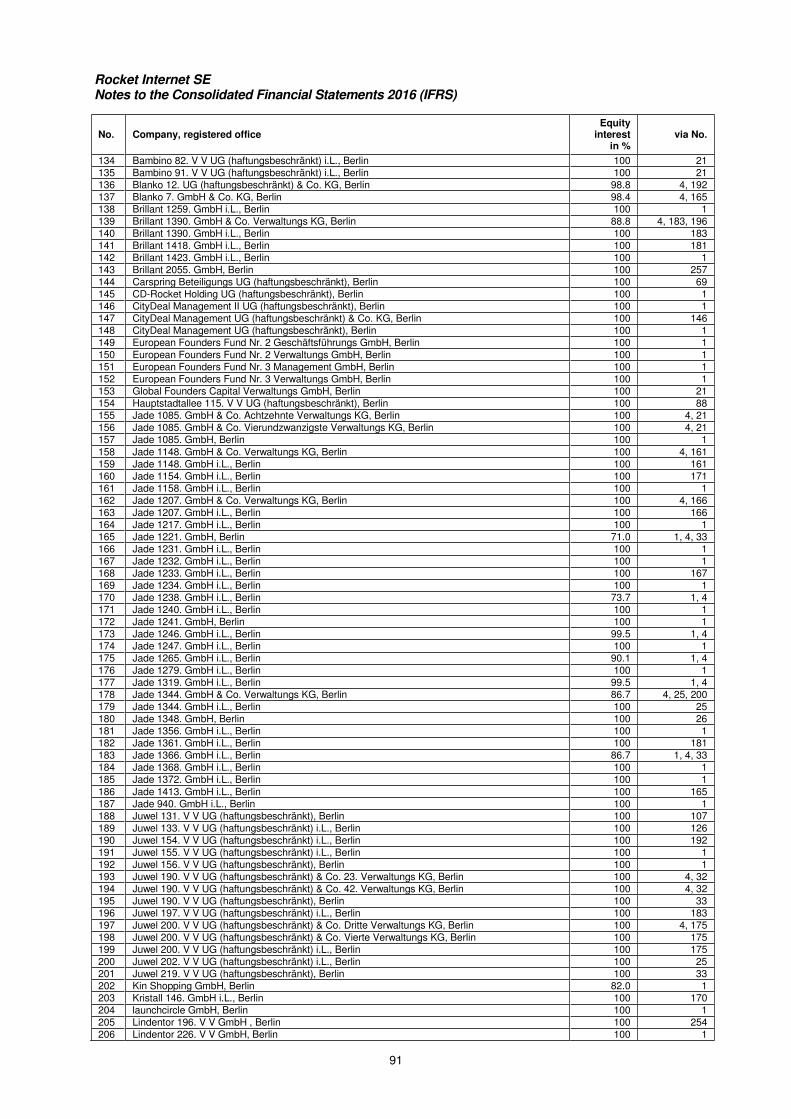
Rocket Internet SE Notes to the Consolidated Financial Statements 2016 (IFRS)
91
No. Company, registered office Equity
interest in %
via No.
134 Bambino 82. V V UG (haftungsbeschränkt) i.L., Berlin 100 21
135 Bambino 91. V V UG (haftungsbeschränkt) i.L., Berlin 100 21
136 Blanko 12. UG (haftungsbeschränkt) & Co. KG, Berlin 98.8 4, 192
137 Blanko 7. GmbH & Co. KG, Berlin 98.4 4, 165
138 Brillant 1259. GmbH i.L., Berlin 100 1
139 Brillant 1390. GmbH & Co. Verwaltungs KG, Berlin 88.8 4, 183, 196
140 Brillant 1390. GmbH i.L., Berlin 100 183
141 Brillant 1418. GmbH i.L., Berlin 100 181
142 Brillant 1423. GmbH i.L., Berlin 100 1
143 Brillant 2055. GmbH, Berlin 100 257
144 Carspring Beteiligungs UG (haftungsbeschränkt), Berlin 100 69
145 CD-Rocket Holding UG (haftungsbeschränkt), Berlin 100 1
146 CityDeal Management II UG (haftungsbeschränkt), Berlin 100 1
147 CityDeal Management UG (haftungsbeschränkt) & Co. KG, Berlin 100 146
148 CityDeal Management UG (haftungsbeschränkt), Berlin 100 1
149 European Founders Fund Nr. 2 Geschäftsführungs GmbH, Berlin 100 1
150 European Founders Fund Nr. 2 Verwaltungs GmbH, Berlin 100 1
151 European Founders Fund Nr. 3 Management GmbH, Berlin 100 1
152 European Founders Fund Nr. 3 Verwaltungs GmbH, Berlin 100 1
153 Global Founders Capital Verwaltungs GmbH, Berlin 100 21
154 Hauptstadtallee 115. V V UG (haftungsbeschränkt), Berlin 100 88
155 Jade 1085. GmbH & Co. Achtzehnte Verwaltungs KG, Berlin 100 4, 21
156 Jade 1085. GmbH & Co. Vierundzwanzigste Verwaltungs KG, Berlin 100 4, 21
157 Jade 1085. GmbH, Berlin 100 1
158 Jade 1148. GmbH & Co. Verwaltungs KG, Berlin 100 4, 161
159 Jade 1148. GmbH i.L., Berlin 100 161
160 Jade 1154. GmbH i.L., Berlin 100 171
161 Jade 1158. GmbH i.L., Berlin 100 1
162 Jade 1207. GmbH & Co. Verwaltungs KG, Berlin 100 4, 166
163 Jade 1207. GmbH i.L., Berlin 100 166
164 Jade 1217. GmbH i.L., Berlin 100 1
165 Jade 1221. GmbH, Berlin 71.0 1, 4, 33
166 Jade 1231. GmbH i.L., Berlin 100 1
167 Jade 1232. GmbH i.L., Berlin 100 1
168 Jade 1233. GmbH i.L., Berlin 100 167
169 Jade 1234. GmbH i.L., Berlin 100 1
170 Jade 1238. GmbH i.L., Berlin 73.7 1, 4
171 Jade 1240. GmbH i.L., Berlin 100 1
172 Jade 1241. GmbH, Berlin 100 1
173 Jade 1246. GmbH i.L., Berlin 99.5 1, 4
174 Jade 1247. GmbH i.L., Berlin 100 1
175 Jade 1265. GmbH i.L., Berlin 90.1 1, 4
176 Jade 1279. GmbH i.L., Berlin 100 1
177 Jade 1319. GmbH i.L., Berlin 99.5 1, 4
178 Jade 1344. GmbH & Co. Verwaltungs KG, Berlin 86.7 4, 25, 200
179 Jade 1344. GmbH i.L., Berlin 100 25
180 Jade 1348. GmbH, Berlin 100 26
181 Jade 1356. GmbH i.L., Berlin 100 1
182 Jade 1361. GmbH i.L., Berlin 100 181
183 Jade 1366. GmbH i.L., Berlin 86.7 1, 4, 33
184 Jade 1368. GmbH i.L., Berlin 100 1
185 Jade 1372. GmbH i.L., Berlin 100 1
186 Jade 1413. GmbH i.L., Berlin 100 165
187 Jade 940. GmbH i.L., Berlin 100 1
188 Juwel 131. V V UG (haftungsbeschränkt), Berlin 100 107
189 Juwel 133. V V UG (haftungsbeschränkt) i.L., Berlin 100 126
190 Juwel 154. V V UG (haftungsbeschränkt) i.L., Berlin 100 192
191 Juwel 155. V V UG (haftungsbeschränkt) i.L., Berlin 100 1
192 Juwel 156. V V UG (haftungsbeschränkt), Berlin 100 1
193 Juwel 190. V V UG (haftungsbeschränkt) & Co. 23. Verwaltungs KG, Berlin 100 4, 32
194 Juwel 190. V V UG (haftungsbeschränkt) & Co. 42. Verwaltungs KG, Berlin 100 4, 32
195 Juwel 190. V V UG (haftungsbeschränkt), Berlin 100 33
196 Juwel 197. V V UG (haftungsbeschränkt) i.L., Berlin 100 183
197 Juwel 200. V V UG (haftungsbeschränkt) & Co. Dritte Verwaltungs KG, Berlin 100 4, 175
198 Juwel 200. V V UG (haftungsbeschränkt) & Co. Vierte Verwaltungs KG, Berlin 100 175
199 Juwel 200. V V UG (haftungsbeschränkt) i.L., Berlin 100 175
200 Juwel 202. V V UG (haftungsbeschränkt) i.L., Berlin 100 25
201 Juwel 219. V V UG (haftungsbeschränkt), Berlin 100 33
202 Kin Shopping GmbH, Berlin 82.0 1
203 Kristall 146. GmbH i.L., Berlin 100 170
204 launchcircle GmbH, Berlin 100 1
205 Lindentor 196. V V GmbH , Berlin 100 254
206 Lindentor 226. V V GmbH, Berlin 100 1
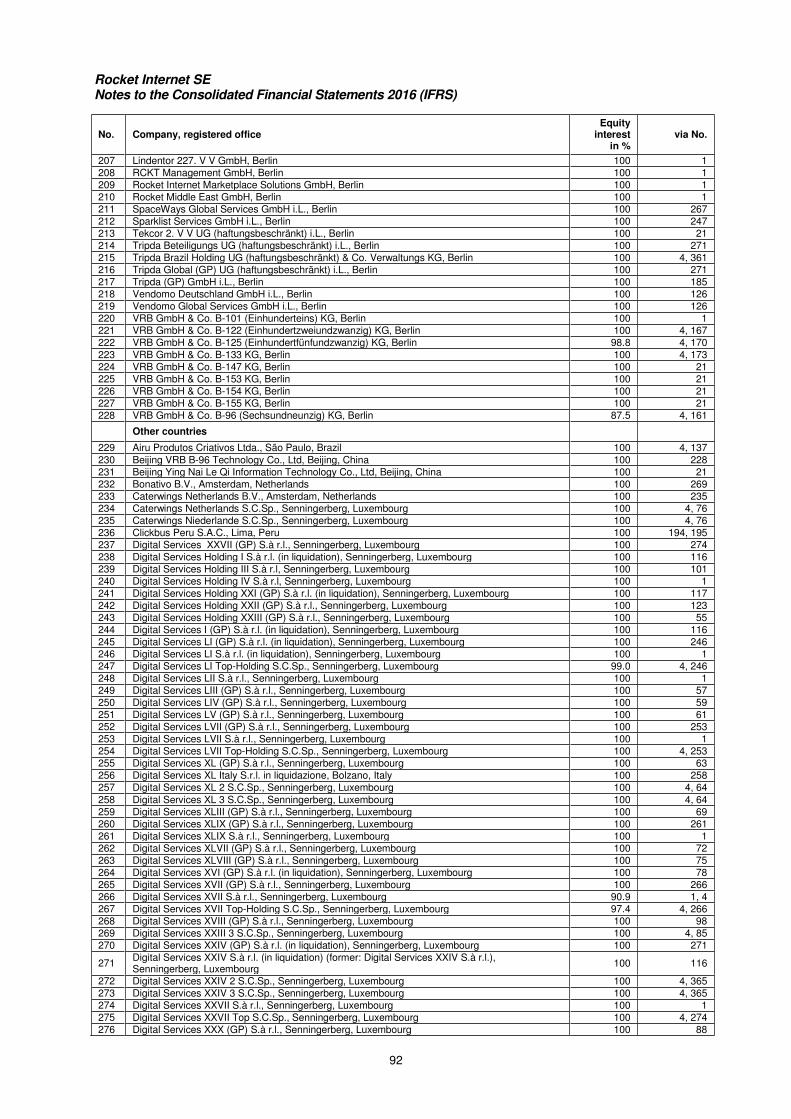
Rocket Internet SE Notes to the Consolidated Financial Statements 2016 (IFRS)
92
No. Company, registered office Equity
interest in %
via No.
207 Lindentor 227. V V GmbH, Berlin 100 1
208 RCKT Management GmbH, Berlin 100 1
209 Rocket Internet Marketplace Solutions GmbH, Berlin 100 1
210 Rocket Middle East GmbH, Berlin 100 1
211 SpaceWays Global Services GmbH i.L., Berlin 100 267
212 Sparklist Services GmbH i.L., Berlin 100 247
213 Tekcor 2. V V UG (haftungsbeschränkt) i.L., Berlin 100 21
214 Tripda Beteiligungs UG (haftungsbeschränkt) i.L., Berlin 100 271
215 Tripda Brazil Holding UG (haftungsbeschränkt) & Co. Verwaltungs KG, Berlin 100 4, 361
216 Tripda Global (GP) UG (haftungsbeschränkt) i.L., Berlin 100 271
217 Tripda (GP) GmbH i.L., Berlin 100 185
218 Vendomo Deutschland GmbH i.L., Berlin 100 126
219 Vendomo Global Services GmbH i.L., Berlin 100 126
220 VRB GmbH & Co. B-101 (Einhunderteins) KG, Berlin 100 1
221 VRB GmbH & Co. B-122 (Einhundertzweiundzwanzig) KG, Berlin 100 4, 167
222 VRB GmbH & Co. B-125 (Einhundertfünfundzwanzig) KG, Berlin 98.8 4, 170
223 VRB GmbH & Co. B-133 KG, Berlin 100 4, 173
224 VRB GmbH & Co. B-147 KG, Berlin 100 21
225 VRB GmbH & Co. B-153 KG, Berlin 100 21
226 VRB GmbH & Co. B-154 KG, Berlin 100 21
227 VRB GmbH & Co. B-155 KG, Berlin 100 21
228 VRB GmbH & Co. B-96 (Sechsundneunzig) KG, Berlin 87.5 4, 161
Other countries
229 Airu Produtos Criativos Ltda., São Paulo, Brazil 100 4, 137
230 Beijing VRB B-96 Technology Co., Ltd, Beijing, China 100 228
231 Beijing Ying Nai Le Qi Information Technology Co., Ltd, Beijing, China 100 21
232 Bonativo B.V., Amsterdam, Netherlands 100 269
233 Caterwings Netherlands B.V., Amsterdam, Netherlands 100 235
234 Caterwings Netherlands S.C.Sp., Senningerberg, Luxembourg 100 4, 76
235 Caterwings Niederlande S.C.Sp., Senningerberg, Luxembourg 100 4, 76
236 Clickbus Peru S.A.C., Lima, Peru 100 194, 195
237 Digital Services XXVII (GP) S.à r.l., Senningerberg, Luxembourg 100 274
238 Digital Services Holding I S.à r.l. (in liquidation), Senningerberg, Luxembourg 100 116
239 Digital Services Holding III S.à r.l, Senningerberg, Luxembourg 100 101
240 Digital Services Holding IV S.à r.l, Senningerberg, Luxembourg 100 1
241 Digital Services Holding XXI (GP) S.à r.l. (in liquidation), Senningerberg, Luxembourg 100 117
242 Digital Services Holding XXII (GP) S.à r.l., Senningerberg, Luxembourg 100 123
243 Digital Services Holding XXIII (GP) S.à r.l., Senningerberg, Luxembourg 100 55
244 Digital Services I (GP) S.à r.l. (in liquidation), Senningerberg, Luxembourg 100 116
245 Digital Services LI (GP) S.à r.l. (in liquidation), Senningerberg, Luxembourg 100 246
246 Digital Services LI S.à r.l. (in liquidation), Senningerberg, Luxembourg 100 1
247 Digital Services LI Top-Holding S.C.Sp., Senningerberg, Luxembourg 99.0 4, 246
248 Digital Services LII S.à r.l., Senningerberg, Luxembourg 100 1
249 Digital Services LIII (GP) S.à r.l., Senningerberg, Luxembourg 100 57
250 Digital Services LIV (GP) S.à r.l., Senningerberg, Luxembourg 100 59
251 Digital Services LV (GP) S.à r.l., Senningerberg, Luxembourg 100 61
252 Digital Services LVII (GP) S.à r.l., Senningerberg, Luxembourg 100 253
253 Digital Services LVII S.à r.l., Senningerberg, Luxembourg 100 1
254 Digital Services LVII Top-Holding S.C.Sp., Senningerberg, Luxembourg 100 4, 253
255 Digital Services XL (GP) S.à r.l., Senningerberg, Luxembourg 100 63
256 Digital Services XL Italy S.r.l. in liquidazione, Bolzano, Italy 100 258
257 Digital Services XL 2 S.C.Sp., Senningerberg, Luxembourg 100 4, 64
258 Digital Services XL 3 S.C.Sp., Senningerberg, Luxembourg 100 4, 64
259 Digital Services XLIII (GP) S.à r.l., Senningerberg, Luxembourg 100 69
260 Digital Services XLIX (GP) S.à r.l., Senningerberg, Luxembourg 100 261
261 Digital Services XLIX S.à r.l., Senningerberg, Luxembourg 100 1
262 Digital Services XLVII (GP) S.à r.l., Senningerberg, Luxembourg 100 72
263 Digital Services XLVIII (GP) S.à r.l., Senningerberg, Luxembourg 100 75
264 Digital Services XVI (GP) S.à r.l. (in liquidation), Senningerberg, Luxembourg 100 78
265 Digital Services XVII (GP) S.à r.l., Senningerberg, Luxembourg 100 266
266 Digital Services XVII S.à r.l., Senningerberg, Luxembourg 90.9 1, 4
267 Digital Services XVII Top-Holding S.C.Sp., Senningerberg, Luxembourg 97.4 4, 266
268 Digital Services XVIII (GP) S.à r.l., Senningerberg, Luxembourg 100 98
269 Digital Services XXIII 3 S.C.Sp., Senningerberg, Luxembourg 100 4, 85
270 Digital Services XXIV (GP) S.à r.l. (in liquidation), Senningerberg, Luxembourg 100 271
271 Digital Services XXIV S.à r.l. (in liquidation) (former: Digital Services XXIV S.à r.l.), Senningerberg, Luxembourg
100 116
272 Digital Services XXIV 2 S.C.Sp., Senningerberg, Luxembourg 100 4, 365
273 Digital Services XXIV 3 S.C.Sp., Senningerberg, Luxembourg 100 4, 365
274 Digital Services XXVII S.à r.l., Senningerberg, Luxembourg 100 1
275 Digital Services XXVII Top S.C.Sp., Senningerberg, Luxembourg 100 4, 274
276 Digital Services XXX (GP) S.à r.l., Senningerberg, Luxembourg 100 88
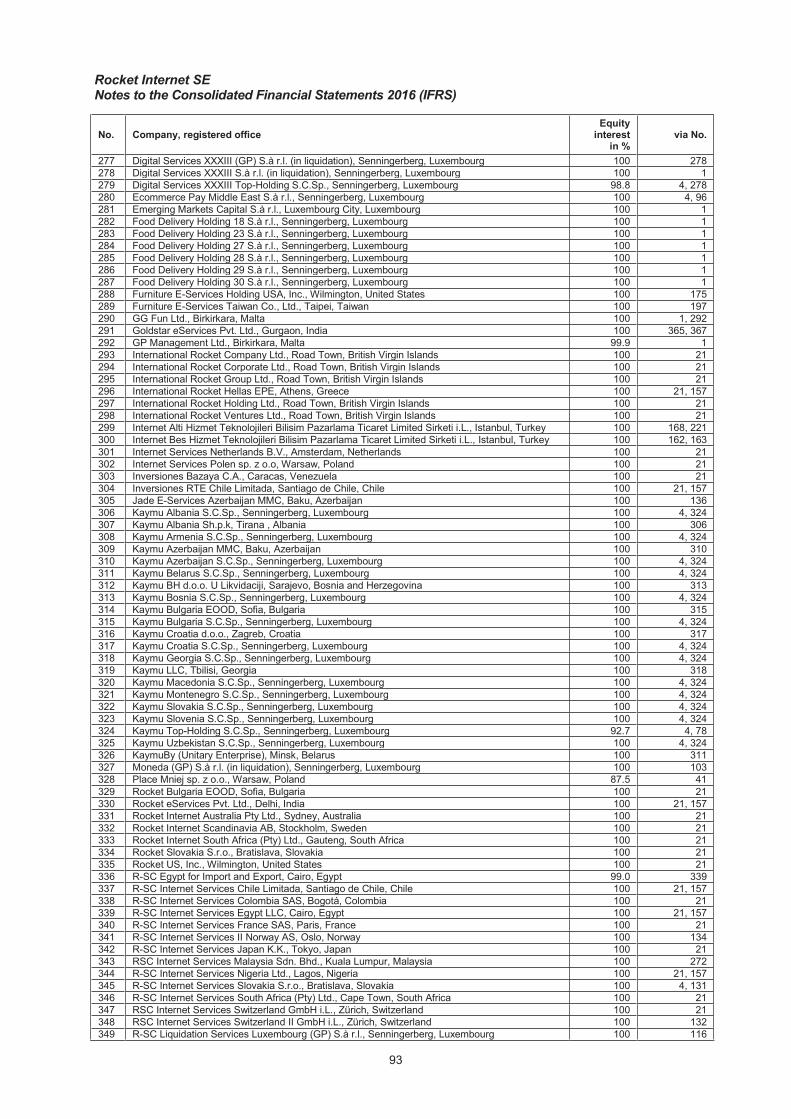
Rocket Internet SE Notes to the Consolidated Financial Statements 2016 (IFRS)
93
No. Company, registered office Equity
interest in %
via No.
277 Digital Services XXXIII (GP) S.à r.l. (in liquidation), Senningerberg, Luxembourg 100 278
278 Digital Services XXXIII S.à r.l. (in liquidation), Senningerberg, Luxembourg 100 1
279 Digital Services XXXIII Top-Holding S.C.Sp., Senningerberg, Luxembourg 98.8 4, 278
280 Ecommerce Pay Middle East S.à r.l., Senningerberg, Luxembourg 100 4, 96
281 Emerging Markets Capital S.à r.l., Luxembourg City, Luxembourg 100 1
282 Food Delivery Holding 18 S.à r.l., Senningerberg, Luxembourg 100 1
283 Food Delivery Holding 23 S.à r.l., Senningerberg, Luxembourg 100 1
284 Food Delivery Holding 27 S.à r.l., Senningerberg, Luxembourg 100 1
285 Food Delivery Holding 28 S.à r.l., Senningerberg, Luxembourg 100 1
286 Food Delivery Holding 29 S.à r.l., Senningerberg, Luxembourg 100 1
287 Food Delivery Holding 30 S.à r.l., Senningerberg, Luxembourg 100 1
288 Furniture E-Services Holding USA, Inc., Wilmington, United States 100 175
289 Furniture E-Services Taiwan Co., Ltd., Taipei, Taiwan 100 197
290 GG Fun Ltd., Birkirkara, Malta 100 1, 292
291 Goldstar eServices Pvt. Ltd., Gurgaon, India 100 365, 367
292 GP Management Ltd., Birkirkara, Malta 99.9 1
293 International Rocket Company Ltd., Road Town, British Virgin Islands 100 21
294 International Rocket Corporate Ltd., Road Town, British Virgin Islands 100 21
295 International Rocket Group Ltd., Road Town, British Virgin Islands 100 21
296 International Rocket Hellas EPE, Athens, Greece 100 21, 157
297 International Rocket Holding Ltd., Road Town, British Virgin Islands 100 21
298 International Rocket Ventures Ltd., Road Town, British Virgin Islands 100 21
299 Internet Alti Hizmet Teknolojileri Bilisim Pazarlama Ticaret Limited Sirketi i.L., Istanbul, Turkey 100 168, 221
300 Internet Bes Hizmet Teknolojileri Bilisim Pazarlama Ticaret Limited Sirketi i.L., Istanbul, Turkey 100 162, 163
301 Internet Services Netherlands B.V., Amsterdam, Netherlands 100 21
302 Internet Services Polen sp. z o.o, Warsaw, Poland 100 21
303 Inversiones Bazaya C.A., Caracas, Venezuela 100 21
304 Inversiones RTE Chile Limitada, Santiago de Chile, Chile 100 21, 157
305 Jade E-Services Azerbaijan MMC, Baku, Azerbaijan 100 136
306 Kaymu Albania S.C.Sp., Senningerberg, Luxembourg 100 4, 324
307 Kaymu Albania Sh.p.k, Tirana , Albania 100 306
308 Kaymu Armenia S.C.Sp., Senningerberg, Luxembourg 100 4, 324
309 Kaymu Azerbaijan MMC, Baku, Azerbaijan 100 310
310 Kaymu Azerbaijan S.C.Sp., Senningerberg, Luxembourg 100 4, 324
311 Kaymu Belarus S.C.Sp., Senningerberg, Luxembourg 100 4, 324
312 Kaymu BH d.o.o. U Likvidaciji, Sarajevo, Bosnia and Herzegovina 100 313
313 Kaymu Bosnia S.C.Sp., Senningerberg, Luxembourg 100 4, 324
314 Kaymu Bulgaria EOOD, Sofia, Bulgaria 100 315
315 Kaymu Bulgaria S.C.Sp., Senningerberg, Luxembourg 100 4, 324
316 Kaymu Croatia d.o.o., Zagreb, Croatia 100 317
317 Kaymu Croatia S.C.Sp., Senningerberg, Luxembourg 100 4, 324
318 Kaymu Georgia S.C.Sp., Senningerberg, Luxembourg 100 4, 324
319 Kaymu LLC, Tbilisi, Georgia 100 318
320 Kaymu Macedonia S.C.Sp., Senningerberg, Luxembourg 100 4, 324
321 Kaymu Montenegro S.C.Sp., Senningerberg, Luxembourg 100 4, 324
322 Kaymu Slovakia S.C.Sp., Senningerberg, Luxembourg 100 4, 324
323 Kaymu Slovenia S.C.Sp., Senningerberg, Luxembourg 100 4, 324
324 Kaymu Top-Holding S.C.Sp., Senningerberg, Luxembourg 92.7 4, 78
325 Kaymu Uzbekistan S.C.Sp., Senningerberg, Luxembourg 100 4, 324
326 KaymuBy (Unitary Enterprise), Minsk, Belarus 100 311
327 Moneda (GP) S.à r.l. (in liquidation), Senningerberg, Luxembourg 100 103
328 Place Mniej sp. z o.o., Warsaw, Poland 87.5 41
329 Rocket Bulgaria EOOD, Sofia, Bulgaria 100 21
330 Rocket eServices Pvt. Ltd., Delhi, India 100 21, 157
331 Rocket Internet Australia Pty Ltd., Sydney, Australia 100 21
332 Rocket Internet Scandinavia AB, Stockholm, Sweden 100 21
333 Rocket Internet South Africa (Pty) Ltd., Gauteng, South Africa 100 21
334 Rocket Slovakia S.r.o., Bratislava, Slovakia 100 21
335 Rocket US, Inc., Wilmington, United States 100 21
336 R-SC Egypt for Import and Export, Cairo, Egypt 99.0 339
337 R-SC Internet Services Chile Limitada, Santiago de Chile, Chile 100 21, 157
338 R-SC Internet Services Colombia SAS, Bogotá, Colombia 100 21
339 R-SC Internet Services Egypt LLC, Cairo, Egypt 100 21, 157
340 R-SC Internet Services France SAS, Paris, France 100 21
341 R-SC Internet Services II Norway AS, Oslo, Norway 100 134
342 R-SC Internet Services Japan K.K., Tokyo, Japan 100 21
343 RSC Internet Services Malaysia Sdn. Bhd., Kuala Lumpur, Malaysia 100 272
344 R-SC Internet Services Nigeria Ltd., Lagos, Nigeria 100 21, 157
345 R-SC Internet Services Slovakia S.r.o., Bratislava, Slovakia 100 4, 131
346 R-SC Internet Services South Africa (Pty) Ltd., Cape Town, South Africa 100 21
347 RSC Internet Services Switzerland GmbH i.L., Zürich, Switzerland 100 21
348 RSC Internet Services Switzerland II GmbH i.L., Zürich, Switzerland 100 132
349 R-SC Liquidation Services Luxembourg (GP) S.à r.l., Senningerberg, Luxembourg 100 116
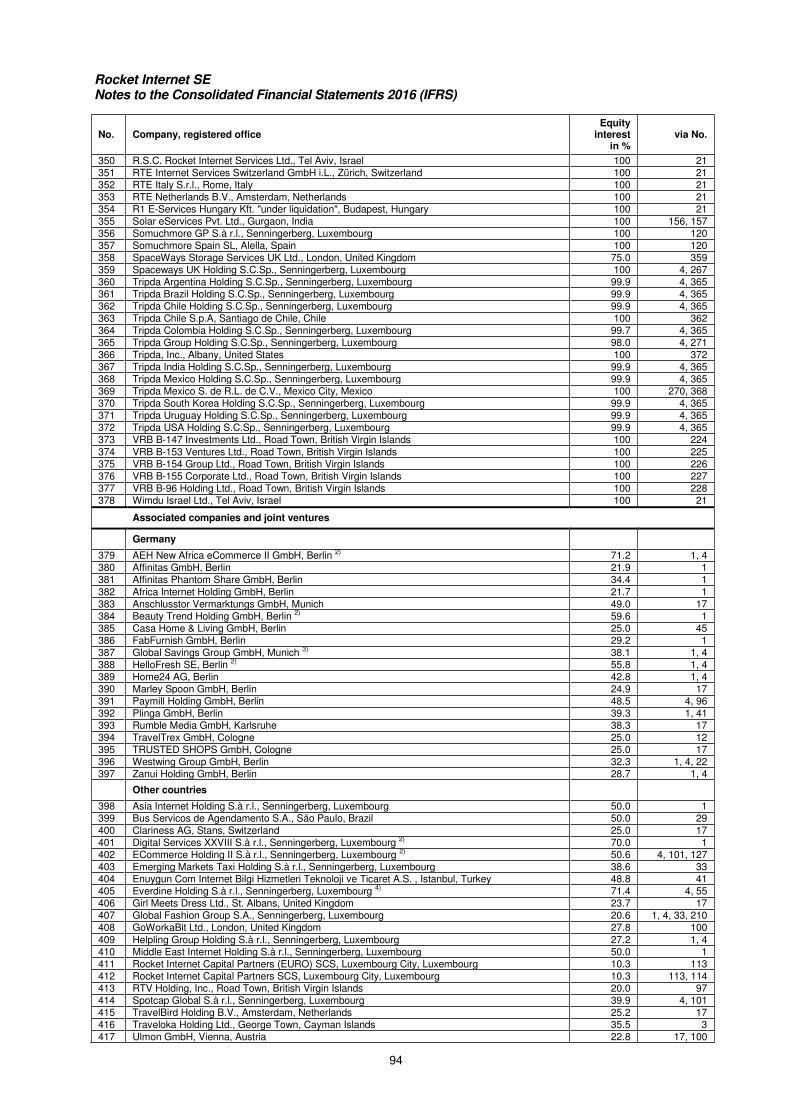
Rocket Internet SE Notes to the Consolidated Financial Statements 2016 (IFRS)
94
No. Company, registered office Equity
interest in %
via No.
350 R.S.C. Rocket Internet Services Ltd., Tel Aviv, Israel 100 21
351 RTE Internet Services Switzerland GmbH i.L., Zürich, Switzerland 100 21
352 RTE Italy S.r.l., Rome, Italy 100 21
353 RTE Netherlands B.V., Amsterdam, Netherlands 100 21
354 R1 E-Services Hungary Kft. "under liquidation", Budapest, Hungary 100 21
355 Solar eServices Pvt. Ltd., Gurgaon, India 100 156, 157
356 Somuchmore GP S.à r.l., Senningerberg, Luxembourg 100 120
357 Somuchmore Spain SL, Alella, Spain 100 120
358 SpaceWays Storage Services UK Ltd., London, United Kingdom 75.0 359
359 Spaceways UK Holding S.C.Sp., Senningerberg, Luxembourg 100 4, 267
360 Tripda Argentina Holding S.C.Sp., Senningerberg, Luxembourg 99.9 4, 365
361 Tripda Brazil Holding S.C.Sp., Senningerberg, Luxembourg 99.9 4, 365
362 Tripda Chile Holding S.C.Sp., Senningerberg, Luxembourg 99.9 4, 365
363 Tripda Chile S.p.A, Santiago de Chile, Chile 100 362
364 Tripda Colombia Holding S.C.Sp., Senningerberg, Luxembourg 99.7 4, 365
365 Tripda Group Holding S.C.Sp., Senningerberg, Luxembourg 98.0 4, 271
366 Tripda, Inc., Albany, United States 100 372
367 Tripda India Holding S.C.Sp., Senningerberg, Luxembourg 99.9 4, 365
368 Tripda Mexico Holding S.C.Sp., Senningerberg, Luxembourg 99.9 4, 365
369 Tripda Mexico S. de R.L. de C.V., Mexico City, Mexico 100 270, 368
370 Tripda South Korea Holding S.C.Sp., Senningerberg, Luxembourg 99.9 4, 365
371 Tripda Uruguay Holding S.C.Sp., Senningerberg, Luxembourg 99.9 4, 365
372 Tripda USA Holding S.C.Sp., Senningerberg, Luxembourg 99.9 4, 365
373 VRB B-147 Investments Ltd., Road Town, British Virgin Islands 100 224
374 VRB B-153 Ventures Ltd., Road Town, British Virgin Islands 100 225
375 VRB B-154 Group Ltd., Road Town, British Virgin Islands 100 226
376 VRB B-155 Corporate Ltd., Road Town, British Virgin Islands 100 227
377 VRB B-96 Holding Ltd., Road Town, British Virgin Islands 100 228
378 Wimdu Israel Ltd., Tel Aviv, Israel 100 21
Associated companies and joint ventures
Germany
379 AEH New Africa eCommerce II GmbH, Berlin 2) 71.2 1, 4
380 Affinitas GmbH, Berlin 21.9 1
381 Affinitas Phantom Share GmbH, Berlin 34.4 1
382 Africa Internet Holding GmbH, Berlin 21.7 1
383 Anschlusstor Vermarktungs GmbH, Munich 49.0 17
384 Beauty Trend Holding GmbH, Berlin 2) 59.6 1
385 Casa Home & Living GmbH, Berlin 25.0 45
386 FabFurnish GmbH, Berlin 29.2 1
387 Global Savings Group GmbH, Munich 3) 38.1 1, 4
388 HelloFresh SE, Berlin 2) 55.8 1, 4
389 Home24 AG, Berlin 42.8 1, 4
390 Marley Spoon GmbH, Berlin 24.9 17
391 Paymill Holding GmbH, Berlin 48.5 4, 96
392 Plinga GmbH, Berlin 39.3 1, 41
393 Rumble Media GmbH, Karlsruhe 38.3 17
394 TravelTrex GmbH, Cologne 25.0 12
395 TRUSTED SHOPS GmbH, Cologne 25.0 17
396 Westwing Group GmbH, Berlin 32.3 1, 4, 22
397 Zanui Holding GmbH, Berlin 28.7 1, 4
Other countries
398 Asia Internet Holding S.à r.l., Senningerberg, Luxembourg 50.0 1
399 Bus Servicos de Agendamento S.A., São Paulo, Brazil 50.0 29
400 Clariness AG, Stans, Switzerland 25.0 17
401 Digital Services XXVIII S.à r.l., Senningerberg, Luxembourg 2) 70.0 1
402 ECommerce Holding II S.à r.l., Senningerberg, Luxembourg 2) 50.6 4, 101, 127
403 Emerging Markets Taxi Holding S.à r.l., Senningerberg, Luxembourg 38.6 33
404 Enuygun Com Internet Bilgi Hizmetleri Teknoloji ve Ticaret A.S. , Istanbul, Turkey 48.8 41
405 Everdine Holding S.à r.l., Senningerberg, Luxembourg 4) 71.4 4, 55
406 Girl Meets Dress Ltd., St. Albans, United Kingdom 23.7 17
407 Global Fashion Group S.A., Senningerberg, Luxembourg 20.6 1, 4, 33, 210
408 GoWorkaBit Ltd., London, United Kingdom 27.8 100
409 Helpling Group Holding S.à r.l., Senningerberg, Luxembourg 27.2 1, 4
410 Middle East Internet Holding S.à r.l., Senningerberg, Luxembourg 50.0 1
411 Rocket Internet Capital Partners (EURO) SCS, Luxembourg City, Luxembourg 10.3 113
412 Rocket Internet Capital Partners SCS, Luxembourg City, Luxembourg 10.3 113, 114
413 RTV Holding, Inc., Road Town, British Virgin Islands 20.0 97
414 Spotcap Global S.à r.l., Senningerberg, Luxembourg 39.9 4, 101
415 TravelBird Holding B.V., Amsterdam, Netherlands 25.2 17
416 Traveloka Holding Ltd., George Town, Cayman Islands 35.5 3
417 Ulmon GmbH, Vienna, Austria 22.8 17, 100
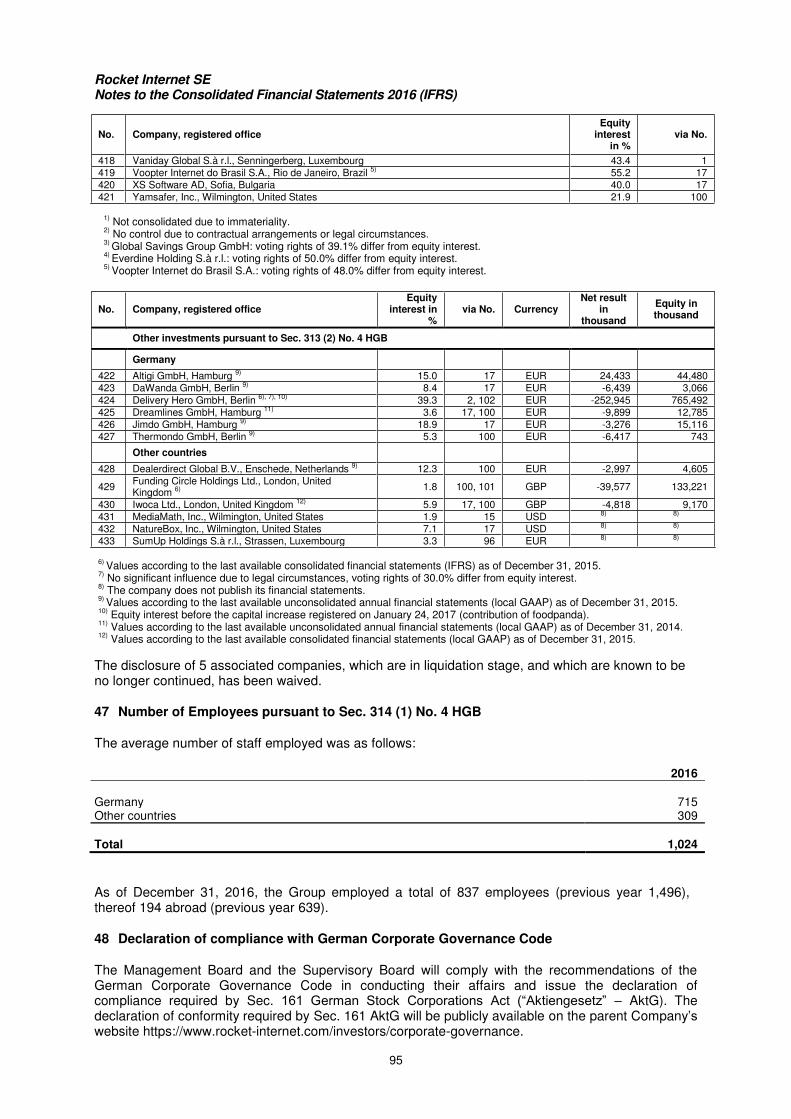
Rocket Internet SE Notes to the Consolidated Financial Statements 2016 (IFRS)
95
No. Company, registered office Equity
interest in %
via No.
418 Vaniday Global S.à r.l., Senningerberg, Luxembourg 43.4 1
419 Voopter Internet do Brasil S.A., Rio de Janeiro, Brazil 5) 55.2 17
420 XS Software AD, Sofia, Bulgaria 40.0 17
421 Yamsafer, Inc., Wilmington, United States 21.9 100
1) Not consolidated due to immateriality.
2) No control due to contractual arrangements or legal circumstances.
3) Global Savings Group GmbH: voting rights of 39.1% differ from equity interest.
4) Everdine Holding S.à r.l.: voting rights of 50.0% differ from equity interest.
5) Voopter Internet do Brasil S.A.: voting rights of 48.0% differ from equity interest.
No. Company, registered office Equity
interest in %
via No. Currency Net result
in thousand
Equity in thousand
Other investments pursuant to Sec. 313 (2) No. 4 HGB
Germany
422 Altigi GmbH, Hamburg 9) 15.0 17 EUR 24,433 44,480
423 DaWanda GmbH, Berlin 9) 8.4 17 EUR -6,439 3,066
424 Delivery Hero GmbH, Berlin 6), 7), 10) 39.3 2, 102 EUR -252,945 765,492
425 Dreamlines GmbH, Hamburg 11) 3.6 17, 100 EUR -9,899 12,785
426 Jimdo GmbH, Hamburg 9) 18.9 17 EUR -3,276 15,116
427 Thermondo GmbH, Berlin 9) 5.3 100 EUR -6,417 743
Other countries
428 Dealerdirect Global B.V., Enschede, Netherlands 9) 12.3 100 EUR -2,997 4,605
429 Funding Circle Holdings Ltd., London, United Kingdom 6)
1.8 100, 101 GBP -39,577 133,221
430 Iwoca Ltd., London, United Kingdom 12) 5.9 17, 100 GBP -4,818 9,170
431 MediaMath, Inc., Wilmington, United States 1.9 15 USD 8) 8)
432 NatureBox, Inc., Wilmington, United States 7.1 17 USD 8) 8)
433 SumUp Holdings S.à r.l., Strassen, Luxembourg 3.3 96 EUR 8) 8)
6)
Values according to the last available consolidated financial statements (IFRS) as of December 31, 2015. 7) No significant influence due to legal circumstances, voting rights of 30.0% differ from equity interest.
8) The company does not publish its financial statements.
9) Values according to the last available unconsolidated annual financial statements (local GAAP) as of December 31, 2015.
10) Equity interest before the capital increase registered on January 24, 2017 (contribution of foodpanda).
11) Values according to the last available unconsolidated annual financial statements (local GAAP) as of December 31, 2014.
12) Values according to the last available consolidated financial statements (local GAAP) as of December 31, 2015.
The disclosure of 5 associated companies, which are in liquidation stage, and which are known to be no longer continued, has been waived.
47 Number of Employees pursuant to Sec. 314 (1) No. 4 HGB
The average number of staff employed was as follows:
2016
Germany 715 Other countries 309
Total 1,024
As of December 31, 2016, the Group employed a total of 837 employees (previous year 1,496), thereof 194 abroad (previous year 639).
48 Declaration of compliance with German Corporate Governance Code
The Management Board and the Supervisory Board will comply with the recommendations of the German Corporate Governance Code in conducting their affairs and issue the declaration of compliance required by Sec. 161 German Stock Corporations Act (“Aktiengesetz” – AktG). The declaration of conformity required by Sec. 161 AktG will be publicly available on the parent Company’s website https://www.rocket-internet.com/investors/corporate-governance.

Rocket Internet SE Notes to the Consolidated Financial Statements 2016 (IFRS)
96
49 Authorization of the Financial Statements for Issue
The Management Board authorized the issue of the consolidated financial statements on March 31, 2017.
Berlin, March 31, 2017
The Management Board
Oliver Samwer Peter Kimpel Alexander Kudlich
Management Report for the Parent Company
and the Group 2016
Rocket Internet SE, Berlin
Non-binding convenience translation from German
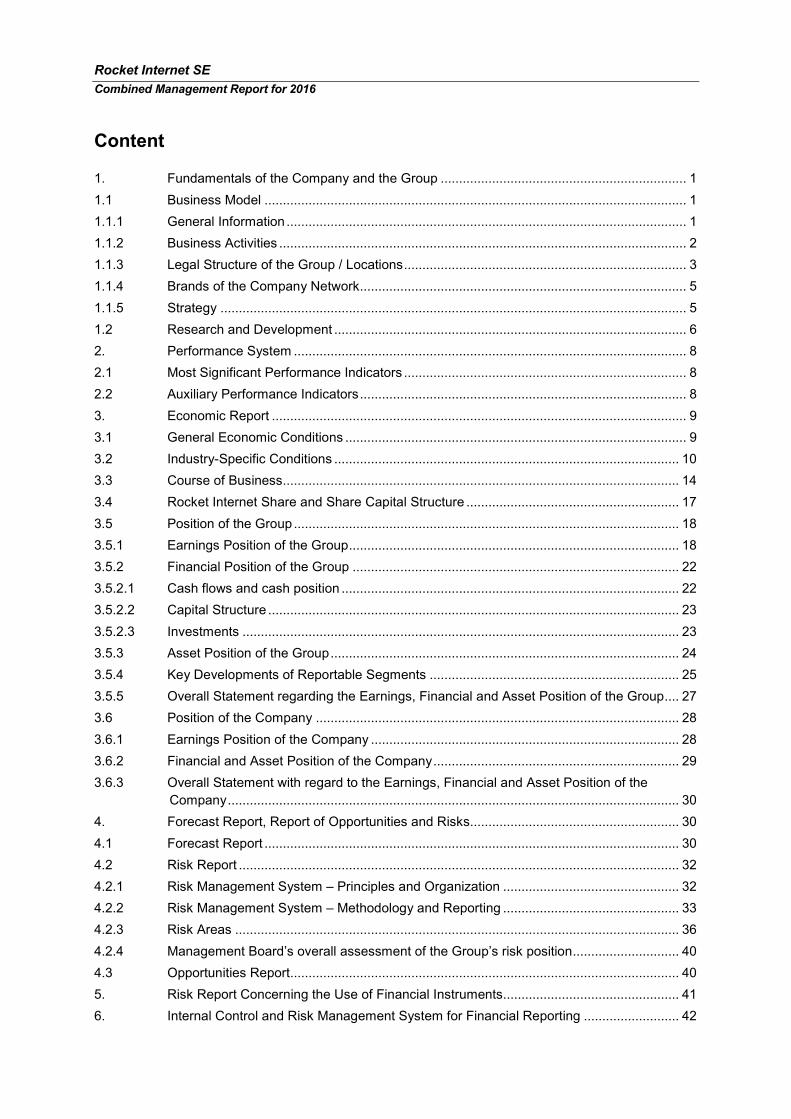
Rocket Internet SE
Combined Management Report for 2016
Content
1. Fundamentals of the Company and the Group ................................................................... 1
1.1 Business Model ................................................................................................................... 1
1.1.1 General Information ............................................................................................................. 1
1.1.2 Business Activities ............................................................................................................... 2
1.1.3 Legal Structure of the Group / Locations ............................................................................. 3
1.1.4 Brands of the Company Network ......................................................................................... 5
1.1.5 Strategy ............................................................................................................................... 5
1.2 Research and Development ................................................................................................ 6
2. Performance System ........................................................................................................... 8
2.1 Most Significant Performance Indicators ............................................................................. 8
2.2 Auxiliary Performance Indicators ......................................................................................... 8
3. Economic Report ................................................................................................................. 9
3.1 General Economic Conditions ............................................................................................. 9
3.2 Industry-Specific Conditions .............................................................................................. 10
3.3 Course of Business............................................................................................................ 14
3.4 Rocket Internet Share and Share Capital Structure .......................................................... 17
3.5 Position of the Group ......................................................................................................... 18
3.5.1 Earnings Position of the Group .......................................................................................... 18
3.5.2 Financial Position of the Group ......................................................................................... 22
3.5.2.1 Cash flows and cash position ............................................................................................ 22
3.5.2.2 Capital Structure ................................................................................................................ 23
3.5.2.3 Investments ....................................................................................................................... 23
3.5.3 Asset Position of the Group ............................................................................................... 24
3.5.4 Key Developments of Reportable Segments .................................................................... 25
3.5.5 Overall Statement regarding the Earnings, Financial and Asset Position of the Group .... 27
3.6 Position of the Company ................................................................................................... 28
3.6.1 Earnings Position of the Company .................................................................................... 28
3.6.2 Financial and Asset Position of the Company ................................................................... 29
3.6.3 Overall Statement with regard to the Earnings, Financial and Asset Position of the
Company ........................................................................................................................... 30
4. Forecast Report, Report of Opportunities and Risks ......................................................... 30
4.1 Forecast Report ................................................................................................................. 30
4.2 Risk Report ........................................................................................................................ 32
4.2.1 Risk Management System – Principles and Organization ................................................ 32
4.2.2 Risk Management System – Methodology and Reporting ................................................ 33
4.2.3 Risk Areas ......................................................................................................................... 36
4.2.4 Management Board’s overall assessment of the Group’s risk position ............................. 40
4.3 Opportunities Report.......................................................................................................... 40
5. Risk Report Concerning the Use of Financial Instruments ................................................ 41
6. Internal Control and Risk Management System for Financial Reporting .......................... 42

Rocket Internet SE
Combined Management Report for 2016
7. Takeover Law Disclosures Pursuant to Secs. 289 (4) and 315 (4) HGB (German
Commercial Code) ............................................................................................................ 43
8. Remuneration Report ........................................................................................................ 46
8.1 Remuneration of the Management Board ......................................................................... 46
8.2 Remuneration of the Supervisory Board ........................................................................... 50
9. Corporate Governance Report / Declaration of Conformity .............................................. 51
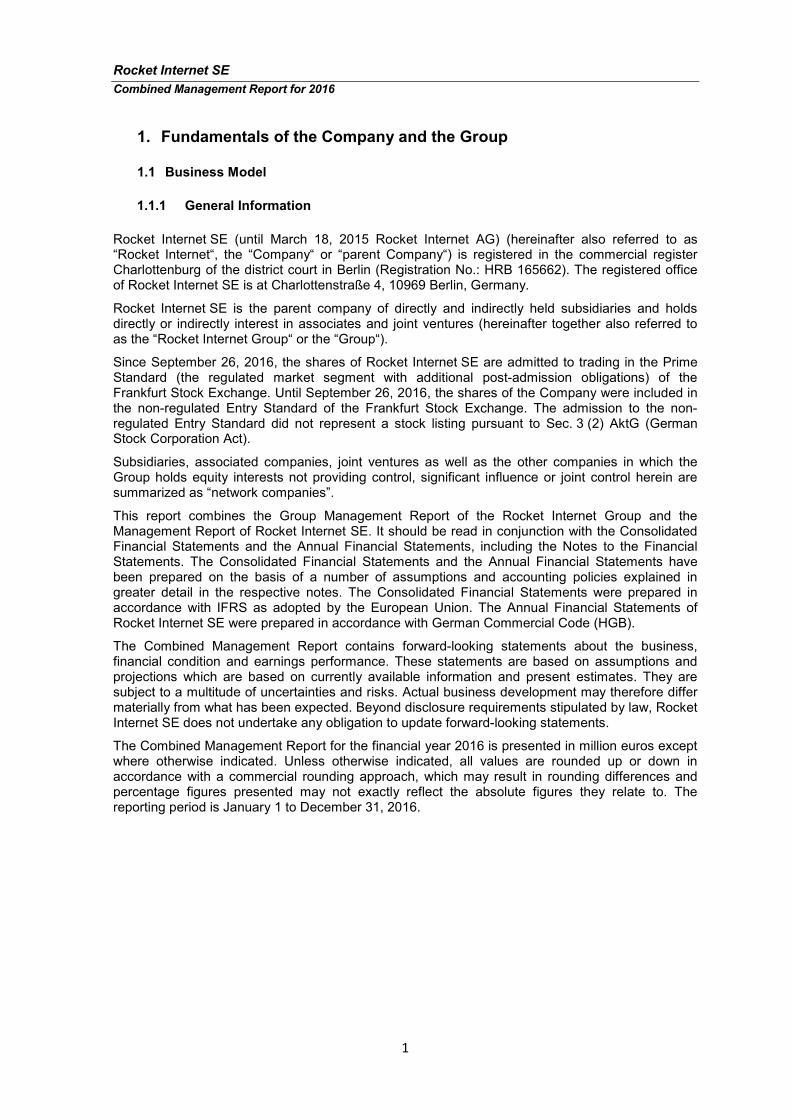
Rocket Internet SE
Combined Management Report for 2016
1
1. Fundamentals of the Company and the Group
1.1 Business Model
1.1.1 General Information
Rocket Internet SE (until March 18, 2015 Rocket Internet AG) (hereinafter also referred to as “Rocket Internet“, the “Company“ or “parent Company“) is registered in the commercial register Charlottenburg of the district court in Berlin (Registration No.: HRB 165662). The registered office of Rocket Internet SE is at Charlottenstraße 4, 10969 Berlin, Germany.
Rocket Internet SE is the parent company of directly and indirectly held subsidiaries and holds directly or indirectly interest in associates and joint ventures (hereinafter together also referred to as the “Rocket Internet Group“ or the “Group“).
Since September 26, 2016, the shares of Rocket Internet SE are admitted to trading in the Prime Standard (the regulated market segment with additional post-admission obligations) of the Frankfurt Stock Exchange. Until September 26, 2016, the shares of the Company were included in the non-regulated Entry Standard of the Frankfurt Stock Exchange. The admission to the non-regulated Entry Standard did not represent a stock listing pursuant to Sec. 3 (2) AktG (German Stock Corporation Act).
Subsidiaries, associated companies, joint ventures as well as the other companies in which the Group holds equity interests not providing control, significant influence or joint control herein are summarized as “network companies”.
This report combines the Group Management Report of the Rocket Internet Group and the Management Report of Rocket Internet SE. It should be read in conjunction with the Consolidated Financial Statements and the Annual Financial Statements, including the Notes to the Financial Statements. The Consolidated Financial Statements and the Annual Financial Statements have been prepared on the basis of a number of assumptions and accounting policies explained in greater detail in the respective notes. The Consolidated Financial Statements were prepared in accordance with IFRS as adopted by the European Union. The Annual Financial Statements of Rocket Internet SE were prepared in accordance with German Commercial Code (HGB).
The Combined Management Report contains forward-looking statements about the business, financial condition and earnings performance. These statements are based on assumptions and projections which are based on currently available information and present estimates. They are subject to a multitude of uncertainties and risks. Actual business development may therefore differ materially from what has been expected. Beyond disclosure requirements stipulated by law, Rocket Internet SE does not undertake any obligation to update forward-looking statements.
The Combined Management Report for the financial year 2016 is presented in million euros except where otherwise indicated. Unless otherwise indicated, all values are rounded up or down in accordance with a commercial rounding approach, which may result in rounding differences and percentage figures presented may not exactly reflect the absolute figures they relate to. The reporting period is January 1 to December 31, 2016.
Rocket Internet SE
Combined Management Report for 2016
2
1.1.2 Business Activities
Rocket Internet incubates and invests in Internet companies with proven business models. On both incubation and investment, we currently focus on four industry sectors of online and mobile retail and services that make up a significant share of consumer spending: Food & Groceries, Fashion, General Merchandise and Home & Living.
Rocket Internet has industrialized the process of incubation with its platform approach. The access to our know-how and our ability to scale a business quickly provide new companies with a key competitive advantage. They benefit from strong network effects, our technological, functional and regional expertise, strategic partnerships and in-house knowledge sharing. We implement our business strategy through our close involvement in the day-to-day management of many network companies and our hands-on participation in their operational development. We provide these network companies with guidance to develop their operations and we seek to foster their operational development by giving them access to deep functional expertise, proprietary technology and by sharing our proprietary knowledge with them.
We deploy capital on the premise that the offline to online shift will continue to disrupt almost all sectors and fundamentally change business models and industries. We are agnostic to building versus investing in Internet companies and look for companies and business models that can achieve a significant scale, as well as a high level of profitability and defensible market leading positions over time.
Rocket Internet has a flexible and scalable platform, which enables starting several new projects per year in its five target regions
� Europe (excluding Russia and other CIS countries (Commonwealth of Independent
States)),
� Africa and Middle East,
� Asia-Pacific (excluding China),
� Russia and other CIS countries, and
� Latin America.
Four Industry Sectors
Rocket Internet is focused on proven Internet-based business models that satisfy basic consumer needs across the following four industry sectors1:
� Food & Groceries (individualized fresh food at home and online food delivery and
takeaway),
� Fashion (emerging markets online fashion),
� General Merchandise (emerging markets online retail as well as marketplaces for online
merchandise) and
� Home & Living (international home & living eCommerce).
Regional Internet Groups
Rocket Internet has created Regional Internet Groups in order to combine the knowledge of local markets with the business model expertise, to foster regional commercial, strategic and investment partnerships especially with mobile operators. Our Regional Internet Groups include Asia Pacific Internet Group, Middle East Internet Group and Jumia Group (former Africa Internet Group).
1Sectors do not represent reportable segments.
Rocket Internet SE
Combined Management Report for 2016
3
New Businesses & Investments
In addition to the companies in the four industry sectors, Rocket Internet owns stakes in companies at varying maturity stages, ranging from recently launched models to companies that are in the process of establishing leadership positions or still expanding their geographic reach.
GFC Investments
Besides founding new companies ourselves, we invest in existing companies (the so-called “GFC Investments” (Global Founders Capital Investments)) by either participating in a financing round or purchasing stakes through secondary transactions. These investments are geared toward long-term commitments, where we seek to create value in the long-term by developing the business.
Services
Furthermore, Rocket Internet Group performs a range of IT systems engineering, product design, online marketing and other services, particularly commercial and technical consulting services for its subsidiaries and non-controlled equity investments. Rocket Internet is involved in the strategic leadership and tactical implementation of the business plans of its subsidiaries, associates and joint ventures, in particular in the early stage.
Rocket Internet has created the Rocket Internet platform to systematize the process of identifying, building and scaling Internet companies around the world. The goal is to identify commonalities within different business models and leverage these via a platform approach to optimize the building and scaling process.
1.1.3 Legal Structure of the Group / Locations
While Rocket Internet as well as some of its subsidiaries focus on providing services along the different functional areas of an Internet business, the operational business is carried out exclusively by Rocket Internet’s subsidiaries, associates and joint ventures under the umbrella of specifically created consumer brands.
In its role as Group holding, Rocket Internet fulfils central functions including operational investment management, accounting, Group financial reporting, press and investor relations, risk management and internal audit as well as human resources management.
Rocket Internet typically owns directly or indirectly approximately 80% of its companies2 at the time of launch, with the remainder set aside for equity participations of the management of the respective network company. In subsequent financing rounds, the companies attract the equity financing necessary to expand their business from Rocket Internet and other external investors. The external equity financing is provided by strategic partners and other strategic and financial investors, including existing Rocket Internet shareholders. These investments are made either directly into the company or indirectly into an intermediate holding company or a Regional Internet Group. In practice, this has meant that the direct and indirect stakes of Rocket Internet in a company have diluted over time to less than 50%. Furthermore, for several companies in which Rocket Internet holds a participation of more than 50%, shareholder agreements exist that lead to ongoing restrictions of Rocket Internet’s control over those network companies. Therefore as of December 31, 2016, Rocket Internet does not consolidate most of its significant network companies, but accounts for them as associated companies or joint ventures. The most important associated companies and joint ventures in Rocket Internet Group as of December 31, 2016 are:
2 All participation quotas for the network companies shown in the financial statements are based on the Group’s ownership
calculated pursuant to the respective accounting rules (e.g. reflecting the transaction closing dates, dates of change in control, considering trust shares allocated to the Group, excluding stakes indirectly held via RICP etc.) and may therefore differ from the respective information (beneficial interest including RICP) published on the Company’s website which is based on the signing dates.
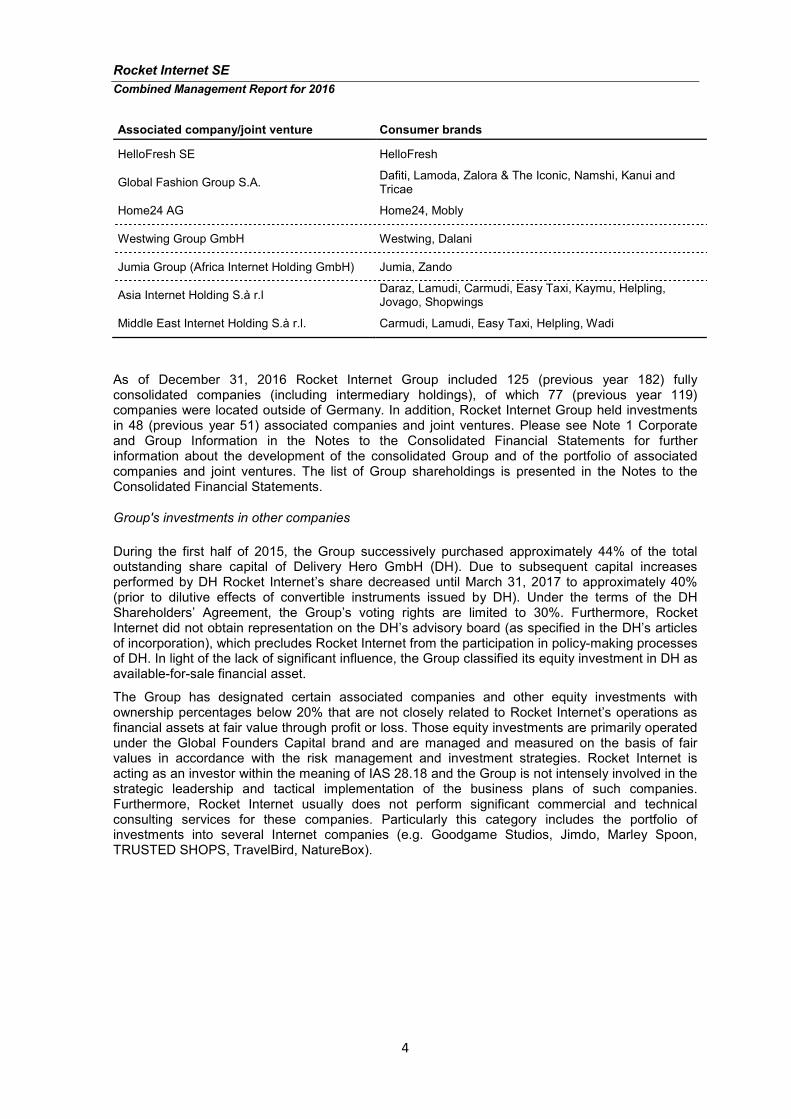
Rocket Internet SE
Combined Management Report for 2016
4
Associated company/joint venture Consumer brands
HelloFresh SE HelloFresh
Global Fashion Group S.A. Dafiti, Lamoda, Zalora & The Iconic, Namshi, Kanui and Tricae
Home24 AG Home24, Mobly
Westwing Group GmbH Westwing, Dalani
Jumia Group (Africa Internet Holding GmbH) Jumia, Zando
Asia Internet Holding S.à r.l Daraz, Lamudi, Carmudi, Easy Taxi, Kaymu, Helpling, Jovago, Shopwings
Middle East Internet Holding S.à r.l. Carmudi, Lamudi, Easy Taxi, Helpling, Wadi
As of December 31, 2016 Rocket Internet Group included 125 (previous year 182) fully consolidated companies (including intermediary holdings), of which 77 (previous year 119) companies were located outside of Germany. In addition, Rocket Internet Group held investments in 48 (previous year 51) associated companies and joint ventures. Please see Note 1 Corporate and Group Information in the Notes to the Consolidated Financial Statements for further information about the development of the consolidated Group and of the portfolio of associated companies and joint ventures. The list of Group shareholdings is presented in the Notes to the Consolidated Financial Statements.
Group's investments in other companies
During the first half of 2015, the Group successively purchased approximately 44% of the total outstanding share capital of Delivery Hero GmbH (DH). Due to subsequent capital increases performed by DH Rocket Internet’s share decreased until March 31, 2017 to approximately 40% (prior to dilutive effects of convertible instruments issued by DH). Under the terms of the DH Shareholders’ Agreement, the Group’s voting rights are limited to 30%. Furthermore, Rocket Internet did not obtain representation on the DH’s advisory board (as specified in the DH’s articles of incorporation), which precludes Rocket Internet from the participation in policy-making processes of DH. In light of the lack of significant influence, the Group classified its equity investment in DH as available-for-sale financial asset.
The Group has designated certain associated companies and other equity investments with ownership percentages below 20% that are not closely related to Rocket Internet’s operations as financial assets at fair value through profit or loss. Those equity investments are primarily operated under the Global Founders Capital brand and are managed and measured on the basis of fair values in accordance with the risk management and investment strategies. Rocket Internet is acting as an investor within the meaning of IAS 28.18 and the Group is not intensely involved in the strategic leadership and tactical implementation of the business plans of such companies. Furthermore, Rocket Internet usually does not perform significant commercial and technical consulting services for these companies. Particularly this category includes the portfolio of investments into several Internet companies (e.g. Goodgame Studios, Jimdo, Marley Spoon, TRUSTED SHOPS, TravelBird, NatureBox).
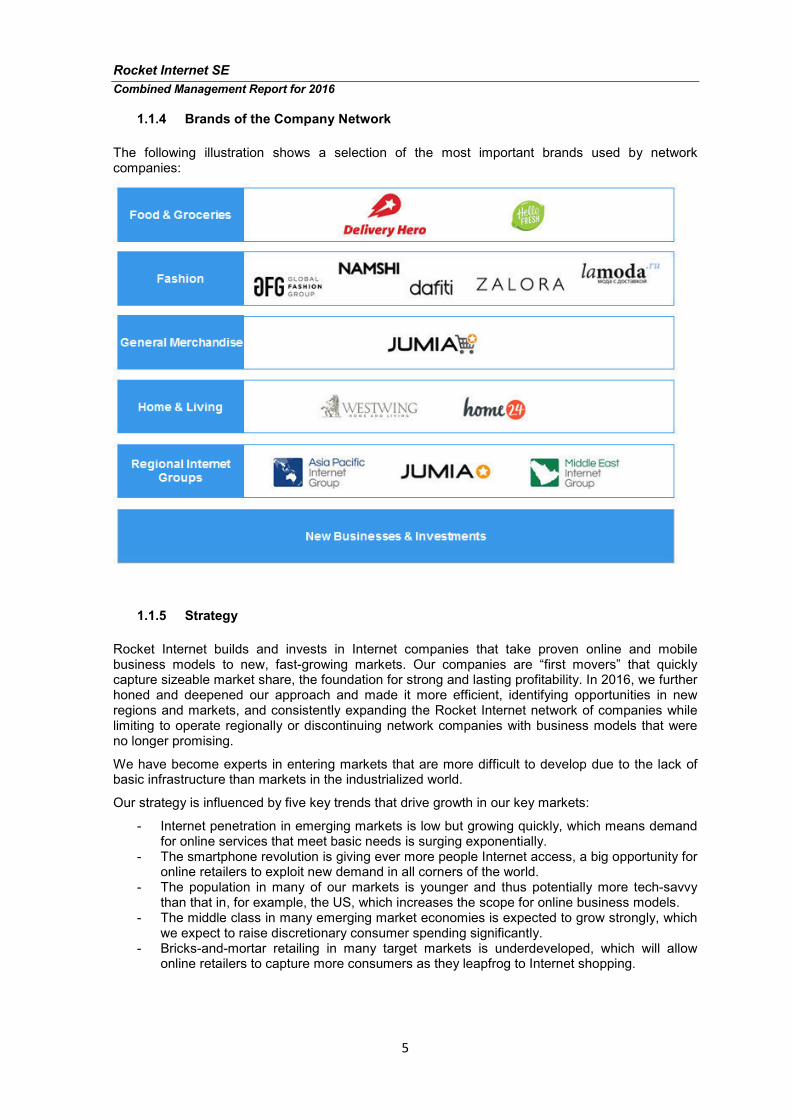
Rocket Internet SE
Combined Management Report for 2016
5
1.1.4 Brands of the Company Network
The following illustration shows a selection of the most important brands used by network companies:
1.1.5 Strategy
Rocket Internet builds and invests in Internet companies that take proven online and mobile business models to new, fast-growing markets. Our companies are “first movers” that quickly capture sizeable market share, the foundation for strong and lasting profitability. In 2016, we further honed and deepened our approach and made it more efficient, identifying opportunities in new regions and markets, and consistently expanding the Rocket Internet network of companies while limiting to operate regionally or discontinuing network companies with business models that were no longer promising.
We have become experts in entering markets that are more difficult to develop due to the lack of basic infrastructure than markets in the industrialized world.
Our strategy is influenced by five key trends that drive growth in our key markets:
- Internet penetration in emerging markets is low but growing quickly, which means demand for online services that meet basic needs is surging exponentially.
- The smartphone revolution is giving ever more people Internet access, a big opportunity for online retailers to exploit new demand in all corners of the world.
- The population in many of our markets is younger and thus potentially more tech-savvy than that in, for example, the US, which increases the scope for online business models.
- The middle class in many emerging market economies is expected to grow strongly, which we expect to raise discretionary consumer spending significantly.
- Bricks-and-mortar retailing in many target markets is underdeveloped, which will allow online retailers to capture more consumers as they leapfrog to Internet shopping.
Rocket Internet SE
Combined Management Report for 2016
6
By monitoring these developments and keeping a close eye on consumer habits in individual markets, Rocket Internet was able to further develop its network of companies in 2016.
Our operational platform and our expanding network of companies have put us in a unique position to capitalize on the growth of Internet commerce in and outside Europe. Technological innovation and rapidly changing consumer habits offer online retailers and service providers significant opportunities as Internet-based business models scale quickly. We invest in select business models and sectors, with the aim of owning significant stakes in companies that have the potential to become leading players in their markets.
Our aim is to achieve long-term leadership in the markets and sectors we enter. To gain a strong market position, we are willing to invest in the early development stages, leading to start-up losses. Long-term value creation is therefore our key focus when starting new businesses. To support this goal, we continue to invest in our product portfolio technology, the customer experience, infrastructure and logistics capabilities. Targeting profitability in the mid-term, our focus for these companies shifts over time to creating equilibrium between growth and market share on the one hand and unit economics and profitability on the other. It is our objective that these companies reach break-even within six to nine years after launch.
We provide companies launched on the Rocket Internet platform with the financial means to start up and develop their operations. Since we are the initiator of the respective company, we own a significant majority and hence we benefit from the so-called “founder economics”. Company growth is typically funded through a mix of own and third party capital, underscoring the attractiveness of and value creation in our network of companies. When we see an investment opportunity in a promising business model, we invest with conviction and provide significant amounts of capital.
Rocket Internet’s network comprises companies at different stages of development. At the time of launch, we typically own directly or indirectly an approximately 80% stake, with the remainder set aside for management equity participation. In subsequent financing rounds, we invest and attract external equity financing, which is provided by our local strategic partners as well as other strategic and financial investors. As we firmly believe in the business models we launch, we seek to retain a large share of the absolute value creation and therefore intend to maintain relatively high ownership stakes and control in many of our companies. We continue to participate in financing rounds of our companies and selectively purchase additional stakes through secondary transactions.
In January 2016, the Rocket Internet Capital Partners (RICP) Fund was launched. Rocket Internet SE has underwritten an amount equal to 10% of the subscribed capital of the Fund via its fully consolidated subsidiary Rocket Internet Capital Partners Founder SCS. The remaining 90% of the commitments are provided by third parties (institutional investors as well as high net worth individuals). The Fund invests jointly with Rocket Internet (co-investment ratio: 80% RICP; 20% Rocket Internet). The Fund has a duration of at least nine years.
Detailed, up to date information on the strategy and the major network companies of Rocket Internet can be found on the website of the parent Company: www.rocket-internet.com.
1.2 Research and Development
Rocket Internet has developed proprietary technology that provides the network companies with standardized solutions for a range of Internet business models. The modular framework is built to serve the needs of our businesses as it can be adapted to the specific requirements of individual companies and different markets. While stand-alone companies have to develop their technology from scratch, the companies in the Rocket Internet network have access to a flexible and field-tested framework, which allows our entrepreneurs to focus on their core business models.
All units of the Company, supported by a central strategic product development function, optimize the existing offerings and establish innovative products in the market. Most importantly, this means that the offering spectrum is expanded continuously through innovations.
Development expenses are capitalized as internally generated intangible assets, whereas maintenance expenditure as well as research expenses are recognized in the income statement.
Rocket Internet SE
Combined Management Report for 2016
7
In its core business, the Group constantly develops new products for the needs of its customers. New developments are subject to user tests on a timely basis. Their experience flows, in turn, into the product optimization.
The entire industry is transitioning from classic desktop-Internet companies to mobile-first and even mobile-only, which requires the development of new products. Mobile people increasingly do their research and make choices on their way from one place to another. Smartphones and tablets are more and more replacing the home desktop PC. Further, new device classes are being added, such as Internet-capable TV sets and smart watches. The Group is committed to support its network companies in delivering products and rendering services to all relevant digital devices.
Furthermore, Rocket Internet has developed instruments to analyze essential key performance indicators that allow us to compare the performance of our companies, identify best practices, and share this knowledge within our network of companies.
In 2016, the Group capitalized EUR 2.9 million of development expenses (previous year EUR 5.7 million). Amortization of internally generated intangible assets of the Group amounted to EUR 2.2 million (previous year EUR 3.2 million). In 2016, the impairment losses of internally generated intangible assets of the Group amounted to EUR 6.5 million (previous year EUR 0.0 million). In the Annual Financial Statements of Rocket Internet SE, EUR 2.9 million of development expenses were capitalized in 2016 (previous year EUR 4.0 million). Amortization of internally generated intangible assets of Rocket Internet SE amounted to EUR 1.7 million (previous year EUR 1.0 million). In 2016, the impairment losses of internally generated intangible assets in the Annual Financial Statements amounted to EUR 4.4 million (previous year EUR 0.0 million). The amount of research expenses was insignificant.
Rocket Internet SE
Combined Management Report for 2016
8
2. Performance System
In line with our strategy, we have designed our internal performance system, and defined appropriate performance indicators. The performance system involves the consolidated network companies as well as the non-consolidated network companies. We differentiate between financial and non-financial performance indicators in measuring our success in implementing our strategy. These indicators are, or can be, so-called non-GAAP financial measures. Other companies, which use financial measures with a similar designation, may define them differently.
2.1 Most Significant Performance Indicators
Our most significant performance indicators at both Group and segment level are unchanged from the previous year.
Revenue
We aim to achieve sustainable market positions in the markets and sectors we enter. Profitable growth of revenues (as reported in the income statement) is an important factor for the long-term increase in corporate value.
EBITDA
The Group aims to make its network companies, depending on the type of business model, profitable within six to nine years after their launch. Rocket Internet primarily measures the profitability of its businesses on the basis of EBITDA. We define EBITDA as result before financial result, income taxes, depreciation, amortization and impairment. At Group level EBITDA comprises the result from deconsolidation of subsidiaries and the share of profit/loss from associates and joint ventures.
EBITDA margin
The EBITDA margin of network companies is defined as EBITDA divided by revenue.
Cash position
Sustained development of revenues and earnings is supported by a solid cash position. Rocket Internet provides companies with the financial means to start up, develop and grow their operations. As capital is a key component in growing companies, we aim to maintain a strong financial position as well as access to funding. Typically the network companies are funded through a mix of capital from Rocket Internet and third-party capital. As capital is a key component of growing companies, we strive for a solid financial position and want to secure access to financial ressources. Our primary measure for monitoring and controlling our cash position is the balance sheet line item cash and cash equivalents.
2.2 Auxiliary Performance Indicators
In addition to the above-stated most significant performance indicators, the Group uses various auxiliary indicators in order to measure the economic success of business activities. For an assessment of the revenue potential of the companies, performance indicators such as GMV (gross merchandise value), number of orders, number of transactions, number of customers, number of active customers or number of homepage visitors are used. In the area of eCommerce for instance, Rocket Internet analyzes the turnover ratios of the operational net current assets, return rates in eCommerce and the quality of operational procedures in order to ensure the timely and correct shipping and invoicing of the ordered merchandise as part of the monitoring of operations.
The quality of products and solutions is a critical success factor. In this context, the reliability, user friendliness and availability of the products offered online play an important role. Availability and interruption-free operation of the service systems as well as the resistance against targeted attacks, from hackers or through manipulation for example, are essential for providing customers with the promised services.
Rocket Internet SE
Combined Management Report for 2016
9
Rocket Internet’s business approach and business policy is oriented towards sustainability. This approach is demonstrated particularly by high investments in customer relations, new fields of business and, accordingly, in future growth. With regard to customer loyalty and satisfaction as well as service quality, aspects relevant to security (e.g. security of cashless payments, data maintenance of bank accounts and other customer data) are considered highly important.
The Group presents the selected performance indicators for the major network companies on a quarterly basis on the website of the parent Company.
3. Economic Report
3.1 General Economic Conditions
According to the International Monetary Fund’s (IMF) published “World Economic Outlook” (update January 2017), global growth slowed down to 3.1% in 2016. Advanced economies are now estimated to have grown by 1.6% in 2016. Emerging market and developing economies growth is currently estimated at 4.1% in 2016. Among advanced economies, activity rebounded strongly in the United States after a weak first half of 2016, and the economy is approaching full employment. Output remains below potential in a number of other advanced economies, notably in the euro area. Preliminary third-quarter growth figures were somewhat stronger than previously forecast in some economies, such as Spain and the United Kingdom, where domestic demand held up better than expected in the aftermath of the Brexit vote. Growth prospects have marginally worsened for emerging market and developing economies, where financial conditions have generally tightened. Near-term growth prospects were revised up for China, due to expected policy stimulus and for Nigeria reflecting higher oil production due to security improvements, but were revised down for a number of other large economies, most notably India, Brazil and Mexico. Activity was weaker than expected in some Latin American countries currently in recession, such as Argentina and Brazil, as well as in Turkey, which faced a sharp contraction in tourism revenues. Activity in Russia was slightly better than expected, in part reflecting firmer oil prices. The U.S. dollar has appreciated in real effective terms by over 6% since August 2016. The currencies of advanced commodity exporters have also strengthened, reflecting the firming of commodity prices, whereas the euro and especially the Japanese yen have weakened. Several emerging market currencies depreciated substantially in recent months, most notably the Turkish lira and the Mexican peso, while the currencies of several commodity exporters, most notably Russia, appreciated. Long-term nominal and real interest rates have risen substantially since August 2016, particularly in the United Kingdom and in the United States since the November election. Geopolitical risks and a range of other non-economic factors continue to weigh on the outlook in various regions: civil war and domestic conflict in parts of the Middle East and Africa, the tragic plight of refugees and migrants in neighboring countries and in Europe, acts of terror worldwide, the protracted effects of a drought in eastern and southern Africa, and the spread of the Zika virus in Latin America. If these factors intensify, they would deepen the hardship in directly affected countries. Increased geopolitical tensions and terrorism could also take a large toll on global market sentiment and economic confidence.
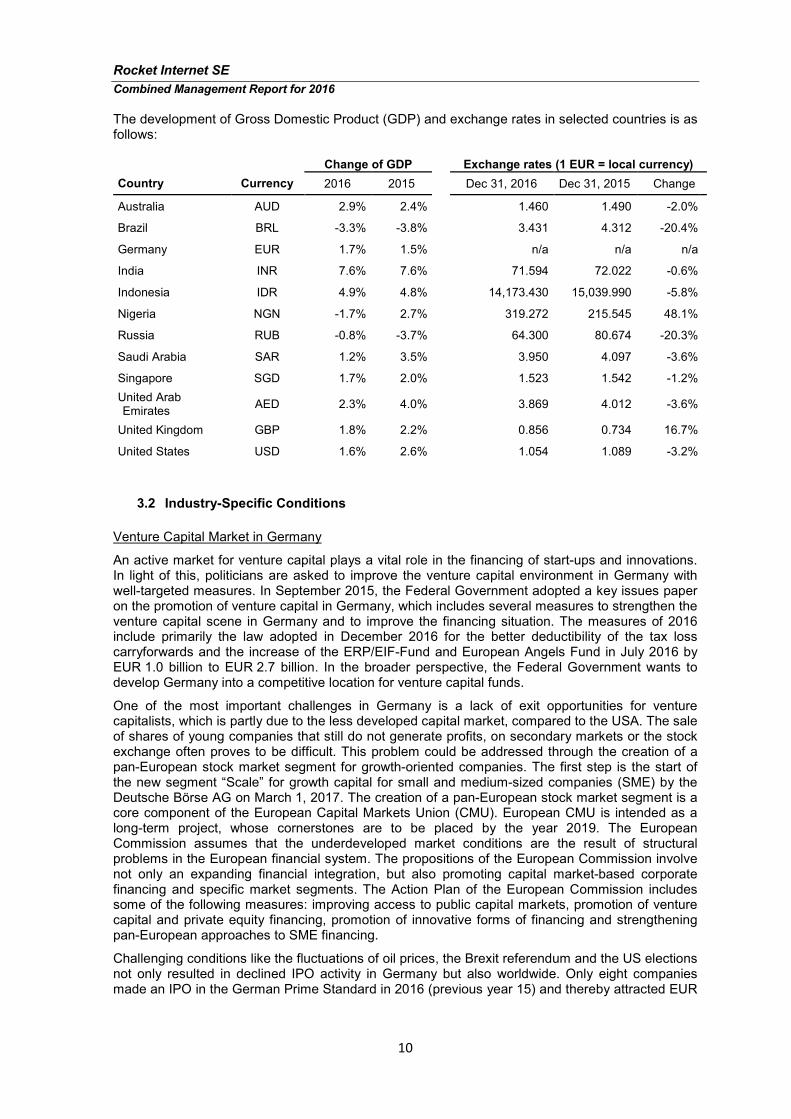
Rocket Internet SE
Combined Management Report for 2016
10
The development of Gross Domestic Product (GDP) and exchange rates in selected countries is as follows:
Change of GDP Exchange rates (1 EUR = local currency)
Country Currency 2016 2015
Dec 31, 2016 Dec 31, 2015 Change
Australia AUD 2.9% 2.4%
1.460 1.490 -2.0%
Brazil BRL -3.3% -3.8%
3.431 4.312 -20.4%
Germany EUR 1.7% 1.5% n/a n/a n/a
India INR 7.6% 7.6%
71.594 72.022 -0.6%
Indonesia IDR 4.9% 4.8%
14,173.430 15,039.990 -5.8%
Nigeria NGN -1.7% 2.7%
319.272 215.545 48.1%
Russia RUB -0.8% -3.7%
64.300 80.674 -20.3%
Saudi Arabia SAR 1.2% 3.5%
3.950 4.097 -3.6%
Singapore SGD 1.7% 2.0%
1.523 1.542 -1.2%
United Arab Emirates
AED 2.3% 4.0%
3.869 4.012 -3.6%
United Kingdom GBP 1.8% 2.2% 0.856 0.734 16.7%
United States USD 1.6% 2.6% 1.054 1.089 -3.2%
3.2 Industry-Specific Conditions
Venture Capital Market in Germany
An active market for venture capital plays a vital role in the financing of start-ups and innovations. In light of this, politicians are asked to improve the venture capital environment in Germany with well-targeted measures. In September 2015, the Federal Government adopted a key issues paper on the promotion of venture capital in Germany, which includes several measures to strengthen the venture capital scene in Germany and to improve the financing situation. The measures of 2016 include primarily the law adopted in December 2016 for the better deductibility of the tax loss carryforwards and the increase of the ERP/EIF-Fund and European Angels Fund in July 2016 by EUR 1.0 billion to EUR 2.7 billion. In the broader perspective, the Federal Government wants to develop Germany into a competitive location for venture capital funds.
One of the most important challenges in Germany is a lack of exit opportunities for venture capitalists, which is partly due to the less developed capital market, compared to the USA. The sale of shares of young companies that still do not generate profits, on secondary markets or the stock exchange often proves to be difficult. This problem could be addressed through the creation of a pan-European stock market segment for growth-oriented companies. The first step is the start of the new segment “Scale” for growth capital for small and medium-sized companies (SME) by the Deutsche Börse AG on March 1, 2017. The creation of a pan-European stock market segment is a core component of the European Capital Markets Union (CMU). European CMU is intended as a long-term project, whose cornerstones are to be placed by the year 2019. The European Commission assumes that the underdeveloped market conditions are the result of structural problems in the European financial system. The propositions of the European Commission involve not only an expanding financial integration, but also promoting capital market-based corporate financing and specific market segments. The Action Plan of the European Commission includes some of the following measures: improving access to public capital markets, promotion of venture capital and private equity financing, promotion of innovative forms of financing and strengthening pan-European approaches to SME financing.
Challenging conditions like the fluctuations of oil prices, the Brexit referendum and the US elections not only resulted in declined IPO activity in Germany but also worldwide. Only eight companies made an IPO in the German Prime Standard in 2016 (previous year 15) and thereby attracted EUR
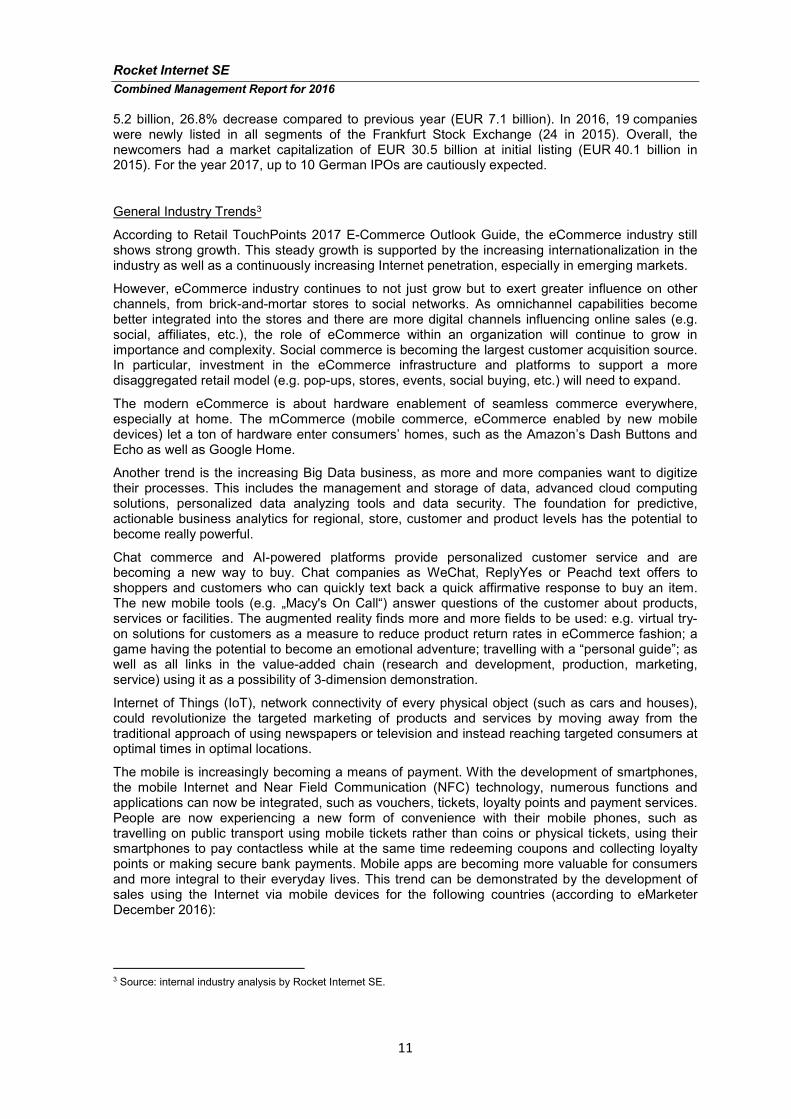
Rocket Internet SE
Combined Management Report for 2016
11
5.2 billion, 26.8% decrease compared to previous year (EUR 7.1 billion). In 2016, 19 companies were newly listed in all segments of the Frankfurt Stock Exchange (24 in 2015). Overall, the newcomers had a market capitalization of EUR 30.5 billion at initial listing (EUR 40.1 billion in 2015). For the year 2017, up to 10 German IPOs are cautiously expected.
General Industry Trends3
According to Retail TouchPoints 2017 E-Commerce Outlook Guide, the eCommerce industry still shows strong growth. This steady growth is supported by the increasing internationalization in the industry as well as a continuously increasing Internet penetration, especially in emerging markets.
However, eCommerce industry continues to not just grow but to exert greater influence on other channels, from brick-and-mortar stores to social networks. As omnichannel capabilities become better integrated into the stores and there are more digital channels influencing online sales (e.g. social, affiliates, etc.), the role of eCommerce within an organization will continue to grow in importance and complexity. Social commerce is becoming the largest customer acquisition source. In particular, investment in the eCommerce infrastructure and platforms to support a more disaggregated retail model (e.g. pop-ups, stores, events, social buying, etc.) will need to expand.
The modern eCommerce is about hardware enablement of seamless commerce everywhere, especially at home. The mCommerce (mobile commerce, eCommerce enabled by new mobile devices) let a ton of hardware enter consumers’ homes, such as the Amazon’s Dash Buttons and Echo as well as Google Home.
Another trend is the increasing Big Data business, as more and more companies want to digitize their processes. This includes the management and storage of data, advanced cloud computing solutions, personalized data analyzing tools and data security. The foundation for predictive, actionable business analytics for regional, store, customer and product levels has the potential to become really powerful.
Chat commerce and AI-powered platforms provide personalized customer service and are becoming a new way to buy. Chat companies as WeChat, ReplyYes or Peachd text offers to shoppers and customers who can quickly text back a quick affirmative response to buy an item. The new mobile tools (e.g. „Macy's On Call“) answer questions of the customer about products, services or facilities. The augmented reality finds more and more fields to be used: e.g. virtual try-on solutions for customers as a measure to reduce product return rates in eCommerce fashion; a game having the potential to become an emotional adventure; travelling with a “personal guide”; as well as all links in the value-added chain (research and development, production, marketing, service) using it as a possibility of 3-dimension demonstration.
Internet of Things (IoT), network connectivity of every physical object (such as cars and houses), could revolutionize the targeted marketing of products and services by moving away from the traditional approach of using newspapers or television and instead reaching targeted consumers at optimal times in optimal locations.
The mobile is increasingly becoming a means of payment. With the development of smartphones, the mobile Internet and Near Field Communication (NFC) technology, numerous functions and applications can now be integrated, such as vouchers, tickets, loyalty points and payment services. People are now experiencing a new form of convenience with their mobile phones, such as travelling on public transport using mobile tickets rather than coins or physical tickets, using their smartphones to pay contactless while at the same time redeeming coupons and collecting loyalty points or making secure bank payments. Mobile apps are becoming more valuable for consumers and more integral to their everyday lives. This trend can be demonstrated by the development of sales using the Internet via mobile devices for the following countries (according to eMarketer December 2016):
3 Source: internal industry analysis by Rocket Internet SE.
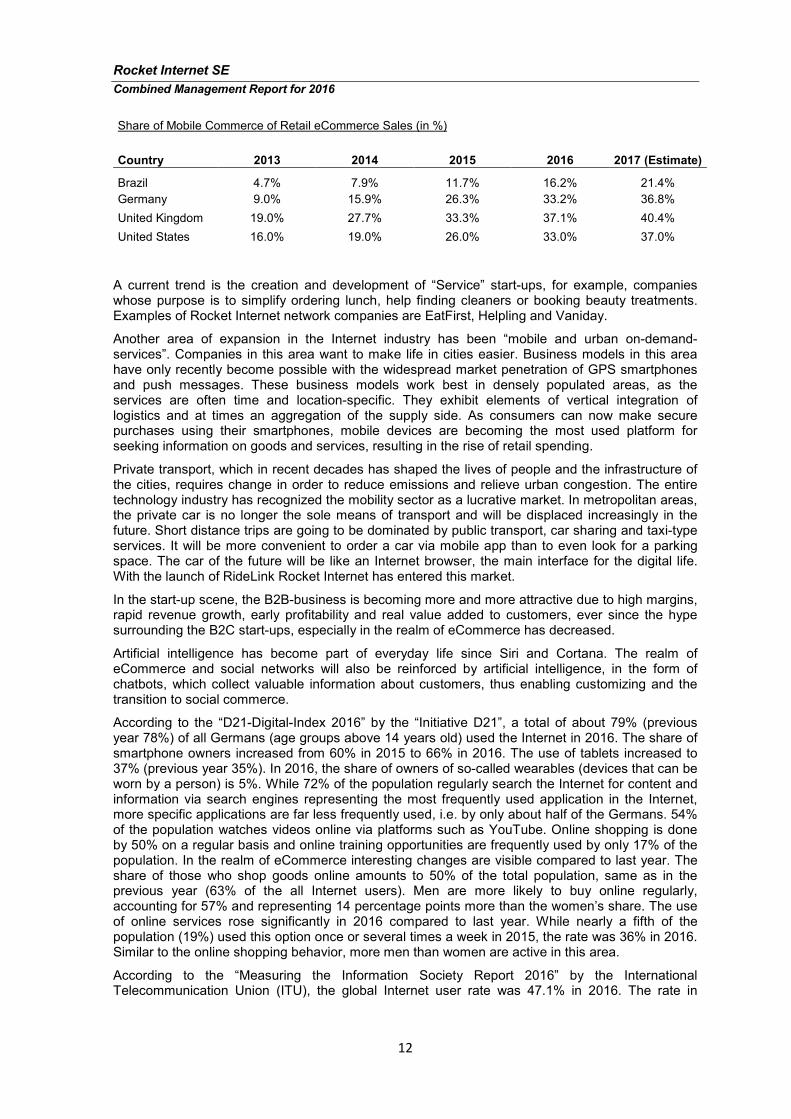
Rocket Internet SE
Combined Management Report for 2016
12
Share of Mobile Commerce of Retail eCommerce Sales (in %)
Country 2013 2014 2015 2016 2017 (Estimate)
Brazil 4.7% 7.9% 11.7% 16.2% 21.4%
Germany 9.0% 15.9% 26.3% 33.2% 36.8%
United Kingdom 19.0% 27.7% 33.3% 37.1% 40.4%
United States 16.0% 19.0% 26.0% 33.0% 37.0%
A current trend is the creation and development of “Service” start-ups, for example, companies whose purpose is to simplify ordering lunch, help finding cleaners or booking beauty treatments. Examples of Rocket Internet network companies are EatFirst, Helpling and Vaniday.
Another area of expansion in the Internet industry has been “mobile and urban on-demand-services”. Companies in this area want to make life in cities easier. Business models in this area have only recently become possible with the widespread market penetration of GPS smartphones and push messages. These business models work best in densely populated areas, as the services are often time and location-specific. They exhibit elements of vertical integration of logistics and at times an aggregation of the supply side. As consumers can now make secure purchases using their smartphones, mobile devices are becoming the most used platform for seeking information on goods and services, resulting in the rise of retail spending.
Private transport, which in recent decades has shaped the lives of people and the infrastructure of the cities, requires change in order to reduce emissions and relieve urban congestion. The entire technology industry has recognized the mobility sector as a lucrative market. In metropolitan areas, the private car is no longer the sole means of transport and will be displaced increasingly in the future. Short distance trips are going to be dominated by public transport, car sharing and taxi-type services. It will be more convenient to order a car via mobile app than to even look for a parking space. The car of the future will be like an Internet browser, the main interface for the digital life. With the launch of RideLink Rocket Internet has entered this market.
In the start-up scene, the B2B-business is becoming more and more attractive due to high margins, rapid revenue growth, early profitability and real value added to customers, ever since the hype surrounding the B2C start-ups, especially in the realm of eCommerce has decreased.
Artificial intelligence has become part of everyday life since Siri and Cortana. The realm of eCommerce and social networks will also be reinforced by artificial intelligence, in the form of chatbots, which collect valuable information about customers, thus enabling customizing and the transition to social commerce.
According to the “D21-Digital-Index 2016” by the “Initiative D21”, a total of about 79% (previous year 78%) of all Germans (age groups above 14 years old) used the Internet in 2016. The share of smartphone owners increased from 60% in 2015 to 66% in 2016. The use of tablets increased to 37% (previous year 35%). In 2016, the share of owners of so-called wearables (devices that can be worn by a person) is 5%. While 72% of the population regularly search the Internet for content and information via search engines representing the most frequently used application in the Internet, more specific applications are far less frequently used, i.e. by only about half of the Germans. 54% of the population watches videos online via platforms such as YouTube. Online shopping is done by 50% on a regular basis and online training opportunities are frequently used by only 17% of the population. In the realm of eCommerce interesting changes are visible compared to last year. The share of those who shop goods online amounts to 50% of the total population, same as in the previous year (63% of the all Internet users). Men are more likely to buy online regularly, accounting for 57% and representing 14 percentage points more than the women’s share. The use of online services rose significantly in 2016 compared to last year. While nearly a fifth of the population (19%) used this option once or several times a week in 2015, the rate was 36% in 2016. Similar to the online shopping behavior, more men than women are active in this area.
According to the “Measuring the Information Society Report 2016” by the International Telecommunication Union (ITU), the global Internet user rate was 47.1% in 2016. The rate in
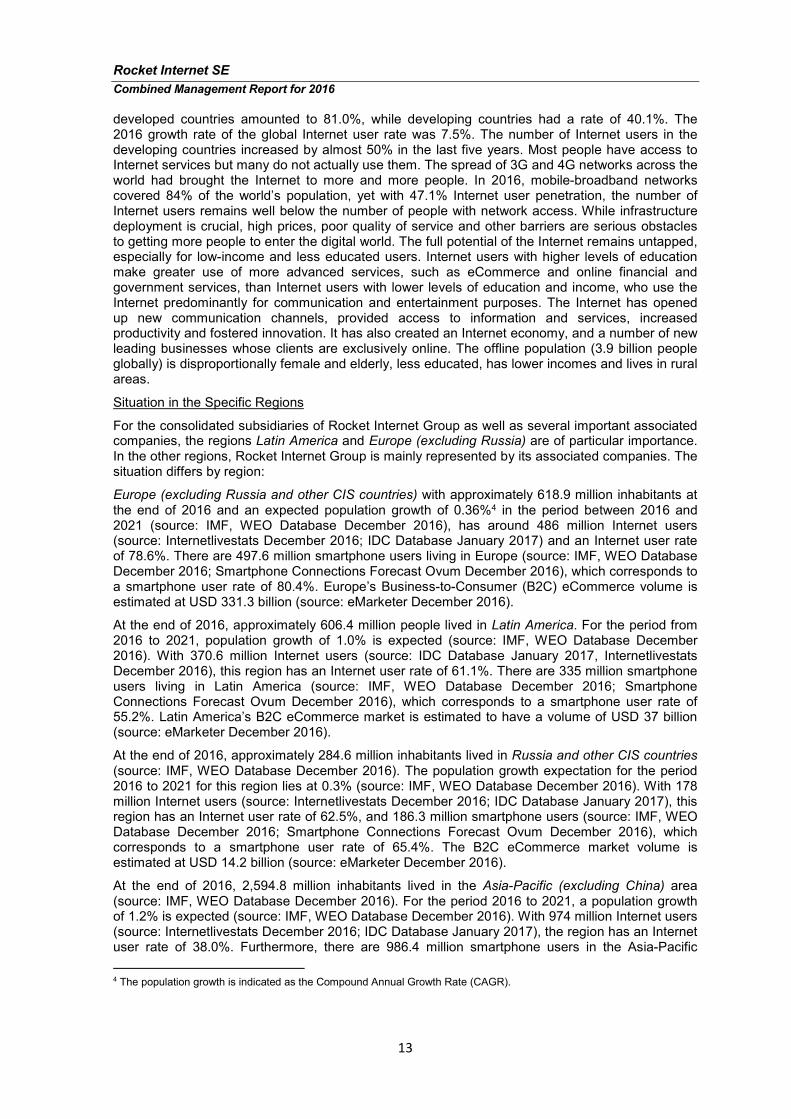
Rocket Internet SE
Combined Management Report for 2016
13
developed countries amounted to 81.0%, while developing countries had a rate of 40.1%. The 2016 growth rate of the global Internet user rate was 7.5%. The number of Internet users in the developing countries increased by almost 50% in the last five years. Most people have access to Internet services but many do not actually use them. The spread of 3G and 4G networks across the world had brought the Internet to more and more people. In 2016, mobile-broadband networks covered 84% of the world’s population, yet with 47.1% Internet user penetration, the number of Internet users remains well below the number of people with network access. While infrastructure deployment is crucial, high prices, poor quality of service and other barriers are serious obstacles to getting more people to enter the digital world. The full potential of the Internet remains untapped, especially for low-income and less educated users. Internet users with higher levels of education make greater use of more advanced services, such as eCommerce and online financial and government services, than Internet users with lower levels of education and income, who use the Internet predominantly for communication and entertainment purposes. The Internet has opened up new communication channels, provided access to information and services, increased productivity and fostered innovation. It has also created an Internet economy, and a number of new leading businesses whose clients are exclusively online. The offline population (3.9 billion people globally) is disproportionally female and elderly, less educated, has lower incomes and lives in rural areas.
Situation in the Specific Regions
For the consolidated subsidiaries of Rocket Internet Group as well as several important associated companies, the regions Latin America and Europe (excluding Russia) are of particular importance. In the other regions, Rocket Internet Group is mainly represented by its associated companies. The situation differs by region:
Europe (excluding Russia and other CIS countries) with approximately 618.9 million inhabitants at the end of 2016 and an expected population growth of 0.36%4 in the period between 2016 and 2021 (source: IMF, WEO Database December 2016), has around 486 million Internet users (source: Internetlivestats December 2016; IDC Database January 2017) and an Internet user rate of 78.6%. There are 497.6 million smartphone users living in Europe (source: IMF, WEO Database December 2016; Smartphone Connections Forecast Ovum December 2016), which corresponds to a smartphone user rate of 80.4%. Europe’s Business-to-Consumer (B2C) eCommerce volume is estimated at USD 331.3 billion (source: eMarketer December 2016).
At the end of 2016, approximately 606.4 million people lived in Latin America. For the period from 2016 to 2021, population growth of 1.0% is expected (source: IMF, WEO Database December 2016). With 370.6 million Internet users (source: IDC Database January 2017, Internetlivestats December 2016), this region has an Internet user rate of 61.1%. There are 335 million smartphone users living in Latin America (source: IMF, WEO Database December 2016; Smartphone Connections Forecast Ovum December 2016), which corresponds to a smartphone user rate of 55.2%. Latin America’s B2C eCommerce market is estimated to have a volume of USD 37 billion (source: eMarketer December 2016).
At the end of 2016, approximately 284.6 million inhabitants lived in Russia and other CIS countries (source: IMF, WEO Database December 2016). The population growth expectation for the period 2016 to 2021 for this region lies at 0.3% (source: IMF, WEO Database December 2016). With 178 million Internet users (source: Internetlivestats December 2016; IDC Database January 2017), this region has an Internet user rate of 62.5%, and 186.3 million smartphone users (source: IMF, WEO Database December 2016; Smartphone Connections Forecast Ovum December 2016), which corresponds to a smartphone user rate of 65.4%. The B2C eCommerce market volume is estimated at USD 14.2 billion (source: eMarketer December 2016).
At the end of 2016, 2,594.8 million inhabitants lived in the Asia-Pacific (excluding China) area (source: IMF, WEO Database December 2016). For the period 2016 to 2021, a population growth of 1.2% is expected (source: IMF, WEO Database December 2016). With 974 million Internet users (source: Internetlivestats December 2016; IDC Database January 2017), the region has an Internet user rate of 38.0%. Furthermore, there are 986.4 million smartphone users in the Asia-Pacific
4 The population growth is indicated as the Compound Annual Growth Rate (CAGR).
Rocket Internet SE
Combined Management Report for 2016
14
region (source: IMF, WEO Database December 2016; Smartphone Connections Forecast Ovum December 2016), which amounts to a smartphone user rate of 37.5%. Asia-Pacific’s B2C eCommerce market volume is estimated at USD 191.0 billion (source: eMarketer December 2016).
Africa and the Middle East with approximately 1,406.5 million inhabitants at the end of 2016 and an expected population growth in the period 2016 to 2021 of 2.4% (source: IMF, WEO Database December 2016), are home to about 393.2 million Internet users (source: Internetlivestats December 2016; IDC Database January 2017), which corresponds to an Internet user rate of 28.0%. The region hosts 408.8 million smartphone users (source: IMF, WEO Database December 2016; Smartphone Connections Forecast Ovum December 2016), which correspond to a smartphone user rate of 29.1%. The B2C eCommerce market volume in Africa and the Middle East is estimated at USD 18.7 billion (source: eMarketer December 2016).
3.3 Course of Business
In the past financial year, we continued our path on the capital market with the stock listing of Rocket Internet SE in the Prime Standard of the Frankfurt Stock Exchange that we started by the admission to the Entry Standard in 2014. The necessary prerequisites were met as planned by the Company as a whole in the announced timeframe.
As a further important step, the Company has moved its headquarters to Charlottenstraße 4, and with much more flexible and customized spaces, has been able to further promote its own corporate culture while bringing the technology fully up to date.
At the beginning of the 2016 financial year, the Rocket Internet Capital Partners Fund established a further pillar of market access and financing within the Company network, and the expertise in the realm of investment was significantly expanded and deepened.
The execution of Rocket Internet’s strategy to expand existing major network companies such as HelloFresh, Home24, Global Fashion Group, Jumia and foodpanda, to build new business models (e.g. Campsy, Everdine, Instafreight) and to invest in existing and new businesses such as Ace & Tate, Marley Spoon, Thermondo, Pets Deli, Goldbely, NatureBox and Sonovate was continued in the financial year 2016.
Most of Rocket Internet SE’s network companies in our four key focus sectors showed continued revenue growth and demonstrated further progress on the path to profitability in the financial year 2016 in comparison to the financial year 2015.
In April 2016, Rocket Internet divested half of its stake in Lazada (Lazada operates an online shopping and selling destination for assorted merchandise in Southeast Asia) to Alibaba Group Services Limited, Hong Kong (Alibaba), marking its largest divestment since the IPO and thereby confirming that Rocket Internet, in addition to building companies, is in the position to turn value into cash at the right time and at the right price. Lazada’s shareholders, including Rocket Internet, have also entered into a put-call agreement with Alibaba, giving the buyer the right to purchase, and the shareholders the right to sell collectively, their remaining stakes at fair market value within the 12 to 18 month period following the closing of the transaction.
In the reportable segment General Merchandise Lazada and Linio (Online retailer in Latin America), ceased to be reportable when Rocket Internet SE sold half of its share in Lazada to Alibaba and lost significant influence over Linio as a result of not participating in the financial round in August 2016. Additionally, the merger of the African General Merchandise business activities with the other marketplaces and classifieds businesses in the region resulted in the creation of the new reportable segment Jumia. For comparability the financial information of the former operating segment Jumia is reclassified into the new reportable segment Jumia.
In 2016, a Fund named Rocket Internet Capital Partners (“RICP” or “Fund”) was established. At the end of 2016 the Fund had total commitments of USD 869.2 million. The Fund belongs to Europe’s largest early stage and growth capital funds focused on the Internet sector.
On July 22, 2016, the Global Fashion Group announced a funding round of EUR 330.0 million, which has been subscribed by existing investors including Rocket Internet and the Rocket Internet Capital Partners (RICP) Fund. Rocket Internet has invested EUR 18.9 million in cash in July 2016
Rocket Internet SE
Combined Management Report for 2016
15
and received shares from conversion of existing convertible preference shares. The transaction implied a valuation of Global Fashion Group at EUR 1.0 billion following the investment (post-money) leading to significant impairment losses at Global Fashion Group, which were already reflected with its pro rata share in Rocket Internet SE’s half year results.
The financial year 2016 was also characterized by selective sales of subsidiaries. During the financial year 2016, Rocket Internet divested La Nevera Roja and Pizzabo.it in line with its strategy of divesting non-core operations that are not market leading, and further reducing the complexity of Rocket Internet. In addition, some of the non-core (e.g. Bonnyprints, FabFurnish) or no longer viable business models (Vendomo, Tripda, Shopkin, Sparklist) were discontinued, sold or limited to operate regionally.
In February 2016, the Management Board of Rocket Internet SE concluded a partial repurchase of the convertible bonds. In line with this program, up to EUR 150.0 million shall be used in order to repurchase not subordinated, unsecured convertible bonds due in 2022 and issued by the Company in the year 2015. In September 2016, the buyback program has been expanded by an additional up to EUR 85.0 million to be spent until September 30, 2017. During the year 2016, the Group repurchased convertible bonds with an aggregate principal amount of EUR 196.2 million.
In September 2016, Rocket Internet SE’s shares were approved for admission to the regulated market segment (Prime Standard) of the Frankfurt Stock Exchange. Effective as of October 14, 2016, the shares of Rocket Internet SE were included in the SDAX index.
In December 2016, the Group received newly issued shares in Delivery Hero in exchange for all its shares in foodpanda. As a result of this transaction, foodpanda ceased to represent an associated company and the Group recognized a disposal gain amounting to EUR 79.1 million.
EBITDA of the Group deteriorated mainly driven by non-cash items significantly from negative EUR 200.8 million in 2015 to negative EUR 565.3 million in 2016. This deterioration was mainly due to an impairment-driven decrease in the share of profit/loss of associates (especially impairment losses of stakes in Global Fashion Group and Linio) and joint ventures, lower result from deconsolidation of subsidiaries and a decrease in revenue, which were only partially offset by a decrease in employee benefits expenses, a decrease in expenses for purchased merchandise and purchased services and a decrease in other operating expenses.
The average EBITDA margin of the Group of New Businesses & Investments remained negative but improved significantly regarding subsidiaries, which were fully consolidated by the Rocket Internet Group in 2015 and 2016.
Cash and cash equivalents of the Group including balances in assets classified as held for sale amount to EUR 1,401.7 million (previous year EUR 1,768.6 million) as of December 31, 2016. The decrease of the cash and cash equivalents of the Group is caused by the negative cash flows from financing activities which amounted to EUR -162.2 million, negative cash flows from investing activities which amounted to EUR -123.6 million and negative cash flow from operating activities which amounted to EUR -85.7 million.
Overall, the loss for the period of the Group amounted to EUR 741.5 million (previous year loss of EUR 197.8 million). The total comprehensive loss for the period, net of tax for the financial year 2016 amounted to EUR 623.2 million (previous year total comprehensive loss of EUR 161.4 million).
The forecast sharp decrease in consolidated revenue has materialized in 2016 and is due to deconsolidations, shut-downs and sales of subsidiaries. As projected, overall, the consolidated revenues of New Businesses & Investments decreased from EUR 84.6 million in financial year 2015 by 75% to EUR 21.2 million in 2016.
The previous year report’s forecast of a significant increase in consolidated revenue of New Businesses & Investments for those companies that continued to be fully consolidated after December 31, 2015, has been realized. New Businesses & Investments which continued to be consolidated at the end of 2016 have shown significant growth in revenues as predicted. Especially, Carspring in the UK showed significant growth and contributed a significant share of revenues. However, there have been further deconsolidations and closings that cause a reduction in revenues from New Businesses & Investments overall, contributing to the aforementioned sharp
Rocket Internet SE
Combined Management Report for 2016
16
decrease in consolidated revenue. As forecast the area of New Businesses & Investments realized a negative EBIT and thus contributed to the expected negative EBIT on Rocket Internet Group level.
The result from deconsolidation of subsidiaries in 2016 in the amount of EUR 48.3 million (previous year EUR 167.0 million) has decreased significantly as had been forecast in the 2015 Combined Management Report. In line with the previous year’s report forecast, a substantial negative result occurred from the share of profit/loss from associates and joint ventures. In 2016, the Group’s share of the net income of associates or joint ventures including adjustments made by the Group under the equity method as well as gains from deemed disposals amounts to negative EUR 148.8 million. In addition, the Group has recognized impairment losses of EUR 568.0 million, which are partly offset by gains from disposals of associates of EUR 177.2 million.
In line with the previous year report’s forecast, mostly international expansion of our companies has continued accompanied by the development and acquisition of various new business models. In 2016 numerous GFC investments have been acquired. At the same time, new network companies have been added to the consolidation Group representing new business models. However, no longer viable business models have been discontinued, sold or limited to operate regionally. As a result, the number of fully consolidated companies has decreased from 182 to 125, as had been predicted in the 2015 Combined Management Report.
In line with our Group strategy, Rocket Internet did not execute dilutive capital increases at the Group level and there were no significant M&A transactions in 2016.
In the 2015 Combined Management Report, the stable or slightly decreasing revenues from rendering services was forecast for the parent Company due to the increased individual independence of the network companies. As reflected in the parent Company’s Annual Financial Statements, revenues for services rendered by Rocket Internet decreased more extensive than forecast from EUR 34.2 million by 18% to EUR 28.1 million. At the Group level the revenues for other services decreased from EUR 43.7 million by 33% to EUR 29.2 million.
In the Annual Financial Statements of the parent Company in 2016, a net profit of EUR 41.4 million (previous year net loss of EUR 73.5 million) was recognized, which resulted primarily from the gains from disposals of participations reported in the line item other operating income.
As disclosed in the 2015 Combined Management Report, the earnings position of the Company and the Group can vary substantially from year to year, due to dilution or in some cases as a result of sale of participations. As in the previous years, we assessed the degree of predictability of the occurrence of the respective transactions to be low and therefore we did not present an EBITDA forecast.
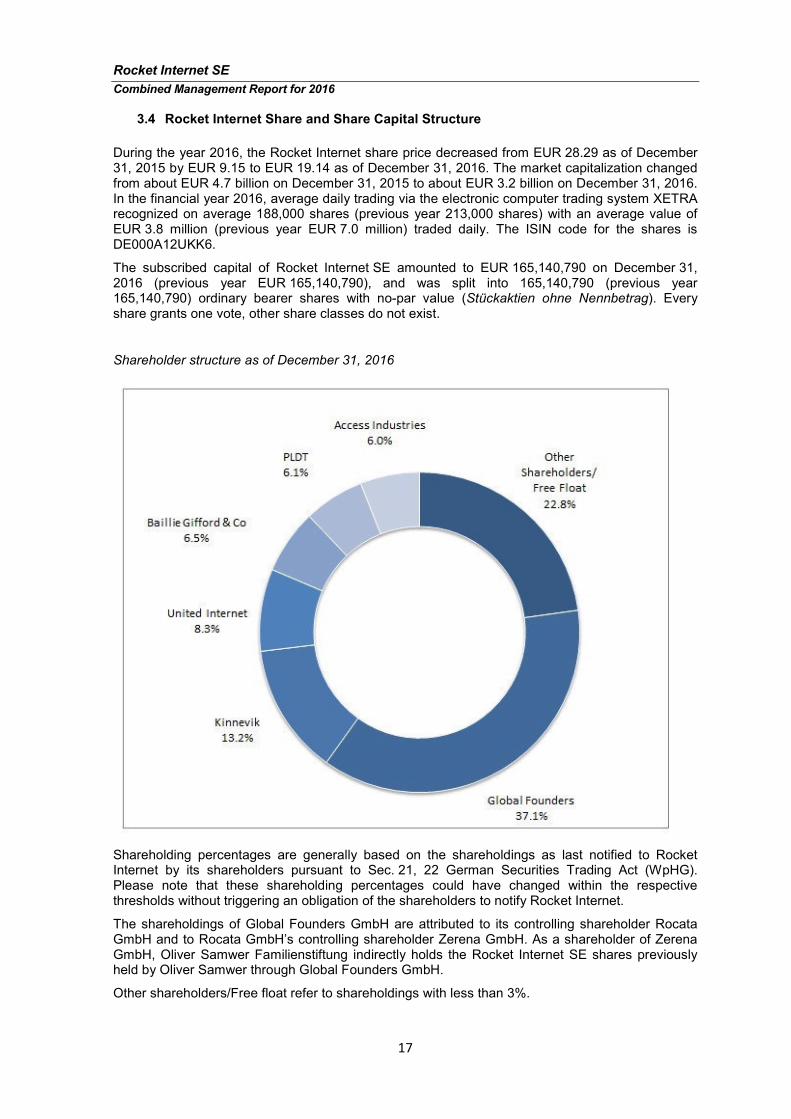
Rocket Internet SE
Combined Management Report for 2016
17
3.4 Rocket Internet Share and Share Capital Structure
During the year 2016, the Rocket Internet share price decreased from EUR 28.29 as of December 31, 2015 by EUR 9.15 to EUR 19.14 as of December 31, 2016. The market capitalization changed from about EUR 4.7 billion on December 31, 2015 to about EUR 3.2 billion on December 31, 2016. In the financial year 2016, average daily trading via the electronic computer trading system XETRA recognized on average 188,000 shares (previous year 213,000 shares) with an average value of EUR 3.8 million (previous year EUR 7.0 million) traded daily. The ISIN code for the shares is DE000A12UKK6.
The subscribed capital of Rocket Internet SE amounted to EUR 165,140,790 on December 31, 2016 (previous year EUR 165,140,790), and was split into 165,140,790 (previous year 165,140,790) ordinary bearer shares with no-par value (Stückaktien ohne Nennbetrag). Every share grants one vote, other share classes do not exist.
Shareholder structure as of December 31, 2016
Shareholding percentages are generally based on the shareholdings as last notified to Rocket Internet by its shareholders pursuant to Sec. 21, 22 German Securities Trading Act (WpHG). Please note that these shareholding percentages could have changed within the respective thresholds without triggering an obligation of the shareholders to notify Rocket Internet.
The shareholdings of Global Founders GmbH are attributed to its controlling shareholder Rocata GmbH and to Rocata GmbH’s controlling shareholder Zerena GmbH. As a shareholder of Zerena GmbH, Oliver Samwer Familienstiftung indirectly holds the Rocket Internet SE shares previously held by Oliver Samwer through Global Founders GmbH.
Other shareholders/Free float refer to shareholdings with less than 3%.
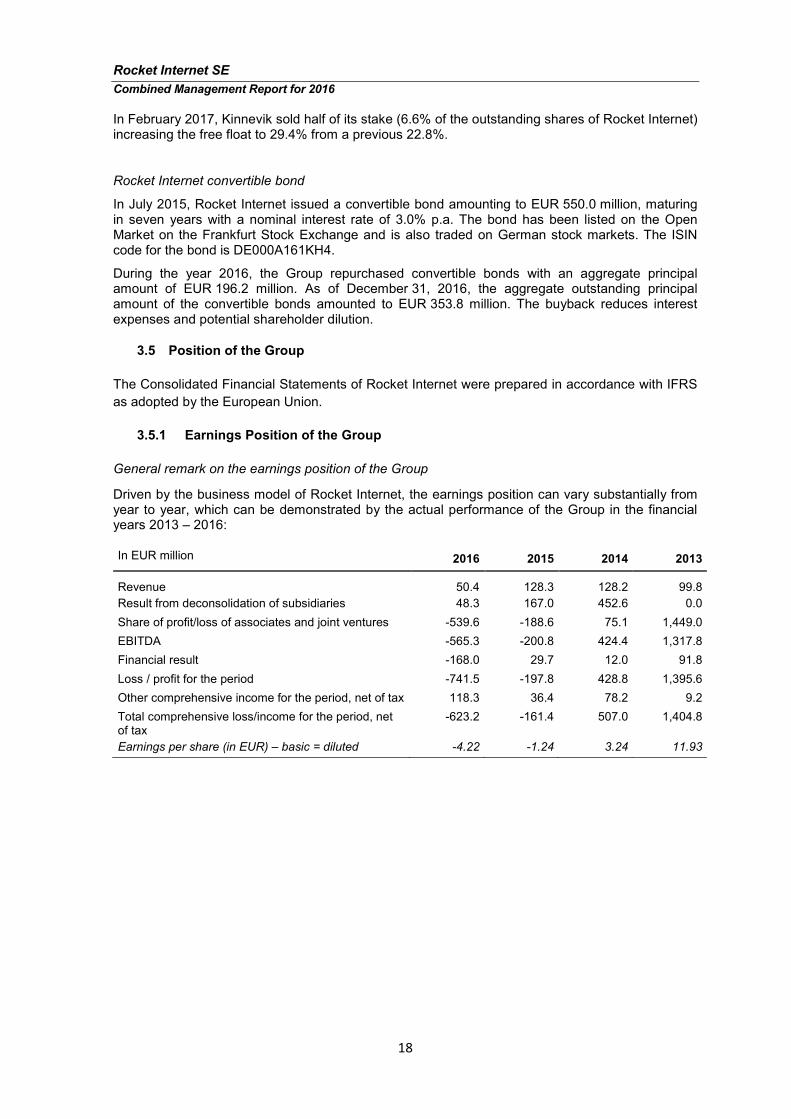
Rocket Internet SE
Combined Management Report for 2016
18
In February 2017, Kinnevik sold half of its stake (6.6% of the outstanding shares of Rocket Internet) increasing the free float to 29.4% from a previous 22.8%.
Rocket Internet convertible bond
In July 2015, Rocket Internet issued a convertible bond amounting to EUR 550.0 million, maturing in seven years with a nominal interest rate of 3.0% p.a. The bond has been listed on the Open Market on the Frankfurt Stock Exchange and is also traded on German stock markets. The ISIN code for the bond is DE000A161KH4.
During the year 2016, the Group repurchased convertible bonds with an aggregate principal amount of EUR 196.2 million. As of December 31, 2016, the aggregate outstanding principal amount of the convertible bonds amounted to EUR 353.8 million. The buyback reduces interest expenses and potential shareholder dilution.
3.5 Position of the Group
The Consolidated Financial Statements of Rocket Internet were prepared in accordance with IFRS
as adopted by the European Union.
3.5.1 Earnings Position of the Group
General remark on the earnings position of the Group
Driven by the business model of Rocket Internet, the earnings position can vary substantially from year to year, which can be demonstrated by the actual performance of the Group in the financial years 2013 – 2016:
In EUR million 2016 2015 2014 2013
Revenue 50.4 128.3 128.2 99.8
Result from deconsolidation of subsidiaries 48.3 167.0 452.6 0.0
Share of profit/loss of associates and joint ventures -539.6 -188.6 75.1 1,449.0
EBITDA -565.3 -200.8 424.4 1,317.8
Financial result -168.0 29.7 12.0 91.8
Loss / profit for the period -741.5 -197.8 428.8 1,395.6
Other comprehensive income for the period, net of tax 118.3 36.4 78.2 9.2
Total comprehensive loss/income for the period, net of tax
-623.2 -161.4 507.0 1,404.8
Earnings per share (in EUR) – basic = diluted -4.22 -1.24 3.24 11.93
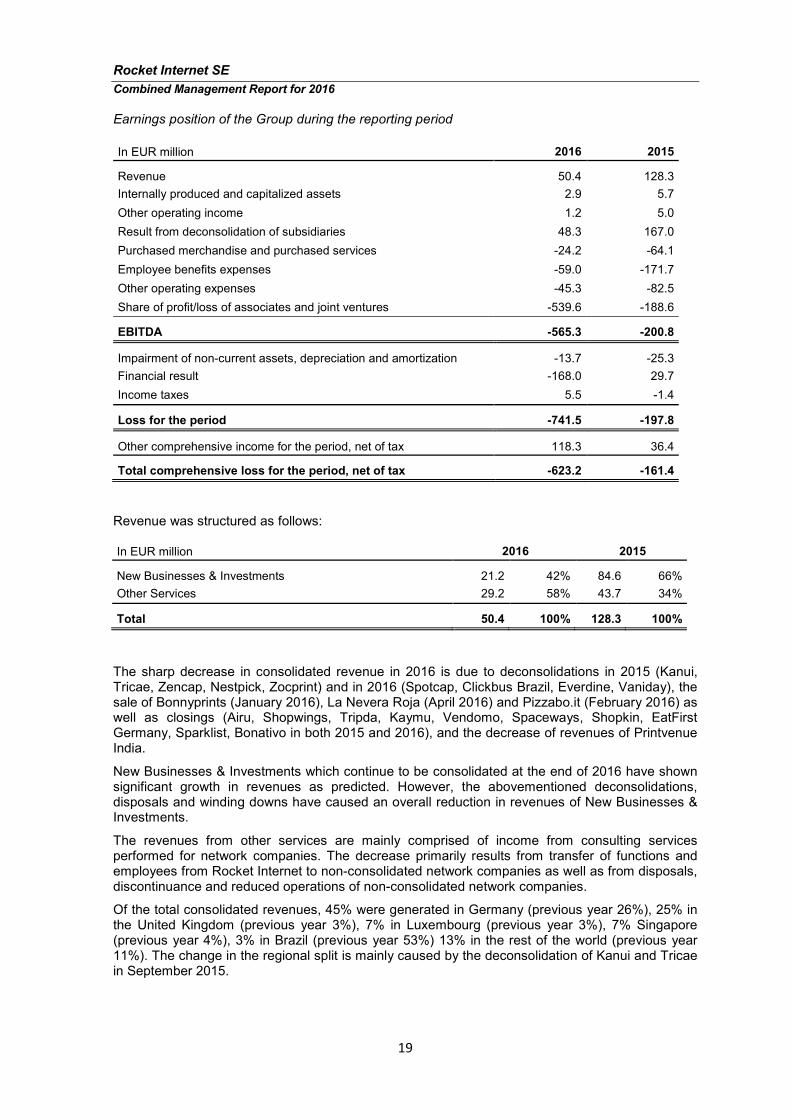
Rocket Internet SE
Combined Management Report for 2016
19
Earnings position of the Group during the reporting period
In EUR million 2016 2015
Revenue 50.4 128.3
Internally produced and capitalized assets 2.9 5.7
Other operating income 1.2 5.0
Result from deconsolidation of subsidiaries 48.3 167.0
Purchased merchandise and purchased services -24.2 -64.1
Employee benefits expenses -59.0 -171.7
Other operating expenses -45.3 -82.5
Share of profit/loss of associates and joint ventures -539.6 -188.6
EBITDA -565.3 -200.8
Impairment of non-current assets, depreciation and amortization -13.7 -25.3
Financial result -168.0 29.7
Income taxes 5.5 -1.4
Loss for the period -741.5 -197.8
Other comprehensive income for the period, net of tax 118.3 36.4
Total comprehensive loss for the period, net of tax -623.2 -161.4
Revenue was structured as follows:
In EUR million 2016 2015
New Businesses & Investments 21.2 42% 84.6 66%
Other Services 29.2 58% 43.7 34%
Total 50.4 100% 128.3 100%
The sharp decrease in consolidated revenue in 2016 is due to deconsolidations in 2015 (Kanui, Tricae, Zencap, Nestpick, Zocprint) and in 2016 (Spotcap, Clickbus Brazil, Everdine, Vaniday), the sale of Bonnyprints (January 2016), La Nevera Roja (April 2016) and Pizzabo.it (February 2016) as well as closings (Airu, Shopwings, Tripda, Kaymu, Vendomo, Spaceways, Shopkin, EatFirst Germany, Sparklist, Bonativo in both 2015 and 2016), and the decrease of revenues of Printvenue India.
New Businesses & Investments which continue to be consolidated at the end of 2016 have shown significant growth in revenues as predicted. However, the abovementioned deconsolidations, disposals and winding downs have caused an overall reduction in revenues of New Businesses & Investments.
The revenues from other services are mainly comprised of income from consulting services performed for network companies. The decrease primarily results from transfer of functions and employees from Rocket Internet to non-consolidated network companies as well as from disposals, discontinuance and reduced operations of non-consolidated network companies.
Of the total consolidated revenues, 45% were generated in Germany (previous year 26%), 25% in the United Kingdom (previous year 3%), 7% in Luxembourg (previous year 3%), 7% Singapore (previous year 4%), 3% in Brazil (previous year 53%) 13% in the rest of the world (previous year 11%). The change in the regional split is mainly caused by the deconsolidation of Kanui and Tricae in September 2015.
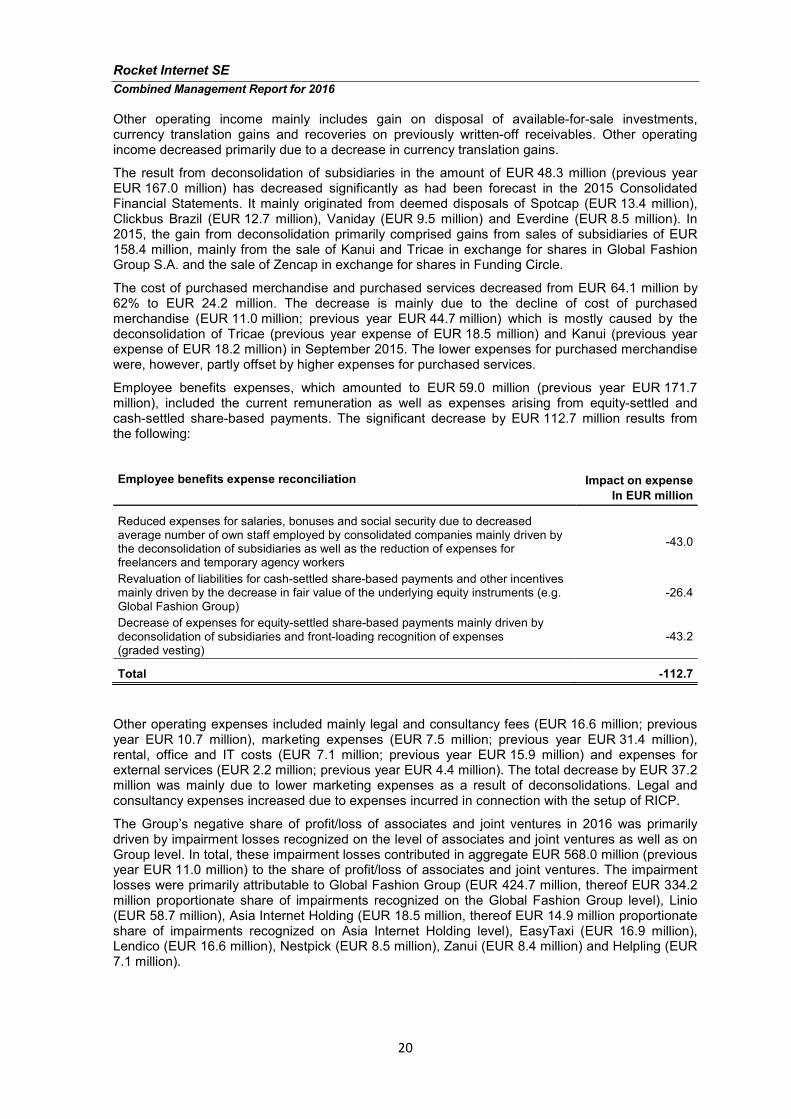
Rocket Internet SE
Combined Management Report for 2016
20
Other operating income mainly includes gain on disposal of available-for-sale investments, currency translation gains and recoveries on previously written-off receivables. Other operating income decreased primarily due to a decrease in currency translation gains.
The result from deconsolidation of subsidiaries in the amount of EUR 48.3 million (previous year EUR 167.0 million) has decreased significantly as had been forecast in the 2015 Consolidated Financial Statements. It mainly originated from deemed disposals of Spotcap (EUR 13.4 million), Clickbus Brazil (EUR 12.7 million), Vaniday (EUR 9.5 million) and Everdine (EUR 8.5 million). In 2015, the gain from deconsolidation primarily comprised gains from sales of subsidiaries of EUR 158.4 million, mainly from the sale of Kanui and Tricae in exchange for shares in Global Fashion Group S.A. and the sale of Zencap in exchange for shares in Funding Circle.
The cost of purchased merchandise and purchased services decreased from EUR 64.1 million by 62% to EUR 24.2 million. The decrease is mainly due to the decline of cost of purchased merchandise (EUR 11.0 million; previous year EUR 44.7 million) which is mostly caused by the deconsolidation of Tricae (previous year expense of EUR 18.5 million) and Kanui (previous year expense of EUR 18.2 million) in September 2015. The lower expenses for purchased merchandise were, however, partly offset by higher expenses for purchased services.
Employee benefits expenses, which amounted to EUR 59.0 million (previous year EUR 171.7 million), included the current remuneration as well as expenses arising from equity-settled and cash-settled share-based payments. The significant decrease by EUR 112.7 million results from the following:
Employee benefits expense reconciliation Impact on expense
In EUR million
Reduced expenses for salaries, bonuses and social security due to decreased average number of own staff employed by consolidated companies mainly driven by the deconsolidation of subsidiaries as well as the reduction of expenses for freelancers and temporary agency workers
-43.0
Revaluation of liabilities for cash-settled share-based payments and other incentives mainly driven by the decrease in fair value of the underlying equity instruments (e.g. Global Fashion Group)
-26.4
Decrease of expenses for equity-settled share-based payments mainly driven by deconsolidation of subsidiaries and front-loading recognition of expenses (graded vesting)
-43.2
Total -112.7
Other operating expenses included mainly legal and consultancy fees (EUR 16.6 million; previous year EUR 10.7 million), marketing expenses (EUR 7.5 million; previous year EUR 31.4 million), rental, office and IT costs (EUR 7.1 million; previous year EUR 15.9 million) and expenses for external services (EUR 2.2 million; previous year EUR 4.4 million). The total decrease by EUR 37.2 million was mainly due to lower marketing expenses as a result of deconsolidations. Legal and consultancy expenses increased due to expenses incurred in connection with the setup of RICP.
The Group’s negative share of profit/loss of associates and joint ventures in 2016 was primarily driven by impairment losses recognized on the level of associates and joint ventures as well as on Group level. In total, these impairment losses contributed in aggregate EUR 568.0 million (previous year EUR 11.0 million) to the share of profit/loss of associates and joint ventures. The impairment losses were primarily attributable to Global Fashion Group (EUR 424.7 million, thereof EUR 334.2 million proportionate share of impairments recognized on the Global Fashion Group level), Linio (EUR 58.7 million), Asia Internet Holding (EUR 18.5 million, thereof EUR 14.9 million proportionate share of impairments recognized on Asia Internet Holding level), EasyTaxi (EUR 16.9 million), Lendico (EUR 16.6 million), Nestpick (EUR 8.5 million), Zanui (EUR 8.4 million) and Helpling (EUR 7.1 million).
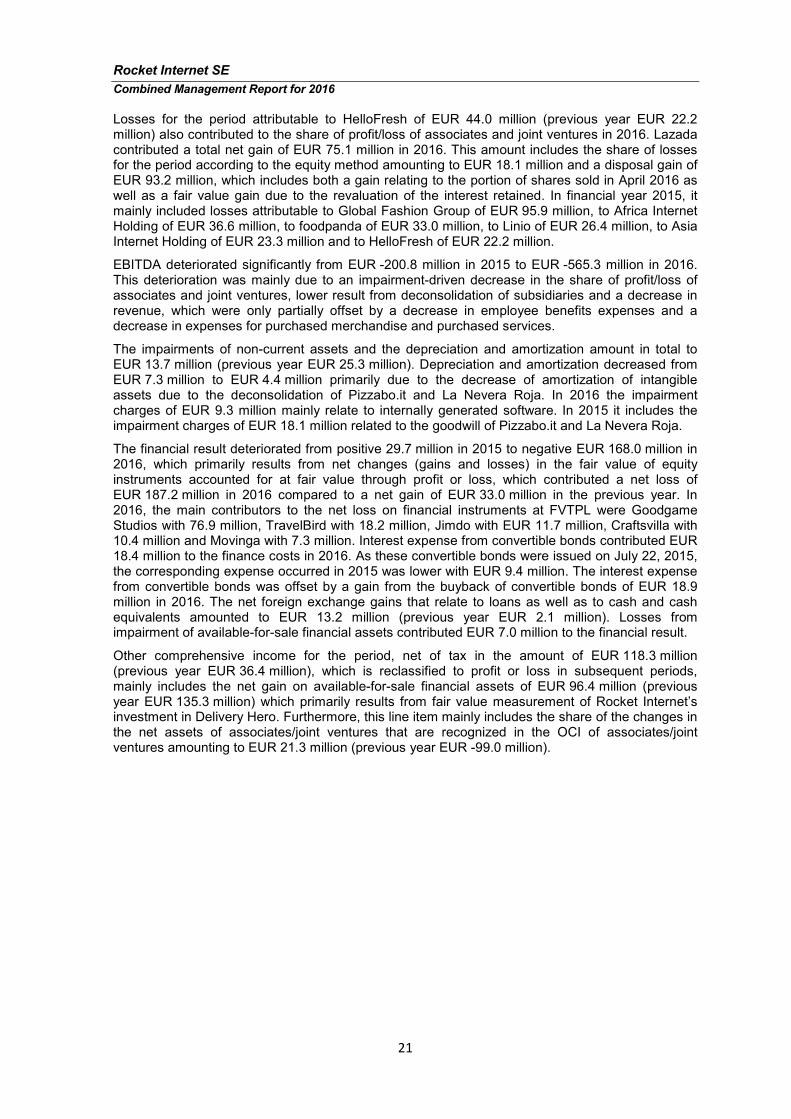
Rocket Internet SE
Combined Management Report for 2016
21
Losses for the period attributable to HelloFresh of EUR 44.0 million (previous year EUR 22.2 million) also contributed to the share of profit/loss of associates and joint ventures in 2016. Lazada contributed a total net gain of EUR 75.1 million in 2016. This amount includes the share of losses for the period according to the equity method amounting to EUR 18.1 million and a disposal gain of EUR 93.2 million, which includes both a gain relating to the portion of shares sold in April 2016 as well as a fair value gain due to the revaluation of the interest retained. In financial year 2015, it mainly included losses attributable to Global Fashion Group of EUR 95.9 million, to Africa Internet Holding of EUR 36.6 million, to foodpanda of EUR 33.0 million, to Linio of EUR 26.4 million, to Asia Internet Holding of EUR 23.3 million and to HelloFresh of EUR 22.2 million.
EBITDA deteriorated significantly from EUR -200.8 million in 2015 to EUR -565.3 million in 2016. This deterioration was mainly due to an impairment-driven decrease in the share of profit/loss of associates and joint ventures, lower result from deconsolidation of subsidiaries and a decrease in revenue, which were only partially offset by a decrease in employee benefits expenses and a decrease in expenses for purchased merchandise and purchased services.
The impairments of non-current assets and the depreciation and amortization amount in total to EUR 13.7 million (previous year EUR 25.3 million). Depreciation and amortization decreased from EUR 7.3 million to EUR 4.4 million primarily due to the decrease of amortization of intangible assets due to the deconsolidation of Pizzabo.it and La Nevera Roja. In 2016 the impairment charges of EUR 9.3 million mainly relate to internally generated software. In 2015 it includes the impairment charges of EUR 18.1 million related to the goodwill of Pizzabo.it and La Nevera Roja.
The financial result deteriorated from positive 29.7 million in 2015 to negative EUR 168.0 million in 2016, which primarily results from net changes (gains and losses) in the fair value of equity instruments accounted for at fair value through profit or loss, which contributed a net loss of EUR 187.2 million in 2016 compared to a net gain of EUR 33.0 million in the previous year. In 2016, the main contributors to the net loss on financial instruments at FVTPL were Goodgame Studios with 76.9 million, TravelBird with 18.2 million, Jimdo with EUR 11.7 million, Craftsvilla with 10.4 million and Movinga with 7.3 million. Interest expense from convertible bonds contributed EUR 18.4 million to the finance costs in 2016. As these convertible bonds were issued on July 22, 2015, the corresponding expense occurred in 2015 was lower with EUR 9.4 million. The interest expense from convertible bonds was offset by a gain from the buyback of convertible bonds of EUR 18.9 million in 2016. The net foreign exchange gains that relate to loans as well as to cash and cash equivalents amounted to EUR 13.2 million (previous year EUR 2.1 million). Losses from impairment of available-for-sale financial assets contributed EUR 7.0 million to the financial result.
Other comprehensive income for the period, net of tax in the amount of EUR 118.3 million (previous year EUR 36.4 million), which is reclassified to profit or loss in subsequent periods, mainly includes the net gain on available-for-sale financial assets of EUR 96.4 million (previous year EUR 135.3 million) which primarily results from fair value measurement of Rocket Internet’s investment in Delivery Hero. Furthermore, this line item mainly includes the share of the changes in the net assets of associates/joint ventures that are recognized in the OCI of associates/joint ventures amounting to EUR 21.3 million (previous year EUR -99.0 million).
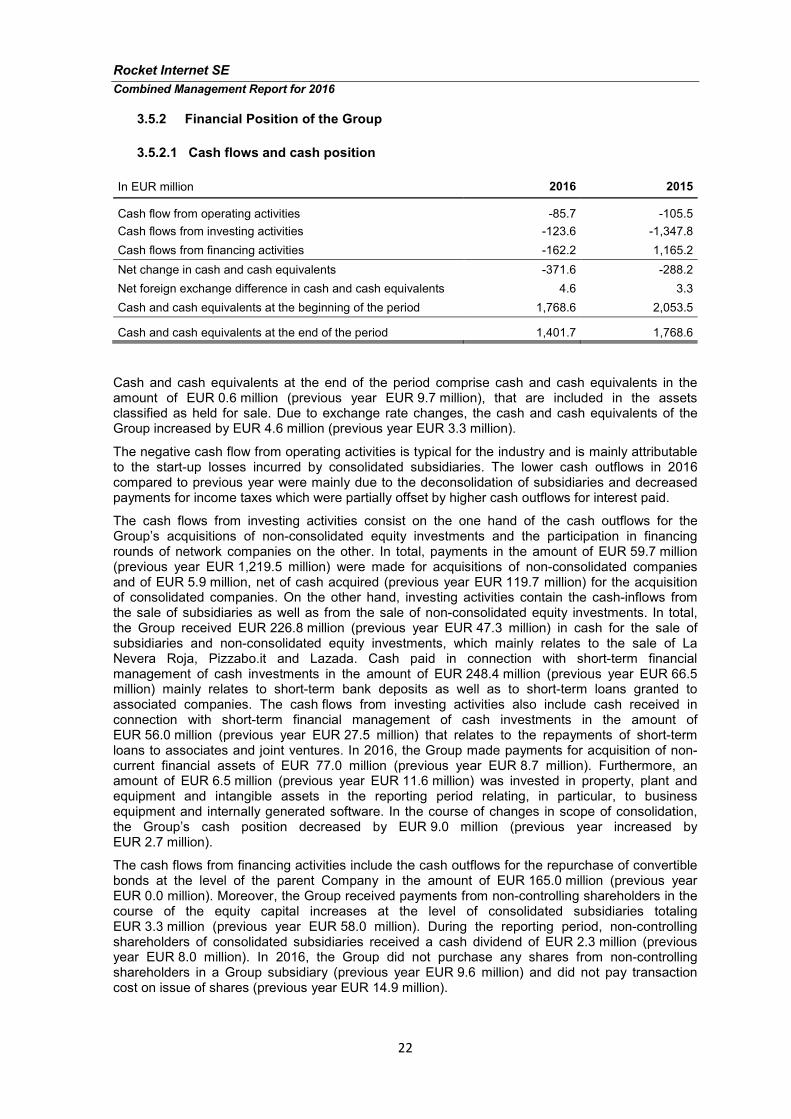
Rocket Internet SE
Combined Management Report for 2016
22
3.5.2 Financial Position of the Group
3.5.2.1 Cash flows and cash position
In EUR million 2016 2015
Cash flow from operating activities -85.7 -105.5
Cash flows from investing activities -123.6 -1,347.8
Cash flows from financing activities -162.2 1,165.2
Net change in cash and cash equivalents -371.6 -288.2
Net foreign exchange difference in cash and cash equivalents 4.6 3.3
Cash and cash equivalents at the beginning of the period 1,768.6 2,053.5
Cash and cash equivalents at the end of the period 1,401.7 1,768.6
Cash and cash equivalents at the end of the period comprise cash and cash equivalents in the amount of EUR 0.6 million (previous year EUR 9.7 million), that are included in the assets classified as held for sale. Due to exchange rate changes, the cash and cash equivalents of the Group increased by EUR 4.6 million (previous year EUR 3.3 million).
The negative cash flow from operating activities is typical for the industry and is mainly attributable to the start-up losses incurred by consolidated subsidiaries. The lower cash outflows in 2016 compared to previous year were mainly due to the deconsolidation of subsidiaries and decreased payments for income taxes which were partially offset by higher cash outflows for interest paid.
The cash flows from investing activities consist on the one hand of the cash outflows for the Group’s acquisitions of non-consolidated equity investments and the participation in financing rounds of network companies on the other. In total, payments in the amount of EUR 59.7 million (previous year EUR 1,219.5 million) were made for acquisitions of non-consolidated companies and of EUR 5.9 million, net of cash acquired (previous year EUR 119.7 million) for the acquisition of consolidated companies. On the other hand, investing activities contain the cash-inflows from the sale of subsidiaries as well as from the sale of non-consolidated equity investments. In total, the Group received EUR 226.8 million (previous year EUR 47.3 million) in cash for the sale of subsidiaries and non-consolidated equity investments, which mainly relates to the sale of La Nevera Roja, Pizzabo.it and Lazada. Cash paid in connection with short-term financial management of cash investments in the amount of EUR 248.4 million (previous year EUR 66.5 million) mainly relates to short-term bank deposits as well as to short-term loans granted to associated companies. The cash flows from investing activities also include cash received in connection with short-term financial management of cash investments in the amount of EUR 56.0 million (previous year EUR 27.5 million) that relates to the repayments of short-term loans to associates and joint ventures. In 2016, the Group made payments for acquisition of non-current financial assets of EUR 77.0 million (previous year EUR 8.7 million). Furthermore, an amount of EUR 6.5 million (previous year EUR 11.6 million) was invested in property, plant and equipment and intangible assets in the reporting period relating, in particular, to business equipment and internally generated software. In the course of changes in scope of consolidation, the Group’s cash position decreased by EUR 9.0 million (previous year increased by EUR 2.7 million).
The cash flows from financing activities include the cash outflows for the repurchase of convertible bonds at the level of the parent Company in the amount of EUR 165.0 million (previous year EUR 0.0 million). Moreover, the Group received payments from non-controlling shareholders in the course of the equity capital increases at the level of consolidated subsidiaries totaling EUR 3.3 million (previous year EUR 58.0 million). During the reporting period, non-controlling shareholders of consolidated subsidiaries received a cash dividend of EUR 2.3 million (previous year EUR 8.0 million). In 2016, the Group did not purchase any shares from non-controlling shareholders in a Group subsidiary (previous year EUR 9.6 million) and did not pay transaction cost on issue of shares (previous year EUR 14.9 million).
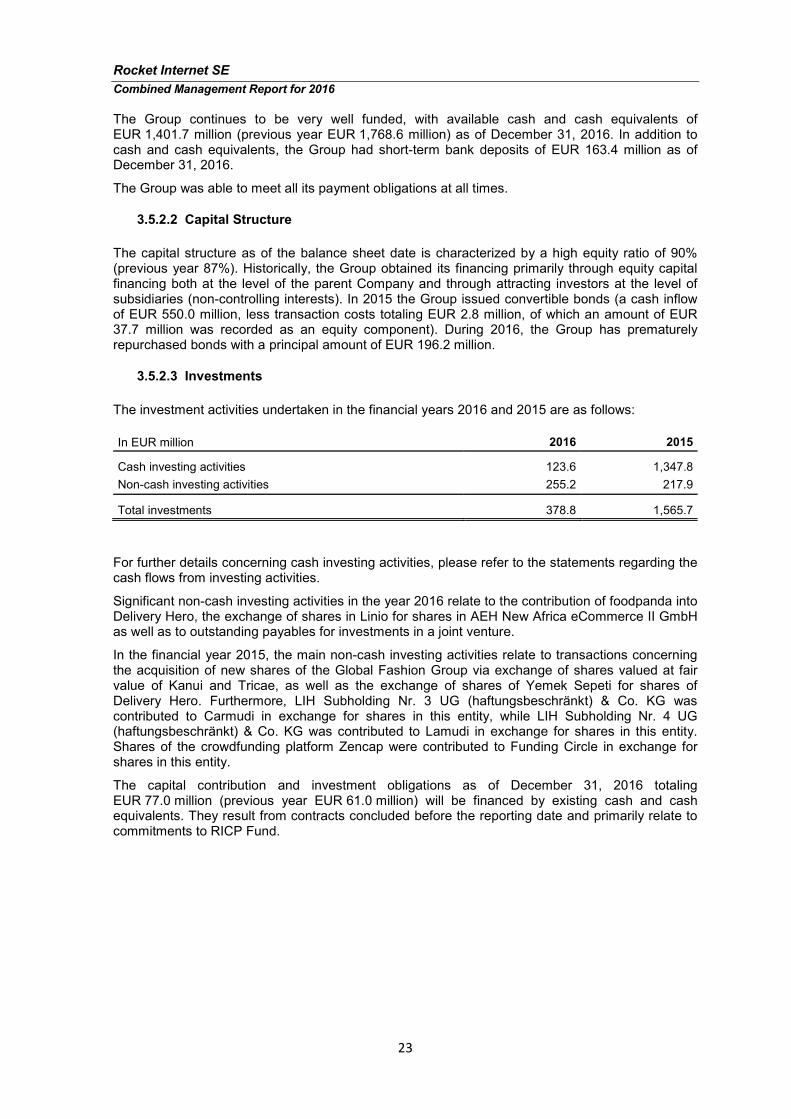
Rocket Internet SE
Combined Management Report for 2016
23
The Group continues to be very well funded, with available cash and cash equivalents of EUR 1,401.7 million (previous year EUR 1,768.6 million) as of December 31, 2016. In addition to cash and cash equivalents, the Group had short-term bank deposits of EUR 163.4 million as of December 31, 2016.
The Group was able to meet all its payment obligations at all times.
3.5.2.2 Capital Structure
The capital structure as of the balance sheet date is characterized by a high equity ratio of 90% (previous year 87%). Historically, the Group obtained its financing primarily through equity capital financing both at the level of the parent Company and through attracting investors at the level of subsidiaries (non-controlling interests). In 2015 the Group issued convertible bonds (a cash inflow of EUR 550.0 million, less transaction costs totaling EUR 2.8 million, of which an amount of EUR 37.7 million was recorded as an equity component). During 2016, the Group has prematurely repurchased bonds with a principal amount of EUR 196.2 million.
3.5.2.3 Investments
The investment activities undertaken in the financial years 2016 and 2015 are as follows:
In EUR million 2016 2015
Cash investing activities 123.6 1,347.8
Non-cash investing activities 255.2 217.9
Total investments 378.8 1,565.7
For further details concerning cash investing activities, please refer to the statements regarding the cash flows from investing activities.
Significant non-cash investing activities in the year 2016 relate to the contribution of foodpanda into Delivery Hero, the exchange of shares in Linio for shares in AEH New Africa eCommerce II GmbH as well as to outstanding payables for investments in a joint venture.
In the financial year 2015, the main non-cash investing activities relate to transactions concerning the acquisition of new shares of the Global Fashion Group via exchange of shares valued at fair value of Kanui and Tricae, as well as the exchange of shares of Yemek Sepeti for shares of Delivery Hero. Furthermore, LIH Subholding Nr. 3 UG (haftungsbeschränkt) & Co. KG was contributed to Carmudi in exchange for shares in this entity, while LIH Subholding Nr. 4 UG (haftungsbeschränkt) & Co. KG was contributed to Lamudi in exchange for shares in this entity. Shares of the crowdfunding platform Zencap were contributed to Funding Circle in exchange for shares in this entity.
The capital contribution and investment obligations as of December 31, 2016 totaling EUR 77.0 million (previous year EUR 61.0 million) will be financed by existing cash and cash equivalents. They result from contracts concluded before the reporting date and primarily relate to commitments to RICP Fund.
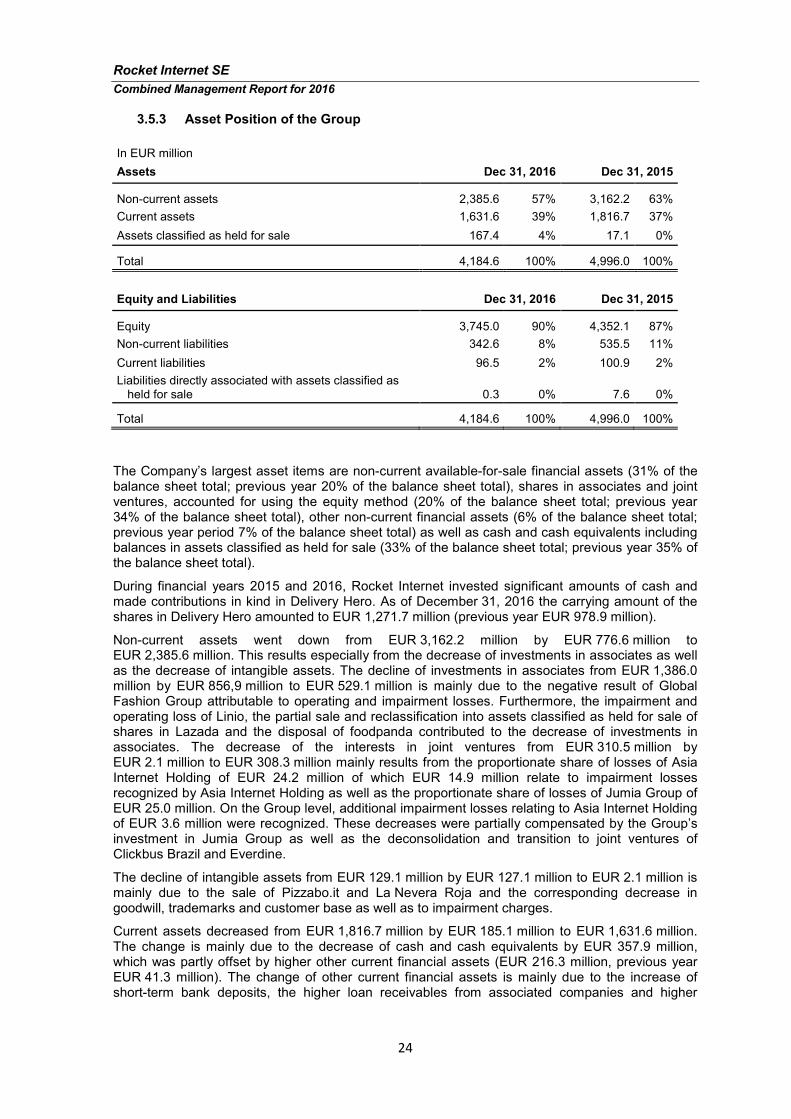
Rocket Internet SE
Combined Management Report for 2016
24
3.5.3 Asset Position of the Group
In EUR million
Assets Dec 31, 2016 Dec 31, 2015
Non-current assets 2,385.6 57% 3,162.2 63%
Current assets 1,631.6 39% 1,816.7 37%
Assets classified as held for sale 167.4 4% 17.1 0%
Total 4,184.6 100% 4,996.0 100%
Equity and Liabilities Dec 31, 2016 Dec 31, 2015
Equity 3,745.0 90% 4,352.1 87%
Non-current liabilities 342.6 8% 535.5 11%
Current liabilities 96.5 2% 100.9 2%
Liabilities directly associated with assets classified as held for sale 0.3
0%
7.6
0%
Total 4,184.6 100% 4,996.0 100%
The Company’s largest asset items are non-current available-for-sale financial assets (31% of the balance sheet total; previous year 20% of the balance sheet total), shares in associates and joint ventures, accounted for using the equity method (20% of the balance sheet total; previous year 34% of the balance sheet total), other non-current financial assets (6% of the balance sheet total; previous year period 7% of the balance sheet total) as well as cash and cash equivalents including balances in assets classified as held for sale (33% of the balance sheet total; previous year 35% of the balance sheet total).
During financial years 2015 and 2016, Rocket Internet invested significant amounts of cash and made contributions in kind in Delivery Hero. As of December 31, 2016 the carrying amount of the shares in Delivery Hero amounted to EUR 1,271.7 million (previous year EUR 978.9 million).
Non-current assets went down from EUR 3,162.2 million by EUR 776.6 million to EUR 2,385.6 million. This results especially from the decrease of investments in associates as well as the decrease of intangible assets. The decline of investments in associates from EUR 1,386.0 million by EUR 856,9 million to EUR 529.1 million is mainly due to the negative result of Global Fashion Group attributable to operating and impairment losses. Furthermore, the impairment and operating loss of Linio, the partial sale and reclassification into assets classified as held for sale of shares in Lazada and the disposal of foodpanda contributed to the decrease of investments in associates. The decrease of the interests in joint ventures from EUR 310.5 million by EUR 2.1 million to EUR 308.3 million mainly results from the proportionate share of losses of Asia Internet Holding of EUR 24.2 million of which EUR 14.9 million relate to impairment losses recognized by Asia Internet Holding as well as the proportionate share of losses of Jumia Group of EUR 25.0 million. On the Group level, additional impairment losses relating to Asia Internet Holding of EUR 3.6 million were recognized. These decreases were partially compensated by the Group’s investment in Jumia Group as well as the deconsolidation and transition to joint ventures of Clickbus Brazil and Everdine.
The decline of intangible assets from EUR 129.1 million by EUR 127.1 million to EUR 2.1 million is mainly due to the sale of Pizzabo.it and La Nevera Roja and the corresponding decrease in goodwill, trademarks and customer base as well as to impairment charges.
Current assets decreased from EUR 1,816.7 million by EUR 185.1 million to EUR 1,631.6 million. The change is mainly due to the decrease of cash and cash equivalents by EUR 357.9 million, which was partly offset by higher other current financial assets (EUR 216.3 million, previous year EUR 41.3 million). The change of other current financial assets is mainly due to the increase of short-term bank deposits, the higher loan receivables from associated companies and higher
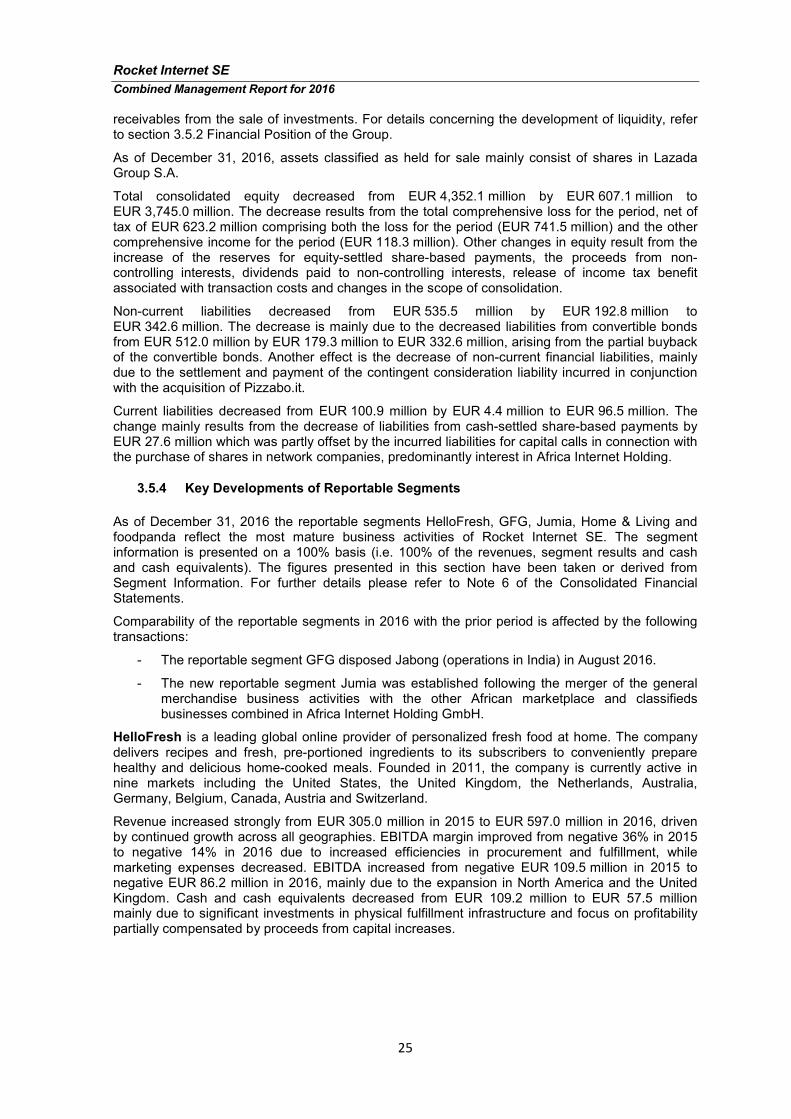
Rocket Internet SE
Combined Management Report for 2016
25
receivables from the sale of investments. For details concerning the development of liquidity, refer to section 3.5.2 Financial Position of the Group.
As of December 31, 2016, assets classified as held for sale mainly consist of shares in Lazada Group S.A.
Total consolidated equity decreased from EUR 4,352.1 million by EUR 607.1 million to EUR 3,745.0 million. The decrease results from the total comprehensive loss for the period, net of tax of EUR 623.2 million comprising both the loss for the period (EUR 741.5 million) and the other comprehensive income for the period (EUR 118.3 million). Other changes in equity result from the increase of the reserves for equity-settled share-based payments, the proceeds from non-controlling interests, dividends paid to non-controlling interests, release of income tax benefit associated with transaction costs and changes in the scope of consolidation.
Non-current liabilities decreased from EUR 535.5 million by EUR 192.8 million to EUR 342.6 million. The decrease is mainly due to the decreased liabilities from convertible bonds from EUR 512.0 million by EUR 179.3 million to EUR 332.6 million, arising from the partial buyback of the convertible bonds. Another effect is the decrease of non-current financial liabilities, mainly due to the settlement and payment of the contingent consideration liability incurred in conjunction with the acquisition of Pizzabo.it.
Current liabilities decreased from EUR 100.9 million by EUR 4.4 million to EUR 96.5 million. The change mainly results from the decrease of liabilities from cash-settled share-based payments by EUR 27.6 million which was partly offset by the incurred liabilities for capital calls in connection with the purchase of shares in network companies, predominantly interest in Africa Internet Holding.
3.5.4 Key Developments of Reportable Segments
As of December 31, 2016 the reportable segments HelloFresh, GFG, Jumia, Home & Living and foodpanda reflect the most mature business activities of Rocket Internet SE. The segment information is presented on a 100% basis (i.e. 100% of the revenues, segment results and cash and cash equivalents). The figures presented in this section have been taken or derived from Segment Information. For further details please refer to Note 6 of the Consolidated Financial Statements.
Comparability of the reportable segments in 2016 with the prior period is affected by the following transactions:
- The reportable segment GFG disposed Jabong (operations in India) in August 2016.
- The new reportable segment Jumia was established following the merger of the general merchandise business activities with the other African marketplace and classifieds businesses combined in Africa Internet Holding GmbH.
HelloFresh is a leading global online provider of personalized fresh food at home. The company delivers recipes and fresh, pre-portioned ingredients to its subscribers to conveniently prepare healthy and delicious home-cooked meals. Founded in 2011, the company is currently active in nine markets including the United States, the United Kingdom, the Netherlands, Australia, Germany, Belgium, Canada, Austria and Switzerland.
Revenue increased strongly from EUR 305.0 million in 2015 to EUR 597.0 million in 2016, driven by continued growth across all geographies. EBITDA margin improved from negative 36% in 2015 to negative 14% in 2016 due to increased efficiencies in procurement and fulfillment, while marketing expenses decreased. EBITDA increased from negative EUR 109.5 million in 2015 to negative EUR 86.2 million in 2016, mainly due to the expansion in North America and the United Kingdom. Cash and cash equivalents decreased from EUR 109.2 million to EUR 57.5 million mainly due to significant investments in physical fulfillment infrastructure and focus on profitability partially compensated by proceeds from capital increases.
Rocket Internet SE
Combined Management Report for 2016
26
foodpanda operated the leading emerging economies online marketplace for food delivery and takeaway. Effective December 31, 2016, foodpanda was sold to DH, thus, ceasing to represent an operating segment starting from 2017.
Revenue increased by 60% from EUR 31.5 million in 2015 to EUR 50.6 million in 2016, mainly due to higher fees and a larger number of orders in key markets. EBITDA improved by EUR 38.1 million from negative EUR 108.7 million in 2015 to negative EUR 70.6 million in 2016, primarily due to higher operational efficiency and lower expenses for marketing measures.
GFG is a leading online fashion destination focused on emerging markets. The company is active in 24 countries across four continents and operates through four branded platforms, uniting the leading fashion eCommerce companies Lamoda (Russia/CIS), Dafiti (Brazil/Latin America), Namshi (Middle East) and Zalora (Southeast Asia) including The Iconic (Australia and New Zealand). During 2016, the segment GFG excludes Jabong (operations in India), which was disposed of in August 2016.
Revenue increased by 10% from EUR 930.1 million in 2015 to EUR 1,023.1 million in 2016. Revenue growth was slower in comparison to previous year given that the 2015 figure includes and the 2016 figure excludes revenues of Jabong. During 2015 Jabong contributed revenues of EUR 122.1 million to the GFG segment. Excluding Jabong revenue of the segment would have increased by 27% in comparison to 2016. EBITDA improved by EUR 172.6 million from negative EUR 318.6 million in 2015 to negative EUR 146.0 million in 2016. The EBITDA margin significantly improved from negative 34% in 2015 to negative 14% in 2016. These changes were due to operational improvements mostly in inventory management, warehousing, delivery and marketing as well as due to the exclusion of operations in India in 2016. Cash and cash equivalents increased from EUR 75.2 million to EUR 244.2 million primarily due to the financing round in 2016 and the proceeds from the disposal of Jabong.
Jumia is a leading online shopping portal in Africa. Customers across the continent can shop from the widest assortment of high quality products with everything from fashion, consumer electronics, and home appliances to beauty products on offer at affordable prices. The company’s goal is to offer a platform for merchants, brands and SMEs to connect and transact with African consumers.
On August 30, 2016 the former operating segment Jumia, that represented the general merchandise business by the group under Africa eCommerce Holding GmbH (AEH), was merged into Africa Internet Holding GmbH (AIG). Consequently, starting from September 30, 2016 the performance of the entire African operations (Jumia general merchandise businesses together with other marketplace and classifieds businesses in Africa) is reviewed at AIG-level solely and is subsumed within the new operating segment Jumia. For comparability the financial information of the former operating segment Jumia for the previous year was reclassified from the segment General Merchandise into the new reportable segment Jumia.
Revenue of Jumia decreased by 37% from EUR 134.6 million in 2015 to EUR 84.4 million in 2016, mainly impacted by the continuing shift from eCommerce towards a marketplace business model, by the slowdown of the Nigerian economy and by currency devaluations in June 2016. EBITDA for 2016 of negative EUR 104.5 million (previous year negative EUR 118.9 million) and EBITDA margin of negative 124% (previous year negative 88%) are negatively affected by additional losses related to other marketplace and classifieds businesses contributed by AIG in the merger with AEH. This is particularly attributable to the early stage of the contributed businesses. The increase in cash and cash equivalents from EUR 9.5 million to EUR 29.5 million mainly results from the merger of AIG with AEH and proceeds from capital calls.
Home & Living includes the business of Home24, a leading online retailer for home and living products operating in Europe and Latin America, and Westwing, an online retailer offering a frequently changing, curated selection of home design products in Europe, CIS and Latin America.
Revenue of our Home & Living segment increased by 9% from EUR 452.8 million in 2015 to EUR 494.2 million in 2016. The reduced revenue growth has been driven by an increased focus on profitability. EBITDA improved by EUR 67.6 million from negative EUR 131.7 million in 2015 to negative EUR 64.1 million in 2016, as a result of operational improvements. The EBITDA margin improved from negative 29% in 2015 to negative 13% in 2016. The change of cash and cash equivalents from EUR 64.6 million to EUR 51.9 million results from operating losses as well as
Rocket Internet SE
Combined Management Report for 2016
27
investments in technology and infrastructure partially compensated by proceeds from financing rounds during the reporting period.
Historically, the Group reported the segment General Merchandise which included operations of Linio, Jumia (AEH) and Lazada. In April 2016, Lazada was partially sold to Alibaba and ceased to represent an operating segment due to the loss of significant influence from thereon. Starting from July 1, 2016, Linio ceased to represent an operating segment, due to the loss of significant influence as a result of non-participation of Rocket Internet SE in the most recent financing round and the corresponding decrease in voting rights to less than 20%. For further discussion please refer to the Note 6 of the Consolidated Financial Statements.
3.5.5 Overall Statement regarding the Earnings, Financial and Asset Position of the
Group
The reporting period is characterized by impairment losses of several associated companies, valuation losses of equity instruments accounted for at fair value through profit or loss, divestments of stakes in various companies (Pizzabo.it, La Nevera Roja, Bonnyprints and Lazada), by the expansion of existing companies such as Caterwings and the development of new business models (Campsy, Everdine, Instafreight) as well as investments in existing and new businesses (Ace & Tate, Marley Spoon, Thermondo, Pets Deli, Goldbely, NatureBox and Sonovate). No longer viable business models (Vendomo, Tripda, Shopkin, Sparklist) were discontinued, sold or limited to operate regionally. In addition, the process of raising capital has been optimized by the Rocket Internet Capital Partners Fund which was founded in January 2016. 90% of the equity funding of the Fund was provided by third parties (institutional investors and high net worth individuals) which is crucial for the support of existing and the implementation of new business models.
Rocket Internet SE
Combined Management Report for 2016
28
3.6 Position of the Company
The Annual Financial Statements of Rocket Internet SE were prepared in accordance with German
Commercial Code (HGB).
3.6.1 Earnings Position of the Company
General remark on the earnings position of the Company
Driven by the business model of Rocket Internet SE, the earnings position can vary substantially from year to year, which is also due to occasional sales of participations. This can be demonstrated by the actual performance of the Company in the financial years 2010 – 2016:
In EUR million 2016 2015 2014 2013 2012 2011 2010
Revenue 28.1 34.2 28.8 26.0 24.3 6.8 5.4
Other operating income 150.6 30.5 5.9 187.5 176.8 14.7 1.7
EBITDA 80.5 -65.1 -44.6 161.7 165.7 13.8 0,8
Financial and investment result -32.0 -7.3 -0.6 -2.4 215.3 37.3 46.3
Net income / loss for the year 41.4 -73.5 -45.9 147.1 378.1 50.7 45.3
Following the first-time application of the German Accounting Directive Implementation Act (Bilanzrichtlinie-Umsetzungsgesetz – short: BilRuG) regarding the elimination of extraordinary losses, last year's losses are now reported under other operating expenses.
Earnings position of the Company during the reporting period
In EUR million 2016 2015
Revenue 28.1 34.2
Changes in work in progress -0.8 0.2
Other own work capitalized 2.9 4.0
Other operating income 150.6 30.5
Cost of materials -10.8 -8.6
Personnel expenses -51.3 -77.0
Other operating expenses -38.2 -48.4
EBITDA 80.5 -65.1
Amortization/depreciation of property, plant and equipment and of intangible assets -7.1 -1.6
Financial and investment result -32.0 -7.3
Income taxes, other taxes 0.0 0.5
Net income/loss for the year 41.4 -73.5
The Company’s revenues have decreased significantly by EUR 6.1 million to EUR 28.1 million, due to services previously provided by Rocket Internet being moved inhouse by network companies or those network companies being sold or closed.
The disposal of participations during the reporting period impacted the other operating income position by EUR 118.8 million (previous year EUR 23.7 million), the majority of which resulted from the sale of Lazada shares amounting to EUR 104.8 million and EUR 8.0 million sale of Zalando SE shares (previous year sale of Zalando SE shares amounting to EUR 17.7 million).
Rocket Internet SE
Combined Management Report for 2016
29
The average number of employees during the financial year 2016 decreased in comparison to the previous financial year from 403 to 321. The total personnel expenses decreased by 33% to EUR 51.3 million (previous year EUR 77.0 million). The reduction of the workforce led to a decrease of the regular personnel expenses to EUR 24.6 million (previous year EUR 29.5 million). Additionally, the accounting for equity-settled share-based payment plans generated expenses amounting to EUR 21.8 million (previous year EUR 38.0 million), which were recorded as personnel expenses. Moreover, the expenses for compensation obligations of EUR 4.9 million (previous year EUR 9.5 million) were recognized in personnel expenses as well.
Other operating expenses in the financial year include equity-settled share-based payment plans which generated expenses of EUR 1.6 million (previous year EUR 10.2 million). The expenses decreased in comparison to the previous financial year regarding adjustments for equity-settled share-based payment plans. Moreover, the expenses for compensation obligations generated expenses of EUR 3.2 million (previous year EUR 14.0 million). Following the first-time application of BilRuG regarding the elimination of extraordinary losses, last year's losses are now reported under other operating expenses. Corresponding to Sec. 277 HGB (Art. 13 Sec. 1 in conjunction with appendix 5 and 6 of the European Directive 2013/34/EU) the other operating expenses in the profit and loss statement in previous year amounts to EUR 48.4 million and increased by EUR 2.9 million.
The gain from participations in the financial year 2016 amounted to EUR 6.5 million (previous year EUR 15.3 million), the majority of which resulted from distribution in kind received from a subsidiary. Interest expense on convertible bond amounts to EUR 19.1 million (previous year EUR 9.4 million). Furthermore, the financial and investment result includes financial asset impairment charges amounting to EUR 29.5 million (previous year EUR 14.0 million).
The net income for the financial year amounts to EUR 41.4 million (previous year net loss for the year of EUR 73.5 million). The Company realized a return on equity of 1.4% (previous year -2.6%). EBIT totaled EUR 73.4 million (previous year EUR -66.7 million) and EBITDA amounted to EUR 80.5 million (previous year EUR -65.1 million). Due to the first time adoption of the Implementation Act (BilRUG), the extraordinary expenses are reclassified to the other operating expenses. With corresponding application in the Management Report in the previous year, the EBIT and the EBITDA differ to the prior year by an amount of EUR 2.9 million.
3.6.2 Financial and Asset Position of the Company
In EUR million
Assets Dec 31, 2016 Dec 31, 2015
Fixed assets 2,642.6 76% 1,611.8 47%
Current assets 814.2 23% 1,805.0 52%
Other assets 34.0 1% 39.3 1%
Total 3,490.8 100% 3,456.1 100%
Equity and Liabilities Dec 31, 2016 Dec 31, 2015
Equity 2,913.1 83% 2,857.1 83%
Provisions 17.7 1% 36.9 1%
Liabilities 560.0 16% 562.1 16%
Total 3,490.8 100% 3,456.1 100%
The financial position of the Company can be described as strong. It continues to offer opportunities for investments into new companies and for participations in capital increases in existing ones. Cash and cash equivalents as of December 31, 2016 amounted to EUR 653.6 million (previous year EUR 1,720.0 million). Thus, the Company experienced a
Rocket Internet SE
Combined Management Report for 2016
30
negative cash flow of EUR 1,066.4 million (previous year negative cash flow of EUR 277.7 million). The decrease of cash and cash equivalents is primarily a result of investments and repurchases of convertible bonds in the financial year
In the financial year, the Company remains financed mainly through equity with an equity ratio as of December 31, 2016 of 83% (previous year 83%). No dividends were paid in 2016 and 2015.
The asset position comprises participations amounting to EUR 2,639.1 million (76% of total assets; previous year EUR 1,606.2 million, 47% of total assets), receivables from subsidiaries and companies in which a participation is held in the amount of EUR 139.1 million (4% of total assets; previous year EUR 81.9 million, 2% of total assets) as well as cash and cash equivalents in the amount of EUR 653.6 million (19% of total assets; previous year EUR 1,720.0 million, 50% of total assets).
The increase in participations by EUR 1,033.0 million is mainly due to the acquisitions of shares in various companies as well as to the further, mostly international expansion of existing businesses. Moreover, the Company invested into the development of diverse new business models, such as Global Fashion Group S.A. and GFC Global Founders Capital S.à r.l. In the financial year, the financial assets were impaired in the amount of EUR 29.5 million, thereby exceeding last year’s figure (previous year EUR 14.0 million), which resulted primarily from proportionate impairments of Wimdu GmbH, New TIN Linio II GmbH, Digital Services XXVIII S.à r.l., (Nestpick), Somuchmore Global S.à r.l. and Global Savings Group GmbH. The reversals of impairment losses amounted to EUR 0.6 million (previous year EUR 0.6 million).
In 2016, loan receivables were impaired by EUR 20.1 million (previous year EUR 5.9 million). The majority thereof relate to Bambino 106. VV UG (Payco & Printvenue), Somuchmore, EasyTaxi and Wimdu, for which the loan receivables became irrecoverable.
3.6.3 Overall Statement with regard to the Earnings, Financial and Asset Position of
the Company
Rocket Internet SE has successfully addressed its multifaceted challenges during the financial year 2016. Rocket Internet SE’s economic position is characterized by investment activities and expansion of its network of companies. The total earnings exceeded the expenses earnings in the financial year. This especially applies to the sold shares of the Lazada Group S.A. The overall business development can be considered as satisfactory. The development of investment activities and expansion of the network companies continued after the reporting date. Based on the Company’s noticeably solid balance sheet structure, Rocket Internet SE is in a good position to achieve future growth both organically and through future investments.
4. Forecast Report, Report of Opportunities and Risks
4.1 Forecast Report
The International Monetary Fund (IMF) published its “World Economic Outlook” (update January 2017), in which global growth is projected to recover to 3.4% in 2017 and 3.6% in 2018. Advanced economies are now projected to grow by 1.9% in 2017 and 2.0% in 2018. Emerging market and developing economies growth is projected to reach 4.5% for 2017. A further pickup in growth to 4.8% is projected for 2018. After a lackluster outturn in 2016, economic activity is projected to pick up pace in 2017 and 2018, especially in emerging market and developing economies. The outlook for advanced economies has improved for 2017 and 2018, reflecting somewhat stronger activity in the second half of 2016 as well as a projected fiscal stimulus in the United States.
According to eMarketer worldwide retail sales – including in-store and Internet purchases – surpass USD 22.0 trillion in 2016, up 6.0% from 2015. Retail eCommerce sales, those purchased over the Internet, make up 9.0% of the total retail market worldwide, or USD 1.9 trillion. By 2020, that share will jump to USD 4.1 trillion. eMarketer expects online sales will grow at double-digit rates throughout the forecast period through 2020, this includes products or services ordered using the
Rocket Internet SE
Combined Management Report for 2016
31
Internet via any device, regardless of the method of payment or fulfillment and excludes travel and event tickets. The number of digital buyers worldwide increases by 7.9% on an annual basis from 2016 on until 2020, fueled by new Internet users in Asia-Pacific, Latin America, the Middle East and Africa making digital purchases for the first time.
With regard to the worldwide Internet sector, market parties expect a continuation of the shift from traditional sales channels to online and mobile business and an acceleration of the growth in mobile Internet usage. Accordingly, the entire industry goes through a transition from classic desktop-Internet companies to mobile-first and even mobile-only. The emergence of new competitor companies in the incubation business as well as the operational online business and the development of new online business models are very likely. We expect the further expansion of our companies to continue accompanied by the development and investments in various new business models.
Rocket Internet is established in the start-up industry and intends to maintain and advance its position. Our employees, including members of the management team, have attended many congresses and other events not only to advance their own expertise but also to present and share their experience with the industry, current and future entrepreneurs and high potential students. We see it as crucial that Rocket Internet is connected to the moving forces in the start-up industry. Our engagement in the communication with the industry will keep Rocket Internet well informed about market developments.
We believe that Rocket Internet is equipped to identify investment opportunities and has the necessary means to act on opportunities when they arise. Rocket Internet expects to maintain and further expand its grip into the interesting and promising online business opportunities. While we still look for great business ideas that we want to pursue ourselves, we expect to largely invest directly into selective, existing start-ups at early and growth stage in their development during 2017.
Regarding RICP, Rocket Internet will fulfill its commitments from capital calls, and potentially increase its share in the fund.
Investments into most of our larger network companies included in segments are expected to probably, predominantly decrease due to their improving profitability. Investments into existing network companies in the area of Regional Internet Groups and New Businesses & Investments should remain stable. Consequently, we expect the number of fully consolidated entities to remain fairly stable, whereas number and size overall of GFC investments is bound to increase.
Regarding New Businesses & Investments, Rocket Internet Group expects a considerable increase in consolidated revenue for the financial year 2017 for those companies that continue to be fully consolidated after December 31, 2016. Overall, however, due to the sale of Bonnyprints (in January 2016), La Nevera Roja (in April 2016), Pizzabo.it (in February 2016) and Somuchmore (in December 2016) as well as deconsolidation of some other former subsidiaries (Spotcap, Clickbus Brazil, Everdine, Vaniday), discontinued business activities of subsidiaries (Bonativo, Spaceways, Blue Circle), and potentially also by disposal of further subsidiaries a slight increase in consolidated revenue is forecast for the financial year 2017. Due to the early stage of our fully consolidated subsidiaries, we expect negative operating results (EBITDA) in the area New Businesses & Investments for 2017 in the range between EUR 20 to 30 million.
As Rocket Internet aims to keep a larger share of the economic ownership in most of the new companies, a reduced level of result from deconsolidation is expected for 2017.
Results from associated companies and joint ventures are determined by their operations and the consequent results from operational activity on the one hand, and by the conditions agreed with new investors in future financing rounds on the other. For most associated companies and joint ventures, we expect negative proportionate contributions from their operational results, which should be compensated partly by the effects from financing rounds. Overall, we expect a substantial negative result from associated companies and joint ventures but estimate the degree of predictability to be low given the market movements in our business environment.
Rocket Internet SE
Combined Management Report for 2016
32
The earnings position of the Company and the Group can vary substantially from year to year, due to dilution or occasional sales of participations. The earnings position of the Group can also be subject to high volatility due to the results from deconsolidation. Overall, therefore, we estimate the predictability of EBITDA with regard to the timing and its amount to be low, as in previous years. Against this backdrop, corporate planning does not include a quantified projected result for 2017, but EBITDA is forecast to improve for 2017 in comparison with 2016.
Rocket Internet SE expects revenues to decrease by a low double-digit percentage in 2017 as compared to 2016 due to the increased individual independence of the network companies. Through the provision of essential administrative company functions and the recognition of expenses from share-based payment plans in the income statement we expect a negative, and compared with previous year decreased, operating result (EBITDA) in the Annual Financial Statements of Rocket Internet SE for the reporting year 2017 provided there are no material divestments of participations.
Outlook for the segments that continue to be reportable in 2017
In all segments that continue to be reportable in 2017, we expect revenue growth, negative EBITDA and an improvement in the EBITDA margins for the financial year 2017.
HelloFresh
Our segment HelloFresh’s revenues should expand by a double-digit percentage in 2017 as compared to 2016. Total operating loss should decrease significantly in 2017 compared to 2016 and the negative EBITDA margin should significantly improve.
GFG
For GFG, we anticipate that revenues will be higher for the financial year 2017 than the prior-year figure by an amount in the low double-digit percentage range. We expect a slight improvement in EBITDA compared to previous year’s operating loss, thereby improving the EBITDA margin moderately, but still remaining at a low double-digit negative percentage range.
Jumia
Jumia is expected to grow revenues by a low double-digit percentage during the financial year 2017. When it comes to EBITDA, we forecast it to increase by a low single-digit percentage range. Accordingly, we estimate EBITDA margin should improve slightly.
Home & Living
For Home & Living, we expect an increase in revenues by a low double-digit percentage in the financial year 2017 as compared to 2016. EBITDA should improve by a double-digit percentage, albeit staying in the negative zone. Therefore, we expect that the negative EBITDA margin of the Home & Living segment will be in the single-digit percentage range.
4.2 Risk Report
4.2.1 Risk Management System – Principles and Organization
Rocket Internet has implemented a management system to handle opportunities and risks arising out of its economic activities. The objective of the risk and opportunity management is to develop a risk management strategy and establish goals that create an optimal balance between growth and profitability on the one hand and the related risk on the other.
Risk is defined as the possibility of negative deviations of actual business performance from the planned targets or objectives, while opportunities represent the possibility of positive deviations. We do not seek to avoid risks at all costs, but to carefully weigh the opportunities and risks associated with our decisions and our business activities, from a well-informed perspective. Accordingly, opportunities should be exploited to generate income or increase the Company’s value and risks should be assumed only if they remain within appropriate limits that are acceptable to the Company. Thus, risks should be limited to a level deemed acceptable by the Company’s
Rocket Internet SE
Combined Management Report for 2016
33
Management by taking appropriate measures, be transferred to third parties in full or in part, or, in those cases where risk mitigation is not considered advisable, be avoided or monitored closely. All employees are duty-bound to handle risks responsibly within their own area of responsibility. The risk policy principles and risk strategy are coordinated and closely aligned with the business strategy and business objectives.
The concept, organization and task of Rocket Internet SE’s risk management system are defined by the Management Board and Supervisory Board and documented in a risk policy. These requirements are regularly adapted to changing legal conditions and continually developed.
The general form of structure and processes in the risk management system at Rocket Internet are based on the internationally recognized "Enterprise Risk Management Framework", a framework developed by the Committee of Sponsoring Organizations of the Treadway Commission (COSO). This links the risk management process to the internal control system. The use of this holistic, integrated approach should ensure that countermeasures and monitoring activities are systematically focused upon the strategic, operational, reporting-related and compliance-related objectives of Rocket Internet Group and their risks.
The Risk Management department coordinates the implementation and ongoing development of the risk management system. All activities of the Risk Management department are closely coordinated with the Compliance department to ensure appropriate interlinking of individual subsystems (risk management, compliance management and internal control system) as well as related reporting with the aim to implement Group-wide effective monitoring systems. The systematic identification and assessment of opportunities is included in the strategic planning process.
The examination of the effectiveness and efficiency of the risk management system is generally within the responsibility of the Internal Audit department. In addition, the Audit Committee set up by the Supervisory Board monitors the effectiveness of the internal control, risk management and internal audit system. As part of his statutory auditing obligations for the Annual Financial Statements and Consolidated Financial Statements, the external auditor also examines whether the early risk recognition system is generally suitable for the early identification of risks and developments which might endanger the Company so that suitable countermeasures can be swiftly introduced.
During this financial year certain elements of internal monitoring (Risk Management, Compliance Management, Internal Control and Internal Audit) have been further developed and expanded. In regards of risk management there was particular focus on ensuring the continuous improvement of the quality and completeness of the risk register and the corresponding internal management measures.
4.2.2 Risk Management System – Methodology and Reporting
The risk management system comprises those measures which enable Rocket Internet SE to identify, assess and monitor from an early stage all possible risks for the attainment of its corporate objectives.
The risk management system covers Rocket Internet SE and generally all significant network companies where risks could occur that might have a material impact on the Rocket Internet Group, independent of their consolidation status. The consolidation group for risk management purposes is hereby derived based on an individual assessment considering the risk-bearing capacity of the Rocket Internet Group and the potential risks per network company.
Due to the limited risk expertise at the network companies and often restricted control over the network companies the individual risks of the network companies that are included in the risk consolidation group are then assessed on Rocket Internet level using a top down approach.
The analysis of the potential risk consolidation group during the last annual risk assessment concluded that no single network company could currently create risks that would materially impact the Rocket Internet Group. As a result no network company was individually included in the risk consolidation group.
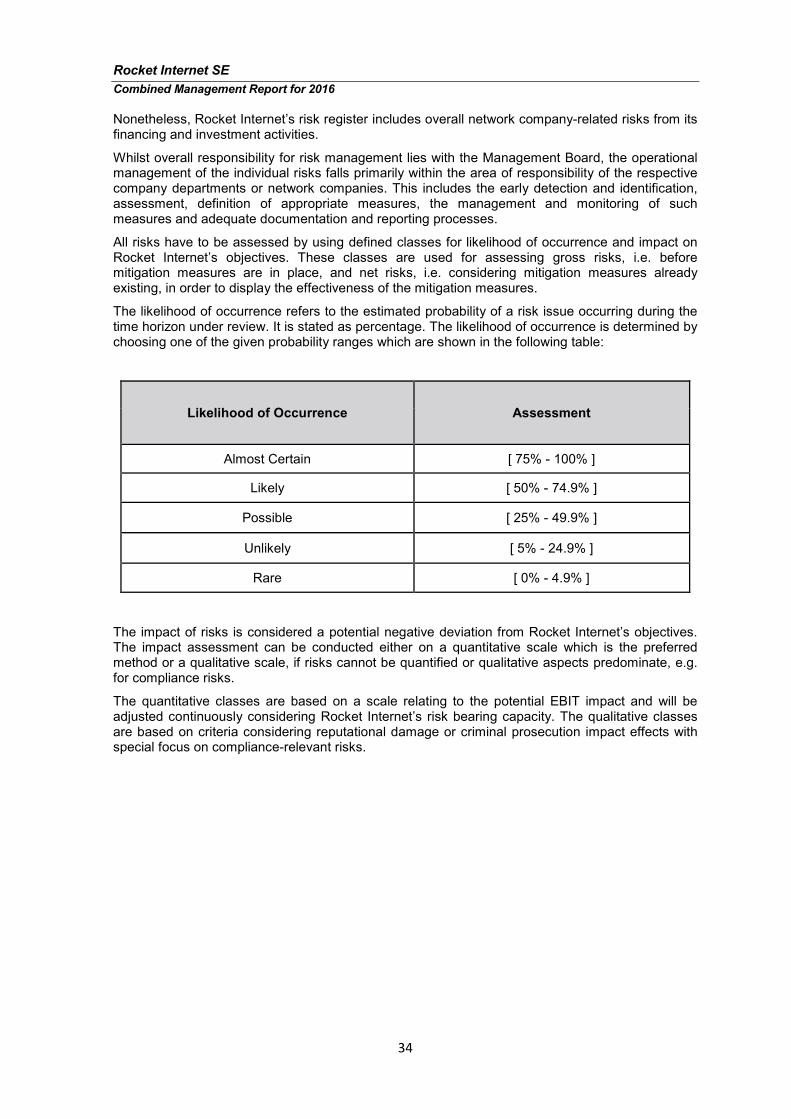
Rocket Internet SE
Combined Management Report for 2016
34
Nonetheless, Rocket Internet’s risk register includes overall network company-related risks from its financing and investment activities.
Whilst overall responsibility for risk management lies with the Management Board, the operational management of the individual risks falls primarily within the area of responsibility of the respective company departments or network companies. This includes the early detection and identification, assessment, definition of appropriate measures, the management and monitoring of such measures and adequate documentation and reporting processes.
All risks have to be assessed by using defined classes for likelihood of occurrence and impact on Rocket Internet’s objectives. These classes are used for assessing gross risks, i.e. before mitigation measures are in place, and net risks, i.e. considering mitigation measures already existing, in order to display the effectiveness of the mitigation measures.
The likelihood of occurrence refers to the estimated probability of a risk issue occurring during the time horizon under review. It is stated as percentage. The likelihood of occurrence is determined by choosing one of the given probability ranges which are shown in the following table:
Likelihood of Occurrence Assessment
Almost Certain [ 75% - 100% ]
Likely [ 50% - 74.9% ]
Possible [ 25% - 49.9% ]
Unlikely [ 5% - 24.9% ]
Rare [ 0% - 4.9% ]
The impact of risks is considered a potential negative deviation from Rocket Internet’s objectives. The impact assessment can be conducted either on a quantitative scale which is the preferred method or a qualitative scale, if risks cannot be quantified or qualitative aspects predominate, e.g. for compliance risks.
The quantitative classes are based on a scale relating to the potential EBIT impact and will be adjusted continuously considering Rocket Internet’s risk bearing capacity. The qualitative classes are based on criteria considering reputational damage or criminal prosecution impact effects with special focus on compliance-relevant risks.
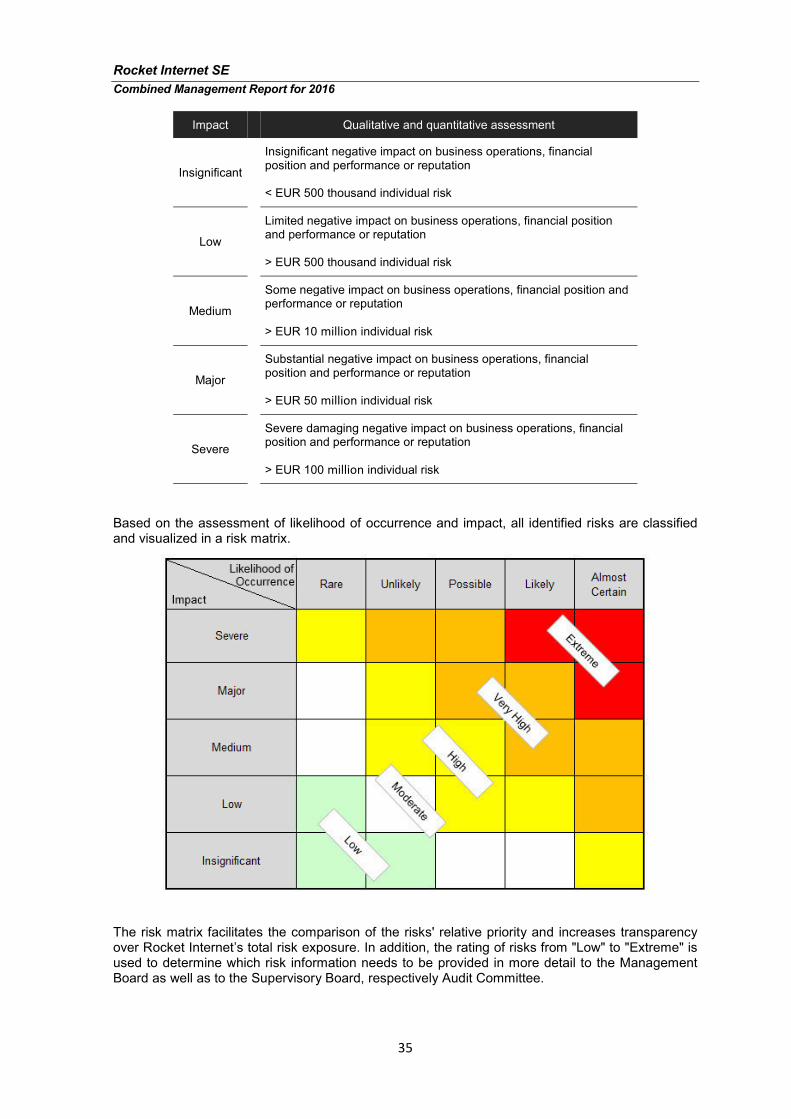
Rocket Internet SE
Combined Management Report for 2016
35
Impact Qualitative and quantitative assessment
Insignificant
Insignificant negative impact on business operations, financial position and performance or reputation
< EUR 500 thousand individual risk
Low
Limited negative impact on business operations, financial position and performance or reputation
> EUR 500 thousand individual risk
Medium
Some negative impact on business operations, financial position and performance or reputation
> EUR 10 million individual risk
Major
Substantial negative impact on business operations, financial position and performance or reputation
> EUR 50 million individual risk
Severe
Severe damaging negative impact on business operations, financial position and performance or reputation
> EUR 100 million individual risk
Based on the assessment of likelihood of occurrence and impact, all identified risks are classified and visualized in a risk matrix.
The risk matrix facilitates the comparison of the risks' relative priority and increases transparency over Rocket Internet’s total risk exposure. In addition, the rating of risks from "Low" to "Extreme" is used to determine which risk information needs to be provided in more detail to the Management Board as well as to the Supervisory Board, respectively Audit Committee.
Rocket Internet SE
Combined Management Report for 2016
36
The systematic and standardized risk inventory is conducted once a year. However, the risk owners must continuously monitor any changing risk situations within their department or Company. Significant changes in the risk situation must be reported immediately to the Risk Manager or Management Board.
The annual risk reports prepared for the Management Board, Audit Committee and Supervisory Board focus primarily on existential risks and significant risks, along with the countermeasures adopted.
4.2.3 Risk Areas
Companies with business models that include founding, financing and investing in young companies in the Internet sector take deliberate entrepreneurial risks. Rocket Internet is primarily exposed to operational, investment and valuation risks. These risks are related to the success potential of the business models of the network of companies as well as to the intense competition in the area of online business by other incubators and founders. Moreover, the worldwide expansion particularly into a large number of emerging markets increases the exposure to political, economic, legal as well as other risks and uncertainties. In this context, there is also the risk of target markets and their development deviating from pre-entry expectations.
The overall risk situation is determined by assessing the following risk clusters as the result of a consolidated consideration:
• Investment Risk,
• Financing Risk,
• Legal and Compliance Risk,
• Finance and Reporting Risk,
• Operational Risk.
Risk clusters, which from the current perspective could significantly affect the results of operations, the financial position and net assets of the Rocket Internet Group are presented below. These are not necessarily the only risks to which the Company is exposed. Further risks, which could affect our operations are currently not foreseen, or we assess these to be non-substantial.
Risks are typically presented in the order of their priority for the Group and risk assessments are given on a net risk basis considering existing mitigation measures.
Investment Risk
Rocket Internet builds and invests in Internet companies that take proven online and mobile business models to new, fast-growing markets. Our companies are “first movers” that quickly capture sizeable market share, the foundation for strong and lasting profitability.
Identification of new, promising business models and proper judgement of the business opportunities are therefore key risks for the Rocket Internet Group. Misjudging the current market environment, demands and competition can lead to missed chances to establish promising businesses or unsuccessful implementation of new business models. All new business concepts and products bear the risk that they are technically, procedurally or organizationally (e.g. availability of service providers) not feasible for implementation.
Experienced scouts for certain regions or business models are constantly identifying new opportunities. A structured process for identifying and evaluating new business opportunities based on information on e.g. business models and markets is in place. To assess the risks connected to new business concepts Rocket Internet performs a standardized, tool-based market and competition analysis prior to taking any investment or launch decisions with individual evaluations on the market situation, proper launch date and technical feasibility. Those research tools are constantly extended. However, due to a naturally higher likelihood the risk of wrong investment decisions is considered to be high.
Rocket Internet SE
Combined Management Report for 2016
37
In the fast pacing Internet environment speed is one of the key factors for success. Rocket Internet’s goal is to start operations within 100 days from the decision of establishing a business model.
Rocket Internet has industrialized the process of incubation with its platform approach. The launch process is standardized which connects the new network company (or product) with all departments and provides best practice guidelines and support. Milestones are set and tracked by a dedicated management team which actively supports new network companies from day one. This combines unique launching knowledge with the flexibility to adapt to the individual needs of each network company. The scalability of standard processes and IT platforms hereby reduces implementation costs and time.
Guidance to develop their operations and accelerating their operational development is provided to the network companies by giving access to Rocket Internet’s technology and by sharing our proprietary knowledge with the network companies.
After investment or incubation, the business development of each company is monitored on a regular basis in short intervals by means of key performance indicators (KPIs) and financial data. The analysis is focused on operational performance of the network company thereby benchmarking relevant KPIs compared with other network companies and external competitors, customer needs, market developments and technical performance and innovation to reduce the risks of wrong management and business decisions.
Rocket Internet provides companies with the financial means to start up, develop and grow their operations. As capital is a key component in growing companies, we aim to maintain a strong financial position as well as access to funding. Rocket Internet typically funds the network companies through a mix of own and third-party capital based on a financial budgeting planning including detailed cash planning according to the respective stage of the network company. Regular cash reporting is implemented which ensures an early identification of cash requirements.
All measures taken in regards of investment management, including the launch process, reduce the risks to a moderate level. This does not mean that all launches or investments will be successful.
Required value adjustments are recorded at an early stage to maintain a conservative business view of the asset position at all times.
Financing Risk
Due to the predominant equity financing via public markets, the Group is directly affected by developments and risks relevant to capital markets. The growth and expansion of Rocket Internet continuously requires additional capital. Problems in network company financing may have a negative impact on the ability to further develop network companies. Founding, investing and financing of a company depend on its own financing capability to a particularly high extent, which increases capital procurement risks.
The Group has to rely on the financing capability of its existing and future shareholders and their willingness to invest in the event of a further expansion of the network of companies. A critical success factor is to be able to provide promptly full and reliable information on the status and development of the Group companies. Communication of incorrect or incomplete information can result in reputational damage and might negatively impact the investor relations or even result in the loss of investors.
To properly manage the investor relations the Corporate Finance team implemented standard capital market communication and due diligence processes to collect and standardize all required information. An investment controlling department manages relevant information regarding the network companies. Although management of due diligence processes on Group company level are within the responsibility of the local management the experienced Rocket Internet teams support the network companies in providing correct and complete information. In addition, Rocket Internet and the Group companies are supported by specialized law firms.
The financing of new and existing network companies by several co-investors permits the distribution of risks across several parties. Moreover, the Company also systematically ensures risk
Rocket Internet SE
Combined Management Report for 2016
38
diversification by starting and financing businesses in different operational business fields and geographic areas. The Rocket Internet Group has access to a variety of investors as well as existing strategic partnerships.
However, as Rocket Internet’s business model relies on the capital markets as well as attracting external financing in subsequent financing rounds to expand the network company business the investor relation risk is considered high.
After admission to trading in the Prime Standard, the risk assessment was increased compared to prior year due to increased regulations, additional post-admission obligations and correspondingly changed investor expectations. Furthermore, the general funding environment for growth companies has become more challenging.
Rocket Internet has currently a sufficient cash position to fulfil its capital requirements relating to the financing of new and existing companies and the operating business.
Legal and Compliance Risk
The great number of contractual relationships and agreements concluded by the Group on a regular basis give rise to various legal risks. This refers especially to legal risks in corporate law, intellectual property law as well as competition/antitrust law and tax risks in connection with corporate reorganizations and resulting from interaction with the network companies.
These risks are reduced to a moderate level through mandating renowned corporate and tax law firms. A system of contract templates is in place for standard agreements. In addition, specialized law firms often located outside Europe are also increasingly engaged at the level of the company network, with a view to minimizing the risks resulting from legal uncertainty and capital recoverability. However, because of outsourcing, dependencies on the corporate and tax law firms can occur, which can be reduced by the assignment of engagements to multiple professional firms.
Rocket Internet is involved in the strategic leadership and tactical implementation of the business plans of its subsidiaries, associates and joint ventures, in particular in the early stage. It also performs a range of IT, marketing and other services, particularly commercial and technical consulting services for its subsidiaries and non-consolidated equity investments. However, the management of the network companies is in the responsibility of the local management. Rocket Internet’s control over many network companies is limited as it does not hold shareholding majority in many cases or shareholder agreements exist that lead to ongoing restrictions of Rocket Internet’s control over those network companies. Notwithstanding Rocket Internet is aware that reputational risks can arise for Rocket Internet Group resulting from non-compliance of network companies with relevant legal or regulatory requirements.
To reduce the risk of non-compliance Rocket Internet prepared guidelines for implementing adequate management systems in various areas, such as compliance management, internal controls, risk management and further standardized processes to apply legal requirements, due diligence requirements and financial statement closing. Business and compliance activities are, where possible, closely monitored through board representation. In addition, key business decisions and corporate changes of the network companies are subject to investor approval. A standard monitoring and approval process for investor approvals is implemented. However, given the control restrictions the risk of network company non-compliance is still considered to be high.
Other compliance-related risks that could possibly result from violation of internal or external laws and regulations, such as capital market or data protection regulations are managed and monitored by Rocket Internet’s Compliance department. Rocket Internet established a Group-wide code of conduct which provides guidance on various professional situations, a compliance hotline which should support the detection of relevant infringements as well as training on special topics such as competition issues or the proper handling of insider information. Compliance risks are identified on an ongoing basis and adequate measures implemented as relevant. In consideration of the mentioned awareness-raising measures we classify this risk as moderate.
Rocket Internet SE
Combined Management Report for 2016
39
Finance and Reporting Risk
Finance and Reporting risks mainly comprise:
- the Rocket Internet accounting process,
- the consolidation process, incl. accounting and reporting of network companies,
- the valuation of investments, as well as
- treasury.
Rocket Internet has implemented a system of internal controls over financial reporting to manage and reduce the finance and reporting risks to a moderate level. Due to limited control over processes at network company level, risks depending on information from network companies, i.e. reporting from network companies and input for valuation of investments, are assessed as high. For details refer to Section 6 Internal Control and Risk Management System for Financial Reporting.
In regard to treasury Rocket Internet is mainly exposed to liquidity and market risks. Rocket Internet has currently a sufficient cash position to finance investment activities. As a result the liquidity risk is considered to be moderate. Currency and interest rate risk resulting from the international business activities are not material and therefore assessed to be low. The risks arising from the use of financial instruments are discussed in detail in Note 40 and Note 41 of the Notes to the Consolidated Financial Statements and in Section 5 Risk Report Concerning the Use of Financial Instruments in this Management Report.
Operational Risk
Technology
Rocket Internet has created core technology platforms for the network companies, which allow a “plug and play” setup, and which are used as the starting point in the process of establishing a new company. Rocket Internet provides technology development services for its network companies to adapt those platforms to their individual requirements, optimize the existing offerings or establish innovative products in the market. Delayed developments, developments not addressing future business models or technical innovation as well as changes not meeting business needs might have a negative impact on the economic success of Rocket Internet Group and its network companies.
Rocket Internet manages the program development risks by following a standardized tool supported program development and change management process with a constantly increased amount and sophistication of automated unit-, integration- and functional tests to bring them to a moderate level. Each new project has to pass a technology strategy review for the best possible technical strategy and IT planning is constantly monitored and adapted to the current needs.
Especially due to steadily growing cybercrime, Rocket Internet assesses the risks regarding the availability of the utilized IT systems as well as the confidentiality and integrity of data as higher than compared to the prior year. The outage of IT systems can lead to disturbances of business operations, but it can also have a reputational impact.
The main causes, complexity of systems and infrastructure as well as external attacks, are mitigated by constant monitoring of all systems as well as the improvement of processes and security measures by a special IT security team. Due to the high dependency on the Internet and constantly evolving cybercrime activities, breaches of network and data security are considered to be a high risk.
Personnel
Berlin is increasingly becoming an established location for Internet and venture capital companies, which leads to increased competition for specialized management staff and functional experts. Especially IT specialist staff is increasingly in demand, particularly with regards to the increasing digitization of business models. Rocket Internet has set up an in-house recruiting team that is very successful in discovering candidates for digital business activities. As an international company which is attractive for many people willing to work in the Internet business and start up environment
Rocket Internet SE
Combined Management Report for 2016
40
Rocket Internet can and does recruit many positions globally. Therefore, the recruiting risk is deemed to be moderate.
The individual skills, professional competence, and commitment of our employees contribute greatly to the success of the Rocket Internet Group. As a consequence, the loss of specialist staff and management and the associated loss of expertise and the capacity issue is a high risk which we actively look to counter. This personnel-related risk is addressed through various personnel retention measures, targeted development of employees and motivation through attractive salary and incentive schemes.
4.2.4 Management Board’s overall assessment of the Group’s risk position
In summary, it should be noted that the Group performs systematic and regular analyses of the business risks based on qualified early risk detection systems and minimizes the risks through deliberate measures such as risk prevention, limitation of risks, risk diversification and risk insurance.
The assessment of the overall level of risk is based on a consolidated view of all significant risk fields and individual risks, also taking account of their interdependencies. At present, there are no discernible risks that could threaten the continued existence of the Rocket Internet Group, or could significantly affect the Group's financial position, financial performance and liquidity in the forecast period 2017.
4.3 Opportunities Report
As mentioned above the risk management system is maintained by the Risk Management Department. A systematic identification and assessment of opportunities is currently included in the strategic planning process. Strategic planning and the management of opportunities is shared between the Management Board, operational managers and the venture development team.
Rocket Internet’s business largely depends on the identification of business opportunities. Rocket Internet has dedicated teams to identify both interesting ideas which can be pursued by Rocket Internet itself in creating a new dedicated network company or promising start-ups where it makes more sense to participate as an investor. Management relies on the work of these independent teams to propose ideas and target entities and to prepare investment memos and business plans on the basis of which the decisions are made.
Rocket Internet also regularly reviews and weighs opportunities of existing businesses in order to decide if the business activities should be continued or ceased. Equally, Rocket Internet scans and evaluates all potential options for exits from an investment and the resulting gain or loss.
Depending on the size of the engagement or divestment different levels of approval are necessary.
Participation in the growth of the Internet sector
The Internet sector is still one of the fastest growing sectors of the economy. This offers generally good opportunities for companies that can establish themselves at an early stage and with promising business models in new geographic locations. At the same time, the rapid pace of developments in the Internet sector entails risks.
Identification and implementation of new business models
The Group is very well established in the industry. As a result, it has many opportunities to make use of innovations and trends in the Internet market within a short time frame through the creation of viable businesses. Rocket Internet’s core competencies include, in particular, the pursuit of new digital business models and trends and the early identification of new markets. The implementation of new business models is carried out using the unique platform approach that Rocket Internet developed.
To this end, the Group can rely on a highly qualified workforce. The members of the experienced and dedicated management team have a trained eye for assessing ideas and opportunities in the market with regard to their feasibility and profitability.
Rocket Internet SE
Combined Management Report for 2016
41
Standardized network company development process
Furthermore, Rocket Internet has standardized the process of building companies. The goal is to start operations within 100 days from the decision of establishing the business model.
The parallel development of various business models also enables synergies through the exchange of information, knowledge and best-in-class solutions. The internationality of the Group and the staff structure offer the opportunity to access and understand the most diverse international markets quickly. Consequently, Rocket Internet Group can promote one of its key strategies: the initial tapping of new and undersupplied markets and markets that have not yet been explored by competitors, in particular in Africa, Asia, Middle East and Latin America, but also in Europe.
Emerging markets engagement
While our network companies have substantial operations in developed markets, they typically strive to expand their emerging market activities. We include these emerging markets because we believe their growth in terms of gross domestic product (“GDP”), population and Internet penetration, combined with the absence of a sophisticated offline retail infrastructure, presents a significant market opportunity to leapfrog the development of traditional brick-and-mortar retail industries, which involves the maintenance of stores and other sales facilities. At the same time, the existence of high barriers of entry in these markets may bar competitors and may allow defending a leading market position. Some of the network companies operate in markets in which logistics, delivery and payment infrastructure do not exist and had to be built from the ground up. Competitors would have to first make similar significant efforts before they could enter the respective market.
Rocket Internet’s investor reach
The existing capitalization and access to investors as well as the existing strategic partnerships enable Rocket Internet to establish and finance new companies internationally and over longer periods. Moreover, the Group can generate economies of scope and scale as a result of its parallel international rollouts and its presence on six continents including many complex emerging markets.
Rocket Internet infrastructure, technology partners and deep knowledge sharing
As soon as a viable idea is identified, Rocket Internet has the necessary infrastructure and staff to enable a quick implementation of the idea. This includes very efficient Group-wide competence centers such as the marketing unit with its CRM (Customer Relationship Management), SEO (Search Engine Optimization) and SEA (Search Engine Advertising) teams. These competence centers support new as well as already existing network companies.
Strong and internationally leading technology partners such as Google, Facebook, Responsys, Sociomantic and Criteo enable Rocket Internet Group to utilize external technologies benefitting from superior terms relative to competitors, which are achieved through bundling service agreements across the Group.
Another success factor is the Group’s own core technology developed for different business models like eCommerce, Marketplaces and Financial Technology, which enables Rocket Internet Group to reliably set up several companies in parallel and within a very short time frame. These software solutions can be adapted flexibly to the requirements of the respective company and are scalable.
5. Risk Report Concerning the Use of Financial Instruments
The major financial instruments of Rocket Internet Group are cash (33% of total assets; previous year 35%) and short-term bank deposits (4% of total assets; previous year 0%), available-for-sale equity investments (31% of total assets; previous year 20%), equity instruments at fair value through profit or loss (FVTPL) (8% of total assets; previous year 6%) and other non-current financial assets (2% of total assets; previous year <1%), as well as liabilities from convertible bonds (8% of total assets; previous year 10%). The Group also records trade receivables and trade
Rocket Internet SE
Combined Management Report for 2016
42
liabilities as well as loan receivables and loan liabilities mainly from associated companies and joint ventures, which arise in the ordinary course of business.
The major financial instruments in the Annual Financial Statements prepared in accordance with German GAAP (HGB) of Rocket Internet SE are cash (19% of the total assets, previous year 50%), investments in subsidiaries (59% of total assets, previous year 34%), participations (11% of total assets, previous year 12%), as well as the liabilities from convertible bonds (16% of total assets, previous year 16%).
For information about the functions and objectives of our financial management, please refer to Note 40 Financial Risk Management in the Notes to the Consolidated Financial Statements. The information disclosed therein also applies for the Annual Financial Statements of the parent Company.
6. Internal Control and Risk Management System for Financial Reporting
The (consolidated) financial reporting-related risk management system and the connected internal control system are important elements of the internal management system of Rocket Internet SE.
The concept and organization of these systems is based on the internationally recognized framework of the Committee of Sponsoring Organizations of the Treadway Commission (COSO).
The effective interplay of the risk management system and internal control system is meant to ensure the effectiveness and efficiency of Rocket Internet’s business activities, the completeness and reliability of its financial reporting as well as compliance with relevant laws and standards.
The (consolidated) financial reporting related risk management and internal control system comprise all organizational regulations and measures aimed to identify, assess and manage all risks that might have a material impact on the (consolidated) financial statements.
However, even an effective, and therefore adequate and well-functioning internal control system cannot guarantee the prevention or detection of all irregularities or inaccurate disclosures.
We consider the following elements of the risk management and internal control system to be significant with respect to the (consolidated) financial reporting process:
• Identification of all significant financial reporting-related processes and risk areas including supporting IT systems and definition of corresponding key controls.
• Documentation and regular update of risk and controls in a risk-control-matrix for each business process and accounting system comprising control description, control type and frequency and control owner.
• Implementation of entity level, preventive and detective controls (manual and automated controls, 4-eye-principle and segregation of duties).
• Continuing analysis of new or changing accounting principles, laws and other regulations and assessment of their effect on the financial statements. Regular update of Group-wide accounting and reporting directives in the form of accounting guidelines, charts of accounts and reporting procedures.
• Quarterly communication of information to all consolidated Group companies on current developments related to accounting, reporting, and the process of preparing the financial statements as well as the reporting deadlines to be observed.
• Support of Group companies in implementation of adequate accounting processes and systems, e.g. by providing accounting services, guidelines and checklists for financial statement closing as well as key risks and standard controls within the business processes.
• Centralized preparation of the Consolidated Financial Statements (including Combined Management Report), employing manual and automated controls and quality checks.
• Assuring requisite expertise of employees involved in the financial accounting and reporting process by means of appropriate selection procedures and training as well as
Rocket Internet SE
Combined Management Report for 2016
43
employing specialists for specific valuation and IFRS topics such as valuation of investments and share-based payments.
• Monthly internal reports (income statement, statement of financial position) and monthly reports on all cost units of Rocket Internet, including analysis and reporting of significant developments and budget/actual variances.
The Internal Audit department independently audits effectiveness and efficiency of the accounting related risk management and internal control system by having authorized full, free and unrestricted access to any and all of Rocket Internet’s records, physical properties and personnel pertinent to carrying out any engagement. The audit procedures are based on a risk-oriented annual audit plan. In addition, the effectiveness of the financial reporting-related internal control system is subject to the risk-based financial statement audit of the external auditor.
If significant control weaknesses or opportunities for improvement are detected, they are assessed and countermeasures are developed with the responsible persons to further improve the effectiveness of the internal control system. Implementation of the management measures is monitored by the Internal Audit department and may be subject of subsequent audits. In order to ensure the high quality of the accounting-related internal control system the Internal Audit department is closely involved during all stages.
7. Takeover Law Disclosures Pursuant to Secs. 289 (4) and 315 (4) HGB
(German Commercial Code)
Composition of share capital
Rocket Internet SE’s share capital currently amounts to EUR 165,140,790. It is divided into 165,140,790 bearer shares with no-par value (Stückaktien), each such share represents a notional share of EUR 1.00 in the share capital. The share capital has been fully paid in. There are no other share classes.
Restrictions relating to the voting rights or the transfer of shares
Rocket Internet SE does not hold any treasury shares as of the reporting date. Therefore, there are no restrictions relating to voting rights according to Sec. 71b AktG.
Similarly, there are no restrictions regarding the transfer of shares.
Shareholdings that exceed 10% of the voting rights
At the end of the financial year 2016 Global Founders GmbH, Grünwald held 37.1% and Kinnevik Internet Lux S.à r.l., Luxembourg (a subsidiary of Kinnevik AB, Stockholm) held 13.2% of the shares in Rocket Internet SE. In February 2017, Kinnevik sold half of its stake in Rocket Internet SE decreasing its share to 6.6%. Please see Section 3.4 Rocket Internet Share and Share Capital Structure for further information.
The Management Board is not aware of further participations in capital exceeding 10% of voting rights. The current notifications of changes in voting rights in accordance with the Wertpapierhandelsgesetz (WpHG – German Securities Trading Act) are also published on the website https://www.rocket-internet.com/investors/share.
Appointment and removal from office of Management Board members and modifications of the Articles of Association
According to Art. 9 (1), Art. 39 (2) and Art. 46 of the SE Regulation, Secs. 84 and 85 AktG and Art. 7 of the Articles of Association, the Supervisory Board appoints the members of the Management Board for a maximum term of five years. In accordance with Art. 7 of the Articles of Association, the Management Board consists of one or more members. The number of members of the Management Board is determined by the Supervisory Board.
The annual general meeting passes the resolutions to amend the Articles of Association. The amendments to the Articles of Association are made in accordance with Secs. 179 and 133 AktG
Rocket Internet SE
Combined Management Report for 2016
44
and Art. 20 of the Articles of Association. Unless this conflicts with mandatory legal provisions, amendments to the Articles of Association require a majority of two-thirds of the valid votes cast or, if at least one-half of the share capital is represented, the simple majority of the valid votes cast.
Authority of the Management Board to issue shares
The Management Board is hereby authorized to increase the registered capital of the Company until August 21, 2019, with the consent of the Supervisory Board once or repeatedly, by up to a total of EUR 15,012,592 by the issuance of up to 15,012,592 new no-par value bearer shares against contributions in cash or in kind (Authorized Capital 2014). In principle, the shareholders are to be offered subscription rights. The new shares may be taken over by one or more banks with the obligation to offer them to the shareholders (so-called indirect subscription right). The subscription right of the shareholders is excluded for one or more capital increases in several circumstances specified in Art. 4 (3) of the Articles of the Association. The new shares shall bear the right to participate in the profits of the Company from the first day of the year in which they have been issued. The Management Board is authorized to determine any further details of the capital increase and its implementation, subject to the Supervisory Board’s approval. The Supervisory Board is authorized to adjust the wording of the Articles of Association accordingly after the utilization of the Authorized Capital 2014 or after the period for the utilization of the Authorized Capital 2014 has expired.
The share capital of the Company is conditionally increased by up to EUR 4,541,712 by issuance of up to 4,541,712 new registered no-par value shares (Conditional Capital 2014 / I). The Conditional Capital 2014 / I may only be used to fulfil the subscription rights which have been granted to the member of the Management Board of the Company, Mr. Oliver Samwer, in connection with the Stock Option Program 2014 / I in accordance with the resolution of the general meeting on September 8, 2014. The conditional capital increase will only be implemented to the extent that such subscription rights have been or will be issued in accordance with the Stock Option Program 2014 / I as resolved by the general meeting on September 8, 2014, the holder of the subscription rights exercises his rights and the Company does not deliver treasury shares to satisfy the subscription rights, whereas the Supervisory Board shall be exclusively competent regarding the granting and settlement of subscription rights to the member of Management Board. The new no-par value shares participate in the profit from the beginning of the financial year for which at the time of the issue of the new shares no resolution of the general meeting on the application of the balance sheet profit was passed, to the extent legally and factually admissible.
The share capital of the Company is conditionally increased by up to EUR 6,005,113 by issuance of up to 6,005,113 new no-par value bearer shares (Conditional Capital 2014 / II). The Conditional Capital 2014 / II may only be used to fulfil the subscription rights which have been granted to members of the Management Board (except for Mr. Oliver Samwer) and employees of the Company as well as members of the management bodies and employees of companies affiliated with the Company in the meaning of Secs 15 et seq. AktG in connection with the Stock Option Program 2014 / II in accordance with the resolution of the general meeting on September 8, 2014. The conditional capital increase will only be implemented to the extent that such subscription rights have been or will be issued in accordance with the Stock Option Program 2014 / II as resolved by the general meeting on September 8, 2014, the holders of the subscription rights exercise their rights and the Company does not deliver treasury shares to satisfy the subscription rights, whereas the Supervisory Board shall be exclusively competent regarding the granting and settlement of subscription rights to the members of Management Board. The new no-par value shares participate in the profit from the beginning of the financial year for which at the time of the issue of the new shares no resolution of the general meeting on the application of the balance sheet profit was passed, to the extent legally and factually admissible.
The basic capital will be conditionally increased by up to EUR 72,000,000 by the issue of up to 72,000,000 new bearer no-par value shares with profit entitlement (Conditional Capital 2015/2016). The conditional capital increase serves the granting of shares on the exercise of conversion or option rights or the fulfilment of conversion or option obligations to the bearer or creditor of conversion bonds, option bonds, profit rights and/or profit bonds (or a combination of these instruments) (hereinafter together “Bonds”) issued on the basis of the authorizing resolution of the General Meeting of June 23, 2015 or the authorizing resolution of the General Meeting of June 9,
Rocket Internet SE
Combined Management Report for 2016
45
2016. The issue of new shares is based on the conversion or option price to be determined in accordance with the authorizing resolution of the General Meeting of June 23, 2015 or the authorizing resolution of the General Meeting of June 9, 2016. The conditional capital increase will only be implemented to the extent that the bearers or creditors of Bonds which are issued or guaranteed by the Company or company dependent on or directly or indirectly majority-owned by it on the basis of the above authorizing resolution of the General Meeting of June 23, 2015 or are issued or guaranteed on the basis of the authorizing resolution of the General Meeting of June 9, 2016 up to June 8, 2021, avail of their conversion or option right or satisfy the conversion or option obligations under such Bonds or to the extent the Company grants shares in the Company instead of paying the amount due and to the extent the conversion or option rights or conversion or option obligations are not serviced by the Company’s own shares but by shares from Authorized Capital or other consideration. The new shares participate in the profit from the beginning of the financial year in which they are created and for all subsequent financial years. In deviation here from, the Management Board can, insofar as legally admissible, with the approval of the Supervisory Board, determine that the new shares participate in profit from the beginning of the financial year for which at the time of the exercise of the conversion or option rights, the fulfilment of the conversion or option obligations or the grant (of shares) instead of the amount of money due a resolution of the General Meeting as to the appropriation of the balance sheet profit has not yet been passed. The Management Board is authorized to determine the further details of the implementation of the conditional capital increase. The Supervisory Board is authorized to amend Art. 4 (6) and Art. 4 (1) and (2) of the Articles of Association in accordance with the claims in each case on the Conditional Capital and after the expiry of all option and conversion periods.
The Management Board is authorized with the consent of the Supervisory Board to increase the basic capital of the Company in the period up to June 8, 2021 by up to EUR 67,557,803 once or several times by the issue of up to 67,557,803 new bearer no-par value shares for cash and/or contributions in kind (Authorized Capital 2016). A subscription right is in principle to be granted to the shareholders. The shares can thereby be taken up according to Sec. 186 (5) Stock Corporation Act even by one or more financial institutions with the obligation to offer them to the shareholders of the Company (indirect subscription right). The Management Board is however authorized to exclude the subscription right of the shareholders with the approval of the Supervisory Board for one or more capital increases in several circumstances specified in Art. 4 (7) of the Articles of Association.
The Management Board is also authorized with the consent of the Supervisory Board to specify the additional content of the rights attached to the shares and the Conditions of the share issue. The Supervisory Board is authorized after the exhaustion of the Authorized Capital 2016 or after expiry of the period for the use of the Authorized Capital 2016, to amend the version of the Articles of Association accordingly.
Rocket Internet SE
Combined Management Report for 2016
46
8. Remuneration Report
8.1 Remuneration of the Management Board
Basic features of the remuneration system for the members of the Management Board
Total remuneration consists of a fixed base salary and a long-term incentive through option programs.
The total remuneration is appropriate to the tasks and performance of each member of the Management Board. The criteria used to determine what remuneration is appropriate relate to the responsibilities of the individual members of the Management Board, the personal achievement together with the Company’s economic situation, performance and future development. The industry environment and the remuneration structure that otherwise applies in the Company is also considered.
Pursuant to the resolution passed at the Company’s extraordinary general meeting held on August 22, 2014, information on the individual remuneration of each member of the Management Board is not disclosed in accordance with Secs. 285 (9), 315a (1) and 314 (1) HGB in conjunction with Art. 61 of the SE Regulation.
Non-share-based payments (non-performance-based remuneration)
The members of the Management Board receive non-share-based remuneration, such as salaries, non-cash payments and other benefits.
The salaries of the members of the Management Board are paid in monthly installments. The members of the Management Board as a group received annual salaries totaling EUR 1,750 thousand in the financial year 2016 (previous year: EUR 1,750 thousand).
Additionally, Rocket Internet SE bears 50% of the costs of the Management Board members’ private health insurance, but no more than the cost that would occur in the public health insurance system. Rocket Internet SE pays a monthly gross amount of the applicable employer’s contribution to the statutory pension and unemployment insurance, taking into account the contribution ceiling (Beitragsbemessungsgrenze).
All members of the Management Board received reimbursements of their out-of-pocket expenses, including travel expenses. In the event of a temporary incapacity to work as a result of health reasons, all Management Board members’ service agreements provide that the relevant base salary will continue to be paid for up to six weeks, but not beyond the expiry of the service agreement. In the case of a Management Board member’s death, the member’s surviving spouse, or registered partner, and eligible surviving children are entitled jointly to the relevant base salary for the remainder of the month of death and the following three months.
The members of the Management Board are covered by directors and officers (“D&O”) insurance policies with coverage in line with best market practice and a deductible in line with the respective provisions of the AktG. The D&O insurance policies also cover the risk of criminal prosecution.
Share-based payments (long-term incentives)
- Share options in Rocket Internet SE
The members of the Management Board participated in the Stock Option Programs 2014 in financial year 2016 (as well as in the prior year). Under the Stock Option Programs 2014 (“SOP I” and “SOP II”), one share option grants the holder the right to subscribe for one share of the Company. Rocket Internet has the right, without any obligation, to pay the entitlements in cash instead of shares.
All 4,541,712 share options under the SOP I were granted to the Company’s CEO after the listing of the Company’s shares on the Open Market of the Frankfurt Stock Exchange (Frankfurter Wertpapierbörse or the “Open Market”) on October 2, 2014. These share options have an exercise price of EUR 42.63 per share option and will vest in monthly installments over a five-year vesting period and can be, subject to certain conditions, exercised after a waiting period of four years commencing on the date the share options were granted.
Rocket Internet SE
Combined Management Report for 2016
47
The options granted under the SOP I can only be exercised if (amongst others):
(i) the Company successfully launches an average of at least four companies per year during the four-year waiting period; and
(ii) the stock price reflects, on at least one single trading day within the waiting period, a Company valuation of EUR 4 billion plus the total of all amounts paid in through capital increases or payments into the capital reserves since May 27, 2014 until the relevant trading day.
Under the SOP II, the Supervisory Board is authorized to grant up to 1,201,022 share options to each of the other two members of the Management Board (i.e. the CFO and the Group Managing Director).
The SOP II provides for an overall ten-year vesting period with a certain number of share options vesting after an initial four-year vesting term and the remaining share options vesting in yearly installments thereafter. The share options can be, subject to their vesting and certain other conditions, exercised after a four-year waiting period commencing on the date the respective share options are granted.
The exercise price of the share options granted prior to listing of the Company’s shares in the Open Market amounts to EUR 26.14 per share option. For share options granted subsequent to the listing of the Company’s shares in the Open Market the exercise price per share option corresponds to the volume-weighted average closing price of the shares twenty consecutive trading days prior to the relevant grant date.
The exercise of share options under the SOP II requires that:
(i) the shares of the Company are included in the Open Market until October 31, 2014; and
(ii) the Company successfully launches an average of at least four companies per year during the four-year waiting period.
If the performance targets are not achieved by the end of the waiting period, the share options granted under the Stock Option Programs 2014 will forfeit completely without any further consideration. In addition, the share options are only exercisable within three weeks after publication of interim financial reports or annual financial reports.
The table below provides an overview of the movements in the share option awards of SOP I and SOP II during the reporting period:
Share options 2016 2015
Weighted average exercise price
Number of options
Weighted average exercise price
Number of options
Options outstanding at January 1 EUR 39.88 5,450,054 EUR 39.88 5,450,054
Granted during the period EUR 17.90 292,680 - -
Forfeited during the period - - - -
Exercised during the period - - - -
Options outstanding at December 31 EUR 38.76 5,742,734 EUR 39.88 5,450,054
Exercisable at the end December 31 - - - -
Furthermore, members of the Management Board receive shares respectively share options in single, incubated portfolio entities of Rocket Internet SE at the date of founding of these portfolio entities.
- Ordinary shares in subsidiaries
The respective share-based payment arrangements provide for equity participation via a trust relationship. The trustee entity holds a certain amount of shares in accordance with the terms and conditions of a trust agreement for the benefit of the trustor, who can be the participant or an investment entity controlled by such a participant. A separate agreement, between the trustor and the relevant company receiving services, governs certain obligations regarding, inter alia, vesting-
Rocket Internet SE
Combined Management Report for 2016
48
rights and non-compete obligations that relate to the indirect shareholding of the relevant participant in the relevant company.
The vesting scheme requires a certain period of continued services. According to the currently mainly applied agreements 50% respectively 66.67% of the participant’s shares vest quarterly over a period of typically four years (3.125% respectively 4.167% per quarter) with typically a 6-month or 12-month cliff. Partially the vesting period is only three years. Typically the vesting of 33.33% to 50% of the participant’s shares is dependent on a change of control event (i.e. this part vests only in the later of the following events (i) occurrence of a change of control event – in some cases plus 12 month – or (ii) four years after the granting of the shares). If a leaver event occurs prior to the expiration of the cliff period, typically all shares can be clawed back. Thereafter, in the case of a bad leaver event, the Company can usually claw back all vested and unvested shares, while in case of a good leaver event, the Company may only claw back the unvested shares. A bad leaver event is typically triggered, if, for example, the respective service agreement between a participant and a subsidiary is terminated by such company for cause, the participant demonstrably committed a criminal offence against the company, or such member breached its non-compete obligation. A good leaver event is typically triggered, if, for example, the service agreement is terminated by either party properly.
Shares in subsidiaries of the Group have been issued to participants at the nominal value of the shares of EUR 1. If the applicable vesting conditions are not met (typically if a participant’s employment is terminated), Rocket Internet SE or a subsidiary has a right to reacquire these shares at the nominal value or – if lower – at market value.
Movements in the number of shares in subsidiaries issued to members of the Management Board are as follows:
2016 2015
Number of unvested shares at January 1 519 262
Deconsolidation of subsidiaries 228 - Granted during the period - 614 Vested during the period 72 - Forfeited during the period 15 357
Number of unvested shares at December 31 204 519
489484899 4174 Number of vested shares at December 31 489 417
- Share options in subsidiaries
Call option arrangements entitle the members of the Management Board to acquire a pre-defined number of shares in a subsidiary. The currently generally applied agreements correspond typically to the above-mentioned conditions for ordinary shares in subsidiaries. In the case of a change of control event the subsidiary is entitled to request that the members of Management Board exercise all call options outstanding at such point in time. Upon the occurrence of a bad leaver event, all call options that have not been exercised lapse. In the case of a good leaver event, all call options lapse for which the exercise period has not yet commenced.
Rocket Internet SE
Combined Management Report for 2016
49
Movements in the number of share options in subsidiaries granted to members of the Management Board and their related weighted average exercise prices are as follows:
2016 2015
Weighted average
exercise price
Number of
shares
Weighted average
exercise price
Number of
shares
Outstanding options at January 1 EUR 1,00 332 EUR 1,00 0
Deconsolidation of subsidiaries EUR 1,00 296 EUR 1,00 0
Granted during the year EUR 1,00 25 EUR 1,00 332
Exercised during the year EUR 1,00 0 EUR 1,00 0
Forfeited during the year EUR 1,00 0 EUR 1,00 0
Outstanding options at December 31 EUR 1,00 61 EUR 1,00 332
Exercisable at December 31 EUR 1,00 28 EUR 1,00 22
The contractual lives for the options are not specified in the option agreements. As a result, the weighted average remaining contractual life for the options outstanding at the reporting date is dependent on future exit events. In accordance with individual agreements, the outstanding options have an exercise price of EUR 1 per share.
Other disclosures
During the period of employment most additional jobs of the members of the Management Board outside of the Group require the previous written consent of the Supervisory Board. Additionally, the employment contracts contain non-compete obligations, which prohibit that members of the Management Board work for an entity that is a direct or indirect competitor of the Company or one of its portfolio companies or that is related to one of such competitor. However, each member of the Management Board is allowed to invest in a competitor as long as such an investment does not exceed a certain, individually agreed percentage of the voting rights of this entity.
The conditions of the employment contracts between the members of the Management Board and the Company became effective with the transformation of the Company into an Aktiengesellschaft (stock corporation) and were renewed with the transformation into a SE (Societas Europaea). They are effective until March 15, 2020. In this period the employment contracts may be terminated for cause. Through the dismissal of a member of Management Board the employment contract does not end automatically.
According to the provisions of the German Stock Companies Act (Aktiengesetz) the members of the Management Board are covered by a directors and officers (“D&O”) insurance policy with a reasonable coverage and a retention of 10% of the damage, but within a year maximum 1.5 times the annual fix salary. The D&O insurance covers financial damages occurred through breach of duty by the members of Management Board in line with their activity as Member of the Management Board and their operating activity.
There are no other service or employment contracts between Alexander Kudlich and Peter Kimpel and their related parties and the Company or its subsidiaries. Oliver Samwer receives a regular salary of an indirect, wholly owned subsidiary of Rocket Internet, which is completely (100%) subtracted from its salary paid by Rocket Internet SE.
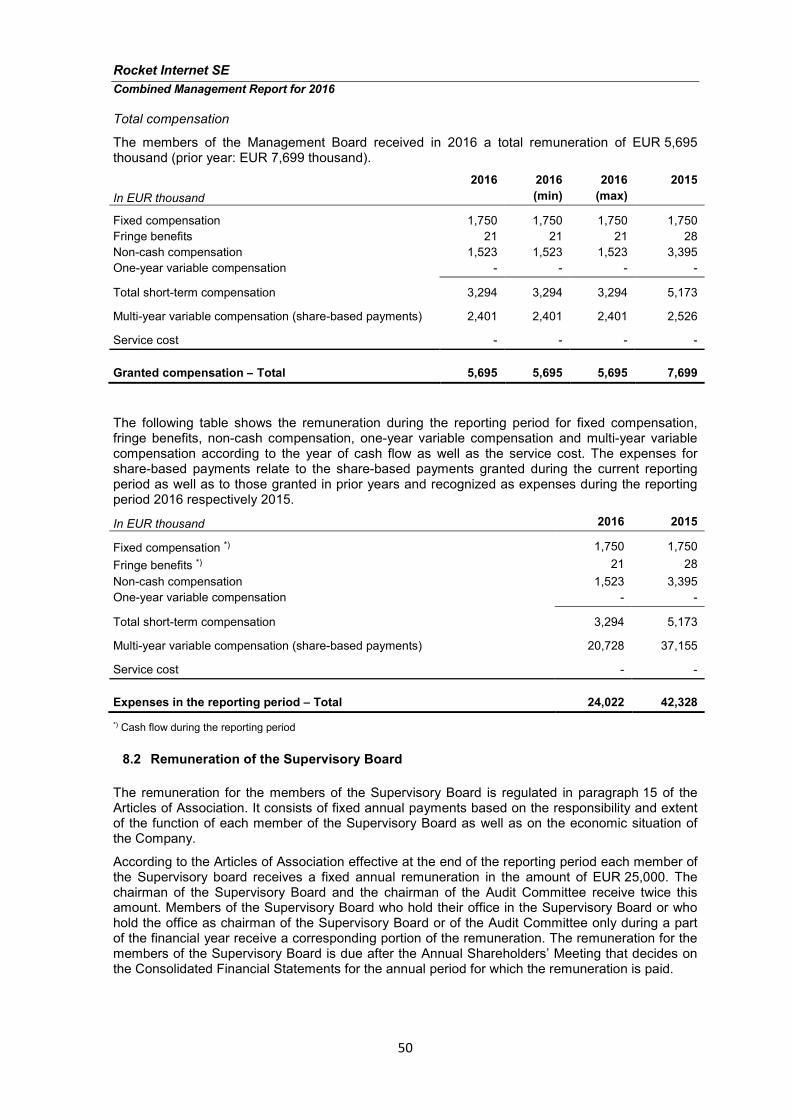
Rocket Internet SE
Combined Management Report for 2016
50
Total compensation
The members of the Management Board received in 2016 a total remuneration of EUR 5,695 thousand (prior year: EUR 7,699 thousand).
In EUR thousand
2016 2016
(min)
2016
(max)
2015
Fixed compensation 1,750 1,750 1,750 1,750
Fringe benefits 21 21 21 28
Non-cash compensation 1,523 1,523 1,523 3,395
One-year variable compensation - - - -
Total short-term compensation 3,294 3,294 3,294 5,173
Multi-year variable compensation (share-based payments) 2,401 2,401 2,401 2,526
Service cost - - - -
Granted compensation – Total 5,695 5,695 5,695 7,699
The following table shows the remuneration during the reporting period for fixed compensation, fringe benefits, non-cash compensation, one-year variable compensation and multi-year variable compensation according to the year of cash flow as well as the service cost. The expenses for share-based payments relate to the share-based payments granted during the current reporting period as well as to those granted in prior years and recognized as expenses during the reporting period 2016 respectively 2015.
In EUR thousand 2016 2015
Fixed compensation *) 1,750 1,750
Fringe benefits *) 21 28
Non-cash compensation 1,523 3,395
One-year variable compensation - -
Total short-term compensation 3,294 5,173
Multi-year variable compensation (share-based payments) 20,728 37,155
Service cost - -
Expenses in the reporting period – Total 24,022 42,328
*) Cash flow during the reporting period
8.2 Remuneration of the Supervisory Board
The remuneration for the members of the Supervisory Board is regulated in paragraph 15 of the Articles of Association. It consists of fixed annual payments based on the responsibility and extent of the function of each member of the Supervisory Board as well as on the economic situation of the Company.
According to the Articles of Association effective at the end of the reporting period each member of the Supervisory board receives a fixed annual remuneration in the amount of EUR 25,000. The chairman of the Supervisory Board and the chairman of the Audit Committee receive twice this amount. Members of the Supervisory Board who hold their office in the Supervisory Board or who hold the office as chairman of the Supervisory Board or of the Audit Committee only during a part of the financial year receive a corresponding portion of the remuneration. The remuneration for the members of the Supervisory Board is due after the Annual Shareholders’ Meeting that decides on the Consolidated Financial Statements for the annual period for which the remuneration is paid.
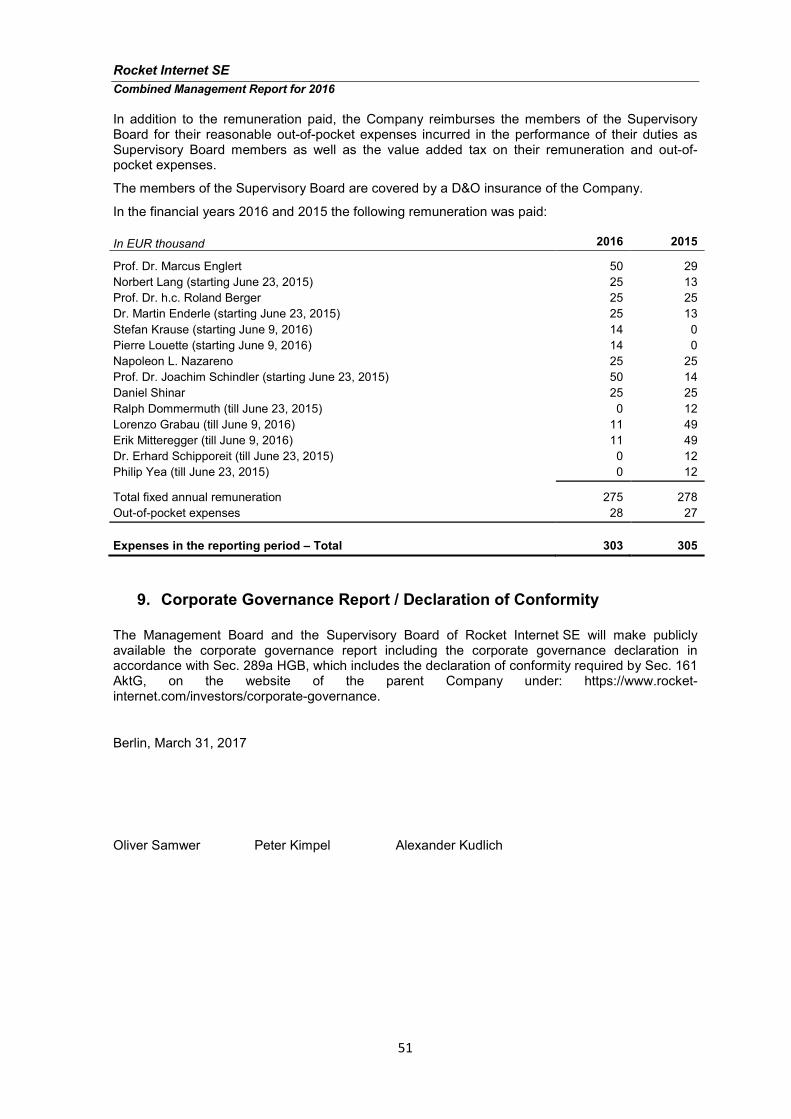
Rocket Internet SE
Combined Management Report for 2016
51
In addition to the remuneration paid, the Company reimburses the members of the Supervisory Board for their reasonable out-of-pocket expenses incurred in the performance of their duties as Supervisory Board members as well as the value added tax on their remuneration and out-of-pocket expenses.
The members of the Supervisory Board are covered by a D&O insurance of the Company.
In the financial years 2016 and 2015 the following remuneration was paid:
In EUR thousand 2016 2015
Prof. Dr. Marcus Englert 50 29
Norbert Lang (starting June 23, 2015) 25 13
Prof. Dr. h.c. Roland Berger 25 25
Dr. Martin Enderle (starting June 23, 2015) 25 13
Stefan Krause (starting June 9, 2016) 14 0
Pierre Louette (starting June 9, 2016) 14 0
Napoleon L. Nazareno 25 25
Prof. Dr. Joachim Schindler (starting June 23, 2015) 50 14
Daniel Shinar 25 25
Ralph Dommermuth (till June 23, 2015) 0 12
Lorenzo Grabau (till June 9, 2016) 11 49
Erik Mitteregger (till June 9, 2016) 11 49
Dr. Erhard Schipporeit (till June 23, 2015) 0 12
Philip Yea (till June 23, 2015) 0 12
Total fixed annual remuneration 275 278
Out-of-pocket expenses 28 27
Expenses in the reporting period – Total 303 305
9. Corporate Governance Report / Declaration of Conformity
The Management Board and the Supervisory Board of Rocket Internet SE will make publicly available the corporate governance report including the corporate governance declaration in accordance with Sec. 289a HGB, which includes the declaration of conformity required by Sec. 161 AktG, on the website of the parent Company under: https://www.rocket-internet.com/investors/corporate-governance.
Berlin, March 31, 2017
Oliver Samwer Peter Kimpel Alexander Kudlich
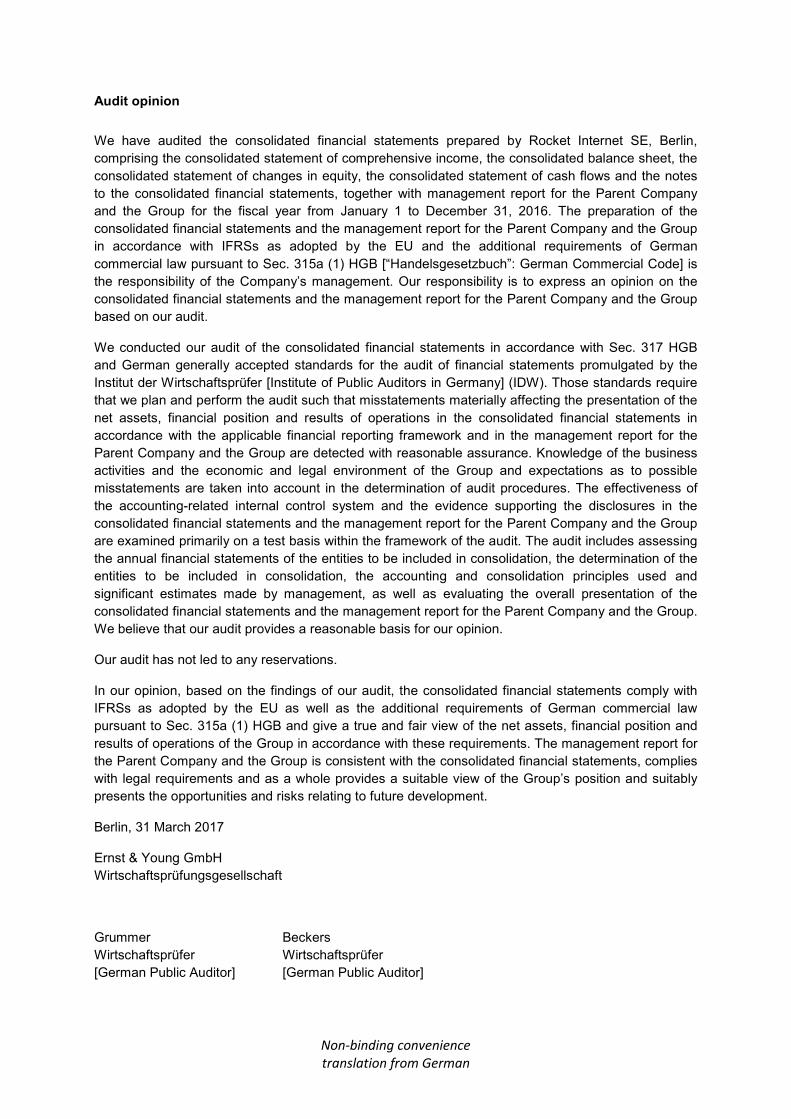
Non-binding convenience
translation from German
Audit opinion
We have audited the consolidated financial statements prepared by Rocket Internet SE, Berlin,
comprising the consolidated statement of comprehensive income, the consolidated balance sheet, the
consolidated statement of changes in equity, the consolidated statement of cash flows and the notes
to the consolidated financial statements, together with management report for the Parent Company
and the Group for the fiscal year from January 1 to December 31, 2016. The preparation of the
consolidated financial statements and the management report for the Parent Company and the Group
in accordance with IFRSs as adopted by the EU and the additional requirements of German
commercial law pursuant to Sec. 315a (1) HGB [“Handelsgesetzbuch”: German Commercial Code] is
the responsibility of the Company’s management. Our responsibility is to express an opinion on the
consolidated financial statements and the management report for the Parent Company and the Group
based on our audit.
We conducted our audit of the consolidated financial statements in accordance with Sec. 317 HGB
and German generally accepted standards for the audit of financial statements promulgated by the
Institut der Wirtschaftsprüfer [Institute of Public Auditors in Germany] (IDW). Those standards require
that we plan and perform the audit such that misstatements materially affecting the presentation of the
net assets, financial position and results of operations in the consolidated financial statements in
accordance with the applicable financial reporting framework and in the management report for the
Parent Company and the Group are detected with reasonable assurance. Knowledge of the business
activities and the economic and legal environment of the Group and expectations as to possible
misstatements are taken into account in the determination of audit procedures. The effectiveness of
the accounting-related internal control system and the evidence supporting the disclosures in the
consolidated financial statements and the management report for the Parent Company and the Group
are examined primarily on a test basis within the framework of the audit. The audit includes assessing
the annual financial statements of the entities to be included in consolidation, the determination of the
entities to be included in consolidation, the accounting and consolidation principles used and
significant estimates made by management, as well as evaluating the overall presentation of the
consolidated financial statements and the management report for the Parent Company and the Group.
We believe that our audit provides a reasonable basis for our opinion.
Our audit has not led to any reservations.
In our opinion, based on the findings of our audit, the consolidated financial statements comply with
IFRSs as adopted by the EU as well as the additional requirements of German commercial law
pursuant to Sec. 315a (1) HGB and give a true and fair view of the net assets, financial position and
results of operations of the Group in accordance with these requirements. The management report for
the Parent Company and the Group is consistent with the consolidated financial statements, complies
with legal requirements and as a whole provides a suitable view of the Group’s position and suitably
presents the opportunities and risks relating to future development.
Berlin, 31 March 2017
Ernst & Young GmbH
Wirtschaftsprüfungsgesellschaft
Grummer Beckers
Wirtschaftsprüfer Wirtschaftsprüfer
[German Public Auditor] [German Public Auditor]
Responsibility Statement
pursuant to Sec. 297 (2) HGB
2016
Rocket Internet SE, Berlin
Non-binding convenience translation from German
Responsibility Statement pursuant to Sec. 297 (2) HGB
To the best of our knowledge, and in accordance with the applicable reporting principles, the consolidated financial statements give a true and fair view of the assets, liabilities, financial position and profit or loss of the Group, and Combined Management Report (Management Report for the Group and Parent Company) includes a fair review of the development and performance of the business and the position of the Group, together with a description of the principal opportunities and risks associated with the expected development of the Group. Berlin, March 31, 2017 The Management Board Oliver Samwer Peter Kimpel Alexander Kudlich
About Rocket Internet
Rocket Internet builds and invests in Internet companies that take proven online business models to new, fast-growing markets. Rocket Internet focuses on four industry sectors of online and mobile retail and services that make up a significant share of consumer spending: Food & Groceries, Fashion, General Merchandise and Home & Living. Its network of companies operates in a large number of countries around the world with more than 36,000 employees. Rocket Internet SE is listed on the Frankfurt Stock Exchange (ISIN DE000A12UKK6, RKET). For further information please visit www.rocket-internet.com. About this Document
This document is a part of the Annual Financial Report pursuant to Sec. 50 of the Exchange Rules for the Frankfurt Stock Exchange. Annual Financial Report was prepared on March 31, 2017 (editorial deadline) and submitted for publication on April 25, 2017 (publication date).
Disclaimer and other Notes
This document contains forward-looking statements. These statements are based on the current views, expectations and assumptions of the management of Rocket Internet SE and involve known and unknown risks and uncertainties that could cause actual results, performance or events to differ materially from those expressed or implied in such statements. Actual results, performance or events may differ materially from those described in such statements due to, among other things, changes in the general economic and competitive environment, risks associated with capital markets, currency exchange rate fluctuations and competition from other companies, changes in international and national laws and regulations, in particular with respect to tax laws and regulations, and other factors. Rocket Internet SE assumes no obligation to update any information or forward-looking statement contained herein, save for any information required to be disclosed by law. The financial figures have been prepared in conformity with International Financial Reporting Standards (IFRS) as adopted by the EU. Furthermore, this document includes in IFRS not clearly defined additional financial measures that are or may be so-called non-GAAP financial measures. These supplemental financial measures should not be viewed in isolation or as alternatives to assess the position of the Group as presented in accordance with IFRS. Other enterprises that report or describe similarly titled financial measures may calculate them differently. Due to rounding, numbers presented throughout this and other documents may not add up precisely to the totals provided and percentages may not precisely reflect the absolute figures.
This document is a translation of the original German version and is intended to be used for informational purposes only. While every effort has been made to ensure the accuracy and completeness of the translation, please note that the German original is binding.
Imprint
Rocket Internet SE
Charlottenstraße 4
10969 Berlin
Germany
Phone: +49 30 300 13 18-00
Fax: +49 30 300 13 18-99
www.rocket-internet.com
© 2017 by Rocket Internet SE