Embed Size (px)
DESCRIPTION
15s. .5s. 6-15 s. 6-15 s. …. …. …. 1000Hz. 1200Hz. Constant Fixation. Controls: N=41, p
Citation preview
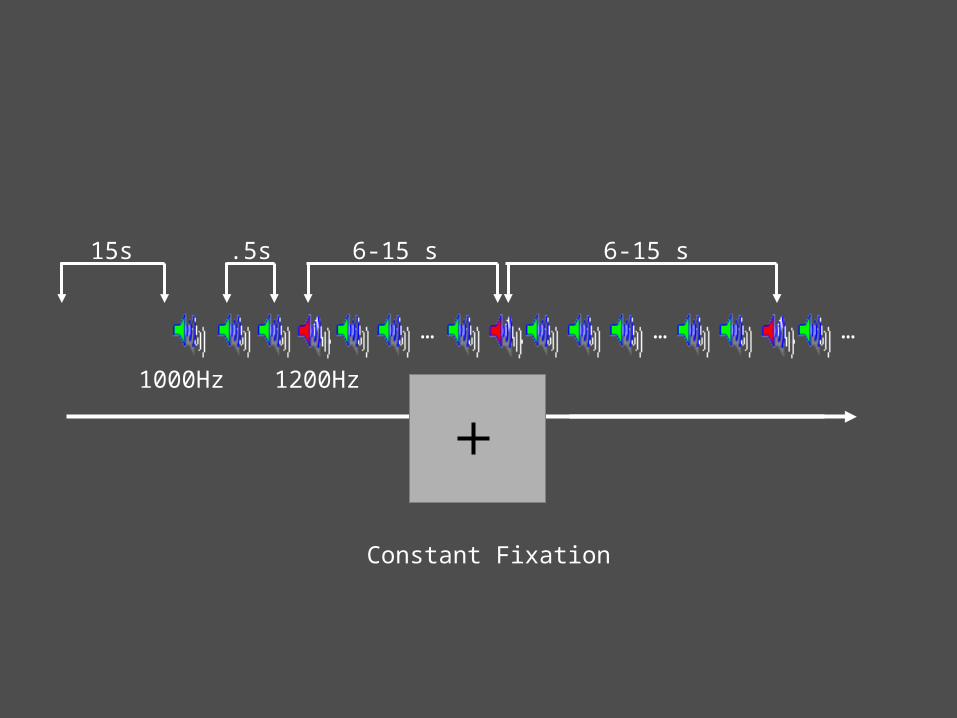
Constant Fixation
15s
………
.5s 6-15 s 6-15 s
1000Hz 1200Hz
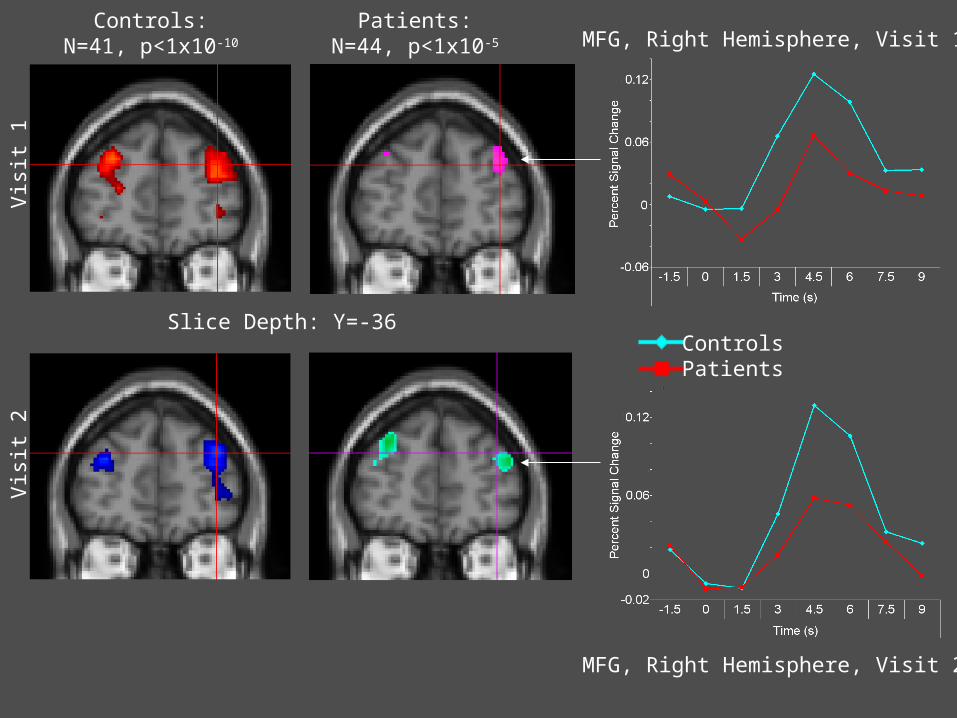
MFG, Right Hemisphere, Visit 1
MFG, Right Hemisphere, Visit 2
Slice Depth: Y=-36ControlsPatients
Vis
it 1
Vis
it 2
Controls:N=41, p<1x10⁻¹⁰
Patients:N=44, p<1x10⁻⁵
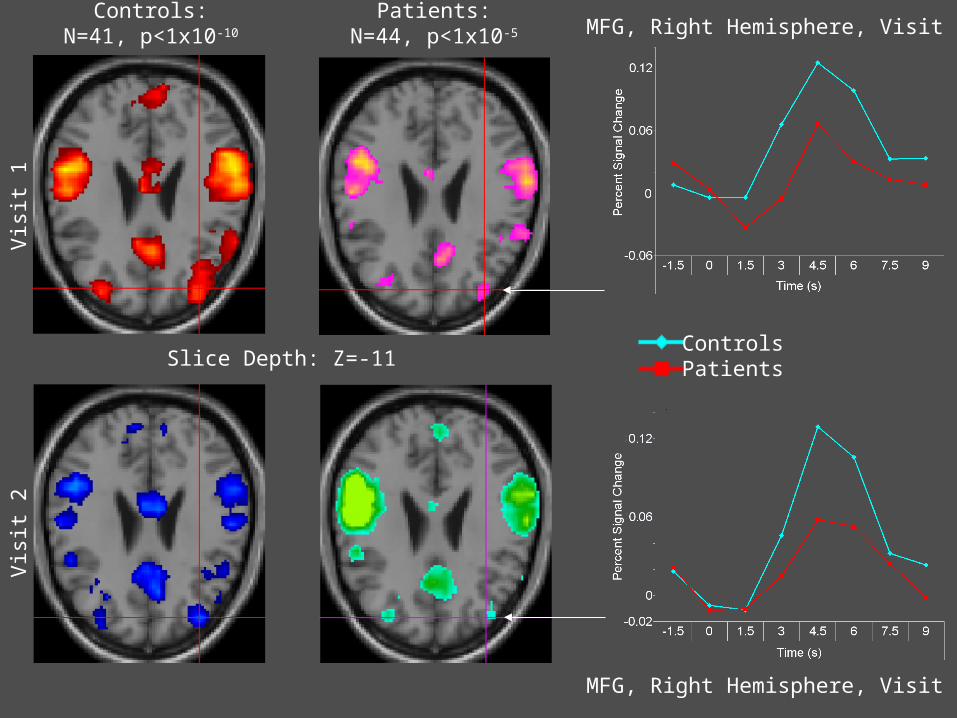
Slice Depth: Z=-11ControlsPatients
Controls:N=41, p<1x10⁻¹⁰
Patients:N=44, p<1x10⁻⁵
Vis
it 1
Vis
it 2
MFG, Right Hemisphere, Visit 1
MFG, Right Hemisphere, Visit 2
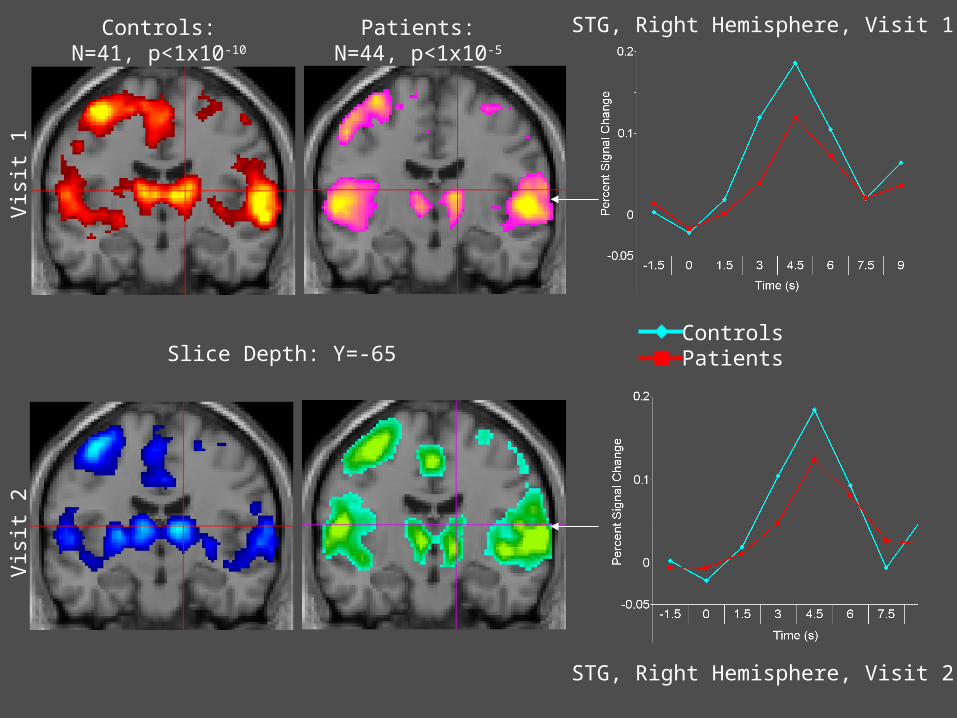
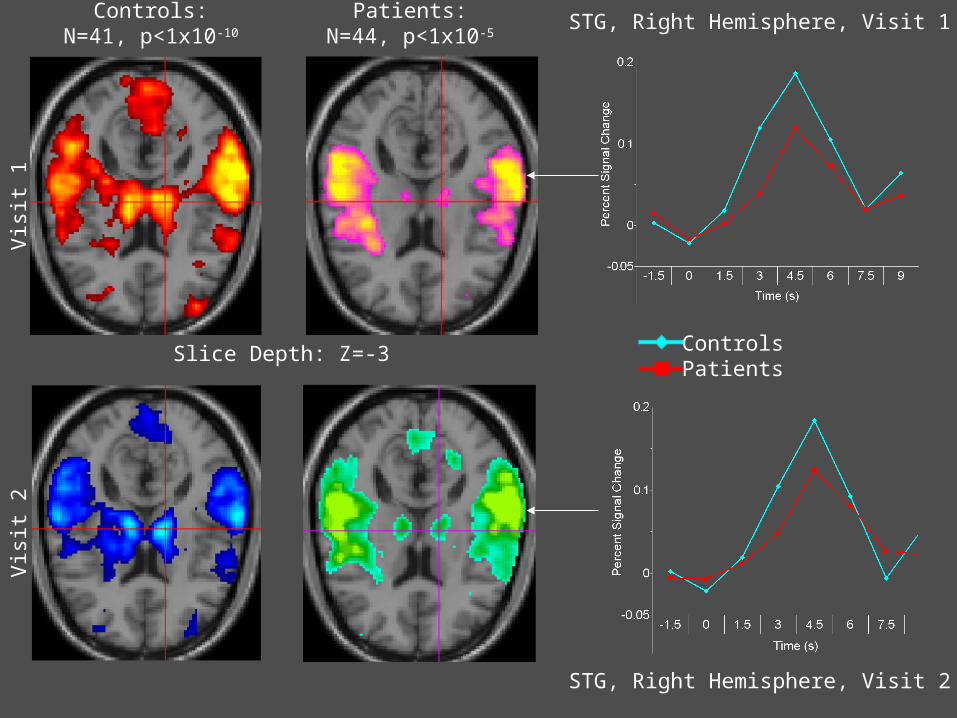
STG, Right Hemisphere, Visit 1
STG, Right Hemisphere, Visit 2
Controls:N=41, p<1x10⁻¹⁰
Patients:N=44, p<1x10⁻⁵
ControlsPatients
Vis
it 1
Vis
it 2
Slice Depth: Y=-65
STG, Right Hemisphere, Visit 1
STG, Right Hemisphere, Visit 2
Controls:N=41, p<1x10⁻¹⁰
Patients:N=44, p<1x10⁻⁵
ControlsPatients
Vis
it 1
Vis
it 2
Slice Depth: Z=-3
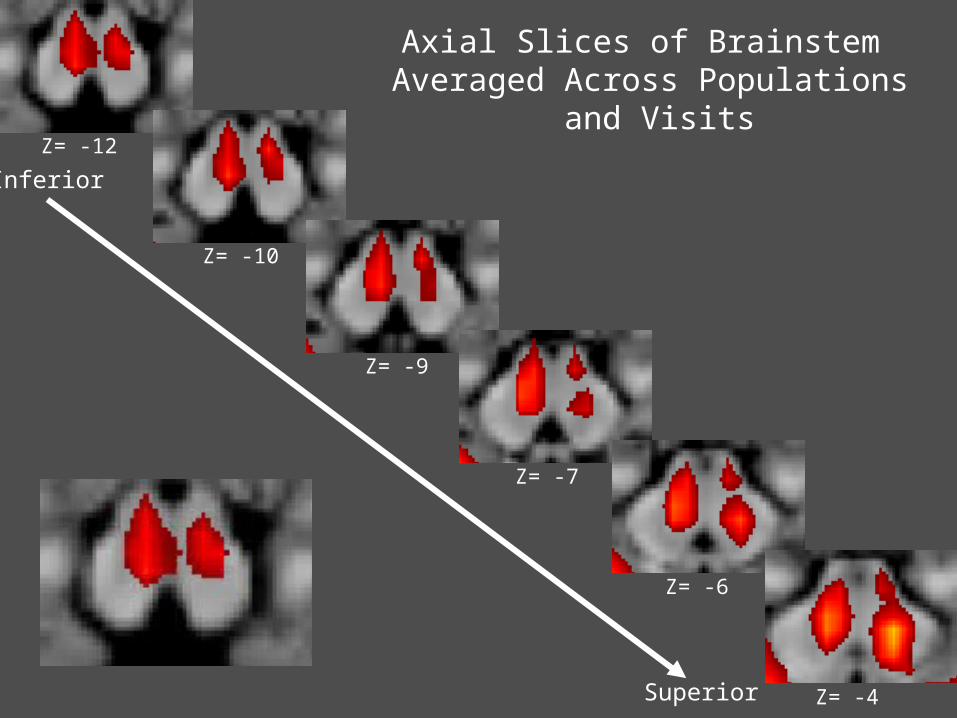
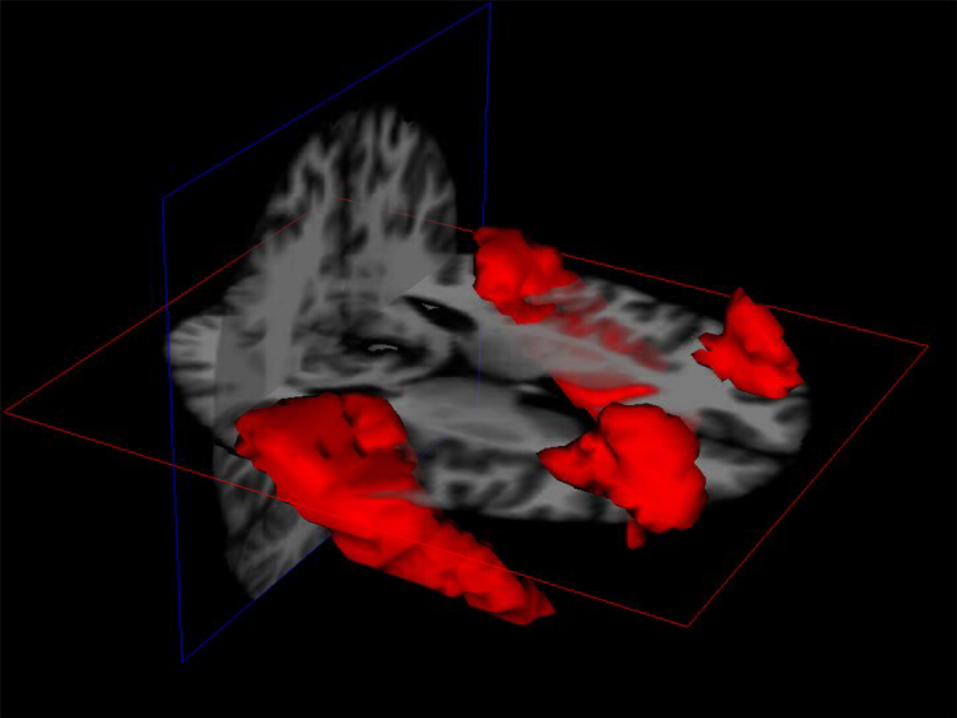
Axial Slices of Brainstem Averaged Across Populations
and Visits
Inferior
Superior
Z= -12
Z= -10
Z= -9
Z= -7
Z= -6
Z= -4
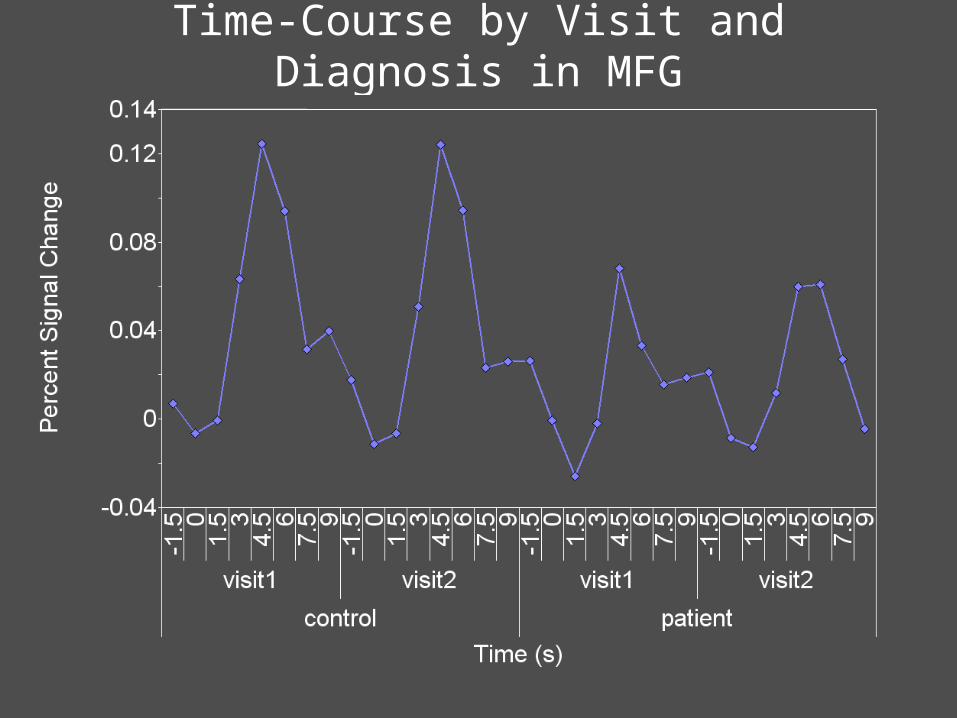
Time-Course by Visit and Diagnosis in MFG
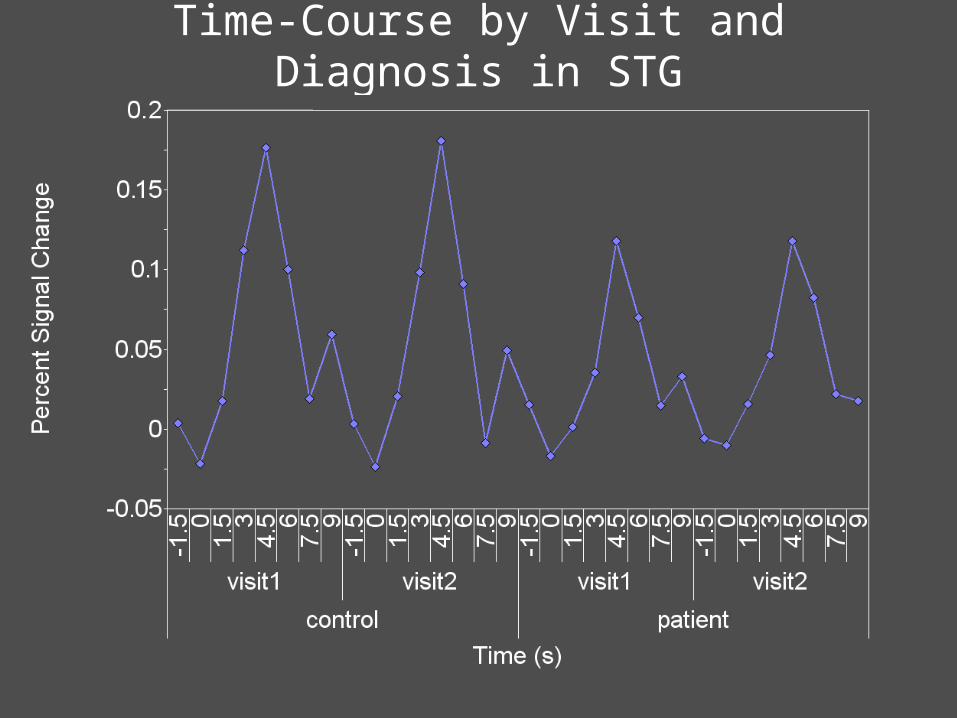
Time-Course by Visit and Diagnosis in STG
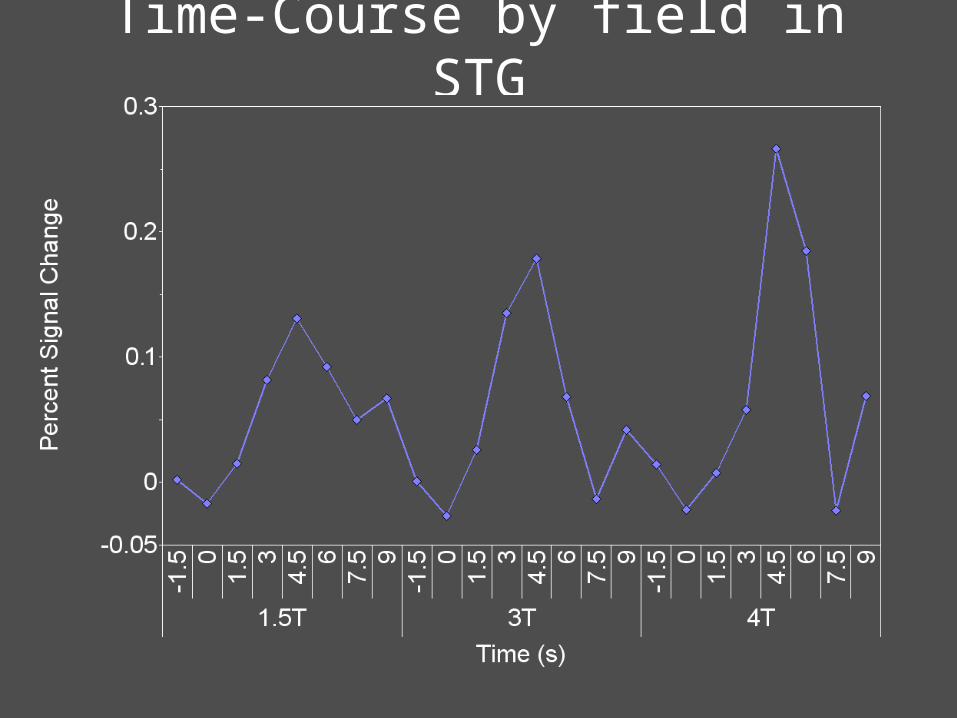
Time-Course by field in STG
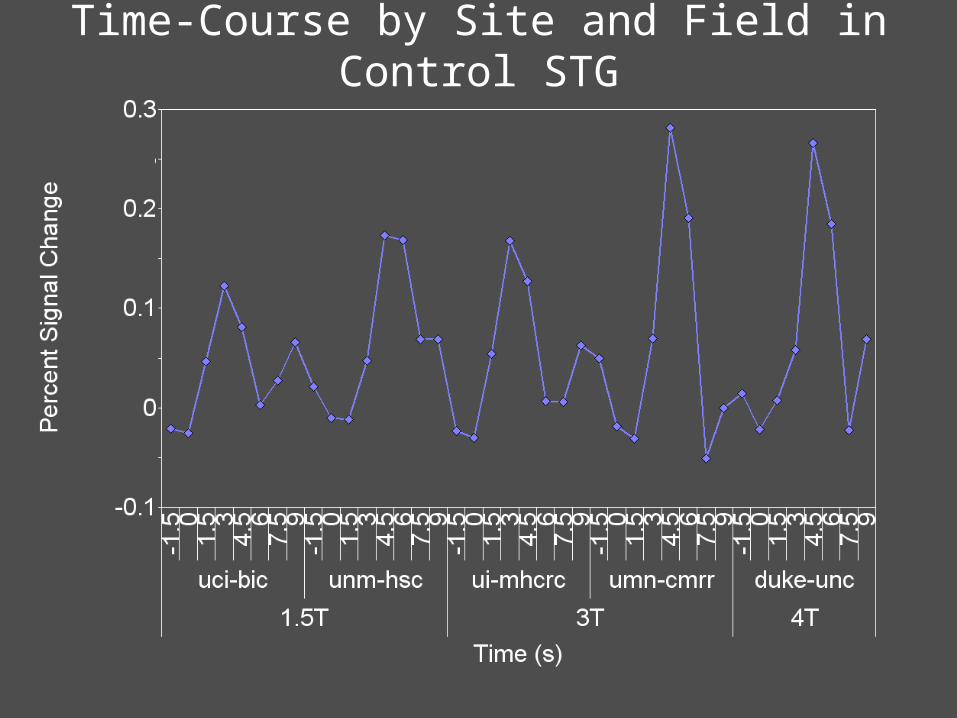
Time-Course by Site and Field in Control STG
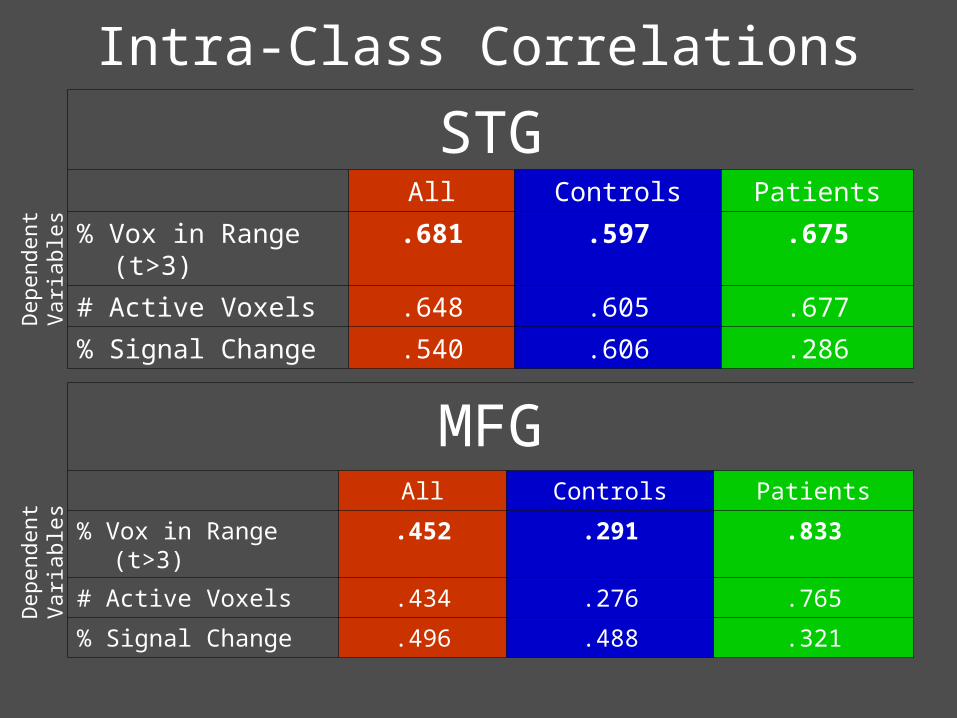
STGAll Controls Patients
% Vox in Range (t>3) .681 .597 .675
# Active Voxels .648 .605 .677
% Signal Change .540 .606 .286
MFGAll Controls Patients
% Vox in Range (t>3) .452 .291 .833
# Active Voxels .434 .276 .765
% Signal Change .496 .488 .321
Intra-Class CorrelationsD
epen
dent
Var
iabl
esD
epen
dent
Var
iabl
es
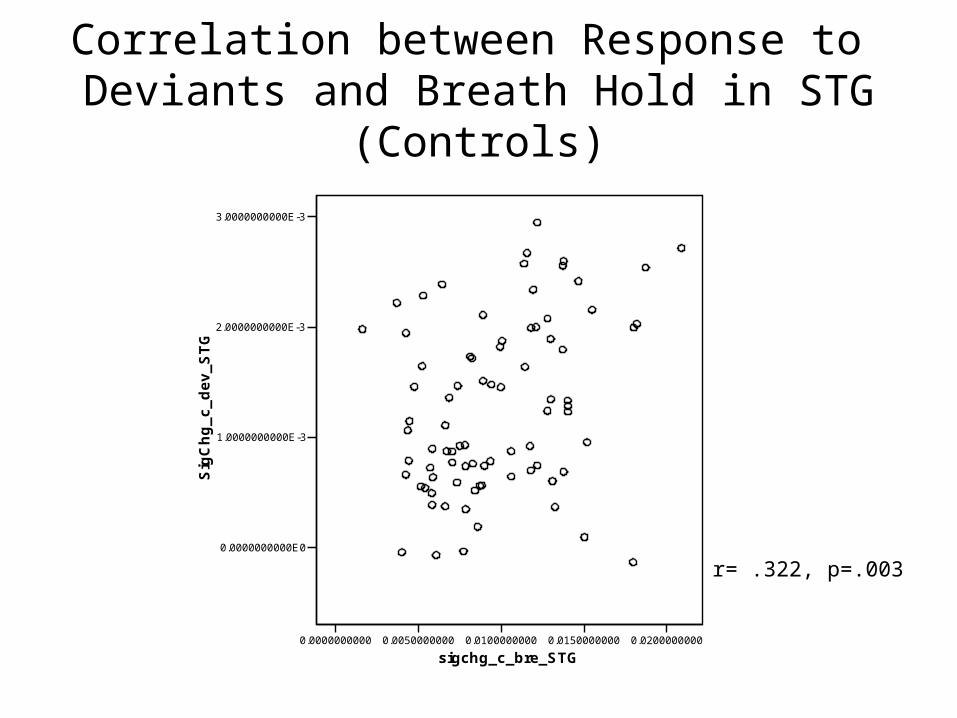
Correlation between Response to Deviants and Breath Hold in STG
(Controls)
0.0000000000 0.0050000000 0.0100000000 0.0150000000 0.0200000000
sigchg_c_bre_STG
0.0000000000E0
1.0000000000E-3
2.0000000000E-3
3.0000000000E-3S
igC
hg
_c
_d
ev
_S
TG
r= .322, p=.003
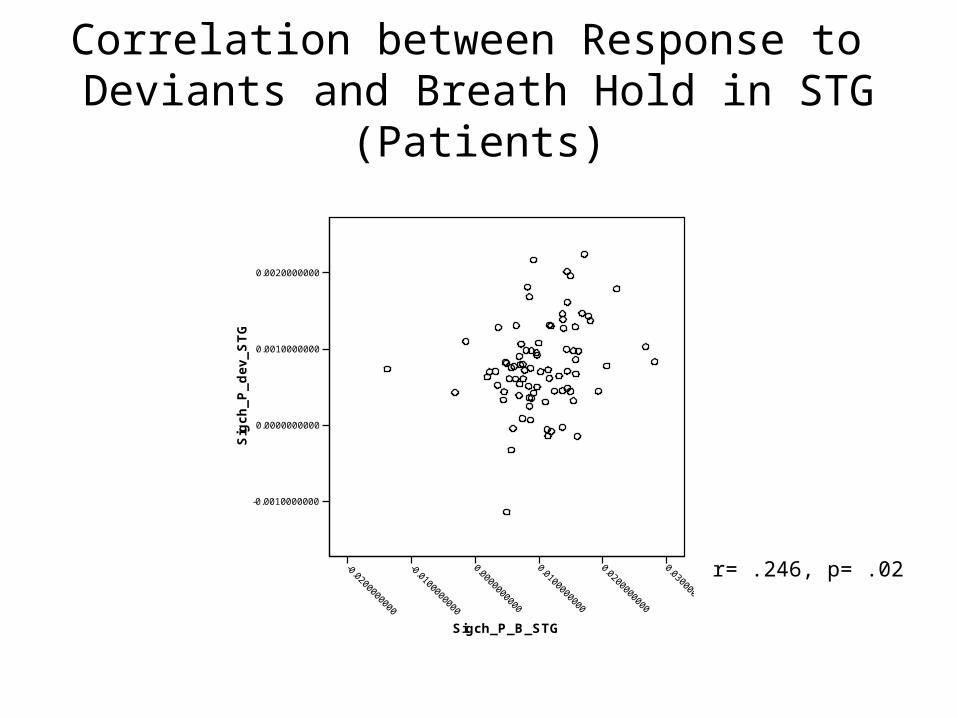
Correlation between Response to Deviants and Breath Hold in STG
(Patients)
-0.0200000000
-0.0100000000
0.0000000000
0.0100000000
0.0200000000
0.0300000000
Sigch_P_B_STG
-0.0010000000
0.0000000000
0.0010000000
0.0020000000
Sig
ch
_P
_d
ev
_S
TG
r= .246, p= .02
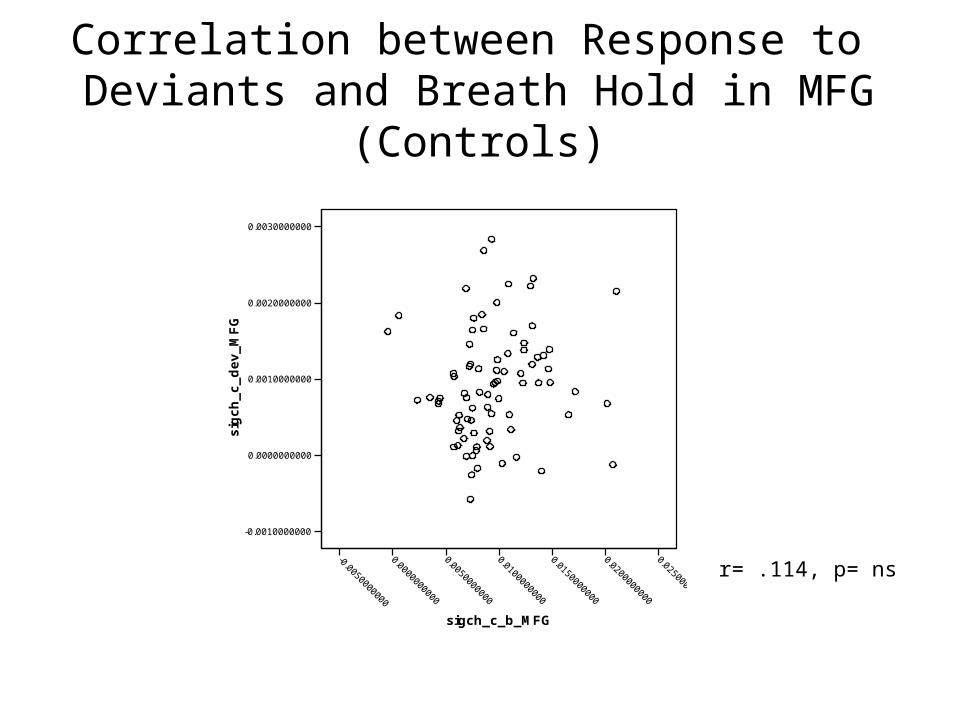
Correlation between Response to Deviants and Breath Hold in MFG
(Controls)
-0.0050000000
0.0000000000
0.0050000000
0.0100000000
0.0150000000
0.0200000000
0.0250000000
sigch_c_b_MFG
-0.0010000000
0.0000000000
0.0010000000
0.0020000000
0.0030000000s
igc
h_
c_
de
v_
MF
G
r= .114, p= ns
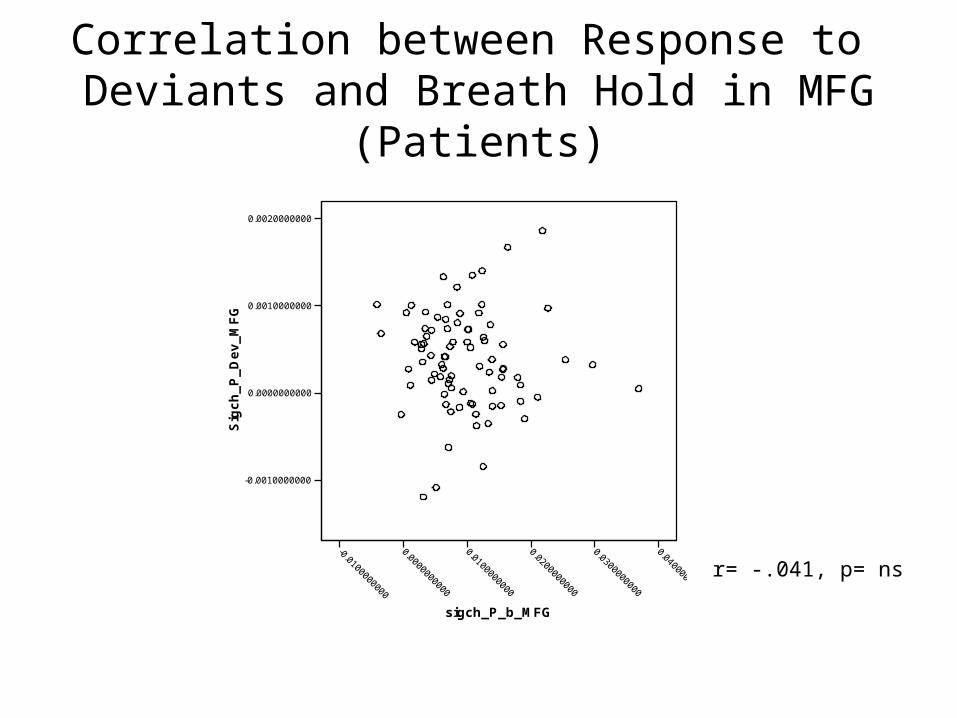
Correlation between Response to Deviants and Breath Hold in MFG
(Patients)
-0.0100000000
0.0000000000
0.0100000000
0.0200000000
0.0300000000
0.0400000000
sigch_P_b_MFG
-0.0010000000
0.0000000000
0.0010000000
0.0020000000
Sig
ch
_P
_D
ev
_M
FG
r= -.041, p= ns
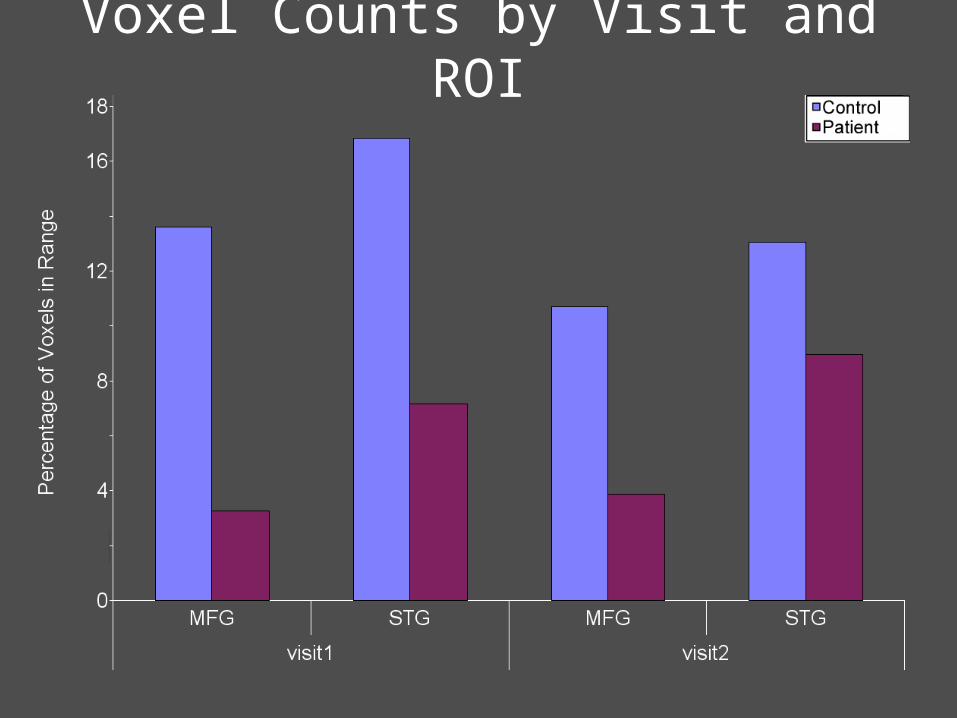
Voxel Counts by Visit and ROI
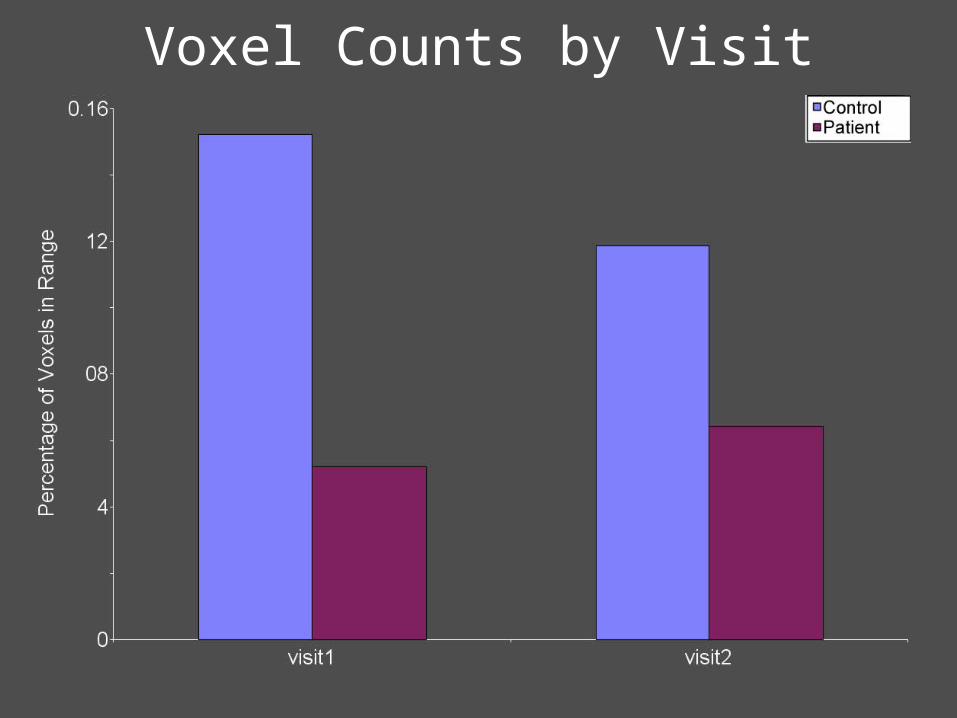
Voxel Counts by Visit
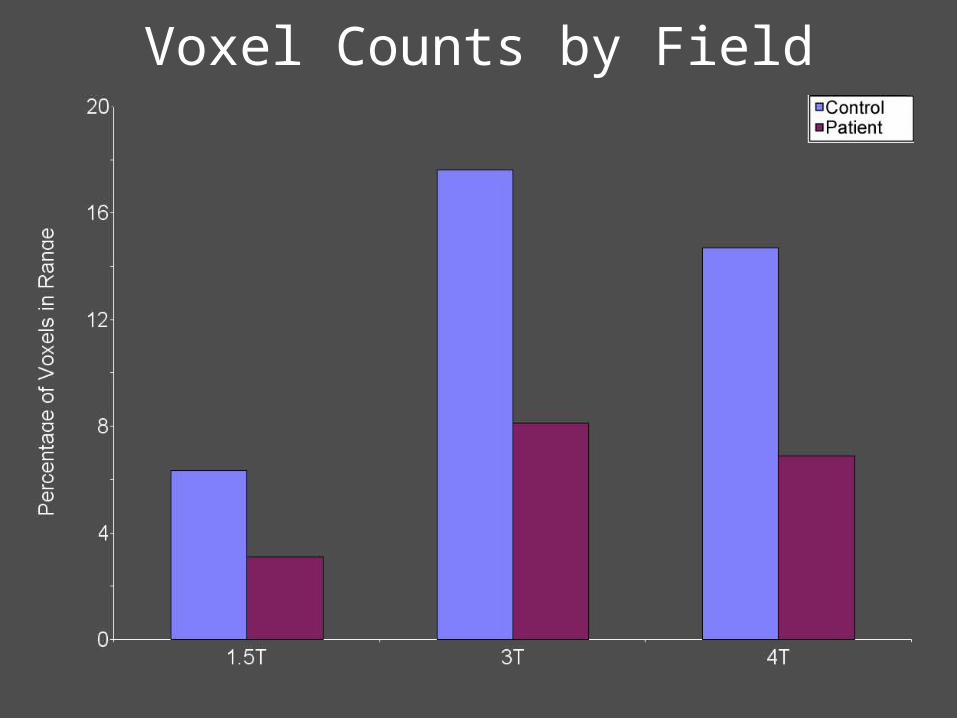
Voxel Counts by Field
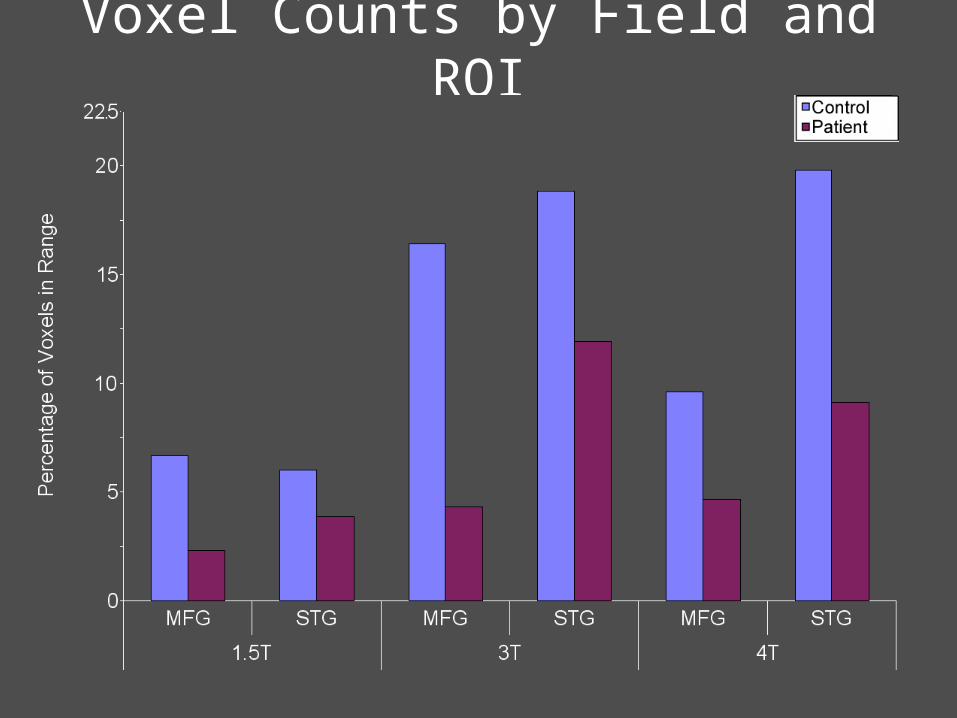
Voxel Counts by Field and ROI
Cog WG
Auditory Oddball
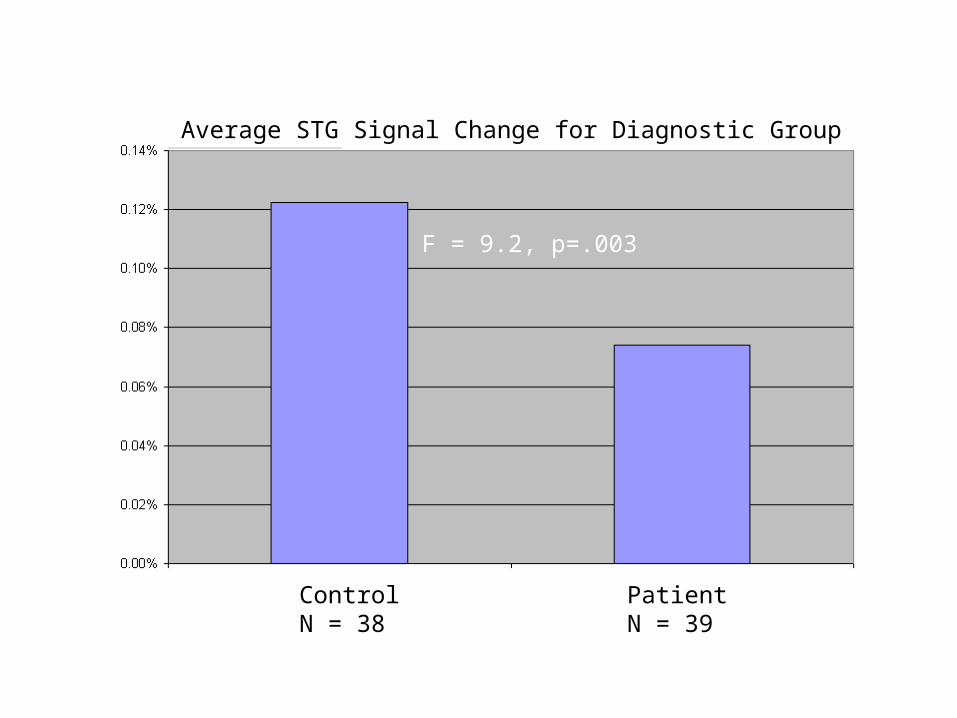
Average STG Signal Change for Diagnostic Group
ControlN = 38
PatientN = 39
F = 9.2, p=.003
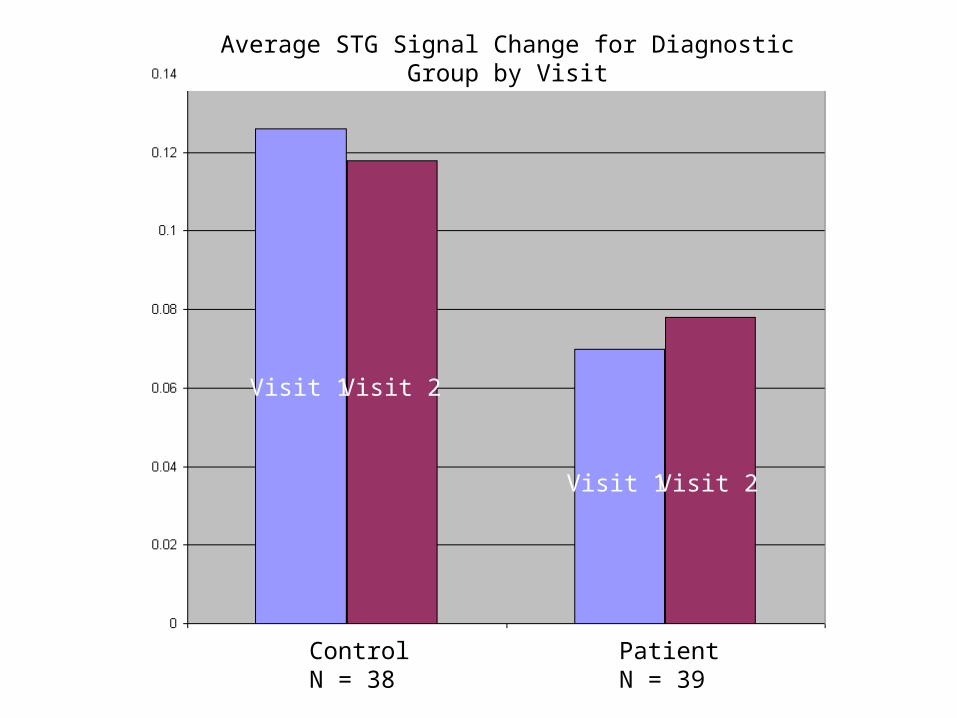
Average STG Signal Change for Diagnostic Group by Visit
ControlN = 38
PatientN = 39
Visit 1 Visit 2
Visit 1 Visit 2
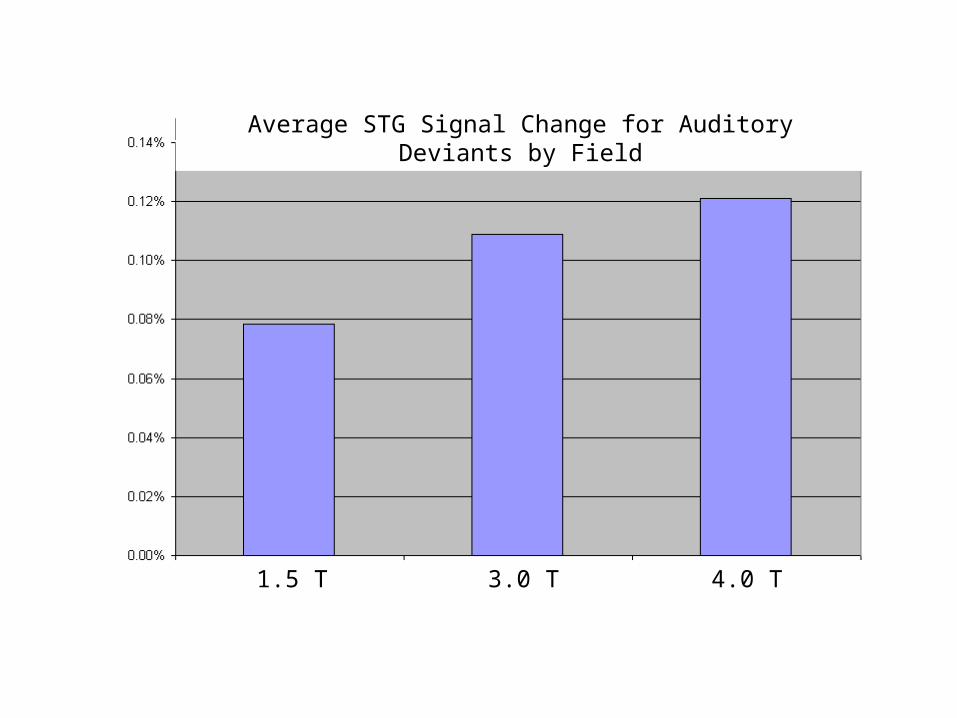
Average STG Signal Change for Auditory Deviants by Field
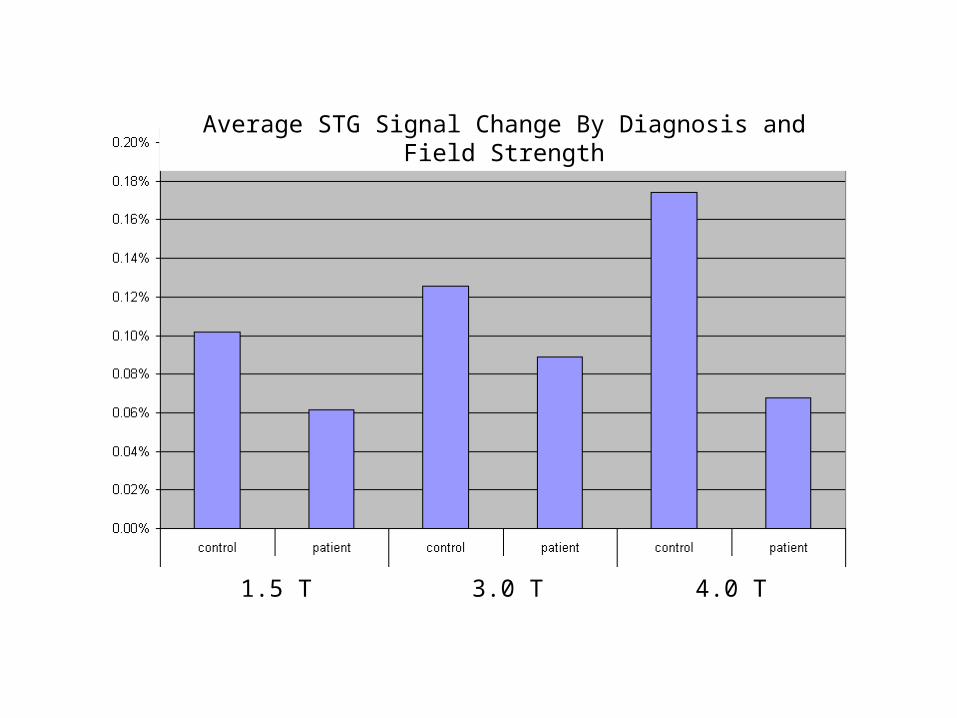
1.5 T 3.0 T 4.0 T
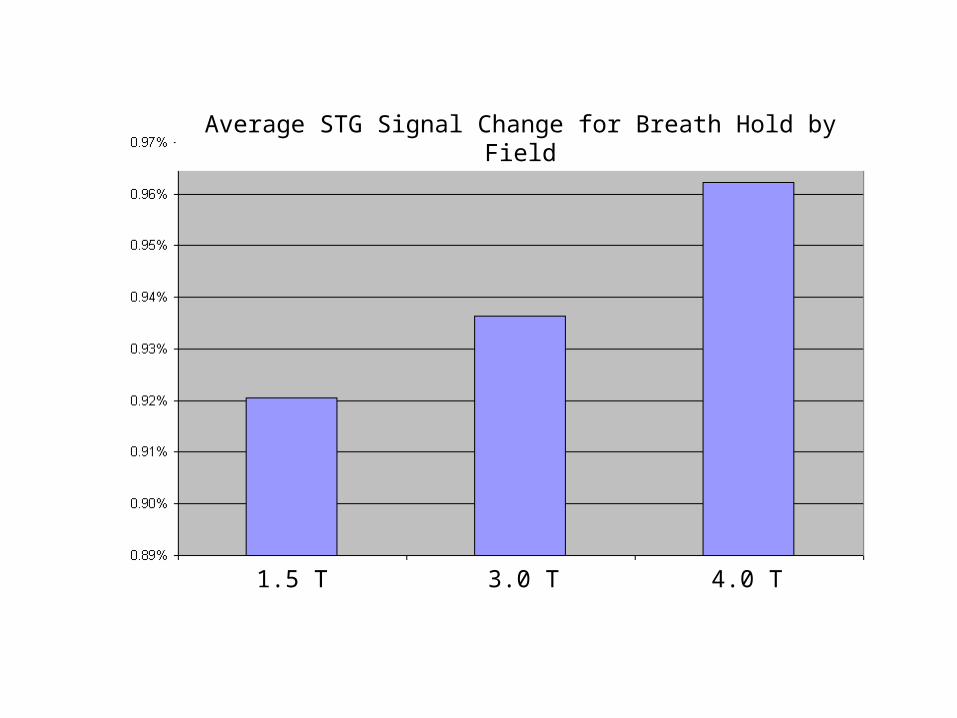
Average STG Signal Change for Breath Hold by Field
1.5 T 3.0 T 4.0 T
1.5 T 3.0 T 4.0 T
Average STG Signal Change By Diagnosis and Field Strength
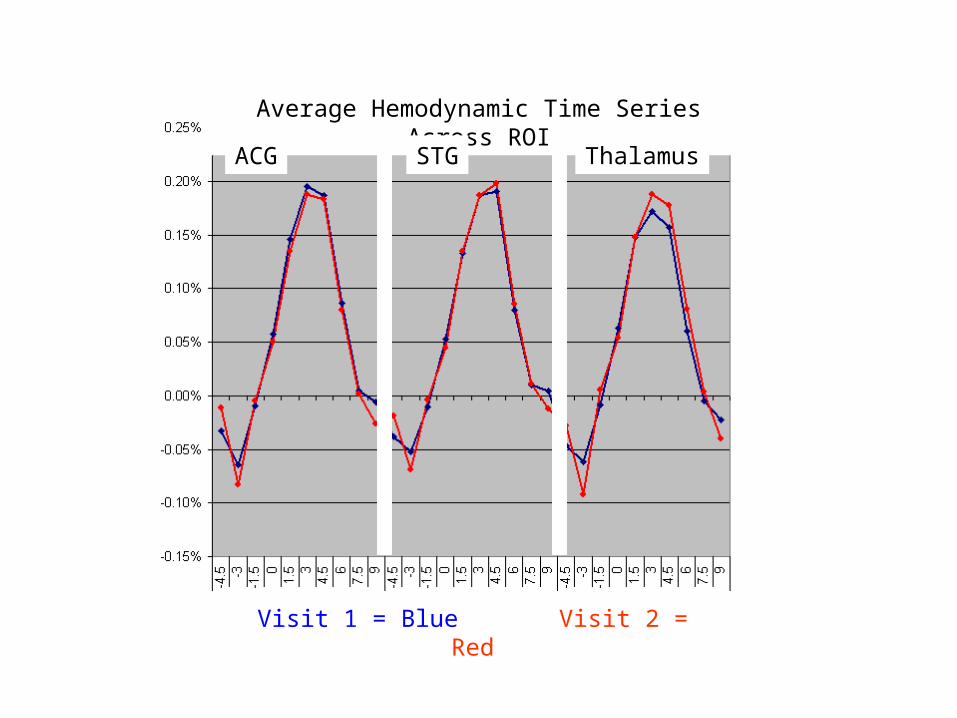
Average Hemodynamic Time Series Across ROI
ACG STG Thalamus
Visit 1 = Blue Visit 2 = Red
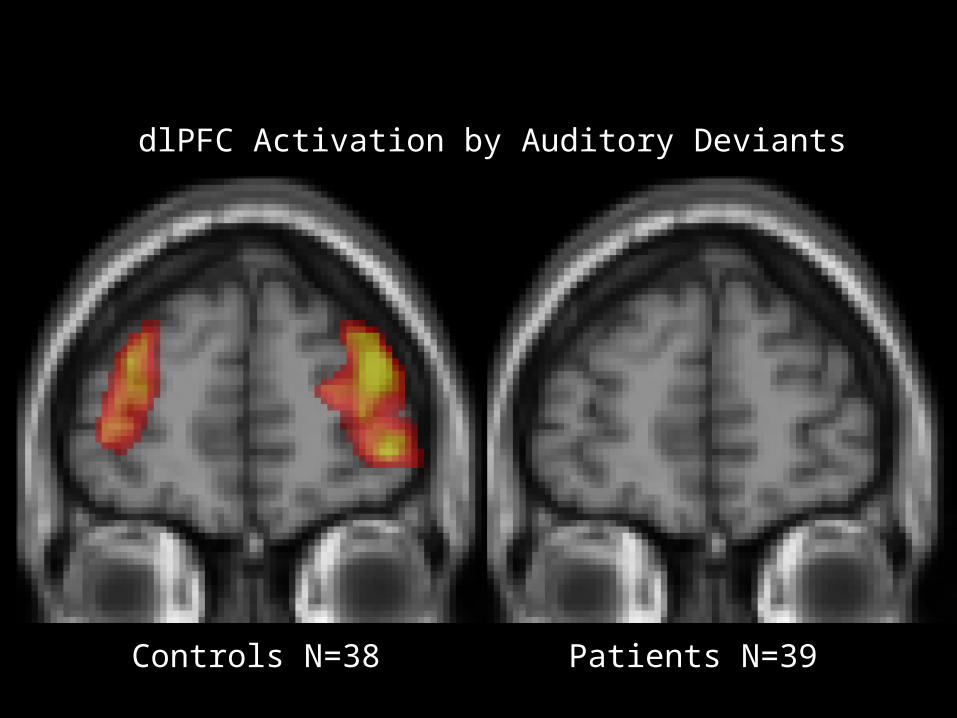
dlPFC Activation by Auditory Deviants
Controls N=38 Patients N=39
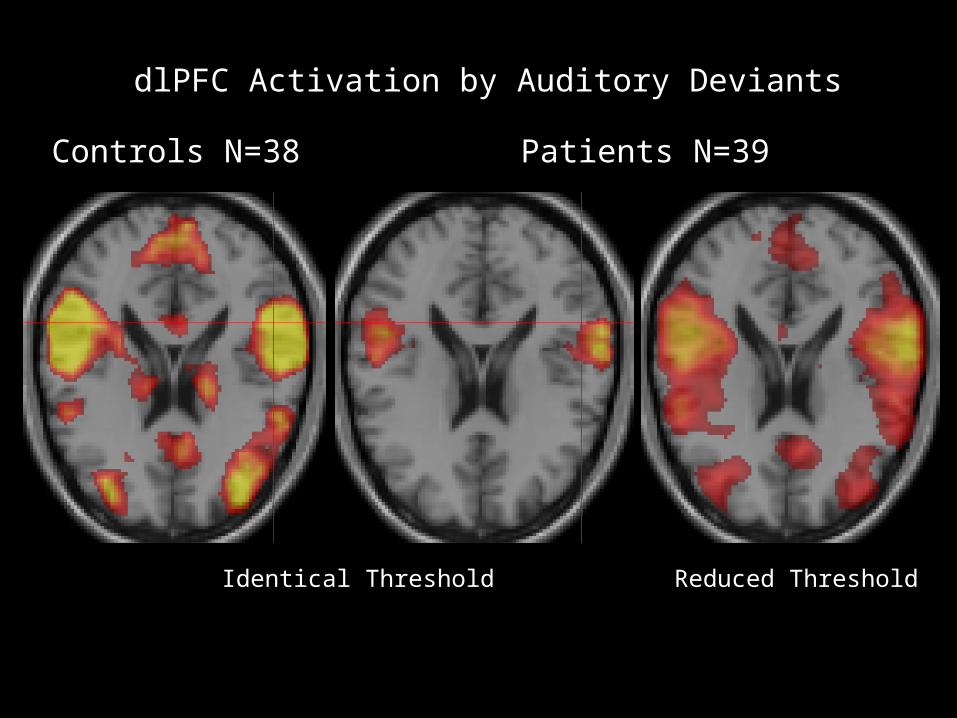
dlPFC Activation by Auditory Deviants
Controls N=38 Patients N=39
Reduced ThresholdIdentical Threshold
Cog WG
Dual Sternberg MMN Tasks
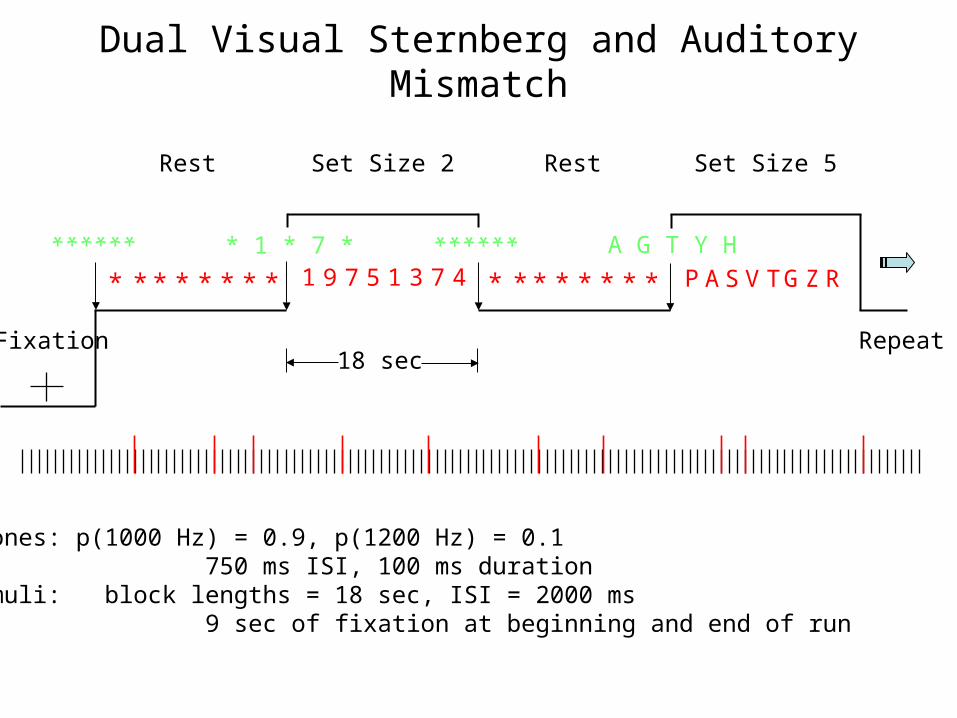
1 9 7 5 1 3 7 4 P A S V TGZ R
Rest Rest Set Size 5Set Size 2
******
* * * * * * * *
* 1 * 7 *
******
* * * * * * * *
A G T Y H
Fixation18 sec
Auditory tones: p(1000 Hz) = 0.9, p(1200 Hz) = 0.1 750 ms ISI, 100 ms durationVisual stimuli: block lengths = 18 sec, ISI = 2000 ms 9 sec of fixation at beginning and end of run
Repeat
Dual Visual Sternberg and Auditory Mismatch
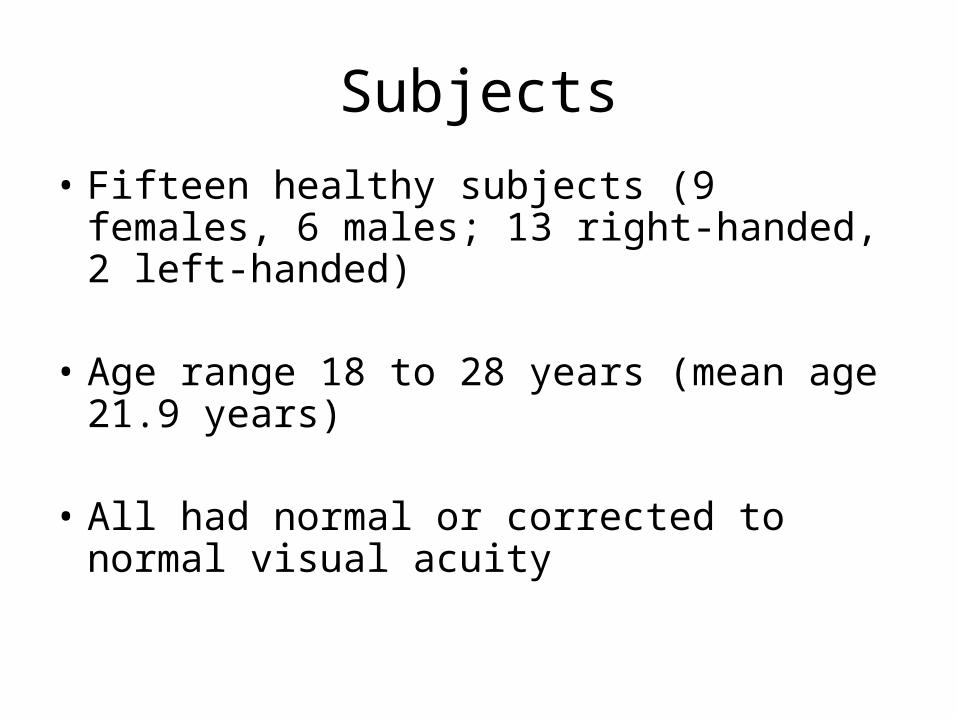
Subjects
• Fifteen healthy subjects (9 females, 6 males; 13 right-handed, 2 left-handed)
• Age range 18 to 28 years (mean age 21.9 years)
• All had normal or corrected to normal visual acuity
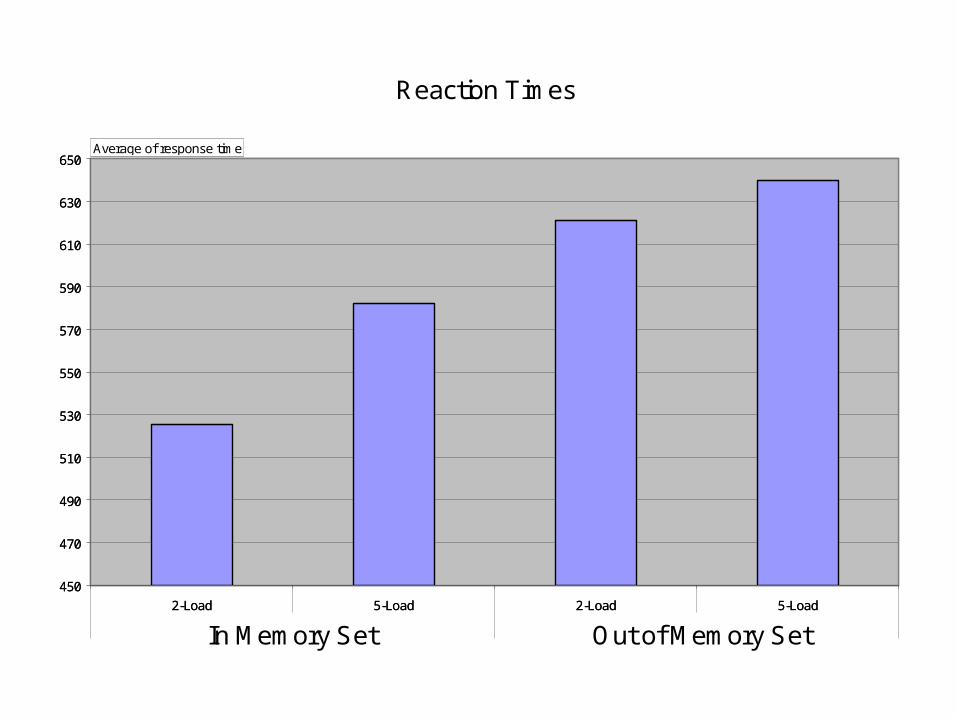
Total
450
470
490
510
530
550
570
590
610
630
650
2-Load 5-Load 2-Load 5-Load
2 4
Average of response time
In Memory Set Out of Memory Set
Reaction TimesTotal
450
470
490
510
530
550
570
590
610
630
650
2-Load 5-Load 2-Load 5-Load
2 4
Average of response time
In Memory Set Out of Memory Set
Reaction Times
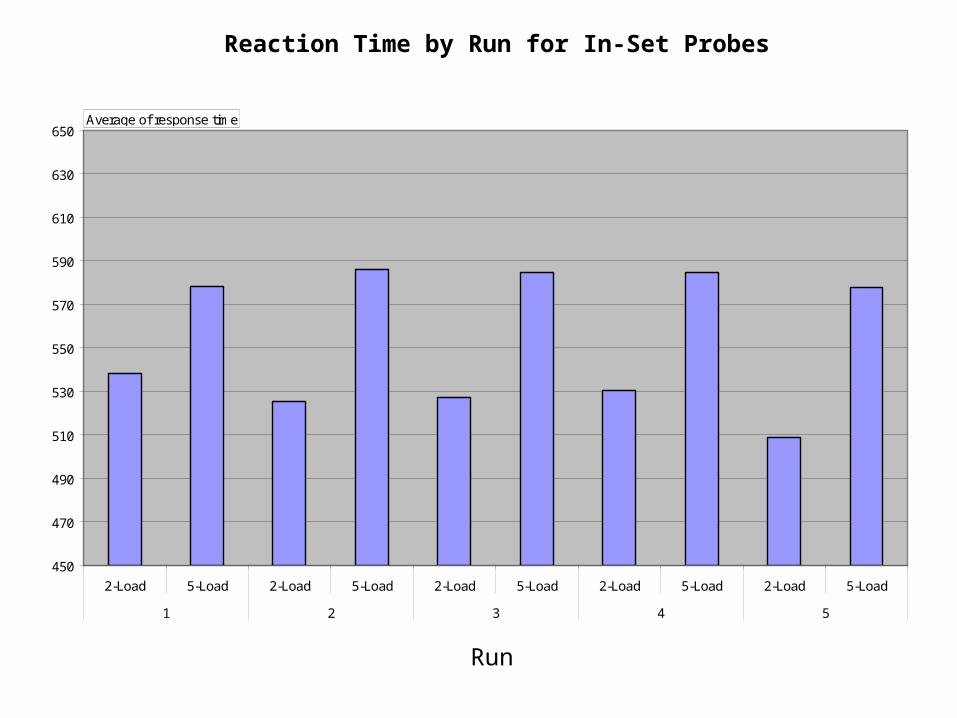
Reaction Time by Run for In-Set Probes
Run
450
470
490
510
530
550
570
590
610
630
650
2-Load 5-Load 2-Load 5-Load 2-Load 5-Load 2-Load 5-Load 2-Load 5-Load
1 2 3 4 5
Average of response time
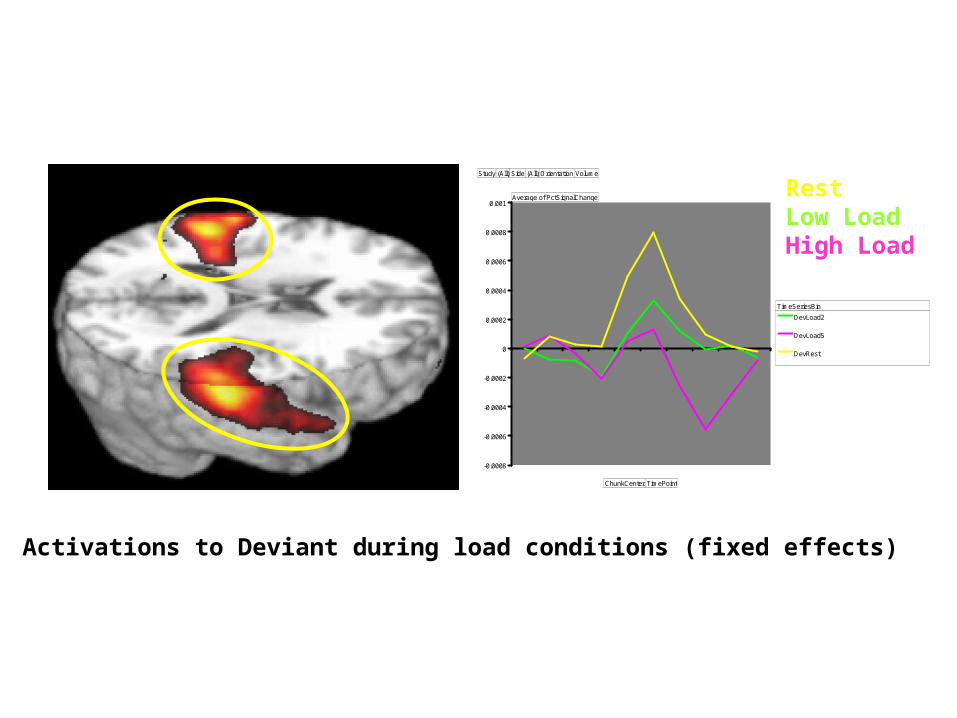
-0.0008
-0.0006
-0.0004
-0.0002
0
0.0002
0.0004
0.0006
0.0008
0.001
DevLoad2
DevLoad5
DevRest
Study (All) Side (All) Orientation Volume
Average of PctSignalChange
ChunkCenter TimePoint
TimeSeriesBin
RestLow LoadHigh Load
Activations to Deviant during load conditions (fixed effects)
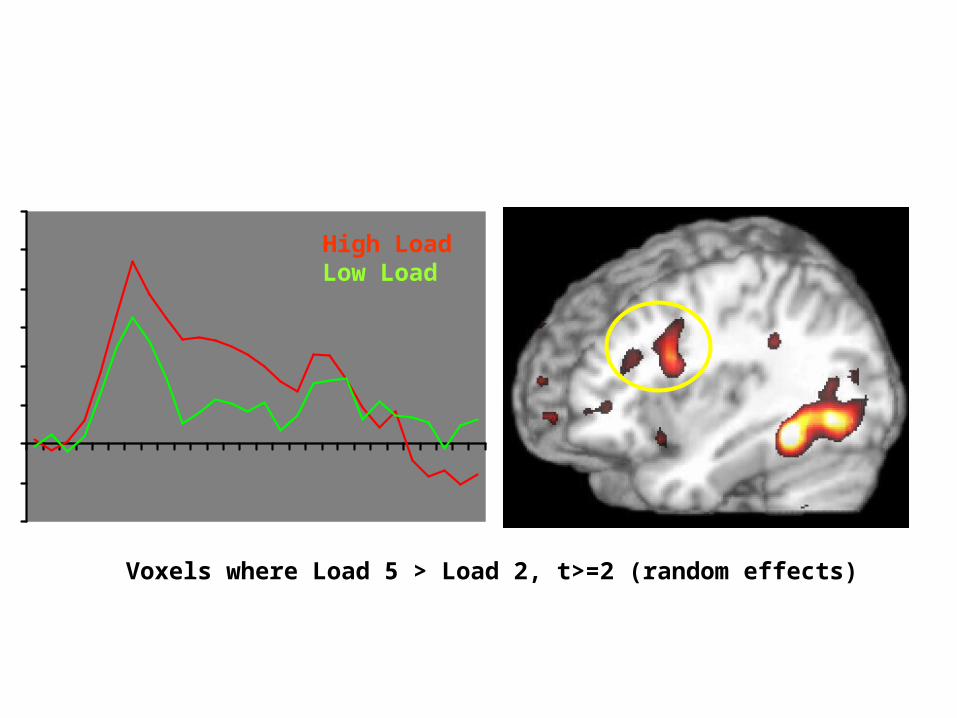
High LoadLow Load
Voxels where Load 5 > Load 2, t>=2 (random effects)
Cog WG
Emotional Oddball Task
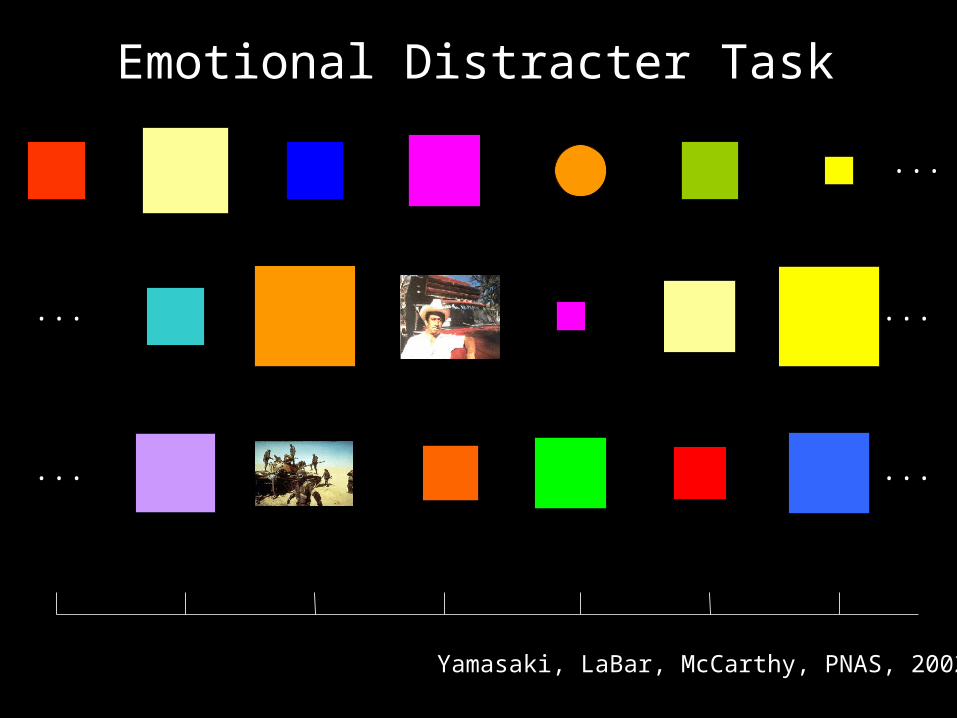
Yamasaki, LaBar, McCarthy, PNAS, 2002
...
......
......
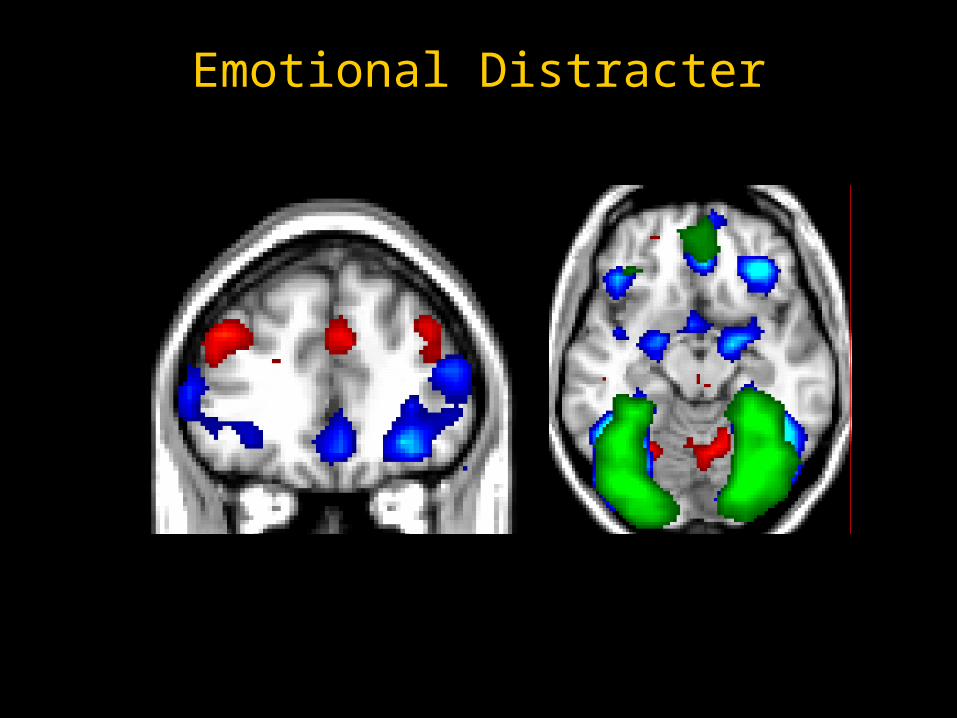
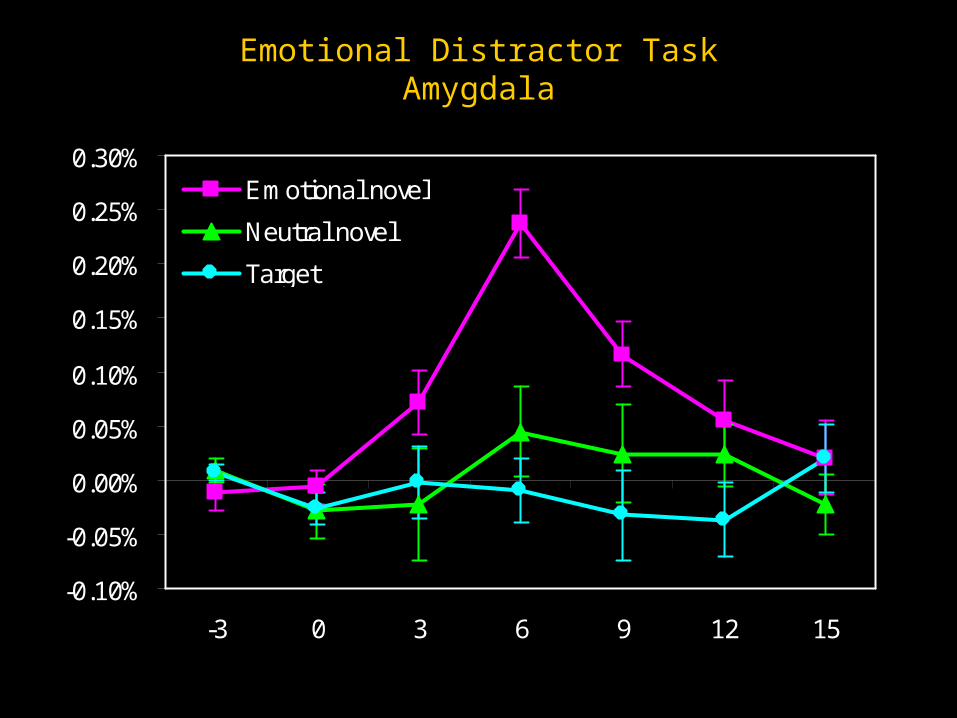
Emotional Distracter Task
Emotional Distracter
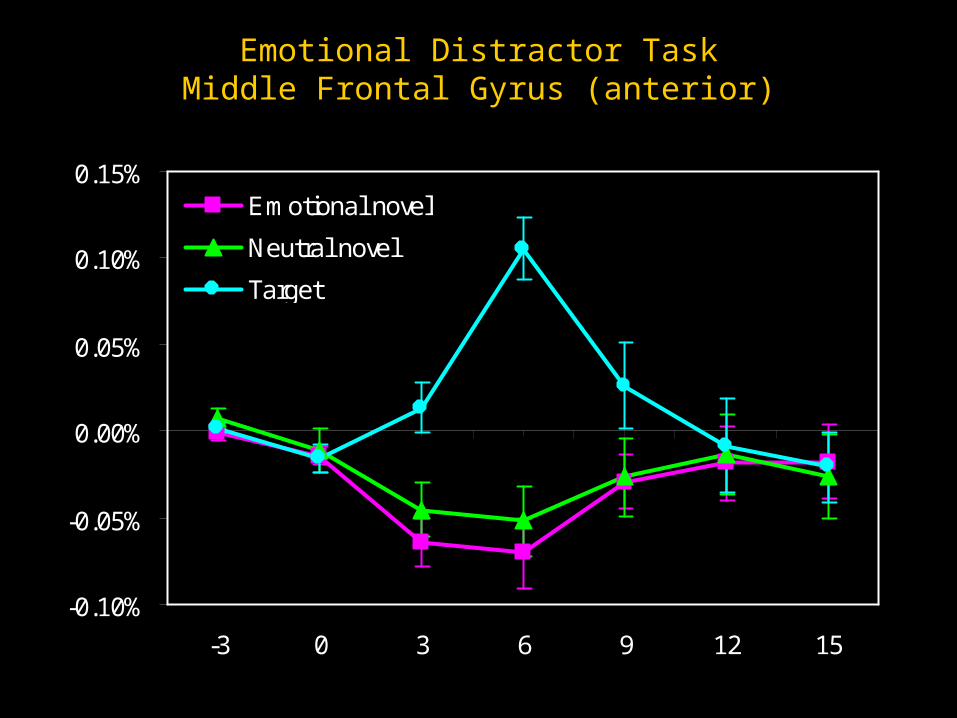
Emotional Distractor TaskMiddle Frontal Gyrus (anterior)
-0.10%
-0.05%
0.00%
0.05%
0.10%
0.15%
-3 0 3 6 9 12 15
Emotional novel
Neutral novel
Target
-0.10%
-0.05%
0.00%
0.05%
0.10%
0.15%
0.20%
0.25%
0.30%
-3 0 3 6 9 12 15
Emotional novel
Neutral novel
Target
Emotional Distractor TaskAmygdala
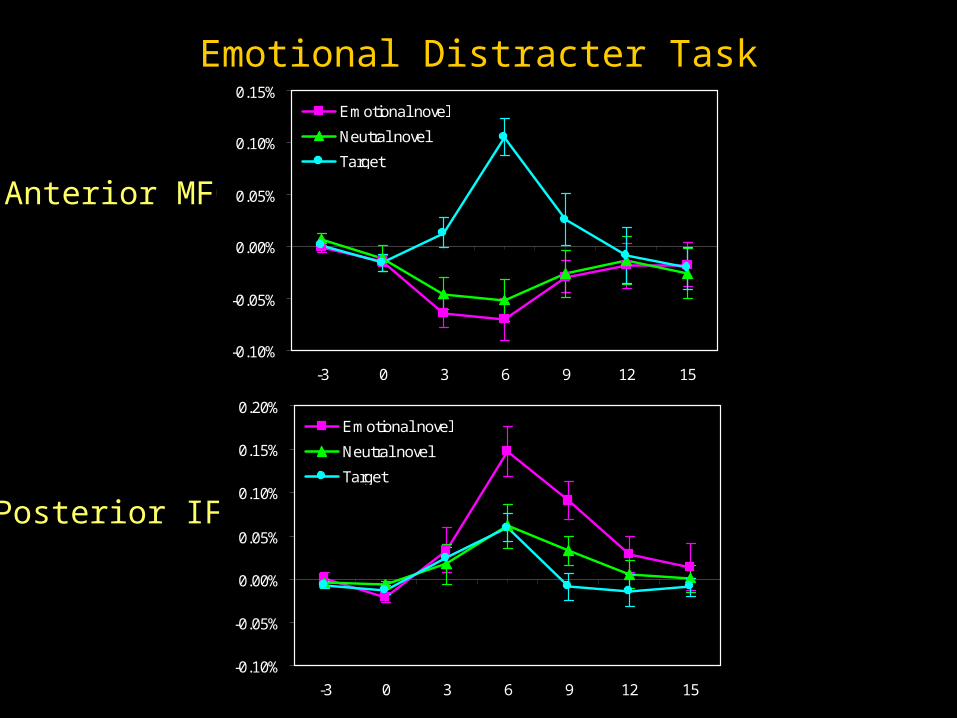
Anterior MFG
Posterior IFG
-0.10%
-0.05%
0.00%
0.05%
0.10%
0.15%
-3 0 3 6 9 12 15
Emotional novel
Neutral novel
Target
-0.10%
-0.05%
0.00%
0.05%
0.10%
0.15%
0.20%
-3 0 3 6 9 12 15
Emotional novel
Neutral novel
Target
Emotional Distracter Task
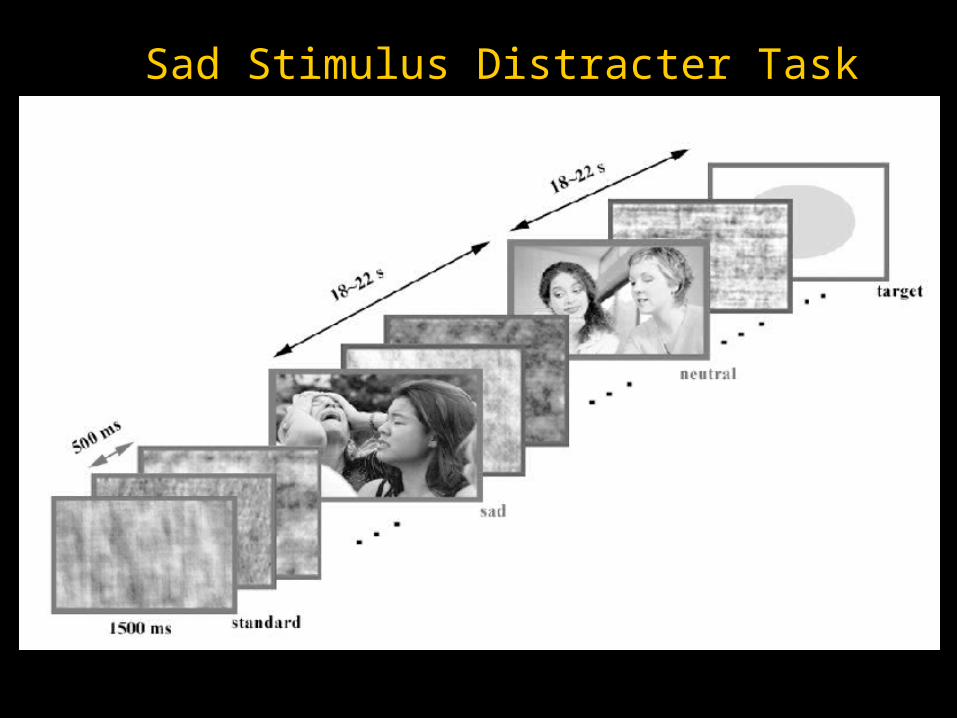
Sad Stimulus Distracter Task
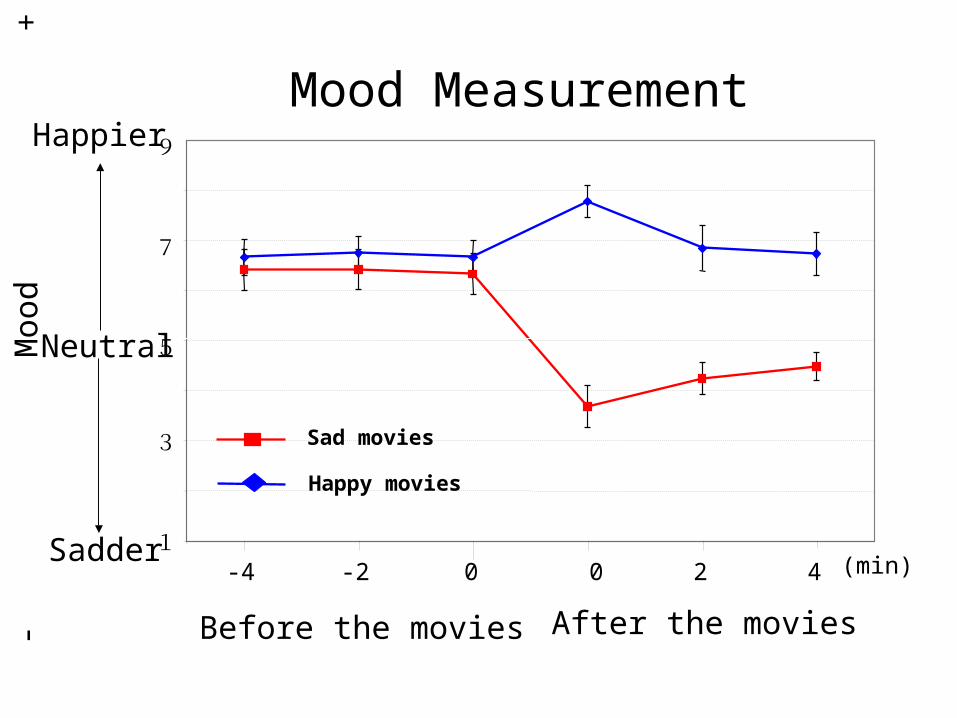
Mood Measurement
1
3
5
7
9
-4 -2 0 0 2 4
Before the movies
Happy movies
Sad movies
After the movies
(min)
-
M
ood
+
Sadder
Happier
Neutral
Ave
rage
of
% S
igna
l Cha
nge
to
sad
stim
uli
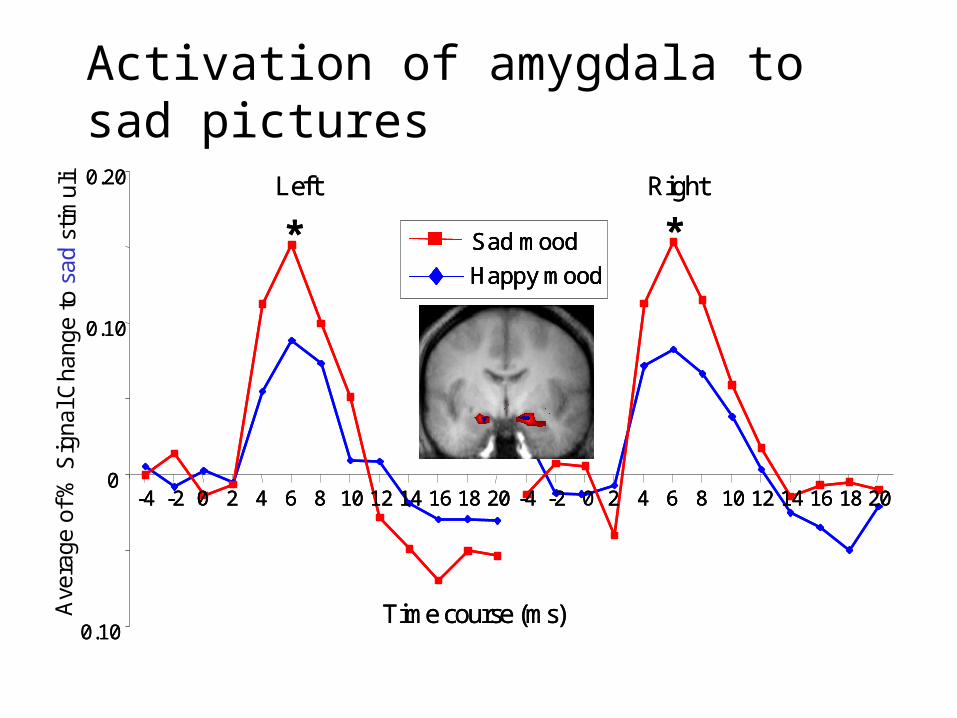
0.10
0
0.10
0.20
0-4 -2 0 2 4 6 8 10 12 14 16 18 20 -4 -2 2 4 6 8 10 12 14 16 18 20
Happy mood
Sad mood* *Left Right
Time course (ms)0.10
0
0.10
0.20
0-4 -2 0 2 4 6 8 10 12 14 16 18 20 -4 -2 2 4 6 8 10 12 14 16 18 20-4 -2 0 2 4 6 8 10 12 14 16 18 20 -4 -2 2 4 6 8 10 12 14 16 18 20
Happy mood
Sad mood
Happy mood
Sad mood* *Left Right
Time course (ms)
Activation of amygdala to sad pictures
-0.1
0
0.25
-4 -2 0 2 4 6 8 10 12 14 16 18 20 -4 -2 0 2 4 6 8 10 12 14 16 18 20-4 -2 0 2 4 6 8 10 12 14 16 18 20 -4 -2 0 2 4 6 8 10 12 14 16 18 20Ave
rage
of
% s
igna
l cha
nge
Time course (s)
Happy Mood Sad Mood*
Neutral stimuli
Sad stimuli
Neutral stimuli
Sad stimuli
Activation of amygdala
Goals for Cog Challenge Group
Evaluate Phase II SIRP design Did the inclusion of three working memory loads differentiate
schizophrenic and control samples?
Evaluate Phase II Auditory Oddball task Did temporal lobe activation differentiate schizophrenic and
control samples?
Cross-task comparisons for Phase II data Were similar patterns of dorsolateral PFC activation
observed in both SIRP and Oddball tasks?
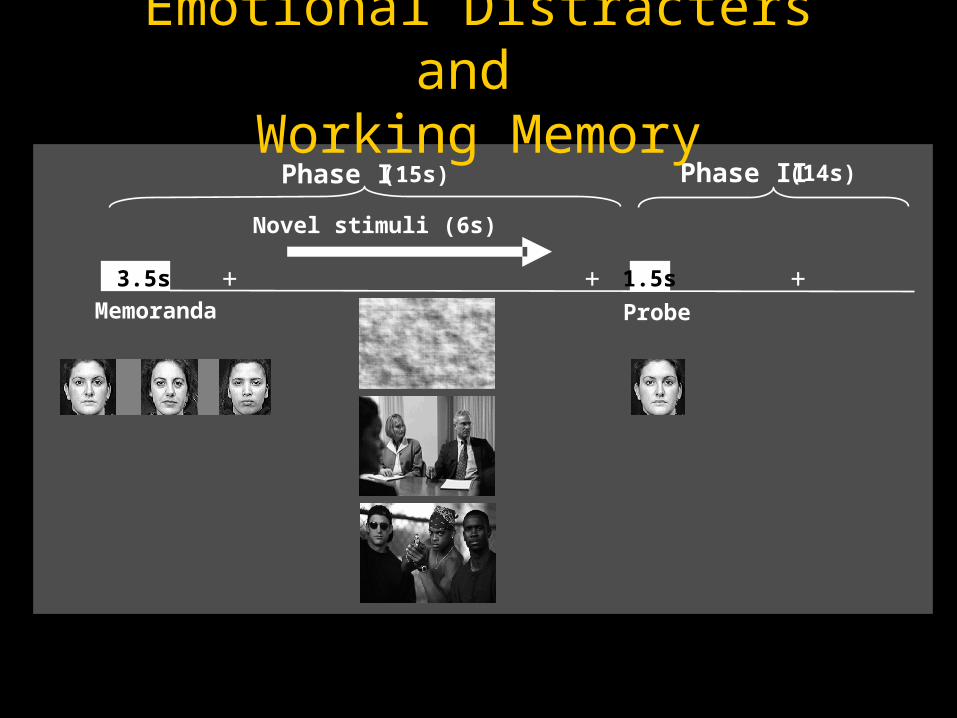
Phase I (15s) Phase II (14s)
Memoranda Probe
3.5s 1.5s
Novel stimuli (6s)
+ ++
Emotional Distracters and Working Memory
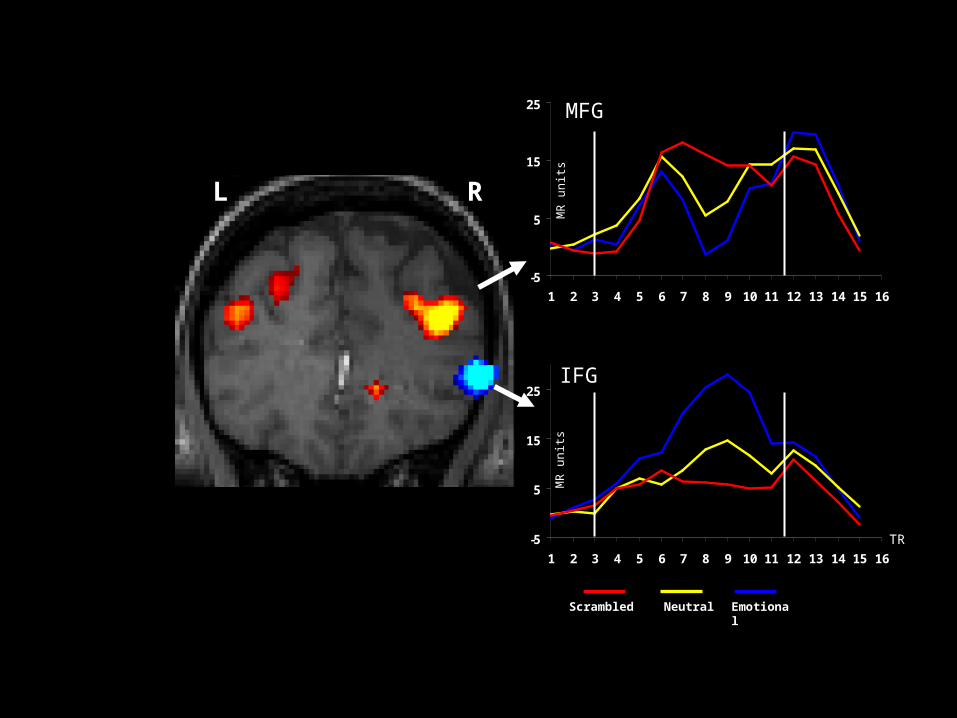
-5
5
15
25
1 2 3 4 5 6 7 8 9 10 11 12 13 14 15 16
-5
5
15
25
1 2 3 4 5 6 7 8 9 10 11 12 13 14 15 16
RL
IFG
TR
MR
un
itsM
R u
nits
Scrambled Neutral Emotional
MFG