Embed Size (px)
Citation preview
Supporting Information
Construction of an Autonomously Concatenated
Hybridization Chain Reaction for Signal
Amplification and Intracellular Imaging
Jie Wei,a Xue Gong,a Qing Wang,a Min Pan,a Xiaoqing Liu,a Jing Liu,b Fan Xia,c Fuan Wang*,a
a Key Laboratory of Analytical Chemistry for Biology and Medicine (Ministry of Education),
College of Chemistry and Molecular Sciences, Wuhan University, Wuhan 430072, P. R. China
b Department of Gastroenterology, Zhongnan Hospital of Wuhan University, Hubei Clinical
Center & Key Lab of Intestinal & Colorectal Diseases, Wuhan 430072, P. R. China
c Department of Urology, Union Hospital, Tongji Medical College, Hubei Key Laboratory of
Bioinorganic Chemistry & Materia Medica, School of Chemistry and Chemical Engineering and
Department of Epidemiology and Biostatistics, School of Public Health, Tongji Medical
College, Huazhong University of Science and Technology (HUST), Wuhan 430074, P. R. China
* To whom correspondence should be addressed. E-mail: [email protected].
Electronic Supplementary Material (ESI) for Chemical Science.This journal is © The Royal Society of Chemistry 2017
Supporting Information
S-1
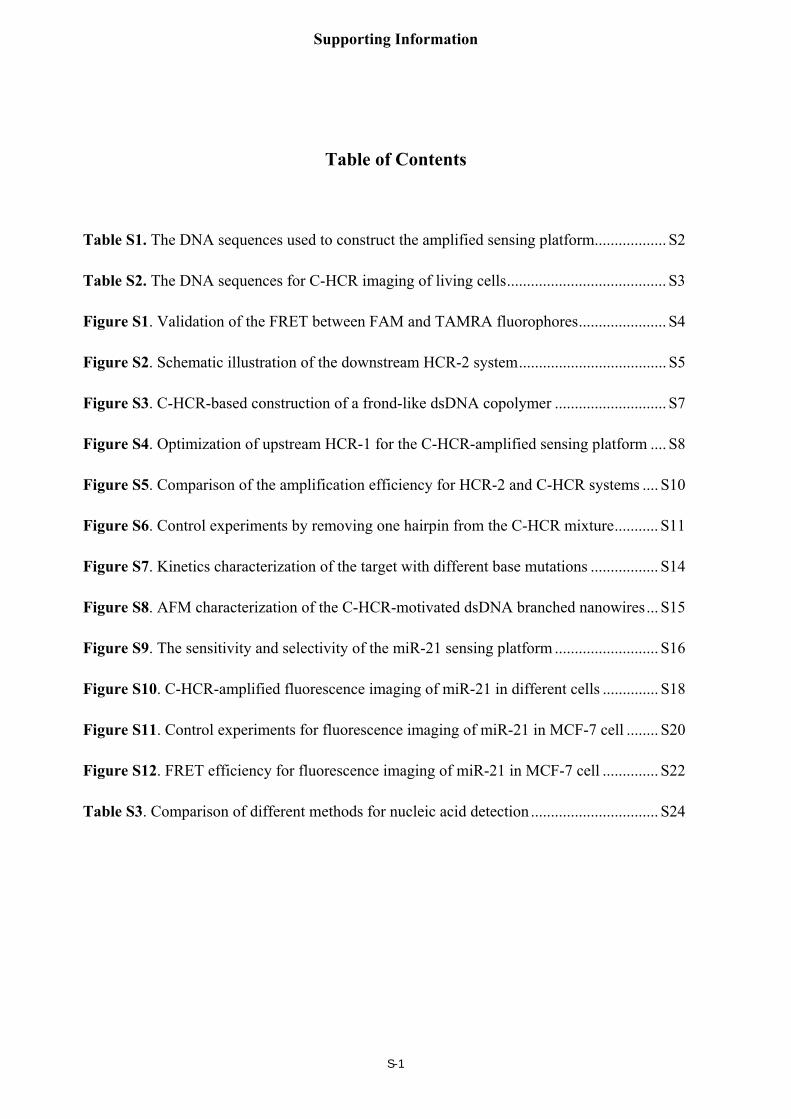
Table of Contents
Table S1. The DNA sequences used to construct the amplified sensing platform.................. S2
Table S2. The DNA sequences for C-HCR imaging of living cells ........................................ S3
Figure S1. Validation of the FRET between FAM and TAMRA fluorophores ...................... S4
Figure S2. Schematic illustration of the downstream HCR-2 system ..................................... S5
Figure S3. C-HCR-based construction of a frond-like dsDNA copolymer ............................ S7
Figure S4. Optimization of upstream HCR-1 for the C-HCR-amplified sensing platform .... S8
Figure S5. Comparison of the amplification efficiency for HCR-2 and C-HCR systems .... S10
Figure S6. Control experiments by removing one hairpin from the C-HCR mixture ........... S11
Figure S7. Kinetics characterization of the target with different base mutations ................. S14
Figure S8. AFM characterization of the C-HCR-motivated dsDNA branched nanowires ... S15
Figure S9. The sensitivity and selectivity of the miR-21 sensing platform .......................... S16
Figure S10. C-HCR-amplified fluorescence imaging of miR-21 in different cells .............. S18
Figure S11. Control experiments for fluorescence imaging of miR-21 in MCF-7 cell ........ S20
Figure S12. FRET efficiency for fluorescence imaging of miR-21 in MCF-7 cell .............. S22
Table S3. Comparison of different methods for nucleic acid detection ................................ S24
Supporting Information
S-2
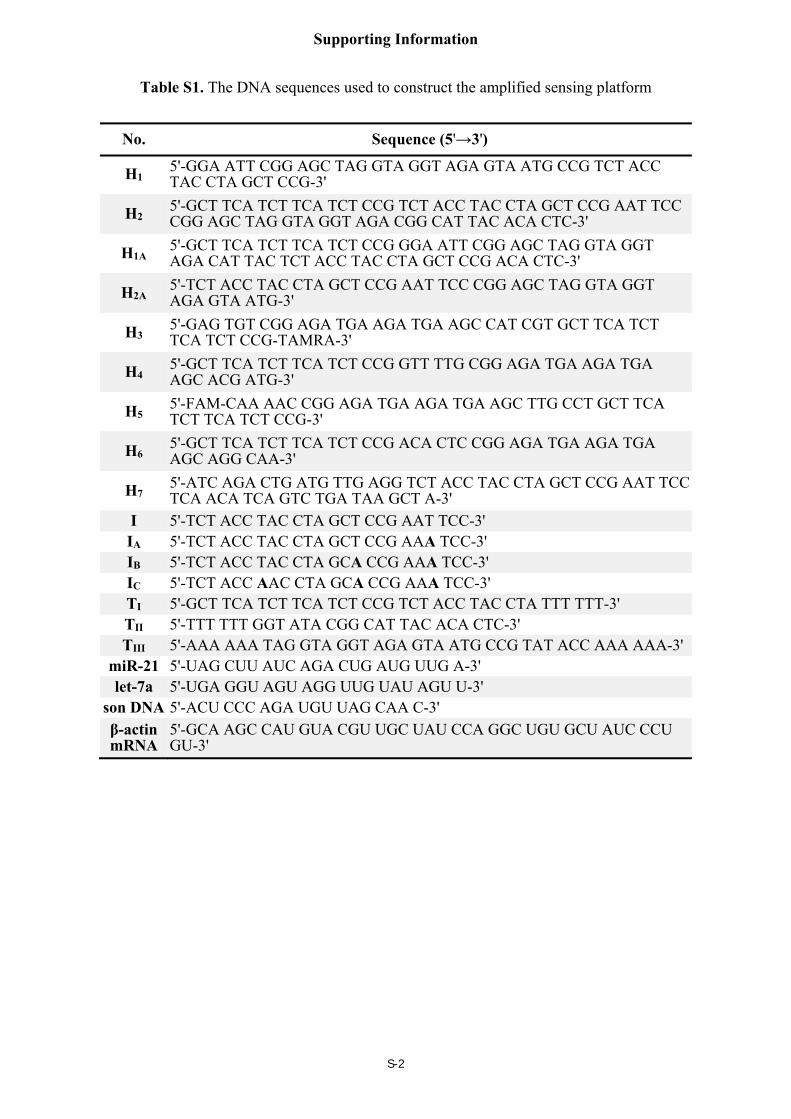
Table S1. The DNA sequences used to construct the amplified sensing platform
No. Sequence (5'→3')
H1 5'-GGA ATT CGG AGC TAG GTA GGT AGA GTA ATG CCG TCT ACC TAC CTA GCT CCG-3'
H2 5'-GCT TCA TCT TCA TCT CCG TCT ACC TAC CTA GCT CCG AAT TCC CGG AGC TAG GTA GGT AGA CGG CAT TAC ACA CTC-3'
H1A 5'-GCT TCA TCT TCA TCT CCG GGA ATT CGG AGC TAG GTA GGT AGA CAT TAC TCT ACC TAC CTA GCT CCG ACA CTC-3'
H2A 5'-TCT ACC TAC CTA GCT CCG AAT TCC CGG AGC TAG GTA GGT AGA GTA ATG-3'
H3 5'-GAG TGT CGG AGA TGA AGA TGA AGC CAT CGT GCT TCA TCT TCA TCT CCG-TAMRA-3'
H4 5'-GCT TCA TCT TCA TCT CCG GTT TTG CGG AGA TGA AGA TGA AGC ACG ATG-3'
H5 5'-FAM-CAA AAC CGG AGA TGA AGA TGA AGC TTG CCT GCT TCA TCT TCA TCT CCG-3'
H6 5'-GCT TCA TCT TCA TCT CCG ACA CTC CGG AGA TGA AGA TGA AGC AGG CAA-3'
H7 5'-ATC AGA CTG ATG TTG AGG TCT ACC TAC CTA GCT CCG AAT TCC TCA ACA TCA GTC TGA TAA GCT A-3'
I 5'-TCT ACC TAC CTA GCT CCG AAT TCC-3'IA 5'-TCT ACC TAC CTA GCT CCG AAA TCC-3'IB 5'-TCT ACC TAC CTA GCA CCG AAA TCC-3'IC 5'-TCT ACC AAC CTA GCA CCG AAA TCC-3'TI 5'-GCT TCA TCT TCA TCT CCG TCT ACC TAC CTA TTT TTT-3' TII 5'-TTT TTT GGT ATA CGG CAT TAC ACA CTC-3'TIII 5'-AAA AAA TAG GTA GGT AGA GTA ATG CCG TAT ACC AAA AAA-3'
miR-21 5'-UAG CUU AUC AGA CUG AUG UUG A-3'let-7a 5'-UGA GGU AGU AGG UUG UAU AGU U-3'
son DNA 5'-ACU CCC AGA UGU UAG CAA C-3'β-actin mRNA
5'-GCA AGC CAU GUA CGU UGC UAU CCA GGC UGU GCU AUC CCU GU-3'
Supporting Information
S-3
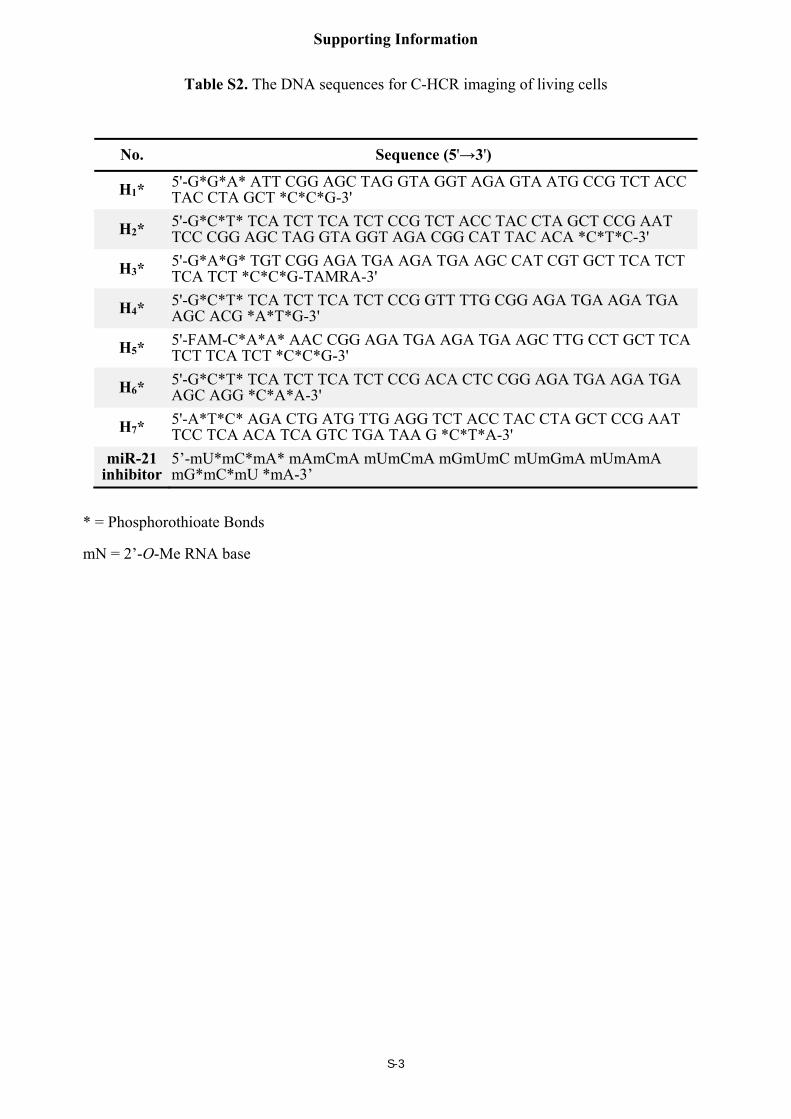
Table S2. The DNA sequences for C-HCR imaging of living cells
No. Sequence (5'→3')
H1* 5'-G*G*A* ATT CGG AGC TAG GTA GGT AGA GTA ATG CCG TCT ACC TAC CTA GCT *C*C*G-3'
H2* 5'-G*C*T* TCA TCT TCA TCT CCG TCT ACC TAC CTA GCT CCG AAT TCC CGG AGC TAG GTA GGT AGA CGG CAT TAC ACA *C*T*C-3'
H3* 5'-G*A*G* TGT CGG AGA TGA AGA TGA AGC CAT CGT GCT TCA TCT TCA TCT *C*C*G-TAMRA-3'
H4* 5'-G*C*T* TCA TCT TCA TCT CCG GTT TTG CGG AGA TGA AGA TGA AGC ACG *A*T*G-3'
H5* 5'-FAM-C*A*A* AAC CGG AGA TGA AGA TGA AGC TTG CCT GCT TCA TCT TCA TCT *C*C*G-3'
H6* 5'-G*C*T* TCA TCT TCA TCT CCG ACA CTC CGG AGA TGA AGA TGA AGC AGG *C*A*A-3'
H7* 5'-A*T*C* AGA CTG ATG TTG AGG TCT ACC TAC CTA GCT CCG AAT TCC TCA ACA TCA GTC TGA TAA G *C*T*A-3'
miR-21 inhibitor
5’-mU*mC*mA* mAmCmA mUmCmA mGmUmC mUmGmA mUmAmA mG*mC*mU *mA-3’
* = Phosphorothioate Bonds
mN = 2’-O-Me RNA base
Supporting Information
S-4
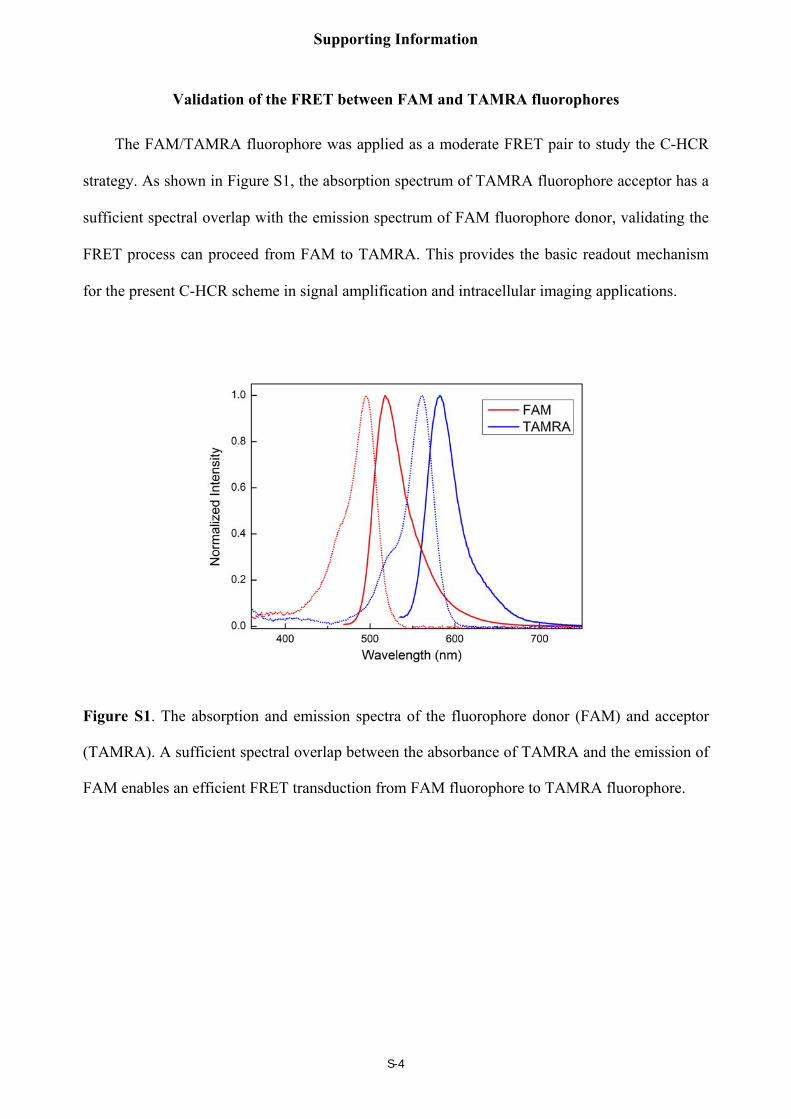
Validation of the FRET between FAM and TAMRA fluorophores
The FAM/TAMRA fluorophore was applied as a moderate FRET pair to study the C-HCR
strategy. As shown in Figure S1, the absorption spectrum of TAMRA fluorophore acceptor has a
sufficient spectral overlap with the emission spectrum of FAM fluorophore donor, validating the
FRET process can proceed from FAM to TAMRA. This provides the basic readout mechanism
for the present C-HCR scheme in signal amplification and intracellular imaging applications.
Figure S1. The absorption and emission spectra of the fluorophore donor (FAM) and acceptor
(TAMRA). A sufficient spectral overlap between the absorbance of TAMRA and the emission of
FAM enables an efficient FRET transduction from FAM fluorophore to TAMRA fluorophore.
Supporting Information
S-5
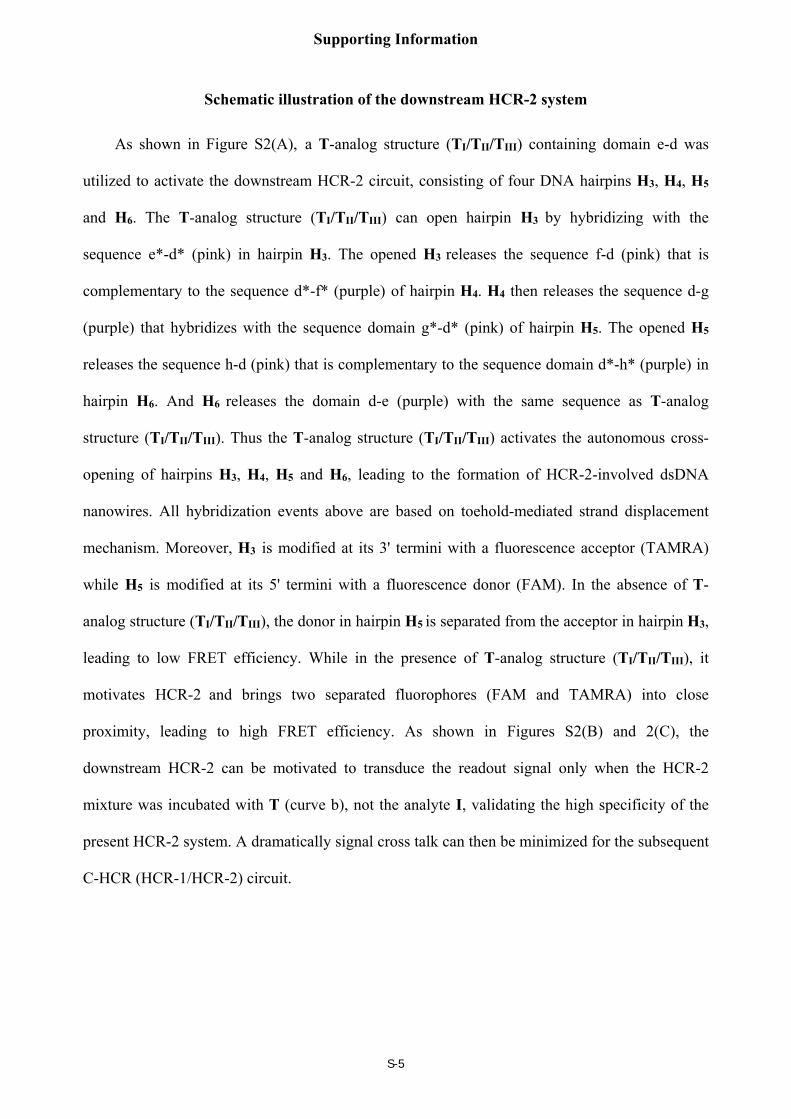
Schematic illustration of the downstream HCR-2 system
As shown in Figure S2(A), a T-analog structure (TI/TII/TIII) containing domain e-d was
utilized to activate the downstream HCR-2 circuit, consisting of four DNA hairpins H3, H4, H5
and H6. The T-analog structure (TI/TII/TIII) can open hairpin H3 by hybridizing with the
sequence e*-d* (pink) in hairpin H3. The opened H3 releases the sequence f-d (pink) that is
complementary to the sequence d*-f* (purple) of hairpin H4. H4 then releases the sequence d-g
(purple) that hybridizes with the sequence domain g*-d* (pink) of hairpin H5. The opened H5
releases the sequence h-d (pink) that is complementary to the sequence domain d*-h* (purple) in
hairpin H6. And H6 releases the domain d-e (purple) with the same sequence as T-analog
structure (TI/TII/TIII). Thus the T-analog structure (TI/TII/TIII) activates the autonomous cross-
opening of hairpins H3, H4, H5 and H6, leading to the formation of HCR-2-involved dsDNA
nanowires. All hybridization events above are based on toehold-mediated strand displacement
mechanism. Moreover, H3 is modified at its 3' termini with a fluorescence acceptor (TAMRA)
while H5 is modified at its 5' termini with a fluorescence donor (FAM). In the absence of T-
analog structure (TI/TII/TIII), the donor in hairpin H5 is separated from the acceptor in hairpin H3,
leading to low FRET efficiency. While in the presence of T-analog structure (TI/TII/TIII), it
motivates HCR-2 and brings two separated fluorophores (FAM and TAMRA) into close
proximity, leading to high FRET efficiency. As shown in Figures S2(B) and 2(C), the
downstream HCR-2 can be motivated to transduce the readout signal only when the HCR-2
mixture was incubated with T (curve b), not the analyte I, validating the high specificity of the
present HCR-2 system. A dramatically signal cross talk can then be minimized for the subsequent
C-HCR (HCR-1/HCR-2) circuit.
Supporting Information
S-6
Figure S2. (A) The scheme for downstream HCR-2 to transduce the colocalized structure T,
products of upstream HCR-1, into a fluorescence readout signal. The trigger T motivates the
multiple sequential cross-opening of H3, H4, H5 and H6 to produce long dsDNA copolymer
nanowires. This brings the donor/acceptor fluorophore (FAM/TAMRA) pairs into close
proximity, and leads to a FRET readout signal. (B) Time-dependent fluorescence changes (at
λ=520 nm) of the HCR-2 system outlined in Figure S2(A) in the presence of no analyte (a), 50
nM T (b) and 50 nM I (c). (C) Fluorescence spectra generated by the downstream HCR-2 circuit
shown in Figure S2(A) in the presence of no analyte (a), 50 nM T (b) and 50 nM I (c) for a fixed
time interval of 2 h. Inset: summary of the results of fluorescence spectra at λ=520 nm. F0
represents the original fluorescence intensity. The system consisting of H3+H4+H5+H6 mixture
(200 nM each) was carried out in reaction buffer (10 mM HEPES, 1 M NaCl, 50 mM MgCl2, pH
7.2). Error bars were derived from n=5 experiments.
Supporting Information
S-7
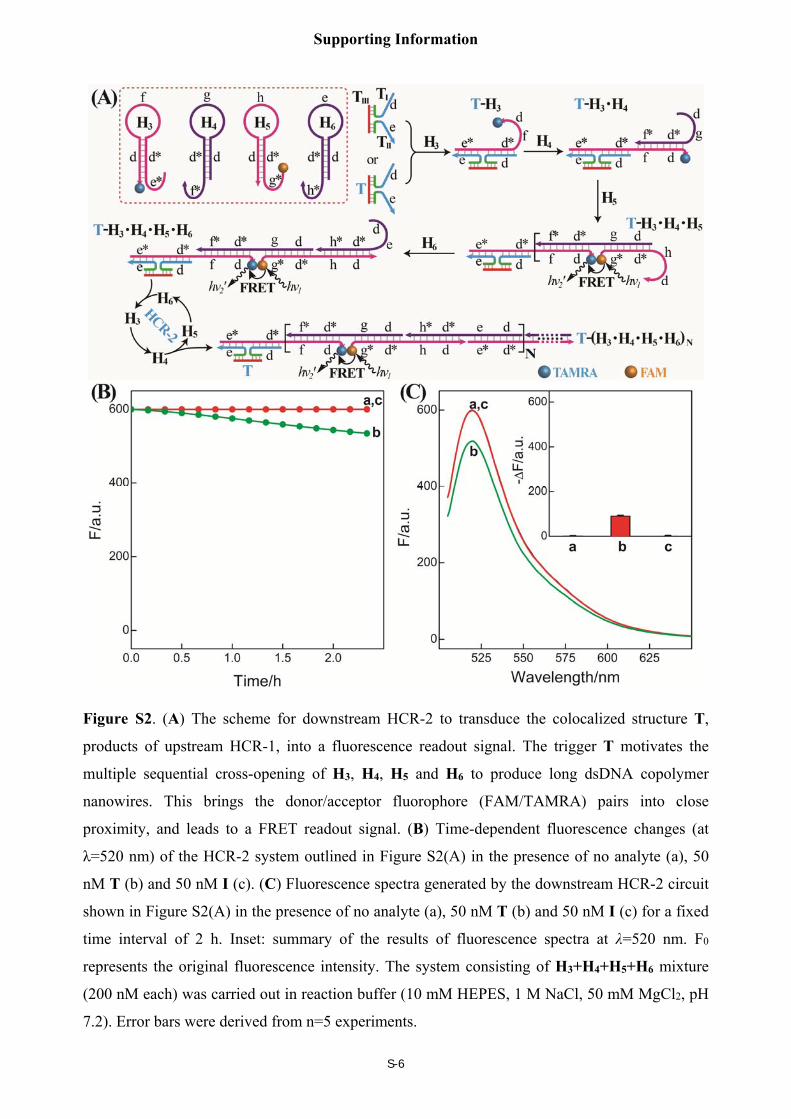
C-HCR-based construction of a frond-like dsDNA copolymer
For the C-HCR system, each H1-H2 pair hybridization event of HCR-1 circuit constitute can
produce one HCR-2 copolymeric dsDNA nanowire. The I-motivated HCR-1 between H1 and H2
generates a tandem structure consisting of numerous reconstituted d-e (blue) structure (T) that
thus provides massive accessible sprouting stages to activate a downstream HCR-2 between H3,
H4, H5 and H6, leading to the construction of a frond-like dsDNA copolymer nanostructure, as
schematically shown in Figure S3.
Figure S3. The scheme for the isothermal enzyme-free C-HCR-based construction of a frond-like
dsDNA copolymer structure as shown in Figure 1.
Supporting Information
S-8
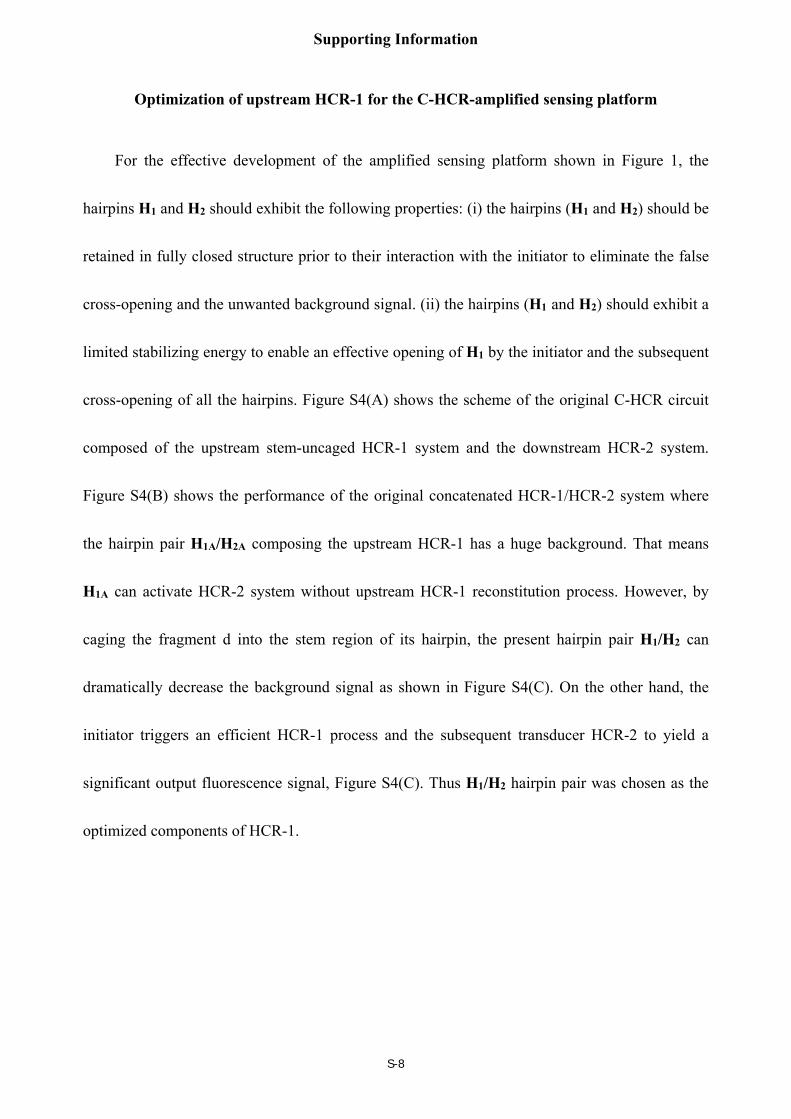
Optimization of upstream HCR-1 for the C-HCR-amplified sensing platform
For the effective development of the amplified sensing platform shown in Figure 1, the
hairpins H1 and H2 should exhibit the following properties: (i) the hairpins (H1 and H2) should be
retained in fully closed structure prior to their interaction with the initiator to eliminate the false
cross-opening and the unwanted background signal. (ii) the hairpins (H1 and H2) should exhibit a
limited stabilizing energy to enable an effective opening of H1 by the initiator and the subsequent
cross-opening of all the hairpins. Figure S4(A) shows the scheme of the original C-HCR circuit
composed of the upstream stem-uncaged HCR-1 system and the downstream HCR-2 system.
Figure S4(B) shows the performance of the original concatenated HCR-1/HCR-2 system where
the hairpin pair H1A/H2A composing the upstream HCR-1 has a huge background. That means
H1A can activate HCR-2 system without upstream HCR-1 reconstitution process. However, by
caging the fragment d into the stem region of its hairpin, the present hairpin pair H1/H2 can
dramatically decrease the background signal as shown in Figure S4(C). On the other hand, the
initiator triggers an efficient HCR-1 process and the subsequent transducer HCR-2 to yield a
significant output fluorescence signal, Figure S4(C). Thus H1/H2 hairpin pair was chosen as the
optimized components of HCR-1.
Supporting Information
S-9
Figure S4. (A) The scheme for the original C-HCR circuit composed of the upstream stem-uncaged HCR-1 system and the downstream HCR-2 system. Compared with the optimized C-HCR circuit, segment d herein was not introduced and caged into the stem region of hairpin H1A. The initiator (I)-triggered the cross-opening of H1A and H2A in the upstream HCR-1 system, yielding dsDNA copolymer consisting of the tandem colocalized structure T for transducer HCR-2. (B) Fluorescence spectra generated by the original C-HCR system outlined in Figure S4(A) by incubating HCR-2, composed of H3, H4, H5 and H6 (200 nM each), with different components of the stem-uncaged HCR-1 for a fixed time interval of 2 h: (a) 200 nM H2A, (b) 200 nM H1A, (c) 200 nM H1A and 200 nM H2A, and (d) 200 nM H1A, 200 nM H2A, and 50 nM I. Inset: summary of the results of fluorescence spectra at λ=520 nm. The system was carried out in reaction buffer (10 mM HEPES, 1 M NaCl, 50 mM MgCl2, pH 7.2). (C) Fluorescence spectra generated by the optimized C-HCR system shown in Figure 1 by incubating HCR-2, composed of H3, H4, H5 and H6 (200 nM each), with different components of the stem-caged HCR-1 for a fixed time interval of 2 h: (a) 200 nM H1, (b) 200 nM H2, (c) 200 nM H1 and 200 nM H2, and (d) 200 nM H1, 200 nM H2 and 50 nM I. Inset: summary of the results of fluorescence spectra at λ = 520 nm. F0 represents the original fluorescence intensity. The system was carried out in reaction buffer (10 mM HEPES, 1 M NaCl, 50 mM MgCl2, pH 7.2). Error bars were derived from n=5 experiments.
Supporting Information
S-10
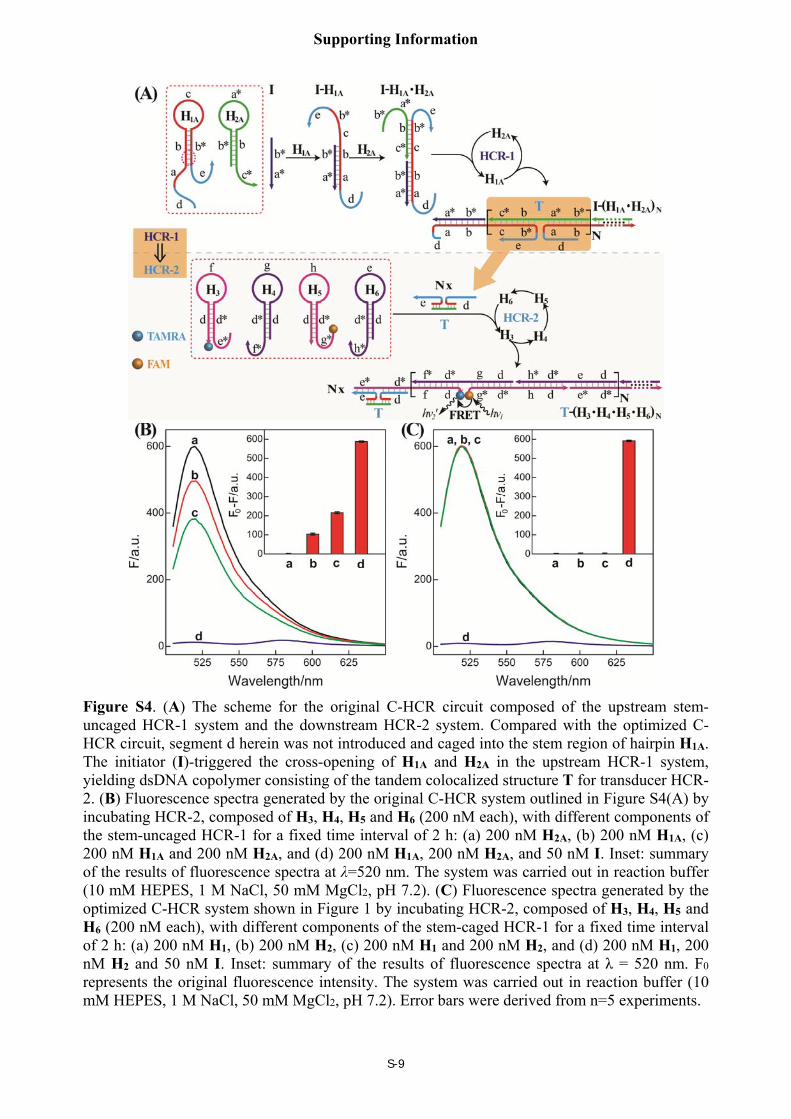
Comparison of the amplification efficiency for HCR-2 and C-HCR systems.
It is a characteristic HCR system when the C-HCR mixture was incubated with trigger T
only since then the downstream HCR-2 is merely activated to transduce the readout signal and
the upstream HCR-1 is not involved in the process. As shown in Figure S5, the C-HCR system
showed a much higher of fluorescence response over conventional HCR, indicating an enhanced
signal amplification efficacy of the C-HCR amplifier (1:N2) over traditional HCR scheme (1:N).
Figure S5. Fluorescence spectra generated by the C-HCR system outlined in Figure 1 in the
absence of analyte (a), and upon analyzing 50 nM T (b) or I (c). Inset: summary of the results of
fluorescence spectra at λ=520 nm. F0 represents the original fluorescence intensity. The system
consisting of H1+H2+H3+H4+H5+H6 mixture (200 nM each) was carried out in reaction buffer
for a fixed time interval of 2 h. Error bars were derived from n = 5 experiments.
Supporting Information
S-11
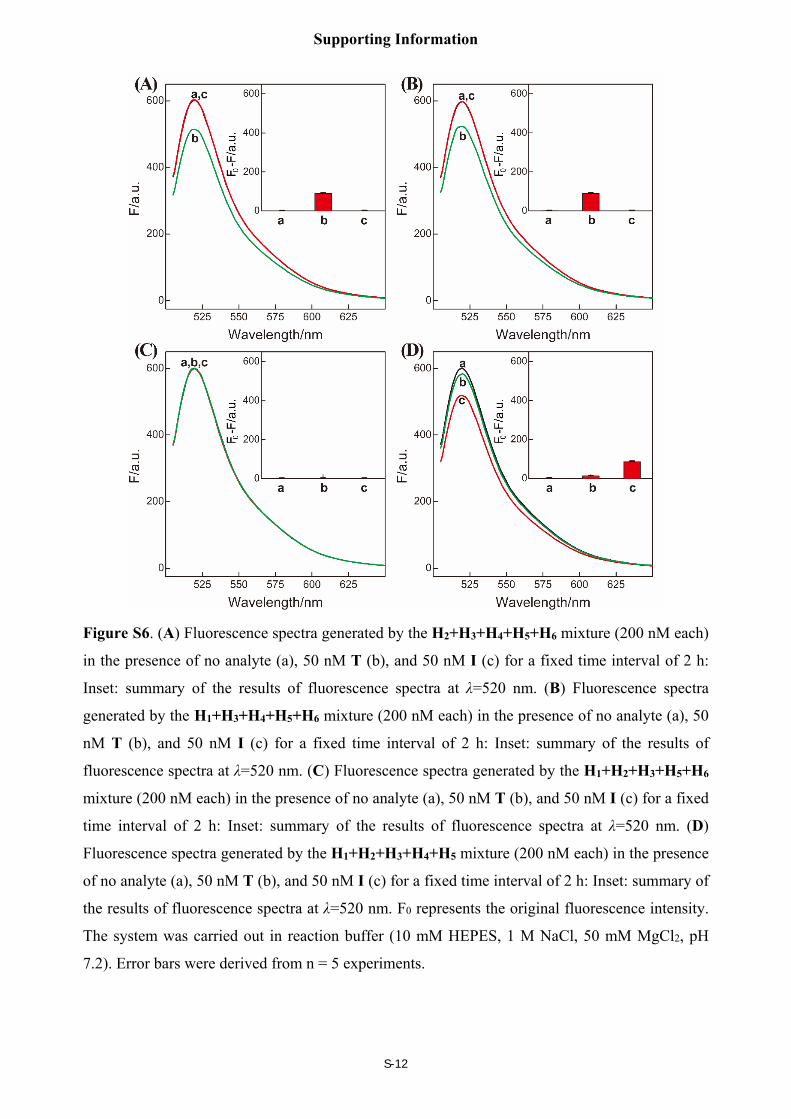
Control experiments by removing one hairpin from the C-HCR mixture
By subtracting H1 or H2 from upstream HCR-1, only T activates the HCR-2 system,
generating a moderate fluorescence change, Figure S6(A) and S6(B), respectively. No
fluorescence change can be observed by subtracting H4 from downstream HCR-2 circuit for the
shortage of an important linker between TAMRA- and FAM-labeled H3 and H5 hairpins,
resulting in no readout transduction even HCR-1 can be activated to generate a copolymeric
dsDNA nanowire, Figure S6(C). However, a moderate fluorescence change was observed for I-
motivated C-HCR system that subtracted H6 from downstream HCR-2 circuit, while T-motivated
H6-subtracted C-HCR system generated a much lower fluorescence change as compared with that
of I-motivated C-HCR scheme. This can be explicated as follows, for the H1+H2+H3+H4+H5
mixture, the absence of H6 inhibits downstream HCR-2, T also generates F/Q hybrid with a ratio
corresponding to 1:1, giving rise to a lower FRET signal. However, I generates numerous F/Q
hybrid based on successive hybridization of upstream HCR-1, giving rise to a moderate FRET
signal. This, on the other hand, demonstrate our C-HCR system is based on a concatenated HCR-
1/HCR-2 process as shown in Figure 1.
Supporting Information
S-12
Figure S6. (A) Fluorescence spectra generated by the H2+H3+H4+H5+H6 mixture (200 nM each)
in the presence of no analyte (a), 50 nM T (b), and 50 nM I (c) for a fixed time interval of 2 h:
Inset: summary of the results of fluorescence spectra at λ=520 nm. (B) Fluorescence spectra
generated by the H1+H3+H4+H5+H6 mixture (200 nM each) in the presence of no analyte (a), 50
nM T (b), and 50 nM I (c) for a fixed time interval of 2 h: Inset: summary of the results of
fluorescence spectra at λ=520 nm. (C) Fluorescence spectra generated by the H1+H2+H3+H5+H6
mixture (200 nM each) in the presence of no analyte (a), 50 nM T (b), and 50 nM I (c) for a fixed
time interval of 2 h: Inset: summary of the results of fluorescence spectra at λ=520 nm. (D)
Fluorescence spectra generated by the H1+H2+H3+H4+H5 mixture (200 nM each) in the presence
of no analyte (a), 50 nM T (b), and 50 nM I (c) for a fixed time interval of 2 h: Inset: summary of
the results of fluorescence spectra at λ=520 nm. F0 represents the original fluorescence intensity.
The system was carried out in reaction buffer (10 mM HEPES, 1 M NaCl, 50 mM MgCl2, pH
7.2). Error bars were derived from n = 5 experiments.
Supporting Information
S-13
Comparison of the amplification efficiency for HCR-1 and C-HCR systems.
For comparing the present C-HCR with conventional HCR system, the C-HCR system
consisting of H1+H2+H3+H4+H5+H6 mixture (200 nM each) or the traditional HCR control
system (HCR-1 analogues or H6-excluded C-HCR) consisting of H1+H2+H3+H4+H5 mixture
(200 nM each) was carried out in reaction buffer (10 mM HEPES, 1 M NaCl, 50 mM MgCl2, pH
7.2) for a fixed time interval of 2 h. The fluorescence intensity changes were acquired at a fixed
wavelength of 520 nm. F0 represents the original fluorescence intensity. Error bars were derived
from n=5 experiments. Based on the slope of the linear detection range, C-HCR showed a 25-fold
higher of fluorescence response over conventional HCR, indicating an enhanced signal
amplification efficacy of the C-HCR amplifier (1:N2) over HCR scheme (1:N).
Supporting Information
S-14
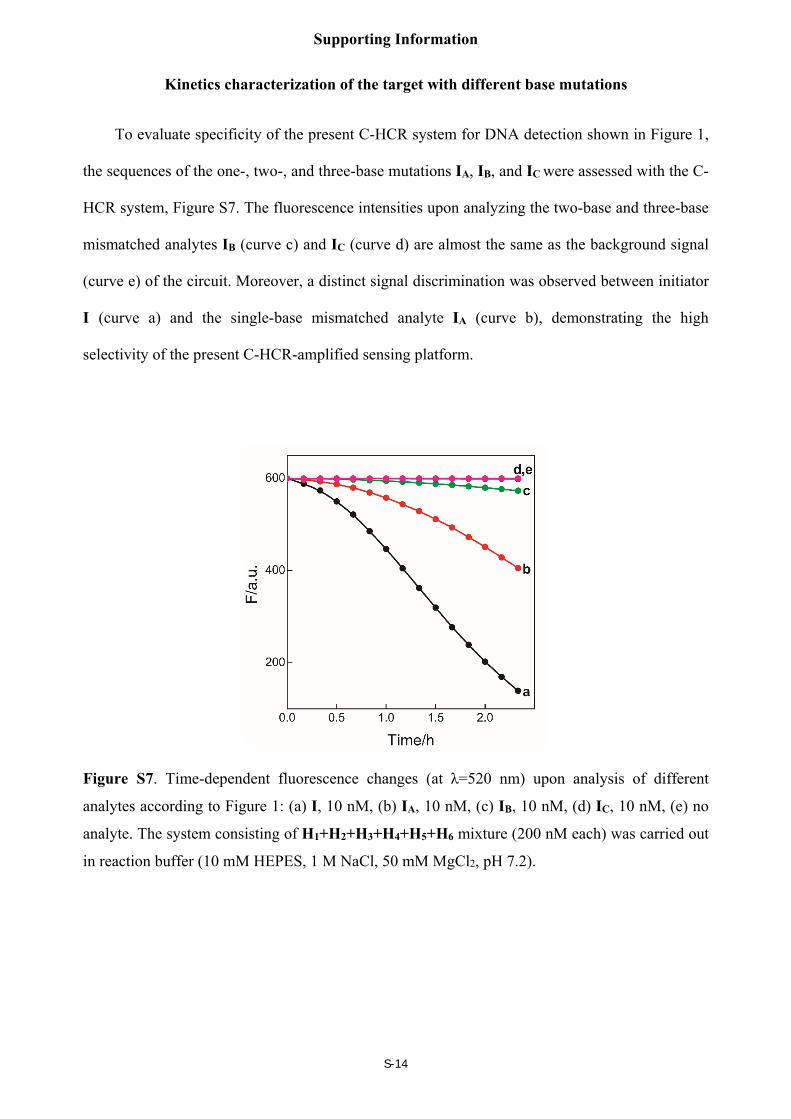
Kinetics characterization of the target with different base mutations
To evaluate specificity of the present C-HCR system for DNA detection shown in Figure 1,
the sequences of the one-, two-, and three-base mutations IA, IB, and IC were assessed with the C-
HCR system, Figure S7. The fluorescence intensities upon analyzing the two-base and three-base
mismatched analytes IB (curve c) and IC (curve d) are almost the same as the background signal
(curve e) of the circuit. Moreover, a distinct signal discrimination was observed between initiator
I (curve a) and the single-base mismatched analyte IA (curve b), demonstrating the high
selectivity of the present C-HCR-amplified sensing platform.
Figure S7. Time-dependent fluorescence changes (at λ=520 nm) upon analysis of different
analytes according to Figure 1: (a) I, 10 nM, (b) IA, 10 nM, (c) IB, 10 nM, (d) IC, 10 nM, (e) no
analyte. The system consisting of H1+H2+H3+H4+H5+H6 mixture (200 nM each) was carried out
in reaction buffer (10 mM HEPES, 1 M NaCl, 50 mM MgCl2, pH 7.2).
Supporting Information
S-15
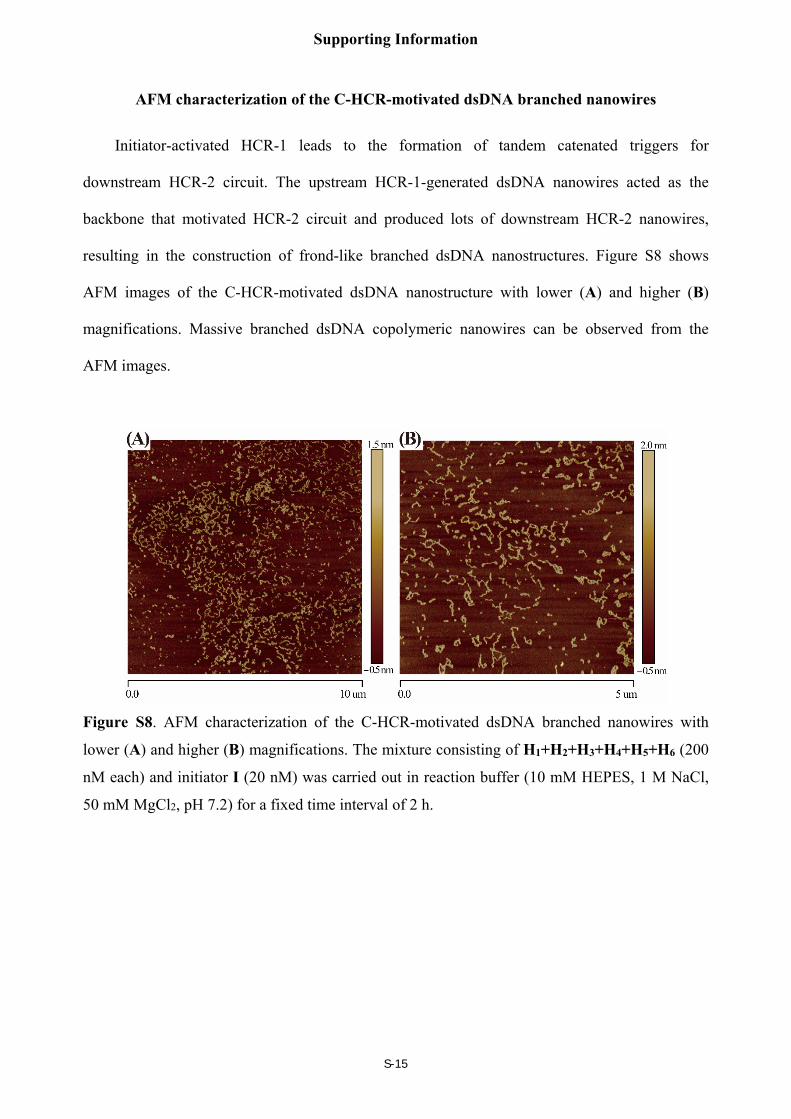
AFM characterization of the C-HCR-motivated dsDNA branched nanowires
Initiator-activated HCR-1 leads to the formation of tandem catenated triggers for
downstream HCR-2 circuit. The upstream HCR-1-generated dsDNA nanowires acted as the
backbone that motivated HCR-2 circuit and produced lots of downstream HCR-2 nanowires,
resulting in the construction of frond-like branched dsDNA nanostructures. Figure S8 shows
AFM images of the C-HCR-motivated dsDNA nanostructure with lower (A) and higher (B)
magnifications. Massive branched dsDNA copolymeric nanowires can be observed from the
AFM images.
Figure S8. AFM characterization of the C-HCR-motivated dsDNA branched nanowires with
lower (A) and higher (B) magnifications. The mixture consisting of H1+H2+H3+H4+H5+H6 (200
nM each) and initiator I (20 nM) was carried out in reaction buffer (10 mM HEPES, 1 M NaCl,
50 mM MgCl2, pH 7.2) for a fixed time interval of 2 h.
Supporting Information
S-16
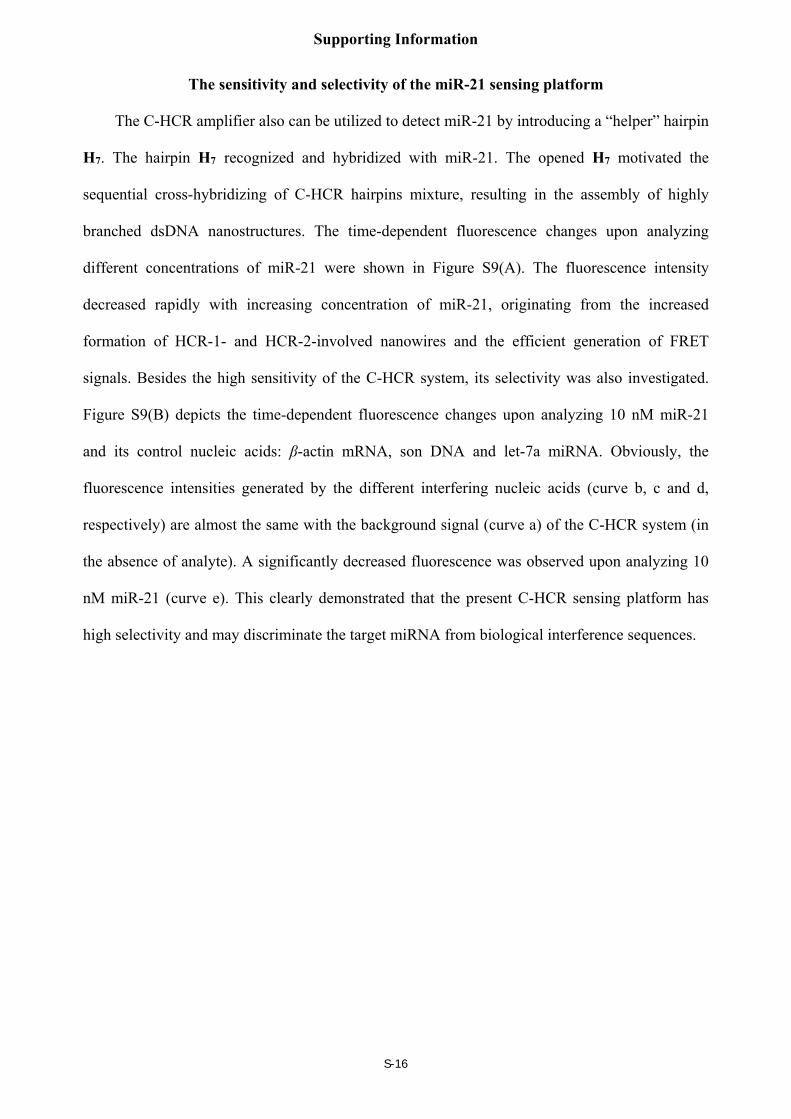
The sensitivity and selectivity of the miR-21 sensing platform
The C-HCR amplifier also can be utilized to detect miR-21 by introducing a “helper” hairpin
H7. The hairpin H7 recognized and hybridized with miR-21. The opened H7 motivated the
sequential cross-hybridizing of C-HCR hairpins mixture, resulting in the assembly of highly
branched dsDNA nanostructures. The time-dependent fluorescence changes upon analyzing
different concentrations of miR-21 were shown in Figure S9(A). The fluorescence intensity
decreased rapidly with increasing concentration of miR-21, originating from the increased
formation of HCR-1- and HCR-2-involved nanowires and the efficient generation of FRET
signals. Besides the high sensitivity of the C-HCR system, its selectivity was also investigated.
Figure S9(B) depicts the time-dependent fluorescence changes upon analyzing 10 nM miR-21
and its control nucleic acids: β-actin mRNA, son DNA and let-7a miRNA. Obviously, the
fluorescence intensities generated by the different interfering nucleic acids (curve b, c and d,
respectively) are almost the same with the background signal (curve a) of the C-HCR system (in
the absence of analyte). A significantly decreased fluorescence was observed upon analyzing 10
nM miR-21 (curve e). This clearly demonstrated that the present C-HCR sensing platform has
high selectivity and may discriminate the target miRNA from biological interference sequences.
Supporting Information
S-17
Figure S9. (A) Time-dependent fluorescence changes (at λ=520 nm) upon analyzing different
concentrations of the target miR-21 using the updated C-HCR sensing platform shown in Figure
4: (a) 0 M, (b) 1 × 10⁻¹¹ M, (c) 5× 10⁻¹¹ M, (d) 1 × 10⁻¹⁰ M, (e) 5 × 10⁻¹⁰ M, (f) 1 ×10⁻⁹ M, (g) 5 ×
10-9 M, (h) 1 × 10⁻⁸ M, (i) 5×10⁻⁸ M, and (j) 1 × 10⁻⁷ M. (B) Time-dependent fluorescence
changes (at λ=520 nm) upon analysis of different analytes according to Figure 4: (a) no analyte,
(b) β-actin mRNA, 10 nM, (c) let-7a, 10 nM, (d) son DNA, 10 nM, and (e) miR-21, 10 nM. The
system consisting of H1+H2+H3+H4+H5+H6 mixture (200 nM each) and a “helper” hairpin H7
(50 nM) was carried out in reaction buffer (10 mM HEPES, 1 M NaCl, 50 mM MgCl2, pH 7.2).
Supporting Information
S-18
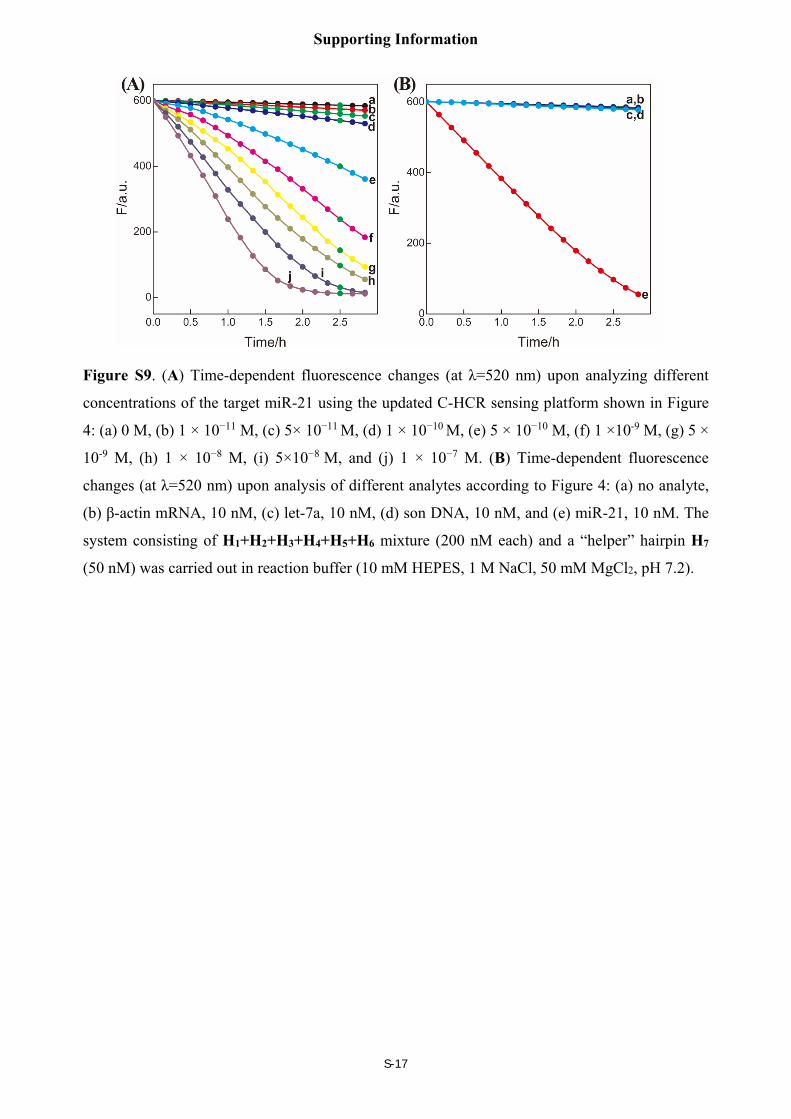
C-HCR-amplified fluorescence imaging of miR-21 in different cells
As shown in Figure S10, the C-HCR system was utilized to detect miR-21 in different living
cancer cells. To avoid undesired interfere from the complex cellular environment, we use the
fluorescence emission ratio of acceptor to donor (FA/FD) as the detecting FRET signal to
discriminate microRNA of different expression levels in living cancer cells. An obvious FRET
signals were observed for live MCF-7 cells (sample a), indicating a high miR-21 expression level
in MCF-7 cells. A comparably decreased FRET signals were observed in live HeLa cell (sample
d), indicating the presence of low miR-21 expression in HeLa cell. These results showed that the
C-HCR system could distinguish different cell lines with different miRNA expression levels. A
slightly weak FRET signals were observed in live MCF-7 cells by conventional HCR system
(sample b, H6-excluded C-HCR imaging strategy), indicating the present C-HCR imaging
platform has a comparably enhanced amplification efficacy in living cells as compared to the
conventional HCR imaging system. Almost no FRET signals were observed when the miR-21
expression was knocked down by introducing an anti-miRNA antisense inhibitor oligonucleotide
into MCF-7 cells (sample c), indicating that the C-HCR system can detect the changes in
microRNA expression levels in living cancer cells.
Supporting Information
S-19
Figure S10. Living cell analysis of miR-21 based on C-HCR or HCR strategy and FRET
transduction (in the form of FA/FD). Confocal laser scanning microscopy (CLSM) imaging of
miR-21 in (a) routine MCF-7 live cells by C-HCR amplifier, (b) routine MCF-7 live cells by
conventional HCR amplifier (H6-excluded C-HCR), (c) MCF-7 live cells treated with a
chemically modified miR-21 inhibitor by C-HCR amplifier, and (d) HeLa live cells by C-HCR
amplifier. All of the aforementioned living cells were transfected and incubated with miR-21-
targeting C-HCR or conventional HCR mixture at 37 °C for 2 h. All scale bars correspond to 20
μm.
Supporting Information
S-20
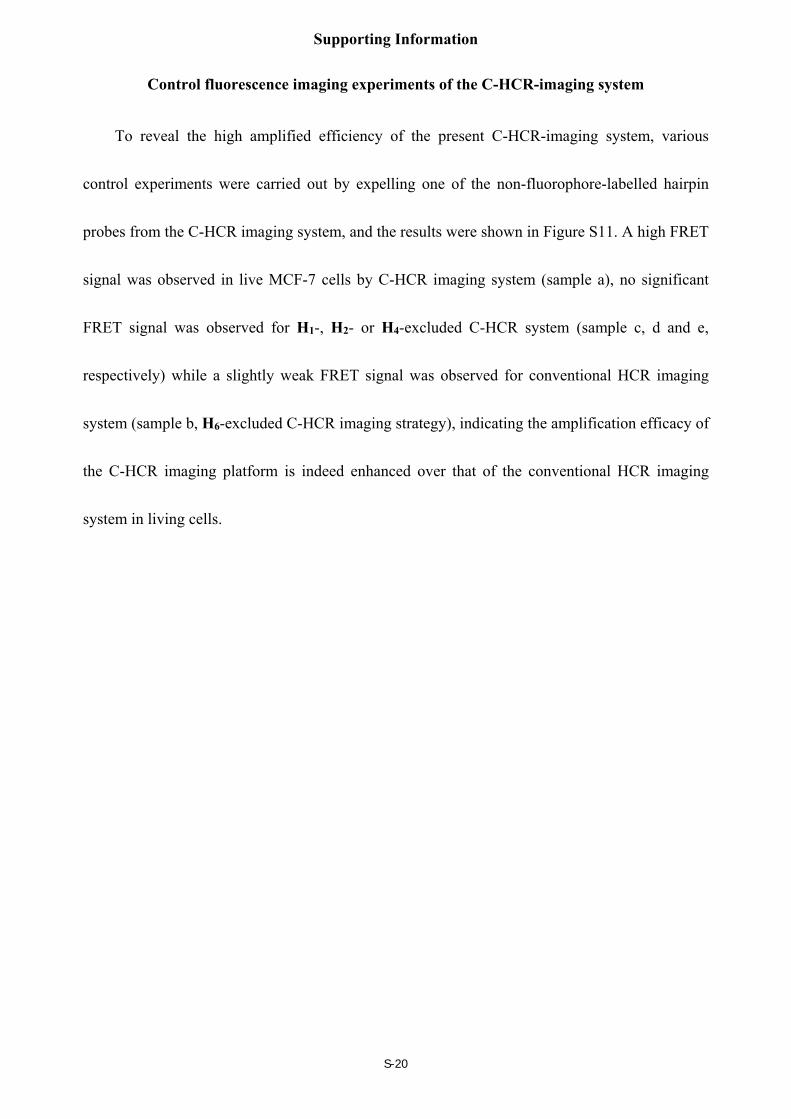
Control fluorescence imaging experiments of the C-HCR-imaging system
To reveal the high amplified efficiency of the present C-HCR-imaging system, various
control experiments were carried out by expelling one of the non-fluorophore-labelled hairpin
probes from the C-HCR imaging system, and the results were shown in Figure S11. A high FRET
signal was observed in live MCF-7 cells by C-HCR imaging system (sample a), no significant
FRET signal was observed for H1-, H2- or H4-excluded C-HCR system (sample c, d and e,
respectively) while a slightly weak FRET signal was observed for conventional HCR imaging
system (sample b, H6-excluded C-HCR imaging strategy), indicating the amplification efficacy of
the C-HCR imaging platform is indeed enhanced over that of the conventional HCR imaging
system in living cells.
Supporting Information
S-21
Figure S11. Living cell analysis of miR-21 based on C-HCR-mediated FRET transduction (in the
form of FA/FD). Confocal laser scanning microscopy (CLSM) imaging of miR-21 in routine
MCF-7 live cells that were respectively transfected and incubated with the original C-HCR
system (a), the H6-excluded C-HCR system (b), the H1-excluded C-HCR system (c), the H2-
excluded C-HCR system (d), and the H4-excluded C-HCR system (e) at 37 °C for 2 h. All scale
bars correspond to 20 μm.
Supporting Information
S-22
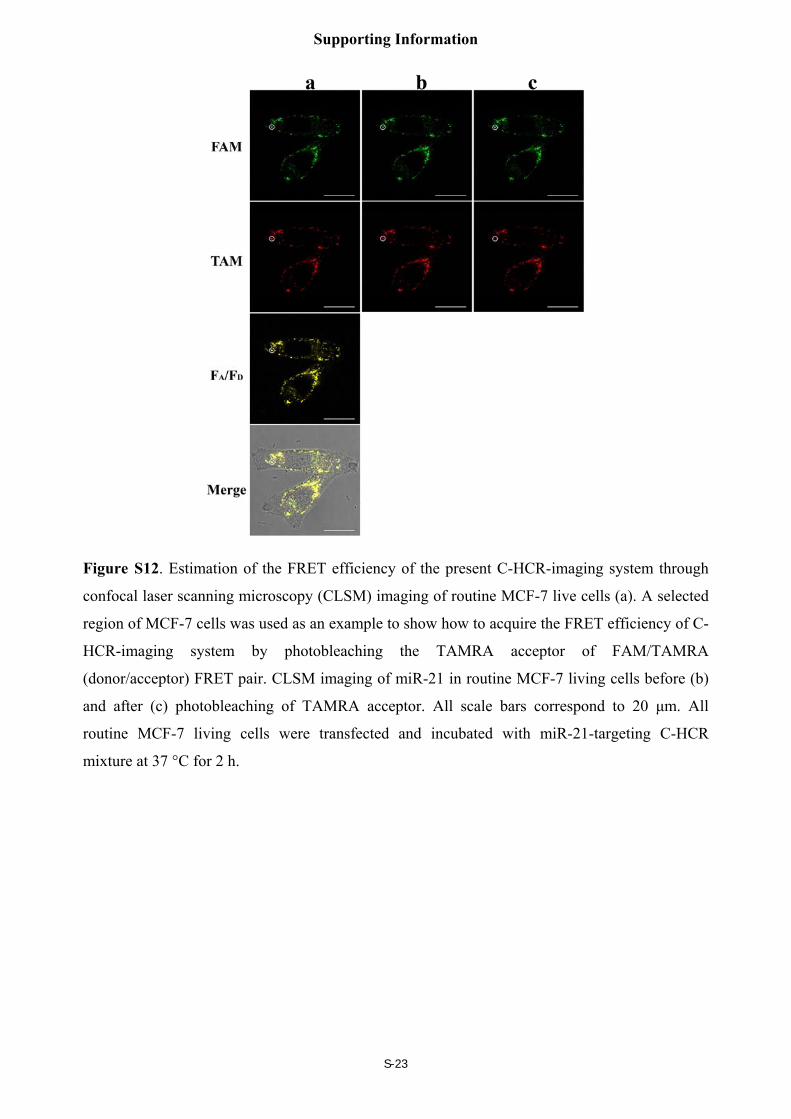
FRET efficiency of the CHCR-imaging system
The FRET efficiency of fluorescence imaging systems was acquired by a conventional
acceptor-photo-bleaching technique (Figure S12). Here, the acceptor (TAMRA)-photo-bleaching-
induced fluorescent intensity changes of the donor (FAM) were analyzed and calculated for
obtaining reliable FRET efficiency of the C-HCR imaging system. The fluorescence of FAM
donor could be restored after photobleaching TAMRA acceptor. The luminescence intensities of
FAM donor were recorded before and after the photobleaching of TAMRA acceptor, and
provided a direct way for quantifying the FRET efficiency (FRETeff) as follows:
FRETeff = (Dpost - Dpre)/Dpost
where Dpre and Dpost correspond to the fluorescence intensities of FAM donor before and after
TAMRA-photobleaching, respectively.
For reliability and accuracy purposes, the FRET efficiency was derived from different
regions and sets of the living cells. And the calculated average FRET efficiency corresponds to
0.62 (Figure 6(C)).
Supporting Information
S-23
Figure S12. Estimation of the FRET efficiency of the present C-HCR-imaging system through
confocal laser scanning microscopy (CLSM) imaging of routine MCF-7 live cells (a). A selected
region of MCF-7 cells was used as an example to show how to acquire the FRET efficiency of C-
HCR-imaging system by photobleaching the TAMRA acceptor of FAM/TAMRA
(donor/acceptor) FRET pair. CLSM imaging of miR-21 in routine MCF-7 living cells before (b)
and after (c) photobleaching of TAMRA acceptor. All scale bars correspond to 20 μm. All
routine MCF-7 living cells were transfected and incubated with miR-21-targeting C-HCR
mixture at 37 °C for 2 h.
Supporting Information
S-24
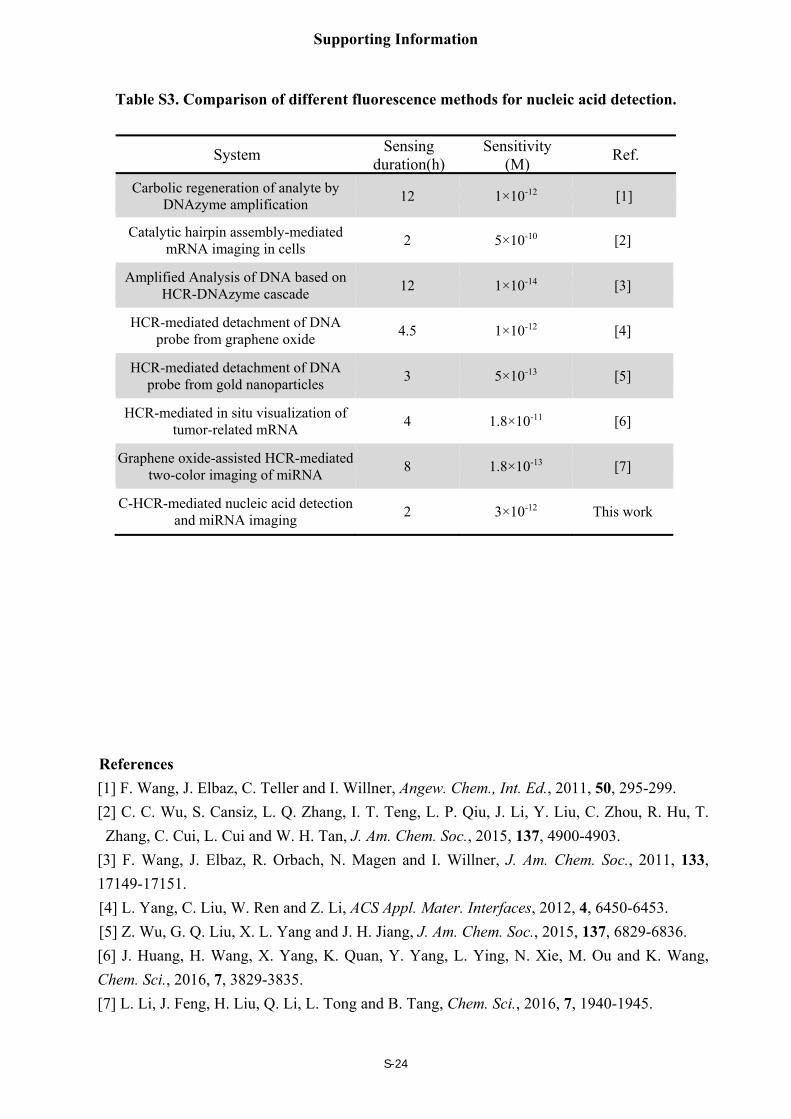
Table S3. Comparison of different fluorescence methods for nucleic acid detection.
System Sensing duration(h)
Sensitivity (M)
Ref.
Carbolic regeneration of analyte by DNAzyme amplification
12 1×10-12 [1]
Catalytic hairpin assembly-mediated mRNA imaging in cells
2 5×10⁻¹⁰ [2]
Amplified Analysis of DNA based on HCR-DNAzyme cascade
12 1×10-14 [3]
HCR-mediated detachment of DNA probe from graphene oxide
4.5 1×10-12 [4]
HCR-mediated detachment of DNA probe from gold nanoparticles
3 5×10-13 [5]
HCR-mediated in situ visualization of tumor-related mRNA
4 1.8×10⁻¹¹ [6]
Graphene oxide-assisted HCR-mediatedtwo-color imaging of miRNA
8 1.8×10⁻¹³ [7]
C-HCR-mediated nucleic acid detection and miRNA imaging
2 3×10-12 This work
References
[1] F. Wang, J. Elbaz, C. Teller and I. Willner, Angew. Chem., Int. Ed., 2011, 50, 295-299.
[2] C. C. Wu, S. Cansiz, L. Q. Zhang, I. T. Teng, L. P. Qiu, J. Li, Y. Liu, C. Zhou, R. Hu, T.
Zhang, C. Cui, L. Cui and W. H. Tan, J. Am. Chem. Soc., 2015, 137, 4900-4903.
[3] F. Wang, J. Elbaz, R. Orbach, N. Magen and I. Willner, J. Am. Chem. Soc., 2011, 133,
17149-17151.
[4] L. Yang, C. Liu, W. Ren and Z. Li, ACS Appl. Mater. Interfaces, 2012, 4, 6450-6453.
[5] Z. Wu, G. Q. Liu, X. L. Yang and J. H. Jiang, J. Am. Chem. Soc., 2015, 137, 6829-6836.
[6] J. Huang, H. Wang, X. Yang, K. Quan, Y. Yang, L. Ying, N. Xie, M. Ou and K. Wang,
Chem. Sci., 2016, 7, 3829-3835.
[7] L. Li, J. Feng, H. Liu, Q. Li, L. Tong and B. Tang, Chem. Sci., 2016, 7, 1940-1945.