Embed Size (px)
Citation preview
January 2017
Consumer Experiences with Debt Collection Findings from the CFPB’s Survey of Consumer Views on Debt
Consumer Experiences with Debt Collection Findings from the CFPB’s Survey of Consumer Views on Debt
Consumer Experiences with Debt Collection Findings from the CFPB’s Survey of Consumer Views on Debt
Consumer Experiences with Debt Collection Findings from the CFPB’s Survey of Consumer Views on Debt
1 CONSUMER EXPERIENCES WITH DEBT COLLECTION
Table of contents
Table of contents......................................................................................................... 1
1. Introduction ........................................................................................................... 3
2. Sample and survey design, response rates, and weights ................................ 7
2.1 Sample design ........................................................................................... 7
2.2 Survey questionnaire and topics .............................................................. 8
2.3 Data collection protocol .......................................................................... 10
2.4 Response rates ......................................................................................... 11
2.5 Statistical adjustments and considerations ............................................. 11
3. Collections-related contacts, disputes, and lawsuits ...................................... 13
3.1 Consumers with collections experience ................................................. 13
3.2 Types of debt in collection ...................................................................... 18
3.3 Contacts about debts a consumer believed were in error and disputes 23
3.4 Lawsuits .................................................................................................. 27
4. Contacts by creditors and collectors ................................................................ 29
4.1 How consumers were contacted ............................................................. 29
4.2 How often consumers were contacted .................................................... 30
4.3 Contact frequency by number of debts ................................................... 32
4.4 Requesting not to be contacted .............................................................. 34
2 CONSUMER EXPERIENCES WITH DEBT COLLECTION
5. Communication methods ................................................................................... 36
5.1 Preferences for contacts about a debt in collection ................................ 36
5.2 Preferences about messages from a creditor or collector ...................... 37
6. Comparing collections for creditors and collectors ........................................ 40
6.1 Method and frequency of contact by creditors and debt collectors ....... 40
6.2 Consumer characterizations of creditor and debt collector contacts .... 44
7. Conclusion .......................................................................................................... 48
8. Appendix: Survey instrument ............................................................................ 49
3 CONSUMER EXPERIENCES WITH DEBT COLLECTION
1. Introduction This report presents the results of the Survey of Consumer Views on Debt (“survey”) which was
conducted by the Consumer Financial Protection Bureau (“Bureau”) between December 2014
and March 2015. The survey results substantially expand the understanding of debt collection in
the United States by providing the first comprehensive and nationally representative data on
consumers’ experiences and preferences related to debt collection.1
A debt collector generally contacts a consumer when the collector believes that the consumer
owes an unpaid debt. Debts for which a collection may be attempted can include both loans,
such as a car loan or student loan, and past-due bills, such as a doctor’s bill or a phone bill. The
collector may be the original creditor or another entity that is trying to collect the debt on behalf
of the creditor, on behalf of a third party that has purchased the debt from the creditor, or on its
own account as a purchaser of the debt obligation (collectively, debt collectors).2
1 The Bureau released some preliminary findings from this survey in July 2016. See Appendix B of CFPB, “Small Business Review Panel for Debt Collector and Debt Buyer Rulemaking” (July 28, 2016), available at http://files.consumerfinance.gov/f/documents/20160727_cfpb_Outline_of_proposals.pdf. This report provides more detailed results.
2 This report refers to third parties attempting to collect a debt as “debt collectors” and uses the term “creditor” to refer to first-party collectors, including lenders or billers to whom the consumer has an outstanding debt, regardless of whether that debt is a loan or a bill. This shorthand aligns with the wording of the survey, which defined a debt collector as “a person or company other than the creditor that tries to collect on a debt, such as an attorney, a debt
4 CONSUMER EXPERIENCES WITH DEBT COLLECTION
The survey provides a more comprehensive picture of consumers’ experiences with debt
collection than has been available from other data sources. Consumer complaint data, for
example, reflect only the experiences of those consumers who contacted the Bureau or other
governmental agencies and therefore may not be representative of consumers’ experiences
generally. Administrative data from specific debt collection firms can provide detail that is
helpful for understanding collection processes and practices of particular entities, including
some of the larger firms engaged in debt collection. Information from firms, however, generally
cannot provide a market-wide perspective or capture the consumer’s perspective, and it may not
be representative of collections by firms of different sizes or debt types. In contrast, as described
in Section 2, the Bureau’s survey sample was selected from credit records maintained by one of
the top three nationwide credit repositories, and the survey data were adjusted for differences in
response rates for different types of consumers. As a result, estimates from the survey are
representative of U.S. consumers with a credit report.3
The survey asked consumers about their experiences, if any, with debt collectors over the past
year.4 For consumers who had such an experience, the survey captured detail on the debt for
which they were most recently contacted. In addition, the survey collected data on disputes and
lawsuits, preferences for communications with a creditor or collector, and each consumer’s
demographic characteristics, general financial situation, and credit-market experiences. As with
any survey data, the results reflect the self-reported responses of survey participants and should
be considered as such throughout this report. In contrast, results based on other sources of data,
collection firm, or other third party” and defined “creditor” to include both lenders and those seeking payment on a past-due bill.
3 This report uses the term “consumer” for brevity, but because the sample was drawn from a random sample of consumer credit records from one nationwide credit repository, the sample and population are, more precisely, consumers with a credit record from that firm. Prior Bureau research indicates that one in ten adult Americans do not have a credit record.
4 Specifically, the survey asked about consumers’ experiences with debt collection in the period since January 2014, roughly one year before the survey was conducted.
5 CONSUMER EXPERIENCES WITH DEBT COLLECTION
notably administrative data linked to the surveys, are noted in the text. The survey
questionnaire is appended to this report.
The following is a summary of the key findings:
About one-in-three consumers with a credit record (32 percent) indicated that they had
been contacted by at least one creditor or collector trying to collect one or more debts
during the year prior to the survey. Most of these consumers (72 percent) reported that
they had been contacted about two or more debts.
Past-due medical bills, credit cards, and student loans were among the most frequently
cited debts consumers were contacted about. The prevalence of contacts about credit
cards and student loans in collection differed across demographic and credit-score
groups. In contrast, the shares of consumers who were contacted about past-due medical
bills were more comparable across income levels, credit scores, and ages.
More than half of consumers (53 percent) who were contacted about a debt in collection
in the past year indicated that the debt was not theirs, was owed by a family member, or
was for the wrong amount. Roughly one-quarter (27 percent) of consumers who were
contacted about a debt in collection reported having disputed a debt with their creditor
or collector in the past year.
About one-in-seven consumers (15 percent) who were contacted about a debt in
collection reported having been sued by a creditor or debt collector in the preceding year.
Twenty-six percent of consumers who were sued reported that they attended the court
hearing.
More than one-third of consumers (37 percent) contacted about a debt in collection
indicated that the creditor or debt collector that had contacted them most recently
usually tried to reach the consumer at least four times per week and 17 percent reported
that the creditor or collector usually tried to reach them at least eight times per week.
Close to two-thirds of consumers (63 percent) contacted by a creditor or debt collector
said they were contacted too often.
Forty-two percent of consumers with collection experience in the past year said they had
asked at least one creditor or collector to stop contacting them. One-in-four consumers
who made this request reported that the contact stopped.
6 CONSUMER EXPERIENCES WITH DEBT COLLECTION
Consumers most commonly indicated that they would prefer to be contacted about a
debt in collection by letter or phone. Consumers most commonly identified in-person
contacts as the way they would least like to be contacted.
Consumers feel it is important that others not overhear a message about their debt from
a creditor or debt collector. At the same time, most consumers also want the creditor or
debt collector to include, for example, their name and the purpose of the call (debt
collection) on a voicemail or answering machine.
Consumers tend to take a more favorable view of creditors seeking to collect a debt than
of debt collectors. Consumers were more likely to report that debt collectors contacted
them too frequently compared with consumers contacted with the same frequency by a
creditor. Consumers contacted by debt collectors were more likely than those contacted
by creditors to report negative experiences such as being treated impolitely or
threatened.
The rest of this report is organized as follows. Section 2 details the methodology and the types of
questions asked in the survey. Section 3 discusses the prevalence of debt collections, as well as
the extent to which consumers dispute debts and the extent to which creditors or collectors
pursue the collection of debt through lawsuits. In many cases, these results are broken out based
on selected consumer characteristics. Sections 4 and 5 detail survey responses related to how the
creditor or collector communicated with consumers for their most recent debt collection and
how the consumer would prefer to communicate regarding a debt collection. The final section of
the report compares the responses for consumers based on whether the consumer’s most recent
collections-related contact was from the original creditor or from a debt collector.
7 CONSUMER EXPERIENCES WITH DEBT COLLECTION
2. Sample and survey design, response rates, and weights
2.1 Sample design The sample for the survey was selected from the Bureau’s Consumer Credit Panel (CCP), a 1-in-
48 random and deidentified sample of credit records maintained by one of the top three
nationwide credit repositories.5 The credit repository associated the survey responses to CCP
information through a process that preserved the confidentiality of consumers in the survey
sample, survey responses, and credit record information.6
5 The CCP excludes any information that might reveal consumers’ identities, such as names, addresses, and Social Security numbers. For more information on the privacy protections associated with this survey, see the Consumer Experience Research Privacy Impact Assessment, available at http://files.consumerfinance.gov/f/201406_cfpb_consumer-experience-research_pia.pdf and System of Records Notice CFPB.022, Market and Consumer Research Records, available at http://www.consumerfinance.gov/privacy/system-records-notices/market-and-consumer-research-records-2/.
6 The Bureau selected the survey sample and informed the credit repository which credit records were selected. The credit repository (which, unlike the Bureau, has name and address information associated with each record) mailed the survey to the consumer associated with each sampled credit record. Survey responses were collected by the credit repository’s subcontractor, who removed any direct personally identifying information and other potentially identifying information that respondents may have inadvertently included. The subcontractor converted the
8 CONSUMER EXPERIENCES WITH DEBT COLLECTION
This approach has several advantages. In a simple random sample, most consumers would not
have had a recent debt collection. To ensure that the survey included a sufficient number of
responses from consumers who had experienced debt collection, credit records with a recent 60-
day delinquency on a loan, a reported collection, or both as of September 2014 were sampled at
a higher rate than other records. By disproportionately sampling records with 60-day
delinquencies, the survey captured not only consumers with a collection tradeline, but also those
who might be delinquent with a creditor and thus may experience collection efforts even though
they do not have a collection tradeline on their credit record. The survey weights account for the
different sampling rates (see below), so the survey results presented here are representative of
all consumers with a credit record.
Associating the survey responses to CCP information such as credit score, age, and recent
delinquencies strengthens the survey in two additional ways. First, this information is captured
for consumers who did not respond to the survey as well as for those who responded. Statistical
bias in estimates due to nonresponse is a concern for almost all surveys. The information
contained in credit records provides a stronger basis to examine and to adjust for potential
nonresponse bias than is generally available in most surveys, which typically do not have
similarly extensive information for both respondents and non-respondents. The results reported
here are weighted to adjust for nonresponse bias (see below). Second, in some cases,
information from credit records can be brought to bear in reviewing, editing, and statistical
processing of incomplete or ambiguous survey responses.
2.2 Survey questionnaire and topics The survey questionnaire comprised 67 questions covering seven topic areas. The final
questionnaire reflected public comments on a proposed questionnaire which was published as
responses into an electronic format, and transmitted the data to the credit repository which provided the response data to the Bureau along with the CCP-specific encrypted record identifier.
9 CONSUMER EXPERIENCES WITH DEBT COLLECTION
part of the process of obtaining approval to conduct the survey under the Paperwork Reduction
Act and also findings from cognitive testing of the proposed survey questionnaire. All consumers
were asked to complete sections A, F, and G. Section A asked about consumers’ general financial
situation and credit-market experiences. Section F assessed preferences for ways that creditors
or collectors could contact the consumer (for example, home phone, cell phone, letter, or email).
Finally, Section G collected data on demographic characteristics, annual household income, and
demographic or economic events that the household had experienced in the prior year.
Questions in sections B through E pertained only to consumers who indicated that a creditor or
debt collector had contacted them in the prior year about a debt in collection.7 Section B asked
about all such collection attempts in the past year, including the types of debt in collection,
whether the consumer paid a debt after being contacted, and whether the consumer felt any of
the collection attempts were in error.
The questions in Section C focused on details of the most recent collection attempt, including
the ways in which the consumer was contacted, the frequency of contacts, and whether the
creditor or a debt collector was pursuing payment. Section C also solicited consumers’ views on,
for example, whether the creditor or debt collector had been polite, provided accurate
information, or had contacted the consumer too often.
Section D focused on disputed debts.8 The section examined, for example, how and why
consumers disputed debts as well as the creditor’s or collector’s response to the dispute.
7 The questions in these sections and elsewhere about consumers’ experiences asked, specifically, about the period since January 2014, roughly one year before the survey was conducted.
8 The survey said that “People may dispute a debt by telling the creditor or debt collector, for example, that the debt is not theirs, that the amount is wrong, or that something else about the debt is incorrect.” The consumers’ perspectives on whether they had disputed a debt may differ from the definition of dispute used by a given creditor or collector, or what may constitute disputes pursuant to the Fair Credit Reporting Act (FCRA) or Fair Debt Collection Practices Act (FDCPA).
10 CONSUMER EXPERIENCES WITH DEBT COLLECTION
Section E collected information on the prevalence of collections-related lawsuits and whether
consumers who were sued attended the court hearing.
2.3 Data collection protocol The survey proceeded in two phases and was sent to a total of 10,876 consumers. First, to gauge
the potential success of the survey, the Bureau conducted a pilot survey of 997 consumers in
December 2014. Responses from the pilot indicated that consumers could follow the question
sequences and were willing to complete the survey. With the success of the pilot, the main
survey of 9,879 consumers began in mid-January 2015, and data collection continued into
March 2015. For both the pilot and main surveys, the invitation and reminder letters were in
both English and Spanish, and consumers were given the option to complete the survey in
English, either on paper or online. The main survey additionally included an online Spanish
option.
The survey protocol was approved by the Office of Management and Budget as required under
the Paperwork Reduction Act of 1995.9 The protocol for the main survey started with a mailed
cover letter, paper questionnaire, and respondent incentive. The letter and questionnaire
contained an option to take the survey online. A reminder letter was sent in week two. In week
five, another letter, replacement questionnaire, and incentive were sent to those who had not yet
responded. A final reminder was sent in week seven. The pilot survey used a slightly abbreviated
protocol, but the questionnaires for the pilot and main surveys were identical, so the results
presented in this report combine responses from both.
9 The survey was assigned OMB Control Number 3170-0047.
11 CONSUMER EXPERIENCES WITH DEBT COLLECTION
2.4 Response rates About 20 percent of consumers invited to complete the survey did so, yielding a sample of 2,132
survey responses. About ten percent of responses (from 226 consumers) were received online,
and the rest were returned by mail. The response rate varied by several key variables available in
the CCP. For example, the response rate for consumers whose credit record contained a new 60-
day past-due loan or a newly reported collection in the prior year was about 15 percent. By
comparison, 30 percent of sampled consumers whose credit record did not include a new
delinquency or collection responded to the survey. This difference in response rates might be
expected because potentially negative financial information—including debt and debt collection,
in particular—is a sensitive topic to many consumers. Finally, the response rate for consumers
who appear to have moved from one census tract to another between September 2014 and
March 2015 was 13 percent, which was about eight percentage points lower than the response
rate for other consumers.
2.5 Statistical adjustments and considerations
As described, different segments were sampled from the CCP at different rates, and survey
response rates varied by characteristics of credit records. The survey data are, therefore,
weighted to account for both the differential sampling and the differential nonresponse. A
variety of variables which are available in the CCP can be used to facilitate weighting to account
for differential nonresponse. The weights used in all of the analyses combine selection weights
(to account for the fact that certain segments were sampled at higher rates than others) and
nonresponse adjustment weights (to account for differences in response rates). These combined
weights ensure that the weighted distributions for the sample of respondents align with the CCP
for key variables. Such weighting procedures reduce the risk of significant bias in generalizing
from the sample of respondents to the broader population of consumers with credit records.
A key aim of the survey was to gain a basis for examining how consumers’ experiences with debt
collection processes vary. The report illustrates this variation by presenting estimates for several
groups of consumers defined by demographic or credit characteristics. These results are
intended to be descriptive and to highlight patterns that may be of policy interest as they add to
the Bureau’s and other researchers’ understanding of consumers’ experiences with the debt
12 CONSUMER EXPERIENCES WITH DEBT COLLECTION
collection process. Differences across groups may reflect a variety of factors that may be
correlated with demographic or credit characteristics. This report does not attempt to
disentangle the underlying sources of these differences. In addition, although the analysis
sought to ensure reasonable sample size in calculations, the report does not present standard
errors or statements about the statistical significance of the differences.
The Bureau intends to report additional technical documentation of the survey methodology
and expects that the survey will form the basis for both further descriptive studies as well as in-
depth analyses of consumer finances and financial decisionmaking. As noted in the original
material presented to the OMB, the Bureau intends to release a public version of the data if it
can do so while protecting the confidentiality of survey respondents.10
10 The estimates in future reports or in a public release file may differ slightly from those reported here as the Bureau’s researchers may revise the weighting, editing, or statistical processing of the survey responses as they continue to work with the data. The Bureau does not expect that any such changes would substantively alter the estimates.
13 CONSUMER EXPERIENCES WITH DEBT COLLECTION
3. Collections-related contacts, disputes, and lawsuits
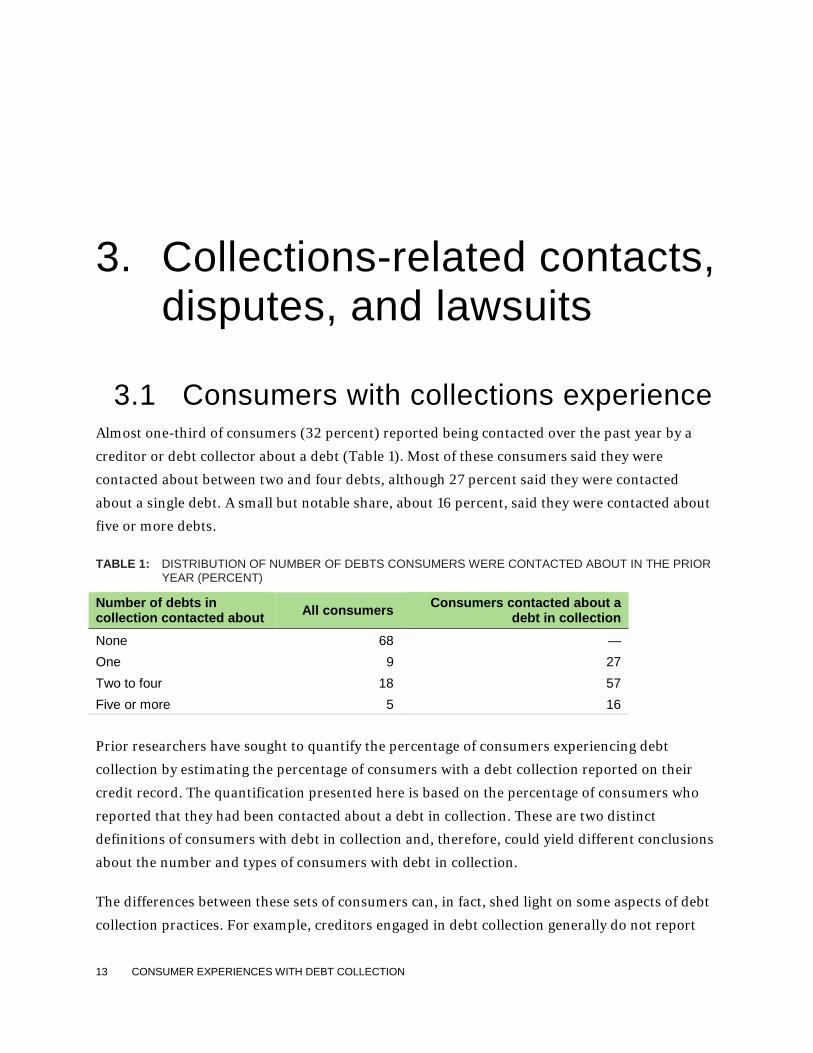
3.1 Consumers with collections experience Almost one-third of consumers (32 percent) reported being contacted over the past year by a
creditor or debt collector about a debt (Table 1). Most of these consumers said they were
contacted about between two and four debts, although 27 percent said they were contacted
about a single debt. A small but notable share, about 16 percent, said they were contacted about
five or more debts.
TABLE 1: DISTRIBUTION OF NUMBER OF DEBTS CONSUMERS WERE CONTACTED ABOUT IN THE PRIOR YEAR (PERCENT)
Number of debts in collection contacted about All consumers Consumers contacted about a
debt in collection None 68 — One 9 27 Two to four 18 57 Five or more 5 16
Prior researchers have sought to quantify the percentage of consumers experiencing debt
collection by estimating the percentage of consumers with a debt collection reported on their
credit record. The quantification presented here is based on the percentage of consumers who
reported that they had been contacted about a debt in collection. These are two distinct
definitions of consumers with debt in collection and, therefore, could yield different conclusions
about the number and types of consumers with debt in collection.
The differences between these sets of consumers can, in fact, shed light on some aspects of debt
collection practices. For example, creditors engaged in debt collection generally do not report
14 CONSUMER EXPERIENCES WITH DEBT COLLECTION
collection tradelines; rather, they either report the status of the underlying loan (where
applicable) or do not report at all. Debt collectors may also refrain from reporting their
collections activity—especially if there is an underlying loan that is being reported by the
creditor—or, they may not report collection tradelines with respect to debts that have been paid.
On the other hand, debt collectors may report collection tradelines even though the collectors
are not actively attempting to collect.11
The combined survey-CCP data suggest that, in fact, many collections may not be reported to
the nationwide credit repositories as collection tradelines since, for example, nearly 80 percent
of consumers who reported having been contacted about a single debt in collection in the past
year did not have a new collection tradeline reported between January 2014 and March 2015
(Table 2). About half of consumers who indicated they had been contacted about more than one
debt in collection in the past year had no new collection tradeline that appeared on their credit
records in the prior fifteen months.12
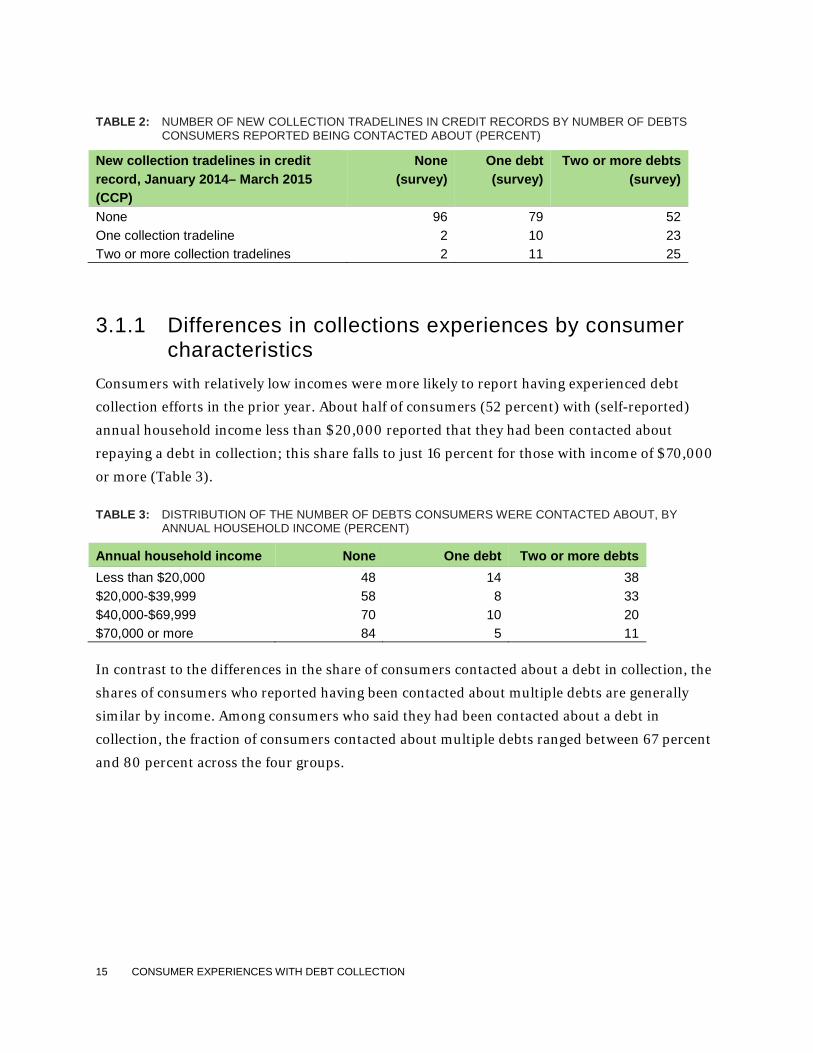
At the same time, it is noteworthy that ninety-six percent of consumers who indicated they had
not been contacted by a creditor or collector in the prior year did not have any new collection
tradelines in the prior year (Table 2). The fact that the vast majority of consumers who were not
contacted about a debt in collection in the past year did not have a new collection tradeline
provides confidence in the accuracy of the survey responses and illustrates the ability to
effectively sample types of consumers of particular interest when using credit record data as a
sampling frame for surveys related to debt and consumer finances.
11 The Bureau previously has reported on the practice known as “passive collections” that involves reporting a debt in collections to one or more credit repositories and simply waiting for the consumer to discover the collection tradeline (rather than actively seeking to collect from the consumer). See CFPB, “Consumer Credit Reports: A Study of Medical and Non-Medical Collections,” available at http://files.consumerfinance.gov/f/201412_cfpb_reports_consumer-credit-medical-and-non-medical-collections.pdf.
12 Some of these consumers may have been contacted about older debts with collection tradelines that were reported earlier than January 2014.
15 CONSUMER EXPERIENCES WITH DEBT COLLECTION
TABLE 2: NUMBER OF NEW COLLECTION TRADELINES IN CREDIT RECORDS BY NUMBER OF DEBTS CONSUMERS REPORTED BEING CONTACTED ABOUT (PERCENT)
New collection tradelines in credit record, January 2014– March 2015 (CCP)
None (survey)
One debt (survey)
Two or more debts (survey)
None 96 79 52 One collection tradeline 2 10 23 Two or more collection tradelines 2 11 25
3.1.1 Differences in collections experiences by consumer characteristics
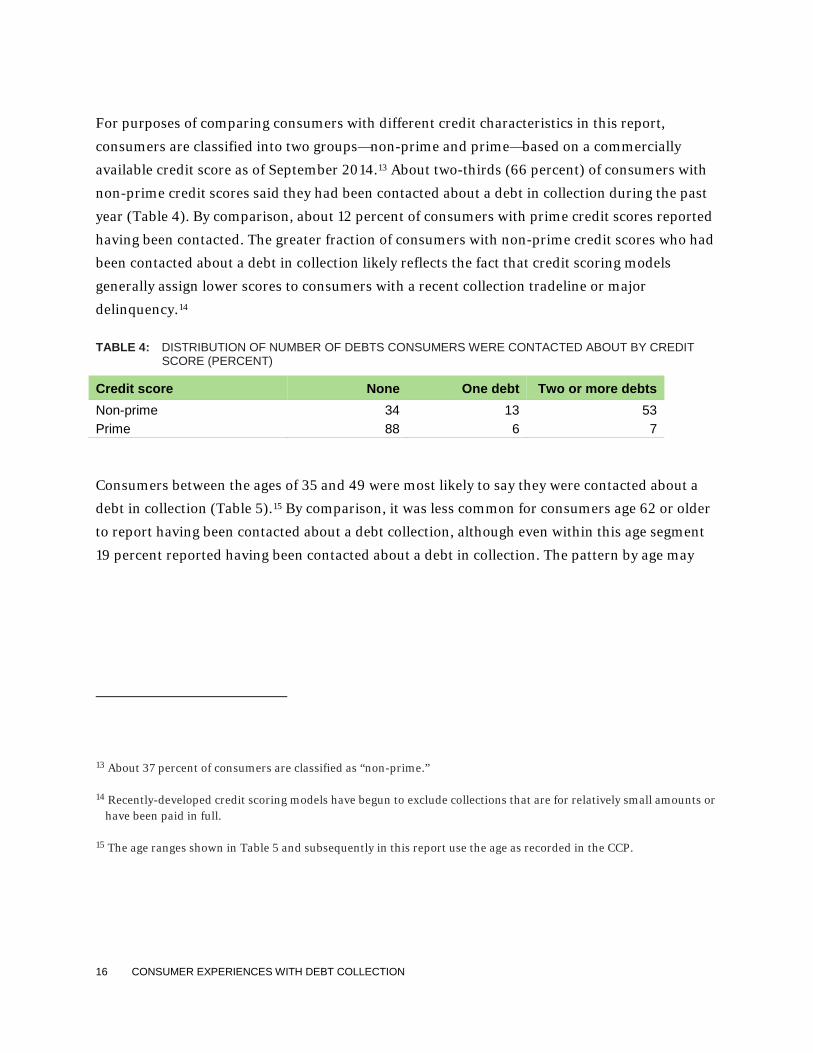
Consumers with relatively low incomes were more likely to report having experienced debt
collection efforts in the prior year. About half of consumers (52 percent) with (self-reported)
annual household income less than $20,000 reported that they had been contacted about
repaying a debt in collection; this share falls to just 16 percent for those with income of $70,000
or more (Table 3).
TABLE 3: DISTRIBUTION OF THE NUMBER OF DEBTS CONSUMERS WERE CONTACTED ABOUT, BY ANNUAL HOUSEHOLD INCOME (PERCENT)
Annual household income None One debt Two or more debts Less than $20,000 48 14 38 $20,000-$39,999 58 8 33 $40,000-$69,999 70 10 20 $70,000 or more 84 5 11 In contrast to the differences in the share of consumers contacted about a debt in collection, the
shares of consumers who reported having been contacted about multiple debts are generally
similar by income. Among consumers who said they had been contacted about a debt in
collection, the fraction of consumers contacted about multiple debts ranged between 67 percent
and 80 percent across the four groups.
16 CONSUMER EXPERIENCES WITH DEBT COLLECTION
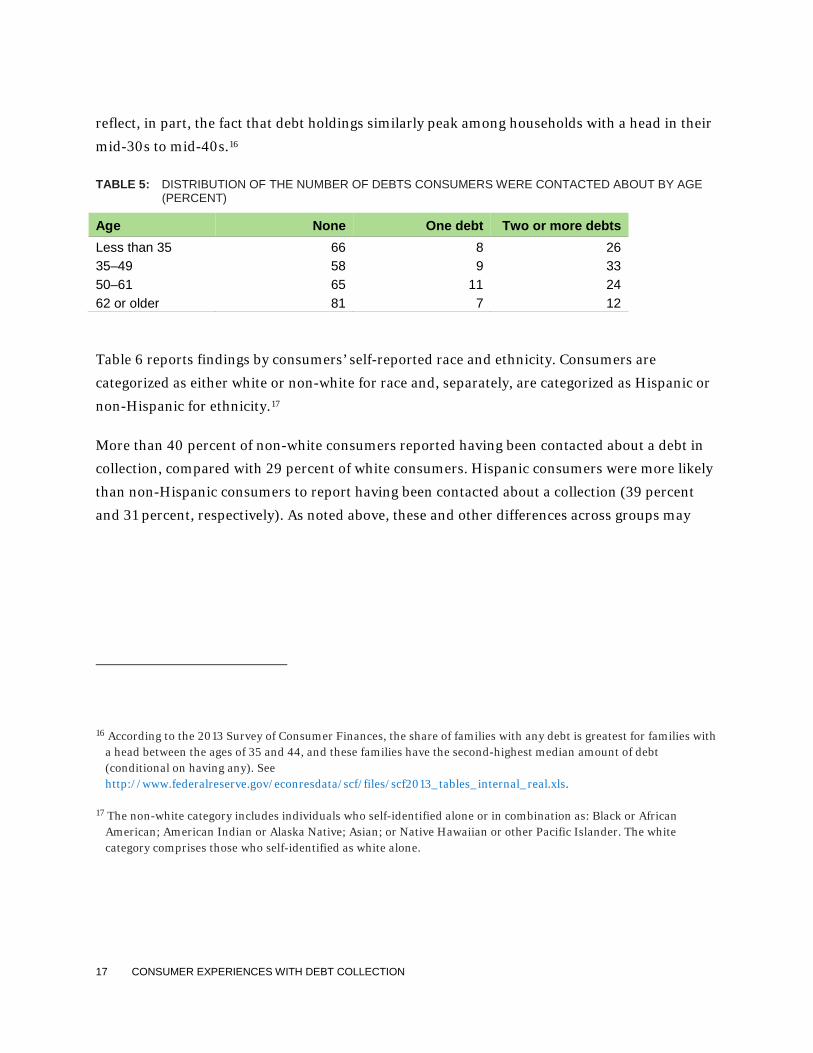
For purposes of comparing consumers with different credit characteristics in this report,
consumers are classified into two groups—non-prime and prime—based on a commercially
available credit score as of September 2014.13 About two-thirds (66 percent) of consumers with
non-prime credit scores said they had been contacted about a debt in collection during the past
year (Table 4). By comparison, about 12 percent of consumers with prime credit scores reported
having been contacted. The greater fraction of consumers with non-prime credit scores who had
been contacted about a debt in collection likely reflects the fact that credit scoring models
generally assign lower scores to consumers with a recent collection tradeline or major
delinquency.14
TABLE 4: DISTRIBUTION OF NUMBER OF DEBTS CONSUMERS WERE CONTACTED ABOUT BY CREDIT SCORE (PERCENT)
Credit score None One debt Two or more debts Non-prime 34 13 53 Prime 88 6 7
Consumers between the ages of 35 and 49 were most likely to say they were contacted about a
debt in collection (Table 5).15 By comparison, it was less common for consumers age 62 or older
to report having been contacted about a debt collection, although even within this age segment
19 percent reported having been contacted about a debt in collection. The pattern by age may
13 About 37 percent of consumers are classified as “non-prime.”
14 Recently-developed credit scoring models have begun to exclude collections that are for relatively small amounts or have been paid in full.
15 The age ranges shown in Table 5 and subsequently in this report use the age as recorded in the CCP.
17 CONSUMER EXPERIENCES WITH DEBT COLLECTION
reflect, in part, the fact that debt holdings similarly peak among households with a head in their
mid-30s to mid-40s.16
TABLE 5: DISTRIBUTION OF THE NUMBER OF DEBTS CONSUMERS WERE CONTACTED ABOUT BY AGE (PERCENT)
Age None One debt Two or more debts Less than 35 66 8 26 35–49 58 9 33 50–61 65 11 24 62 or older 81 7 12
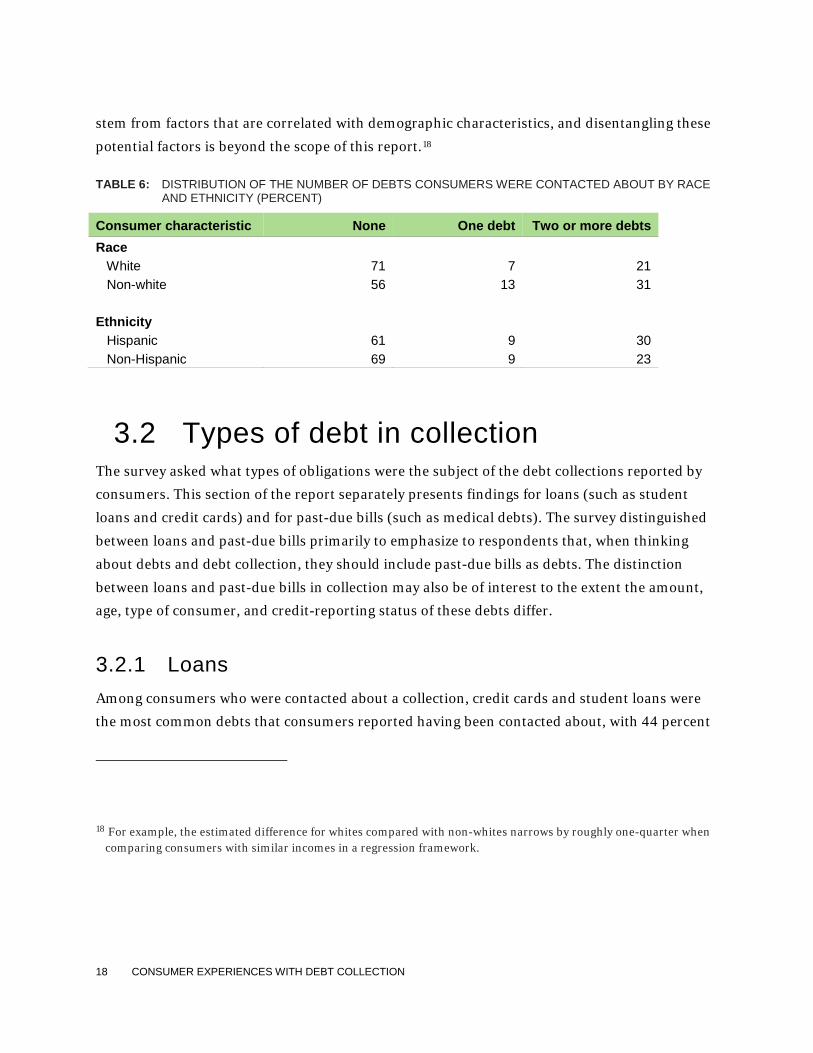
Table 6 reports findings by consumers’ self-reported race and ethnicity. Consumers are
categorized as either white or non-white for race and, separately, are categorized as Hispanic or
non-Hispanic for ethnicity.17
More than 40 percent of non-white consumers reported having been contacted about a debt in
collection, compared with 29 percent of white consumers. Hispanic consumers were more likely
than non-Hispanic consumers to report having been contacted about a collection (39 percent
and 31 percent, respectively). As noted above, these and other differences across groups may
16 According to the 2013 Survey of Consumer Finances, the share of families with any debt is greatest for families with a head between the ages of 35 and 44, and these families have the second-highest median amount of debt (conditional on having any). See http://www.federalreserve.gov/econresdata/scf/files/scf2013_tables_internal_real.xls.
17 The non-white category includes individuals who self-identified alone or in combination as: Black or African American; American Indian or Alaska Native; Asian; or Native Hawaiian or other Pacific Islander. The white category comprises those who self-identified as white alone.
18 CONSUMER EXPERIENCES WITH DEBT COLLECTION
stem from factors that are correlated with demographic characteristics, and disentangling these
potential factors is beyond the scope of this report.18
TABLE 6: DISTRIBUTION OF THE NUMBER OF DEBTS CONSUMERS WERE CONTACTED ABOUT BY RACE AND ETHNICITY (PERCENT)
Consumer characteristic None One debt Two or more debts Race White 71 7 21 Non-white 56 13 31 Ethnicity Hispanic 61 9 30 Non-Hispanic 69 9 23
3.2 Types of debt in collection The survey asked what types of obligations were the subject of the debt collections reported by
consumers. This section of the report separately presents findings for loans (such as student
loans and credit cards) and for past-due bills (such as medical debts). The survey distinguished
between loans and past-due bills primarily to emphasize to respondents that, when thinking
about debts and debt collection, they should include past-due bills as debts. The distinction
between loans and past-due bills in collection may also be of interest to the extent the amount,
age, type of consumer, and credit-reporting status of these debts differ.
3.2.1 Loans Among consumers who were contacted about a collection, credit cards and student loans were
the most common debts that consumers reported having been contacted about, with 44 percent
18 For example, the estimated difference for whites compared with non-whites narrows by roughly one-quarter when comparing consumers with similar incomes in a regression framework.
19 CONSUMER EXPERIENCES WITH DEBT COLLECTION
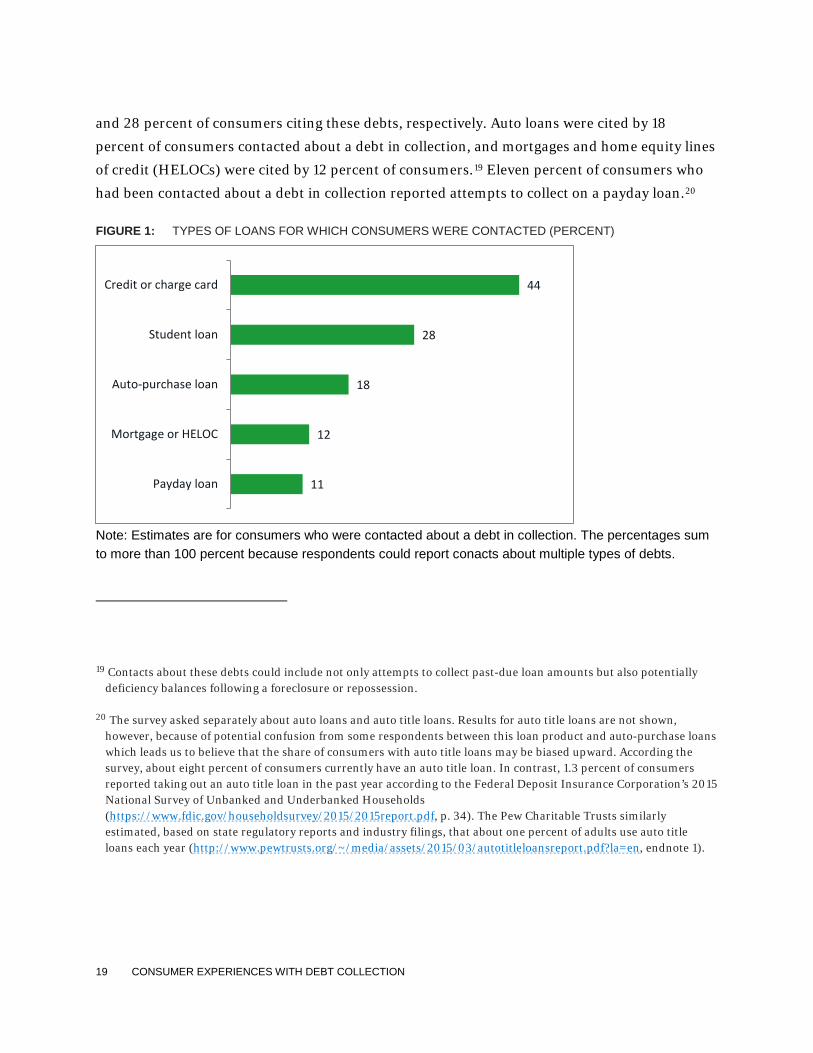
and 28 percent of consumers citing these debts, respectively. Auto loans were cited by 18
percent of consumers contacted about a debt in collection, and mortgages and home equity lines
of credit (HELOCs) were cited by 12 percent of consumers.19 Eleven percent of consumers who
had been contacted about a debt in collection reported attempts to collect on a payday loan.20
FIGURE 1: TYPES OF LOANS FOR WHICH CONSUMERS WERE CONTACTED (PERCENT)
Note: Estimates are for consumers who were contacted about a debt in collection. The percentages sum to more than 100 percent because respondents could report conacts about multiple types of debts.
19 Contacts about these debts could include not only attempts to collect past-due loan amounts but also potentially deficiency balances following a foreclosure or repossession.
20 The survey asked separately about auto loans and auto title loans. Results for auto title loans are not shown, however, because of potential confusion from some respondents between this loan product and auto-purchase loans which leads us to believe that the share of consumers with auto title loans may be biased upward. According the survey, about eight percent of consumers currently have an auto title loan. In contrast, 1.3 percent of consumers reported taking out an auto title loan in the past year according to the Federal Deposit Insurance Corporation’s 2015 National Survey of Unbanked and Underbanked Households (https://www.fdic.gov/householdsurvey/2015/2015report.pdf, p. 34). The Pew Charitable Trusts similarly estimated, based on state regulatory reports and industry filings, that about one percent of adults use auto title loans each year (http://www.pewtrusts.org/~/media/assets/2015/03/autotitleloansreport.pdf?la=en, endnote 1).
11
12
18
28
44
Payday loan
Mortgage or HELOC
Auto-purchase loan
Student loan
Credit or charge card
20 CONSUMER EXPERIENCES WITH DEBT COLLECTION
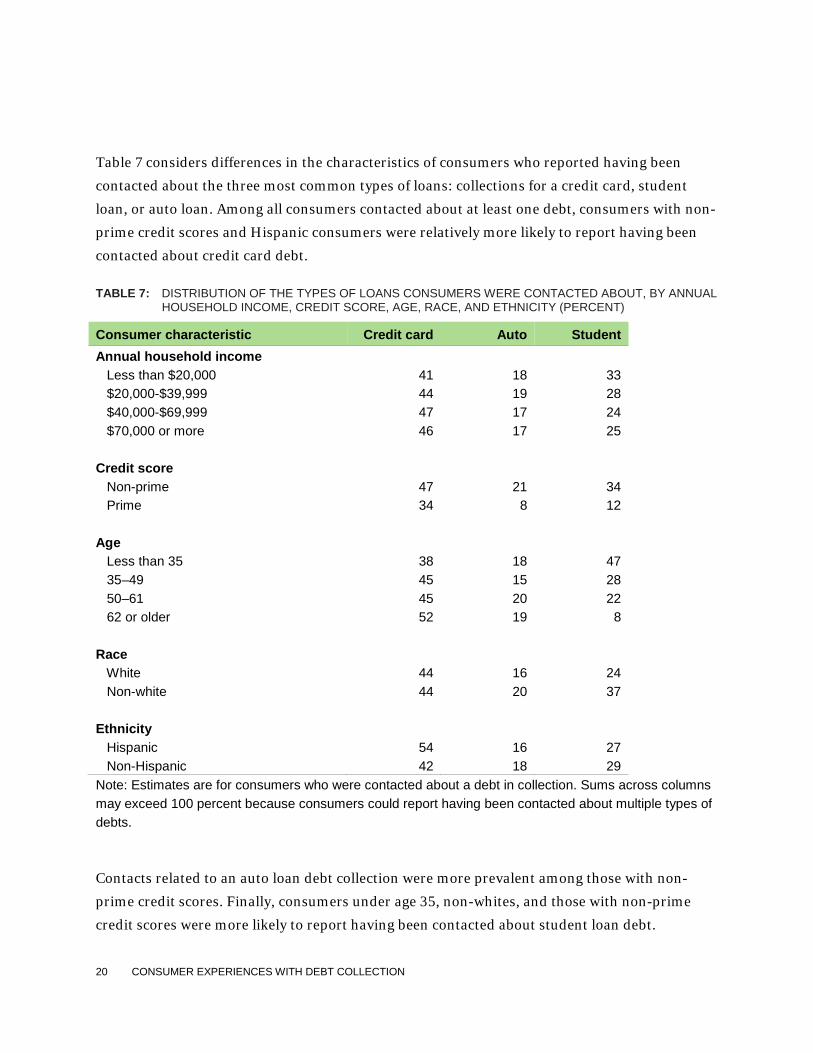
Table 7 considers differences in the characteristics of consumers who reported having been
contacted about the three most common types of loans: collections for a credit card, student
loan, or auto loan. Among all consumers contacted about at least one debt, consumers with non-
prime credit scores and Hispanic consumers were relatively more likely to report having been
contacted about credit card debt.
TABLE 7: DISTRIBUTION OF THE TYPES OF LOANS CONSUMERS WERE CONTACTED ABOUT, BY ANNUAL HOUSEHOLD INCOME, CREDIT SCORE, AGE, RACE, AND ETHNICITY (PERCENT)
Consumer characteristic Credit card Auto Student Annual household income Less than $20,000 41 18 33 $20,000-$39,999 44 19 28 $40,000-$69,999 47 17 24 $70,000 or more 46 17 25 Credit score Non-prime 47 21 34 Prime 34 8 12 Age Less than 35 38 18 47 35–49 45 15 28 50–61 45 20 22 62 or older 52 19 8 Race White 44 16 24 Non-white 44 20 37 Ethnicity Hispanic 54 16 27 Non-Hispanic 42 18 29 Note: Estimates are for consumers who were contacted about a debt in collection. Sums across columns may exceed 100 percent because consumers could report having been contacted about multiple types of debts.
Contacts related to an auto loan debt collection were more prevalent among those with non-
prime credit scores. Finally, consumers under age 35, non-whites, and those with non-prime
credit scores were more likely to report having been contacted about student loan debt.
21 CONSUMER EXPERIENCES WITH DEBT COLLECTION
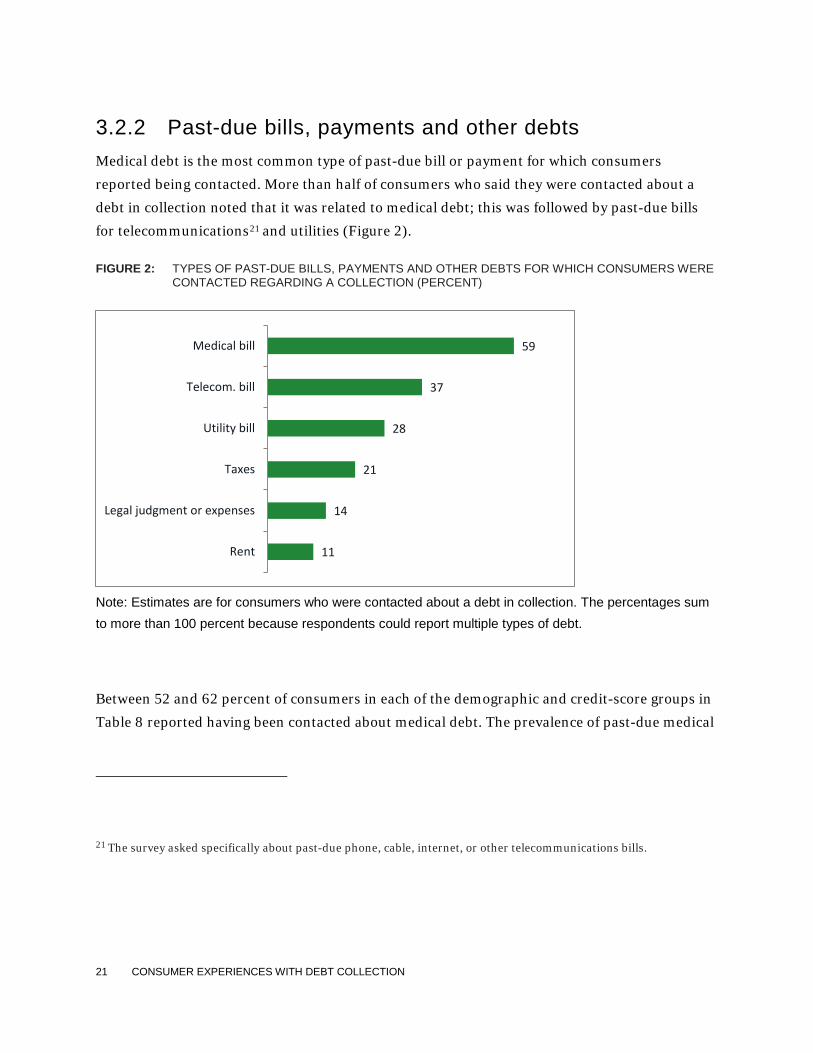
3.2.2 Past-due bills, payments and other debts Medical debt is the most common type of past-due bill or payment for which consumers
reported being contacted. More than half of consumers who said they were contacted about a
debt in collection noted that it was related to medical debt; this was followed by past-due bills
for telecommunications21 and utilities (Figure 2).
FIGURE 2: TYPES OF PAST-DUE BILLS, PAYMENTS AND OTHER DEBTS FOR WHICH CONSUMERS WERE CONTACTED REGARDING A COLLECTION (PERCENT)
Note: Estimates are for consumers who were contacted about a debt in collection. The percentages sum to more than 100 percent because respondents could report multiple types of debt.
Between 52 and 62 percent of consumers in each of the demographic and credit-score groups in
Table 8 reported having been contacted about medical debt. The prevalence of past-due medical
21 The survey asked specifically about past-due phone, cable, internet, or other telecommunications bills.
11
14
21
28
37
59
Rent
Legal judgment or expenses
Taxes
Utility bill
Telecom. bill
Medical bill
22 CONSUMER EXPERIENCES WITH DEBT COLLECTION
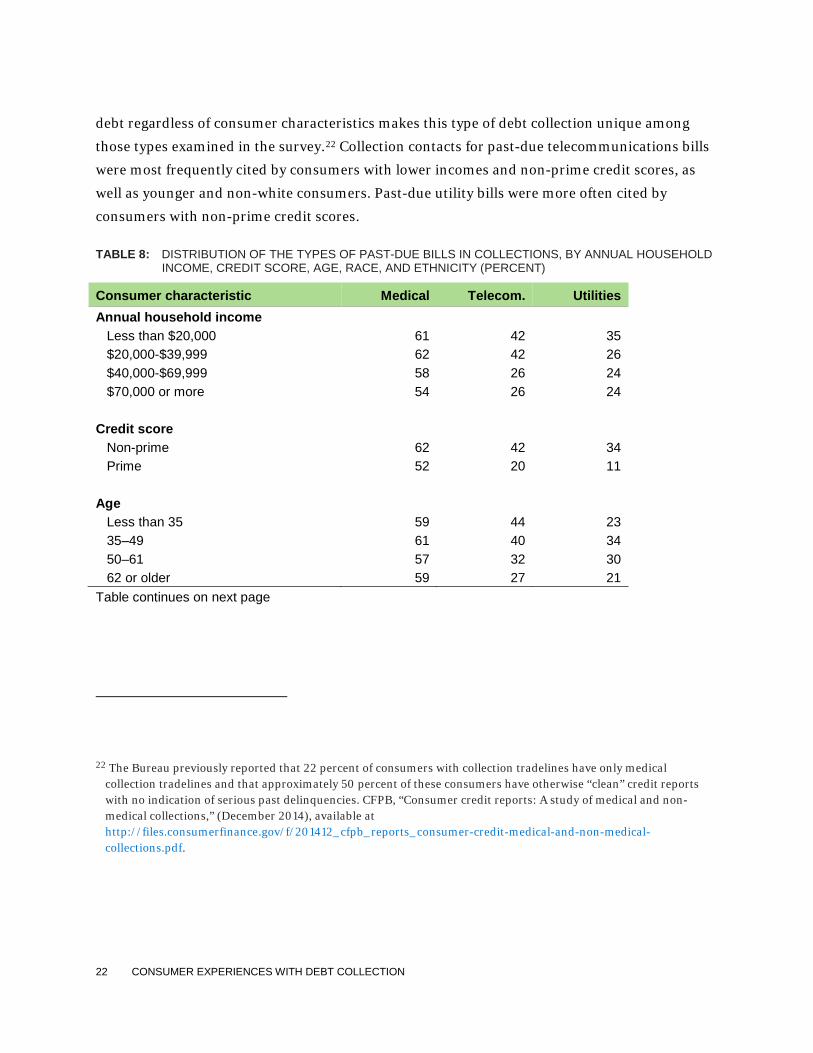
debt regardless of consumer characteristics makes this type of debt collection unique among
those types examined in the survey.22 Collection contacts for past-due telecommunications bills
were most frequently cited by consumers with lower incomes and non-prime credit scores, as
well as younger and non-white consumers. Past-due utility bills were more often cited by
consumers with non-prime credit scores.
TABLE 8: DISTRIBUTION OF THE TYPES OF PAST-DUE BILLS IN COLLECTIONS, BY ANNUAL HOUSEHOLD INCOME, CREDIT SCORE, AGE, RACE, AND ETHNICITY (PERCENT)
Consumer characteristic Medical Telecom. Utilities Annual household income Less than $20,000 61 42 35 $20,000-$39,999 62 42 26 $40,000-$69,999 58 26 24 $70,000 or more 54 26 24 Credit score Non-prime 62 42 34 Prime 52 20 11 Age Less than 35 59 44 23 35–49 61 40 34 50–61 57 32 30 62 or older 59 27 21 Table continues on next page
22 The Bureau previously reported that 22 percent of consumers with collection tradelines have only medical collection tradelines and that approximately 50 percent of these consumers have otherwise “clean” credit reports with no indication of serious past delinquencies. CFPB, “Consumer credit reports: A study of medical and non-medical collections,” (December 2014), available at http://files.consumerfinance.gov/f/201412_cfpb_reports_consumer-credit-medical-and-non-medical-collections.pdf.
23 CONSUMER EXPERIENCES WITH DEBT COLLECTION
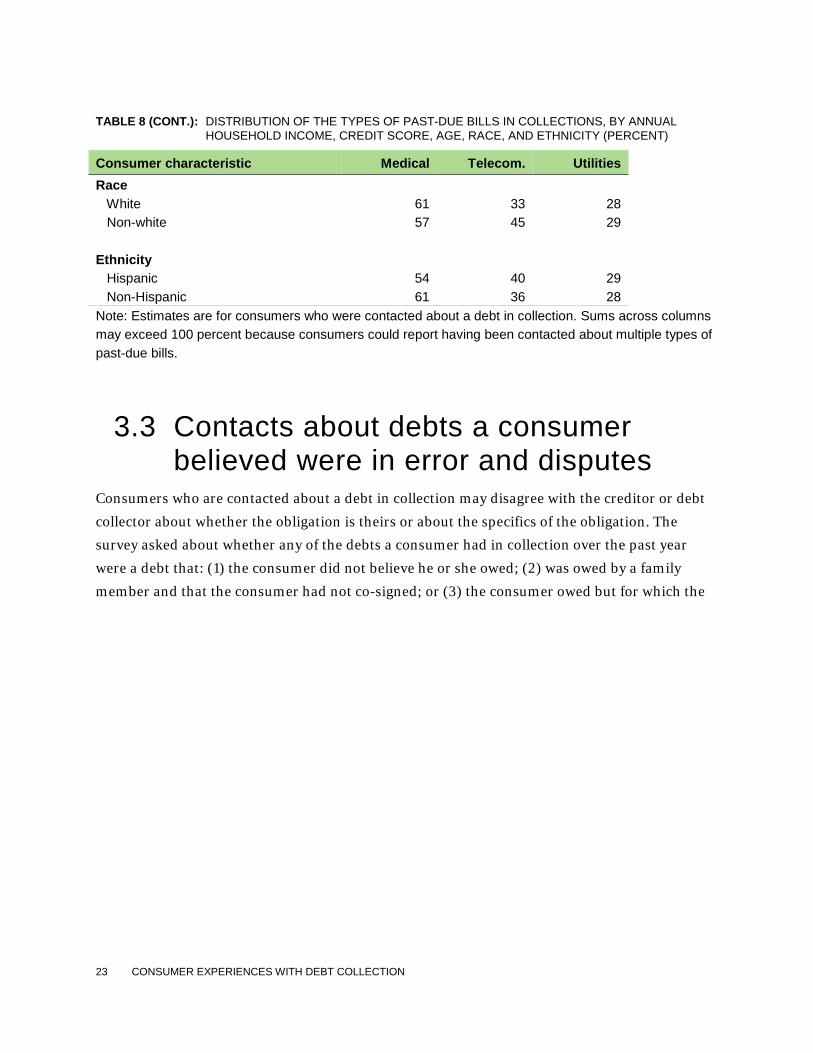
TABLE 8 (CONT.): DISTRIBUTION OF THE TYPES OF PAST-DUE BILLS IN COLLECTIONS, BY ANNUAL HOUSEHOLD INCOME, CREDIT SCORE, AGE, RACE, AND ETHNICITY (PERCENT)
Consumer characteristic Medical Telecom. Utilities Race White 61 33 28 Non-white 57 45 29 Ethnicity Hispanic 54 40 29 Non-Hispanic 61 36 28 Note: Estimates are for consumers who were contacted about a debt in collection. Sums across columns may exceed 100 percent because consumers could report having been contacted about multiple types of past-due bills.
3.3 Contacts about debts a consumer believed were in error and disputes
Consumers who are contacted about a debt in collection may disagree with the creditor or debt
collector about whether the obligation is theirs or about the specifics of the obligation. The
survey asked about whether any of the debts a consumer had in collection over the past year
were a debt that: (1) the consumer did not believe he or she owed; (2) was owed by a family
member and that the consumer had not co-signed; or (3) the consumer owed but for which the
24 CONSUMER EXPERIENCES WITH DEBT COLLECTION
amount sought was incorrect.23 The survey included a second set of questions about whether the
consumer had disputed a debt and, if so, the details of the dispute.24
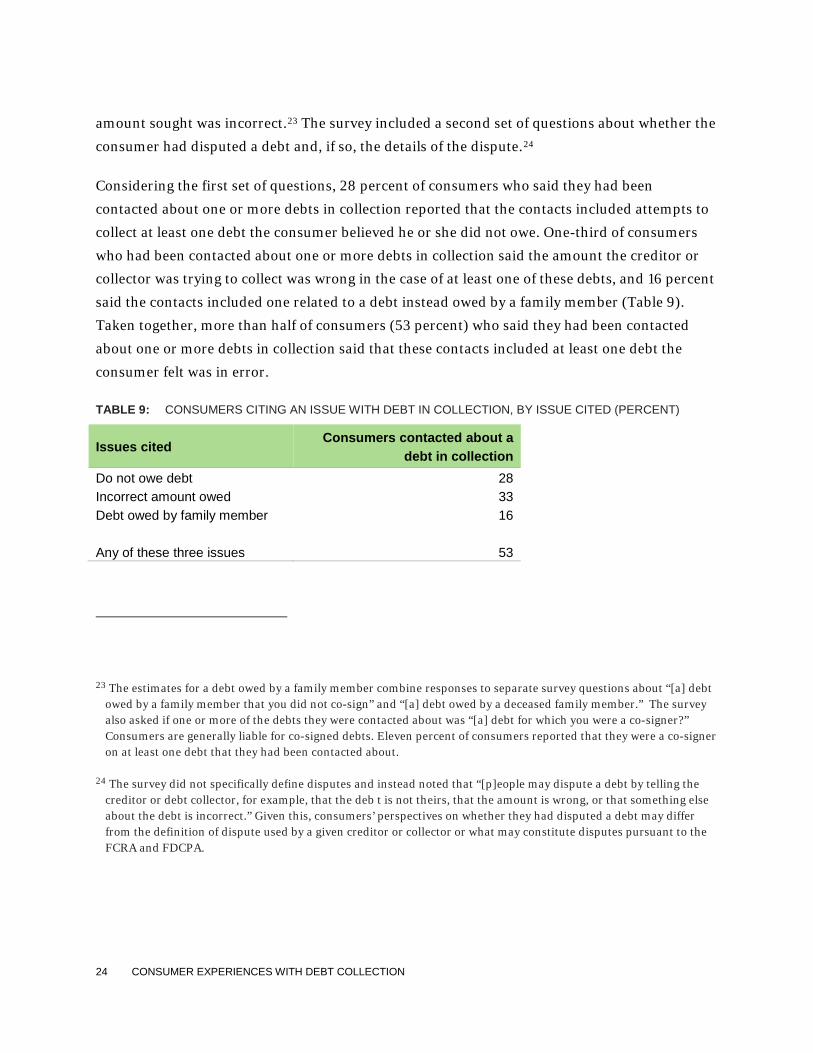
Considering the first set of questions, 28 percent of consumers who said they had been
contacted about one or more debts in collection reported that the contacts included attempts to
collect at least one debt the consumer believed he or she did not owe. One-third of consumers
who had been contacted about one or more debts in collection said the amount the creditor or
collector was trying to collect was wrong in the case of at least one of these debts, and 16 percent
said the contacts included one related to a debt instead owed by a family member (Table 9).
Taken together, more than half of consumers (53 percent) who said they had been contacted
about one or more debts in collection said that these contacts included at least one debt the
consumer felt was in error.
TABLE 9: CONSUMERS CITING AN ISSUE WITH DEBT IN COLLECTION, BY ISSUE CITED (PERCENT)
Issues cited Consumers contacted about a
debt in collection Do not owe debt 28 Incorrect amount owed 33 Debt owed by family member 16 Any of these three issues 53
23 The estimates for a debt owed by a family member combine responses to separate survey questions about “[a] debt owed by a family member that you did not co-sign” and “[a] debt owed by a deceased family member.” The survey also asked if one or more of the debts they were contacted about was “[a] debt for which you were a co-signer?” Consumers are generally liable for co-signed debts. Eleven percent of consumers reported that they were a co-signer on at least one debt that they had been contacted about.
24 The survey did not specifically define disputes and instead noted that “[p]eople may dispute a debt by telling the creditor or debt collector, for example, that the deb t is not theirs, that the amount is wrong, or that something else about the debt is incorrect.” Given this, consumers’ perspectives on whether they had disputed a debt may differ from the definition of dispute used by a given creditor or collector or what may constitute disputes pursuant to the FCRA and FDCPA.
25 CONSUMER EXPERIENCES WITH DEBT COLLECTION
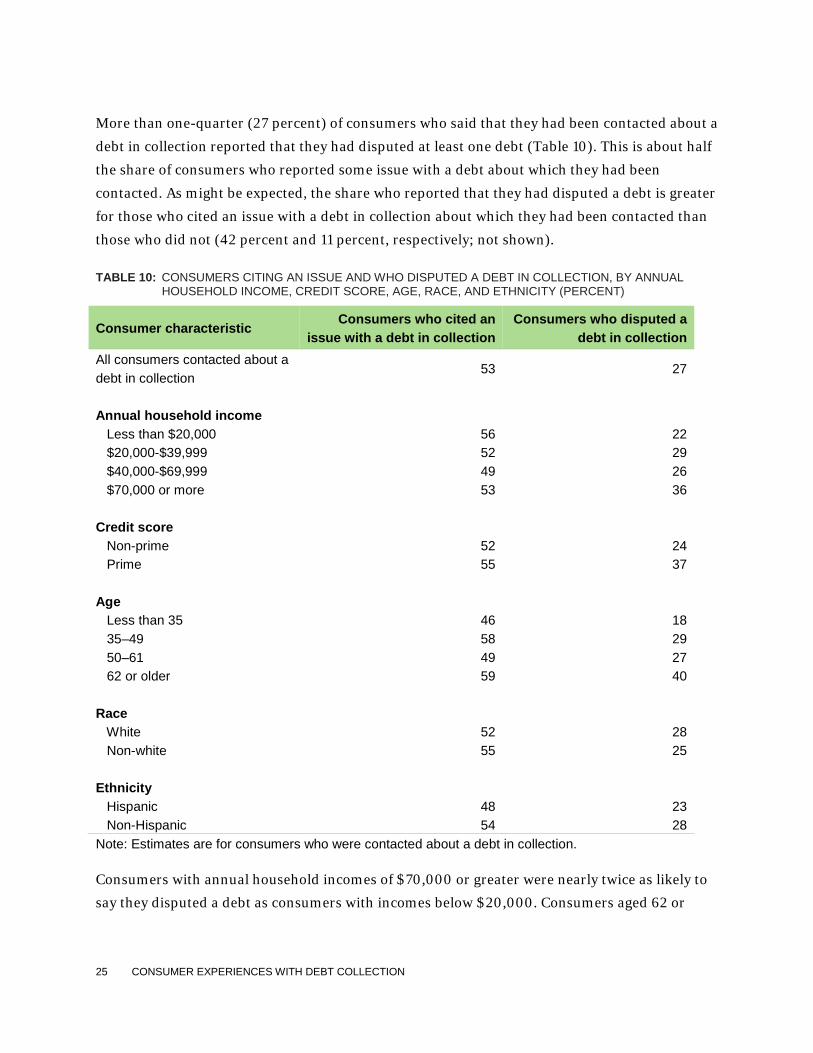
More than one-quarter (27 percent) of consumers who said that they had been contacted about a
debt in collection reported that they had disputed at least one debt (Table 10). This is about half
the share of consumers who reported some issue with a debt about which they had been
contacted. As might be expected, the share who reported that they had disputed a debt is greater
for those who cited an issue with a debt in collection about which they had been contacted than
those who did not (42 percent and 11 percent, respectively; not shown).
TABLE 10: CONSUMERS CITING AN ISSUE AND WHO DISPUTED A DEBT IN COLLECTION, BY ANNUAL HOUSEHOLD INCOME, CREDIT SCORE, AGE, RACE, AND ETHNICITY (PERCENT)
Consumer characteristic Consumers who cited an
issue with a debt in collection Consumers who disputed a
debt in collection All consumers contacted about a debt in collection
53 27
Annual household income Less than $20,000 56 22 $20,000-$39,999 52 29 $40,000-$69,999 49 26 $70,000 or more 53 36 Credit score Non-prime 52 24 Prime 55 37 Age Less than 35 46 18 35–49 58 29 50–61 49 27 62 or older 59 40 Race White 52 28 Non-white 55 25 Ethnicity Hispanic 48 23 Non-Hispanic 54 28 Note: Estimates are for consumers who were contacted about a debt in collection. Consumers with annual household incomes of $70,000 or greater were nearly twice as likely to
say they disputed a debt as consumers with incomes below $20,000. Consumers aged 62 or
26 CONSUMER EXPERIENCES WITH DEBT COLLECTION
older and those with prime credit scores also had higher rates of reported disputes. The shares
of consumers who reported that they had disputed a debt vary more substantially across groups
than do the shares who cited an issue with a debt in collection. This suggests that, for example,
the greater fraction of prime consumers contacted about a debt in collection who had disputed a
debt compared with non-prime consumers is not driven entirely by differences in the likelihood
in having experienced collection efforts the consumer felt were in error.
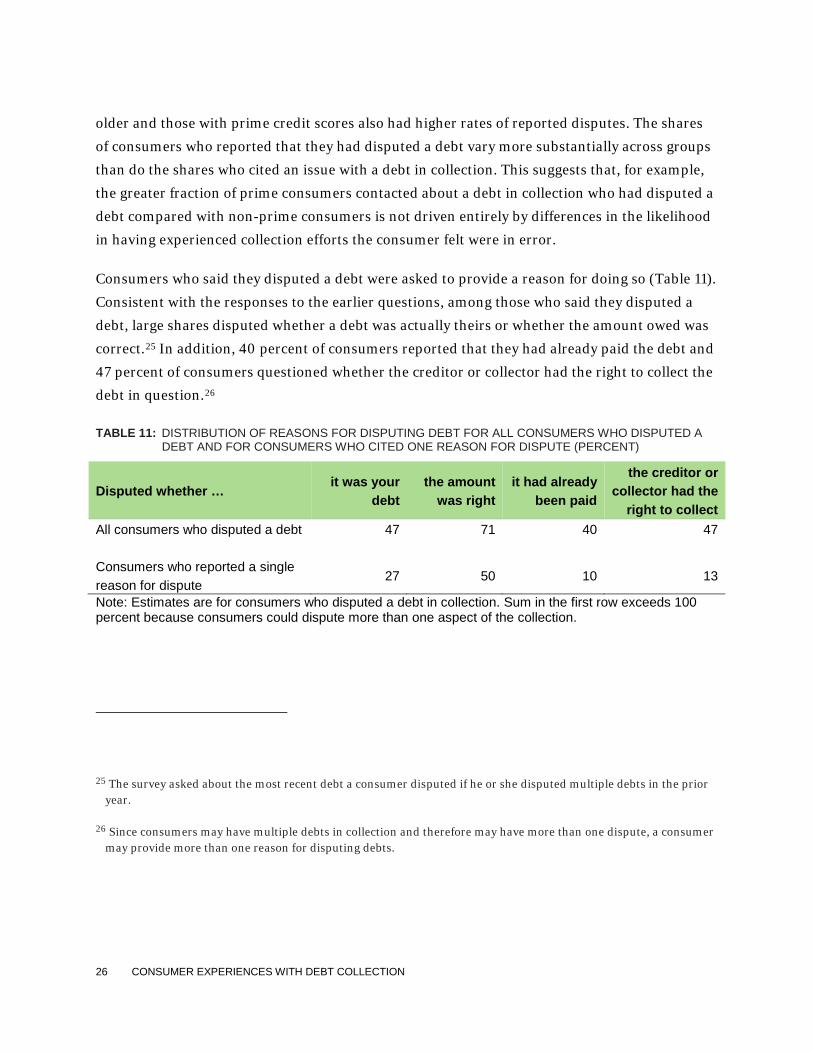
Consumers who said they disputed a debt were asked to provide a reason for doing so (Table 11).
Consistent with the responses to the earlier questions, among those who said they disputed a
debt, large shares disputed whether a debt was actually theirs or whether the amount owed was
correct.25 In addition, 40 percent of consumers reported that they had already paid the debt and
47 percent of consumers questioned whether the creditor or collector had the right to collect the
debt in question.26
TABLE 11: DISTRIBUTION OF REASONS FOR DISPUTING DEBT FOR ALL CONSUMERS WHO DISPUTED A DEBT AND FOR CONSUMERS WHO CITED ONE REASON FOR DISPUTE (PERCENT)
Disputed whether … it was your
debt the amount
was right it had already
been paid
the creditor or collector had the
right to collect All consumers who disputed a debt 47 71 40 47 Consumers who reported a single reason for dispute
27 50 10 13
Note: Estimates are for consumers who disputed a debt in collection. Sum in the first row exceeds 100 percent because consumers could dispute more than one aspect of the collection.
25 The survey asked about the most recent debt a consumer disputed if he or she disputed multiple debts in the prior year.
26 Since consumers may have multiple debts in collection and therefore may have more than one dispute, a consumer may provide more than one reason for disputing debts.
27 CONSUMER EXPERIENCES WITH DEBT COLLECTION
These reasons are not mutually exclusive: a consumer who believed the debt was not his or hers
may also have reported that, therefore, the creditor or collector did not have a right to collect the
debt. Restricting attention to just those consumers who reported a single reason for disputing a
debt, 27 percent said they disputed whether the debt was theirs, and half said they disputed the
amount. Much smaller shares of consumers who cited a single reason for the dispute questioned
whether it had already been paid or the creditor’s or collector’s right to collect.
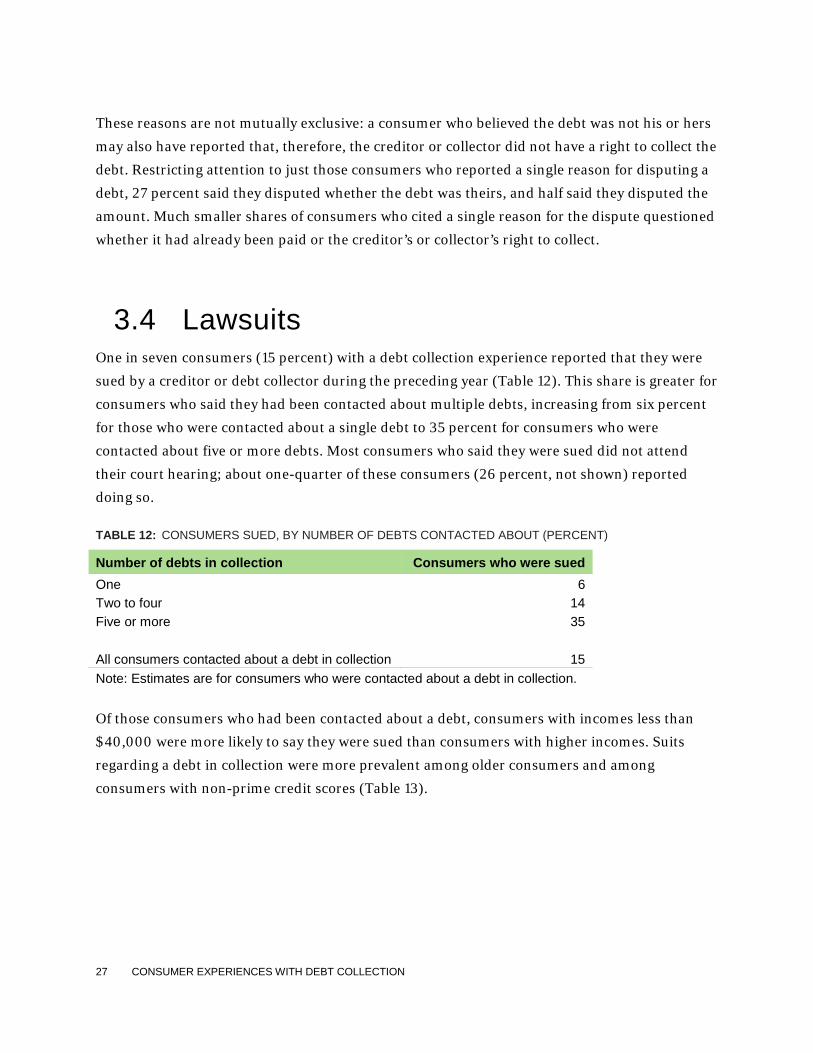
3.4 Lawsuits One in seven consumers (15 percent) with a debt collection experience reported that they were
sued by a creditor or debt collector during the preceding year (Table 12). This share is greater for
consumers who said they had been contacted about multiple debts, increasing from six percent
for those who were contacted about a single debt to 35 percent for consumers who were
contacted about five or more debts. Most consumers who said they were sued did not attend
their court hearing; about one-quarter of these consumers (26 percent, not shown) reported
doing so.
TABLE 12: CONSUMERS SUED, BY NUMBER OF DEBTS CONTACTED ABOUT (PERCENT)
Number of debts in collection Consumers who were sued One 6 Two to four 14 Five or more 35 All consumers contacted about a debt in collection 15 Note: Estimates are for consumers who were contacted about a debt in collection.
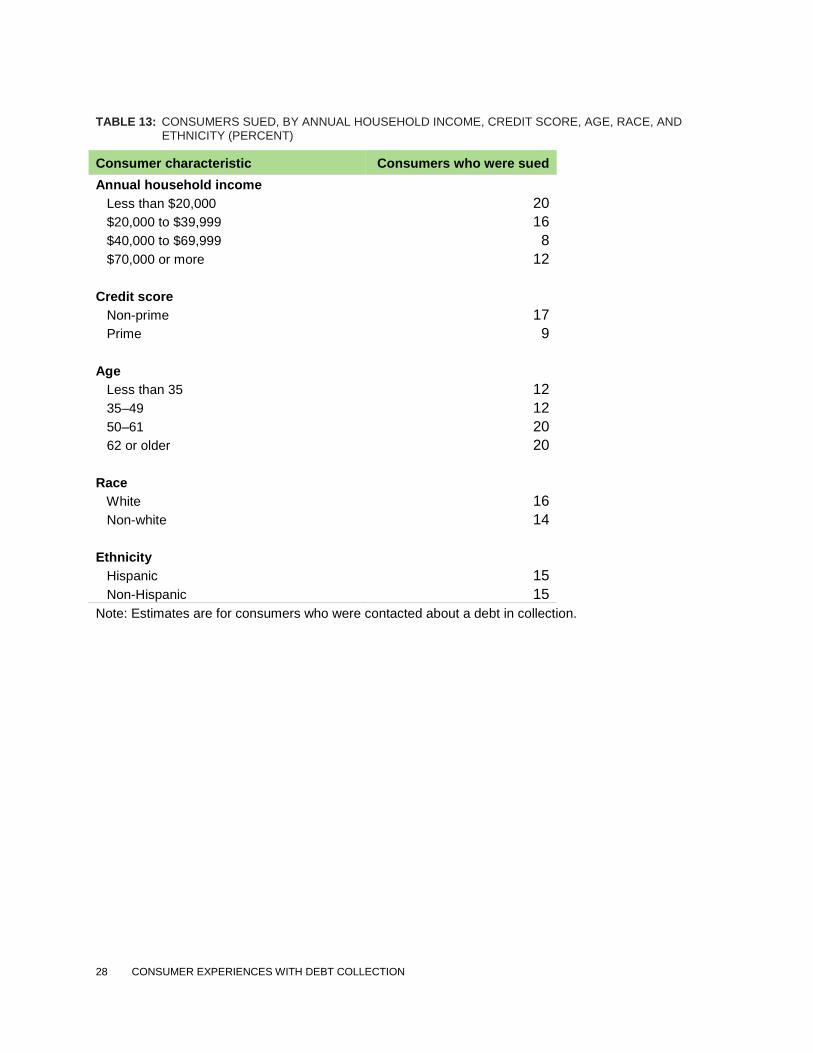
Of those consumers who had been contacted about a debt, consumers with incomes less than
$40,000 were more likely to say they were sued than consumers with higher incomes. Suits
regarding a debt in collection were more prevalent among older consumers and among
consumers with non-prime credit scores (Table 13).
28 CONSUMER EXPERIENCES WITH DEBT COLLECTION
TABLE 13: CONSUMERS SUED, BY ANNUAL HOUSEHOLD INCOME, CREDIT SCORE, AGE, RACE, AND ETHNICITY (PERCENT)
Consumer characteristic Consumers who were sued Annual household income Less than $20,000 20 $20,000 to $39,999 16 $40,000 to $69,999 8 $70,000 or more 12 Credit score Non-prime 17 Prime 9 Age Less than 35 12 35–49 12 50–61 20 62 or older 20 Race White 16 Non-white 14 Ethnicity Hispanic 15 Non-Hispanic 15 Note: Estimates are for consumers who were contacted about a debt in collection.
29 CONSUMER EXPERIENCES WITH DEBT COLLECTION
4. Contacts by creditors and collectors
Debt collection generally requires the creditor or collector that is trying to obtain payment on a
debt to contact the consumer. The method, frequency, and nature of these contacts or attempts
to contact may affect a consumer’s experiences with the collections process, the amount of time
a debt is subject to collection efforts, and whether the consumer pays a debt.
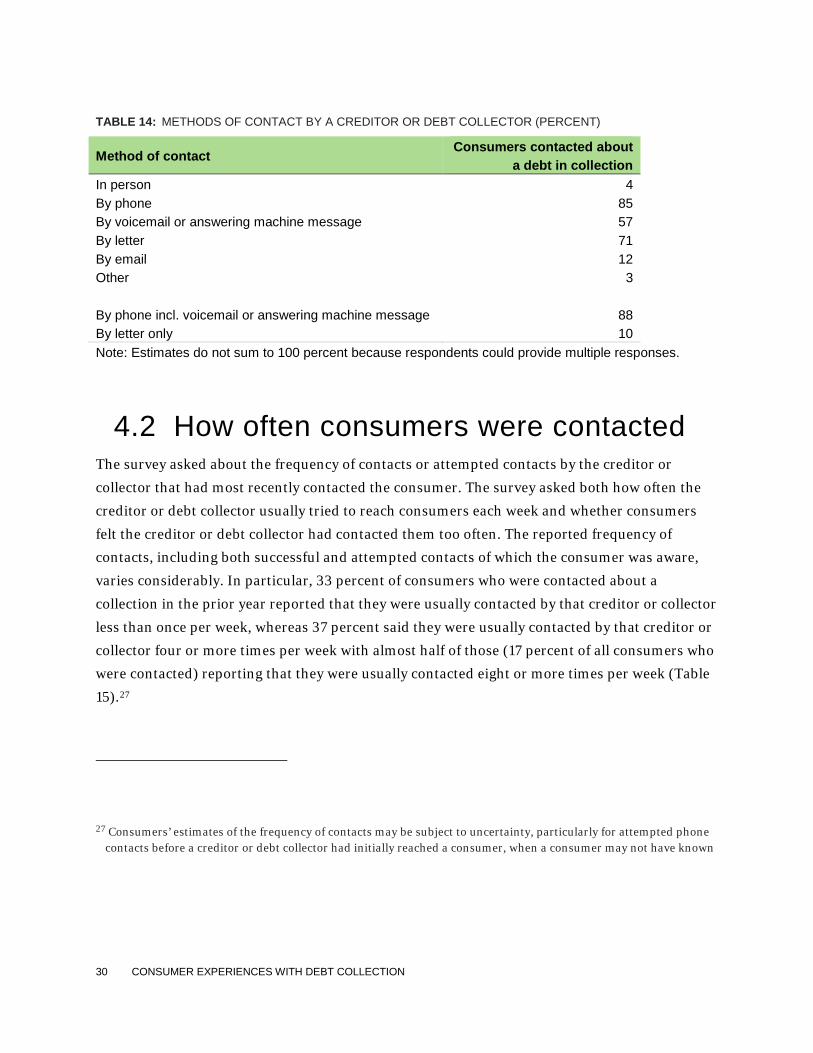
4.1 How consumers were contacted Consumers who had been contacted about a debt in collection were asked, with respect to the
debt which was the subject of the most recent collection activity, about all the ways in which the
creditor or debt collector had reached or tried to reach them (Table 14). The most common
forms of contact reported were phone (85 percent) and letter (71 percent). Fifty-seven percent of
these consumers reported contact by voicemail or answering machine message. Much smaller
shares of consumers reported contact in person, by email, or by other methods, including text
message or social media.
Consumers who were not contacted by phone were generally said they were contacted by letter
only. Combining contacts either by phone or by an answering machine or voicemail message, 88
percent of consumers reported contact or attempted contact by phone. Of the remaining 12
percent of consumers, more than four fifths—10 percent of all consumers—were contacted by
letter only.
30 CONSUMER EXPERIENCES WITH DEBT COLLECTION
TABLE 14: METHODS OF CONTACT BY A CREDITOR OR DEBT COLLECTOR (PERCENT)
Method of contact Consumers contacted about
a debt in collection In person 4 By phone 85 By voicemail or answering machine message 57 By letter 71 By email 12 Other 3 By phone incl. voicemail or answering machine message 88 By letter only 10 Note: Estimates do not sum to 100 percent because respondents could provide multiple responses.
4.2 How often consumers were contacted The survey asked about the frequency of contacts or attempted contacts by the creditor or
collector that had most recently contacted the consumer. The survey asked both how often the
creditor or debt collector usually tried to reach consumers each week and whether consumers
felt the creditor or debt collector had contacted them too often. The reported frequency of
contacts, including both successful and attempted contacts of which the consumer was aware,
varies considerably. In particular, 33 percent of consumers who were contacted about a
collection in the prior year reported that they were usually contacted by that creditor or collector
less than once per week, whereas 37 percent said they were usually contacted by that creditor or
collector four or more times per week with almost half of those (17 percent of all consumers who
were contacted) reporting that they were usually contacted eight or more times per week (Table
15).27
27 Consumers’ estimates of the frequency of contacts may be subject to uncertainty, particularly for attempted phone contacts before a creditor or debt collector had initially reached a consumer, when a consumer may not have known
31 CONSUMER EXPERIENCES WITH DEBT COLLECTION
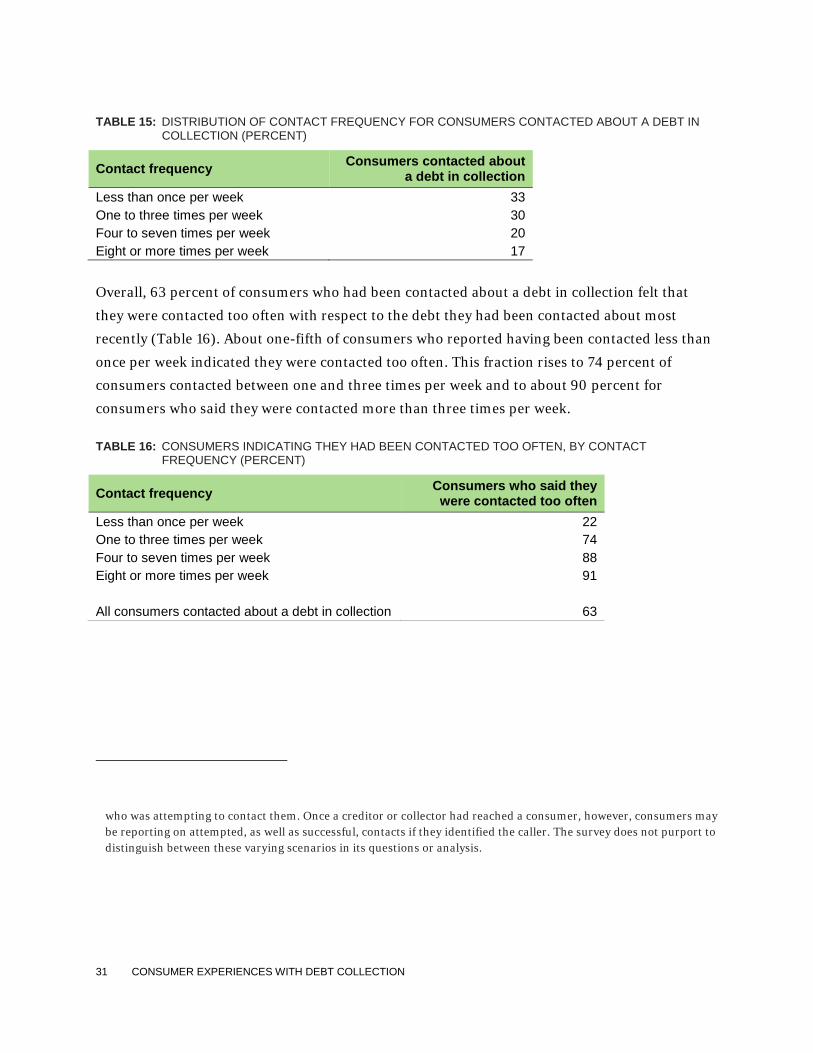
TABLE 15: DISTRIBUTION OF CONTACT FREQUENCY FOR CONSUMERS CONTACTED ABOUT A DEBT IN COLLECTION (PERCENT)
Contact frequency Consumers contacted about a debt in collection
Less than once per week 33 One to three times per week 30 Four to seven times per week 20 Eight or more times per week 17
Overall, 63 percent of consumers who had been contacted about a debt in collection felt that
they were contacted too often with respect to the debt they had been contacted about most
recently (Table 16). About one-fifth of consumers who reported having been contacted less than
once per week indicated they were contacted too often. This fraction rises to 74 percent of
consumers contacted between one and three times per week and to about 90 percent for
consumers who said they were contacted more than three times per week.
TABLE 16: CONSUMERS INDICATING THEY HAD BEEN CONTACTED TOO OFTEN, BY CONTACT FREQUENCY (PERCENT)
Contact frequency Consumers who said they were contacted too often
Less than once per week 22 One to three times per week 74 Four to seven times per week 88 Eight or more times per week 91 All consumers contacted about a debt in collection 63
who was attempting to contact them. Once a creditor or collector had reached a consumer, however, consumers may be reporting on attempted, as well as successful, contacts if they identified the caller. The survey does not purport to distinguish between these varying scenarios in its questions or analysis.
32 CONSUMER EXPERIENCES WITH DEBT COLLECTION
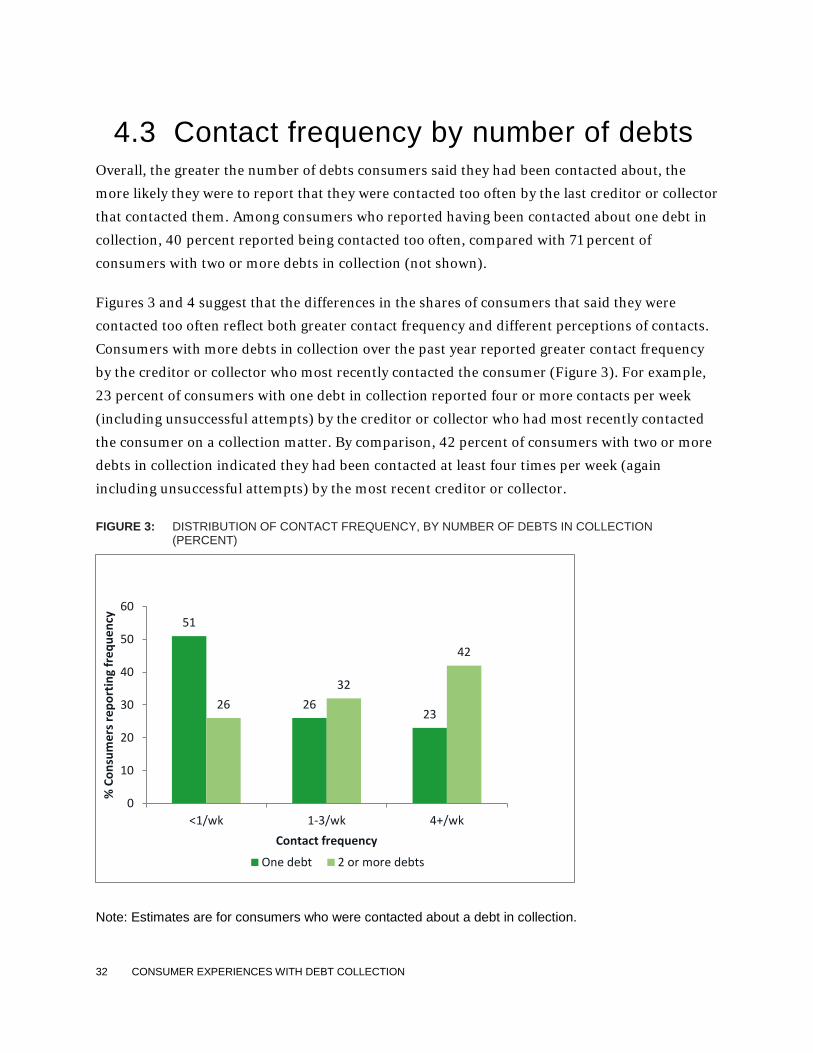
4.3 Contact frequency by number of debts Overall, the greater the number of debts consumers said they had been contacted about, the
more likely they were to report that they were contacted too often by the last creditor or collector
that contacted them. Among consumers who reported having been contacted about one debt in
collection, 40 percent reported being contacted too often, compared with 71 percent of
consumers with two or more debts in collection (not shown).
Figures 3 and 4 suggest that the differences in the shares of consumers that said they were
contacted too often reflect both greater contact frequency and different perceptions of contacts.
Consumers with more debts in collection over the past year reported greater contact frequency
by the creditor or collector who most recently contacted the consumer (Figure 3). For example,
23 percent of consumers with one debt in collection reported four or more contacts per week
(including unsuccessful attempts) by the creditor or collector who had most recently contacted
the consumer on a collection matter. By comparison, 42 percent of consumers with two or more
debts in collection indicated they had been contacted at least four times per week (again
including unsuccessful attempts) by the most recent creditor or collector.
FIGURE 3: DISTRIBUTION OF CONTACT FREQUENCY, BY NUMBER OF DEBTS IN COLLECTION (PERCENT)
Note: Estimates are for consumers who were contacted about a debt in collection.
51
26 23
26 32
42
0
10
20
30
40
50
60
<1/wk 1-3/wk 4+/wk
% C
onsu
mer
s rep
ortin
g fr
eque
ncy
Contact frequency
One debt 2 or more debts
33 CONSUMER EXPERIENCES WITH DEBT COLLECTION
Given the structure of the survey, it is not surprising that consumers with more debts in
collection report greater contact frequency. The survey questions focused on the debt collector
or creditor that contacted them most recently. For a consumer who is being contacted by
multiple debt collectors, the collector that contacted the respondent most recently is more likely
to be one that attempts contact more frequently – for example, if one collector contacts the
consumer once per week, and another contacts the consumer twice per week, then at any given
time the second collector is more likely to be the one that made the most recent contact.
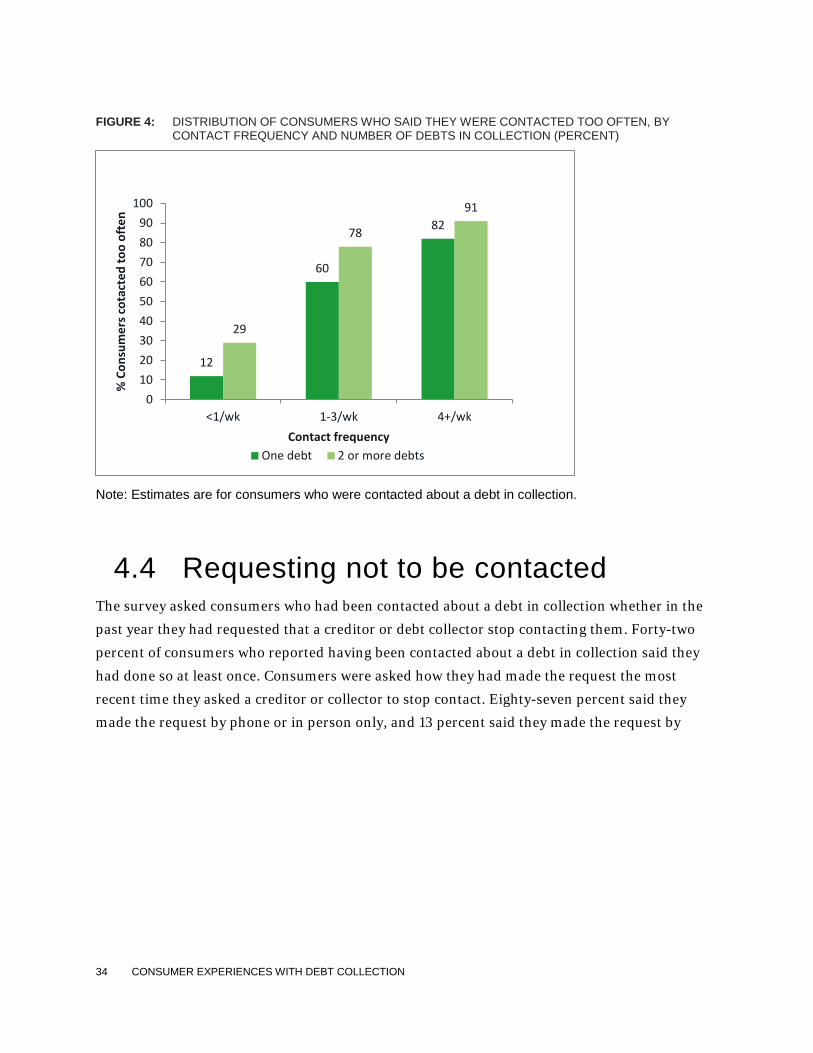
Consumers with more debts in collection over the past year were generally more likely to say
that they were contacted too often by the creditor or collector who had most recently contacted
them, even holding constant the number of contacts they received each week (Figure 4). This
was especially true for lower rates of contact frequency. For consumers with one debt in
collection, 12 percent of consumers contacted less than once per week said they were contacted
too often by the most recent creditor or collector, whereas this share increased to 29 percent for
consumers with two or more debts. This pattern suggests that a consumer’s perception of one
collector’s call frequency may depend in part on the total number of collection contacts the
consumer receives. A consumer who is contacted about multiple debts is likely to experience a
higher overall frequency of calls, and this may make the consumer more likely to perceive any
number of calls from any one collector as “too often.” Nonetheless, these responses reflect a
perception of “too frequent” contact for many consumers who had been contacted about a debt
in collection.
34 CONSUMER EXPERIENCES WITH DEBT COLLECTION
FIGURE 4: DISTRIBUTION OF CONSUMERS WHO SAID THEY WERE CONTACTED TOO OFTEN, BY CONTACT FREQUENCY AND NUMBER OF DEBTS IN COLLECTION (PERCENT)
Note: Estimates are for consumers who were contacted about a debt in collection.
4.4 Requesting not to be contacted The survey asked consumers who had been contacted about a debt in collection whether in the
past year they had requested that a creditor or debt collector stop contacting them. Forty-two
percent of consumers who reported having been contacted about a debt in collection said they
had done so at least once. Consumers were asked how they had made the request the most
recent time they asked a creditor or collector to stop contact. Eighty-seven percent said they
made the request by phone or in person only, and 13 percent said they made the request by
12
60
82
29
78
91
0102030405060708090
100
<1/wk 1-3/wk 4+/wk
% C
onsu
mer
s cot
acte
d to
o of
ten
Contact frequency One debt 2 or more debts
35 CONSUMER EXPERIENCES WITH DEBT COLLECTION
other means (letter, fax, email, etc.), or by multiple means.28 Twenty-five percent of consumers
said that the creditor or debt collector stopped attempting to contact them after being asked to.
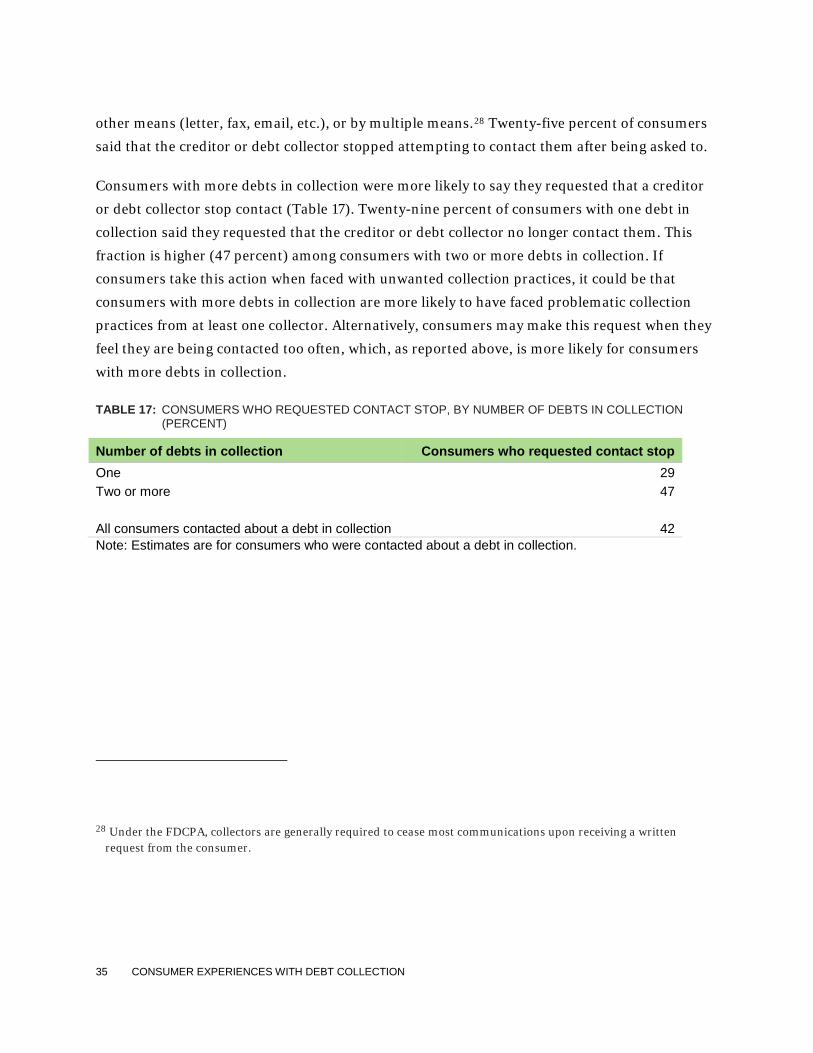
Consumers with more debts in collection were more likely to say they requested that a creditor
or debt collector stop contact (Table 17). Twenty-nine percent of consumers with one debt in
collection said they requested that the creditor or debt collector no longer contact them. This
fraction is higher (47 percent) among consumers with two or more debts in collection. If
consumers take this action when faced with unwanted collection practices, it could be that
consumers with more debts in collection are more likely to have faced problematic collection
practices from at least one collector. Alternatively, consumers may make this request when they
feel they are being contacted too often, which, as reported above, is more likely for consumers
with more debts in collection.
TABLE 17: CONSUMERS WHO REQUESTED CONTACT STOP, BY NUMBER OF DEBTS IN COLLECTION (PERCENT)
Number of debts in collection Consumers who requested contact stop One 29 Two or more 47 All consumers contacted about a debt in collection 42 Note: Estimates are for consumers who were contacted about a debt in collection.
28 Under the FDCPA, collectors are generally required to cease most communications upon receiving a written request from the consumer.
36 CONSUMER EXPERIENCES WITH DEBT COLLECTION
5. Communication methods
5.1 Preferences for contacts about a debt in collection
The survey collected information from all consumers—including those who did not report any
collections in the past year—about the ways consumers say they could be reached and the ways
they would prefer to be reached by a creditor or debt collector.
The survey questions about each of the ways that the consumer could be reached, by design, did
not refer to being reached by a creditor or collector. This question was intended to provide
context for interpreting the subsequent question about preferences for collections-related
contacts by determining which means of contact were relevant. Nevertheless, many respondents
appear to have interpreted the questions to be about ways they would like to be reached by a
creditor or collector. For example, 30 percent of consumers said they could be contacted in
person, and nearly 90 percent said they could be reached by mail, though presumably nearly all
consumers could be reached by either of these means. This interpretation could reflect the
survey’s general focus on collections or the fact that the subsequent questions about contact
preferences specifically referred to contacts by creditors and debt collectors.
Almost half of consumers said they would most prefer to be reached by letter (Table 18). The
second most common preference for contact was through some kind of phone other than work:
14 percent preferred a cell phone, 11 percent a home phone, and one percent indicated a generic
preference for “phone” without further specification. Less than one percent of consumers
indicated work phone as their preferred method of contact. Consumers who were contacted
about debt in collection were more likely than consumers overall to list a cell phone as their
most preferred method of contact, and they were slightly less likely to prefer contact by letter or
email.
37 CONSUMER EXPERIENCES WITH DEBT COLLECTION
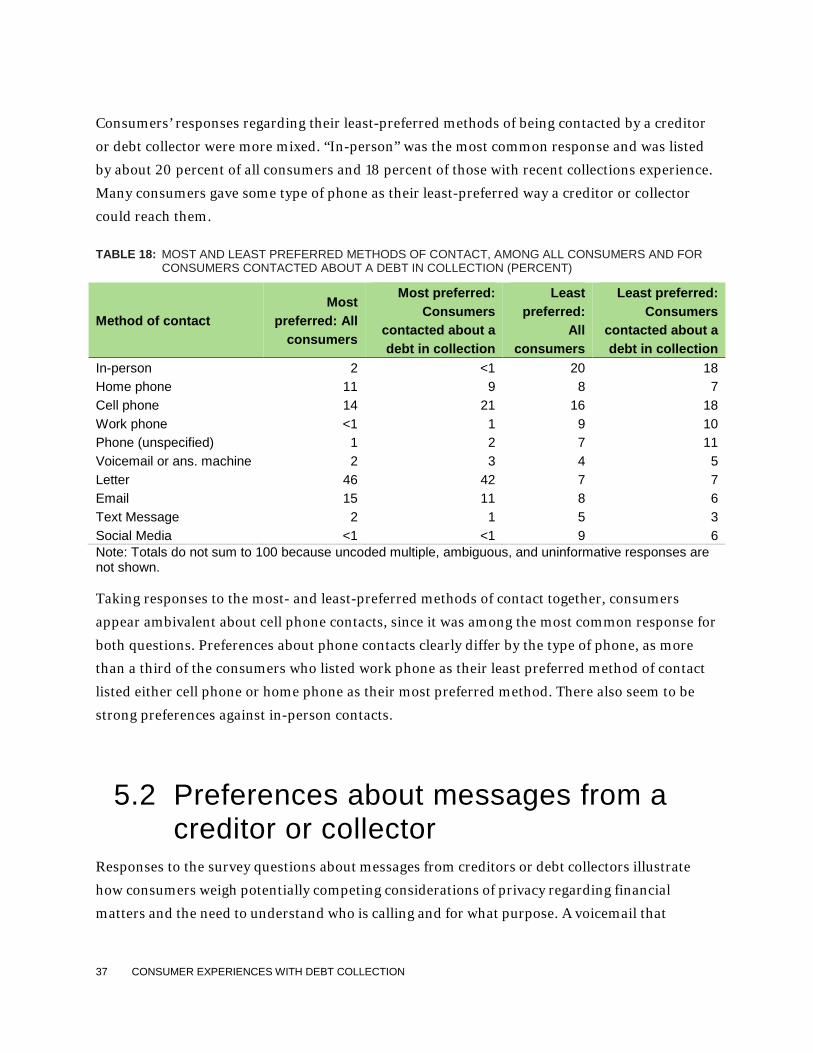
Consumers’ responses regarding their least-preferred methods of being contacted by a creditor
or debt collector were more mixed. “In-person” was the most common response and was listed
by about 20 percent of all consumers and 18 percent of those with recent collections experience.
Many consumers gave some type of phone as their least-preferred way a creditor or collector
could reach them.
TABLE 18: MOST AND LEAST PREFERRED METHODS OF CONTACT, AMONG ALL CONSUMERS AND FOR CONSUMERS CONTACTED ABOUT A DEBT IN COLLECTION (PERCENT)
Method of contact Most
preferred: All consumers
Most preferred: Consumers
contacted about a debt in collection
Least preferred:
All consumers
Least preferred: Consumers
contacted about a debt in collection
In-person 2 <1 20 18 Home phone 11 9 8 7 Cell phone 14 21 16 18 Work phone <1 1 9 10 Phone (unspecified) 1 2 7 11 Voicemail or ans. machine 2 3 4 5 Letter 46 42 7 7 Email 15 11 8 6 Text Message 2 1 5 3 Social Media <1 <1 9 6 Note: Totals do not sum to 100 because uncoded multiple, ambiguous, and uninformative responses are not shown. Taking responses to the most- and least-preferred methods of contact together, consumers
appear ambivalent about cell phone contacts, since it was among the most common response for
both questions. Preferences about phone contacts clearly differ by the type of phone, as more
than a third of the consumers who listed work phone as their least preferred method of contact
listed either cell phone or home phone as their most preferred method. There also seem to be
strong preferences against in-person contacts.
5.2 Preferences about messages from a creditor or collector
Responses to the survey questions about messages from creditors or debt collectors illustrate
how consumers weigh potentially competing considerations of privacy regarding financial
matters and the need to understand who is calling and for what purpose. A voicemail that
38 CONSUMER EXPERIENCES WITH DEBT COLLECTION
discusses a debt collection could be overheard by others, revealing information that the
consumer would prefer to remain private. At the same time, a voicemail from a collector that
does not reference a debt collection would leave the consumer in the dark as to the identity of
the caller and the purpose of the call.
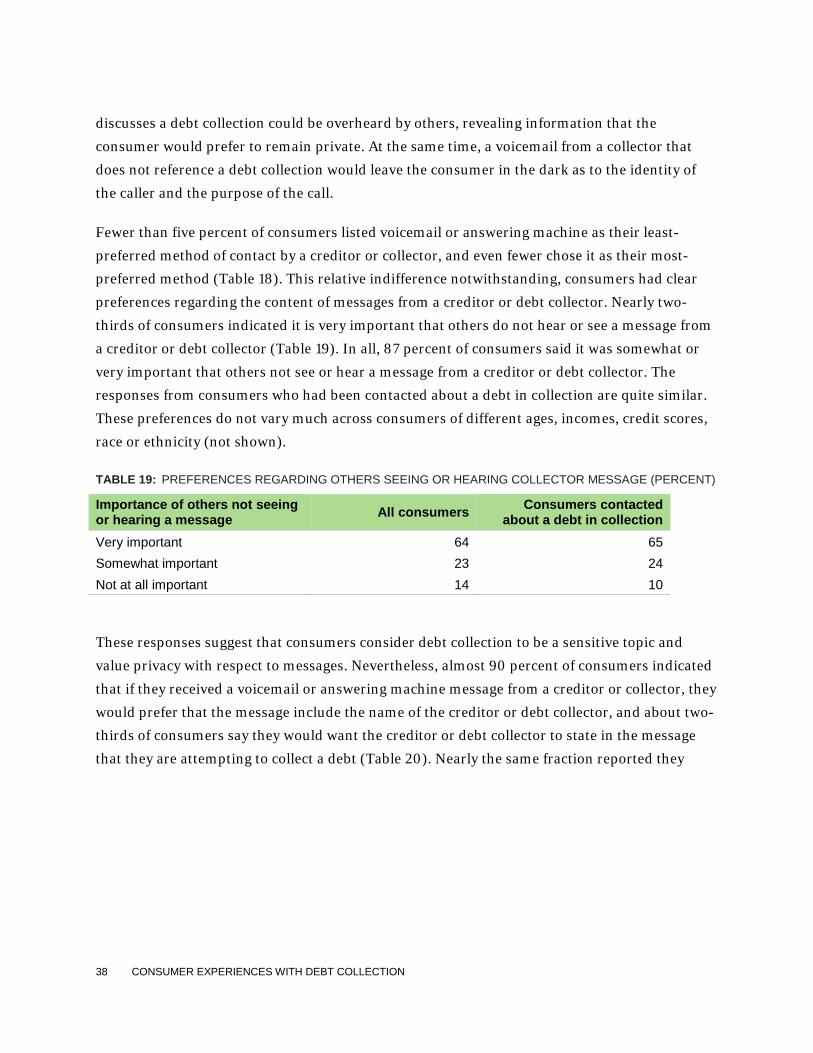
Fewer than five percent of consumers listed voicemail or answering machine as their least-
preferred method of contact by a creditor or collector, and even fewer chose it as their most-
preferred method (Table 18). This relative indifference notwithstanding, consumers had clear
preferences regarding the content of messages from a creditor or debt collector. Nearly two-
thirds of consumers indicated it is very important that others do not hear or see a message from
a creditor or debt collector (Table 19). In all, 87 percent of consumers said it was somewhat or
very important that others not see or hear a message from a creditor or debt collector. The
responses from consumers who had been contacted about a debt in collection are quite similar.
These preferences do not vary much across consumers of different ages, incomes, credit scores,
race or ethnicity (not shown).
TABLE 19: PREFERENCES REGARDING OTHERS SEEING OR HEARING COLLECTOR MESSAGE (PERCENT)
Importance of others not seeing or hearing a message All consumers Consumers contacted
about a debt in collection Very important 64 65 Somewhat important 23 24 Not at all important 14 10
These responses suggest that consumers consider debt collection to be a sensitive topic and
value privacy with respect to messages. Nevertheless, almost 90 percent of consumers indicated
that if they received a voicemail or answering machine message from a creditor or collector, they
would prefer that the message include the name of the creditor or debt collector, and about two-
thirds of consumers say they would want the creditor or debt collector to state in the message
that they are attempting to collect a debt (Table 20). Nearly the same fraction reported they
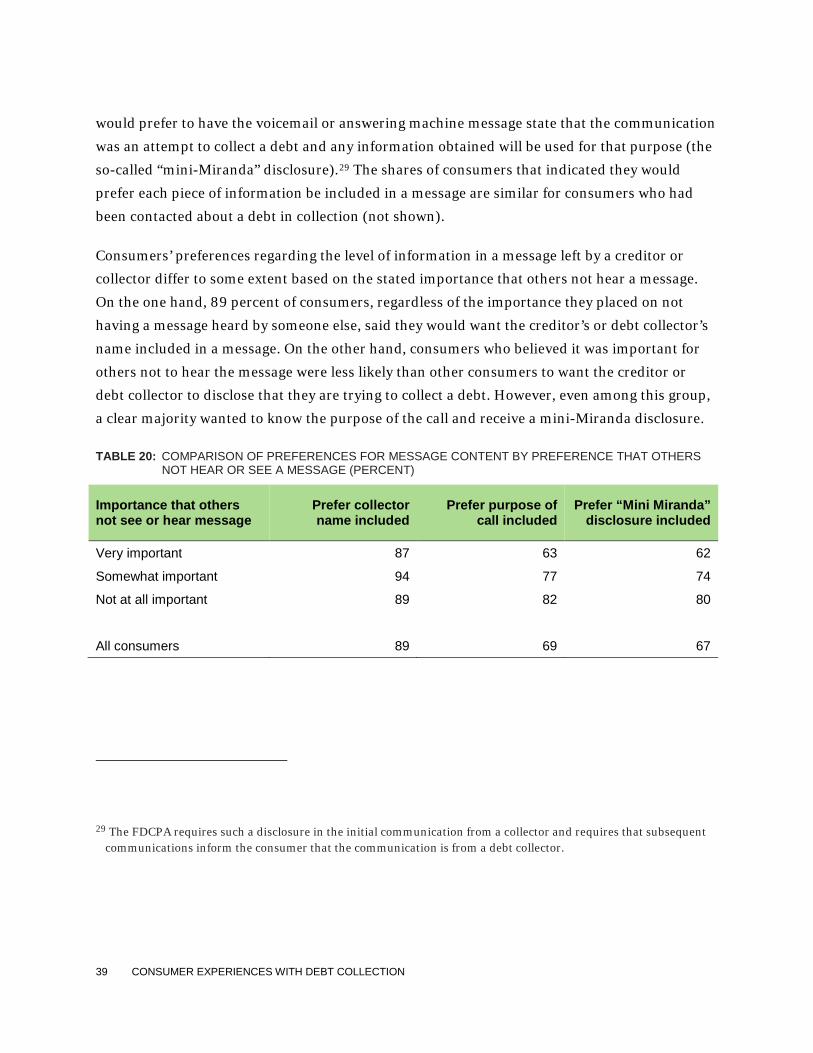
39 CONSUMER EXPERIENCES WITH DEBT COLLECTION
would prefer to have the voicemail or answering machine message state that the communication
was an attempt to collect a debt and any information obtained will be used for that purpose (the
so-called “mini-Miranda” disclosure).29 The shares of consumers that indicated they would
prefer each piece of information be included in a message are similar for consumers who had
been contacted about a debt in collection (not shown).
Consumers’ preferences regarding the level of information in a message left by a creditor or
collector differ to some extent based on the stated importance that others not hear a message.
On the one hand, 89 percent of consumers, regardless of the importance they placed on not
having a message heard by someone else, said they would want the creditor’s or debt collector’s
name included in a message. On the other hand, consumers who believed it was important for
others not to hear the message were less likely than other consumers to want the creditor or
debt collector to disclose that they are trying to collect a debt. However, even among this group,
a clear majority wanted to know the purpose of the call and receive a mini-Miranda disclosure.
TABLE 20: COMPARISON OF PREFERENCES FOR MESSAGE CONTENT BY PREFERENCE THAT OTHERS NOT HEAR OR SEE A MESSAGE (PERCENT)
Importance that others not see or hear message
Prefer collector name included
Prefer purpose of call included
Prefer “Mini Miranda” disclosure included
Very important 87 63 62
Somewhat important 94 77 74
Not at all important 89 82 80
All consumers 89 69 67
29 The FDCPA requires such a disclosure in the initial communication from a collector and requires that subsequent communications inform the consumer that the communication is from a debt collector.
40 CONSUMER EXPERIENCES WITH DEBT COLLECTION
6. Comparing collections for creditors and collectors
Creditors and debt collectors might be expected to take different approaches to collecting
unpaid debts for several reasons. First, a creditor has an existing relationship with a consumer
that it may want to maintain, whereas collectors are not seeking to retain the consumer’s
business. Second, creditors may have more complete or up-to-date information about the
consumer including address and contact information, which may make creditors more likely
than collectors to readily reach a consumer and to accurately state the amount owed. Third,
collectors are more likely to be engaged after the creditor has been unsuccessful in collecting the
debt, which may lead them to take a different strategy for getting a payment.
6.1 Method and frequency of contact by creditors and debt collectors
Among consumers who reported having been contacted about a debt in the prior year, 23
percent said they were last contacted about the debt by a creditor, and 63 percent by a debt
41 CONSUMER EXPERIENCES WITH DEBT COLLECTION
collector (not shown).30 This survey question was one of a few that included “don’t know” as a
response option, to measure how well consumers can discern whom they are interacting with in
the context of collections. About 15 percent of consumers contacted about a collection in the
prior year indicated they were uncertain whether the most recent contact was from a creditor or
debt collector.
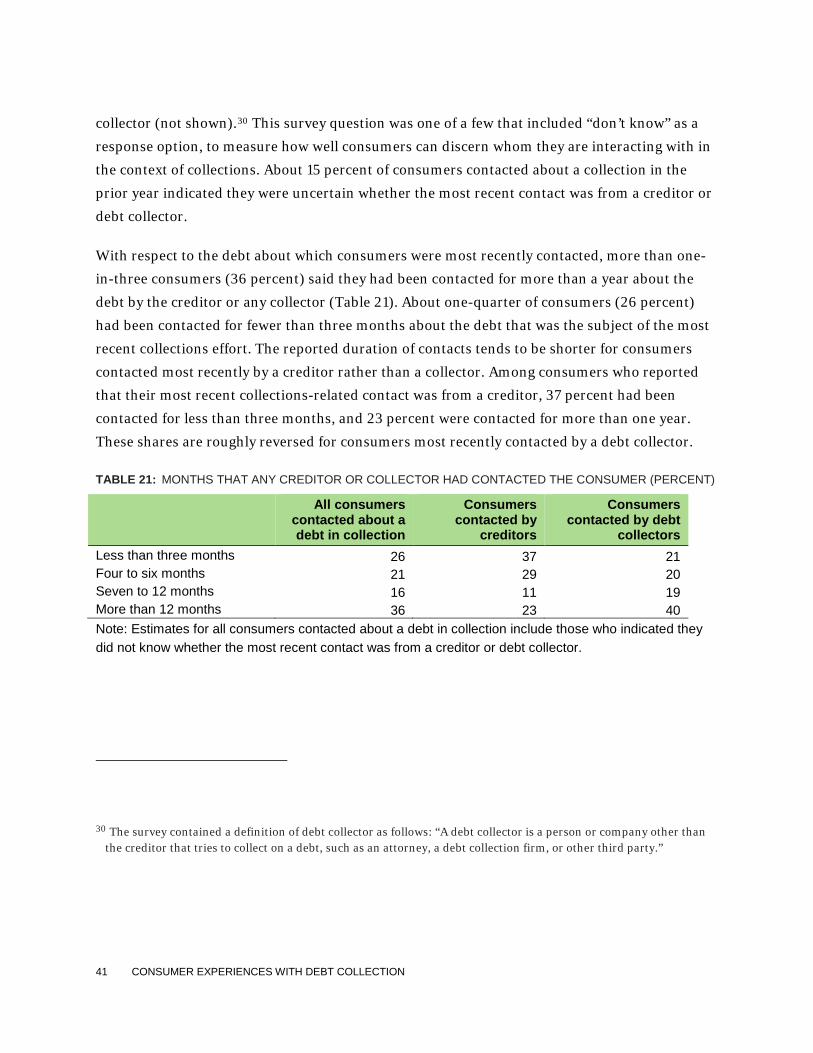
With respect to the debt about which consumers were most recently contacted, more than one-
in-three consumers (36 percent) said they had been contacted for more than a year about the
debt by the creditor or any collector (Table 21). About one-quarter of consumers (26 percent)
had been contacted for fewer than three months about the debt that was the subject of the most
recent collections effort. The reported duration of contacts tends to be shorter for consumers
contacted most recently by a creditor rather than a collector. Among consumers who reported
that their most recent collections-related contact was from a creditor, 37 percent had been
contacted for less than three months, and 23 percent were contacted for more than one year.
These shares are roughly reversed for consumers most recently contacted by a debt collector.
TABLE 21: MONTHS THAT ANY CREDITOR OR COLLECTOR HAD CONTACTED THE CONSUMER (PERCENT)
All consumers
contacted about a debt in collection
Consumers contacted by
creditors
Consumers contacted by debt
collectors Less than three months 26 37 21 Four to six months 21 29 20 Seven to 12 months 16 11 19 More than 12 months 36 23 40 Note: Estimates for all consumers contacted about a debt in collection include those who indicated they did not know whether the most recent contact was from a creditor or debt collector.
30 The survey contained a definition of debt collector as follows: “A debt collector is a person or company other than the creditor that tries to collect on a debt, such as an attorney, a debt collection firm, or other third party.”
42 CONSUMER EXPERIENCES WITH DEBT COLLECTION
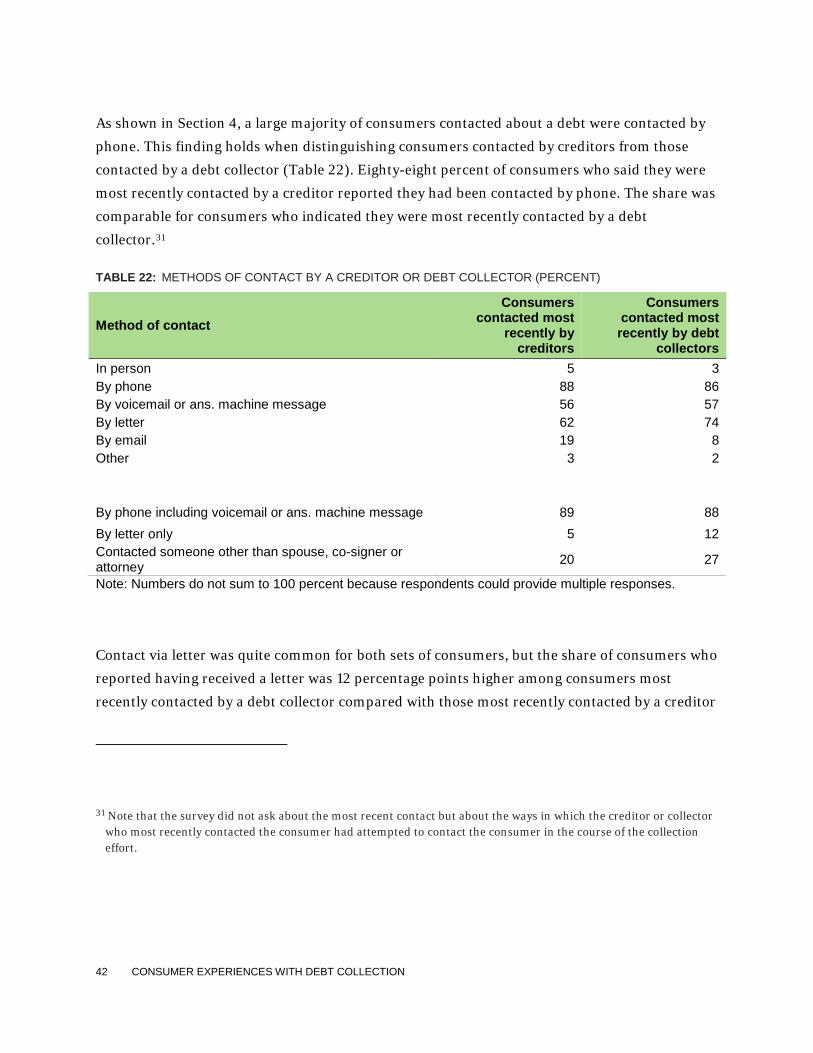
As shown in Section 4, a large majority of consumers contacted about a debt were contacted by
phone. This finding holds when distinguishing consumers contacted by creditors from those
contacted by a debt collector (Table 22). Eighty-eight percent of consumers who said they were
most recently contacted by a creditor reported they had been contacted by phone. The share was
comparable for consumers who indicated they were most recently contacted by a debt
collector.31
TABLE 22: METHODS OF CONTACT BY A CREDITOR OR DEBT COLLECTOR (PERCENT)
Method of contact Consumers
contacted most recently by
creditors
Consumers contacted most recently by debt
collectors In person 5 3 By phone 88 86 By voicemail or ans. machine message 56 57 By letter 62 74 By email 19 8 Other 3 2
By phone including voicemail or ans. machine message 89 88 By letter only 5 12 Contacted someone other than spouse, co-signer or attorney 20 27
Note: Numbers do not sum to 100 percent because respondents could provide multiple responses.
Contact via letter was quite common for both sets of consumers, but the share of consumers who
reported having received a letter was 12 percentage points higher among consumers most
recently contacted by a debt collector compared with those most recently contacted by a creditor
31 Note that the survey did not ask about the most recent contact but about the ways in which the creditor or collector who most recently contacted the consumer had attempted to contact the consumer in the course of the collection effort.
43 CONSUMER EXPERIENCES WITH DEBT COLLECTION
(74 percent compared with 62 percent). This difference may be due, in part, to requirements
that most debt collectors (but not most creditors) provide certain disclosures to consumers
within five days of the initial communication with the consumer, unless those disclosures were
made in the initial communication. These disclosures are commonly mailed.32
Consumers were much more likely to report email contact if they had been contacted by a
creditor rather than a debt collector, with 19 percent of those who were most recently contacted
by a creditor reporting email contact, compared with eight percent of consumers most recently
contacted by a debt collector. The greater prevalence of reported email contact by creditors may
reflect among other things differences in the availability of valid email addresses for consumers,
consent obtained to communicate by email, and concerns on collectors’ part that using e-mail
may lead to litigation. Finally, 20 percent of consumers who were most recently contacted by a
creditor reported that the creditor had contacted someone other than a spouse, co-signer, or
attorney in the course of collection efforts. The corresponding share for consumers most
recently contacted by a collector was 27 percent.
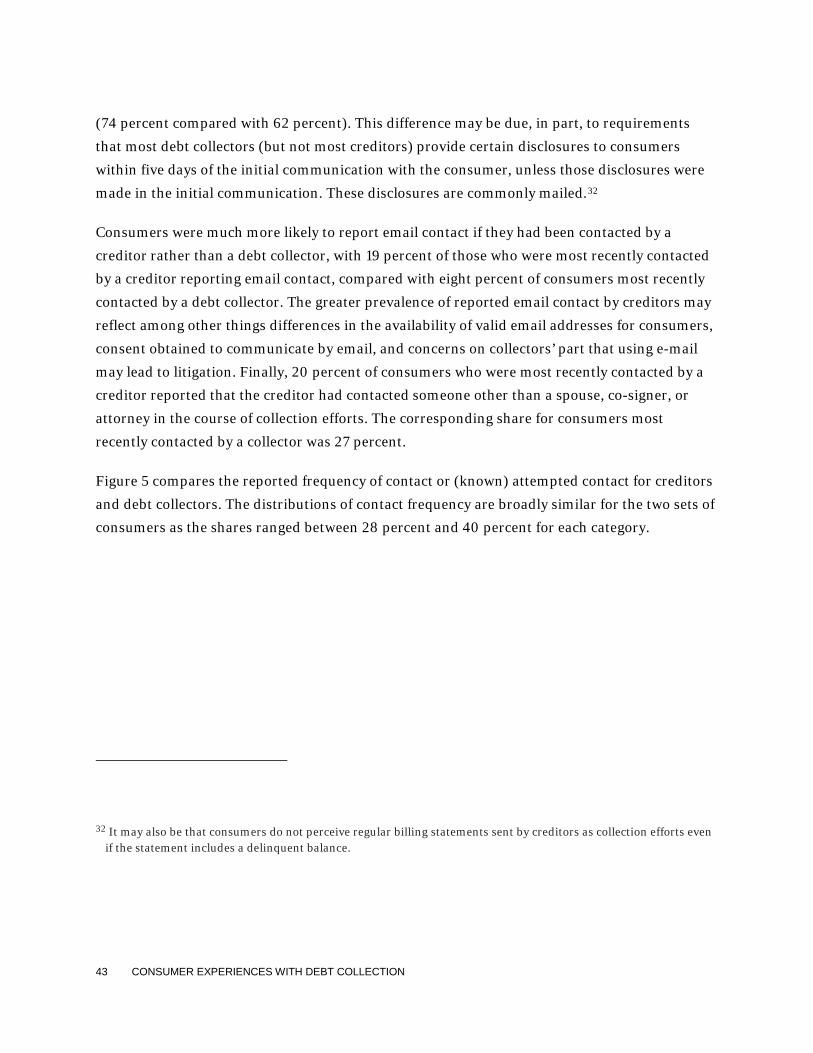
Figure 5 compares the reported frequency of contact or (known) attempted contact for creditors
and debt collectors. The distributions of contact frequency are broadly similar for the two sets of
consumers as the shares ranged between 28 percent and 40 percent for each category.
32 It may also be that consumers do not perceive regular billing statements sent by creditors as collection efforts even if the statement includes a delinquent balance.
44 CONSUMER EXPERIENCES WITH DEBT COLLECTION
FIGURE 5: DISTRIBUTION OF CONTACT FREQUENCY FOR CONSUMERS CONTACTED BY A CREDITOR OR A DEBT COLLECTOR (PERCENT)
Note: Estimates are for consumers who were contacted about a debt in collection.
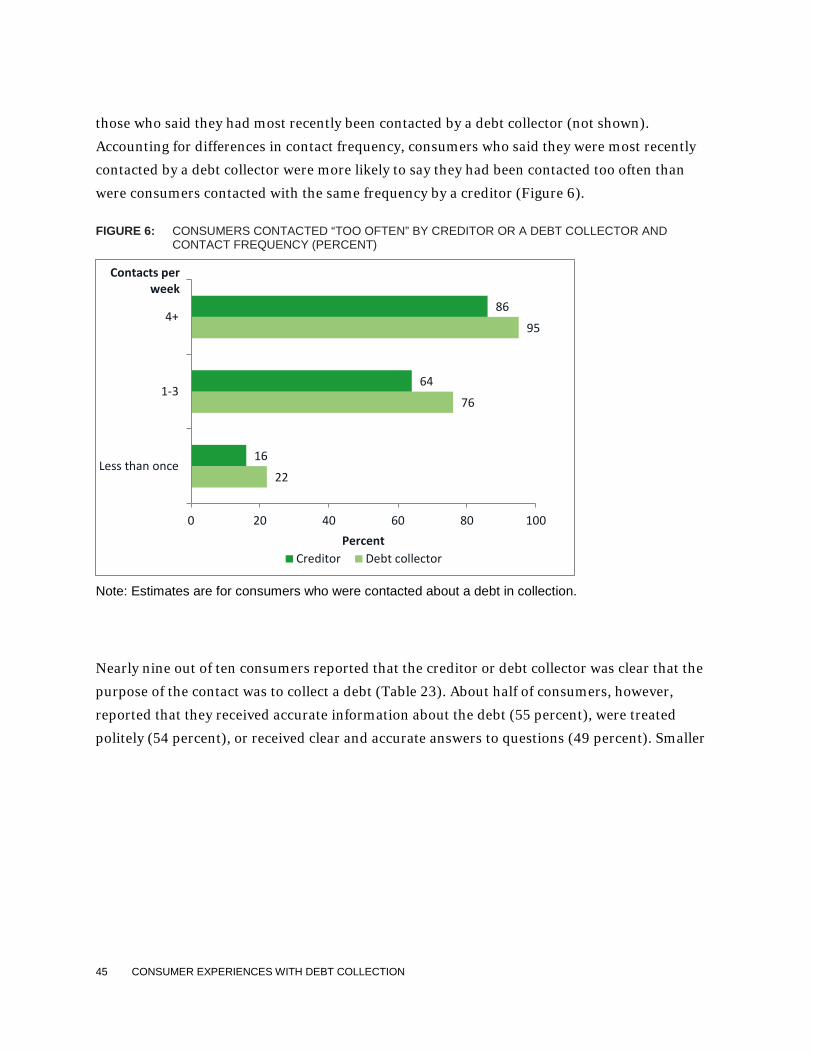
6.2 Consumer characterizations of creditor and debt collector contacts
The survey asked consumers to characterize their interactions with the creditor or debt collector
that contacted them most recently.33 The shares who said they were contacted too often were
similar for consumers who reported they had most recently been contacted by a creditor and
33 It seems likely that consumers’ responses to questions about interactions with the creditor or debt collector are based largely on successful contacts. In contrast, the question about the usual frequency of contacts, for example, explicitly asked consumers to consider both successful and attempted contacts, such as calls that a consumer did not answer but identified based on caller ID.
35
29
35
28
32
40
0 10 20 30 40 50
Less than once
1-3
4+
Percent
Contacts per week
Creditor Debt collector
45 CONSUMER EXPERIENCES WITH DEBT COLLECTION
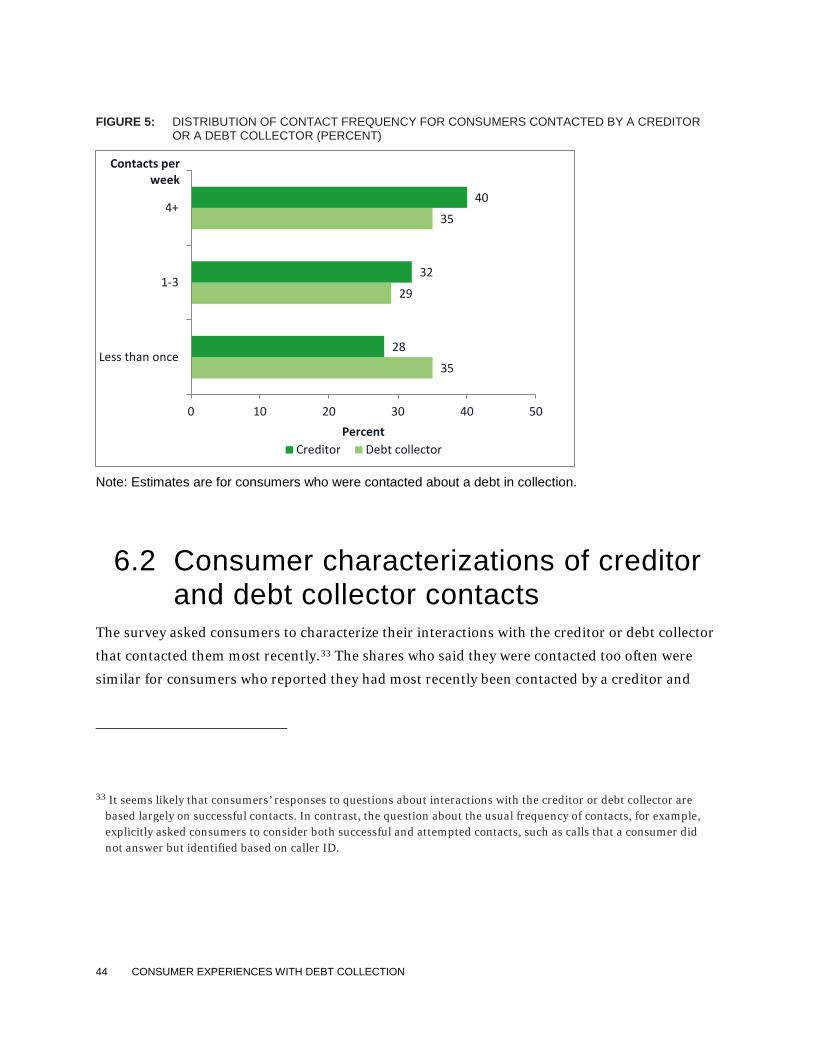
those who said they had most recently been contacted by a debt collector (not shown).
Accounting for differences in contact frequency, consumers who said they were most recently
contacted by a debt collector were more likely to say they had been contacted too often than
were consumers contacted with the same frequency by a creditor (Figure 6).
FIGURE 6: CONSUMERS CONTACTED “TOO OFTEN” BY CREDITOR OR A DEBT COLLECTOR AND CONTACT FREQUENCY (PERCENT)
Note: Estimates are for consumers who were contacted about a debt in collection.
Nearly nine out of ten consumers reported that the creditor or debt collector was clear that the
purpose of the contact was to collect a debt (Table 23). About half of consumers, however,
reported that they received accurate information about the debt (55 percent), were treated
politely (54 percent), or received clear and accurate answers to questions (49 percent). Smaller
22
76
95
16
64
86
0 20 40 60 80 100
Less than once
1-3
4+
Percent
Contacts per week
Creditor Debt collector
46 CONSUMER EXPERIENCES WITH DEBT COLLECTION
but still notable fractions of consumers indicated that the creditor or collector had threatened
them or had called between 9:00 p.m. and 8:00 a.m.34
TABLE 23: CONSUMERS’ CHARACTERIZATIONS OF CONTACTS WITH CREDITORS AND COLLECTORS (PERCENT)
All consumers
contacted about a debt in
collection
Consumers contacted by
creditors
Consumers contacted by
debt collectors
Provided accurate information 55 77 49 Provided options to pay the debt 53 60 49 Communicated in preferred language 79 81 79 Stated reason for contact was collection 86 88 87 Addressed questions clearly and accurately 49 66 44 Treated you politely 54 66 50 Contacted too often 63 59 64 Called before 8 a.m. or after 9 p.m. 36 34 34 Threatened 27 16 28 Note: Estimates for all consumers contacted about a debt in collection include those who indicated they did not know whether the most recent contact was from a creditor or debt collector.
Consumers reported more favorable experiences with creditors than debt collectors along many
of the dimensions surveyed. About three-quarters (77 percent) of consumers who reported being
contacted by a creditor, for example, said that the creditor provided accurate information
compared with 49 percent of consumers contacted by a debt collector. Consumers contacted by
creditors similarly were more likely to say that the creditor provided options to pay the debt,
34 Most consumers who had been contacted about a debt in collection also indicated that the creditor or collector communicated in the consumer’s preferred language, but this proportion, 79 percent, is lower than expected. Analysis of responses to this question suggests that the question may have been interpreted by some consumers as referring to the tone and tenor of the communications, rather than a consumer’s preference for a language other than English.

47 CONSUMER EXPERIENCES WITH DEBT COLLECTION
addressed their questions, and was polite. Finally, those contacted by creditors were less likely
than those contacted by debt collectors to agree with less-favorable characterization of
interactions such as reporting that the creditor threatened them.
48 CONSUMER EXPERIENCES WITH DEBT COLLECTION
7. Conclusion This report draws on nationally representative data from the Bureau’s Survey of Consumer
Views on Debt to sketch, from consumers’ perspectives, the broad experience of debt collection
in the United States. As the report notes, this experience is shared by many consumers: roughly
one-third said they were contacted by a creditor or collector in the last year. Most consumers
who were contacted about a debt in collection were contacted about multiple debts; and, for
consumers of all ages, income, and credit scores who experienced collection efforts, these efforts
often included attempts to collect on past-due medical bills. A large percentage of consumers
stated that they were contacted too often. And, just over half of consumers who said they had
been contacted about at least one debt in collection said they had been contacted about a debt
that was not theirs, was owed by a family member, or was for the wrong amount.
These broad patterns are not uniform, however. Lower-income consumers and consumers
between the ages of 35 and 49, for example, were more likely than others to report having been
contacted about a debt in collection. As might be expected because credit-scoring models
generally assign lower scores to consumers with collections, consumers with non-prime credit
scores were more likely to have had collections experience. The survey results further suggest
that consumers may view their experiences with creditors more favorably than they do
experiences with debt collectors.
Beyond the results in this report, a more complete picture of debt collection in the U.S. will
emerge from both filling in additional details and understanding how this picture fits with the
perspective provided by other data. To this end, the Bureau intends to draw on the survey data
to provide further descriptive results as well as to do more in-depth research on consumer
finances and decisionmaking. Moreover, the Bureau hopes that this report prompts others to
consider how the survey’s findings from consumers’ perspectives may be reconciled with the
findings offered by, for example, administrative data from collectors and creditors or by
complaints data, each of which can add to our understanding of debt collection in the United
States.
49 CONSUMER EXPERIENCES WITH DEBT COLLECTION
8. Appendix: Survey instrument
Consumer FinancialProtection Bureau
OMB Control Number 3170-0047
An official U.S. Government agency
QUESTIONS?For more information about this survey, please call 1-855-246-9457
or go to www.consumerfinance.gov/debtsurvey.htmlFor more information about the CFPB, visit www.consumerfinance.gov
A Survey of Consumer Views on Debt
Esta encuesta está disponible en español en Internet. Ver la parte posterior del cuestionario para obtener instrucciones.
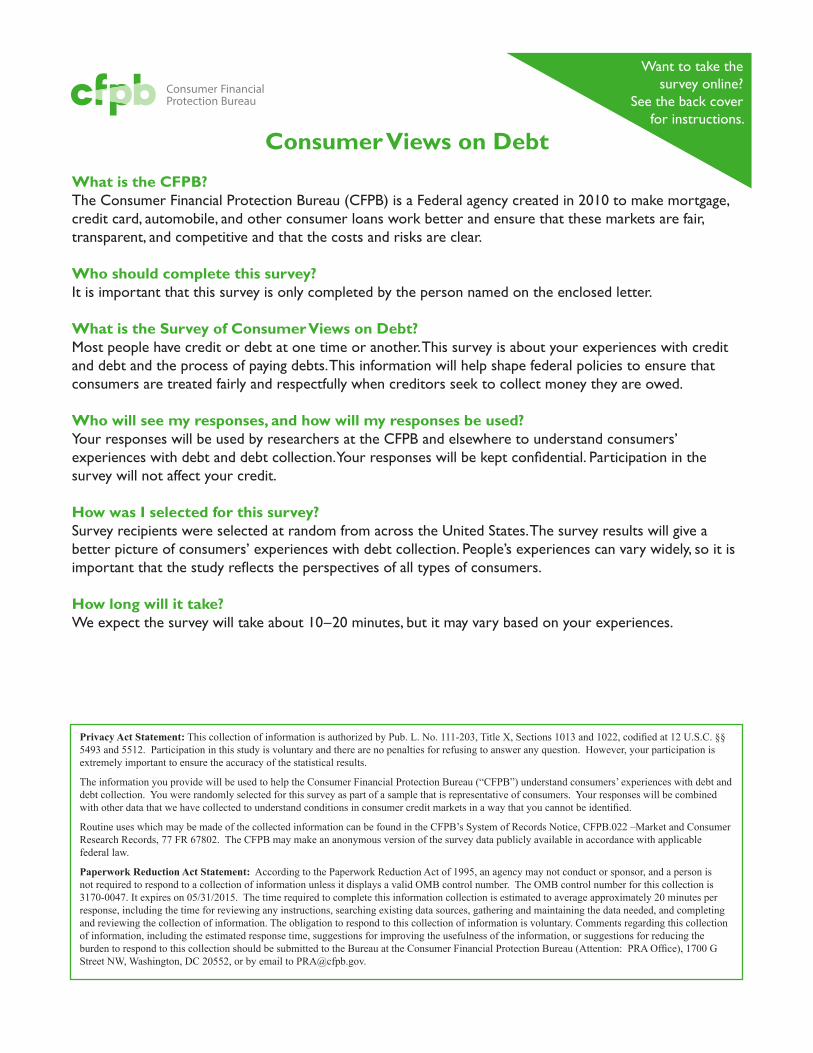
Consumer Views on DebtWhat is the CFPB?The Consumer Financial Protection Bureau (CFPB) is a Federal agency created in 2010 to make mortgage, credit card, automobile, and other consumer loans work better and ensure that these markets are fair, transparent, and competitive and that the costs and risks are clear.
Who should complete this survey?It is important that this survey is only completed by the person named on the enclosed letter.
What is the Survey of Consumer Views on Debt?Most people have credit or debt at one time or another. This survey is about your experiences with credit and debt and the process of paying debts. This information will help shape federal policies to ensure that consumers are treated fairly and respectfully when creditors seek to collect money they are owed.
Who will see my responses, and how will my responses be used?Your responses will be used by researchers at the CFPB and elsewhere to understand consumers’ experiences with debt and debt collection. Your responses will be kept confidential. Participation in the survey will not affect your credit.
How was I selected for this survey?Survey recipients were selected at random from across the United States. The survey results will give a better picture of consumers’ experiences with debt collection. People’s experiences can vary widely, so it is important that the study reflects the perspectives of all types of consumers.
How long will it take?We expect the survey will take about 10–20 minutes, but it may vary based on your experiences.
Want to take the survey online?
See the back cover for instructions.
Consumer FinancialProtection Bureau
Privacy Act Statement: This collection of information is authorized by Pub. L. No. 111-203, Title X, Sections 1013 and 1022, codified at 12 U.S.C. §§ 5493 and 5512. Participation in this study is voluntary and there are no penalties for refusing to answer any question. However, your participation is extremely important to ensure the accuracy of the statistical results.
The information you provide will be used to help the Consumer Financial Protection Bureau (“CFPB”) understand consumers’ experiences with debt and debt collection. You were randomly selected for this survey as part of a sample that is representative of consumers. Your responses will be combined with other data that we have collected to understand conditions in consumer credit markets in a way that you cannot be identified.
Routine uses which may be made of the collected information can be found in the CFPB’s System of Records Notice, CFPB.022 –Market and Consumer Research Records, 77 FR 67802. The CFPB may make an anonymous version of the survey data publicly available in accordance with applicable federal law.
Paperwork Reduction Act Statement: According to the Paperwork Reduction Act of 1995, an agency may not conduct or sponsor, and a person is not required to respond to a collection of information unless it displays a valid OMB control number. The OMB control number for this collection is 3170-0047. It expires on 05/31/2015. The time required to complete this information collection is estimated to average approximately 20 minutes per response, including the time for reviewing any instructions, searching existing data sources, gathering and maintaining the data needed, and completing and reviewing the collection of information. The obligation to respond to this collection of information is voluntary. Comments regarding this collection of information, including the estimated response time, suggestions for improving the usefulness of the information, or suggestions for reducing the burden to respond to this collection should be submitted to the Bureau at the Consumer Financial Protection Bureau (Attention: PRA Office), 1700 G Street NW, Washington, DC 20552, or by email to [email protected].
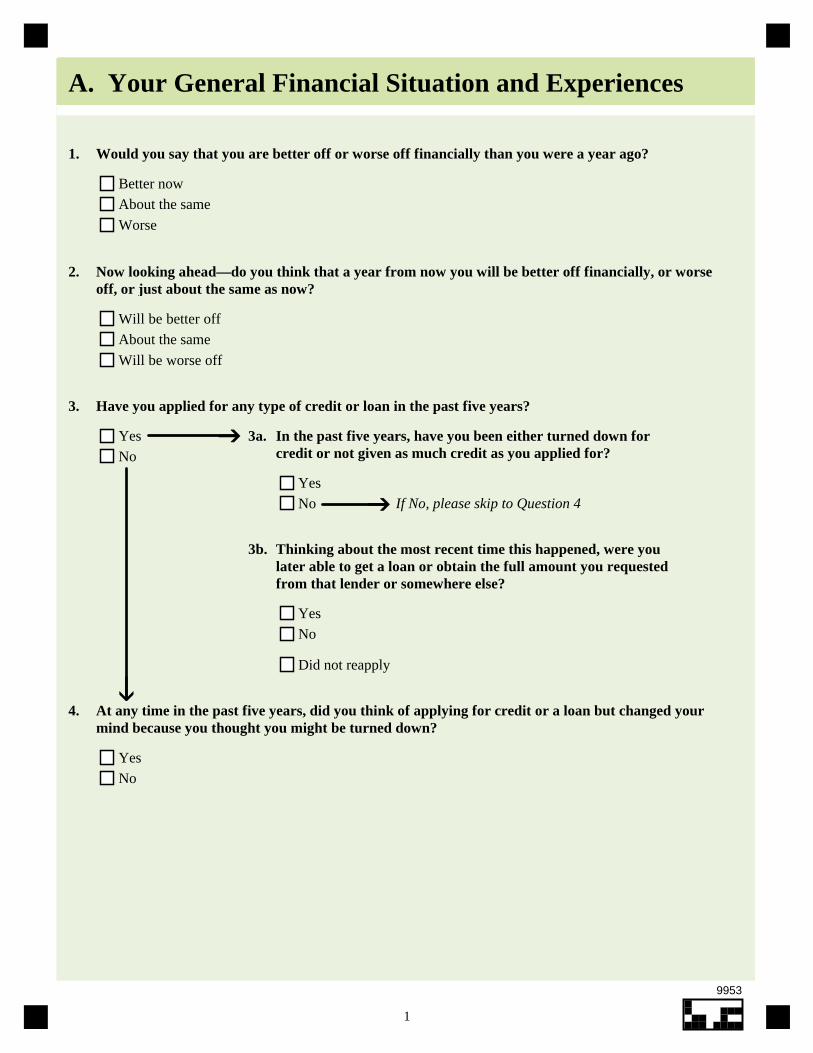
11
A. Your General Financial Situation and Experiences
1. Would you say that you are better off or worse off financially than you were a year ago?
Better now
About the same
Worse
2. Now looking ahead—do you think that a year from now you will be better off financially, or worseoff, or just about the same as now?
Will be better off
About the same
Will be worse off
3. Have you applied for any type of credit or loan in the past five years?
Yes
No
In the past five years, have you been either turned down forcredit or not given as much credit as you applied for?
3a.
Yes
No If No, please skip to Question 4
3b. Thinking about the most recent time this happened, were youlater able to get a loan or obtain the full amount you requestedfrom that lender or somewhere else?
Yes
No
Did not reapply
4. At any time in the past five years, did you think of applying for credit or a loan but changed yourmind because you thought you might be turned down?
Yes
No
9953
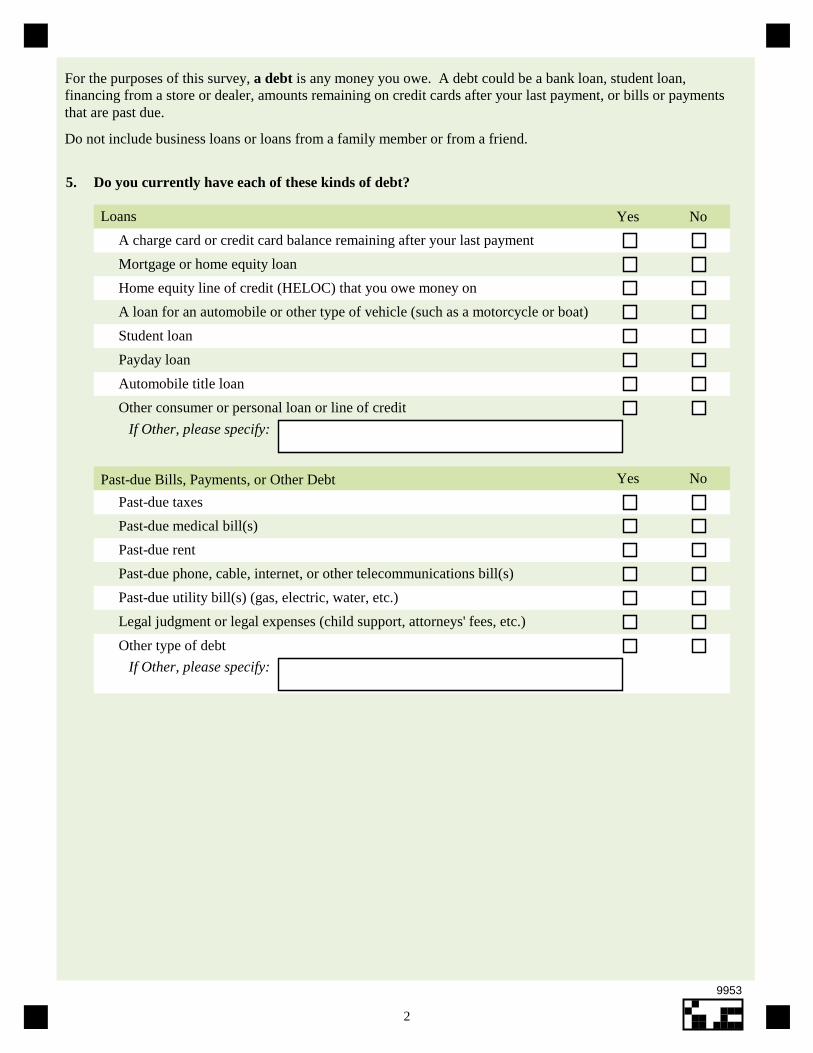
2
For the purposes of this survey, a debt is any money you owe. A debt could be a bank loan, student loan,financing from a store or dealer, amounts remaining on credit cards after your last payment, or bills or paymentsthat are past due.
Do not include business loans or loans from a family member or from a friend.
5. Do you currently have each of these kinds of debt?
Loans Yes No
A charge card or credit card balance remaining after your last payment
Mortgage or home equity loan
Home equity line of credit (HELOC) that you owe money on
A loan for an automobile or other type of vehicle (such as a motorcycle or boat)
Student loan
Payday loan
Automobile title loan
Other consumer or personal loan or line of credit
If Other, please specify:
Past-due Bills, Payments, or Other Debt Yes No
Past-due taxes
Past-due medical bill(s)
Past-due rent
Past-due phone, cable, internet, or other telecommunications bill(s)
Past-due utility bill(s) (gas, electric, water, etc.)
Legal judgment or legal expenses (child support, attorneys' fees, etc.)
Other type of debt
If Other, please specify:
9953
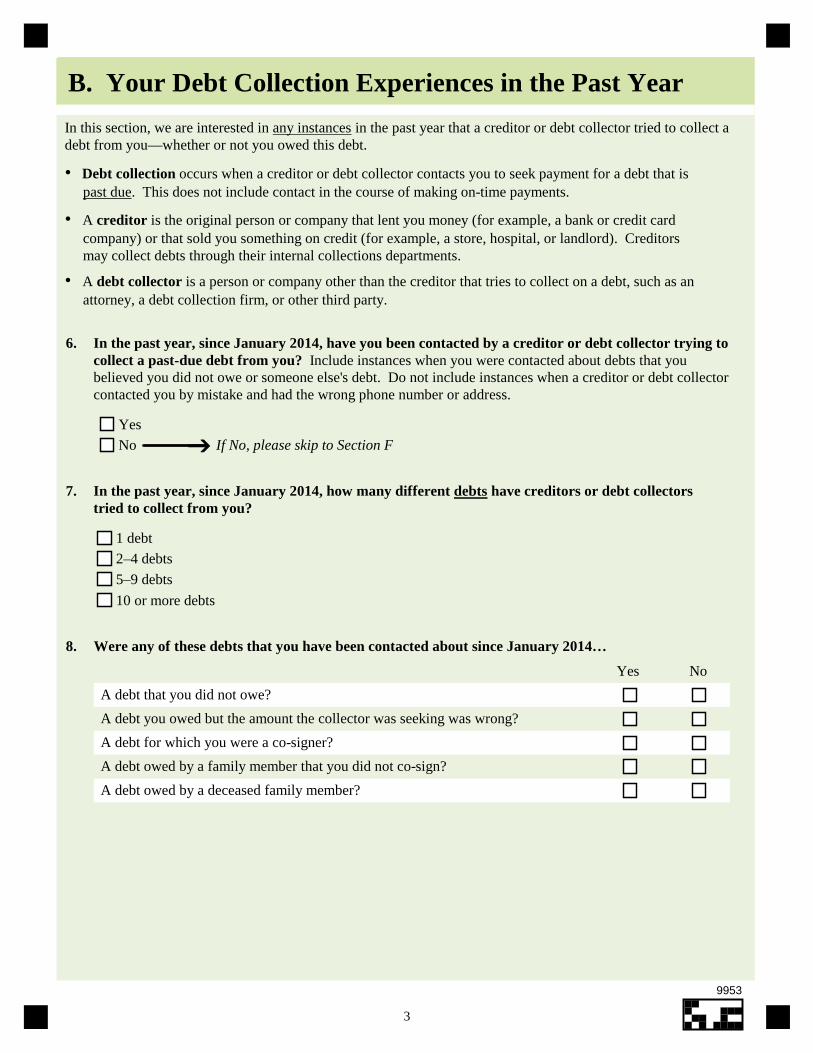
3
B. Your Debt Collection Experiences in the Past Year
In this section, we are interested in any instances in the past year that a creditor or debt collector tried to collect adebt from you—whether or not you owed this debt.
• Debt collection occurs when a creditor or debt collector contacts you to seek payment for a debt that is past due. This does not include contact in the course of making on-time payments.
• A creditor is the original person or company that lent you money (for example, a bank or credit card company) or that sold you something on credit (for example, a store, hospital, or landlord). Creditors may collect debts through their internal collections departments.
• A debt collector is a person or company other than the creditor that tries to collect on a debt, such as an attorney, a debt collection firm, or other third party.
Yes
No If No, please skip to Section F
7. In the past year, since January 2014, how many different debts have creditors or debt collectorstried to collect from you?
1 debt
2–4 debts
5–9 debts
10 or more debts
8. Were any of these debts that you have been contacted about since January 2014…
Yes No
A debt that you did not owe?
A debt you owed but the amount the collector was seeking was wrong?
A debt for which you were a co-signer?
A debt owed by a family member that you did not co-sign?
A debt owed by a deceased family member?
In the past year, since January 2014, have you been contacted by a creditor or debt collector trying tocollect a past-due debt from you? Include instances when you were contacted about debts that youbelieved you did not owe or someone else's debt. Do not include instances when a creditor or debt collectorcontacted you by mistake and had the wrong phone number or address.
6.
9953
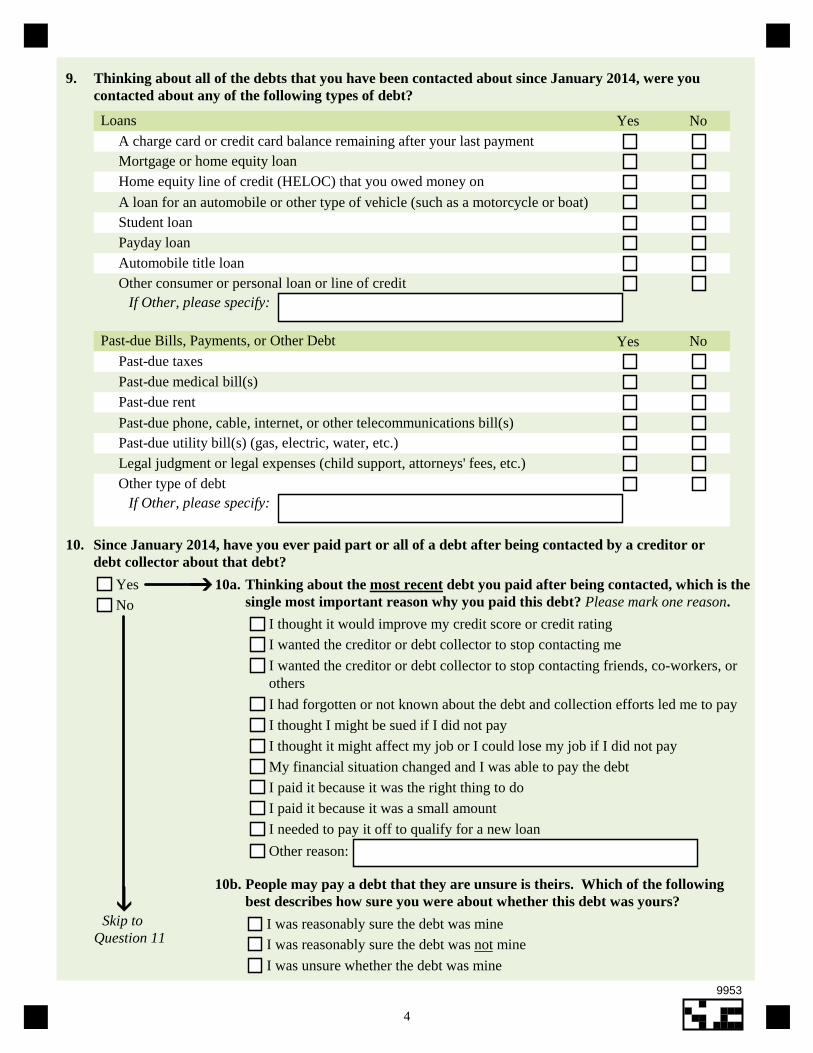
4
9. Thinking about all of the debts that you have been contacted about since January 2014, were youcontacted about any of the following types of debt?
A charge card or credit card balance remaining after your last paymentMortgage or home equity loan
Home equity line of credit (HELOC) that you owed money on
A loan for an automobile or other type of vehicle (such as a motorcycle or boat)Student loanPayday loan
Automobile title loanOther consumer or personal loan or line of credit
If Other, please specify:
Past-due Bills, Payments, or Other Debt Yes NoPast-due taxes
Past-due medical bill(s)Past-due rent
Past-due phone, cable, internet, or other telecommunications bill(s)Past-due utility bill(s) (gas, electric, water, etc.)
Legal judgment or legal expenses (child support, attorneys' fees, etc.)
If Other, please specify:Other type of debt
10. Since January 2014, have you ever paid part or all of a debt after being contacted by a creditor ordebt collector about that debt?
Yes
No10a. Thinking about the most recent debt you paid after being contacted, which is the
single most important reason why you paid this debt? Please mark one reason.
I thought it would improve my credit score or credit rating
I wanted the creditor or debt collector to stop contacting me
I wanted the creditor or debt collector to stop contacting friends, co-workers, or
I had forgotten or not known about the debt and collection efforts led me to pay
I thought I might be sued if I did not pay
I thought it might affect my job or I could lose my job if I did not pay
My financial situation changed and I was able to pay the debt
I paid it because it was the right thing to do
I paid it because it was a small amount
I needed to pay it off to qualify for a new loan
Other reason:
others
10b. People may pay a debt that they are unsure is theirs. Which of the followingbest describes how sure you were about whether this debt was yours?
I was reasonably sure the debt was mine
I was reasonably sure the debt was not mine
I was unsure whether the debt was mine
Skip to
Question 11
Loans Yes No
9953
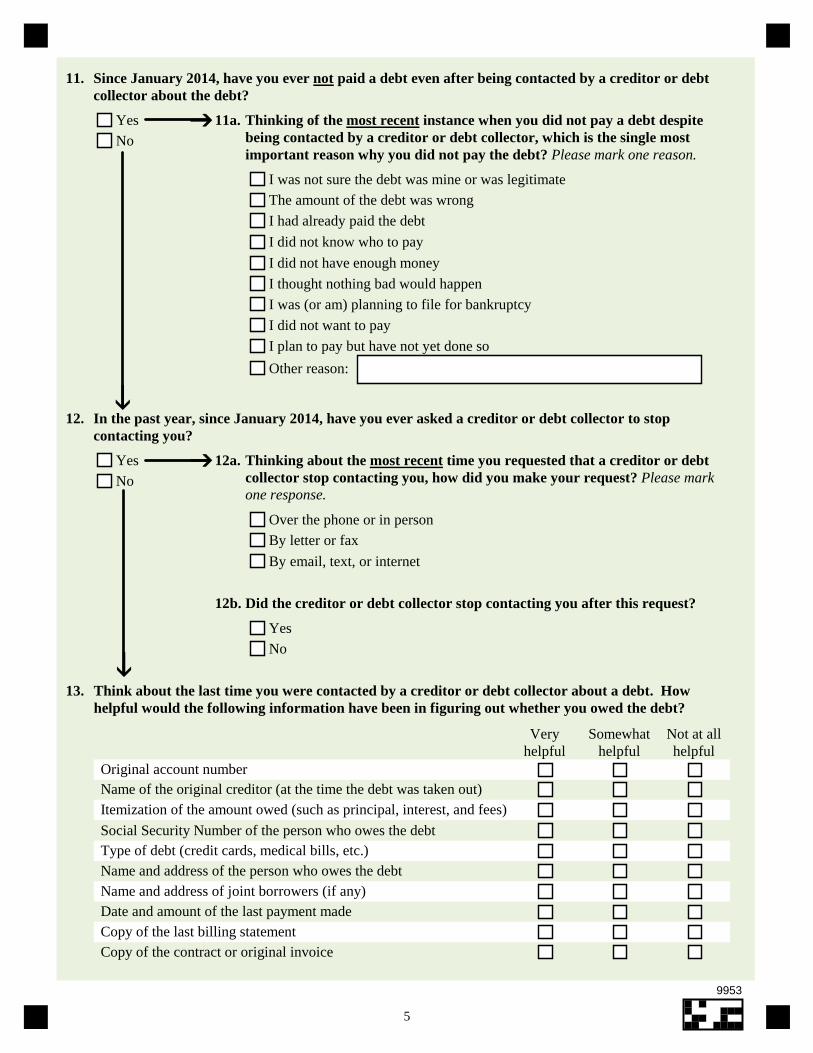
5
11. Since January 2014, have you ever not paid a debt even after being contacted by a creditor or debtcollector about the debt?
Yes
No11a. Thinking of the most recent instance when you did not pay a debt despite
being contacted by a creditor or debt collector, which is the single mostimportant reason why you did not pay the debt? Please mark one reason.
I was not sure the debt was mine or was legitimate
The amount of the debt was wrong
I had already paid the debt
I did not know who to pay
I did not have enough money
I thought nothing bad would happen
I was (or am) planning to file for bankruptcy
I did not want to pay
I plan to pay but have not yet done so
Other reason:
12. In the past year, since January 2014, have you ever asked a creditor or debt collector to stop
contacting you?
Yes
No12a. Thinking about the most recent time you requested that a creditor or debt
collector stop contacting you, how did you make your request? Please markone response.
Over the phone or in person
By letter or fax
By email, text, or internet
13. Think about the last time you were contacted by a creditor or debt collector about a debt. Howhelpful would the following information have been in figuring out whether you owed the debt?
Original account numberName of the original creditor (at the time the debt was taken out)
Itemization of the amount owed (such as principal, interest, and fees)
Social Security Number of the person who owes the debtType of debt (credit cards, medical bills, etc.)Name and address of the person who owes the debt
Name and address of joint borrowers (if any)Date and amount of the last payment made
Veryhelpful
Not at allhelpful
Copy of the last billing statementCopy of the contract or original invoice
Somewhathelpful
Yes
No
Did the creditor or debt collector stop contacting you after this request?12b.
9953
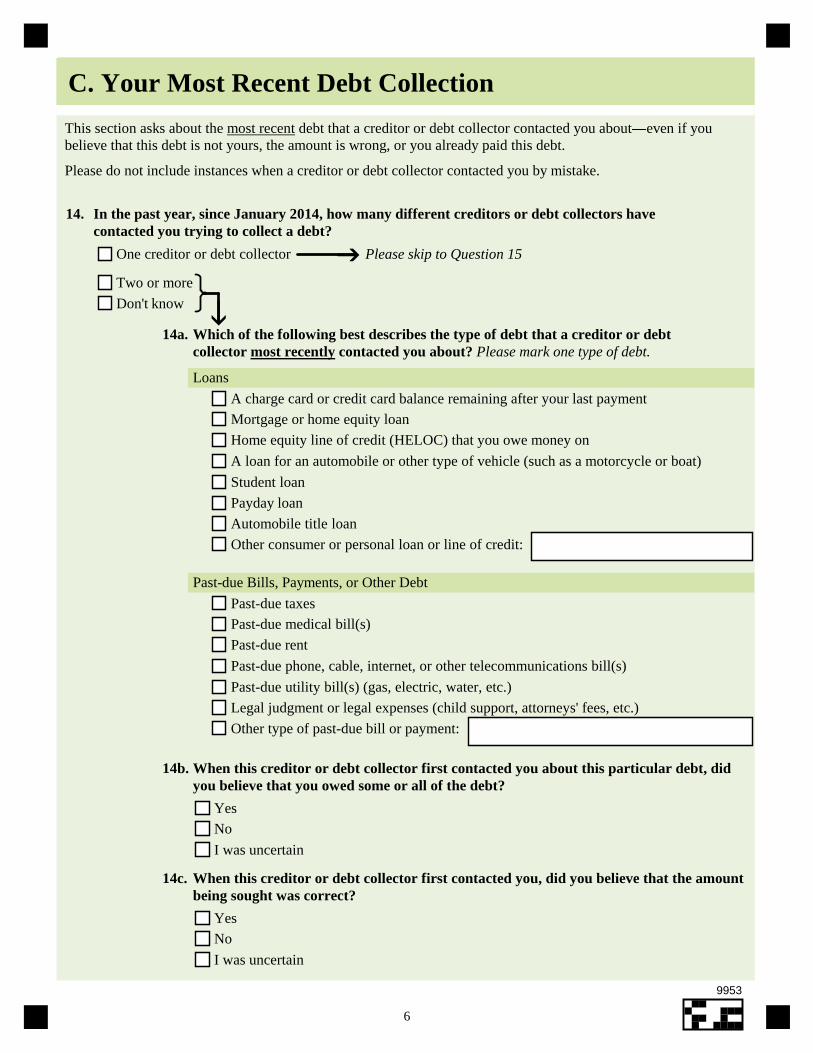
6
C. Your Most Recent Debt Collection
This section asks about the most recent debt that a creditor or debt collector contacted you about—even if youbelieve that this debt is not yours, the amount is wrong, or you already paid this debt.
Please do not include instances when a creditor or debt collector contacted you by mistake.
14. In the past year, since January 2014, how many different creditors or debt collectors havecontacted you trying to collect a debt?
One creditor or debt collector
Two or more
Don't know
Please skip to Question 15
14a. Which of the following best describes the type of debt that a creditor or debt
collector most recently contacted you about? Please mark one type of debt.
Loans
A charge card or credit card balance remaining after your last payment
Mortgage or home equity loan
Home equity line of credit (HELOC) that you owe money on
A loan for an automobile or other type of vehicle (such as a motorcycle or boat)
Student loan
Payday loan
Automobile title loan
Other consumer or personal loan or line of credit:
Past-due Bills, Payments, or Other Debt
Past-due taxes
Past-due medical bill(s)
Past-due rent
Past-due phone, cable, internet, or other telecommunications bill(s)
Past-due utility bill(s) (gas, electric, water, etc.)
Legal judgment or legal expenses (child support, attorneys' fees, etc.)
Other type of past-due bill or payment:
14c. When this creditor or debt collector first contacted you, did you believe that the amountbeing sought was correct?
Yes
No
I was uncertain
14b. When this creditor or debt collector first contacted you about this particular debt, didyou believe that you owed some or all of the debt?
Yes
No
I was uncertain
9953
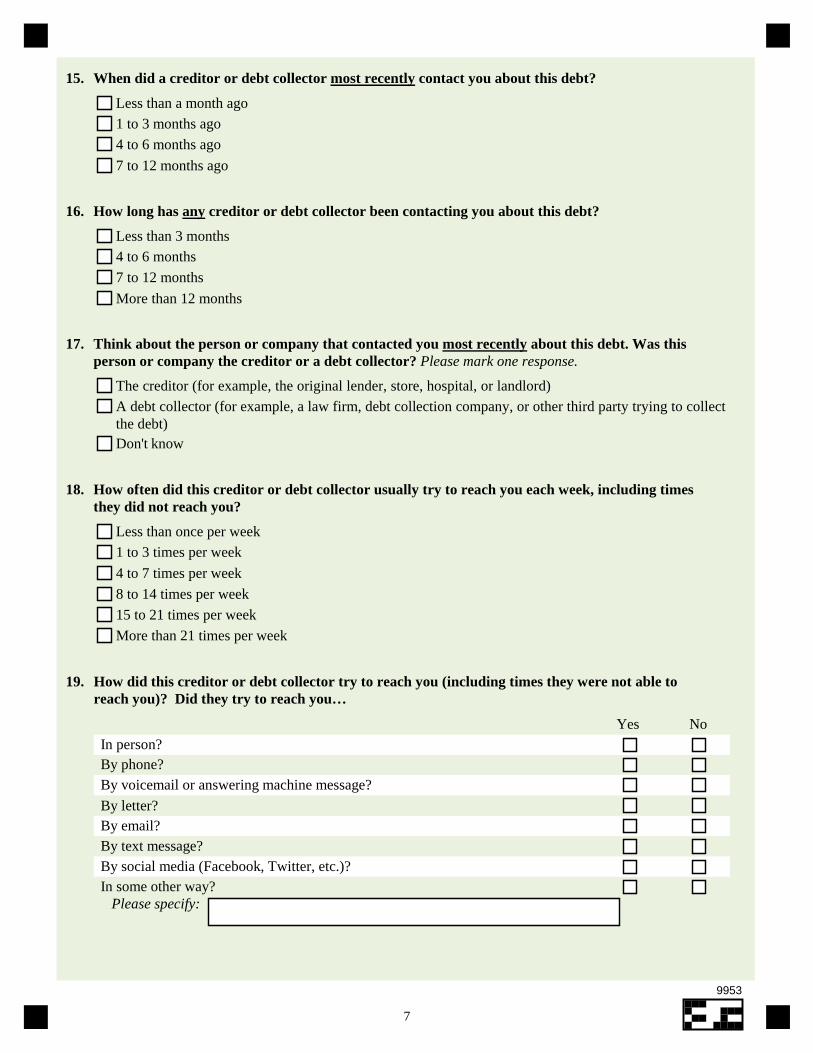
7
15. When did a creditor or debt collector most recently contact you about this debt?
Less than a month ago
1 to 3 months ago
4 to 6 months ago
7 to 12 months ago
16. How long has any creditor or debt collector been contacting you about this debt?
Less than 3 months
4 to 6 months
7 to 12 months
More than 12 months
17. Think about the person or company that contacted you most recently about this debt. Was thisperson or company the creditor or a debt collector? Please mark one response.
The creditor (for example, the original lender, store, hospital, or landlord)
A debt collector (for example, a law firm, debt collection company, or other third party trying to collect
Don't knowthe debt)
How often did this creditor or debt collector usually try to reach you each week, including timesthey did not reach you?
18.
Less than once per week
1 to 3 times per week
4 to 7 times per week
8 to 14 times per week
15 to 21 times per week
More than 21 times per week
19. How did this creditor or debt collector try to reach you (including times they were not able toreach you)? Did they try to reach you…
In person?By phone?
By voicemail or answering machine message?
By letter?By email?By text message?
By social media (Facebook, Twitter, etc.)?In some other way? Please specify:
Yes No
9953
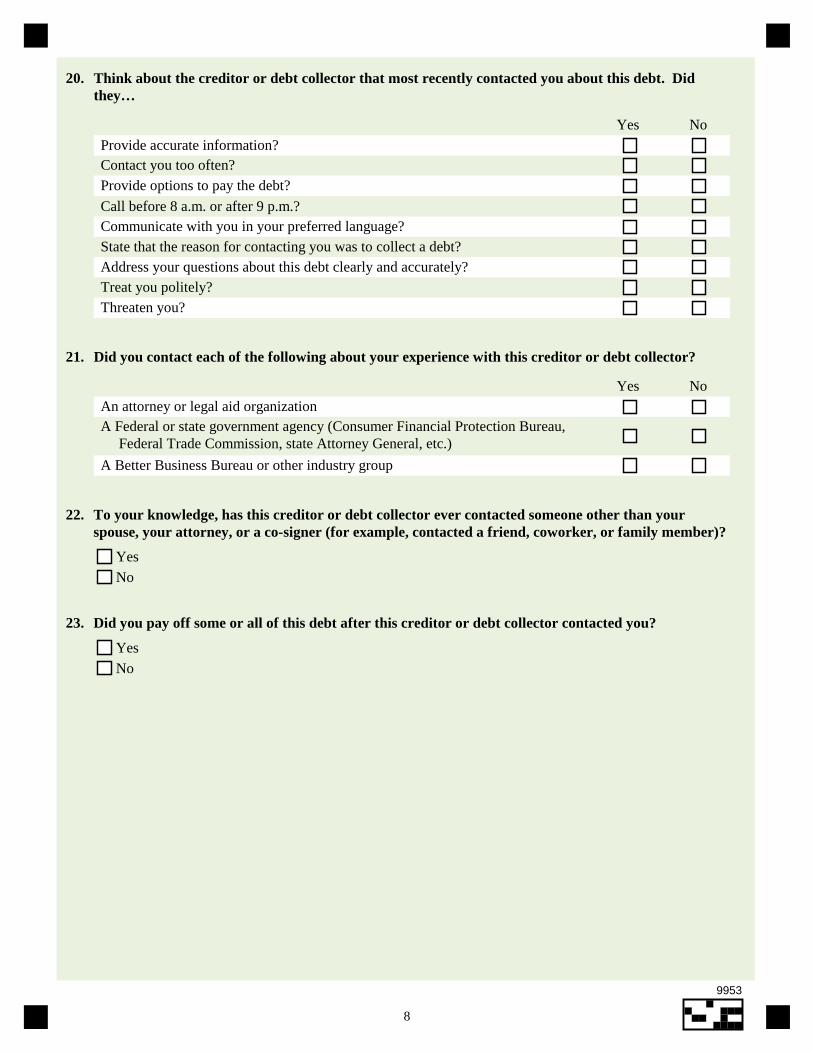
8
20. Think about the creditor or debt collector that most recently contacted you about this debt. Didthey…
Provide accurate information?Contact you too often?
Provide options to pay the debt?
Call before 8 a.m. or after 9 p.m.?Communicate with you in your preferred language?
State that the reason for contacting you was to collect a debt?Address your questions about this debt clearly and accurately?Treat you politely?
Yes No
Threaten you?
21. Did you contact each of the following about your experience with this creditor or debt collector?
An attorney or legal aid organizationA Federal or state government agency (Consumer Financial Protection Bureau, Federal Trade Commission, state Attorney General, etc.)
Yes No
A Better Business Bureau or other industry group
22. To your knowledge, has this creditor or debt collector ever contacted someone other than yourspouse, your attorney, or a co-signer (for example, contacted a friend, coworker, or family member)?
Yes
No
23. Did you pay off some or all of this debt after this creditor or debt collector contacted you?
Yes
No
9953
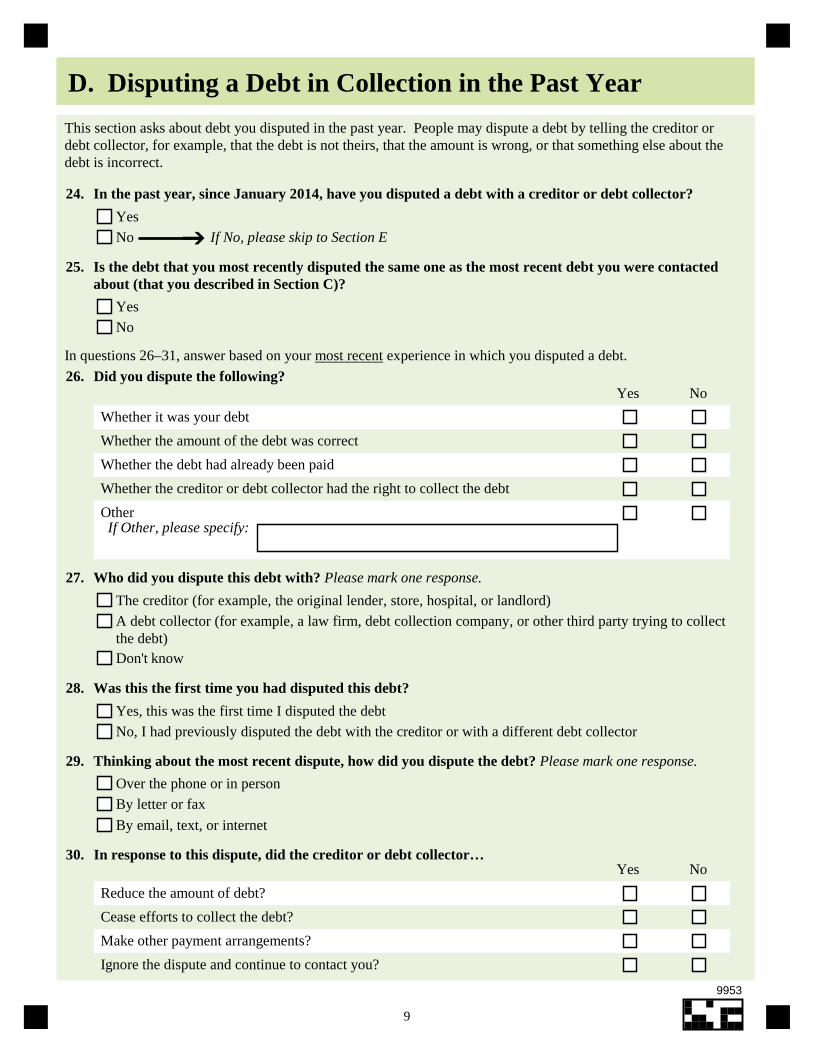
9
D. Disputing a Debt in Collection in the Past Year
This section asks about debt you disputed in the past year. People may dispute a debt by telling the creditor ordebt collector, for example, that the debt is not theirs, that the amount is wrong, or that something else about thedebt is incorrect.
24. In the past year, since January 2014, have you disputed a debt with a creditor or debt collector?
Yes
No If No, please skip to Section E25. Is the debt that you most recently disputed the same one as the most recent debt you were contacted
about (that you described in Section C)?
Yes
No
In questions 26–31, answer based on your most recent experience in which you disputed a debt.
26. Did you dispute the following?Yes No
Whether it was your debt
Whether the amount of the debt was correct
Whether the debt had already been paid
Whether the creditor or debt collector had the right to collect the debt
Other If Other, please specify:
Yes, this was the first time I disputed the debt
No, I had previously disputed the debt with the creditor or with a different debt collector
Was this the first time you had disputed this debt?28.
The creditor (for example, the original lender, store, hospital, or landlord)
A debt collector (for example, a law firm, debt collection company, or other third party trying to collect
Don't knowthe debt)
Who did you dispute this debt with? Please mark one response.27.
Over the phone or in person
By letter or fax
By email, text, or internet
29. Thinking about the most recent dispute, how did you dispute the debt? Please mark one response.
30. In response to this dispute, did the creditor or debt collector…Yes No
Reduce the amount of debt?
Cease efforts to collect the debt?
Make other payment arrangements?
Ignore the dispute and continue to contact you?
9953
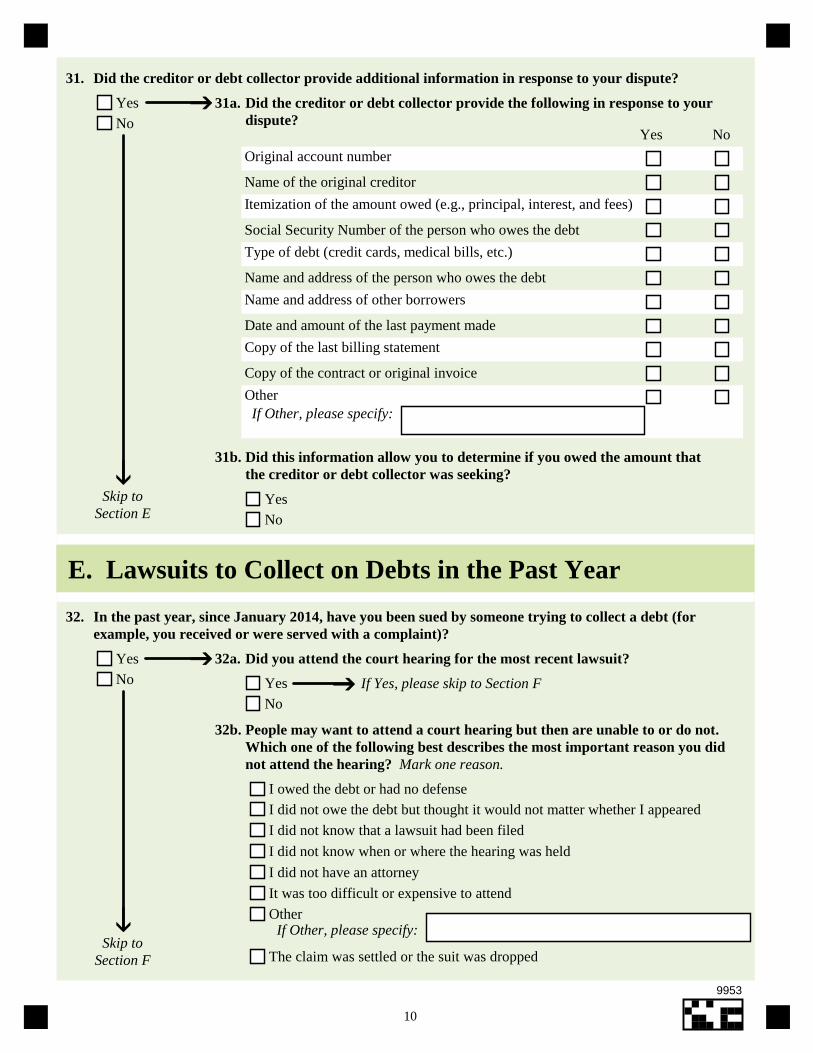
10
31. Did the creditor or debt collector provide additional information in response to your dispute?
Yes
No31a.
31b.
E. Lawsuits to Collect on Debts in the Past Year
32. In the past year, since January 2014, have you been sued by someone trying to collect a debt (forexample, you received or were served with a complaint)?
Yes
No32a. Did you attend the court hearing for the most recent lawsuit?
Did the creditor or debt collector provide the following in response to yourdispute?
Yes No
Original account number
Name of the original creditor
Itemization of the amount owed (e.g., principal, interest, and fees)
Social Security Number of the person who owes the debt
Type of debt (credit cards, medical bills, etc.)
Name and address of the person who owes the debt
Name and address of other borrowers
Date and amount of the last payment made
Copy of the last billing statement
Copy of the contract or original invoice
Other
Did this information allow you to determine if you owed the amount thatthe creditor or debt collector was seeking?
Yes
No
Yes
No
If Yes, please skip to Section F
32b. People may want to attend a court hearing but then are unable to or do not.Which one of the following best describes the most important reason you didnot attend the hearing? Mark one reason.
If Other, please specify:
Skip toSection F
Skip toSection E
I owed the debt or had no defense
I did not owe the debt but thought it would not matter whether I appeared
I did not know that a lawsuit had been filed
I did not know when or where the hearing was held
I did not have an attorney
It was too difficult or expensive to attend
Other
The claim was settled or the suit was dropped
If Other, please specify:
9953
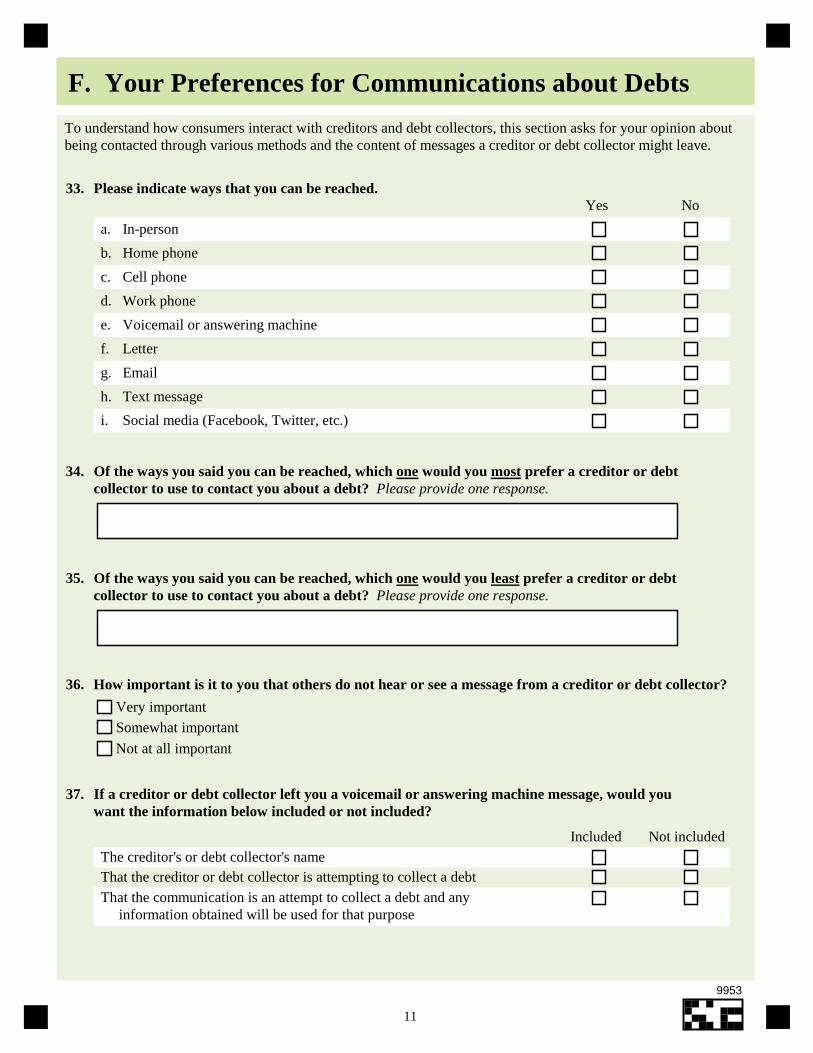
11
F. Your Preferences for Communications about Debts
To understand how consumers interact with creditors and debt collectors, this section asks for your opinion aboutbeing contacted through various methods and the content of messages a creditor or debt collector might leave.
33. Please indicate ways that you can be reached.Yes No
a. In-person
b. Home phone
c. Cell phone
d. Work phone
e. Voicemail or answering machine
f. Letter
g. Email
h. Text message
i. Social media (Facebook, Twitter, etc.)
34. Of the ways you said you can be reached, which one would you most prefer a creditor or debtcollector to use to contact you about a debt? Please provide one response.
Of the ways you said you can be reached, which one would you least prefer a creditor or debtcollector to use to contact you about a debt? Please provide one response.
35.
How important is it to you that others do not hear or see a message from a creditor or debt collector?36.
Very important
Somewhat important
Not at all important
37. If a creditor or debt collector left you a voicemail or answering machine message, would youwant the information below included or not included?
The creditor's or debt collector's nameThat the creditor or debt collector is attempting to collect a debt
That the communication is an attempt to collect a debt and any information obtained will be used for that purpose
Included Not included
9953
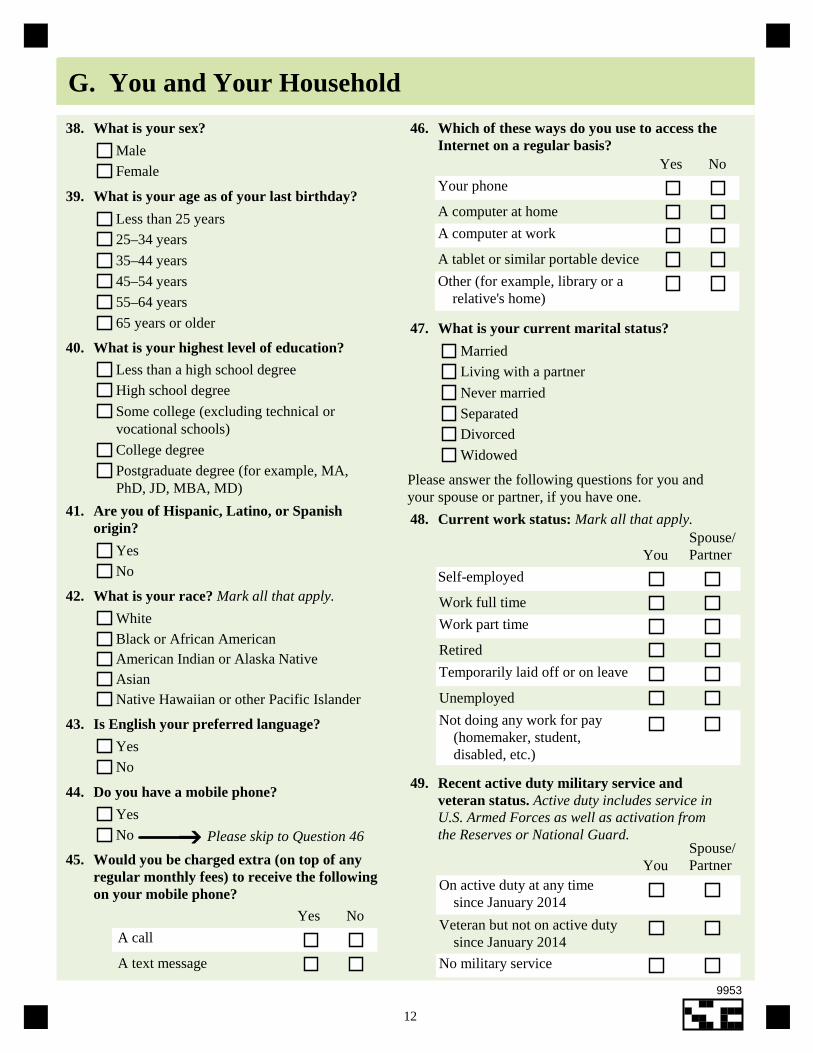
12
G. You and Your Household
38. What is your sex?
Male
Female
39. What is your age as of your last birthday?
Less than 25 years
25–34 years
35–44 years
45–54 years
55–64 years
65 years or older
PhD, JD, MBA, MD)
vocational schools)
Less than a high school degree
High school degree
Some college (excluding technical or
College degree
Postgraduate degree (for example, MA,
40. What is your highest level of education?
Yes
No
Are you of Hispanic, Latino, or Spanishorigin?
41.
45. Would you be charged extra (on top of anyregular monthly fees) to receive the followingon your mobile phone?
46. Which of these ways do you use to access theInternet on a regular basis?
Your phone
A computer at home
NoYes
A computer at work
A tablet or similar portable device
Other (for example, library or a relative's home)
47. What is your current marital status?
Please answer the following questions for you andyour spouse or partner, if you have one.
48. Current work status: Mark all that apply.
Self-employed
Spouse/PartnerYou
Work full time
Work part time
Retired
Temporarily laid off or on leave
YouSpouse/Partner
On active duty at any time since January 2014
Veteran but not on active duty since January 2014
Unemployed
Not doing any work for pay (homemaker, student, disabled, etc.)
49. Recent active duty military service andveteran status. Active duty includes service inU.S. Armed Forces as well as activation fromthe Reserves or National Guard.
No military service
Native Hawaiian or other Pacific IslanderAsianAmerican Indian or Alaska NativeBlack or African American
White
What is your race? Mark all that apply.42.
Yes
No
Is English your preferred language?43.
Do you have a mobile phone?
Yes
No
44.
Please skip to Question 46
A text message
A call
NoYes
Living with a partner
Never married
Separated
Widowed
Divorced
Married
9953
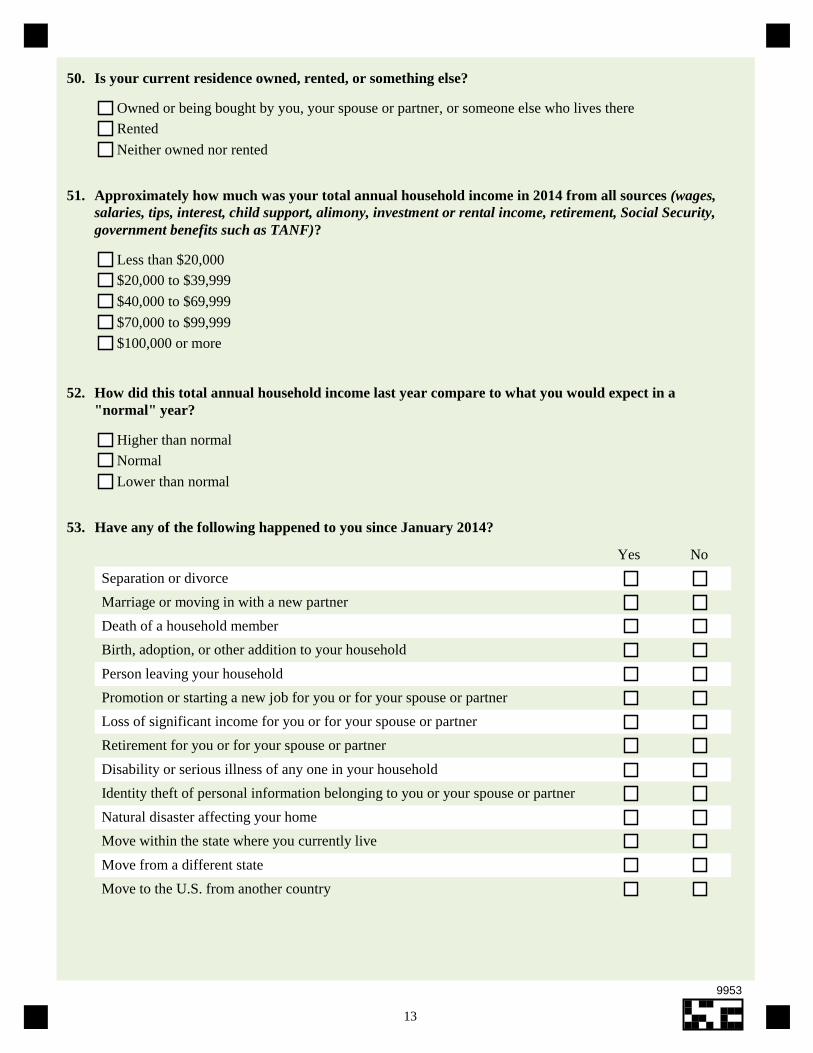
13
50. Is your current residence owned, rented, or something else?
Owned or being bought by you, your spouse or partner, or someone else who lives there
Rented
Neither owned nor rented
51. Approximately how much was your total annual household income in 2014 from all sources (wages,salaries, tips, interest, child support, alimony, investment or rental income, retirement, Social Security,government benefits such as TANF)?
Less than $20,000
$20,000 to $39,999
$40,000 to $69,999
$70,000 to $99,999
$100,000 or more
52. How did this total annual household income last year compare to what you would expect in a"normal" year?
Higher than normal
Normal
Lower than normal
53. Have any of the following happened to you since January 2014?
Separation or divorce
Marriage or moving in with a new partner
Death of a household member
Birth, adoption, or other addition to your household
Person leaving your household
Promotion or starting a new job for you or for your spouse or partner
Loss of significant income for you or for your spouse or partner
Retirement for you or for your spouse or partner
Disability or serious illness of any one in your household
Identity theft of personal information belonging to you or your spouse or partner
Natural disaster affecting your home
Move within the state where you currently live
Move from a different state
Move to the U.S. from another country
NoYes
9953
14
We have provided the space below if you wish to share additional comments or further explain any of yourresponses. Please do not put your name or address on the questionnaire.
Thank you for completing our survey!
Please use the enclosed business reply envelope to return your completed questionnaire to:
Consumer Financial Protection Bureau1600 Research Blvd., RC B16
Rockville MD 20850
9953
If you would prefer to complete the survey online in English or Spanish, follow theinstructions below. Web responses are processed more quickly, so taking the surveyonline makes it less likely that you will receive follow-up contacts.
Web Survey Instructions
1 Go to the website www.CFPBDebtSurvey.comVisite al sitio web www.CFPBDebtSurvey.com
Log in and enter your unique survey PIN number and 5-digit zip codefound in the accompanying letter. Inicie la sesión con su número PIN único dela encuesta y el código postal de 5 digitos que se encuentra en la carta adjunta.
2
Questions?If you have any technical difficulties, including problems with the website orany questions about the survey, please call 1-855-246-9457.