Embed Size (px)
Citation preview
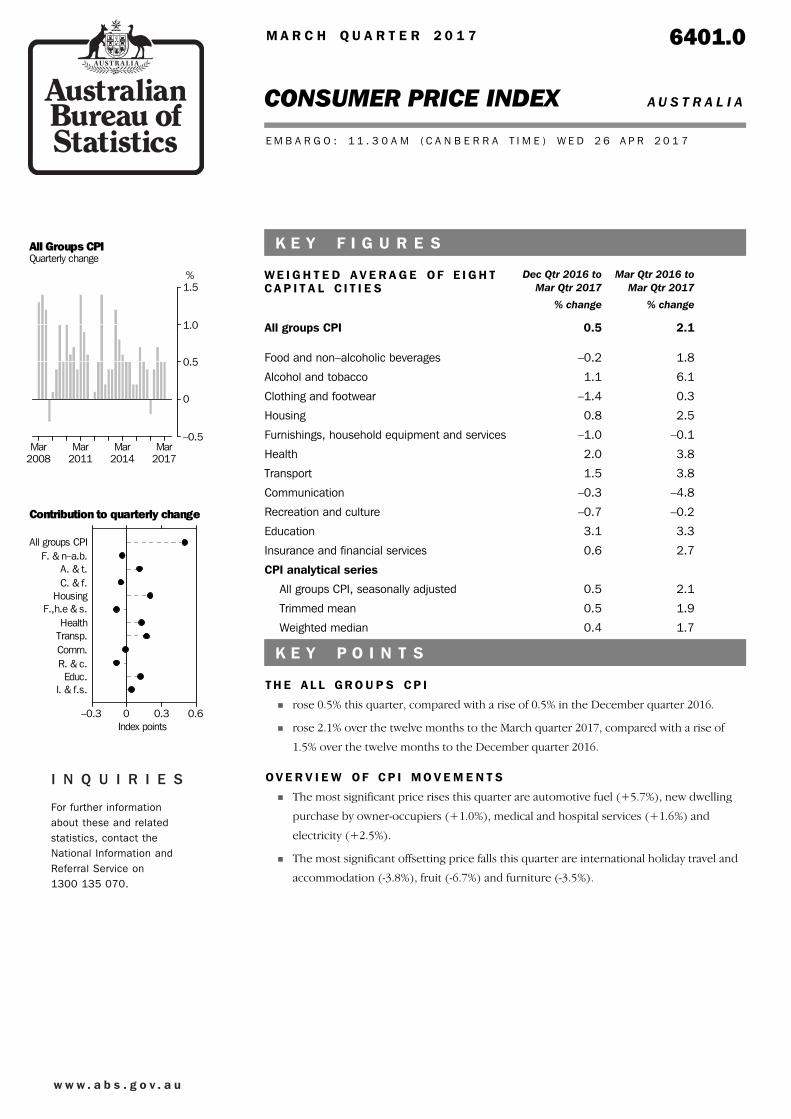
1.70.4Weighted median
1.90.5Trimmed mean
2.10.5All groups CPI, seasonally adjusted
CPI analytical series
2.70.6Insurance and financial services
3.33.1Education
–0.2–0.7Recreation and culture
–4.8–0.3Communication
3.81.5Transport
3.82.0Health
–0.1–1.0Furnishings, household equipment and services
2.50.8Housing
0.3–1.4Clothing and footwear
6.11.1Alcohol and tobacco
1.8–0.2Food and non–alcoholic beverages
2.10.5All groups CPI
% change% change
Mar Qtr 2016 toMar Qtr 2017
Dec Qtr 2016 toMar Qtr 2017
W E I G H T E D A V E R A G E O F E I G H TC A P I T A L C I T I E S
K E Y F I G U R E S
T H E A L L G R O U P S C P I
rose 0.5% this quarter, compared with a rise of 0.5% in the December quarter 2016.
rose 2.1% over the twelve months to the March quarter 2017, compared with a rise of
1.5% over the twelve months to the December quarter 2016.
O V E R V I E W O F C P I M O V E M E N T S
The most significant price rises this quarter are automotive fuel (+5.7%), new dwelling
purchase by owner-occupiers (+1.0%), medical and hospital services (+1.6%) and
electricity (+2.5%).
The most significant offsetting price falls this quarter are international holiday travel and
accommodation (-3.8%), fruit (-6.7%) and furniture (-3.5%).
K E Y P O I N T S
E M B A R G O : 1 1 . 3 0 A M ( C A N B E R R A T I M E ) W E D 2 6 A P R 2 0 1 7
CONSUMER PRICE INDEX A U S T R A L I A
6401.0M A R C H Q U A R T E R 2 0 1 7
For further informationabout these and relatedstatistics, contact theNational Information andReferral Service on1300 135 070.
All Groups CPIQuarterly change
Mar2008
Mar2011
Mar2014
Mar2017
%
–0.5
0
0.5
1.0
1.5
Contribution to quarterly change
All groups CPIF. & n–a.b.
A. & t.C. & f.
HousingF.,h.e & s.
HealthTransp.Comm.R. & c.Educ.
I. & f.s.
–0.3 0 0.3 0.6Index points
I N Q U I R I E S
w w w . a b s . g o v . a u
24 April 2018March 2018
31 January 2018December 2017
25 October 2017September 2017
26 July 2017June 2017
RELEASE DATEISSUE (Quarter)FO R T H C O M I N G I S S U E S
Any discrepancies between totals and sums of components in this publication are due to
rounding.
RO U N D I N G
Implementation of the changes outlined in the December quarter 2016 feature article
Measuring Price Change of Attached Dwellings in the CPI are included in this
publication. These changes see the inclusion of dwellings such as apartments and
townhouses in the measurement of price change for the new dwelling purchase by
owner-occupiers expenditure class. These changes do not result in any changes to the
published series in this publication.
CH A N G E S IN TH I S I S S U E
not elsewhere classifiedn.e.c.
Consumer Price IndexCPI
Australian Bureau of StatisticsABSAB B R E V I A T I O N S
Da v i d W . Ka l i s c h
Au s t r a l i a n S t a t i s t i c i a n
2 A B S • CO N S U M E R P R I C E I N D E X • 6 4 0 1 . 0 • MA R QT R 2 0 1 7
N O T E S
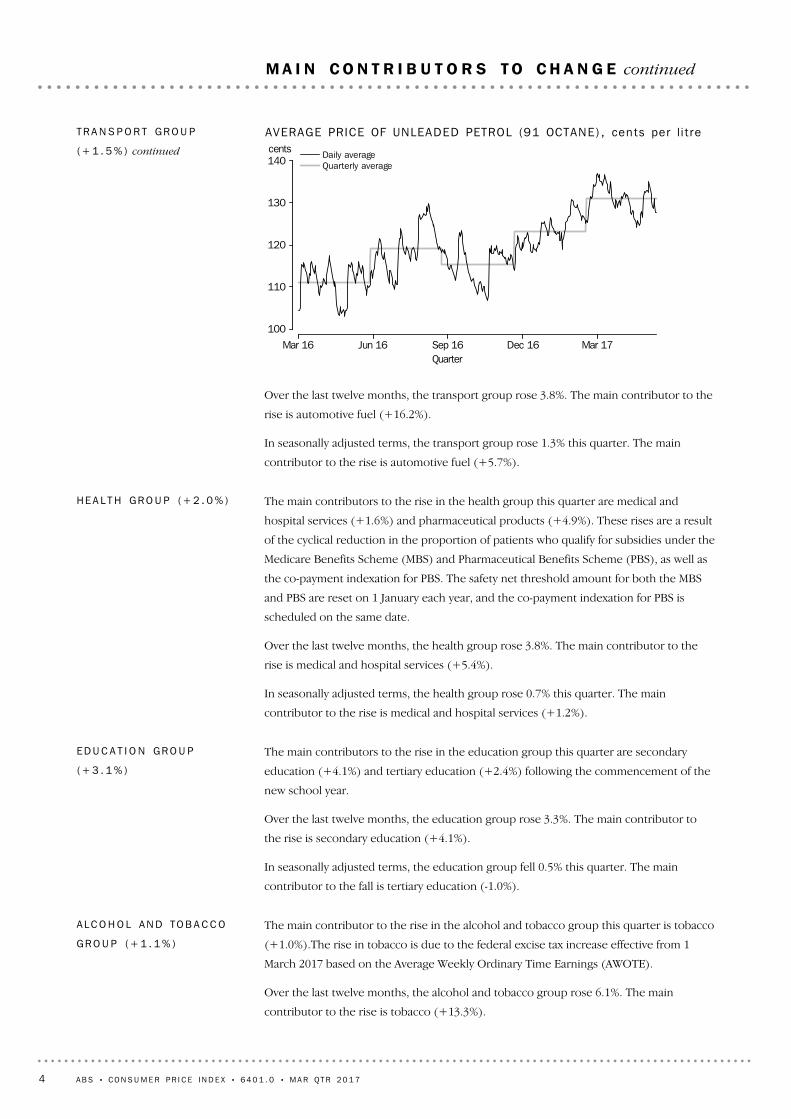
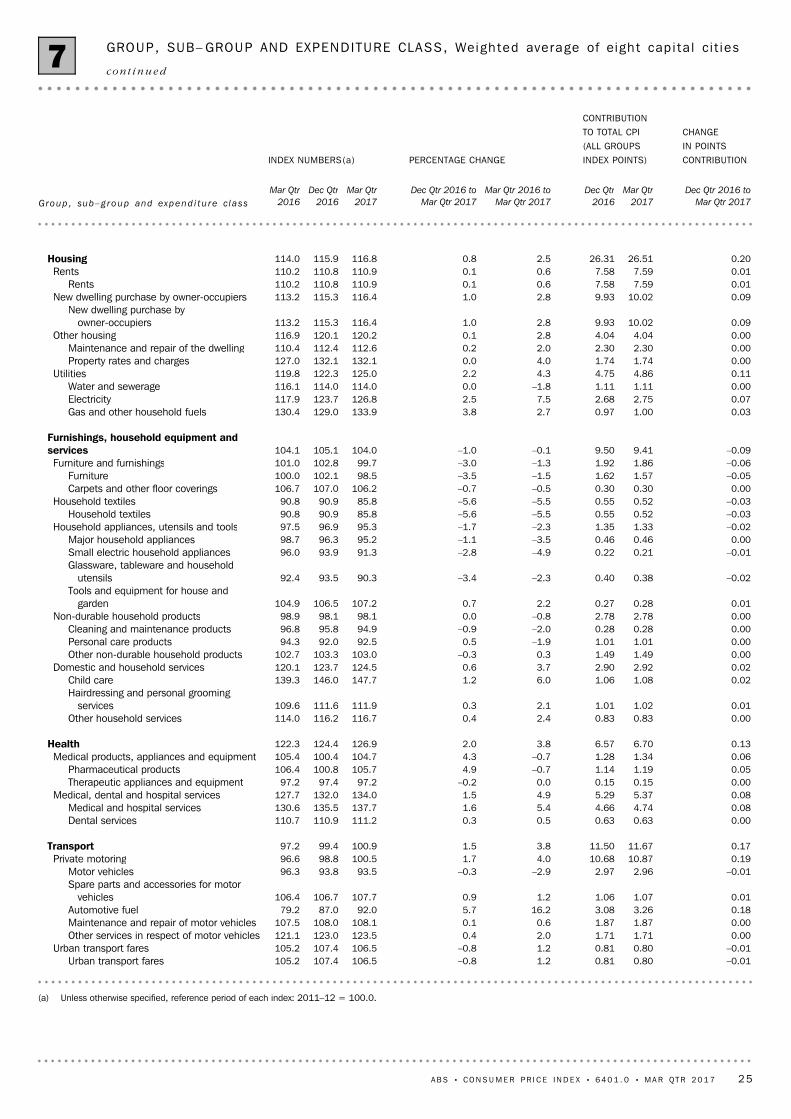
The main contributor to the rise in the transport group this quarter is automotive fuel
(+5.7%). Automotive fuel rose in January (+4.6%) and fell in February (-2.4%) and
March (-1.4%). All fuel types recorded rises this quarter. The rise is partially offset by falls
in urban transport fares (-0.8%) and motor vehicles (-0.3%).
The following graph shows the pattern of the average daily prices for unleaded petrol for
the eight capital cities over the last fifteen months.
TR A N S P O R T GR O U P
(+ 1 . 5 % )
The main contributors to the rise in the housing group this quarter are new dwelling
purchase by owner-occupiers (+1.0%), electricity (+2.5%) and gas and other household
fuels (+3.8%). The rise in new dwelling purchase by owner-occupiers is driven by rises in
input costs. The rise in electricity and gas and other household fuels is driven by
increases in wholesale costs.
Over the last twelve months, the housing group rose 2.5%. The main contributors to the
rise are new dwelling purchase by owner-occupiers (+2.8%) and electricity (+7.5%).
In seasonally adjusted terms, the housing group rose 0.8% this quarter. The main
contributor to the rise is new dwelling purchase by owner-occupiers (+1.0%).
HO U S I N G GR O U P (+ 0 . 8 % )
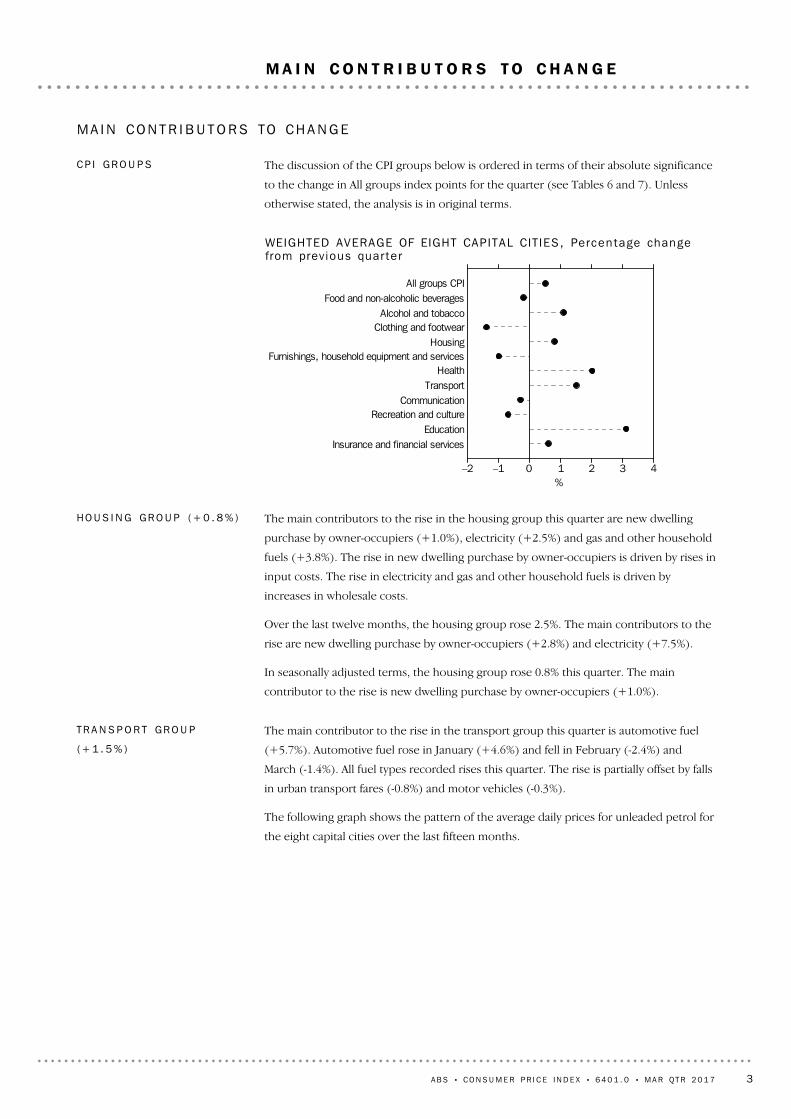
All groups CPIFood and non-alcoholic beverages
Alcohol and tobaccoClothing and footwear
HousingFurnishings, household equipment and services
HealthTransport
CommunicationRecreation and culture
EducationInsurance and financial services
–2 –1 0 1 2 3 4%
WEIGHTED AVERAGE OF EIGHT CAPITAL CIT IES, Percen tage changefrom prev ious quar te r
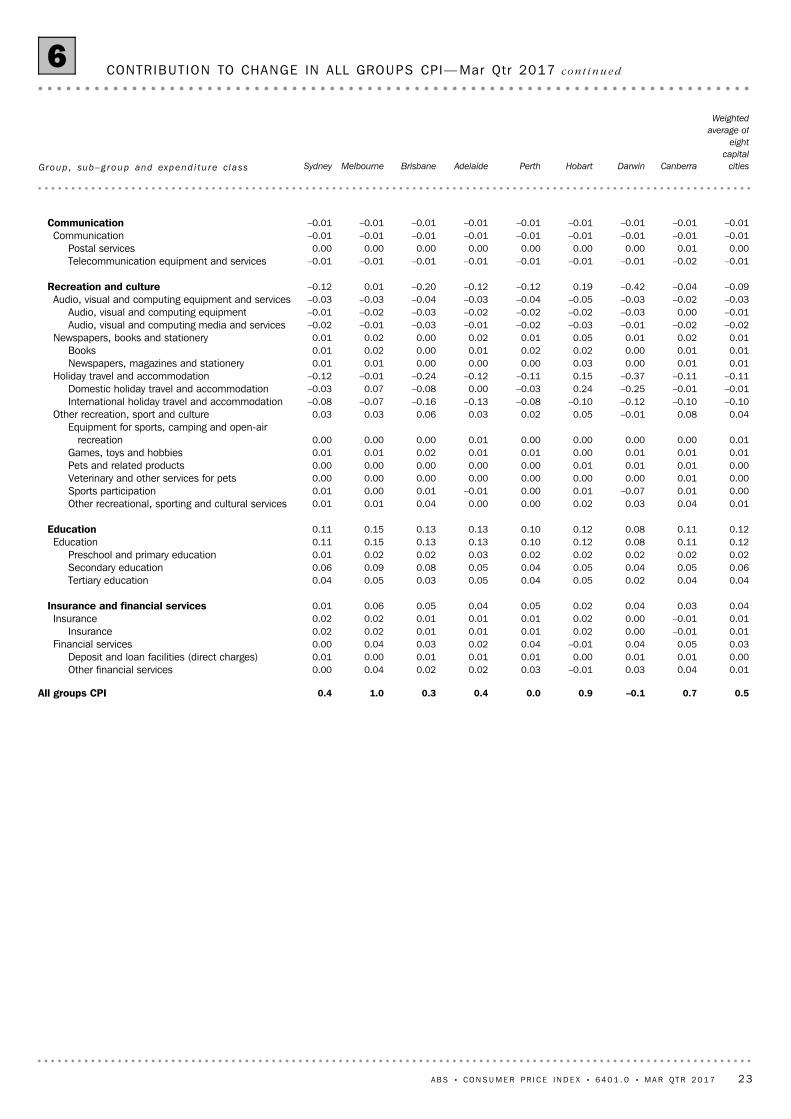
The discussion of the CPI groups below is ordered in terms of their absolute significance
to the change in All groups index points for the quarter (see Tables 6 and 7). Unless
otherwise stated, the analysis is in original terms.
CP I GR O U P S
MA I N CO N T R I B U T O R S TO CH A N G E
A B S • CO N S U M E R P R I C E I N D E X • 6 4 0 1 . 0 • MA R QT R 2 0 1 7 3
M A I N C O N T R I B U T O R S T O C H A N G E
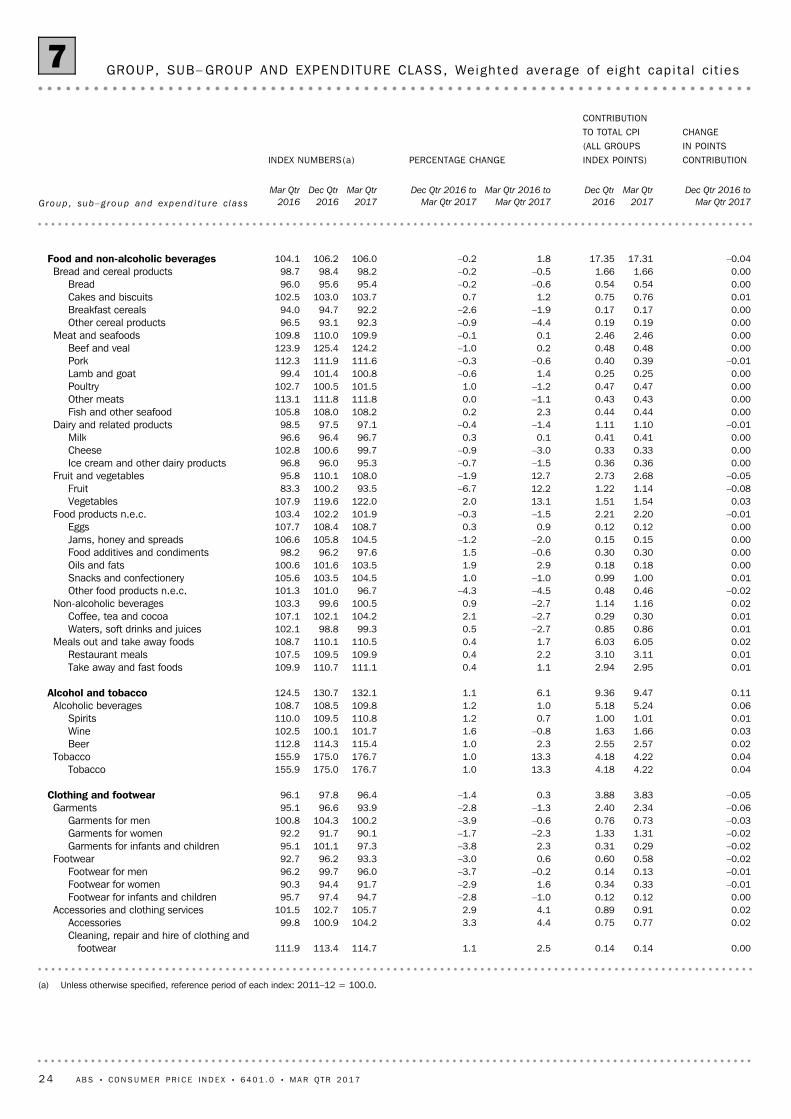
The main contributor to the rise in the alcohol and tobacco group this quarter is tobacco
(+1.0%).The rise in tobacco is due to the federal excise tax increase effective from 1
March 2017 based on the Average Weekly Ordinary Time Earnings (AWOTE).
Over the last twelve months, the alcohol and tobacco group rose 6.1%. The main
contributor to the rise is tobacco (+13.3%).
AL C O H O L AN D TO B A C C O
GR O U P (+ 1 . 1 % )
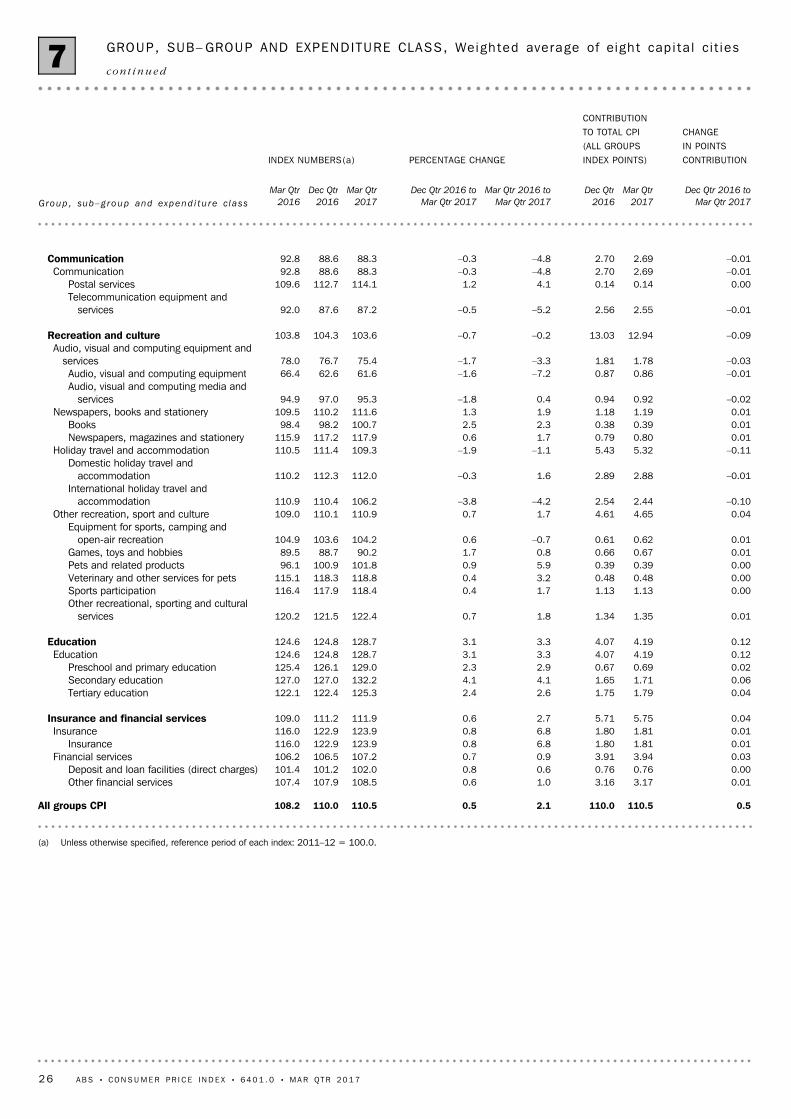
The main contributors to the rise in the education group this quarter are secondary
education (+4.1%) and tertiary education (+2.4%) following the commencement of the
new school year.
Over the last twelve months, the education group rose 3.3%. The main contributor to
the rise is secondary education (+4.1%).
In seasonally adjusted terms, the education group fell 0.5% this quarter. The main
contributor to the fall is tertiary education (-1.0%).
ED U C A T I O N GR O U P
(+ 3 . 1 % )
The main contributors to the rise in the health group this quarter are medical and
hospital services (+1.6%) and pharmaceutical products (+4.9%). These rises are a result
of the cyclical reduction in the proportion of patients who qualify for subsidies under the
Medicare Benefits Scheme (MBS) and Pharmaceutical Benefits Scheme (PBS), as well as
the co-payment indexation for PBS. The safety net threshold amount for both the MBS
and PBS are reset on 1 January each year, and the co-payment indexation for PBS is
scheduled on the same date.
Over the last twelve months, the health group rose 3.8%. The main contributor to the
rise is medical and hospital services (+5.4%).
In seasonally adjusted terms, the health group rose 0.7% this quarter. The main
contributor to the rise is medical and hospital services (+1.2%).
HE A L T H GR O U P (+ 2 . 0 % )
Over the last twelve months, the transport group rose 3.8%. The main contributor to the
rise is automotive fuel (+16.2%).
In seasonally adjusted terms, the transport group rose 1.3% this quarter. The main
contributor to the rise is automotive fuel (+5.7%).
Mar 16 Jun 16 Sep 16 Dec 16 Mar 17Quarter
cents
100
110
120
130
140Daily averageQuarterly average
AVERAGE PRICE OF UNLEADED PETROL (91 OCTANE) , cents per l i t reTR A N S P O R T GR O U P
(+ 1 . 5 % ) continued
4 A B S • CO N S U M E R P R I C E I N D E X • 6 4 0 1 . 0 • MA R QT R 2 0 1 7
M A I N C O N T R I B U T O R S T O C H A N G E continued

The main contributor to the rise in the insurance and financial services group this
quarter is insurance (+0.8%).
Over the last twelve months, the insurance and financial services group rose 2.7%. The
main contributor to the rise is insurance (+6.8%).
In seasonally adjusted terms, the insurance and financial services group rose 0.7% this
quarter. The main contributor to the rise is insurance (+0.9%).
I N S U R A N C E AN D
F I N A N C I A L SE R V I C E S
GR O U P (+ 0 . 6 % )
The main contributors to the fall in the clothing and footwear group this quarter are
garments for men (-3.9%), garments for infants and children (-3.8%) and garments for
women (-1.7%) due to post Christmas specials.
Over the last twelve months, the clothing and footwear group rose 0.3%. The main
contributor to the rise is accessories (+4.4%).
In seasonally adjusted terms, the clothing and footwear group rose 0.1% this quarter.
The main contributor to the rise is accessories (+2.8%).
CL O T H I N G AN D
FO O T W E A R GR O U P
( - 1 . 4 % )
The main contributor to the fall in the recreation and culture group this quarter is
international holiday travel and accommodation (-3.8%) due to the winter off-peak
seasons in Europe and America.
Over the last twelve months, the recreation and culture group fell 0.2%. The main
contributors to the fall are international holiday travel and accommodation (-4.2%) and
audio, visual and computing equipment (-7.2%).
In the CPI, airfares are collected in advance (at the time of payment), but are only used
in the CPI in the quarter in which the trip is undertaken. International airfares are
collected two months in advance (January for travel in March) and domestic airfares are
collected one month in advance (February for travel in March).
In seasonally adjusted terms, the recreation and culture group rose 0.2% this quarter.
The main contributor to the rise is domestic holiday travel and accommodation (+0.8%).
RE C R E A T I O N AN D
CU L T U R E GR O U P ( - 0 . 7 % )
The main contributor to the fall in the furnishings, household equipment and services
group this quarter is furniture (-3.5%) due to post Christmas specials.
Over the last twelve months, the furnishings, household equipment and services group
fell 0.1%. The main contributor to the fall is household textiles (-5.5%).
In seasonally adjusted terms, the furnishings, household equipment and services group
recorded no movement.
FU R N I S H I N G S ,
HO U S E H O L D EQ U I P M E N T
AN D SE R V I C E S GR O U P
( - 1 . 0 % )
In seasonally adjusted terms, the alcohol and tobacco group rose 1.9% this quarter. The
main contributor to the rise is tobacco (+3.0%).
AL C O H O L AN D TO B A C C O
GR O U P (+ 1 . 1 % ) continued
A B S • CO N S U M E R P R I C E I N D E X • 6 4 0 1 . 0 • MA R QT R 2 0 1 7 5
M A I N C O N T R I B U T O R S T O C H A N G E continued
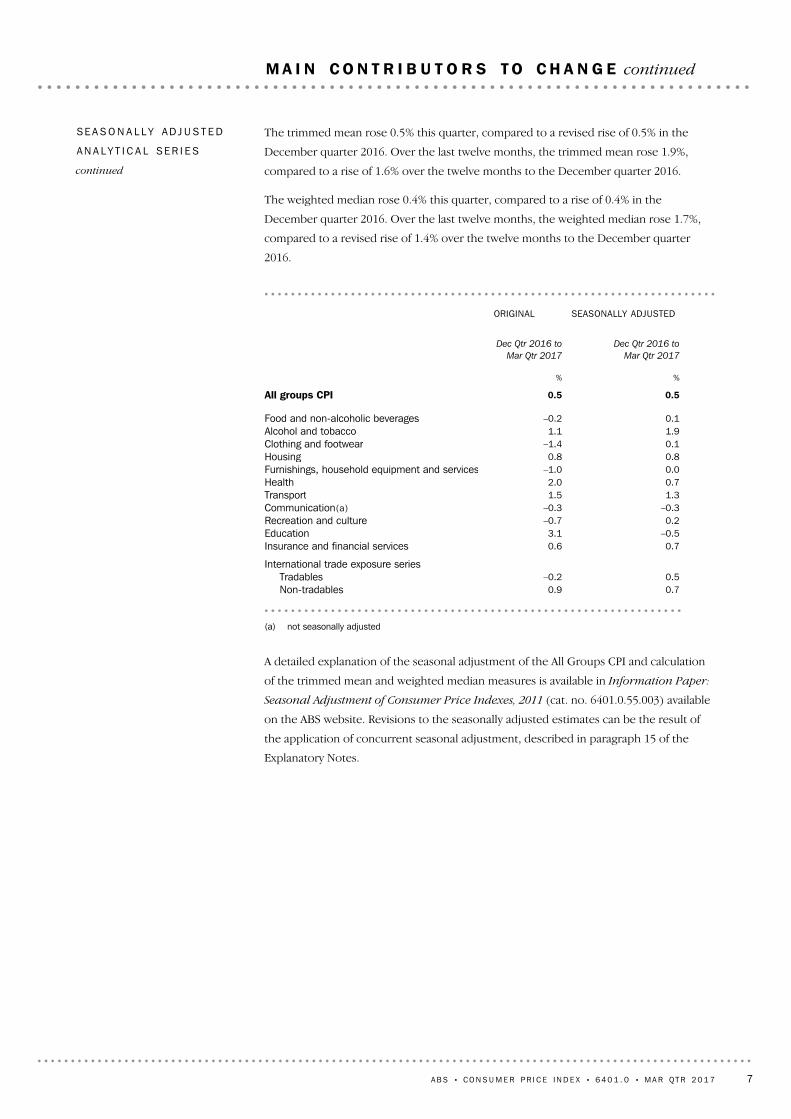
The All groups CPI seasonally adjusted rose 0.5% this quarter, compared to the original
All groups CPI which also recorded a rise of 0.5%.
SE A S O N A L L Y AD J U S T E D
AN A L Y T I C A L SE R I E S
The tradables component (see Table 8) of the All groups CPI fell 0.2% this quarter. Price
changes for the goods and services in this component are largely determined on the
world market. The tradables component represents approximately 35% of the weight of
the CPI. The tradable goods component recorded no movement this quarter. The most
significant negative contributor is fruit (-6.7%), while the most significant positive
contributor is automotive fuel (+5.7%). The fall in the tradable services component of
3.6% is driven by international holiday travel and accommodation (-3.8%).
The non-tradables component of the All groups CPI rose 0.9% this quarter. Price changes
for the goods and services in this component are largely determined by domestic price
pressures. The non-tradables component represents approximately 65% of the weight of
the CPI. The most significant contributors to the 1.1% rise in the non-tradable goods
component are new dwelling purchase by owner-occupiers (+1.0%) and electricity
(+2.5%). The rise in the non-tradable services component of 0.6% is driven by medical
and hospital services (+1.6%), secondary education (+4.1%) and tertiary education
(+2.4%).
Over the last twelve months, the tradables component rose 1.3%, while the
non-tradables component rose 2.6%. This compares to a rise of 0.1% and 2.1%
respectively over the twelve months to the December quarter 2016.
In seasonally adjusted terms, the tradables component of the All groups CPI rose 0.5%
this quarter, while the non-tradables component rose 0.7%.
A detailed description of which expenditure classes are classified as tradable and
non-tradable in the 16th series is shown in the Appendix of the December quarter 2016
issue of Consumer Price Index, Australia (cat. no 6401.0).
I N T E R N A T I O N A L TR A D E
EX P O S U R E - TR A D A B L E S
AN D NO N - T R A D A B L E S
The main contributor to the fall in the communication group this quarter is
telecommunication equipment and services (-0.5%).
Over the last twelve months, the communication group fell 4.8%. The main contributor
to the fall is telecommunication equipment and services (-5.2%).
The communication group is not seasonally adjusted.
CO M M U N I C A T I O N GR O U P
( - 0 . 3 % )
The main contributors to the fall in the food and non-alcoholic beverages group this
quarter are fruit (-6.7%), which saw increased supply of summer fruits, and other food
products n.e.c. (-4.3%).
Over the last twelve months, the food and non-alcoholic beverages group rose 1.8%. The
main contributors to the rise are vegetables (+13.1%) and fruit (+12.2%). Adverse
weather conditions in major growing areas over previous periods continue to impact
supply for particular vegetables and fruits.
In seasonally adjusted terms, the food and non-alcoholic beverages group rose 0.1% this
quarter. The main contributor to the rise is fruit (+1.7%).
FO O D AN D
NO N - A L C O H O L I C
BE V E R A G E S GR O U P
( - 0 . 2 % )
6 A B S • CO N S U M E R P R I C E I N D E X • 6 4 0 1 . 0 • MA R QT R 2 0 1 7
M A I N C O N T R I B U T O R S T O C H A N G E continued
A detailed explanation of the seasonal adjustment of the All Groups CPI and calculation
of the trimmed mean and weighted median measures is available in Information Paper:
Seasonal Adjustment of Consumer Price Indexes, 2011 (cat. no. 6401.0.55.003) available
on the ABS website. Revisions to the seasonally adjusted estimates can be the result of
the application of concurrent seasonal adjustment, described in paragraph 15 of the
Explanatory Notes.
(a) not seasonally adjusted
0.70.9Non-tradables0.5–0.2Tradables
International trade exposure series
0.70.6Insurance and financial services–0.53.1Education0.2–0.7Recreation and culture
–0.3–0.3Communication(a)1.31.5Transport0.72.0Health0.0–1.0Furnishings, household equipment and services0.80.8Housing0.1–1.4Clothing and footwear1.91.1Alcohol and tobacco0.1–0.2Food and non-alcoholic beverages
0.50.5All groups CPI
%%
Dec Qtr 2016 to
Mar Qtr 2017
Dec Qtr 2016 to
Mar Qtr 2017
SEASONALLY ADJUSTEDORIGINAL
The trimmed mean rose 0.5% this quarter, compared to a revised rise of 0.5% in the
December quarter 2016. Over the last twelve months, the trimmed mean rose 1.9%,
compared to a rise of 1.6% over the twelve months to the December quarter 2016.
The weighted median rose 0.4% this quarter, compared to a rise of 0.4% in the
December quarter 2016. Over the last twelve months, the weighted median rose 1.7%,
compared to a revised rise of 1.4% over the twelve months to the December quarter
2016.
SE A S O N A L L Y AD J U S T E D
AN A L Y T I C A L SE R I E S
continued
A B S • CO N S U M E R P R I C E I N D E X • 6 4 0 1 . 0 • MA R QT R 2 0 1 7 7
M A I N C O N T R I B U T O R S T O C H A N G E continued
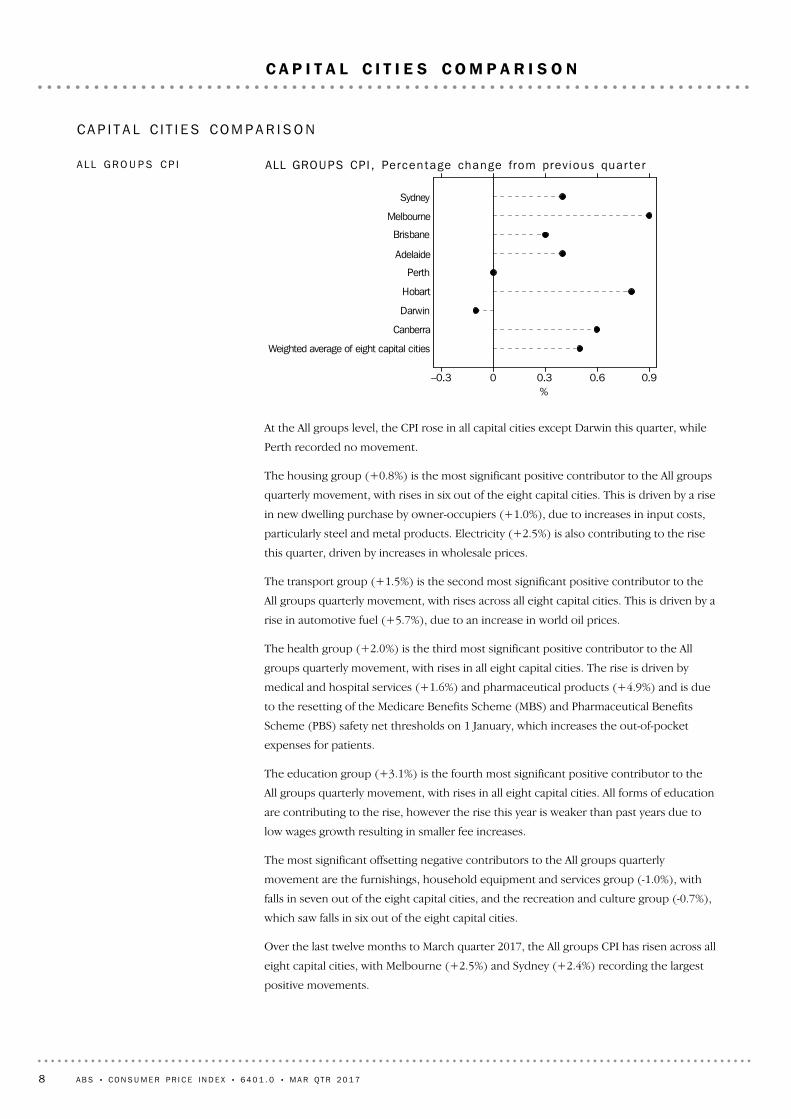
At the All groups level, the CPI rose in all capital cities except Darwin this quarter, while
Perth recorded no movement.
The housing group (+0.8%) is the most significant positive contributor to the All groups
quarterly movement, with rises in six out of the eight capital cities. This is driven by a rise
in new dwelling purchase by owner-occupiers (+1.0%), due to increases in input costs,
particularly steel and metal products. Electricity (+2.5%) is also contributing to the rise
this quarter, driven by increases in wholesale prices.
The transport group (+1.5%) is the second most significant positive contributor to the
All groups quarterly movement, with rises across all eight capital cities. This is driven by a
rise in automotive fuel (+5.7%), due to an increase in world oil prices.
The health group (+2.0%) is the third most significant positive contributor to the All
groups quarterly movement, with rises in all eight capital cities. The rise is driven by
medical and hospital services (+1.6%) and pharmaceutical products (+4.9%) and is due
to the resetting of the Medicare Benefits Scheme (MBS) and Pharmaceutical Benefits
Scheme (PBS) safety net thresholds on 1 January, which increases the out-of-pocket
expenses for patients.
The education group (+3.1%) is the fourth most significant positive contributor to the
All groups quarterly movement, with rises in all eight capital cities. All forms of education
are contributing to the rise, however the rise this year is weaker than past years due to
low wages growth resulting in smaller fee increases.
The most significant offsetting negative contributors to the All groups quarterly
movement are the furnishings, household equipment and services group (-1.0%), with
falls in seven out of the eight capital cities, and the recreation and culture group (-0.7%),
which saw falls in six out of the eight capital cities.
Over the last twelve months to March quarter 2017, the All groups CPI has risen across all
eight capital cities, with Melbourne (+2.5%) and Sydney (+2.4%) recording the largest
positive movements.
Sydney
Melbourne
Brisbane
Adelaide
Perth
Hobart
Darwin
Canberra
Weighted average of eight capital cities
–0.3 0 0.3 0.6 0.9%
ALL GROUPS CPI , Percen tage change from prev ious quar te rAL L GR O U P S CP I
CA P I T A L C I T I E S CO M P A R I S O N
8 A B S • CO N S U M E R P R I C E I N D E X • 6 4 0 1 . 0 • MA R QT R 2 0 1 7
C A P I T A L C I T I E S C O M P A R I S O N
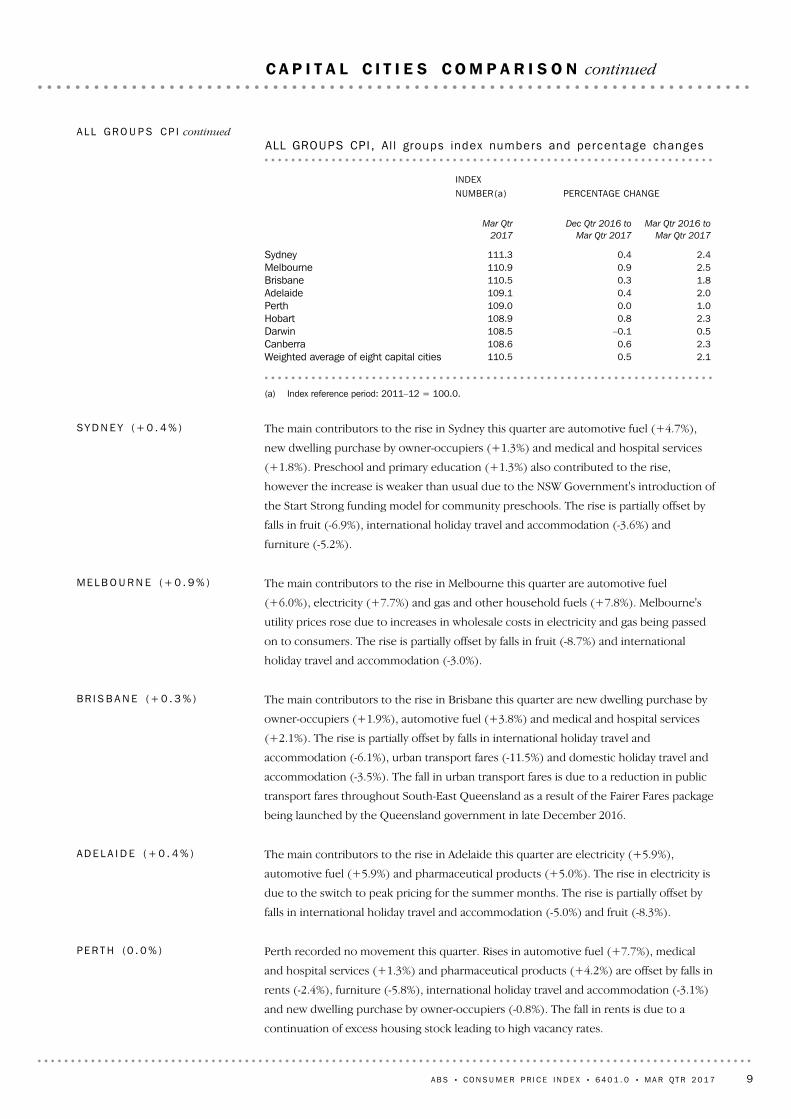
Perth recorded no movement this quarter. Rises in automotive fuel (+7.7%), medical
and hospital services (+1.3%) and pharmaceutical products (+4.2%) are offset by falls in
rents (-2.4%), furniture (-5.8%), international holiday travel and accommodation (-3.1%)
and new dwelling purchase by owner-occupiers (-0.8%). The fall in rents is due to a
continuation of excess housing stock leading to high vacancy rates.
PE R T H (0 . 0 % )
The main contributors to the rise in Adelaide this quarter are electricity (+5.9%),
automotive fuel (+5.9%) and pharmaceutical products (+5.0%). The rise in electricity is
due to the switch to peak pricing for the summer months. The rise is partially offset by
falls in international holiday travel and accommodation (-5.0%) and fruit (-8.3%).
AD E L A I D E (+ 0 . 4 % )
The main contributors to the rise in Brisbane this quarter are new dwelling purchase by
owner-occupiers (+1.9%), automotive fuel (+3.8%) and medical and hospital services
(+2.1%). The rise is partially offset by falls in international holiday travel and
accommodation (-6.1%), urban transport fares (-11.5%) and domestic holiday travel and
accommodation (-3.5%). The fall in urban transport fares is due to a reduction in public
transport fares throughout South-East Queensland as a result of the Fairer Fares package
being launched by the Queensland government in late December 2016.
BR I S B A N E (+ 0 . 3 % )
The main contributors to the rise in Melbourne this quarter are automotive fuel
(+6.0%), electricity (+7.7%) and gas and other household fuels (+7.8%). Melbourne's
utility prices rose due to increases in wholesale costs in electricity and gas being passed
on to consumers. The rise is partially offset by falls in fruit (-8.7%) and international
holiday travel and accommodation (-3.0%).
ME L B O U R N E (+ 0 . 9 % )
The main contributors to the rise in Sydney this quarter are automotive fuel (+4.7%),
new dwelling purchase by owner-occupiers (+1.3%) and medical and hospital services
(+1.8%). Preschool and primary education (+1.3%) also contributed to the rise,
however the increase is weaker than usual due to the NSW Government's introduction of
the Start Strong funding model for community preschools. The rise is partially offset by
falls in fruit (-6.9%), international holiday travel and accommodation (-3.6%) and
furniture (-5.2%).
SY D N E Y (+ 0 . 4 % )
(a) Index reference period: 2011–12 = 100.0.
2.10.5110.5Weighted average of eight capital cities2.30.6108.6Canberra0.5–0.1108.5Darwin2.30.8108.9Hobart1.00.0109.0Perth2.00.4109.1Adelaide1.80.3110.5Brisbane2.50.9110.9Melbourne2.40.4111.3Sydney
Mar Qtr 2016 to
Mar Qtr 2017
Dec Qtr 2016 to
Mar Qtr 2017
Mar Qtr
2017
PERCENTAGE CHANGEINDEXNUMBER(a)
ALL GROUPS CPI , Al l groups index numbers and percen tage changesAL L GR O U P S CP I continued
A B S • CO N S U M E R P R I C E I N D E X • 6 4 0 1 . 0 • MA R QT R 2 0 1 7 9
C A P I T A L C I T I E S C O M P A R I S O N continued
The main contributors to the rise in Canberra this quarter are automotive fuel (+8.5%),
medical and hospital services (+2.9%) and child care (+2.6%). The rise is partially offset
by falls in international holiday travel and accommodation (-3.8%), furniture (-4.2%) and
fruit (-5.6%).
CA N B E R R A (+ 0 . 6 % )
Darwin is the only capital city to record a fall this quarter at the All groups level. The
main contributors to the fall in Darwin this quarter are domestic holiday travel and
accommodation (-7.8%), international holiday travel and accommodation (-6.2%), rents
(-1.4%) and fruit (-10.2%). The fall in domestic holiday travel and accommodation is due
to lower airfare prices as the wet season impacts tourist numbers in Darwin. The fall is
partially offset by a rise in automotive fuel (+10.2%).
DA R W I N ( - 0 . 1 % )
The main contributors to the rise in Hobart this quarter are automotive fuel (+13.2%),
domestic holiday travel and accommodation (+5.9%) and rents (+1.4%). Hobart
recorded the strongest rise for automotive fuel of any capital city this quarter. The rise in
domestic holiday travel and accommodation is due to Tasmania's increasing popularity as
a holiday destination for both international and domestic travellers. The rise is partially
offset by falls in fruit (-11.4%) and international holiday travel and accommodation
(-3.7%).
HO B A R T (+ 0 . 8 % )
10 A B S • CO N S U M E R P R I C E I N D E X • 6 4 0 1 . 0 • MA R QT R 2 0 1 7
C A P I T A L C I T I E S C O M P A R I S O N continued
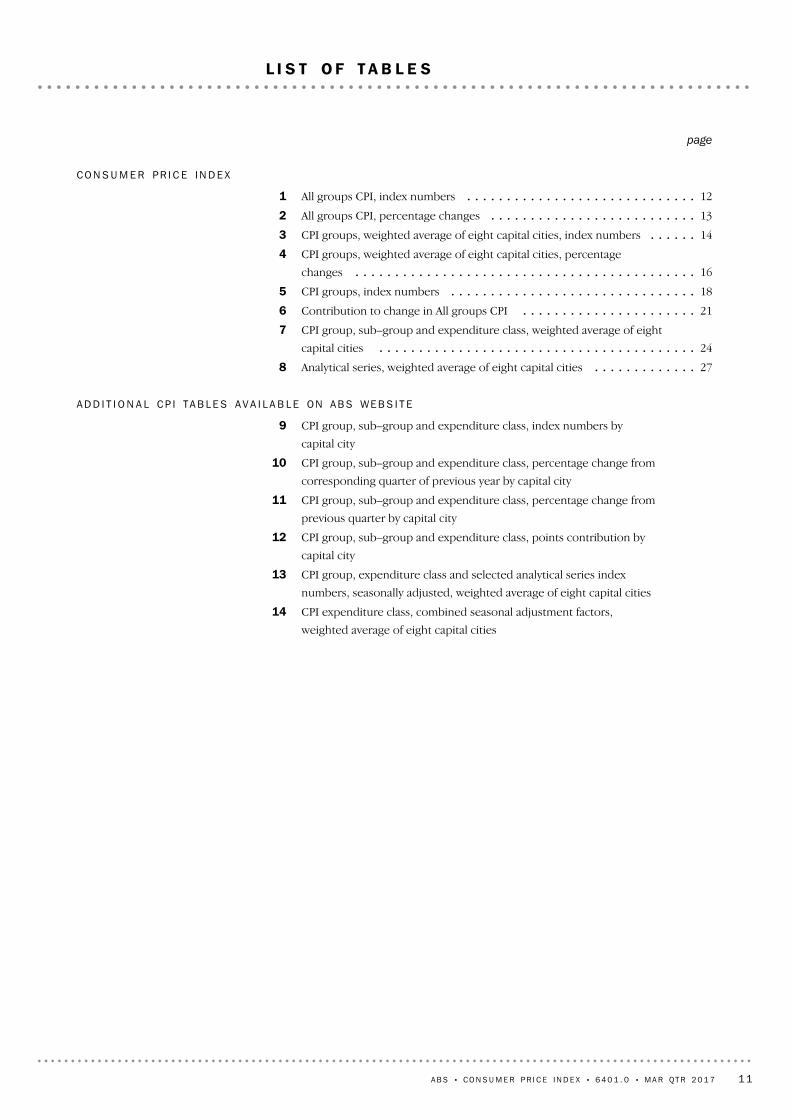
CPI expenditure class, combined seasonal adjustment factors,
weighted average of eight capital cities
14
CPI group, expenditure class and selected analytical series index
numbers, seasonally adjusted, weighted average of eight capital cities
13
CPI group, sub–group and expenditure class, points contribution by
capital city
12
CPI group, sub–group and expenditure class, percentage change from
previous quarter by capital city
11
CPI group, sub–group and expenditure class, percentage change from
corresponding quarter of previous year by capital city
10
CPI group, sub–group and expenditure class, index numbers by
capital city
9
AD D I T I O N A L CP I TA B L E S AV A I L A B L E ON AB S WE B S I T E
27Analytical series, weighted average of eight capital cities8 . . . . . . . . . . . . .24
CPI group, sub–group and expenditure class, weighted average of eight
capital cities
7. . . . . . . . . . . . . . . . . . . . . . . . . . . . . . . . . . . . . . . .
21Contribution to change in All groups CPI6 . . . . . . . . . . . . . . . . . . . . . .18CPI groups, index numbers5 . . . . . . . . . . . . . . . . . . . . . . . . . . . . . . .16
CPI groups, weighted average of eight capital cities, percentage
changes
4. . . . . . . . . . . . . . . . . . . . . . . . . . . . . . . . . . . . . . . . . . .
14CPI groups, weighted average of eight capital cities, index numbers3 . . . . . .13All groups CPI, percentage changes2 . . . . . . . . . . . . . . . . . . . . . . . . . .12All groups CPI, index numbers1 . . . . . . . . . . . . . . . . . . . . . . . . . . . . .
CO N S U M E R PR I C E IN D E X
page
A B S • CO N S U M E R P R I C E I N D E X • 6 4 0 1 . 0 • MA R QT R 2 0 1 7 11
L I S T O F T A B L E S

(a) Unless otherwise specified, reference period of each index: 2011–12 = 100.0.
110.5108.6108.5108.9109.0109.1110.5110.9111.3March2017
110.0107.9108.6108.0109.0108.7110.2109.9110.9December109.4107.3108.7107.1108.6108.4109.7109.1110.4September108.6106.4108.3106.4108.2107.5109.0108.6109.3June108.2106.2108.0106.4107.9107.0108.5108.2108.7March
2016108.4106.0109.0106.6108.6107.3108.5108.3108.9December108.0105.8108.7105.7108.1107.1108.1107.6108.6September107.5105.6108.3105.1107.7106.8107.4107.1108.3June106.8105.2108.3105.0107.1106.3106.7106.4107.3March
2015106.6105.3108.5104.7107.0106.2106.7106.3106.8December106.4105.2108.3104.6106.9105.9106.5106.1106.6September105.9104.8108.1104.5106.4105.5105.8105.9106.0June105.4104.6107.4104.1105.6105.1105.2105.3105.6March
2014104.8104.1106.5103.6104.9104.4104.6104.8105.0December104.0103.1105.5102.6104.2103.7103.8104.0104.3September102.8102.5104.6101.7103.0102.3102.5102.6103.1June102.4101.9103.7101.3102.4102.1102.0102.4102.7March
2013
108.3106.1108.5106.3108.2107.2108.5108.2108.92015–16106.8105.3108.4104.9107.2106.3106.8106.5107.32014–15105.0104.2106.9103.7105.3104.7104.9105.0105.22013–14102.3101.9103.1101.2102.2102.1102.0102.2102.62012–13
Weighted
average
of eight
capital
citiesCanberraDarwinHobartPerthAdelaideBrisbaneMelbourneSydneyPe r i od
ALL GROUPS CPI , Index numbers (a )1
12 A B S • CO N S U M E R P R I C E I N D E X • 6 4 0 1 . 0 • MA R QT R 2 0 1 7
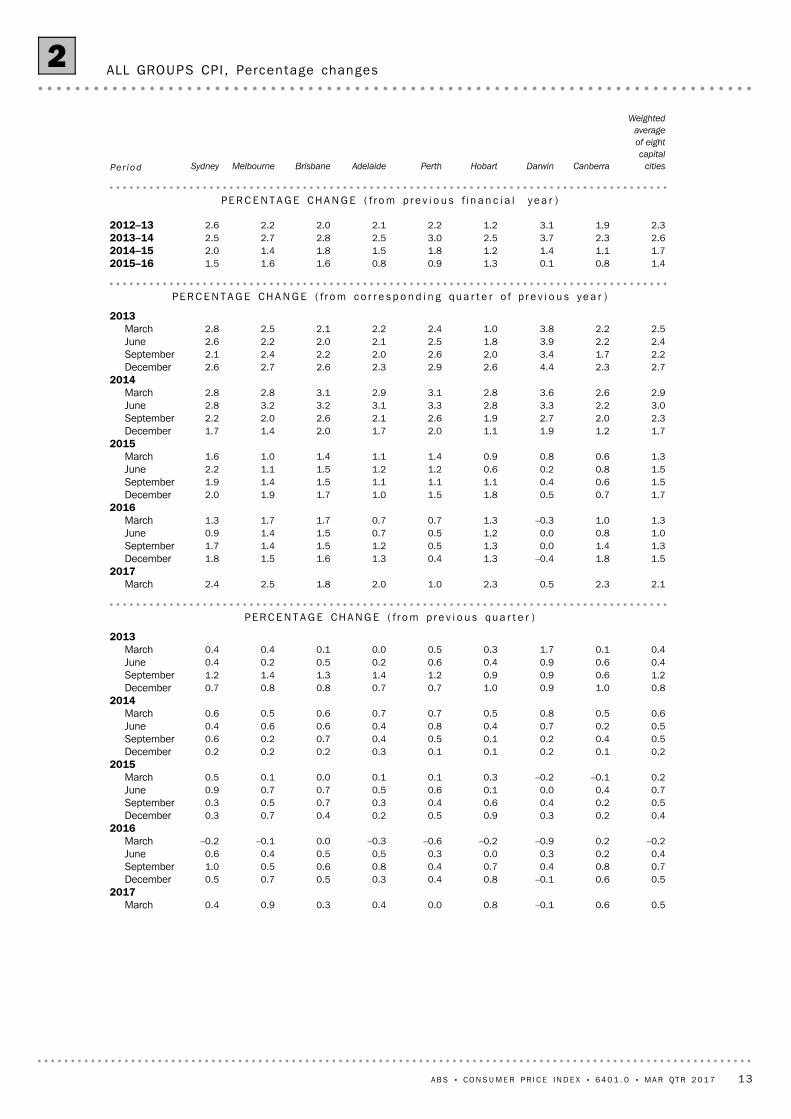
0.50.6–0.10.80.00.40.30.90.4March2017
0.50.6–0.10.80.40.30.50.70.5December0.70.80.40.70.40.80.60.51.0September0.40.20.30.00.30.50.50.40.6June
–0.20.2–0.9–0.2–0.6–0.30.0–0.1–0.2March2016
0.40.20.30.90.50.20.40.70.3December0.50.20.40.60.40.30.70.50.3September0.70.40.00.10.60.50.70.70.9June0.2–0.1–0.20.30.10.10.00.10.5March
20150.20.10.20.10.10.30.20.20.2December0.50.40.20.10.50.40.70.20.6September0.50.20.70.40.80.40.60.60.4June0.60.50.80.50.70.70.60.50.6March
20140.81.00.91.00.70.70.80.80.7December1.20.60.90.91.21.41.31.41.2September0.40.60.90.40.60.20.50.20.4June0.40.11.70.30.50.00.10.40.4March
2013
PE R C E N T A G E CH A N G E ( f r o m p r e v i o u s qu a r t e r )
2.12.30.52.31.02.01.82.52.4March2017
1.51.8–0.41.30.41.31.61.51.8December1.31.40.01.30.51.21.51.41.7September1.00.80.01.20.50.71.51.40.9June1.31.0–0.31.30.70.71.71.71.3March
20161.70.70.51.81.51.01.71.92.0December1.50.60.41.11.11.11.51.41.9September1.50.80.20.61.21.21.51.12.2June1.30.60.80.91.41.11.41.01.6March
20151.71.21.91.12.01.72.01.41.7December2.32.02.71.92.62.12.62.02.2September3.02.23.32.83.33.13.23.22.8June2.92.63.62.83.12.93.12.82.8March
20142.72.34.42.62.92.32.62.72.6December2.21.73.42.02.62.02.22.42.1September2.42.23.91.82.52.12.02.22.6June2.52.23.81.02.42.22.12.52.8March
2013
PE R C E N T A G E CH A N G E ( f r o m co r r e s p o n d i n g qu a r t e r o f p r e v i o u s y e a r )
1.40.80.11.30.90.81.61.61.52015–161.71.11.41.21.81.51.81.42.02014–152.62.33.72.53.02.52.82.72.52013–142.31.93.11.22.22.12.02.22.62012–13
PE R C E N T A G E CH A N G E ( f r o m p r e v i o u s f i n a n c i a l y e a r )
Weighted
average
of eight
capital
citiesCanberraDarwinHobartPerthAdelaideBrisbaneMelbourneSydneyPe r i od
ALL GROUPS CPI , Percentage changes2
A B S • CO N S U M E R P R I C E I N D E X • 6 4 0 1 . 0 • MA R QT R 2 0 1 7 13
(a) Unless otherwise specified, reference period of each index: 2011–12 = 100.0.
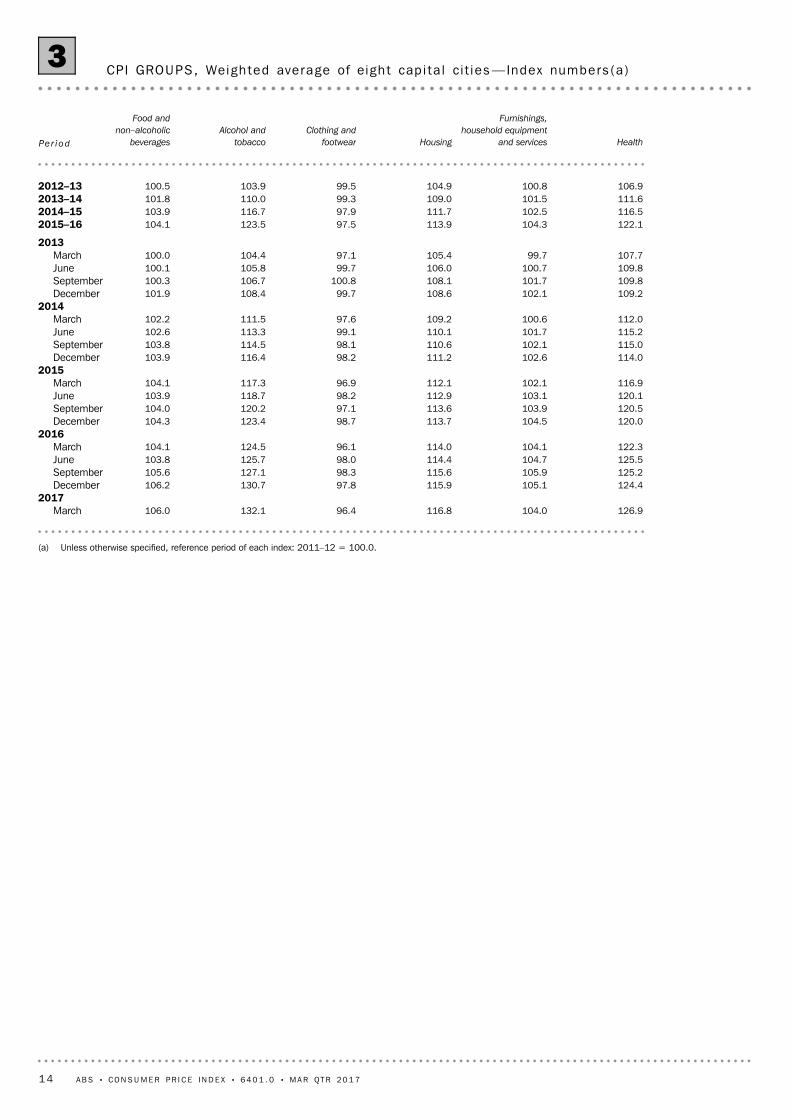
126.9104.0116.896.4132.1106.0March2017
124.4105.1115.997.8130.7106.2December125.2105.9115.698.3127.1105.6September125.5104.7114.498.0125.7103.8June122.3104.1114.096.1124.5104.1March
2016120.0104.5113.798.7123.4104.3December120.5103.9113.697.1120.2104.0September120.1103.1112.998.2118.7103.9June116.9102.1112.196.9117.3104.1March
2015114.0102.6111.298.2116.4103.9December115.0102.1110.698.1114.5103.8September115.2101.7110.199.1113.3102.6June112.0100.6109.297.6111.5102.2March
2014109.2102.1108.699.7108.4101.9December109.8101.7108.1100.8106.7100.3September109.8100.7106.099.7105.8100.1June107.799.7105.497.1104.4100.0March
2013
122.1104.3113.997.5123.5104.12015–16116.5102.5111.797.9116.7103.92014–15111.6101.5109.099.3110.0101.82013–14106.9100.8104.999.5103.9100.52012–13
Health
Furnishings,
household equipment
and servicesHousing
Clothing and
footwear
Alcohol and
tobacco
Food and
non–alcoholic
beveragesPe r i od
CPI GROUPS, Weighted average of eigh t cap i ta l ci t ies —Index numbers (a )3
14 A B S • CO N S U M E R P R I C E I N D E X • 6 4 0 1 . 0 • MA R QT R 2 0 1 7
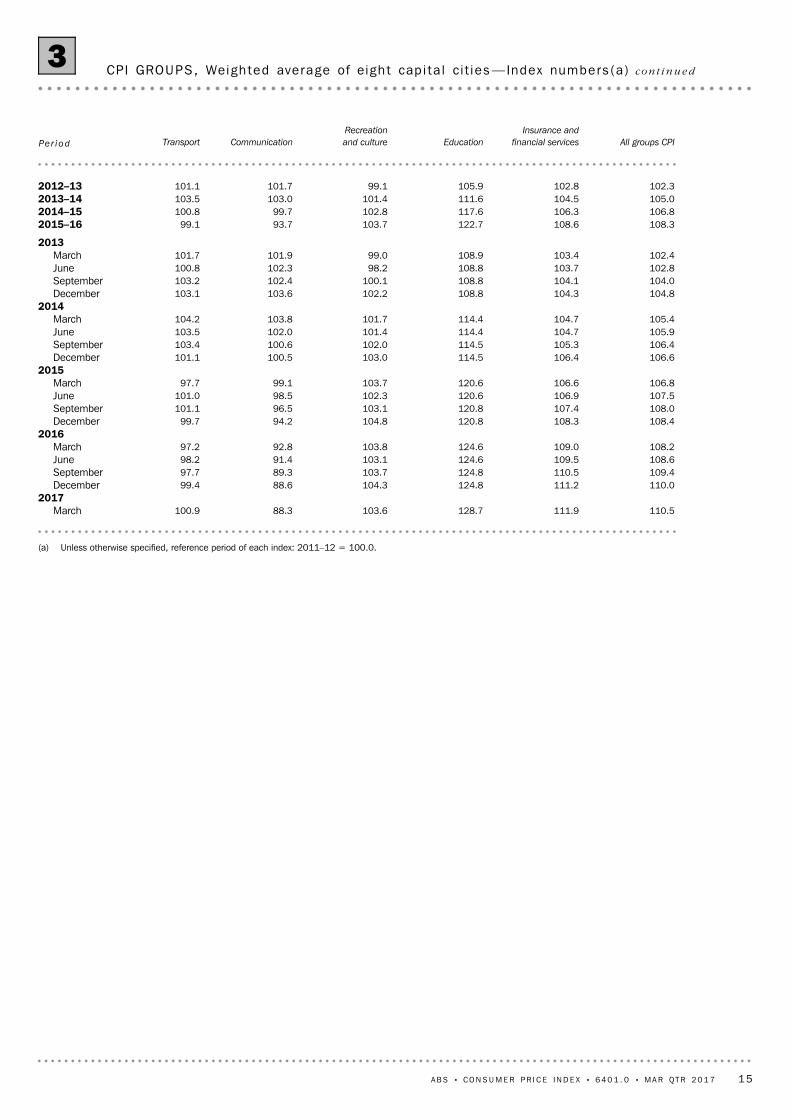
(a) Unless otherwise specified, reference period of each index: 2011–12 = 100.0.
110.5111.9128.7103.688.3100.9March2017
110.0111.2124.8104.388.699.4December109.4110.5124.8103.789.397.7September108.6109.5124.6103.191.498.2June108.2109.0124.6103.892.897.2March
2016108.4108.3120.8104.894.299.7December108.0107.4120.8103.196.5101.1September107.5106.9120.6102.398.5101.0June106.8106.6120.6103.799.197.7March
2015106.6106.4114.5103.0100.5101.1December106.4105.3114.5102.0100.6103.4September105.9104.7114.4101.4102.0103.5June105.4104.7114.4101.7103.8104.2March
2014104.8104.3108.8102.2103.6103.1December104.0104.1108.8100.1102.4103.2September102.8103.7108.898.2102.3100.8June102.4103.4108.999.0101.9101.7March
2013
108.3108.6122.7103.793.799.12015–16106.8106.3117.6102.899.7100.82014–15105.0104.5111.6101.4103.0103.52013–14102.3102.8105.999.1101.7101.12012–13
All groups CPI
Insurance and
financial servicesEducation
Recreation
and cultureCommunicationTransportPe r i o d
CPI GROUPS, Weighted average of eigh t cap i ta l ci t ies —Index numbers (a ) co n t i n u e d3
A B S • CO N S U M E R P R I C E I N D E X • 6 4 0 1 . 0 • MA R QT R 2 0 1 7 15
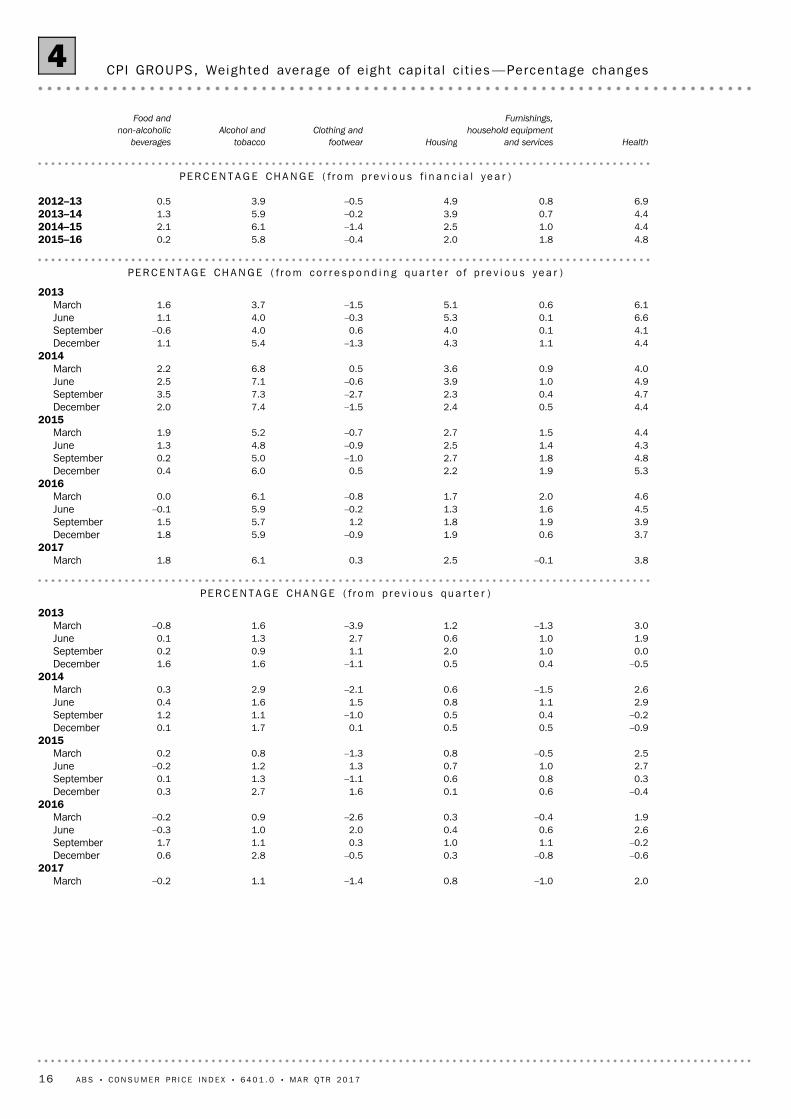
2.0–1.00.8–1.41.1–0.2March2017
–0.6–0.80.3–0.52.80.6December–0.21.11.00.31.11.7September2.60.60.42.01.0–0.3June1.9–0.40.3–2.60.9–0.2March
2016–0.40.60.11.62.70.3December0.30.80.6–1.11.30.1September2.71.00.71.31.2–0.2June2.5–0.50.8–1.30.80.2March
2015–0.90.50.50.11.70.1December–0.20.40.5–1.01.11.2September2.91.10.81.51.60.4June2.6–1.50.6–2.12.90.3March
2014–0.50.40.5–1.11.61.6December0.01.02.01.10.90.2September1.91.00.62.71.30.1June3.0–1.31.2–3.91.6–0.8March
2013
PE R C E N T A G E CH A N G E ( f r o m p r e v i o u s qu a r t e r )
3.8–0.12.50.36.11.8March2017
3.70.61.9–0.95.91.8December3.91.91.81.25.71.5September4.51.61.3–0.25.9–0.1June4.62.01.7–0.86.10.0March
20165.31.92.20.56.00.4December4.81.82.7–1.05.00.2September4.31.42.5–0.94.81.3June4.41.52.7–0.75.21.9March
20154.40.52.4–1.57.42.0December4.70.42.3–2.77.33.5September4.91.03.9–0.67.12.5June4.00.93.60.56.82.2March
20144.41.14.3–1.35.41.1December4.10.14.00.64.0–0.6September6.60.15.3–0.34.01.1June6.10.65.1–1.53.71.6March
2013
PE R C E N T A G E CH A N G E ( f r o m co r r e s p o n d i n g qu a r t e r o f p r e v i o u s y e a r )
4.81.82.0–0.45.80.22015–164.41.02.5–1.46.12.12014–154.40.73.9–0.25.91.32013–146.90.84.9–0.53.90.52012–13
PE R C E N T A G E CH A N G E ( f r o m p r e v i o u s f i n a n c i a l y e a r )
Health
Furnishings,
household equipment
and servicesHousing
Clothing and
footwear
Alcohol and
tobacco
Food and
non-alcoholic
beverages
CPI GROUPS, Weighted average of eigh t cap i ta l ci t ies —Percentage changes4
16 A B S • CO N S U M E R P R I C E I N D E X • 6 4 0 1 . 0 • MA R QT R 2 0 1 7
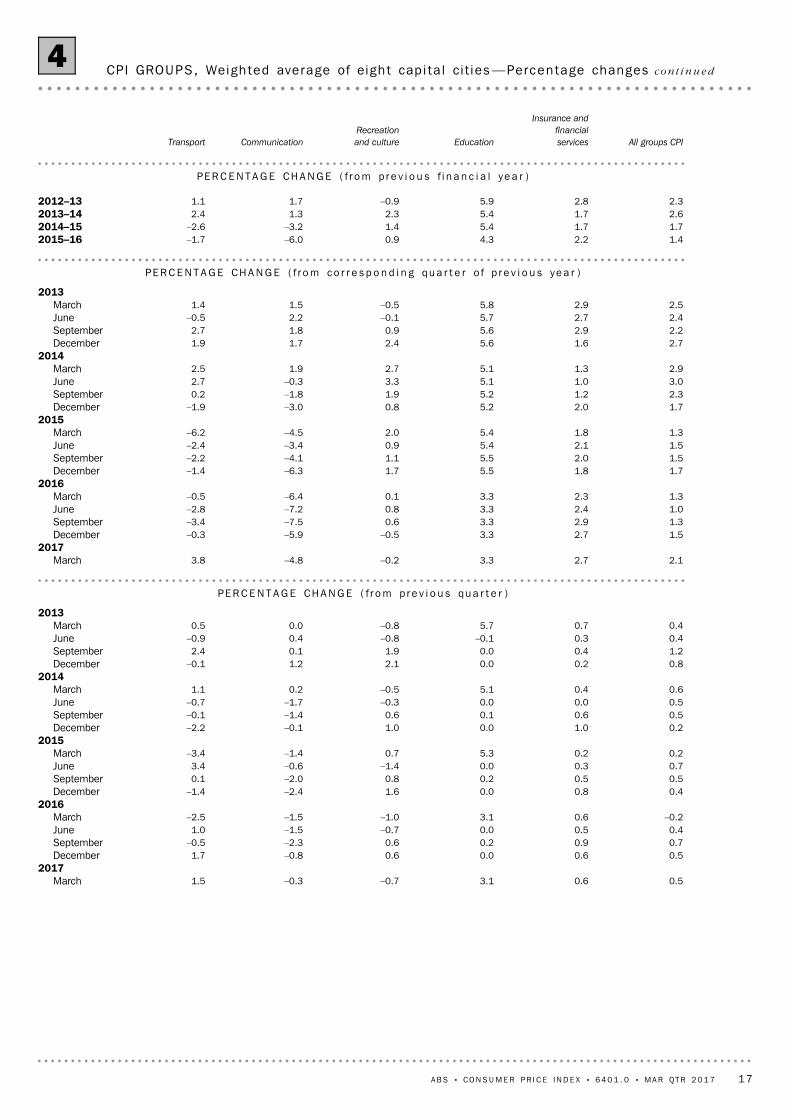
0.50.63.1–0.7–0.31.5March2017
0.50.60.00.6–0.81.7December0.70.90.20.6–2.3–0.5September0.40.50.0–0.7–1.51.0June
–0.20.63.1–1.0–1.5–2.5March2016
0.40.80.01.6–2.4–1.4December0.50.50.20.8–2.00.1September0.70.30.0–1.4–0.63.4June0.20.25.30.7–1.4–3.4March
20150.21.00.01.0–0.1–2.2December0.50.60.10.6–1.4–0.1September0.50.00.0–0.3–1.7–0.7June0.60.45.1–0.50.21.1March
20140.80.20.02.11.2–0.1December1.20.40.01.90.12.4September0.40.3–0.1–0.80.4–0.9June0.40.75.7–0.80.00.5March
2013
PE R C E N T A G E CH A N G E ( f r o m p r e v i o u s qu a r t e r )
2.12.73.3–0.2–4.83.8March2017
1.52.73.3–0.5–5.9–0.3December1.32.93.30.6–7.5–3.4September1.02.43.30.8–7.2–2.8June1.32.33.30.1–6.4–0.5March
20161.71.85.51.7–6.3–1.4December1.52.05.51.1–4.1–2.2September1.52.15.40.9–3.4–2.4June1.31.85.42.0–4.5–6.2March
20151.72.05.20.8–3.0–1.9December2.31.25.21.9–1.80.2September3.01.05.13.3–0.32.7June2.91.35.12.71.92.5March
20142.71.65.62.41.71.9December2.22.95.60.91.82.7September2.42.75.7–0.12.2–0.5June2.52.95.8–0.51.51.4March
2013
PE R C E N T A G E CH A N G E ( f r o m co r r e s p o n d i n g qu a r t e r o f p r e v i o u s y e a r )
1.42.24.30.9–6.0–1.72015–161.71.75.41.4–3.2–2.62014–152.61.75.42.31.32.42013–142.32.85.9–0.91.71.12012–13
PE R C E N T A G E CH A N G E ( f r o m p r e v i o u s f i n a n c i a l y e a r )
All groups CPI
Insurance and
financial
servicesEducation
Recreation
and cultureCommunicationTransport
CPI GROUPS, Weighted average of eigh t cap i ta l ci t ies —Percentage changes co n t i n u e d4
A B S • CO N S U M E R P R I C E I N D E X • 6 4 0 1 . 0 • MA R QT R 2 0 1 7 17
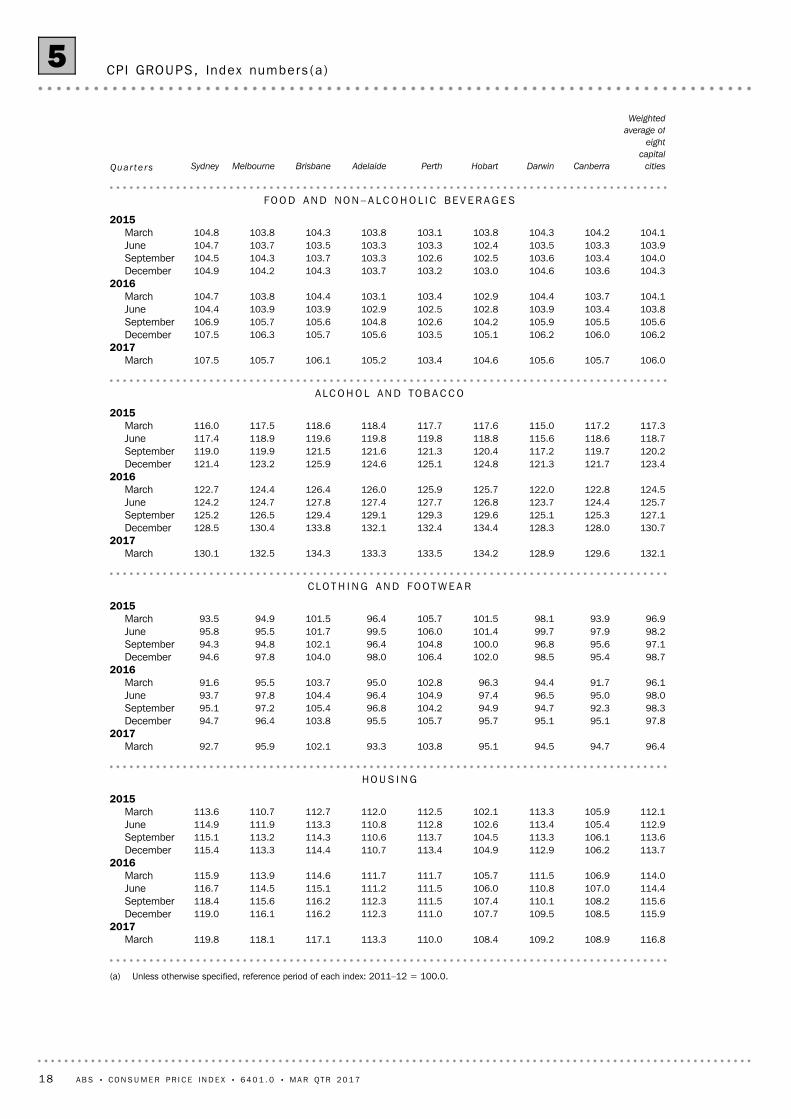
(a) Unless otherwise specified, reference period of each index: 2011–12 = 100.0.
116.8108.9109.2108.4110.0113.3117.1118.1119.8March2017
115.9108.5109.5107.7111.0112.3116.2116.1119.0December115.6108.2110.1107.4111.5112.3116.2115.6118.4September114.4107.0110.8106.0111.5111.2115.1114.5116.7June114.0106.9111.5105.7111.7111.7114.6113.9115.9March
2016113.7106.2112.9104.9113.4110.7114.4113.3115.4December113.6106.1113.3104.5113.7110.6114.3113.2115.1September112.9105.4113.4102.6112.8110.8113.3111.9114.9June112.1105.9113.3102.1112.5112.0112.7110.7113.6March
2015
HO U S I N G
96.494.794.595.1103.893.3102.195.992.7March2017
97.895.195.195.7105.795.5103.896.494.7December98.392.394.794.9104.296.8105.497.295.1September98.095.096.597.4104.996.4104.497.893.7June96.191.794.496.3102.895.0103.795.591.6March
201698.795.498.5102.0106.498.0104.097.894.6December97.195.696.8100.0104.896.4102.194.894.3September98.297.999.7101.4106.099.5101.795.595.8June96.993.998.1101.5105.796.4101.594.993.5March
2015
CL O T H I N G AN D FO O T W E A R
132.1129.6128.9134.2133.5133.3134.3132.5130.1March2017
130.7128.0128.3134.4132.4132.1133.8130.4128.5December127.1125.3125.1129.6129.3129.1129.4126.5125.2September125.7124.4123.7126.8127.7127.4127.8124.7124.2June124.5122.8122.0125.7125.9126.0126.4124.4122.7March
2016123.4121.7121.3124.8125.1124.6125.9123.2121.4December120.2119.7117.2120.4121.3121.6121.5119.9119.0September118.7118.6115.6118.8119.8119.8119.6118.9117.4June117.3117.2115.0117.6117.7118.4118.6117.5116.0March
2015
AL C O H O L AN D TO B A C C O
106.0105.7105.6104.6103.4105.2106.1105.7107.5March2017
106.2106.0106.2105.1103.5105.6105.7106.3107.5December105.6105.5105.9104.2102.6104.8105.6105.7106.9September103.8103.4103.9102.8102.5102.9103.9103.9104.4June104.1103.7104.4102.9103.4103.1104.4103.8104.7March
2016104.3103.6104.6103.0103.2103.7104.3104.2104.9December104.0103.4103.6102.5102.6103.3103.7104.3104.5September103.9103.3103.5102.4103.3103.3103.5103.7104.7June104.1104.2104.3103.8103.1103.8104.3103.8104.8March
2015
FO O D AN D NO N – A L C O H O L I C BE V E R A G E S
Weighted
average of
eight
capital
citiesCanberraDarwinHobartPerthAdelaideBrisbaneMelbourneSydneyQua r t e r s
CPI GROUPS, Index numbers (a )5
18 A B S • CO N S U M E R P R I C E I N D E X • 6 4 0 1 . 0 • MA R QT R 2 0 1 7
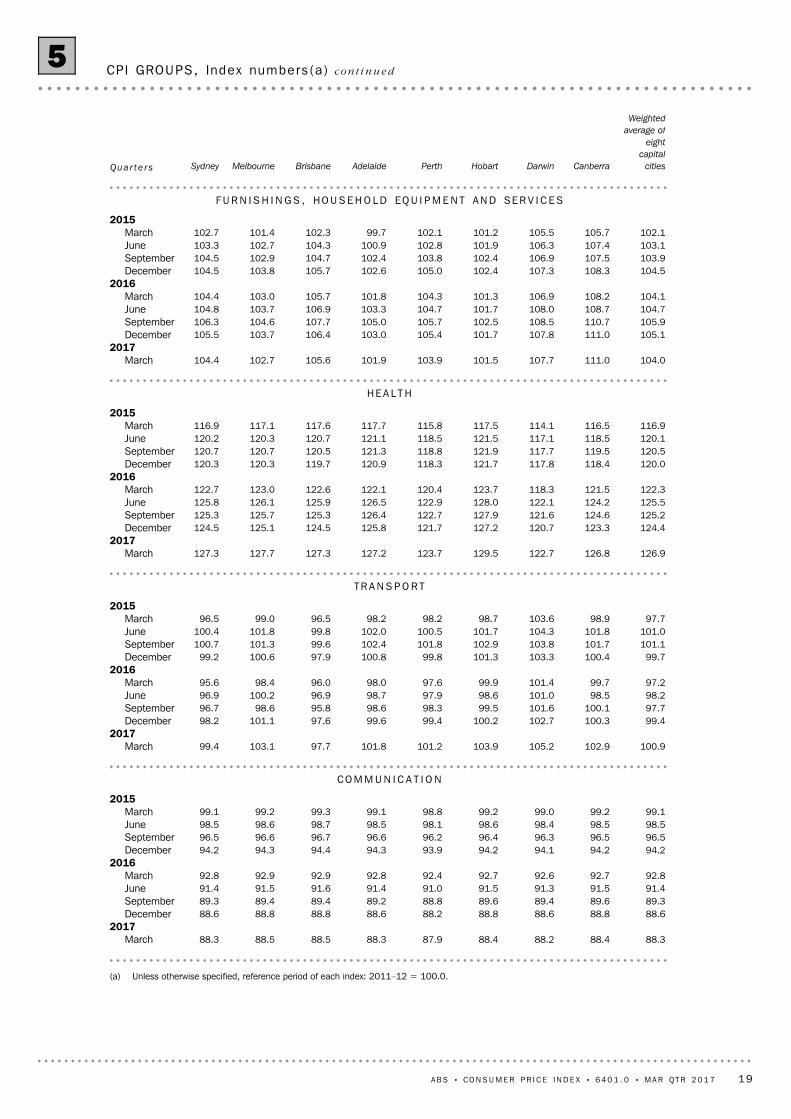
(a) Unless otherwise specified, reference period of each index: 2011–12 = 100.0.
88.388.488.288.487.988.388.588.588.3March2017
88.688.888.688.888.288.688.888.888.6December89.389.689.489.688.889.289.489.489.3September91.491.591.391.591.091.491.691.591.4June92.892.792.692.792.492.892.992.992.8March
201694.294.294.194.293.994.394.494.394.2December96.596.596.396.496.296.696.796.696.5September98.598.598.498.698.198.598.798.698.5June99.199.299.099.298.899.199.399.299.1March
2015
CO M M U N I C A T I O N
100.9102.9105.2103.9101.2101.897.7103.199.4March2017
99.4100.3102.7100.299.499.697.6101.198.2December97.7100.1101.699.598.398.695.898.696.7September98.298.5101.098.697.998.796.9100.296.9June97.299.7101.499.997.698.096.098.495.6March
201699.7100.4103.3101.399.8100.897.9100.699.2December
101.1101.7103.8102.9101.8102.499.6101.3100.7September101.0101.8104.3101.7100.5102.099.8101.8100.4June
97.798.9103.698.798.298.296.599.096.5March2015
TR A N S P O R T
126.9126.8122.7129.5123.7127.2127.3127.7127.3March2017
124.4123.3120.7127.2121.7125.8124.5125.1124.5December125.2124.6121.6127.9122.7126.4125.3125.7125.3September125.5124.2122.1128.0122.9126.5125.9126.1125.8June122.3121.5118.3123.7120.4122.1122.6123.0122.7March
2016120.0118.4117.8121.7118.3120.9119.7120.3120.3December120.5119.5117.7121.9118.8121.3120.5120.7120.7September120.1118.5117.1121.5118.5121.1120.7120.3120.2June116.9116.5114.1117.5115.8117.7117.6117.1116.9March
2015
HE A L T H
104.0111.0107.7101.5103.9101.9105.6102.7104.4March2017
105.1111.0107.8101.7105.4103.0106.4103.7105.5December105.9110.7108.5102.5105.7105.0107.7104.6106.3September104.7108.7108.0101.7104.7103.3106.9103.7104.8June104.1108.2106.9101.3104.3101.8105.7103.0104.4March
2016104.5108.3107.3102.4105.0102.6105.7103.8104.5December103.9107.5106.9102.4103.8102.4104.7102.9104.5September103.1107.4106.3101.9102.8100.9104.3102.7103.3June102.1105.7105.5101.2102.199.7102.3101.4102.7March
2015
FU R N I S H I N G S , HO U S E H O L D EQ U I P M E N T AN D SE R V I C E S
Weighted
average of
eight
capital
citiesCanberraDarwinHobartPerthAdelaideBrisbaneMelbourneSydneyQua r t e r s
CPI GROUPS, Index numbers (a ) co n t i n u e d5
A B S • CO N S U M E R P R I C E I N D E X • 6 4 0 1 . 0 • MA R QT R 2 0 1 7 19

(a) Unless otherwise specified, reference period of each index: 2011–12 = 100.0.
111.9100.9109.0112.9115.1110.3107.2111.5114.9March2017
111.2100.3108.1112.7114.0109.5106.4110.3114.6December110.599.8109.1112.5113.9109.1104.0110.1113.9September109.5100.4111.0113.0110.5107.0103.7109.5113.1June109.0100.1110.8112.5110.1106.6103.4109.3112.3March
2016108.399.5109.8111.1109.2106.2102.4108.7111.6December107.499.2109.4110.5107.5105.3103.1107.1110.9September106.9101.3108.5109.9107.9104.4101.0106.7110.6June106.6100.6108.3109.9107.7104.8101.0105.9110.2March
2015
I N S U R A N C E AN D F I N A N C I A L SE R V I C E S
128.7123.1126.2124.9129.0126.9128.1127.6131.3March2017
124.8119.6122.9121.1125.7123.4124.0123.5127.7December124.8119.6122.9121.1125.7123.3124.0123.5127.7September124.6119.3122.9121.1125.3123.3124.0123.1127.5June124.6119.3122.9121.1125.3123.3123.9123.1127.5March
2016120.8115.6118.9118.0121.8120.0120.1118.7123.9December120.8115.6118.9118.0121.8120.0120.1118.7123.9September120.6115.5118.8118.0121.5119.8120.0118.6123.8June120.6115.4118.8118.0121.5119.8120.0118.6123.7March
2015
ED U C A T I O N
103.6105.5100.1104.2103.6101.9102.9104.5103.4March2017
104.3105.8103.6102.8104.4102.7104.5104.4104.4December103.7104.7105.9100.7104.0102.5103.9103.4104.1September103.1104.0103.8100.4104.0101.7102.9103.3103.2June103.8104.5102.0102.9103.4101.5103.1104.8104.0March
2016104.8105.3105.4103.4104.6103.0104.4105.5104.8December103.1103.3106.0100.0103.0101.9103.4103.1103.3September102.3102.7102.5100.1102.7100.8101.8102.3102.6June103.7104.2105.0103.7103.5101.8102.4104.6103.9March
2015
RE C R E A T I O N AN D CU L T U R E
Weighted
average of
eight
capital
citiesCanberraDarwinHobartPerthAdelaideBrisbaneMelbourneSydneyQua r t e r s
CPI GROUPS, Index numbers (a ) co n t i n u e d5
20 A B S • CO N S U M E R P R I C E I N D E X • 6 4 0 1 . 0 • MA R QT R 2 0 1 7
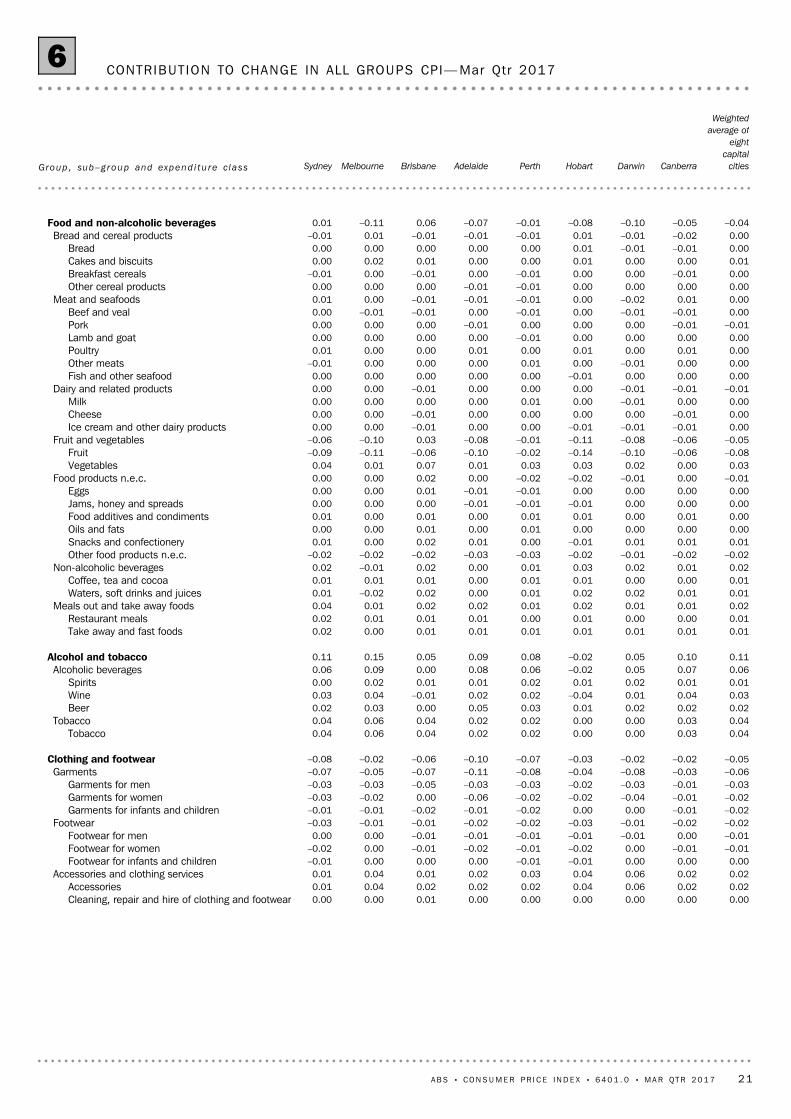
0.000.000.000.000.000.000.010.000.00Cleaning, repair and hire of clothing and footwear0.020.020.060.040.020.020.020.040.01Accessories0.020.020.060.040.030.020.010.040.01Accessories and clothing services0.000.000.00–0.01–0.010.000.000.00–0.01Footwear for infants and children
–0.01–0.010.00–0.02–0.01–0.02–0.010.00–0.02Footwear for women–0.010.00–0.01–0.01–0.01–0.01–0.010.000.00Footwear for men–0.02–0.02–0.01–0.03–0.02–0.02–0.01–0.01–0.03Footwear–0.02–0.010.000.00–0.02–0.01–0.02–0.01–0.01Garments for infants and children–0.02–0.01–0.04–0.02–0.02–0.060.00–0.02–0.03Garments for women–0.03–0.01–0.03–0.02–0.03–0.03–0.05–0.03–0.03Garments for men–0.06–0.03–0.08–0.04–0.08–0.11–0.07–0.05–0.07Garments–0.05–0.02–0.02–0.03–0.07–0.10–0.06–0.02–0.08Clothing and footwear
0.040.030.000.000.020.020.040.060.04Tobacco0.040.030.000.000.020.020.040.060.04Tobacco0.020.020.020.010.030.050.000.030.02Beer0.030.040.01–0.040.020.02–0.010.040.03Wine0.010.010.020.010.020.010.010.020.00Spirits0.060.070.05–0.020.060.080.000.090.06Alcoholic beverages0.110.100.05–0.020.080.090.050.150.11Alcohol and tobacco
0.010.010.010.010.010.010.010.000.02Take away and fast foods0.010.000.000.010.000.010.010.010.02Restaurant meals0.020.010.010.020.010.020.020.010.04Meals out and take away foods0.010.010.020.020.010.000.02–0.020.01Waters, soft drinks and juices0.010.000.000.010.010.000.010.010.01Coffee, tea and cocoa0.020.010.020.030.010.000.02–0.010.02Non-alcoholic beverages
–0.02–0.02–0.01–0.02–0.03–0.03–0.02–0.02–0.02Other food products n.e.c.0.010.010.01–0.010.000.010.020.000.01Snacks and confectionery0.000.000.000.000.010.000.010.000.00Oils and fats0.000.010.000.010.010.000.010.000.01Food additives and condiments0.000.000.00–0.01–0.01–0.010.000.000.00Jams, honey and spreads0.000.000.000.00–0.01–0.010.010.000.00Eggs
–0.010.00–0.01–0.02–0.020.000.020.000.00Food products n.e.c.0.030.000.020.030.030.010.070.010.04Vegetables
–0.08–0.06–0.10–0.14–0.02–0.10–0.06–0.11–0.09Fruit–0.05–0.06–0.08–0.11–0.01–0.080.03–0.10–0.06Fruit and vegetables0.00–0.01–0.01–0.010.000.00–0.010.000.00Ice cream and other dairy products0.00–0.010.000.000.000.00–0.010.000.00Cheese0.000.00–0.010.000.010.000.000.000.00Milk
–0.01–0.01–0.010.000.000.00–0.010.000.00Dairy and related products0.000.000.00–0.010.000.000.000.000.00Fish and other seafood0.000.00–0.010.000.010.000.000.00–0.01Other meats0.000.010.000.010.000.010.000.000.01Poultry0.000.000.000.00–0.010.000.000.000.00Lamb and goat
–0.01–0.010.000.000.00–0.010.000.000.00Pork0.00–0.01–0.010.00–0.010.00–0.01–0.010.00Beef and veal0.000.01–0.020.00–0.01–0.01–0.010.000.01Meat and seafoods0.000.000.000.00–0.01–0.010.000.000.00Other cereal products0.00–0.010.000.00–0.010.00–0.010.00–0.01Breakfast cereals0.010.000.000.010.000.000.010.020.00Cakes and biscuits0.00–0.01–0.010.010.000.000.000.000.00Bread0.00–0.02–0.010.01–0.01–0.01–0.010.01–0.01Bread and cereal products
–0.04–0.05–0.10–0.08–0.01–0.070.06–0.110.01Food and non-alcoholic beverages
Weighted
average of
eight
capital
citiesCanberraDarwinHobartPerthAdelaideBrisbaneMelbourneSydneyGroup , sub–g r oup and expend i t u r e c l a s s
CONTRIBUT ION TO CHANGE IN ALL GROUPS CPI— Mar Qtr 20176
A B S • CO N S U M E R P R I C E I N D E X • 6 4 0 1 . 0 • MA R QT R 2 0 1 7 21
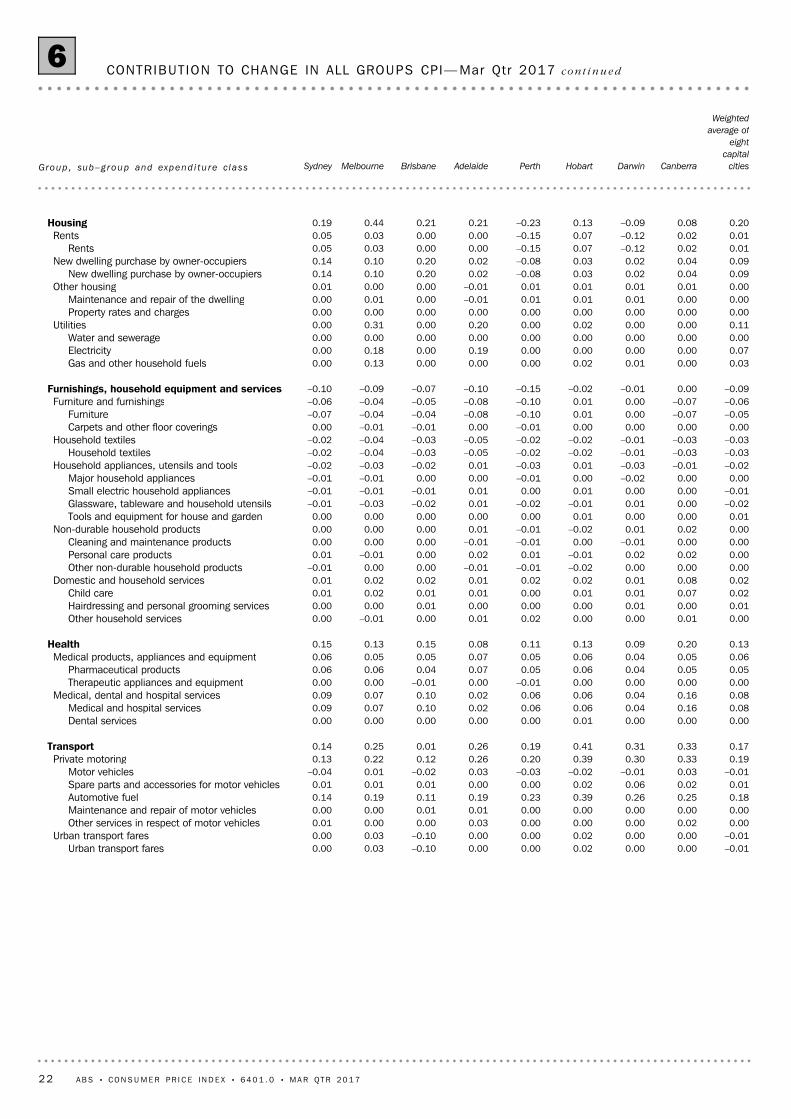
–0.010.000.000.020.000.00–0.100.030.00Urban transport fares–0.010.000.000.020.000.00–0.100.030.00Urban transport fares0.000.020.000.000.000.030.000.000.01Other services in respect of motor vehicles0.000.000.000.000.000.010.010.000.00Maintenance and repair of motor vehicles0.180.250.260.390.230.190.110.190.14Automotive fuel0.010.020.060.020.000.000.010.010.01Spare parts and accessories for motor vehicles
–0.010.03–0.01–0.02–0.030.03–0.020.01–0.04Motor vehicles0.190.330.300.390.200.260.120.220.13Private motoring0.170.330.310.410.190.260.010.250.14Transport
0.000.000.000.010.000.000.000.000.00Dental services0.080.160.040.060.060.020.100.070.09Medical and hospital services0.080.160.040.060.060.020.100.070.09Medical, dental and hospital services0.000.000.000.00–0.010.00–0.010.000.00Therapeutic appliances and equipment0.050.050.040.060.050.070.040.060.06Pharmaceutical products0.060.050.040.060.050.070.050.050.06Medical products, appliances and equipment0.130.200.090.130.110.080.150.130.15Health
0.000.010.000.000.020.010.00–0.010.00Other household services0.010.000.010.000.000.000.010.000.00Hairdressing and personal grooming services0.020.070.010.010.000.010.010.020.01Child care0.020.080.010.020.020.010.020.020.01Domestic and household services0.000.000.00–0.02–0.01–0.010.000.00–0.01Other non-durable household products0.000.020.02–0.010.010.020.00–0.010.01Personal care products0.000.00–0.010.00–0.01–0.010.000.000.00Cleaning and maintenance products0.000.020.01–0.02–0.010.010.000.000.00Non-durable household products0.010.000.000.010.000.000.000.000.00Tools and equipment for house and garden
–0.020.000.01–0.01–0.020.01–0.02–0.03–0.01Glassware, tableware and household utensils–0.010.000.000.010.000.01–0.01–0.01–0.01Small electric household appliances0.000.00–0.020.00–0.010.000.00–0.01–0.01Major household appliances
–0.02–0.01–0.030.01–0.030.01–0.02–0.03–0.02Household appliances, utensils and tools–0.03–0.03–0.01–0.02–0.02–0.05–0.03–0.04–0.02Household textiles–0.03–0.03–0.01–0.02–0.02–0.05–0.03–0.04–0.02Household textiles0.000.000.000.00–0.010.00–0.01–0.010.00Carpets and other floor coverings
–0.05–0.070.000.01–0.10–0.08–0.04–0.04–0.07Furniture–0.06–0.070.000.01–0.10–0.08–0.05–0.04–0.06Furniture and furnishings–0.090.00–0.01–0.02–0.15–0.10–0.07–0.09–0.10Furnishings, household equipment and services
0.030.000.010.020.000.000.000.130.00Gas and other household fuels0.070.000.000.000.000.190.000.180.00Electricity0.000.000.000.000.000.000.000.000.00Water and sewerage0.110.000.000.020.000.200.000.310.00Utilities0.000.000.000.000.000.000.000.000.00Property rates and charges0.000.000.010.010.01–0.010.000.010.00Maintenance and repair of the dwelling0.000.010.010.010.01–0.010.000.000.01Other housing0.090.040.020.03–0.080.020.200.100.14New dwelling purchase by owner-occupiers0.090.040.020.03–0.080.020.200.100.14New dwelling purchase by owner-occupiers0.010.02–0.120.07–0.150.000.000.030.05Rents0.010.02–0.120.07–0.150.000.000.030.05Rents0.200.08–0.090.13–0.230.210.210.440.19Housing
Weighted
average of
eight
capital
citiesCanberraDarwinHobartPerthAdelaideBrisbaneMelbourneSydneyGroup , sub–g r oup and expend i t u r e c l a s s
CONTRIBUT ION TO CHANGE IN ALL GROUPS CPI— Mar Qtr 2017 co n t i n u e d6
22 A B S • CO N S U M E R P R I C E I N D E X • 6 4 0 1 . 0 • MA R QT R 2 0 1 7
0.50.7–0.10.90.00.40.31.00.4All groups CPI
0.010.040.03–0.010.030.020.020.040.00Other financial services0.000.010.010.000.010.010.010.000.01Deposit and loan facilities (direct charges)0.030.050.04–0.010.040.020.030.040.00Financial services0.01–0.010.000.020.010.010.010.020.02Insurance0.01–0.010.000.020.010.010.010.020.02Insurance0.040.030.040.020.050.040.050.060.01Insurance and financial services
0.040.040.020.050.040.050.030.050.04Tertiary education0.060.050.040.050.040.050.080.090.06Secondary education0.020.020.020.020.020.030.020.020.01Preschool and primary education0.120.110.080.120.100.130.130.150.11Education0.120.110.080.120.100.130.130.150.11Education
0.010.040.030.020.000.000.040.010.01Other recreational, sporting and cultural services0.000.01–0.070.010.00–0.010.010.000.01Sports participation0.000.010.000.000.000.000.000.000.00Veterinary and other services for pets0.000.010.010.010.000.000.000.000.00Pets and related products0.010.010.010.000.010.010.020.010.01Games, toys and hobbies0.010.000.000.000.000.010.000.000.00
Equipment for sports, camping and open-airrecreation
0.040.08–0.010.050.020.030.060.030.03Other recreation, sport and culture–0.10–0.10–0.12–0.10–0.08–0.13–0.16–0.07–0.08International holiday travel and accommodation–0.01–0.01–0.250.24–0.030.00–0.080.07–0.03Domestic holiday travel and accommodation–0.11–0.11–0.370.15–0.11–0.12–0.24–0.01–0.12Holiday travel and accommodation0.010.010.000.030.000.000.000.010.01Newspapers, magazines and stationery0.010.010.000.020.020.010.000.020.01Books0.010.020.010.050.010.020.000.020.01Newspapers, books and stationery
–0.02–0.02–0.01–0.03–0.02–0.01–0.03–0.01–0.02Audio, visual and computing media and services–0.010.00–0.03–0.02–0.02–0.02–0.03–0.02–0.01Audio, visual and computing equipment–0.03–0.02–0.03–0.05–0.04–0.03–0.04–0.03–0.03Audio, visual and computing equipment and services–0.09–0.04–0.420.19–0.12–0.12–0.200.01–0.12Recreation and culture
–0.01–0.02–0.01–0.01–0.01–0.01–0.01–0.01–0.01Telecommunication equipment and services0.000.010.000.000.000.000.000.000.00Postal services
–0.01–0.01–0.01–0.01–0.01–0.01–0.01–0.01–0.01Communication–0.01–0.01–0.01–0.01–0.01–0.01–0.01–0.01–0.01Communication
Weighted
average of
eight
capital
citiesCanberraDarwinHobartPerthAdelaideBrisbaneMelbourneSydneyGroup , sub–g r oup and expend i t u r e c l a s s
CONTRIBUT ION TO CHANGE IN ALL GROUPS CPI— Mar Qtr 2017 co n t i n u e d6
A B S • CO N S U M E R P R I C E I N D E X • 6 4 0 1 . 0 • MA R QT R 2 0 1 7 23
(a) Unless otherwise specified, reference period of each index: 2011–12 = 100.0.
0.000.140.142.51.1114.7113.4111.9Cleaning, repair and hire of clothing and
footwear
0.020.770.754.43.3104.2100.999.8Accessories0.020.910.894.12.9105.7102.7101.5Accessories and clothing services0.000.120.12–1.0–2.894.797.495.7Footwear for infants and children
–0.010.330.341.6–2.991.794.490.3Footwear for women–0.010.130.14–0.2–3.796.099.796.2Footwear for men–0.020.580.600.6–3.093.396.292.7Footwear–0.020.290.312.3–3.897.3101.195.1Garments for infants and children–0.021.311.33–2.3–1.790.191.792.2Garments for women–0.030.730.76–0.6–3.9100.2104.3100.8Garments for men–0.062.342.40–1.3–2.893.996.695.1Garments–0.053.833.880.3–1.496.497.896.1Clothing and footwear
0.044.224.1813.31.0176.7175.0155.9Tobacco0.044.224.1813.31.0176.7175.0155.9Tobacco0.022.572.552.31.0115.4114.3112.8Beer0.031.661.63–0.81.6101.7100.1102.5Wine0.011.011.000.71.2110.8109.5110.0Spirits0.065.245.181.01.2109.8108.5108.7Alcoholic beverages0.119.479.366.11.1132.1130.7124.5Alcohol and tobacco
0.012.952.941.10.4111.1110.7109.9Take away and fast foods0.013.113.102.20.4109.9109.5107.5Restaurant meals0.026.056.031.70.4110.5110.1108.7Meals out and take away foods0.010.860.85–2.70.599.398.8102.1Waters, soft drinks and juices0.010.300.29–2.72.1104.2102.1107.1Coffee, tea and cocoa0.021.161.14–2.70.9100.599.6103.3Non-alcoholic beverages
–0.020.460.48–4.5–4.396.7101.0101.3Other food products n.e.c.0.011.000.99–1.01.0104.5103.5105.6Snacks and confectionery0.000.180.182.91.9103.5101.6100.6Oils and fats0.000.300.30–0.61.597.696.298.2Food additives and condiments0.000.150.15–2.0–1.2104.5105.8106.6Jams, honey and spreads0.000.120.120.90.3108.7108.4107.7Eggs
–0.012.202.21–1.5–0.3101.9102.2103.4Food products n.e.c.0.031.541.5113.12.0122.0119.6107.9Vegetables
–0.081.141.2212.2–6.793.5100.283.3Fruit–0.052.682.7312.7–1.9108.0110.195.8Fruit and vegetables0.000.360.36–1.5–0.795.396.096.8Ice cream and other dairy products0.000.330.33–3.0–0.999.7100.6102.8Cheese0.000.410.410.10.396.796.496.6Milk
–0.011.101.11–1.4–0.497.197.598.5Dairy and related products0.000.440.442.30.2108.2108.0105.8Fish and other seafood0.000.430.43–1.10.0111.8111.8113.1Other meats0.000.470.47–1.21.0101.5100.5102.7Poultry0.000.250.251.4–0.6100.8101.499.4Lamb and goat
–0.010.390.40–0.6–0.3111.6111.9112.3Pork0.000.480.480.2–1.0124.2125.4123.9Beef and veal0.002.462.460.1–0.1109.9110.0109.8Meat and seafoods0.000.190.19–4.4–0.992.393.196.5Other cereal products0.000.170.17–1.9–2.692.294.794.0Breakfast cereals0.010.760.751.20.7103.7103.0102.5Cakes and biscuits0.000.540.54–0.6–0.295.495.696.0Bread0.001.661.66–0.5–0.298.298.498.7Bread and cereal products
–0.0417.3117.351.8–0.2106.0106.2104.1Food and non-alcoholic beverages
Dec Qtr 2016 to
Mar Qtr 2017
Mar Qtr
2017
Dec Qtr
2016
Mar Qtr 2016 to
Mar Qtr 2017
Dec Qtr 2016 to
Mar Qtr 2017
Mar Qtr
2017
Dec Qtr
2016
Mar Qtr
2016
CHANGEIN POINTSCONTRIBUTION
CONTRIBUTIONTO TOTAL CPI(ALL GROUPSINDEX POINTS)PERCENTAGE CHANGEINDEX NUMBERS(a)
Group , sub–g r oup and expend i t u r e c l a s s
GROUP, SUB– GROUP AND EXPENDITURE CLASS, Weighted average of eigh t cap i ta l ci t ies7
24 A B S • CO N S U M E R P R I C E I N D E X • 6 4 0 1 . 0 • MA R QT R 2 0 1 7
(a) Unless otherwise specified, reference period of each index: 2011–12 = 100.0.
–0.010.800.811.2–0.8106.5107.4105.2Urban transport fares–0.010.800.811.2–0.8106.5107.4105.2Urban transport fares0.001.711.712.00.4123.5123.0121.1Other services in respect of motor vehicles0.001.871.870.60.1108.1108.0107.5Maintenance and repair of motor vehicles0.183.263.0816.25.792.087.079.2Automotive fuel0.011.071.061.20.9107.7106.7106.4
Spare parts and accessories for motorvehicles
–0.012.962.97–2.9–0.393.593.896.3Motor vehicles0.1910.8710.684.01.7100.598.896.6Private motoring0.1711.6711.503.81.5100.999.497.2Transport
0.000.630.630.50.3111.2110.9110.7Dental services0.084.744.665.41.6137.7135.5130.6Medical and hospital services0.085.375.294.91.5134.0132.0127.7Medical, dental and hospital services0.000.150.150.0–0.297.297.497.2Therapeutic appliances and equipment0.051.191.14–0.74.9105.7100.8106.4Pharmaceutical products0.061.341.28–0.74.3104.7100.4105.4Medical products, appliances and equipment0.136.706.573.82.0126.9124.4122.3Health
0.000.830.832.40.4116.7116.2114.0Other household services0.011.021.012.10.3111.9111.6109.6
Hairdressing and personal groomingservices
0.021.081.066.01.2147.7146.0139.3Child care0.022.922.903.70.6124.5123.7120.1Domestic and household services0.001.491.490.3–0.3103.0103.3102.7Other non-durable household products0.001.011.01–1.90.592.592.094.3Personal care products0.000.280.28–2.0–0.994.995.896.8Cleaning and maintenance products0.002.782.78–0.80.098.198.198.9Non-durable household products0.010.280.272.20.7107.2106.5104.9
Tools and equipment for house andgarden
–0.020.380.40–2.3–3.490.393.592.4Glassware, tableware and household
utensils
–0.010.210.22–4.9–2.891.393.996.0Small electric household appliances0.000.460.46–3.5–1.195.296.398.7Major household appliances
–0.021.331.35–2.3–1.795.396.997.5Household appliances, utensils and tools–0.030.520.55–5.5–5.685.890.990.8Household textiles–0.030.520.55–5.5–5.685.890.990.8Household textiles0.000.300.30–0.5–0.7106.2107.0106.7Carpets and other floor coverings
–0.051.571.62–1.5–3.598.5102.1100.0Furniture–0.061.861.92–1.3–3.099.7102.8101.0Furniture and furnishings–0.099.419.50–0.1–1.0104.0105.1104.1
Furnishings, household equipment andservices
0.031.000.972.73.8133.9129.0130.4Gas and other household fuels0.072.752.687.52.5126.8123.7117.9Electricity0.001.111.11–1.80.0114.0114.0116.1Water and sewerage0.114.864.754.32.2125.0122.3119.8Utilities0.001.741.744.00.0132.1132.1127.0Property rates and charges0.002.302.302.00.2112.6112.4110.4Maintenance and repair of the dwelling0.004.044.042.80.1120.2120.1116.9Other housing0.0910.029.932.81.0116.4115.3113.2
New dwelling purchase byowner-occupiers
0.0910.029.932.81.0116.4115.3113.2New dwelling purchase by owner-occupiers0.017.597.580.60.1110.9110.8110.2Rents0.017.597.580.60.1110.9110.8110.2Rents0.2026.5126.312.50.8116.8115.9114.0Housing
Dec Qtr 2016 to
Mar Qtr 2017
Mar Qtr
2017
Dec Qtr
2016
Mar Qtr 2016 to
Mar Qtr 2017
Dec Qtr 2016 to
Mar Qtr 2017
Mar Qtr
2017
Dec Qtr
2016
Mar Qtr
2016
CHANGEIN POINTSCONTRIBUTION
CONTRIBUTIONTO TOTAL CPI(ALL GROUPSINDEX POINTS)PERCENTAGE CHANGEINDEX NUMBERS(a)
Group , sub–g r oup and expend i t u r e c l a s s
GROUP, SUB– GROUP AND EXPENDITURE CLASS, Weighted average of eigh t cap i ta l ci t ies
co n t i n u e d7
A B S • CO N S U M E R P R I C E I N D E X • 6 4 0 1 . 0 • MA R QT R 2 0 1 7 25
(a) Unless otherwise specified, reference period of each index: 2011–12 = 100.0.
0.5110.5110.02.10.5110.5110.0108.2All groups CPI
0.013.173.161.00.6108.5107.9107.4Other financial services0.000.760.760.60.8102.0101.2101.4Deposit and loan facilities (direct charges)0.033.943.910.90.7107.2106.5106.2Financial services0.011.811.806.80.8123.9122.9116.0Insurance0.011.811.806.80.8123.9122.9116.0Insurance0.045.755.712.70.6111.9111.2109.0Insurance and financial services
0.041.791.752.62.4125.3122.4122.1Tertiary education0.061.711.654.14.1132.2127.0127.0Secondary education0.020.690.672.92.3129.0126.1125.4Preschool and primary education0.124.194.073.33.1128.7124.8124.6Education0.124.194.073.33.1128.7124.8124.6Education
0.011.351.341.80.7122.4121.5120.2Other recreational, sporting and cultural
services
0.001.131.131.70.4118.4117.9116.4Sports participation0.000.480.483.20.4118.8118.3115.1Veterinary and other services for pets0.000.390.395.90.9101.8100.996.1Pets and related products0.010.670.660.81.790.288.789.5Games, toys and hobbies0.010.620.61–0.70.6104.2103.6104.9
Equipment for sports, camping andopen-air recreation
0.044.654.611.70.7110.9110.1109.0Other recreation, sport and culture–0.102.442.54–4.2–3.8106.2110.4110.9
International holiday travel andaccommodation
–0.012.882.891.6–0.3112.0112.3110.2Domestic holiday travel and
accommodation
–0.115.325.43–1.1–1.9109.3111.4110.5Holiday travel and accommodation0.010.800.791.70.6117.9117.2115.9Newspapers, magazines and stationery0.010.390.382.32.5100.798.298.4Books0.011.191.181.91.3111.6110.2109.5Newspapers, books and stationery
–0.020.920.940.4–1.895.397.094.9Audio, visual and computing media and
services
–0.010.860.87–7.2–1.661.662.666.4Audio, visual and computing equipment–0.031.781.81–3.3–1.775.476.778.0
Audio, visual and computing equipment andservices
–0.0912.9413.03–0.2–0.7103.6104.3103.8Recreation and culture
–0.012.552.56–5.2–0.587.287.692.0Telecommunication equipment and
services
0.000.140.144.11.2114.1112.7109.6Postal services–0.012.692.70–4.8–0.388.388.692.8Communication–0.012.692.70–4.8–0.388.388.692.8Communication
Dec Qtr 2016 to
Mar Qtr 2017
Mar Qtr
2017
Dec Qtr
2016
Mar Qtr 2016 to
Mar Qtr 2017
Dec Qtr 2016 to
Mar Qtr 2017
Mar Qtr
2017
Dec Qtr
2016
Mar Qtr
2016
CHANGEIN POINTSCONTRIBUTION
CONTRIBUTIONTO TOTAL CPI(ALL GROUPSINDEX POINTS)PERCENTAGE CHANGEINDEX NUMBERS(a)
Group , sub–g r oup and expend i t u r e c l a s s
GROUP, SUB– GROUP AND EXPENDITURE CLASS, Weighted average of eigh t cap i ta l ci t ies
co n t i n u e d7
26 A B S • CO N S U M E R P R I C E I N D E X • 6 4 0 1 . 0 • MA R QT R 2 0 1 7
(b) Unless otherwise specified, reference period of each index: 2011–12 = 100.0.(c) Index numbers are available in the time series spreadsheet 'Table 8. CPI:
Analytical Series, Weighted Average of Eight Capital Cities'.
. . not applicabler revised(a) Refer to paragraphs 11 and 12 of the Explanatory Notes for a description of
these series.
0.37104.53104.161.50.4111.2110.8109.6'Volatile items'0.2689.2689.001.50.3111.5111.2109.8Food and energy0.42105.74105.322.00.4109.5109.1107.4Medical and hospital services0.2578.2177.962.00.4108.4108.0106.3
Housing, Insurance andfinancial services
0.46104.73104.272.10.5110.4109.9108.1Insurance and financial services0.38106.29105.912.10.4109.9109.5107.6Education0.5897.5396.952.50.6111.5110.8108.8Recreation and culture0.50107.78107.282.40.5111.2110.6108.6Communication0.3398.8198.481.90.3111.7111.4109.6Transport0.36103.77103.412.00.4109.6109.2107.4Health0.59101.07100.482.30.5111.1110.5108.6
Furnishings, householdequipment and services
0.2983.9683.672.00.4108.6108.2106.5Housing0.56106.65106.092.20.5111.1110.5108.7Clothing and footwear0.39101.01100.621.80.4108.8108.4106.9Alcohol and tobacco0.5393.1692.632.10.5111.3110.7109.0Food and non-alcoholic beverages
All groups CPI excluding
0.0083.3083.301.00.0107.9107.9106.8Total
–0.0333.4433.470.70.0109.4109.4108.6Services0.0249.8649.841.20.1106.9106.8105.6Goods
Market goods and servicesexcluding 'volatile items'
. .. .. .2.10.5111.1110.5108.8Deposit and loan facilities
(indirect charges)
All groups CPI including
0.1948.6248.431.60.3114.9114.5113.1Services component0.3261.8661.542.50.5107.2106.7104.6Goods component
Goods and services series
0.5973.7973.202.60.9115.7114.7112.8Non-tradables–0.0936.6936.781.3–0.2102.2102.4100.9Tradables
International trade exposure series
. .. .. .1.70.4. .. .. .Weighted median(c)
. .. .. .1.90.5. .. .. .Trimmed mean(c)Underlying trend series
0.00.00.02.10.5110.5r109.9108.2All groups CPI, seasonally adjusted
0.5110.5110.02.10.5110.5110.0108.2All groups CPI
Dec Qtr 2016 to
Mar Qtr 2017
Mar Qtr
2017
Dec Qtr
2016
Mar Qtr 2016 to
Mar Qtr 2017
Dec Qtr 2016 to
Mar Qtr 2017
Mar Qtr
2017
Dec Qtr
2016
Mar Qtr
2016
CHANGEIN POINTSCONTRIBUTION
CONTRIBUTIONTO TOTAL CPI(ALL GROUPS CPIINDEX POINTS)PERCENTAGE CHANGEINDEX NUMBERS(b)
ANALYT ICAL SERIES, Weighted average of eigh t cap i ta l ci t ies (a )8
A B S • CO N S U M E R P R I C E I N D E X • 6 4 0 1 . 0 • MA R QT R 2 0 1 7 27
6 There are 87 expenditure classes (that is, groupings of like items) in the 16th series
CPI and each expenditure class has its own weight, or measure of relative importance. In
calculating the index, price changes for the various expenditure classes are combined
using these weights.
7 Changes in the weighting pattern have been made at approximately six yearly
intervals to take account of changes in household spending patterns. The CPI now
comprises sixteen series of price indexes which have been linked to form a continuous
series. The current and historical weighting patterns for the CPI for the weighted average
of the eight capital cities are published in Consumer Price Index: Historical Weighting
Patterns (1948 to 2011) (cat. no. 6431.0). The 16th series weighting pattern for the
weighted average of eight capital cities and for each of the eight capital cities, as well as
each city's percentage contribution to the weighted average, are also published in the
Consumer Price Index: 16th Series Weighting Pattern (cat. no. 6471.0). Both
publications are available on the ABS website <http://www.abs.gov.au>.
WE I G H T I N G PA T T E R N
4 The frequency of price collection by item varies as necessary to obtain reliable price
measures. Prices of some items are volatile (i.e. their prices may vary many times each
quarter) and for these items frequent price observations are necessary to obtain a
reliable measure of the average price for the quarter. Each month prices are collected at
regular intervals for goods such as milk, bread, fresh meat and seafood, fresh fruit and
vegetables, alcohol, tobacco, women's outerwear, project homes, motor vehicles, petrol
and holiday travel and accommodation. For most other items, price volatility is not a
problem and prices are collected once a quarter. There are a few items where prices are
changed at infrequent intervals, for example education fees where prices are set once a
year. In these cases, the frequency of price collection is modified accordingly.
5 In order to facilitate a more even spread of field collection workload, the number of
items for which prices are collected quarterly is distributed roughly equally across each
month of each quarter. In all cases, however, individual items are priced in the same
month of each quarter. For example, items for which prices are collected in the first
month of the September quarter, July, are also priced in the first month of subsequent
quarters, namely October, January and April.
PR I C E S
1 The Consumer Price Index (CPI) measures quarterly changes in the price of a 'basket'
of goods and services which account for a high proportion of expenditure by the CPI
population group (i.e. metropolitan households). This 'basket' covers a wide range of
goods and services, arranged in the following eleven groups:
Food and non–alcoholic beverages
Alcohol and tobacco
Clothing and footwear
Housing
Furnishings, household equipment and services
Health
Transport
Communication
Recreation and culture
Education
Insurance and financial services.
2 Capital city indexes used by the CPI are based on the 2006 Australian Standard
Geographical Classification (ASGC) statistical divisions. The capital city indexes measure
price movements over time in each city individually. They do not measure differences in
retail price levels between cities.
3 Further information about the CPI is contained in Consumer Price Index: Concepts,
Sources and Methods, 2016 (cat. no. 6461.0).
BR I E F DE S C R I P T I O N OF TH E
CP I
28 A B S • CO N S U M E R P R I C E I N D E X • 6 4 0 1 . 0 • MA R QT R 2 0 1 7
E X P L A N A T O R Y N O T E S
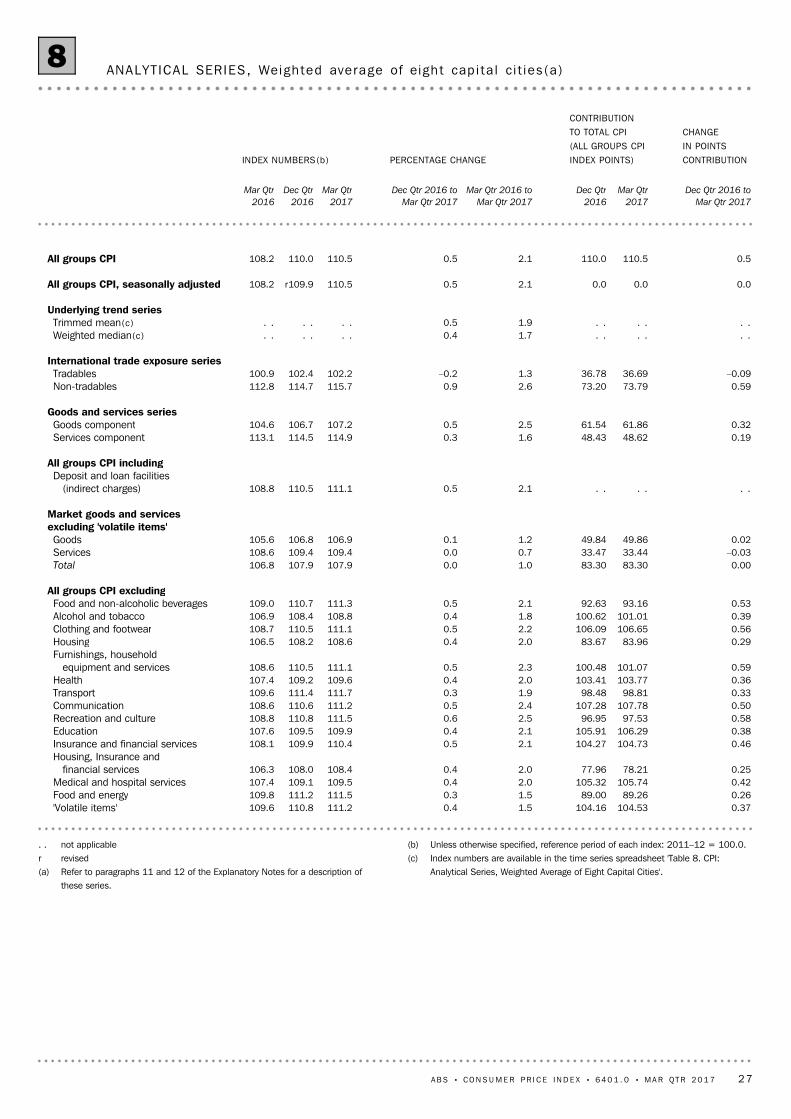
11 Various series are presented in Table 8 in this publication to assist users analyse the
CPI. Some of the analytical series are compiled by taking subsets of the CPI basket, and
most are self explanatory, such as 'All groups CPI excluding Food and non-alcoholic
beverages'. (A complete list of CPI groups, sub-groups and expenditure classes is
contained in Tables 6 and 7). Other series and their composition are described below:
All groups CPI, seasonally adjusted: Comprises all components included in the All
groups CPI, seasonally adjusted where seasonality has been identified at the
weighted average of eight capital cities level. Seasonal adjustment factors are
calculated using the history of price changes up to the current quarter CPI and are
revised each quarter.
Where CPI expenditure classes are identified as having a seasonal pattern,
quarterly price changes are estimated on a seasonally adjusted basis. At the
introduction of the 16th series, 62 out of the 87 expenditure classes were
classified as seasonal. A description of which series are currently seasonally
adjusted is published in the Appendix of every September quarter issue of
Consumer Price Index, Australia (cat. no. 6401.0), following the annual seasonal
reanalysis.
Underlying trend series, 'Trimmed mean' and 'Weighted median': These are two
analytical measures of trend inflation calculated from the June quarter 2002 using
standard ABS seasonal adjustment techniques. For more information see the
Information Paper: Seasonal Adjustment of Consumer Price Indexes, 2011 (cat. no.
6401.0.55.003). The Trimmed mean and Weighted median are calculated using the
distribution of expenditure classes each quarter derived as follows:
The CPI expenditure classes are ranked from lowest to highest according to the
seasonally adjusted percentage change from the previous quarter.
The seasonally adjusted relative weight of each expenditure class is calculated
based on its previous quarter contribution to the All groups CPI.
The 'Trimmed mean' is calculated by using a weighted average of percentage
change from the previous quarter (seasonally adjusted) from the middle 70 per
cent of the distribution.
AN A L Y T I C A L SE R I E S
8 Movements in indexes from one period to another can be expressed either as
changes in index points or as percentage changes. The following example illustrates the
method of calculating changes in index points and percentage changes between any two
periods:
All groups CPI: Weighted average of eight capital cities. Index numbers:
June Quarter 2012 100.4 (see Table 1)
less June Quarter 2011 99.2 (see Table 1)
Change in index points 1.2
Percentage change 1.2/99.2 x 100 = 1.2% (see Table 2)
9 Percentage changes are calculated to illustrate three different kinds of movements in
index numbers:
movements between consecutive financial years (where the index numbers for
financial years are simple averages of the quarterly index numbers)
movements between corresponding quarters of consecutive years
movements between consecutive quarters.
10 Table 7 provides a detailed analysis, for the weighted average of eight capital cities,
of movements in the CPI since the previous quarter, including information on
movements for groups, sub–groups and expenditure classes. It also shows the
contribution which each makes to the total CPI. For instance, the dairy and related
products sub–group contributed 1.13 index points to the total All groups index number
of 100.4 for the June Quarter 2012. The final column shows contributions to the change
in All Groups index points by each group, sub–group and expenditure class.
AN A L Y S I S OF CP I CH A N G E S
A B S • CO N S U M E R P R I C E I N D E X • 6 4 0 1 . 0 • MA R QT R 2 0 1 7 29
E X P L A N A T O R Y N O T E S continued
The 'Weighted median' is calculated using the percentage change from the
previous quarter (seasonally adjusted) expenditure class at the 50th percentile
of the distribution.
International trade exposure series, Tradables component: Comprises all items
whose prices are largely determined on the world market. For more information,
see paragraph 12 below.
International trade exposure series, Non-tradables component: Comprises all
items not included in the Tradables component.
All groups CPI, goods component: Comprises the Food and non-alcoholic beverages
group (except Restaurant meals); Alcohol and tobacco group; Clothing and footwear
group (except Cleaning, repair and hire of clothing and footwear); Furnishings,
household equipment and services group (except Domestic and household services
sub-group); Utilities, Audio, visual and computing equipment and services, and
Newspapers, books and stationery sub-groups; and New dwelling purchase by
owner-occupiers, Pharmaceutical products, Motor vehicles, Automotive fuel, Spare
parts and accessories for motor vehicles, Equipment for sports, camping and
open-air recreation, Games, toys and hobbies and Pets and related products
expenditure classes.
All groups CPI, services component: Comprises all items not included in the 'All
groups CPI, goods component'. A description of which series are goods or services is
published in the Appendix of the December quarter 2016 issue of Consumer Price
Index, Australia (cat. no 6401.0).
All groups CPI including Deposit and loan facilities (indirect charges): One of the
outcomes of the 16th series CPI Review was to remove the indirectly measured
component of the Deposit and loan facilities index from the headline CPI but to
include it in a new analytical series. This index includes the 16th series All groups
CPI plus the indirectly measured component of the Deposit and loan facilities index.
Market goods and services excluding 'volatile items': in addition to the items
excluded from the series 'All groups CPI excluding 'volatile items', also excludes:
Utilities, Property rates and charges, Child care, Health, Other services in respect of
motor vehicles, Urban transport fares, Postal services, and Education.
All groups CPI excluding Insurance and financial services: Reflecting the changing
composition of the CPI, from the September quarter 1989 to the June quarter 1998,
comprises the All groups CPI excluding house insurance, house contents insurance,
vehicle insurance and mortgage interest charges and consumer credit charges; from
the September quarter 1998 to the June quarter 2000 comprises the All groups CPI
excluding house insurance, house contents insurance and vehicle insurance; from
the September quarter 2000 to the June quarter 2005 comprises the All groups CPI
excluding insurance services; from the September quarter 2005 to the June quarter
2011 comprises the All groups CPI excluding Financial and insurance services; from
the September quarter 2011 comprises the All groups CPI excluding Insurance and
financial services.
All groups CPI excluding Housing and Insurance and financial services: Reflecting
the changing composition of the CPI, from the September quarter 1989 to the June
quarter 1998, comprises the All groups CPI excluding Housing, house contents
insurance, vehicle insurance and consumer credit charges; from the September
quarter 1998 to the June quarter 2000 comprises the All groups CPI excluding
Housing, house insurance, house contents insurance and vehicle insurance; from
the September quarter 2000 to the June quarter 2005 comprises the All groups CPI
excluding Housing and insurance services; from the September quarter 2005 to the
June quarter 2011 comprises the All groups CPI excluding Housing and Financial
and insurance services; from the September quarter 2011 comprises the All groups
CPI excluding Housing and Insurance and financial services.
AN A L Y T I C A L SE R I E S continued
30 A B S • CO N S U M E R P R I C E I N D E X • 6 4 0 1 . 0 • MA R QT R 2 0 1 7
E X P L A N A T O R Y N O T E S continued
14 Seasonally adjusted estimates are derived by estimating and removing systematic
calendar related effects from the original series. In most economic data these calendar
related effects are a combination of the classical seasonal influences (e.g. the effect of the
weather, social traditions or administrative practices such as government charges
increasing on 1 July each year) plus other kinds of calendar related variations, such as
Easter or the proximity of significant days in the year (e.g. Christmas). In the seasonal
adjustment process, both seasonal and other calendar related factors evolve over time to
reflect changes in activity patterns. The seasonally adjusted estimates reflect the
sampling and non–sampling errors to which the original estimates are subject.
15 The CPI uses a concurrent seasonal adjustment methodology to derive the
adjustment factors. This method uses the original time series available at each reference
period to estimate seasonal factors for the current and previous quarters. Concurrent
seasonal adjustment is technically superior to the more traditional method of reanalysing
seasonal patterns once each year because it uses all available data to fine tune the
estimates of the seasonal component each quarter. With concurrent analysis, the
seasonally adjusted series are subject to revision each quarter as the estimates of the
seasonal factors are improved. In most instances, the only significant revisions will be to
the combined adjustment factors for the previous quarter and for the same quarter in
the preceding year as the reference quarter (i.e. if the latest quarter is September quarter
2011 then the most significant revisions will be to June quarter 2011 and September
quarter 2010). The seasonal patterns are also reanalysed on an annual basis or when
there are known changes to regular events. This can lead to additional revisions.
16 Autoregressive integrated moving average (ARIMA) modelling can improve the
revision properties of the seasonally adjusted and trend estimates. ARIMA modelling
relies on the characteristics of the series being analysed to project future period data.
The projected values are temporary, intermediate values, that are only used internally to
improve the estimation of the seasonal factors. The projected data do not affect the
SE A S O N A L L Y AD J U S T E D
IN D E X E S
13 Published index numbers, except for the underlying trend series, are rounded to
one decimal place. Percentage change movements are calculated from the index
numbers and then rounded to one decimal place. Rounding errors can occur, causing
discrepancies (e.g. when calculating percentage changes of aggregates and their
components). Underlying trend series, 'Trimmed mean' and 'Weighted median' index
numbers are published to four decimal places. Percentage change movements are
calculated from the published index numbers and rounded to one decimal place.
RO U N D I N G
All groups CPI excluding food and energy: Comprises the All groups CPI excluding
the Food and non-alcoholic beverages group (except Restaurant meals); Electricity,
Gas and other household fuels; and Automotive fuel.
All groups CPI excluding 'volatile items': Comprises the All groups CPI excluding
Fruit and vegetables and Automotive fuel.
12 The International trade exposure series was reviewed and updated for the
December quarter 2016. There were eight changes of classification outlined in the
September quarter 2016 feature article 'Review of the Consumer Price Index
International Trade Exposure Series' (cat. no. 6401.0): Breakfast cereals; Waters, soft
drinks and juices; Gas and other household fuels; Therapeutic appliances and
equipment; and Newspaper, magazines and stationery were reclassified from
non-tradables to tradables: and Spirits; Tobacco; and Pharmaceutical products were
reclassified from tradables to non-tradables. These changes are included from the
December quarter 2016. The historical tradables and non-tradables series will not be
revised. A description of which expenditure classes are tradables or non-tradables is
published in the Appendix of the December quarter 2016 issue of Consumer Price Index,
Australia (cat. no 6401.0).
AN A L Y T I C A L SE R I E S continued
A B S • CO N S U M E R P R I C E I N D E X • 6 4 0 1 . 0 • MA R QT R 2 0 1 7 31
E X P L A N A T O R Y N O T E S continued

20 Current publications and other products released by the ABS are listed on the ABS
website <http://www.abs.gov.au>. The ABS also issues a daily Release Advice on the
website which details products to be released in the week ahead.
21 Users may also wish to refer to the following publications and other data products
that are available free of charge from the ABS website:
Enhancing the Australian CPI: A roadmap, Aug 2015 (cat. no. 6401.0.60.001)
Information Paper: Increasing the Frequency of CPI Expenditure Class Weight
Updates, July 2016 (cat. no. 6401.0.60.002)
Information Paper: Making Greater Use of Transactions Data to compile the
Consumer Price Index, Austraia, 2016 (cat. no. 6401.0.60.003)
A Guide to the Consumer Price Index, 16th Series (cat. no. 6440.0)
Consumer Price Index: Concepts, Sources and Methods, 2016 (cat. no. 6461.0)
Information Paper: Introduction of the 16th Series Australian Consumer Price
Index, 2011 (cat. no. 6470.0)
Information Paper: Outcome of the 16th Series Australian Consumer Price Index
Review, Australia (cat. no. 6469.0)
Consumer Price Index Commodity Classification, Australia, 16th Series, 2011
(cat. no. 6401.0.55.004)
RE L A T E D PU B L I C A T I O N S
19 CPI original indexes are revised only in exceptional circumstances, such as to
correct a significant error. As is the case with all price indexes, the index reference period
(i.e. the period in which the index is set equal to 100.0) will be changed periodically. The
index number levels for all periods will be changed by this process and it may also result
in differences, due to rounding, between the percentage changes published on the old
base and those on the new base. Seasonally adjusted indexes (including the Trimmed
mean and Weighted median) for some quarters will be revised as extra quarters are
included in the series analysed for seasonal influences (see paragraphs 14 to 17).
RE V I S I O N S
18 In analysing price movements in Australia, an important consideration is Australia's
performance relative to other countries. However, a simple comparison of All groups (or
headline) CPIs is often inappropriate because of the different measurement approaches
used by countries for certain products, particularly housing and financial and insurance
services. To provide a better basis for international comparisons, the 17th International
Conference of Labour Statisticians adopted a resolution which called for countries to 'if
possible, compile and provide for dissemination to the international community an index
that excludes housing and financial services' in addition to the all-items index.
I N T E R N A T I O N A L
CO M P A R I S O N S
original estimates and are discarded at the end of the seasonal adjustment process. From
the December quarter 2012, the Consumer Price Index uses ARIMA modelling where
appropriate for individual time series. The ARIMA model is assessed as part of the annual
reanalysis. For more information on ARIMA modelling see Feature article: Use of ARIMA
modelling to reduce revisions in the October 2004 issue of Australian Economic
Indicators (cat. no. 1350.0).
17 The ABS applies seasonal adjustment to the expenditure class components of the
CPI which are found to be seasonal, and then aggregates the seasonally adjusted and
non–seasonally adjusted components to calculate the All groups CPI, seasonally adjusted,
Trimmed mean and Weighted median estimates. The seasonally adjusted expenditure
class components are available in Table 13 – CPI expenditure classes and selected
analytical series, seasonally adjusted index numbers, weighted average of eight capital
cities. The seasonal factors used to derive these seasonally adjusted indexes are available
in Table 14 – CPI expenditure class, combined seasonal adjustment factors, weighted
average of eight capital cities. For more information about seasonal adjustment of the
CPI please refer to Information Paper: Seasonal Adjustment of Consumer Price Indexes,
2011 (cat. no. 6401.0.55.003).
SE A S O N A L L Y AD J U S T E D
IN D E X E S continued
32 A B S • CO N S U M E R P R I C E I N D E X • 6 4 0 1 . 0 • MA R QT R 2 0 1 7
E X P L A N A T O R Y N O T E S continued
22 As well as the statistics included in this publication, there is more detailed data for
each capital city available on the ABS website. Inquiries should be made to the National
Information and Referral Service on 1300 135 070.
DA T A AV A I L A B L E
Consumer Price Index: 16th Series Weighting Pattern (cat. no. 6471.0)
Consumer Price Index: Historical Weighting Patterns (1948–2011) (cat. no. 6431.0)
Analytical Living Cost Indexes and Pensioner and Beneficiary Living Cost Index:
16th Series Weighting Patterns (cat. no. 6472.0)
Consumer Price Index: Correspondence with Household Expenditure
Classification, Australia (cat. no. 6446.0.55.001)
Information Paper: Seasonal Adjustment of Consumer Price Indexes, 2011
(cat. no. 6401.0.55.003)
Information Paper: Experimental Price Indexes for Financial Services
(cat. no. 6413.0)
Information Paper: The Introduction of Hedonic Price Indexes for Personal
Computers (cat. no. 6458.0)
Analytical Living Cost Indexes for Selected Australian Household Types
(cat. no. 6463.0)
Selected Living Cost Indexes, Australia (cat. no. 6467.0)
Residential Property Price Indexes: Eight Capital Cities (cat. no. 6416.0)
Producer Price Indexes, Australia (cat. no. 6427.0)
International Trade Price Indexes, Australia (cat. no. 6457.0)
Wage Price Index, Australia (cat. no. 6345.0)
RE L A T E D PU B L I C A T I O N S
continued
A B S • CO N S U M E R P R I C E I N D E X • 6 4 0 1 . 0 • MA R QT R 2 0 1 7 33
E X P L A N A T O R Y N O T E S continued


www.abs.gov.auWEB ADDRESS
All statistics on the ABS website can be downloaded freeof charge.
F R E E A C C E S S T O S T A T I S T I C S
Client Services, ABS, GPO Box 796, Sydney NSW 2001POST
1300 135 211FAX
1300 135 070PHONE
Our consultants can help you access the full range ofinformation published by the ABS that is available free ofcharge from our website. Information tailored to yourneeds can also be requested as a 'user pays' service.Specialists are on hand to help you with analytical ormethodological advice.
I N F O R M A T I O N A N D R E F E R R A L S E R V I C E
www.abs.gov.au the ABS website is the best place fordata from our publications and information about the ABS.
INTERNET
F O R M O R E I N F O R M A T I O N . . .
© Commonwealth of Australia 2017Produced by the Australian Bureau of Statistics
64
01
.0
•
CO
NS
UM
ER
P
RI
CE
IND
EX
, A
US
TR
AL
IA
•
Ma
rc
h Q
ua
rt
er
20
17
ISSN 1442–3987