Embed Size (px)
Citation preview
Contingent Capital Trigger Effects:Evidence from Liability Management
Exercises
Boris Vallee∗†
November 8, 2017
First Draft: October 28, 2013This Draft: November 8, 2017
Abstract
This paper empirically investigates the effects of banks triggering contingent cap-ital instruments by studying liability management exercises, which bear comparableregulatory capital effects. These actions create core tier-one capital by crystalizinglosses on hybrid debt holders. Banks’ use of liability management exercises, andthe market reaction to them, are consistent with these exercises relaxing a regu-latory capital constraint. The created value mainly accrues to debt holders, anddoes not generate a negative signal. Liability management exercises prove effec-tive at improving bank capitalization levels. These findings strengthen the case forcontingent capital instruments as an alternative to raising capital requirements.
Keywords : Contingent Capital, Financial Distress, Regulatory Capital, Financial Institu-tionsJEL codes: G21, G28, G01, G14
∗Boris Vallee - Harvard Business School; Address: Soldiers Field, Boston MA02163; Email: [email protected];Tel: (617) 496-4604.
†I am indebted to Ulrich Hege for his attentive guidance and encouragement. I thank Thierry Foucault and DavidThesmar for very helpful suggestions. I am also grateful to Viral Acharya, Malcolm Baker, Jean-Noel Barrot, Bo Becker(AEA discussant), Patrick Bolton, Claire Celerier, Jean-Edouard Colliard, Andrew Ellul (discussant), Simon Gervais, ItayGoldstein, Johan Hombert, Victoria Ivashina, Rajkamal Iyer, Wei Jiang, Pab Jotikashira (Cavalcade discussant), AdrienMatray, Thomas Mosk (EFA discussant), Evren Ors, Christophe Perignon, Jose-Luis Peydro, Guillaume Plantin, ManjuPuri, Adriano Rampini, Jean-Charles Rochet, Paola Sapienza, David Scharfstein, Michael Spira, Jeremy Stein, Felipe Varas,Zhenyu Wang (discussant), Jing Zeng (FIRS discussant) and conference and seminar participants from the Fed Board andUniversity of Zurich, AEA San Francisco, Cavalcade Atlanta, FIRS Lisbon, EFA Vienna, Conference on Bank Performance,Financial Stability and the Real Economy in Capri, Young Scholars Finance Consortium, Eurofidai Paris Conference, andDuke Brown Bag for valuable comments and suggestions. Part of this work was done while I was a student at HEC Paris,and while I was visiting Duke University. I also thank Clement Puechbroussou (Deutsche Bank) and Emmeline Travers(BNP Paribas) for very insightful discussions. The paper was previously circulated under the title Call Me Maybe? TheEffects of Triggering Contingent Capital. All errors are mine only.
1
1 Introduction
Outside of the United States, financial institutions are increasingly issuing contingent
capital instruments as part of their balance sheet strengthening: issuances so far amount
to more than USD400bn since 2009, and their rhythm has been increasing. Among these
Basel III-compliant instruments, which trigger if a regulatory capital ratio drops below
a given threshold, the most popular contract design consists of Principal Write-Down
bonds and Contingent Convertibles, known as CoCos. Principal Write-Down bonds offer
a reduction of the principal in case of a trigger event, and represent 55% of the current
issuances (Avdjiev, Bolton, Jiang, Kartasheva, and Bogdanova, 2015). The remaining
issuances consist of CoCos, which convert into common equity when triggered. By contrast
to the rest of the world, US banks are not currently issuing this type of securities, as they
do not obtain regulatory capital treatment under US regulation. However, the single-
point-of-entry resolution mechanism under Title II of the Dodd-Frank Act would rely on
bail-in securities, which share the same economic rationale.
In theory, contingent capital instruments, first proposed by Flannery (2005), and sup-
ported by an increasing body of literature (Brunnermeier et al., 2009; Kashyap et al.,
2008; French, Baily, Campbell, Cochrane, Diamond, Duffie, Kashyap, Mishkin, Rajan,
Scharfstein, Shiller, Shin, Slaughter, Stein, and Stulz, French et al.), provide banks with
a form of insurance on their regulatory capital. This insurance mechanism could reduce
the documented frictions associated with raising equity, which are particularly acute in
times of distress (Bolton and Samama, 2012). Effective bank deleveraging through bail-in
securities which are issued during boom periods is an appealing alternative to government
bail-out, as the capital is provided when it is abundant, and the cost of financial distress
is born by investors and not taxpayers. Whether contingent capital securities, and specif-
ically write-down bonds, offer effective loss-absorption and facilitate deleveraging in times
of distress remains however a vividly debated question among practitioners, academics
and regulators (Pazarbasioglu et al., 2011; Delivorias, 2016). These instruments have in-
2
deed raised important concerns.1 First, contingent capital triggers lead to a violation of
the absolute priority rule: when the principal is written down, debt investors bear losses
before equity-holders do. Banks may therefore be willing to protect their debt investors
and avoid triggering contingent capital instruments, for instance by selling assets or even
raising equity, making them less efficient. Second, a trigger could send a negative signal on
bank balance sheet quality, which might exacerbate banks’ difficulties instead of helping
to solve them. Third, the main objective of these instruments has come under question:
how effective are these instruments at improving banks’ resilience in times of stress?2
I investigate empirically the efficiency and address concerns over contingent capital
triggers by studying the so-called liability management exercises (LMEs) by European
banks during the recent financial crisis. In the heart of the financial crisis, numerous
banks imposed losses on their subordinated debt-holders by simultaneously refusing to
call them at par at the first call date, a departure from the traditional policy of issuers for
these instruments, and by launching highly discounted tender offers. These transactions
allowed the banks to book consequent capital gains on their liabilities as core tier-one,
therefore propping up their most scrutinized regulatory capital ratio. For instance, Banco
Santander, the Spanish bank, increased its core tier-one capital by more than 4 billion
euros through these actions.
While data on the trigger of new-generation contingent capital instruments will not
be available to researchers until the next financial crisis, there are four main reasons why
liability management exercises represent an adequate laboratory for investigating these
triggers. First, the impact of LMEs on banks’ regulatory capital ratios is economically
similar to a contingent capital trigger: the capital gain on the exercise is booked as an
1The set of concerns applicable to write-down bonds is narrower than for Cocos. First, because thetriggers of principal write-down bonds are not value dilutive to existing shareholders, they do not createa risk of ”death spiral” (Sundaresan and Wang, 2015). Second, because they do not convert into equity,they are more suited to fixed income investor mandates, and limit the risk of fire sales following a trigger.
2A different type of criticism has focused on the tax treatment of these instruments, which benefit fromtax deductibility of their interests, as debt does. The argument against contingent capital is that theywould constitute a form of tax arbitrage. However, contingent capital instrument issuances do not appearto be correlated with corporate tax at the country level, with for instance a high volume of issuances inSingapore where corporate tax is low.
3
increase in core tier-one, the highest quality of regulatory capital, and the amount of
subordinated debt is reduced.3 The majority of these tenders are funded with cash, and
correspond to a principal write-down, while some are implemented through an exchange
in stocks, which is comparable to CoCos. Second, because banks use the threat of never
calling these perpetual securities, and have the discretion not to pay coupons, investors
are largely forced to accept these offers to avoid being kept in an illiquid and highly
subordinated position.4 Their situation is therefore comparable to that of contingent
capital investors facing a compulsory trigger. Third, these exercises are conducted at a
large scale and by more than 50 different banks, which allows the first and only feasible
econometric analysis of this issue before the next crisis.5 Fourth, the discretionary nature
on the issuer side of these transactions - the decision not to call the instrument and
simultaneously launching a tender offer - allows us to study revealed preferences from
banks regarding contingent capital instrument terms and trigger conditions.
The paper has three main results. First, I show that non-bankrupt European banks
are comfortable with imposing significant losses on subordinated debt holders, thereby
obtaining additional core tier-one capital but violating the absolute priority rule. Under
issuers’ threat of extending the maturity of the instruments, investors have tendered more
than EUR 110bn of hybrid bonds, which has allowed European banks to increase their
core tier-one capital by more than EUR 30bn.6 This episode represents a counter-example
to the widespread view that banks are reluctant to impose losses on debt holders, and
therefore suggests that banks will not try to avoid contingent capital triggers. LMEs
are implemented by banks with singularly low levels of regulatory capital, both in the
3See Figure 1 for more details on the regulatory and accounting balance sheet effects of LMEs andcontingent capital triggers.
4Secondary market liquidity is low for these instruments even prior to LMEs.5Banco Popular Basel-III contingent capital securities were wiped-out in June 2017. The first and
only loss on the new generation of contingent capital for investors, this event does not even allow a casestudy to judge the effectiveness of these instruments, as Banco Popular failed due to sudden losses thatwere significantly larger than its total amount of capital (common and contingent), and was consequentlyacquired by Santander for one euro. The contingent capital securities therefore did not get triggered asshareholders and all types of creditors got wiped out.
6This amount is economically large when compared to the amount of equity issuances for the sameperiod of EUR130bn.
4
cross-section and the time-series.
The second result of the paper is to document value effects consistent with LMEs
relaxing a regulatory capital constraint, and to rule out concerns over their potential
negative signal. Liability management exercises are, for the most part, received positively
by debt holders, with a more pronounced gain for subordinated creditors. Stock reaction
is more mixed and appears driven by the subset of banks that received government bail-
out. Market reaction is consistent with liability management exercises allowing banks to
relax their regulatory capital constraint in times of stress, thereby creating value that
mainly accrues to creditor.7
The third result consists in providing empirical evidence of a causal relationship be-
tween LMEs and improved capitalization levels. By instrumenting LMEs size through a
regulatory limit on hybrid bond issue prior to the crisis, I find that the improvement in
core tier-one ratio is proportional to the size of LMEs. These improvements are larger
than the core tier-one directly created by the LMEs, as LMEs are often associated with
equity issuances. This complementarity between equity issuances and LMEs suggests that
LMEs face lower frictions than the ones banks face when raising equity in times of stress.
One potential cost of LMEs, however, is that banks find it more expensive to issue a
bond shortly after, which suggests a form of stigma associated with these actions. This
finding underlines the importance of educating investors to the risk embedded in hybrid
capital instruments such as contingent capital, which bear many attributes of debt but
may incur losses before equity does.
For the purpose of my analysis, I hand-collect a comprehensive database of liability
management exercises by European banks covering the period 2008-2016. I use banks’
websites and broker coverage reports to obtain detailed data on LMEs and match this
7This regulatory capital constraint is arguably driven by both the regulator and market participants.The latter indeed scrutinize bank regulatory capital ratios, potentially affecting bank decisions before theregulatory constraint becomes binding. Under Basel II, the minimum Tier 1 ratio was 4% of risk-weightedassets, however during the crisis market participants became vocal about banks needing more capital thanthis level, and increasingly turned their attention to core tier-one ratio, which had no regulatory lowerbound.
5
data with issuer financials, security issuances, as well as credit default swaps (CDS)
and share prices. In terms of methodology, I use cross-sectional logit and panel c-logit
regressions on liability management exercises to identify the type of financial institutions
that implemented these operations. I then implement an event study methodology on
hybrid bond issuer CDS and stock prices to identify the market reaction to these exercises.
I calculate abnormal returns associated with these events for both CDS and stock price.
In a following step, I implement an instrumental variable analysis to assess the effect of
LMEs on capitalization levels while addressing potential endogeneity concerns.
This paper contributes to several fields of research. First, this work broadly relates
to the questions of bank capital structure (Admati, Demarzo, Hellwig, and Pfleiderer,
2013; DeAngelo and Stulz, 2015), bank debt overhang (Admati, DeMarzo, Hellwig, and
Pfleiderer, 2012; Philippon and Schnabl, 2013), behavior of distressed financial institutions
(Acharya et al., 2013), and bank liabilities restructuring (Colliard and Gromb, 2017).
More specifically, this paper brings empirical evidence to the debate on contingent capital
instruments as an effective alternative to raising common equity requirements, and provide
insights on how contingent capital instruments would perform in practice. The theoretical
literature on this topic has explored several possible designs for such instruments, and
provides both arguments in favor of contingent capital (Pennacchi, Vermaelen, and Wolff,
2014; Martynova and Perotti, 2017; Zeng, 2012; Flannery, 2010; Duffie, 2010) and against
it (Sundaresan and Wang, 2015; Chan and van Wijnbergen, 2016). On the other hand,
empirical work remains scarce. The closest work to my study is Avdjiev, Bolton, Jiang,
Kartasheva, and Bogdanova (2015), who explore the effects of the issuances of contingent
capital instruments on bank funding cost, and find evidence consistent with a reduction in
banks’ credit risk. Another recent empirical work from Berg and Kaserer (2015) explores
CoCos secondary trading prices to investigate their impact on risk-taking.
Second, my work contributes to the literature on financial innovation. An established
literature studies the impact of innovative assets such as securitization on bank balance
sheets (Loutskina, 2011), but my work underlines the importance of innovative liabili-
6
ties. Although some innovative liability instruments may be driven by adverse incentives
(Perignon and Vallee, 2017), contingent capital instruments illustrate how innovative in-
struments on the liabilities side of the balance sheet may help address frictions in bank
access to capital (Bolton and Samama, 2012), potentially preventing or at least mitigating
future financial crises (Haliassos, 2013).
Last, this study expands the knowledge of bank subordinated debt and preferred se-
curities (Krishnan and Laux, 2005; Benston, Irvine, Rosenfeld, and Sinkey, 2003; Boyson,
Fahlenbrach, and Stulz, 2016).
This paper is organized as follows: Section 2 provides background on liability manage-
ment exercises. Section 3 develops the hypotheses. Section 4 presents the dataset built
for the empirical analysis, and documents the extent of LMEs and which banks imple-
ment them. Section 5 studies the market reaction to liability management exercises from
both debt and equity holders, while Section 6 analyzes whether and how LMEs improve
capitalization levels. Section 7 studies the potential cost of LMEs. Section 8 concludes.
2 Background on Liability Management Exercises
2.1 The European Hybrid Bond Market in the Run-up to the
Crisis
In 1998, the Basel committee modified its bank capital rules by clarifying its position con-
cerning hybrid instruments and their eligibility as regulatory capital.8 This announcement
followed an increasing number of innovative hybrid instrument issuances: fixed income
instruments with repayment in 5 to 10 years, which granted them coupon tax deductibil-
ity, but embedded an option to postpone repayment for a very long horizon or even until
perpetuity. This option allows transforming debt-like security into loss absorbing claims
quasi-similar to preferred shares: non-compulsory coupon payments, infinite maturity and
8Source: www.bis.org/press/p981027.htm.
7
no voting rights. The tax deductibility, the absence of covenants, and the non-dilutive
nature of these instruments made them an attractive alternative to equity for banks.
When marketing the hybrid bonds to investors, issuers strongly hinted at their deter-
mination to always honor the call option and to repay the bond in full as soon as the first
call date would be reached. Around 40% of the hybrid bonds also include a commitment
device in the form of a step-up clause: the coupon increases by a pre-determined margin
when the repayment is postponed.9 Calling hybrid bonds at the first call date was the
standard practice before the financial crisis. No exception occurred until the end of 2008,
nor was there any expectation of non-calls, as can be inferred from security prices at
issuance. Thus, Moody’s (2009) writes: “Prior to the financial crisis, there was a tacit
agreement between an issuer and investors that hybrid and subordinated debt would be
called at the first call date”.
Hybrid bonds gained investor interest as they offered higher yields than senior bonds,
due to their junior status that ranks them senior only to equity. Fixed income funds were
allowed to invest in hybrid bonds, and hybrid bonds became a popular investment among
fixed income asset managers seeking to increase fund performance.10 Retail investors are
also increasingly attracted to this type of subordinated instruments, as they appreciate
the fixed coupon format and the issuers’ reputation. The development of EUR 1,000
denominated bonds, vs. EUR 50,000 and EUR 100,000 denominations targeted at insti-
tutional investors, made it easier for retail investors to access the hybrid bond market.
When assessing financial institutions’ creditworthiness, rating agencies classified hybrid
bonds as equity, which also fostered hybrid bond market development. The market has
met a strong growth since its inception, with issuances rising from EUR2bn in 1998 to
EUR105bn in 2008. The amount of issuances was however limited by country-level limits
on the share of regulatory capital that could be made of hybrid bonds (see Table A4 in
9A step-up clause typically switches the coupon from fixed rate to variable rate and increases thecoupon credit margin by 100 bps after the first call date.
10Deutsche Bank research desk writes “Real money managers are the largest buyers of T1[bonds]”(Bhimalingam and Burns (2011)).
8
the appendix).
2.2 Liability Management Exercises
When the crisis hit and refinancing costs surged for financial institutions, banks reconsid-
ered their call strategy. The watershed event was on December 16, 2008, in the midst of
the financial turmoil: Deutsche Bank announced that it was not calling its lower tier-two
notes with first call date on January 2009. This first announcement of a non-call of a
hybrid bond took many investors by surprise, and was poorly received by market opera-
tors, with some investors threatening to cease subscription to any future debt and equity
issuance from Deutsche Bank.11 Following this announcement by one of Europe’s leading
banks, not calling hybrid bonds became increasingly frequent in 2009 and the following
years.
Starting in summer 2009, European financial institutions implemented so-called liabil-
ity management exercises (henceforth LMEs) by simultaneously not calling their hybrid
bonds and launching tender offers on them.12 The non-call, whether anticipated or not,
typically leads the bond to trade at a significant discount, as investors become the holder
of a deeply subordinated perpetual bond with non-compulsory coupons during a time of
stress. The tender offer is thus realized at a significant discount which allows the financial
institution to book the difference between nominal and tender price as a capital gain.
The tender gain feeds into core tier-one capital, and crystallizes losses of hybrid bond
holders, who typically follow a buy-and-hold strategy. Precisely measuring the creation
of core tier-one is possible as it corresponds to the accounting gain booked by the is-
suer as a result of liability management exercise. The issuer can offer payment in cash
through a cash tender, or in new securities through an exchange offer for either stocks
11For instance, Bank of China writes in a letter to every European bank following DeutscheBank decision: “any non-call by a given institution will result in that institution’s debt (not justlower tier 2 but senior and tier 1 as well) being ineligible for future investment consideration”. Source: http://www.independent.co.uk/news/business/news/bank-of-china-furious-at-deutsche-debt-move-1207511.html.
12Explicit reference to non-call policy appears in the majority of offer announcement. Source: BarclaysResearch.
9
or bonds. Such transaction mainly included tier-one and tier-two instruments, as well as
senior instruments, although the latter is rare.13
Some of the LMEs were implemented as a Dutch tender offer. A Dutch tender offer
operates like an auction; the bank offers to repurchase the hybrid bonds within a given
price range. Shareholders are invited to tender shares over a given period, and do so by
specifying the lowest price within the range that they will accept. Santander was the first
bank to implement a Dutch tender offer.
2.3 LMEs and Contingent Capital Triggers Regulatory and Ac-
counting Treatment
A close parallel can be drawn between the impact of LMEs, which create core tier-one
capital, and the trigger of the two most issued forms of contingent capital instruments.
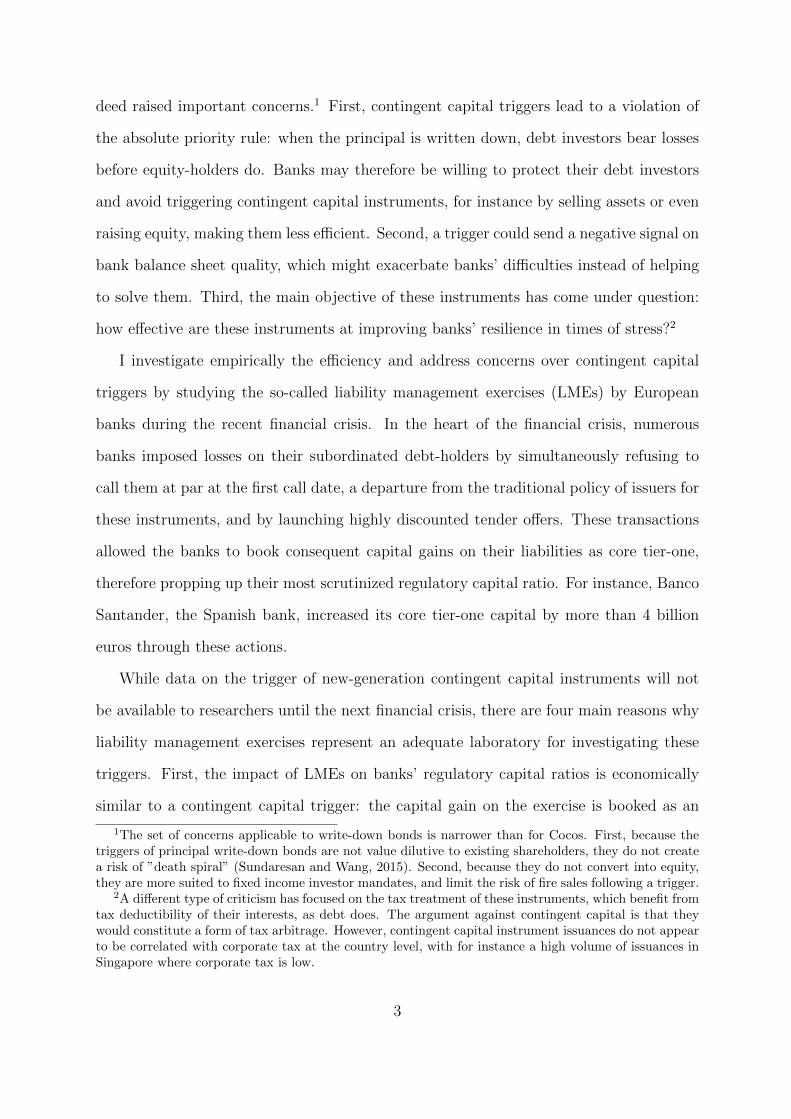
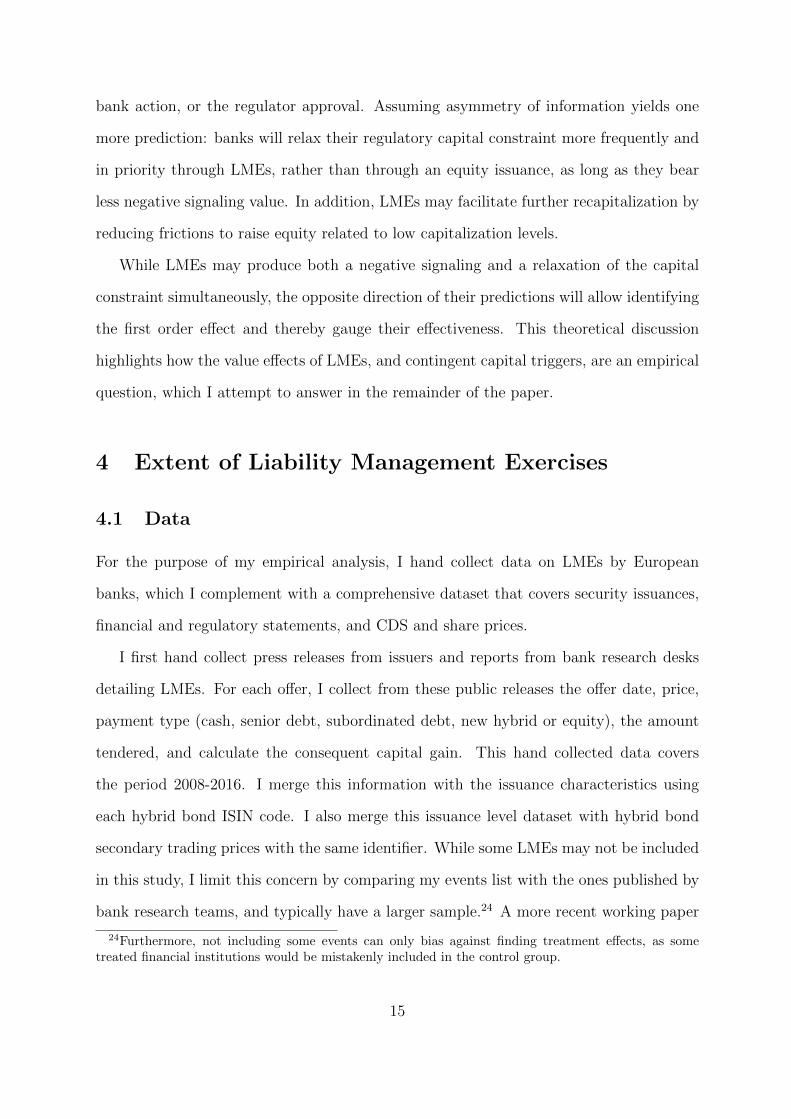
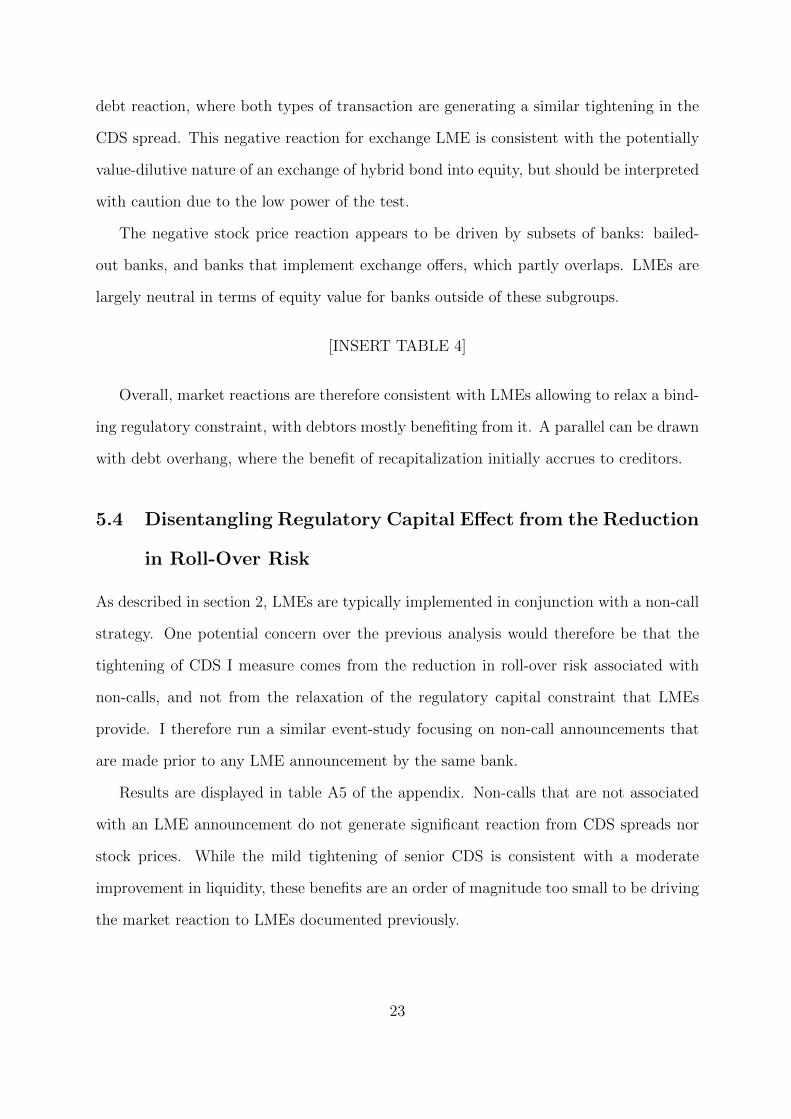
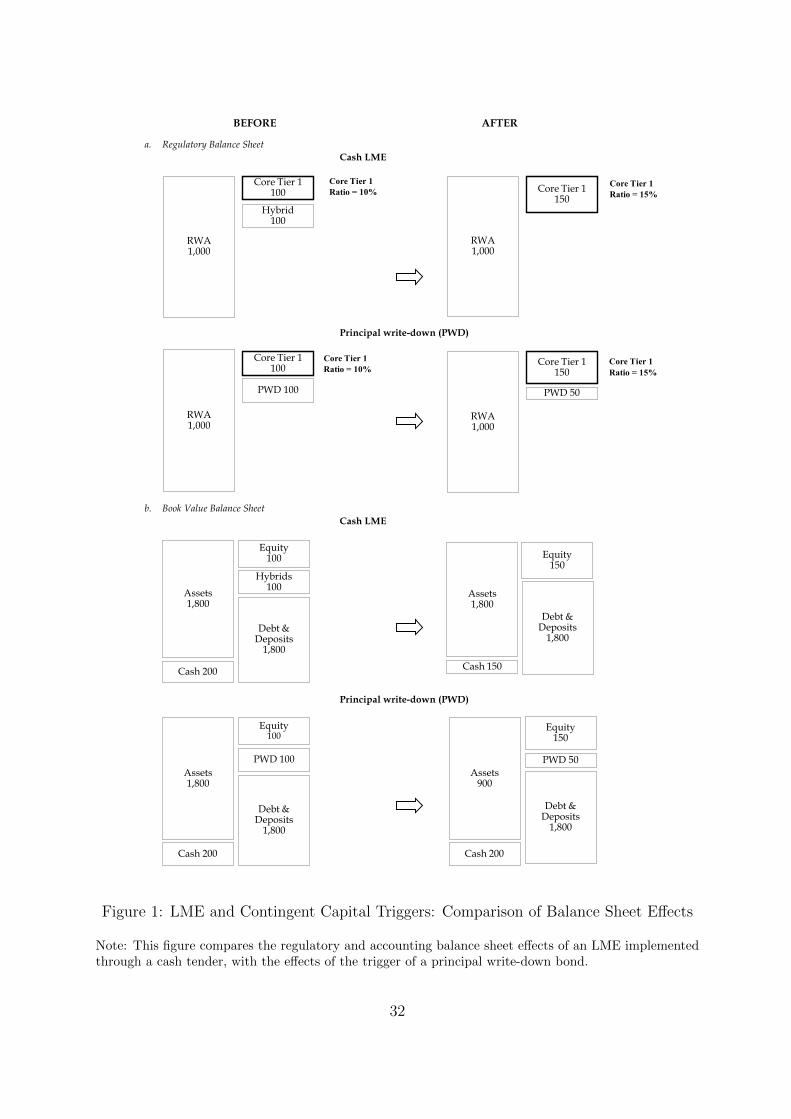
Figure 1 compares the impact of cash tender LMEs and the trigger of principal write-
down bonds on the regulatory and accounting balance sheets of banks. Figure 1 in the
appendix conducts the same comparison exercise for LMEs relying on exchange offer and
triggers of CoCos.14
[INSERT FIGURE 1]
First, panel A of Figure 1 illustrates how the treatment on the main indicator of the
regulatory balance sheet, the core tier-one ratio, is exactly similar for LMEs and the
trigger of principal write-down bonds. This similarity is the main rationale for studying
LMEs to educate our knowledge of contingent capital trigger. Banks’ core tier-one ratio
is scrutinized by both regulators and market participants.
13The seniority, as well as the lack of extension option for the issuer, mean that senior debt do not tradeat large discounts, making them less appealing for this type of transactions. However, Deutsche Banklaunched a large senior debt buy-back in February 2016 to alleviate investors concern over its liquidityposition, which proved successful in supporting its stock price but had negligible effect on its capitallevels.
14The majority of contingent capital instruments currently being issued are principal write down bonds.See Avdjiev et al. (2015).
10
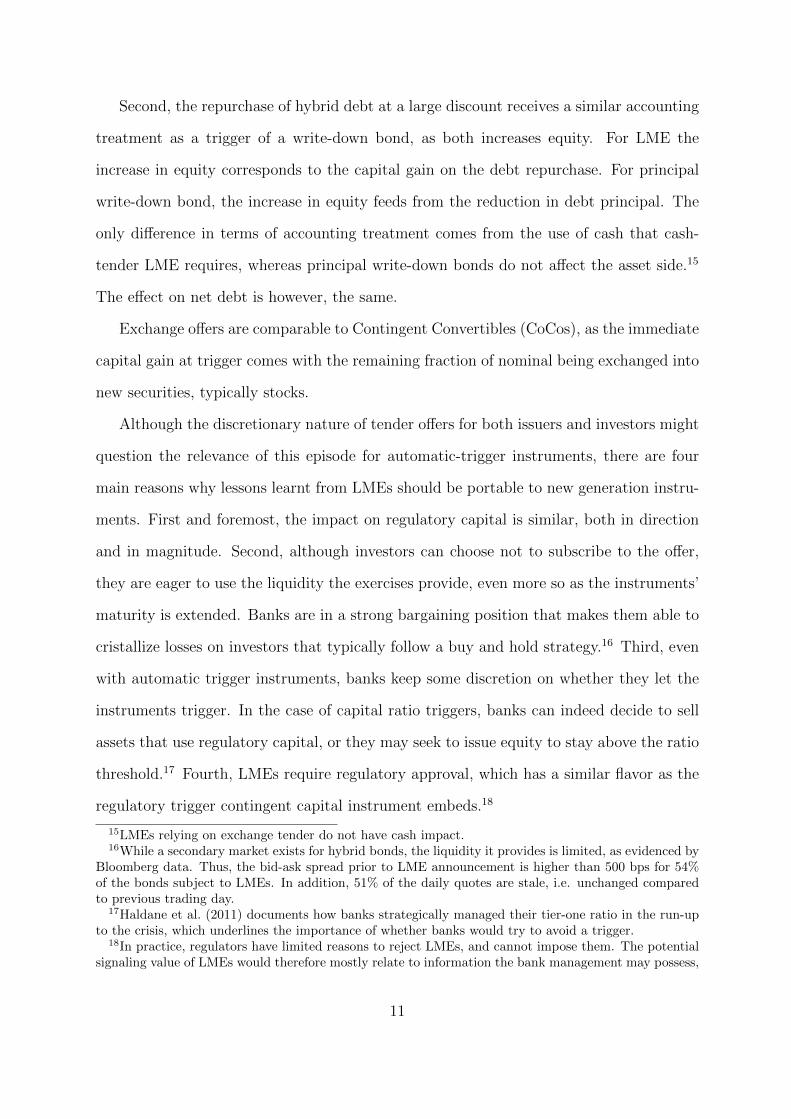
Second, the repurchase of hybrid debt at a large discount receives a similar accounting
treatment as a trigger of a write-down bond, as both increases equity. For LME the
increase in equity corresponds to the capital gain on the debt repurchase. For principal
write-down bond, the increase in equity feeds from the reduction in debt principal. The
only difference in terms of accounting treatment comes from the use of cash that cash-
tender LME requires, whereas principal write-down bonds do not affect the asset side.15
The effect on net debt is however, the same.
Exchange offers are comparable to Contingent Convertibles (CoCos), as the immediate
capital gain at trigger comes with the remaining fraction of nominal being exchanged into
new securities, typically stocks.
Although the discretionary nature of tender offers for both issuers and investors might
question the relevance of this episode for automatic-trigger instruments, there are four
main reasons why lessons learnt from LMEs should be portable to new generation instru-
ments. First and foremost, the impact on regulatory capital is similar, both in direction
and in magnitude. Second, although investors can choose not to subscribe to the offer,
they are eager to use the liquidity the exercises provide, even more so as the instruments’
maturity is extended. Banks are in a strong bargaining position that makes them able to
cristallize losses on investors that typically follow a buy and hold strategy.16 Third, even
with automatic trigger instruments, banks keep some discretion on whether they let the
instruments trigger. In the case of capital ratio triggers, banks can indeed decide to sell
assets that use regulatory capital, or they may seek to issue equity to stay above the ratio
threshold.17 Fourth, LMEs require regulatory approval, which has a similar flavor as the
regulatory trigger contingent capital instrument embeds.18
15LMEs relying on exchange tender do not have cash impact.16While a secondary market exists for hybrid bonds, the liquidity it provides is limited, as evidenced by
Bloomberg data. Thus, the bid-ask spread prior to LME announcement is higher than 500 bps for 54%of the bonds subject to LMEs. In addition, 51% of the daily quotes are stale, i.e. unchanged comparedto previous trading day.
17Haldane et al. (2011) documents how banks strategically managed their tier-one ratio in the run-upto the crisis, which underlines the importance of whether banks would try to avoid a trigger.
18In practice, regulators have limited reasons to reject LMEs, and cannot impose them. The potentialsignaling value of LMEs would therefore mostly relate to information the bank management may possess,
11
An additional concern over the portability of the results comes from the potential
cash drain that LMEs may generate, as the trigger of write-down bonds and Cocos do
not generate such effect. To mitigate this concern, I compare the cash used by cash
LMEs and the amount of cash and its equivalent banks have on their balance sheet
before implementing the LME. I observe that for the majority of cash LME users, the
cash used by the LME is less than 10% of the cash the bank holds on its balance sheet,
suggesting that any value effect of a liquidity drain would be quantitatively small (see
figure A2 in the appendix). Moreover, this potential effect can only bias negatively value
effects, and therefore makes the empirical setup conservative to measure the positive effect
of a relaxation of the regulatory capital constraint. Last, LMEs implemented through
exchange offers offer a counterfactual with no impact on cash.
2.4 Comparing Europe and the United States
There has been almost no occurrence of liability management exercises by US banks,
despite the existence of largely comparable subordinated debt, Trust Preferred Securities
(TPS). This lack of LMEs likely comes from relatively higher trading prices, often above
par, which lead US issuers to call them at par at first possible date. Some issuers used
the regulatory call clause to call these bonds at par earlier and refinance with cheaper
securities.19
Despite the financial crisis, the majority of US bank Trust Preferred Securities (TPS)
traded above par, which can be rationalized with the combination of a drop in interest
rate, bail-out guarantees, and a more protective legal documentation that discouraged
non-calls. TPS are cumulative and include a dividend stopper clause, meaning that US
investors are better protected against non payment of coupon and principal than European
and in a lesser extent on information the regulator may possess.19The regulatory call clause allows issuer to call at any time at par if the instrument loses regulatory
capital treatment. This clause is present in the documentation of all Trust Preferred Securities and hybridbonds. The regulatory calls were made possible by the implementation of the Dodd Frank Act, whichchanged the regulatory treatment of TPS securities.
12
ones.20 Europe is therefore the only possible laboratory for this study.
Another important difference between the two continents is that US banks are not
currently issuing contingent capital instruments, as US regulators do not provide favorable
regulatory capital treatment. Obtaining interest tax deductibility for contingent capital
might also prove difficult under the current US tax regime. However, US banks’ new
resolution system of single point of entry actually represents a mechanism similar to
gone-concern contingent capital. This resolution system might be a precursor of further
development of contingent capital instruments in the US.
3 Hypotheses
The main purpose of this paper is to analyze the value and regulatory balance sheet effects
of liability management exercises, to understand through their prism the effectiveness of
contingent capital instruments to achieve an efficient deleveraging in times of distress.
I build on capital structure theory, more precisely on Modigliani and Miller (1958) and
some of its variations, to structure my empirical analysis. The relevance of this seminal
framework to financial institutions has been recently reinforced by the work of Admati
et al. (2013). While financial institutions possess specific features that deviate from the
perfect capital markets assumptions of this framework, this theory provides us with a
useful benchmark to develop theoretical predictions for the value impact of LME. The
assumptions of Modigliani-Miller can then be relaxed to better reflect financial institu-
tion specific characteristics. Predictions from this framework are arguably applicable to
contingent capital triggers, as the effect on the regulatory and accounting balance sheets
are almost identical, as described in the previous section.
Under the Modigliani and Miller (1958) framework, the change in the capital structure
-namely the increase in book common equity- that an LME generates should not have
20Cumulative coupons means that any skipped coupons are accumulated to be paid in the future, atthe latest at redemption date. Under a dividend stopper, for a specified period of time (the stopperperiod), the issuer cannot pay a coupon on another security or class of securities, typically stocks, if itdoes not pay a coupon on the security in question.
13
any impact on bank firm value, nor on relative debt and stock prices, as capital structure
is irrelevant to firm value. The immediate testable prediction one can derive is that
under the Modigliani-Miller framework, debt and equity value should not react to LMEs
announcement.21 The only effect of LMEs would be to crystallize already existing losses
(in market value) for hybrid-bond holders.
If one now assumes that banks face a constraint on their level of regulatory capital
ratio, this prediction changes and one should anticipate a positive impact of LMEs on
bank debt value, as well as potentially on equity.22 When the regulatory capital con-
straint becomes binding, it limits bank ability to implement NPV-positive projects. As
described in the previous subsection, LMEs increase the amount of core tier-one capital,
and therefore relax this constraint. Such relaxation should therefore increase the bank
firm value, which would first accrue to debt holders as the bank is in financial distress, and
then to equity holders. Hybrid bonds are junior to both senior and subordinated debt,
meaning that their redemption does not improve the position of traditional bondholders
in the creditor waterfall. A positive impact on bond price can therefore only result from
a higher firm value, and not from an improved claim on the underlying assets.
Under asymmetry of information (Myers and Majluf, 1984), LMEs could however be
perceived as a negative signal, revealing negative information not contained in the financial
statements. Such a signal would lead to a negative impact on the firm value, affecting
both debt and equity value.23 This inference on private information may result from the
21This prediction on debt and equity value does not hold if one introduces departures from theModigliani-Miller framework. First, if LMEs are realized at a large discount to the market value ofhybrid bonds, which would create a transfer of value from hybrid-bond holders to other capital providers.However, I observe that LMEs are on average realized at a modest premium to the last trading prices.Second, LMEs could represent a transfer of value from debtors to equity holders, whose interest manage-ment typically prioritizes. Such a transfer would predict LMEs to have a negative effect on debt value,and positive effect on the equity value. This transfer could result from using cash on which debtors havefirst claim to generate capital gain that accrue to equity holders.
22In practice, the regulatory capital constraint may be a hard one, as enforced by the regulator, ora soft one. If capital providers focus on regulatory capital ratios as a meaningful indicator of financialstrength when making their investment decision, banks will cater to this market preference and prioritizeit over other projects.
23An alternative signal, when implementing a cash tender, would be that the bank has the sufficientcash to conduct this operation. This is less likely to matter as European banks had satisfying liquiditypositions, and the cash needed for these transactions is limited.
14
bank action, or the regulator approval. Assuming asymmetry of information yields one
more prediction: banks will relax their regulatory capital constraint more frequently and
in priority through LMEs, rather than through an equity issuance, as long as they bear
less negative signaling value. In addition, LMEs may facilitate further recapitalization by
reducing frictions to raise equity related to low capitalization levels.
While LMEs may produce both a negative signaling and a relaxation of the capital
constraint simultaneously, the opposite direction of their predictions will allow identifying
the first order effect and thereby gauge their effectiveness. This theoretical discussion
highlights how the value effects of LMEs, and contingent capital triggers, are an empirical
question, which I attempt to answer in the remainder of the paper.
4 Extent of Liability Management Exercises
4.1 Data
For the purpose of my empirical analysis, I hand collect data on LMEs by European
banks, which I complement with a comprehensive dataset that covers security issuances,
financial and regulatory statements, and CDS and share prices.
I first hand collect press releases from issuers and reports from bank research desks
detailing LMEs. For each offer, I collect from these public releases the offer date, price,
payment type (cash, senior debt, subordinated debt, new hybrid or equity), the amount
tendered, and calculate the consequent capital gain. This hand collected data covers
the period 2008-2016. I merge this information with the issuance characteristics using
each hybrid bond ISIN code. I also merge this issuance level dataset with hybrid bond
secondary trading prices with the same identifier. While some LMEs may not be included
in this study, I limit this concern by comparing my events list with the ones published by
bank research teams, and typically have a larger sample.24 A more recent working paper
24Furthermore, not including some events can only bias against finding treatment effects, as sometreated financial institutions would be mistakenly included in the control group.
15
by Lubberink and Renders (2016), which uses data collected by investment bank DCM
desks, allows for an additional cross-check of the quality of the hand-collection exercise.
I then compile a dataset of the whole universe of hybrid issuances in Europe over the
period 1998 to 2012.25 I extract the characteristics of every hybrid bond issuance over the
sample period from Dealogic DCM Analytics and Bloomberg. I merge these two sources
using each bond’s unique ISIN identifier. I complement this data with hand-collected
information from issuers websites and broker reports.
As required for my event study I merge manually by issuer name and country the
liability management data with issuer senior and subordinated CDS spreads and stock
prices from Datastream. Finally, I integrate balance sheet information from Bankscope
and from the 2011 and 2014 EBA stress test data through additional manual mergers by
name of holding company. I convert variables of interest of Bankscope into euros.26
4.2 Summary Statistics
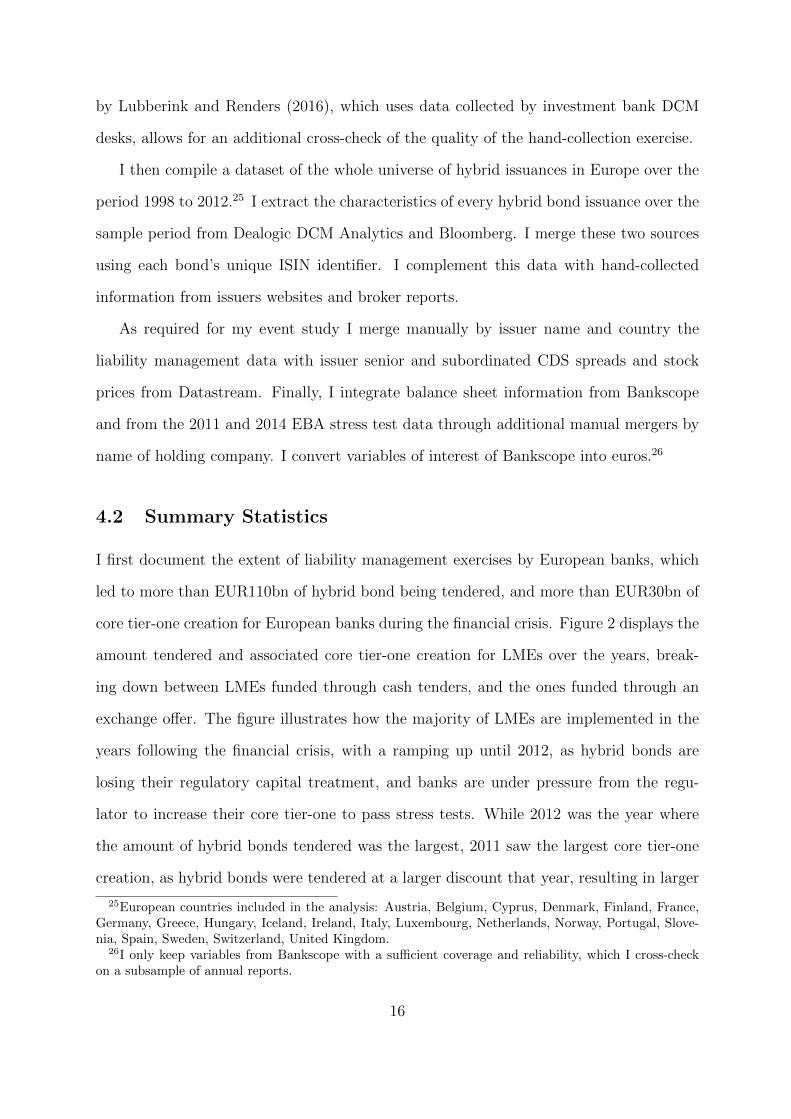
I first document the extent of liability management exercises by European banks, which
led to more than EUR110bn of hybrid bond being tendered, and more than EUR30bn of
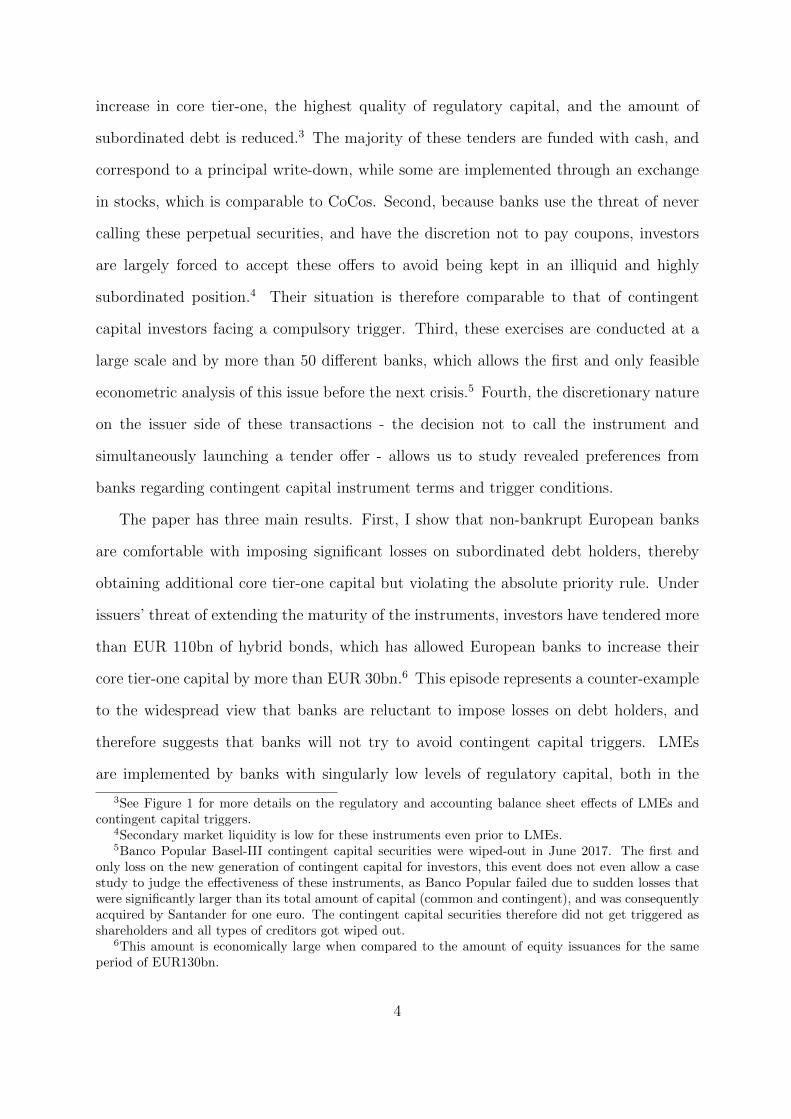
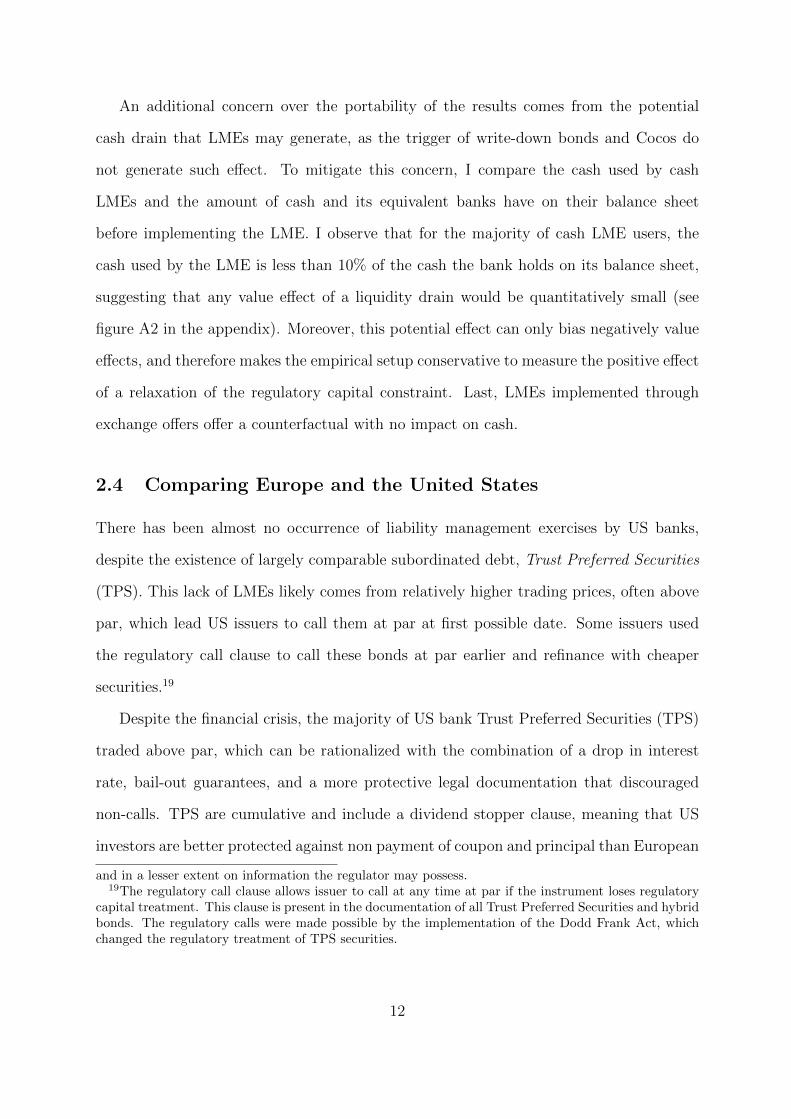
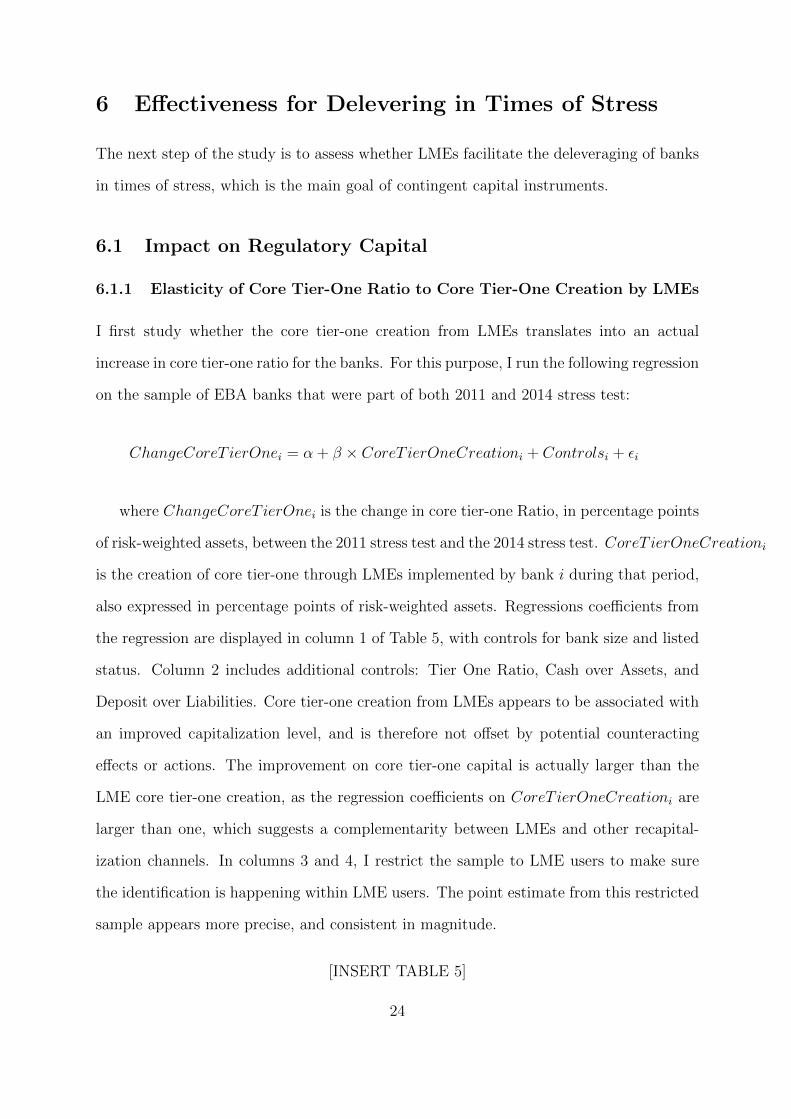
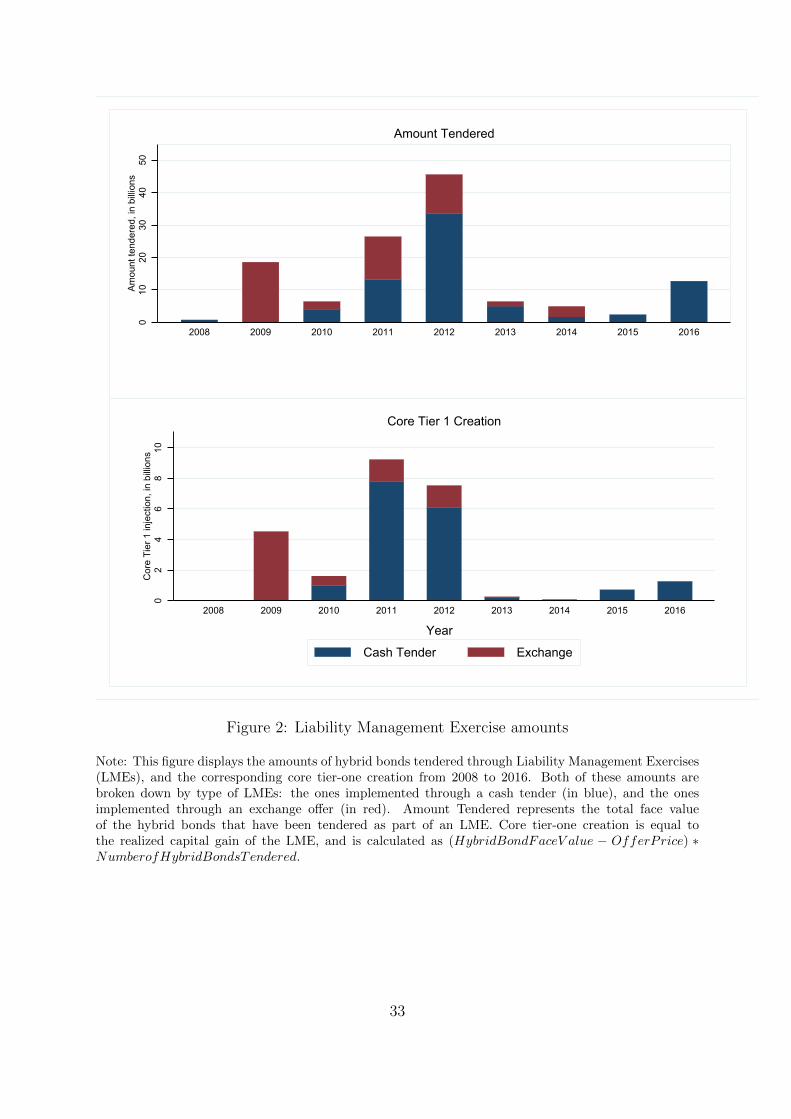
core tier-one creation for European banks during the financial crisis. Figure 2 displays the
amount tendered and associated core tier-one creation for LMEs over the years, break-
ing down between LMEs funded through cash tenders, and the ones funded through an
exchange offer. The figure illustrates how the majority of LMEs are implemented in the
years following the financial crisis, with a ramping up until 2012, as hybrid bonds are
losing their regulatory capital treatment, and banks are under pressure from the regu-
lator to increase their core tier-one to pass stress tests. While 2012 was the year where
the amount of hybrid bonds tendered was the largest, 2011 saw the largest core tier-one
creation, as hybrid bonds were tendered at a larger discount that year, resulting in larger
25European countries included in the analysis: Austria, Belgium, Cyprus, Denmark, Finland, France,Germany, Greece, Hungary, Iceland, Ireland, Italy, Luxembourg, Netherlands, Norway, Portugal, Slove-nia, Spain, Sweden, Switzerland, United Kingdom.
26I only keep variables from Bankscope with a sufficient coverage and reliability, which I cross-checkon a subsample of annual reports.
16
capital gains. Exchange offers, initially the predominant way of implementing tenders,
become less popular as time passes by, while cash tenders gain traction.
[INSERT FIGURE1]
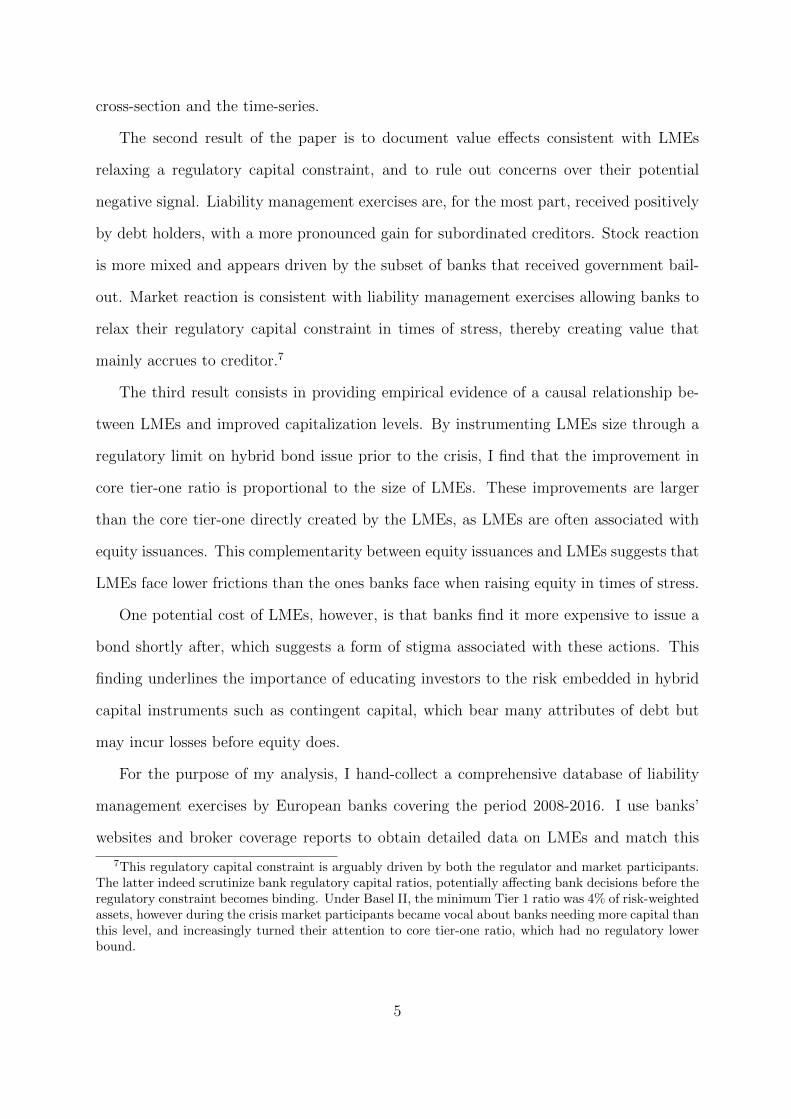
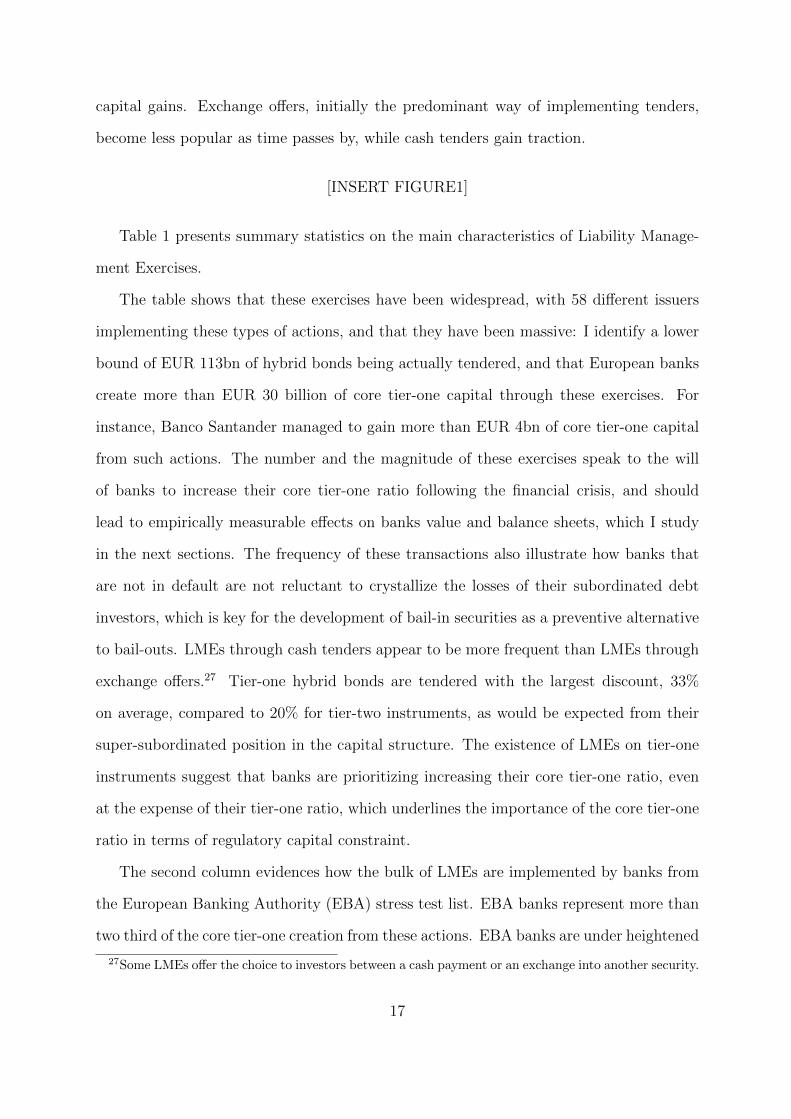
Table 1 presents summary statistics on the main characteristics of Liability Manage-
ment Exercises.
The table shows that these exercises have been widespread, with 58 different issuers
implementing these types of actions, and that they have been massive: I identify a lower
bound of EUR 113bn of hybrid bonds being actually tendered, and that European banks
create more than EUR 30 billion of core tier-one capital through these exercises. For
instance, Banco Santander managed to gain more than EUR 4bn of core tier-one capital
from such actions. The number and the magnitude of these exercises speak to the will
of banks to increase their core tier-one ratio following the financial crisis, and should
lead to empirically measurable effects on banks value and balance sheets, which I study
in the next sections. The frequency of these transactions also illustrate how banks that
are not in default are not reluctant to crystallize the losses of their subordinated debt
investors, which is key for the development of bail-in securities as a preventive alternative
to bail-outs. LMEs through cash tenders appear to be more frequent than LMEs through
exchange offers.27 Tier-one hybrid bonds are tendered with the largest discount, 33%
on average, compared to 20% for tier-two instruments, as would be expected from their
super-subordinated position in the capital structure. The existence of LMEs on tier-one
instruments suggest that banks are prioritizing increasing their core tier-one ratio, even
at the expense of their tier-one ratio, which underlines the importance of the core tier-one
ratio in terms of regulatory capital constraint.
The second column evidences how the bulk of LMEs are implemented by banks from
the European Banking Authority (EBA) stress test list. EBA banks represent more than
two third of the core tier-one creation from these actions. EBA banks are under heightened
27Some LMEs offer the choice to investors between a cash payment or an exchange into another security.
17
scrutiny from the regulator to maintain a resilient balance sheet, due to their systemic
nature, which likely encouraged them to implement LMEs.
[INSERT TABLE 1]
4.3 LME User Characteristics in the Cross-Section and Time-
series
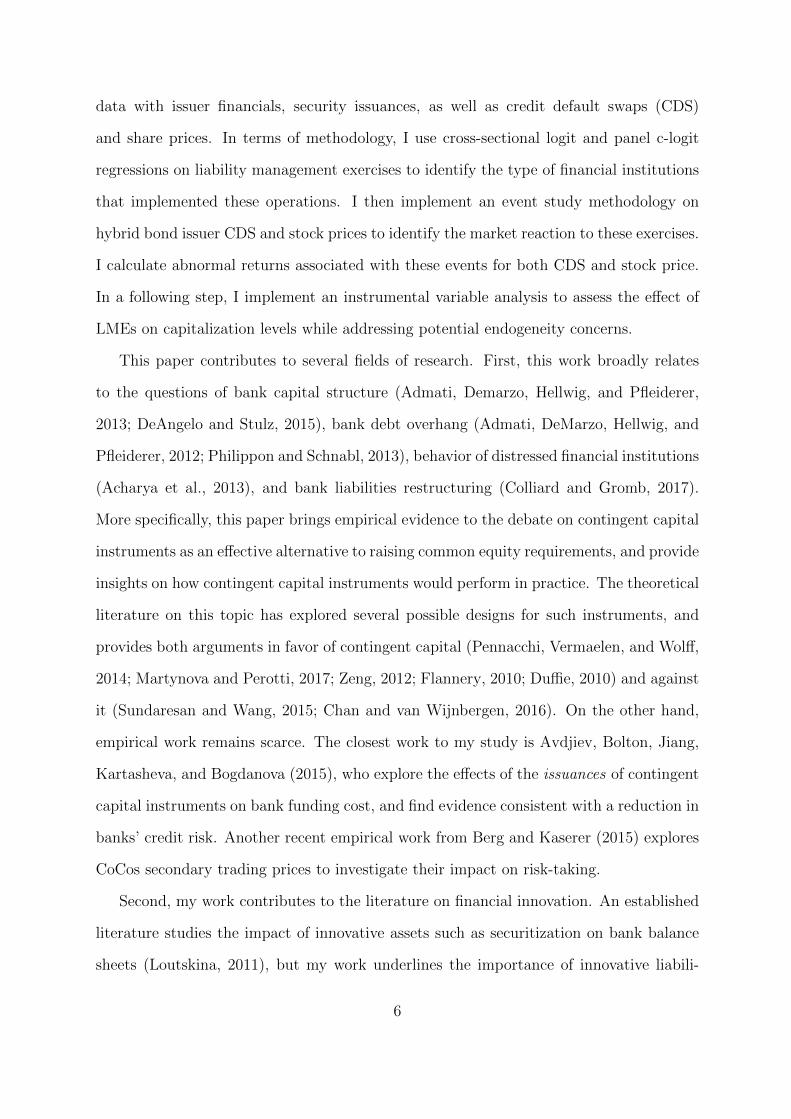
I first test whether LMEs are associated with low level of regulatory capital, and find it to
be the case both in the cross-section and the time-series. Banks with low regulatory capital
ratios likely face a regulatory capital constraint, and are therefore eager to implement
actions allowing them to relax it.
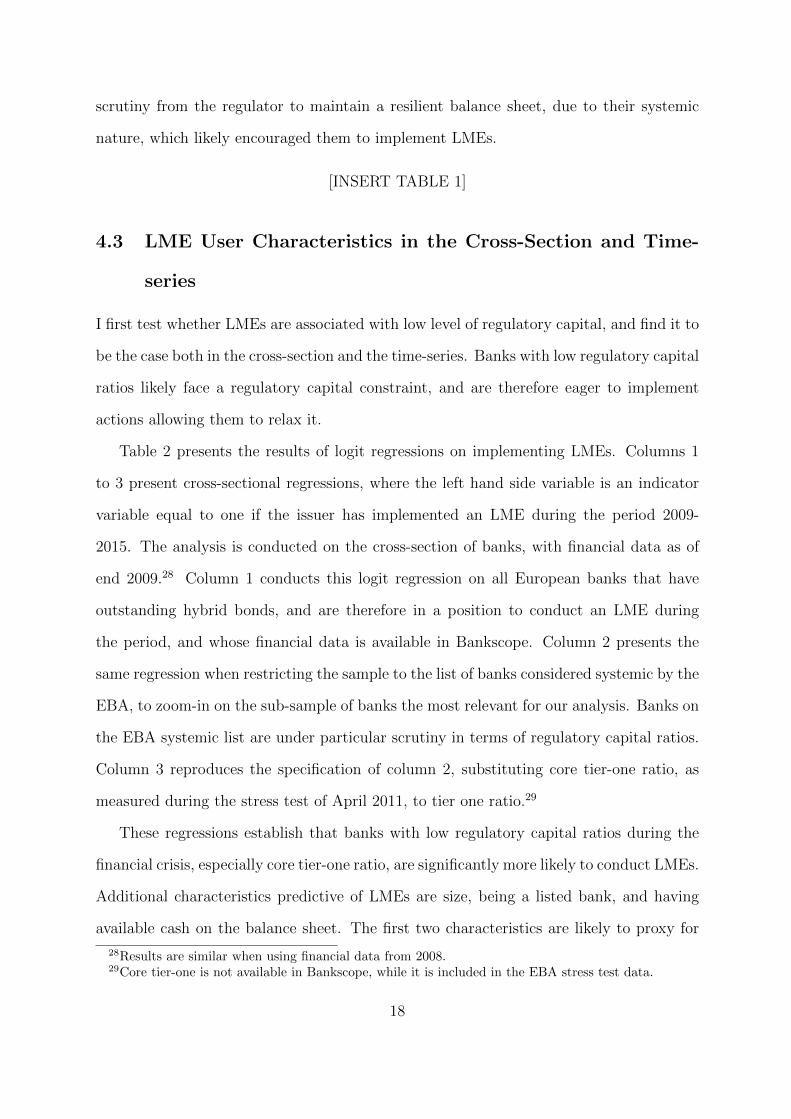
Table 2 presents the results of logit regressions on implementing LMEs. Columns 1
to 3 present cross-sectional regressions, where the left hand side variable is an indicator
variable equal to one if the issuer has implemented an LME during the period 2009-
2015. The analysis is conducted on the cross-section of banks, with financial data as of
end 2009.28 Column 1 conducts this logit regression on all European banks that have
outstanding hybrid bonds, and are therefore in a position to conduct an LME during
the period, and whose financial data is available in Bankscope. Column 2 presents the
same regression when restricting the sample to the list of banks considered systemic by the
EBA, to zoom-in on the sub-sample of banks the most relevant for our analysis. Banks on
the EBA systemic list are under particular scrutiny in terms of regulatory capital ratios.
Column 3 reproduces the specification of column 2, substituting core tier-one ratio, as
measured during the stress test of April 2011, to tier one ratio.29
These regressions establish that banks with low regulatory capital ratios during the
financial crisis, especially core tier-one ratio, are significantly more likely to conduct LMEs.
Additional characteristics predictive of LMEs are size, being a listed bank, and having
available cash on the balance sheet. The first two characteristics are likely to proxy for
28Results are similar when using financial data from 2008.29Core tier-one is not available in Bankscope, while it is included in the EBA stress test data.
18
regulator and investor attention to capital levels, while the latter can be rationalized by
the need for some liquidity to conduct a cash LME.
In column 4, I explore whether certain issuers are more likely to conduct an LME
funded through an exchange offer, which do not require any liquidity. I observe that
banks with the lowest level of capital among LME users are more likely to choose this
form of LME, while available cash has no predictive power.30
I then turn to a panel analysis, by running c-logit regressions on doing an LME in a
given year, using financial characteristics as per the previous annual closing as explanatory
variables. Column 4 and 5 present coefficients from these regressions using two samples:
hybrid issuers, and EBA banks. This analysis, which controls for bank fixed effects, shows
that a drop in regulatory capital, as well as a reduction in assets, is associated with a
higher probability of implementing an LME.
Altogether, these results are supportive of LMEs being a widespread method for banks
under stress to improve their core tier-one ratio. This motive is also brought forward in the
press releases for these transactions. The next section explores the value effects of LMEs
to test whether they are consistent with a relaxation of the regulatory capital constraint.
[INSERT TABLE 2]
5 Market Reaction to Liability Management Exer-
cises
This section investigates the value effects of LMEs on CDS and stock prices, and confronts
them to the predictions derived in section 3. Overall, the market reaction to LMEs is
consistent with an increase in firm value due to a relaxation of the regulatory capital
constraint, which accrues to bondholders. On the other hand, these value effects are
30A large share of these banks received a government bailout, and the regulator forced them to choosethis type of LMEs so as not to give the impression of distributing liquidity obtained from the bail-out toinvestors.
19
not consistent with LMEs creating a negative signal on the quality of the banks balance
sheet, which is one of the main concerns raised against contingent capital instruments
(Pazarbasioglu et al., 2011).
5.1 Methodology
For this analysis, I follow the event-study methodology of Brown and Warner (1985) and
MacKinlay (1997). The identification strategy of this event study relies on the semi-
strong form of market efficiency: market reaction is driven by information made public at
the time of the LME announcement. Although a small number of liability management
exercises are made in conjunction with other issuer specific news, typically for bailed-out
banks, the large majority of them are announced independently from any other corporate
events, as observed on issuer press releases.31
I use change in Credit Default Swap (CDS) spreads (both senior and subordinated)
to measure debt value reaction to LMEs. CDS are more liquid than bonds, which limits
measurement errors.32 For the equity value reaction, I examine the stock prices of listed
banks. Cumulative abnormal returns are the sum of abnormal returns over the considered
windows: over a -1/+1 day window.33
I calculate adjusted returns of CDS as the change in a given issuer spread minus the
change in its benchmark index. This adjustment is comparable with the rating adjusted
spread used in Jorion and Zhang (2007). Stock abnormal returns are calculated based on
the CAPM model, using the benchmark as the market index. Stock betas are estimated
prior to the LME events, over a window of 200 days starting on January 1st, 2008.34
To ensure the robustness of the analysis, I implement three specifications on market
reaction on the announcement of the LME, which I complement with a falsification test.
I first look at the raw market reaction, and then adjust for two benchmarks: a broad
31Robustness checks of the event study excludes bailed-out banks for this reason.32This methodology is used, for instance, in Jorion and Zhang (2007).33Results are similar with a [-2,+2] window.34Results detailed below are robust to using stock adjusted returns, calculated by subtracting the
benchmark index performance to the stock performance.
20
benchmark (iTraxx Financial for CDS and Euro Stoxx 50 for stocks) and a benchmark
built with the other LME users, for maximum comparability.
As a falsification test, I look at market reaction 50 days before the announcement of
an LME, therefore at a time where no significant information is made public.
5.2 CDS Spreads Reaction
Table A5 presents the average reaction of CDS spreads to LMEs. LMEs have a tighten-
ing effect on issuer CDS spreads, meaning investors perceive issuer credit quality to be
improved by LMEs, which is consistent with a relaxation of the regulatory capital con-
straint. The effect on issuer CDS spread is statistically and economically significant for
both senior and subordinated CDS.35 The larger magnitude of subordinated CDS reaction
is consistent with these securities being more information sensitive than senior CDS, as
well as less influenced by so-called too-big-to-fail government put options.36 This result
is robust to the three specifications for market reaction: raw change in CDS spread, and
change adjusted by iTraxx Financial change, and by the average CDS spread change for
LME users. On the other hand, there is no statistical significance on the falsification test.
A potential cash drain effect would bias against a CDS spread tightening, as reducing
the liquid assets of the bank can only weaken the position of its creditors. The empirical
setting is therefore conservative when estimating the effect. However, cash LMEs only
consume a small fraction of the liquid assets on the bank balance sheets, typically less
than 10% (see Figure A2 in the appendix), making this bias likely of second order.
I then restrict the sample of the event study to EBA banks and observe comparable
results, which ensures that small banks do not drive this result.
I also explore whether the type of LME matter for CDS spread reaction. LMEs funded
by cash appear to be associated with a more pronounced CDS spread tightening than the
35Tender offers might decrease the liquidity of some of the underlying bonds. Such an effect would notnecessarily affect the CDS prices, and if it did it would bias against finding a tightening reaction, as anoverall decrease in liquidity would widen the CDS spreads.
36The subordinated CDS spread reaction is distinct from any price reaction from the hybrid bondsubject to the LMEs, which are mechanically driven by the tender price.
21
ones financed by an exchange tender.
To rule out that the CDS spread tightening results from a form of bail-out from
government being announced simultaneously, I split the sample between banks having
received no bail-out and banks having received bail-out. The result appears to be robust
for both sub-samples, and coefficients are more precisely estimated for non-bailout banks.
[INSERT TABLE A5]
This positive reaction from debt investors is consistent with LMEs allowing a relax-
ation of the regulatory constraint, and is not consistent with a negative signaling of LMEs,
which would affect it negatively.37 To strengthen this interpretation, I split the sample
between banks with low tier one capital (less than 10% of risk-weighted assets) and banks
with higher regulatory capital, and find that the CDS spread tightening is stronger for
banks with low regulatory capital.
5.3 Stock Price Reaction
Table 4 displays the event study results for stock prices reaction. Overall, the stock price
reaction to LMEs appears to be moderately negative, with a cumulative abnormal return
around 1%. The magnitude is comparable when restricting the sample to EBA banks.
To dig further into this negative stock reaction, I cut the sample according to bank
bail-outs, and observe that the negative reaction is concentrated on the bailed-out banks.
This is in contrast to the debt reaction, where bailed-out banks CDS are not reacting
differentially from non-bailed-out banks, and suggests that the negative stock price reac-
tion could result from announcements related to the bail-outs, and not the LMEs per se.
I also look separately at LMEs implemented through cash tenders, and the ones imple-
mented through exchange offers. This cut of the data suggests that the negative stock
reaction is more pronounced in the exchange operations. This is again in contrast to the
37On the other hand, this result could be consistent with a positive signaling value of LMEs, for instanceif banks are using these transactions to signal the availability of cash on their balance sheet. However,the CDS spread tightening is similar for exchange LMEs, which cannot have this signaling value.
22
debt reaction, where both types of transaction are generating a similar tightening in the
CDS spread. This negative reaction for exchange LME is consistent with the potentially
value-dilutive nature of an exchange of hybrid bond into equity, but should be interpreted
with caution due to the low power of the test.
The negative stock price reaction appears to be driven by subsets of banks: bailed-
out banks, and banks that implement exchange offers, which partly overlaps. LMEs are
largely neutral in terms of equity value for banks outside of these subgroups.
[INSERT TABLE 4]
Overall, market reactions are therefore consistent with LMEs allowing to relax a bind-
ing regulatory constraint, with debtors mostly benefiting from it. A parallel can be drawn
with debt overhang, where the benefit of recapitalization initially accrues to creditors.
5.4 Disentangling Regulatory Capital Effect from the Reduction
in Roll-Over Risk
As described in section 2, LMEs are typically implemented in conjunction with a non-call
strategy. One potential concern over the previous analysis would therefore be that the
tightening of CDS I measure comes from the reduction in roll-over risk associated with
non-calls, and not from the relaxation of the regulatory capital constraint that LMEs
provide. I therefore run a similar event-study focusing on non-call announcements that
are made prior to any LME announcement by the same bank.
Results are displayed in table A5 of the appendix. Non-calls that are not associated
with an LME announcement do not generate significant reaction from CDS spreads nor
stock prices. While the mild tightening of senior CDS is consistent with a moderate
improvement in liquidity, these benefits are an order of magnitude too small to be driving
the market reaction to LMEs documented previously.
23
6 Effectiveness for Delevering in Times of Stress
The next step of the study is to assess whether LMEs facilitate the deleveraging of banks
in times of stress, which is the main goal of contingent capital instruments.
6.1 Impact on Regulatory Capital
6.1.1 Elasticity of Core Tier-One Ratio to Core Tier-One Creation by LMEs
I first study whether the core tier-one creation from LMEs translates into an actual
increase in core tier-one ratio for the banks. For this purpose, I run the following regression
on the sample of EBA banks that were part of both 2011 and 2014 stress test:
ChangeCoreT ierOnei = α + β × CoreT ierOneCreationi + Controlsi + εi
where ChangeCoreT ierOnei is the change in core tier-one Ratio, in percentage points
of risk-weighted assets, between the 2011 stress test and the 2014 stress test. CoreT ierOneCreationi
is the creation of core tier-one through LMEs implemented by bank i during that period,
also expressed in percentage points of risk-weighted assets. Regressions coefficients from
the regression are displayed in column 1 of Table 5, with controls for bank size and listed
status. Column 2 includes additional controls: Tier One Ratio, Cash over Assets, and
Deposit over Liabilities. Core tier-one creation from LMEs appears to be associated with
an improved capitalization level, and is therefore not offset by potential counteracting
effects or actions. The improvement on core tier-one capital is actually larger than the
LME core tier-one creation, as the regression coefficients on CoreT ierOneCreationi are
larger than one, which suggests a complementarity between LMEs and other recapital-
ization channels. In columns 3 and 4, I restrict the sample to LME users to make sure
the identification is happening within LME users. The point estimate from this restricted
sample appears more precise, and consistent in magnitude.
[INSERT TABLE 5]
24
6.1.2 Instrumenting LME Size
A natural concern over the previous analysis is a potential source of endogeneity on the
size of LMEs: banks with lower regulatory capital would implement larger LMEs, as well
as other ways of deleveraging, without the association being causal.38
To gain causal identification, I therefore instrument the size of core tier-one creation
through LMEs with the regulatory limit on hybrid capital imposed to banks under Basel
II at the country level. This limit varies by country as the principles of Basel II are
translated into national laws. Country limits on hybrid bonds, expressed in percentage
points of tier one capital, are provided in table A4 of the appendix. The rationale of
this instrument is that banks that had lower limits on hybrid bonds issued relatively less
of such instruments before the crisis compared to similar banks in countries with higher
limits, and were therefore not in a position to implement as large LMEs when the crisis
hit.
Column 5 exhibits the regression coefficients of the first stage of the instrumental
variable analysis. The country limits appear to be a strong predictor of the relative size
of the LMEs. Due to their narrow and regulatory nature, as well as their pre-existence to
the financial crisis, these limits are unlikely to directly affect the change of core tier-one
ratio during the period 2011-2014, which supports the absence of violation of the exclusion
restriction for the instrument.
Columns 6 and 7 present the instrumented version of columns 3 and 4. The coefficient
on CoreT ierOneCreationi is still positive and significant under this specification, which
supports a causal interpretation of the relationship between LMEs and improvement in
core tier-one ratio. This result illustrates how contingent capital instruments would be
efficient at deleveraging banks in times of distress, and mitigate the heightened frictions
to raise equity for banks in times of stress.
When addressing the potential endogeneity of the OLS regressions, the coefficient
38The potential concern over endogeneity only applies to the magnitude of LMEs under the specificationI use, and not to the decision to implement an LME, as the sample is restricted to LME users in columns3 and 4 for this purpose.
25
on CoreT ierOneCreationi increases in magnitude. This suggests that LMEs facilitated
additional recapitalizations through other channels, which I study in the next subsection.
6.2 Complementarity With Equity Issuances
The natural way to recapitalize a bank is through an equity issuance. I therefore in-
vestigate whether LMEs are associated equity issuances, which would explain the large
coefficient obtained in the previous analysis. If LMEs reduce the friction to raise equity
in times of stress, there should be a positive association between LMEs and equity issues.
I run logit regressions on implementing an equity issue between the 2011 and 2014
EBA stress tests, and use an indicator variable for LMEs as an explanatory variable. I
indeed find that banks that implement an LME are more likely to implement an equity
issue as well.
Column 1 in Table 6 conducts the analysis for all EBA banks, while column 2 excludes
bail-out banks, where the association could be spurious. In both columns, LMEs appear
to be associated with a significantly higher likelihood of implementing an equity issue.
LMEs appear to be a complement of equity issuances.
[INSERT TABLE 6]
7 Potential Stigma
For completeness, I also study the potential cost of LMEs raised by market players: a
stigma affecting future security issuances, which would raise the cost of capital going
onward.39 This concern extends to contingent capital instruments, as the violation of the
absolute priority rule they represent might alienate debt investors, which therefore might
be reluctant to lend again to the issuer. It also raises the question of investor education
when marketing non-standard securities.
39This argument was brought forward by some investment banks acting as advisors to issuers to dis-courage them from implementing LMEs, or to encourage them to call hybrid bonds at par.
26
Under this argument, LMEs would affect the demand for future security issuances from
the bank. I therefore test whether LMEs impact the pricing of subsequent debt issuances
by the same bank. I regress yield to maturity at issuance on an indicator variable for
the issuance being the first issuance of a bank since it performed an LME, controlling for
issuance characteristics, such as rating-month fixed effects, security type, maturity, and
bank financials. The sample of the analysis covers bond issuances by European banks
having issued Basel-II hybrid instruments prior to the crisis.
Results are displayed in table 7, and show a positive coefficient on the indicator variable
for being a bond issuance immediately following an LME. This result suggests that it can
be more expensive to issue a bond for banks that have recently implemented an LME than
for banks that have not, consistent with a lower demand from investors for these bonds.
A possible interpretation of this result is that some investors “punish” the banks that
have recently imposed losses on bondholders. In column 2, I restrict the sample to EBA
banks, and find consistent results. In column 3, I add an indicator variable for the LME
to take the form of an exchange offer, and to be implemented as a Dutch auction. The
negative impact on bond yield does not differ significantly for exchange LME, but is even
stronger for LMEs taking the form of a Dutch auction, which are famously disliked by
investors as they do not provide price guidance and thereby minimize the tender price.40
For comparison purpose, I run in column 4 the same analysis for equity issuance and
bailouts, and find an insignificant positive effect, i.e. a lower yield to maturity at issuance,
for bonds issued following a recent equity issuance, and a significant negative effect for
bailouts.
These results suggest that bondholders may somewhat punish the banks for violating
the absolute priority rule -or at least their expectations- when conducting LMEs. It
underlines the importance of educating investors to the risk resulting from hybrid capital
instruments such as contingent capital, which bear many attributes of debt but may
40As few banks have been using dutch auctions, this coefficient should however be interpreted with agrain of salt.
27
incur losses before equity does. The short-lived aspect of such an effect should however
mitigate concerns over contingent capital trigger materially affecting investor behaviors
in the future.41
[INSERT TABLE 7]
8 Conclusion
This paper explores the effects of liability management exercises (LMEs) as a laboratory
to gain knowledge into the effects of triggering contingent capital instruments. I document
that financial institutions under stress massively implemented liability management exer-
cises following the recent financial crisis, thereby creating large amounts of core tier-one
capital.
When conducting an event study on the announcements of liability management exer-
cises, I find that CDS spreads tighten significantly. This increase in debt value is consistent
with a reduction of the regulatory capital constraint at these banks. The reaction of stock
prices is more mixed, but neutral for LMEs implemented by banks that did not receive a
government bail-out.
Liability management exercises are associated with improved capitalization. An in-
strument variable analysis allows me to establish the causality of such relationship. LMEs
appear to be a complement of equity issuances, which suggests that the capital creation
they allow reduces the frictions associated with raising equity in times of stress.
My results bring some empirical substance to the discussion on the efficiency of contin-
gent capital instruments. By limiting financial distress costs in times of stress, contingent
capital instruments represent an alternative to higher capital requirements, which banks
appear less reluctant to implement.
41In untabulated regressions, I find no significant impact when looking at ulterior bond issuances.
28
References
Acharya, V. V., P. Schnabl, and G. Suarez (2013, mar). Securitization without risk transfer. Journal ofFinancial Economics 107 (3), 515–536.
Admati, A., P. DeMarzo, M. Hellwig, and P. Pfleiderer (2012). Debt overhang and capital regulation.
Admati, A. R., P. M. Demarzo, M. F. Hellwig, and P. Pfleiderer (2013). Fallacies, irrelevant facts, andmyths in the discussion of capital regulation : Why bank equity is not expensive. Working Paper.Stanford University .
Avdjiev, S., P. Bolton, W. Jiang, A. Kartasheva, and B. Bogdanova (2015). Coco bond issuance andbank funding costs. Working Paper. BIS and Columbia University .
Benston, G., P. Irvine, J. Rosenfeld, and J. J. F. Sinkey (2003). Bank capital structure, regulatory capital,and securities innovations. Journal of Money Credit and Banking 35 (3), 301–322.
Berg, T. and C. Kaserer (2015). Does contingent capital induce excessive risk-taking? Journal ofFinancial Intermediation 24 (3), 356–385.
Bhimalingam, M. D. B. and N. D. B. Burns (2011). Fundamental credit special basel iii and solvency ii- impact on credit markets. (May).
Bolton, P. and F. Samama (2012). Capital access bonds: contingent capital with an option to convert.Economic Policy (2010), 1–46.
Boyson, N. M., R. Fahlenbrach, and R. M. Stulz (2016). Why don’t all banks practice regulatoryarbitrage? evidence from usage of trust-preferred securities. The Review of Financial Studies 29 (7),1821–1859.
Brown, S. and J. Warner (1985). Using daily stock returns: The case of event studies. Journal ofFinancial Economics 14, 3–31.
Brunnermeier, M., A. Crocket, C. Goodhart, A. D. Persaud, and H. Shin (2009). The FundamentalPrinciples of Financial Regulation.
Chan, S. and S. van Wijnbergen (2016). Coco design, risk shifting and financial fragility.
Colliard, J.-E. and D. Gromb (2017). Financial restructuring and resolution of banks. Working Paper .
DeAngelo, H. and R. M. Stulz (2015). Liquid-claim production, risk management, and bank capitalstructure: Why high leverage is optimal for banks. Journal of Financial Economics 116 (2), 219–236.
Delivorias, A. (2016). Contingent convertible securities: Is a storm brewing? European ParliamentaryResearch Service Briefing .
Duffie, D. (2010). Financial institutions. Ending Government Bailouts as We Know Them, 109–124.
Flannery, M. (2005). No pain, no gain? effecting market discipline via reverse convertible debentures.Capital Adequacy Beyond Basel: Banking, Securities, and Insurance.
Flannery, M. (2010). Stabilizing large financial institutions with contingent capital certificates. CAREFINResearch Paper .
French, K., M. Baily, J. Campbell, J. Cochrane, D. Diamond, D. Duffie, A. Kashyap, F. Mishkin, R. Ra-jan, D. Scharfstein, R. Shiller, H. S. Shin, M. Slaughter, J. Stein, and j. . T. m. . s. n. . . p. . . t. . F.v. . . y. . . Stulz, Rene.
29
Haldane, A., V. S. Rogowski, R. Sowerbutts, M. Spaltro, G. Speight, B. Tracey, and P. Tucker (2011).Capital discipline.
Haliassos, M. (2013). Financial innovation: Too much or too little?
Jorion, P. and G. Zhang (2007). Good and bad credit contagion: Evidence from credit default swaps.Journal of Financial Economics (949).
Kashyap, A., R. Rajan, and J. Stein (2008). Rethinking capital regulation. Federal Bank of Kansas CitySymposium, 431–471.
Krishnan, C. N. V. and P. A. Laux (2005). Misreaction. Journal of Financial and Quantitative Analy-sis 40 (2), 403–434.
Loutskina, E. (2011, jun). The role of securitization in bank liquidity and funding management. Journalof Financial Economics 100 (3), 663–684.
Lubberink, M. J. P. and A. Renders (2016). Are banks’ below-par own debt repurchases a cause forprudential concern? Working Paper .
MacKinlay, A. (1997). Event studies in economics and finance. Journal of Economic Litera-ture XXXV (March), 13–39.
Martynova, N. and E. Perotti (2017). Convertible bonds and bank risk-taking. Journal of FinancialIntermediation - Forthcoming .
Modigliani, F. and M. H. Miller (1958). The cost of capital, corporation finance and the theory ofinvestment. The American Economic Review , 261–297.
Moody’s (2009). Moody ’ s guidelines for rating bank hybrid securities and subordinated debt. (Novem-ber).
Myers, S. C. and N. S. Majluf (1984). Corporate financing and investment decisions when firms haveinformation that investors do not have. Journal of Financial Economics 13 (2), 187–221.
Pazarbasioglu, C., J. Zhou, V. Le Lesle, and M. Moore (2011). Contingent capital: Economic rationaleand design features? International Monetary Fund, SDN/11/01 .
Pennacchi, G., T. Vermaelen, and C. C. Wolff (2014). Contingent capital: The case of coercs. Journal ofFinancial and Quantitative analysis 49 (3), 541–574.
Perignon, C. and B. Vallee (2017). The political economy of financial innovation: evidence from localgovernments. The Review of Financial Studies 30 (6), 1903–1934.
Philippon, T. and P. Schnabl (2013). Efficient recapitalization. The Journal of Finance 68 (1), 1–42.
Sundaresan, S. and Z. Wang (2015). On the design of contingent capital with market trigger. Journal ofFinance.
Zeng, J. (2012). Contingent capital structure. Working Paper , 1–34.
30

9 Figures and Tables
31
BEFORE AFTER
a. Regulatory Balance Sheet Cash LME
Principal write-down (PWD)
b. Book Value Balance Sheet
Cash LME
Principal write-down (PWD)
RWA1,000
Core Tier 1100
Hybrid100
RWA1,000
Core Tier 1150
RWA1,000
Core Tier 1100
PWD 100
RWA1,000
Core Tier 1150
PWD 50
Assets1,800
Cash 200
Equity100
Hybrids100
Debt & Deposits
1,800
Assets1,800
Cash 150
Equity150
Debt & Deposits
1,800
Assets1,800
Cash 200
Equity100
PWD 100
Debt & Deposits
1,800
Assets900
Cash 200
Equity150
PWD 50
Debt & Deposits
1,800
Core Tier 1 Ratio = 15%
Core Tier 1 Ratio = 10%
Core Tier 1 Ratio = 10%
Core Tier 1 Ratio = 15%
Figure 1: LME and Contingent Capital Triggers: Comparison of Balance Sheet Effects
Note: This figure compares the regulatory and accounting balance sheet effects of an LME implementedthrough a cash tender, with the effects of the trigger of a principal write-down bond.
32
010
2030
4050
Am
ount
tend
ered
, in
billi
ons
2008 2009 2010 2011 2012 2013 2014 2015 2016
Amount Tendered
02
46
810
Cor
e Ti
er 1
inje
ctio
n, in
bill
ions
2008 2009 2010 2011 2012 2013 2014 2015 2016
Year
Core Tier 1 Creation
Cash Tender Exchange
Figure 2: Liability Management Exercise amounts
Note: This figure displays the amounts of hybrid bonds tendered through Liability Management Exercises(LMEs), and the corresponding core tier-one creation from 2008 to 2016. Both of these amounts arebroken down by type of LMEs: the ones implemented through a cash tender (in blue), and the onesimplemented through an exchange offer (in red). Amount Tendered represents the total face valueof the hybrid bonds that have been tendered as part of an LME. Core tier-one creation is equal tothe realized capital gain of the LME, and is calculated as (HybridBondFaceV alue − OfferPrice) ∗NumberofHybridBondsTendered.
33
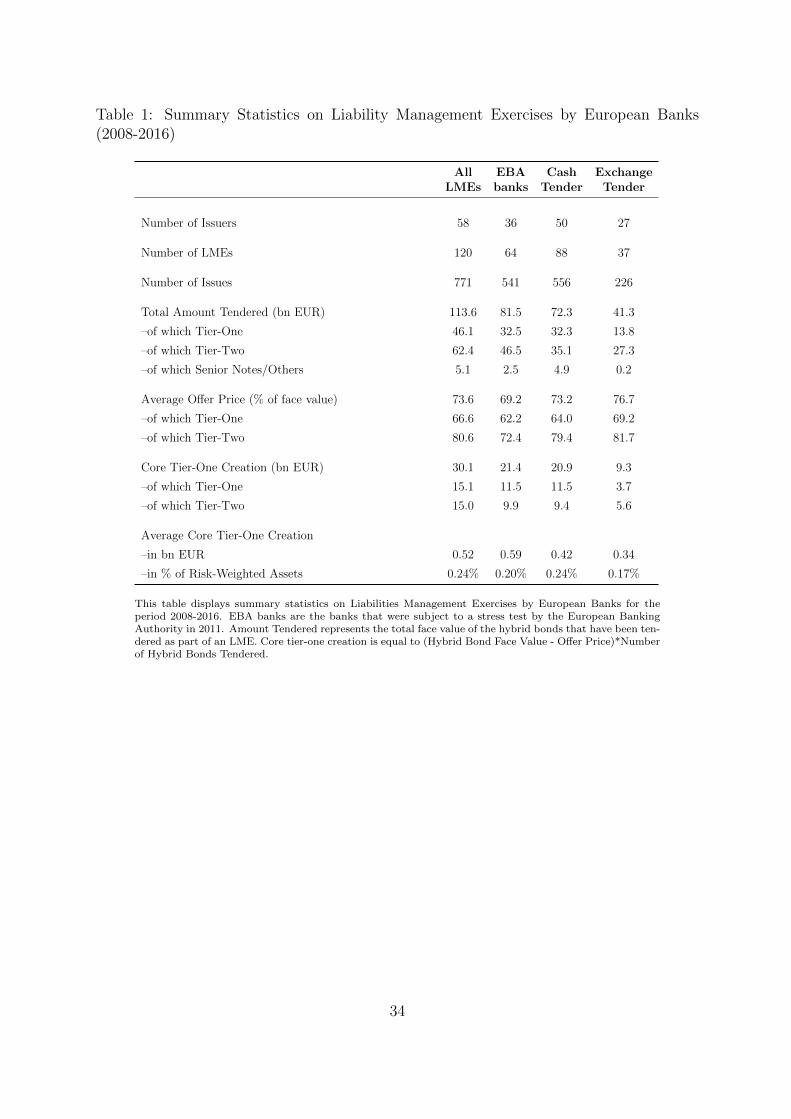
Table 1: Summary Statistics on Liability Management Exercises by European Banks(2008-2016)
All EBA Cash ExchangeLMEs banks Tender Tender
Number of Issuers 58 36 50 27
Number of LMEs 120 64 88 37
Number of Issues 771 541 556 226
Total Amount Tendered (bn EUR) 113.6 81.5 72.3 41.3
–of which Tier-One 46.1 32.5 32.3 13.8
–of which Tier-Two 62.4 46.5 35.1 27.3
–of which Senior Notes/Others 5.1 2.5 4.9 0.2
Average Offer Price (% of face value) 73.6 69.2 73.2 76.7
–of which Tier-One 66.6 62.2 64.0 69.2
–of which Tier-Two 80.6 72.4 79.4 81.7
Core Tier-One Creation (bn EUR) 30.1 21.4 20.9 9.3
–of which Tier-One 15.1 11.5 11.5 3.7
–of which Tier-Two 15.0 9.9 9.4 5.6
Average Core Tier-One Creation
–in bn EUR 0.52 0.59 0.42 0.34
–in % of Risk-Weighted Assets 0.24% 0.20% 0.24% 0.17%
This table displays summary statistics on Liabilities Management Exercises by European Banks for theperiod 2008-2016. EBA banks are the banks that were subject to a stress test by the European BankingAuthority in 2011. Amount Tendered represents the total face value of the hybrid bonds that have been ten-dered as part of an LME. Core tier-one creation is equal to (Hybrid Bond Face Value - Offer Price)*Numberof Hybrid Bonds Tendered.
34
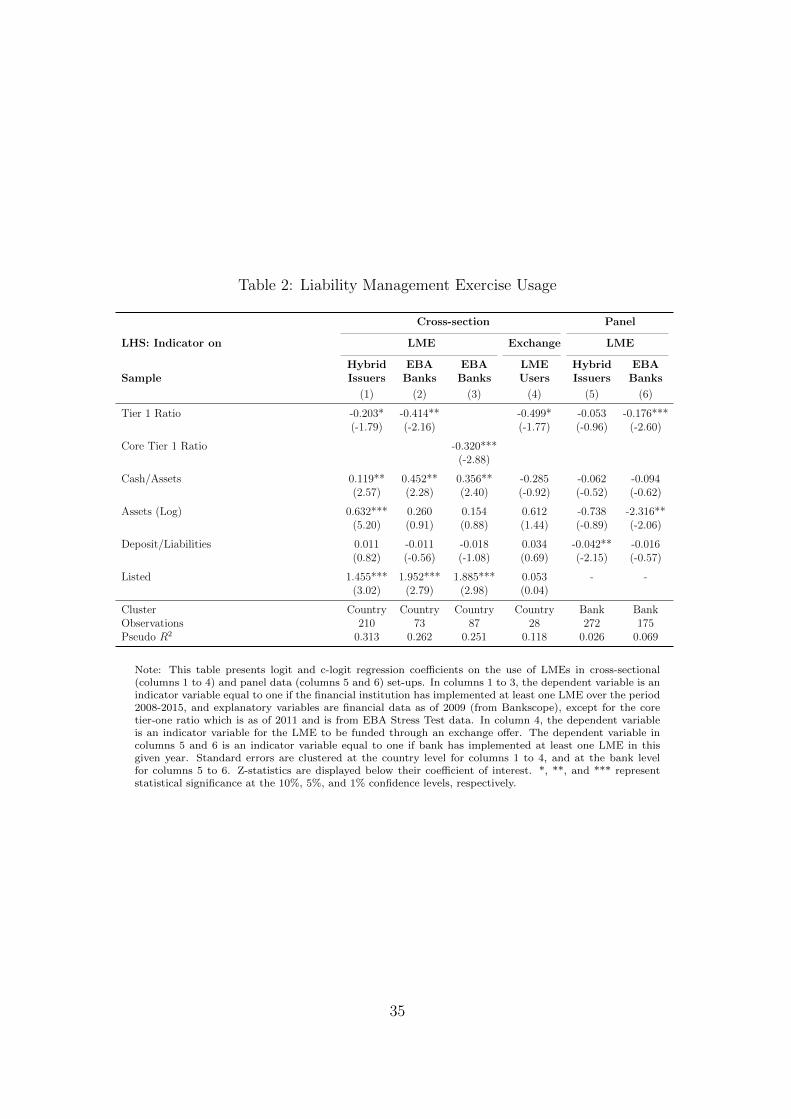
Table 2: Liability Management Exercise Usage
Cross-section Panel
LHS: Indicator on LME Exchange LME
Hybrid EBA EBA LME Hybrid EBASample Issuers Banks Banks Users Issuers Banks
(1) (2) (3) (4) (5) (6)
Tier 1 Ratio -0.203* -0.414** -0.499* -0.053 -0.176***(-1.79) (-2.16) (-1.77) (-0.96) (-2.60)
Core Tier 1 Ratio -0.320***(-2.88)
Cash/Assets 0.119** 0.452** 0.356** -0.285 -0.062 -0.094(2.57) (2.28) (2.40) (-0.92) (-0.52) (-0.62)
Assets (Log) 0.632*** 0.260 0.154 0.612 -0.738 -2.316**(5.20) (0.91) (0.88) (1.44) (-0.89) (-2.06)
Deposit/Liabilities 0.011 -0.011 -0.018 0.034 -0.042** -0.016(0.82) (-0.56) (-1.08) (0.69) (-2.15) (-0.57)
Listed 1.455*** 1.952*** 1.885*** 0.053 - -(3.02) (2.79) (2.98) (0.04)
Cluster Country Country Country Country Bank BankObservations 210 73 87 28 272 175Pseudo R2 0.313 0.262 0.251 0.118 0.026 0.069
Note: This table presents logit and c-logit regression coefficients on the use of LMEs in cross-sectional(columns 1 to 4) and panel data (columns 5 and 6) set-ups. In columns 1 to 3, the dependent variable is anindicator variable equal to one if the financial institution has implemented at least one LME over the period2008-2015, and explanatory variables are financial data as of 2009 (from Bankscope), except for the coretier-one ratio which is as of 2011 and is from EBA Stress Test data. In column 4, the dependent variableis an indicator variable for the LME to be funded through an exchange offer. The dependent variable incolumns 5 and 6 is an indicator variable equal to one if bank has implemented at least one LME in thisgiven year. Standard errors are clustered at the country level for columns 1 to 4, and at the bank levelfor columns 5 to 6. Z-statistics are displayed below their coefficient of interest. *, **, and *** representstatistical significance at the 10%, 5%, and 1% confidence levels, respectively.
35
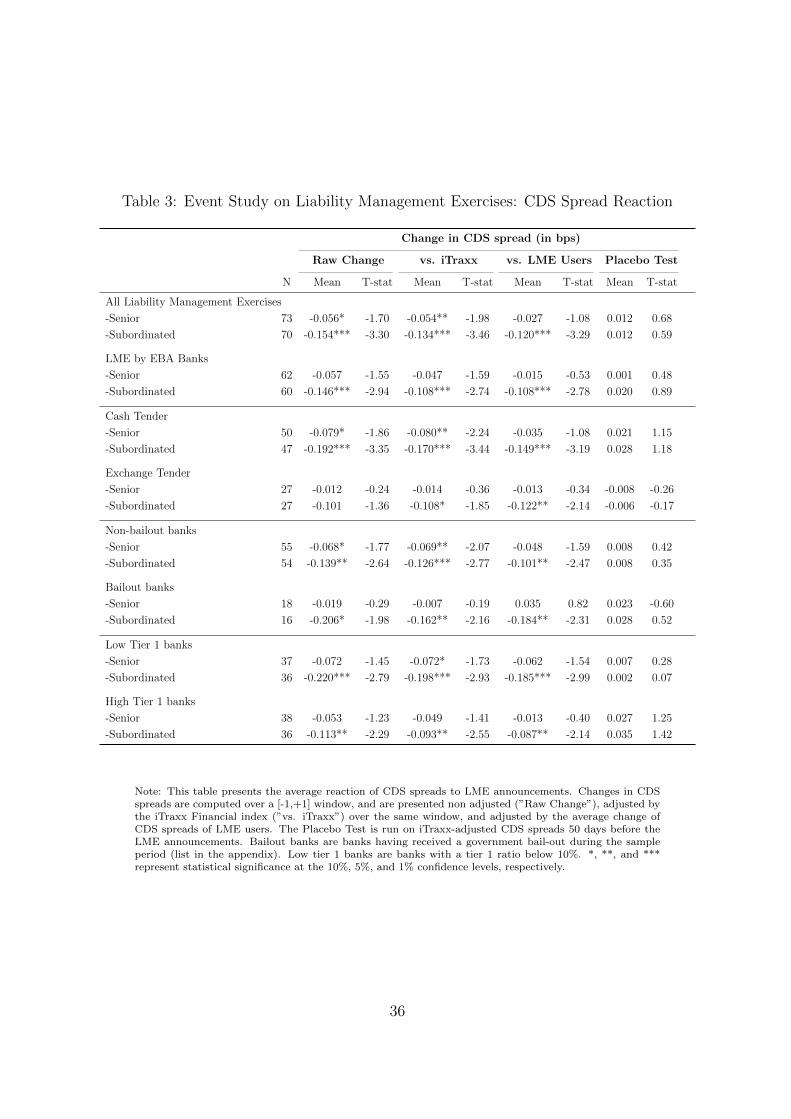
Table 3: Event Study on Liability Management Exercises: CDS Spread Reaction
Change in CDS spread (in bps)
Raw Change vs. iTraxx vs. LME Users Placebo Test
N Mean T-stat Mean T-stat Mean T-stat Mean T-stat
All Liability Management Exercises
-Senior 73 -0.056* -1.70 -0.054** -1.98 -0.027 -1.08 0.012 0.68
-Subordinated 70 -0.154*** -3.30 -0.134*** -3.46 -0.120*** -3.29 0.012 0.59
LME by EBA Banks
-Senior 62 -0.057 -1.55 -0.047 -1.59 -0.015 -0.53 0.001 0.48
-Subordinated 60 -0.146*** -2.94 -0.108*** -2.74 -0.108*** -2.78 0.020 0.89
Cash Tender
-Senior 50 -0.079* -1.86 -0.080** -2.24 -0.035 -1.08 0.021 1.15
-Subordinated 47 -0.192*** -3.35 -0.170*** -3.44 -0.149*** -3.19 0.028 1.18
Exchange Tender
-Senior 27 -0.012 -0.24 -0.014 -0.36 -0.013 -0.34 -0.008 -0.26
-Subordinated 27 -0.101 -1.36 -0.108* -1.85 -0.122** -2.14 -0.006 -0.17
Non-bailout banks
-Senior 55 -0.068* -1.77 -0.069** -2.07 -0.048 -1.59 0.008 0.42
-Subordinated 54 -0.139** -2.64 -0.126*** -2.77 -0.101** -2.47 0.008 0.35
Bailout banks
-Senior 18 -0.019 -0.29 -0.007 -0.19 0.035 0.82 0.023 -0.60
-Subordinated 16 -0.206* -1.98 -0.162** -2.16 -0.184** -2.31 0.028 0.52
Low Tier 1 banks
-Senior 37 -0.072 -1.45 -0.072* -1.73 -0.062 -1.54 0.007 0.28
-Subordinated 36 -0.220*** -2.79 -0.198*** -2.93 -0.185*** -2.99 0.002 0.07
High Tier 1 banks
-Senior 38 -0.053 -1.23 -0.049 -1.41 -0.013 -0.40 0.027 1.25
-Subordinated 36 -0.113** -2.29 -0.093** -2.55 -0.087** -2.14 0.035 1.42
Note: This table presents the average reaction of CDS spreads to LME announcements. Changes in CDSspreads are computed over a [-1,+1] window, and are presented non adjusted (”Raw Change”), adjusted bythe iTraxx Financial index (”vs. iTraxx”) over the same window, and adjusted by the average change ofCDS spreads of LME users. The Placebo Test is run on iTraxx-adjusted CDS spreads 50 days before theLME announcements. Bailout banks are banks having received a government bail-out during the sampleperiod (list in the appendix). Low tier 1 banks are banks with a tier 1 ratio below 10%. *, **, and ***represent statistical significance at the 10%, 5%, and 1% confidence levels, respectively.
36
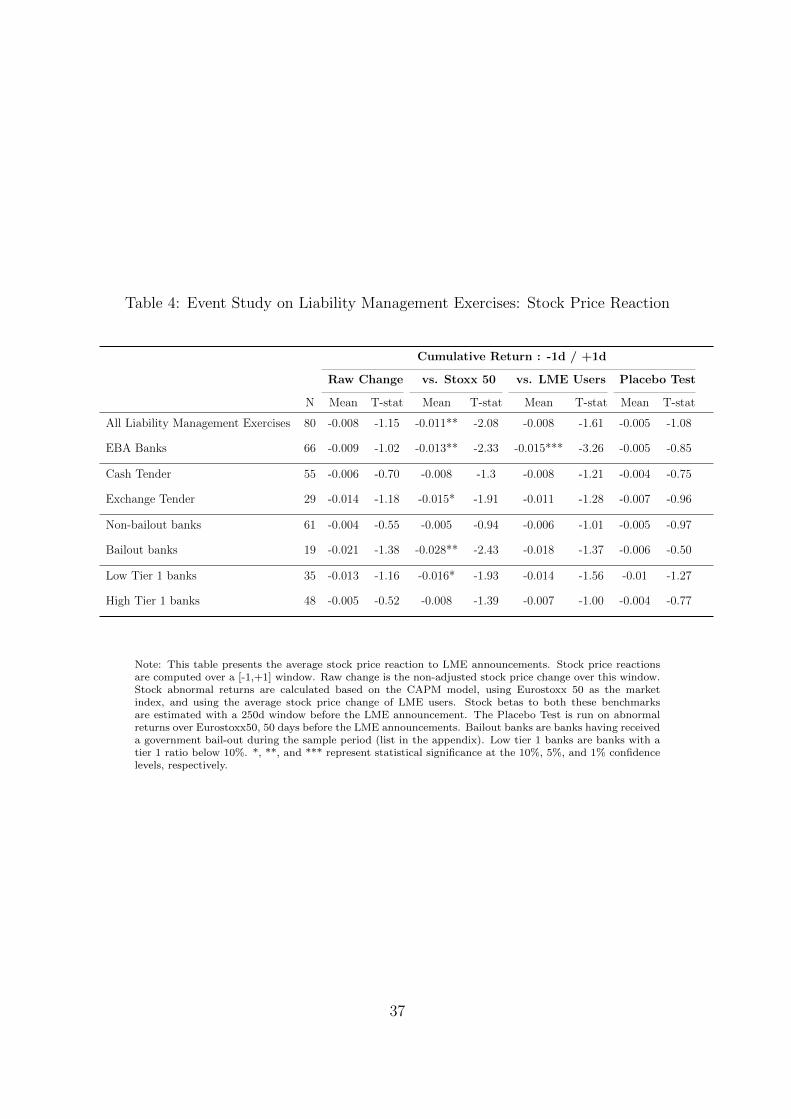
Table 4: Event Study on Liability Management Exercises: Stock Price Reaction
Cumulative Return : -1d / +1d
Raw Change vs. Stoxx 50 vs. LME Users Placebo Test
N Mean T-stat Mean T-stat Mean T-stat Mean T-stat
All Liability Management Exercises 80 -0.008 -1.15 -0.011** -2.08 -0.008 -1.61 -0.005 -1.08
EBA Banks 66 -0.009 -1.02 -0.013** -2.33 -0.015*** -3.26 -0.005 -0.85
Cash Tender 55 -0.006 -0.70 -0.008 -1.3 -0.008 -1.21 -0.004 -0.75
Exchange Tender 29 -0.014 -1.18 -0.015* -1.91 -0.011 -1.28 -0.007 -0.96
Non-bailout banks 61 -0.004 -0.55 -0.005 -0.94 -0.006 -1.01 -0.005 -0.97
Bailout banks 19 -0.021 -1.38 -0.028** -2.43 -0.018 -1.37 -0.006 -0.50
Low Tier 1 banks 35 -0.013 -1.16 -0.016* -1.93 -0.014 -1.56 -0.01 -1.27
High Tier 1 banks 48 -0.005 -0.52 -0.008 -1.39 -0.007 -1.00 -0.004 -0.77
Note: This table presents the average stock price reaction to LME announcements. Stock price reactionsare computed over a [-1,+1] window. Raw change is the non-adjusted stock price change over this window.Stock abnormal returns are calculated based on the CAPM model, using Eurostoxx 50 as the marketindex, and using the average stock price change of LME users. Stock betas to both these benchmarksare estimated with a 250d window before the LME announcement. The Placebo Test is run on abnormalreturns over Eurostoxx50, 50 days before the LME announcements. Bailout banks are banks having receiveda government bail-out during the sample period (list in the appendix). Low tier 1 banks are banks with atier 1 ratio below 10%. *, **, and *** represent statistical significance at the 10%, 5%, and 1% confidencelevels, respectively.
37
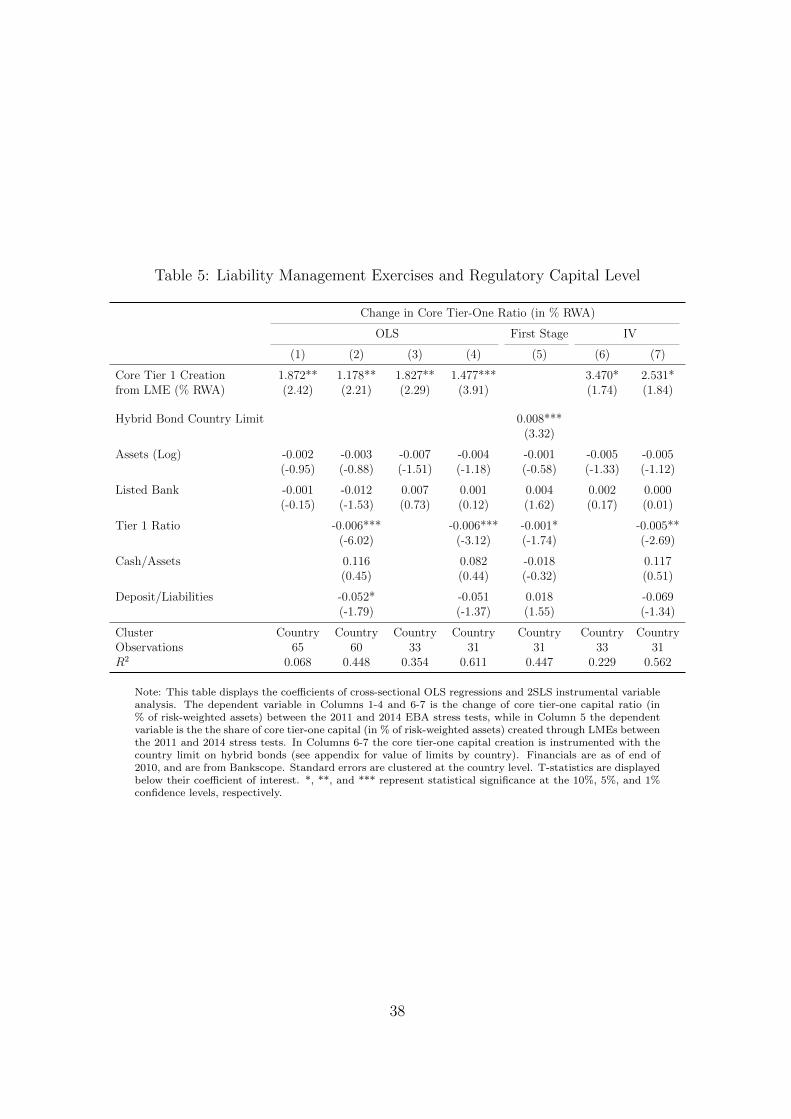
Table 5: Liability Management Exercises and Regulatory Capital Level
Change in Core Tier-One Ratio (in % RWA)
OLS First Stage IV
(1) (2) (3) (4) (5) (6) (7)
Core Tier 1 Creation 1.872** 1.178** 1.827** 1.477*** 3.470* 2.531*from LME (% RWA) (2.42) (2.21) (2.29) (3.91) (1.74) (1.84)
Hybrid Bond Country Limit 0.008***(3.32)
Assets (Log) -0.002 -0.003 -0.007 -0.004 -0.001 -0.005 -0.005(-0.95) (-0.88) (-1.51) (-1.18) (-0.58) (-1.33) (-1.12)
Listed Bank -0.001 -0.012 0.007 0.001 0.004 0.002 0.000(-0.15) (-1.53) (0.73) (0.12) (1.62) (0.17) (0.01)
Tier 1 Ratio -0.006*** -0.006*** -0.001* -0.005**(-6.02) (-3.12) (-1.74) (-2.69)
Cash/Assets 0.116 0.082 -0.018 0.117(0.45) (0.44) (-0.32) (0.51)
Deposit/Liabilities -0.052* -0.051 0.018 -0.069(-1.79) (-1.37) (1.55) (-1.34)
Cluster Country Country Country Country Country Country CountryObservations 65 60 33 31 31 33 31R2 0.068 0.448 0.354 0.611 0.447 0.229 0.562
Note: This table displays the coefficients of cross-sectional OLS regressions and 2SLS instrumental variableanalysis. The dependent variable in Columns 1-4 and 6-7 is the change of core tier-one capital ratio (in% of risk-weighted assets) between the 2011 and 2014 EBA stress tests, while in Column 5 the dependentvariable is the the share of core tier-one capital (in % of risk-weighted assets) created through LMEs betweenthe 2011 and 2014 stress tests. In Columns 6-7 the core tier-one capital creation is instrumented with thecountry limit on hybrid bonds (see appendix for value of limits by country). Financials are as of end of2010, and are from Bankscope. Standard errors are clustered at the country level. T-statistics are displayedbelow their coefficient of interest. *, **, and *** represent statistical significance at the 10%, 5%, and 1%confidence levels, respectively.
38
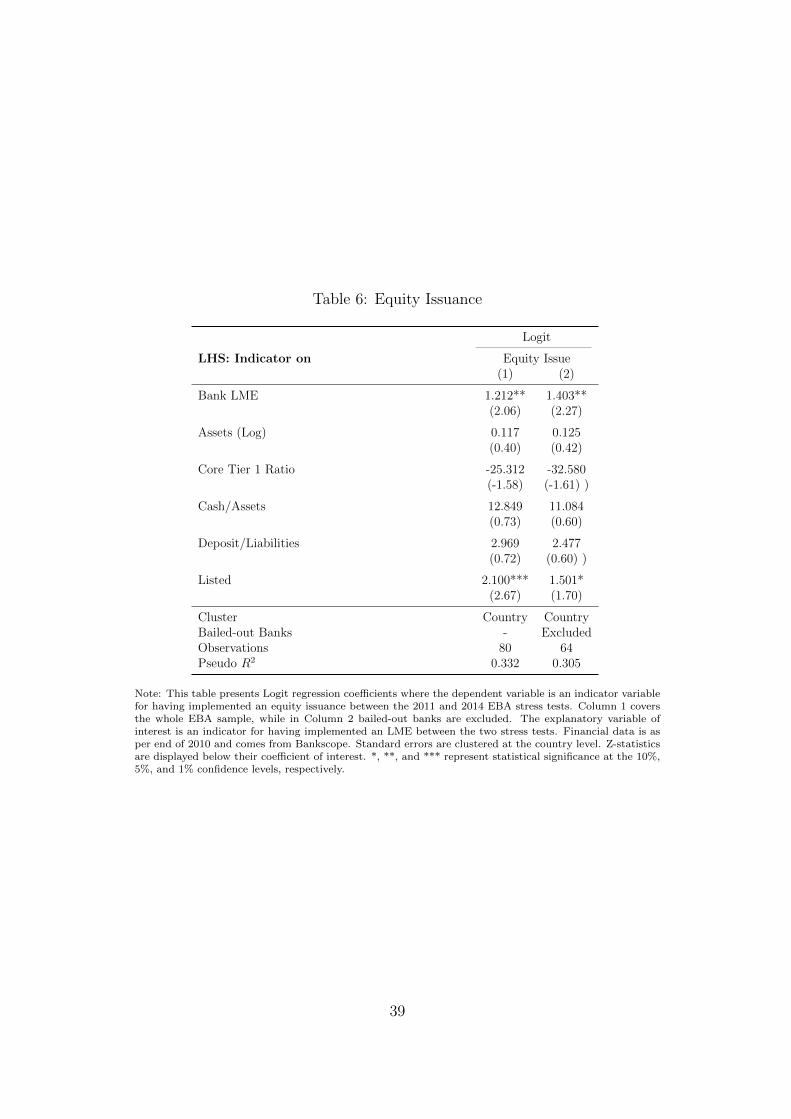
Table 6: Equity Issuance
Logit
LHS: Indicator on Equity Issue(1) (2)
Bank LME 1.212** 1.403**(2.06) (2.27)
Assets (Log) 0.117 0.125(0.40) (0.42)
Core Tier 1 Ratio -25.312 -32.580(-1.58) (-1.61) )
Cash/Assets 12.849 11.084(0.73) (0.60)
Deposit/Liabilities 2.969 2.477(0.72) (0.60) )
Listed 2.100*** 1.501*(2.67) (1.70)
Cluster Country CountryBailed-out Banks - ExcludedObservations 80 64Pseudo R2 0.332 0.305
Note: This table presents Logit regression coefficients where the dependent variable is an indicator variablefor having implemented an equity issuance between the 2011 and 2014 EBA stress tests. Column 1 coversthe whole EBA sample, while in Column 2 bailed-out banks are excluded. The explanatory variable ofinterest is an indicator for having implemented an LME between the two stress tests. Financial data is asper end of 2010 and comes from Bankscope. Standard errors are clustered at the country level. Z-statisticsare displayed below their coefficient of interest. *, **, and *** represent statistical significance at the 10%,5%, and 1% confidence levels, respectively.
39
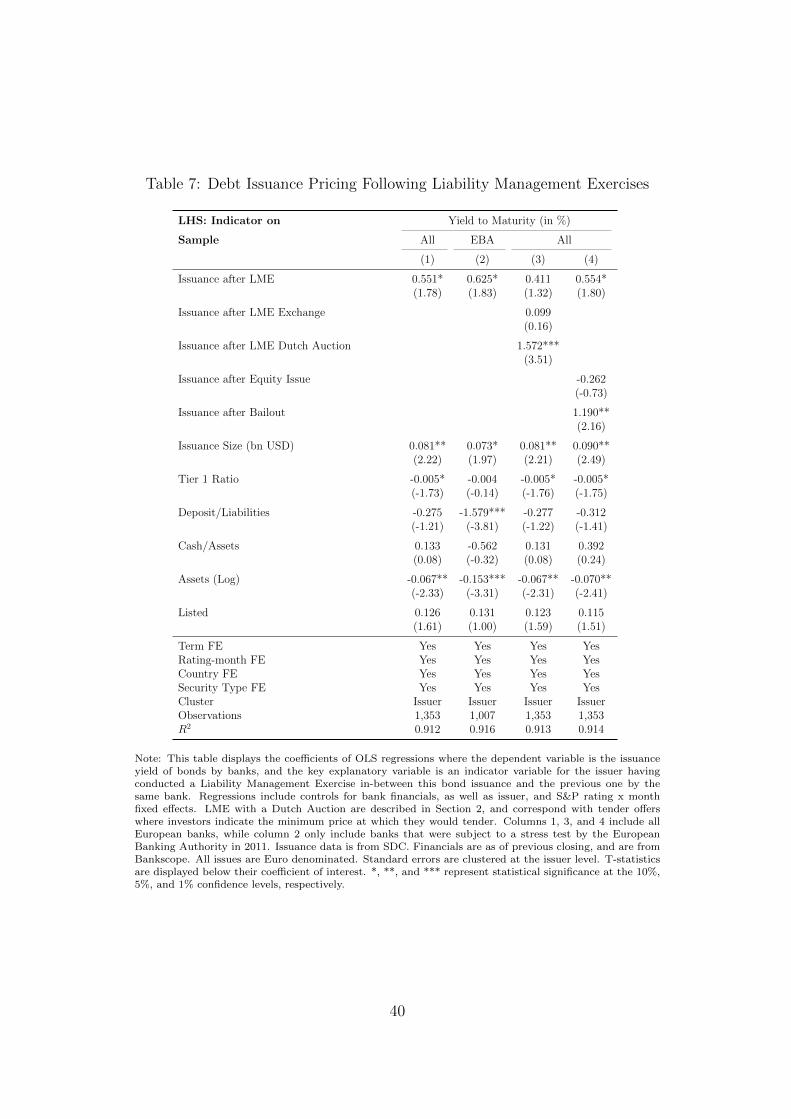
Table 7: Debt Issuance Pricing Following Liability Management Exercises
LHS: Indicator on Yield to Maturity (in %)
Sample All EBA All
(1) (2) (3) (4)
Issuance after LME 0.551* 0.625* 0.411 0.554*(1.78) (1.83) (1.32) (1.80)
Issuance after LME Exchange 0.099(0.16)
Issuance after LME Dutch Auction 1.572***(3.51)
Issuance after Equity Issue -0.262(-0.73)
Issuance after Bailout 1.190**(2.16)
Issuance Size (bn USD) 0.081** 0.073* 0.081** 0.090**(2.22) (1.97) (2.21) (2.49)
Tier 1 Ratio -0.005* -0.004 -0.005* -0.005*(-1.73) (-0.14) (-1.76) (-1.75)
Deposit/Liabilities -0.275 -1.579*** -0.277 -0.312(-1.21) (-3.81) (-1.22) (-1.41)
Cash/Assets 0.133 -0.562 0.131 0.392(0.08) (-0.32) (0.08) (0.24)
Assets (Log) -0.067** -0.153*** -0.067** -0.070**(-2.33) (-3.31) (-2.31) (-2.41)
Listed 0.126 0.131 0.123 0.115(1.61) (1.00) (1.59) (1.51)
Term FE Yes Yes Yes YesRating-month FE Yes Yes Yes YesCountry FE Yes Yes Yes YesSecurity Type FE Yes Yes Yes YesCluster Issuer Issuer Issuer IssuerObservations 1,353 1,007 1,353 1,353R2 0.912 0.916 0.913 0.914
Note: This table displays the coefficients of OLS regressions where the dependent variable is the issuanceyield of bonds by banks, and the key explanatory variable is an indicator variable for the issuer havingconducted a Liability Management Exercise in-between this bond issuance and the previous one by thesame bank. Regressions include controls for bank financials, as well as issuer, and S&P rating x monthfixed effects. LME with a Dutch Auction are described in Section 2, and correspond with tender offerswhere investors indicate the minimum price at which they would tender. Columns 1, 3, and 4 include allEuropean banks, while column 2 only include banks that were subject to a stress test by the EuropeanBanking Authority in 2011. Issuance data is from SDC. Financials are as of previous closing, and are fromBankscope. All issues are Euro denominated. Standard errors are clustered at the issuer level. T-statisticsare displayed below their coefficient of interest. *, **, and *** represent statistical significance at the 10%,5%, and 1% confidence levels, respectively.
40
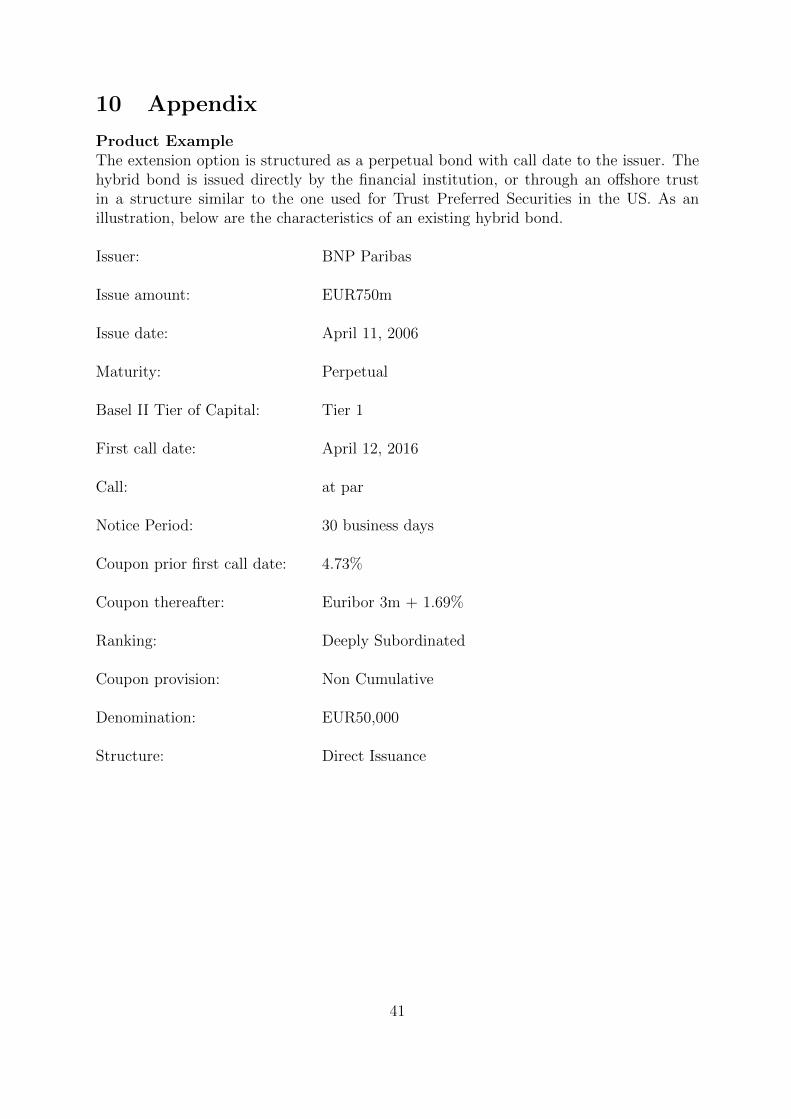
10 Appendix
Product ExampleThe extension option is structured as a perpetual bond with call date to the issuer. Thehybrid bond is issued directly by the financial institution, or through an offshore trustin a structure similar to the one used for Trust Preferred Securities in the US. As anillustration, below are the characteristics of an existing hybrid bond.
Issuer: BNP Paribas
Issue amount: EUR750m
Issue date: April 11, 2006
Maturity: Perpetual
Basel II Tier of Capital: Tier 1
First call date: April 12, 2016
Call: at par
Notice Period: 30 business days
Coupon prior first call date: 4.73%
Coupon thereafter: Euribor 3m + 1.69%
Ranking: Deeply Subordinated
Coupon provision: Non Cumulative
Denomination: EUR50,000
Structure: Direct Issuance
41
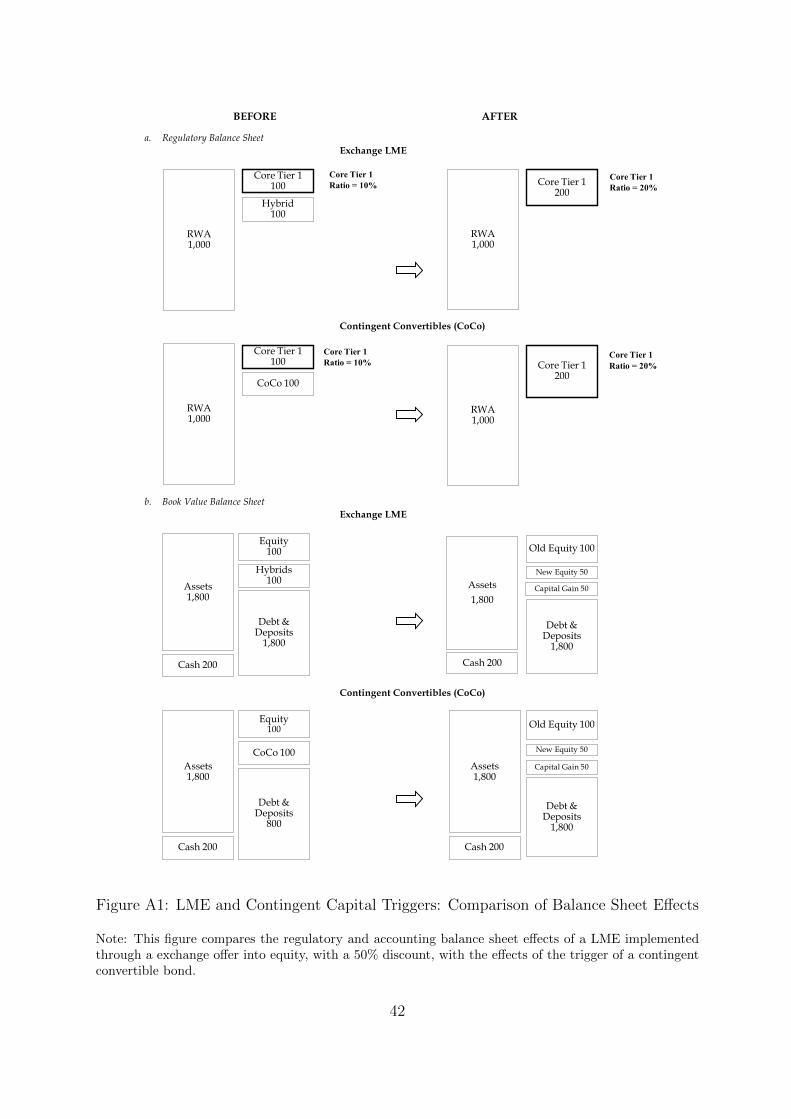
BEFORE AFTER
a. Regulatory Balance Sheet Exchange LME
Contingent Convertibles (CoCo)
b. Book Value Balance Sheet
Exchange LME
Contingent Convertibles (CoCo)
RWA1,000
Core Tier 1100
Hybrid100
RWA1,000
Core Tier 1200
RWA1,000
Core Tier 1100
CoCo 100
RWA1,000
Core Tier 1200
Assets1,800
Cash 200
Equity100
Hybrids100
Debt & Deposits
1,800
Assets1,800
Cash 200
Old Equity 100
Debt & Deposits
1,800
New Equity 50
Capital Gain 50
Assets1,800
Cash 200
Equity100
CoCo 100
Debt & Deposits
800
Assets1,800
Cash 200
Old Equity 100
Debt & Deposits
1,800
New Equity 50
Capital Gain 50
Core Tier 1 Ratio = 20%
Core Tier 1 Ratio = 10%
Core Tier 1 Ratio = 10%
Core Tier 1 Ratio = 20%
Figure A1: LME and Contingent Capital Triggers: Comparison of Balance Sheet Effects
Note: This figure compares the regulatory and accounting balance sheet effects of a LME implementedthrough a exchange offer into equity, with a 50% discount, with the effects of the trigger of a contingentconvertible bond.
42
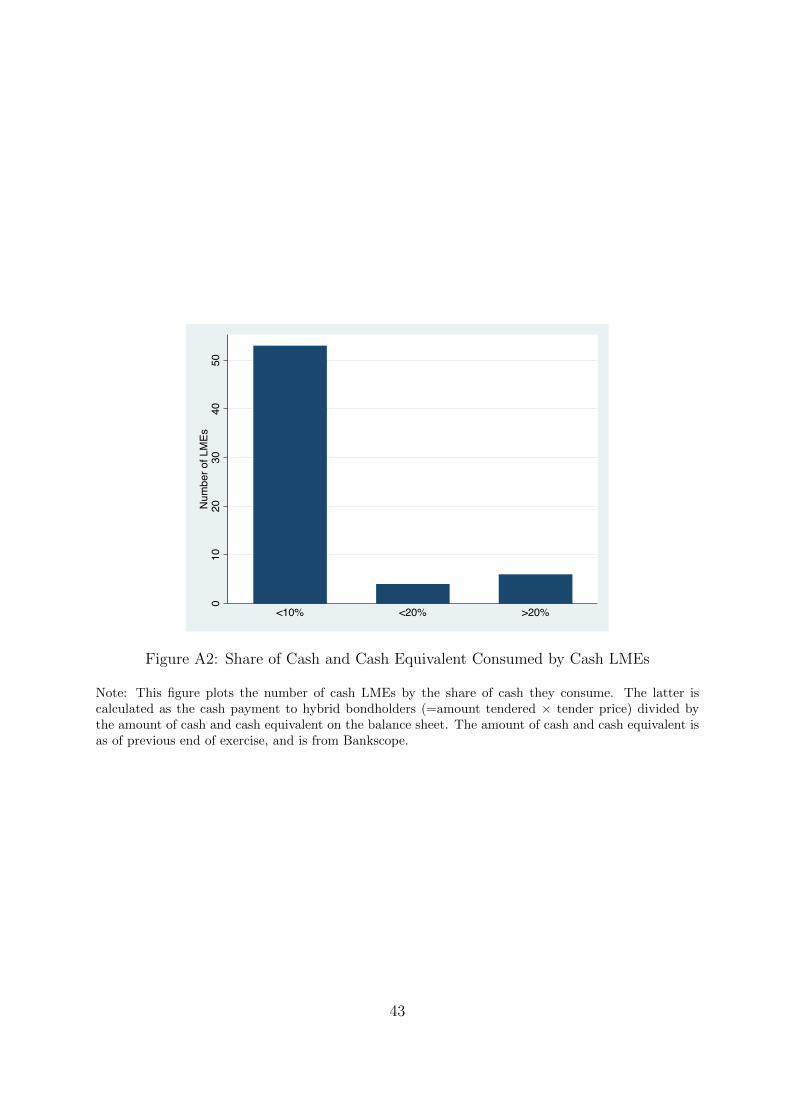
010
2030
4050
Num
ber o
f LM
Es
<10% <20% >20%
Figure A2: Share of Cash and Cash Equivalent Consumed by Cash LMEs
Note: This figure plots the number of cash LMEs by the share of cash they consume. The latter iscalculated as the cash payment to hybrid bondholders (=amount tendered × tender price) divided bythe amount of cash and cash equivalent on the balance sheet. The amount of cash and cash equivalent isas of previous end of exercise, and is from Bankscope.
43
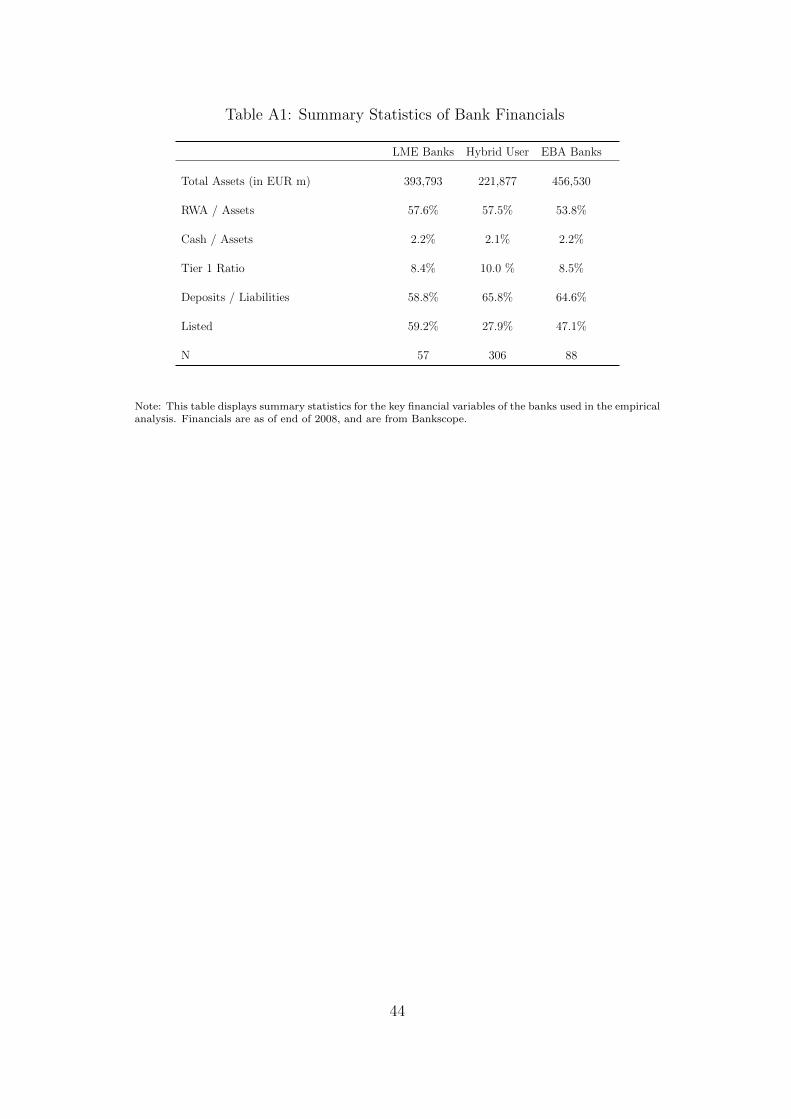
Table A1: Summary Statistics of Bank Financials
LME Banks Hybrid User EBA Banks
Total Assets (in EUR m) 393,793 221,877 456,530
RWA / Assets 57.6% 57.5% 53.8%
Cash / Assets 2.2% 2.1% 2.2%
Tier 1 Ratio 8.4% 10.0 % 8.5%
Deposits / Liabilities 58.8% 65.8% 64.6%
Listed 59.2% 27.9% 47.1%
N 57 306 88
Note: This table displays summary statistics for the key financial variables of the banks used in the empiricalanalysis. Financials are as of end of 2008, and are from Bankscope.
44
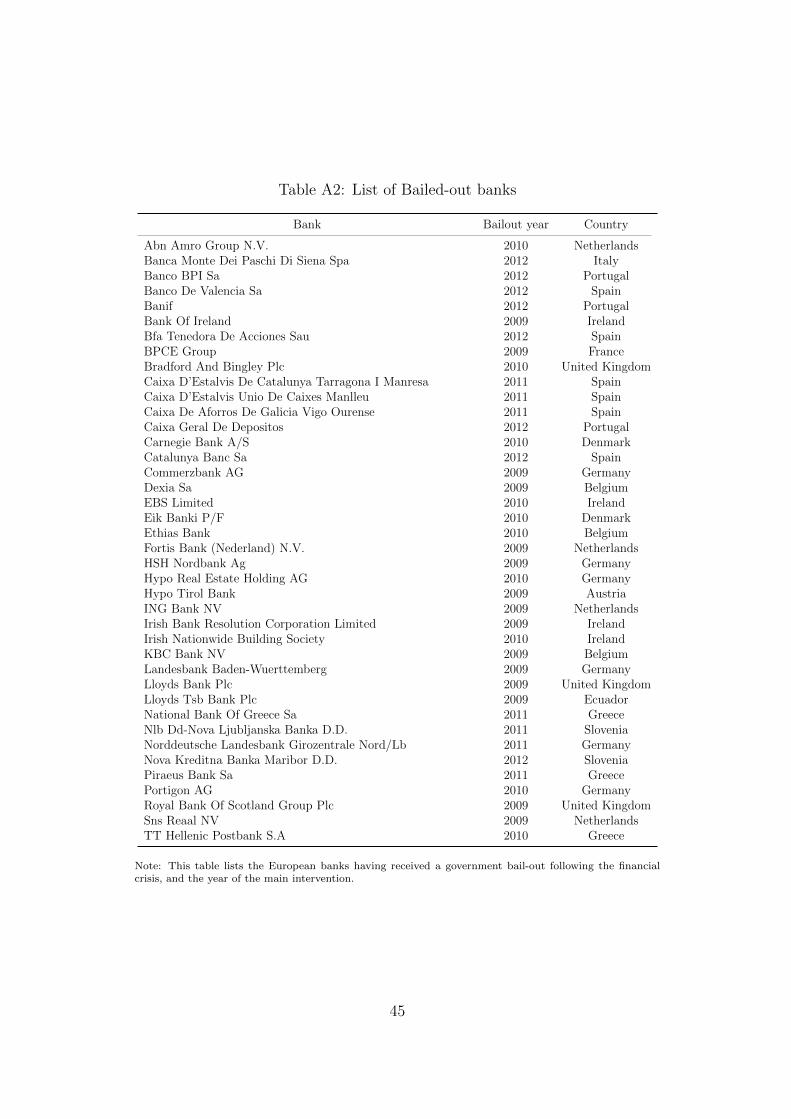
Table A2: List of Bailed-out banks
Bank Bailout year Country
Abn Amro Group N.V. 2010 NetherlandsBanca Monte Dei Paschi Di Siena Spa 2012 ItalyBanco BPI Sa 2012 PortugalBanco De Valencia Sa 2012 SpainBanif 2012 PortugalBank Of Ireland 2009 IrelandBfa Tenedora De Acciones Sau 2012 SpainBPCE Group 2009 FranceBradford And Bingley Plc 2010 United KingdomCaixa D’Estalvis De Catalunya Tarragona I Manresa 2011 SpainCaixa D’Estalvis Unio De Caixes Manlleu 2011 SpainCaixa De Aforros De Galicia Vigo Ourense 2011 SpainCaixa Geral De Depositos 2012 PortugalCarnegie Bank A/S 2010 DenmarkCatalunya Banc Sa 2012 SpainCommerzbank AG 2009 GermanyDexia Sa 2009 BelgiumEBS Limited 2010 IrelandEik Banki P/F 2010 DenmarkEthias Bank 2010 BelgiumFortis Bank (Nederland) N.V. 2009 NetherlandsHSH Nordbank Ag 2009 GermanyHypo Real Estate Holding AG 2010 GermanyHypo Tirol Bank 2009 AustriaING Bank NV 2009 NetherlandsIrish Bank Resolution Corporation Limited 2009 IrelandIrish Nationwide Building Society 2010 IrelandKBC Bank NV 2009 BelgiumLandesbank Baden-Wuerttemberg 2009 GermanyLloyds Bank Plc 2009 United KingdomLloyds Tsb Bank Plc 2009 EcuadorNational Bank Of Greece Sa 2011 GreeceNlb Dd-Nova Ljubljanska Banka D.D. 2011 SloveniaNorddeutsche Landesbank Girozentrale Nord/Lb 2011 GermanyNova Kreditna Banka Maribor D.D. 2012 SloveniaPiraeus Bank Sa 2011 GreecePortigon AG 2010 GermanyRoyal Bank Of Scotland Group Plc 2009 United KingdomSns Reaal NV 2009 NetherlandsTT Hellenic Postbank S.A 2010 Greece
Note: This table lists the European banks having received a government bail-out following the financialcrisis, and the year of the main intervention.
45
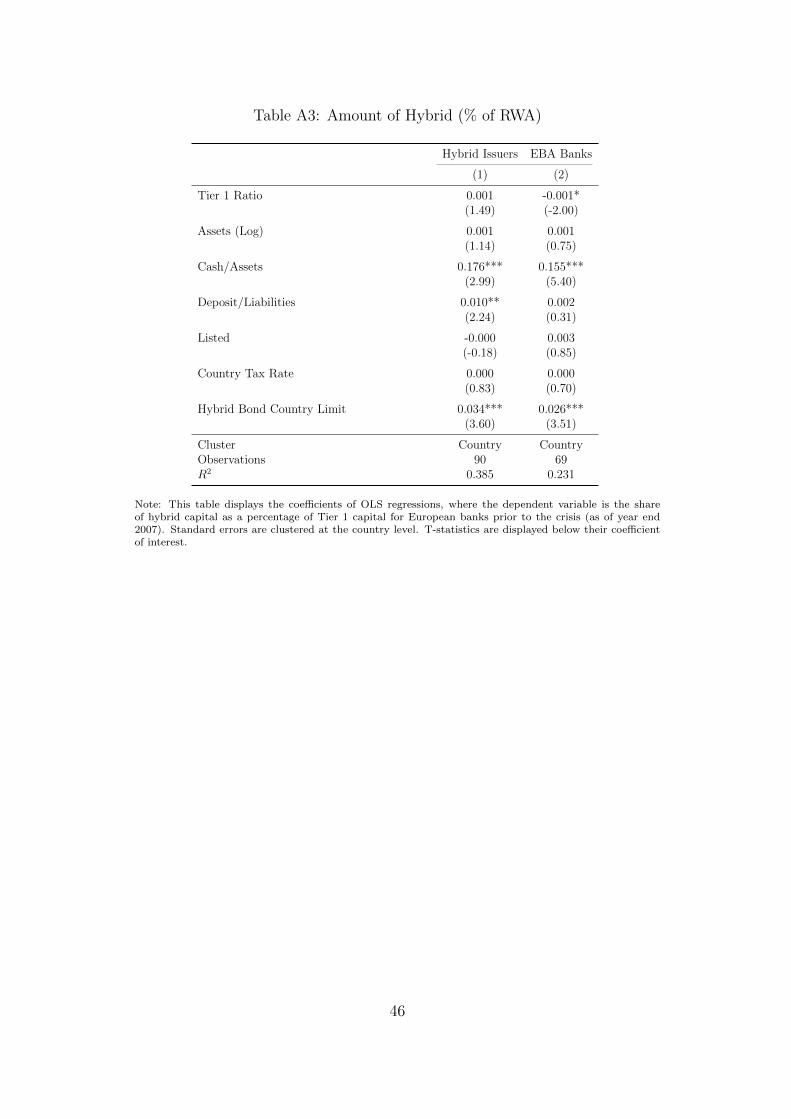
Table A3: Amount of Hybrid (% of RWA)
Hybrid Issuers EBA Banks
(1) (2)
Tier 1 Ratio 0.001 -0.001*(1.49) (-2.00)
Assets (Log) 0.001 0.001(1.14) (0.75)
Cash/Assets 0.176*** 0.155***(2.99) (5.40)
Deposit/Liabilities 0.010** 0.002(2.24) (0.31)
Listed -0.000 0.003(-0.18) (0.85)
Country Tax Rate 0.000 0.000(0.83) (0.70)
Hybrid Bond Country Limit 0.034*** 0.026***(3.60) (3.51)
Cluster Country CountryObservations 90 69R2 0.385 0.231
Note: This table displays the coefficients of OLS regressions, where the dependent variable is the shareof hybrid capital as a percentage of Tier 1 capital for European banks prior to the crisis (as of year end2007). Standard errors are clustered at the country level. T-statistics are displayed below their coefficientof interest.
46
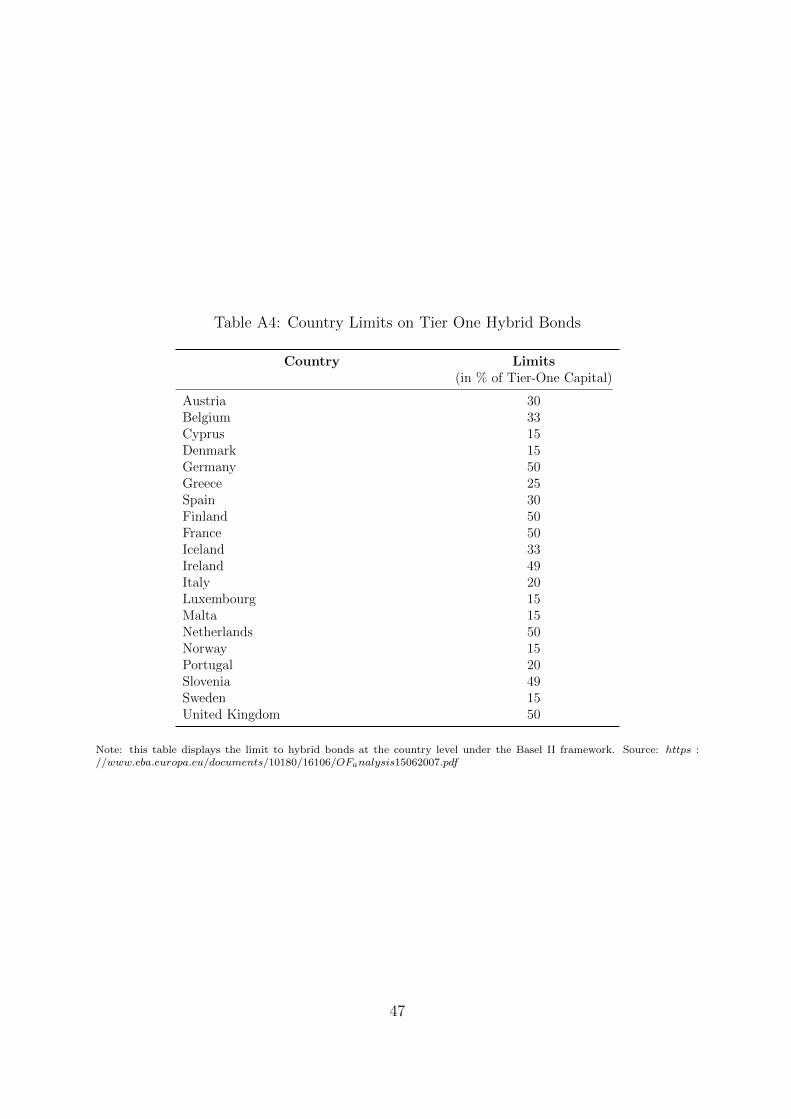
Table A4: Country Limits on Tier One Hybrid Bonds
Country Limits(in % of Tier-One Capital)
Austria 30Belgium 33Cyprus 15Denmark 15Germany 50Greece 25Spain 30Finland 50France 50Iceland 33Ireland 49Italy 20Luxembourg 15Malta 15Netherlands 50Norway 15Portugal 20Slovenia 49Sweden 15United Kingdom 50
Note: this table displays the limit to hybrid bonds at the country level under the Basel II framework. Source: https ://www.eba.europa.eu/documents/10180/16106/OFanalysis15062007.pdf
47
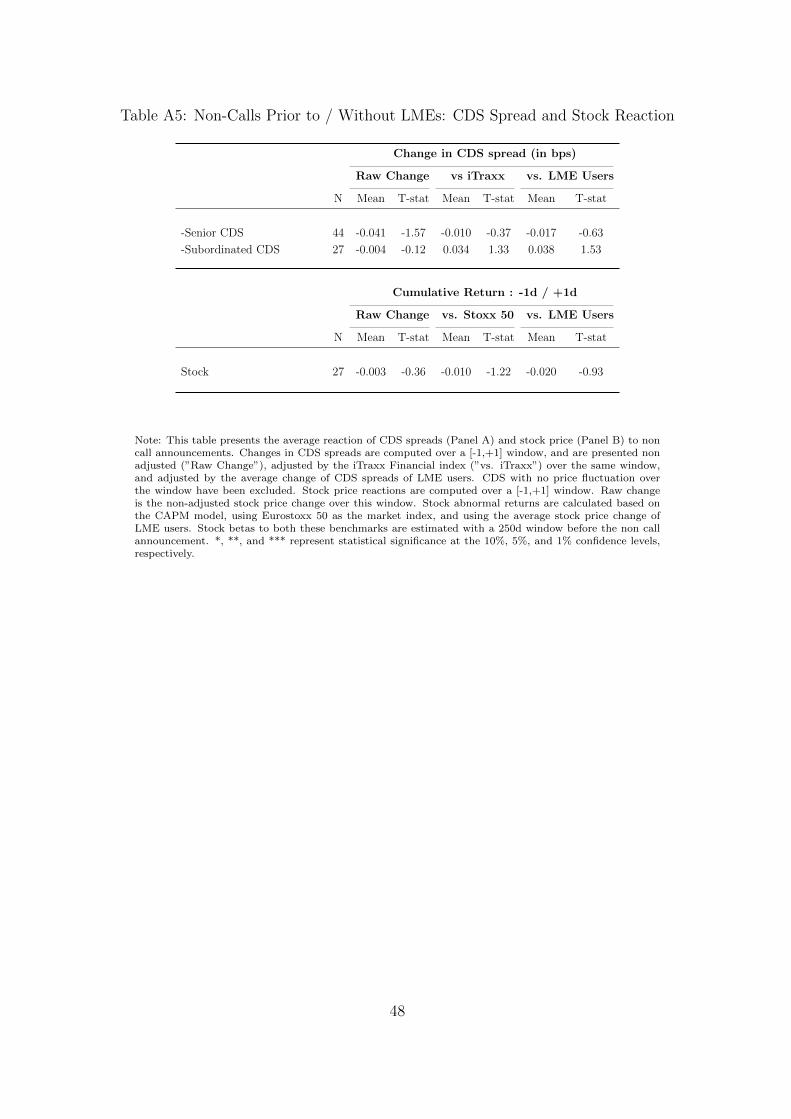
Table A5: Non-Calls Prior to / Without LMEs: CDS Spread and Stock Reaction
Change in CDS spread (in bps)
Raw Change vs iTraxx vs. LME Users
N Mean T-stat Mean T-stat Mean T-stat
-Senior CDS 44 -0.041 -1.57 -0.010 -0.37 -0.017 -0.63
-Subordinated CDS 27 -0.004 -0.12 0.034 1.33 0.038 1.53
Cumulative Return : -1d / +1d
Raw Change vs. Stoxx 50 vs. LME Users
N Mean T-stat Mean T-stat Mean T-stat
Stock 27 -0.003 -0.36 -0.010 -1.22 -0.020 -0.93
Note: This table presents the average reaction of CDS spreads (Panel A) and stock price (Panel B) to noncall announcements. Changes in CDS spreads are computed over a [-1,+1] window, and are presented nonadjusted (”Raw Change”), adjusted by the iTraxx Financial index (”vs. iTraxx”) over the same window,and adjusted by the average change of CDS spreads of LME users. CDS with no price fluctuation overthe window have been excluded. Stock price reactions are computed over a [-1,+1] window. Raw changeis the non-adjusted stock price change over this window. Stock abnormal returns are calculated based onthe CAPM model, using Eurostoxx 50 as the market index, and using the average stock price change ofLME users. Stock betas to both these benchmarks are estimated with a 250d window before the non callannouncement. *, **, and *** represent statistical significance at the 10%, 5%, and 1% confidence levels,respectively.
48