Embed Size (px)
Citation preview
CWI2014 Global Analysis
Contingent Workforce Index
HARNESSING THE WINDS OF CHANGE IS HUMANLY POSSIBLE
Propr ie tar y and Conf ident ia l , ManpowerGroup ©2014
2Sources: The primary data sources for this index are all based on December 2013 statistics from the Ministries of Labour for the 75
countries within the scope, the Central Intelligence Agency (U.S.), World Data Bank, Trading Economics, and internal data collected as
part of ManpowerGroup global reporting efforts (Annual Data Survey, Manpower Employment Outlook Survey, Talent Shortage Survey).
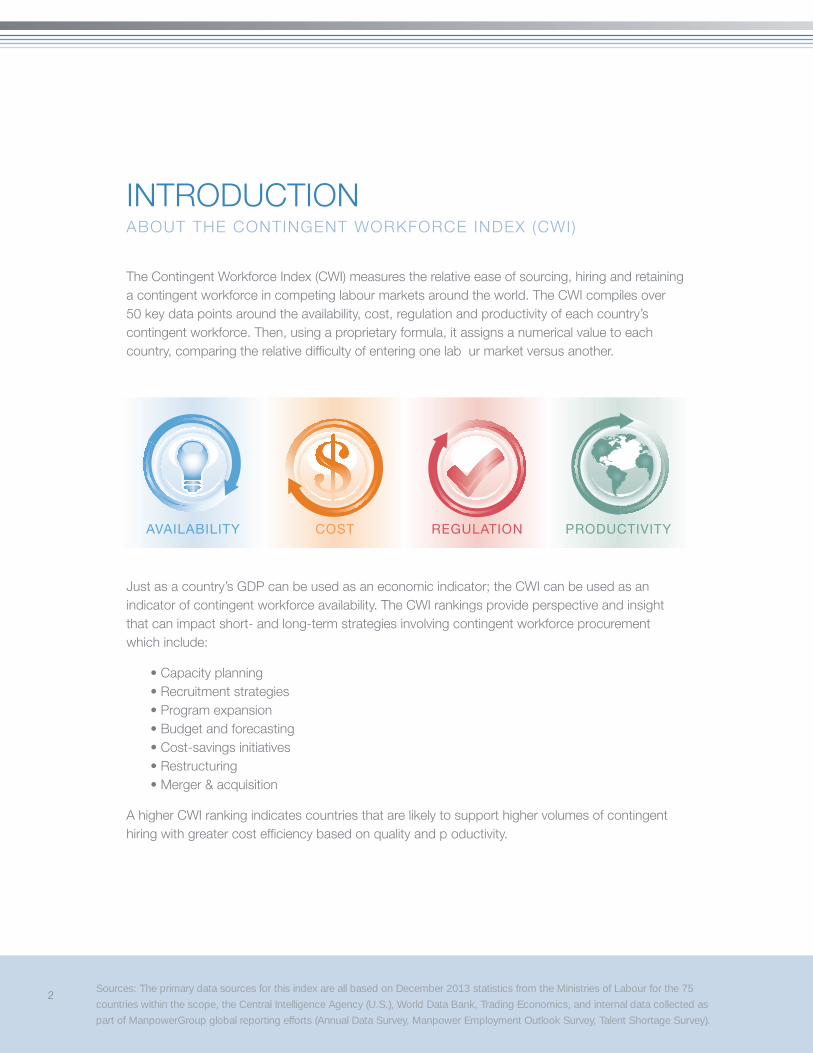
The Contingent Workforce Index (CWI) measures the relative ease of sourcing, hiring and retaining a contingent workforce in competing labour markets around the world. The CWI compiles over 50 key data points around the availability, cost, regulation and productivity of each country’s contingent workforce. Then, using a proprietary formula, it assigns a numerical value to each country, comparing the relative difficulty of entering one lab ur market versus another.
Just as a country’s GDP can be used as an economic indicator; the CWI can be used as an indicator of contingent workforce availability. The CWI rankings provide perspective and insight that can impact short- and long-term strategies involving contingent workforce procurement which include:
• Capacity planning• Recruitment strategies• Program expansion• Budget and forecasting• Cost-savings initiatives• Restructuring• Merger & acquisition
A higher CWI ranking indicates countries that are likely to support higher volumes of contingent hiring with greater cost efficiency based on quality and p oductivity.
INTRODUCTIONABOUT THE CONTINGENT WORKFORCE INDEX (CWI)
PRODUCTIVITYCOSTAVAILABILITY REGULATION
Proprietary and Confidential, ManpowerG oup ©2014 3
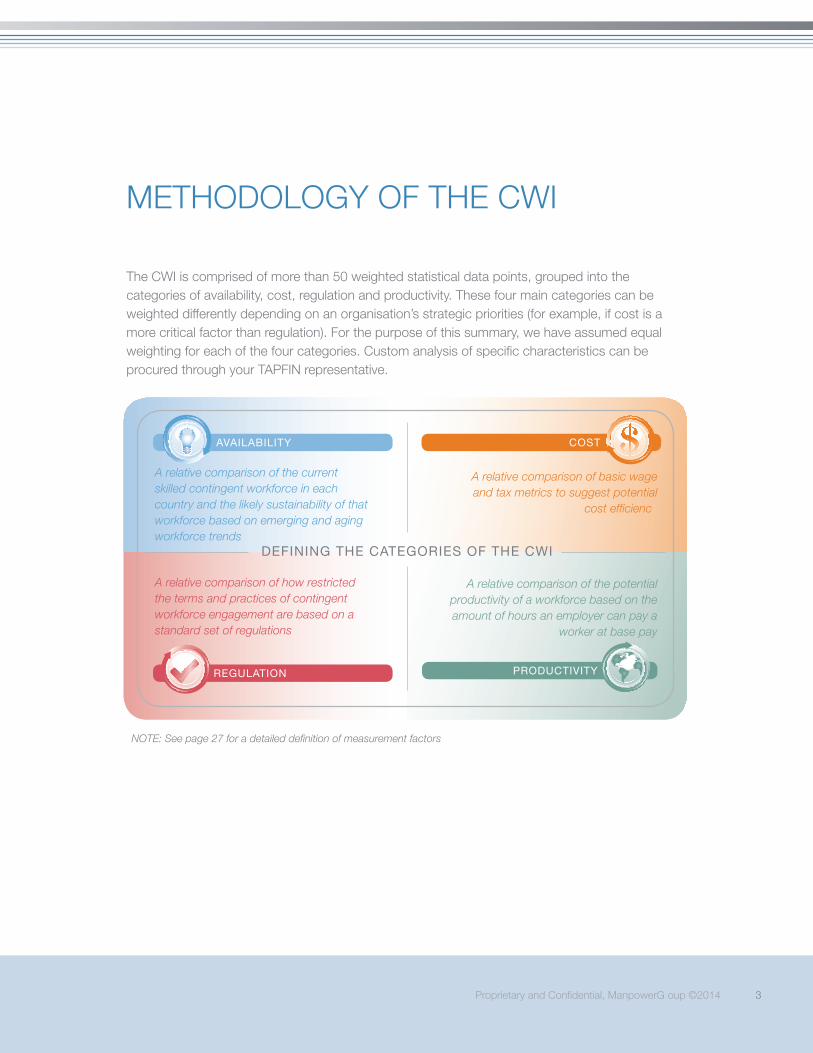
REGULATION
AVAILABILITY
A relative comparison of the current skilled contingent workforce in each country and the likely sustainability of that workforce based on emerging and aging workforce trends
DEFINING THE CATEGORIES OF THE CWI
PRODUCTIVITY
A relative comparison of the potential productivity of a workforce based on the amount of hours an employer can pay a
worker at base pay
COST
A relative comparison of basic wage and tax metrics to suggest potential
cost efficienc
A relative comparison of how restricted the terms and practices of contingent workforce engagement are based on a standard set of regulations
METHODOLOGY OF THE CWI
The CWI is comprised of more than 50 weighted statistical data points, grouped into the categories of availability, cost, regulation and productivity. These four main categories can be weighted differently depending on an organisation’s strategic priorities (for example, if cost is a more critical factor than regulation). For the purpose of this summary, we have assumed equal weighting for each of the four categories. Custom analysis of specific characteristics can beprocured through your TAPFIN representative.
NOTE: See page 27 for a detailed definition of measurement factors
4Sources: The primary data sources for this index are all based on December 2013 statistics from the Ministries of Labour for the 75
countries within the scope, the Central Intelligence Agency (U.S.), World Data Bank, Trading Economics, and internal data collected as
part of ManpowerGroup global reporting efforts (Annual Data Survey, Manpower Employment Outlook Survey, Talent Shortage Survey).
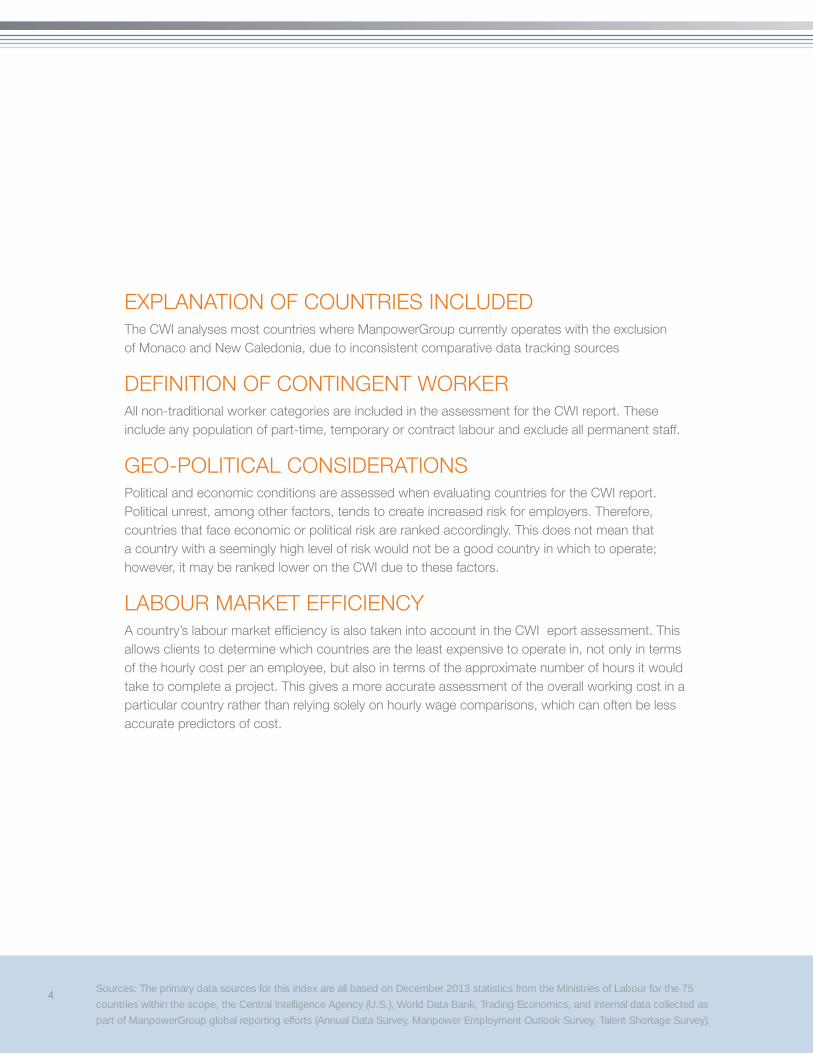
EXPLANATION OF COUNTRIES INCLUDEDThe CWI analyses most countries where ManpowerGroup currently operates with the exclusion of Monaco and New Caledonia, due to inconsistent comparative data tracking sources
DEFINITION OF CONTINGENT WORKERAll non-traditional worker categories are included in the assessment for the CWI report. These include any population of part-time, temporary or contract labour and exclude all permanent staff.
GEO-POLITICAL CONSIDERATIONSPolitical and economic conditions are assessed when evaluating countries for the CWI report. Political unrest, among other factors, tends to create increased risk for employers. Therefore, countries that face economic or political risk are ranked accordingly. This does not mean that a country with a seemingly high level of risk would not be a good country in which to operate; however, it may be ranked lower on the CWI due to these factors.
LABOUR MARKET EFFICIENCYA country’s labour market efficiency is also taken into account in the CWI eport assessment. This allows clients to determine which countries are the least expensive to operate in, not only in terms of the hourly cost per an employee, but also in terms of the approximate number of hours it would take to complete a project. This gives a more accurate assessment of the overall working cost in a particular country rather than relying solely on hourly wage comparisons, which can often be less accurate predictors of cost.
Proprietary and Confidential, ManpowerG oup ©2014 5
INTERPRETING THE CWIThe CWI assesses the extent to which a country and its contingent workforce may meet the needs of an employer. It includes a comprehensive analysis of workforce statistics, economic factors, labour regulations, cost considerations and growth trends.
Organisations can use the CWI to determine:
• Locations and availability of skilled and professional workers
• Costs of engaging with contingent workers in different countries and regions
• Productivity of contingent workers regionally and nationally
• Markets with reduced geopolitical risk
A higher CWI ranking indicates countries that are likely to support higher volumes of contingent hiring with greater cost efficienc , based on quality and productivity.
DOES YOUR ORGANISATION HAVE SPECIFIC PRIORITIES?
The CWI report utilises a proprietary
weighting system to rank 75 countries.
However, this report can be customised
to reflect your organ sation’s prospective
labour markets and workforce priorities.
Talk to your TAPFIN representative today
to learn how your organisation can receive
a custom workshop and assessment.
6Sources: The primary data sources for this index are all based on December 2013 statistics from the Ministries of Labour for the 75
countries within the scope, the Central Intelligence Agency (U.S.), World Data Bank, Trading Economics, and internal data collected as
part of ManpowerGroup global reporting efforts (Annual Data Survey, Manpower Employment Outlook Survey, Talent Shortage Survey).
CHANGES TO 2014 CWITAPFIN has improved and refined our eporting for the 2014 CWI report. This has allowed us to provide you with the most robust analysis to date. Below, you will find an explanation of the overallchanges to the CWI report. Regional and country-based explanations are included at the start of each section.
REPORTING CHANGESOur consultants utilise the CWI methodology, as well as additional labour statistics, when advising clients on their contingent workforce planning and approach. The following metrics have been added in order to ensure the CWI analysis and results reflect the constantly evolving world of work trends.
The following data points were added to 2014 CWI (as compared to the 2013 report):
• English proficiency• Secondary educational enrollment• Financial risk• Foreign business regulation• Labour market efficienc• Technical readiness• Infrastructure• Average monthly wage
CHANGES TO RANKINGSIn 2014, we place greater emphasis on the size of a country’s contingent workforce than we did in 2013. This has led to a jump in the rankings for countries with large populations and pools of contingent labour, such as China and India. Likewise, countries with smaller pools of available contingent labour have moved down in the rankings, such as the Dominican Republic and Denmark.
Additionally, we have increased the emphasis on productivity in order to more accurately reflectthe cost of working in a particular country. Therefore, countries with higher levels of contingent workforce productivity, such as Macau and the United Kingdom, have moved up in the rankings.
Proprietary and Confidential, ManpowerG oup ©2014 7
2.75
2.71
2.70
Hon
g K
ong
Uni
ted
Sta
tes
Chi
na
New
Zea
land
Sin
gap
ore
Ind
ia
Can
ada
Uni
ted
Ara
b E
mira
tes
Mal
aysi
a
Uni
ted
Kin
gdom
Sou
th A
fric
a
Phi
lipp
ines
Isra
el
Chi
le
Aus
tral
ia
Thai
land
Mac
au
Est
onia
Irela
nd
Pol
and
Pue
rto
Ric
o
Turk
ey
Jap
an
Gua
tem
ala
El S
alva
dor
2.69
2.68
2.59
2.55
2.55
2.47
2.47
2.42
2.42
2.42
2.40
2.38
2.37
2.37
2.36
2.35
2.31
2.31
2.27
2.26
2.25
2.25
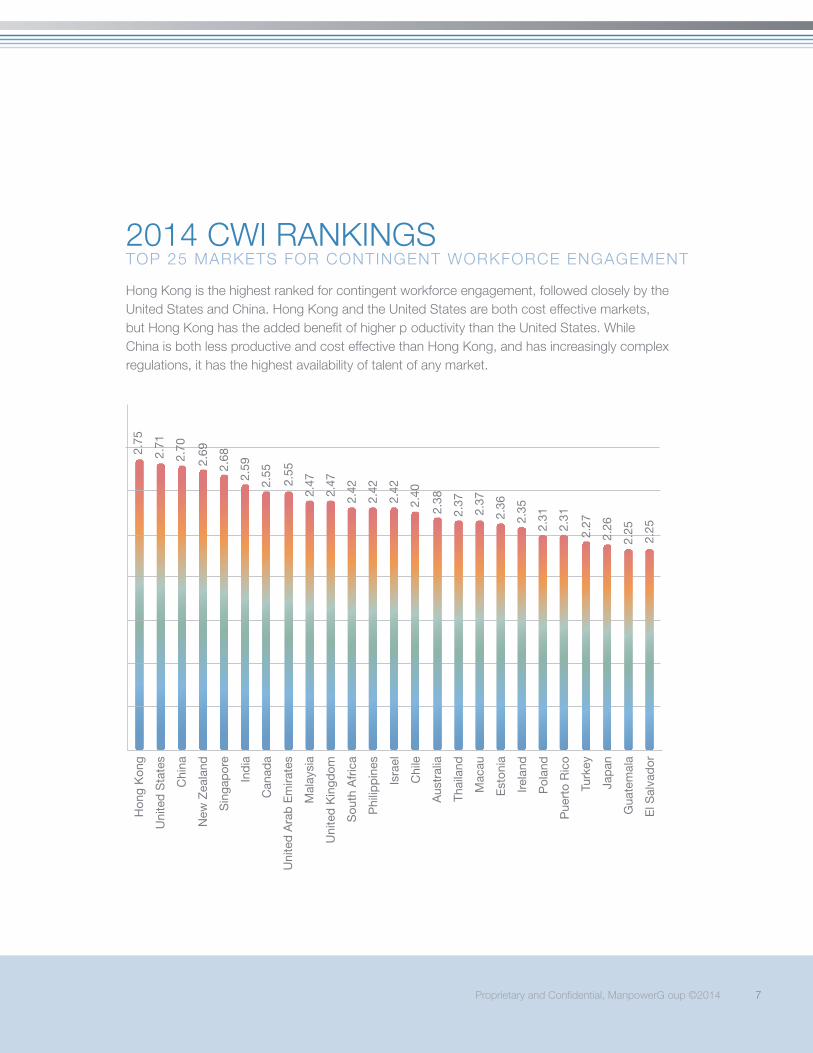
2014 CWI RANKINGSTOP 25 MARKETS FOR CONTINGENT WORKFORCE ENGAGEMENT
Hong Kong is the highest ranked for contingent workforce engagement, followed closely by the United States and China. Hong Kong and the United States are both cost effective markets, but Hong Kong has the added benefit of higher p oductivity than the United States. While China is both less productive and cost effective than Hong Kong, and has increasingly complex regulations, it has the highest availability of talent of any market.
8Sources: The primary data sources for this index are all based on December 2013 statistics from the Ministries of Labour for the 75
countries within the scope, the Central Intelligence Agency (U.S.), World Data Bank, Trading Economics, and internal data collected as
part of ManpowerGroup global reporting efforts (Annual Data Survey, Manpower Employment Outlook Survey, Talent Shortage Survey).
CHANGES FROM 2013 RANKINGS
Hong Kong has remained the highest ranked country for contingent workforce operations in 2014. This is primarily due to its extremely favorable regulatory environment mixed with a low cost of manufacturing labour (USD $7.64 per hour) and relatively high productivity due to no overtime, eight hour workdays and six day workweeks. Though availability of talent is lower in Hong Kong than other highly ranked countries on the Index, like China, it remains at levels similar to that of the United States, New Zealand and Singapore.
Interestingly, China has moved from the 16th highest ranked country on the Index in 2013 to the third highest. This ranking was impacted by weighting adjustments that emphasise workforce availability. However, the primary reason for the change is China’s well balanced mix of relatively high workforce availability, favorable wages, with an hourly manufacturing wage of USD $3.27 per hour, the current regulatory environment and medium productivity. It is important to note that over the next two years, as the use of contractors is restricted and enforced based on recent regulatory changes, that China’s ranking will likley decrease.
Australia fell from fourth place in the 2013 rankings to 15th in the 2014 rankings. Though Australia continues to have one of the more favorable regulatory environments for contingent engagements, it has a reduced cost favorability, with manufacturing wage rising to USD $38.29 per hour and a reduced workforce availability.
Proprietary and Confidential, ManpowerG oup ©2014 9
Argentina 1.78 Guatemala 2.25 Philippines 2.42
Australia 2.38 Honduras 1.74 Poland 2.31
Austria 2.06 Hong Kong 2.75 Portugal 1.97
Bahrain 2.20 Hungary 2.05 Puerto Rico 2.31
Belarus 2.13 India 2.59 Romania 2.03
Belgium 2.00 Ireland 2.35 Russia 1.93
Bolivia 1.59 Israel 2.42 Serbia 2.04
Brazil 1.85 Italy 1.75 Singapore 2.68
Bulgaria 2.05 Japan 2.26 Slovakia 1.99
Canada 2.55 Kazakhstan 2.23 Slovenia 2.01
Chile 2.40 Korea 2.09 South Africa 2.42
China 2.70 Latvia 2.23 Spain 1.88
Colombia 2.07 Lithuania 2.14 Sweden 1.90
Costa Rica 2.05 Luxembourg 1.70 Switzerland 2.13
Croatia 2.08 Macau 2.37 Taiwan 2.06
Czech Republic 2.15 Malaysia 2.47 Thailand 2.37
Denmark 2.16 Mexico 2.17 Tunisia 2.05
Dominican Republic 2.19 Morocco 1.92 Turkey 2.27
Ecuador 1.78 Netherlands 2.15 Ukraine 2.14
El Salvador 2.25 New Zealand 2.69 United Arab Emirates 2.55
Estonia 2.36 Nicaragua 2.11 United Kingdom 2.47
Finland 2.07 Norway 1.96 United States 2.71
France 1.72 Panama 2.09 Uruguay 2.22
Germany 1.87 Paraguay 2.02 Venezuela 1.38
Greece 1.85 Peru 2.12 Vietnam 2.17
COUNTRY RANKING COUNTRY RANKING COUNTRY RANKING
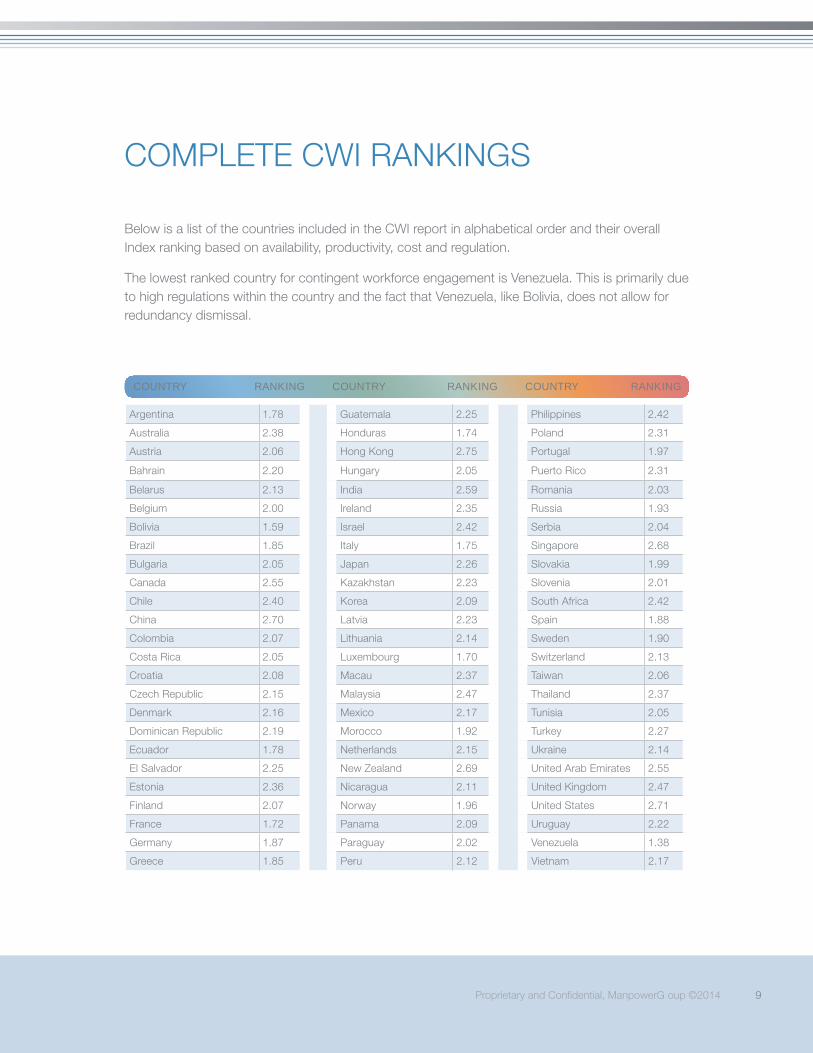
COMPLETE CWI RANKINGS
Below is a list of the countries included in the CWI report in alphabetical order and their overall Index ranking based on availability, productivity, cost and regulation.
The lowest ranked country for contingent workforce engagement is Venezuela. This is primarily due to high regulations within the country and the fact that Venezuela, like Bolivia, does not allow for redundancy dismissal.
10Sources: The primary data sources for this index are all based on December 2013 statistics from the Ministries of Labour for the 75
countries within the scope, the Central Intelligence Agency (U.S.), World Data Bank, Trading Economics, and internal data collected as
part of ManpowerGroup global reporting efforts (Annual Data Survey, Manpower Employment Outlook Survey, Talent Shortage Survey).
PRIMARY INFLUENCING FACTORS ON WORKFORCE AVAILABILITY RANKING:
• Size of local contingent workforce• Gap between age dependency and emerging workforce• Gap between age dependency and tertiary enrollment• Level of English proficienc
0.0 0.1 0.2 0.3 0.4 0.5 0.6 0.7 0.8
Singapore
Australia
New Zealand
Philippines
Ireland
Vietnam
Thailand
United States
India
China
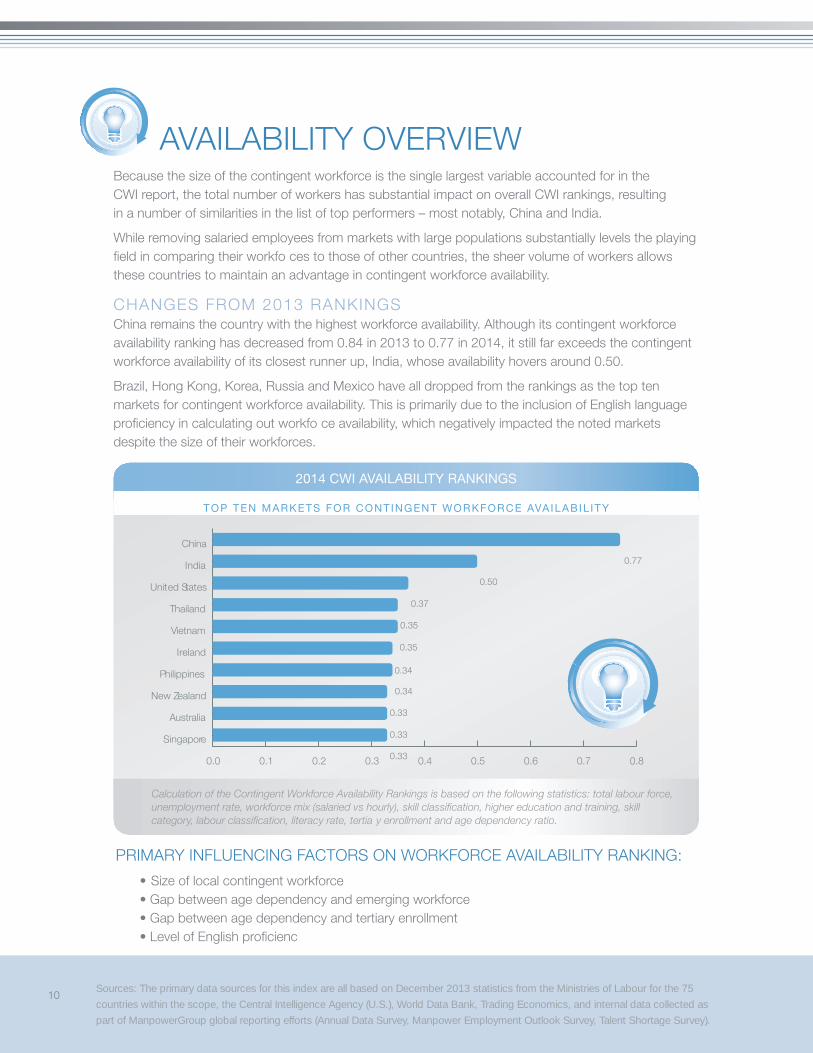
2014 CWI AVAILABILITY RANKINGS
TOP TEN MARKETS FOR CONTINGENT WORKFORCE AVAILABIL ITY
0.77
0.50
0.37
0.35
0.35
0.34
0.34
0.33
0.33
0.33
Calculation of the Contingent Workforce Availability Rankings is based on the following statistics: total labour force, unemployment rate, workforce mix (salaried vs hourly), skill classification, higher education and training, skillcategory, labour classification, literacy rate, tertia y enrollment and age dependency ratio.
AVAILABILITY OVERVIEWBecause the size of the contingent workforce is the single largest variable accounted for in the CWI report, the total number of workers has substantial impact on overall CWI rankings, resulting in a number of similarities in the list of top performers – most notably, China and India.
While removing salaried employees from markets with large populations substantially levels the playing field in comparing their workfo ces to those of other countries, the sheer volume of workers allows these countries to maintain an advantage in contingent workforce availability.
CHANGES FROM 2013 RANKINGSChina remains the country with the highest workforce availability. Although its contingent workforce availability ranking has decreased from 0.84 in 2013 to 0.77 in 2014, it still far exceeds the contingent workforce availability of its closest runner up, India, whose availability hovers around 0.50.
Brazil, Hong Kong, Korea, Russia and Mexico have all dropped from the rankings as the top ten markets for contingent workforce availability. This is primarily due to the inclusion of English language proficiency in calculating out workfo ce availability, which negatively impacted the noted markets despite the size of their workforces.
Proprietary and Confidential, ManpowerG oup ©2014 11
MAIN FACTORS INFLUENCING WORKFORCE COST RANKING:• Countries below average minimum wage (<USD $5.50/hour) had substantially
lower employer taxes and average hourly labour costs• Countries with no minimum wage were found to have higher costs in almost
every aspect of contingent workforce engagement
0.0 0.2 0.4 0.6 0.8 1.0
Panama
Ukraine
Serbia
Latvia
Guatemala
Morocco
Philippines
Chile
Thailand
India
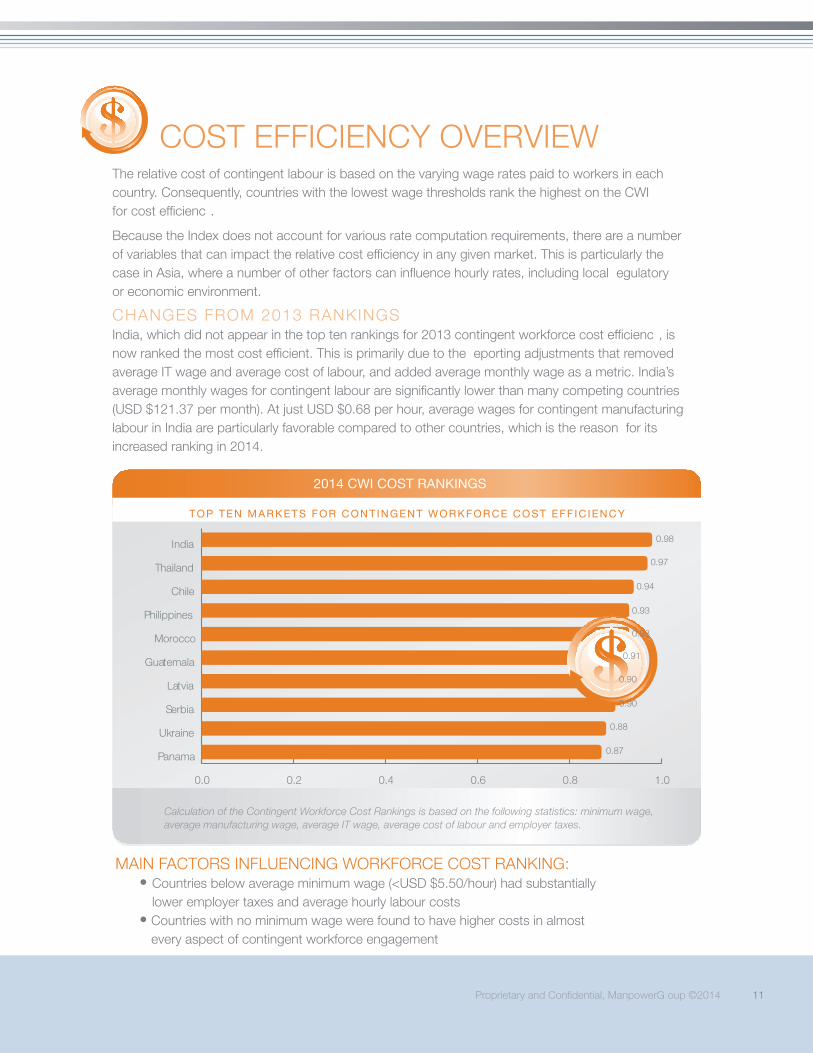
2014 CWI COST RANKINGS
TOP TEN MARKETS FOR CONTINGENT WORKFORCE COST EFF IC IENCY
0.98
0.97
0.94
0.93
0.93
0.91
0.90
0.90
0.88
0.87
Calculation of the Contingent Workforce Cost Rankings is based on the following statistics: minimum wage, average manufacturing wage, average IT wage, average cost of labour and employer taxes.
COST EFFICIENCY OVERVIEWThe relative cost of contingent labour is based on the varying wage rates paid to workers in each country. Consequently, countries with the lowest wage thresholds rank the highest on the CWI for cost efficienc .
Because the Index does not account for various rate computation requirements, there are a number of variables that can impact the relative cost efficiency in any given market. This is particularly the case in Asia, where a number of other factors can influence hourly rates, including local egulatory or economic environment.
CHANGES FROM 2013 RANKINGSIndia, which did not appear in the top ten rankings for 2013 contingent workforce cost efficienc , is now ranked the most cost efficient. This is primarily due to the eporting adjustments that removed average IT wage and average cost of labour, and added average monthly wage as a metric. India’s average monthly wages for contingent labour are significantly lower than many competing countries(USD $121.37 per month). At just USD $0.68 per hour, average wages for contingent manufacturing labour in India are particularly favorable compared to other countries, which is the reason for its increased ranking in 2014.
12Sources: The primary data sources for this index are all based on December 2013 statistics from the Ministries of Labour for the 75
countries within the scope, the Central Intelligence Agency (U.S.), World Data Bank, Trading Economics, and internal data collected as
part of ManpowerGroup global reporting efforts (Annual Data Survey, Manpower Employment Outlook Survey, Talent Shortage Survey).
0.0 0.2 0.4 0.6 0.8 1.0
Switzerland
United States
Austria
Canada
Hong Kong
United Kingdom
Australia
Singapore
Denmark
New Zealand
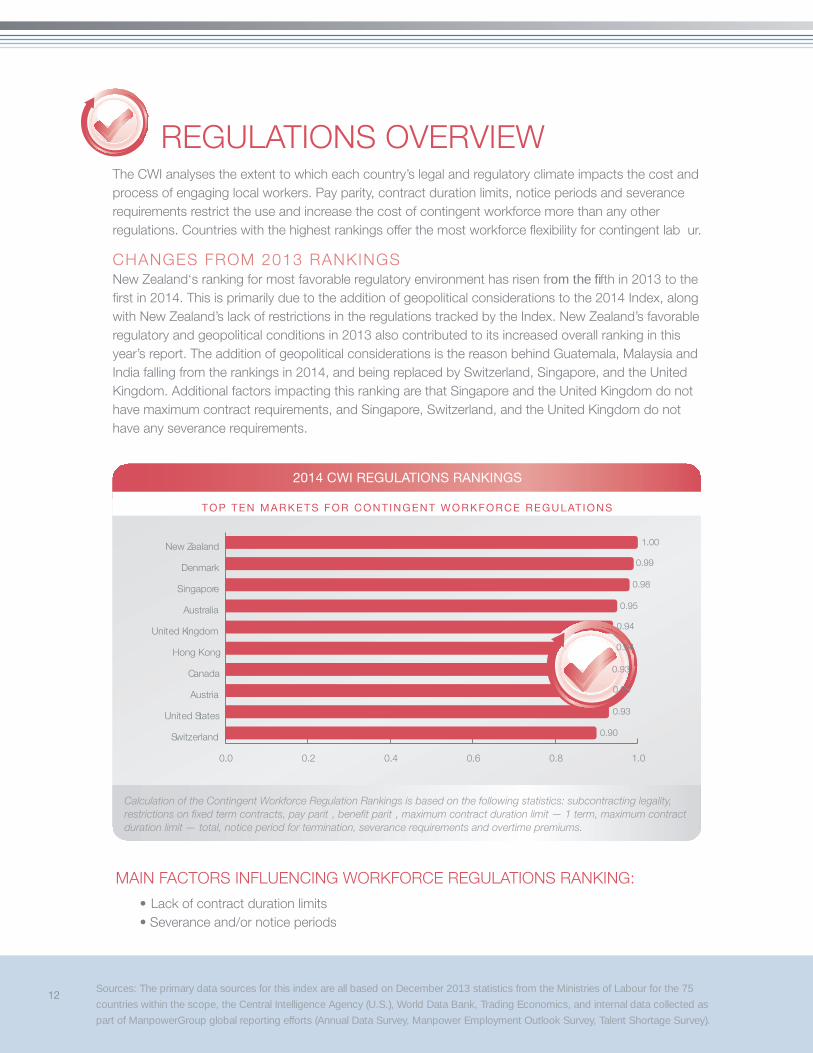
2014 CWI REGULATIONS RANKINGS
TOP TEN MARKETS FOR CONTINGENT WORKFORCE REGULAT IONS
1.00
0.99
0.98
0.95
0.94
0.94
0.93
0.93
0.93
0.90
Calculation of the Contingent Workforce Regulation Rankings is based on the following statistics: subcontracting legality, restrictions on fixed term contracts, pay parit , benefit parit , maximum contract duration limit — 1 term, maximum contract duration limit — total, notice period for termination, severance requirements and overtime premiums.
REGULATIONS OVERVIEWThe CWI analyses the extent to which each country’s legal and regulatory climate impacts the cost and process of engaging local workers. Pay parity, contract duration limits, notice periods and severance requirements restrict the use and increase the cost of contingent workforce more than any other regulations. Countries with the highest rankings offer the most workforce flexibility for contingent lab ur.
CHANGES FROM 2013 RANKINGSNew Zealand‘s ranking for most favorable regulatory environment has risen from the fifth in 2013 to the first in 2014. This is primarily due to the addition of geopolitical considerations to the 2014 Index, alongwith New Zealand’s lack of restrictions in the regulations tracked by the Index. New Zealand’s favorable regulatory and geopolitical conditions in 2013 also contributed to its increased overall ranking in this year’s report. The addition of geopolitical considerations is the reason behind Guatemala, Malaysia and India falling from the rankings in 2014, and being replaced by Switzerland, Singapore, and the United Kingdom. Additional factors impacting this ranking are that Singapore and the United Kingdom do not have maximum contract requirements, and Singapore, Switzerland, and the United Kingdom do not have any severance requirements.
MAIN FACTORS INFLUENCING WORKFORCE REGULATIONS RANKING:
• Lack of contract duration limits• Severance and/or notice periods
Proprietary and Confidential, ManpowerG oup ©2014 13
0.0 0.2 0.4 0.6 0.8 1.0
Netherlands
United Kingdom
Hong Kong
Macau
Norway
Canada
Switzerland
New Zealand
United States
Singapore
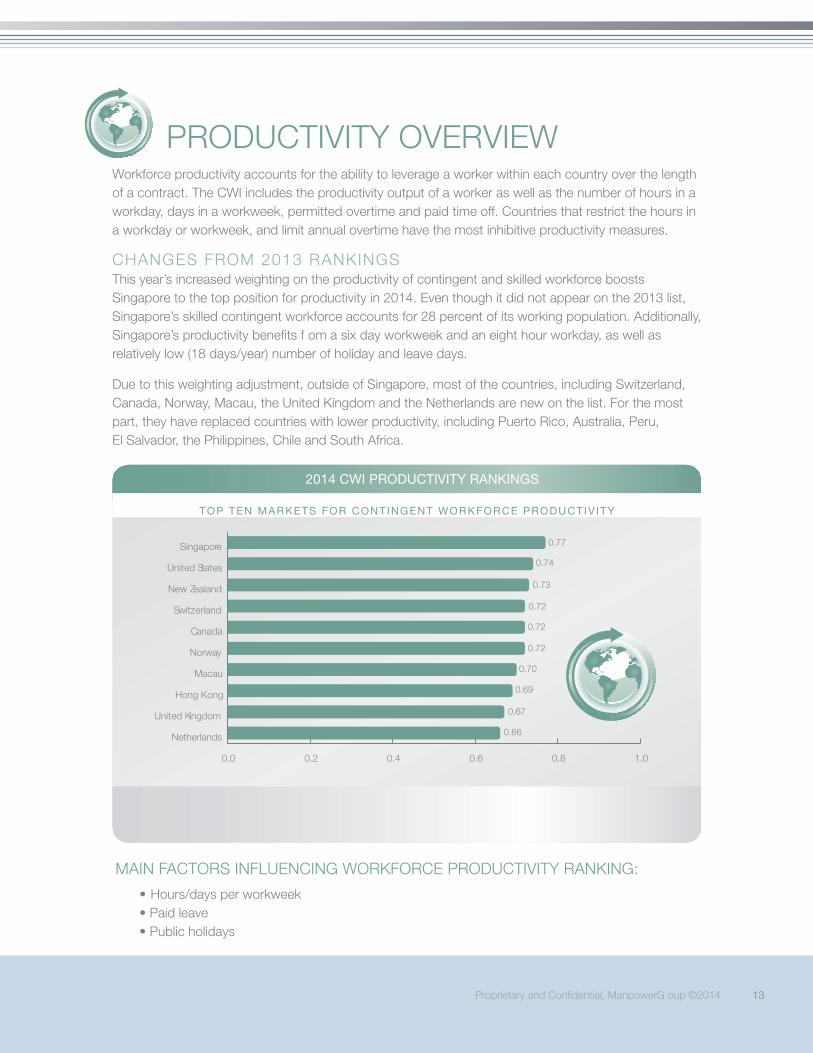
2014 CWI PRODUCTIVITY RANKINGS
TOP TEN MARKETS FOR CONTINGENT WORKFORCE PRODUCTIV ITY
0.77
0.74
0.73
0.72
0.72
0.72
0.70
0.69
0.67
0.66
PRODUCTIVITY OVERVIEWWorkforce productivity accounts for the ability to leverage a worker within each country over the length of a contract. The CWI includes the productivity output of a worker as well as the number of hours in a workday, days in a workweek, permitted overtime and paid time off. Countries that restrict the hours in a workday or workweek, and limit annual overtime have the most inhibitive productivity measures.
CHANGES FROM 2013 RANKINGSThis year’s increased weighting on the productivity of contingent and skilled workforce boosts Singapore to the top position for productivity in 2014. Even though it did not appear on the 2013 list, Singapore’s skilled contingent workforce accounts for 28 percent of its working population. Additionally, Singapore’s productivity benefits f om a six day workweek and an eight hour workday, as well as relatively low (18 days/year) number of holiday and leave days.
Due to this weighting adjustment, outside of Singapore, most of the countries, including Switzerland, Canada, Norway, Macau, the United Kingdom and the Netherlands are new on the list. For the most part, they have replaced countries with lower productivity, including Puerto Rico, Australia, Peru, El Salvador, the Philippines, Chile and South Africa.
MAIN FACTORS INFLUENCING WORKFORCE PRODUCTIVITY RANKING:
• Hours/days per workweek• Paid leave• Public holidays
14Sources: The primary data sources for this index are all based on December 2013 statistics from the Ministries of Labour for the 75
countries within the scope, the Central Intelligence Agency (U.S.), World Data Bank, Trading Economics, and internal data collected as
part of ManpowerGroup global reporting efforts (Annual Data Survey, Manpower Employment Outlook Survey, Talent Shortage Survey).
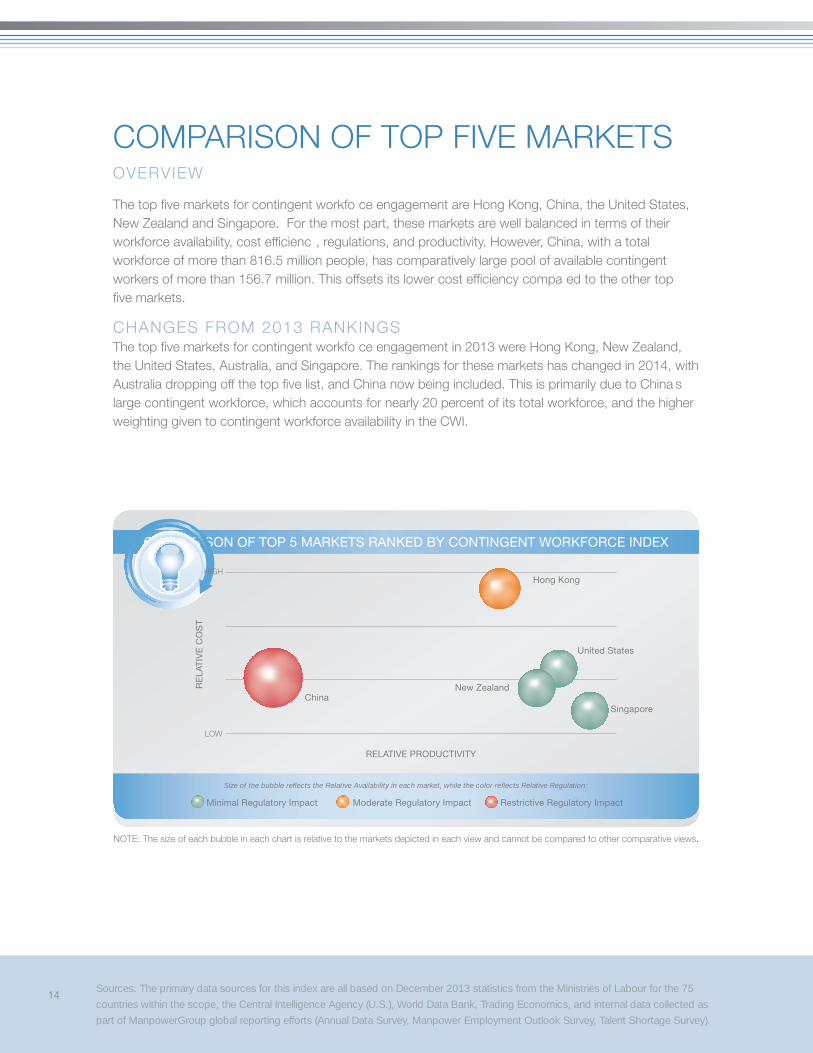
COMPARISON OF TOP FIVE MARKETSOVERVIEW
The top five markets for contingent workfo ce engagement are Hong Kong, China, the United States, New Zealand and Singapore. For the most part, these markets are well balanced in terms of their workforce availability, cost efficienc , regulations, and productivity. However, China, with a total workforce of more than 816.5 million people, has comparatively large pool of available contingent workers of more than 156.7 million. This offsets its lower cost efficiency compa ed to the other top five markets.
CHANGES FROM 2013 RANKINGSThe top five markets for contingent workfo ce engagement in 2013 were Hong Kong, New Zealand, the United States, Australia, and Singapore. The rankings for these markets has changed in 2014, with Australia dropping off the top five list, and China now being included. This is primarily due to China s large contingent workforce, which accounts for nearly 20 percent of its total workforce, and the higher weighting given to contingent workforce availability in the CWI.
Minimal Regulatory Impact Moderate Regulatory Impact Restrictive Regulatory Impact
Size of the bubble reflects the Relative Availability in each market, while the color reflects Relative Regulation:
COMPARISON OF TOP 5 MARKETS RANKED BY CONTINGENT WORKFORCE INDEX
RE
LAT
IVE
CO
ST
RELATIVE PRODUCTIVITY
Hong Kong
United States
ChinaNew Zealand
Singapore
NOTE: The size of each bubble in each chart is relative to the markets depicted in each view and cannot be compared to other comparative views.
HIGH
LOW
Proprietary and Confidential, ManpowerG oup ©2014 15
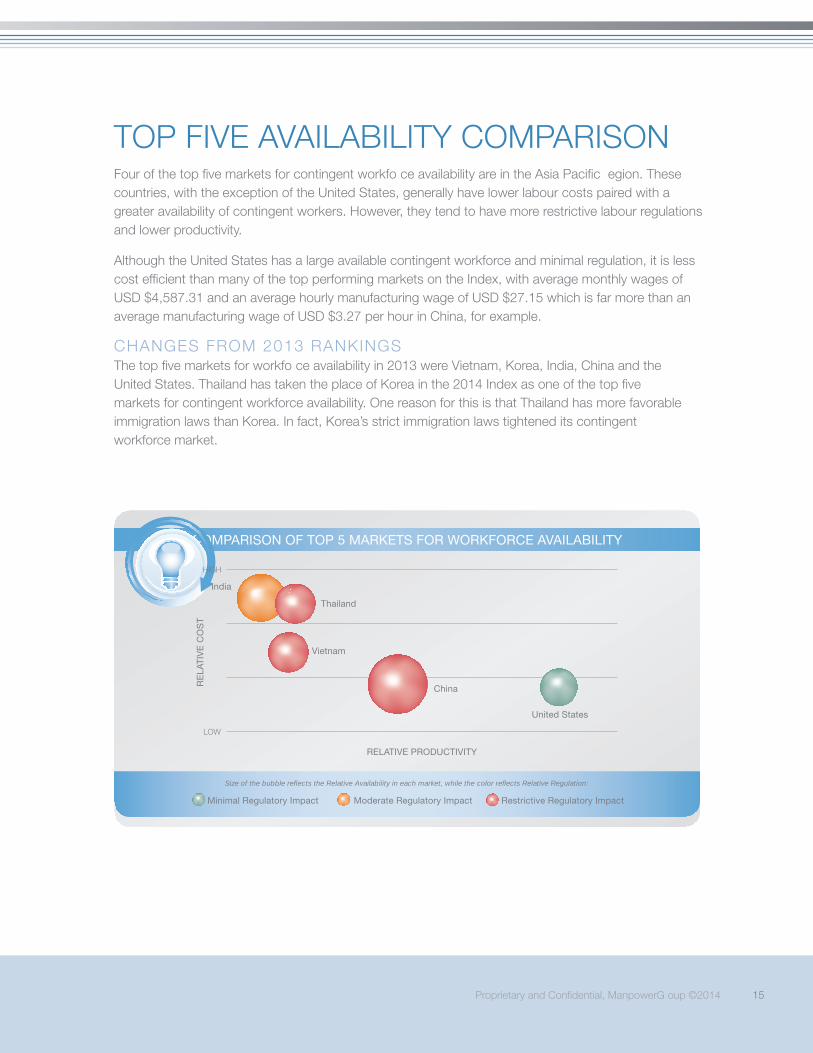
TOP FIVE AVAILABILITY COMPARISONFour of the top five markets for contingent workfo ce availability are in the Asia Pacific egion. These countries, with the exception of the United States, generally have lower labour costs paired with a greater availability of contingent workers. However, they tend to have more restrictive labour regulations and lower productivity.
Although the United States has a large available contingent workforce and minimal regulation, it is less cost efficient than many of the top performing markets on the Index, with average monthly wages ofUSD $4,587.31 and an average hourly manufacturing wage of USD $27.15 which is far more than an average manufacturing wage of USD $3.27 per hour in China, for example.
CHANGES FROM 2013 RANKINGSThe top five markets for workfo ce availability in 2013 were Vietnam, Korea, India, China and the United States. Thailand has taken the place of Korea in the 2014 Index as one of the top fivemarkets for contingent workforce availability. One reason for this is that Thailand has more favorable immigration laws than Korea. In fact, Korea’s strict immigration laws tightened its contingent workforce market.
Minimal Regulatory Impact Moderate Regulatory Impact Restrictive Regulatory Impact
Size of the bubble reflects the Relative Availability in each market, while the color reflects Relative Regulation:
COMPARISON OF TOP 5 MARKETS FOR WORKFORCE AVAILABILITY
RE
LAT
IVE
CO
ST
RELATIVE PRODUCTIVITY
Thailand
United States
India
China
Vietnam
HIGH
LOW
16Sources: The primary data sources for this index are all based on December 2013 statistics from the Ministries of Labour for the 75
countries within the scope, the Central Intelligence Agency (U.S.), World Data Bank, Trading Economics, and internal data collected as
part of ManpowerGroup global reporting efforts (Annual Data Survey, Manpower Employment Outlook Survey, Talent Shortage Survey).
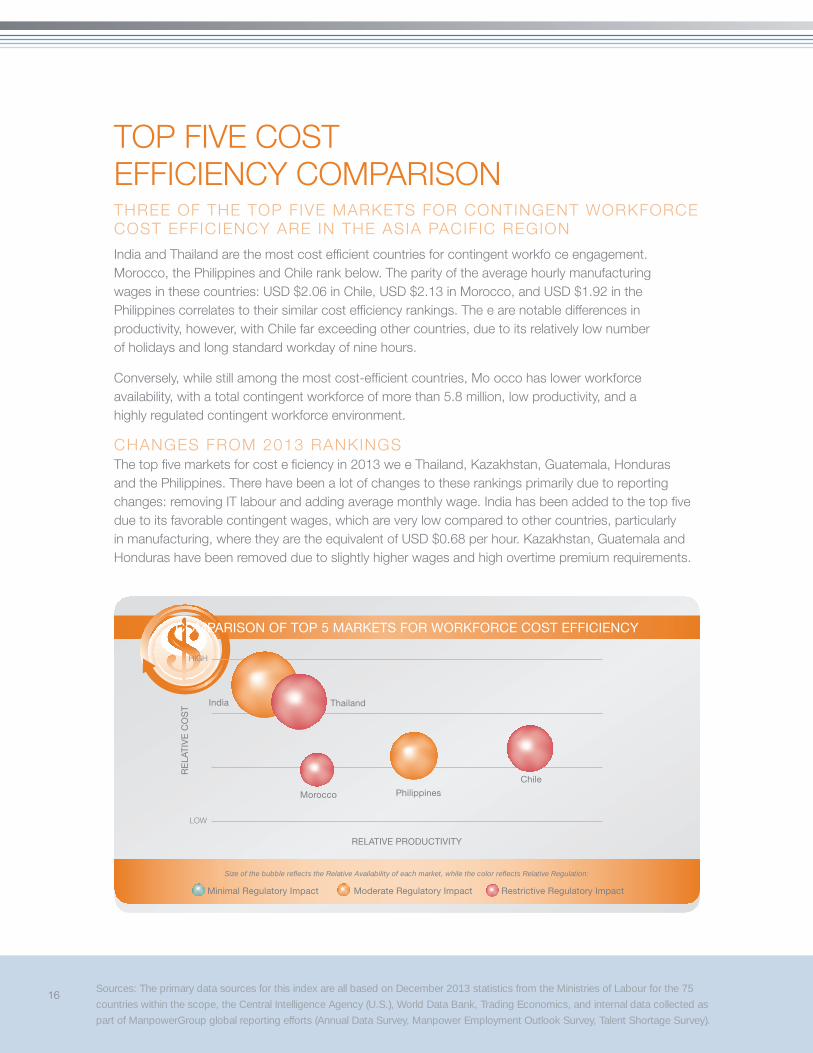
TOP FIVE COST EFFICIENCY COMPARISONTHREE OF THE TOP FIVE MARKETS FOR CONTINGENT WORKFORCE COST EFFICIENCY ARE IN THE ASIA PACIFIC REGION
India and Thailand are the most cost efficient countries for contingent workfo ce engagement. Morocco, the Philippines and Chile rank below. The parity of the average hourly manufacturing wages in these countries: USD $2.06 in Chile, USD $2.13 in Morocco, and USD $1.92 in the Philippines correlates to their similar cost efficiency rankings. The e are notable differences in productivity, however, with Chile far exceeding other countries, due to its relatively low number of holidays and long standard workday of nine hours.
Conversely, while still among the most cost-efficient countries, Mo occo has lower workforce availability, with a total contingent workforce of more than 5.8 million, low productivity, and a highly regulated contingent workforce environment.
CHANGES FROM 2013 RANKINGSThe top five markets for cost e ficiency in 2013 we e Thailand, Kazakhstan, Guatemala, Honduras and the Philippines. There have been a lot of changes to these rankings primarily due to reporting changes: removing IT labour and adding average monthly wage. India has been added to the top fivedue to its favorable contingent wages, which are very low compared to other countries, particularly in manufacturing, where they are the equivalent of USD $0.68 per hour. Kazakhstan, Guatemala and Honduras have been removed due to slightly higher wages and high overtime premium requirements.
Minimal Regulatory Impact Moderate Regulatory Impact Restrictive Regulatory Impact
Size of the bubble reflects the Relative Availability of each market, while the color reflects Relative Regulation:
COMPARISON OF TOP 5 MARKETS FOR WORKFORCE COST EFFICIENCY
Chile
Philippines
India
Morocco
Thailand
RE
LAT
IVE
CO
ST
RELATIVE PRODUCTIVITY
HIGH
LOW
Proprietary and Confidential, ManpowerG oup ©2014 17
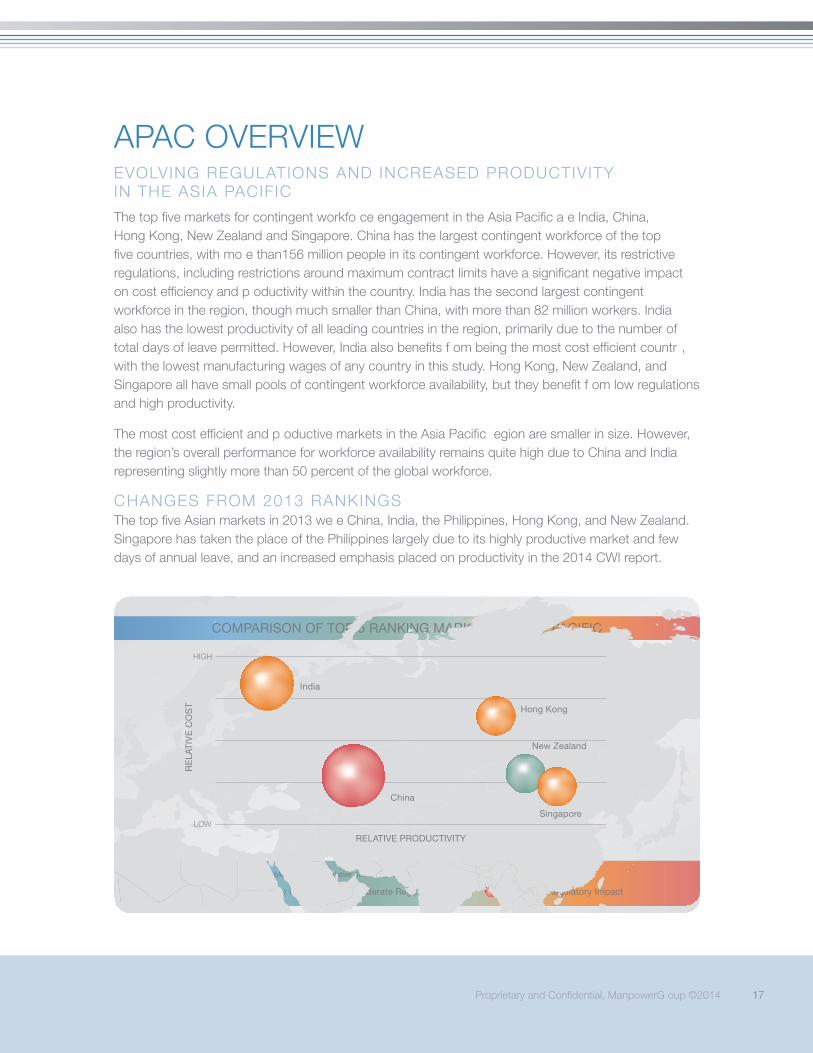
APAC OVERVIEWEVOLVING REGULATIONS AND INCREASED PRODUCTIVITY IN THE ASIA PACIFIC
The top five markets for contingent workfo ce engagement in the Asia Pacific a e India, China, Hong Kong, New Zealand and Singapore. China has the largest contingent workforce of the top five countries, with mo e than156 million people in its contingent workforce. However, its restrictive regulations, including restrictions around maximum contract limits have a significant negative impacton cost efficiency and p oductivity within the country. India has the second largest contingent workforce in the region, though much smaller than China, with more than 82 million workers. India also has the lowest productivity of all leading countries in the region, primarily due to the number of total days of leave permitted. However, India also benefits f om being the most cost efficient countr , with the lowest manufacturing wages of any country in this study. Hong Kong, New Zealand, and Singapore all have small pools of contingent workforce availability, but they benefit f om low regulations and high productivity.
The most cost efficient and p oductive markets in the Asia Pacific egion are smaller in size. However, the region’s overall performance for workforce availability remains quite high due to China and India representing slightly more than 50 percent of the global workforce.
CHANGES FROM 2013 RANKINGSThe top five Asian markets in 2013 we e China, India, the Philippines, Hong Kong, and New Zealand. Singapore has taken the place of the Philippines largely due to its highly productive market and few days of annual leave, and an increased emphasis placed on productivity in the 2014 CWI report.
COMPARISON OF TOP 5 RANKING MARKETS IN ASIA PACIFIC
Minimal Regulatory Impact Moderate Regulatory Impact Restrictive Regulatory Impact
Size of the bubble reflects the Relative Availability of each market, while the color reflects Relative Regulation:
Singapore
Hong Kong
New Zealand
China
India
RE
LAT
IVE
CO
ST
RELATIVE PRODUCTIVITY
HIGH
LOW
18Sources: The primary data sources for this index are all based on December 2013 statistics from the Ministries of Labour for the 75
countries within the scope, the Central Intelligence Agency (U.S.), World Data Bank, Trading Economics, and internal data collected as
part of ManpowerGroup global reporting efforts (Annual Data Survey, Manpower Employment Outlook Survey, Talent Shortage Survey).
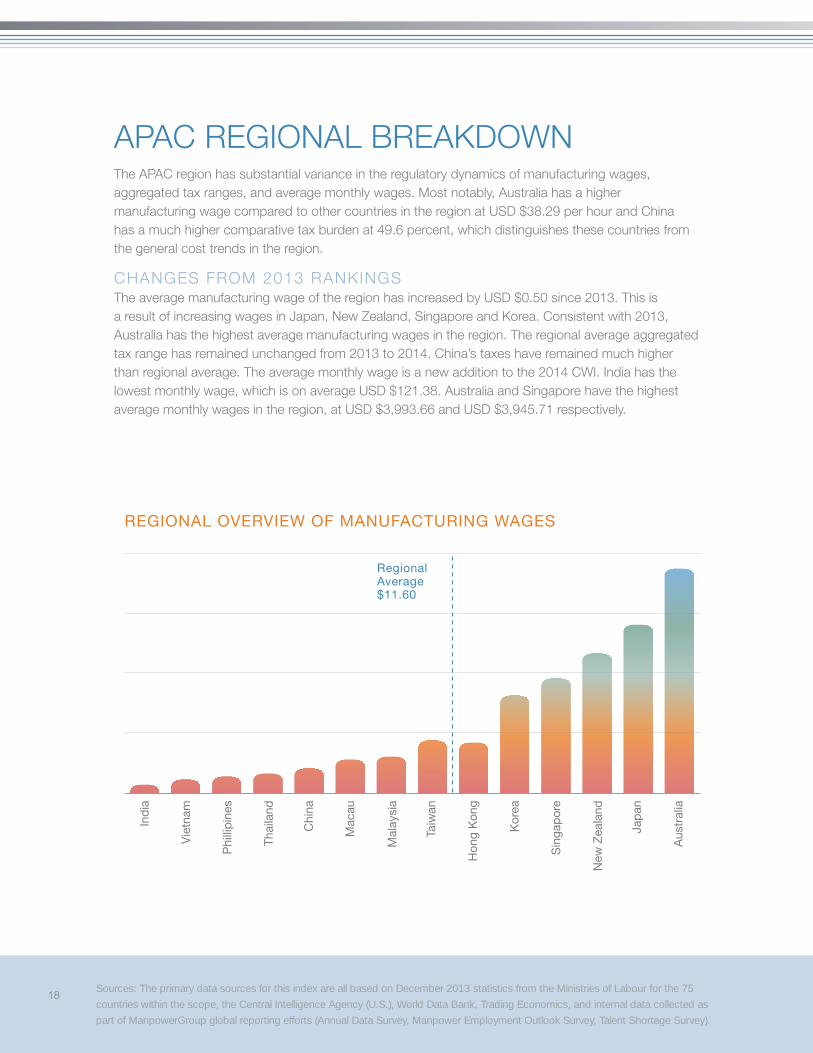
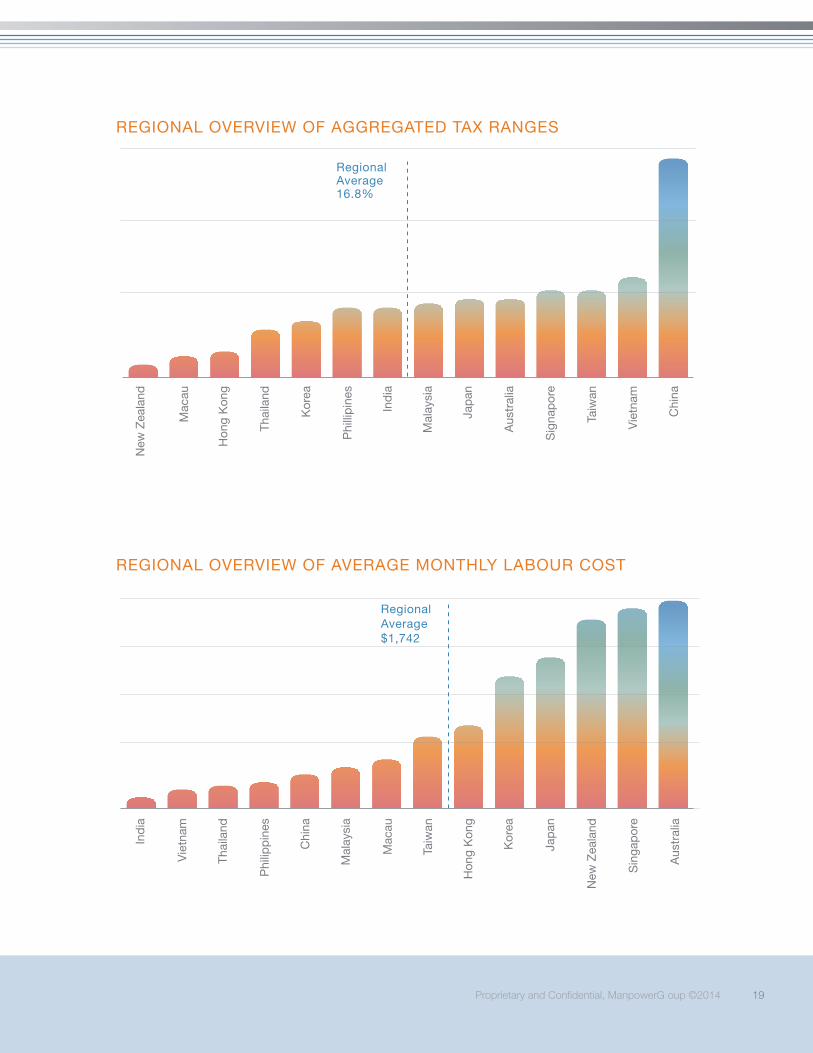
APAC REGIONAL BREAKDOWNThe APAC region has substantial variance in the regulatory dynamics of manufacturing wages, aggregated tax ranges, and average monthly wages. Most notably, Australia has a higher manufacturing wage compared to other countries in the region at USD $38.29 per hour and China has a much higher comparative tax burden at 49.6 percent, which distinguishes these countries from the general cost trends in the region.
CHANGES FROM 2013 RANKINGSThe average manufacturing wage of the region has increased by USD $0.50 since 2013. This is a result of increasing wages in Japan, New Zealand, Singapore and Korea. Consistent with 2013, Australia has the highest average manufacturing wages in the region. The regional average aggregated tax range has remained unchanged from 2013 to 2014. China’s taxes have remained much higher than regional average. The average monthly wage is a new addition to the 2014 CWI. India has the lowest monthly wage, which is on average USD $121.38. Australia and Singapore have the highest average monthly wages in the region, at USD $3,993.66 and USD $3,945.71 respectively.
Ind
ia
REGIONAL OVERVIEW OF MANUFACTURING WAGES
Regional Average $11.60
Vie
tnam
Phi
llip
ines
Thai
land
Chi
na
Mac
au
Mal
aysi
a
Taiw
an
Hon
g K
ong
Kor
ea
Sin
gap
ore
New
Zea
land
Jap
an
Aus
tral
ia
Proprietary and Confidential, ManpowerG oup ©2014 19
New
Zea
land
REGIONAL OVERVIEW OF AGGREGATED TAX RANGES
Regional Average 16.8%
Ind
ia
REGIONAL OVERVIEW OF AVERAGE MONTHLY LABOUR COST
Regional Average $1,742
Mac
au
Hon
g K
ong
Thai
land
Kor
ea
Phi
llip
ines
Ind
ia
Mal
aysi
a
Jap
an
Aus
tral
ia
Sig
nap
ore
Taiw
an
Vie
tnam
Chi
na
Vie
tnam
Thai
land
Phi
lipp
ines
Chi
na
Mal
aysi
a
Mac
au
Taiw
an
Hon
g K
ong
Kor
ea
Jap
an
New
Zea
land
Sin
gap
ore
Aus
tral
ia
20Sources: The primary data sources for this index are all based on December 2013 statistics from the Ministries of Labour for the 75
countries within the scope, the Central Intelligence Agency (U.S.), World Data Bank, Trading Economics, and internal data collected as
part of ManpowerGroup global reporting efforts (Annual Data Survey, Manpower Employment Outlook Survey, Talent Shortage Survey).
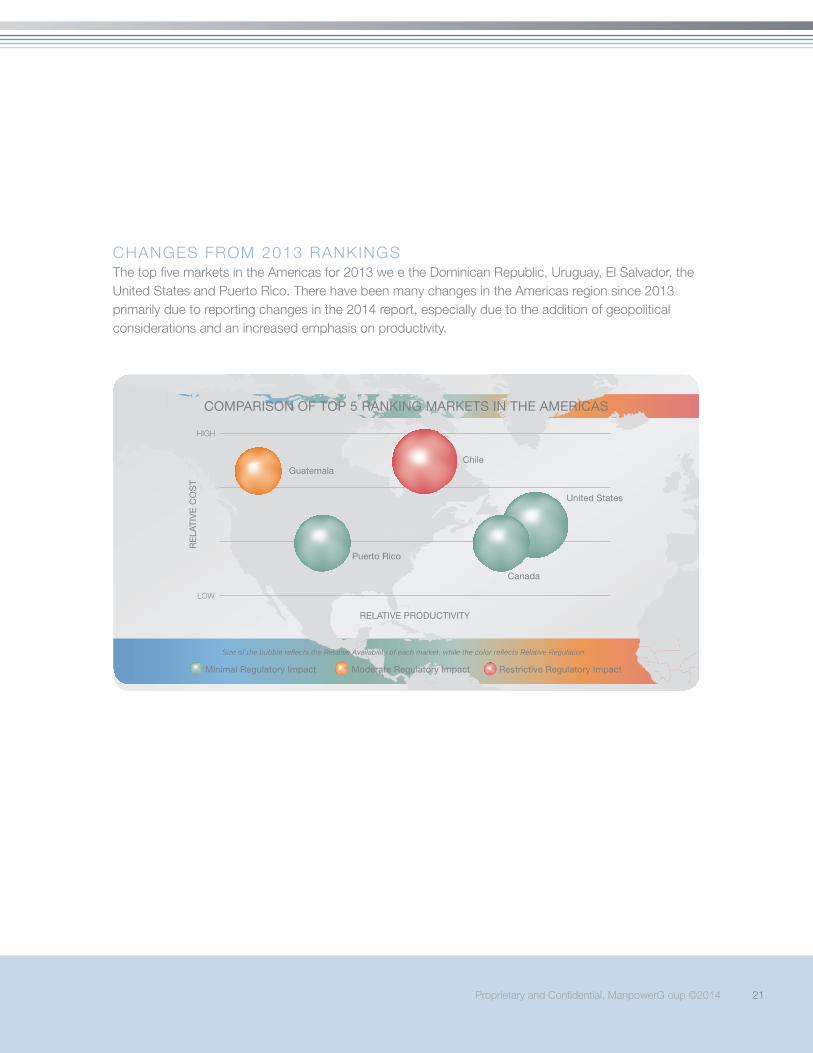
AMERICAS OVERVIEWTHE REGION PROVIDES A MIXED BAG OF CONTINGENT WORKFORCE MARKETS
Countries in the Americas with the top five contingentworkforce markets are Guatemala, Puerto Rico, Chile, the United States and Canada. The United States and Canada stand out for having substantially large contingent workforces for the region, at more than nine million people and 2.5 million people respectively, minimal regulatory impact, and high productivity. While Chile has a large contingent workforce (>2.3 million workers) and favorable cost factors (average monthly wage of just USD $1,318.33 compared to the United States’ USD $4,587.31), it is also encumbered by restrictive regulations and lower productivity. Puerto Rico has a small contingent workforce (156,048 workers) and lower costs than the United States and Canada (USD $2,223.00 on average per month). Puerto Rico also has lower productivity than the United States and Canada and a moderate regulatory environment.
Guatemala has a large contingent workforce compared to its population, at more than three million workers. However, Guatemala has the lowest productivity of the top five Americas markets, though it does o fer favorable cost, with an average monthly wage of just USD $333.92. It is worth noting that, while moderate compared to other countries, the local regulations in Latin America are often complex, particularly when it comes to worker classification and engagement parameters.
Proprietary and Confidential, ManpowerG oup ©2014 21
RE
LAT
IVE
CO
ST
RELATIVE PRODUCTIVITY
COMPARISON OF TOP 5 RANKING MARKETS IN THE AMERICAS
Minimal Regulatory Impact Moderate Regulatory Impact Restrictive Regulatory Impact
Size of the bubble reflects the Relative Availability of each market, while the color reflects Relative Regulation:
RE
LAT
IVE
CO
ST
RELATIVE PRODUCTIVITY
GuatemalaChile
Puerto Rico
Canada
United States
CHANGES FROM 2013 RANKINGSThe top five markets in the Americas for 2013 we e the Dominican Republic, Uruguay, El Salvador, the United States and Puerto Rico. There have been many changes in the Americas region since 2013 primarily due to reporting changes in the 2014 report, especially due to the addition of geopolitical considerations and an increased emphasis on productivity.
HIGH
LOW
22Sources: The primary data sources for this index are all based on December 2013 statistics from the Ministries of Labour for the 75
countries within the scope, the Central Intelligence Agency (U.S.), World Data Bank, Trading Economics, and internal data collected as
part of ManpowerGroup global reporting efforts (Annual Data Survey, Manpower Employment Outlook Survey, Talent Shortage Survey).
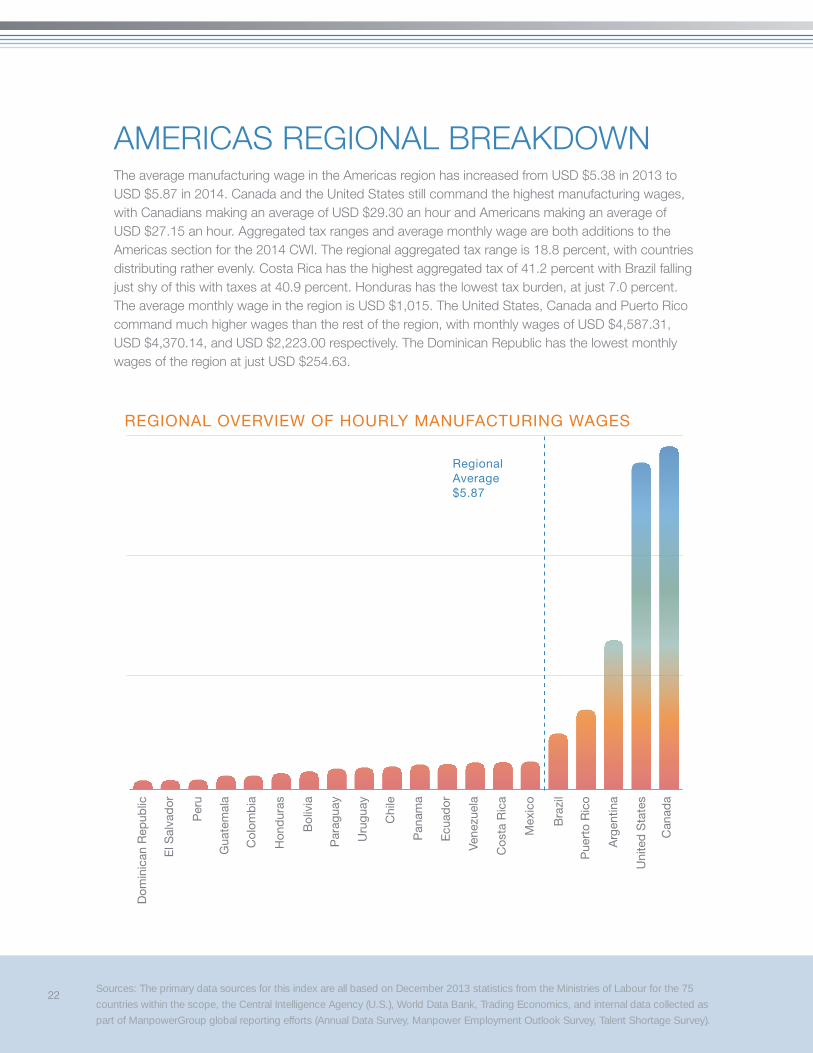
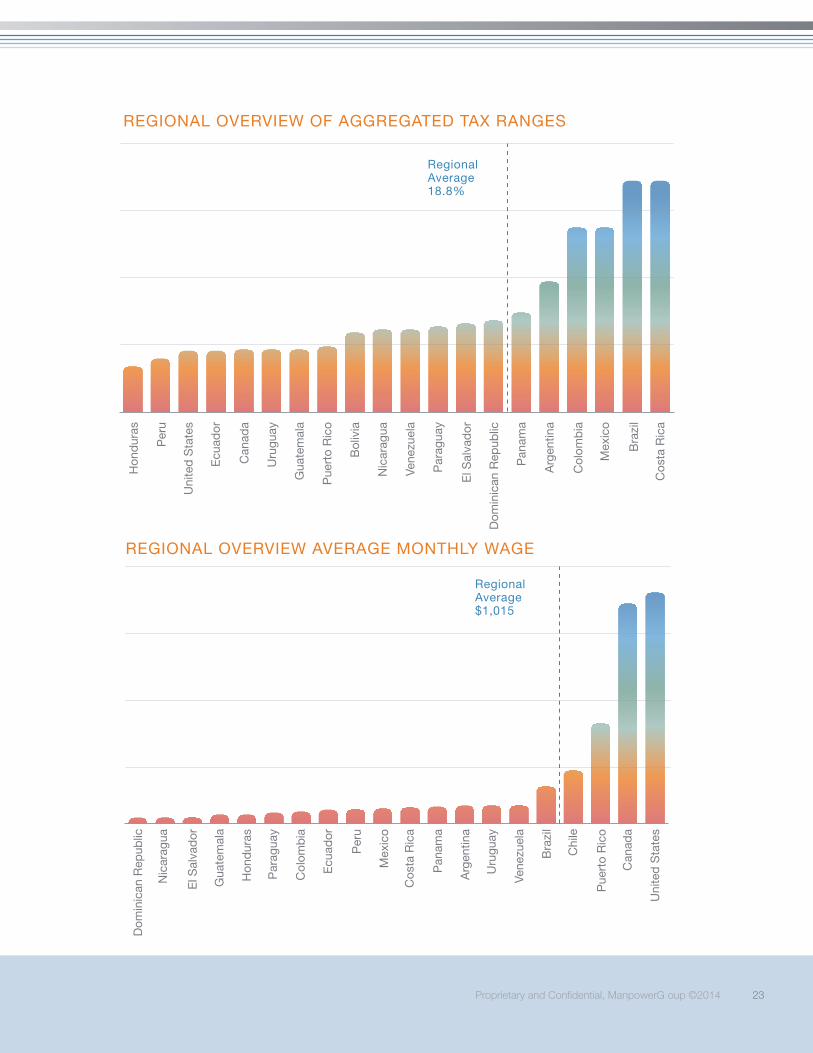
AMERICAS REGIONAL BREAKDOWNThe average manufacturing wage in the Americas region has increased from USD $5.38 in 2013 to USD $5.87 in 2014. Canada and the United States still command the highest manufacturing wages, with Canadians making an average of USD $29.30 an hour and Americans making an average of USD $27.15 an hour. Aggregated tax ranges and average monthly wage are both additions to the Americas section for the 2014 CWI. The regional aggregated tax range is 18.8 percent, with countries distributing rather evenly. Costa Rica has the highest aggregated tax of 41.2 percent with Brazil falling just shy of this with taxes at 40.9 percent. Honduras has the lowest tax burden, at just 7.0 percent. The average monthly wage in the region is USD $1,015. The United States, Canada and Puerto Rico command much higher wages than the rest of the region, with monthly wages of USD $4,587.31, USD $4,370.14, and USD $2,223.00 respectively. The Dominican Republic has the lowest monthly wages of the region at just USD $254.63.
Dom
inic
an R
epub
lic
REGIONAL OVERVIEW OF HOURLY MANUFACTURING WAGES
Regional Average $5.87
El S
alva
dor
Per
u
Gua
tem
ala
Col
omb
ia
Hon
dur
as
Bol
ivia
Par
agua
y
Uru
guay
Chi
le
Pan
ama
Ecu
ador
Vene
zuel
a
Cos
ta R
ica
Mex
ico
Bra
zil
Pue
rto
Ric
o
Arg
entin
a
Uni
ted
Sta
tes
Can
ada
Proprietary and Confidential, ManpowerG oup ©2014 23
Hon
dur
asREGIONAL OVERVIEW OF AGGREGATED TAX RANGES
Regional Average 18.8%
Per
u
Uni
ted
Sta
tes
Ecu
ador
Can
ada
Uru
guay
Gua
tem
ala
Pue
rto
Ric
o
Bol
ivia
Nic
arag
ua
Vene
zuel
a
Par
agua
y
El S
alva
dor
Dom
inic
an R
epub
lic
Pan
ama
Arg
entin
a
Col
omb
ia
Mex
ico
Bra
zil
Cos
ta R
ica
REGIONAL OVERVIEW AVERAGE MONTHLY WAGE
Dom
inic
an R
epub
lic
Nic
arag
ua
El S
alva
dor
Gua
tem
ala
Hon
dur
as
Par
agua
y
Col
omb
ia
Ecu
ador
Per
u
Mex
ico
Cos
ta R
ica
Pan
ama
Arg
entin
a
Uru
guay
Vene
zuel
a
Bra
zil
Chi
le
Pue
rto
Ric
o
Can
ada
Uni
ted
Sta
tes
Regional Average $1,015
24Sources: The primary data sources for this index are all based on December 2013 statistics from the Ministries of Labour for the 75
countries within the scope, the Central Intelligence Agency (U.S.), World Data Bank, Trading Economics, and internal data collected as
part of ManpowerGroup global reporting efforts (Annual Data Survey, Manpower Employment Outlook Survey, Talent Shortage Survey).
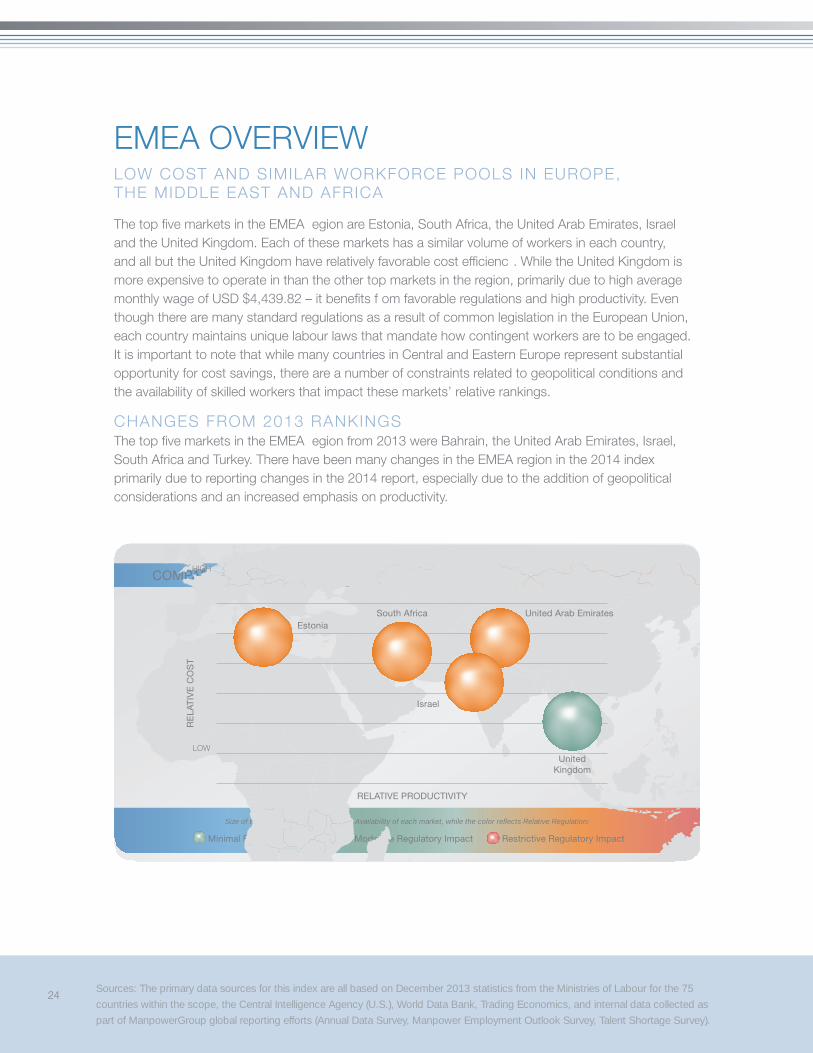
EMEA OVERVIEWLOW COST AND SIMILAR WORKFORCE POOLS IN EUROPE, THE MIDDLE EAST AND AFRICA
The top five markets in the EMEA egion are Estonia, South Africa, the United Arab Emirates, Israel and the United Kingdom. Each of these markets has a similar volume of workers in each country, and all but the United Kingdom have relatively favorable cost efficienc . While the United Kingdom is more expensive to operate in than the other top markets in the region, primarily due to high average monthly wage of USD $4,439.82 – it benefits f om favorable regulations and high productivity. Even though there are many standard regulations as a result of common legislation in the European Union, each country maintains unique labour laws that mandate how contingent workers are to be engaged. It is important to note that while many countries in Central and Eastern Europe represent substantial opportunity for cost savings, there are a number of constraints related to geopolitical conditions and the availability of skilled workers that impact these markets’ relative rankings.
CHANGES FROM 2013 RANKINGSThe top five markets in the EMEA egion from 2013 were Bahrain, the United Arab Emirates, Israel, South Africa and Turkey. There have been many changes in the EMEA region in the 2014 index primarily due to reporting changes in the 2014 report, especially due to the addition of geopolitical considerations and an increased emphasis on productivity.
COMPARISON OF TOP 5 RANKING MARKETS IN EUROPE, MIDDLE EAST, AFRICA
RE
LAT
IVE
CO
ST
RELATIVE PRODUCTIVITY
Minimal Regulatory Impact Moderate Regulatory Impact Restrictive Regulatory Impact
Size of the bubble reflects the Relative Availability of each market, while the color reflects Relative Regulation:
Estonia United Arab Emirates
Israel
South Africa
United Kingdom
COMPARISON OF TOP 5 RANKING MARKETS IN EUROPE, MIDDLE EAST, AFRICA
Minimal Regulatory Impact Moderate Regulatory Impact Restrictive Regulatory Impact
Size of the bubble reflects the Relative Availability of each market, while the color reflects Relative Regulation:
Estonia
RE
LAT
IVE
CO
ST
RELATIVE PRODUCTIVITY
South Africa
Israel
United Arab Emirates
UnitedKingdom
HIGH
LOW
Proprietary and Confidential, ManpowerG oup ©2014 25
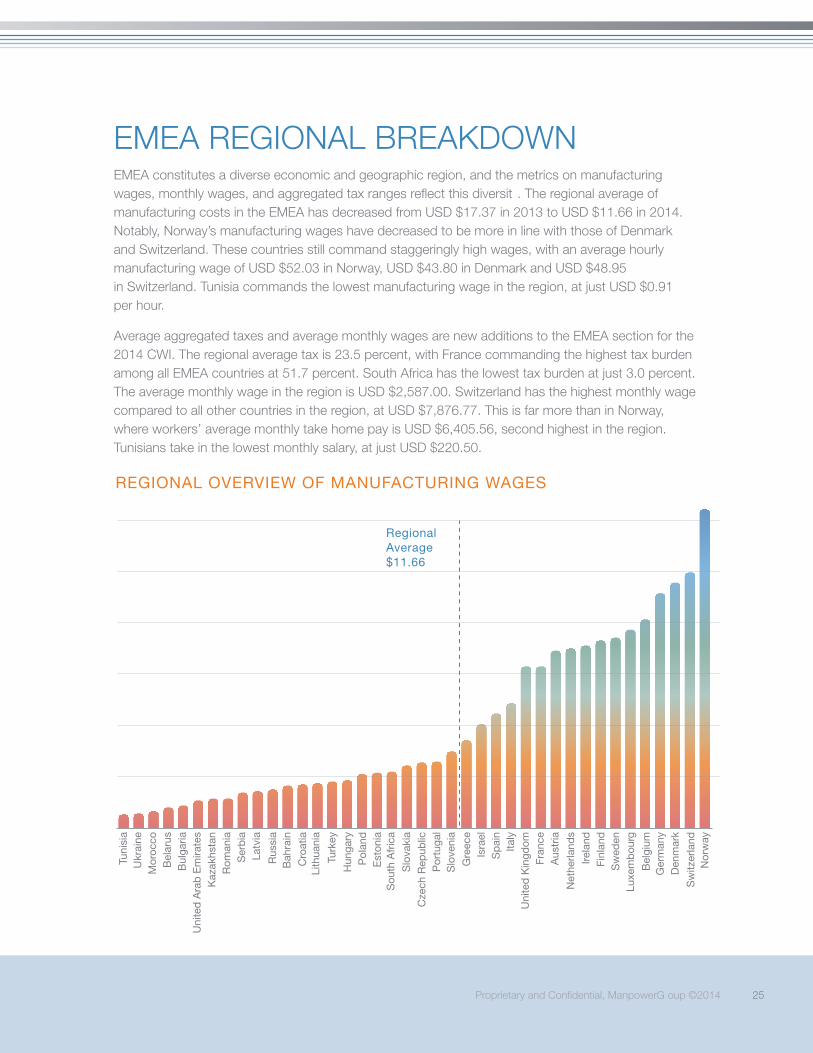
EMEA REGIONAL BREAKDOWNEMEA constitutes a diverse economic and geographic region, and the metrics on manufacturing wages, monthly wages, and aggregated tax ranges reflect this diversit . The regional average of manufacturing costs in the EMEA has decreased from USD $17.37 in 2013 to USD $11.66 in 2014. Notably, Norway’s manufacturing wages have decreased to be more in line with those of Denmark and Switzerland. These countries still command staggeringly high wages, with an average hourly manufacturing wage of USD $52.03 in Norway, USD $43.80 in Denmark and USD $48.95 in Switzerland. Tunisia commands the lowest manufacturing wage in the region, at just USD $0.91 per hour.
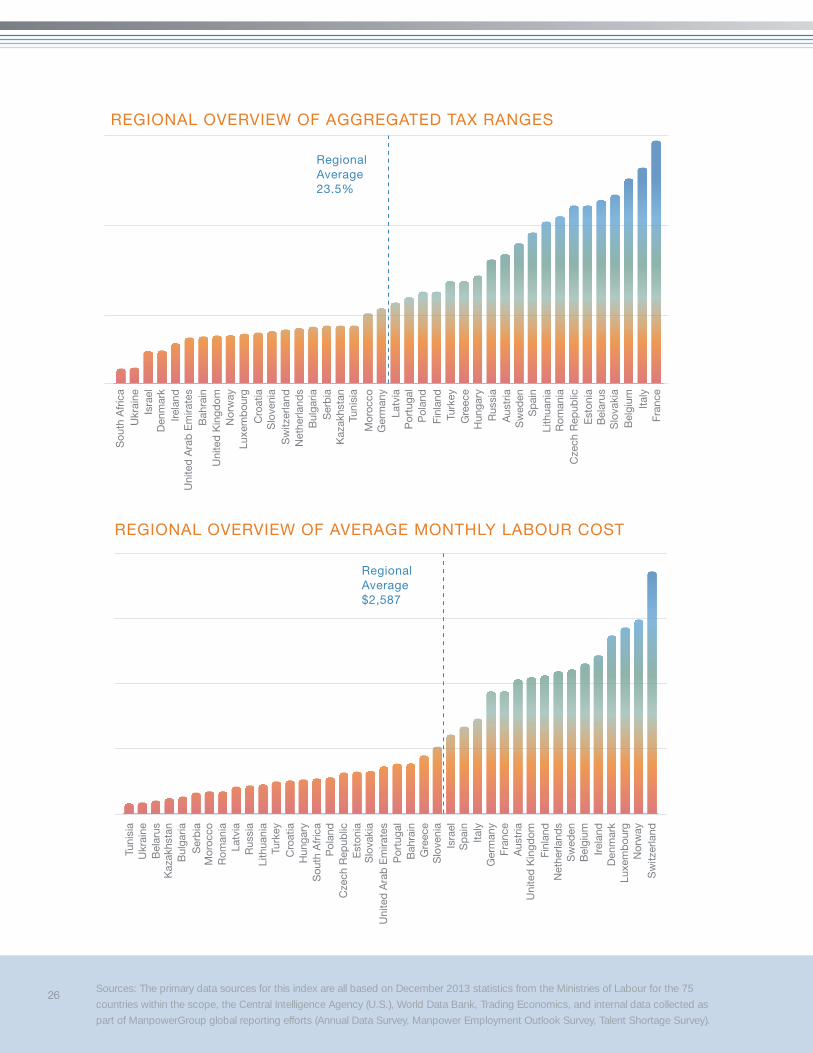
Average aggregated taxes and average monthly wages are new additions to the EMEA section for the 2014 CWI. The regional average tax is 23.5 percent, with France commanding the highest tax burden among all EMEA countries at 51.7 percent. South Africa has the lowest tax burden at just 3.0 percent. The average monthly wage in the region is USD $2,587.00. Switzerland has the highest monthly wage compared to all other countries in the region, at USD $7,876.77. This is far more than in Norway, where workers’ average monthly take home pay is USD $6,405.56, second highest in the region. Tunisians take in the lowest monthly salary, at just USD $220.50.
REGIONAL OVERVIEW OF MANUFACTURING WAGES
Regional Average $11.66
Tuni
sia
Ukr
aine
Mor
occo
B
elar
usB
ulga
riaU
nite
d A
rab
Em
irate
sK
azak
hsta
nR
oman
iaS
erb
iaLa
tvia
Lith
uani
a
Isra
el
Est
onia
Fran
ce
Sw
eden
Rus
sia
Por
tuga
l
Turk
ey
Sp
ain
Sou
th A
fric
a
Aus
tria
Luxe
mb
ourg
Den
mar
k
Bah
rain
Slo
veni
a
Hun
gary
Italy
Slo
vaki
a
Net
herla
nds
Bel
gium
Sw
itzer
land
Cro
atia
Gre
ece
Pol
and
Uni
ted
Kin
gdom
Finl
and
Cze
ch R
epub
lic
Irela
nd
Ger
man
y
Nor
way
26Sources: The primary data sources for this index are all based on December 2013 statistics from the Ministries of Labour for the 75
countries within the scope, the Central Intelligence Agency (U.S.), World Data Bank, Trading Economics, and internal data collected as
part of ManpowerGroup global reporting efforts (Annual Data Survey, Manpower Employment Outlook Survey, Talent Shortage Survey).
REGIONAL OVERVIEW OF AVERAGE MONTHLY LABOUR COST
Regional Average $2,587
Tuni
sia
Ukr
aine
Bel
arus
K
azak
hsta
nB
ulga
riaS
erb
iaM
oroc
coR
oman
iaLa
tvia
Rus
sia
Hun
gary
Isra
el
Est
onia
Fran
ce
Sw
eden
Lith
uani
a
Bah
rain
Sou
th A
fric
a
Sp
ain
Slo
vaki
a
Aus
tria
Bel
gium
Luxe
mb
ourg
Turk
ey
Gre
ece
Pol
and
Italy
Uni
ted
Ara
b E
mira
tes
Uni
ted
Kin
gdom
Irela
nd
Nor
way
Cro
atia
Slo
veni
a
Cze
ch R
epub
lic
Ger
man
y
Net
herla
nds
Por
tuga
l
Finl
and
Den
mar
k
Sw
itzer
land
REGIONAL OVERVIEW OF AGGREGATED TAX RANGES
Regional Average 23.5%
Sou
th A
fric
aU
krai
neIs
rael
Den
mar
kIre
land
Uni
ted
Ara
b E
mira
tes
Bah
rain
Uni
ted
Kin
gdom
Nor
way
Luxe
mb
ourg
Cro
atia
Slo
veni
aS
witz
erla
ndN
ethe
rland
sB
ulga
riaS
erb
iaK
azak
hsta
nTu
nisi
a
Mor
occo
Ger
man
yLa
tvia
Por
tuga
lP
olan
dFi
nlan
dTu
rkey
Gre
ece
Hun
gary
Rus
sia
Aus
tria
Sw
eden
Sp
ain
Lith
uani
aR
oman
iaC
zech
Rep
ublic
Est
onia
Bel
arus
Slo
vaki
aB
elgi
um Italy
Fran
ce
Proprietary and Confidential, ManpowerG oup ©2014 27
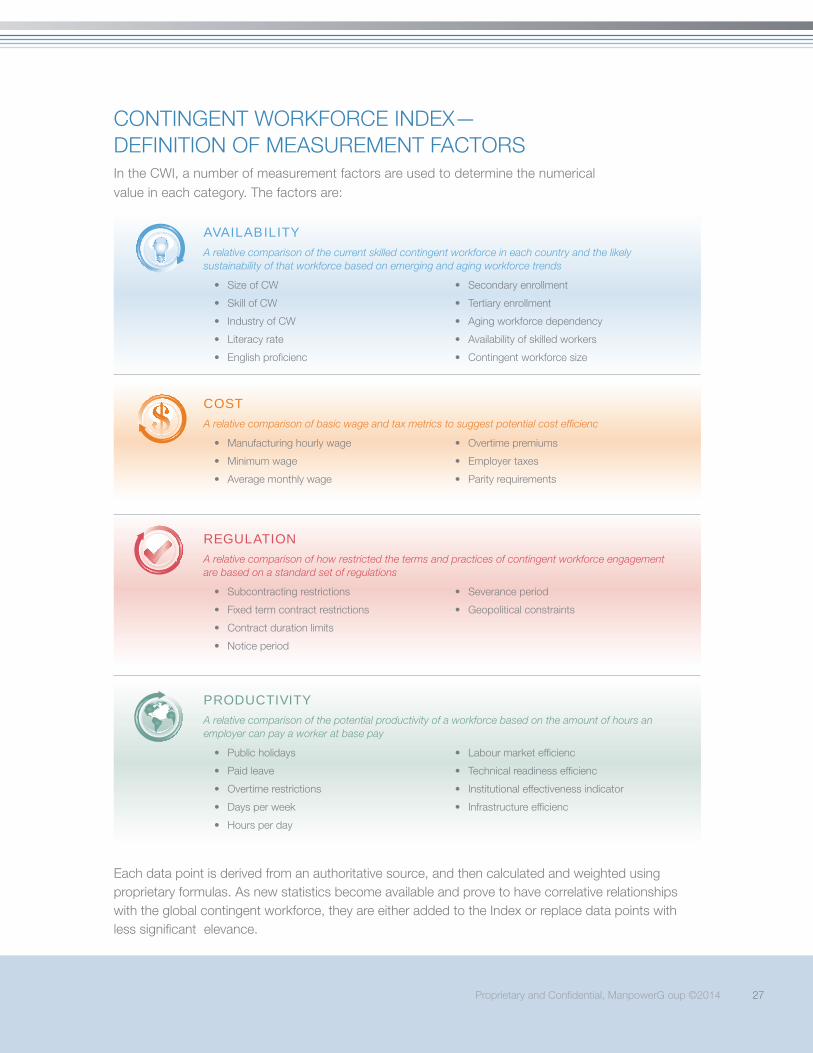
REGULATIONA relative comparison of how restricted the terms and practices of contingent workforce engagement are based on a standard set of regulations
• Subcontracting restrictions
• Fixed term contract restrictions
• Contract duration limits
• Notice period
• Severance period
• Geopolitical constraints
AVAILABILITYA relative comparison of the current skilled contingent workforce in each country and the likely sustainability of that workforce based on emerging and aging workforce trends
• Size of CW
• Skill of CW
• Industry of CW
• Literacy rate
• English proficienc
• Secondary enrollment
• Tertiary enrollment
• Aging workforce dependency
• Availability of skilled workers
• Contingent workforce size
PRODUCTIVITY
A relative comparison of the potential productivity of a workforce based on the amount of hours an employer can pay a worker at base pay
• Public holidays
• Paid leave
• Overtime restrictions
• Days per week
• Hours per day
• Labour market efficienc
• Technical readiness efficienc
• Institutional effectiveness indicator
• Infrastructure efficienc
COST
A relative comparison of basic wage and tax metrics to suggest potential cost efficienc
• Manufacturing hourly wage
• Minimum wage
• Average monthly wage
• Overtime premiums
• Employer taxes
• Parity requirements
CONTINGENT WORKFORCE INDEX — DEFINITION OF MEASUREMENT FACTORSIn the CWI, a number of measurement factors are used to determine the numerical value in each category. The factors are:
Each data point is derived from an authoritative source, and then calculated and weighted using proprietary formulas. As new statistics become available and prove to have correlative relationships with the global contingent workforce, they are either added to the Index or replace data points with less significant elevance.

Proprietary and Confidential, ManpowerGroup ©2014