Embed Size (px)
Citation preview
March 26, 2015
STONE ENERGY CORPORATION SGY/NYSE
Continuing Coverage: 2015: Go Deep Water or Go Home
Investment Rating: Market Outperform
PRICE: $ 15.25 S&P 500: 2,056.15 DJIA: 17,678.23 RUSSELL 2000: 1,231.99
Lower oil and natural gas prices have resulted in stock price decline.
Recent stock issuance, assets sales, hedging have strengthened the balance sheet amid price declines and a highly scrutinized energy lending environment.
Stone’s shift to oil raises both risks and rewards.
2015 CAPEX cuts prove Stone is “all in” on the Gulf of Mexico.
Stock price tumble offers attractive entry point for risk tolerant investors.
Our 12‐month target price is $ 21.00.
Valuation 2014 A 2015 E 2016 E
EPS $ (3.60) $ (1.29) $ (2.47)
P/E NM NM NM
CFPS $ 7.61 $ 6.21 $ 4.41
P/CFPS 2.0x 2.5x 3.5x
Market Capitalization Stock Data
Equity Market Cap (MM): $ 756.62 52‐Week Range: $12.07 ‐ $50.00
Enterprise Value (MM): $ 1,723.17 12‐Month Stock Performance: ‐62.26%
Shares Outstanding (MM): 55.92 Dividend Yield: Nil
Estimated Float (MM): 52.23 Book Value Per Share: $ 19.70
6‐Mo. Avg. Daily Volume: 1,157,740 Beta: 1.83
Company Quick View:
Stone Energy is an exploration and production company with operations onshore in the Marcellus/Utica shale and onshore and offshore in the Gulf of Mexico (GOM) region. The Company cut its 2015 capital budget in half in response to declining oil prices. Management has allocated the majority of its capital budget to GOM operations. Stone has a strong liquidity position as well as healthy credit metrics but, more importantly, a low cost structure which should allow it to be well positioned to survive the downturn.
Web Site: http://www.stoneenergy.com
Analysts: Investment Research Manager: Xiaogeng Deng Matt Guidry
Molly Jubas Chris Ward Jiazhen Zhou
The BURKENROAD REPORTS are produced solely as a part of an educational program of Tulane University's Freeman School of Business. The reports are not investment advice and you should not and may not rely on them in making any investment decision. You should consult an investment professional and/or conduct your own primary research regarding any potential investment.
Wall Street's Farm Team
BURK
ENRO
AD R
EPO
RTS
4/1/13 4:47 PM
Stone Energy Corp. (SGY) BURKENROAD REPORTS (www.burkenroad.org) March 26, 2015
2
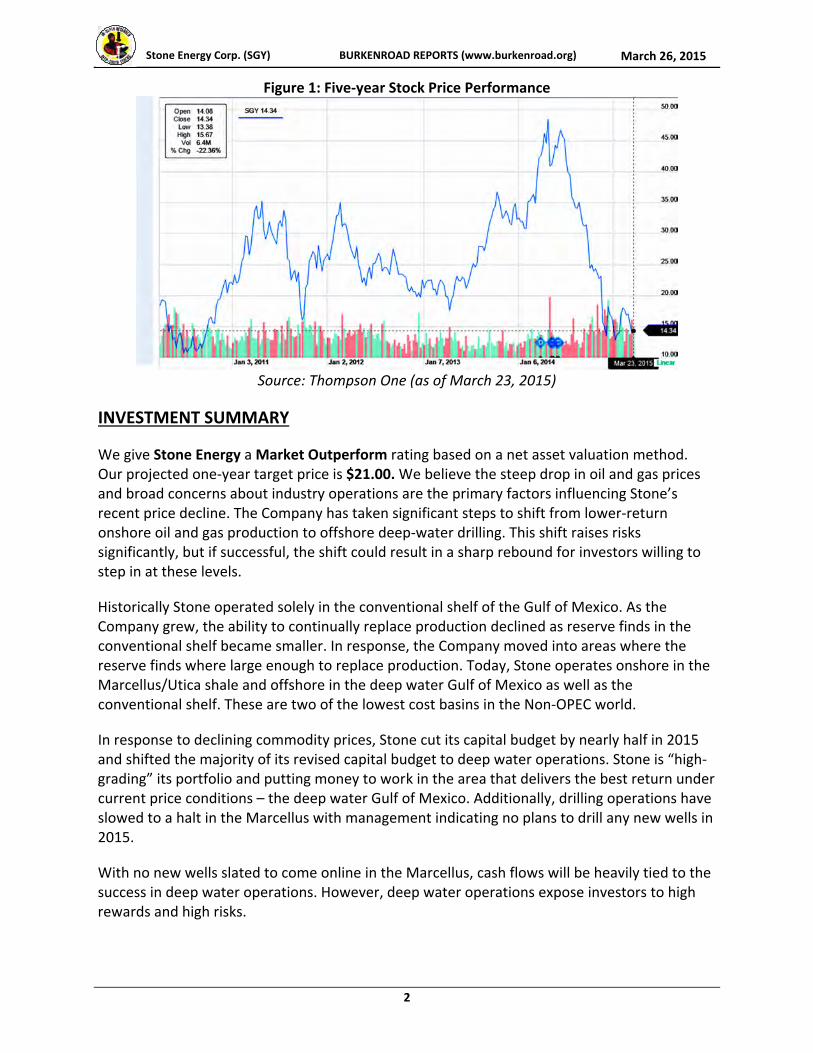
Figure 1: Five‐year Stock Price Performance
Source: Thompson One (as of March 23, 2015)
INVESTMENT SUMMARY
We give Stone Energy a Market Outperform rating based on a net asset valuation method. Our projected one‐year target price is $21.00. We believe the steep drop in oil and gas prices and broad concerns about industry operations are the primary factors influencing Stone’s recent price decline. The Company has taken significant steps to shift from lower‐return onshore oil and gas production to offshore deep‐water drilling. This shift raises risks significantly, but if successful, the shift could result in a sharp rebound for investors willing to step in at these levels.
Historically Stone operated solely in the conventional shelf of the Gulf of Mexico. As the Company grew, the ability to continually replace production declined as reserve finds in the conventional shelf became smaller. In response, the Company moved into areas where the reserve finds where large enough to replace production. Today, Stone operates onshore in the Marcellus/Utica shale and offshore in the deep water Gulf of Mexico as well as the conventional shelf. These are two of the lowest cost basins in the Non‐OPEC world.
In response to declining commodity prices, Stone cut its capital budget by nearly half in 2015 and shifted the majority of its revised capital budget to deep water operations. Stone is “high‐grading” its portfolio and putting money to work in the area that delivers the best return under current price conditions – the deep water Gulf of Mexico. Additionally, drilling operations have slowed to a halt in the Marcellus with management indicating no plans to drill any new wells in 2015.
With no new wells slated to come online in the Marcellus, cash flows will be heavily tied to the success in deep water operations. However, deep water operations expose investors to high rewards and high risks.
Stone Energy Corp. (SGY) BURKENROAD REPORTS (www.burkenroad.org) March 26, 2015
3
Stone is trading very close to its 52 week low of $12.97 reached on January 16, 2015, and short interest has doubled over the past 12 months. The stock could have a lot of room to grow, particularly given the recent declines and the deep pessimism investors have recently shown in the energy sector. Short covering could lead to a nice pop in the stock as well as positive results from the Company’s near term development wells Harrier and Vernaccia. As such, Stone’s stock price will rise or fall with the results of its deep water operations.
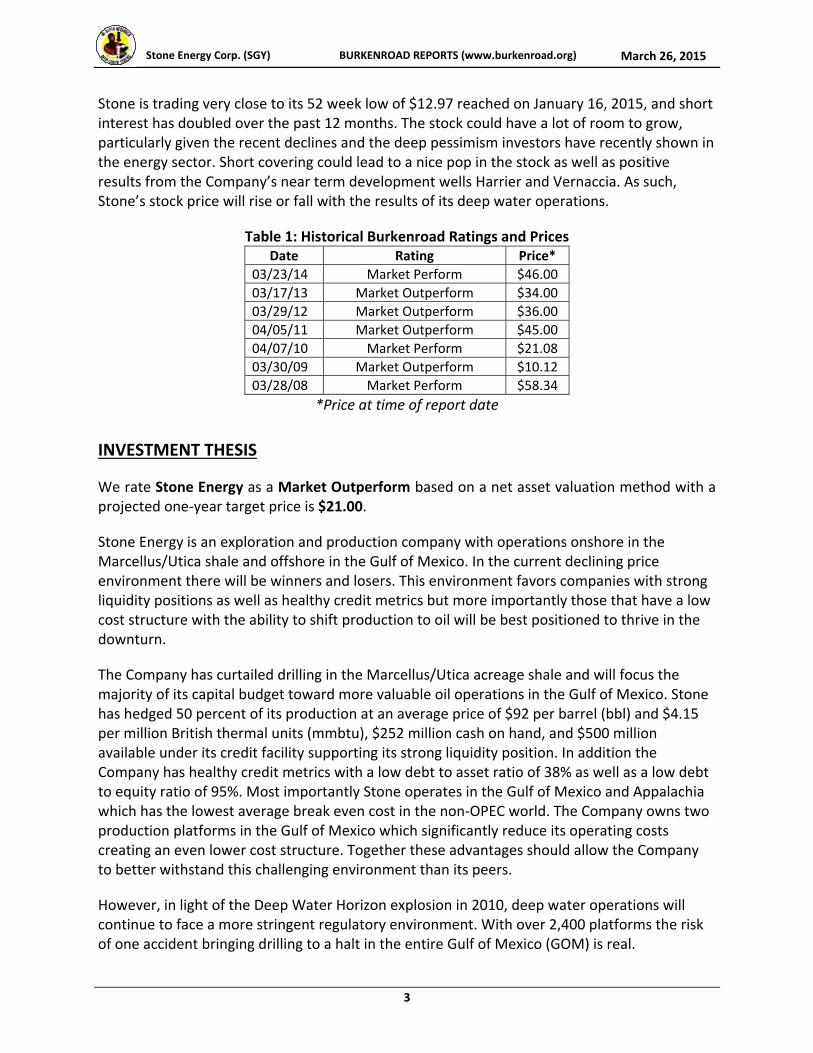
Table 1: Historical Burkenroad Ratings and Prices Date Rating Price*
03/23/14 Market Perform $46.00
03/17/13 Market Outperform $34.00
03/29/12 Market Outperform $36.00
04/05/11 Market Outperform $45.00
04/07/10 Market Perform $21.08
03/30/09 Market Outperform $10.12
03/28/08 Market Perform $58.34
*Price at time of report date
INVESTMENT THESIS
We rate Stone Energy as a Market Outperform based on a net asset valuation method with a projected one‐year target price is $21.00.
Stone Energy is an exploration and production company with operations onshore in the Marcellus/Utica shale and offshore in the Gulf of Mexico. In the current declining price environment there will be winners and losers. This environment favors companies with strong liquidity positions as well as healthy credit metrics but more importantly those that have a low cost structure with the ability to shift production to oil will be best positioned to thrive in the downturn.
The Company has curtailed drilling in the Marcellus/Utica acreage shale and will focus the majority of its capital budget toward more valuable oil operations in the Gulf of Mexico. Stone has hedged 50 percent of its production at an average price of $92 per barrel (bbl) and $4.15 per million British thermal units (mmbtu), $252 million cash on hand, and $500 million available under its credit facility supporting its strong liquidity position. In addition the Company has healthy credit metrics with a low debt to asset ratio of 38% as well as a low debt to equity ratio of 95%. Most importantly Stone operates in the Gulf of Mexico and Appalachia which has the lowest average break even cost in the non‐OPEC world. The Company owns two production platforms in the Gulf of Mexico which significantly reduce its operating costs creating an even lower cost structure. Together these advantages should allow the Company to better withstand this challenging environment than its peers.
However, in light of the Deep Water Horizon explosion in 2010, deep water operations will continue to face a more stringent regulatory environment. With over 2,400 platforms the risk of one accident bringing drilling to a halt in the entire Gulf of Mexico (GOM) is real.
Stone Energy Corp. (SGY) BURKENROAD REPORTS (www.burkenroad.org) March 26, 2015
4
Due to the higher geological risk inherent to operating offshore, all exploration efforts may not prove successful. Hurricane season may result in serious damages to production platforms which could take production offline. Stone faces significant operational as well as regulatory risks from shifting the majority of its operations to the Gulf of Mexico in addition to facing a low oil price environment. For these reasons, we are cautiously optimist about Stone’s stock performance over the next 12 months.
Lower oil and natural gas prices
The Organization of The Petroleum Exporting Countries (OPEC), led by Saudi Arabia, shifted its production strategy. Historically, Saudi Arabia acted as the swing producer, increasing or decreasing production to balance supply with demand. However; the recent development of U.S. shale has eroded Saudi Arabia’s market share. Saudi Arabia believes that as the lowest marginal cost producer they should not adjust production. Instead, producers with the highest marginal cost, like U.S. shale and Canadian oil sands, should adjust production.
On December 22, 2014, Saudi Arabia announced it would pull back production. Seemingly, the goal is to weed out high cost producers by flooding the market with supply while simultaneously cutting its selling price in order to preserve market share. Oil prices have declined more than 50% from a high of $107.26 in June 2014 to a low of $44.50 in January 2015. U.S. E&P’s have responded by deep cuts to capital budgets and curtailing exploration efforts.
Weak global economic data has increased concerns of softening global oil demand. To boost economic growth, China, the European Union, and Japan enacted stimulus programs to induce demand. Conversely, on October 29, 2014, the U.S. Federal Reserve ended its stimulus program. While these foreign countries have been injecting liquidity via stimulus, the U.S. dollar has increased in value. Because oil and gas are priced in dollars, when the value of the dollar increases it takes less dollars to buy oil and gas resulting in lower prices. This creates an additional headwind to oil prices.
Globally, production is not slowing down at a fast enough rate and storage is building to all‐time highs. Absent a serious supply constraint or strong European or Chinese economic data to spur demand, we project downward pressure on prices will continue over the next 12 months. Stone’s margins will be challenged and this could lead to a reduction in net income and ultimately a lower stock price.
Stone Energy Corp. (SGY) BURKENROAD REPORTS (www.burkenroad.org) March 26, 2015
5
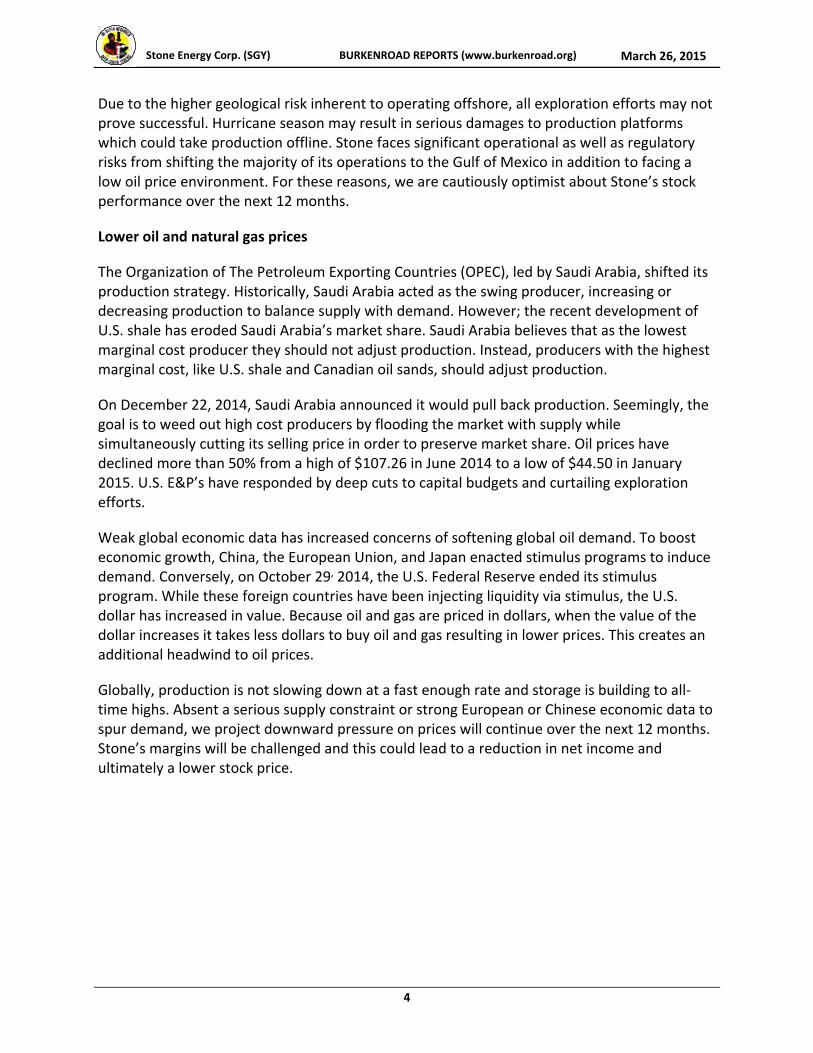
Figure 2: Marcellus Region Natural Gas Production
Source: EIA Marcellus Drilling Productivity Report 2015
Additionally, the Marcellus/Utica shale was even more prolific than anyone thought. Figure 2, from the Energy Information Administration (EIA), shows that in 2015, production has increased to more than 16 Billion cubic feet (bcf) per day. The repeated drilling successes combined with the huge increase in companies producing in the area has created a supply glut in the East. The issue with this significant new production, from the East, is that the pipeline system had been built to move natural gas from South to East. Not the other way around.
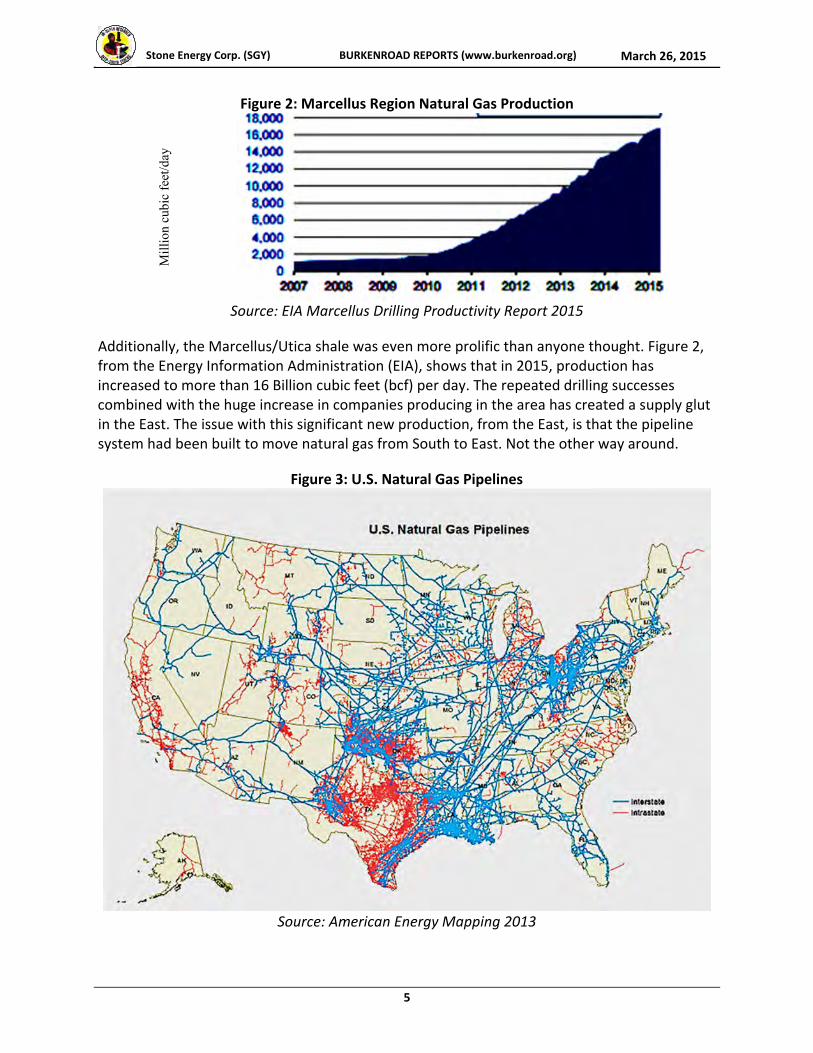
Figure 3: U.S. Natural Gas Pipelines
Source: American Energy Mapping 2013
Mill
ion
cubi
c fe
et/d
ay
Stone Energy Corp. (SGY) BURKENROAD REPORTS (www.burkenroad.org) March 26, 2015
6
In Figure 3 you can see the majority of pipeline infrastructure is concentrated in Texas and Louisiana. In contrast, the East coast, more specifically Appalachia, doesn’t have near as many pipelines. The lack of pipeline infrastructure in this area to move this glut of natural gas resulted in oversupply condition so severe that East coast natural gas now trades at a discount to Henry Hub. Currently, discounts at regional hubs in Appalachia are around $1.00/MMBTU versus a Henry Hub price the U.S. benchmark of $2.99/MMBTU.
Recent stock issuance, assets sales, and hedging have strengthened the balance sheet amid price declines and a more stringent energy lending environment
On May 7, 2014, Stone issued 5 million shares of common stock at a price of $41.00 per share. On June 30, 2014 the Company sold its non‐core conventional shelf properties for $200 million in cash and assumed future undiscounted abandonment liabilities estimated at approximately $117 million. The Company retained the rights to drill on the divested properties.
The Company has a strong hedging program for 2015. Oil prices are hedged at an average of $91.91 per barrel per day (bbl) and gas prices at an average of $4.15 million British thermal units (mmbtu). Stone realizes an effective price of about $75.00/bbl for oil and $3.30/mmbtu for gas. The hedges guarantee cash flow of $456 million, providing additional liquidity.
Stone has $252 million in cash, nearly one‐third of its market capitalization of $1 billion. The level of cash relative to its market capitalization is above the peer average. Also, Stone has an untapped credit revolver of $500 million and management indicated it will manage capital in an attempt to avoid a need to tap these funds.
In addition, Stone has a strong credit profile. Currently, the Company has a debt to assets ratio of 35%. The Company had earnings before interest, taxes, depreciation, and amortization (EBITDA) of $498 million in 2014 and the Company can cover its interest payments 14 times. Both Stone’s leverage and debt coverage metrics are in well above the peer average. Furthermore, with 70% of long‐term debt maturing in 2022, the Company has no debt maturing in the next 24+ months and no immediate need for a large capital influx.
The cash on hand, hedging program, and debt position demonstrate Stone’s strong liquidity position. This should provide them the breathing room needed to better withstand the declining price environment.
Stone’s shift to oil raises both risks and rewards
Stone’s deep water acreage is ideal in the current price environment because it mainly produces oil. Oil currently trades at $48.50 and natural gas trades at $2.88. Stone receives premium pricing for its GOM production while it receives a discount for its production in the Marcellus/Utica shale. Furthermore, the cost to develop the GOM is less than the Marcellus/Utica shale, in part due to the infrastructure such as production platforms and production already online from previous operations. The current advantages of operating in the GOM are the reason the Company has curtailed drilling natural gas in the Marcellus/Utica shale in an effort to preserve capital while focusing drilling oil in the Gulf of Mexico.
Stone Energy Corp. (SGY) BURKENROAD REPORTS (www.burkenroad.org) March 26, 2015
7
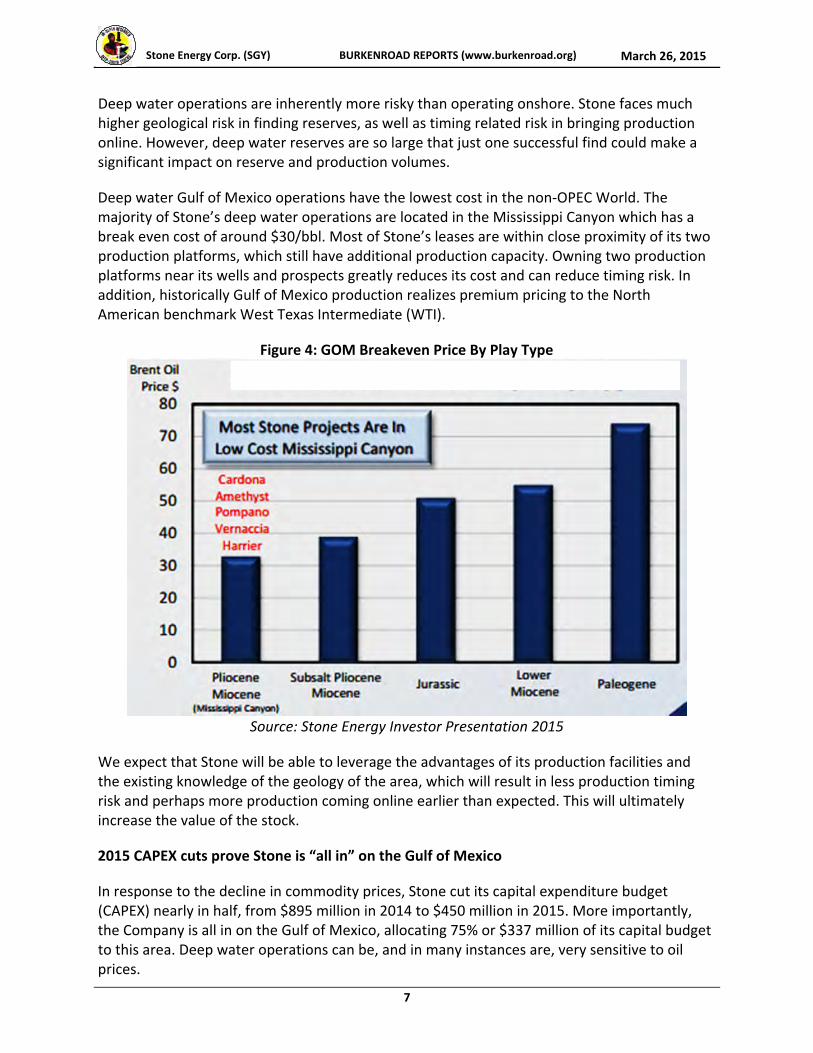
Deep water operations are inherently more risky than operating onshore. Stone faces much higher geological risk in finding reserves, as well as timing related risk in bringing production online. However, deep water reserves are so large that just one successful find could make a significant impact on reserve and production volumes.
Deep water Gulf of Mexico operations have the lowest cost in the non‐OPEC World. The majority of Stone’s deep water operations are located in the Mississippi Canyon which has a break even cost of around $30/bbl. Most of Stone’s leases are within close proximity of its two production platforms, which still have additional production capacity. Owning two production platforms near its wells and prospects greatly reduces its cost and can reduce timing risk. In addition, historically Gulf of Mexico production realizes premium pricing to the North American benchmark West Texas Intermediate (WTI).
Figure 4: GOM Breakeven Price By Play Type
Source: Stone Energy Investor Presentation 2015
We expect that Stone will be able to leverage the advantages of its production facilities and the existing knowledge of the geology of the area, which will result in less production timing risk and perhaps more production coming online earlier than expected. This will ultimately increase the value of the stock.
2015 CAPEX cuts prove Stone is “all in” on the Gulf of Mexico
In response to the decline in commodity prices, Stone cut its capital expenditure budget (CAPEX) nearly in half, from $895 million in 2014 to $450 million in 2015. More importantly, the Company is all in on the Gulf of Mexico, allocating 75% or $337 million of its capital budget to this area. Deep water operations can be, and in many instances are, very sensitive to oil prices.
Stone Energy Corp. (SGY) BURKENROAD REPORTS (www.burkenroad.org) March 26, 2015
8
Based on this, Stone’s operations for 2015 are no longer truly diversified. The Company’s capital is overwhelmingly exposed to the success of deep water operations. The shift to focus on deep water will result in more oil as a percentage of total production. As a result its revenues are even more sensitive to oil prices. This move could result in a homerun or a shutout. However; if oil prices decline further or issues arise bringing production online there will be increased pressure on the capital profile and stock price.
Stock price tumble offers attractive entry point for risk tolerant investors
Amid lower energy prices, investors have punished E&P stocks across the board, especially mid to small capitalize companies. Stone is no exception. The Company’s stock has tumbled over 50% from a 52 week high of $52.00 in April. Currently the stock is trading at $16.90 which is still very near its 52 week low of $12.07. At this price Stone has value, as the Company is undervalued when compared to its peers. In addition there has been a large increase in the short interest. If oil prices rebound faster than expected or operation results are better than expected, this could cause the shorts to cover and lead to an immediate pop in the stock.
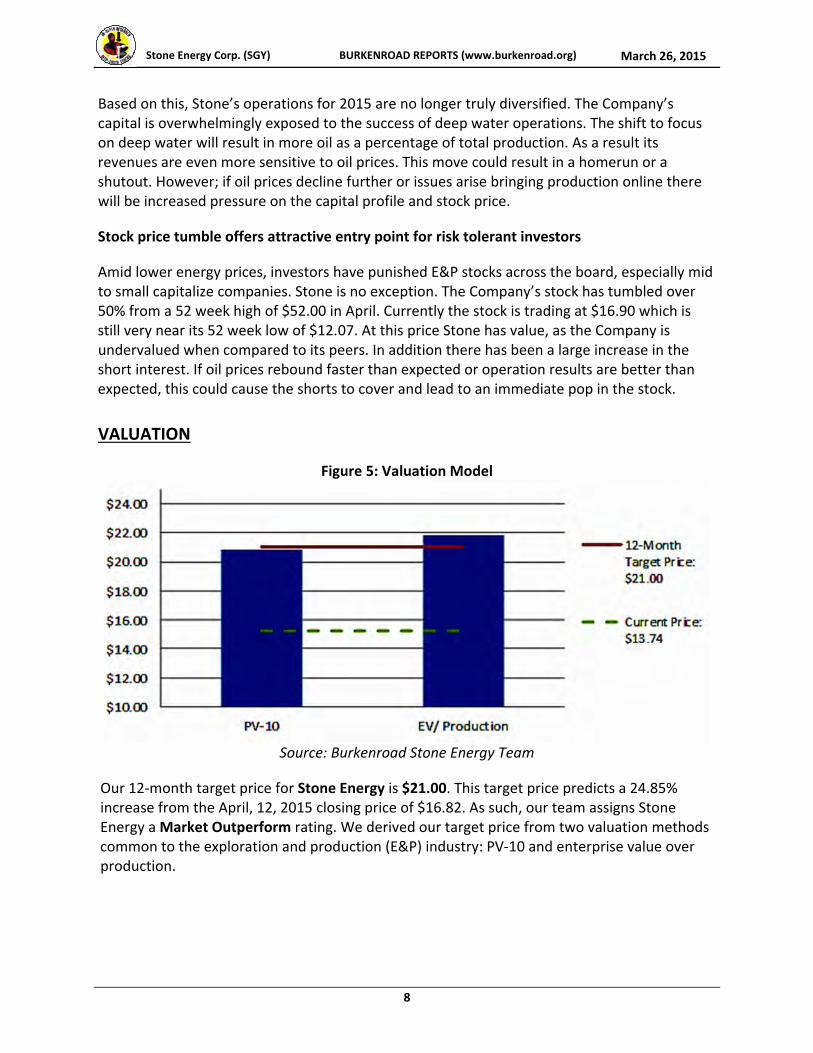
VALUATION
Figure 5: Valuation Model
Source: Burkenroad Stone Energy Team
Our 12‐month target price for Stone Energy is $21.00. This target price predicts a 24.85% increase from the April, 12, 2015 closing price of $16.82. As such, our team assigns Stone Energy a Market Outperform rating. We derived our target price from two valuation methods common to the exploration and production (E&P) industry: PV‐10 and enterprise value over production.
Stone Energy Corp. (SGY) BURKENROAD REPORTS (www.burkenroad.org) March 26, 2015
9
PV‐10
The PV‐10 is a discounted cash flow model which incorporates production, commodity prices, and lease operating expenses. We chose this method because discounted cash flows typically represent the fundamental value of a company. The resulting cash flows generated by operations in our model were discounted at a 10% rate to obtain the net present value (NPV) of Stone’s production. We chose to use an average of three year, five year and seven year cash flow projections to determine a net present value for Stone. We believe the five‐year time period most accurately reflects the NPV generated by Stone’s deep water drilling program. Although predicting cash flows in future years entails a certain degree of uncertainty, we feel our valuation is conservative because our production forecast falls in the lower side of the Company’s management guidance range. Our five‐year average PV‐10 model resulted in a stock price of $20.82.
EV/Production
The enterprise value (EV) over production method uses a peer group average multiple to determine a company’s enterprise value based on its production per day (MMCFE/day) and enterprise value (EV) per production per day that is based on the ratio from peer analysis. Our peer group consisted of the seven companies listed in Table 2. EV/production is a commonly used multiple because oil and gas production is the main drivers of future cash flows for an E&P company. We chose to use this multiple because of its common use in the E&P industry and because it’s relatively close to our PV‐10 valuation. By applying our peer group average multiple to the target company’s daily production rates, we derived a stock price of $21.85.
Source: Burkenroad Stone Energy Team
Additional Multiples Excluded
In our analysis, we also considered one additional multiple: The enterprise value (EV) over barrels of oil equivalent (BOE) proved reserves. Similar to the EV/production method, these multiples derive an enterprise value for a target company by applying a peer group average multiple to determine a company’s enterprise value based on its proved reserves. The resulting target price from this multiple was $14.11. We chose not to incorporate this price into our valuation due to the unreasonably low values.
Stone Energy Corp. (SGY) BURKENROAD REPORTS (www.burkenroad.org) March 26, 2015
10
INDUSTRY ANALYSIS
Stone Energy is part of the global oil and gas industry, which produces roughly 91 million barrels of oil per day and over 100 trillion cubic feet of natural gas annually. Multi‐national and state‐sponsored corporations such Exxon Mobil, Saudi Aramco (Saudi Arabia), Gazprom (Russia), China National Petroleum Corp., have traditionally dominated the industry. Many of the largest oil and gas exploration companies are headquartered in the most hydrocarbon‐rich countries in the world: Russia, Iran, Saudi Arabia, and increasingly the U.S. Russia and the U.S. are unique as they are among the world leaders in both oil and gas production. Yet, the re‐emergence of the U.S. as an energy powerhouse is a relatively recent development.
In June of 2014, the International Energy Agency declared the U.S. as the world’s largest producer of oil and natural gas liquids. According the Energy Information Administration, the U.S. had already achieved the distinction of the world’s largest natural gas producer in 2010. The rise in U.S. production has been due to technological advancements such as hydraulic fracking and horizontal drilling. Combined, the development of these technologies enabled petroleum engineers to extract commercial quantities of hydrocarbons from previously uneconomic formations. These shale formations have proven to be abundant across many geographic areas within the U.S. These newly exploitable resources have attracted massive amounts of investment capital, as evidenced by the super majors (Exxon Mobil, Chevron, Shell, BP) generating combined revenues of over $1 trillion.
As a strictly exploration and production (E&P) company, Stone’s revenue is completely dependent on oil and gas prices. The recent 60% drop in the price of crude oil has forced many corporations in the oil and gas industry into survival mode. When the prices of oil and natural gas collapse, production revenues shrink. If the declines in hydrocarbon prices are severe enough, a company might not be able to generate enough cash flow to service debt or invest in proving more reserves.
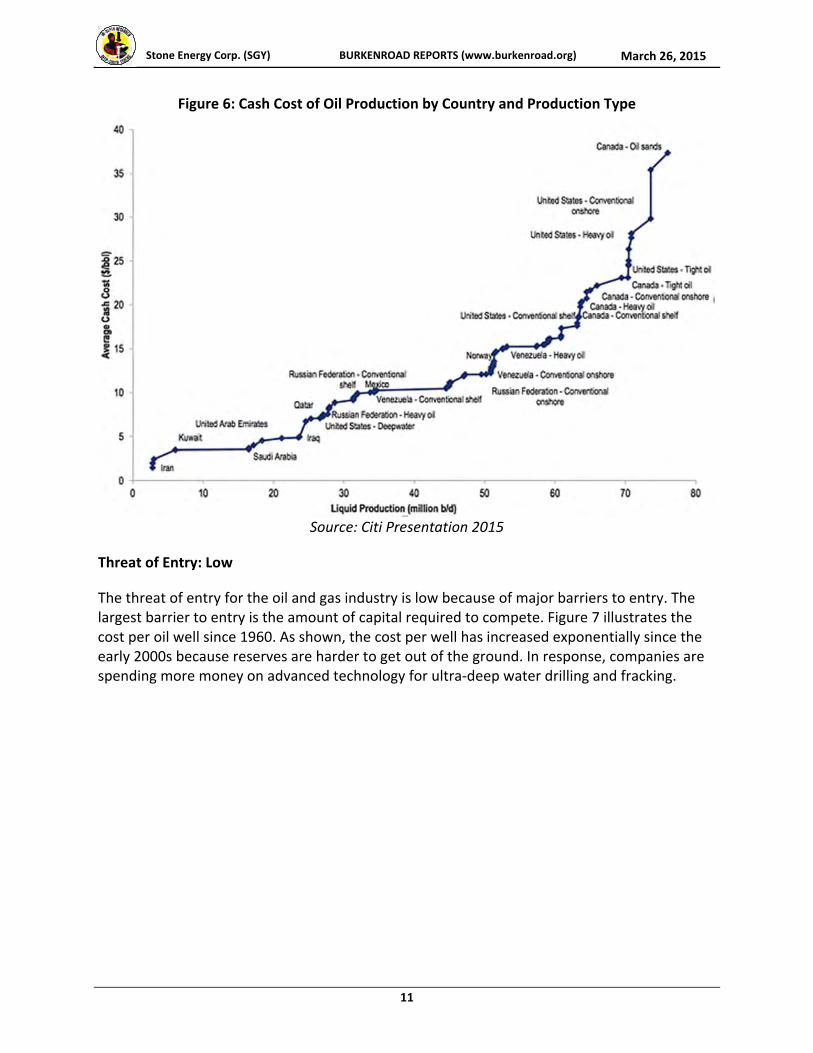
Cash flow is of particular concern in today’s environment, as many of the shale formations are becoming uneconomic at $50/oil and $3/gas. Exploration and production companies (E&P) determine the economics of a particular field by the “breakeven cost,” the price at which the company’s variable and fixed costs are covered. At $46 per barrel, the current price of crude oil is below many of the shale plays breakeven cost, as illustrated in Figure 6.
Stone Energy Corp. (SGY) BURKENROAD REPORTS (www.burkenroad.org) March 26, 2015
11
Figure 6: Cash Cost of Oil Production by Country and Production Type
Source: Citi Presentation 2015
Threat of Entry: Low
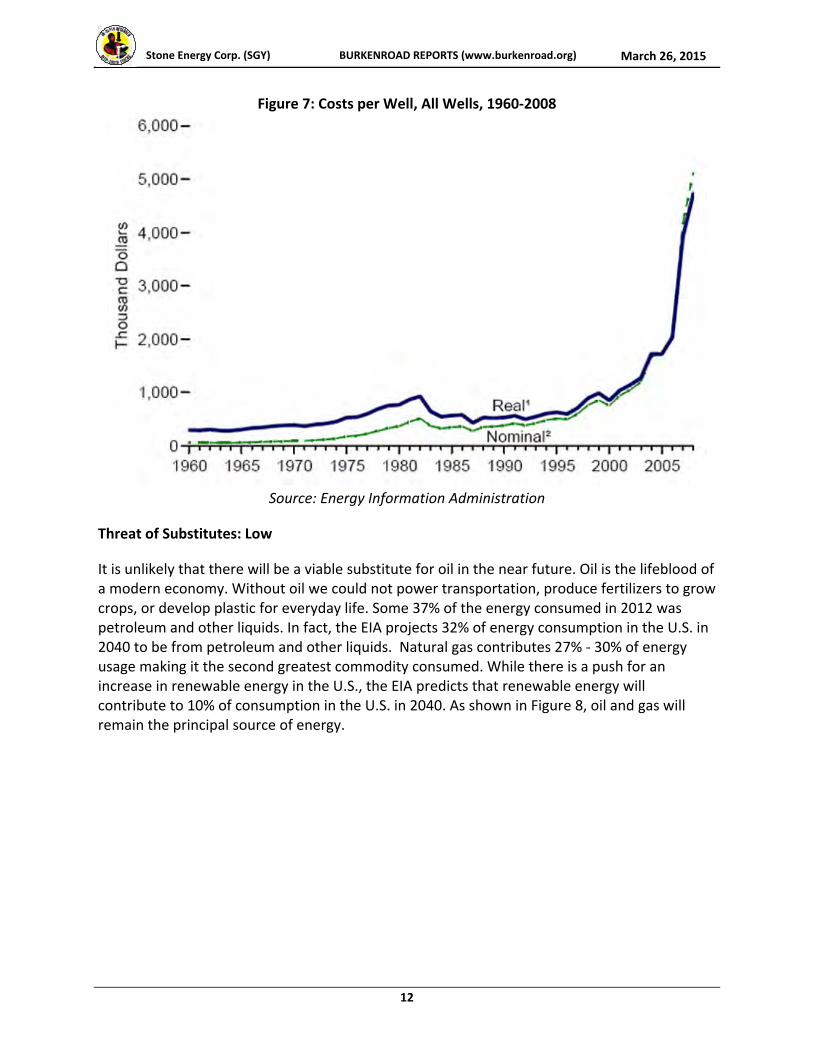
The threat of entry for the oil and gas industry is low because of major barriers to entry. The largest barrier to entry is the amount of capital required to compete. Figure 7 illustrates the cost per oil well since 1960. As shown, the cost per well has increased exponentially since the early 2000s because reserves are harder to get out of the ground. In response, companies are spending more money on advanced technology for ultra‐deep water drilling and fracking.
Stone Energy Corp. (SGY) BURKENROAD REPORTS (www.burkenroad.org) March 26, 2015
12
Figure 7: Costs per Well, All Wells, 1960‐2008
Source: Energy Information Administration
Threat of Substitutes: Low
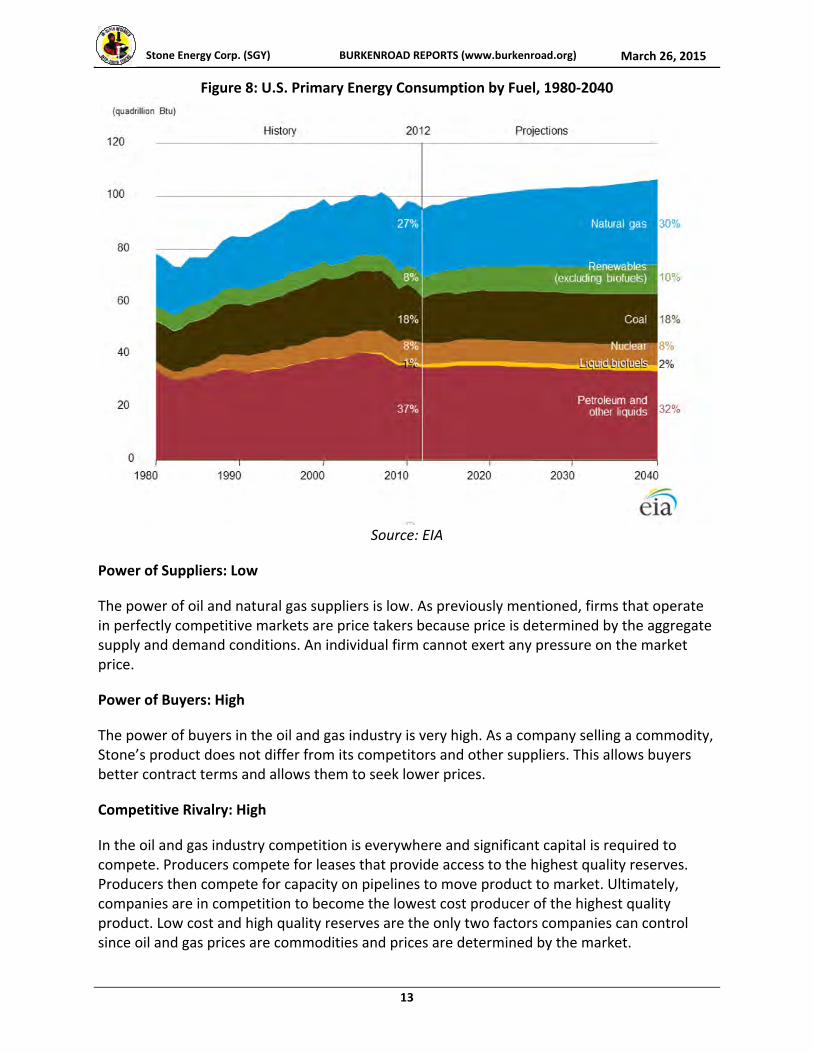
It is unlikely that there will be a viable substitute for oil in the near future. Oil is the lifeblood of a modern economy. Without oil we could not power transportation, produce fertilizers to grow crops, or develop plastic for everyday life. Some 37% of the energy consumed in 2012 was petroleum and other liquids. In fact, the EIA projects 32% of energy consumption in the U.S. in 2040 to be from petroleum and other liquids. Natural gas contributes 27% ‐ 30% of energy usage making it the second greatest commodity consumed. While there is a push for an increase in renewable energy in the U.S., the EIA predicts that renewable energy will contribute to 10% of consumption in the U.S. in 2040. As shown in Figure 8, oil and gas will remain the principal source of energy.
Stone Energy Corp. (SGY) BURKENROAD REPORTS (www.burkenroad.org) March 26, 2015
13
Figure 8: U.S. Primary Energy Consumption by Fuel, 1980‐2040
Source: EIA
Power of Suppliers: Low
The power of oil and natural gas suppliers is low. As previously mentioned, firms that operate in perfectly competitive markets are price takers because price is determined by the aggregate supply and demand conditions. An individual firm cannot exert any pressure on the market price.
Power of Buyers: High
The power of buyers in the oil and gas industry is very high. As a company selling a commodity, Stone’s product does not differ from its competitors and other suppliers. This allows buyers better contract terms and allows them to seek lower prices.
Competitive Rivalry: High
In the oil and gas industry competition is everywhere and significant capital is required to compete. Producers compete for leases that provide access to the highest quality reserves. Producers then compete for capacity on pipelines to move product to market. Ultimately, companies are in competition to become the lowest cost producer of the highest quality product. Low cost and high quality reserves are the only two factors companies can control since oil and gas prices are commodities and prices are determined by the market.
Stone Energy Corp. (SGY) BURKENROAD REPORTS (www.burkenroad.org) March 26, 2015
14
ABOUT STONE
Stone Energy Corporation (SGY/NYSE) is an independent oil and gas company engaged in the acquisition, exploration, exploitation, development, and operation of oil and gas properties. Stone Energy has been operating along the Gulf Coast and in shallow water Gulf of Mexico (GOM) since its incorporation in 1993. The Company has expanded into areas with significant reserves such as deep water GOM, as well as onshore shale opportunities, including the Marcellus Shale in Appalachia. As of December 2013, estimated proved oil and natural gas reserves were approximately 864 billion cubic feet equivalent (Bcfe). In 2014, the Company generated $516.1 million in revenue, down 28% from $715.1 million in 2013. Stone Energy’s corporate headquarters are located in Lafayette, Louisiana.
History
James Hiram Stone founded The Stone Oil Company in 1952. The Company was private for 41 years until it was registered as Stone Energy Corporation in 1993 for its initial public offering (IPO) on the New York Stock Exchange (NYSE).
In 2001, Stone purchased Basin Exploration for $428 million. The acquisition increased Stone’s oil reserves by nearly 55%. Four years later Hurricane Katrina caused a 20% decrease in Stone’s year‐end reserves in addition to all the infrastructure damage. In 2007, Stone began liquidating significant portions of its non‐core assets, beginning with selling its Rocky Mountain assets to Newfield Exploration Company for $578 million. After the sale, Stone focused its attention on the Gulf Coast and Appalachia regions. Stone then acquired Bois d’ Arc Energy Inc. in 2007.
In 2011, Stone Energy acquired deep water assets including the deep water Pompano Platform from British Petroleum for $167.6 million, which increased its estimated proved reserves to 17 million barrels of oil equivalent (BOE). Stone purchased the remainder of the Pompano facility from Anadarko Petroleum Corporation, thus owning 100% of Pompano today.
Operations
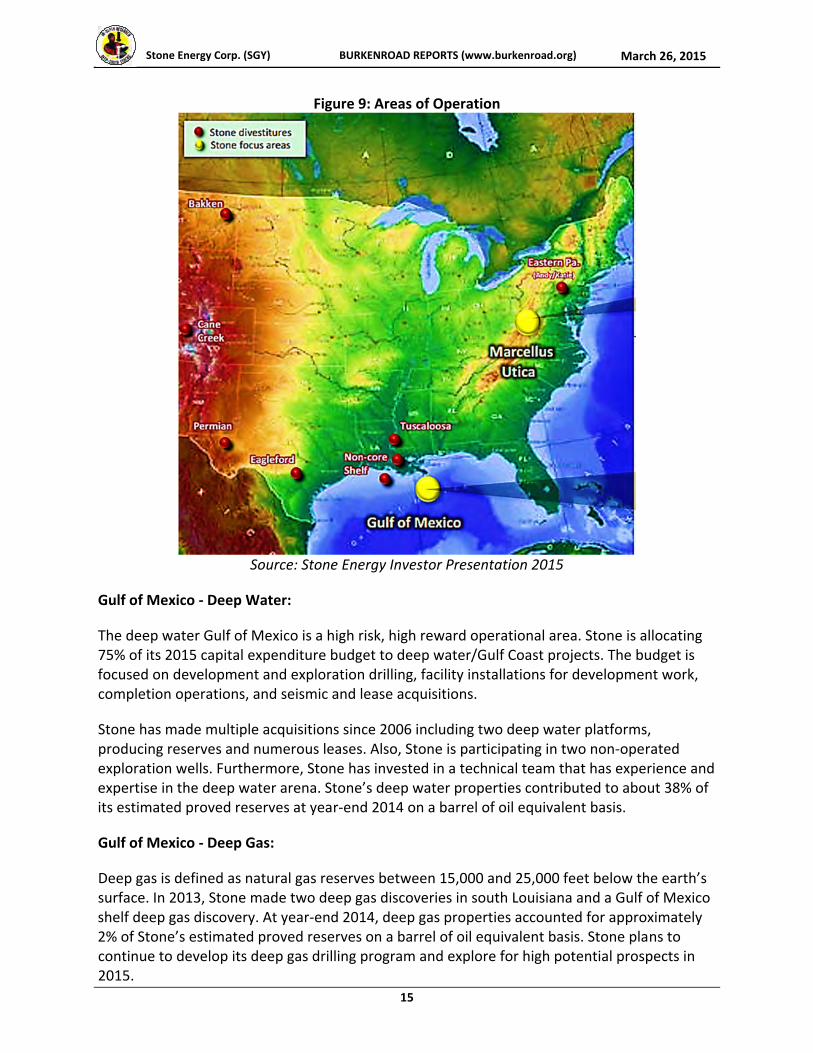
Stone Energy has four major focus areas in regard to exploring for oil and gas: deep water in the Gulf of Mexico, Gulf of Mexico conventional shelf, onshore in the Appalachia region, and onshore in Gulf Coast region. Currently, 51% of the Company’s production is natural gas, 35% is oil, and 14% is natural gas liquids. As of year‐end 2014, oil production created $516.1 million in revenue, gas production generated $166.5 million in revenue, and natural gas liquids added $85.6 million of revenue. Figure 9 illustrates where Stone operates.
Stone Energy Corp. (SGY) BURKENROAD REPORTS (www.burkenroad.org) March 26, 2015
15
Figure 9: Areas of Operation
Source: Stone Energy Investor Presentation 2015
Gulf of Mexico ‐ Deep Water:
The deep water Gulf of Mexico is a high risk, high reward operational area. Stone is allocating 75% of its 2015 capital expenditure budget to deep water/Gulf Coast projects. The budget is focused on development and exploration drilling, facility installations for development work, completion operations, and seismic and lease acquisitions.
Stone has made multiple acquisitions since 2006 including two deep water platforms, producing reserves and numerous leases. Also, Stone is participating in two non‐operated exploration wells. Furthermore, Stone has invested in a technical team that has experience and expertise in the deep water arena. Stone’s deep water properties contributed to about 38% of its estimated proved reserves at year‐end 2014 on a barrel of oil equivalent basis.
Gulf of Mexico ‐ Deep Gas:
Deep gas is defined as natural gas reserves between 15,000 and 25,000 feet below the earth’s surface. In 2013, Stone made two deep gas discoveries in south Louisiana and a Gulf of Mexico shelf deep gas discovery. At year‐end 2014, deep gas properties accounted for approximately 2% of Stone’s estimated proved reserves on a barrel of oil equivalent basis. Stone plans to continue to develop its deep gas drilling program and explore for high potential prospects in 2015.
Stone Energy Corp. (SGY) BURKENROAD REPORTS (www.burkenroad.org) March 26, 2015
16
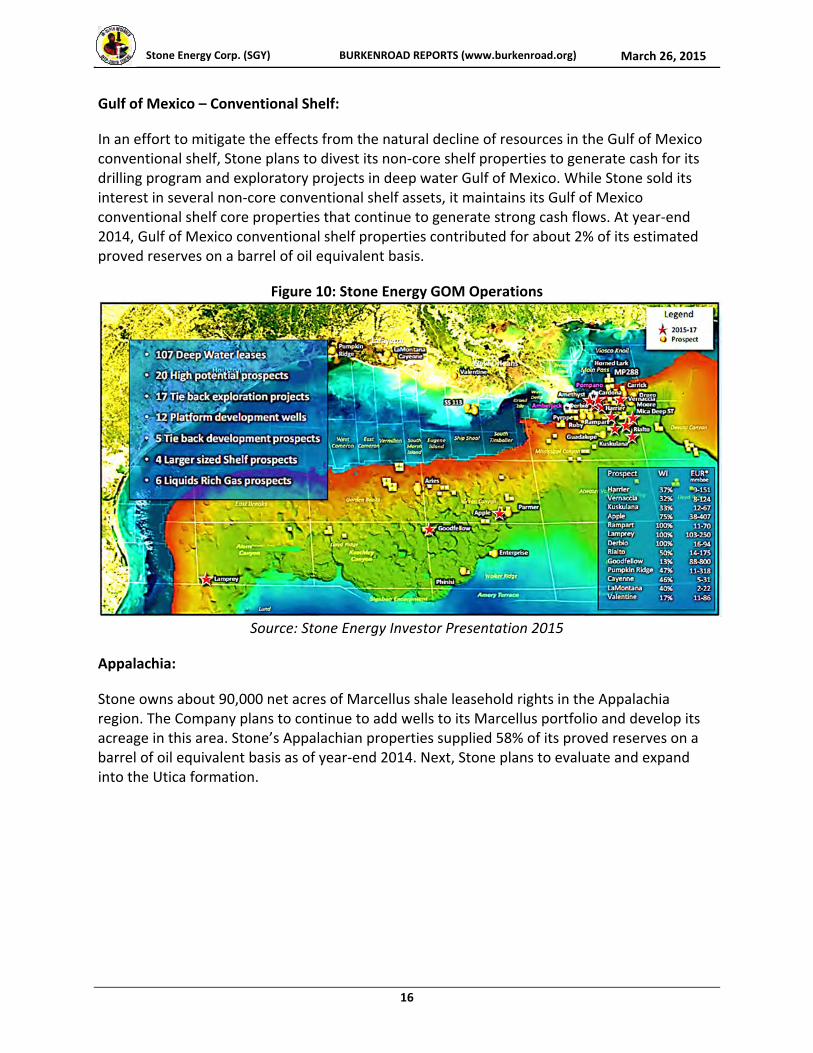
Gulf of Mexico – Conventional Shelf:
In an effort to mitigate the effects from the natural decline of resources in the Gulf of Mexico conventional shelf, Stone plans to divest its non‐core shelf properties to generate cash for its drilling program and exploratory projects in deep water Gulf of Mexico. While Stone sold its interest in several non‐core conventional shelf assets, it maintains its Gulf of Mexico conventional shelf core properties that continue to generate strong cash flows. At year‐end 2014, Gulf of Mexico conventional shelf properties contributed for about 2% of its estimated proved reserves on a barrel of oil equivalent basis.
Figure 10: Stone Energy GOM Operations
Source: Stone Energy Investor Presentation 2015
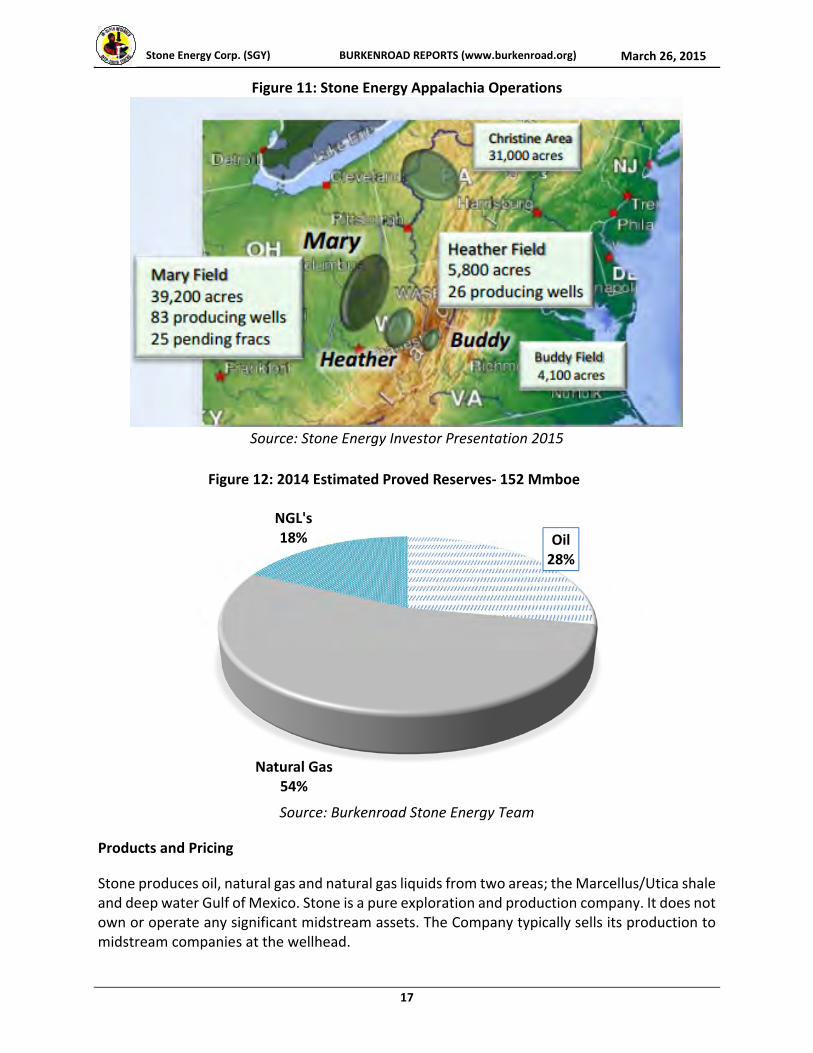
Appalachia:
Stone owns about 90,000 net acres of Marcellus shale leasehold rights in the Appalachia region. The Company plans to continue to add wells to its Marcellus portfolio and develop its acreage in this area. Stone’s Appalachian properties supplied 58% of its proved reserves on a barrel of oil equivalent basis as of year‐end 2014. Next, Stone plans to evaluate and expand into the Utica formation.
Stone Energy Corp. (SGY) BURKENROAD REPORTS (www.burkenroad.org) March 26, 2015
17
Figure 11: Stone Energy Appalachia Operations
Source: Stone Energy Investor Presentation 2015
Source: Burkenroad Stone Energy Team
Products and Pricing
Stone produces oil, natural gas and natural gas liquids from two areas; the Marcellus/Utica shale and deep water Gulf of Mexico. Stone is a pure exploration and production company. It does not own or operate any significant midstream assets. The Company typically sells its production to midstream companies at the wellhead.
Oil28%
Natural Gas54%
NGL's18%
Figure 12: 2014 Estimated Proved Reserves‐ 152 Mmboe
Stone Energy Corp. (SGY) BURKENROAD REPORTS (www.burkenroad.org) March 26, 2015
18
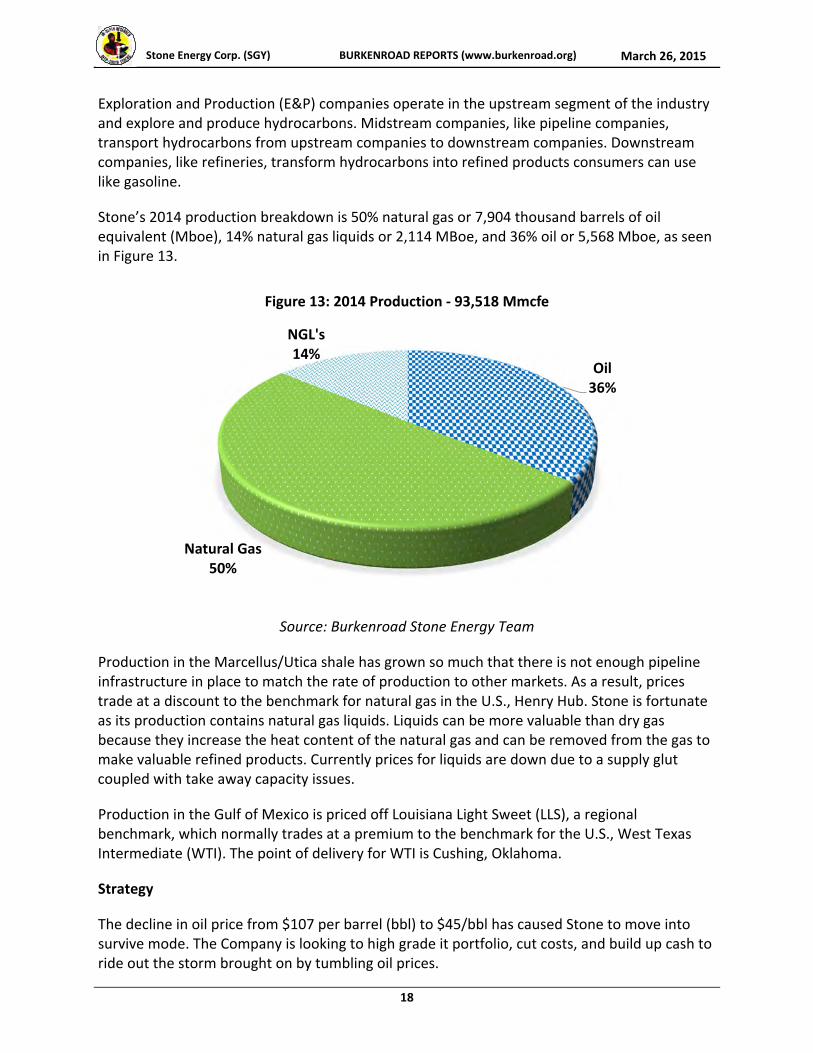
Exploration and Production (E&P) companies operate in the upstream segment of the industry and explore and produce hydrocarbons. Midstream companies, like pipeline companies, transport hydrocarbons from upstream companies to downstream companies. Downstream companies, like refineries, transform hydrocarbons into refined products consumers can use like gasoline.
Stone’s 2014 production breakdown is 50% natural gas or 7,904 thousand barrels of oil equivalent (Mboe), 14% natural gas liquids or 2,114 MBoe, and 36% oil or 5,568 Mboe, as seen in Figure 13.
Source: Burkenroad Stone Energy Team
Production in the Marcellus/Utica shale has grown so much that there is not enough pipeline infrastructure in place to match the rate of production to other markets. As a result, prices trade at a discount to the benchmark for natural gas in the U.S., Henry Hub. Stone is fortunate as its production contains natural gas liquids. Liquids can be more valuable than dry gas because they increase the heat content of the natural gas and can be removed from the gas to make valuable refined products. Currently prices for liquids are down due to a supply glut coupled with take away capacity issues.
Production in the Gulf of Mexico is priced off Louisiana Light Sweet (LLS), a regional benchmark, which normally trades at a premium to the benchmark for the U.S., West Texas Intermediate (WTI). The point of delivery for WTI is Cushing, Oklahoma.
Strategy
The decline in oil price from $107 per barrel (bbl) to $45/bbl has caused Stone to move into survive mode. The Company is looking to high grade it portfolio, cut costs, and build up cash to ride out the storm brought on by tumbling oil prices.
Oil36%
Natural Gas50%
NGL's14%
Figure 13: 2014 Production ‐ 93,518 Mmcfe
Stone Energy Corp. (SGY) BURKENROAD REPORTS (www.burkenroad.org) March 26, 2015
19
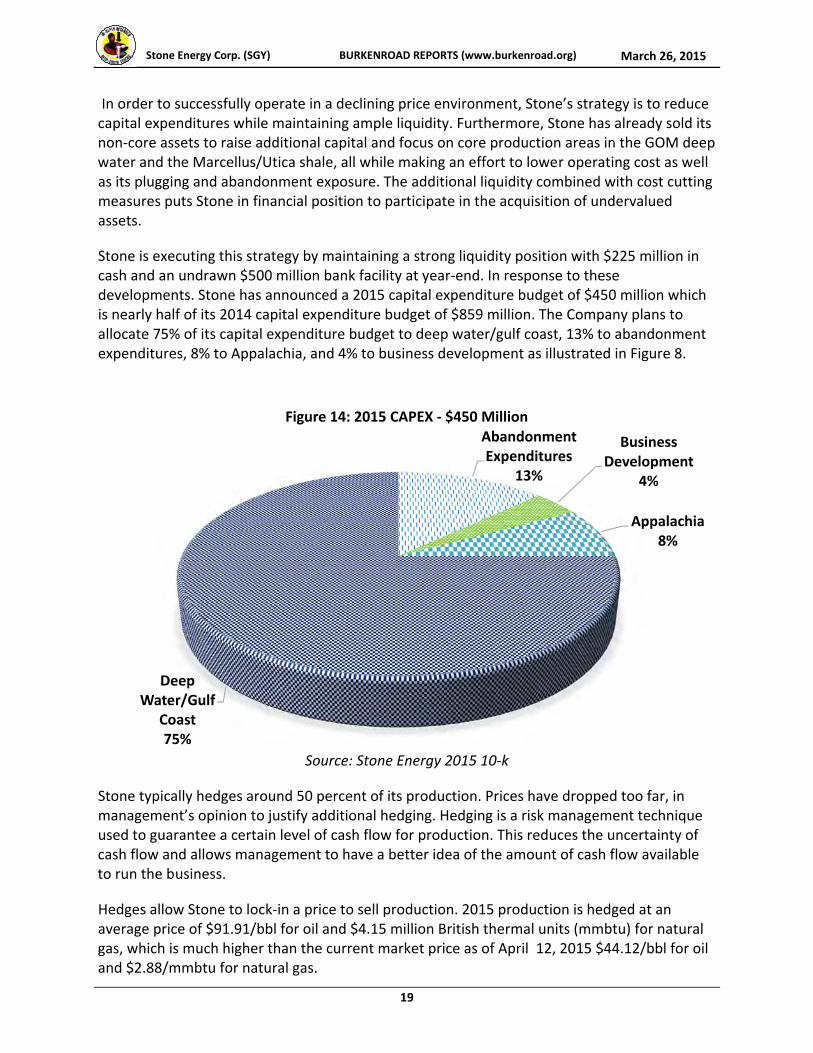
In order to successfully operate in a declining price environment, Stone’s strategy is to reduce capital expenditures while maintaining ample liquidity. Furthermore, Stone has already sold its non‐core assets to raise additional capital and focus on core production areas in the GOM deep water and the Marcellus/Utica shale, all while making an effort to lower operating cost as well as its plugging and abandonment exposure. The additional liquidity combined with cost cutting measures puts Stone in financial position to participate in the acquisition of undervalued assets.
Stone is executing this strategy by maintaining a strong liquidity position with $225 million in cash and an undrawn $500 million bank facility at year‐end. In response to these developments. Stone has announced a 2015 capital expenditure budget of $450 million which is nearly half of its 2014 capital expenditure budget of $859 million. The Company plans to allocate 75% of its capital expenditure budget to deep water/gulf coast, 13% to abandonment expenditures, 8% to Appalachia, and 4% to business development as illustrated in Figure 8.
Source: Stone Energy 2015 10‐k
Stone typically hedges around 50 percent of its production. Prices have dropped too far, in management’s opinion to justify additional hedging. Hedging is a risk management technique used to guarantee a certain level of cash flow for production. This reduces the uncertainty of cash flow and allows management to have a better idea of the amount of cash flow available to run the business.
Hedges allow Stone to lock‐in a price to sell production. 2015 production is hedged at an average price of $91.91/bbl for oil and $4.15 million British thermal units (mmbtu) for natural gas, which is much higher than the current market price as of April 12, 2015 $44.12/bbl for oil and $2.88/mmbtu for natural gas.
Abandonment Expenditures
13%
Business Development
4%
Appalachia8%
Deep Water/Gulf
Coast 75%
Figure 14: 2015 CAPEX ‐ $450 Million
Stone Energy Corp. (SGY) BURKENROAD REPORTS (www.burkenroad.org) March 26, 2015
20
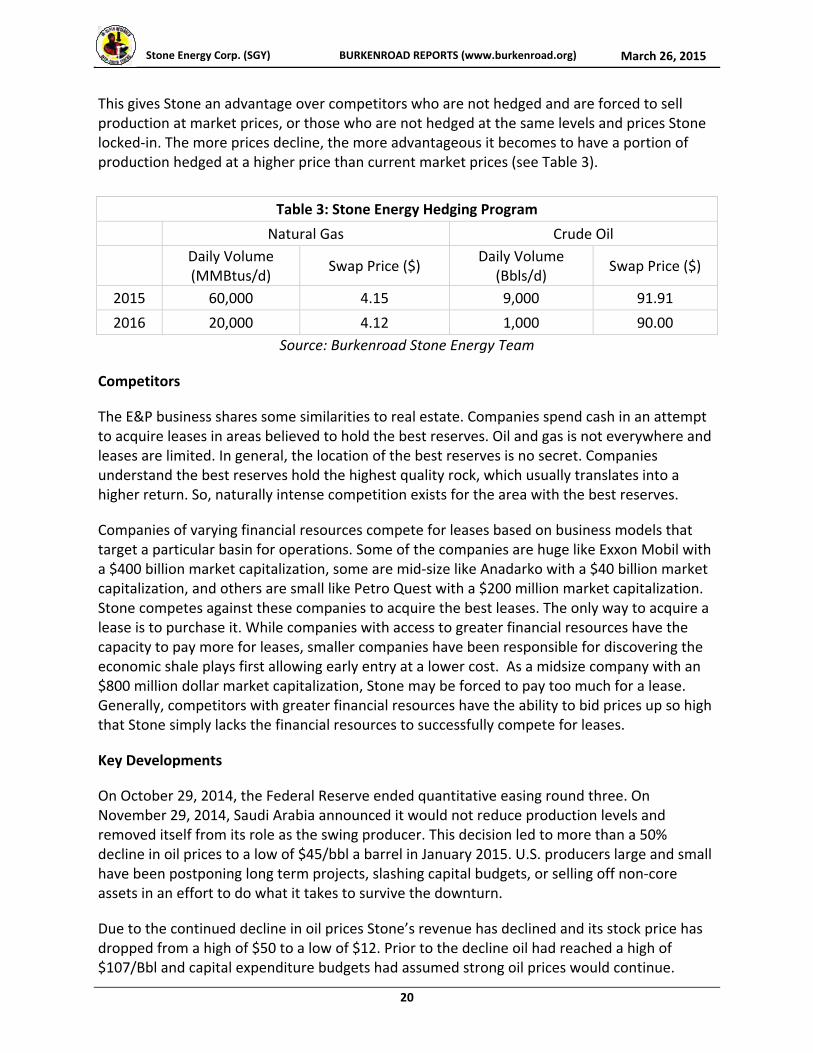
This gives Stone an advantage over competitors who are not hedged and are forced to sell production at market prices, or those who are not hedged at the same levels and prices Stone locked‐in. The more prices decline, the more advantageous it becomes to have a portion of production hedged at a higher price than current market prices (see Table 3).
Source: Burkenroad Stone Energy Team
Table 3: Stone Energy Hedging Program
Natural Gas Crude Oil
Daily Volume (MMBtus/d)
Swap Price ($) Daily Volume
(Bbls/d) Swap Price ($)
2015 60,000 4.15 9,000 91.91
2016 20,000 4.12 1,000 90.00
Competitors
The E&P business shares some similarities to real estate. Companies spend cash in an attempt to acquire leases in areas believed to hold the best reserves. Oil and gas is not everywhere and leases are limited. In general, the location of the best reserves is no secret. Companies understand the best reserves hold the highest quality rock, which usually translates into a higher return. So, naturally intense competition exists for the area with the best reserves.
Companies of varying financial resources compete for leases based on business models that target a particular basin for operations. Some of the companies are huge like Exxon Mobil with a $400 billion market capitalization, some are mid‐size like Anadarko with a $40 billion market capitalization, and others are small like Petro Quest with a $200 million market capitalization. Stone competes against these companies to acquire the best leases. The only way to acquire a lease is to purchase it. While companies with access to greater financial resources have the capacity to pay more for leases, smaller companies have been responsible for discovering the economic shale plays first allowing early entry at a lower cost. As a midsize company with an $800 million dollar market capitalization, Stone may be forced to pay too much for a lease. Generally, competitors with greater financial resources have the ability to bid prices up so high that Stone simply lacks the financial resources to successfully compete for leases.
Key Developments
On October 29, 2014, the Federal Reserve ended quantitative easing round three. On November 29, 2014, Saudi Arabia announced it would not reduce production levels and removed itself from its role as the swing producer. This decision led to more than a 50% decline in oil prices to a low of $45/bbl a barrel in January 2015. U.S. producers large and small have been postponing long term projects, slashing capital budgets, or selling off non‐core assets in an effort to do what it takes to survive the downturn.
Due to the continued decline in oil prices Stone’s revenue has declined and its stock price has dropped from a high of $50 to a low of $12. Prior to the decline oil had reached a high of $107/Bbl and capital expenditure budgets had assumed strong oil prices would continue.
Stone Energy Corp. (SGY) BURKENROAD REPORTS (www.burkenroad.org) March 26, 2015
21
Management is reacting to declining oil prices by cutting spending, maintaining liquidity, and focusing operations on core areas.
Other key developments include
The Board of Directors authorized a 2015 capital expenditure budget of $450 million representing almost a 50% reduction from the 2014 capital expenditure budget of $825 million.
Stone is focusing 75% of its capital expenditure budget on deep water GOM assets
2015 production is expected to decline slightly, even with the Cardona #6 well coming online
PEER ANALYSIS
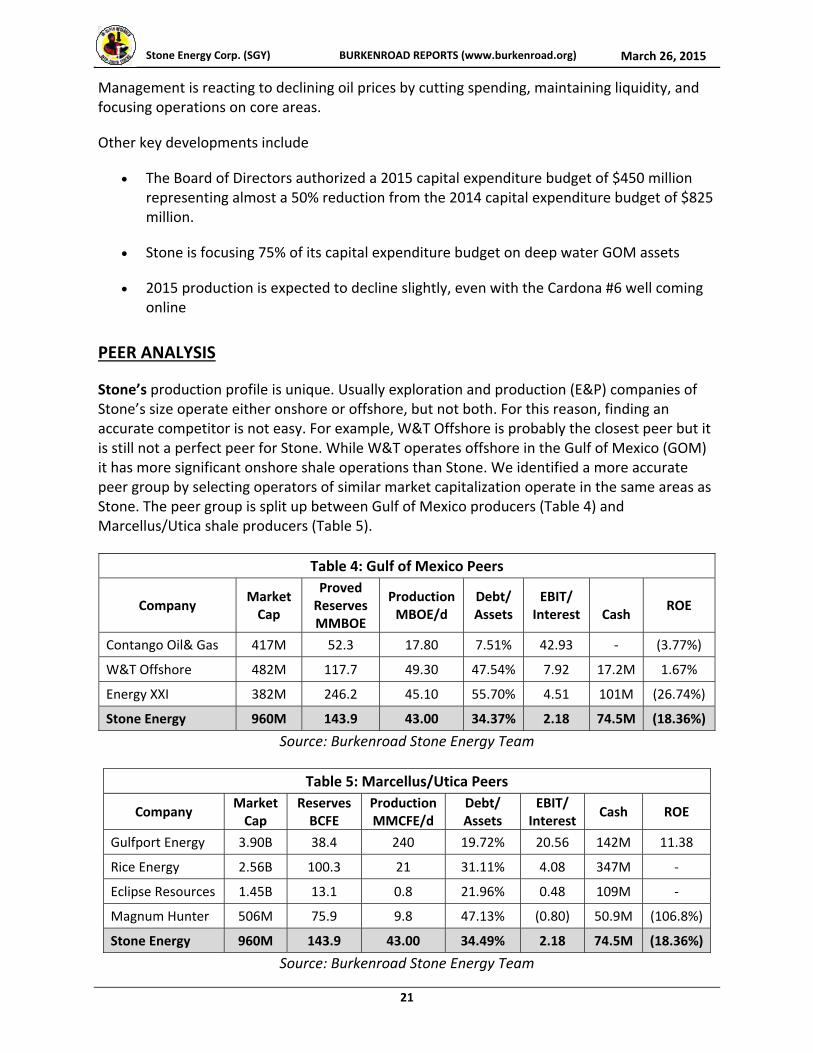
Stone’s production profile is unique. Usually exploration and production (E&P) companies of Stone’s size operate either onshore or offshore, but not both. For this reason, finding an accurate competitor is not easy. For example, W&T Offshore is probably the closest peer but it is still not a perfect peer for Stone. While W&T operates offshore in the Gulf of Mexico (GOM) it has more significant onshore shale operations than Stone. We identified a more accurate peer group by selecting operators of similar market capitalization operate in the same areas as Stone. The peer group is split up between Gulf of Mexico producers (Table 4) and Marcellus/Utica shale producers (Table 5).
Source: Burkenroad Stone Energy Team
Table 4: Gulf of Mexico Peers
Company Market Cap
Proved Reserves MMBOE
Production MBOE/d
Debt/ Assets
EBIT/ Interest
Cash
ROE
Contango Oil& Gas 417M 52.3 17.80 7.51% 42.93 ‐ (3.77%)
W&T Offshore 482M 117.7 49.30 47.54% 7.92 17.2M 1.67%
Energy XXI 382M 246.2 45.10 55.70% 4.51 101M (26.74%)
Stone Energy 960M 143.9 43.00 34.37% 2.18 74.5M (18.36%)
Table 5: Marcellus/Utica Peers
Company Market Cap
Reserves BCFE
Production MMCFE/d
Debt/ Assets
EBIT/ Interest
Cash ROE
Gulfport Energy 3.90B 38.4 240 19.72% 20.56 142M 11.38
Rice Energy 2.56B 100.3 21 31.11% 4.08 347M ‐
Eclipse Resources 1.45B 13.1 0.8 21.96% 0.48 109M ‐
Magnum Hunter 506M 75.9 9.8 47.13% (0.80) 50.9M (106.8%)
Stone Energy 960M 143.9 43.00 34.49% 2.18 74.5M (18.36%)
Source: Burkenroad Stone Energy Team
Stone Energy Corp. (SGY) BURKENROAD REPORTS (www.burkenroad.org) March 26, 2015
22
Gulf of Mexico Peers
Contango Oil & Gas (MCF:NYSE)
Contango Oil & Gas is an E&P company based in Houston, Texas. Historically the Company operated offshore in the Gulf of Mexico conventional shelf. In 2013 the Company merged with Crimson energy in all stock transaction to operate a more balanced portfolio. Since the merger operations expanded onshore in the Eagle Ford, Haynesville, Niobrara, and the Tuscaloosa Marine shale. The majority of production is natural gas. The company maintains a very conservative balance sheet. The stock is currently trading at $22.50 which is very close to its 52 week low of $20.50. Management has a $50M capital budget planned for 2015.
Energy XXI Limited (EXXI: NASDAQ)
Energy XXI Limited is an E&P company based in Houston, Texas. Its operations are focused in the United States Gulf Coast with the majority focused offshore in the conventional shelf in the Gulf of Mexico. The Company merged with EPL Oil and Gas in 2014 for $2.3B. Debt financed a significant amount of the transaction. The merger created the largest public independent producer on the conventional shelf. Due to the low oil price environment Energy XXI is focused on selling non‐core assets to raise cash in order to reduce debt. Short interest makes up a whopping 28% of the float. The company is currently trading at $3.05 which is very close to its 52 week low of $2.30. Management has a $680M capital budget planned for 2015.
W&T Offshore (WTI:NYSE)
W&T Offshore is an E&P company based in Houston, Texas. WTI holds a diverse portfolio with a significant presence offshore and also operates onshore. Offshore the Company operates in the Gulf of Mexico in deep water as well as the conventional shelf. Onshore the Company operates in the Permian Basin in West Texas. W&T is heavily leveraged and has realized a net income loss the last two years. Short interest makes up 13% of the float. The company is currently trading at $5.30 which is very close to its 52 week low of $4.80. Management has a $200M capital budget planned for 2015.
Marcellus Utica Peers
Gulfport Energy (GPOR:NASDAQ)
Gulfport Energy is an E&P company based in Oklahoma City, Oklahoma. Gulfport operates a geographically diverse portfolio with conventional assets in Southern Louisiana, Canadian oil sands and with a strong focus in Ohio in the Utica shale. The Company holds a strong liquidity position and hedging program with significant volumes hedged above current market prices out to 2016. Management has a $600M capital budget planned for 2015.
Stone Energy Corp. (SGY) BURKENROAD REPORTS (www.burkenroad.org) March 26, 2015
23
Eclipse Resources (ECR:NYSE)
Eclipse Resources is an E&P company based in State College, Pennsylvania. Eclipse operations are solely focused on the core of the Marcellus/Utica shale. The Company maintains a conservative balance sheet and strong hedging program. Currently Eclipse is trading at $5.59 which is very close to its 52 week low of $5.08. Management has a $640M capital budget planned for 2015.
Magnum Hunter (MHR:NYSE)
Magnum Hunter is an E&P company based in Houston, Texas. Magnum Hunter operates onshore in the Marcellus/Utica shale as well as the Bakken shale. The company is also involved in midstream operations primarily in West Virginia and Ohio. Mangum Hunter is highly leveraged and has been actively engaged in selling asset over the past 3 years. Short interest makes up 23% of the float. Currently it is trading at $2.29 which is very close to its 52 week low of $1.90. Management has a $100 M capital budget planned for 2015.
Rice Energy (RICE:NYSE)
Rice Energy is an E&P company based in Canonsburg, Pennsylvania. Rice Energy operations are solely focused onshore in the Marcellus/Utica shale. It also operates midstream assets in the area. The company maintains a strong liquidity position and conservative balance sheet. Under its hedging program, Rice has 84% of production hedged above current market prices. Management has a $560 M capital budget planned for 2015.
MANAGEMENT PERFORMANCE AND BACKGROUND
The Board of directors oversees Stone Energy’s executive management team. David Welch, CEO and President of Stone Energy, serves as Chairman of the Board. Furthermore, Stone follows the independence criteria set forth by the New York Stock Exchange, which requires independent board members to hold a majority of the seats available on the Board of Directors. Board members are voted on by stockholders after being selected by the Board’s Nominating & Governance Committee.
David H. Welch President, Chief Executive Officer, and Chairman of the Board (65)
David H. Welch was appointed President and Chief Executive Officer in 2004 and was appointed Chairman of the Board in 2012. Prior to his tenure at Stone Energy, Mr. Welch was the Senior Vice President of British Petroleum (BP) America, Inc. since 2003 and Vice President of BP, Inc. since 1999. Mr. Welch received a degree in petroleum engineering from Louisiana State University and a doctoral degree in economics and engineering from Tulane University. He also completed the advanced management program from Harvard Business School and executive development programs from Cambridge University and Stanford Business School. Mr. Welch currently sits on the Board of Directors of IBERIABANK and serves as the Executive Director of the National Ocean Industries Association.
Stone Energy Corp. (SGY) BURKENROAD REPORTS (www.burkenroad.org) March 26, 2015
24
Kenneth H. Beer Executive Vice President and Chief Financial Officer (56)
Kenneth H. Beer was named Chief Financial Officer in 2005 and became Executive Vice President in 2011. Mr. Beer served as a Senior Energy Analyst and Director of Research at Johnson Rice & Company prior to joining Stone. Before taking his career to Johnson Rice & Company, Mr. Beer was an energy analyst and investment banker at Howard Weil Inc. He received a degree in economics from Dartmouth College in 1979 and went on to receive his MBA from Stanford University in 1983.
Lisa S. Jaubert Senior Vice President – General Counselor and Secretary (59)
Lisa S. Jaubert joined Stone in July 2012 and became a Senior Vice President on May 23, 2013. Prior to her tenure with Stone, Ms. Jaubert worked as Counsel with Latham & Walkins, LLP specializing in energy related transactions. She has also worked for Mariner Energy and was a founding shareholder of Schully Roberts Slattery Jaubert & Marino PLC.
John J. Leonard Senior Vice President – Exploration and Business Development (54)
John J. Leonard was named Senior Vice President – Exploration and Business Development in 2014. Before becoming Vice President he held many positions including General Manager of Deepwater Development, Director of Reservoir Engineering, Asset Manager Conventional Shelf, Asset Manager GOM Shelf East, Eastern GOM Asset Manager, and Chief Reservoir Engineer. Prior to Mr. Leonard’s career at Stone Energy he worked for Object Reservoir, Expro Americas, and Pro Tech.
E. J. Louviere Senior Vice President – Land (65)
E. J. Louviere has been an employee at Stone Energy since the company went public. Mr. Louviere was named Senior Vice President – Land in 2004 after serving as Vice President – Land since 1995.
Keith A. Seilhan Senior Vice President – Deep Water (47)
Keith A. Seilhan became Senior Vice President – Deep Water at Stone Energy in 2013 after serving as Vice President. Previously, Mr. Seilhan spent 21 years at Amoco and BP most recently as BP’s Incident Commander on the Deepwater Horizon incident in 2010. He graduated from Louisiana State University with a degree in mechanical engineering.
Stone Energy Corp. (SGY) BURKENROAD REPORTS (www.burkenroad.org) March 26, 2015
25
Richard L. Toothman Senior Vice President – Appalachia (49)
Richard L. Toothman became the Senior Vice President – Appalachia in 2013 after joining Stone Energy’s management team in 2010 as the Vice President – Appalachia. Mr. Toothman held executive positions as CNX Gas Company and also worked for Consol Energy and Conoco before starting his career at Stone Energy.
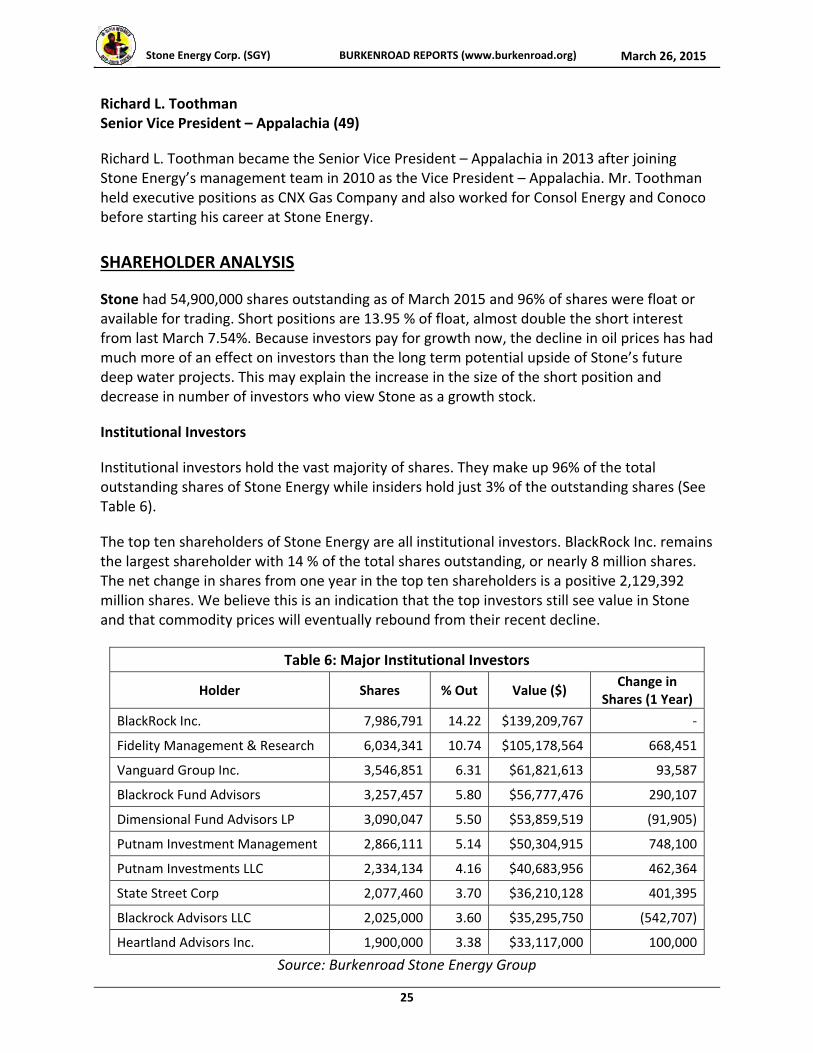
SHAREHOLDER ANALYSIS
Stone had 54,900,000 shares outstanding as of March 2015 and 96% of shares were float or available for trading. Short positions are 13.95 % of float, almost double the short interest from last March 7.54%. Because investors pay for growth now, the decline in oil prices has had much more of an effect on investors than the long term potential upside of Stone’s future deep water projects. This may explain the increase in the size of the short position and decrease in number of investors who view Stone as a growth stock.
Institutional Investors
Institutional investors hold the vast majority of shares. They make up 96% of the total outstanding shares of Stone Energy while insiders hold just 3% of the outstanding shares (See Table 6).
The top ten shareholders of Stone Energy are all institutional investors. BlackRock Inc. remains the largest shareholder with 14 % of the total shares outstanding, or nearly 8 million shares. The net change in shares from one year in the top ten shareholders is a positive 2,129,392 million shares. We believe this is an indication that the top investors still see value in Stone and that commodity prices will eventually rebound from their recent decline.
Table 6: Major Institutional Investors
Holder Shares % Out Value ($) Change in
Shares (1 Year)
BlackRock Inc. 7,986,791 14.22 $139,209,767 ‐
Fidelity Management & Research 6,034,341 10.74 $105,178,564 668,451
Vanguard Group Inc. 3,546,851 6.31 $61,821,613 93,587
Blackrock Fund Advisors 3,257,457 5.80 $56,777,476 290,107
Dimensional Fund Advisors LP 3,090,047 5.50 $53,859,519 (91,905)
Putnam Investment Management 2,866,111 5.14 $50,304,915 748,100
Putnam Investments LLC 2,334,134 4.16 $40,683,956 462,364
State Street Corp 2,077,460 3.70 $36,210,128 401,395
Blackrock Advisors LLC 2,025,000 3.60 $35,295,750 (542,707)
Heartland Advisors Inc. 1,900,000 3.38 $33,117,000 100,000
Source: Burkenroad Stone Energy Group
Stone Energy Corp. (SGY) BURKENROAD REPORTS (www.burkenroad.org) March 26, 2015
26
Company Repurchases/Sales
In May 2014, Stone raised capital by issuing five million shares of common stock at a price of $41.00 per share. The funds raised were used for development of the Gulf of Mexico, Utica shale, the potential acquisition of additional Appalachian acreage, and general corporate purposes.
The ability to raise equity at a price so close to their 52 week high is evidence of investor confidence in Stone’s future growth in a strong commodity price environment. Raising equity capital rather than debt maintained the Company’s strong balance sheet. In addition Stone has continued to avoid tapping its revolver. These actions fall in line with management’s commitment not to rely heavily on debt markets for financing.
Insider Transactions
David Welch holds the largest amount of shares among insiders at 1% of shares outstanding. Yet, he has seen the value of his shares cut by more than half. When the stock reached a high of $49.05 the value of his shares totaled $27 million. After oil prices declined, Stone’s price plummeted to a low of $12.07 and the value of his shares fell to $6.8 million. For shareholders, it has certainly been a wild ride. Currently shares are up to $16.09, but the volatility in this stock demonstrates just how vulnerable E&P’s are to oil prices (see Table 7).
Source: Burkenroad Stone Energy Team
Table 7: Major Insider Investors
Holder Shares % Out Value Change in
Shares (1 Year)
David Welch (Chairman/President/CEO)
566,742 1.01 $10,042,668 (54,099)
Kenneth Beer (CFO) 217,252 0.39 $3,849,705 (16,109)
Kent Pierret 92,949 0.17 $1,647,056 ‐
RISK ANALYSIS AND INVESTMENT CAVEATS
Stone Energy operates in a very physical business, which inherently involves managing a multitude of operational risks. In addition to the operational risk, the industry is heavily regulated. Due to increasing concerns about the environment in light of fracking and the BP Macando spill. As a result, the industry is under even more scrutiny and new regulations appear to be imminent. Due to the large capital expenditures required to develop reserves E&P companies often use the capital markets to raise cash, exposing the Company to significant financial risks.
Operational Risk
The following are major operational risks faced by all exploration and production (E&P) companies: Reserve estimates, reserve depletion and replacement, commodity price volatility, and access to capital markets.
Stone Energy Corp. (SGY) BURKENROAD REPORTS (www.burkenroad.org) March 26, 2015
27
While most companies of Stone’s size operate primarily onshore, Stone Energy faces additional natural disaster and environmental risks due to its operations in the Gulf of Mexico hurricanes.
Reserve Estimates
Reserves are estimated amounts of oil and gas deposits believed to be recoverable using existing technology under current economic conditions. The greater the number of reserves, the longer a company can sustain production and generate cash flow. Reserves are broken down into three categories based on the degree of certainty that oil and gas can be recovered: proved, probable, and possible. Because they have the highest probability of being recovered, proved reserves are the gold standard for financial and operating metrics which investors and lenders use for decision making.
There is inherent uncertainty associated with estimating reserves. Often, revisions are made as new information becomes available. Revisions can cause a material effect on almost every financial aspect of the Company.
Reserve Depletion & Replacement
The rate of depletion of reserves depends on a variety of factors: pressure, porosity of the rock, permeability of the rock, production flow rates, and access to take away capacity to name a few. In order to sustain or grow production, E&P companies must replace reserves. Companies can replace reserves organically through extensions of currently owned properties or by acquiring new properties. Many factors can affect the capital required to acquire new reserves, produce reserves, and transport production to market. In, addition there is no guarantee future exploration and development efforts will be successful. As a result, Stone may be unable to economically replace reserves and sustain or grow production.
Commodity Price Volatility
All E&P companies are price takers. Oil and gas prices are set by the market. Commodity prices are unpredictable and can be very high or very low. A sustained decline in commodity prices can lead to a decline in cash flow. This could affect Stone’s ability to pay the interest on its debt and finance future operations.
The value of reserves is determined by the difference between the cost of the reserves and current market prices. A write‐down occurs when reserves on the balance sheet become uneconomic. Reserves that cost more than the revenues that could be expected from production at current prices are revalued at lower prices.
As such, a write down reduces the value of the reserves on the balance sheet through a non‐cash charge that ultimately results in a reduction of net income. This write down can lead to a reduction in book equity or market equity while having an adverse impact on debt ratios. The recent decline in prices for West Texas Intermediate (WTI), the U.S. benchmark, and Brent (BFO), the international benchmark, has raised the risk that oil companies will have reserve write‐downs.
Stone Energy Corp. (SGY) BURKENROAD REPORTS (www.burkenroad.org) March 26, 2015
28
Access to Capital Markets
Exploring and producing commodities requires a substantial amount of capital. E&P companies must consistently replace reserves and production in order to grow. Producers often outspend cash flow derived from current production so access to capital markets is crucial in funding operations. In the event of a financial crisis or a similar event that restricts access to capital or increases the cost of capital Stone Energy may not be able to fund its operations.
Asset Retirement Obligations
Asset retirement obligation (ARO) refers to the present value of the expected cost associated with removing facilities and equipment at the end of an oil and gas property’s useful life. Some inherent risk is involved in the way ARO is calculated. Depending on the discount factor used, the present value of future cash flows could differ significantly. Management is required to estimate the cost of retiring an asset in the future and the future cost may be higher than estimated.
Natural Disasters
The Gulf of Mexico region represents 45% of Stone’s reserves and 74% of the Company’s production. Hurricanes and tropical storms are common in this area. For six months, a substantial percentage of assets are at potential risk of damage during hurricane season. Given Stone’s significant presence in the Gulf, hurricanes can cause significant revenue losses. However, the Company typically shuts down wells and evacuates crews in advance of a hurricane in order to mitigate revenue loses.
Environmental Risks
Both Stone’s onshore and offshore operations pose environmental risks. Oil and gas production may involve the use of chemicals, which if introduced to the environment due to an accident, could cause environmental damage. The risk of an environmental disaster could lead to costly lawsuits, suspension of drilling, or other events that would delay cash flows or increase costs. Offshore, the challenging environment can lead to oil spills and damage to marine life. Damages offshore can be extremely costly. If a significant environmental event occurred, Stone’s insurance may not pay for all the damages. As a result, the Company may not have the capital required to pay for damages.
Financial Risks
Financial risk arises from the relationship between a company’s business model and its capital structure. Stone’s capital structures are comprised of debt and equity. The Company is obligated to service its debt with no obligation to equity holders. Equity holders are entitled to what’s left after obligations have been paid. Debt service is a fixed cost and cash flows are variable. Therein lies the financial risk. If the company does not produce enough cash flow to service its debt, there is a risk of default.
Stone Energy Corp. (SGY) BURKENROAD REPORTS (www.burkenroad.org) March 26, 2015
29
Stone has three traditional sources to fund its capital expenditures: internal cash flows and issuing debt or issuing equity. In the E&P business, internal cash flows are often not enough to fund capital expenditures, particularly for smaller‐capitalized companies. Stone relies on capital markets to fill the gap. Its reliance on external funding is a financial risk.
In the oil and gas industry it is not uncommon to use join ventures as a source of capital. Especially for deep water operations as the cost and risk of operating a well are significantly larger than they are onshore. To reduce financial and operational risk operators will often spread out capital by taking partial working interest in several wells.
Conditions in capital markets are dynamic. Raising capital can become more expensive or the ability to raise capital can become nonexistent. The metrics below are used to determine the financial health of the company and the ability to repay debt.
Cash Flow
Ultimately cash flow is a factor in Stone’s ability to successfully produce commercial quantities of oil and gas from its reserves. Operational risks could prevent Stone from reaching estimate production levels. Also, prices may fall and Stone could realize less cash flow, which results in an even wider funding gap. The amount of internal cash flow Stone generates will determine the degree of reliance on external financing to fund its operations. The more cash flow generated, the greater degree of financial and operating flexibility.
More simply put, the less cash flow generated the more financial risk Stone must assume to fund its operations using external sources, debt or equity. Increasing the debt load means more interest payments, which are fixed costs Stone must make. This, in turn, makes successful production efforts even more important because more cash flow is obligated to pay interest. Debt increases credit risk and risk of default by obligating Stone to make more fixed payments when cash flows generated from its assets are variable.
Credit Risk
The amount of debt relative to equity and operating performance of a company will determine its credit risk. Credit risk is essentially a measure of Stone’s ability to pay its creditors, which is directly attributable to its ability to generate consistent cash flow and the amount of debt on its balance sheet. The stronger the ability to generate cash flow, the lower the risk of nonpayment or default.
Gulf of Mexico companies in the peer group are more leveraged than shale gas operators. Stone is somewhere in between. While Rice Energy, Gulfport Energy and Eclipse Energy have a strong operating presence in the Marcellus/Utica shale they all recently became public companies. These competitors used the equity raised to pay down debt resulting in healthier leverage metrics. On the other hand, Magnum Hunter Resources has been operating for ten plus years and has the worse debt metrics among the shale gas players. Energy XXI made a major acquisition heavily financed by debt resulting in higher leverage ratios. WTI has also been heavily scrutinized as one of the more leveraged companies in the industry.
Stone Energy Corp. (SGY) BURKENROAD REPORTS (www.burkenroad.org) March 26, 2015
30
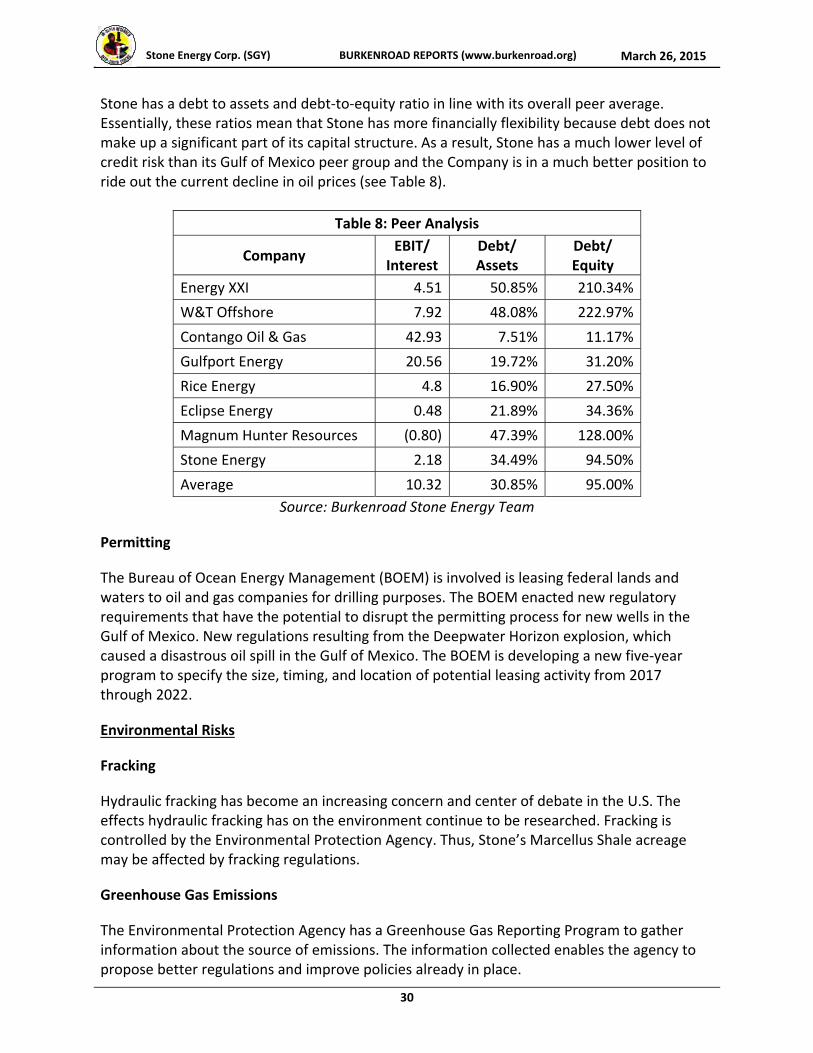
Stone has a debt to assets and debt‐to‐equity ratio in line with its overall peer average. Essentially, these ratios mean that Stone has more financially flexibility because debt does not make up a significant part of its capital structure. As a result, Stone has a much lower level of credit risk than its Gulf of Mexico peer group and the Company is in a much better position to ride out the current decline in oil prices (see Table 8).
Table 8: Peer Analysis
Company EBIT/
Interest Debt/ Assets
Debt/ Equity
Energy XXI 4.51 50.85% 210.34%
W&T Offshore 7.92 48.08% 222.97%
Contango Oil & Gas 42.93 7.51% 11.17%
Gulfport Energy 20.56 19.72% 31.20%
Rice Energy 4.8 16.90% 27.50%
Eclipse Energy 0.48 21.89% 34.36%
Magnum Hunter Resources (0.80) 47.39% 128.00%
Stone Energy 2.18 34.49% 94.50%
Average 10.32 30.85% 95.00%
Source: Burkenroad Stone Energy Team
Permitting
The Bureau of Ocean Energy Management (BOEM) is involved is leasing federal lands and waters to oil and gas companies for drilling purposes. The BOEM enacted new regulatory requirements that have the potential to disrupt the permitting process for new wells in the Gulf of Mexico. New regulations resulting from the Deepwater Horizon explosion, which caused a disastrous oil spill in the Gulf of Mexico. The BOEM is developing a new five‐year program to specify the size, timing, and location of potential leasing activity from 2017 through 2022.
Environmental Risks
Fracking
Hydraulic fracking has become an increasing concern and center of debate in the U.S. The effects hydraulic fracking has on the environment continue to be researched. Fracking is controlled by the Environmental Protection Agency. Thus, Stone’s Marcellus Shale acreage may be affected by fracking regulations.
Greenhouse Gas Emissions
The Environmental Protection Agency has a Greenhouse Gas Reporting Program to gather information about the source of emissions. The information collected enables the agency to propose better regulations and improve policies already in place.
Stone Energy Corp. (SGY) BURKENROAD REPORTS (www.burkenroad.org) March 26, 2015
31
FINANCIAL PERFORMANCE AND PROJECTIONS
Our projections for Stone Energy’s financial performance are tied directly to the Company’s deep water drilling program. Specifically, we believe Stone’s production growth is dependent on the Company’s performance of its Gulf of Mexico (GOM) assets. Stone’s current strategy is to focus on offshore GOM production and decrease onshore activities after first quarter 2015. Given the forecasted commodity prices, we chose to use the price to quantity revenue model to determine the future value of Stone Energy.
Production
Our team forecasted oil, gas, and natural gas liquids (NGLs) production in Stone’s main operation areas: onshore and offshore. Using the Company’s existing production, historical well data, and current management guidance for 2015 drilling performance, we built a waterfall model to forecast the production while introducing a decline curve. Furthermore, we compared the forecasted production with the expected production we received from management. Also, different decline curves are used based on the location of the production and the commodity being produced. Based upon key assumptions and management guidance, our revenue model shows that the predicted annual production for Stone Energy in 2015 is 86,691 million cubic feet equivalent, decreasing 7.4% from 2014.
Oil and Gas Price Assumptions
Our pricing forecast expects oil prices for Louisiana Light Sweet Crude (LLSC) to be $61.89 per barrel at year end 2015. Furthermore, we predict the price of LLSC to be $72.87 by 2020. Additionally, natural gas prices are expected to be $3.03 at year‐end 2015 and increase to $4.28 by 2020. Natural Gas Liquid prices are expected to be $21.04 per barrel at year‐end 2015 and rise to $25.88 by 2020. Our team forecasted oil and gas prices using both model and market driven price indicators.
SITE VISIT
Our team met with Stone Energy’s Executive Vice President and Chief Financial Officer, Kenneth Beer, and Financial Analyst, Michael Burkardt, on February 19, 2015. The meeting took place in the Executive Board Room of Stone’s New Orleans office, which is located in the Energy Centre building in downtown New Orleans.
Mr. Beer and Mr. Burkardt began the meeting with their 2015 investor presentation. This gave our team a better understanding of Stone’s 2015 strategy. During this presentation we asked questions regarding the research we have conducted on Stone and our model.
Mr. Beer helped us identify a more appropriate peer group for Stone. Stone is unique because it has a diverse reserve portfolio with operations in the Gulf of Mexico and the Marcellus/Utica shale. Not many companies, especially companies comparable in size to Stone, have this type of diversification. Management agreed we needed to establish Stone’s peer group based on the area of operations.
Stone Energy Corp. (SGY) BURKENROAD REPORTS (www.burkenroad.org) March 26, 2015
32
Management also stressed concerns about the economic condition of the industry and the effect low gas prices have on Stone’s Marcellus acreage. Notably, the abundance of gas being produced in the region is resulting in a price discount. Mr. Beer stated that Stone does not plan to drill any new wells in the Marcellus region this year. Instead, the Company will focus on producing oil in their Gulf of Mexico operations.
Both Mr. Beer and Mr. Burkardt emphasized the importance of the Pompano facility and the value it brings to the Company. The Pompano facility is a production platform connected to wells in the surrounding acreage. Owning the Pompano facility lowers Stone’s operating costs. Furthermore, they suggested we value the platform by the amount of money Stone would have to pay in fees if they did not own the platform.
Management stressed Stone’s strong balance sheet and liquidity position. Of note, Stone has a respectable amount of cash on hand and is well hedged for 2015. Finally, Mr. Beer mentioned that Stone may be interested in further diversifying its portfolio by adding assets if conditions improve.
INDEPENDENT OUTSIDE RESEARCH
Our team conducted various types of outside research to enhance our understanding of Stone Energy and enable us to better evaluate the Company. While our main source of information came from Stone’s 10‐K, we also used Tulane University’s Turchin Library along with Bloomberg, Investor Presentations, Yahoo! Finance, and Capital IQ to gather and analyze financial data. Furthermore, we gained industry insight using the Energy Information Administration website.
To enhance our report, we interviewed professionals with an understanding of the energy industry and a familiarity with Stone. We met with Richard Tullis, Senior Exploration and Production (E&P) Analyst who covers Stone at Capital One Southcoast, and Phillips Johnston, Senior E&P Analyst at Capital One Securities. Our meeting began by discussing the current market environment and the outlook of the industry. During our meeting on February 23, 2015 we discussed valuation metrics, the future outlook of Stone, and our valuation model. We reviewed our revenue model and the key drivers behind our valuation. Mr. Tullis recommended that we create a separate model for each of Stone’s operational areas. He also suggested that we model Stone using the waterfall approach, adding each well as it comes online. We also received guidance on how to select and evaluate Stone’s competitors.
Stone Energy Corp. (SGY) BURKENROAD REPORTS (www.burkenroad.org) March 26, 2015
33
ANOTHER WAY TO LOOK AT IT
ALTMAN Z‐SCORE
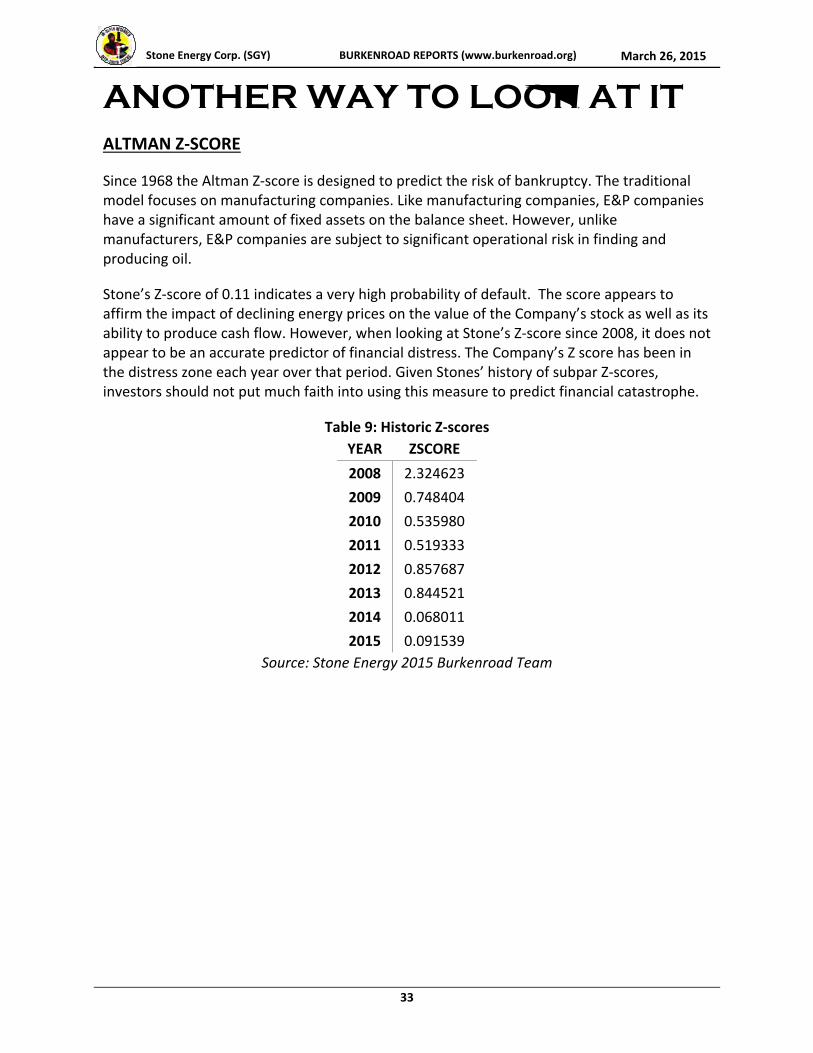
Since 1968 the Altman Z‐score is designed to predict the risk of bankruptcy. The traditional model focuses on manufacturing companies. Like manufacturing companies, E&P companies have a significant amount of fixed assets on the balance sheet. However, unlike manufacturers, E&P companies are subject to significant operational risk in finding and producing oil.
Stone’s Z‐score of 0.11 indicates a very high probability of default. The score appears to affirm the impact of declining energy prices on the value of the Company’s stock as well as its ability to produce cash flow. However, when looking at Stone’s Z‐score since 2008, it does not appear to be an accurate predictor of financial distress. The Company’s Z score has been in the distress zone each year over that period. Given Stones’ history of subpar Z‐scores, investors should not put much faith into using this measure to predict financial catastrophe.
Table 9: Historic Z‐scores
YEAR ZSCORE
2008 2.324623
2009 0.748404
2010 0.535980
2011 0.519333
2012 0.857687
2013 0.844521
2014 0.068011
2015 0.091539
Source: Stone Energy 2015 Burkenroad Team
Stone Energy Corp. (SGY) BURKENROAD REPORTS (www.burkenroad.org) March 26, 2015
34
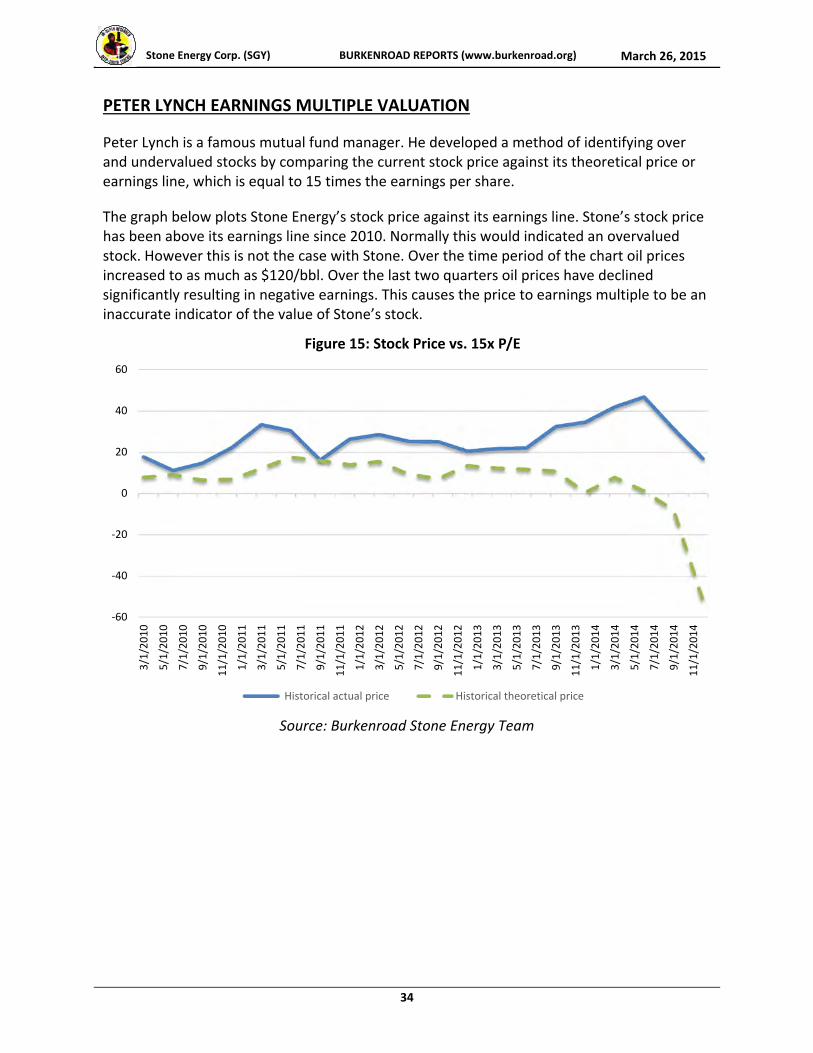
PETER LYNCH EARNINGS MULTIPLE VALUATION
Peter Lynch is a famous mutual fund manager. He developed a method of identifying over and undervalued stocks by comparing the current stock price against its theoretical price or earnings line, which is equal to 15 times the earnings per share.
The graph below plots Stone Energy’s stock price against its earnings line. Stone’s stock price has been above its earnings line since 2010. Normally this would indicated an overvalued stock. However this is not the case with Stone. Over the time period of the chart oil prices increased to as much as $120/bbl. Over the last two quarters oil prices have declined significantly resulting in negative earnings. This causes the price to earnings multiple to be an inaccurate indicator of the value of Stone’s stock.
Source: Burkenroad Stone Energy Team
‐60
‐40
‐20
0
20
40
60
3/1/2010
5/1/2010
7/1/2010
9/1/2010
11/1/2010
1/1/2011
3/1/2011
5/1/2011
7/1/2011
9/1/2011
11/1/2011
1/1/2012
3/1/2012
5/1/2012
7/1/2012
9/1/2012
11/1/2012
1/1/2013
3/1/2013
5/1/2013
7/1/2013
9/1/2013
11/1/2013
1/1/2014
3/1/2014
5/1/2014
7/1/2014
9/1/2014
11/1/2014
Figure 15: Stock Price vs. 15x P/E
Historical actual price Historical theoretical price
Stone Energy Corp. (SGY) BURKENROAD REPORTS (www.burkenroad.org) March 26, 2015
35
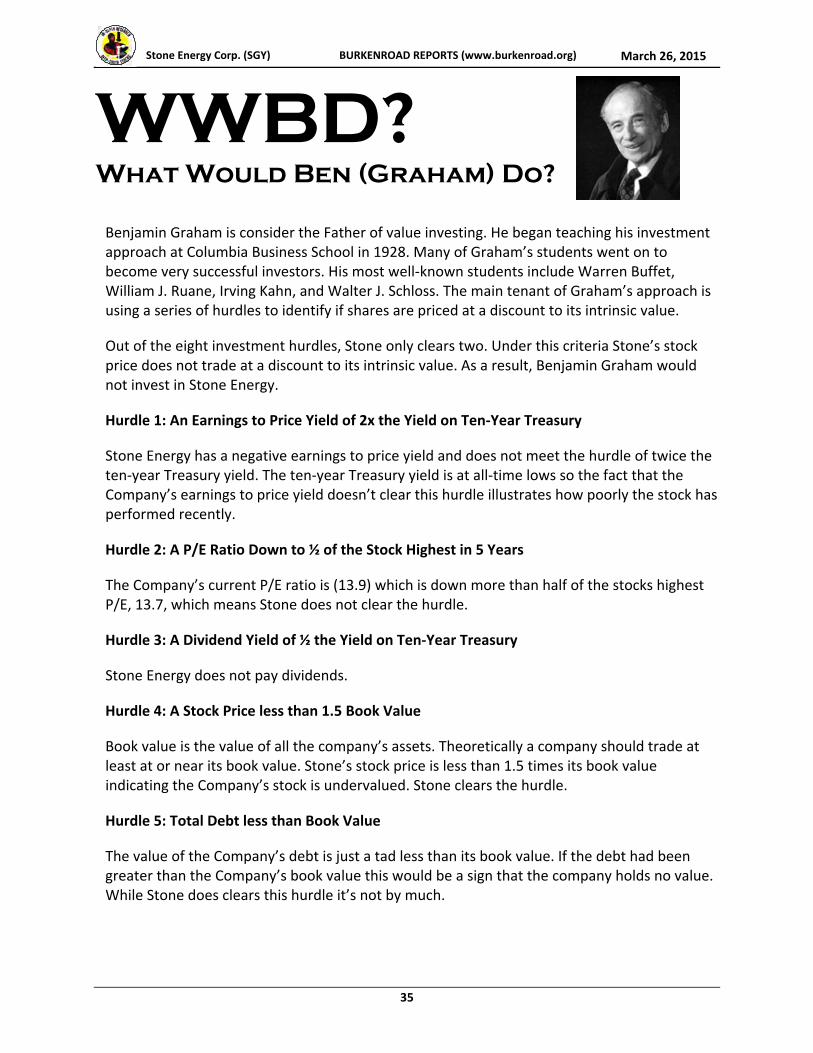
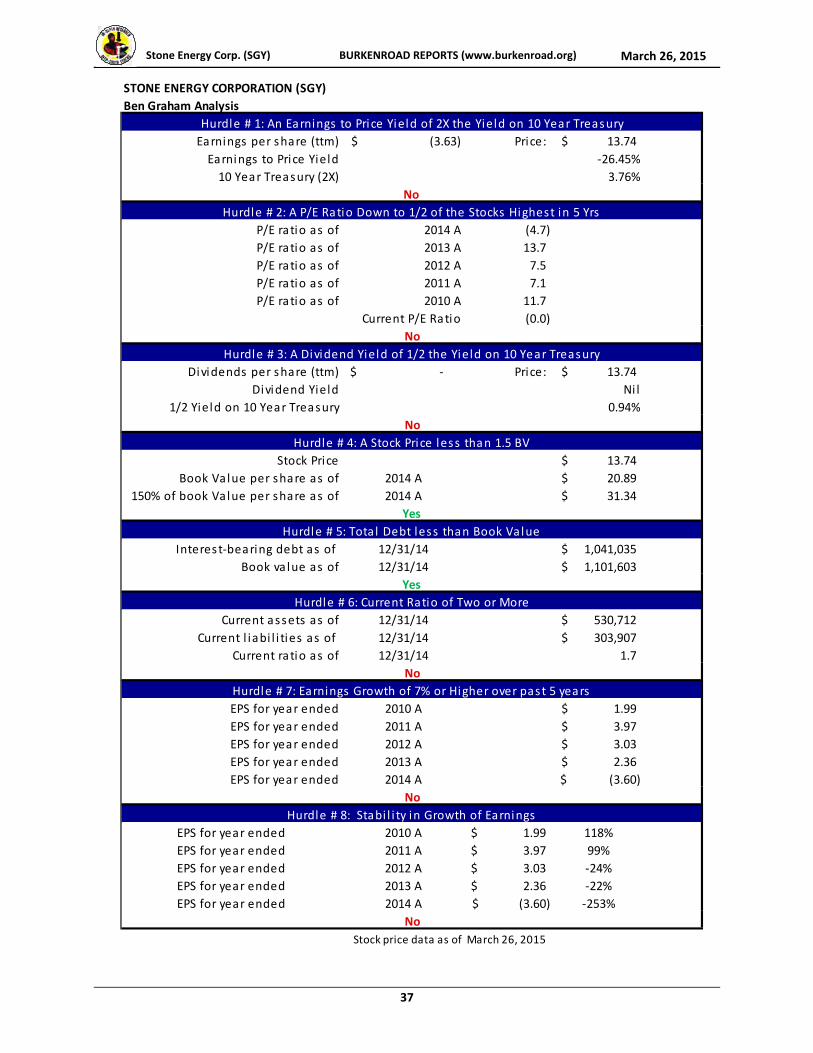
WWBD? What Would Ben (Graham) Do?
Benjamin Graham is consider the Father of value investing. He began teaching his investment approach at Columbia Business School in 1928. Many of Graham’s students went on to become very successful investors. His most well‐known students include Warren Buffet, William J. Ruane, Irving Kahn, and Walter J. Schloss. The main tenant of Graham’s approach is using a series of hurdles to identify if shares are priced at a discount to its intrinsic value.
Out of the eight investment hurdles, Stone only clears two. Under this criteria Stone’s stock price does not trade at a discount to its intrinsic value. As a result, Benjamin Graham would not invest in Stone Energy.
Hurdle 1: An Earnings to Price Yield of 2x the Yield on Ten‐Year Treasury
Stone Energy has a negative earnings to price yield and does not meet the hurdle of twice the ten‐year Treasury yield. The ten‐year Treasury yield is at all‐time lows so the fact that the Company’s earnings to price yield doesn’t clear this hurdle illustrates how poorly the stock has performed recently.
Hurdle 2: A P/E Ratio Down to ½ of the Stock Highest in 5 Years
The Company’s current P/E ratio is (13.9) which is down more than half of the stocks highest P/E, 13.7, which means Stone does not clear the hurdle.
Hurdle 3: A Dividend Yield of ½ the Yield on Ten‐Year Treasury
Stone Energy does not pay dividends.
Hurdle 4: A Stock Price less than 1.5 Book Value
Book value is the value of all the company’s assets. Theoretically a company should trade at least at or near its book value. Stone’s stock price is less than 1.5 times its book value indicating the Company’s stock is undervalued. Stone clears the hurdle.
Hurdle 5: Total Debt less than Book Value
The value of the Company’s debt is just a tad less than its book value. If the debt had been greater than the Company’s book value this would be a sign that the company holds no value. While Stone does clears this hurdle it’s not by much.
Stone Energy Corp. (SGY) BURKENROAD REPORTS (www.burkenroad.org) March 26, 2015
36
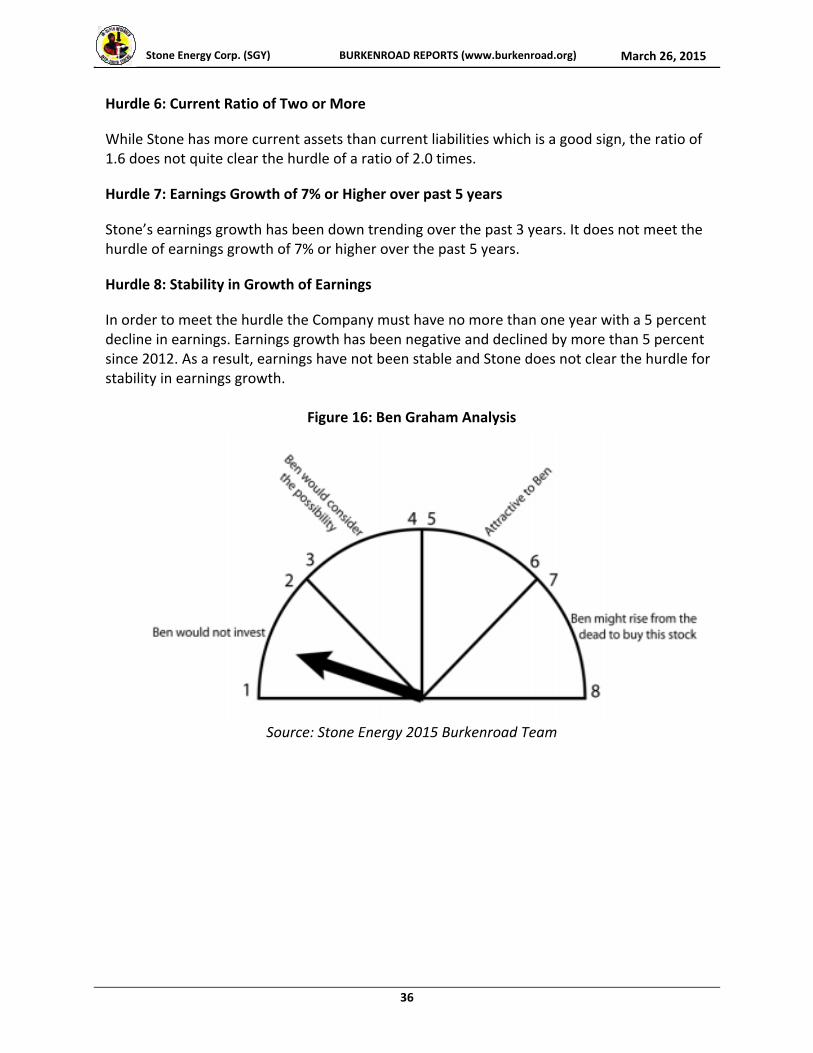
Hurdle 6: Current Ratio of Two or More
While Stone has more current assets than current liabilities which is a good sign, the ratio of 1.6 does not quite clear the hurdle of a ratio of 2.0 times.
Hurdle 7: Earnings Growth of 7% or Higher over past 5 years
Stone’s earnings growth has been down trending over the past 3 years. It does not meet the hurdle of earnings growth of 7% or higher over the past 5 years.
Hurdle 8: Stability in Growth of Earnings
In order to meet the hurdle the Company must have no more than one year with a 5 percent decline in earnings. Earnings growth has been negative and declined by more than 5 percent since 2012. As a result, earnings have not been stable and Stone does not clear the hurdle for stability in earnings growth.
Figure 16: Ben Graham Analysis
Source: Stone Energy 2015 Burkenroad Team
Stone Energy Corp. (SGY) BURKENROAD REPORTS (www.burkenroad.org) March 26, 2015
37
Earnings per share (ttm) (3.63)$ Price: 13.74$
Earnings to Price Yield ‐26.45%
10 Year Treasury (2X) 3.76%
P/E ratio as of 2014 A (4.7)
P/E ratio as of 2013 A 13.7
P/E ratio as of 2012 A 7.5
P/E ratio as of 2011 A 7.1
P/E ratio as of 2010 A 11.7
Current P/E Ratio (0.0)
Dividends per share (ttm) ‐$ Price: 13.74$
Dividend Yield Ni l
1/2 Yield on 10 Year Treasury 0.94%
Stock Price 13.74$
Book Value per share as of 2014 A 20.89$
150% of book Value per share as of 2014 A 31.34$
Interest‐bearing debt as of 12/31/14 1,041,035$
Book va lue as of 12/31/14 1,101,603$
Current assets as of 12/31/14 530,712$
Current l iabi l i ties as of 12/31/14 303,907$
Current ratio as of 12/31/14 1.7
EPS for year ended 2010 A 1.99$
EPS for year ended 2011 A 3.97$
EPS for year ended 2012 A 3.03$
EPS for year ended 2013 A 2.36$
EPS for year ended 2014 A (3.60)$
EPS for year ended 2010 A 1.99$ 118%
EPS for year ended 2011 A 3.97$ 99%
EPS for year ended 2012 A 3.03$ ‐24%
EPS for year ended 2013 A 2.36$ ‐22%
EPS for year ended 2014 A (3.60)$ ‐253%
Stock price data as of March 26, 2015
No
Hurdle # 8: Stabi l i ty in Growth of Earnings
No
Hurdle # 5: Total Debt less than Book Value
Yes
Hurdle # 6: Current Ratio of Two or More
No
Hurdle # 7: Earnings Growth of 7% or Higher over past 5 years
No
Hurdle # 3: A Dividend Yield of 1/2 the Yield on 10 Year Treasury
No
Hurdle # 4: A Stock Price less than 1.5 BV
Yes
STONE ENERGY CORPORATION (SGY)
Ben Graham Analysis
Hurdle # 1: An Earnings to Price Yield of 2X the Yield on 10 Year Treasury
No
Hurdle # 2: A P/E Ratio Down to 1/2 of the Stocks Highest in 5 Yrs
Stone Energy Corp. (SG
Y)
BURKEN
ROAD REP
ORTS (www.burken
road
.org)
March 26, 2015
38
STONE EN
ERGY CORPORATION (SG
Y)Annual and Quarterly Earnings
In thousands
For the period ended
2012 A
2013 A
2014 A
31‐M
ar E
30‐Jun E
30‐Sep E
31‐Dec E
2015 E
30‐M
ar E
29‐Jun E
29‐Sep E
30‐Dec E
2016 E
Operating revenue:
Oil production
761,304
$
715,104
$
516,104
$
79,171
$
79,171
$
79,171
$
79,171
$
316,684
$
80,974
$
80,974
$
80,974
$
80,974
$
323,897
$
Gas production
134,739
190,580
166,494
33,427
33,427
33,427
33,427
133,708
36,046
36,046
36,046
36,046
144,183
NGLs production
48,498
60,687
85,642
9,200
9,200
9,200
9,200
36,800
8,874
8,874
8,874
8,874
35,495
Total revenue from products
944,541
966,371
768,240
121,798
121,798
121,798
121,798
487,191
125,894
125,894
125,894
125,894
503,575
Other operational income
3,520
7,808
7,951
1,988
1,988
1,988
1,988
7,951
1,988
1,988
1,988
1,988
7,951
Derivative
income, net
3,428
19,351
30,342
30,679
31,016
31,016
123,052
3,776
3,818
3,860
3,860
15,316
Total operating revenue
951,489
974,179
795,542
154,127
154,464
154,801
154,801
618,195
131,658
131,700
131,742
131,742
526,841
Operating expenses:
Lease operating expenses
215,003
201,153
176,495
47,102
47,102
47,102
47,102
188,409
45,969
45,969
45,969
45,969
183,875
Transportation, processing and gathering expenses
21,782
42,172
64,951
15,504
15,504
15,504
15,504
62,016
15,585
15,585
15,585
15,585
62,339
Other operational expense
267
151
862
493
493
493
493
1,972
481
481
481
481
1,925
Production taxes
10,015
15,029
12,151
2,518
2,518
2,518
2,518
10,071
2,457
2,457
2,457
2,457
9,829
Depreciation, depletion and amortization
344,365
350,574
340,006
76,291
76,291
76,291
76,291
305,165
74,455
74,455
74,455
74,455
297,821
Write‐down of oil and gas properties
351,192
Accretion expense
33,331
33,575
28,411
13,936
12,141
14,160
12,403
52,640
19,182
17,550
19,581
17,986
74,298
Salaries, general and administrative
54,648
59,524
66,451
15,400
15,400
15,400
15,400
61,600
15,029
15,029
15,029
15,029
60,118
Franchise tax settlement
12,590
Incentive
compensation expense
8,113
15,340
10,361
2,484
2,484
2,484
2,484
9,936
2,424
2,424
2,424
2,424
9,697
Derivative
expenses, net
2,090
Total operating expenses
687,524
732,198
1,050,880
173,729
171,933
173,952
172,195
691,810
175,582
173,951
175,982
174,386
699,901
Gain on Rocky Mountain properties divestiture
Income (loss) from operations
263,965
241,981
(255,338)
(19,601)
(17,469)
(19,151)
(17,394)
(73,615)
(43,925)
(42,251)
(44,240)
(42,645)
(173,060)
Other (income) expenses:
Interest expense
30,375
32,837
38,855
9,197
9,197
9,197
9,197
36,790
9,197
9,462
10,037
10,743
39,440
Interest income
(600)
(1,695)
(574)
(144)
(144)
(144)
(144)
(574)
(144)
(144)
(144)
(144)
(574)
Other income, net
(1,805)
(2,799)
(2,332)
(578)
(578)
(578)
(578)
(2,312)
(620)
(620)
(620)
(620)
(2,481)
Early extinguishment of debt
1,972
27,279
Other expense
274
Total other expenses, net
29,942
55,622
36,223
8,476
8,476
8,476
8,476
33,904
8,434
8,699
9,273
9,980
36,385
Net income (loss) before taxes
234,023
186,359
(291,561)
(28,077)
(25,945)
(27,627)
(25,870)
(107,519)
(52,358)
(50,949)
(53,513)
(52,624)
(209,445)
Income tax provision (benefit)
84,597
68,725
(102,018)
(9,722)
(9,722)
(9,722)
(9,722)
(38,886)
(18,937)
(18,937)
(18,937)
(18,937)
(75,750)
Net income (loss)
149,426
117,634
(189,543)
(18,356)
(16,223)
(17,905)
(16,148)
(68,632)
(33,421)
(32,012)
(34,575)
(33,687)
(133,695)
Net Income (loss) attributable to Stone Energy Corp.
149,426
$
117,634
$
(189,543)
$
(18,356)
$
(16,223)
$
(17,905)
$
(16,148)
$
(68,632)
$
(33,421)
$
(32,012)
$
(34,575)
$
(33,687)
$
(133,695)
$
Earnings (loss) per common share
Basic earnings (loss) per share
3.03
$
2.36
$
(3.60)
$
(0.35)
$
(0.31)
$
(0.34)
$
(0.30)
$
(1.29)
$
(0.62)
$
(0.60)
$
(0.64)
$
(0.62)
$
(2.47)
$
Adjustm
ent non‐recurring items
0.03
$
0.39
$
Adjusted basic earnings per share
3.06
$
2.75
$
(3.60)
$
(0.35)
$
(0.31)
$
(0.34)
$
(0.30)
$
(1.29)
$
(0.62)
$
(0.60)
$
(0.64)
$
(0.62)
$
(2.47)
$
Diluted earnings (loss) per share
3.03
$
2.36
$
(3.60)
$
(0.35)
$
(0.31)
$
(0.34)
$
(0.30)
$
(1.29)
$
(0.62)
$
(0.60)
$
(0.64)
$
(0.62)
$
(2.47)
$
Adjustm
ent non‐recurring items
0.03
$
0.39
$
Adjusted diluted earnings per share
3.06
$
2.75
$
(3.60)
$
(0.35)
$
(0.31)
$
(0.34)
$
(0.30)
$
(1.29)
$
(0.62)
$
(0.60)
$
(0.64)
$
(0.62)
$
(2.47)
$
Average shares outstanding
48,319
48,693
52,721
52,809
52,981
53,150
53,315
53,396
53,480
53,646
53,813
53,979
54,063
Average shares outstanding assuming dilution
48,361
48,735
52,721
52,809
52,981
53,150
53,315
53,396
53,480
53,646
53,813
53,979
54,063
PRODUCTION SUMMARY
Production: oil (MBbls)
7,135
6,894
5,568
1,338
1,338
1,338
1,338
5,350
1,281
1,281
1,281
1,281
5,125
Production: gas (Mmcf)
42,569
50,129
47,426
11,024
11,024
11,024
11,024
44,097
11,094
11,094
11,094
11,094
44,377
Production: NGL (M
bbls)
1,153
1,603
2,114
437
437
437
437
1,749
395
395
395
395
1,580
Production in equivalent units (mmcfe)
92,297
101,111
93,518
21,673
21,673
21,673
21,673
86,691
21,151
21,151
21,151
21,151
84,605
% oil
46%
41%
36%
37%
37%
37%
37%
37%
36%
36%
36%
36%
36%
% gas
46%
50%
51%
51%
51%
51%
51%
51%
52%
52%
52%
52%
52%
% NGL
7%
10%
14%
12%
12%
12%
12%
12%
11%
11%
11%
11%
11%
Daily production in equivalent units (mmcfe)
253
277
256
241
238
236
236
238
235
232
230
230
232
YY changes in production
15.70%
9.55%
92.49%
‐10.48%
‐9.89%
‐0.74%
‐7.47%
92.70%
‐2.41%
‐2.41%
‐2.41%
‐2.41%
97.59%
Oil Hedge Income (Loss)
24,319
24,589
24,859
24,859
98,626
2,218
2,242
2,267
2,267
8,994
Gas Hedge Income (Loss)
6,023
6,090
6,157
6,157
24,426
1,559
1,576
1,593
1,593
6,322
Average per Mmcfe data
Lease operating expenses $ m
mcfe
2.33
$
1.99
$
1.89
$
2.17
$
2.17
$
2.17
$
2.17
$
2.17
$
2.17
$
2.17
$
2.17
$
2.17
$
2.17
$
Transportation, processing and gathering expenses
0.24
$
0.42
$
0.69
$
0.72
$
0.72
$
0.72
$
0.72
$
0.72
$
0.74
$
0.74
$
0.74
$
0.74
$
0.74
$
Production taxes
0.11
$
0.15
$
0.13
$
0.12
$
0.12
$
0.12
$
0.12
$
0.12
$
0.12
$
0.12
$
0.12
$
0.12
$
0.12
$
Salaries, general and administrative
0.59
$
0.59
$
0.71
$
0.71
$
0.71
$
0.71
$
0.71
$
0.71
$
0.71
$
0.71
$
0.71
$
0.71
$
0.71
$
Depreciation, depletion, amoritization
3.69
$
8.69
$
13.69
$
21.12
$
21.12
$
21.12
$
21.12
$
21.12
$
21.12
$
21.12
$
21.12
$
21.12
$
21.12
$
Accretion
0.36
$
0.33
$
0.30
$
0.64
$
0.56
$
0.65
$
0.57
$
0.61
$
0.91
$
0.83
$
0.93
$
0.85
$
0.88
$
Actual/forecast prices (including hedge contracts)
Oil
106.70
$
103.73
$
92.69
$
50.38
$
53.22
$
56.35
$
59.19
$
59.19
$
61.18
$
62.91
$
64.10
$
64.61
$
63.20
$
Gas
3.17
$
3.80
$
3.51
$
3.96
$
2.76
$
2.87
$
3.03
$
3.03
$
3.28
$
3.12
$
3.23
$
3.37
$
3.25
$
NGL
42.06
$
37.86
$
40.51
$
25.19
$
26.61
$
28.17
$
29.59
$
29.59
$
30.59
$
31.45
$
32.05
$
32.31
$
31.60
$
2015 E
2016 E
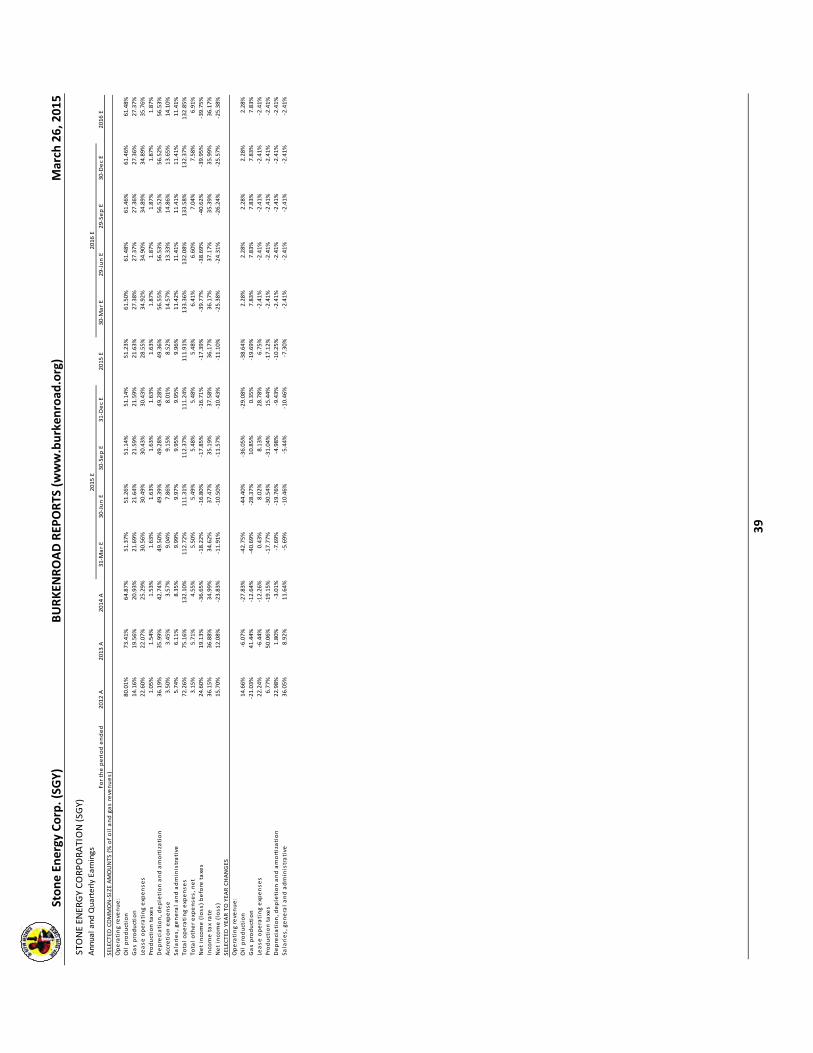
Stone Energy Corp. (SG
Y)
BURKEN
ROAD REP
ORTS (www.burken
road
.org)
March 26, 2015
39
STO
NE EN
ERGY CORPORATION (SG
Y)Annual and Quarterly Earnings
For the period ended
2012 A
2013 A
2014 A
31‐M
ar E
30‐Jun E
30‐Sep E
31‐Dec E
2015 E
30‐M
ar E
29‐Jun E
29‐Sep E
30‐Dec E
2016 E
SELECTED COMMON‐SIZE AMOUNTS (% of oil and gas revenues)
Operating revenue:
Oil production
80.01%
73.41%
64.87%
51.37%
51.26%
51.14%
51.14%
51.23%
61.50%
61.48%
61.46%
61.46%
61.48%
Gas production
14.16%
19.56%
20.93%
21.69%
21.64%
21.59%
21.59%
21.63%
27.38%
27.37%
27.36%
27.36%
27.37%
Lease operating expenses
22.60%
22.07%
25.29%
30.56%
30.49%
30.43%
30.43%
28.55%
34.92%
34.90%
34.89%
34.89%
35.76%
Production taxes
1.05%
1.54%
1.53%
1.63%
1.63%
1.63%
1.63%
1.63%
1.87%
1.87%
1.87%
1.87%
1.87%
Depreciation, depletion and amortization
36.19%
35.99%
42.74%
49.50%
49.39%
49.28%
49.28%
49.36%
56.55%
56.53%
56.52%
56.52%
56.53%
Accretion expense
3.50%
3.45%
3.57%
9.04%
7.86%
9.15%
8.01%
8.52%
14.57%
13.33%
14.86%
13.65%
14.10%
Salaries, general and administrative
5.74%
6.11%
8.35%
9.99%
9.97%
9.95%
9.95%
9.96%
11.42%
11.41%
11.41%
11.41%
11.41%
Total operating expenses
72.26%
75.16%
132.10%
112.72%
111.31%
112.37%
111.24%
111.91%
133.36%
132.08%
133.58%
132.37%
132.85%
Total other expenses, net
3.15%
5.71%
4.55%
5.50%
5.49%
5.48%
5.48%
5.48%
6.41%
6.60%
7.04%
7.58%
6.91%
Net income (loss) before taxes
24.60%
19.13%
‐36.65%
‐18.22%
‐16.80%
‐17.85%
‐16.71%
‐17.39%
‐39.77%
‐38.69%
‐40.62%
‐39.95%
‐39.75%
Income tax rate
36.15%
36.88%
34.99%
34.62%
37.47%
35.19%
37.58%
36.17%
36.17%
37.17%
35.39%
35.99%
36.17%
Net income (loss)
15.70%
12.08%
‐23.83%
‐11.91%
‐10.50%
‐11.57%
‐10.43%
‐11.10%
‐25.38%
‐24.31%
‐26.24%
‐25.57%
‐25.38%
SELECTED YEAR TO YEAR CHANGES
Operating revenue:
Oil production
14.66%
‐6.07%
‐27.83%
‐42.75%
‐44.40%
‐36.05%
‐29.08%
‐38.64%
2.28%
2.28%
2.28%
2.28%
2.28%
Gas production
‐21.03%
41.44%
‐12.64%
‐40.69%
‐28.37%
10.85%
0.35%
‐19.69%
7.83%
7.83%
7.83%
7.83%
7.83%
Lease operating expenses
22.24%
‐6.44%
‐12.26%
0.43%
8.02%
8.13%
28.78%
6.75%
‐2.41%
‐2.41%
‐2.41%
‐2.41%
‐2.41%
Production taxes
6.77%
50.06%
‐19.15%
‐17.77%
‐30.54%
‐31.04%
15.44%
‐17.12%
‐2.41%
‐2.41%
‐2.41%
‐2.41%
‐2.41%
Depreciation, depletion and amortization
22.98%
1.80%
‐3.01%
‐7.69%
‐19.76%
‐4.98%
‐9.43%
‐10.25%
‐2.41%
‐2.41%
‐2.41%
‐2.41%
‐2.41%
Salaries, general and administrative
36.05%
8.92%
11.64%
‐5. 69%
‐10.46%
‐5.44%
‐10.46%
‐7.30%
‐2.41%
‐2.41%
‐2.41%
‐2.41%
‐2.41%
2016 E
2015 E
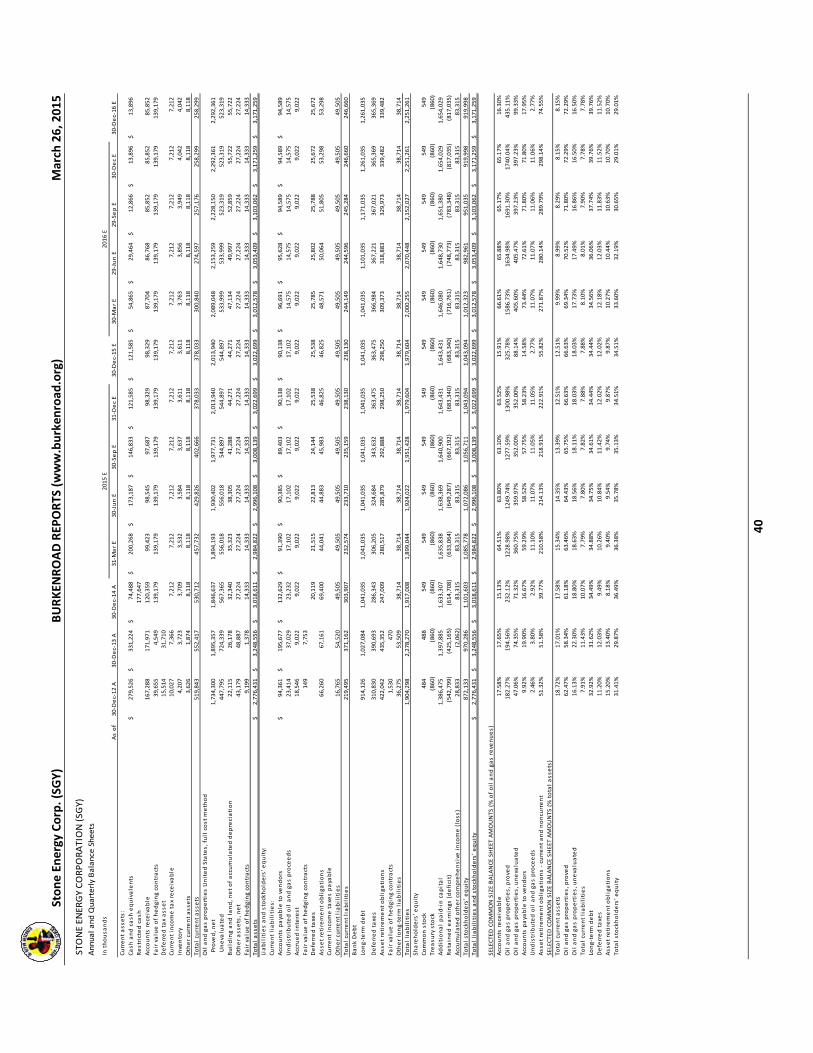
Stone Energy Corp. (SG
Y)
BURKEN
ROAD REP
ORTS (www.burken
road
.org)
March 26, 2015
40
STONE EN
ERGY CORPORATION (SG
Y)Annual and Quarterly Balance Sheets
In thousands
As of
30‐Dec‐12 A
30‐Dec‐13 A
30‐Dec‐14 A
31‐M
ar E
30‐Jun E
30‐Sep E
31‐Dec E
30‐Dec‐15 E
30‐M
ar E
29‐Jun E
29‐Sep E
30‐Dec E
30‐Dec‐16 E
Current assets:
Cash and cash equivalents
279,526
$
331,224
$
74,488
$
200,268
$
173,187
$
146,833
$
121,585
$
121,585
$
54,865
$
29,464
$
12,866
$
13,896
$
13,896
$
Restricted cash
177,647
Accounts receivable
167,288
171,971
120,359
99,423
98,545
97,687
98,329
98,329
87,704
86,768
85,852
85,852
85,852
Fair value of hedging contracts
39,655
4,549
139,179
139,179
139,179
139,179
139,179
139,179
139,179
139,179
139,179
139,179
139,179
Deferred tax asset
15,514
31,710
Current income tax receivable
10,027
7,366
7,212
7, 212
7,212
7,212
7,212
7,212
7,212
7,212
7,212
7,212
7,212
Inventory
4,207
3,723
3,709
3,532
3,584
3,637
3,611
3,611
3,763
3,856
3,949
4,042
4,042
Other current assets
3,626
1,874
8,118
8,118
8,118
8,118
8,118
8,118
8,118
8,118
8,118
8,118
8,118
Total current assets
519,843
552,417
530,712
457,732
429,826
402,666
378,033
378,033
300,840
274,597
257,176
258,299
258,299
Oil and gas properties United States, full cost method
Proved, net
1,734,300
1,895,357
1,846,637
1,894,193
1,930,402
1,977,731
2,013,940
2,013,940
2,089,048
2,153,259
2,228,150
2,292,361
2,292,361
Unevaluated
447,795
724,339
567,365
556,018
556,018
544,897
544,897
544,897
533,999
533,999
523,319
523,319
523,319
Building and land, net of accumulated depreciation
22,115
26,178
32,340
35,323
38,305
41,288
44,271
44,271
47,134
49,997
52,859
55,722
55,722
Other assets, net
43,179
48,887
27,224
27,224
27,224
27,224
27,224
27,224
27,224
27,224
27,224
27,224
27,224
Fair value of hedging contracts
9,199
1,378
14,333
14,333
14,333
14,333
14,333
14,333
14,333
14,333
14,333
14,333
14,333
Total assets
2,776,431
$
3,248,556
$
3,018,611
$
2,984,822
$
2,996,108
$
3,008,139
$
3,022,699
$
3,022,699
$
3,012,578
$
3,053,409
$
3,103,062
$
3,171,259
$
3,171,259
$
Liabilities and stockholders' equity:
Current liabilities:
Accounts payable to vendors
94,361
$
195,677
$
132,629
$
91,390
$
90,385
$
89,403
$
90,138
$
90,138
$
96,691
$
95,628
$
94,589
$
94,589
$
94,589
$
Undistributed oil and gas proceeds
23,414
37,029
23,232
17,102
17,102
17,102
17,102
17,102
14,575
14,575
14,575
14,575
14,575
Accrued interest
18,546
9,022
9,022
9,022
9,022
9,022
9,022
9,022
9,022
9,022
9,022
9,022
9,022
Fair value of hedging contracts
149
7,753
Deferred taxes
20,119
21,515
22,813
24,144
25,538
25,538
25,785
25,802
25,788
25,672
25,672
Asset retirement obligations
66,260
67,161
69,400
44,041
44,883
45,983
46,825
46,825
48,571
50,064
51,805
53,298
53,298
Current income taxes payable
Other current liabilities
16,765
54,520
49,505
49,505
49,505
49,505
49,505
49,505
49,505
49,505
49,505
49,505
49,505
Total current liabilities
219,495
371,162
303,907
232,574
233,710
235,159
238,130
238,130
244,149
244,596
245,284
246,660
246,660
Bank Debt
Long‐term
debt
914,126
1,027,084
1,041,035
1,041,035
1,041,035
1,041,035
1,041,035
1,041,035
1,041,035
1,101,035
1,171,035
1,261,035
1,261,035
Deferred taxes
310,830
390,693
286,343
306,205
324,684
343,632
363,475
363,475
366,984
367,221
367,021
365,369
365,369
Asset retirement obligations
422,042
435,352
247,009
280,517
285,879
292,888
298,250
298,250
309,373
318,883
329,973
339,482
339,482
Fair value of hedging contracts
1,530
470
Other long‐term
liabilities
36,275
53,509
38,714
38,714
38,714
38,714
38,714
38,714
38,714
38,714
38,714
38,714
38,714
Total liabilities
1,904,298
2,278,270
1,917,008
1,899,044
1,924,022
1,951,428
1,979,604
1,979,604
2,000,255
2,070,448
2,152,027
2,251,261
2,251,261
Shareholders' equity
Common stock
484
488
549
549
549
549
549
549
549
549
549
549
549
Treasury stock
(860)
(860)
(860)
(860)
(860)
(860)
(860)
(860)
(860)
(860)
(860)
(860)
(860)
Additional paid‐in capital
1,386,475
1,397,885
1,633,307
1,635,838
1,638,369
1,640,900
1,643,431
1,643,431
1,646,080
1,648,730
1,651,380
1,654,029
1,654,029
Retained earnings (deficit)
(542,799)
(425,165)
(614,708)
(633,064)
(649,287)
(667,192)
(683,340)
(683,340)
(716,761)
(748,773)
(783,348)
(817,035)
(817,035)
Accumulated other comprehensive income (loss)
28,833
(2,062)
83,315
83,315
83,315
83,315
83,315
83,315
83,315
83,315
83,315
83,315
83,315
Total stockholders' equity
872,133
970,286
1,101,603
1,085,778
1,072,086
1,056,711
1,043,094
1,043,094
1,012,323
982,961
951,035
919,998
919,998
Total liabilities and stockholders' equity
2,776,431
$
3,248,556
$
3,018,611
$
2,984,822
$
2,996,108
$
3,008,139
$
3,022,699
$
3,022,699
$
3,012,578
$
3,053,409
$
3,103,062
$
3,171,259
$
3,171,259
$
SELECTED COMMON SIZE BALANCE SHEET AMOUNTS (% of oil and gas revenues)
Accounts receivable
17.58%
17.65%
15.13%
64.51%
63.80%
63.10%
63.52%
15.91%
66.61%
65.88%
65.17%
65.17%
16.30%
Oil and gas properties, proved
182.27%
194.56%
232.12%
1228.98%
1249.74%
1277.59%
1300.98%
325.78%
1586.73%
1634.98%
1691.30%
1740.04%
435.11%
Oil and gas properties, unevaluated
47.06%
74.35%
71.32%
360.75%
359.97%
352.00%
352.00%
88.14%
405.60%
405.47%
397.23%
397.23%
99.33%
Accounts payable to vendors
9.92%
19.90%
16.67%
59.29%
58.52%
57.75%
58.23%
14.58%
73.44%
72.61%
71.80%
71.80%
17.95%
Undistributed oil and gas proceeds
2.46%
3.80%
2.92%
11.10%
11.07%
11.05%
11.05%
2.77%
11.07%
11.07%
11.06%
11.06%
2.77%
Asset retirement obligations ‐ current and noncurrent
51.32%
51.58%
39.77%
210.58%
214.13%
218.91%
222.91%
55.82%
271.87%
280.14%
289.79%
298.14%
74.55%
SELECTED COMMON SIZE BALANCE SHEET AMOUNTS (% total assets)
Total current assets
18.72%
17.01%
17.58%
15.34%
14.35%
13.39%
12.51%
12.51%
9.99%
8.99%
8.29%
8.15%
8.15%
Oil and gas properties, proved
62.47%
58.34%
61.18%
63.46%
64.43%
65.75%
66.63%
66.63%
69.34%
70.52%
71.80%
72.29%
72.29%
Oil and gas properties, unevaluated
16.13%
22.30%
18.80%
18.63%
18.56%
18.11%
18.03%
18.03%
17.73%
17.49%
16.86%
16.50%
16.50%
Total current liabilities
7.91%
11.43%
10.07%
7.79%
7.80%
7.82%
7.88%
7.88%
8.10%
8.01%
7.90%
7.78%
7.78%
Long‐term
debt
32.92%
31.62%
34.49%
34.88%
34.75%
34.61%
34.44%
34.44%
34.56%
36.06%
37.74%
39.76%
39.76%
Deferred taxes
11.20%
12.03%
9.49%
10.26%
10.84%
11.42%
12.02%
12.02%
12.18%
12.03%
11.83%
11.52%
11.52%
Asset retirement obligations
15.20%
13.40%
8.18%
9.40%
9.54%
9.74%
9.87%
9.87%
10.27%
10.44%
10.63%
10.70%
10.70%
Total stockholders' equity
31.41%
29.87%
36.49%
36.38%
35.78%
35.13%
34.51%
34.51%
33.60%
32.19%
30.65%
29.01%
29.01%
2015 E
2016 E
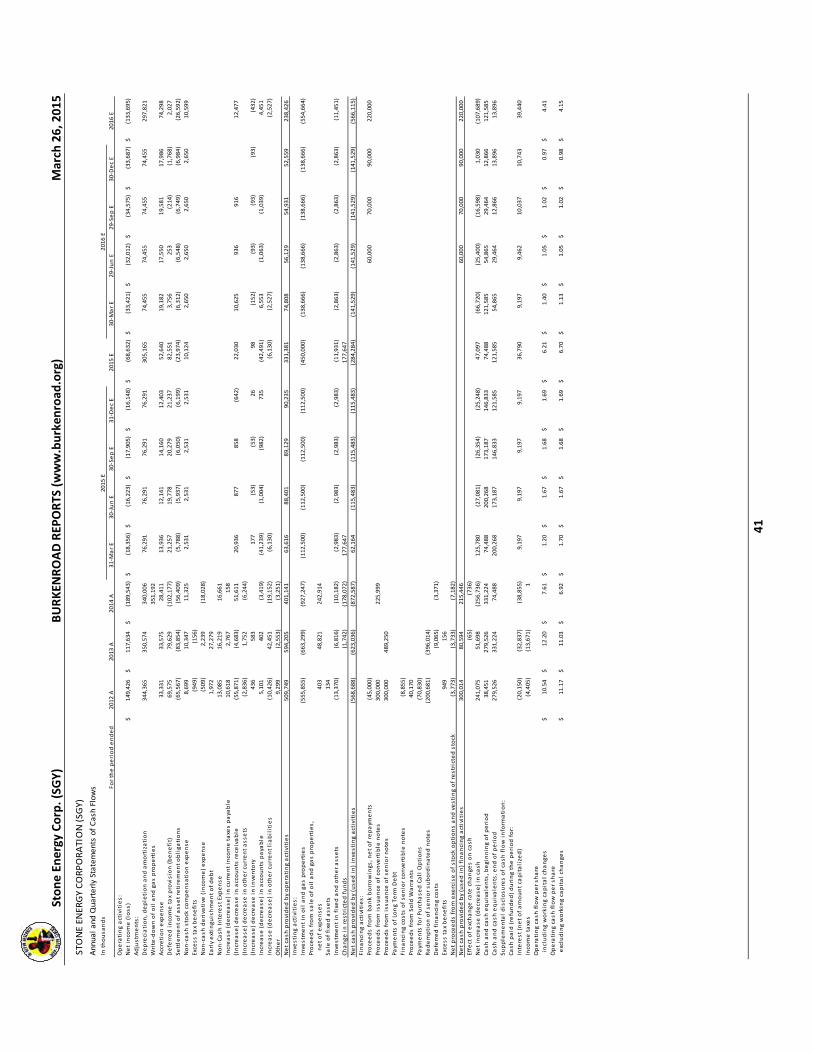
Stone Energy Corp. (SG
Y)
BURKEN
ROAD REP
ORTS (www.burken
road
.org)
March 26, 2015
41
STONE ENERGY CORPORATION (SG
Y)
Annual and Quarterly Statements of Cash Flows
In thousands
For the period ended
2012 A
2013 A
2014 A
31‐M
ar E
30‐Jun E
30‐Sep E
31‐Dec E
2015 E
30‐M
ar E
29‐Jun E
29‐Sep E
30‐Dec E
2016 E
Operating activities:
Net income (loss)
149,426
$
117,634
$
(189,543)
$
(18,356)
$
(16,223)
$
(17,905)
$
(16,148)
$
(68,632)
$
(33,421)
$
(32,012)
$
(34,575)
$
(33,687)
$
(133,695)
$
Adjustm
ents:
Depreciation, depletion and amortization
344,365
350,574
340,006
76,291
76,291
76,291
76,291
305,165
74,455
74,455
74,455
74,455
297,821
Write‐down of oil and gas properties
351,192
Accretion expense
33,331
33,575
28,411
13,936
12,141
14,160
12,403
52,640
19,182
17,550
19,581
17,986
74,298
Deferred income tax provision (benefit)
69,575
79,629
(102,177)
21,257
19,778
20,279
21,237
82,551
3,756
253
(214)
(1,768)
2,027
Settlement of asset retirement obligations
(65,567)
(83,854)
(56,409)
(5,788)
(5,937)
(6,050)
(6,199)
(23,974)
(6,312)
(6,548)
(6,749)
(6,984)
(26,592)
Non‐cash stock compensation expense
8,699
10,347
11,325
2,531
2,531
2,531
2,531
10,124
2,650
2,650
2,650
2,650
10,599
Excess tax benefits
(949)
(156)
Non‐cash derivative
(income) expense
(509)
2,239
(18,028)
Early extinguishment of debt
1,972
27,279
Non‐Cash Interest Expense
13,085
16,219
16,661
Increase (decrease) in current income taxes payable
10,618
2,767
158
(Increase) decrease in accounts receivable
(55,871)
(4,683)
51,611
20,936
877
858
(642)
22,030
10,625
936
916
12,477
(Increase) decrease in other current assets
(2,836)
1,752
(6,244)
(Increase) decrease in inventory
436
583
177
(53)
(53)
26
98
(152)
(93)
(93)
(93)
(432)
Increase (decrease) in accounts payable
5,101
402
(3,419)
(41,239)
(1,004)
(982)
735
(42,491)
6,553
(1,063)
(1,039)
4,451
Increase (decrease) in other current liabilities
(10,426)
42,451
(19,152)
(6,130)
(6,130)
(2,527)
(2,527)
Other
9,299
(2,553)
(3,251)
Net cash provided by operating activities
509,749
594,205
401,141
63,616
88,401
89,129
90,235
331,381
74,808
56,129
54,931
52,559
238,426
Investing activities:
Investm
ent in oil and gas properties
(555,855)
(663,299)
(927,247)
(112,500)
(112,500)
(112,500)
(112,500)
(450,000)
(138,666)
(138,666)
(138,666)
(138,666)
(554,664)
Proceeds from sale of oil and gas properties,
net of expenses
403
48,821
242,914
Sale of fixed assets
134
Investm
ent in fixed and other assets
(13,370)
(6,816)
(10,182)
(2,983)
(2,983)
(2,983)
(2,983)
(11,931)
(2,863)
(2,863)
(2,863)
(2,863)
(11,451)
Change in restricted funds
(1,742)
(178,072)
177,647
177,647
Net cash provided by (used in) investing activities
(568,688)
(623,036)
(872,587)
62,164
(115,483)
(115,483)
(115,483)
(284,284)
(141,529)
(141,529)
(141,529)
(141,529)
(566,115)
Financing activities:
Proceeds from bank borrowings, net of repaym
ents
(45,000)
60,000
70,000
90,000
220,000
Proceeds fr om issuance
of convertible notes
300,000
225,999
Proceeds from issuance
of senior notes
300,000
489,250
Paym
ents of Long Term
Debt
Financing costs of senior convertible notes
(8,855)
Proceeds from Sold W
arrants
40,170
Paym
ents for Purchased Call Options
(70,830)
Redemption of senior subordinated notes
(200,681)
(396,014)
Deferred financing costs
(9,065)
(3,371)
Excess tax benefits
949
156
Net proceeds from ex ercise of stock options and vesting of restricted stock
(3,773)
(3,733)
(7,182)
Net cash provided by (used in) financing activities
300,014
80,594
215,446
60,000
70,000
90,000
220,000
Effect of exchange rate changes on cash
(65)
(736)
Net increase (decrease) in cash
241,075
51,698
(256,736)
125,780
(27,081)
(26,354)
(25,248)
47,097
(66,720)
(25,400)
(16,598)
1,030
(107,689)
Cash and cash equivalents, beginning of period
38,451
279,526
331,224
74,488
200,268
173,187
146,833
74,488
121,585
54,865
29,464
12,866
121,585
Cash and cash equivalents, end of period
279,526
331,224
74,488
200,268
173,187
146,833
121,585
121,585
54,865
29,464
12,866
13,896
13,896
Supplemental disclosures of cash flow inform
ation:
Cash paid (refunded) during the period for:
Interest (net of amount capitalized)
(20,150)
(32,837)
(38,855)
9,197
9,197
9,197
9,197
36,790
9,197
9,462
10,037
10,743
39,440
Income taxes
(4,405)
(13,671)
1
Operating cash flow per share
including working capital changes
10.54
$
12.20
$
7.61
$
1.20
$
1.67
$
1.68
$
1.69
$
6.21
$
1.40
$
1.05
$
1.02
$
0.97
$
4.41
$
Operating cash fl ow per share
excluding working capital changes
11.17
$
11.03
$
6.92
$
1.70
$
1.67
$
1.68
$
1.69
$
6.70
$
1.13
$
1.05
$
1.02
$
0.98
$
4.15
$
2015 E
2016 E
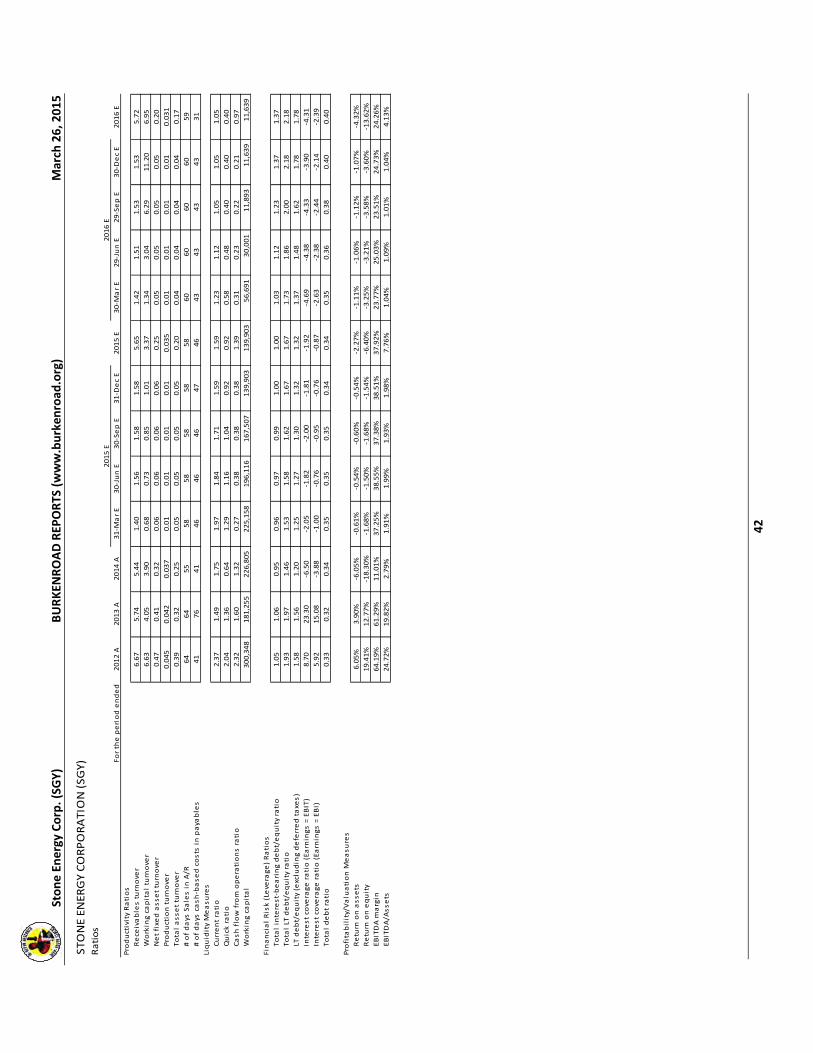
Stone Energy Corp. (SG
Y)
BURKEN
ROAD REP
ORTS (www.burken
road
.org)
March 26, 2015
42
STONE ENERGY CORPORATION (SGY)
Ratios
For the period ended
2012 A
2013 A
2014 A
31‐M
ar E
30‐Jun E
30‐Sep E
31‐Dec E
2015 E
30‐M
ar E
29‐Jun E
29‐Sep E
30‐Dec E
2016 E
Productivity Ratios
Receivables turnover
6.67
5.74
5.44
1.40
1.56
1.58
1.58
5.65
1.42
1.51
1.53
1.53
5.72
Working capital turnover
6.63
4.05
3.90
0.68
0.73
0.85
1.01
3.37
1.34
3.04
6.29
11.20
6.95
Net fixed asset turnover
0.47
0.41
0.32
0.06
0.06
0.06
0.06
0.25
0.05
0.05
0.05
0.05
0.20
Production turnover
0.045
0.042
0.037
0.01
0.01
0.01
0.01
0.035
0.01
0.01
0.01
0.01
0.031
Total asset turnover
0.39
0.32
0.25
0.05
0.05
0.05
0.05
0.20
0.04
0.04
0.04
0.04
0.17
# of days Sales in A/R
64
64
55
58
58
58
58
58
60
60
60
60
59
# of days cash‐based costs in payables
41
76
41
46
46
46
47
46
43
43
43
43
31
Liquidity Measures
Current ratio
2.37
1.49
1.75
1.97
1.84
1.71
1.59
1.59
1.23
1.12
1.05
1.05
1.05
Quick ratio
2.04
1.36
0.64
1.29
1.16
1.04
0.92
0.92
0.58
0.48
0.40
0.40
0.40
Cash flow from operations ratio
2.32
1.60
1.32
0.27
0.38
0.38
0.38
1.39
0.31
0.23
0.22
0.21
0.97
Working capital
300,348
181,255
226,805
225,158
196,116
167,507
139,903
139,903
56,691
30,001
11,893
11,639
11,639
Financial Risk (Leverage) Ratios
Total interest‐bearing debt/equity ratio
1.05
1.06
0.95
0.96
0.97
0.99
1.00
1.00
1.03
1.12
1.23
1.37
1.37
Total LT debt/equity ratio
1.93
1.97
1.46
1.53
1.58
1.62
1.67
1.67
1.73
1.86
2.00
2.18
2.18
LT debt/equity (excluding deferred taxes)
1.58
1.56
1.20
1.25
1.27
1.30
1.32
1.32
1.37
1.48
1.62
1.78
1.78
Interest coverage ratio (Earnings = EBIT)
8.70
23.30
‐6.50
‐2.05
‐1.82
‐2.00
‐1.81
‐1.92
‐4. 69
‐4.38
‐4.33
‐3.90
‐4.31
Interest coverage ratio (Earnings = EBI)
5.92
15.08
‐3.88
‐1.00
‐0.76
‐0.95
‐0.76
‐0.87
‐2.63
‐2.38
‐2.44
‐2.14
‐2.39
Total debt ratio
0.33
0.32
0.34
0.35
0.35
0.35
0.34
0.34
0.35
0.36
0.38
0.40
0.40
Profitability/Valuation M
easures
Return on assets
6.05%
3.90%
‐6.05%
‐0.61%
‐0.54%
‐0.60%
‐0.54%
‐2.27%
‐1.11%
‐1.06%
‐1.12%
‐1.07%
‐4.32%
Return on equity
19.41%
12.77%
‐18.30%
‐1.68%
‐1.50%
‐1.68%
‐1.54%
‐6.40%
‐3.25%
‐3.21%
‐3.58%
‐3.60%
‐13.62%
EBITDA m
argin
64.19%
61.29%
11.01%
37.25%
38.55%
37.38%
38.51%
37.92%
23.77%
25.03%
23.51%
24.73%
24.26%
EBITDA/Assets
24.72%
19.82%
2.79%
1.91%
1.99%
1.93%
1.98%
7.76%
1.04%
1.09%
1.01%
1.04%
4.13%
2015 E
2016 E
BURKENROAD REPORTS RATING SYSTEM
MARKET OUTPERFORM: This rating indicates that we believe forces are in place that would enable this company's stock to produce returns in excess of the stock market averages over the next 12 months.
MARKET PERFORM: This rating indicates that we believe the investment returns from this company's stock will be in line with those produced by the stock market averages over the next 12 months.
MARKET UNDERPERFORM: This rating indicates that while this investment may have positive attributes, we believe an investment in this company will produce subpar returns over the next 12 months. BURKENROAD REPORTS CALCULATIONS
CPFS is calculated using operating cash flows excluding working capital changes.
All amounts are as of the date of the report as reported by Bloomberg or Yahoo Finance unless otherwise noted. Betas are collected from Bloomberg.
Enterprise value is based on the equity market cap as of the report date, adjusted for long‐term debt, cash, & short‐term investments reported on the most recent quarterly report date.
12‐month Stock Performance is calculated using an ending price as of the report date. The stock performance includes the 12‐month dividend yield.
2014‐2015 COVERAGE UNIVERSE Amerisafe Inc. (AMSF) Bristow Group Inc. (BRS) The First Bancshares (FBMS) CalIon Petroleum Company (CPE) Cal‐Maine Foods Inc. (CALM) Carbo Ceramics Inc. (CRR) Cash America International Inc. (CSH) Conn's Inc. (CONN) Crown Crafts Inc. (CRWS) Cyberonics Incorporated (CYBX) Denbury Resources Inc. (DNR) EastGroup Properties Inc. (EGP) Era Group Inc. (ERA) Evolution Petroleum Corp. (EPM) Globalstar (GSAT) Gulf Island Fabrication Inc. (GIFI) Hibbett Sports (HIBB) Hornbeck Offshore Services Inc. (HOS) IBERIABANK Corp. (IBKC) ION Geophysical Corp. (IO)
Key Energy Services (KEG) Marine Products Corp. (MPX) MidSouth Bancorp Inc. (MSL) Newpark Resources Inc. (NR) PetroQuest Energy Inc. (PQ) Popeyes Louisiana Kitchen (PLKI) Pool Corporation (POOL) Powell Industries Inc. (POWL) Rollins Incorporated (ROL) RPC Incorporated (RES) Ruth’s Hospitality Group Inc. (RUTH) Sanderson Farms Inc. (SAFM) SEACOR Holdings Inc. (CKH) Sharps Compliance Inc. (SMED) Stone Energy Corp. (SGY) Sunoco LP (SUN) Superior Energy Services Inc. (SPN) Team Incorporated (TISI) Vaalco Energy Inc. (EGY) Willbros Group Inc. (WG)
PETER RICCHIUTI Director of Research Founder of Burkenroad Reports [email protected] ANTHONY WOOD Senior Director of Accounting [email protected]
JERRY DICOLO DAVID DOWTY ELLIOTT EDWARDS Associate Directors of Research
BURKENROAD REPORTS Tulane University New Orleans, LA 70118‐5669 (504) 862‐8489 (504) 865‐5430 Fax
To receive complete reports on any of the companies we follow, contact:Peter Ricchiuti, Founder & Director of Research
Tulane UniversityFreeman School of BusinessBURKENROAD REPORTS
Phone: (504) 862-8489Fax: (504) 865-5430
E-mail: [email protected] visit our web site at www.BURKENROAD.org
Printed on Recycled Paper
Named in honor of William B. Burkenroad Jr., an alumnus and a longtime supporter of Tulane’s business school, and funded through contributions from his family and friends, BURKENROAD REPORTS is a nationally recognized program, publishing objective, investment research reports on public companies in our region. Students at Tulane University’s Freeman School of Business prepare these reports.Alumni of the BURKENROAD REPORTS program are employed at a number of highly respected financial institutions including:ABN AMRO Bank · Aegis Value Fund · Invesco/AIM Capital Management · Alpha Omega Capital Partners · American General Investment Management · Ameriprise Financial · Atlas Capital · Banc of America Securities · Bank of Montreal · Bancomer · Barclays Capital · Barings PLC · Bearing Point · Bessemer Trust · Black Gold Capital· Bloomberg · Brookfield Asset Management · Brown Brothers Harriman Capital · Blackrock Financial Management · Boston Consulting Group · Buckingham Research · California Board of Regents · Cambridge Associates· Canaccord Genuity · Cantor Fitzgerald · Chaffe & Associates · Citadel Investment Group · Citibank · Citigroup Private Bank · City National Bank · Cornerstone Resources · Credit Suisse · D. A. Davidson & Co. · Deutsche Banc · Duquesne Capital Management · Equitas Capital Advisors· Factset Research · Financial Models · First Albany · Fiduciary Trust · Fitch Investors Services · Forex Trading · Franklin Templeton · Friedman Billings Ramsay · Fulcrum Global Partners · Gintel Asset Management · Global Hunter Securities · Goldman Sachs · Grosever Funds · Gruntal & Co. · Guggenheim Securities , LLC · Hancock Investment Services · Healthcare Markets Group · Capital One Southcoast · Howard Weil Labouisse Friedrichs · IBERIABANK Capital Markets · J.P. Morgan Securities · Janney Montgomery Scott · Jefferies & Co. · Johnson Rice & Co. · KBC Financial · KDI Capital Partners · Key Investments · Keystone Investments · Legacy Capital · Liberty Mutual · Lowenhaupt Global Advisors · Mackay Shields · Manulife/John Hancock Investments · Marsh & McLennan · Mercer Partners · Merrill Lynch · Miramar Asset Management · Moodys Investor Services · Morgan Keegan · Morgan Stanley · New York Stock Exchange · Perkins Wolf McDonnell · Piper Jaffray & Co. · Professional Advisory Services · Quarterdeck Investment Services · RBC · Raymond James · Restoration Capital · Rice Voelker, LLC · Royal Bank of Scotland· Sandler O'Neill & Partners · Sanford Bernstein & Co. · Scotia Capital · Scottrade · Second City Trading LLC · Sequent Energy · Sidoti & Co · Simmons & Co. · Southwest Securities · Stephens & Co. · Sterne Agee · Stewart Capital LLC · Stifel Nicolaus · Sun-Trust Capital Markets · Susquehanna Investment Group · Thomas Weisel Partners · TD Waterhouse Securities · Texas Employee Retirement System · Texas Teachers Retirement System · ThirtyNorth Investments · Thornburg Investment Management · Tivoli Partners · Tudor Pickering & Co. · Tulane University Endowment Fund · Turner Investment Partners · UBS · Value Line Investments · Vaughan Nelson Investment Management · Wells Fargo Capital Management · Whitney National Bank · William Blair & Co. · Zephyr Management