Embed Size (px)
Citation preview
Continuous-Flow, On-Line Monitoring of BiospecificInteractions Using Electrospray MassSpectrometry
A. C. Hogenboom,* A. R. de Boer, R. J. E. Derks, and H. Irth
Faculty of Sciences, Division of Chemistry, Department of Analytical Chemistry and Applied Spectroscopy, Vrije UniversiteitAmsterdam, De Boelelaan 1083, 1081 HV Amsterdam, The Netherlands
A continuous-flow analytical screening system is pre-sented using electrospray mass spectrometry to measurethe interaction of biologically active compounds withsoluble affinity proteins. The biochemical detection systemis based on a solution-phase, homogeneous assay. In afirst step, compounds to be screened (e.g., biotinylatedcompounds, concentration range 10-1000 nmol/L) areinjected into a continuous-flow reaction system and al-lowed to react with the affinity protein (e.g., streptavidin,concentration range 3-48 nmol/L). Subsequently, areporter ligand (fluorescein-labeled biotin 96 nmol/L) isadded to saturate the remaining free binding sites of theaffinity protein and the concentration of unbound reporterligand is measured using electrospray MS in the selected-ion monitoring mode. The presence of active compoundsin the sample results in an increase of the concentrationof unbound reporter ligands. The feasibility of a homoge-neous MS-based biochemical assay is demonstrated usingstreptavidin/biotin and anti-digoxigenin/digoxin as modelsystems. Compared to radioactive or fluorescence-basedbiochemical assays, the present assay format does notrequire the synthesis and purification of labels. Variousanalytical conditions were investigated to determine theability of MS to measure the biochemical interactions. Theavailability of a single ligand that can be detected at 10-50 nmol/L concentrations by electrospray MS is sufficientto set up the biochemical assay. For the biospecificinteractions studies, detection limits of 10-100 nmol/Lwere obtained.
The measurement of biochemical interactions has gainedenormous importance in various areas of analytical chemistry.With the progress made in recombination production, more andmore biological relevant proteins such as receptors, enzymes, orantibodies become available to scientists. The measurement ofthe interaction of small or large molecules with importantbiomolecular targets provides information on the potential biologi-cal activity of these compounds. Such measurements are highlyrelevant for example in drug discovery, but also in areas such asenvironmental toxicology and monitoring.
Several analytical approaches have been chosen to characterizethe interaction of ligands (analytes) with biomolecular targets.Affinity chromatography has been used in various forms for the
selective preconcentration and separation of analytes based onthe interaction with immobilized antibodies or receptors.1-6 AffinitySPE columns are often used in conjunction with liquid chroma-tography-mass spectrometry (LC-MS), allowing the determi-nation of the molecular mass of active compounds. Immobilizationof proteins, however, may lead to inactivation of the binding sitesand, consequently, to a loss of binding affinity. Since the detectionproperties of the analyte(s) are not altered during affinity chro-matography or affinity SPE, it might still be difficult to detect traceconcentrations of biologically active compounds.
To improve both the selectivity and sensitivity, the implemen-tation of biochemical assays is an alternative approach to theanalytical measurement of biochemical interactions. In biochemi-cal assays, the presence of biologically active substances isdetected indirectly via reporter molecules such as fluorescent,radioactive, or enzyme-labeled ligands. Since the reporter ligandcan be detected at high sensitivity, detection limits of biochemicalassays are in the picomole to nanomole per liter range. Biochemi-cal assays are typically performed in batch, often in microtiterplates; however, in recent years, several concepts for the imple-mentation in analytical techniques have been presented. Mostnotably, affinity electrophoresis7-13 and on-line biochemicalassays14-20 have been developed to integrate biochemical interac-
(1) Bean, K. A.; Henion, J. D. J. Chromatogr., A 1997, 791, 119.(2) Nedved, M. L.; HabibiGoudarzi, S.; Ganem, B.; Henion, J. D. Anal. Chem.
1996, 68, 4228.(3) Riggin, A.; Sportsman, J. R.; Regnier, F. E. J. Chromatogr. 1993, 632, 37.(4) Farjam, A.; Brugman, A. E.; Soldaat, A.; Timmerman, P.; Lingeman, H.; de
Jong, G. J.; Frei, R. W.; Th. Brinkman, U. A. Chromatographia 1991, 31,469.
(5) Pichon, V.; Chen, L.; Hennion, M.-C.; Daniel, R.; Martel, A.; Le Goffic, F.;Abian, J.; Barcelo, D. Anal. Chem. 1995, 67, 2451.
(6) Hage, D. J. Chromatogr., A 1998, 795, 185.(7) Schmalzing, D.; Nashabeh, W.; Yao, X. W.; Mhatre, R.; Regnier, F. E.; Afeyan,
N. B.; Fuchs, M. Anal. Chem. 1995, 67, 606.(8) Mito, E.; Zhang, Y.; Esquivel, S.; Gomez, F. A. Anal. Biochem. 2000, 280,
209.(9) Zhang, Y.; Gomez, F. A. J. Chromatogr., A 2000, 897, 339.
(10) Zhao, Y.; Becu, C.; Borremans, F.; Sandra, P. Electrophoresis 1999, 20, 2462.(11) Heintz, J.; Hernandez, M.; Gomez, F. A. J. Chromatogr., A 1999, 840, 261.(12) Heegaard, N. H. H.; Nilsson, S.; Guzman, N. A. J. Chromatogr., B 1998,
715, 29.(13) Chu, Y. H.; Cheng, C. C. Cell. Mol. Life Sci. 1998, 54, 663.(14) Irth, H.; Oosterkamp, A. J.; Tjaden, U. R.; van der Greef, J. Trends Anal.
Chem. 1995, 14, 355.(15) Irth, H.; Oosterkamp, A. J.; van der Welle, W.; Tjaden, U. R.; van der Greef,
J. J. Chromatogr. 1993, 633, 65.(16) van Bommel, M. R.; de Jong, A. P. J. M.; Tjaden, U. R.; Irth, H.; van der
Greef, J. J. Chromatogr., A 2000, 886, 19.
Anal. Chem. 2001, 73, 3816-3823
3816 Analytical Chemistry, Vol. 73, No. 16, August 15, 2001 10.1021/ac010026o CCC: $20.00 © 2001 American Chemical SocietyPublished on Web 07/11/2001
tions into analytical technologies using high-sensitivity labels asreporter ligands.
Next to fluorescence and radioacitivity detection, mass spec-trometry has become an important detection technique in themeasurement of biochemical interactions.21-34 The most widelyused ionization technique has been electrospray ionization (ESI)due to the relatively soft nature of this electrostatic processenabling weak noncovalently bound complex protein interactionsto be directly detected. ESI-MS observations for these weaklybound systems reflect to some extent the nature of the interactionfound in the condensed phase.25 The stoichiometry of the complexis obtained from the resulting mass spectrum because themolecular weight of the complex is directly measured.26,27 MS isa powerful technique due to the advantages afforded in terms ofspeed of analysis and sensitivity. The observation of ESI-MSapplicability in this field was first described by Katta and Chait.28
in their studies on globin-heme interaction of myoglobin and thereceptor-ligand complex by Ganem et al.29 Following these initialreports, several other types of protein-ligand binding werestudied including enzyme-substrate pairings,30 protein-cofactor,31
and protein-DNA complexes.32 Careful experimental consider-ation should be taken when these studies are attempted. In otherwords, ESI interface conditions typically need to be as gentle aspossible to maintain the intact complex.26
Alternatively to measuring the intact protein-ligand com-plexes, analytical techniques have been reported that are basedon the separation of protein-ligand complexes from unbound,nonactive compounds by size exclusion chromatography andrelated techniques, the subsequent dissociation of the complexes,and the measurement of the dissociated active ligands by LC-MS.35-40 These techniques are mostly applied in drug discovery,for example, in the screening of combinatorial libraries.
In the present paper, we are demonstrating the use of ESI-MS as a detection method in homogeneous biochemical assays.Rather than measuring protein-ligand complexes or dissociatedligands directly, a reporter ligand is employed to indirectlymeasure the interaction of active analytes with biomoleculartargets. This approach is similar to fluorescence- or radioactivity-based biochemical assays but uses ESI-MS to detect the reporterligand. The reporter ligand selected for the biochemical assayspreferably has a high affinity for the biomolecular target to bescreened and can be detected with high sensitivity using ESI-MS. In contrast to biochemical assays based on fluorescent- orradioactive-labeled ligands, there is no need to synthesize labelssince known, active ligands can be employed in the biochemicalassay, significantly reducing the assay development time. This isparticularly advantageous for those affinity proteins, where thechemical modification of known active ligands, e.g., the attachmentof a fluorophor, leads to a dramatic increase of binding affinity.
The concept proposed is similar to the biochemical assaysbased on fluorescence detection.14 The assay is carried out in acontinuous-flow postcolumn reaction detection system where theaffinity protein and reporter ligand are sequentially added to thecarrier solution of a flow injection system or the eluate of an LCseparation column. The reaction mixture is directed toward anESI-MS which monitors the concentration of the MS reporterligand. The presence of active compounds in the sample will resultin an increase of the free, unbound concentration of the reporterligand measured by MS in the selected-ion monitoring (SIM)mode. In parallel, the molecular mass of the active ligand can beestablished by interpreting the full-scan trace of the chromato-gram. By employing MS as detection technique for biochemicalassays, the analytical methods developed simultaneously providebiochemical (binding affinity) and chemical information (molecularmass) and may substantially reduce the time to discover andcharacterize biologically active compounds in areas such ascombinatorial chemistry and natural product screening.
EXPERIMENTAL SECTIONMaterials. Avidin, streptavidin, biotin, fluorescein-labeled
biotin (fluorescein-biotin), digoxigenin, and digoxin were pur-chased from Sigma (St. Louis, MO). N-Biotinyl-6-aminocaproichydrazide, N-biotin hydrazide, N-biotinyl-L-lysine, and biotin-N-succinimidyl ester were from Fluka Chemie (Buchs, Germany).Anti-digoxigenin (FAB fragments) was purchased from RocheDiagnostics GmbH (Mannheim, Germany). Sodium phosphate,ammonium acetate, ammonium formate, HEPES, Gly-Gly, trietha-nolamine, acetic acid, and formic acid were from Sigma. Aceto-nitrile and methanol were obtained at Baker (Deventer, TheNetherlands) and were of HPLC-grade.
Binding buffer consisted of either sodium phosphate, am-monium acetate, or ammonium formate (10 mmol/L, pH 7.5). Thecarrier solution is binding buffer/organic modifier (90:10%, v/v).
All the stock solutions of biotin, fluorescein-biotin, digoxin, anddigoxigenin were prepared in methanol. Dilutions were made inthe carrier solution. Stock solutions and dilutions of avidin,streptavidin, and anti-digoxigenin were prepared in binding buffer.
Apparatus. The flow injection (FI) system (Figure 1) consistedof three Shimadzu (Kyoto, Japan) LC-10Ai pumps used to deliverthe carrier solution/eluent, the reporter ligand solution, and theaffinity protein solution. Sample injection was performed with a
(17) Emneus, J.; Marko-Varga, G. J. Chromatogr., A 1995, 703, 191.(18) Onnerfjord, P.; Eremin, S. A.; Emneus, J.; Marko-Varga, G. J. Chromatogr.,
A 1998, 800, 219.(19) Miller, K. J.; Herman, A. C. Anal. Chem. 1996, 68, 3077.(20) Graefe, K. A.; Tang, Z.; Karnes, H. T. J. Chromatogr., B 2000, 745, 305.(21) Natsume, T.; Nakayama, H.; Jansson, O.; Isobe, T.; Takio, K.; Mikoshiba,
K. Anal. Chem. 2000, 72, 4193.(22) Sannes-Lowery, K. A.; Griffey, R. H.; Hofstadler, S. A. Anal. Biochem. 2000,
280, 264.(23) Veenstra, T. D. Biophys. Chem. 1999, 79, 63.(24) Pramanik, B. N.; Bartner, P. L.; Mirza, U. A.; Liu, Y. H.; Ganguly, A. K. J.
Mass Spectrom. 1998, 33, 911.(25) Loo, J. A. Mass Spectrom. Rev. 1997, 16, 1.(26) Smith, R. D.; Light-Wahl, K. J. Biol. Mass Spectrom. 1993, 22, 493.(27) Light-Wahl, K. J.; Schwartz, B. L.; Smith, R. D. J. Am. Chem. Soc. 1994,
116, 5271.(28) Katta, V.; Chait, B. T. J. Am. Chem. Soc. 1993, 115, 6317.(29) Ganem, B.; Li, Y.-T.; Henion, J. J. Am. Chem. Soc. 1991, 113, 6294.(30) Ganem, B.; Li, Y.-T.; Henion, J. J. Am. Chem. Soc. 1991, 113, 7818.(31) Drummond, J. T.; Ogorzalek Loo, R. R.; Matthews, R. G. Biochemistry 1993,
32, 9282.(32) Greig, M. J.; Gaus, H.; Cummins, L. L.; Sasmor, H.; Griffey, R. H. J. Am.
Chem. Soc. 1995, 117, 10765.(33) Schwartz, B. L.; Gale, D. C.; Smith, R. D.; Chilkoti, A.; Stayton, P. S. J. Mass
Spectrom. 1995, 30, 1102.(34) Eckart, K.; Spies, J. J. Am. Soc. Mass Spectrom. 1995, 6, 912.(35) Davis, R. G.; Anderegg, R. J.; Blanchard, S. G. Tetrahedron 1999, 55, 11653.(36) Blom, K. F.; Larsen, B. S.; McEwen, C. N. J. Comb. Chem. 1999, 1, 82.(37) Huang, P. Y.; Carbonell, R. G. Biotechnol. Bioeng. 1999, 63, 633.(38) Kaur, S.; McGuire, L.; Tang, D. Z.; Dollinger, G.; Huebner, V. J. Protein
Chem. 1997, 16, 505.(39) Kelly, M. A.; Liang, H. B.; Sytwu, I. I.; Vlattas, I.;-A Lyons, N. L.; Bowen, B.
R.; Wennogle, L. P. Biochemistry 1996, 35, 11747.(40) van Elswijk, D.; van der Greef, J.; Irth, H. J. Mass Spectrom., submitted for
publication.
Analytical Chemistry, Vol. 73, No. 16, August 15, 2001 3817
Gilson (Villiers-le-Bel, France) 234 autosampler equipped with aRheodyne six-port injection valve (injection loop, 20 µL). A Perkin-Elmer (Applera, Norwalk, CT) LS-4 fluorescence spectrometer anda Micromass (Wythenshawe, Manchester, U.K.) Quattro II triple-quadrupole mass spectrometer (MS-MS) equipped with an ESIsource were used for detection. Masslynx software (version 2.22)running under Windows NT was used for control of the systemand data acquisition. Full-scan sensitivity may be a limiting factorfor future development; therefore, preliminary studies into theutility of a novel orthogonal-acceleration time-of-flight massspectrometer were investigated. A Micromass Q-TOF MS-MSinstrument equipped with a Micromass Z-spray electrospraysource was used in the anti-digoxigenin/digoxin experiments.Instrument control, data acquisition, and data processing weredone using Micromass Masslynx software (version 3.4) runningunder Windows NT.
The FI carrier solution consisted of binding buffer/organicmodifier (90:10%, v/v) and was pumped at a flow rate of 50 µL/min. The different avidin/streptavidin concentrations (in nmol/L) and fluorescein-biotin solutions were prepared in bindingbuffer/organic modifier and added to the carrier solution via aninverted Y-type mixing union. The avidin/streptavidin and fluo-rescein-biotin solution were pumped at a flow rate of 50 and 100µL/min, respectively. Knitted 300-µm-i.d. poly(tetrafluoroethylene)reaction coils with internal volumes of 17 and 33 µL for reactionsI and II, respectively, were used. In the anti-digoxigenin/digoxinexperiments, reaction coils with internal volume of 65 and 33 µLfor reactions I and II, respectively, were used. The reactions wereperformed at room temperature (20 °C).
When MS and fluorescence detection were used in parallel,another Y union was inserted after the second reaction coil tosplit the flow rate to 180 µL/min entering the fluorescencedetector and 20 µL/min entering the ESI source.
Fluorescence detection was performed at an excitation wave-length of 486 nm and an emission wavelength of 520 nm.
Mass spectrometry was operated in SIM in the positive-ion(PI) mode on [M + H]+ and on one or more intense fragmentions (Quattro II). The ESI source conditions (on Quattro II) forthe streptavidin/biotin and the anti-digoxigenin/digoxin systemwere as follows: source temperature, 80 °C; capillary voltage, 3.2
kV. The sample cone voltage was 30 and 60 V for biotin andfluorescein-biotin, respectively. For both digoxigenin and digoxin,the sample cone was 20 V. The ESI source conditions (on theQ-TOF) for the anti-digoxigenin/digoxin system were as follows:source temperature, 80 °C; desolvation temperature, 120 °C;capillary voltage, 3.0 kV. The sampling cone and extraction conevoltage were 15 and 0 V, respectively. In Q-TOF MS experiments,mass spectrometry was operated at a 20-kHz frequency with aspectrum integration time of 5 s in “full-scan” MS in the PI modein the range m/z 350-850 (“interscan” time 0.1 s).
Nitrogen (99.999% purity; Praxair, Oevel, Belgium) was usedwith flow rates of 20 (for nebulization) and 350 L/h for (for drying/desolvation). Argon (99.9995% purity; Praxair) was used for MS-MS experiments.
Batch Experiments. The performance of the biochemicalassay was tested under equilibrium conditions and in the FI modewith fluorescence detection.41 To model physiological systems,phosphate buffer is generally used as binding buffer. However,phosphate buffers are not amenable to MS interfaces. To select acarrier solution composition that would be compatible with MS,two aqueous buffer solutions were selected, i.e., ammoniumacetate and ammonium formate, to test how the biospecificinteraction will behave compared to conventionally used phosphatebuffer. In all batch experiments, carrier solution compositions ofbuffer (10 mmol/L; pH 7.5)/methanol (90:10%, v/v) were usedand FI (20-µL loop) were performed with fluorescence detection.In the first batch experiment, fluorescein-biotin (36 nmol/L) isinjected into the FI-MS system. In the second experiment, avidin(6 nmol/L) was incubated for 15 min with fluorescein-biotin (36nmol/L). In the third batch, avidin (6 nmol/L) was first incubatedwith fluorescein-biotin (36 nmol/L) and after 15 min biotin (600nmol/L) was added. In the last experiment, first avidin (6 nmol/L) was first incubated with biotin (600 nmol/L) and after 15 minfluorescein-biotin (36 nmol/L) was added.
Similar batch experiments were performed for the anti-digoxigenin/digoxin system. In the first batch experiment, digoxin(concentration range: 0, 50, 100, 200, 300 nmol/L) was injectedinto the FI-MS system to obtain calibration curves (n ) 3). In asecond experiment, the various concentration levels of digoxinwere incubated with 200 nmol/L anti-digoxigenin and injected toassess the anti-digoxigenin/digoxin interaction. In the thirdexperiment, anti-digoxigenin (200 nmol/L) was first incubated witha large excess (2000 nmol/L) of digoxigenin and later digoxin(in same concentration range as mentioned above) was added andinjected into FI-MS system The above-mentioned three experi-ments were also performed for digoxigenin in various concentra-tions.
RESULTS AND DISCUSSIONAssay Setup. A homogeneous, on-line continuous-flow bio-
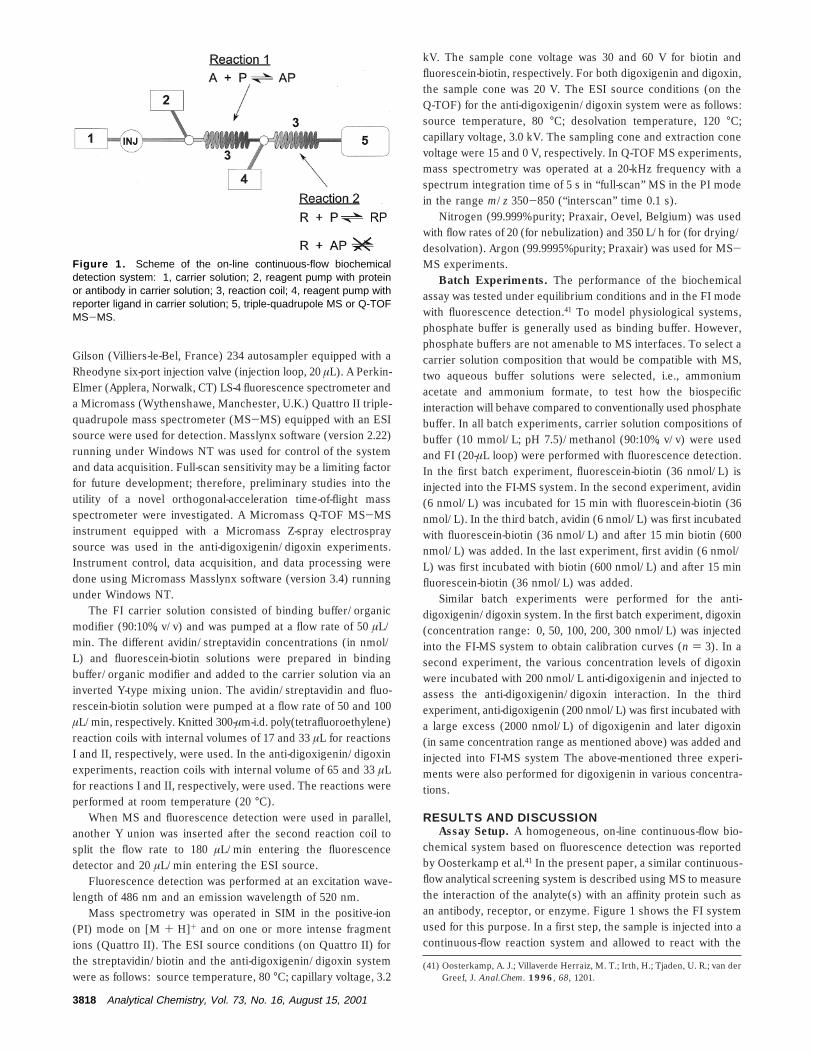
chemical system based on fluorescence detection was reportedby Oosterkamp et al.41 In the present paper, a similar continuous-flow analytical screening system is described using MS to measurethe interaction of the analyte(s) with an affinity protein such asan antibody, receptor, or enzyme. Figure 1 shows the FI systemused for this purpose. In a first step, the sample is injected into acontinuous-flow reaction system and allowed to react with the
(41) Oosterkamp, A. J.; Villaverde Herraiz, M. T.; Irth, H.; Tjaden, U. R.; van derGreef, J. Anal.Chem. 1996, 68, 1201.
Figure 1. Scheme of the on-line continuous-flow biochemicaldetection system: 1, carrier solution; 2, reagent pump with proteinor antibody in carrier solution; 3, reaction coil; 4, reagent pump withreporter ligand in carrier solution; 5, triple-quadrupole MS or Q-TOFMS-MS.
3818 Analytical Chemistry, Vol. 73, No. 16, August 15, 2001
affinity protein (reaction 1) for 10-20 s. In the second step, areporter ligand is added to saturate the remaining free bindingsites of the affinity protein (reaction 2). The reaction time is 10-20 s and depends mainly on the binding constant of reporterligand-affinity protein complex (RP). The reaction time is chosenin a way that the association of free affinity protein molecules withthe reporter ligand is favored whereas the dissociation of theanalyte affinity protein complex (AP) is negligible. Finally, theconcentration of free reporter ligand is detected by using ESI-MS in the SIM mode.
Generally, in biochemical analysis, a phosphate buffer is usedto mimic physiological conditions (pH of ∼7.5). The percentageof organic modifier is usually kept as low as possible to preventdenaturation of the proteins. In addition, a blocking reagent, suchas Tween-20 is added to prevent nonspecific binding of the protein(and protein-ligand complex) to the surface of reaction capillaries.However, nonvolatile additives in the eluent, such as phosphatebuffer and blocking reagent, are not compatible with MS detection.Various reaction conditions were monitored using a series of MS-compatible solvents and compared with the responses observedin the fluorescence detection.
Optimization of MS Conditions. MS Response and MS-Compatible Buffers. Different organic and inorganic buffers, suchas ammonium acetate, ammonium formate, HEPES, Gly-Gly, andtriethanolamine, were selected to study the response of biotin andfluorescein-biotin in MS and compared to phosphate buffer. Biotinand fluorescein-biotin were dissolved in the carrier solutioncompositions of buffer (10 mmol/L; pH 7.5)/methanol (50:50%,v/v) at concentrations of 10 ng/µL. Both infusion and 20-µL loopinjection experiments were performed with detection in MS infull-scan and SIM mode. Main optimization criteria are themaximum response of biotin and fluorescein-biotin with lowestinterference of the carrier solution. HEPES, Gly-Gly, and trietha-nolamine give very high background response, which significantlyhampers the detection of biotin and fluorescein-biotin. Phosphatebuffer and ammonium acetate/ammonium formate give a factor10 and 100 less background response, respectively. As regardssensitivity, ammonium acetate and ammonium formate gave thehighest response for biotin and fluorescein-biotin. All stocksolutions were prepared in methanol (biotin/fluorescein-biotin)or binding buffer (protein).
MS Response and Organic Modifier. To select a carrier solutioncomposition that would provide an overall maximum response forMS detection, two modifiers were selected, acetonitrile andmethanol, and two buffers, i.e. ammonium acetate (10 mmol/L;pH 7.5) and ammonium formate (10 mmol/L; pH 7.5). Biotin andfluorescein-biotin were dissolved in various binding buffer/organicsolvent mixtures ranging from 90:10 (v/v) to 50:50% (v/v) at twoconcentration levels (0.01 and 1 ng/µL), and 20 µL was injectedand analyzed by MS in the full-scan and SIM mode. The maximumresponse was found with 50% methanol, which was a factor ∼2higher than for 10% methanol. Since the proteins can denaturateor protein-ligand complexes can dissociate at relatively lowpercentages of organic modifier, in further experiments only 10%methanol is used in the carrier solution.
Behavior of Biochemical Assay Using Different Buffers. Forstudying the behavior of the biochemical interaction, two MSbuffers were selected, ammonium acetate and ammonium formate
(10 mmol/L; pH 7.5), which gave the highest response in MSexperiments. The FI biochemical fluorescence-based detectionsystem was used to test the behavior of the biochemical assayunder different buffer conditions. The results were compared withphosphate buffer. Four batch experiments (n ) 3) were performedusing each of the three buffers (for details, see ExperimentalSection). First, the response of fluorescein-biotin incubated withavidin (second batch experiment) was compared with standardinjections of fluorescein-biotin. The response of free fluorescein-biotin decreases by a factor of ∼2 due to complexation with avidin.In the third batch experiment, avidin was first incubated withfluorescein-biotin and later a large amount of biotin was added.No significant exchange of biotin for fluorescein-biotin is observed;hence, a similar response as for the second batch experiment wasobserved. In the last experiment, biotin was incubated with avidinand later fluorescein-biotin was added. The increase in responsedue to increase in concentration of free fluorescein-biotin wasalmost equal to injection of fluorescein-biotin. More importantly,these experiments clearly show that when compatible MS buffersare used in the biochemical assay with fluorescence detection,no marked change in the response based on buffers used isobserved. For the detection of biospecific interaction with MS,either ammonium acetate or ammonium formate can be used. Itshould also be noted that no blocking reagents were used in theexperiments. One has to keep in mind that this is not a genericsolution/method. Every biochemical assay (ligand-protein/antibody-antigen interaction) can behave differently.
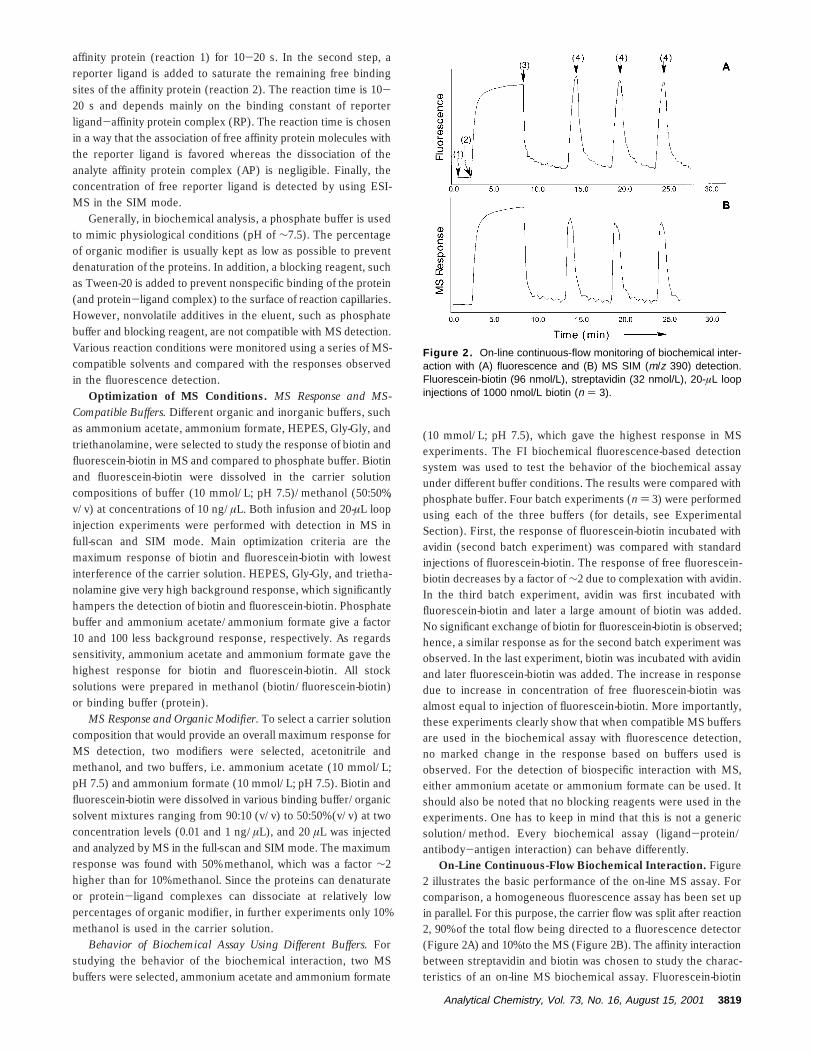
On-Line Continuous-Flow Biochemical Interaction. Figure2 illustrates the basic performance of the on-line MS assay. Forcomparison, a homogeneous fluorescence assay has been set upin parallel. For this purpose, the carrier flow was split after reaction2, 90% of the total flow being directed to a fluorescence detector(Figure 2A) and 10% to the MS (Figure 2B). The affinity interactionbetween streptavidin and biotin was chosen to study the charac-teristics of an on-line MS biochemical assay. Fluorescein-biotin
Figure 2. On-line continuous-flow monitoring of biochemical inter-action with (A) fluorescence and (B) MS SIM (m/z 390) detection.Fluorescein-biotin (96 nmol/L), streptavidin (32 nmol/L), 20-µL loopinjections of 1000 nmol/L biotin (n ) 3).
Analytical Chemistry, Vol. 73, No. 16, August 15, 2001 3819
was used as reporter ligand for both fluorescence and MS in theSIM mode (m/z 390) detection. In the fluorescence mode, thehomogeneous biochemical assay is based on the quenching ofthe fluorescein-biotin fluorescence upon binding to streptavidin.At point 1 in Figure 2, solely carrier solution is pumped by allpumps (carrier pump, affinity protein pump, reporter ligand pump)resulting in stable baseline in both detectors. At point 2, fluorescein-biotin is added to the reporter ligand pump, leading to an increaseof the background signal in both detectors. After stabilization ofthe system, streptavidin is added to the affinity protein pump (point3). The reaction of streptavidin and fluorescein-biotin leads to analmost complete disappearance of free fluorescein-biotin and,consequently, to a reduction of the baseline to the original level.When injecting active analytes such as biotin (4), the concentrationof free, unbound streptavidin is reduced in reaction 1 leading toan increase of the free fluorescein-biotin concentration afterreaction 2 and a positive signal in both the MS and fluorescencedetector. MS is shown to mimic the response patterns in thecontinuous-flow experiment similar to those observed with fluo-rescence detection. The decrease of the unbound fluorescein-biotin concentration upon addition of streptavidin at point 3indicates that complex formation occurs and that the fluoresceinbiotin-streptavidin complex does not dissociate during the ioniza-tion phase. Complete protein-ligand complexes have beenreported to stay intact in the ESI-MS process; however, gentleexperimental conditions should be applied.33,34 Furthermore, when96 nM fluorescein-biotin and 32 nM streptavidin is used, aninjection of 1 µmol/L biotin results in an almost complete blockingof streptavidin, and consequently, the maximum peak heightpossible under the current conditions is ∼95% of the highest point(3), indicating that apparent binding of biotin to streptavidin ison the order of >95%.
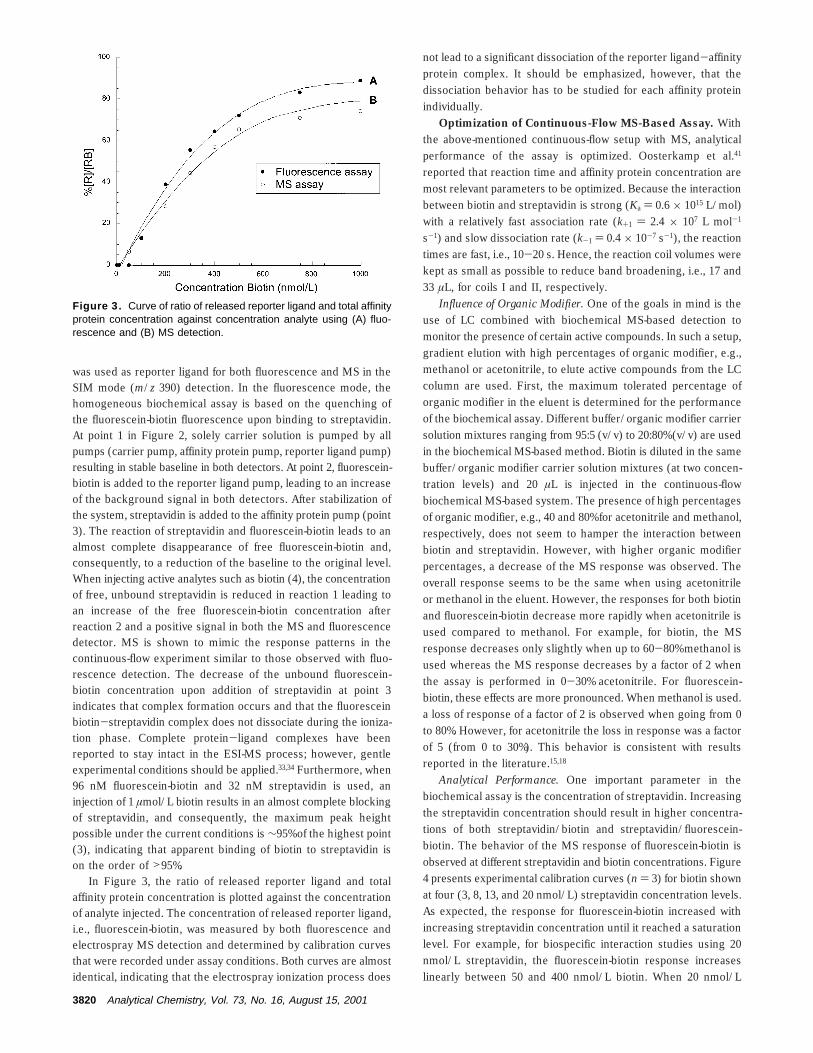
In Figure 3, the ratio of released reporter ligand and totalaffinity protein concentration is plotted against the concentrationof analyte injected. The concentration of released reporter ligand,i.e., fluorescein-biotin, was measured by both fluorescence andelectrospray MS detection and determined by calibration curvesthat were recorded under assay conditions. Both curves are almostidentical, indicating that the electrospray ionization process does
not lead to a significant dissociation of the reporter ligand-affinityprotein complex. It should be emphasized, however, that thedissociation behavior has to be studied for each affinity proteinindividually.
Optimization of Continuous-Flow MS-Based Assay. Withthe above-mentioned continuous-flow setup with MS, analyticalperformance of the assay is optimized. Oosterkamp et al.41
reported that reaction time and affinity protein concentration aremost relevant parameters to be optimized. Because the interactionbetween biotin and streptavidin is strong (Ka ) 0.6 × 10¹⁵ L/mol)with a relatively fast association rate (k+1 ) 2.4 × 10⁷ L mol-1
s-1) and slow dissociation rate (k-1 ) 0.4 × 10⁻⁷ s-1), the reactiontimes are fast, i.e., 10-20 s. Hence, the reaction coil volumes werekept as small as possible to reduce band broadening, i.e., 17 and33 µL, for coils I and II, respectively.
Influence of Organic Modifier. One of the goals in mind is theuse of LC combined with biochemical MS-based detection tomonitor the presence of certain active compounds. In such a setup,gradient elution with high percentages of organic modifier, e.g.,methanol or acetonitrile, to elute active compounds from the LCcolumn are used. First, the maximum tolerated percentage oforganic modifier in the eluent is determined for the performanceof the biochemical assay. Different buffer/organic modifier carriersolution mixtures ranging from 95:5 (v/v) to 20:80% (v/v) are usedin the biochemical MS-based method. Biotin is diluted in the samebuffer/organic modifier carrier solution mixtures (at two concen-tration levels) and 20 µL is injected in the continuous-flowbiochemical MS-based system. The presence of high percentagesof organic modifier, e.g., 40 and 80% for acetonitrile and methanol,respectively, does not seem to hamper the interaction betweenbiotin and streptavidin. However, with higher organic modifierpercentages, a decrease of the MS response was observed. Theoverall response seems to be the same when using acetonitrileor methanol in the eluent. However, the responses for both biotinand fluorescein-biotin decrease more rapidly when acetonitrile isused compared to methanol. For example, for biotin, the MSresponse decreases only slightly when up to 60-80% methanol isused whereas the MS response decreases by a factor of 2 whenthe assay is performed in 0-30% acetonitrile. For fluorescein-biotin, these effects are more pronounced. When methanol is used.a loss of response of a factor of 2 is observed when going from 0to 80%. However, for acetonitrile the loss in response was a factorof 5 (from 0 to 30%). This behavior is consistent with resultsreported in the literature.15,18
Analytical Performance. One important parameter in thebiochemical assay is the concentration of streptavidin. Increasingthe streptavidin concentration should result in higher concentra-tions of both streptavidin/biotin and streptavidin/fluorescein-biotin. The behavior of the MS response of fluorescein-biotin isobserved at different streptavidin and biotin concentrations. Figure4 presents experimental calibration curves (n ) 3) for biotin shownat four (3, 8, 13, and 20 nmol/L) streptavidin concentration levels.As expected, the response for fluorescein-biotin increased withincreasing streptavidin concentration until it reached a saturationlevel. For example, for biospecific interaction studies using 20nmol/L streptavidin, the fluorescein-biotin response increaseslinearly between 50 and 400 nmol/L biotin. When 20 nmol/L
Figure 3. Curve of ratio of released reporter ligand and total affinityprotein concentration against concentration analyte using (A) fluo-rescence and (B) MS detection.
3820 Analytical Chemistry, Vol. 73, No. 16, August 15, 2001
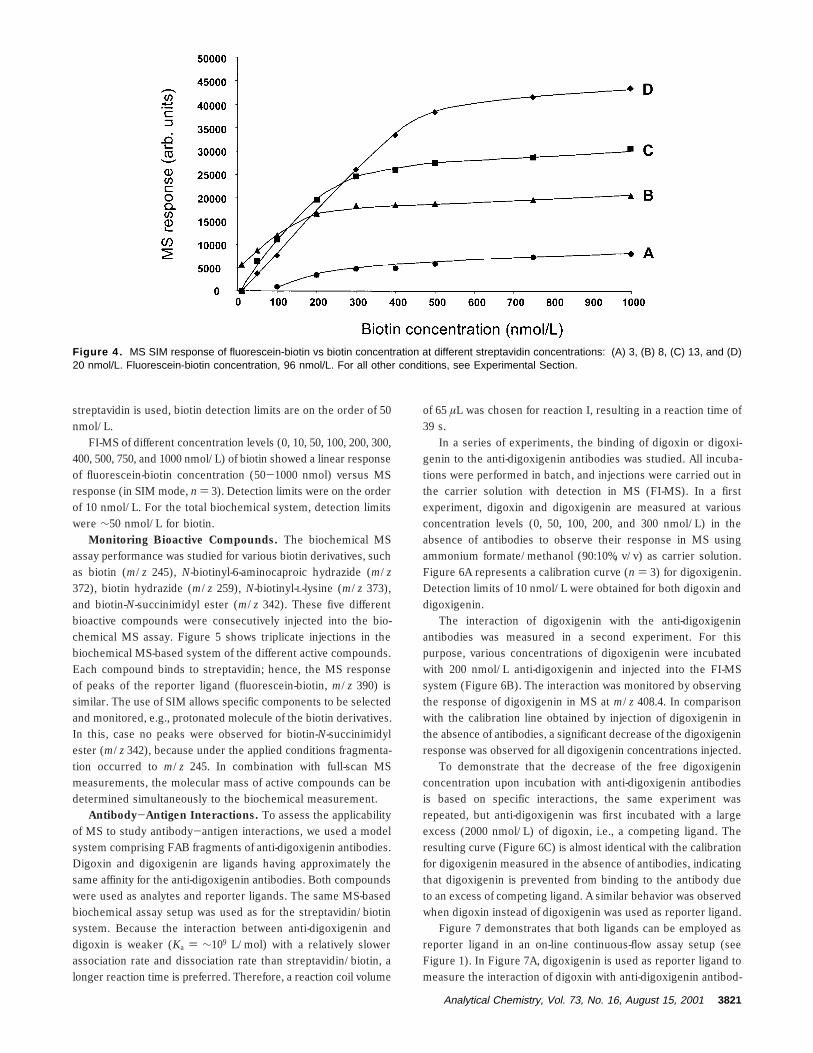
streptavidin is used, biotin detection limits are on the order of 50nmol/L.
FI-MS of different concentration levels (0, 10, 50, 100, 200, 300,400, 500, 750, and 1000 nmol/L) of biotin showed a linear responseof fluorescein-biotin concentration (50-1000 nmol) versus MSresponse (in SIM mode, n ) 3). Detection limits were on the orderof 10 nmol/L. For the total biochemical system, detection limitswere ∼50 nmol/L for biotin.
Monitoring Bioactive Compounds. The biochemical MSassay performance was studied for various biotin derivatives, suchas biotin (m/z 245), N-biotinyl-6-aminocaproic hydrazide (m/z372), biotin hydrazide (m/z 259), N-biotinyl-L-lysine (m/z 373),and biotin-N-succinimidyl ester (m/z 342). These five differentbioactive compounds were consecutively injected into the bio-chemical MS assay. Figure 5 shows triplicate injections in thebiochemical MS-based system of the different active compounds.Each compound binds to streptavidin; hence, the MS responseof peaks of the reporter ligand (fluorescein-biotin, m/z 390) issimilar. The use of SIM allows specific components to be selectedand monitored, e.g., protonated molecule of the biotin derivatives.In this, case no peaks were observed for biotin-N-succinimidylester (m/z 342), because under the applied conditions fragmenta-tion occurred to m/z 245. In combination with full-scan MSmeasurements, the molecular mass of active compounds can bedetermined simultaneously to the biochemical measurement.
Antibody-Antigen Interactions. To assess the applicabilityof MS to study antibody-antigen interactions, we used a modelsystem comprising FAB fragments of anti-digoxigenin antibodies.Digoxin and digoxigenin are ligands having approximately thesame affinity for the anti-digoxigenin antibodies. Both compoundswere used as analytes and reporter ligands. The same MS-basedbiochemical assay setup was used as for the streptavidin/biotinsystem. Because the interaction between anti-digoxigenin anddigoxin is weaker (Ka ) ∼109 L/mol) with a relatively slowerassociation rate and dissociation rate than streptavidin/biotin, alonger reaction time is preferred. Therefore, a reaction coil volume
of 65 µL was chosen for reaction I, resulting in a reaction time of39 s.
In a series of experiments, the binding of digoxin or digoxi-genin to the anti-digoxigenin antibodies was studied. All incuba-tions were performed in batch, and injections were carried out inthe carrier solution with detection in MS (FI-MS). In a firstexperiment, digoxin and digoxigenin are measured at variousconcentration levels (0, 50, 100, 200, and 300 nmol/L) in theabsence of antibodies to observe their response in MS usingammonium formate/methanol (90:10%, v/v) as carrier solution.Figure 6A represents a calibration curve (n ) 3) for digoxigenin.Detection limits of 10 nmol/L were obtained for both digoxin anddigoxigenin.
The interaction of digoxigenin with the anti-digoxigeninantibodies was measured in a second experiment. For thispurpose, various concentrations of digoxigenin were incubatedwith 200 nmol/L anti-digoxigenin and injected into the FI-MSsystem (Figure 6B). The interaction was monitored by observingthe response of digoxigenin in MS at m/z 408.4. In comparisonwith the calibration line obtained by injection of digoxigenin inthe absence of antibodies, a significant decrease of the digoxigeninresponse was observed for all digoxigenin concentrations injected.
To demonstrate that the decrease of the free digoxigeninconcentration upon incubation with anti-digoxigenin antibodiesis based on specific interactions, the same experiment wasrepeated, but anti-digoxigenin was first incubated with a largeexcess (2000 nmol/L) of digoxin, i.e., a competing ligand. Theresulting curve (Figure 6C) is almost identical with the calibrationfor digoxigenin measured in the absence of antibodies, indicatingthat digoxigenin is prevented from binding to the antibody dueto an excess of competing ligand. A similar behavior was observedwhen digoxin instead of digoxigenin was used as reporter ligand.
Figure 7 demonstrates that both ligands can be employed asreporter ligand in an on-line continuous-flow assay setup (seeFigure 1). In Figure 7A, digoxigenin is used as reporter ligand tomeasure the interaction of digoxin with anti-digoxigenin antibod-
Figure 4. MS SIM response of fluorescein-biotin vs biotin concentration at different streptavidin concentrations: (A) 3, (B) 8, (C) 13, and (D)20 nmol/L. Fluorescein-biotin concentration, 96 nmol/L. For all other conditions, see Experimental Section.
Analytical Chemistry, Vol. 73, No. 16, August 15, 2001 3821
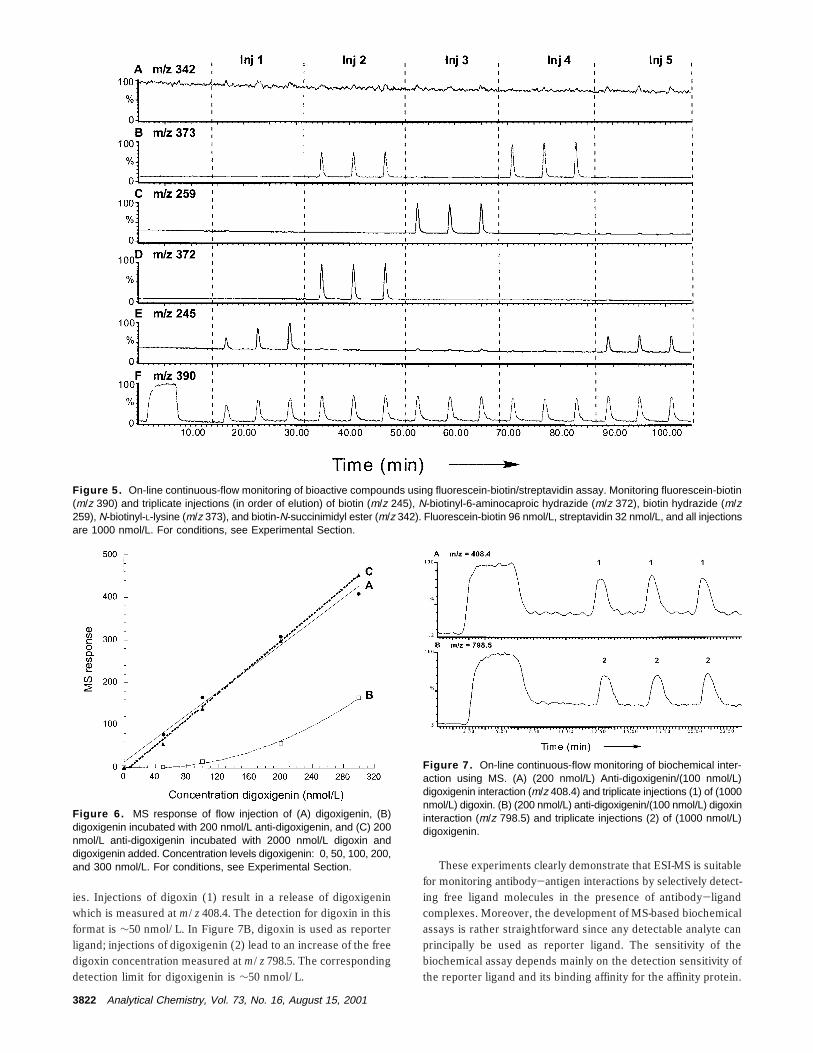
ies. Injections of digoxin (1) result in a release of digoxigeninwhich is measured at m/z 408.4. The detection for digoxin in thisformat is ∼50 nmol/L. In Figure 7B, digoxin is used as reporterligand; injections of digoxigenin (2) lead to an increase of the freedigoxin concentration measured at m/z 798.5. The correspondingdetection limit for digoxigenin is ∼50 nmol/L.
These experiments clearly demonstrate that ESI-MS is suitablefor monitoring antibody-antigen interactions by selectively detect-ing free ligand molecules in the presence of antibody-ligandcomplexes. Moreover, the development of MS-based biochemicalassays is rather straightforward since any detectable analyte canprincipally be used as reporter ligand. The sensitivity of thebiochemical assay depends mainly on the detection sensitivity ofthe reporter ligand and its binding affinity for the affinity protein.
Figure 5. On-line continuous-flow monitoring of bioactive compounds using fluorescein-biotin/streptavidin assay. Monitoring fluorescein-biotin(m/z 390) and triplicate injections (in order of elution) of biotin (m/z 245), N-biotinyl-6-aminocaproic hydrazide (m/z 372), biotin hydrazide (m/z259), N-biotinyl-L-lysine (m/z 373), and biotin-N-succinimidyl ester (m/z 342). Fluorescein-biotin 96 nmol/L, streptavidin 32 nmol/L, and all injectionsare 1000 nmol/L. For conditions, see Experimental Section.
Figure 6. MS response of flow injection of (A) digoxigenin, (B)digoxigenin incubated with 200 nmol/L anti-digoxigenin, and (C) 200nmol/L anti-digoxigenin incubated with 2000 nmol/L digoxin anddigoxigenin added. Concentration levels digoxigenin: 0, 50, 100, 200,and 300 nmol/L. For conditions, see Experimental Section.
Figure 7. On-line continuous-flow monitoring of biochemical inter-action using MS. (A) (200 nmol/L) Anti-digoxigenin/(100 nmol/L)digoxigenin interaction (m/z 408.4) and triplicate injections (1) of (1000nmol/L) digoxin. (B) (200 nmol/L) anti-digoxigenin/(100 nmol/L) digoxininteraction (m/z 798.5) and triplicate injections (2) of (1000 nmol/L)digoxigenin.
3822 Analytical Chemistry, Vol. 73, No. 16, August 15, 2001
Since digoxin and digoxigenin have similar binding affinities forthe anti-digoxigenin antibodies, similar assay sensitivities areobtained when both compounds are used as reporter ligands.
CONCLUSIONSThe applicability of a homogeneous continuous-flow MS-based
biochemical assay was demonstrated for the interaction betweenstreptavidin and biotin and anti-digoxigenin and digoxin interac-tions. One of the major advantages of using MS versus fluores-cence detection is clearly that the choice of reporter ligands isfacilitated. Principally, for the development of a new assay, knownhigh-affinity ligands for the affinity protein to be screened areanalyzed by LC-MS, and the ligand with the highest sensitivityis used as reporter ligand. With this approach, assay developmenttimes can be substantially reduced; moreover, the developmentof biochemical assays might become possible for those receptors,where labeling of known ligand with a fluorophor or an enzymeresults in a dramatic decrease of binding affinity and, conse-quently, of detection sensitivity.
An important requirement for the assay format presented isthat the biochemical interactions between affinity protein andligands proceed under MS-compatible conditions. Compared tothe conditions typically used for biochemical assays, volatilebuffers such as ammonium acetate or formate buffer have to beused rather than phosphate buffer. Moreover, salts such as sodiumchloride, which are often added to adjust the background ionicstrength of the assay, have to be avoided.
Detection limits of the assays described are in the order of10-50 nmol/L for high-affinity ligands. In comparison to fluores-cence-based assays for the same compounds, the detection limitsof the MS-based assays are ∼10-fold higher. The assay detectionlimits are mainly dependent on the detection limits obtained forthe reporter ligand used. Screening for the best reporter ligandfor MS (the maximum response) and optimizing the MS condi-tions for this reporter molecule will improve detection limits.
Further improvements can be made by optimum carrier solutionconditions. Furthermore, the use of nanoflow ESI-MS with itshigher sensitivity will be an option. In future investigations, therange of affinities that can be measured with the present assaytechnology has to be determined using appropriate receptors.
Similar to other biochemical assays based on MS, the meth-odology presented allows the simultaneous measurement ofaffinity and molecular mass, allowing the rapid characterizationof active compounds based on a library search. In comparison tothe parallel detection approach published earlier,42 the peaks ofthe active ligand and the reporter ligand have inherently identicalretention times, facilitating the interpretation of MS and MS-MS spectra.
The assay format presented here has the potential of multi-plexing, i.e., of performing several assays in parallel. Principally,it is necessary to pump mixtures of affinity proteins and thecorresponding reporter ligands, respectively, rather than singlespecies, and monitor several m/z traces at the same time. Clearly,this approach will only be feasible for those assays where no cross-reactivity exists between affinity proteins.
The most important application area of MS-based assays is indrug discovery, particularly in the screening of combinatorialchemistry libraries and natural products. As presented in earlierpapers,14,41 the present MS-based assays can be coupled on-lineto LC, allowing the efficient screening of mixtures. The possibilityto simultaneously measure biochemical affinity and the molecularmass of an active compound might significantly reduce the timeto discover and characterize novel biologically active compounds.
Received for review January 8, 2001. Accepted May 10,2001.
AC010026O
(42) Ingkaninan, K.; de Best, C. M.; van der Heijden, R.; Hofte, A. J. P.; Karabatak,B.; Irth, H.; Tjaden, U. R.; van der Greef, J.; Verpoorte, R. J. Chromatogr., A2000, 872, 61.
Analytical Chemistry, Vol. 73, No. 16, August 15, 2001 3823


![Electrospray ionization mass spectrometry of ...93)85031-R.pdfElectrospray Ionization Mass Spectrometry of Phosphopeptides Isolated by On-Line ... this purpose [19~22]. Immobilized](https://img.pdfslide.net/doc/110x75/5ad660d07f8b9a6b668b8d17/electrospray-ionization-mass-spectrometry-of-9385031-rpdfelectrospray-ionization.jpg)