Embed Size (px)
Citation preview
UNIVERSITÉ DU QUEBEC
THÈSE PRÉSENTÉE À
L'UNIVERSITÉ DU QUÉBEC À CHICOUTIMI
COMME EXIGENCE PARTIELLE
DU DOCTORAT EN INGÉNIERIE
par
Stephan Brettschneider
CONTRIBUTION TO STUDY OF VISIBLE
DISCHARGE INITIATION AND DEVELOPMENT ON
THE ICE SURFACE
CONTRIBUTION À L'ÉTUDE DE L'APPARITION ET
DU DÉVELOPPEMENT DES DÉCHARGES VISIBLES
À LA SURFACE DE LA GLACE
November 2000
bibliothèquePaul-Emile-Bouletj
UIUQAC
Mise en garde/Advice
Afin de rendre accessible au plusgrand nombre le résultat destravaux de recherche menés par sesétudiants gradués et dans l'esprit desrègles qui régissent le dépôt et ladiffusion des mémoires et thèsesproduits dans cette Institution,l'Université du Québec àChicoutimi (UQAC) est fière derendre accessible une versioncomplète et gratuite de cette �uvre.
Motivated by a desire to make theresults of its graduate students'research accessible to all, and inaccordance with the rulesgoverning the acceptation anddiffusion of dissertations andtheses in this Institution, theUniversité du Québec àChicoutimi (UQAC) is proud tomake a complete version of thiswork available at no cost to thereader.
L'auteur conserve néanmoins lapropriété du droit d'auteur quiprotège ce mémoire ou cette thèse.Ni le mémoire ou la thèse ni desextraits substantiels de ceux-ci nepeuvent être imprimés ou autrementreproduits sans son autorisation.
The author retains ownership of thecopyright of this dissertation orthesis. Neither the dissertation orthesis, nor substantial extracts fromit, may be printed or otherwisereproduced without the author'spermission.
ABSTRACT
The present study aims to further the knowledge of the fundamentalprocesses of electrical discharges along ice surfaces. The understanding of thesephenomena may help to develop numerical tools for prediction of flashover on ice-covered insulators and to improve the design of HV insulators for application topower networks in cold regions. Despite the numerous investigations on theelectrical performance of industrial insulators under icing conditions, there still existmajor gaps in comprehensive studies on the subject. Such fundamental studies onelectrical insulation performance under atmospheric icing conditions consist one ofthe main objectives of the NSERC/Hydro Quebec/UQAC Chair on AtmosphericIcing of Power Network Equipment (CIGELE).
Sophisticated ultra high-speed photographic techniques were applied in orderto observe and analyse the very fast processes of visible discharge initiation anddevelopment on the ice surface during the first nanoseconds. In addition,measurements of the 50 % lightning impulse breakdown voltage and waveformmeasurements of voltage and current were realised. A physical model with twohemispherical capped electrodes, half submerged in ice, was used for theexperiments, to which lighting impulse voltage was applied. The effects of variousparameters were investigated: Environmental parameters (freezing waterconductivity, ice temperature, ice surface uniformity, cooling rate, type of iceaccumulation), electrical parameters (voltage polarity, voltage waveform, electricfield during cooling period) and geometrical parameters (electrode distance,electrode curvature radius, electrode axis orientation).
The investigations show that streak photography is an adequate technique tostudy the very fast visible discharge processes along ice surfaces under variousconditions. The study reveals that different regimes govern the ice surfacedischarge process in the early stages, depending on the ice temperature and thedistance between the electrodes. Numerical data is provided on critical conditionsof discharge initiation, time delay between start of pre-discharge activities andoccurrence of breakdown, as well as on velocity of discharge development. In spiteof the fact that the experimental conditions (simplified physical models underimpulse voltage) did not perfectly portray the actual situation on power networksunder icing conditions (complex-shaped insulators under ac or dc voltages), somegood correspondences between previous field observations of power failures andthe present laboratory investigations can be identified.
Ill
RESUME
Le présent travail a pour objectif d'améliorer la connaissance des processusfondamentaux de décharges électriques à la surface de la glace. Lacompréhension de ces phénomènes peut aider à développer des outilsnumériques pour la prédiction des contournements des isolateurs recouverts deglace et à améliorer la conception des isolateurs à haute tension pour desapplications dans des réseaux de transport d'énergie électrique dans les régionsfroides. Malgré un grand nombre d'études relatives à la performance électriquedes isolateurs industriels sous des conditions givrantes, peu de travaux ont traitédes processus fondamentaux. Dans ce contexte, ce projet de recherche a été initiépar la Chaire CRSNG/Hydro-Québec/UQAC sur le givrage atmosphérique deséquipements des réseaux électriques (CIGELE), dont les activités visent àaccroître les connaissances de ces phénomènes.
Dans cette étude expérimentale, des technologies sophistiquées dephotographie à ultra haute vitesse sont appliquées dans le but d'observer etd'analyser pendant les premières nanosecondes les processus extrêmementrapides de l'apparition et du développement de décharge visible à la surface de laglace. Un modèle physique, qui consiste en deux électrodes métalliques à moitiésubmergées dans la glace, est utilisé pour les expériences. Des tensions d'essaien forme de choc de foudre sont appliquées. Les effets de plusieurs paramètressont étudiés: conductivité de l'eau, température de la glace, uniformité de lasurface de glace, taux de refroidissement, type d'accumulation de glace, polaritéde la tension, forme d'onde, champ électrique pendant la période derefroidissement, distance entre les électrodes, rayon de courbure des électrodes,orientation de l'axe des électrodes.
Les résultats montrent que la technologie des appareils photo à balayage defente est adéquate pour l'étude des premières décharges visibles à la surface de laglace. Les expériences révèlent qu'il existe différents régimes pour les premièresétapes des processus de décharge à la surface de la glace en fonction de latempérature de la glace et de la distance entre les électrodes. Des valeursnumériques sont relevées pour les conditions critiques de l'amorçage desdécharges, pour la durée entre l'apparition des premières décharges et lecontournement, ainsi que pour la vitesse de développement des décharges à lasurface de la glace. Malgré le fait que les conditions expérimentales (modèlephysique simplifié, tension en forme de choc de foudre) ne reproduisent pasparfaitement la situation d'une ligne de transport d'énergie électrique à hautetension (isolateur avec des formes complexes, tension sinusoïdale), dessimilitudes peuvent être identifiées entre les observations de terrain pendant descoupures de courant et des expériences en laboratoire.
IV
ZUSAMMENFASSUNG
Die vorliegende Arbeit môchte einen Beitrag zur Erweiterung derGrundlagenkenntnisse uber die elektrischen Entladungserscheinungen aufEisoberflàchen leisten. Das Verstàndnis dieser Phànomene erscheint notwendigfur die Entwicklung von Computerprogrammen zur Simulation und Vorhersage vonÙberschlàgen von vereisten Hochspannungsisolatoren wie auch fur den Entwurfneuer Isolatortypen, die auf die klimatischen Verhàltnisse in Kàlteregionenangepasst sind. Obwohl sich zahlreiche Forschungsarbeiten mit der Problematikvon Ùberschlàgen an vereisten Hochspannungsisolatoren befassen, gehen nursehr wenige Verôffentlichungen auf die zugrundeliegenden Prozesse vonEntstehung und Entwicklung der elektrischen Entladungserscheinungen ein. Vordiesem Hintergrund wurde die hier pràsentierte Forschungsarbeit im Rahmen derAktivitàten des Lehrstuhls fur Vereisungserscheinungen von Komponeten derEnergieùbertragungssysteme an der "Université du Québec à Chicoutimi", Kanada,ins Leben gerufen.
In dieser Studie, die sich vorrangig auf praktische Expérimente stùtzt, wurdenspezielle Hochgeschwindigkeitskameras verwendet, um die ersten Nanosekundender Entstehung und des Wachstums der schnell ablaufendenEntladungserscheinungen auf der Eisoberflàche zu beobachten. Fur die Versuchewurde ein Model benutzt, welches aus zwei Metallelektroden besteht, die zurHàlfte in Eis eingetaucht sind. Impulsspannungen vom Typ "BlitzstoRspannung"wurden angelegt. Die nachfolgende Aufzàhlung nennt die Parameter, dieuntersucht wurden: Leitfâhigkeit des Eiswassers, Eistemperatur, Gleichmàssigkeitder Eisoberflàche, Abkùhlungsgeschwindigkeit, Spannungspolaritàt,Spannungsform, Eisbildung mit elektrischen Feld, Elektrodenabstand,Elektrodenradius, Ausrichtung der Elektrodenachse.
Die Versuchsergebnisse belegen, dass Hochgeschwindigkeitsfotografiemittels einer ,,Streak-Kamera" eine angemessene Verfahrensweise ist, um dieEntstehung und Entwicklung der ersten sichtbaren Entladungserscheinungen aufder Eisoberflàche zu untersuchen. Es konnte gezeigt werden, dass dieelektrischen Entladungen nach verschiedenen Grundprinzipien ablaufen - inAbhàngigkeit von Eistemperatur und Elektrodenabstand.Spannungsschwellenwerte der Entladungsentstehung, Zeitdauer zwischenEntladungsentstehung und elektrischem Ùberschlag sowie dieFortpflanzungsgeschwindigkeit der Entladungen auf der Eisoberflàche konntengemessen werden. Obgleich fur die Versuche mehrere Vereinfachungenvorgenommen werden mussten, um die Situation von vereistenHochspannungsisolatoren im Labor nachzubilden, lassen sich einige intéressanteÙbereinstimmungen zwischen Versuchergebnissen und Feldbeobachtungenwàhrend Eisstùrmen aufzeigen.
PREFACE
"About 12 years ago, Professor Urey, the discoverer ofdeuterium, came to see our laboratory. When he learntthat we were working on the electrical properties of icecrystals, he asked astonished: 'What, isn't thereeverything known about ice?' "
H. Graenicher, opening keynote,International Symposium on Physics of Ice, September 1968 [92]
Today, 44 years after this comment of an astonished Professor Urey, iceresearch is still an actual topic in many aspects - and some characteristics of thissubstance are still a mystery to the scientific community.
Ice - or in a more general sense we should speak of water, as ice is only thesolid state of this substance - is one of the most amazing matter in nature. Someexamples for its exceptional behaviour may be the density characteristic, whichreaches its highest value in liquid state, or the high value of its permittivityconstant. In the temperature range of natural life on our planet, water does appearin all its different chemical states - solid, liquid, gaseous or mixtures of severalstates at the same time. This adds even more complexity to any investigation ofthis substance, as it may be expected that its behaviour will be influenced by thedifferent chemical states. Perhaps this study can add some more aspects todescribe this interesting substance, whereas it has to be admitted that we are stillfar from understanding it entirely.
The interest for studying the impact of atmospheric icing on power networkequipment awoke as early as in the seventies at the University of Québec inChicoutimi (UQAC). Growing research activities led to the creation of the"Research Group on Atmospheric Environment Engineering (GRIEA)" in 1983.During the past years, development continued and a peak in research and theirrecognition could be reached with creation of the "NSERC/Hydro-Québec/UQACChair on Atmospheric Icing of Power Network Equipment (CIGELE)" in September1997. One of the objectives of this research institution is to further fundamentalunderstanding of electrical insulation performance under atmospheric icingconditions. In this framework, a project related to discharge initiation anddevelopment on the ice surface was initiated by CIGELE, under the direction ofProfessor M. Farzaneh and in co-operation with Professor K. D. Srivastava fromthe University of British Columbia (UBC). It was a great pleasure for me to get theopportunity to participate in this project as a Ph.D.-student. A very interesting task
VI
was assigned to me, and I could learn a lot throughout the whole period of thisPh.D.-Thesis. However, I would not have been able to take part in this projectwithout another co-operation that brought me first to the University of Québec inChicoutimi. I had the chance to carry out my final research project, which is a partof the German engineering diploma, at this institution in the framework of ascientific co-operation between Professor M. Farzaneh of UQAC and Professor A.J. Schwab as well as Professor A. M. Miri of the University of Karlsruhe. Therefore,I owe my recognition to them for giving me the chance to participate in this co-operation and to do my diploma project at the University of Québec in Chicoutimi.
This Ph.D. Thesis was carried out in a very practical way. It presented a realchallenge and numerous hours were spent in the two high voltage laboratories(often early in the morning or late in the evening in order to avoid disturbingcolleagues who did working in the same rooms, as the camera requires totaldarkness). However, the research may just have started at this point. Moreexperiments may be carried out, different physical models may be explored,mathematical and numerical models may be established, and theories on type andcharacteristics of the different discharge processes may be developed. I hope thatthis work may have succeeded in proving that this technology transfer into the fieldof ice research is possible, and that doors have been opened for future researchtowards the roots of the physical phenomena on ice surfaces. It is your power, dearreader, to make this ruling and perhaps to pass the opened doors in order tocontinue this research.
Chicoutimi, October 6, 2000
Stephan Brettschneider
VII
ACKNOWLEDGEMENTS
This work was carried out within the framework of the NSERC/Hydro-Québec/UQAC Industrial Chair on Atmospheric Icing of Power Network Equipment(CIGELE) at the University of Québec in Chicoutimi, in collaboration with theUniversity of British Colombia.
A single person cannot accomplish a project like the present one. I would liketo express my grateful recognition to all of the numerous people - friends andcolleagues - who offered their assistance and accompaniment throughout thewhole project. It may be impossible to name all of them at this place, however, Iwould like to express my deepest gratitude in particular to:
Professor Masoud Farzaneh and Professor K.D. Srivastava, respectively mydirector and co-director of the thesis,
for their guidance, presence, patience and confidence that they offeredme at any time during the project;
Professor Abderrahmane Beroual, Dr. William A. Chisholm, Professor RenéChouinard, and Dr. Pierre Couture,
for their participation in the evaluation committee;
Sylvain Desgagnés, Claudio Furnari, Dr. S. Li, and Simon Pilote,for their technical help and assistance during the ultra high-speedrecordings;
Rabah Chaarani and Cyril Guesdon,for their patient support at each appearance of another inexplicable bugin the computer system;
Jean Talbot and Melanie Tremblay,for their advises, encouragement and help to render my texts legible;
My parents,for their constant moral support and all their energy that they have putinto my education, which enabled me to get to the point where I amtoday.
VIII
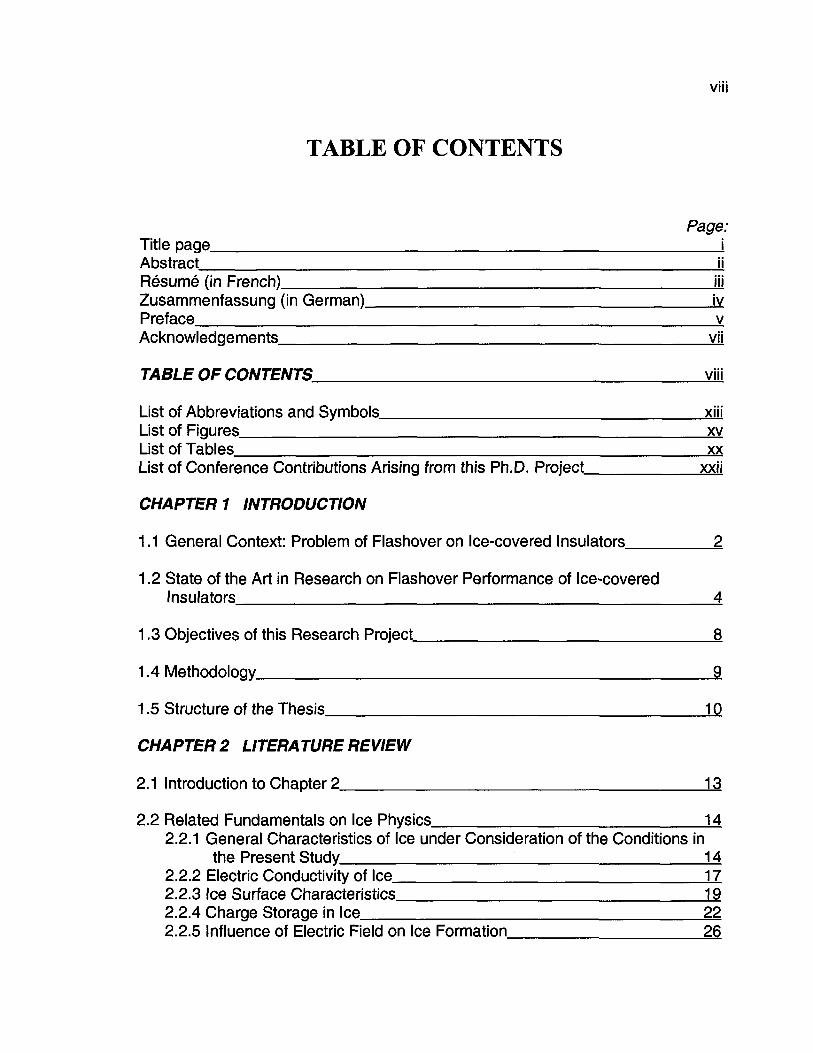
TABLE OF CONTENTS
Page:Title page [Abstract \\Résumé (in French) inZusammenfassung (in German) jvPreface vAcknowledgements vn
TABLE OF CONTENTS vjii
List of Abbreviations and Symbols xiiiList of Figures xvList of Tables xxList of Conference Contributions Arising from this Ph.D. Project xxn
CHAPTER 1 INTRODUCTION
1.1 General Context: Problem of Flashover on Ice-covered Insulators 2
1.2 State of the Art in Research on Flashover Performance of Ice-coveredInsulators 4
1.3 Objectives of this Research Project 8
1.4 Methodology 9
1.5 Structure of the Thesis 10
CHAPTER 2 LITERA TURE REVIEW
2.1 Introduction to Chapter 2 13
2.2 Related Fundamentals on Ice Physics 142.2.1 General Characteristics of Ice under Consideration of the Conditions in
the Present Study 142.2.2 Electric Conductivity of Ice 122.2.3 Ice Surface Characteristics 192.2.4 Charge Storage in Ice 222.2.5 Influence of Electric Field on Ice Formation 26
IX
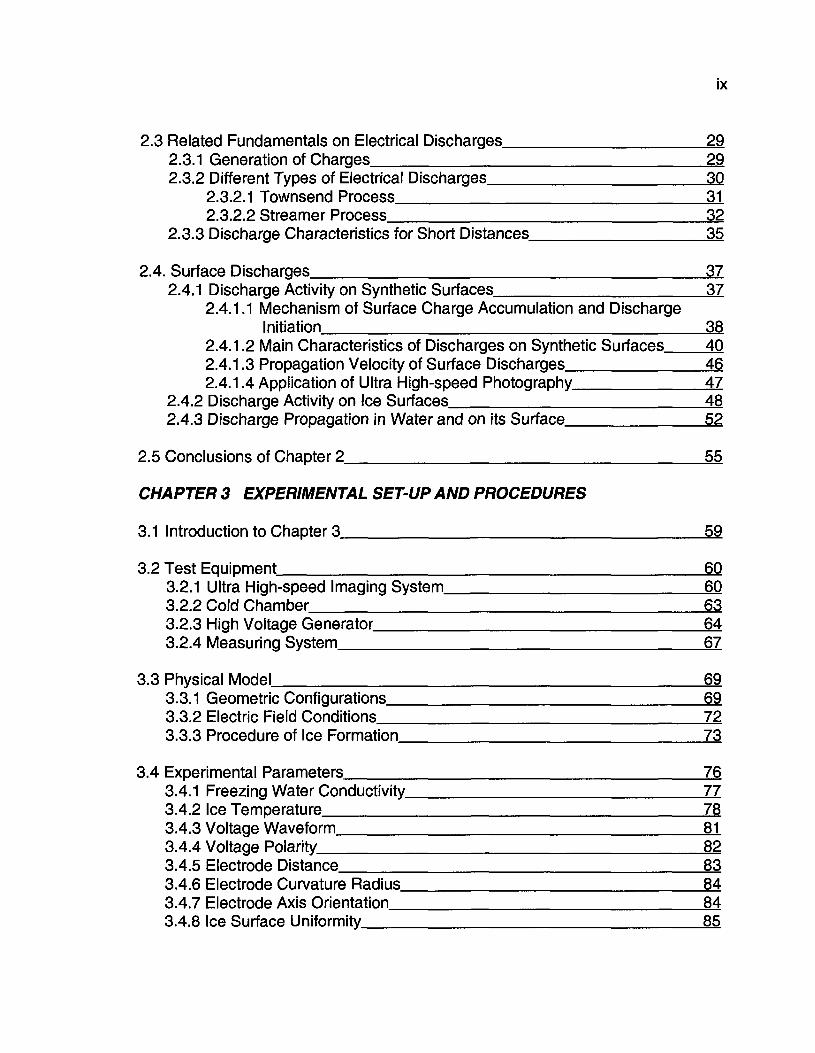
2.3 Related Fundamentals on Electrical Discharges 292.3.1 Generation of Charges 292.3.2 Different Types of Electrical Discharges 30
2.3.2.1 Townsend Process 312.3.2.2 Streamer Process 32
2.3.3 Discharge Characteristics for Short Distances 35
2.4. Surface Discharges 372.4.1 Discharge Activity on Synthetic Surfaces 37
2.4.1.1 Mechanism of Surface Charge Accumulation and DischargeInitiation 38
2.4.1.2 Main Characteristics of Discharges on Synthetic Surfaces 402.4.1.3 Propagation Velocity of Surface Discharges 462.4.1.4 Application of Ultra High-speed Photography 47
2.4.2 Discharge Activity on Ice Surfaces 482.4.3 Discharge Propagation in Water and on its Surface 52
2.5 Conclusions of Chapter 2 55
CHAPTER 3 EXPERIMENTAL SET-UP AND PROCEDURES
3.1 Introduction to Chapter 3 59
3.2 Test Equipment 603.2.1 Ultra High-speed Imaging System 603.2.2 Cold Chamber 633.2.3 High Voltage Generator 643.2.4 Measuring System 67
3.3 Physical Model 693.3.1 Geometric Configurations 693.3.2 Electric Field Conditions Z23.3.3 Procedure of Ice Formation 73
3.4 Experimental Parameters 763.4.1 Freezing Water Conductivity 773.4.2 Ice Temperature Z83.4.3 Voltage Waveform 813.4.4 Voltage Polarity 823.4.5 Electrode Distance 833.4.6 Electrode Curvature Radius 843.4.7 Electrode Axis Orientation 843.4.8 Ice Surface Uniformity 85
3.4.9 Cool ing Rate 853.4.10 Ice Accumulat ion Process 86
3.5 Test Procedures 883.5.1 Basic Principle of Streak Photography 883.5.2 Interpretation of Streak Recordings 893.5.3 Definition of the Instant of Breakdown on the Streak Recordings 9 13.5.4 Determination of 50 % Lightning Impulse Breakdown Voltage 923.5.5 Interpretation of Current Waveforms 93
3.6 Error Discussions 963.6.1 Accuracy in the Determination of 50 % Breakdown Voltage 963.6.2 Temperature Characteristics of Current Shunt 9_Z3.6.3 Time Resolution of Digitising Oscil loscope 983.6.1 T ime Resolution of the Streak Camera 983.6.5 Oscil lations in the Streak Recordings 99
CHAPTER 4 STUDY OF CRITICAL BREAKDOWN VOLTAGES
4.1 Introduction to Chapter 4 1QZ
4.2 Experimental Results 1094.2.1 U50% Values 1094.2.2 Surface Photographs 114
4.3 Discussion and Analysis 1164.3.1 Comparison of Different Materials 1164.3.2 Effect of Freezing Water Conductivity HI4.3.3 Effect of Ice Temperature 1204.3.4 Effect of Voltage Polarity 1224.3.5 Effect of Voltage Waveform 1244.3.6 Effect of Electrode Curvature Radius 1254.3.7 Effect of Electrode Axis Orientation 1264.3.8 Effect of Ice Surface Uniformity 1274.3.9 Effect of Cooling Rate 1324.3.10 Electric Field during Cooling Period 134
4.4 Conclusions of Chapter 4 136
CHAPTER 5 STUDY OF VISIBLE DISCHARGE DEVELOPMENT
5.1 Introduction to Chapter 5 139
XI
5.2 Discharge Development in an Air Gap and along Synthetic Surfaces 1415.3 Verifications of Experimental Methodology 143
5.3.1 Discharge Path 1445.3.2 Repeatability of the Experiments 14Z
5.4 Ultra High-speed Photographic Observations for Ice Surfaces withoutArtificial Air Gap 1495.4.1 Experimental Results 149
5.4.1.1 Ice samples with Electrode Distance of 7 mm 1495.4.1.2 Ice samples with Electrode Distance of 18 mm 152
5.4.2 Discussion and Analysis 15Z5.4.2.1 Comparison of Different Materials 1575.4.2.2 Effect of Freezing Water Conductivity 1595.4.2.3 Effect of Ice Temperature 1625.4.2.4 Effect of Voltage Polarity 1655.4.2.5 Effect of Electrode Distance 16Z5.4.2.6 Effect of Electrode Curvature Radius 1705.4.2.7 Effect of Electrode Axis Orientation 1725.4.2.8 Discharge Propagation Velocity 1735.4.2.9 Effect of Steepness of Voltage Rise 1ZZ
5.5 Ultra High-speed Photographic Observations for Ice Surfaceswith Air Gaps 1795.5.1 Experimental Results 179
5.5.1.1 Ice Samples with Artificial Air Gap 1795.5.1.2 Ice Samples with Natural Air Gaps 183
5.5.2 Discussion and Analysis 1855.5.2.1 Effect of Ice Temperature 1855.5.2.2 Effect of Air Gap Location 1875.5.2.3 Discharge Initiation for Ice Surfaces with Artificial Air Gap 1905.5.2.4 Effect of Cooling Rate 1915.5.2.5 Effect of Electric Field during Cooling Period 1945.5.2.6 Effect of Type of Ice Accumulation Process 195
5.6 Conclusions of Chapter 5 196
CHAPTER 6 STUDY OF VOLTAGE AND CURRENT WA VEFORMS
6.1 Introduction to Chapter 6 201
6.2 Waveform Recordings of the Breakdown Process 2036.2.1 Experimental Results for Ice Surfaces without Artificial Air Gap 2036.2.2 Experimental Results for Ice Surfaces with Artificial Air Gap 206
XII
6.2.3 Discussion and Analysis 20Z6.3 Waveform Recordings of Pre-discharge Activity 209
6.3.1 Experimental Results 2096.3.2 Discussion and Analysis 211
6.4 Conclusions of Chapter 6 215
CHAPTER 7 GENERAL CONCLUSIONS AND RECOMMENDATIONS FORFUTURE WORK
7.1 General Conclusions 218
7.2 Recommendations for Future Work 228
REFERENCES 233
APPENDICESA1 Phase Diagrams of Ice 246A2 Technical Data of Streak Camera 248A3 Technical Data of Climate Chamber 249A4 Elements of HV Impulse Generator 251A5 Technical Data of Digitising Oscilloscope 253A6 Specifications of Overvoltage Protection 256A7 Design Parameters for Capacitive HV Measuring Divider 257A8 Design Parameters for Current Shunts 258A9 Connection of the Sub-systems in the Experimental Test Set-up 260A10 Correction of Freezing Water Conductivity in Function of Temperature 262A11 Non-linear Regression Analysis of the Effect of Freezing Water
Conductivity on Critical Breakdown Voltage 264
XIII
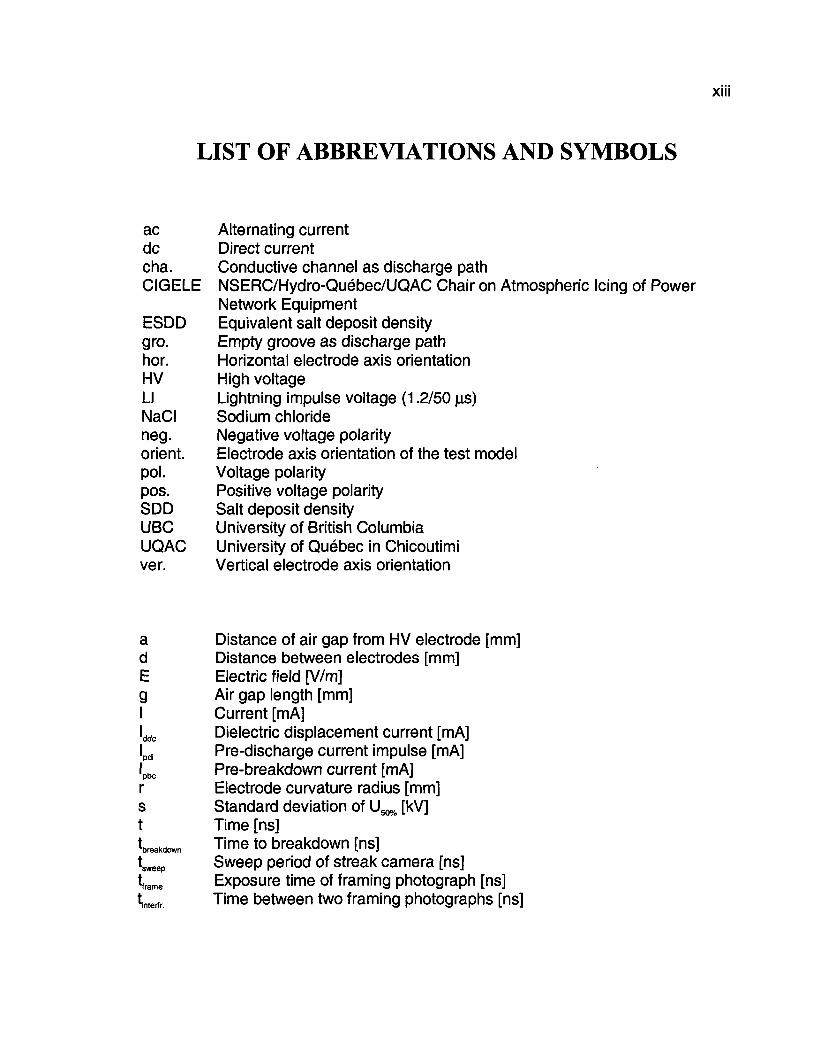
LIST OF ABBREVIATIONS AND SYMBOLS
acdccha.CIGELE
ESDDgro.hor.HVLINaCIneg.orient.pol.pos.SDDUBCUQACver.
adEg
Alternating currentDirect currentConductive channel as discharge pathNSERC/Hydro-Québec/UQAC Chair on Atmospheric Icing of PowerNetwork EquipmentEquivalent salt deposit densityEmpty groove as discharge pathHorizontal electrode axis orientationHigh voltageLightning impulse voltage (1.2/50 jus)Sodium chlorideNegative voltage polarityElectrode axis orientation of the test modelVoltage polarityPositive voltage polaritySalt deposit densityUniversity of British ColumbiaUniversity of Québec in ChicoutimiVertical electrode axis orientation
Distance of air gap from HV electrode [mm]Distance between electrodes [mm]Electric field [V/m]Air gap length [mm]
"ddc
'pbc
rst
breakdown
tframe
interfr.
Current [mA]Dielectric displacement current [mA]Pre-discharge current impulse [mA]Pre-breakdown current [mA]Electrode curvature radius [mm]Standard deviation of U50% [kV]Time [ns]Time to breakdown [ns]Sweep period of streak camera [ns]Exposure time of framing photograph [ns]Time between two framing photographs [ns]
XIV
t, Front t ime [JIS]t. T ime to half value | is]
Duration of cool ing period [h]g Temperature inside cl imate chamber dur ing cool ing period [°C]
Ttest Ice Temperature dur ing test [° C]Appl ied voltage during cool ing rate for ice accumulat ion under electricfield [kV]
U50% 50 % lightning impulse breakdown voltage [kV]
a First Townsend coefficient5 Correct ion factor for freezing water conductivity as a function of
temperatureer Relative electric permittivityy Second Townsend coefficienta Freezing water conductivity [S/m]
(Conductivity of l iquids is often given in "juS/cm". The relationbetween the two units is: 1 ^iS/cm=1 x1 0"4 S/m)
Several units are given using prefixes to avoid very large or very smal lnumerical values. The fol lowing list shows the units concerned:
Distance (a, d , g, r): 1 m m = 10"3 mCurrent (I , lddc> lpdiI I J : 1 m A = 1 0 3 AVoltage ( U ^ , U50%): 1 k V = 1 0 3 VTime (t, tbreakdown, tsweepI t,rarne, tinterfr): 1 ns = 10* s
6
XV
LIST OF FIGURES
Page:Fig. 1 -1 : Appearance of visible discharge activities on the surface and at the
ends of an ice-covered high voltage insulator 3
Fig. 2-1 : Hexagonal structure of ice type "Ih" [75] 16Fig. 2-2: Unrelaxed surface bilayer of ice [75] 21Fig. 2-3: Streamer discharge causing a field enhancement in front of and
behind the electron avalanche [4] 33Fig. 2-4: Creation of secondary avalanches by emission of photons out of the
primary streamer [4] 34Fig. 2-5: Breakdown curves for sphere-plane configuration as a function
of gap length [67] 36
Fig. 3-1 : Experimental set-up combining ultra high-speed imaging system, coldchamber, high voltage generator and measuring system 5.9
Fig. 3-2: Schematic diagram of the imaging system S2Fig. 3-3: Experimental set-up with the streak camera in front of the
cold chamber 64Fig. 3-4: Waveform of a lightning impulse voltage [50] §5Fig. 3-5: Equivalent electric circuit of the high voltage impulse generator §6Fig. 3-6: Photograph of the real set-up of the high voltage impulse generator 66Fig. 3-7: Connections of the oscilloscope to the experimental set-up §8Fig. 3-8: Vertical section of the physical model 71Fig. 3-9: Still photographs of ice model 71Fig. 3-10: Numerical simulation for electric field distribution of the physical model
(d=18 mm; r=6 mm) [108] 72Fig. 3-11 : Electric field values between the electrodes for an applied voltage
of 1 V 73Fig. 3-12: Different steps for the preparation of the ice samples 74Fig. 3-13: Orientation of the streak photographs in this study 8.8Fig. 3-14: Processed versions of a streak recording 90Fig. 3-15: Determination of the instant of breakdown §2Fig. 3-16: Typical waveform recording for voltage and current 95Fig. 3-17: Observed impulses on the current waveform recordings §5Fig. 3-18: Focus image recorded with the streak camera (showing two lines
of a newspaper in this example) 1Q4Fig. 3-19: Recordings with streak camera accidentally adjusted to focus
mode 104
XVI
Fig. 4-1 : Surface still photographs as a function of cooling rate (a=30 x104 S/m;T=-12° C; pol.=pos.; d=18 mm; r=6 mm; orient.=hor.) 115
Fig. 4-2: Surface still photographs as a function the ice accumulation process(c=30 xiO"4 S/m; T=-12° C; pol.=neg.; d=18 mm; r=6 mm;orient.=hor.) 115
Fig. 4-3: 50 % lightning impulse breakdown voltage for different materials(pol.=pos.; d=7 mm; r=6 mm; orient.=hor.) 116
Fig. 4-4: 50 % lightning impulse voltages for ice surface without artificial air gapas a function of freezing water conductivity y, a, and ice temperature, T(d=18 mm; r=6 mm; orient.=hor.) 118
Fig. 4-5: 50 % lightning impulse breakdown voltage as a function of voltagepolarity for different temperatures (o=30 x10'4 S/m; d=18 mm; r=6 mm;orient.=hor.) 123
Fig. 4-6: 50 % breakdown voltages as a function of the voltage waveform(c=30 xiO"4 S/m; T=-12° C; pol.=neg.; d=18 mm; r=6 mm;orient.=hor.) 125
Fig. 4-7: 50 % breakdown voltages as a function of electrode curvature radius(c=30 xiO"4 S/m; d=18 mm; orient.=hor.) 126
Fig. 4-8: 50 % breakdown voltages as a function of ice surface uniformity(G=30 XIO"4 S/m; d=18 mm; r=6 mm; orient.=hor.) 129
Fig. 4-9: 50 % breakdown voltages as a function of surface material and fordifferent surface conditions (cice=30 x10'4 S/m; T=-12° C; pol.=pos.; d=18mm; r=6 mm) 130
Fig. 4-10: 50 % breakdown voltages as a function of cooling rate (a=30 x10"4 S/m;T=-12° C; pol.=pos.; d=18 mm; r=6 mm; orient.=hor.) 133
Fig. 5-1 : Discharge development in an air gap (T=20° C; pol.=pos.; d=7 mm; r=6mm; orient.=ver.; tsweep= 100 ns) 141
Fig. 5-2: Series of framing recordings showing the temporal dischargedevelopment in an air gap (T=-12° C; pol.=pos.; d=7 mm; r=6 mm;orient.=hor.; t,rame=10 ns; tinterfr=0 ns) 142
Fig. 5-3: Discharge development along the surface of a Teflon spacer (T=20° C;pol.=pos.; d=7 mm; r=6 mm; orient.=ver.; tsweep=50 ns) 143
Fig. 5-4: Photographs of discharge staying inside the conductive channel(o=30 xiO"4 S/m; T=0° C; pol.=pos.; d=18 mm; r=6 mm; orient.=hor.;path=cha.) 144
Fig. 5-5: Streak recordings for the two proposed measures to keep thedischarge on a straight line (c=30 x104 S/m; T=-12° C; pol.=pos.;d=18 mm; r=6 mm; orient.=hor.; tsweep=50 ns) 145
Fig. 5-6: Photographs of a discharge propagating along the surface of the ice(c=30 xIO"4 S/m; T=-12° C; pol.=pos.; d=18 mm; r=6 mm; orient.=hor.;path=cha.) 146
XVII
Fig. 5-7: Streak recordings for similar test conditions carried out in differentlaboratories (pol.=pos.; d=7 mm; r=6 mm; orient.=hor.;tsweep=50 ns) 14Z
Fig. 5-8: Comparison of a streak recording with a framing recording for similarexperimental conditions (a=30 x10'4 S/m; T=0° C; pol.=pos.; d=18 mm;r=6 mm; orient.=hor.; path=cha.; a=0 mm) 148
Fig. 5-9: Streak recordings as a function of freezing water conductivity, c(T=-12° C or Tubc=-20° C; d=7 mm; r=6 mm; orient.=hor.;tSweep=50 ns) 150.
Fig. 5-10: Streak recordings as a function of ice temperature, T (a=2.5 x10'4 S/m or<yubc=1 x10'4 S/m; d=7 mm; r=6 mm; orient.=hor.; tsweep=50 ns) 151
Fig. 5-11 : Streak recordings as a function of freezing water conductivity, a(T=-12° C orTubc=-20° C; d=18 mm; r=6 mm; orient.=hor.;tsweep=50 ns) 153
Fig. 5-12: Streak recordings as a function of ice temperature, T (a=2.5 xiO/4 S/mor aubc=1 x10'4 S/m; d=18 mm; r=6 mm; orient.=hor.; tsweep=50 ns) 154
Fig. 5-13: Series of framing recordings showing the very fast temporaldischarge development along the surface of the ice (c=30 x10'4 S/m;T=-12° C; pol.=pos.; d=18 mm; r=6 mm; orient.=hor.; t,rame=10 ns;tinterfr=0 ns) 154
Fig. 5-14: Streak recordings as a function of electrode distance, d (T=-12° Cor Tubc=-20° C; pol.=pos.; r=6 mm; orient.=hor.; tsweep=50 ns) 155
Fig. 5-15: Streak recordings as a function of electrode curvature radius, r(G=2.5 X10'4 S/m; T=-12° C; d=18 mm; r=6 mm; orient.=hor.;tSweep=50 ns) 15S
Fig. 5-16: Streak recordings for increased electrode curvature radius as afunction of freezing water conductivity and ice temperature(pol.=pos.; d=18 mm; r=15.5 mm; orient.=hor.; tsweep=50 ns) 15§
Fig. 5-17: Streak Recordings as a function of electrode axis orientation(o=30 xiO"4 S/m; T=0° C; d=18 mm; r=6 mm; tsweep=200 ns) 15Z
Fig. 5-18: Discharge development for different materials (pol.=pos.; d=7 mm;r=6 mm) 158.
Fig. 5-19: Comparison of streak recordings of Teflon surface and ice surfacefor similar electrode configuration (pol.=pos.; d=18 mm; r=6 mm;tSweep=50 ns) 159
Fig. 5-20: T ime to breakdown as a function of freezing water conductivity, a(T=-12° C or Tubc=-20° C; d=7 mm; r=6 mm; orient.=hor.) 1_60_
Fig. 5-21 : T ime to breakdown as a function of freezing water conductivity, a(T=-12° C or Tubc=-20° C; d=18 mm; r=6 mm; orient.=hor.) 16Q
Fig. 5-22: Time to breakdown as a function of ice temperature, T (CT=2.5 X1 0'4 S/mor aubc=1 x10 4 S/m; d=7 mm; r=6 mm; orient.=hor.) 163
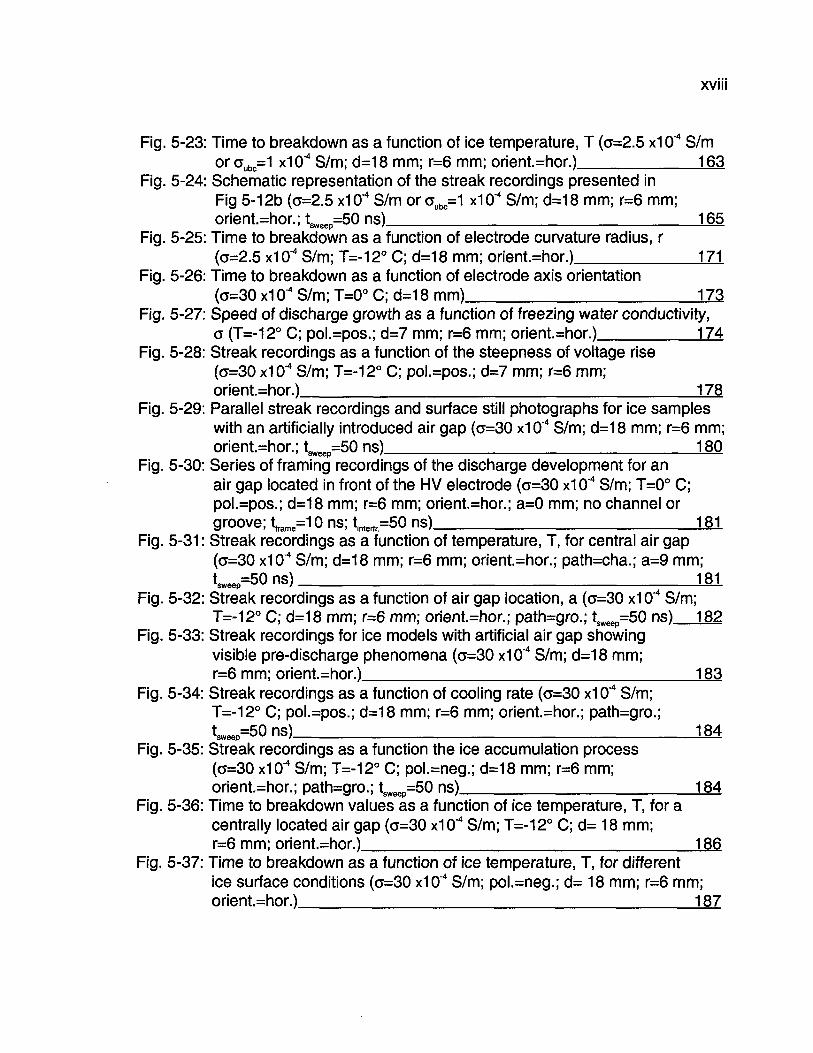
XVIII
Fig. 5-23: Time to breakdown as a function of ice temperature, T (o=2.5 x1CT* S/mor cubc=1 x10'4 S/m; d=18 mm; r=6 mm; orient.=hor.) 163
Fig. 5-24: Schematic representation of the streak recordings presented inFig 5-12b (c=2.5 xiO"4 S/m or aubc=1 x10'4 S/m; d=18 mm; r=6 mm;orient.=hor.; ^ ^ = 5 0 ns) 165
Fig. 5-25: Time to breakdown as a function of electrode curvature radius, r(o=2.5 xiO"4 S/m; T=-12° C; d=18 mm; orient.=hor.) HI
Fig. 5-26: Time to breakdown as a function of electrode axis orientation(o=30 x i r j 4 S/m; T=0° C; d=18 mm) 173
Fig. 5-27: Speed of discharge growth as a function of freezing water conductivity,G (T=-12° C; pol.=pos.; d=7 mm; r=6 mm; orient.=hor.) 174
Fig. 5-28: Streak recordings as a function of the steepness of voltage rise( G = 3 0 XIO"4 S/m; T=-12° C; pol.=pos.; d=7 mm; r=6 mm;orient.=hor.) 178
Fig. 5-29: Parallel streak recordings and surface still photographs for ice sampleswith an artificially introduced air gap ( G = 3 0 X10'4 S/m; d=18 mm; r=6 mm;orient.=hor.; tsweep=50 ns) 180
Fig. 5-30: Series of framing recordings of the discharge development for anair gap located in front of the HV electrode (o=30 x10"4 S/m; T=0° C;pol.=pos.; d=18 mm; r=6 mm; orient.=hor.; a=0 mm; no channel orgroove; U . = 1 0 ns; tinterfr=50 ns) 181
Fig. 5-31 : Streak recordings as a function of temperature, T, for central air gap(o=30 x10^ S/m; d=18 mm; r=6 mm; orient.=hor.; path=cha.; a=9 mm;tSweep=50 ns) 181
Fig. 5-32: Streak recordings as a function of air gap location, a (c=30 x10'4 S/m;T=-12° C; d=18 mm; r=6 mm; orient.=hor.; path=gro.; tsweep=50 ns) 182
Fig. 5-33: Streak recordings for ice models with artificial air gap showingvisible pre-discharge phenomena (o=30 x10'4 S/m; d=18 mm;r=6 mm; orient.=hor.) 183
Fig. 5-34: Streak recordings as a function of cooling rate (a=30 x10"4 S/m;T=-12° C; pol.=pos.; d=18 mm; r=6 mm; orient.=hor.; path=gro.;tSWeep=50 ns) 184
Fig. 5-35: Streak recordings as a function the ice accumulation process(cr=30 xiO"4 S/m; T=-12° C; pol.=neg.; d=18 mm; r=6 mm;orient.=hor.; path=gro.; tsweep=50 ns) 184
Fig. 5-36: Time to breakdown values as a function of ice temperature, T, for acentrally located air gap (o=30 xiO"4 S/m; T=-12° C; d= 18 mm;r=6 mm; orient.=hor.) 186
Fig. 5-37: Time to breakdown as a function of ice temperature, T, for differentice surface conditions (c=30 x10"4 S/m; pol.=neg.; d= 18 mm; r=6 mm;orient.=hor.) 187
XIX
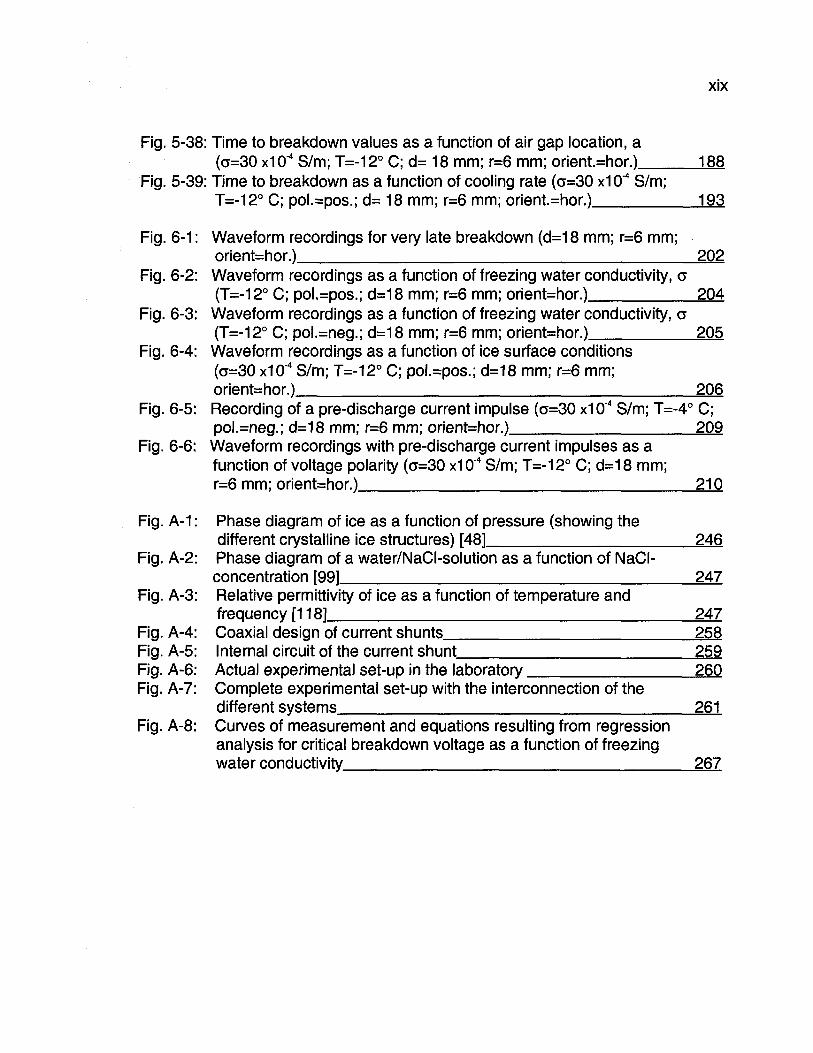
Fig. 5-38: Time to breakdown values as a function of air gap location, a(c=30 x10"4 S/m; T=-12° C; d= 18 mm; r=6 mm; orient.=hor.) 188
Fig. 5-39: Time to breakdown as a function of cooling rate (a=30 x10'4 S/m;T=-12° C; poUpos.; d= 18 mm; r=6 mm; orient.=hor.) 193
Fig. 6-1 : Waveform recordings for very late breakdown (d=18 mm; r=6 mm;orient=hor.) 202
Fig. 6-2: Waveform recordings as a function of freezing water conductivity, o(T=-12° C; poUpos.; d=18 mm; r=6 mm; orient=hor.) 204
Fig. 6-3: Waveform recordings as a function of freezing water conductivity, o(T=-12° C; pol.=neg.; d=18 mm; r=6 mm; orient=hor.) 205
Fig. 6-4: Waveform recordings as a function of ice surface conditions(CT=30 XIO"4 S/m; T=-12° C; poUpos.; d=18 mm; r=6 mm;orient=hor.) 206
Fig. 6-5: Recording of a pre-discharge current impulse (a=30 x10'4 S/m; T=-4° C;pol.=neg.; d=18 mm; r=6 mm; orient=hor.) 209
Fig. 6-6: Waveform recordings with pre-discharge current impulses as afunction of voltage polarity (a=30 x10"4 S/m; T=-12° C; d=18 mm;r=6 mm; orient=hor.) 210
Fig. A-1 : Phase diagram of ice as a function of pressure (showing thedifferent crystalline ice structures) [48] 246
Fig. A-2: Phase diagram of a water/NaCI-solution as a function of NaCI-concentration [99] 247
Fig. A-3: Relative permittivity of ice as a function of temperature andfrequency [118] 247
Fig. A-4: Coaxial design of current shunts 258Fig. A-5: Internal circuit of the current shunt 259Fig. A-6: Actual experimental set-up in the laboratory 260Fig. A-7: Complete experimental set-up with the interconnection of the
different systems 261Fig. A-8: Curves of measurement and equations resulting from regression
analysis for critical breakdown voltage as a function of freezingwater conductivity 267
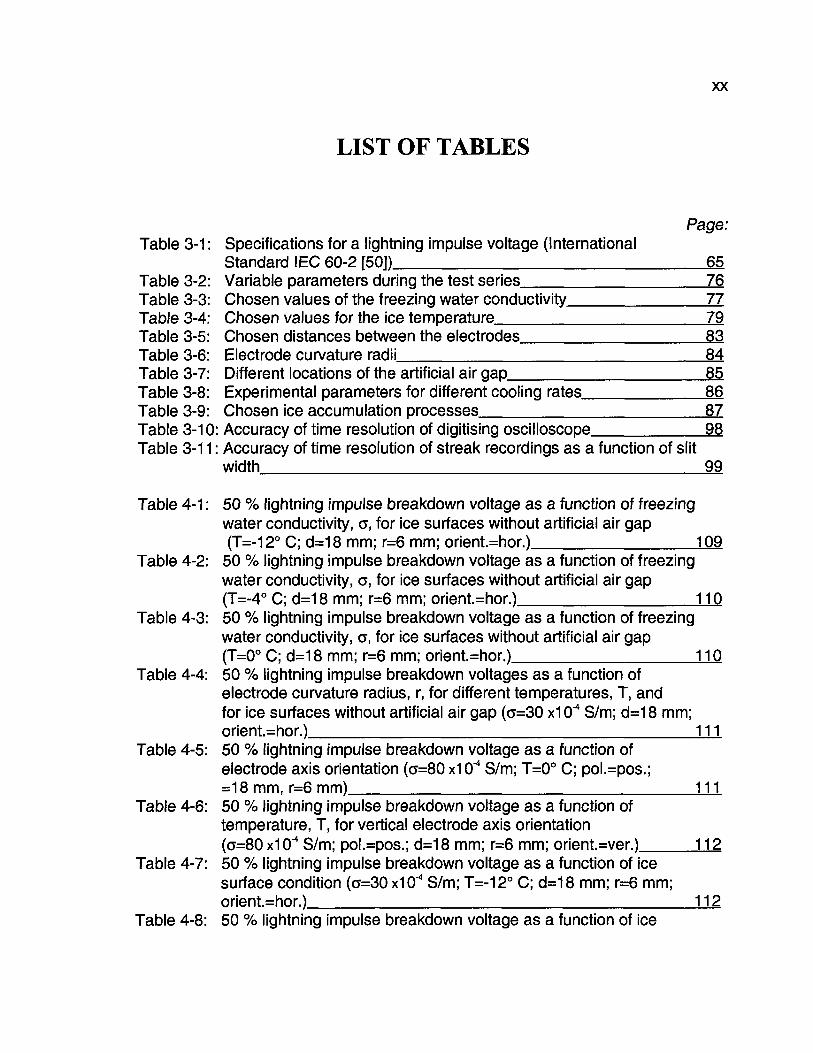
LIST OF TABLES
XX
Variable parameters during the test series.Chosen values of the freezing water conductivity.Chosen values for the ice temperature
Table 3-1 : Specifications for a lightning impulse voltage (InternationalStandard I EC 60-2 [50])
Table 3-2:Table 3-3:Table 3-4:Table 3-5:Table 3-6:Table 3-7:Table 3-8:Table 3-9:Table 3-10:Table 3-11 :
Page:
65767779
Chosen distances between the electrodes.Electrode curvature radii
8384
Different locations of the artificial air gap_ 85Experimental parameters for different cooling rates.Chosen ice accumulation processes
868798Accuracy of time resolution of digitising oscilloscope
Accuracy of time resolution of streak recordings as a function of slitwidth 99
Table 4-1: 50 % lightning impulse breakdown voltage as a function of freezingwater conductivity, a, for ice surfaces without artificial air gap(T=-12° C; d=18 mm; r=6 mm; orient.=hor.) 109
Table 4-2: 50 % lightning impulse breakdown voltage as a function of freezingwater conductivity, a, for ice surfaces without artificial air gap(T=-4° C; d=18 mm; r=6 mm; orient.=hor.) U 0
Table 4-3: 50 % lightning impulse breakdown voltage as a function of freezingwater conductivity, a, for ice surfaces without artificial air gap(T=0° C; d=18 mm; r=6 mm; orient.=hor.) U 0
Table 4-4: 50 % lightning impulse breakdown voltages as a function ofelectrode curvature radius, r, for different temperatures, T, andfor ice surfaces without artificial air gap (c=30 x10"4 S/m; d=18 mm;orient.=hor.) i l l
Table 4-5: 50 % lightning impulse breakdown voltage as a function ofelectrode axis orientation (a=80x10'4 S/m; T=0° C; pol.=pos.;=18 mm, r=6 mm) HI
Table 4-6: 50 % lightning impulse breakdown voltage as a function oftemperature, T, for vertical electrode axis orientation(G=80X10'4 S/m; pol.=pos.; d=18 mm; r=6 mm; orient.=ver.)_ 11250 % lightning impulse breakdown voltage as a function of icesurface condition (c=30x104 S/m; T=-12° C; d=18 mm; r=6 mm;orient.=hor.) 112
Table 4-7:
Table 4-8: 50 % lightning impulse breakdown voltage as a function of ice
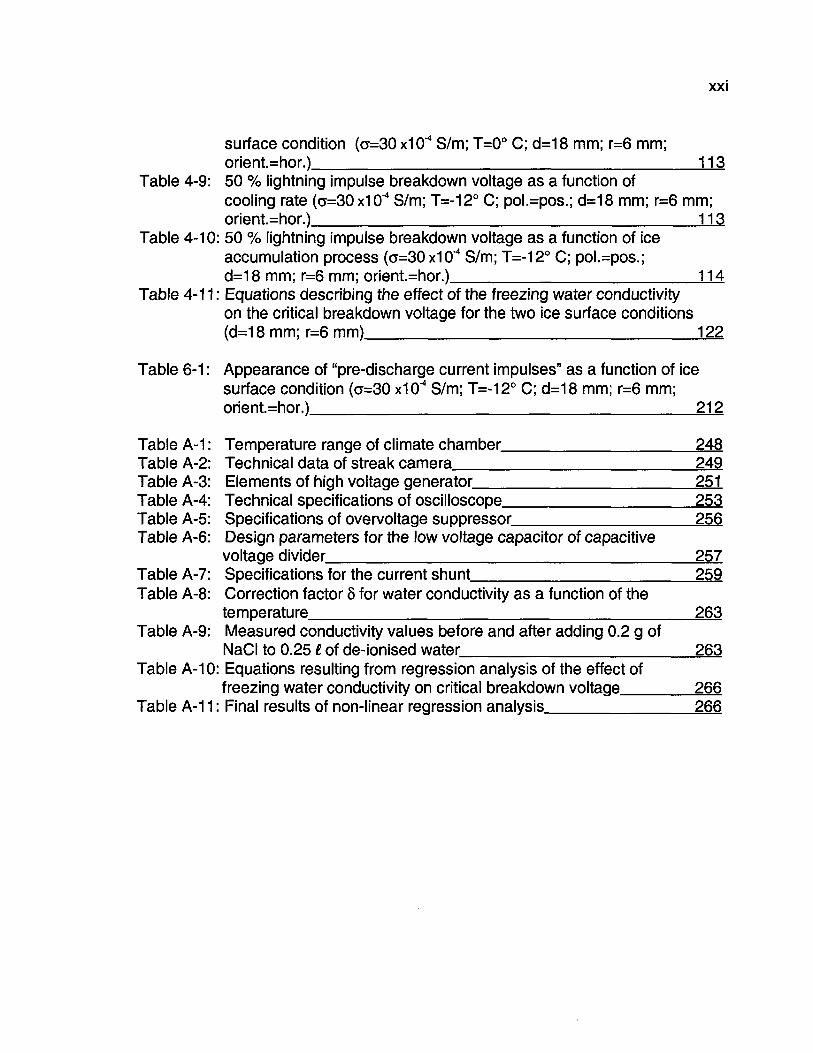
XXI
surface condition (o=30 x10'4 S/m; T=0° C; d=18 mm; r=6 mm;orient.=hor.) 113
Table 4-9: 50 % lightning impulse breakdown voltage as a function ofcooling rate (a=30x10"4 S/m; T=-12° C; pol.=pos.; d=18 mm; r=6 mm;orient.=hor.) 113
Table 4-10: 50 % lightning impulse breakdown voltage as a function of iceaccumulation process (a=30x104 S/m; T=-12° C; pol.=pos.;d=18 mm; r=6 mm; orient.=hor.) 114
Table 4-11 : Equations describing the effect of the freezing water conductivityon the critical breakdown voltage for the two ice surface conditions(d=18 mm; r=6 mm) 122
Table 6-1 : Appearance of "pre-discharge current impulses" as a function of icesurface condition (c=30 x104 S/m; T=-12° C; d=18 mm; r=6 mm;orient.=hor.) 212
Table A-1 : Temperature range of climate chamber 248Table A-2: Technical data of streak camera 249Table A-3: Elements of high voltage generator 251Table A-4: Technical specifications of oscilloscope 253Table A-5: Specifications of overvoltage suppressor 256Table A-6: Design parameters for the low voltage capacitor of capacitive
voltage divider 257Table A-7: Specifications for the current shunt 259Table A-8: Correction factor 8 for water conductivity as a function of the
temperature 263Table A-9: Measured conductivity values before and after adding 0.2 g of
NaCI to 0.25 £ of de-ionised water 263Table A-10: Equations resulting from regression analysis of the effect of
freezing water conductivity on critical breakdown voltage 266Table A-11 : Final results of non-linear regression analysis 266
XXII
LIST OF CONFERENCE CONTRIBUTIONS ARISING
FROM THIS PH.D. PROJECT
S. BRETTSCHNEIDER, M. FARZANEH, K.D. SRIVASTAVA, "Influence of Micro Air-gaps
in the Ice Surface on the Electrical Discharge Development", Proceedings of IWAIS
2000, Chester, UK, June 2000.
S.BRETTSCHNEIDER, M.FARZANEH, K.D.SRIVASTAVA, S.Y.LI , "Study of Ice Surface
Breakdown Using Ultra High-Speed Photography", Proceedings of 56th Eastern
Snow Conference, Fredericton, Canada, pp.23-30, June 1999.
M. FARZANEH, S. BRETTSCHNEIDER, K.D. SRIVASTAVA, "Study of Visible Discharge
Onset and Development on Ice Surfaces", Proceedings of IEEE International
Symposium on Electrical Insulation ISEI 2000, pp.216-221, Anaheim, USA, April
2000.
M.FARZANEH, S.BRETTSCHNEIDER, K.D.SRIVASTAVA, S.LI, "Impulse Breakdown
Performance of the Ice Surface", Proceedings of 11th International Symposium on
High-Voltage Engineering (ISH), Vol.4, pp.341-344, London, UK, August 1999.
M.FARZANEH, S.BRETTSCHNEIDER, K.D.SRIVASTAVA, S.LI, "Ultra High-Speed
Photographic Observations of Discharge Development along the Ice Surface",
Proceedings of 11th International Symposium on High-Voltage Engineering (ISH),
Vol.3, pp.297-300, London, UK, August 1999.

CHAPTER 1
INTRODUCTION
CHAPTER 1
INTRODUCTION
1.1 General Context: Problem of Flashover on Ice-covered
Insulators
Continuous supply with electric power has become one of the major
foundations of industrialised societies. Various technologies of modern life, such as
communication, transportation, heating, cooking, health care etc., rely solely on
electricity in order to work, and any outage will often cause major problems. In
most cases, the electric energy is not produced in the vicinity of consumption
(urban areas), but outside, where enough energy and space is available.
Particularly, hydroelectric power stations are often located in remote areas. Electric
energy transmission systems, using high voltage, are necessary to carry electric
power over long distances. As it is almost impossible to store large amounts of
electric energy (at least from practical and commercial viewpoints), these networks
have to be in continuous operation.
Snow and ice accretion on components of electric power networks can
obstruct their operation and lead to power failures. They can be classified roughly
in two different groups: Mechanical and electrical phenomena. A manifestation of
the second category is flashover of ice-covered insulators, which was reported
from various countries in the scientific literature (Section 1.2). The electrical
insulation capability of the insulators is drastically reduced by ice formation. The
presence of small air gaps and polluting particles in the ice may provoke the onset
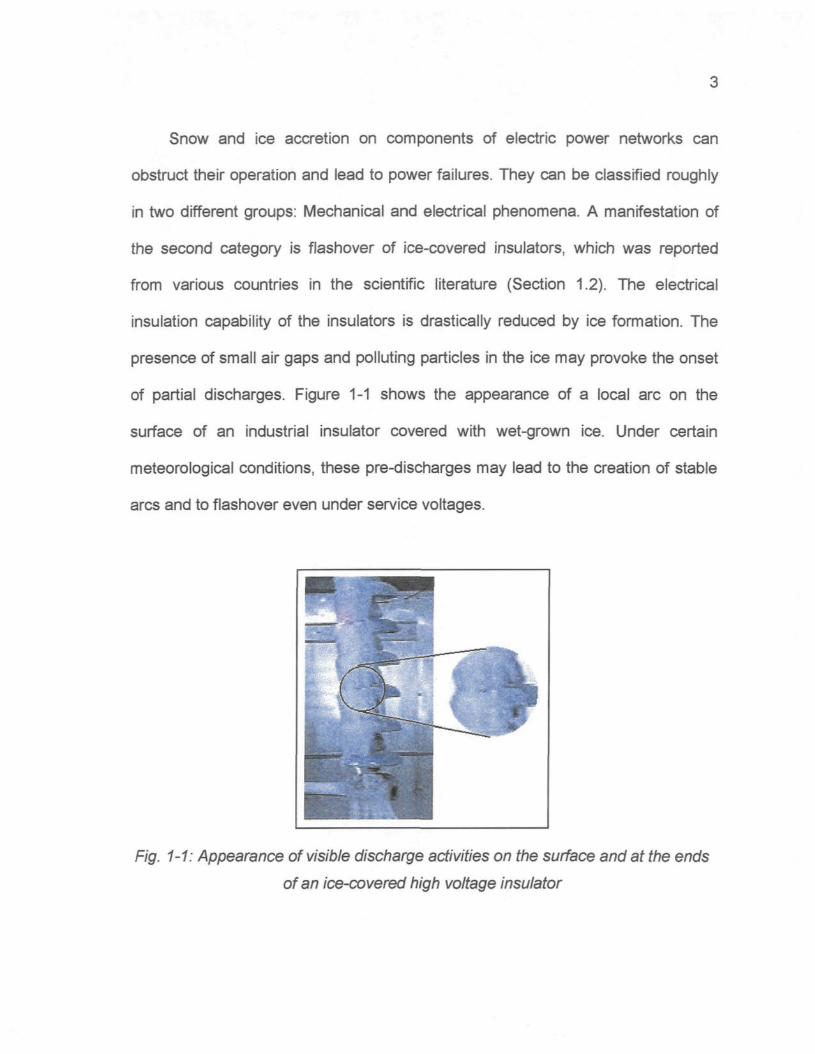
of partial discharges. Figure 1-1 shows the appearance of a local arc on the
surface of an industrial insulator covered with wet-grown ice. Under certain
meteorological conditions, these pre-discharges may lead to the creation of stable
arcs and to flashover even under service voltages.
Fig. 1-1: Appearance of visible discharge activities on the surface and at the ends
of an ice-covered high voltage insulator
Whereas, in the recent past, an important number of investigations were
carried out on the flashover performance of actual insulators under icing conditions
(Section 1.2), little research activity has been dedicated to the fundamental
processes of discharge initiation and early development along ice surfaces.
However, the understanding of the origins of ice surface discharges and their
characteristics may be beneficial for the design of new insulators, and for the
development of numerical tools to predict and prevent flashover on ice-covered
insulators. In this context, the present study was primarily carried out to contribute
to the understanding of these fundamental physical processes.
As flashover on ice-covered insulators presents the practical problem and the
motivation for the accomplishment of this Ph.D. Thesis, related research in this
field is summarised briefly in the next section. Afterwards, the objectives of this
study are listed and the methodologies to achieve these objectives are presented.
Finally, the structure of the succeeding chapters is briefly described.
1.2 State of the art in Research on Flashover Performance of Ice-
covered Insulators
The field of research on the flashover performance of ice-covered insulators
is quite young. The first investigations date back only about 30 years [55] [77].
Since then, a number of worthwhile and valuable studies on the subject were
carried out in various countries (for example [15] [25] [28] [37] [39] [53] [71] [109]
[110]). They can be divided into two groups: Field studies [15] [25] [39] [109] and
laboratory investigations [25] [28] [37] [53] [71] [109] [110]. The effects of several
parameters such as air temperature [15], type, thickness and uniformity of ice [25]
[28], nature and polarity of applied voltage [37] [71], conductivity of freezing
precipitation [25] [28] [53], as well as insulator parameters such as type, leakage
and arcing distances [53] [110] on the withstand voltage of insulators were
investigated. Reviews of most of the studies on the subject were published recently
[26] [27].
The Research Group on Atmospheric Environment Engineering (GRIEA),
attached to of the Applied Science Department at the Université du Québec à
Chicoutimi, has worked on this research field for over 25 years. One of its
objectives is to advance the knowledge on the influence of atmospheric icing on
structures, and more particularly, on overhead power transmission lines. With the
creation of the NSERC/Hydro-Québec/UQAC Chair on Atmospheric Icing Of Power
Network Equipment (CIGELE) in September 1997, the activities of GRIEA have
gained even more importance and particular attention is focused on fundamental
studies on electrical insulation performance under atmospheric icing conditions.
The studies recently undertaken and the ongoing activity aim to characterise
volume and surface conductivity of ice [24], identify flashover characteristics and
flashover mechanisms of ice surfaces [33] [36] [116], calculate electric field
distribution [35], and develop models for the prediction of the flashover
performance of insulators under icing conditions [38]. Also, the results obtained in
the framework of this Ph.D. were the subject of several conference publications
(see list at the beginning of this thesis).
Two papers are reviewed to summarise the results of the research activity on
flashover of ice-covered insulators. The first study [25] combines results from field
observations and laboratory investigations, whereas the second paper [26] reviews
laboratory investigations of the past years. The following conclusions may be
retained:
� The presence of ice on insulators provokes dramatic loss of electrical
strength, which may lead to insulator flashover and consequent power
outages under certain conditions;
� Two forms of ice accretion can be identified in the field, depending on the
amount of freezing rain precipitation: Separated icicles are observed for weak
precipitation, whereas the insulator gets totally covered by the ice if
precipitation exceeds a certain level;
� A precipitation of 40 mm of freezing rain corresponds to an artificial ice
accumulation with a radial thickness of 1 cm on a rotating monitoring cylinder;
� Wet grown ice is considered more dangerous than dry grown ice;
� Besides other factors, the amount, type, uniformity of the ice build-up, the
conductivity of freezing water, and voltage polarity are identified to have a
significant influence on the flashover voltage;
� Increasing wind velocity leads to an increase in withstand voltage due to the
more non-uniform ice distribution, as wind velocity influences the deviation
angle of icicles
� For short insulator strings (arcing distance less than 82 cm), the maximum
withstand voltage increases almost linearly with arcing distance;
� Maximum withstand voltage decreases with increasing ice thickness, but
tends to saturate for a thickness of about 3 cm;
� Increasing freezing water conductivity up to 80 x10"4 S/m decreases the
maximum withstand voltage. On the other hand, for a relatively high
conductivity level of 150 jiS/cm, discharge activities during accretion hinder
ice accumulation and increase withstand voltage;
� A wet uniform ice cover of 2 cm thickness, formed from water of about
80 uS/cm, is equivalent to an ESDD (Equivalent Salt Density Deposit) of
0,13 mg/cm2 on polluted insulators.
8
1.3 Objectives of this Research Project
To further understanding of the flashover processes on ice-covered HV
insulators, the present Ph.D. Thesis was initiated to study the fundamental physical
processes of discharge initiation, mechanisms of local arc formation and
development, as well as flashover characteristics on ice surfaces under various
surface conditions, and to provide experimental data on these processes. In
particular, the present project aimed to analyse the early stages of the very fast
visible discharge processes along the ice surface. Therefore, the experimental
method of ultra high-speed photography, which was already used in various other
research fields, was applied. The following objectives were fixed:
� Observation of development of the first nanoseconds of visible discharges on
the ice surface;
� Determination of influence of nature and polarity of applied voltage on
initiation and development of visible discharges on the ice surface;
� Determination of modes and time to breakdown of the different discharge
types on the ice surface;
� Identification of fundamental mechanisms causing the formation and
propagation of partial discharges on the ice surface.
1.4 Methodology
This study concerns principally laboratory experiments in cold chambers. A
physical model with a simplified geometry was used as actual HV insulators have a
complex structure, and they are composed of several different materials. The
model allows investigating the influence of each individual parameter separately.
Several experimental test series were carried out using different methodologies,
listed below:
� Determination of 50 % lightning impulse breakdown voltage according to IEC
507;
� Recording of visible discharge development during the first nanoseconds
using ultra high-speed photography;
� Measurement of voltage and current waveforms.
No international standards yet exist for the test of the electrical performance
of industrial ice-covered insulators. In order to perform most reliable and
repeatable tests in this context, experiments were based on the available standard
IEC 507 for polluted insulators [51] and standard IEC 60-2 for HV test techniques
[50], as adapted by researchers of UQAC [25] [26] [28].
The major tools for visual observations of the very fast processes of
discharge initiation and development are ultra high-speed cameras. These
10
apparatuses enable the observation, analysis, and understanding of motion that is
too fast for the eye to perceive. Today's technology of ultra high-speed
photography offers the possibilities to capture and visualise processes in the range
of some billionth parts of a second. Several applications in the field of electric
breakdown processes and high voltage engineering were realised in the past, for
example, breakdown in compressed gases and liquids [7] [82] [97], as well as
surface flashover on synthetic spacer surfaces [3] [86] [100] [101].
To the best of our knowledge, no applications of this experimental technique
to study the very fast discharge initiation processes on ice surfaces have yet been
reported. Therefore, this study aims to realise a technology transfer by adapting
this existing technique and applying it for the first time to the field of electrical
discharge processes on ice surfaces.
1.5 Structure of the Thesis
The literature review in the second chapter summarises some theoretical
aspects and previous publications related to the present research work. This
chapter is divided into three parts: First, a section on ice physics; second, a section
on the theory of electrical discharges; third, a review of the literature in the field of
surface discharge activity on synthetic surfaces, as well as on ice and water.
11
The experimental set-up and test procedures are described in the third
chapter. The physical model is presented and all experimental parameters are
explained. Finally, error calculations are shown to evaluate the limits of
interpretation of the results.
The experimental results are presented in Chapters four, five, and six. Each
chapter concentrates on one of the three different experimental methodologies
used, and the presentation of the results is followed by a discussion and analysis.
Chapter four presents the results and discussion on the determination of the 50 %
breakdown voltages. Chapter five deals with the study of visible discharge initiation
and development by means of ultra high-speed photography. Finally, Chapter six
shows and discusses the waveform measurements.
In Chapter seven, general conclusions are deduced from the preceding
discussions, and examples are given on how the knowledge may be applied. In
addition, some recommendations are proposed for future research.

CHAPTER 2
LITERATURE REVIEW
13
CHAPTER 2
LITERATURE REVIEW
2.1 Introduction to Chapter 2
The following chapter presents a brief overview of fundamental theories and
preceding investigations related to the present study. This research project touches
two different fields: Ice physics and electrical discharges. Therefore, data of both
research fields is summarised in the two succeeding sections. Next, previous
investigations on discharge processes along surface are summarised. In particular
discharge processes on synthetic surfaces are focused, as numerous research
work exists already in this field. Due to the fact that ice may be melted locally by
discharge activity and water may be present simultaneously, investigations
regarding discharges on ice surfaces as well as on water are reviewed.
14
2.2 Related Fundamentals on Ice Physics
2.2.1 General Characteristics of Ice under Considerations of the
Conditions in the Present Study
Water forms different solid phases in dependence of the environmental
conditions. Under normal atmospheric conditions (temperature and pressure of
natural life on earth), the water molecules are arranged in hexagonal, crystalline
structure, the so-called "ice In" [48]. There exist at least eight other possible
structures [75], but they are high-pressure polymorphs, and some of them are only
metastable (see Appendix 1). As the present investigation deals with ice at normal
atmospheric conditions, uniquely ice of the structure type "Ih" is studied.
The freezing point of a water-salt solution changes as a function of the salt
concentration (Appendix 1). As the salt concentrations are extremely low in the
present study (Appendix 10), the freezing temperature can be estimated to be
constant for all cases. Although, the freezing point is influenced by pressure [80],
but again, under the experimental conditions of the present study, this effect can
be neglected.
As this study investigates temperatures near the melting point, not only the
solid phase "ice", but also the liquid phase "water" has to be considered. Water is
15
one of the most amazing substances in nature, which exhibits several unique
physical properties. In particular, three of them may be interesting for the present
study:
� Water has a high latent heat of fusion as well as a high specific heat, so it
requires a large amount of energy to change the temperature. This also
means that it releases heat energy slowly when it is cooled from the outside
[89].
� The water molecule has an asymmetrical charge distribution. Oxygen atoms
attract electrons more strongly than hydrogen atoms [98].
� Water and ice have high values for the relative permittivity. In the case of ice,
the value is frequency dependent and the Debye theory has to be applied
[90]. Different values for the relative permittivity can be found in the literature
for the static case, for example er=77 [79] or er=74.6 [90]. For the present
case, very short voltage impulses are used, which may be interpreted as a
half-cycle of one oscillation. Therefore, the relative permittivity value is lower.
For a corresponding frequency of f=20 kHz, an approximate value for the
relative permittivity may be estimated as er=10 [48] (see also Appendix 1).
The water molecule has a quite simple atomic structure. It consists of two
hydrogen (H) atoms joined to one oxygen (O) atom by sharing electrons. This
relatively strong connection, forming the H2O molecule, is called "covalent bond".
Due to its polarised structure, there exists also an attracting force between the
16
negative part (O-atom) of one molecule to the positive part (H-atom) of another
molecule. This kind of joint is called "hydrogen bond" [98]. During the phase
change from liquid to solid, the arrangement pattern of the molecules changes
causing volume expansion [89]. In water, the weak hydrogen bonds are constantly
formed and broken up so that each molecule is bonded to approximately 3.4 other
water molecules [98]. In ice (under ideal conditions without pollution), each
molecule is bonded to 4 other molecules. Thereby, each molecule donates and
accepts two hydrogen bonds. The orientation of the adjacent water molecules is
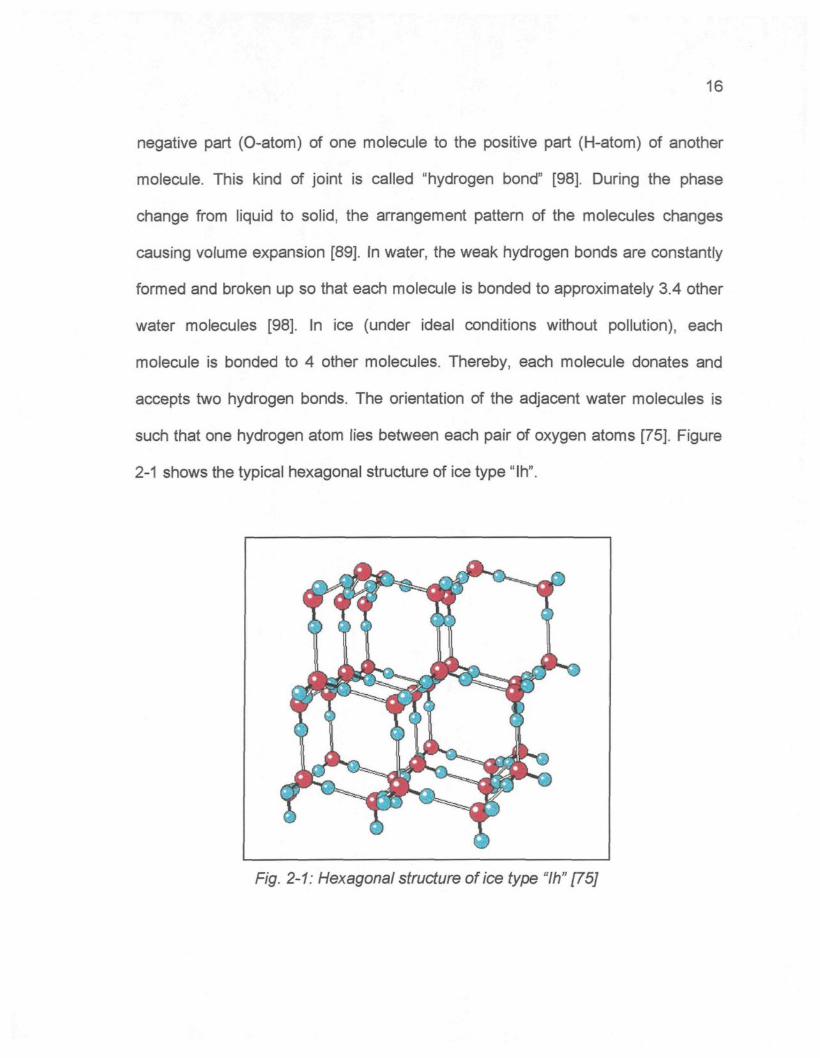
such that one hydrogen atom lies between each pair of oxygen atoms [75]. Figure
2-1 shows the typical hexagonal structure of ice type "In".
Fig. 2-1: Hexagonal structure of ice type "ih" [75]
17
2.2.2 Electrical Conductivity of Ice
For a perfect single ice crystal (homogenous crystalline structure without any
pollution), the number of free electrons is negligible and the only mechanism of
electrical conduction under a dc field is "proton jump" [47] [90]. The impurities play
a major role for electrical conduction. Also, polarisation effects at external and
internal surfaces (cracks, bubbles in the latter case) contribute to the true
conductivity of ice. Furthermore, it was reported that the dc conductivity of ice
samples depends very significantly on the time period between sample preparation
and the experiment due to ageing effects. [94].
For an alternating field, additional phenomena can occur [90]. Whereas ice
has no permanent electric dipole moment, it is readily polarised (shifts in the
electron cloud distribution and by proton jumps). The same electric energy is
dissipated in reversing of induced dipole moment. This dissipative effect, called
dielectric absorption, gives rise to an effective electrical conductivity, ae, which is
much larger than the dc conductivity of pure ice.
Conductivity measurements showed that pure ice may be classified as a
semiconductor due to its specific conductivity of a=10'8...10'9 S/cm [90]. It was
revealed that the conductivity of ice made from de-ionised water is roughly
18
independent of temperature between -20° C and -0.1° C, whereas the conductivity
of tap water ice increases with temperature by a factor of ten within this range.
Most of the increase appears between -5° C and -0.1° C [11]. Measurements on
ice samples formed from ice with controlled conductivity (c=80 x10"4 S/m and
CT=160 x10"4 S/m) showed that the surface conductivity is about 1 x10"6 S for air
temperatures below 0° C [24]. As the temperature rises above 0° C, surface
conductivity increases rapidly, which can be explained by the formation of a liquid
water film on the ice surface. As the water covers the surface uniformly,
conductivity value tends to saturation. A maximum value of about 5 x10'6 S was
reached for ordinary frozen ice formed with freezing water of 160 x10'4 S/m.
Regarding the atmospheric ice accretions on actual HV insulators, it was shown
that the conductivity of the melted surface layer of the ice build-up exceeds the
value of the freezing water clearly [34]. Particularly, the underside of the insulators
and icicles exhibited values exceeding the freezing water conductivity by more than
factor two. This was explained by the process of wet ice accretion on the
insulators, where impurities diffuse to the surface before the water freezes (see
Section 2.2.3).
In the case of polluted ice, the electric conduction in the water film on the ice
surface is mainly based on proton diffusion, as protons are much smaller and
lighter than any other atom or molecule [73]. In the case of water, different
hypotheses exist at this moment on the proton diffusion process arguing either with
19
the creation of "Eigen-cations" H9O4+ or "Zundel-cations" H5O2
+ as the single water
proton H+ connects to surrounding water molecules or a combination of these
different states. Hereby, a continuous creation and rupture of these cations take
place transferring the structural defect from one proton to another, whereas the
protons themselves barely move. Thus, proton diffusion can take place much faster
as migration of any other ions (for example salt ions Na+ and CI"), which move
randomly through the water solution towards the opposite electrode. Inside the ice,
conduction is uniquely based on proton diffusion, as ions are fixed in the crystalline
structure of the ice [99].
2.2.3 Ice Surface Characteristics
It was reported already several years ago that ice seems to be a member of
the small family of solids, which may exhibit anomalous surface properties in the
sense that a quasi-liquid transition layer exists on at least some crystal faces at
temperatures somewhat below the melting point [40]. A phase change of the ice
surface to quasi-liquid state is observed at a temperature a few degrees below the
melting point. The temperature ranges from -6° C to -3° C. This estimated
temperature appears to agree with the critical temperature in the measurements of
the surface conductivity of ice, where a large increase in surface conductivity is
observed for temperatures above T=-4° C [24]. Another study on the surface and
volume conductivity of a single ice crystal [69] showed also that the value of
20
surface conductivity increases rapidly as the temperature is raised. A threshold
value was defined, where the surface conduction becomes more dominant than the
volume conduction ranging between -35° C < T < -10° C. An investigation on the
surface conductivity of ice samples formed under various freezing conditions
revealed that the ice bulk conductivity is very low compared to the surface
conductivity in the range of ambient air temperatures between -12° C and -8° C
[24]. Therefore, two different temperature characteristics are suggested for the
regions below and above the threshold temperature [40].
Recent investigations show that a very thin quasi-liquid layer is present on the
ice surface even for very low temperature [64] [74] [75] [112]. This layer is quite
small at lower temperature, extending over just a few molecular layers for a
temperature T=-10° C, and it becomes thicker with increasing temperature [64].
Detailed molecular-scale pictures of the ice surface at temperatures as low as
90 K, obtained by low-energy electron diffraction, showed that water molecules are
bound in a lattice, but these are not frozen like those in the layers beneath them
[112]. Thus, greater molecular mobility exists in the ice surface than in the
crystalline bulk. The ice can be seen as composed of three parts, a core region of
bulk ice, surrounded by a surface and a subsurface region, which can all be
distinguished by their vibrational spectra [75]. The high degree of vibrational motion
by the water molecules in the surface layer is attributed to the absence of other
molecules above them resulting in unsatisfied bond. The existing bonds between
21
the atoms are weakened, which gives rise to liquid-like vibrational motion and frees
molecules to interact with other particles [112]. Above a certain temperature, this
enhanced motion leads to a state of high energy ("high density phonon bath") and
a separation of individual molecules from their original sites. This phonon-bath
enables a high rate of accommodation of molecules and an easy energy transfer
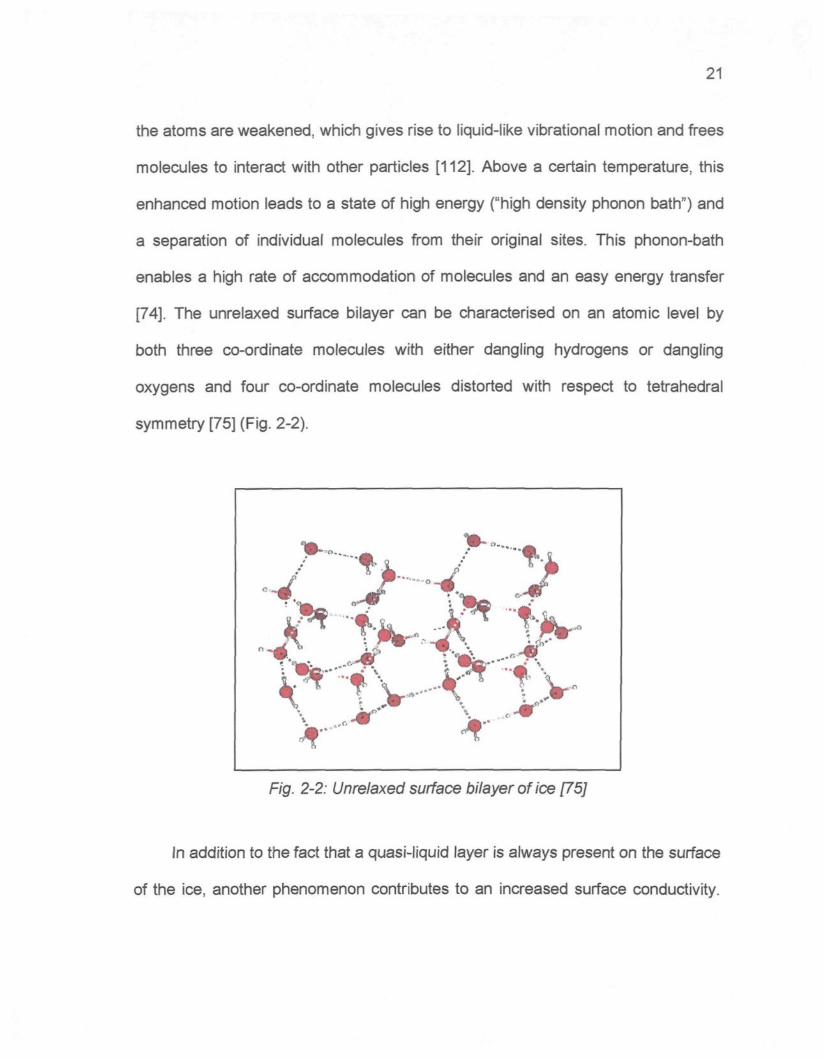
[74]. The unrelaxed surface bilayer can be characterised on an atomic level by
both three co-ordinate molecules with either dangling hydrogens or dangling
oxygens and four co-ordinate molecules distorted with respect to tetrahedral
symmetry [75] (Fig. 2-2).
F/g. 2-2; Unrelaxed surface bilayer of ice [75]
In addition to the fact that a quasi-liquid layer is always present on the surface
of the ice, another phenomenon contributes to an increased surface conductivity.
22
Due to the fact that the potential energy of the crystal lattice varies inversely with
the number of dislocations, foreign molecules are excluded at the liquid-solid
interface during the ice formation [11]. When a water-salt solution is cooled down,
first pure water freezes and forms an ice crystal, while salt ions diffuse into the
liquid phase resulting in higher concentration of ions and thus higher electric
conductivity of the surface layer [99]. Measurements on actual HV insulators
confirmed that the conductivity of the melted surface layer exceeds significantly the
conductivity of the freezing water that was used initially to form the ice [11] [34]
[53].
2.2.4 Charge Storage in Ice
Several investigations of charging and charge storage in ice have been
reported in the literature. Three processes were identified, which may lead to
charge storage in ice [48]:
� By cooling ice crystals in an electric field (ice electrets);
� Through phenomena that appear to be ferroelectric in nature;
� During the growth of ice from solutions (Workman-Reynolds-effect).
An ice electret exhibits a permanent electric dipole moment, which gives rise
to an external electric field [48]. Under the influence of an electric field, negative
surface charges can be observed on the surface, which were originally adjacent to
23
the positive electrode (so-called "heterocharges"). These charges disappear within
a few days. A spontaneously generated polarisation in the opposite direction
occurs (so-called "homocharges"). The maximum value is reached in a few more
days and remains unchanged for years. If the original electric field is less than a
certain critical value, then no homocharges are observed for Camuaba wax.
A gradient of ionic concentration is set up in ice subjected to a temperature
gradient due to more rapid diffusion of positive hydrogen ions [78]. Hereby, the
cold end becomes positively charged and the warm end negatively. If two grains
with different temperatures are brought into temporary contact, the warmer one
becomes negatively charged and the colder one positively charged. Maximum
charge separation occurs for a contact time of 10'2 sec, and the charge declines
with more prolonged contact.
As an ice crystal was cooled down to -196° C and an electric field was
applied at this temperature for several minutes, an electric current was released
during the reheating [21]. In another experiment, ice discs were cooled down to -
196° C while voltage was applied [44]. First heterocharges and, after three to eight
days, homocharges were observed. While a voltage was applied to ice discs at -
70° C, the charging current decreased with time of voltage application and it
reached a constant value within six minutes [17]. Also, the discharge current in
reverse direction, which could be observed after the end of voltage application,
24
decreased with time. Thereby, no difference could be observed between single
crystals and polycrystalline ice samples.
The existence of an electric potential at the boundary between the ice and
liquid water was demonstrated by measuring the electric surface potential with a
vibrating surface electrometer, as the ice samples were heated [104]. The electric
potential increased sharply to negative values when the temperature of the ice
surface reached 0° C. The negative electric potential of the liquid water occurred
not only near 0° C, but when the air temperature was -13° C and -20° C. When
the heating was stopped, the negative potentials returned to their original small
magnitudes. A possible explanation for the charge separation at the boundary
between the ice and water could be a higher concentration of H+ and OH' ions in
water than in ice and the relative high mobility of H+ ions in ice.
Several experiments were carried out using the method of rubbing two ice
rods against each in order to provoke a charge separation. When two pieces of ice
of different temperature were rubbed together, the colder piece received positive
charges [91] [114]. For asymmetrical rubbing of two ice rods, it could be observed
that for temperatures below -10° C, the warmer ice rod was initially charged
negatively, but it becomes positively charged for continued rubbing [70]. Above
-5° C, the warmer ice rod was charged positively from the beginning of rubbing.
Another investigation measured the surface electric potential of single crystals of
25
ice from the Mendenhall glacier, which were rubbed with another single crystal or
with a plane [105]. The electric potential of the ice surface became increasingly
negative as the rubbing frequency was increased, but it reached a steady value of
about -200 mV after several rubbings. When the rubbing was stopped, the electric
potential of remained constant for a temperature T=-16° C, but it decreased
exponentially for increasing temperatures between -6° C and -3° C. In a second
test, a negative electric potential of -40 mV appeared, when the ice surface was
rubbed twenty times with ice cut from the same single crystal. After fifty more
rubbings, it increased to -75 mV, and then to -105 mV with an additional fifty
rubbings. The surface electric potential decreased gradually after the rubbing was
stopped and reached an equilibrium value. The negative potential of the surface
returned to its original value when the ice surface as melted.
To the best knowledge of the author, no experimental data on charge
accumulation and its measurement on the surface of ice are available. The studies
discussed in this section report charge generation in the ice bulk. The experimental
conditions of most of the investigations cited (for example very low temperatures
[21] [44] [17] and the processes to create the charges (for example rubbing of two
ice crystals [70] [91] [104] [114]) are very different from the conditions of the
present study. Little quantitative data could be found, in most cases only a
phenomenological description of the charging process was given. However, it may
26
be supposed, under consideration of these previous investigations, that charges
may be accumulated in the ice bulk as well as on the ice surface.
In contrast with the lack of knowledge on charge accumulation on ice
surfaces, several studies were reported concerning similar processes on the
surface of synthetic materials, which will be discussed in Section 2.4.1. Even
though the data obtained on these investigations may be used for comparative
analysis with the processes on ice surfaces, it has to be considered that processes
of creation and accumulation of charges may be different in the case of ice, due to
the particular characteristics of the ice surface. In particular, for higher conductivity
and higher temperature values, no charge accumulation can be expected, as any
charge on the quasi-liquid surface will be immediately conducted towards the
electrodes.
2.2.5 influence of Electric Field on Ice Formation
The visual appearance of an atmospheric ice accretion changes clearly if an
electric field is present during ice formation [32]. Under the experimental conditions
of this study, ice accretion showed only small protuberances in the absence of an
electric field, whereas in the presence of electric fields higher than 10 x105 V/m, ice
surface protuberances grow once a uniform ice layer of a few millimetres has
formed on the cylinder. For positive dc field of +15 x105 V/m, ice trees and side-
27
branches look more numerous and thinner than those grown in an ac field. Under
negative voltage polarity, the trunks of the ice feathers are even thinner than those
observed in ac and dc+, but thickness of the accreted ice is limited to that of
uniform ice preceding ice treeing for higher field strength (-20 x105 V/m). The
weight of the ice deposit for a given accumulation time first increases with field
strength up to 10 x105 V/m, whereas it decreases sharply with higher field
strengths. It becomes almost negligible under negative fields above -15 x105 V/m.
Mean ice density decreases from 0.77-0.85 g/cm3 at 5 x10⁵ V/m to about 0.2-0.3
g/cm3 at 10x10s V/m [32],
The presence of an electric field influences also the growth of icicles as the
water drop hanging from the tip of the icicle is deformed and elongated under
enhanced field strength [31]. On the one hand, cooling effects are produced by
decrease in drop diameter and increase in ionic wind, whereas, heating effects are
created on the other hand by the conduction current. Evidence of the cooling effect
is shown under dc+ and ac, where ionic wind is the strongest, but the effect is less
important than the heat released by the conduction current.
The ice morphology exhibits different patterns as a function of the electric
field applied during ice formation. Large air-bubbles appear in the presence of a
negative voltage stress elongated in the direction of the field [59]. In another
investigation, two distinct types of bubbles were identified [30]. The first type,
28
observed only under dc- and ac, corresponds to large cavities, over 1 mm in size,
which are located away from the insulator surface. The second type, observed in
all samples, corresponds to spherical bubbles less than 200 jj.m in diameter,
arranged in layers parallel to the surface of the insulator. The spherical bubbles
observed in all samples are found in greater number in dc- than in non-energised
conditions. This could simply be attributed to the different locations of the ice cut.
The crystalline texture of ice grown under ac and non-energised conditions is
similar to that under dc- and dc+. In all these samples, ice grains are equiaxial with
about the same mean diameter: 0.6 mm for dc-, 0.5 mm for dc+ and without
applied voltage and 0.4 mm for ac. These differences may be attributed to the
stronger ionisation intensity and stronger deformation of water droplets under a
negative electric field [87].
An application of neutron diffraction showed that the general hexagonal
structure of ice molecules does not change under the presence of an electric field,
but the distances in the crystalline structure (distance between two oxygen atoms)
increases slightly in presence of an positive field, whereas it decreases in presence
of an negative field [9]. Nevertheless, this change in the range of 10"3 under the
chosen experimental conditions seems too small to explain the different
phenomena observed.
29
The influence of an electric field on the freezing process of water was also
studied [93]. It was shown that under the influence of an electric field, the drops
freeze at a temperature nearer 0° C than without the field and that the freezing
process happens faster as the intensity of the electric field increases. Thereby, the
formation of the ice crystals does not appear to depend on the polarity of the high
voltage.
2.3. Related Fundamentals on Electrical Discharges
2.3.1 Generation of Charges
Protons, ions with either polarity or free electrons constitute charge carriers.
In most cases, free electrons play a much more important role as sources of an
electric current due to their weaker mass, thus higher mobility. Several processes
exist for the generation of free electrons, which can be divided into two groups:
Emission and ionisation. Emission is the liberation of electrons out of the surface of
the solid electrodes. This can take place by different processes:
� Emission by electron impact
� Photoemission
� Thermal emission
� Electric field emission
30
Ionisation is the phenomenon, in which free electrons are created inside the
gaseous volume. Again, this can happen by different processes:
� Ionisation by impact
� Photoionisation
� Thermal ionisation
More details on these processes can be found in the literature (for example
[8] [67] [76] [83]).
After their creation, free electrons may be captured by previously excited
atoms inside the gaseous space, and thus, negatively charged ions will be created.
As these ions are much less mobile than the previous electrons, they will create
relatively static space charges. On the other hand, molecules that have lost an
electron will form positive ionic charges.
2.3.2 Different Types of Electrical Discharges
Before the conditions for breakdown are established, stable partial discharges
may appear. They are limited to a certain space where the electric field strength is
high enough to sustain sufficient ionisation processes. The space charge created
by recompensation of free electrons limits and may stop temporarily the
propagation of the discharge processes. If the applied voltage is further increased
to a sufficient value, a zone of ionisation is created, bridging the whole distance
between the electrodes. Then, breakdown can take place. One of the visual
31
aspects of the partial discharges before breakdown is a weak light emission,
sometimes in the form of a bluish glow, which forms a circle around any asperity.
Thus, the term "corona discharges" was created to describe the partial discharges.
It is important to distinguish the threshold voltage for initiation of partial
discharges and the critical breakdown voltage. Normally, the latter is higher and is
influenced by different parameters. Nevertheless, for very short distances
breakdown may occur before the appearance of any partial discharge activity (see
Section 2.3.3 [67] [100] [101]. In the general case of metallic electrodes in air, the
threshold value for partial discharges is lower for negative voltage polarity,
whereas the critical breakdown value is lower for positive polarity [4].
Discharges are basically of two types, Townsend, and streamer discharges. A
short explanation of both types is given below.
2.3.2.1 Townsend Process
If the number of charged particles is lower than 108, field distortion by space
charges can still be neglected [8]. The discharge mechanism in this case is the
Townsend process.
32
The first Townsend coefficient, a, is a local function of the electric field E(x),
which may be variable along distance x. It depends also on gas type and pressure,
and can be determined by equation e2-1. The constants A and B depend
themselves on pressure, type of gas, and ratio E/p.
92-1
p
In the case of a uniform field, we have N free electrons after equation e2-2:
N = ecul e2-2
The spark criterion proposed by Townsend consists in the assumption that
the discharge takes place when the current tends to infinity. For uniform field
conditions, equation e2-3 can be established:
ad = k = In� e2-3
In uniform field conditions, Townsend discharge occurs for k in a range of 7 to
9 [58]. Paschen-curves show the influence of pressure and electrode distance.
2.3.2.2 Streamer Process
If an electron avalanche consists of more than 108 electrons, a space charge
will be created by the positive ions left behind [8] provoking a distortion of the
electric field in front and behind the avalanche (Fig. 2-3). The increased electric
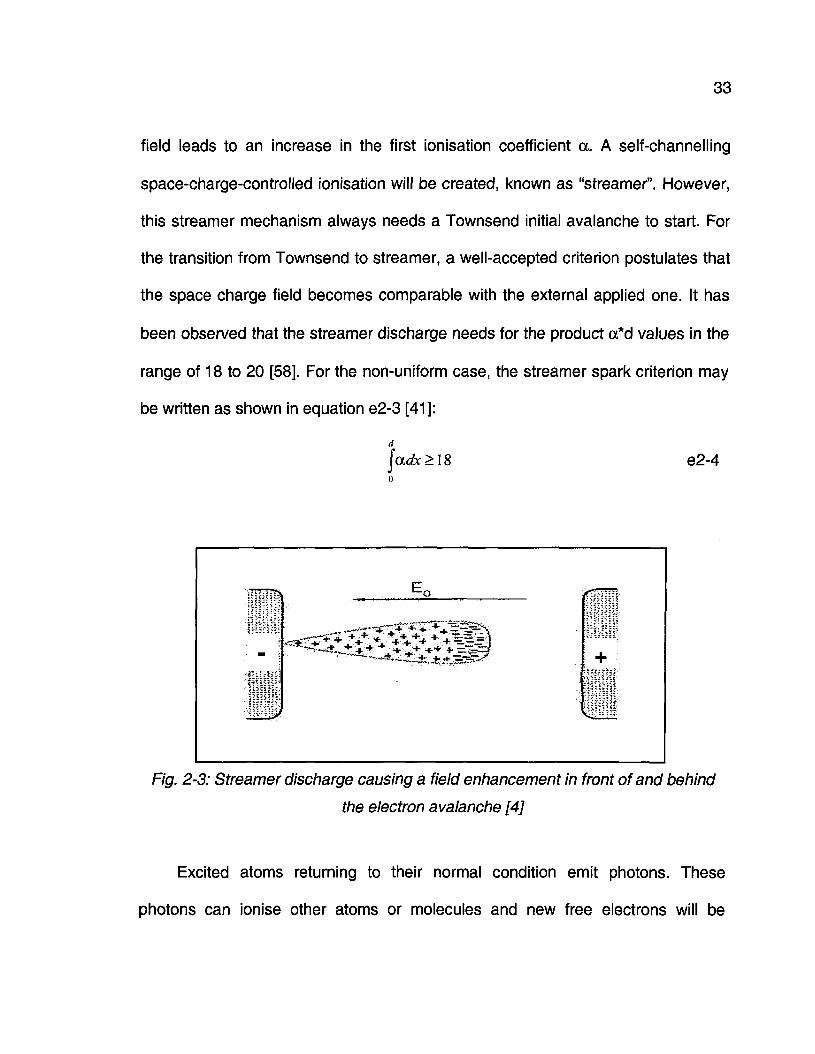
33
field leads to an increase in the first ionisation coefficient a. A self-channelling
space-charge-controlled ionisation will be created, known as "streamer". However,
this streamer mechanism always needs a Townsend initial avalanche to start. For
the transition from Townsend to streamer, a well-accepted criterion postulates that
the space charge field becomes comparable with the external applied one. It has
been observed that the streamer discharge needs for the product a*d values in the
range of 18 to 20 [58]. For the non-uniform case, the streamer spark criterion may
be written as shown in equation e2-3 [41]:
a
jadx>l8 e2-4
- i
E° (
**~ *- JL - i + ~z££Zyi'
\
+
illii
Fig. 2-3: Streamer discharge causing a field enhancement in front of and behind
the electron avalanche [4]
Excited atoms returning to their normal condition emit photons. These
photons can ionise other atoms or molecules and new free electrons will be
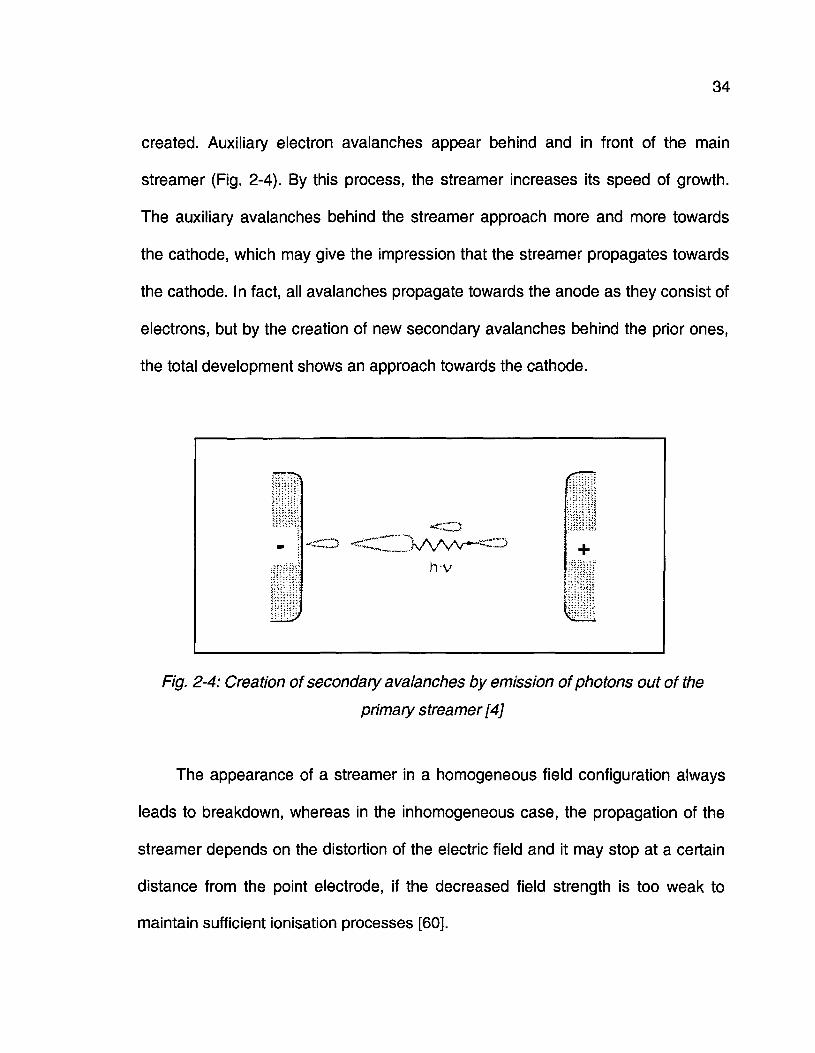
34
created. Auxiliary electron avalanches appear behind and in front of the main
streamer (Fig. 2-4). By this process, the streamer increases its speed of growth.
The auxiliary avalanches behind the streamer approach more and more towards
the cathode, which may give the impression that the streamer propagates towards
the cathode. In fact, all avalanches propagate towards the anode as they consist of
electrons, but by the creation of new secondary avalanches behind the prior ones,
the total development shows an approach towards the cathode.
Fig. 2-4: Creation of secondary avalanches by emission of photons out of the
primary streamer [4]
The appearance of a streamer in a homogeneous field configuration always
leads to breakdown, whereas in the inhomogeneous case, the propagation of the
streamer depends on the distortion of the electric field and it may stop at a certain
distance from the point electrode, if the decreased field strength is too weak to
maintain sufficient ionisation processes [60].
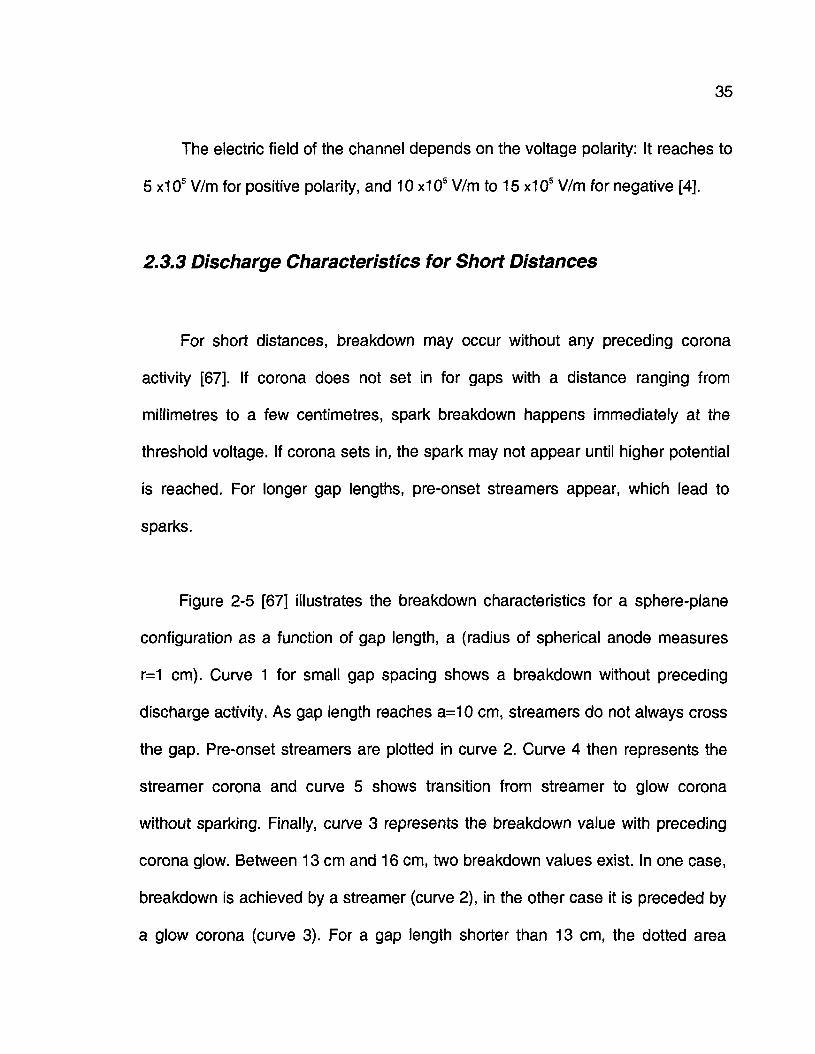
35
The electric field of the channel depends on the voltage polarity: It reaches to
5 x10s V/m for positive polarity, and 10 x105 V/m to 15 x105 V/m for negative [4].
2.3.3 Discharge Characteristics for Short Distances
For short distances, breakdown may occur without any preceding corona
activity [67]. If corona does not set in for gaps with a distance ranging from
millimetres to a few centimetres, spark breakdown happens immediately at the
threshold voltage. If corona sets in, the spark may not appear until higher potential
is reached. For longer gap lengths, pre-onset streamers appear, which lead to
sparks.
Figure 2-5 [67] illustrates the breakdown characteristics for a sphere-plane
configuration as a function of gap length, a (radius of spherical anode measures
r=1 cm). Curve 1 for small gap spacing shows a breakdown without preceding
discharge activity. As gap length reaches a=10 cm, streamers do not always cross
the gap. Pre-onset streamers are plotted in curve 2. Curve 4 then represents the
streamer corona and curve 5 shows transition from streamer to glow corona
without sparking. Finally, curve 3 represents the breakdown value with preceding
corona glow. Between 13 cm and 16 cm, two breakdown values exist. In one case,
breakdown is achieved by a streamer (curve 2), in the other case it is preceded by
a glow corona (curve 3). For a gap length shorter than 13 cm, the dotted area
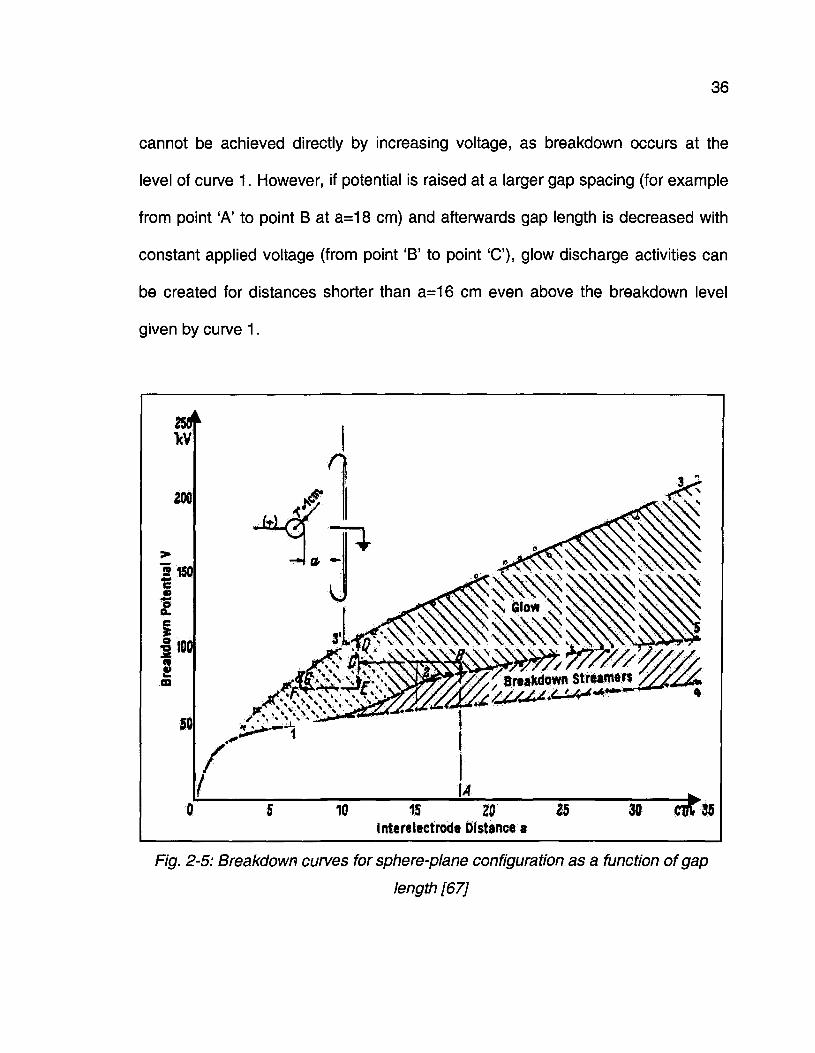
36
cannot be achieved directly by increasing voltage, as breakdown occurs at the
level of curve 1. However, if potential is raised at a larger gap spacing (for example
from point 'A' to point B at a=18 cm) and afterwards gap length is decreased with
constant applied voltage (from point 'B' to point 'C'), glow discharge activities can
be created for distances shorter than a=16 cm even above the breakdown level
given by curve 1.
15 20Interelectrode Distance a
25
Fig. 2-5: Breakdown curves for sphere-plane configuration as a function of gap
length [67]
37
2.4 Surface Discharges
2.4.1 Discharge Activity on Synthetic Surfaces
Research on surface discharges was mainly motivated in the recent past by
problems of surface discharges and breakdown in gas insulated substations and
transmission lines (GIS and GITL). Whereas the materials used (for example,
Teflon, ceramics etc.) have excellent insulation properties, partial discharge activity
and breakdown happen at surprisingly low voltage levels inside the enclosed
systems. Investigations are directed towards the surface of the insulators, as
various tests in the past clearly indicated that dynamic interaction between the
spacer surface and the surrounding gas volume determines the breakdown
characteristics [103]. As these enclosed systems do work in vacuum [2] [18] [19]
[81] [103] or with electronegative gases (SF6, N2) [86] [97] [107] [113], several
aspects of the discharge phenomena may differ from the case of the present study.
Also, very fast transient overvoltage (VFT) stress plays an important role for such
systems, therefore, some studies work with such voltage types [86] [97] [107].
However, the scientific findings in this research field may help to identify and
explain the processes in the domain of ice surface discharges. Therefore, it seems
pertinent to review some results of this field.
38
2.4.1.1 Mechanism of Surface Charge Accumulation and
Discharge Initiation
Surface charge measurements in the past [14] [52] [117] showed that
surfaces of synthetic insulators get charged when subjected to high voltage. First, it
can be stated that an ideal surface does not exist in practice, especially when
industrial production processes also have to satisfy economical considerations.
There always exist microscopic scratches and voids due to machining processes.
These non-uniformities may create local field enhancements leading to partial
discharge initiation. The charges created are likely to be captured on the surface.
Furthermore, contamination of the surface cannot be avoided totally (for example
by absorption) [2], which may also play an important role for surface charging.
The first question to clarify for the elaboration of a theory on the surface
charge accumulation may be on the origin of free charges. In the case of vacuum,
different authors identified the metallic electrode - insulator - gas triple junction as
source of free electrons [2] [63] [81]. For discharge processes along a gas-surface
interface, relatively few significant studies exist on the early stages of discharge
development [61]. Ionisation processes in the gaseous space next to the surface
may provide the free electrons. Photoemission from the surface has also been
mentioned previously [115].
39
Different processes have been proposed for the accumulation of surface
charges in the case of vacuum [2]. Positive ions on the surface may be created
when impinging free electrons dislodge other electrons from absorbed atoms or
molecules (e2-5). If a free electron has sufficient energy it may even dissociate the
molecule into smaller fractions (e2-6 and e2-7).
AB + e" ==> A+B + 2e" e2-5
A+B ==> A+ + B e2-6
A+B ==> A + B+ e2-7
Negative surface charges may be created when free electrons get trapped
again at the surface. At low energy level, electrons may be trapped by positive
ions (e2-8). As the accumulated energy of the electrons increases, they may also
become trapped by neutral atoms or molecules (e2-9). At even higher voltages,
already negatively charged particles may be charged further (e2-10).
A+ + e ==> A e2-8
A + e" ==> A' e2-9
A' +e ==> A2- e2-10
The surface charge clusters of different polarities distort the electric field of
the applied voltage. Strong electric fields may be created locally. If critical field
strength is surpassed, trapped electrons in the negative charge regions may be
liberated again and may be accelerated along the surface. These electrons then
usually multiply as they travel along the insulator surface, either as a surface
secondary electron emission avalanche, or as an electron cascade in a thin
40
surface layer [81]. Thus, avalanches are created and are accelerated towards the
anode, leading to breakdown.
2.4.1.2 Main Characteristics of Discharges on Synthetic Surfaces
Two reviews on the mechanisms of surface breakdown along solid dielectrics
in vacuum summarise the research in this field [81] [103]. The first publication [103]
discusses the different breakdown models existing at this moment, as well as some
experimental results. It was stated that breakdown processes on insulator surfaces
are affected predominantly by external factors like metallic particle contamination,
surface defects, triple-junction interface, etc. Material properties such as
permittivity are found to have less influence. However, at this stage of research, no
investigations on other intrinsic material properties were reported. Various studies
on practical design of GIS-systems were discussed in order to find insulator
shapes and electrode configurations with uniform field distribution, and to eliminate
high-stress regions. Surface charge measurements were limited, at that time, to
electrostatic measurements without applied voltage. It was shown that charging is
bipolar and that charge distribution strongly depends on triple-junction geometry,
surface smoothness, surface field, and duration of applied voltage. Furthermore,
the presence of a conducting particle increases the amount of surface charge.
41
The effects of several parameters on the surface breakdown processes in
vacuum were described in the second review [81]:
� Influence of applied voltage:
In general, short pulses in the range of nanoseconds have the highest
breakdown voltage, pulses in the range of microseconds or dc voltage have
intermediate breakdown voltages, while ac voltages give lowest results.
� Influence of insulator shape:
The exact shape of an insulator can have a strong effect upon its surface
breakdown. The simplest shape, a cylinder, tends to have lower holdoff
voltages than more complex shapes. In general, cones with an angle of +45°
have the highest breakdown voltage. It appears that -45° cones perform
about as well as +45° for insulators of organic materials, but are only slightly
better than 0° cones (cylinders) for glass. The poorest insulator performance
seems to be for cones with slight negative angles. In many cases, the
simplicity of cylindrical insulators outweighs the improved performance of
insulators with more complex geometry. The use of metal inserts in insulators,
or recessing the insulator ends into the electrodes, can significantly improve
the insulator's performance.
� Influence of material:
The material of the insulator has a great effect on its performance. In general,
homogenous materials are preferred to inhomogeneous, especially poor are
42
materials of fibrous construction. There is an inverse relation between the
relative permittivity, e, of a material and its breakdown voltage.
� Influence of surface condition:
A surface breakdown can damage the surface of an insulator. This damage
can be severe enough to lower subsequent breakdown voltages significantly.
An insulator material strongly resistant to damage may be preferred to one
with a higher surface breakdown voltage. It is generally desirable to clean the
surface of an insulator to remove possible contaminants. Bakeouts of the
assembled system are generally desirable if the insulator can tolerate the
necessary temperatures. Both processes could remove contaminants from
accumulating on the surface.
� Influence of temperature:
In general, surface breakdown voltage of insulators tends to decrease as the
temperature increases.
A previous study on the surface breakdown processes of solid insulators
[100] [101] used experimental conditions quite similar to the parameters chosen in
the present study. Lightning impulse voltages of both polarities were used,
experiments were carried out under atmospheric air pressure. The electrode
configuration was different from the physical model of this study, but the range of
electrode distances covers the values chosen in the present case. Determination of
50 % breakdown voltage, as well as optical ultra high-speed observation were
43
carried out, which may yield interesting data to compare with the results of this
study. The surface discharges and breakdown phenomena were investigated on
acrylic plates, 1 to 10 mm thick, under positive [100] and negative [101] impulse
voltages. The 50 % breakdown voltage, U50, and 50 % corona inception voltage
were measured, and observations of visible phenomena were carried out using an
image converter camera, which was able to record streak as well as framing
images. The following list summarises the results:
� The characteristics of the 50 % breakdown voltage as a function of distance
consists of three regions, i.e. A, B and C. For regions A and C, equations can
be given to describe these characteristics.
� The discharge processes are different in the different regions, and they
depend on the voltage polarity.
� Region A:
- Negative polarity: A highly conductive negative leader with a negative
streamer at the tip of its channel appears, which plays an important role in
the breakdown process.
- Positive polarity: A positive leader with intermittent leader coronas
appears, which lead to breakdown, as seen in point-to-plane air gaps
larger than 1.7 cm.
� Region B: This region is a transition region between A and C. Breakdown
may occur through process A or C, and the instantaneous value of voltage, at
44
which the first primary streamer develops, plays an important part in
determining the breakdown process.
� Region C:
- Negative polarity: A negative space charge formed by the negative
streamer induces a positive discharge from the anode, then breakdown
occurs.
- Positive polarity: An initial positive streamer leads to breakdown, without
any following primary positive streamers, as in point-to-plane air gaps
larger than 1,7 cm, but no leaders are observed, in contrast to point-to-
plane air gaps.
- The equation for U50 versus d characteristics shows that the 50 %
breakdown voltage is independent of the thickness of the acrylic plate.
� Back discharges may occur with the drop in voltage in the wave tail of the
applied voltage for both polarities.
The present study was carried out in co-operation with the University of
British Colombia. Previous work in this institution used the technique of ultra high-
speed streak photography for several studies on the discharge development on
synthetic spacer surfaces in different gases [61] [62] [63]. These outcomes may
also be interesting when compared to the present study; thus, some of the results
are listed below:
45
� It is very clearly shown that the spacer surface actively assists discharge
development. In general, the discharge development accelerates in the
presence of a synthetic spacer.
� Under impulse voltage, the spacer surface cannot be assumed to be
dielectrically homogeneous. Therefore, discharge may be initiated at any
location in a uniform or quasi-uniform field situation.
� It may be assumed that the spacer surface is not ideally homogenous and
that micro-discharges may occur on the surface. These clusters of surface
charges generate a continually changing surface electric field.
� The process of photoemission, already mentioned in a previous study [115],
may also contribute to the creation of surface charging, thus lowering both
formative time lag to breakdown and breakdown voltage.
Several authors agree that surface charge accumulation may be the main
reason for the relatively poor surface breakdown characteristics. Thus, some
investigations in the HV laboratory at UBC were carried out to measure surface
charges and to study their contribution to surface breakdown [14] [117]. Some
conclusions are listed below:
� The surface charging is found to be directly related to the corona phenomena.
Surface charge density increases significantly when applied voltage reaches
a critical value and increases thereafter with applied voltage.
46
� Surface charging is strongly field dependent, related to the duration of voltage
application, and it shows different patterns as a function of the gas (studies
were carried out in air, N2 and SF6).
� A spacer reduces significantly the corona inception time of the spacer gap.
� In certain cases, both positive and negative charge accumulations are found
on the spacer surfaces independently of polarity of applied voltage. Hereby,
polarity of the accumulated surface charges depends on gas type and level of
applied voltage.
2.4.1.3 Propagation Velocity of Surface Discharges
Regarding the speed of discharge propagation, several experimental studies
for surface discharge in vacuum were reviewed by [81]. Surface roughness and
surface composition present important factors influencing the speed of propagation
For most cases, the results for propagation velocity are in the range of 107 m/s. For
surface discharge in air, values of 3 x10⁷ m/s for the final stage and 9 x10⁶ m/s as
average velocity were determined [61]. Experiments in nitrogen revealed a velocity
of propagation of 5 x10⁶ m/s for the final breakdown [84]. A recent investigation
presented experimental results on the streamer propagation along insulating
surfaces at atmospheric air pressure [1]. It was concluded that stable streamer
propagation is characterised by an intrinsic propagation field and velocity, which
depend on the dielectric medium. They have higher values for propagation along
47
insulating surfaces than for propagation in air. Depending on the different
experimental conditions (distance of traverse, applied pulse amplitude, electric
field, surface material) streamer propagation speeds between v=2 x10⁵ m/s and
v=13 x105 m/s were measured. If the applied electric field is higher than the
minimum field required for stable streamer propagation, the discharge activity
divides into two components: A surface and an air component. The propagation
speed of the latter component is smaller than that of a streamer in air alone.
2.4.1.4 Application of Ultra High-speed Photography
Numerous investigations were reported using ultra high-speed optical
observation techniques in order to study discharge initiation and development.
Several examples of recent studies are listed here. [61] [71], [100] [101], and [111]
reported applications of streak photography in air at atmospheric pressure.
Research activities with streak cameras along synthetic spacer surfaces were
carried out by [3], [18], [19] on vacuum discharges, other studies on discharges in
compressed gases were reported by [62] [63] [97], [107] and [113]. Framing
cameras were used in the past for investigations of discharge propagation in liquid
dielectrics [5] [7] [65], [68], [82] and also for the breakdown processes along solid
insulating surfaces in air [100] [101]. Furthermore, a single frame high-speed
camera system was used to investigate of discharge initiation in SFg/N2 gas
mixtures under very fast transient voltage stress [86], whereas [43] used an ICCD
48
camera for studies on avalanches and streamer formation along Teflon spacers in
dry air. The present study adopts the streak camera system that was used
beforehand for studying discharge activity on various synthetic spacers in air and
compressed gases [61] [62] [63].
2.4.2 Discharge Activity on Ice Surfaces
There exist only few investigations on the characteristics of electrical
discharges along ice surfaces. Results of three previous studies are mentioned
here.
A master project [12] at the University of Quebec in Chicoutimi studied the
corona discharges and breakdown characteristics on a linear physical model,
consisting of a metallic HV electrode and an ice plane placed on a grounded metal
plate. The following points can be retained from this study:
� The resistance of ice decreases when passing from icing period to melting
period. This is an important factor influencing the mobility of charge carriers
on the conductive surface of the ice.
� For ice formed from water with low conductivity, the resistance decreases by
32 % to 48 % between icing and melting periods.
� If a thin water film covers the ice, total equivalent resistance is decreased to a
higher degree than without water film.
49
� For the icing period, a water film covering the ice surface decreases the
resistance by approximately 97 % in comparison with its initial value.
� If a liquid film covers the ice during the melting period, resistance decreases
by 95 % in addition to the decrease in resistivity due to melting. This is the
most dangerous case, as ice resistance is decreased by two processes -
melting period and water film.
� For the icing period, a water film on the ice surface leads to a decrease in
minimal breakdown voltage of about 12 % to 20 % in comparison with the
value for dry ice surface condition.
� Minimal breakdown voltage is slightly lower for negative polarity for any
temperature studied.
Another investigation aims to explain the characteristics of an established arc
on ice surfaces [36] [116]. The present study deals with the discharge onset, thus,
it studies processes before establishment of a stable arc. Nevertheless, some
conclusions on the pervious work of arc propagation could be interesting to
mention at this point. Experiments were carried out on a triangular model, 28 cm
high. The velocity of the arc was determined using a high-speed video system.
From the results, it may be concluded that:
� The arc propagation can be divided into two stages. In the first stage,
covering about 40 % to 50 % of total leakage distance, the velocity of arc
50
propagation is relatively small, varying between 0.04 and 0.3 m/s. In the
second stage, velocity increases to a range of 3 to 50 m/s.
� In general, velocity is slightly lower under ac than under dc, except during the
final moment just before breakdown. Hereby, velocity reaches its maximum
value, which can be as high as 100 m/s for dc and 440 m/s for ac.
� In the case of dc-voltage, no obvious difference could be detected between
propagation velocities of negative and positive arcs during the first stage. In
the second stage, higher values were found for negative arc.
� In the case of ac, the partial arc extinguishes and reignites cyclically with the
alternating voltage. Thereby, a time delay of about 1 ms exists between the
variations of arc length and voltage.
The fundamental characteristics of ac breakdown under conditions of
combined contamination and ice covering were also investigated [95]. Experiments
were carried out on a rectangular physical model mounted at an angle of 30°. The
ice-covered part had dimensions of 10 cm by 5 cm. Optical high-speed
observations in the range of milliseconds, as well as electrical measurements were
carried out. The experimental conditions were very different to those normally used
in the investigations at UQAC. Moreover, some terminology was defined in a
different way, so comparison of results has to be done carefully. Nevertheless,
some interesting points can be retained from this study:
51
� The average value of salt deposit density (SDD) in the presence of icing is
five to nine times higher than that for ice-free conditions. This may be
explained by the fact that without ice the sprayed liquid contamination flows
down on the inclined model.
� Thawed snow with a relatively low salt concentration can produce a sufficient
SDD for flashover on an iced insulator surface.
� Under the experimental conditions of this study, soft rime conditions lead to
lowest breakdown values. At the same SDD, soft rime takes on a sherbet
state (mixture of water and ice) providing a 20 % reduction of breakdown
stress in comparison with icing-free conditions. This effect is explained by the
fact that soft rime tends to increase the density of Na atoms in the discharge
space at breakdown.
� The discharge behaviour depends on the type of ice:
- Soft rime shows discharge activity in front of both electrodes, growing
gradually along the surface during several half-cycles.
- Hard rime and glaze show weak pre-discharge activity at different locations
either near the electrodes or somewhere on the ice surface. The
occurrence of final breakdown is very fast, the transition period from pre-
discharge to breakdown lasting about one half-cycle.
� A common feature can be observed: In all three cases, the local discharges
extinct and reignite at each half-cycle.
52
2.4.3 Discharge Propagation in Water and on its Surface
Due to the fact that the ice surface exhibits a quasi-liquid characteristic and
also the possible existence of a water film on the ice surface due to melting
processes, some aspects of discharges in water and on its surface is reviewed.
Several theories exist on the progression of electrical discharge activities in water.
Papers are cited in this section in order to give an insight into two theories.
A study on the pre-breakdown phenomena in a uniform field in water [42]
showed that pre-breakdown streamers exist for both polarities. They are either
subsonic or supersonic in a non-uniform field. Formation and development of slow
anodic and cathodic streamers are assumed to be induced by water cavitation in
the band of injected space charge. Development of fast streamers is preceded by a
kinetic phase transition, which causes a weak-conducting filament. Heating of this
filament leads to appearance of an ionisation wave and the formation of a plasma
channel.
A recent study focused on the propagation features of a streamer discharge
in water [65]. The results reveal that the streamer propagates in a low-density
vapour rather than in liquid. Due to the fact that electron avalanches do not occur
in water, the concept of thermal processes plays a decisive role in the theory of
water breakdown. It does not seem possible for electrons to gain the high energy
53
necessary to initiate ionisation processes in water, while ionisation can take place
in a low-density medium such as vapour. The calculated power required to
evaporate the water inside a streamer channel during its propagation was found to
be concurrent to the measurements. The streamer propagation velocity was found
to be independent of the water conductivity, which indicates that the vaporisation at
the tip of a streamer takes place due to charged particle flow from the discharge
plasma in the streamer channel. Extrapolation of classical approaches give drift
velocities of 103 m/s for heavy ions and <105 m/s for protons, which are the primary
product of the water dissociation and ionisation.
Concerning the propagation of discharges on the water surface, a publication
reports optical and field probe measurements using a water bath and a non-
symmetrical electrode configuration to identify the electrical conditions in the
discharges as well as in the water layer [10]. The following details can be retained:
� A propagation arc establishes multiple contacts between the discharge
channel and the conducting surface for both polarities.
� Shape and velocity of the discharge propagation are strongly voltage polarity
dependent:
- The positive discharge is constricted and has many branches, whereas the
negative appears broader and simpler.
54
- In the case of positive voltage polarity, the velocity of discharge
propagation is up to ten times faster than in the case of negative voltage
polarity.
� The field intensity increases inside the discharge towards the advancing tip.
� The velocity of discharge propagation depends on the resistance of the
electrolyte: The discharge propagates faster as the resistance decreases.
55
2.5 Conclusions of Chapter 2
Despite the numerous investigations in ice physics and electrical surface
discharges, little information is applicable to the present study. In general, the
review of the available literature illustrates that electrical discharge phenomena on
ice surfaces are very complex. The surface of ice is a sophisticated structure
containing a greater number of impurities than the ice bulk due to the freezing
process of water. In the range of normal atmospheric conditions, the surface can
change from solid to liquid depending on the ambient air temperature. However, it
is shown that even for low air temperatures it does not act as a solid material in
some aspects, therefore it is described as quasi-liquid. From each of the
concerned research fields, some points are summarised, which should be retained
in respect to the following discussion and analysis of the experimental results of
this study (Chapters 4 to 6).
From the literature review on electrical discharges along synthetic surfaces
(Section 2.3), the following aspects can be retained:
� The homogeneity of the synthetic material influences the electrical
performance of the insulating spacers.
� Different regimes govern the discharge process as a function of the distance
between the electrodes. This is related to the fact that certain partial
discharge modes require a minimum distance to develop.
56
� The existence of surface charge accumulation has been shown and
quantified for different synthetic insulating materials. These charge
accumulations play an important role for the initiation of the discharges on the
synthetic surfaces.
� Discharges between charge accumulation on the surface and one electrode
(so-called "back-discharges") have been observed.
From the literature review on electrical discharges along water and ice
surfaces (Section 2.4), the following aspects can be retained:
� The discharge process along the ice surface depends on the type and
morphology of the ice.
� The propagation of an established arc can be divided into two different
regimes: At the beginning, the propagation velocity of the arc is relatively
small (in the range of 0.04 m/s to 0.3 m/s). As the arc exceeds a certain
length, about half the leakage distance, arc propagation velocity increases by
a magnitude of approximately two.
� The presence of a liquid water film on the ice surface decreases significantly
the surface resistance, which leads to lower critical breakdown voltages under
applied ac and dc voltages.
� With dc voltage applied, lower breakdown voltages were obtained for
negative voltage polarity.
57
� The propagation velocity of an established arc along the surface of an
electrolytic solution is a function of the resistance of the solution: A decrease
of the resistance will lead to an increase of the arc propagation velocity.
� Higher propagation velocities could be found for positive polarity for a non-
symmetrical electrode configuration.
The studies on discharge processes on synthetic surfaces in vacuum and in
diverse gases under high pressure showed that surface charge accumulation is of
crucial importance for the initiation of surface discharges. Therefore, one may
expect that they could also play a role for ice surface discharges. On the one hand,
there is no doubt that charges cannot be accumulated on wet ice surfaces due to
the increased surface conductivity. On the other hand, their role for discharge
initiation on dry ice surfaces cannot be clarified in this review as no experimental
data could be identified in the literature regarding the study and measurement of
charge accumulation on ice surfaces.
CHAPTER 3
EXPERIMENTAL SET-UP AND PROCEDURES
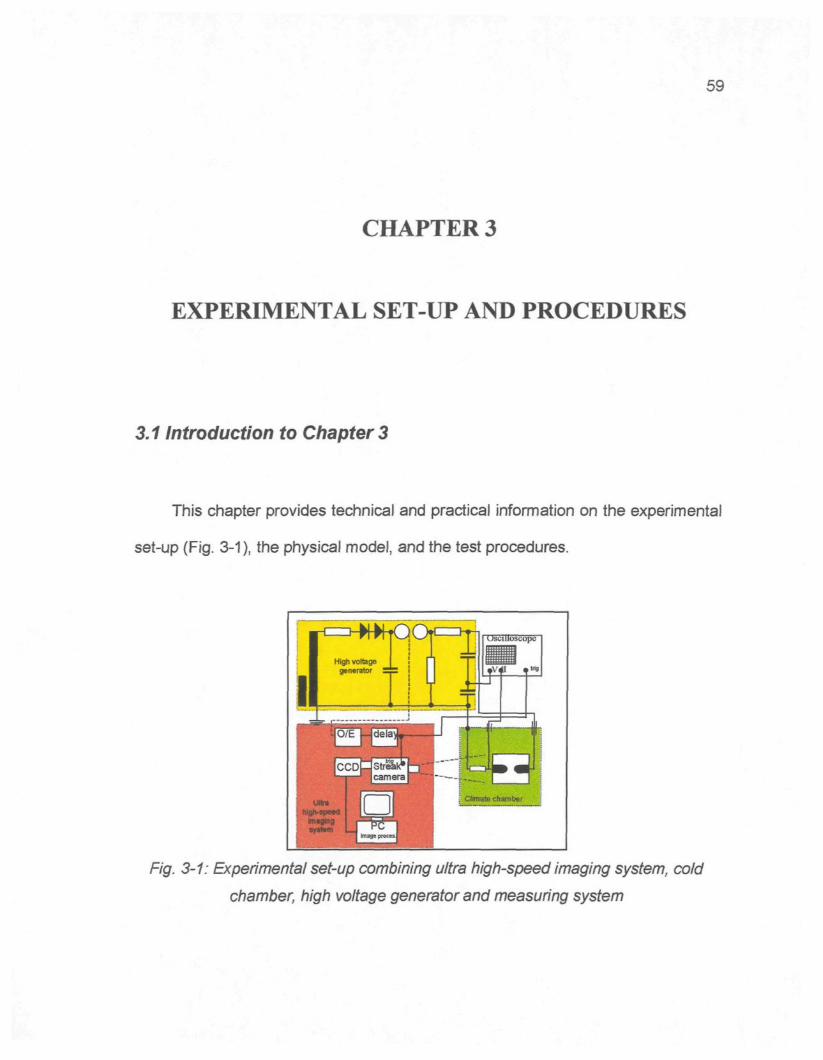
59
CHAPTER 3
EXPERIMENTAL SET-UP AND PROCEDURES
3.1 Introduction to Chapter 3
This chapter provides technical and practical information on the experimental
set-up (Fig. 3-1), the physical model, and the test procedures.
Fig. 3-1: Experimental set-up combining ultra high-speed imaging system, cold
chamber, high voltage generator and measuring system
60
At the beginning, the different components of the set-up are described. Next,
design and preparation of the physical model consisting of two metal capped rod
electrodes half submerged into the ice, are explained. All experimental parameters
are listed and the chosen values are given. The following section presents the
different test procedures. Finally, the limits of interpretation for the different
experimental methodologies with the available equipment are discussed in the last
section on error discussions.
3.2 Test Equipment
3.2.1 Ultra High-speed Imaging System
The main tools for this study are specialised ultra high-speed cameras, which
can record and portray processes that are too rapid to be perceived by the human
eye. Two different recording techniques exist: Framing recording and streak
recording. Both techniques could be utilised within the framework of this study.
A framing camera provides two-dimensional photographs, where each of
these images represents the integrated recording over the exposure time interval,
tframe- A series of framing recordings does not provide any information on the
observed process during the time period between the frames, tinterfr. Even if this
61
value is adjusted to zero so that at the end of one framing recording the next starts
immediately, the process will not appear as a continuous phenomenon due to the
integrating effect of the framing recording. On the other hand, a streak camera
provides a continuous recording of one geometric dimension. The result - a two-
dimensional photograph, shows the development of any dynamic process along a
line as a function of time (see Section 3.5.1). Thus, the advantage of continuous
recording has to be won by the fact that one is limited to one geometric dimension.
It may be concluded that both technologies - streak and framing camera - present
complementary experimental methodologies, where each of them has certain
advantages and disadvantages. The use of streak technology may be
recommended for the study of the basic discharge processes, where a one-
dimensional discharge development can be contrived. However, for experiments
on larger physical models or even real insulators with complex geometric
structures, it can be expected that the electric arc will not follow a straight line any
more. Thus, it seems to be necessary to use framing technologies with its
possibility of two-dimensional representation of the dynamic processes. New
framing cameras with shorter frame duration will be available in the near future,
which may be very helpful for the study of the very fast surface processes.
A scheme of the different components of the imaging system used in the
present study is given in Fig. 3-2. The streak camera model Hamamatsu C2830
was coupled to a CCD-camera model Hamamatsu C3640 allowing digital data
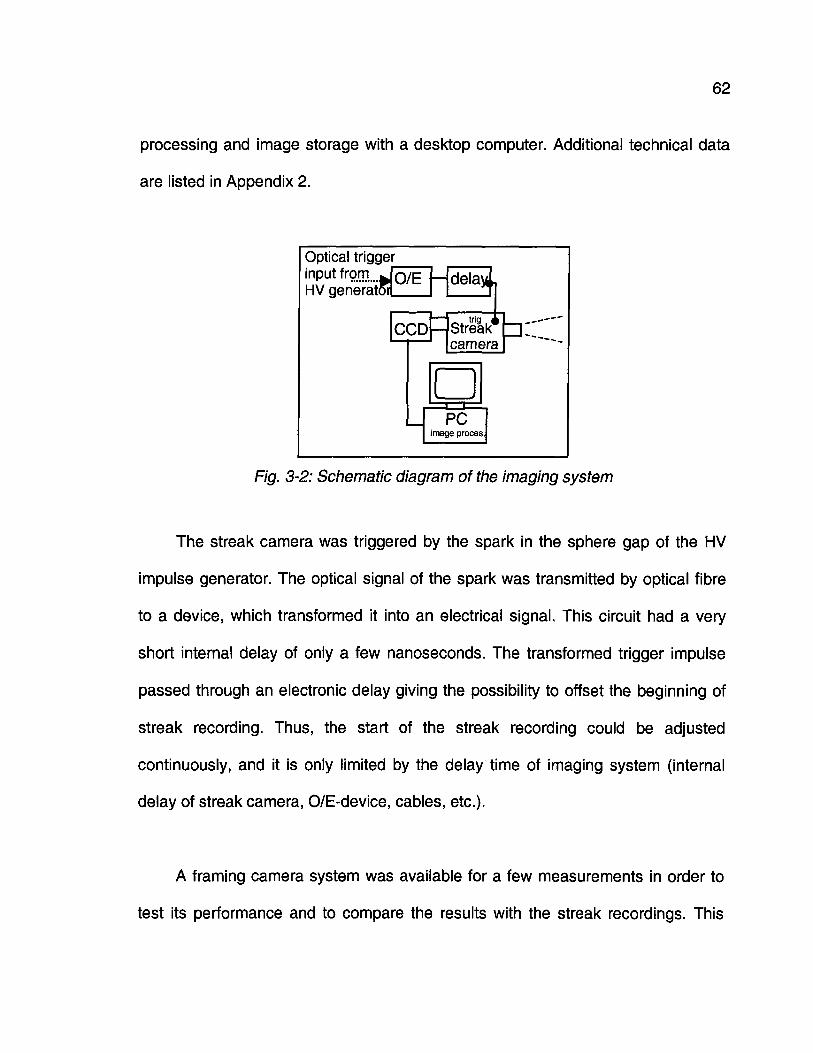
62
processing and image storage with a desktop computer. Additional technical data
are listed in Appendix 2.
Optical triggerinput from..HV generate
O/E -
CCD
delay.
Streak"camera
PCimage procès.
Fig. 3-2: Schematic diagram of the imaging system
The streak camera was triggered by the spark in the sphere gap of the HV
impulse generator. The optical signal of the spark was transmitted by optical fibre
to a device, which transformed it into an electrical signal. This circuit had a very
short internal delay of only a few nanoseconds. The transformed trigger impulse
passed through an electronic delay giving the possibility to offset the beginning of
streak recording. Thus, the start of the streak recording could be adjusted
continuously, and it is only limited by the delay time of imaging system (internal
delay of streak camera, O/E-device, cables, etc.).
A framing camera system was available for a few measurements in order to
test its performance and to compare the results with the streak recordings. This
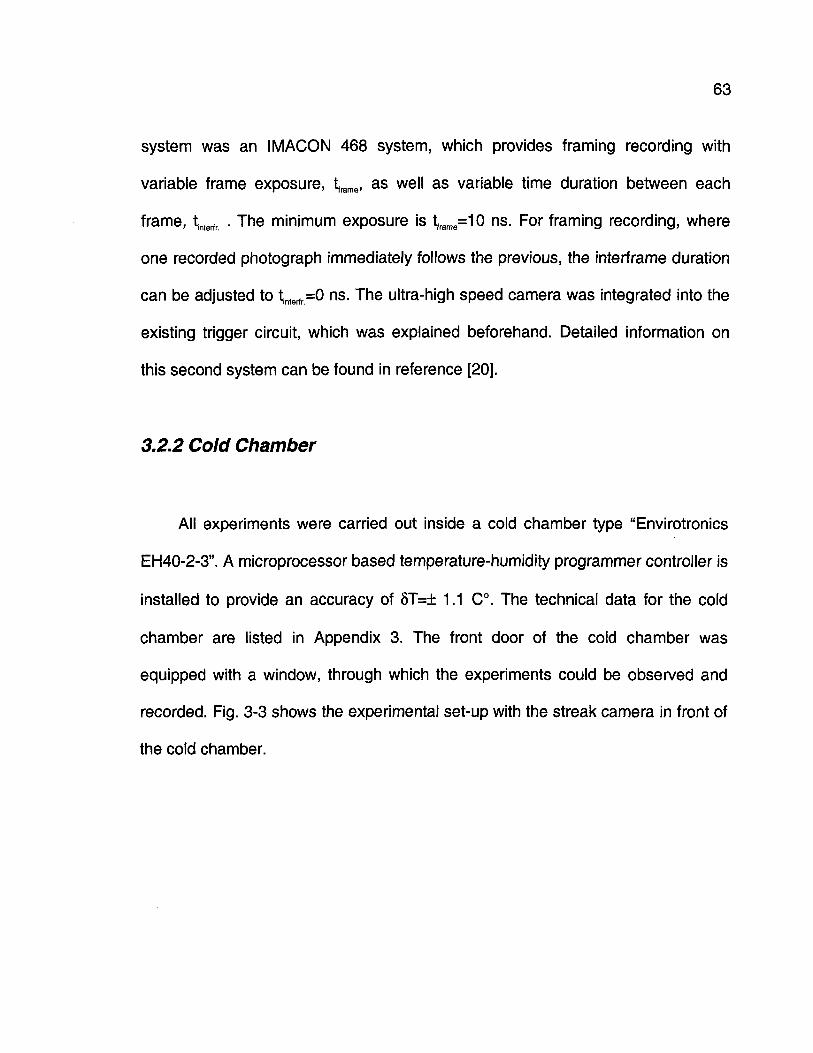
63
system was an IMACON 468 system, which provides framing recording with
variable frame exposure, t,ram6, as well as variable time duration between each
frame, \meri! . The minimum exposure is t,rame=10 ns. For framing recording, where
one recorded photograph immediately follows the previous, the interframe duration
can be adjusted to tint6rfr=0 ns. The ultra-high speed camera was integrated into the
existing trigger circuit, which was explained beforehand. Detailed information on
this second system can be found in reference [20].
3.2.2 Cold Chamber
All experiments were carried out inside a cold chamber type "Envirotronics
EH40-2-3". A microprocessor based temperature-humidity programmer controller is
installed to provide an accuracy of ÔT=± 1.1 C°. The technical data for the cold
chamber are listed in Appendix 3. The front door of the cold chamber was
equipped with a window, through which the experiments could be observed and
recorded. Fig. 3-3 shows the experimental set-up with the streak camera in front of
the cold chamber.
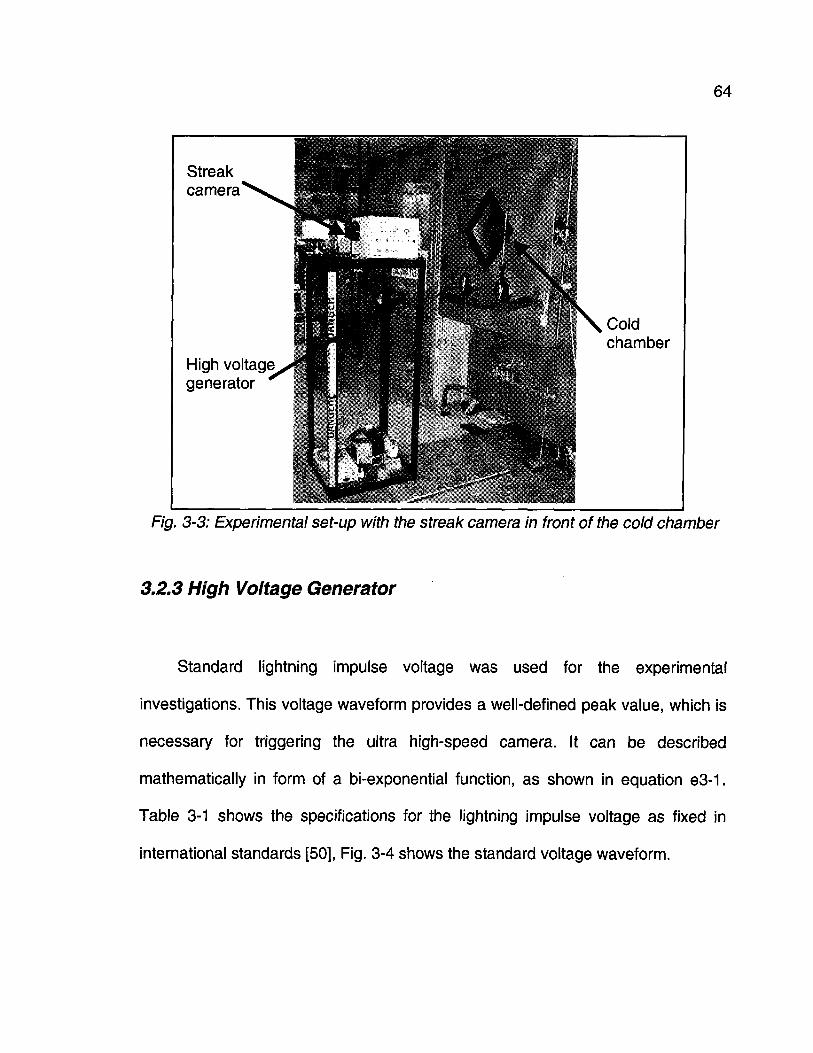
64
Streakcamera
High voltage^generator
Coldchamber
Fig. 3-3: Experimental set-up with the streak camera in front of the cold chamber
3.2.3 High Voltage Generator
Standard lightning impulse voltage was used for the experimental
investigations. This voltage waveform provides a well-defined peak value, which is
necessary for triggering the ultra high-speed camera. It can be described
mathematically in form of a bi-exponential function, as shown in equation e3-1.
Table 3-1 shows the specifications for the lightning impulse voltage as fixed in
international standards [50], Fig. 3-4 shows the standard voltage waveform.
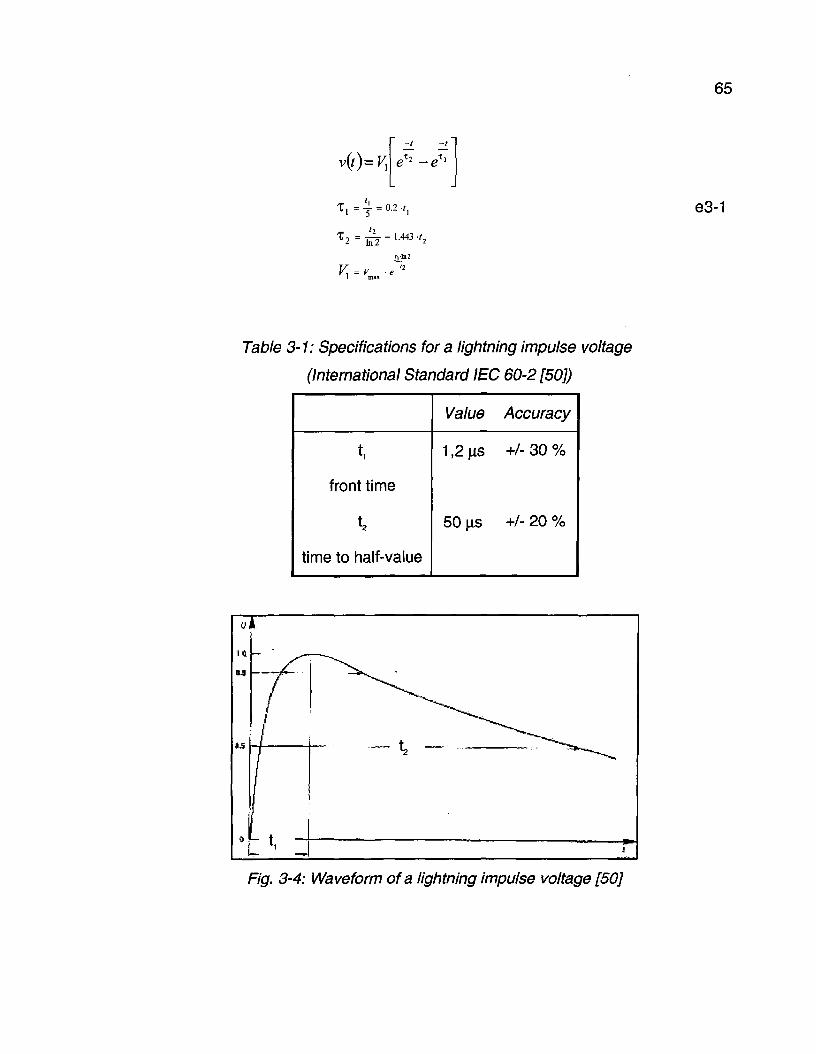
65
T, 4 = « �',T 2 = _ L = ,.443.,2
K = V -1 max
I]ln2
�1
e3-1
Table 3-1: Specifications for a lightning impulse voltage
(International Standard IEC 60-2 [50])
front time
time to half-value
Value
1,2 MS
50 |JS
Accuracy
+/- 30 %
+/- 20 %
F/g. 3-4; Waveform of a lightning impulse voltage [50]
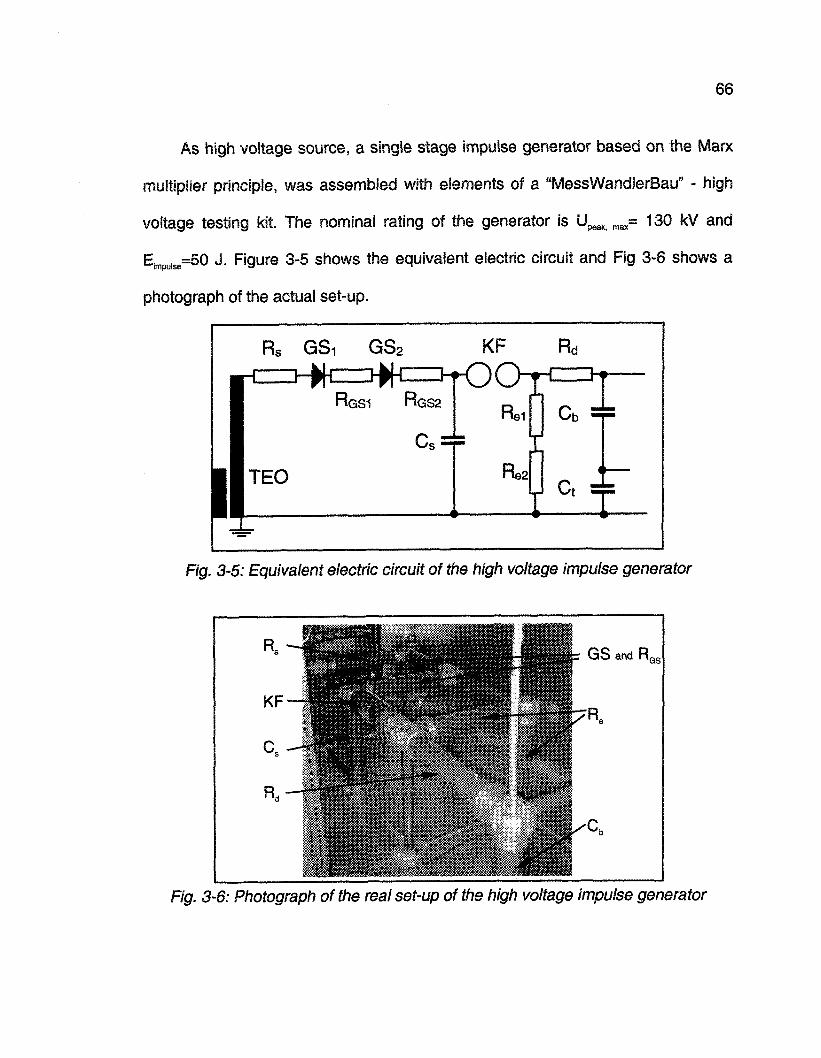
66
As high voltage source, a single stage impulse generator based on the Marx
multiplier principle, was assembled with elements of a "MessWandlerBau" - high
voltage testing kit. The nominal rating of the generator is UpeAmax= 130 kV and
Eimputee=50 J- F'Qure 3-5 shows the equivalent electric circuit and Fig 3-6 shows a
photograph of the actual set-up.
Fig. 3-5: Equivalent electric circuit of the high voltage impulse generator
Fig. 3-6: Photograph of the real set-up of the high voltage impulse generator
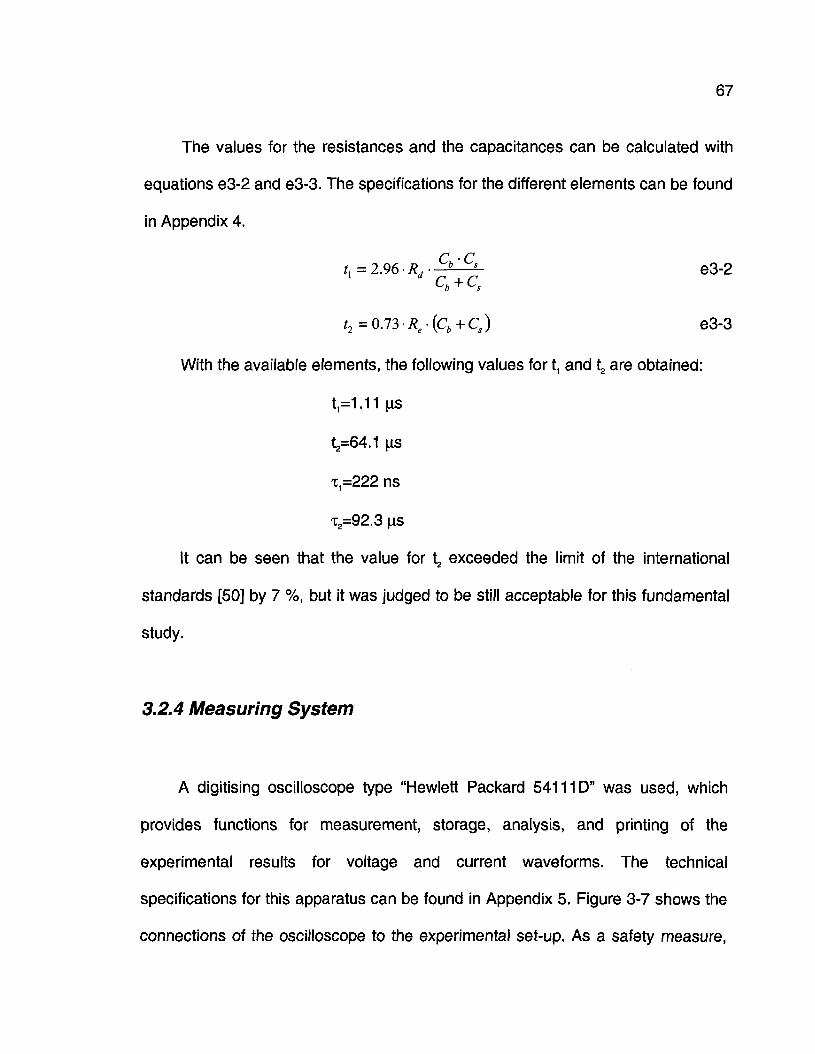
67
The values for the resistances and the capacitances can be calculated with
equations e3-2 and e3-3. The specifications for the different elements can be found
in Appendix 4.
tx=2.96Rd- C"'Cs e3-2
d c + ct2 = 0.73 Re-{Cb + Cs) e3-3
With the available elements, the following values for t, and t2 are obtained:
t,=1.11 \ys
t2=64.1 [is
x,=222 ns
x2=92.3 (is
It can be seen that the value for t, exceeded the limit of the international
standards [50] by 7 %, but it was judged to be still acceptable for this fundamental
study.
3.2.4 Measuring System
A digitising oscilloscope type "Hewlett Packard 54111D" was used, which
provides functions for measurement, storage, analysis, and printing of the
experimental results for voltage and current waveforms. The technical
specifications for this apparatus can be found in Appendix 5. Figure 3-7 shows the
connections of the oscilloscope to the experimental set-up. As a safety measure,
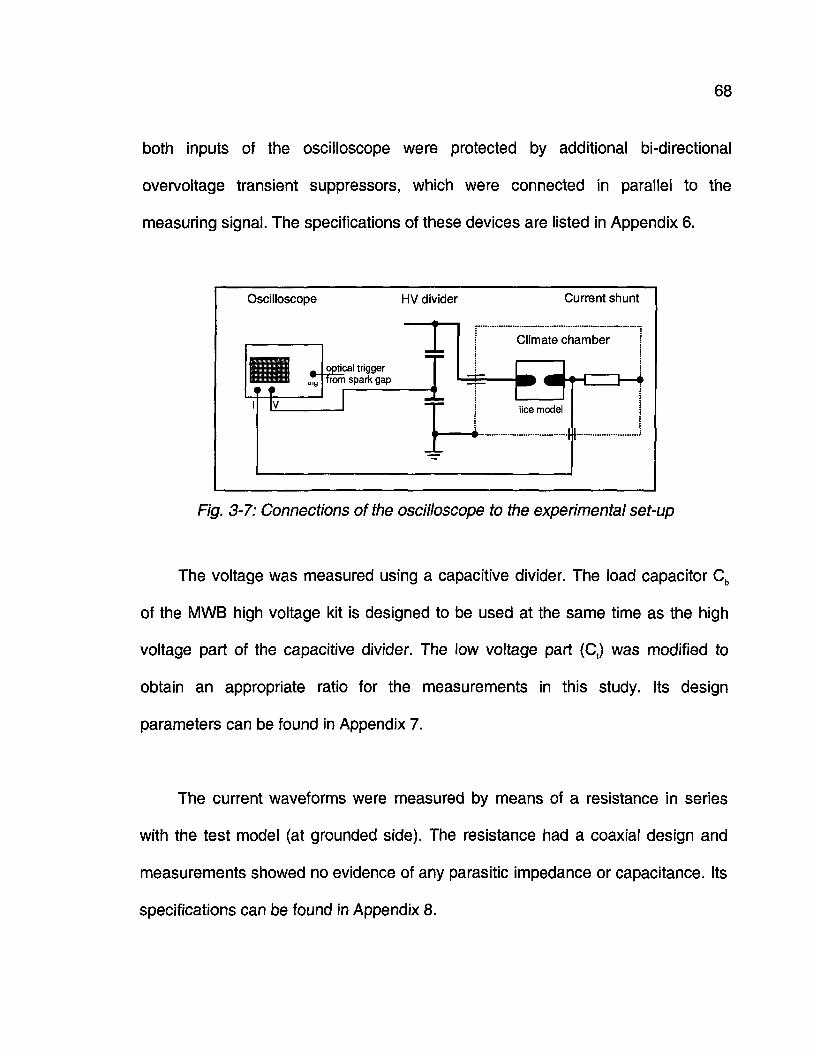
68
both inputs of the oscilloscope were protected by additional bi-directional
overvoltage transient suppressors, which were connected in parallel to the
measuring signal. The specifications of these devices are listed in Appendix 6.
Oscilloscope HV divider Current shunt
orjticTrom
ical triggerrom spark gap
j
Fig. 3-7: Connections of the oscilloscope to the experimental set-up
The voltage was measured using a capacitive divider. The load capacitor Cb
of the MWB high voltage kit is designed to be used at the same time as the high
voltage part of the capacitive divider. The low voltage part (Ct) was modified to
obtain an appropriate ratio for the measurements in this study. Its design
parameters can be found in Appendix 7.
The current waveforms were measured by means of a resistance in series
with the test model (at grounded side). The resistance had a coaxial design and
measurements showed no evidence of any parasitic impedance or capacitance. Its
specifications can be found in Appendix 8.
69
3.3 Physical Model
3.3.1 Geometric Configurations
As an industrial HV insulator has a complex geometric structure and
comprises different materials, a simplified physical model was used for the
experiments. Regardless the geometric shape or the material of the insulator,
electrical discharges will extend first over very short distances at locations of
enhanced electric field. For a study on the discharge onset, observations may be
limited on the region next to this process. Thus, the simplified geometric model
may represent quite well the actual discharge initiation and the early stages of
discharge development. Several different locations can be identified, where
discharges may be initiated on an ice-covered HV insulator:
� Between one metal terminal (HV or ground contact) and the ice cover;
� From ice asperity to ice asperity bridging air gaps somewhere along the
insulator;
� Along the ice surface between impurities imbedded in the ice.
The present study focuses on locations of second and third type.
The advantage of a simplified geometry is that the investigations can be
concentrated on each single experimental parameter without having any effects
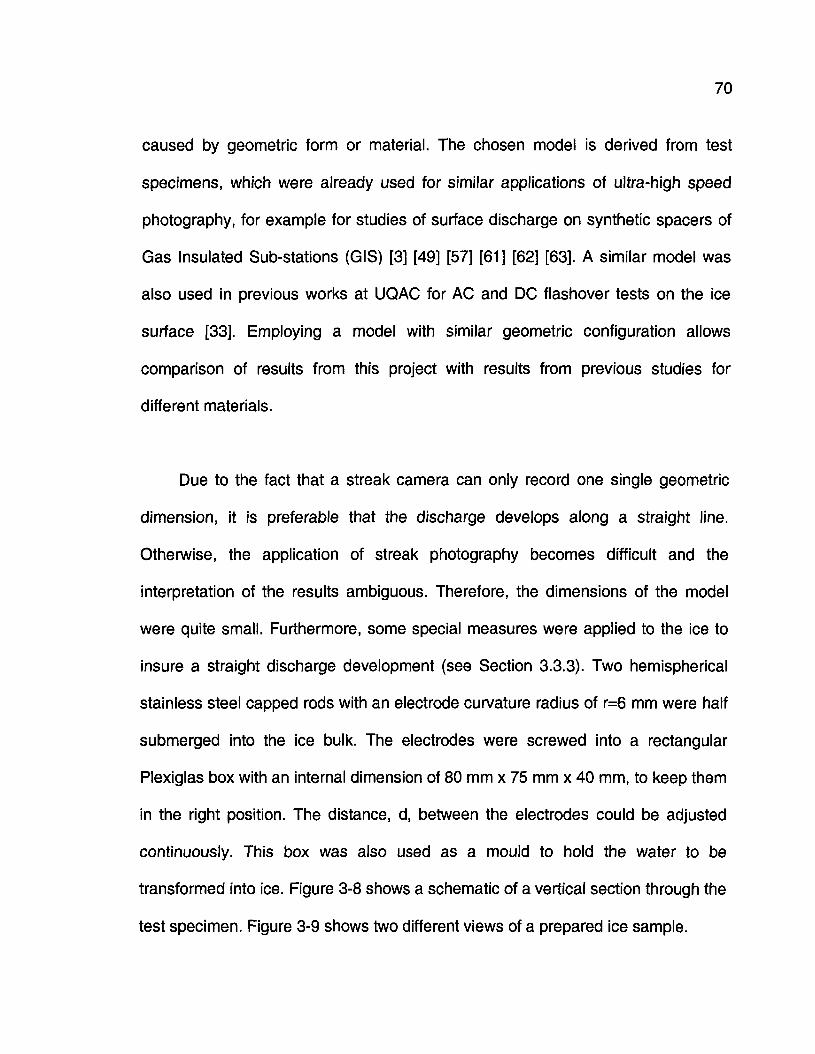
70
caused by geometric form or material. The chosen model is derived from test
specimens, which were already used for similar applications of ultra-high speed
photography, for example for studies of surface discharge on synthetic spacers of
Gas Insulated Sub-stations (GIS) [3] [49] [57] [61] [62] [63]. A similar model was
also used in previous works at UQAC for AC and DC flashover tests on the ice
surface [33]. Employing a model with similar geometric configuration allows
comparison of results from this project with results from previous studies for
different materials.
Due to the fact that a streak camera can only record one single geometric
dimension, it is preferable that the discharge develops along a straight line.
Otherwise, the application of streak photography becomes difficult and the
interpretation of the results ambiguous. Therefore, the dimensions of the model
were quite small. Furthermore, some special measures were applied to the ice to
insure a straight discharge development (see Section 3.3.3). Two hemispherical
stainless steel capped rods with an electrode curvature radius of r=6 mm were half
submerged into the ice bulk. The electrodes were screwed into a rectangular
Plexiglas box with an internal dimension of 80 mm x 75 mm x 40 mm, to keep them
in the right position. The distance, d, between the electrodes could be adjusted
continuously. This box was also used as a mould to hold the water to be
transformed into ice. Figure 3-8 shows a schematic of a vertical section through the
test specimen. Figure 3-9 shows two different views of a prepared ice sample.
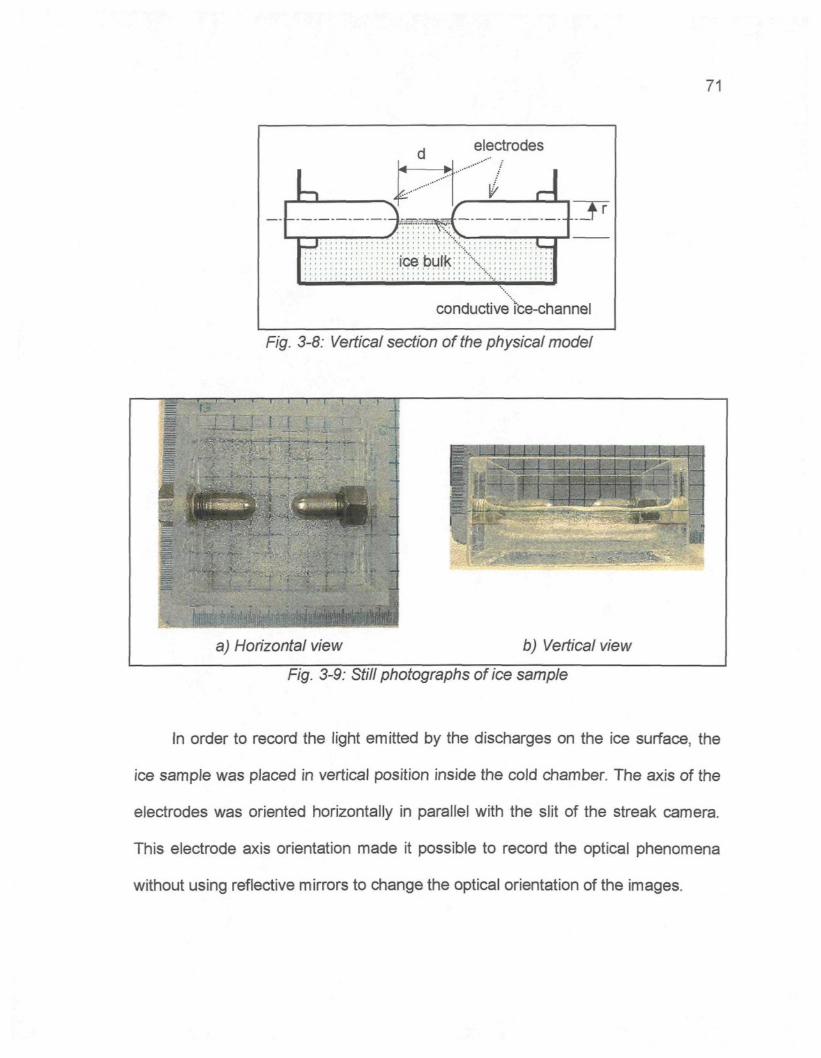
71
IL,_ J : :
d
: : : : ; ibe bulk
electrodes
' i À\^_: i!Kji 1
conductive îce-channel
Fig. 3-8: Vertical section of the physical model
i
Horizontal view b) Vertical view
Fig. 3-9: Still photographs of ice sample
In order to record the light emitted by the discharges on the ice surface, the
ice sample was placed in vertical position inside the cold chamber. The axis of the
electrodes was oriented horizontally in parallel with the slit of the streak camera.
This electrode axis orientation made it possible to record the optical phenomena
without using reflective mirrors to change the optical orientation of the images.
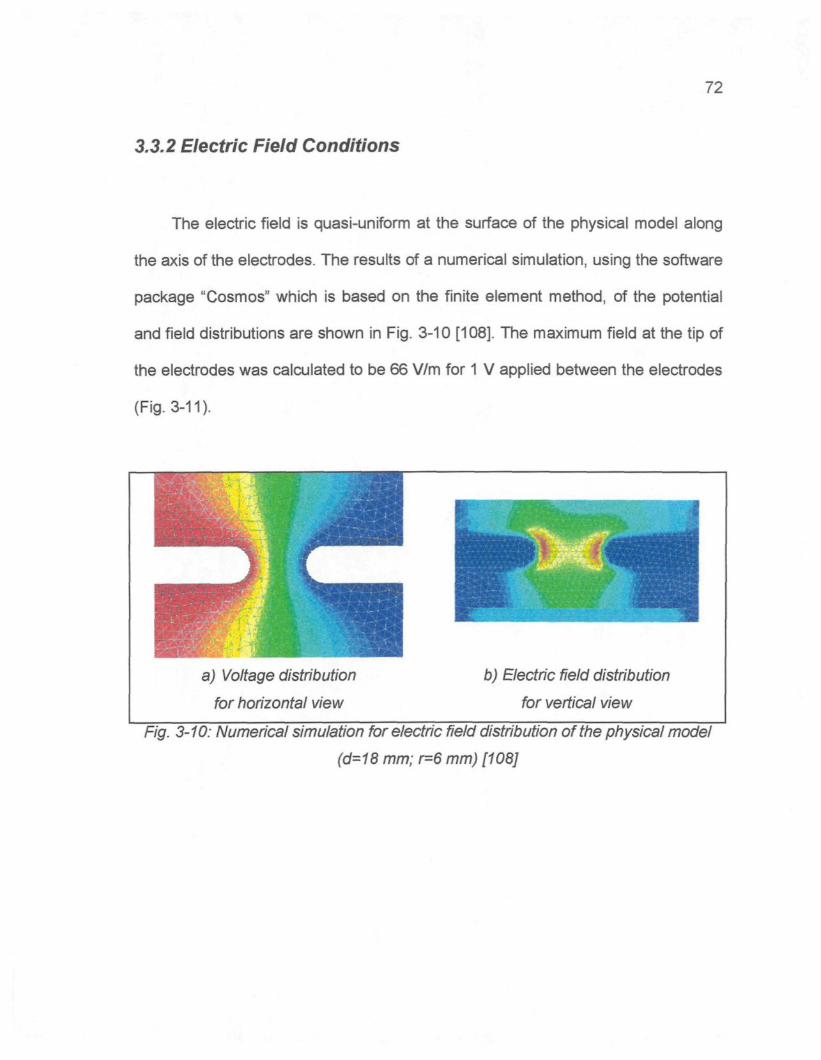
72
3.3.2 Electric Field Conditions
The electric field is quasi-uniform at the surface of the physical model along
the axis of the electrodes. The results of a numerical simulation, using the software
package "Cosmos" which is based on the finite element method, of the potential
and field distributions are shown in Fig. 3-10 [108]. The maximum field at the tip of
the electrodes was calculated to be 66 V/m for 1 V applied between the electrodes
(Fig. 3-11).
a) Voltage distribution
for horizontal view
b) Electric field distribution
for vertical view
Fig. 3-10: Numerical simulation for electric field distribution of the physical model
(d=18 mm; r=6 mm) [108]
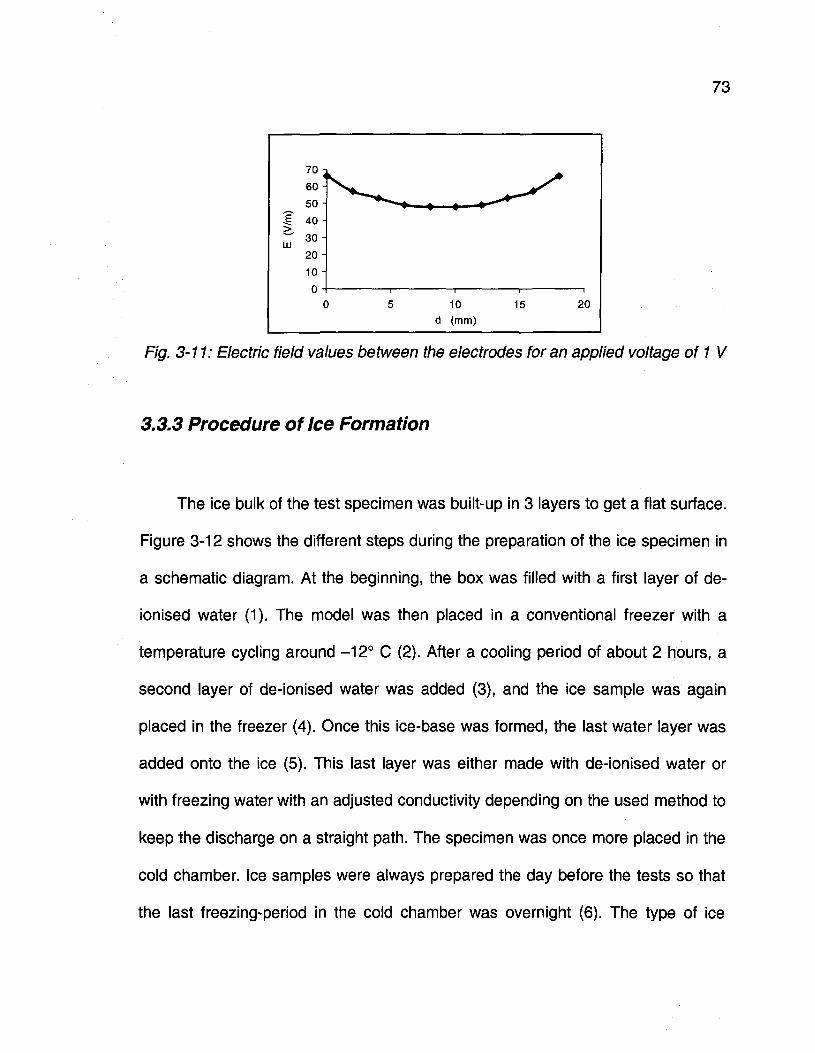
73
E (
V/m
)
70 n
60 -
50 -
40 -
30 -
20 -
10-
0 -C
1
ï 5>
10d (mm)
1 '15 20
3-7 7; Electric field values between the electrodes for an applied voltage of 1 V
3.3.3 Procedure of Ice Formation
The ice bulk of the test specimen was built-up in 3 layers to get a flat surface.
Figure 3-12 shows the different steps during the preparation of the ice specimen in
a schematic diagram. At the beginning, the box was filled with a first layer of de-
ionised water (1). The model was then placed in a conventional freezer with a
temperature cycling around -12° C (2). After a cooling period of about 2 hours, a
second layer of de-ionised water was added (3), and the ice sample was again
placed in the freezer (4). Once this ice-base was formed, the last water layer was
added onto the ice (5). This last layer was either made with de-ionised water or
with freezing water with an adjusted conductivity depending on the used method to
keep the discharge on a straight path. The specimen was once more placed in the
cold chamber. Ice samples were always prepared the day before the tests so that
the last freezing-period in the cold chamber was overnight (6). The type of ice
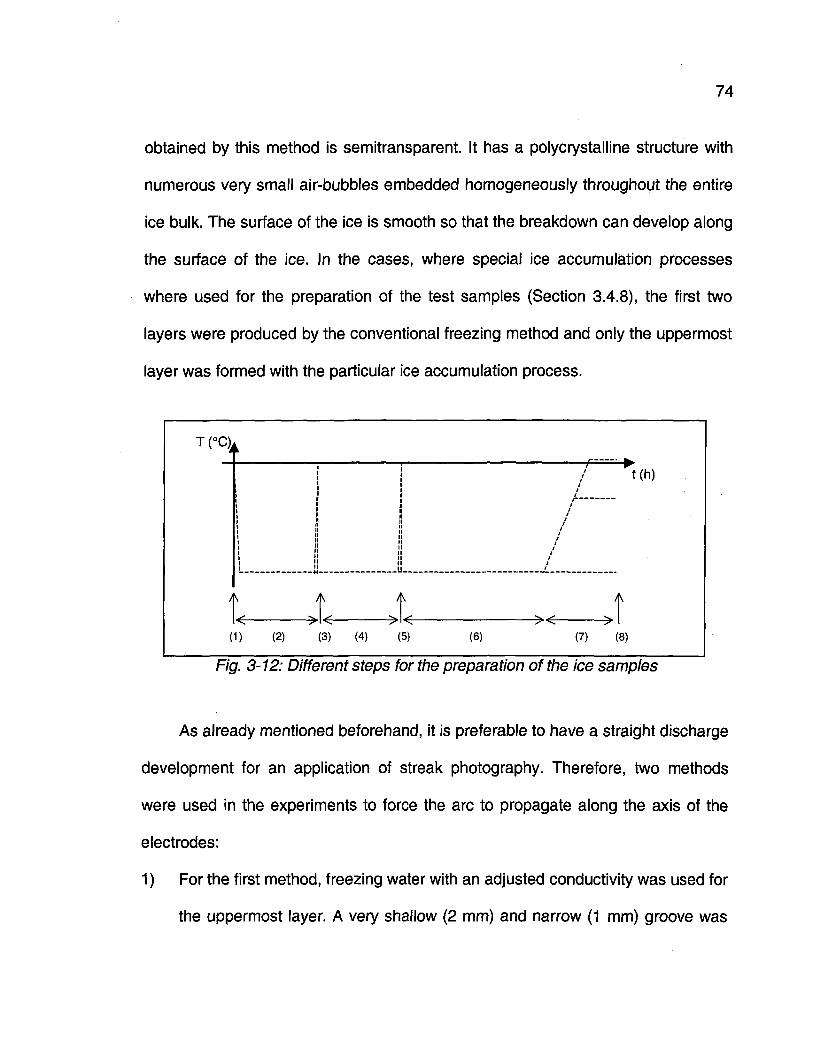
74
obtained by this method is semitransparent. It has a polycrystalline structure with
numerous very small air-bubbles embedded homogeneously throughout the entire
ice bulk. The surface of the ice is smooth so that the breakdown can develop along
the surface of the ice. In the cases, where special ice accumulation processes
where used for the preparation of the test samples (Section 3.4.8), the first two
layers were produced by the conventional freezing method and only the uppermost
layer was formed with the particular ice accumulation process.
TCC).
i
k
!!i
(1) (2)
i
j! i
i
ii
' i
î, 1(3) (4) (5) (6)
////
j.�///////1
t1
11
1
(7)
t(h)
J(8)
Fig. 3-12: Different steps for the preparation of the ice samples
As already mentioned beforehand, it is preferable to have a straight discharge
development for an application of streak photography. Therefore, two methods
were used in the experiments to force the arc to propagate along the axis of the
electrodes:
1 ) For the first method, freezing water with an adjusted conductivity was used for
the uppermost layer. A very shallow (2 mm) and narrow (1 mm) groove was
75
milled into the ice surface along the axis of the electrodes. As this groove
presents a non-uniformity of the surface, the discharge tends to stay inside
the groove.
2) For the second method, the uppermost ice layer was also formed using de-
ionised water. As in the first method, a narrow and shallow groove was milled
into the ice along the axis between the electrodes. Then, the groove was filled
with water having an adjusted conductivity creating an ice channel with a
higher conductivity at the surface of the ice bulk formed with de-ionised water.
The discharge was supposed to stay inside the ice channel due to the locally
reduced ice resistance. For the case of the ice-sample formed from water with
very low conductivity (2.5 x10"4 S/m), this method could not be applied and
only the first method was used.
In this investigation, most of the experiments were carried out using the
second method. The first method was used as a measure to verify the experiments
and for experiments with different ice formation parameters.
At least 1 hour prior to the test, the ice samples were placed in the cold
chamber "Envirotronics EH40-2-3" (7), in which the temperature was already
adjusted to the test value Ttest. As the volume of the ice bulk was small (80 mm by
75 mm by 20 mm), this was judged as being sufficient to allow the temperature of
the ice to equalise with the ambient air temperature of the test chamber.
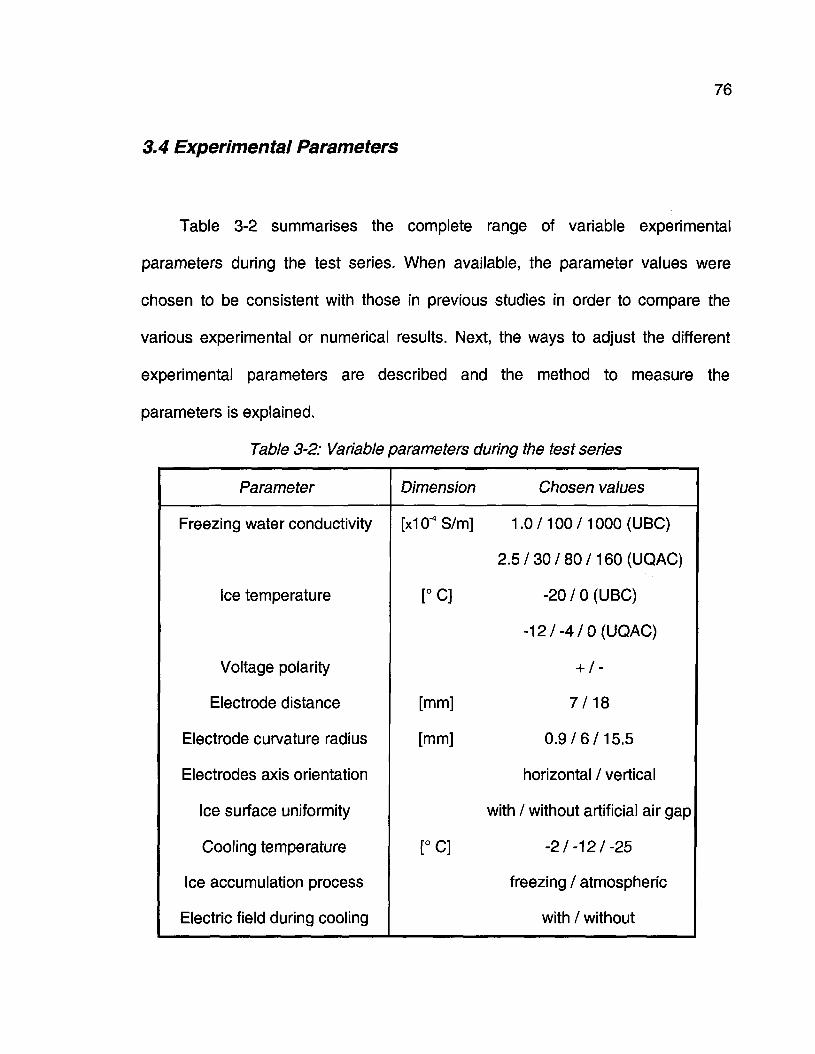
76
3.4 Experimental Parameters
Table 3-2 summarises the complete range of variable experimental
parameters during the test series. When available, the parameter values were
chosen to be consistent with those in previous studies in order to compare the
various experimental or numerical results. Next, the ways to adjust the different
experimental parameters are described and the method to measure the
parameters is explained.
Table 3-2: Variable parameters during the test series
Parameter
Freezing water conductivity
Ice temperature
Voltage polarity
Electrode distance
Electrode curvature radius
Electrodes axis orientation
Ice surface uniformity
Cooling temperature
Ice accumulation process
Electric field during cooling
Dimension
[x104S/m]
[°C]
[mm]
[mm]
[°C]
Chosen values
1.0/100/1000 (UBC)
2.5/30/80/160(UQAC)
-20 / 0 (UBC)
-12/-4/0(UQAC)
+ /-
7/18
0.9/6/15.5
horizontal / vertical
with / without artificial air gap
-2/-12/-25
freezing / atmospheric
with / without
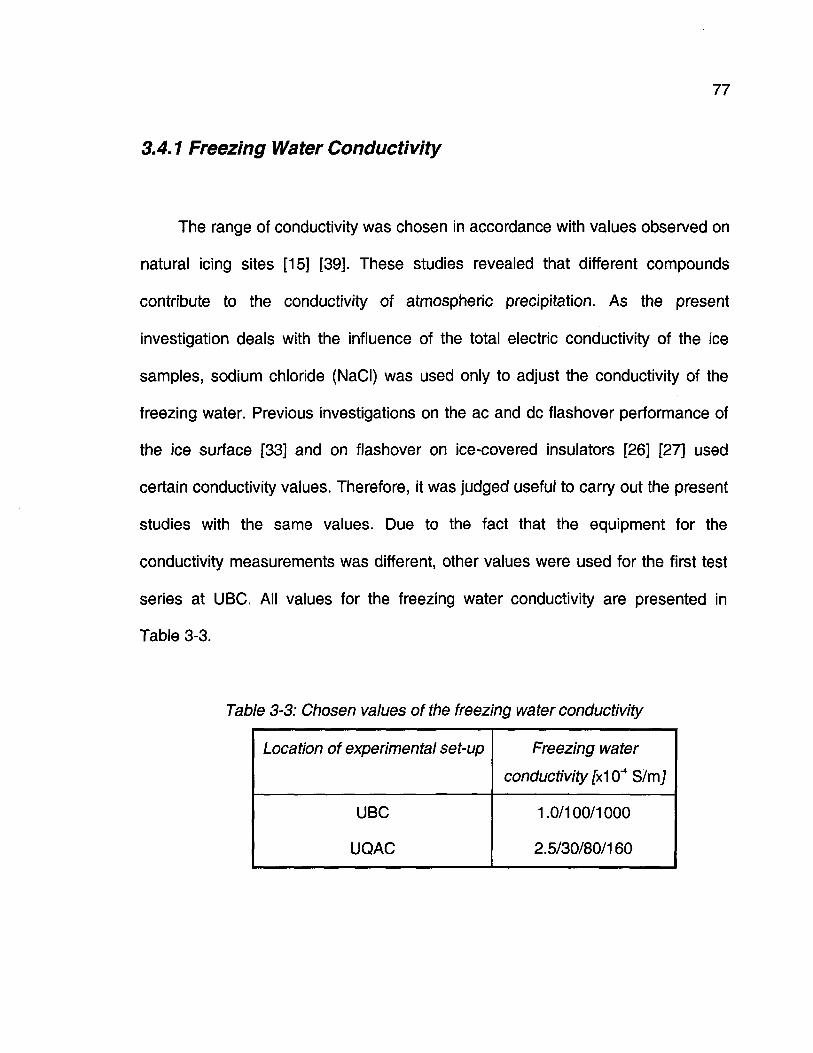
77
3.4.1 Freezing Water Conductivity
The range of conductivity was chosen in accordance with values observed on
natural icing sites [15] [39]. These studies revealed that different compounds
contribute to the conductivity of atmospheric precipitation. As the present
investigation deals with the influence of the total electric conductivity of the ice
samples, sodium chloride (NaCI) was used only to adjust the conductivity of the
freezing water. Previous investigations on the ac and dc flashover performance of
the ice surface [33] and on flashover on ice-covered insulators [26] [27] used
certain conductivity values. Therefore, it was judged useful to carry out the present
studies with the same values. Due to the fact that the equipment for the
conductivity measurements was different, other values were used for the first test
series at UBC. All values for the freezing water conductivity are presented in
Table 3-3.
Table 3-3: Chosen values of the freezing water conductivity
Location of experimental set-up
UBC
UQAC
Freezing water
conductivity WO* S/mJ
1.0/100/1000
2.5/30/80/160
78
As it is quite difficult to determine precisely the electric conductivity of ice,
especially to differentiate between surface and bulk conduction, a common
procedure in the laboratories of CIGELE/UQAC [24] [26] [27] [34] as well as in
other research institutions [6] [53] [77] [96] [110] is to measure the freezing water
conductivity before forming the ice samples. To obtain water with a certain
conductivity, sodium chloride (NaCI) is added to de-ionised water while its
conductivity is constantly measured with a conductivity-meter type "Yokogawa
SC82", until the desired value of conductivity was reached. With this method, it is
ensured that the chosen value is obtained exactly, even if the conductivity of the
de-ionised water changes or the salt used is of inconsistent quality.
As the electric conductivity of water changes with temperature, all the
conductivity data are corrected for a temperature of 20° C. Details on the correction
procedure can be found in Appendix 10.
3.4.2 Ice Temperature
It was judged to be interesting to study the electrical phenomena for an ice
temperature well below the melting point, and for a temperature of 0° C, when the
surface of the ice starts to melt. These two temperatures would simulate the two
opposite conditions of dry and wet ice surfaces. They were already used in a
preceding study on ac and dc flashover performance of the ice surface [33].
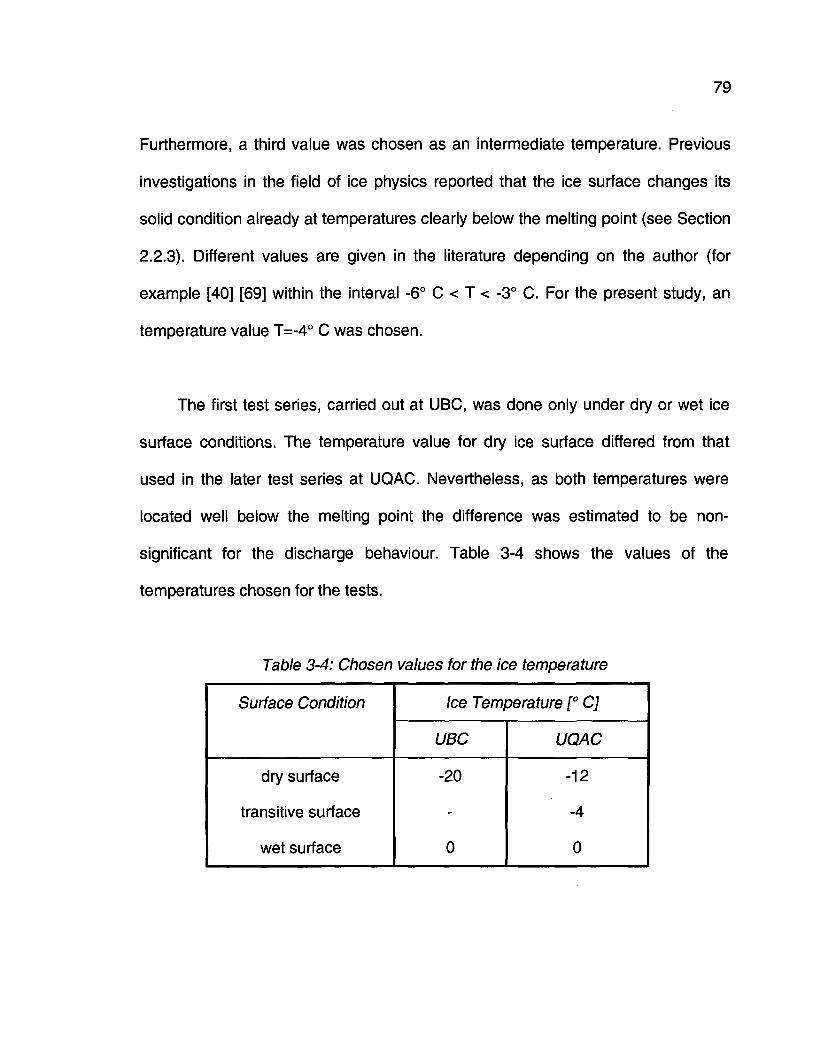
79
Furthermore, a third value was chosen as an intermediate temperature. Previous
investigations in the field of ice physics reported that the ice surface changes its
solid condition already at temperatures clearly below the melting point (see Section
2.2.3). Different values are given in the literature depending on the author (for
example [40] [69] within the interval -6° C < T < -3° C. For the present study, an
temperature value T=-4° C was chosen.
The first test series, carried out at UBC, was done only under dry or wet ice
surface conditions. The temperature value for dry ice surface differed from that
used in the later test series at UQAC. Nevertheless, as both temperatures were
located well below the melting point the difference was estimated to be non-
significant for the discharge behaviour. Table 3-4 shows the values of the
temperatures chosen for the tests.
Table 3-4: Chosen values for the ice temperature
Surface Condition
dry surface
transitive surface
wet surface
Ice Temperature [° C]
UBC
-20
0
UQAC
-12
-4
0
80
Even for the highest value of freezing water conductivity, the percentage of
NaCI in the water solution was very low so that the freezing temperature did not
change observably (see Appendix 10 and phase diagram in Appendix 1).
Therefore, it can be assumed that no water film exists on the ice surface at the
chosen temperatures for the surface condition "dry ice surface". However, the
particular characteristics of the uppermost molecular layers along the ice surface
have to be kept in mind (see Section 2.2.3) [64] [74] [75] [112].
The temperature was measured with two different thermometers. The first
thermometer is part of the "Envirotronics"- cold chamber. It is a digital meter with a
resolution of +/- 0.1° C. It measures the ambient air temperature in the upper
section of the chamber. As the air was constantly circulated inside the chamber,
the air temperature was considered to be constant throughout the whole volume of
the cold chamber. A second digital thermometer was glued to the metal table, on
which the ice samples where placed for the tests.
The models were placed in their final test position on the table inside the cold
chamber about one hour before each test, to allow the temperature of the ice
sample and surrounding air volume to reach a stable value. It was estimated that
the heat exchange between the ice sample, the Plexiglas mould, and the metal
table would be sufficient to equalise any temperature differences. Using this
81
consideration, all temperature values given in this report may be regarded as "ice
temperature".
3.4.3 Voltage Waveform
All experiments in the framework of this study were carried out using lightning
impulse (LI) voltages (see Section 3.2.3). To reasons may justify this choice:
� The main reason for the decision to use LI voltage is the fact that the well-
defined voltage peak value of the impulse is needed to trigger the ultra high-
speed camera. Otherwise, ultra-high speed recordings become very difficult
with today's available camera technologies, as very long optical delays
(several hundreds of nanoseconds) would be necessary [56].
� As the duration of voltage application is very short for such a type of voltage
impulse, no important melting processes are expected, which would alter the
ice surface condition and influence the discharge processes.
As the transmission of electric energy in actual power networks is done using
ac voltage and also dc voltage for very long distances, the question may be raised
what value the experiments with LI voltages would have. The interpretation of the
experimental outcome has to be done carefully. However, the results may be
useful under several viewpoints:
82
� The breakdown behaviour under lightning impulse is an important parameter
for insulation co-ordination. In some cases, power networks can work well
under stationary conditions, whereas transient events and overcharges set off
breakdown processes on insulators. In theses cases, impulses voltages are
superposed to the stationary ac or dc voltage and the knowledge of their
characteristics becomes very important.
� Until now, most flashover tests on ice-covered insulators were carried out
using ac and dc voltages. If more tests on actual ice-covered insulators will
be realised applying impulse voltage, then, results of fundamental studies
such as this one can be compared to the data obtained on industrial
insulators. The necessary HV infrastructure is now available at UQAC [23];
thus, this kind of comparison will be possible in the near future.
� Some data is available on the breakdown characteristics of ice surfaces
under ac and dc voltages [33]. The comparison of these results and the
measurements from the present study may enable some general conclusions
for any voltage type.
3.4.4 Voltage Polarity
Due to the symmetrical electrode configuration of the test specimen, no
polarity effect may be expected for voltage or current measurements. On the other
hand, optical investigations may reveal distinct processes in the vicinity of the two
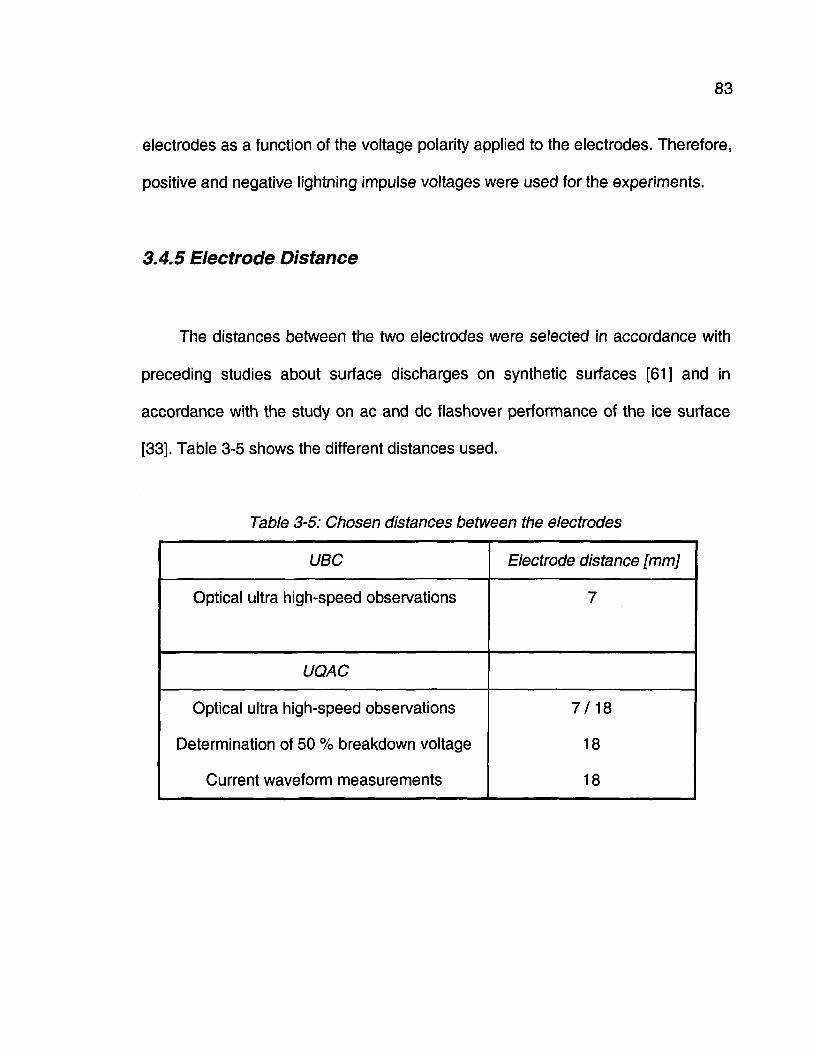
83
electrodes as a function of the voltage polarity applied to the electrodes. Therefore,
positive and negative lightning impulse voltages were used for the experiments.
3.4.5 Electrode Distance
The distances between the two electrodes were selected in accordance with
preceding studies about surface discharges on synthetic surfaces [61] and in
accordance with the study on ac and dc flashover performance of the ice surface
[33]. Table 3-5 shows the different distances used.
Table 3-5: Chosen distances between the electrodes
UBC
Optical ultra high-speed observations
UQAC
Optical ultra high-speed observations
Determination of 50 % breakdown voltage
Current waveform measurements
Electrode distance [mm]
7
7/18
18
18
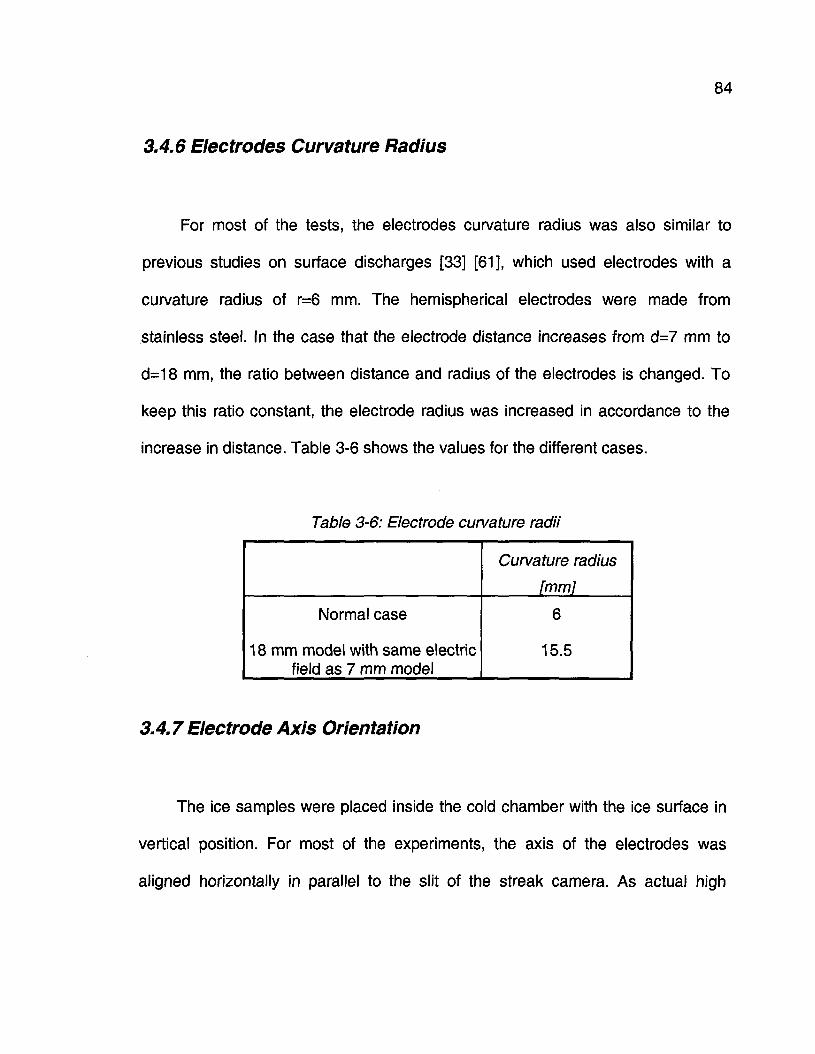
84
3.4.6 Electrodes Curvature Radius
For most of the tests, the electrodes curvature radius was also similar to
previous studies on surface discharges [33] [61], which used electrodes with a
curvature radius of r=6 mm. The hemispherical electrodes were made from
stainless steel. In the case that the electrode distance increases from d=7 mm to
d=18 mm, the ratio between distance and radius of the electrodes is changed. To
keep this ratio constant, the electrode radius was increased in accordance to the
increase in distance. Table 3-6 shows the values for the different cases.
Table 3-6: Electrode curvature radii
Normal case
18 mm model with same electricfield as 7 mm model
Curvature radius
[mm]
6
15.5
3.4.7 Electrode Axis Orientation
The ice samples were placed inside the cold chamber with the ice surface in
vertical position. For most of the experiments, the axis of the electrodes was
aligned horizontally in parallel to the slit of the streak camera. As actual high
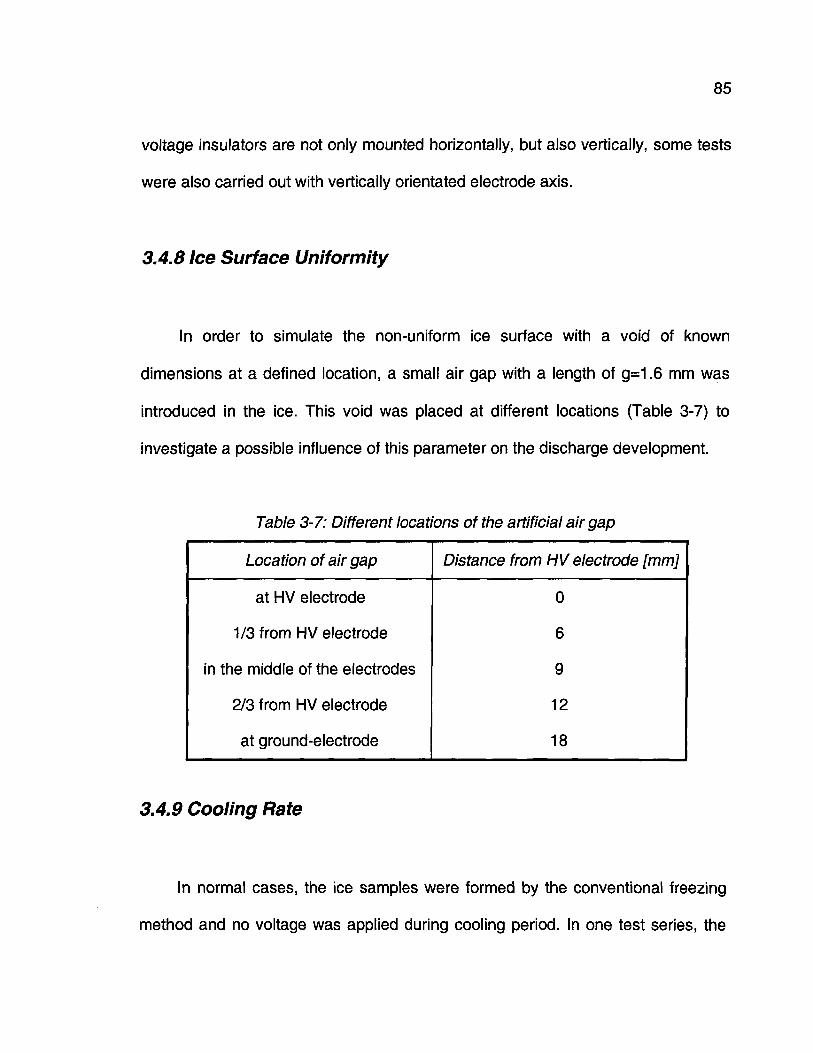
85
voltage insulators are not only mounted horizontally, but also vertically, some tests
were also carried out with vertically orientated electrode axis.
3.4.8 Ice Surface Uniformity
In order to simulate the non-uniform ice surface with a void of known
dimensions at a defined location, a small air gap with a length of g=1.6 mm was
introduced in the ice. This void was placed at different locations (Table 3-7) to
investigate a possible influence of this parameter on the discharge development.
Table 3-7: Different locations of the artificial air gap
Location of air gap
at HV electrode
1/3 from HV electrode
in the middle of the electrodes
2/3 from HV electrode
at ground-electrode
Distance from HV electrode [mm]
0
6
9
12
18
3.4.9 Cooling Rate
In normal cases, the ice samples were formed by the conventional freezing
method and no voltage was applied during cooling period. In one test series, the
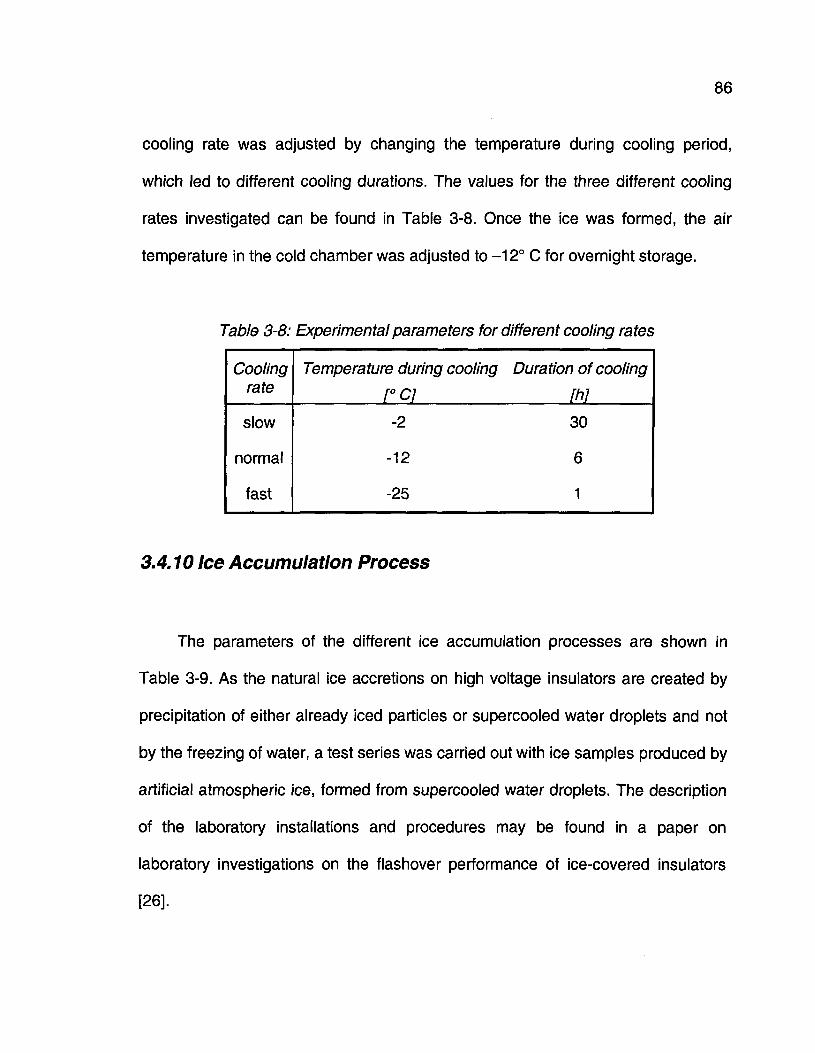
86
cooling rate was adjusted by changing the temperature during cooling period,
which led to different cooling durations. The values for the three different cooling
rates investigated can be found in Table 3-8. Once the ice was formed, the air
temperature in the cold chamber was adjusted to -12° C for overnight storage.
Table 3-8: Experimental parameters for different cooling rates
Coolingrate
slow
normal
fast
Temperature during cooling
[°C]
-2
-12
-25
Duration of cooling
[hi
30
6
1
3.4.10 Ice Accumulation Process
The parameters of the different ice accumulation processes are shown in
Table 3-9. As the natural ice accretions on high voltage insulators are created by
precipitation of either already iced particles or supercooled water droplets and not
by the freezing of water, a test series was carried out with ice samples produced by
artificial atmospheric ice, formed from supercooled water droplets. The description
of the laboratory installations and procedures may be found in a paper on
laboratory investigations on the flashover performance of ice-covered insulators
[26].
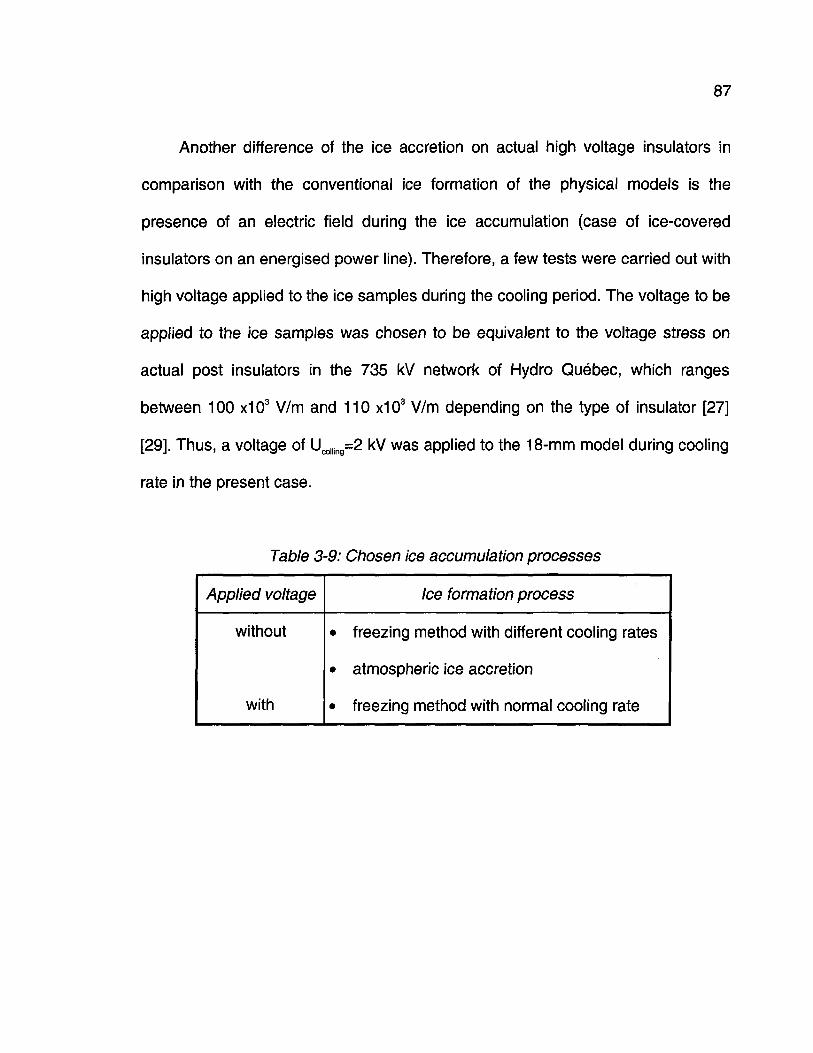
87
Another difference of the ice accretion on actual high voltage insulators in
comparison with the conventional ice formation of the physical models is the
presence of an electric field during the ice accumulation (case of ice-covered
insulators on an energised power line). Therefore, a few tests were carried out with
high voltage applied to the ice samples during the cooling period. The voltage to be
applied to the ice samples was chosen to be equivalent to the voltage stress on
actual post insulators in the 735 kV network of Hydro Québec, which ranges
between 100 x103 V/m and 110 x103 V/m depending on the type of insulator [27]
[29]. Thus, a voltage of Ucolling=2 kV was applied to the 18-mm model during cooling
rate in the present case.
Table 3-9: Chosen ice accumulation processes
Applied voltage
without
with
Ice formation process
� freezing method with different cooling rates
� atmospheric ice accretion
� freezing method with normal cooling rate
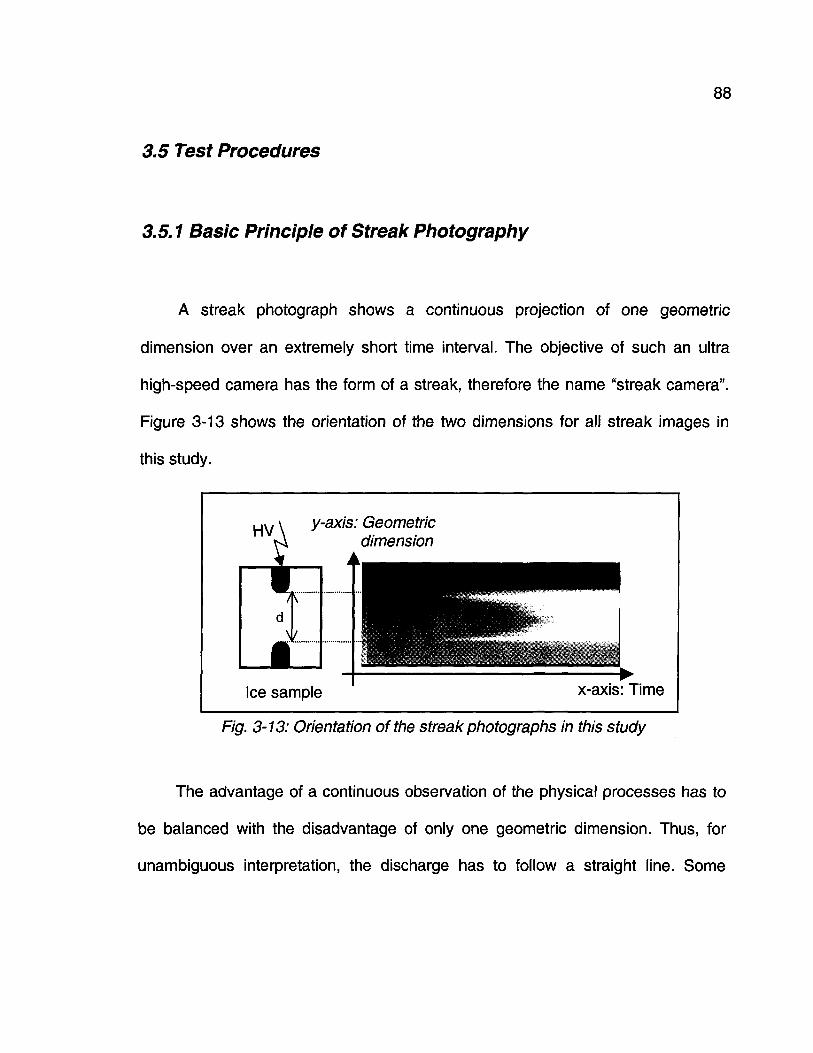
88
3.5 Test Procedures
3.5.1 Basic Principle of Streak Photography
A streak photograph shows a continuous projection of one geometric
dimension over an extremely short time interval. The objective of such an ultra
high-speed camera has the form of a streak, therefore the name "streak camera".
Figure 3-13 shows the orientation of the two dimensions for all streak images in
this study.
HV \ y~axis: Geometricdimension
Ice sample x-axis: Time
Fig. 3-13: Orientation of the streak photographs in this study
The advantage of a continuous observation of the physical processes has to
be balanced with the disadvantage of only one geometric dimension. Thus, for
unambiguous interpretation, the discharge has to follow a straight line. Some
89
measures were mentioned earlier to ensure such a discharge behaviour without
influencing the discharge process (Section 3.3.3).
3.5.2 Interpretation of Streak Recordings
Modern streak camera systems represent powerful tools to study the very fast
processes of early surface discharge development. Recording, storage, and
processing of the streak images are done by digital image processing in recent
generations of these systems. This has several advantages, for example,
immediate review of the image, no loss of material, and money in the case of
insignificant photographs, and powerful image post-processing. However, the
interpretation of the results has to be carried out very carefully, as the digital image
processing can easily lead to misinterpretations. With the system used in this
study, the analysis of the light intensities is limited as this data got lost during the
digital image processing.
The streak camera produces an artificially coloured image, which is stored on
the control computer in a camera-specific format. To export the image, it is
transformed into a "tif-type" file, in which the information on colour is lost. This
black-and-white image is then transferred to another computer, where it was
processed with different software packages. For the present study, MS-Photoeditor
(version 3.0) and Adobe PhotoShop (version 5.0) were used in most cases. The
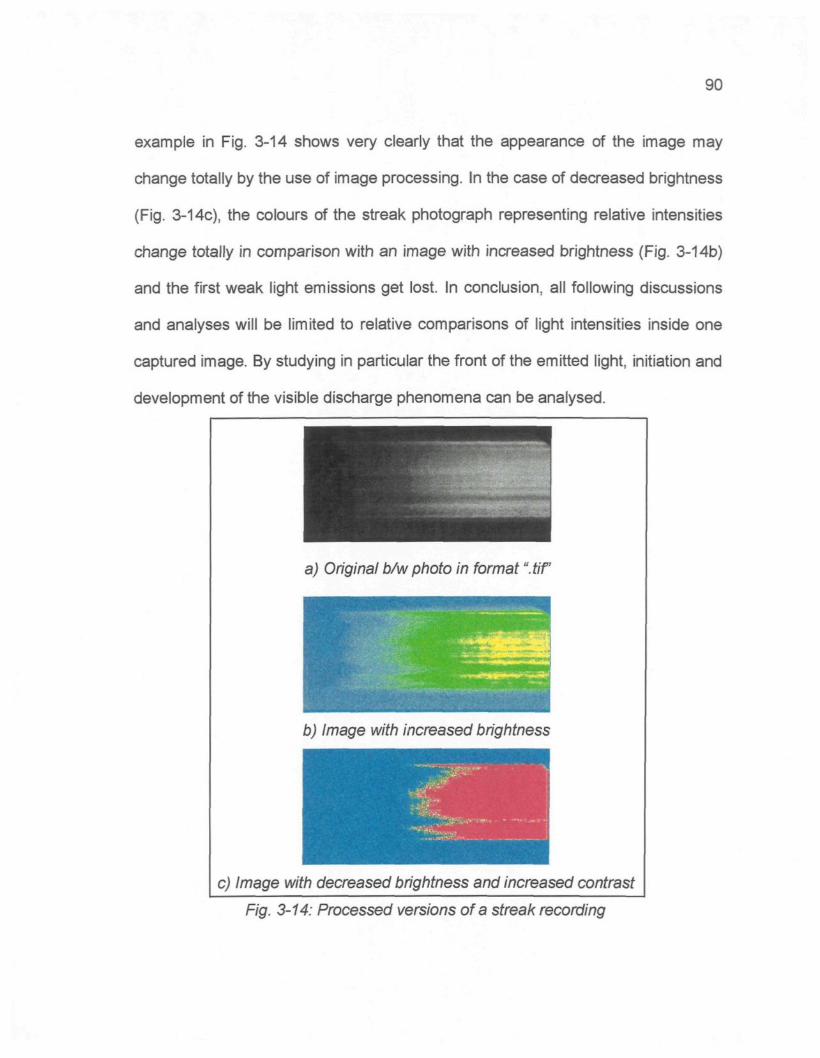
90
example in Fig. 3-14 shows very clearly that the appearance of the image may
change totally by the use of image processing, in the case of decreased brightness
(Fig. 3-14c), the colours of the streak photograph representing relative intensities
change totally in comparison with an image with increased brightness (Fig. 3-14b)
and the first weak light emissions get lost. In conclusion, all following discussions
and analyses will be limited to relative comparisons of light intensities inside one
captured image. By studying in particular the front of the emitted light, initiation and
development of the visible discharge phenomena can be analysed.
a) Original b/w photo in format ". tif
b) Image with increased brightness
:
� t « * W i " � -
c) Image with decreased brightness and increased contrast
Fig. 3-14: Processed versions of a streak recording
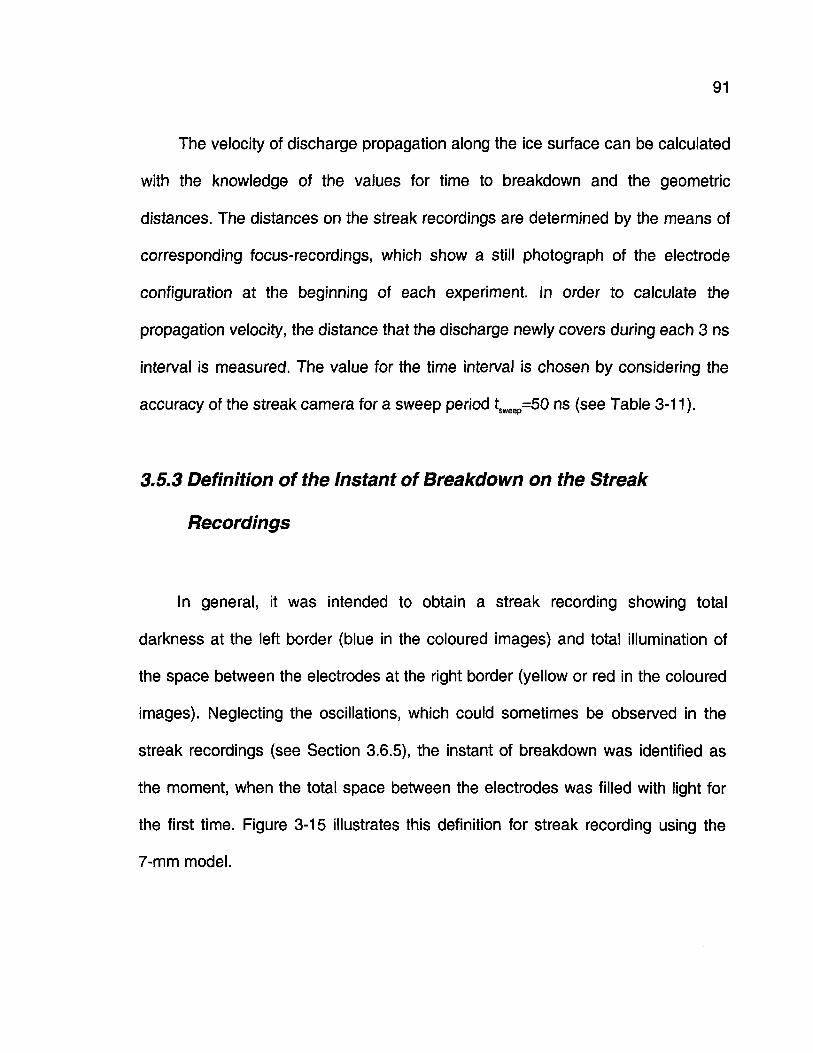
91
The velocity of discharge propagation along the ice surface can be calculated
with the knowledge of the values for time to breakdown and the geometric
distances. The distances on the streak recordings are determined by the means of
corresponding focus-recordings, which show a still photograph of the electrode
configuration at the beginning of each experiment. In order to calculate the
propagation velocity, the distance that the discharge newly covers during each 3 ns
interval is measured. The value for the time interval is chosen by considering the
accuracy of the streak camera for a sweep period tsweep=50 ns (see Table 3-11 ).
3.5.3 Definition of the Instant of Breakdown on the Streak
Recordings
In general, it was intended to obtain a streak recording showing total
darkness at the left border (blue in the coloured images) and total illumination of
the space between the electrodes at the right border (yellow or red in the coloured
images). Neglecting the oscillations, which could sometimes be observed in the
streak recordings (see Section 3.6.5), the instant of breakdown was identified as
the moment, when the total space between the electrodes was filled with light for
the first time. Figure 3-15 illustrates this definition for streak recording using the
7-mm model.
92
First dischargeactivity in front of
HV-electrode
Second dischargeactivity in front ofground-electrode
Instant ofbreakdown
Fig. 3-15: Determination of the instant of breakdown
During the streak recordings, the sensitivity of the camera was adjusted so
that the light emitted would not damage the camera at the moment of breakdown.
This adjustment produced, on the other hand, the effect that pre-discharge
phenomena with very weak light emissions might not be seen on the recordings.
This disadvantage had to be accepted to prevent any damage or destruction of the
fragile ultra high-speed camera. At this point, it is reminded that all results and
discussions in the following chapters deal with the "visible" discharge phenomena
under the experimental conditions explained.
3.5.4 Determination of 50 % Lightning Impulse Breakdown Voltage
The 50 % lightning impulse breakdown voltage was determined according to
IEC-507 [51] and IEC-60-2 [50], The up-and-down method was used to perform the
experiments with steps of about 10 % of the supposed critical breakdown voltage.
93
For each test series, at least 10 useful tests were carried out. If the experiment
resulted in breakdown, the test voltage was reduced one step. After a withstand
test, the voltage was increased one step. After each voltage application, regardless
of the result, breakdown or withstand, the ice specimen was replaced to ensure
that only one voltage impulse was applied to each ice sample. The calculation of
the 50 % breakdown voltage was based on 10 experimental results. The first
"useful" result was encountered when the outcome of the experiment did change
(from withstand to breakdown or vice versa). This result and the nine following
were considered for the calculation. The 50 % lightning impulse breakdown voltage
was determined by calculating the mean value with equation e3-4.
^ e3-4
U, peak value of applied impulse voltage
n. Number of tests with the same voltage value
N Number of useful tests
3.5.5 Interpretation of Current Waveforms
The measurement of the leakage currents and current peaks in the case of
breakdown under high voltage and for the very fast events like lightning impulses
presents a complex technical task. The main aspect of the present study is the
ultra high-speed observation of the first visible discharge phenomenon. In addition,
electrical measurements were made to provide more data in addition to the
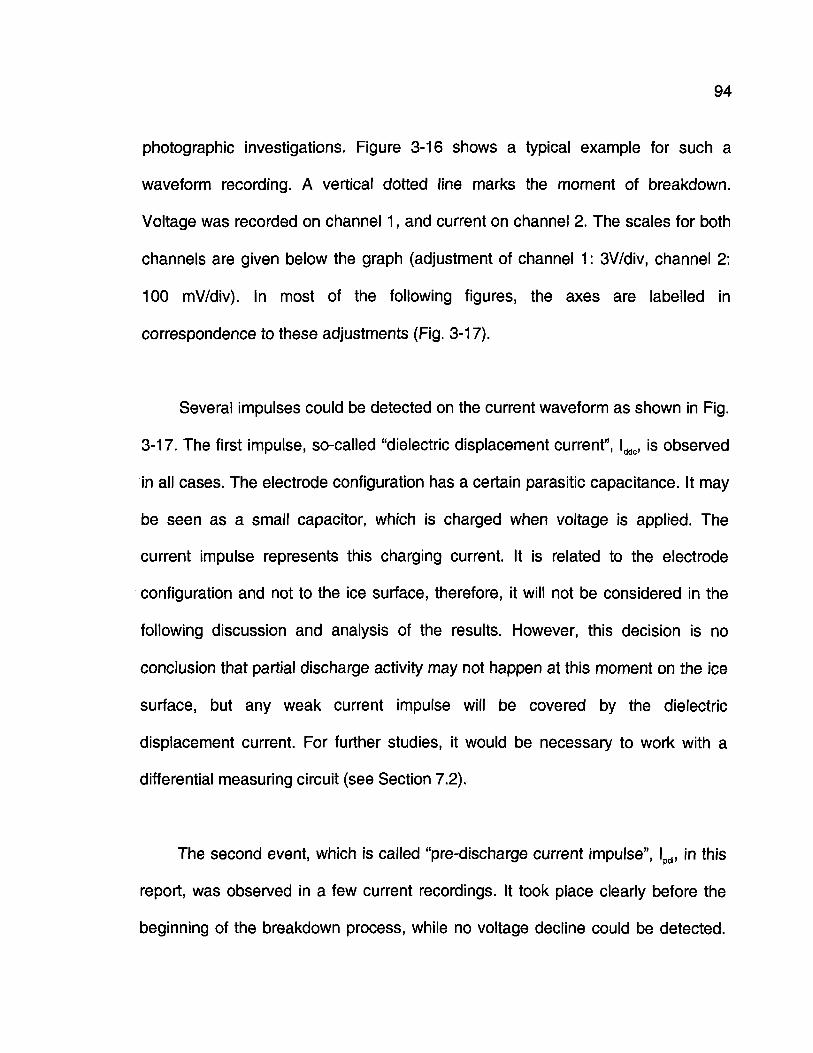
94
photographie investigations. Figure 3-16 shows a typical example for such a
waveform recording. A vertical dotted line marks the moment of breakdown.
Voltage was recorded on channel 1, and current on channel 2. The scales for both
channels are given below the graph (adjustment of channel 1: 3V/div, channel 2:
100 mV/div). In most of the following figures, the axes are labelled in
correspondence to these adjustments (Fig. 3-17).
Several impulses could be detected on the current waveform as shown in Fig.
3-17. The first impulse, so-called "dielectric displacement current", lddc, is observed
in all cases. The electrode configuration has a certain parasitic capacitance. It may
be seen as a small capacitor, which is charged when voltage is applied. The
current impulse represents this charging current. It is related to the electrode
configuration and not to the ice surface, therefore, it will not be considered in the
following discussion and analysis of the results. However, this decision is no
conclusion that partial discharge activity may not happen at this moment on the ice
surface, but any weak current impulse will be covered by the dielectric
displacement current. For further studies, it would be necessary to work with a
differential measuring circuit (see Section 7.2).
The second event, which is called "pre-discharge current impulse", lpdi, in this
report, was observed in a few current recordings. It took place clearly before the
beginning of the breakdown process, while no voltage decline could be detected.
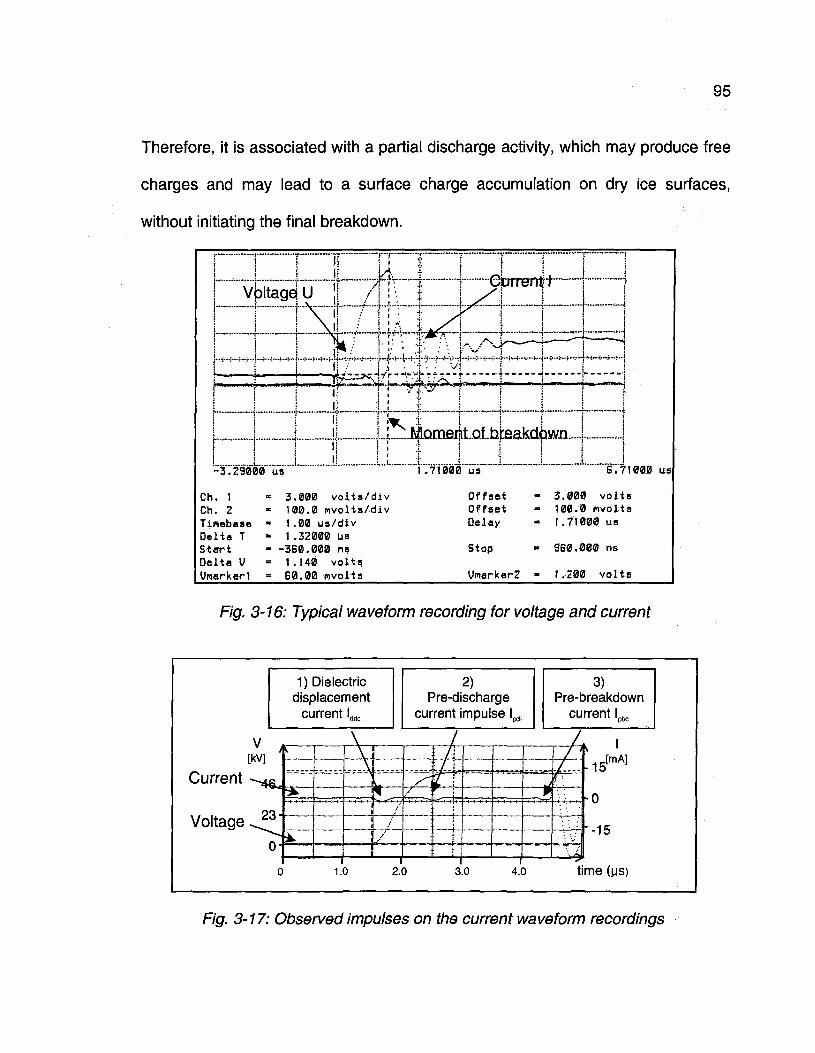
95
Therefore, it is associated with a partial discharge activity, which may produce free
charges and may lead to a surface charge accumulation on dry ice surfaces,
without initiating the final breakdown.
i�
v. J. , L:A li.-^. - - ! �
-O"9000"us! i L .t j . _ _
1.71000 us......
6.71000 us
Ch. 1 = 3.000 volts/divCh. 2 - 100.0 mvolis/divTimebase " 1.00 us/divDelta T - 1.32000 usStart - -3B0.000 naDelta V - 1.140 voltsVnarkeri * 60.00 mvolts
OffsetOffsetDelay
Stop
VeiarkerZ
3.000 volts100.0 mvolts1.71000 us
960.000 ns
1.200 volts
Fig. 3-16: Typical waveform recording for voltage and current
1) Dielectricdisplacement
current lddc
2)Pre-discharge
current impulse l^,
3)Pre-breakdown
current lpbc
Current
Voltage
V A ^v / ,<V1
o-��
/\ i /'
w
/
-14
-0
� - 1 5
1.0 2.0 3.0 4.0 time (us)
Fig. 3-17: Observed impulses on the current waveform recordings
96
Finally, a third current event could be observed in all waveform
measurements, which happened immediately before breakdown. Thus, it is called
"pre-breakdown current", lpbc. This current changed slightly as a function of certain
experimental parameters and will be object of the discussion in Section 6.
The experiments showed that the experimental set-up for current
measurements was not free of reflections and the HV circuit had some parasitic
impedances and capacitances. In addition, the measured values for the current
were not very high due to the means of protection for the oscilloscope. Thus, the
analysis of the results has to be made carefully. As already mentioned in relation to
light intensities of the discharge phenomena in the streak recordings, the
interpretation of the current measurements will be limited to the study of waveform
shapes and to relative comparisons of the current values.
3.6 Error Discussions
3.6.1 Accuracy in the Determination of 50 % Breakdown Voltage
As no international standard exists yet prescribing the determination of any
critical breakdown voltage on ice surfaces, the international standard IEC 507 for
97
artificial pollution tests on high voltage insulators [51] was applied to obtain the
50 % lightning impulse breakdown voltages. The choice of the voltage step was
affected by the control of the available high voltage generator. Each step of 5 V of
the regulated voltage corresponds to a step of 2.5 kV of the peak value of the high
voltage impulse. IEC 507 stipulates a step of about 10 % of the estimated 50 %
breakdown voltage. Under certain experimental conditions, the results dropped
below 25 kV, though the voltage step exceeds 10 % for these cases. Standard
deviation, s, is given for all results in order to estimate the exactitude of the
statistical mean value.
3.6.2 Temperature Characteristics of Current Shunt
The value of the current shunt was measured at ambient temperature,
whereas during the experiments, the shunt was placed in the cold chamber near to
the test sample. Therefore, the change of resistance value with temperature has to
be considered. As an average value derived from data of different manufacturers, a
temperature dependence of 1000 ppm/° C can be assumed for a carbon
resistance. For a difference between temperature at measurement (25° C) and test
temperature (varying between -12° C and 0° C), a worst-case estimation can be
done for a value of 37 K. In this case, the reduction of the resistance amounts to
-3.7 %, thus, the value of current shunt no. 1 (small shunt with R25 oc=1.45 Q) at
T=-12° C changes to R12,c=1,4 Q.
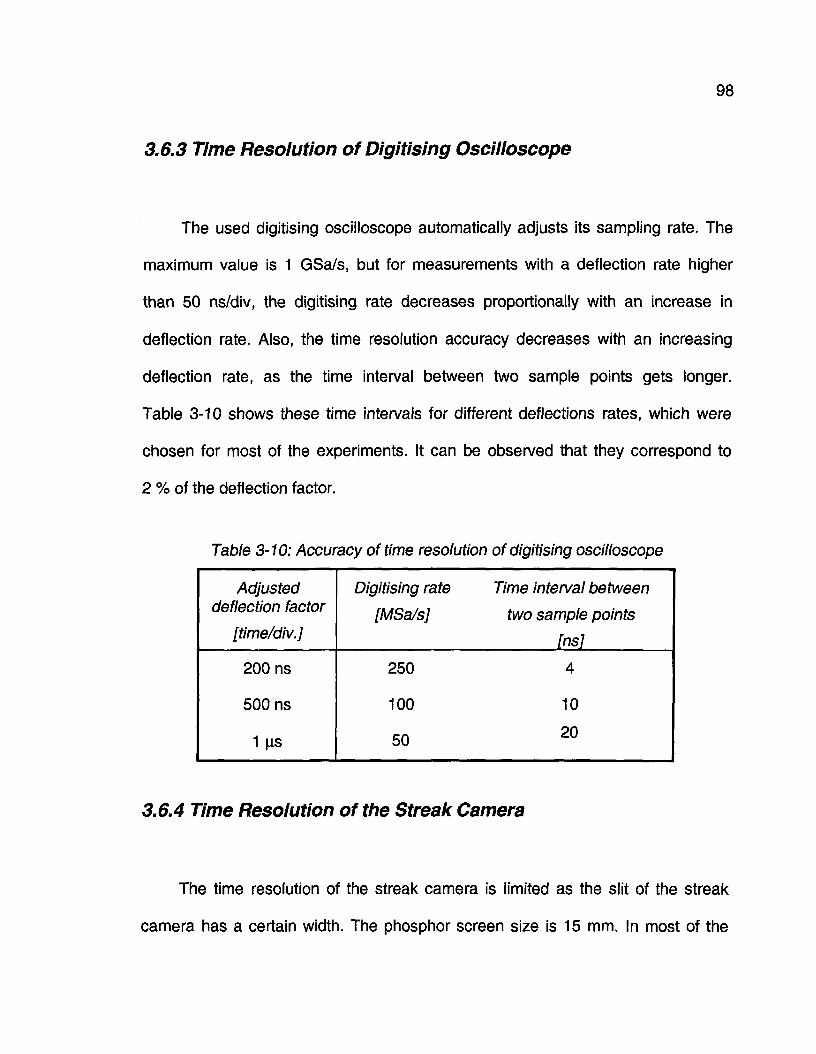
98
3.6.3 Time Resolution of Digitising Oscilloscope
The used digitising oscilloscope automatically adjusts its sampling rate. The
maximum value is 1 GSa/s, but for measurements with a deflection rate higher
than 50 ns/div, the digitising rate decreases proportionally with an increase in
deflection rate. Also, the time resolution accuracy decreases with an increasing
deflection rate, as the time interval between two sample points gets longer.
Table 3-10 shows these time intervals for different deflections rates, which were
chosen for most of the experiments. It can be observed that they correspond to
2 % of the deflection factor.
Table 3-10: Accuracy of time resolution of digitising oscilloscope
Adjusteddeflection factor
[time/div.]
200 ns
500 ns
1 us
Digitising rate Time interval between
[MSa/s] two sample points
[ns]
250 4
100 10
50 2 0
3.6.4 Time Resolution of the Streak Camera
The time resolution of the streak camera is limited as the slit of the streak
camera has a certain width. The phosphor screen size is 15 mm. In most of the
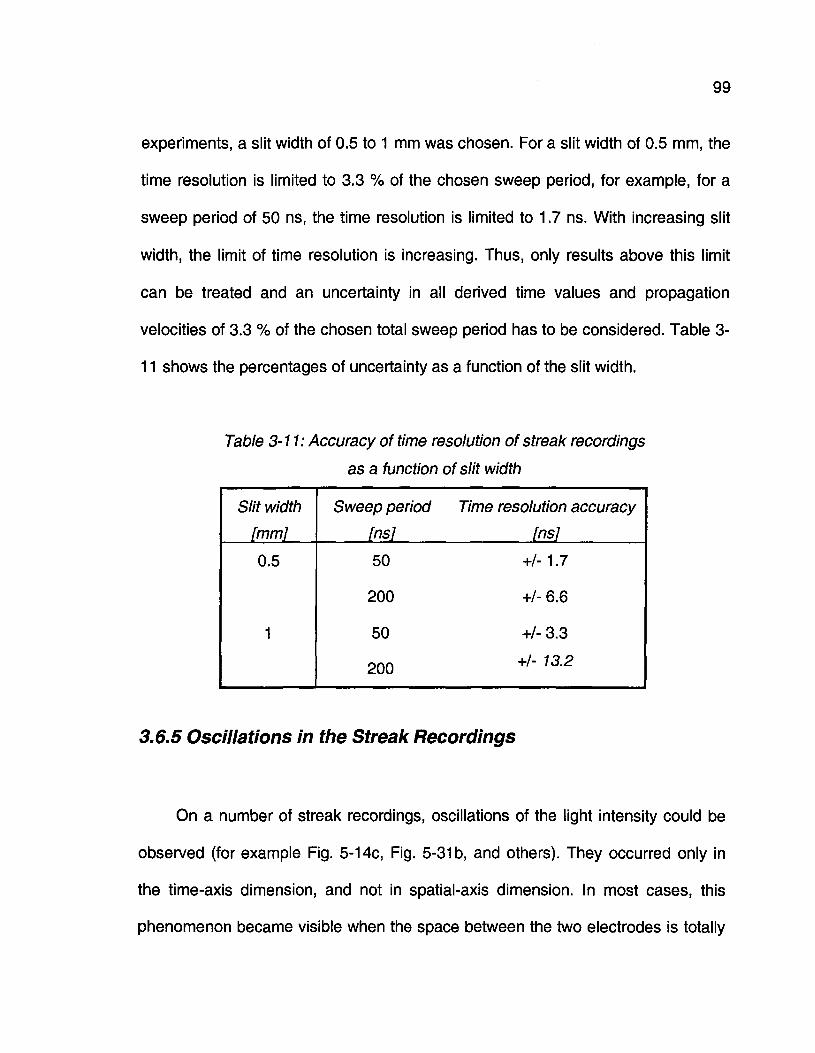
99
experiments, a slit width of 0.5 to 1 mm was chosen. For a slit width of 0.5 mm, the
time resolution is limited to 3.3 % of the chosen sweep period, for example, for a
sweep period of 50 ns, the time resolution is limited to 1.7 ns. With increasing slit
width, the limit of time resolution is increasing. Thus, only results above this limit
can be treated and an uncertainty in all derived time values and propagation
velocities of 3.3 % of the chosen total sweep period has to be considered. Table 3-
11 shows the percentages of uncertainty as a function of the slit width.
Table 3-11: Accuracy of time resolution of streak recordings
as a function of slit width
Slit width
[mm]
0.5
1
Sweep period
[ns]
50
200
50
200
Time resolution accuracy
[ns]
+/-1.7
+/- 6.6
+/- 3.3
+/- 13.2
3.6.5 Oscillations in the Streak Recordings
On a number of streak recordings, oscillations of the light intensity could be
observed (for example Fig. 5-14c, Fig. 5-31 b, and others). They occurred only in
the time-axis dimension, and not in spatial-axis dimension. In most cases, this
phenomenon became visible when the space between the two electrodes is totally
100
filled with light (after breakdown occurred). It was also recorded for surface
discharges along various synthetic insulators (Fig. 5-3) and for air gap discharges
(Fig. 5-1). In the last case, time to breakdown is much longer and the oscillations
can already be seen before final breakdown. At several moments during the
experimental phases, questions about the origins and meaning of these oscillations
were raised. In the following paragraphs, this phenomenon is discussed and
different hypotheses for its explication are proposed.
The oscillations were observed for all kinds of different surface materials:
Synthetic spacer, ice samples, and also for experiments with air gaps. The
oscillations were observed at two different laboratory locations (UBC and UQAC)
on two different experimental set-ups. They appeared to be the same for both set-
ups. No influence by any of the experimental parameters (freezing water
conductivity, temperature, electrode distance etc.) could be identified. The only
parameter, which apparently influenced the oscillations, was the adjusted sweep
period of the streak camera. For a sweep period of 200 ns, about 40 cycles could
be counted in a recording, whereas, a recording with a sweep period of 50 ns
showed about 10 cycles. Thus, it may be concluded that the oscillation has a
period of 5 ns. Considering the fact that the oscillations are independent of any
experimental parameters, it may be concluded that they are related to the process
of image acquisition and processing in the camera. As the camera was placed near
the high voltage generator and the test object, electromagnetic influences cannot
101
be excluded. The housing of the camera does not present an ideal screen, neither
do the Faraday-cage of the high-voltage area (see Fig. 3-3). The inside and
outside walls of the climate chamber, where the test object is placed, are metallic,
and may give a relatively good screening effect. Nevertheless, the window in the
front door and the rubber sealing around the door may restrict the screening effect
of the door.
In order to get more information on the theory that the camera could be the
possible source of these oscillations, the company was consulted for further
information. Two points can be retained from this contact [16]:
� The oscillations may results from electromagnetic noise applied to the streak
sweep electrode.
� On the other hand, the company estimates that streak sweep circuitry should
be immune to such high frequency electromagnetic noise (about 200 MHz).
Thus, no definite answer could be found on whether the camera would be the
source of the oscillation or not. Therefore, several theories were developed in order
to explain the oscillations, but in the most cases, reasons contradicting these
theories came up immediately. Nevertheless, these various theories will be
presented in what follows.
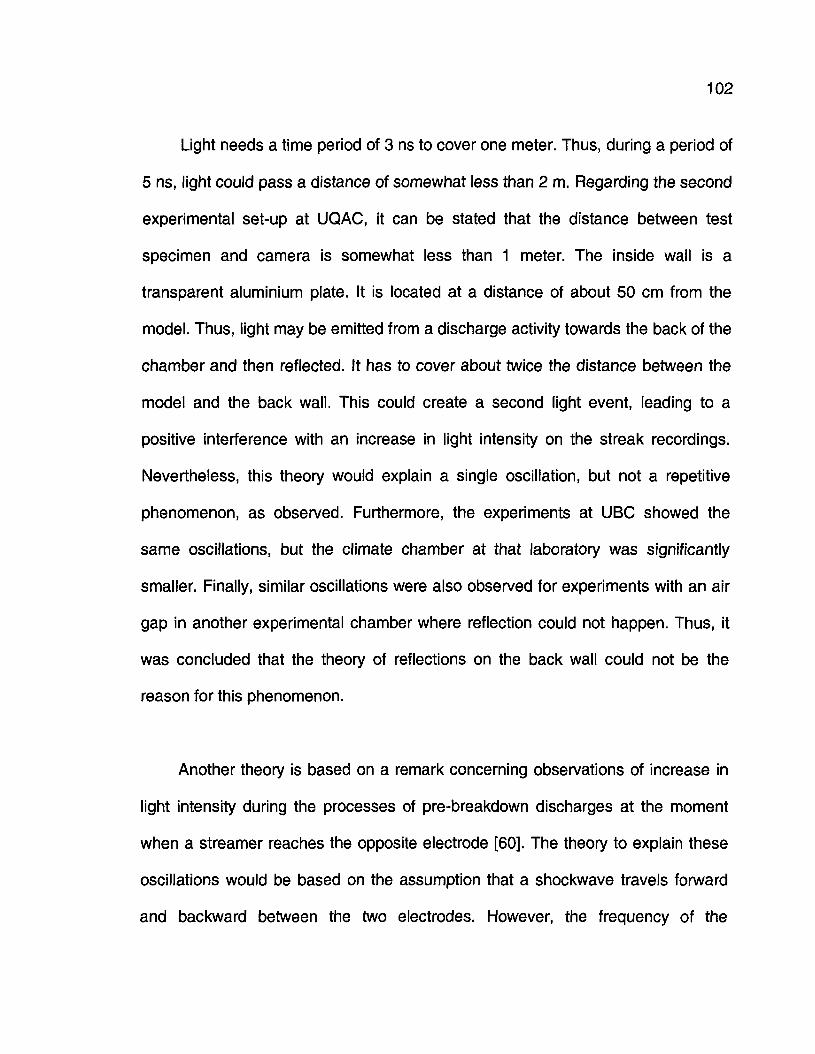
102
Light needs a time period of 3 ns to cover one meter. Thus, during a period of
5 ns, light could pass a distance of somewhat less than 2 m. Regarding the second
experimental set-up at UQAC, it can be stated that the distance between test
specimen and camera is somewhat less than 1 meter. The inside wall is a
transparent aluminium plate. It is located at a distance of about 50 cm from the
model. Thus, light may be emitted from a discharge activity towards the back of the
chamber and then reflected. It has to cover about twice the distance between the
model and the back wall. This could create a second light event, leading to a
positive interference with an increase in light intensity on the streak recordings.
Nevertheless, this theory would explain a single oscillation, but not a repetitive
phenomenon, as observed. Furthermore, the experiments at UBC showed the
same oscillations, but the climate chamber at that laboratory was significantly
smaller. Finally, similar oscillations were also observed for experiments with an air
gap in another experimental chamber where reflection could not happen. Thus, it
was concluded that the theory of reflections on the back wall could not be the
reason for this phenomenon.
Another theory is based on a remark concerning observations of increase in
light intensity during the processes of pre-breakdown discharges at the moment
when a streamer reaches the opposite electrode [60]. The theory to explain these
oscillations would be based on the assumption that a Shockwave travels forward
and backward between the two electrodes. However, the frequency of the
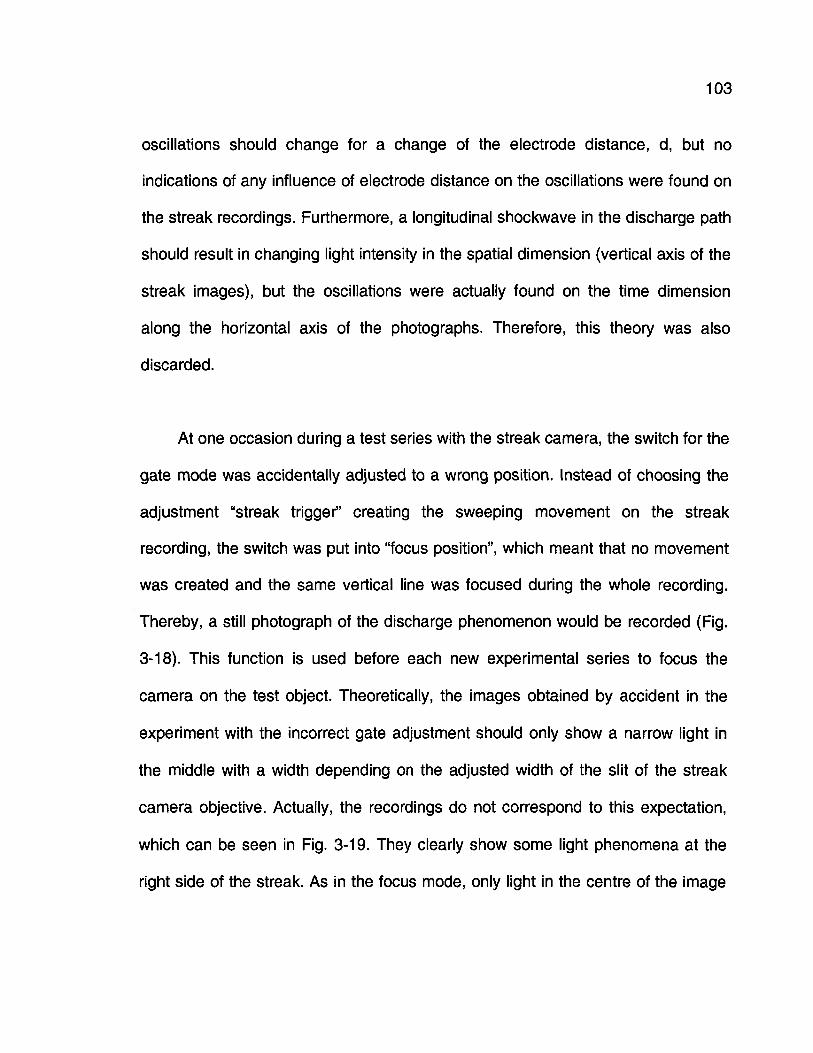
103
oscillations should change for a change of the electrode distance, d, but no
indications of any influence of electrode distance on the oscillations were found on
the streak recordings. Furthermore, a longitudinal Shockwave in the discharge path
should result in changing light intensity in the spatial dimension (vertical axis of the
streak images), but the oscillations were actually found on the time dimension
along the horizontal axis of the photographs. Therefore, this theory was also
discarded.
At one occasion during a test series with the streak camera, the switch for the
gate mode was accidentally adjusted to a wrong position. Instead of choosing the
adjustment "streak trigger" creating the sweeping movement on the streak
recording, the switch was put into "focus position", which meant that no movement
was created and the same vertical line was focused during the whole recording.
Thereby, a still photograph of the discharge phenomenon would be recorded (Fig.
3-18). This function is used before each new experimental series to focus the
camera on the test object. Theoretically, the images obtained by accident in the
experiment with the incorrect gate adjustment should only show a narrow light in
the middle with a width depending on the adjusted width of the slit of the streak
camera objective. Actually, the recordings do not correspond to this expectation,
which can be seen in Fig. 3-19. They clearly show some light phenomena at the
right side of the streak. As in the focus mode, only light in the centre of the image
104
(see Rg. 3-18) can be recorded, it is concluded that these phenomena do not
represent a real light emission, but are created artificially by the camera.
Fig. 3-18: Focus image recorded with the streak camera
(showing two lines of a newspaper in this example)
a)tsmmv=200ns
Fig. 3-19: Recordings with streak camera accidentally adjusted to focus mode
105
In another research institution, oscillations in ultra high-speed recordings
have been detected in a different context [18]. After several tests, it was found that
these oscillations were created by electromagnetic interference of the high voltage
generator to the high-speed camera [19]. As already mentioned earlier, strong
electric fields and important gradients of voltage and current exist, especially for
applications with high voltage impulse generators. They may cause interference,
which are able to bypass protective devices like grounding screens, if these are not
totally ideal. Such severe conditions were identified in the actual experimental set-
up. Considering the previous discussions, it is concluded at the present moment
that the oscillations observed may be related to the processes of image acquisition
and processing inside the camera.
CHAPTER 4
STUDY OF CRITICAL BREAKDOWN VOLTAGES
107
CHAPTER 4
STUDY OF CRITICAL BREAKDOWN VOLTAGES
4.1 Introduction to Chapter 4
The determination of the critical breakdown voltages of ice surfaces under
different conditions was the initial object of the experimental work, in order to
determine applied voltage values for optical investigations with the ultra high-speed
cameras. Furthermore, several parameters influencing the breakdown voltages
could be analysed. Measurements were carried out using the up-and-down method
according to IEC 507 [51]. The electrode distance was d=18 mm in these
experiments, and the electrode axis was placed horizontally (with exception of
results presented in Tables 4-5 and 4-6).
In Section 4.2, the results are presented in Tables 4-1 to 4-10, showing the
50 % lightning impulse breakdown voltage, U50%, and the standard deviation, s. In
108
addition, several still photographs of ice surfaces are shown to provide information
on ice morphology under different experimental parameters.
Afterwards, the effects of various experimental parameters on the ice surface
breakdown are analysed in Section 4.3. The following parameters were
investigated:
� Surface material
� Freezing water conductivity
� Ice temperature
� Voltage polarity
� Voltage waveform
� Electrode curvature radius
� Electrode axis orientation
� Ice surface uniformity
� Cooling rate
� Ice accumulation process
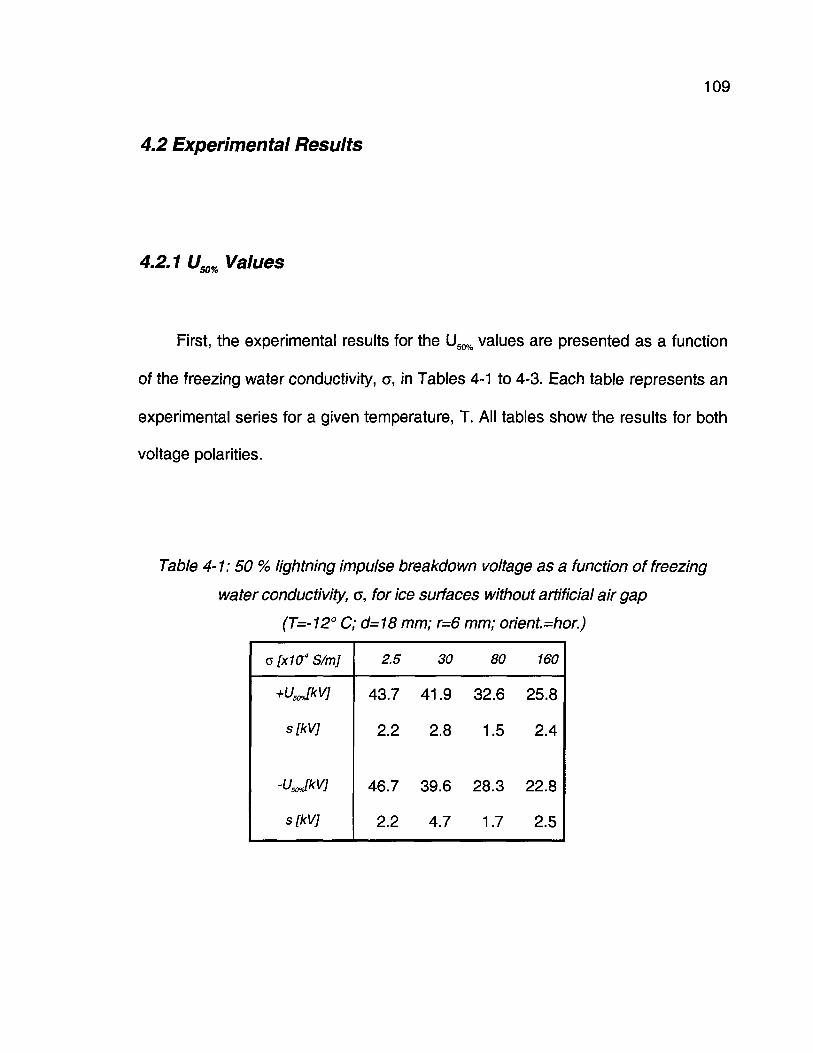
109
4.2 Experimental Results
4.2.1 U50% Values
First, the experimental results for the U50% values are presented as a function
of the freezing water conductivity, a, in Tables 4-1 to 4-3. Each table represents an
experimental series for a given temperature, T. All tables show the results for both
voltage polarities.
Table 4-1:50 % lightning impulse breakdown voltage as a function of freezing
water conductivity, o, for ice surfaces without artificial air gap
(T=-12° C; d=18 mm; r=6 mm; orient.=hor.)
a [X104 S/m]
+U5JkV]
s[kV]
-UsJkV]
s[kV]
2.5
43.7
2.2
46.7
2.2
30
41.9
2.8
39.6
4.7
80
32.6
1.5
28.3
1.7
160
25.8
2.4
22.8
2.5
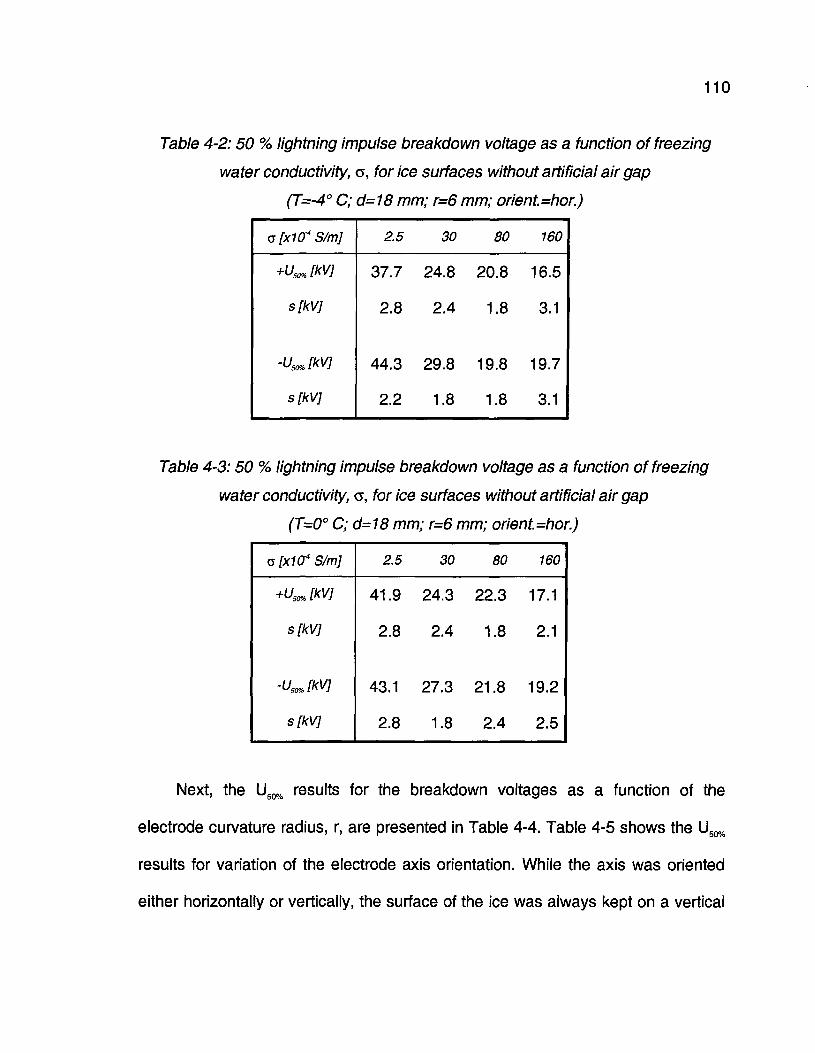
110
Table 4-2:50 % lightning impulse breakdown voltage as a function of freezing
water conductivity, o, for ice surfaces without artificial air gap
(T=-4° C; d=18 mm; r=6 mm; orient.=hor.)
or [X104 S/m]
+U5û%[kV]
s[kV]
-U50%[kV]
S[kV]
2.5
37.7
2.8
44.3
2.2
30
24.8
2.4
29.8
1.8
80
20.8
1.8
19.8
1.8
160
16.5
3.1
19.7
3.1
Table 4-3:50 % lightning impulse breakdown voltage as a function of freezing
water conductivity, a, for ice surfaces without artificial air gap
(T=0° C; d=18 mm; r=6 mm; orient.=hor.)
olxiO4 S/m]
+U50%[kV]
s[kV]
�U5S%[kV]
s[kV]
2.5
41.9
2.8
43.1
2.8
30
24.3
2.4
27.3
1.8
80
22.3
1.8
21.8
2.4
160
17.1
2.1
19.2
2.5
Next, the U50% results for the breakdown voltages as a function of the
electrode curvature radius, r, are presented in Table 4-4. Table 4-5 shows the U50%
results for variation of the electrode axis orientation. While the axis was oriented
either horizontally or vertically, the surface of the ice was always kept on a vertical
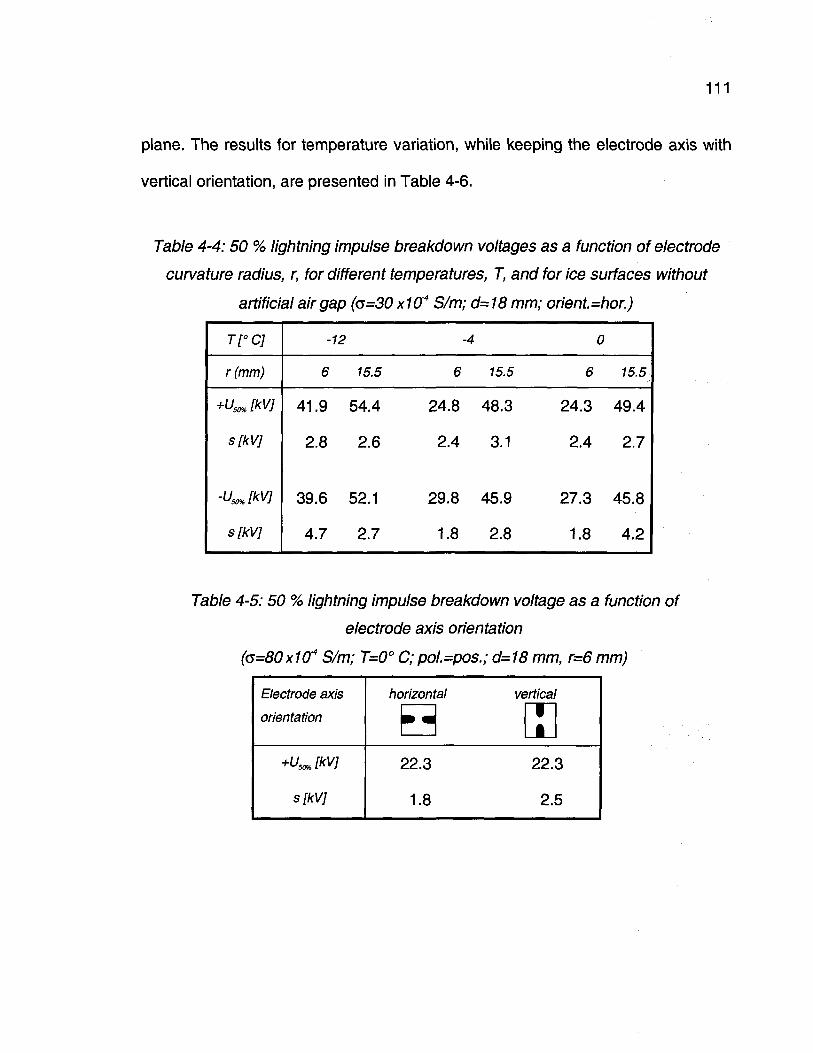
111
plane. The results for temperature variation, while keeping the electrode axis with
vertical orientation, are presented in Table 4-6.
Table 4-4:50 % lightning impulse breakdown voltages as a function ofeiectrode
curvature radius, r, for different temperatures, T, and for ice surfaces without
artificial air gap (<s=30 x1O4 S/m; d=18 mm; orient. =hor.)
T[°C]
r (mm)
+U50%[kV)
s[kV]
-Uso%[kV]
s[kV]
-12
6
41.9
2.8
39.6
4.7
15.5
54.4
2.6
52.1
2.7
-4
6
24.8
2.4
29.8
1.8
15.5
48.3
3.1
45.9
2.8
0
6
24.3
2.4
27.3
1.8
15.5
49.4
2.7
45.8
4.2
Table 4-5:50 % lightning impulse breakdown voltage as a function of
electrode axis orientation
(0=80x10* S/m; T=0° C; pol.=pos.; d=18 mm, r=6 mm)
Electrode axis
orientation
+US0%[kV]
s[kV]
horizontal vertical
m m 1|
22.3 22.3
1.8 2.5
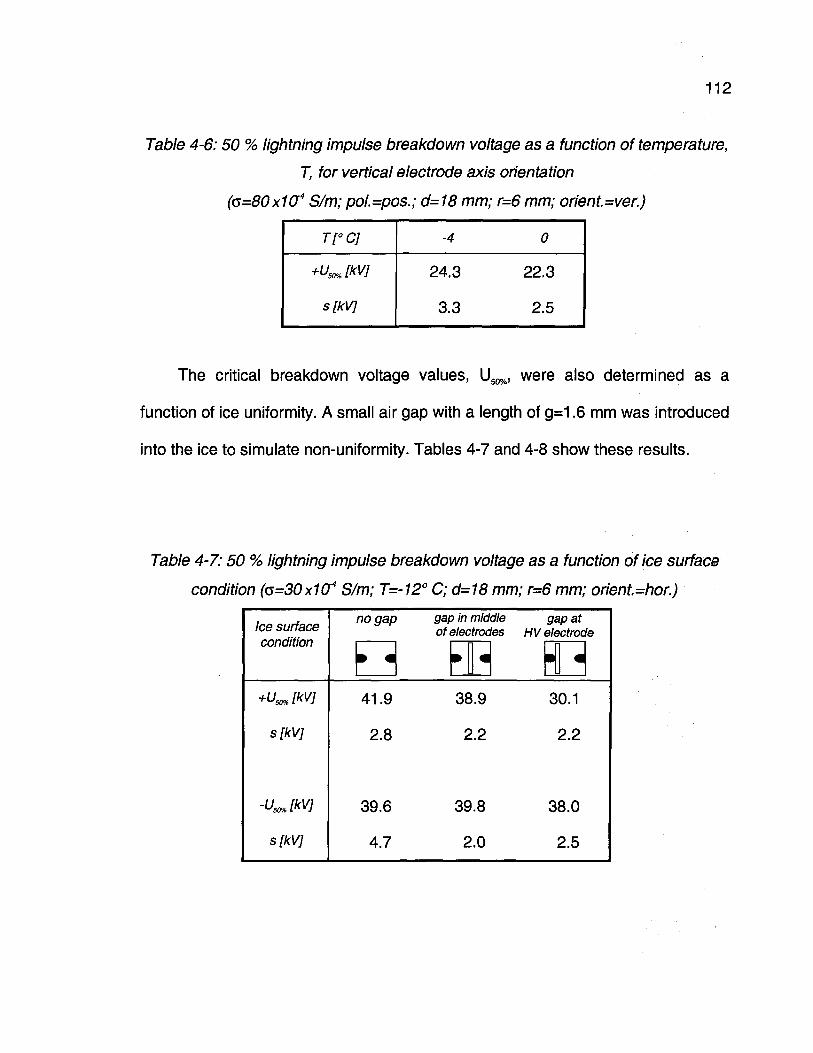
112
Table 4-6:50 % lightning impulse breakdown voltage as a function of temperature,
T, for vertical electrode axis orientation
(<5=80x1O4 S/m; pol.=pos.; d=18 mm; r=6 mm; orient.=ver.)
T[°C]
+U50.JkV]
s[kV]
-4 0
24.3 22.3
3.3 2.5
The critical breakdown voltage values, U^, were also determined as a
function of ice uniformity. A small air gap with a length of g=1.6 mm was introduced
into the ice to simulate non-uniformity. Tables 4-7 and 4-8 show these results.
Table 4-7:50 % lightning impulse breakdown voltage as a function of ice surface
condition ((5=30x10^ S/m; T=~12° C; d=18 mm; r=6 mm; orient.=hor.)
Ice surfacecondition
+U50%[kV]
s[kV]
-Um(kV]
S[kV]
no gap
41.9
2.8
39.6
4.7
gap in middle gap atof electrodes HV electrode
» �
38.9 30.1
2.2 2.2
39.8 38.0
2.0 2.5
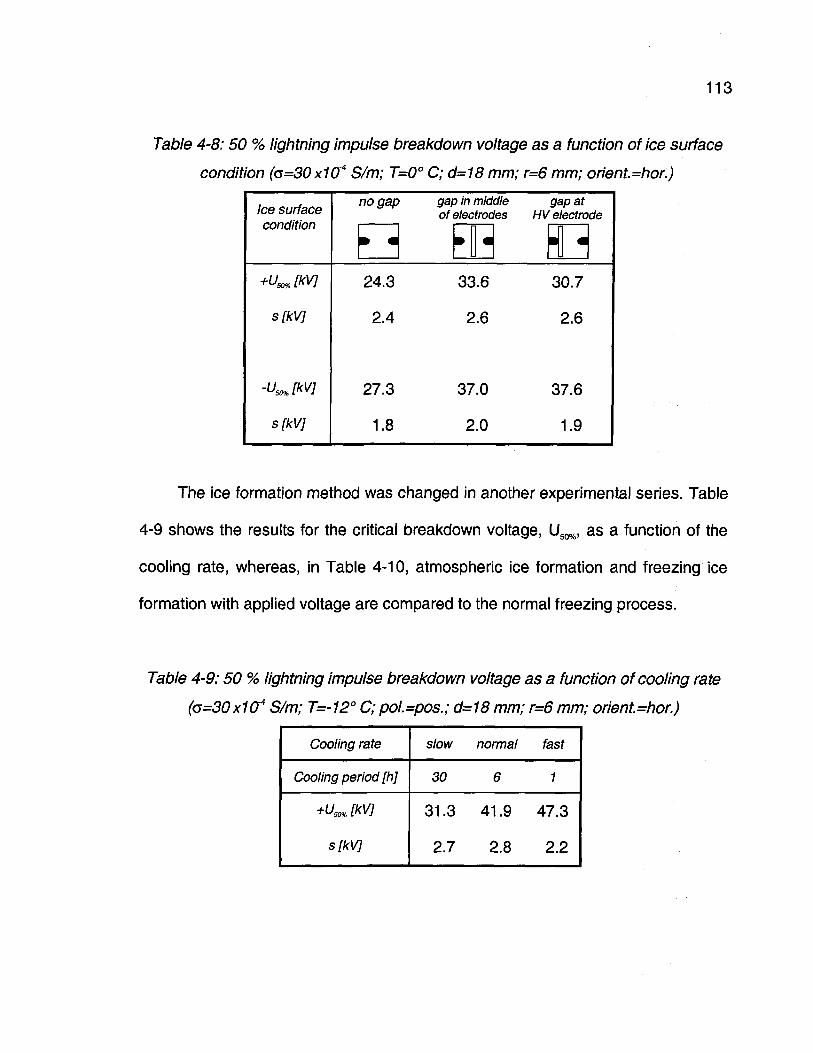
113
Table 4-8:50 % lightning impulse breakdown voltage as a function of ice surface
condition (a=30 x 104 S/m; T=0° C; d= 18 mm; r=6 mm; orient. =hor.)
Ice surfacecondition
s[kV]
^.ms[kV]
no gap
m m
24.3
2.4
27.3
1.8
gap in middle gap atof electrodes HV electrode
�
33.6 30.7
2.6 2.6
37.0 37.6
2.0 1.9
The ice formation method was changed in another experimental series. Table
4-9 shows the results for the critical breakdown voltage, U50%, as a function of the
cooling rate, whereas, in Table 4-10, atmospheric ice formation and freezing ice
formation with applied voltage are compared to the normal freezing process.
Table 4-9:50 % lightning impulse breakdown voltage as a function of cooling rate
(o=30x1O4 S/m; T=-12° C; pol.=pos.; d=18 mm; r=6 mm; orient.=hor.)
Cooling rate
Cooling period [h]
+U50%[kV]
s[kV]
slow
30
31.3
2.7
normal
6
41.9
2.8
fast
1
47.3
2.2
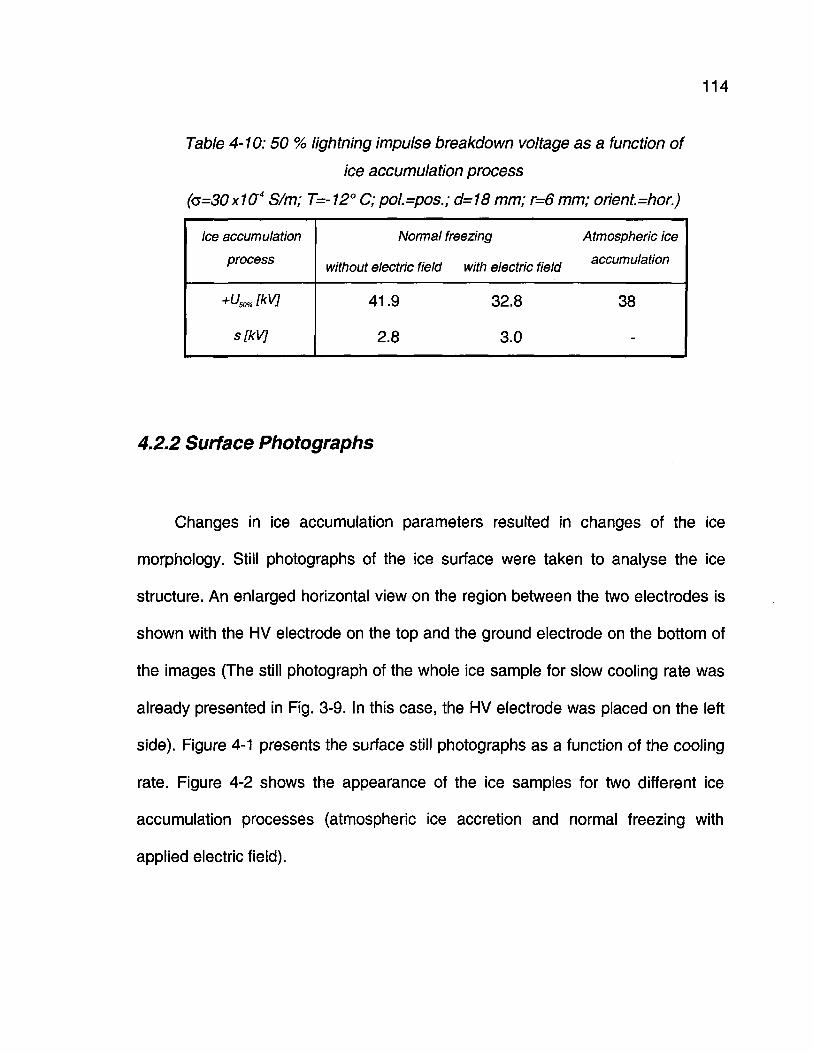
114
Table 4-10:50 % lightning impulse breakdown voltage as a function of
ice accumulation process
(<5=30x1Cf S/m; T=-12° C; pol.=pos.; d=18 mm; r=6 mm; orient. =hor.)
Ice accumulation
process
+US0%[kVl
sfkV]
Normal freezing Atmospheric ice
without electric field with electric field accumulation
41.9 32.8 38
2.8 3.0
4.2.2 Surface Photographs
Changes in ice accumulation parameters resulted in changes of the ice
morphology. Still photographs of the ice surface were taken to analyse the ice
structure. An enlarged horizontal view on the region between the two electrodes is
shown with the HV electrode on the top and the ground electrode on the bottom of
the images (The still photograph of the whole ice sample for slow cooling rate was
already presented in Fig. 3-9. In this case, the HV electrode was placed on the left
side). Figure 4-1 presents the surface still photographs as a function of the cooling
rate. Figure 4-2 shows the appearance of the ice samples for two different ice
accumulation processes (atmospheric ice accretion and normal freezing with
applied electric field).
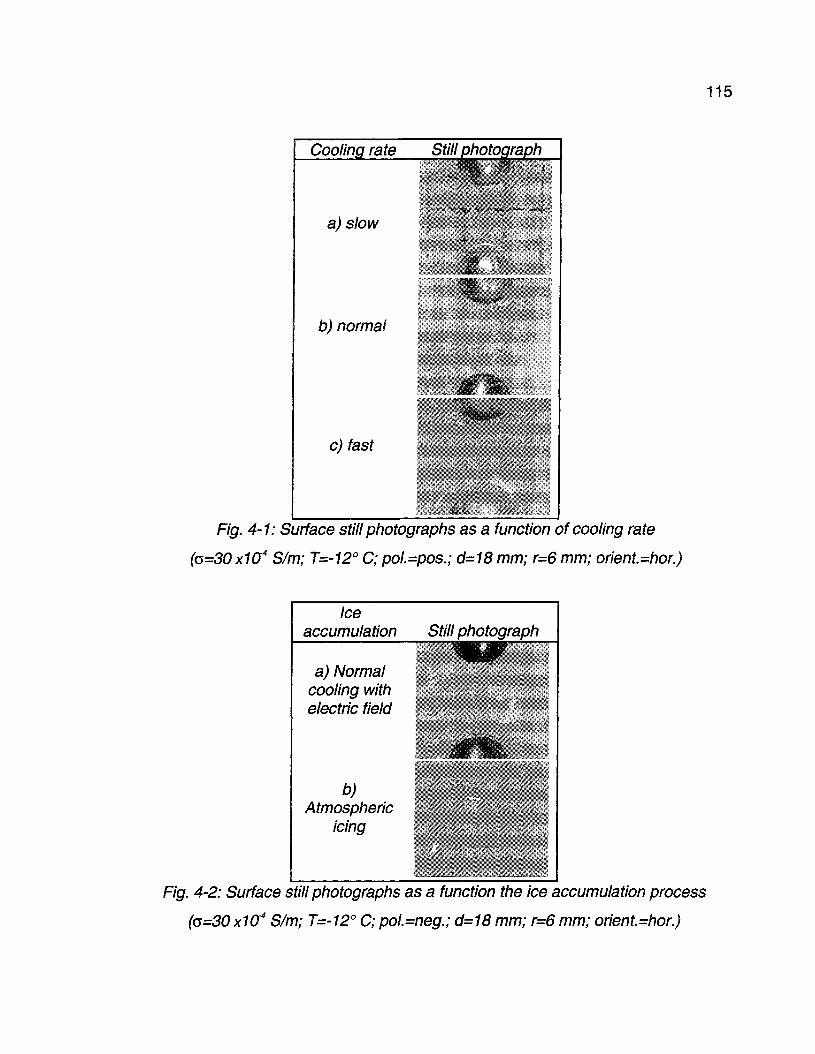
115
Cooling rate
a) slow
b) normal
c) fast
Still photographi
� * *
Fig. 4-1: Surface still photographs as a function of cooling rate
(<5=30 xiO4 S/m; T=-12° C; pol.=pos.; d=18 mm; r=6 mm; orient.=hor.)
Iceaccumulation Still photograph
a) Normalcooling withelectric field
b)Atmospheric
icing
Fig. 4-2: Surface still photographs as a function the ice accumulation process
(o=30x1Cf S/m; T=-12° C; pol.=neg.; d=18 mm; r=6 mm; orient.=hor.)
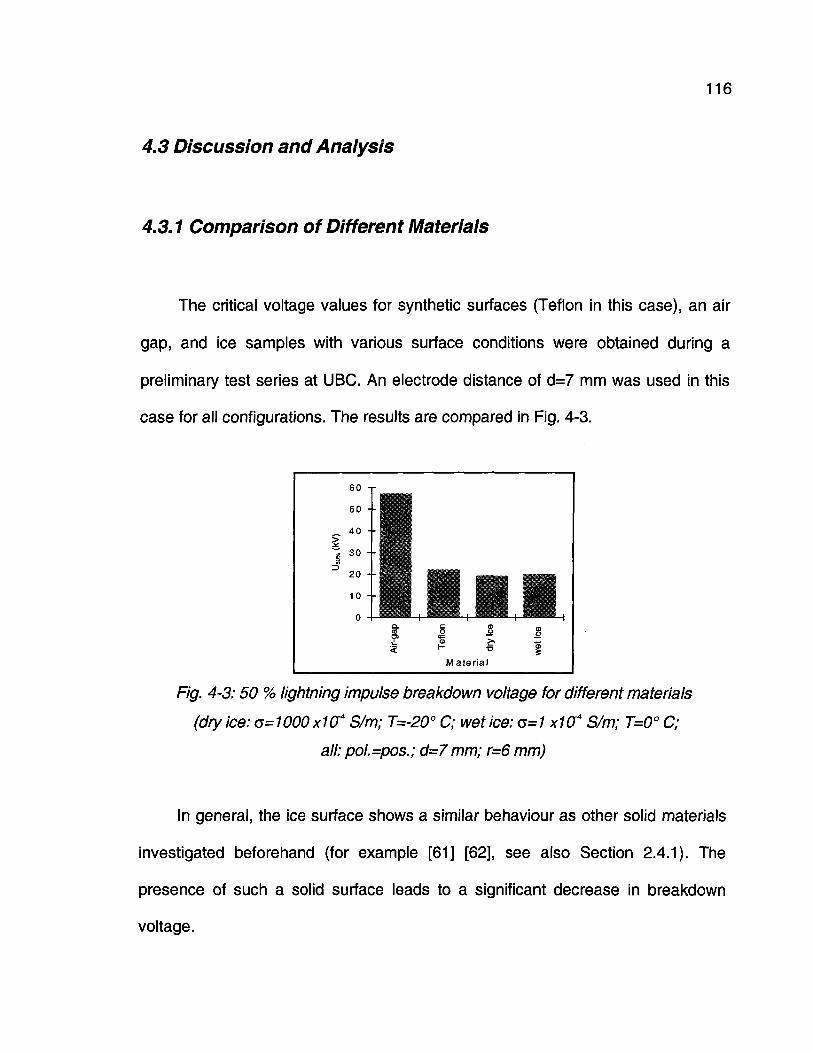
116
4.3 Discussion and Analysis
4.3.1 Comparison of Different Materials
The critical voltage values for synthetic surfaces (Teflon in this case), an air
gap, and ice samples with various surface conditions were obtained during a
preliminary test series at UBC. An electrode distance of d=7 mm was used in this
case for all configurations. The results are compared in Fig. 4-3.
Fig. 4-3:50 % lightning impulse breakdown voltage for different materials
(dry ice: o=1000xW4 S/m; T=-20° C; wet ice: G=1 X10⁴ S/m; T=0° C;
all: pol.=pos.; d=7 mm; r=6 mm)
In general, the ice surface shows a similar behaviour as other solid materials
investigated beforehand (for example [61] [62], see also Section 2.4.1). The
presence of such a solid surface leads to a significant decrease in breakdown
voltage.
117
4.3.2 Effect of Freezing Water Conductivity
Figure 4-4 presents a graph of the critical breakdown voltage measurements
as a function of freezing water conductivity, a, and ice temperature, T, (derived
from Tables 4-1 to 4-3). Ice temperature is assigned to the x-axis (to the left),
freezing water conductivity to the y-axis (to the right). The values for the 50 %
lightning impulse breakdown voltage, U50%, assigned to the z-axis, are expressed
as percentages related to the highest result obtained. This value is U50%=46.7 kV,
found for a test model with a dry ice surface, formed from de-ionised freezing water
under negative applied voltage (T=-12° C, a=2.5 x10"4 S/m, pol.=neg.). On the
other hand, the lowest value, U50%=17,1 kV, is obtained for the case of wet ice
surface with ice formed from very conductive water with positive voltage applied
(T=0° C, c=160 x10"4 S/m, pol.=pos.).
It can be observed that the breakdown voltage decreases as the freezing
water conductivity increases for any of the chosen temperatures. The rate of
decrease is greatest for low freezing water conductivity and tends to saturation at
higher values. A similar behaviour was already revealed under applied ac and dc
voltages [33]. It may seem surprising at first sight to observe this voltage decrease
under dry ice surface conditions (at temperature T=-12° C), but the special
characteristics of the ice surface can explain this phenomenon (see Section 2.2.3).
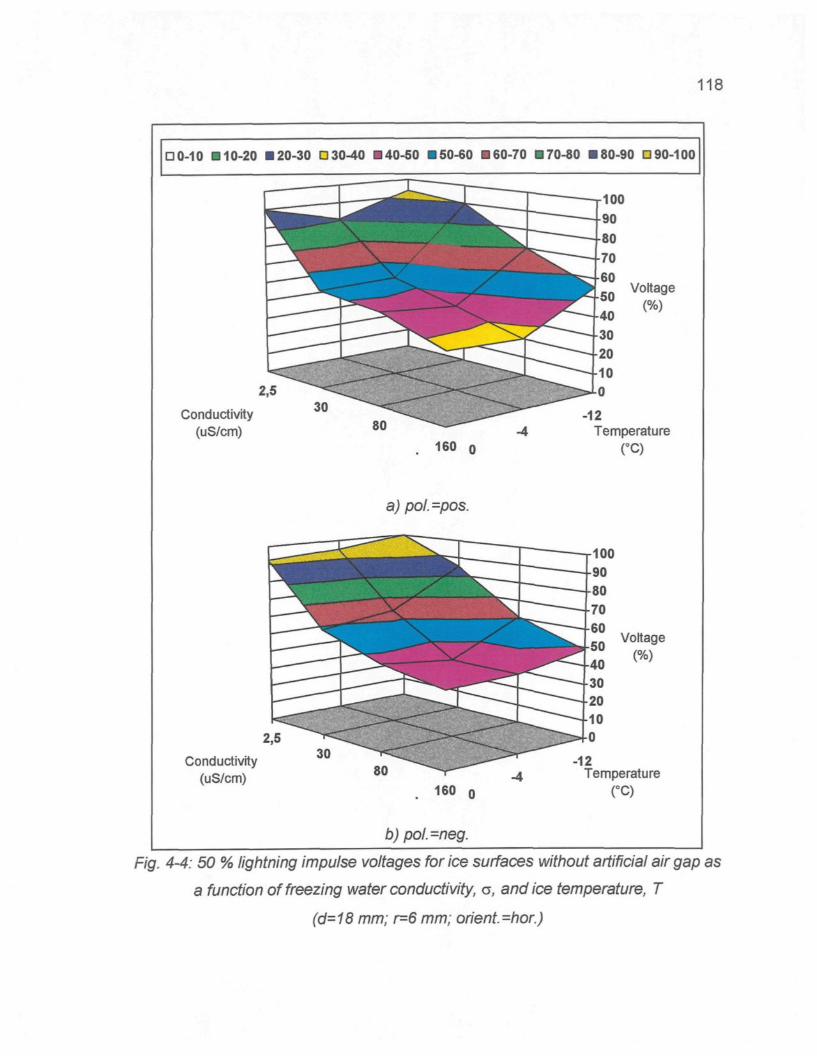
118
� 0-10 � 10-20 � 20-30 � 30-40 � 40-50 «50-60 160-70 B70-80 � 80-90 D 90-100
Conductivity(uS/cm)
160 o
a) pol. =po$.
Conductivity(uS/cm) 80
160
b) poi.-neg.
Voltage
-12Temperature
Voltage
12Temperature
CC)
Fig. 4-4: 50 % lightning impulse voltages for ice surfaces without artificial air gap as
a function of freezing water conductivity, <J, and ice temperature, T
(d=18 mm; r=6 mm; ohent.=hor.)
119
First, pollution particles are carried to the surface during the freezing process
[11] [99]. Thus, the surface contains a higher degree of pollution than the ice bulk.
Second, studies on the structure of ice showed that even for temperatures below
the melting point, a quasi-liquid layer is present on the surface of the ice [64] [74]
[75] [112]. The appearance of a dry ice surface obscures the fact that the
uppermost molecular layers of the ice surface are still much more reactive than the
solid crystalline ice structure of the inner ice bulk. Therefore, ice surface
conductivity is assumed to be influenced by freezing water conductivity, even for
lower temperatures without any initial water film at the ice surface.
Once pre-discharge activity is initiated, local arc may provoke melting, thus
creating a water film, which further increases ice surface conductivity. Then,
conditions become favourable - high conductivity due to pollution particles at the
ice surface and the presence of a liquid film in a locally limited area - to provoke a
breakdown at relatively low voltage levels even for temperatures well below the
melting point (as in this case T=-12° C). It is believed that increasing freezing water
conductivity will lead to higher leakage currents, so that a critical current can
already be reached at lower voltage levels provoking electrical breakdown [24].
This will be studied in another experiment (Chapter 6).
120
4.3.3 Effect of Ice Temperature
The same characteristic as for freezing water conductivity can be observed
for changing ice temperature: Breakdown voltage decreases as the temperature is
increased from -12° C to the melting point. A significant decrease in ice surface
breakdown voltage with increasing temperature was already observed in studies
on the ac and dc flashover characteristics [12] [33]. In contrast to the behaviour for
changing freezing water conductivity, the decrease in breakdown voltage for
changing ice temperature is not gradual for the parameter values chosen in the
present study. The measurements exhibit approximately the same order of
magnitude for the two temperatures, T=-4° C and T=0° C, for any conductivity (with
exception of the value for de-ionised water under positive voltage polarity). The
appearance of a water film on the ice surface for temperature values near, but
below the melting point can explain these observations [40] [69]. This process will
lead to a significant increase in the surface conductivity [24].
By comparing the effects of the two parameters, temperature and
conductivity, it can be said that the breakdown voltage has about the same value
for a test specimen formed with highly conductive water under dry surface
conditions (a=160 x10"4 S/m; T=-12° C) as for an ice model formed with less
conductive freezing water, but with a liquid film on its surface (a=30 x10"4 S/m; T=0°
121
C): U50%=25.8 kV in the first case, and U50%=24.3 kV in the second case under
positive voltage. If both freezing water conductivity and ice temperature are
increased simultaneously, the decrease in critical breakdown voltage is enhanced
for both polarities. Lowest breakdown voltages were obtained for a freezing water
conductivity of a=160 x10'4 S/m and ice temperatures near the melting point.
A regression analysis was carried out in order to determine the relation
between the critical breakdown voltage and the freezing water conductivity in the
form of a mathematical equation (Appendix 11). As the critical breakdown voltage
does not seem to change gradually with increasing ice temperature, it is proposed
to model the breakdown characteristic with two different regimes, depending on the
ice surface condition. Due to the non-linear characteristic of the results for varying
freezing water conductivity, a regression type "power" was used. In the case of dry
ice surface conditions (T=-12° C), the first regression result for a range of freezing
water conductivity of 2.5 x10"4 S/m < a < 160 x10'4 S/m showed significant
deviations from the measurements. An improved result was obtained when the
lowest value of freezing water conductivity was excluded. In the case of wet ice
surface conditions (Tice >-4° C), the resulting equation shows good agreement to
the measurements for the whole range of freezing water conductivity values used.
Table 4-11 presents the two retained equations.
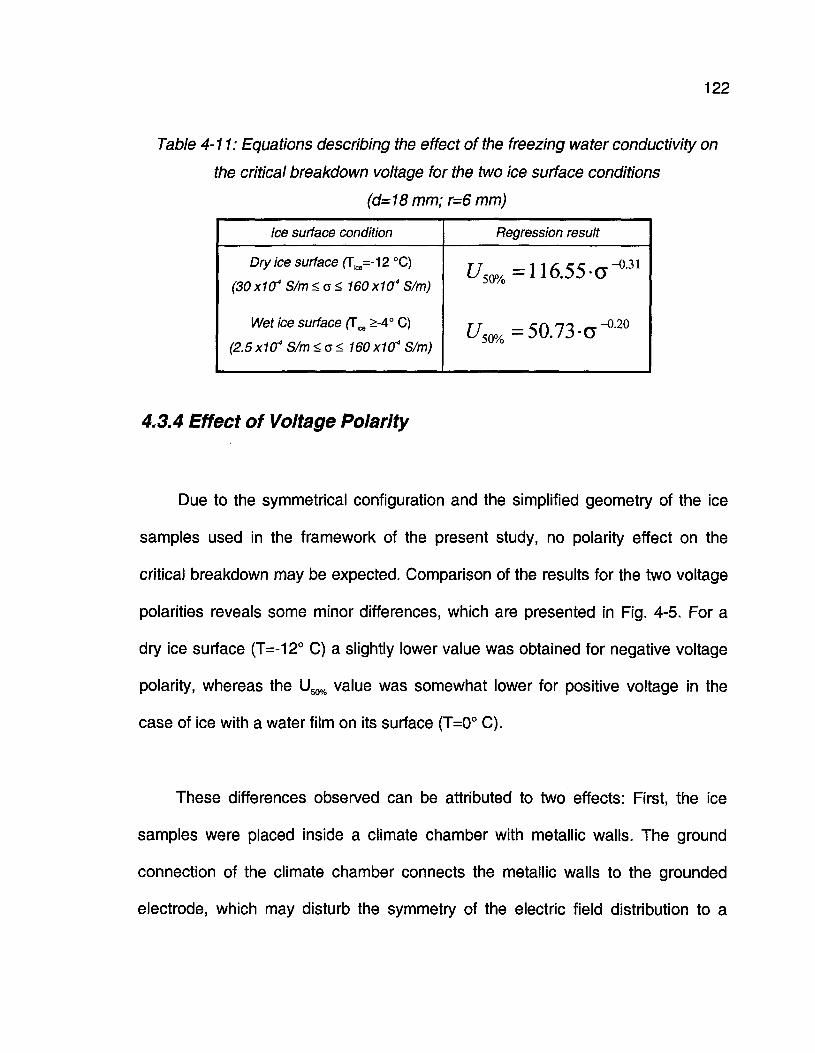
122
Table 4-11: Equations describing the effect of the freezing water conductivity on
the critical breakdown voltage for the two ice surface conditions
(d=18 mm; r=6 mm)
Ice surface condition
Dry ice surface (T^-12 °C)
(30X104 S/m<o< 160xiO4 S/m)
Wet ice surface (T^ >-4° C)
(2.5X10⁴ S/m<o< 160X104 S/m)
Regression result
£/5O%=116.55-0^31
!7m=50.73-a^20
4.3.4 Effect of Voltage Polarity
Due to the symmetrical configuration and the simplified geometry of the ice
samples used in the framework of the present study, no polarity effect on the
critical breakdown may be expected. Comparison of the results for the two voltage
polarities reveals some minor differences, which are presented in Fig. 4-5. For a
dry ice surface (T=-12° C) a slightly lower value was obtained for negative voltage
polarity, whereas the U50% value was somewhat lower for positive voltage in the
case of ice with a water film on its surface (T=0° C).
These differences observed can be attributed to two effects: First, the ice
samples were placed inside a climate chamber with metallic walls. The ground
connection of the climate chamber connects the metallic walls to the grounded
electrode, which may disturb the symmetry of the electric field distribution to a
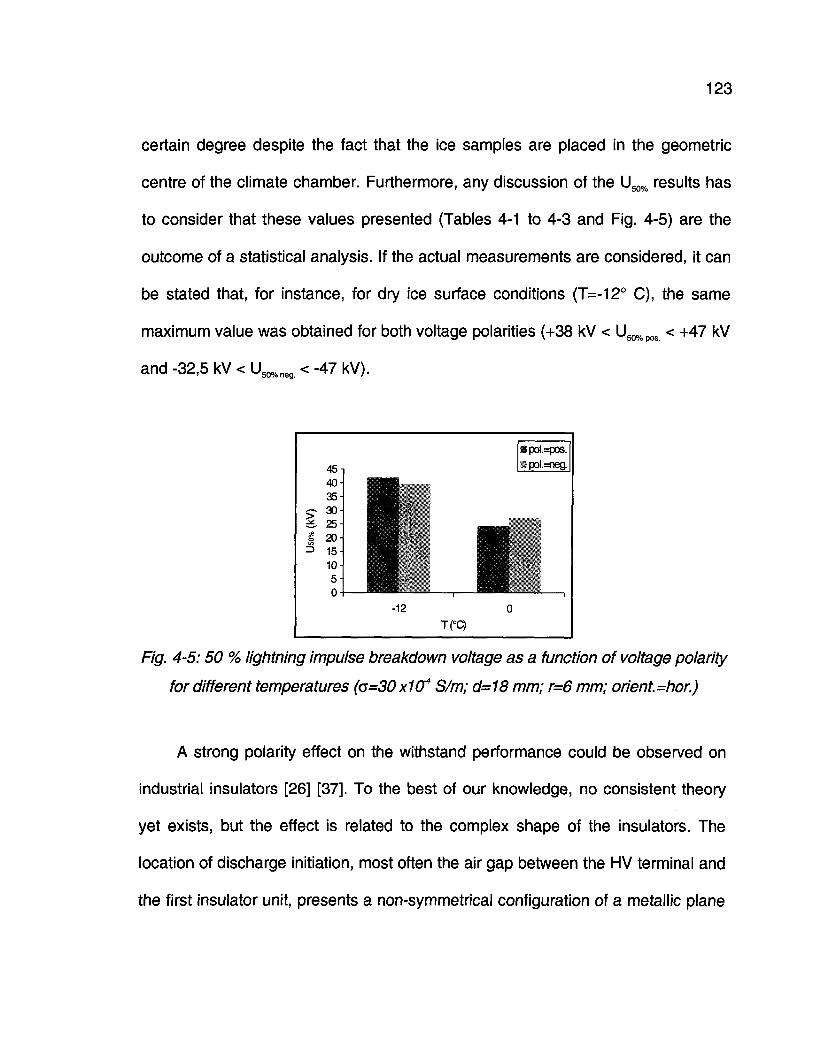
123
certain degree despite the fact that the ice samples are placed in the geometric
centre of the climate chamber. Furthermore, any discussion of the U50% results has
to consider that these values presented (Tables 4-1 to 4-3 and Fig. 4-5) are the
outcome of a statistical analysis. If the actual measurements are considered, it can
be stated that, for instance, for dry ice surface conditions (T=-12° C), the same
maximum value was obtained for both voltage polarities (+38 kV < U50%pos < +47 kV
and -32,5 kV < U50%neg < -47 kV).
Fig. 4-5:50 % lightning impulse breakdown voltage as a function of voltage polarity
for different temperatures (G=30X1O4 S/m; d=18 mm; r=6 mm; orient.=hor.)
A strong polarity effect on the withstand performance could be observed on
industrial insulators [26] [37]. To the best of our knowledge, no consistent theory
yet exists, but the effect is related to the complex shape of the insulators. The
location of discharge initiation, most often the air gap between the HV terminal and
the first insulator unit, presents a non-symmetrical configuration of a metallic plane
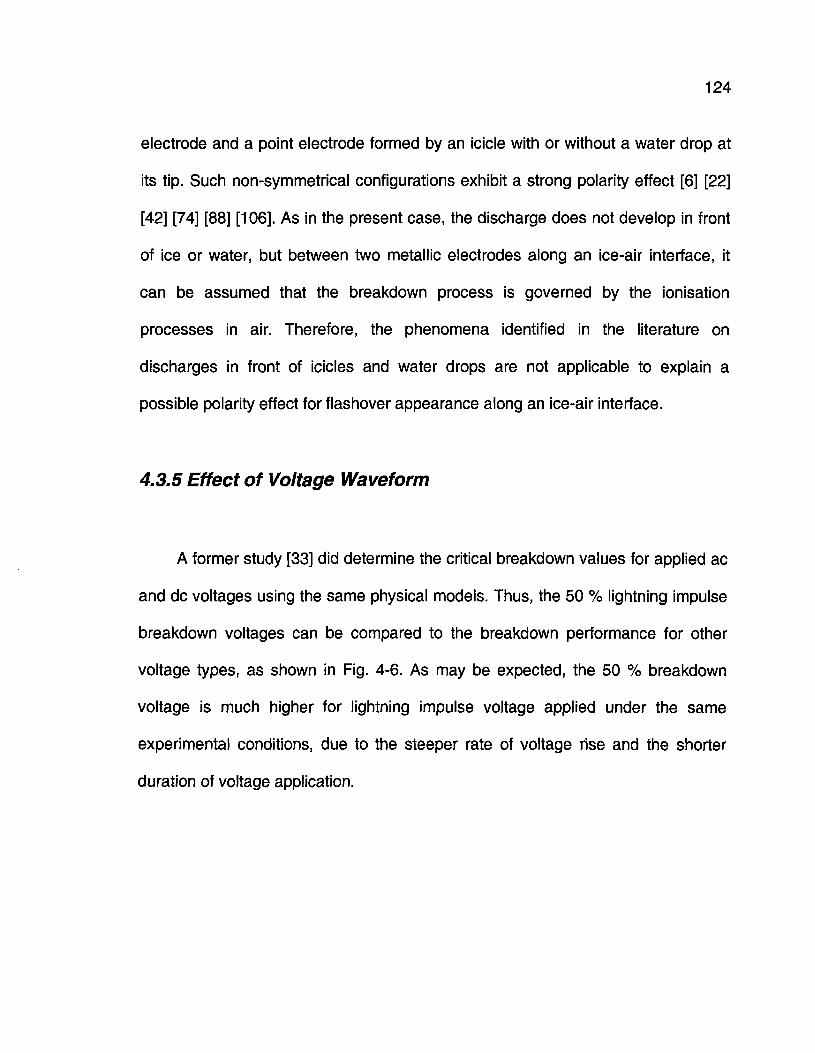
124
electrode and a point electrode formed by an icicle with or without a water drop at
its tip. Such non-symmetrical configurations exhibit a strong polarity effect [6] [22]
[42] [74] [88] [106]. As in the present case, the discharge does not develop in front
of ice or water, but between two metallic electrodes along an ice-air interface, it
can be assumed that the breakdown process is governed by the ionisation
processes in air. Therefore, the phenomena identified in the literature on
discharges in front of icicles and water drops are not applicable to explain a
possible polarity effect for flashover appearance along an ice-air interface.
4.3.5 Effect of Voltage Waveform
A former study [33] did determine the critical breakdown values for applied ac
and dc voltages using the same physical models. Thus, the 50 % lightning impulse
breakdown voltages can be compared to the breakdown performance for other
voltage types, as shown in Fig. 4-6. As may be expected, the 50 % breakdown
voltage is much higher for lightning impulse voltage applied under the same
experimental conditions, due to the steeper rate of voltage rise and the shorter
duration of voltage application.
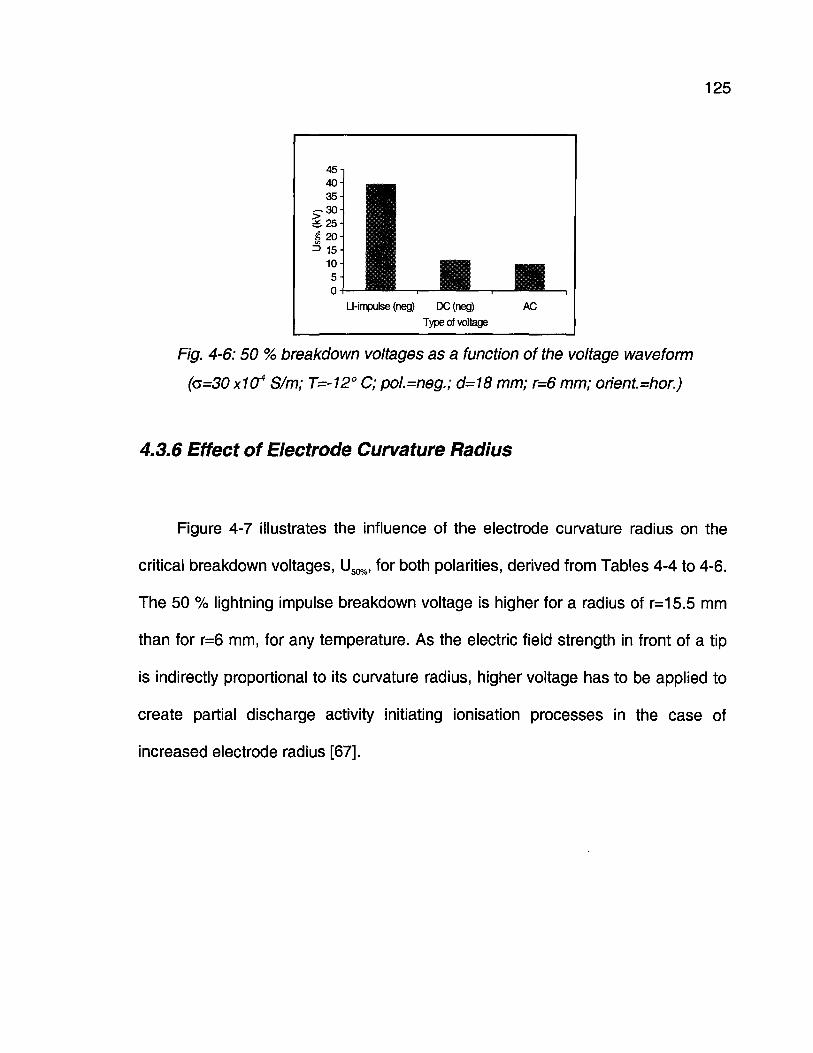
125
Ll-impulse (neg) DC (neg) AC
Type of voltage
Fig. 4-6:50 % breakdown voltages as a function of the voltage waveform
(G=30 XIQ4 S/m; T=-12° C; pol.=neg.; d=18 mm; r=6 mm; orient.=hor.)
4.3.6 Effect of Electrode Curvature Radius
Figure 4-7 illustrates the influence of the electrode curvature radius on the
critical breakdown voltages, U50%, for both polarities, derived from Tables 4-4 to 4-6.
The 50 % lightning impulse breakdown voltage is higher for a radius of r=15.5 mm
than for r=6 mm, for any temperature. As the electric field strength in front of a tip
is indirectly proportional to its curvature radius, higher voltage has to be applied to
create partial discharge activity initiating ionisation processes in the case of
increased electrode radius [67].
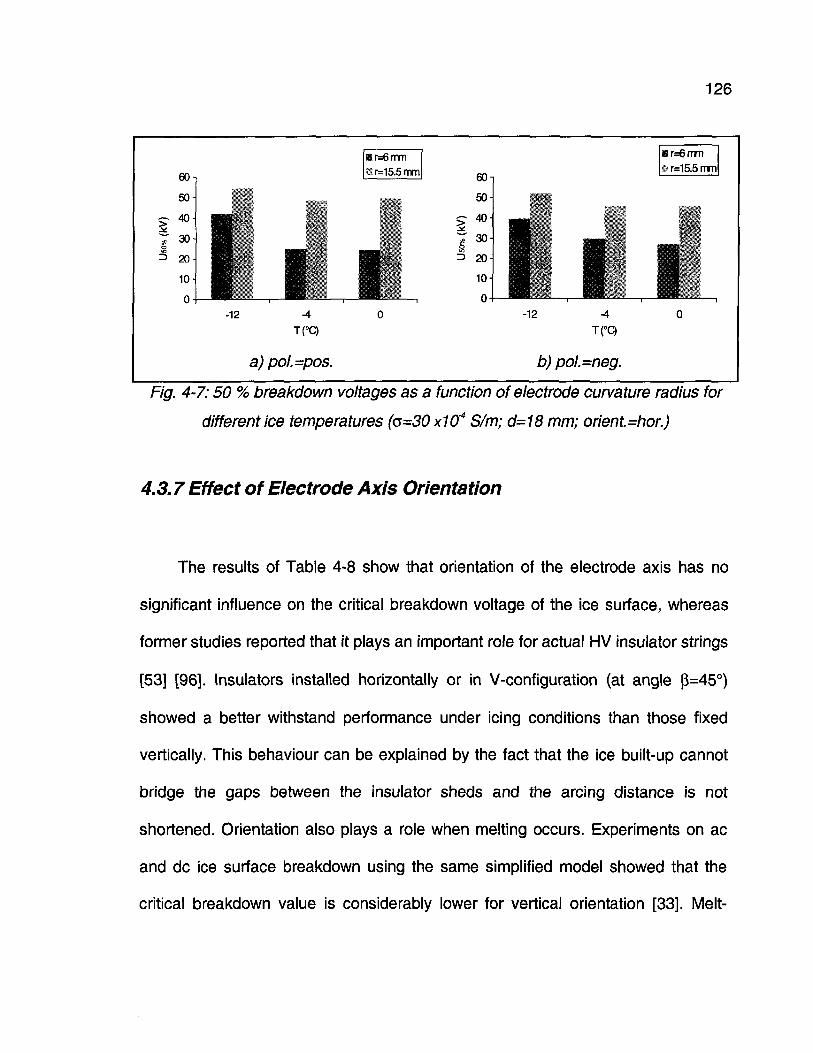
126
a) pol.=pos.
� r=6mmr=15.5 mm
b) pol.=neg.
� r=6mmi r=15.5 mm
-**:*
Fig. 4-7:50 % breakdown voltages as a function of electrode curvature radius for
different ice temperatures ((5=30x104 S/m; d=18 mm; orient.=hor.)
4.3.7 Effect of Electrode Axis Orientation
The results of Table 4-8 show that orientation of the electrode axis has no
significant influence on the critical breakdown voltage of the ice surface, whereas
former studies reported that it plays an important role for actual HV insulator strings
[53] [96]. Insulators installed horizontally or in V-configuration (at angle (3=45°)
showed a better withstand performance under icing conditions than those fixed
vertically. This behaviour can be explained by the fact that the ice built-up cannot
bridge the gaps between the insulator sheds and the arcing distance is not
shortened. Orientation also plays a role when melting occurs. Experiments on ac
and dc ice surface breakdown using the same simplified model showed that the
critical breakdown value is considerably lower for vertical orientation [33]. Melt-
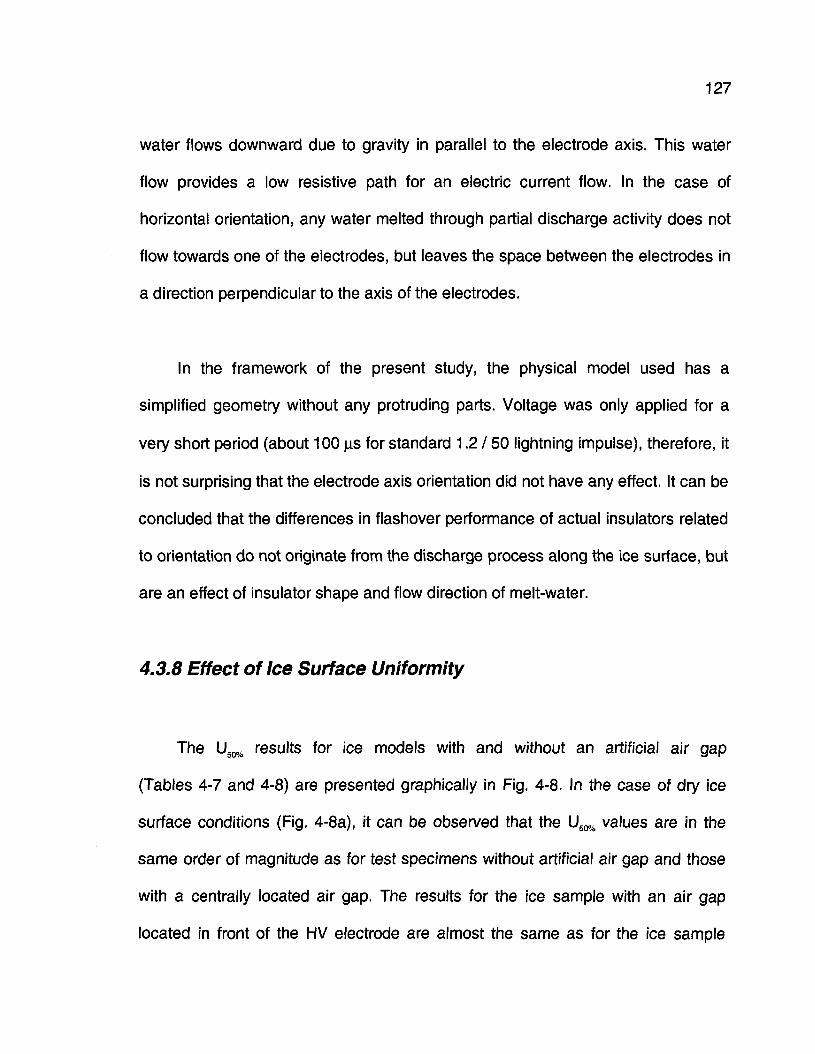
127
water flows downward due to gravity in parallel to the electrode axis. This water
flow provides a low resistive path for an electric current flow. In the case of
horizontal orientation, any water melted through partial discharge activity does not
flow towards one of the electrodes, but leaves the space between the electrodes in
a direction perpendicular to the axis of the electrodes.
In the framework of the present study, the physical model used has a
simplified geometry without any protruding parts. Voltage was only applied for a
very short period (about 100 |JS for standard 1.2 / 50 lightning impulse), therefore, it
is not surprising that the electrode axis orientation did not have any effect. It can be
concluded that the differences in flashover performance of actual insulators related
to orientation do not originate from the discharge process along the ice surface, but
are an effect of insulator shape and flow direction of melt-water.
4.3.8 Effect of Ice Surface Uniformity
The U50% results for ice models with and without an artificial air gap
(Tables 4-7 and 4-8) are presented graphically in Fig. 4-8. In the case of dry ice
surface conditions (Fig. 4-8a), it can be observed that the U50% values are in the
same order of magnitude as for test specimens without artificial air gap and those
with a centrally located air gap. The results for the ice sample with an air gap
located in front of the HV electrode are almost the same as for the ice sample
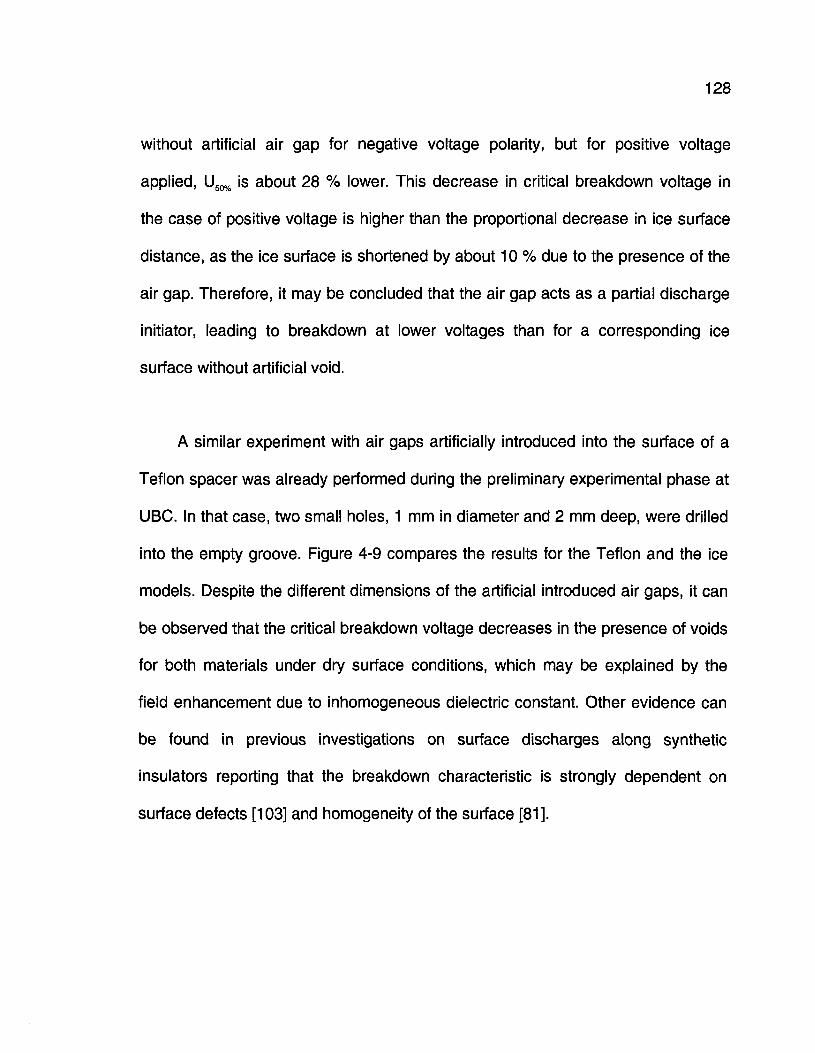
128
without artificial air gap for negative voltage polarity, but for positive voltage
applied, U50% is about 28 % lower. This decrease in critical breakdown voltage in
the case of positive voltage is higher than the proportional decrease in ice surface
distance, as the ice surface is shortened by about 10 % due to the presence of the
air gap. Therefore, it may be concluded that the air gap acts as a partial discharge
initiator, leading to breakdown at lower voltages than for a corresponding ice
surface without artificial void.
A similar experiment with air gaps artificially introduced into the surface of a
Teflon spacer was already performed during the preliminary experimental phase at
UBC. In that case, two small holes, 1 mm in diameter and 2 mm deep, were drilled
into the empty groove. Figure 4-9 compares the results for the Teflon and the ice
models. Despite the different dimensions of the artificial introduced air gaps, it can
be observed that the critical breakdown voltage decreases in the presence of voids
for both materials under dry surface conditions, which may be explained by the
field enhancement due to inhomogeneous dielectric constant. Other evidence can
be found in previous investigations on surface discharges along synthetic
insulators reporting that the breakdown characteristic is strongly dependent on
surface defects [103] and homogeneity of the surface [81].
129
� Uniform ice surface� Central air-gap«Air-gap at HV
pos. neg.Polarity
a)T=-12°C
� Uniform ice surface� Central air-gapi Air-gap at HV
pos.Polarity
b) T=0° C
neg.
Fig. 4-8:50 % breakdown voltages as a function of ice surface uniformity
(G=30 xiff4 S/m; 6=18 mm; r=6 mm; orient.=hor.)
For a comparison of the critical breakdown voltages for the two temperatures
(different ice surface conditions: Fig. 4-8a shows results for dry ice surface
conditions, Fig. 4-8b shows results for wet ice surface conditions), it can be seen
that the decrease in critical breakdown voltage due to the presence of a water film
is not as significant when there is an air gap in the ice surface (for example, under
negative voltage polarity: 7 % for a central air gap, 27 % for an air gap in front of
the HV electrode, and 31 % for ice surface without artificial air gap). Therefore, it
can be deduced that the withstand capacity of an ice model with an air gap may be
less dependent on the presence or absence of a water film, thus less temperature
dependent. This behaviour may be explained by the fact that the ice surface has
become more conductive at temperature T=0° C, due to the water film at the
surface, but essentially the situation in the air gap has not changed. The withstand
characteristic of a combination ice surface and air gap deteriorates less.
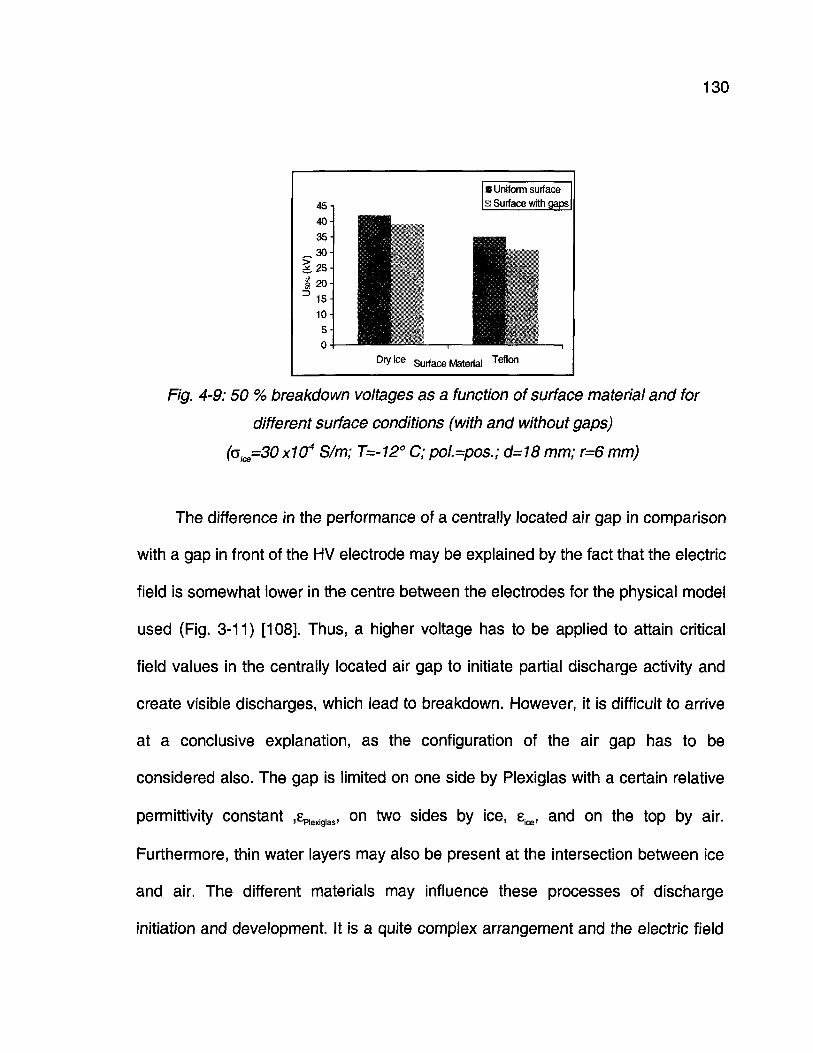
130
45
40-
35-
20-15-10-
50
� Uniform surface1 Surface with gaps
D rV i c e Surface Material T e f l o n
Fig. 4-9:50 % breakdown voltages as a function of surface material and for
different surface conditions (with and without gaps)
(<5ice=30 x1O4 S/m; T=-12° C; pol.=pos.; d=18 mm; r=6 mm)
The difference in the performance of a centrally located air gap in comparison
with a gap in front of the HV electrode may be explained by the fact that the electric
field is somewhat lower in the centre between the electrodes for the physical model
used (Fig. 3-11) [108]. Thus, a higher voltage has to be applied to attain critical
field values in the centrally located air gap to initiate partial discharge activity and
create visible discharges, which lead to breakdown. However, it is difficult to arrive
at a conclusive explanation, as the configuration of the air gap has to be
considered also. The gap is limited on one side by Plexiglas with a certain relative
permittivity constant ,eplexiglas, on two sides by ice, eice, and on the top by air.
Furthermore, thin water layers may also be present at the intersection between ice
and air. The different materials may influence these processes of discharge
initiation and development. It is a quite complex arrangement and the electric field
131
distribution is difficult to ascertain. A recent study on discharge phenomena in
systems with dielectric-covered electrodes [102] showed that charge depositions
on the dielectric coatings on the electrodes reduce the electric field in the air gap.
If, in the present case for very low temperature and low conductivity, the ice is be
seen as a dielectric cover of the metallic electrodes, it may be argued that charge
deposition on the ice decreases the electric field inside the air gap. Therefore,
higher voltage is needed to breakdown the air gap and, consequently, the total
distance between the electrodes compared to surfaces without any gap.
Another parameter is also assumed to influence breakdown characteristics -
the length of the air gap in relation to the electrode distance. In the present study,
an air gap length of g=1.6 mm was chosen, whereas the electrode distance was
d=18 mm. Thus, the gap represents almost 10 % of the discharge path. If the gap
in the conductive layer becomes too large, the field enhancement at its edges
might not be sufficient to maintain the discharge activity and cause breakdown.
Thus, the gap may improve the withstand performance if it is large enough (as
observed in the case of wet ice surface conditions). During investigations on the
flashover performance of actual industrial insulators, it could be observed that a
growing air gap was created due to melting by local arcs quenching the partial
discharges after a certain period [54] [96].
132
In summary, it can be concluded that an ice surface containing a very small
air gap acts like any synthetic surface containing a roughness: The small void
presents a non-uniformity in the ice surface, which causes a field enhancement
[63] [103], partial discharge initiation [62] [81] [103] and perhaps charge
accumulation along the surface [14] [52] [117], resulting in breakdown at lower
voltages than for ice surfaces without gaps. If, on the other hand, the dimension of
the gap exceeds certain limits, it will lead to an increase in withstand strength, if the
field inside the void is not strong enough to initiate ionisation processes and partial
discharge activity [96]. Thus, the dimension of the air gap in relation to the
dimension of the total electrode configuration may be a decisive parameter, if the
air gap acts as an initiator or preventer of discharge activity. The dimension of the
air gap was not changed in this study, but it seems to be an important experimental
parameter that should be considered in future investigations, for a better
understanding of the combined air gap and ice surface breakdown processes.
Furthermore, it was already pointed out in Chapter 2 that no experimental evidence
yet exists about surface charge accumulation on ice.
4.3.9 Effect of Cooling Rate
The results of the 50 % lightning impulse breakdown voltage, U50%, as a
function of the cooling rate (Table 4-9), are presented in Fig. 4-10. It can be seen
very clearly that the critical breakdown voltage increases with increasing cooling
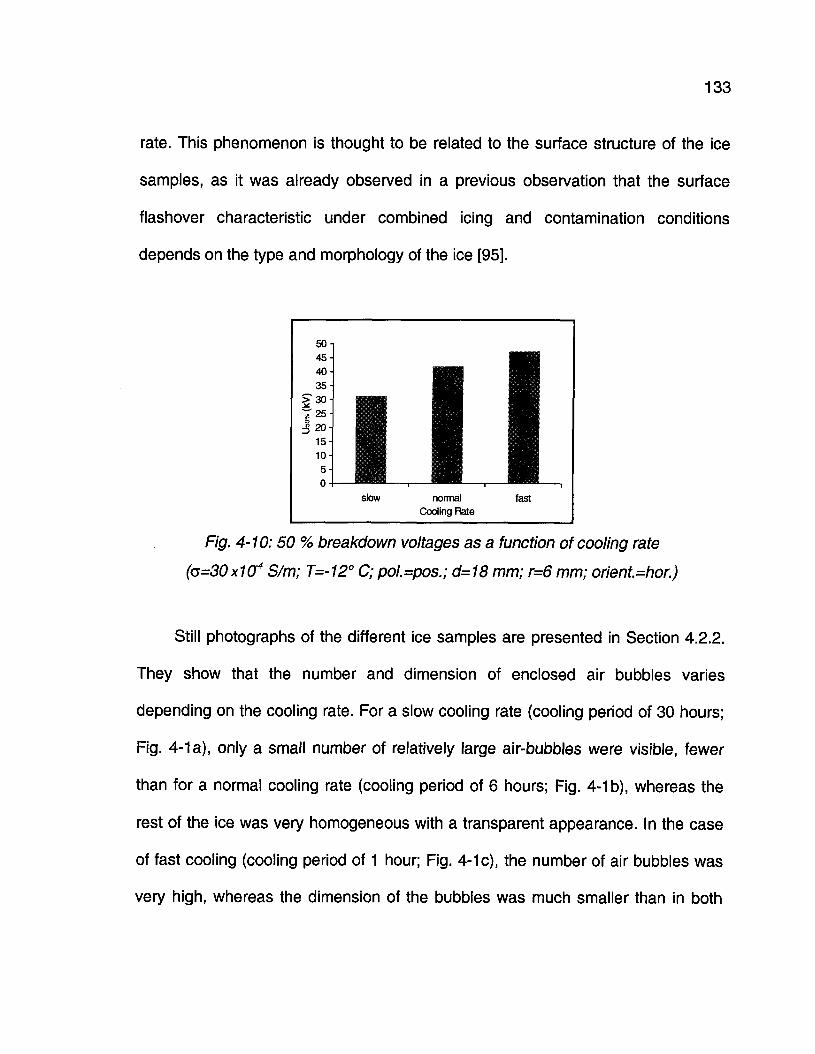
133
rate. This phenomenon is thought to be related to the surface structure of the ice
samples, as it was already observed in a previous observation that the surface
flashover characteristic under combined icing and contamination conditions
depends on the type and morphology of the ice [95].
Fig. 4-10:50 % breakdown voltages as a function of cooling rate
(<5=30x1O4 S/m; T=-12° C; pol.=pos.; d=18 mm; r=6 mm; orient.=hor.)
Still photographs of the different ice samples are presented in Section 4.2.2.
They show that the number and dimension of enclosed air bubbles varies
depending on the cooling rate. For a slow cooling rate (cooling period of 30 hours;
Fig. 4-1 a), only a small number of relatively large air-bubbles were visible, fewer
than for a normal cooling rate (cooling period of 6 hours; Fig. 4-1 b), whereas the
rest of the ice was very homogeneous with a transparent appearance. In the case
of fast cooling (cooling period of 1 hour; Fig. 4-1 c), the number of air bubbles was
very high, whereas the dimension of the bubbles was much smaller than in both
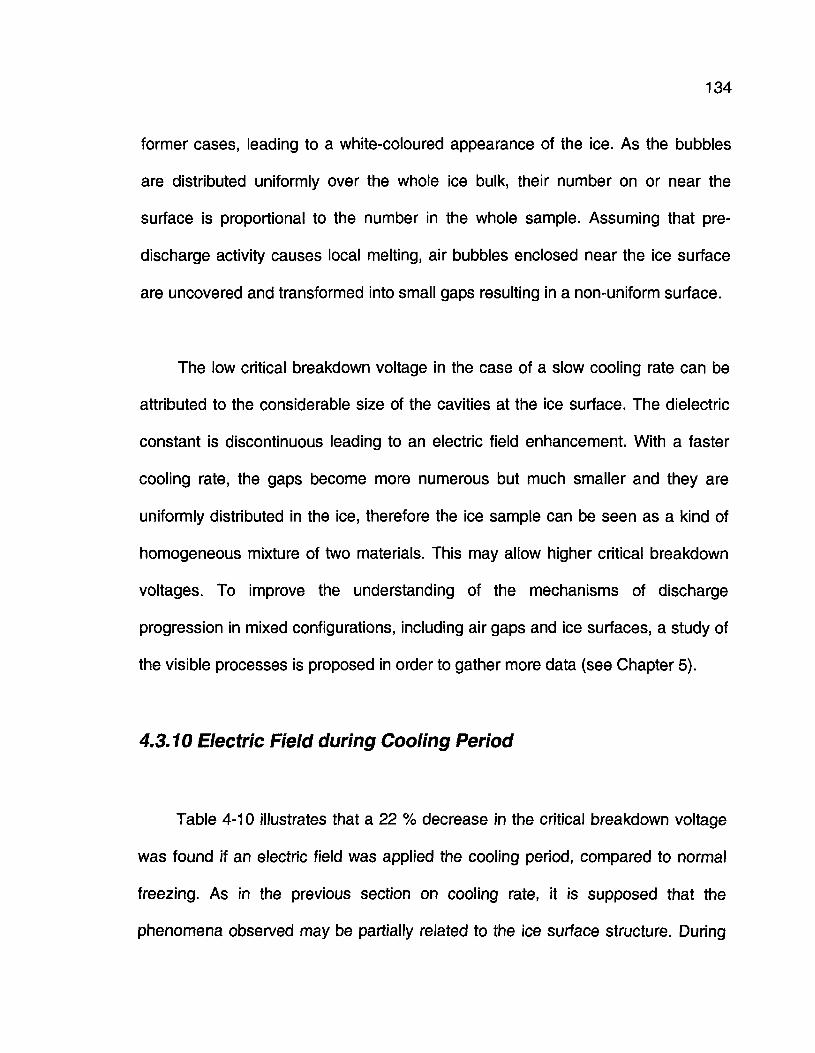
134
former cases, leading to a white-coloured appearance of the ice. As the bubbles
are distributed uniformly over the whole ice bulk, their number on or near the
surface is proportional to the number in the whole sample. Assuming that pre-
discharge activity causes local melting, air bubbles enclosed near the ice surface
are uncovered and transformed into small gaps resulting in a non-uniform surface.
The low critical breakdown voltage in the case of a slow cooling rate can be
attributed to the considerable size of the cavities at the ice surface. The dielectric
constant is discontinuous leading to an electric field enhancement. With a faster
cooling rate, the gaps become more numerous but much smaller and they are
uniformly distributed in the ice, therefore the ice sample can be seen as a kind of
homogeneous mixture of two materials. This may allow higher critical breakdown
voltages. To improve the understanding of the mechanisms of discharge
progression in mixed configurations, including air gaps and ice surfaces, a study of
the visible processes is proposed in order to gather more data (see Chapter 5).
4.3.10 Electric Field during Cooling Period
Table 4-10 illustrates that a 22 % decrease in the critical breakdown voltage
was found if an electric field was applied the cooling period, compared to normal
freezing. As in the previous section on cooling rate, it is supposed that the
phenomena observed may be partially related to the ice surface structure. During
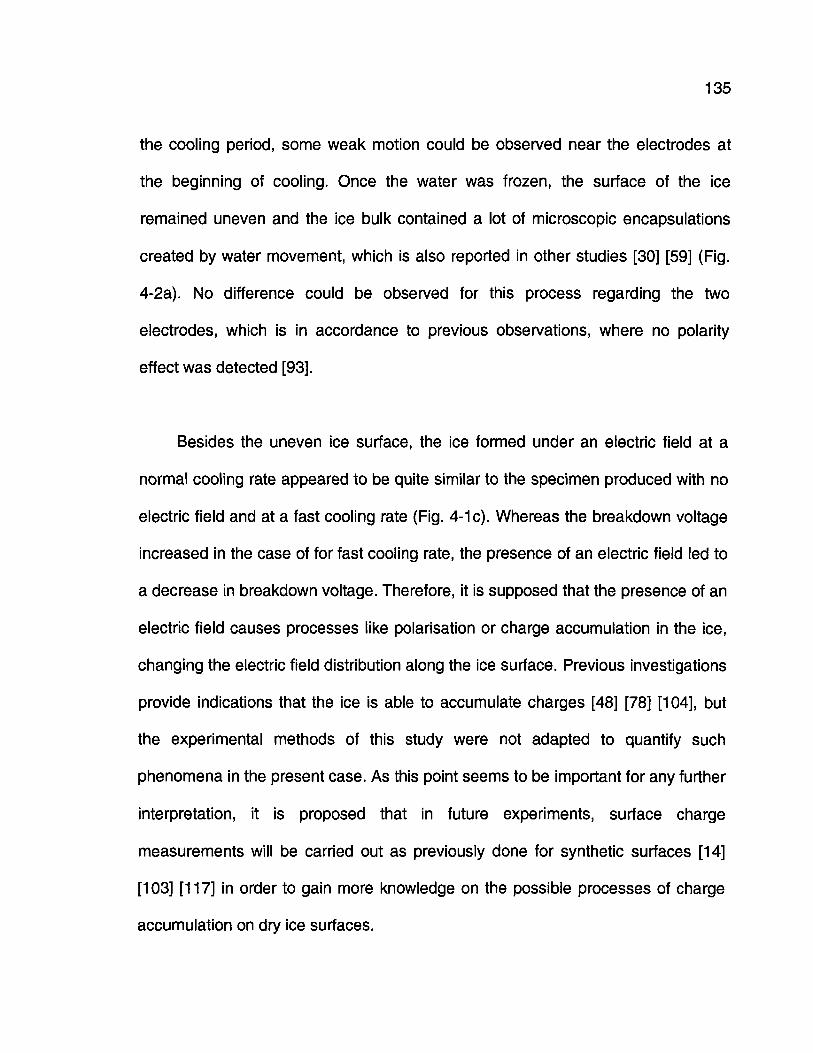
135
the cooling period, some weak motion could be observed near the electrodes at
the beginning of cooling. Once the water was frozen, the surface of the ice
remained uneven and the ice bulk contained a lot of microscopic encapsulations
created by water movement, which is also reported in other studies [30] [59] (Fig.
4-2a). No difference could be observed for this process regarding the two
electrodes, which is in accordance to previous observations, where no polarity
effect was detected [93].
Besides the uneven ice surface, the ice formed under an electric field at a
normal cooling rate appeared to be quite similar to the specimen produced with no
electric field and at a fast cooling rate (Fig. 4-1 c). Whereas the breakdown voltage
increased in the case of for fast cooling rate, the presence of an electric field led to
a decrease in breakdown voltage. Therefore, it is supposed that the presence of an
electric field causes processes like polarisation or charge accumulation in the ice,
changing the electric field distribution along the ice surface. Previous investigations
provide indications that the ice is able to accumulate charges [48] [78] [104], but
the experimental methods of this study were not adapted to quantify such
phenomena in the present case. As this point seems to be important for any further
interpretation, it is proposed that in future experiments, surface charge
measurements will be carried out as previously done for synthetic surfaces [14]
[103] [117] in order to gain more knowledge on the possible processes of charge
accumulation on dry ice surfaces.
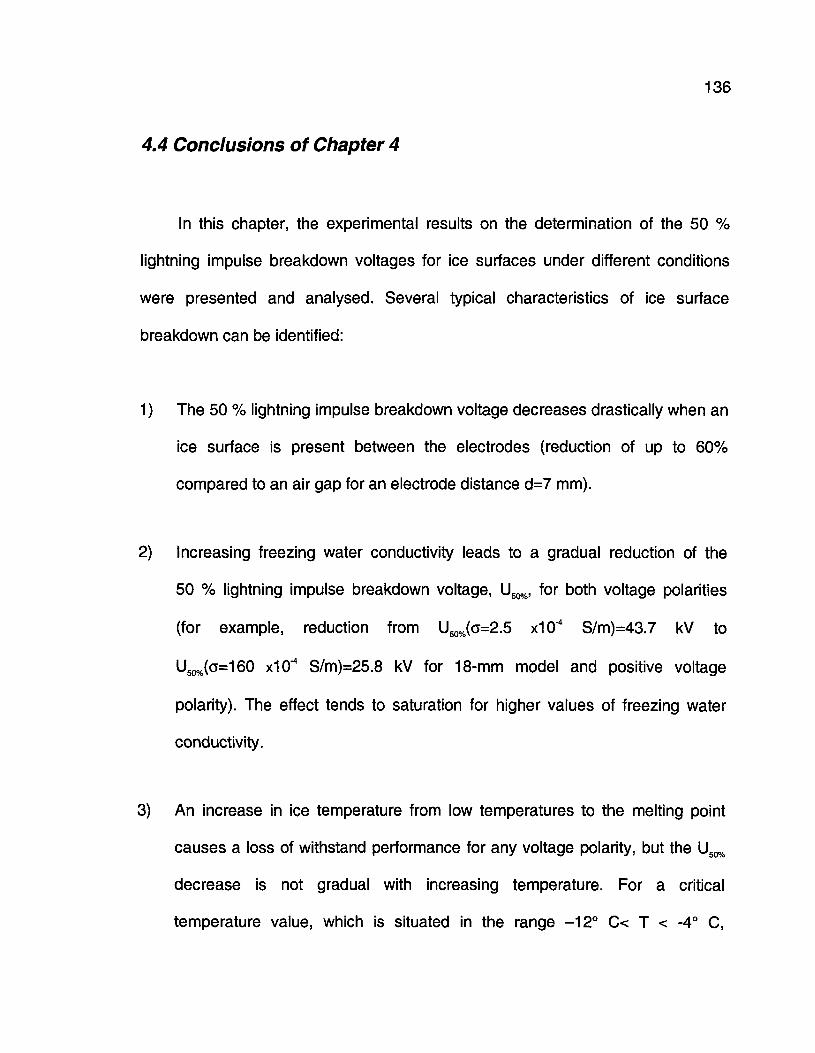
136
4.4 Conclusions of Chapter 4
In this chapter, the experimental results on the determination of the 50 %
lightning impulse breakdown voltages for ice surfaces under different conditions
were presented and analysed. Several typical characteristics of ice surface
breakdown can be identified:
1) The 50 % lightning impulse breakdown voltage decreases drastically when an
ice surface is present between the electrodes (reduction of up to 60%
compared to an air gap for an electrode distance d=7 mm).
2) Increasing freezing water conductivity leads to a gradual reduction of the
50 % lightning impulse breakdown voltage, U50%, for both voltage polarities
(for example, reduction from US0%(o=2.5 x10"4 S/m)=43.7 kV to
U50%(o=160 x10'4 S/m)=25.8 kV for 18-mm model and positive voltage
polarity). The effect tends to saturation for higher values of freezing water
conductivity.
3) An increase in ice temperature from low temperatures to the melting point
causes a loss of withstand performance for any voltage polarity, but the U50%
decrease is not gradual with increasing temperature. For a critical
temperature value, which is situated in the range -12° C< T < -4° C,
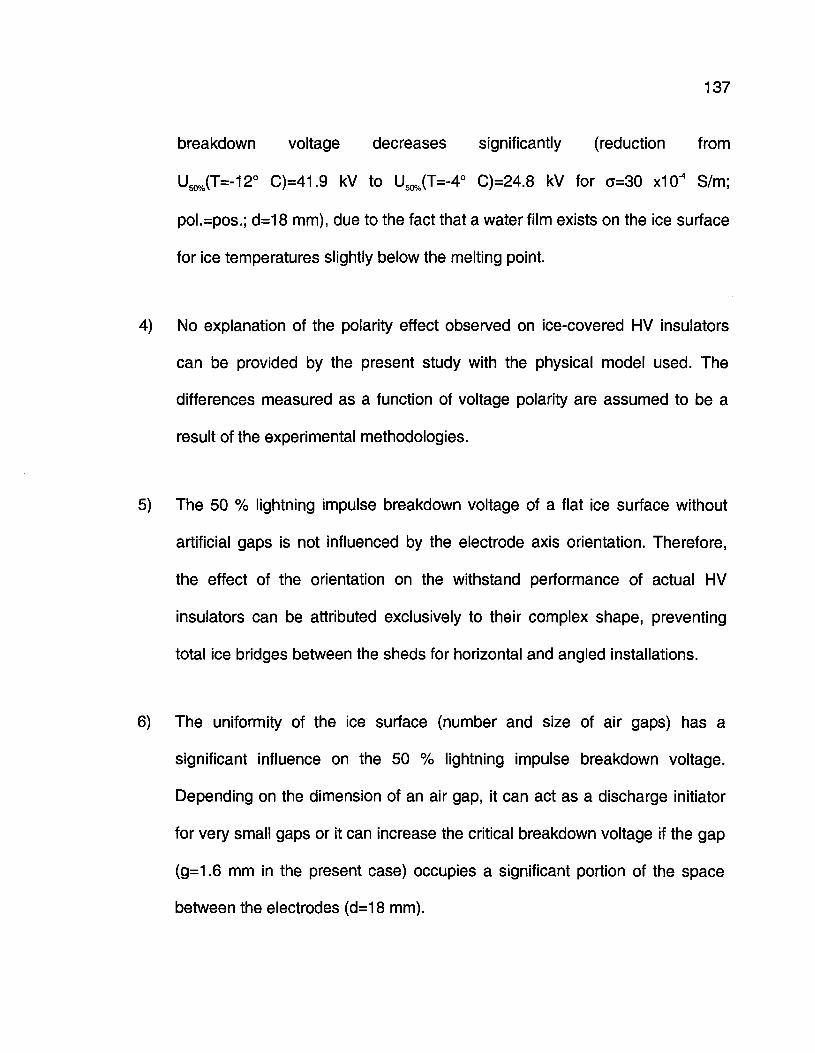
137
breakdown voltage decreases significantly (reduction from
U50%(T=-12° C)=41.9 kV to U50%(T=-4° C)=24.8 kV for c=30 x104 S/m;
pol.=pos.; d=18 mm), due to the fact that a water film exists on the ice surface
for ice temperatures slightly below the melting point.
4) No explanation of the polarity effect observed on ice-covered HV insulators
can be provided by the present study with the physical model used. The
differences measured as a function of voltage polarity are assumed to be a
result of the experimental methodologies.
5) The 50 % lightning impulse breakdown voltage of a flat ice surface without
artificial gaps is not influenced by the electrode axis orientation. Therefore,
the effect of the orientation on the withstand performance of actual HV
insulators can be attributed exclusively to their complex shape, preventing
total ice bridges between the sheds for horizontal and angled installations.
6) The uniformity of the ice surface (number and size of air gaps) has a
significant influence on the 50 % lightning impulse breakdown voltage.
Depending on the dimension of an air gap, it can act as a discharge initiator
for very small gaps or it can increase the critical breakdown voltage if the gap
(g=1.6 mm in the present case) occupies a significant portion of the space
between the electrodes (d=18 mm).
CHAPTER 5
STUDY OF VISIBLE DISCHARGE DEVELOPMENT
139
CHAPTER 5
STUDY OF VISIBLE DISCHARGE DEVELOPMENT
5.11ntroduction to Chapter 5
With the knowledge obtained on the critical breakdown voltages (Chapter 4),
the experiments using ultra high-speed photography could be carried out. A
voltage level 5 % to 10 % higher than the critical voltage was applied to the ice
sample, to ensure that breakdown takes place. For each case, several similar
images were obtained, and the most significant recording was retained for further
analysis. Further information on the interpretation of streak recordings can be
found in Section 3.5.2.
The first section of this chapter shows recordings of two typical discharge
processes, one in an air gap and the second along a synthetic surface (in the
present case Teflon) in order to provide data for comparison and classification of
ice surface recordings under different conditions. Next, some test recordings are
140
presented to verify if the ultra high-speed recordings correspond to the actual
discharge developments, and if the experimental methodology influences or
falsifies the physical discharge processes.
The ultra high-speed streak recordings are presented in several groups to
point out the specific characteristics of the different experimental parameters. Not
only do they allow capturing the general visual appearance of the discharge
activity, but also the derivation of various physical parameters is enabled:
� Time to breakdown, tbreakdown
� Discharge propagation velocity
� Point of origin of first visual discharge activity
� Light emission pattern (for example linear discharge growth, stepped
development, continuous growth of final jump, etc.)
The experiments on the determination of the breakdown voltages (Chapter 4)
revealed that the uniformity of the ice surface plays and important role on the ice
surface discharge process. Therefore, the succeeding presentation and discussion
of the experimental results is divided into two parts, one for ice surfaces without
artificial air gap and the other for ice surfaces with artificial and natural air gaps.
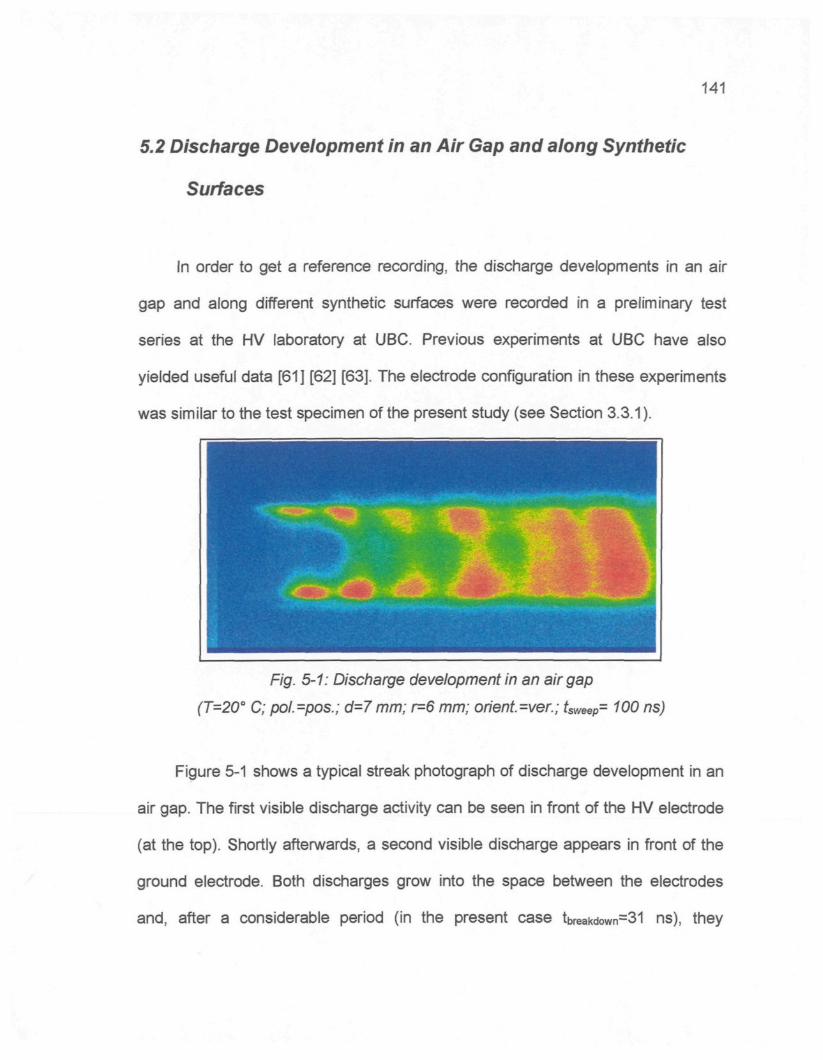
141
5.2 Discharge Development in an Air Gap and along Synthetic
Surfaces
In order to get a reference recording, the discharge developments in an air
gap and along different synthetic surfaces were recorded in a preliminary test
series at the HV laboratory at UBC. Previous experiments at UBC have also
yielded useful data [61] [62] [63]. The electrode configuration in these experiments
was similar to the test specimen of the present study (see Section 3.3.1 ).
Fig. 5-1: Discharge development in an air gap
(T=20° C; pol.=pos.; d=7 mm; r=6 mm; orient =ver; tsweep= 100 ns)
Figure 5-1 shows a typical streak photograph of discharge development in an
air gap. The first visible discharge activity can be seen in front of the HV electrode
(at the top). Shortly afterwards, a second visible discharge appears in front of the
ground electrode. Both discharges grow into the space between the electrodes
and, after a considerable period (in the present case tbreakdown=31 ns), they
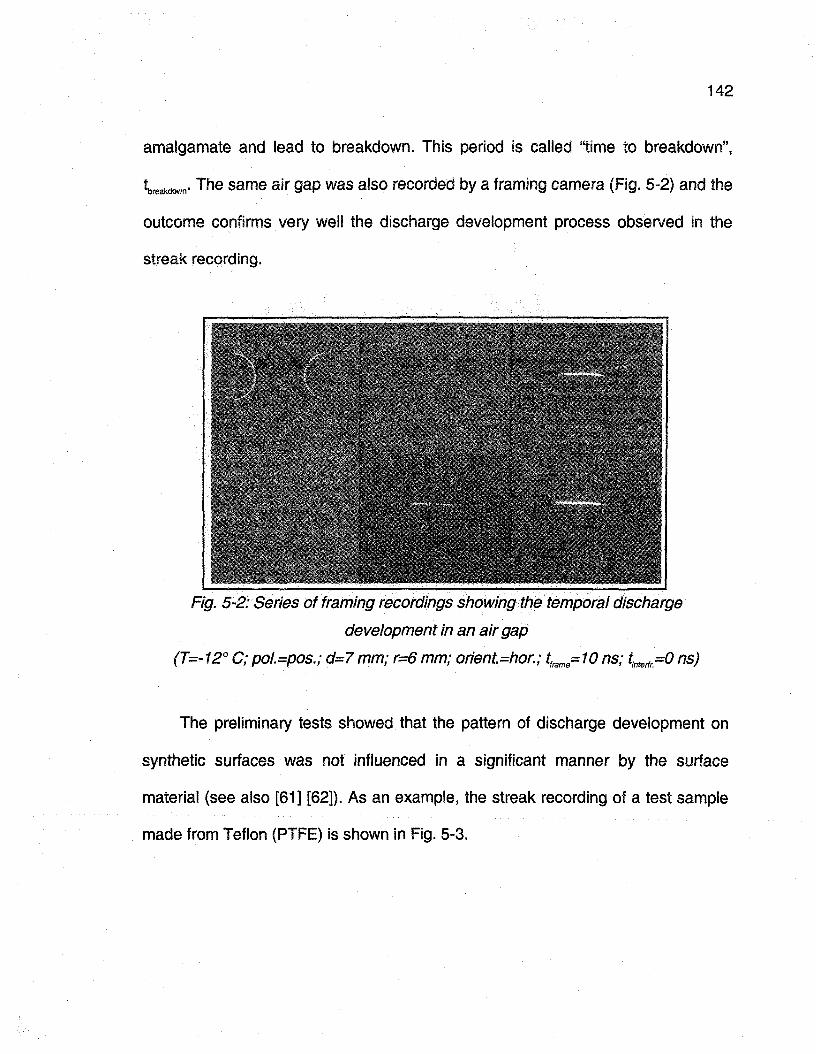
142
amalgamate and lead to breakdown. This period is called "time to breakdown",
breakdown- The same air gap was also recorded by a framing camera (Fig. 5-2) and the
outcome confirms very well the discharge development process observed in the
streak recording.
� � � � V % �
� *
: . . . . - . . � . . .
�r
-
t
"f �t
i
y
'. -,
' 'j * -
£ ^ . J �*�
� -
^. £'v' !..
- ' � � V " � - - ' . , ..� *
' ' ' � T V * "*'-�"'"-." 5->; ';�"�
� s .
� " / '
-
: . . � . .
?
, - "l,
. . . 1
' / ' � '� "l
* *'�
Fig. 5-2: Series of framing recordings showing the temporal discharge
development in an air gap
(T=-12° C; pol.=pos.; d=7 mm; r=6 mm; orient=hor.; tframe=10 ns; tmterir=0 ns)
The preliminary tests showed that the pattern of discharge development on
synthetic surfaces was not influenced in a significant manner by the surface
material (see also [61] [62]). As an example, the streak recording of a test sample
made from Teflon (PTFE) is shown in Fig. 5-3.
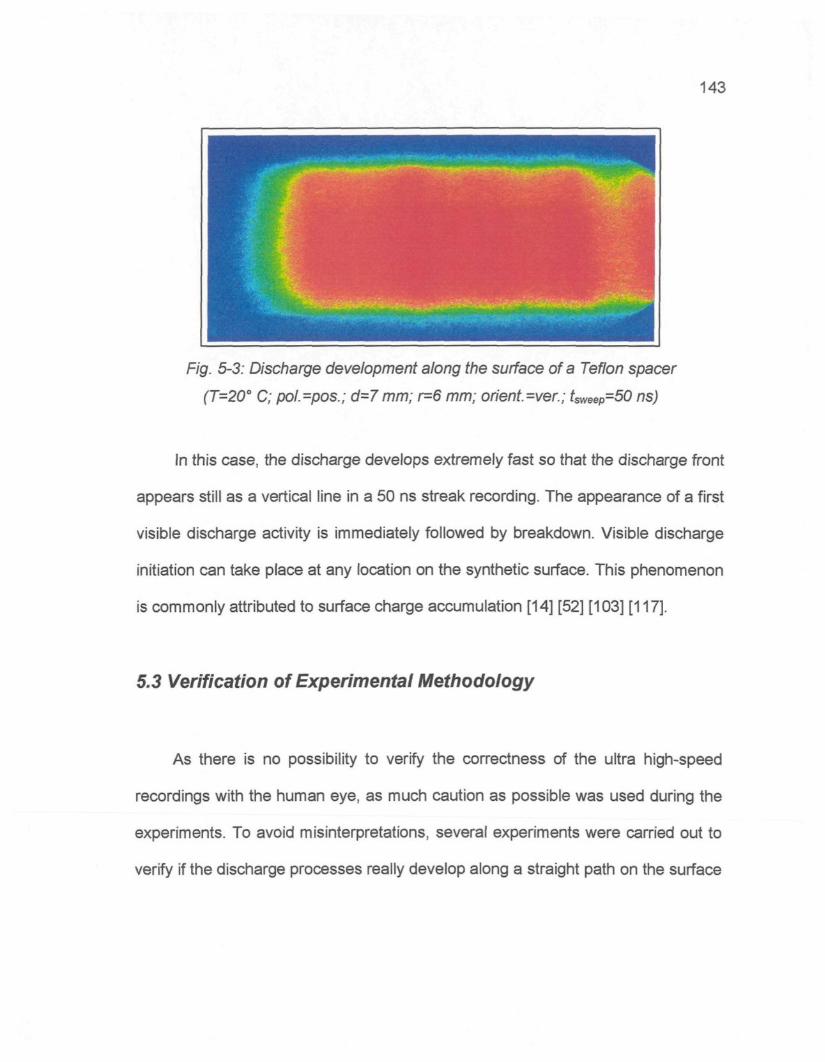
143
Fig. 5-3: Discharge development along the surface of a Teflon spacer
(T=20° C; pol.=pos.; d=7 mm; r=6 mm; orient.=ver; tsweep=50 ns)
In this case, the discharge develops extremely fast so that the discharge front
appears still as a vertical line in a 50 ns streak recording. The appearance of a first
visible discharge activity is immediately followed by breakdown. Visible discharge
initiation can take place at any location on the synthetic surface. This phenomenon
is commonly attributed to surface charge accumulation [14] [52] [103] [117],
5.3 Verification of Experimental Methodology
As there is no possibility to verify the correctness of the ultra high-speed
recordings with the human eye, as much caution as possible was used during the
experiments. To avoid misinterpretations, several experiments were carried out to
verify if the discharge processes really develop along a straight path on the surface
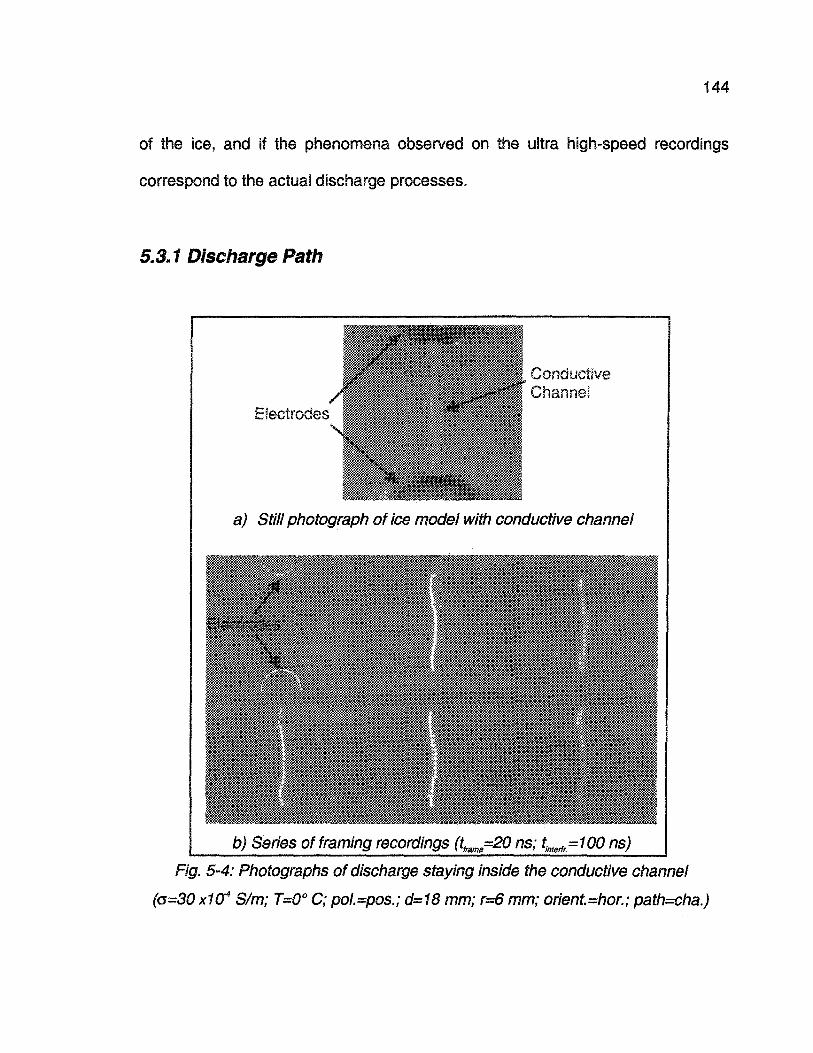
144
of the ice, and if the phenomena observed on the ultra high-speed recordings
correspond to the actual discharge processes.
5.3.1 Discharge Path
Electrodes
ConductiveChannel
a) Still photograph of ice model with conductive channel
'./ '. V .
� � &
� *
' ' � ' . ' ' �
� / / v -S*- .
r ^ , �
� ' - . �
'� 't'y o' '' *'£'%'? '" 'fy^j; *î''y't '?%{'�' �'': » * - <..
b) Series of framing recordings (tfmme=20 ns; tlmerir=i00 ns)
Fig. 5-4: Photographs of discharge staying inside the conductive channel
(G=30 XIO4 S/m; T=0° C; pol.=pos.; d=18 mm; r=6 mm; orient.=hor.; path=cha.)
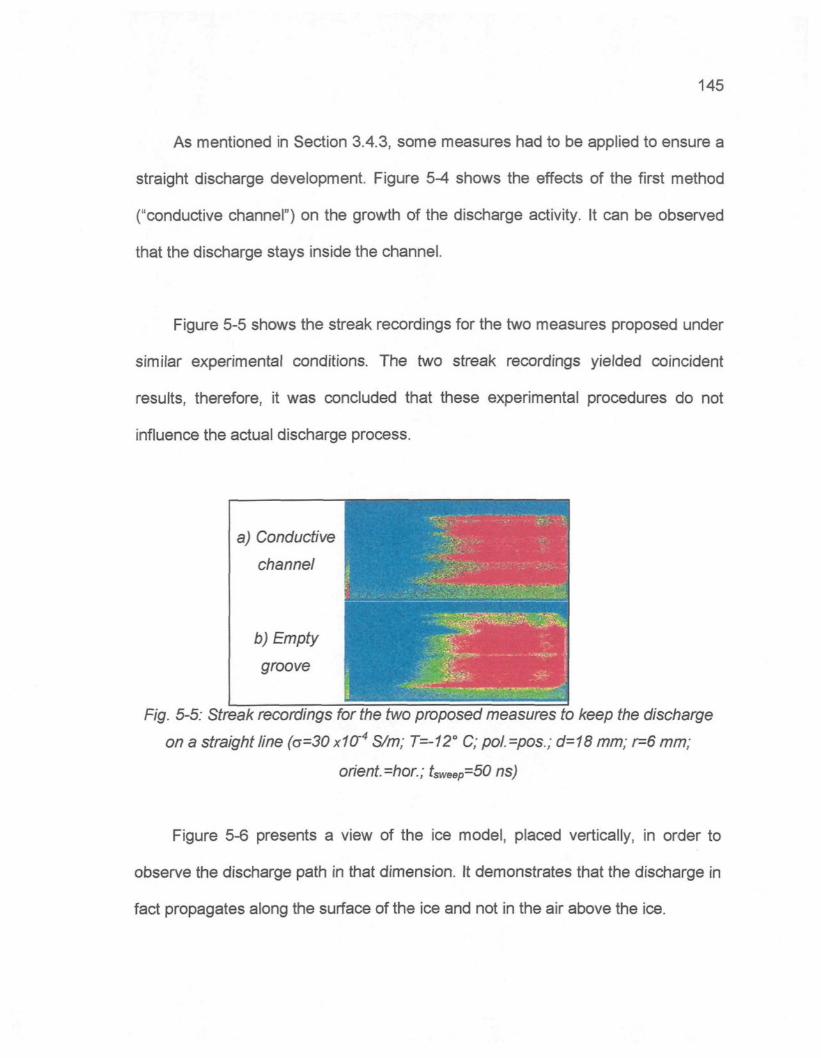
145
As mentioned in Section 3.4.3, some measures had to be applied to ensure a
straight discharge development. Figure 5^4 shows the effects of the first method
("conductive channel") on the growth of the discharge activity. It can be observed
that the discharge stays inside the channel.
Figure 5-5 shows the streak recordings for the two measures proposed under
similar experimental conditions. The two streak recordings yielded coincident
results, therefore, it was concluded that these experimental procedures do not
influence the actual discharge process.
a) Conductive
channel
b) Empty
groove
� ' � � � � " ' " - I
Fig. 5-5: Streak recordings for the two proposed measures to keep the discharge
on a straight line (a=30 xW4 S/m; T=-12° C; pol.=pos.; d-18 mm; r=6 mm;
orient =hor.; tSweeP=50 ns)
Figure 5-6 presents a view of the ice model, placed vertically, in order to
observe the discharge path in that dimension. It demonstrates that the discharge in
fact propagates along the surface of the ice and not in the air above the ice.
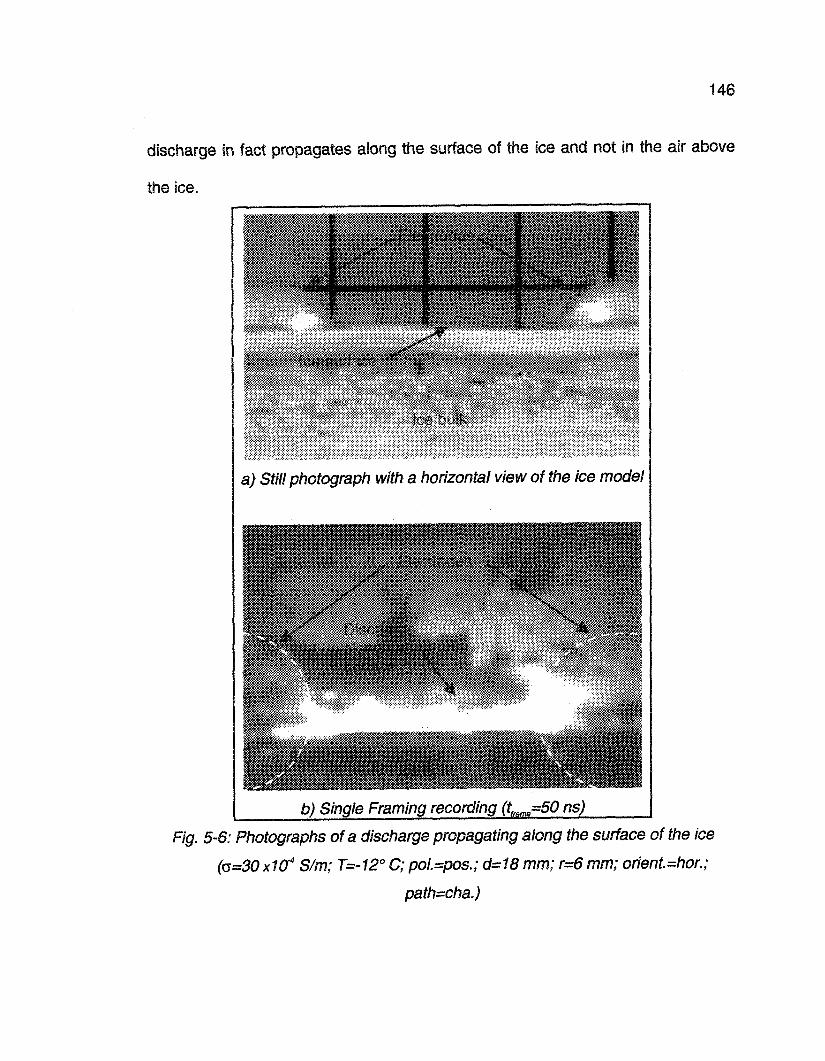
146
discharge in fact propagates along the surface of the ice and not in the air above
the ice.
a) Still photograph with a horizontal view of the ice model
b) Single Framing recording (tiiaij=5G ns)
Fig. 5-6: Photographs of a discharge propagating along the surface of the ice
(o=30x1(f S/m; T=-12° C; pol.=pos.; d=18 mm; r=6 mm; orient.=hor.;
path=cha.)
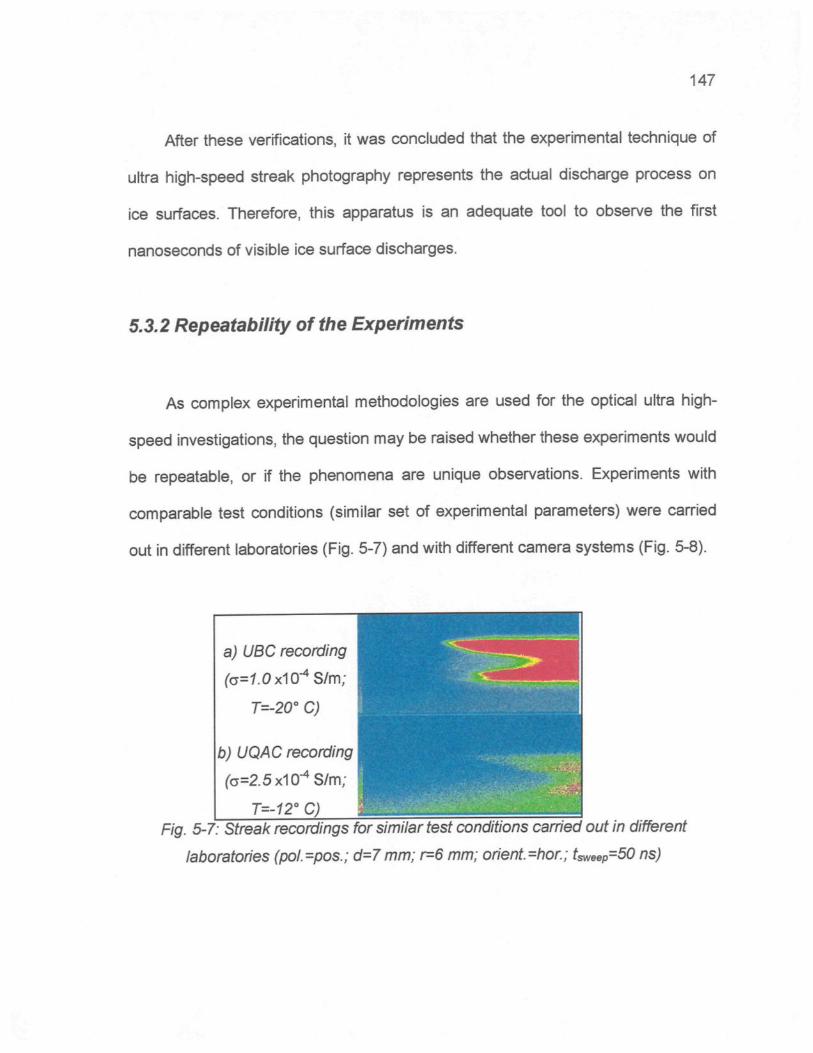
147
After these verifications, it was concluded that the experimental technique of
ultra high-speed streak photography represents the actual discharge process on
ice surfaces. Therefore, this apparatus is an adequate tool to observe the first
nanoseconds of visible ice surface discharges.
5.3.2 Repeatability of the Experiments
As complex experimental methodologies are used for the optical ultra high-
speed investigations, the question may be raised whether these experiments would
be repeatable, or if the phenomena are unique observations. Experiments with
comparable test conditions (similar set of experimental parameters) were carried
out in different laboratories (Fig. 5-7) and with different camera systems (Fig. 5-8).
a) UBC recording
(a=7.Ox10"4S/m;
T=-20° C)
b) UQAC recording
(G=2.5 xiO^
T�12° C)Fig. 5-7: Streak recordings for similar test conditions carried out in different
laboratories (pol. -pos.; d=7 mm; r=6 mm; orient -hor.; tsweep=50 ns)
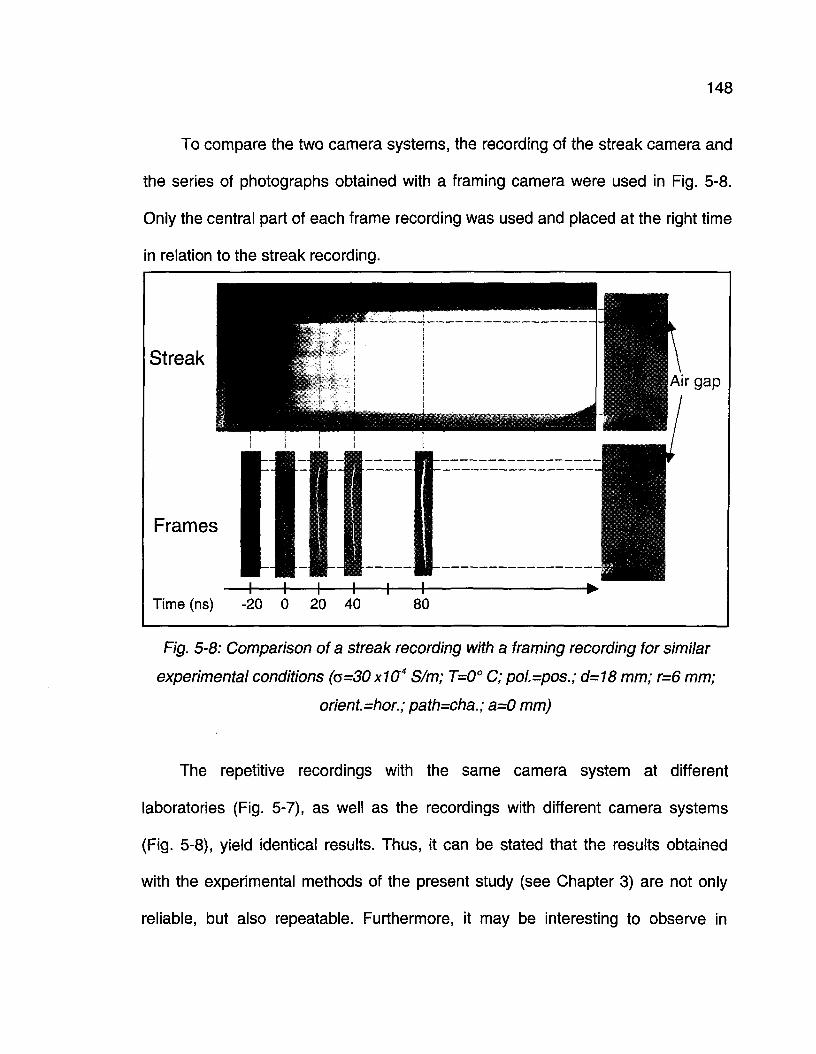
148
To compare the two camera systems, the recording of the streak camera and
the series of photographs obtained with a framing camera were used in Fig. 5-8.
Only the central part of each frame recording was used and placed at the right time
in relation to the streak recording.
Streak
Frames
Air gap
^�i�i�i�i�\Time (ns) -20 0 20 40 80
Fig. 5-8: Comparison of a streak recording with a framing recording for similar
experimental conditions (c=30 x1Q4 S/m; T=0° C; pol.=pos.; d=18 mm; r=6 mm;
orient.=hor.; path=cha.; a=0 mm)
The repetitive recordings with the same camera system at different
laboratories (Fig. 5-7), as well as the recordings with different camera systems
(Fig. 5-8), yield identical results. Thus, it can be stated that the results obtained
with the experimental methods of the present study (see Chapter 3) are not only
reliable, but also repeatable. Furthermore, it may be interesting to observe in
149
Fig. 5-8 that breakdown occurred 45 ns after the first appearance of a visible
ionisation process. This moment is located in-between two frames and can not be
determined with the framing camera only. Therefore, it may be said that both
photographic techniques - framing and streak recording - have their advantages
and are complementary.
At this point, it should be kept in mind that no interpretation of the intensity of
the light emissions in the streak recordings is done in this study, as the appearance
of the recorded image strongly depends on image processing (see Section 3.5.2).
Attention is directed towards the shape of the light emissions before the arrival of
total breakdown.
5.4 Ultra High-speed Photographic Observations for Ice Surfaces
without Artificial Air Gap
5.4.1 Experimental Results
5.4.1.1 7-mm Model
First, the streak recordings are presented for distance, d=7 mm, between the
electrodes. Figure 5-9 shows the streak recordings as a function of freezing water
conductivity, and Fig. 5-10 illustrates the influence of ice temperature.
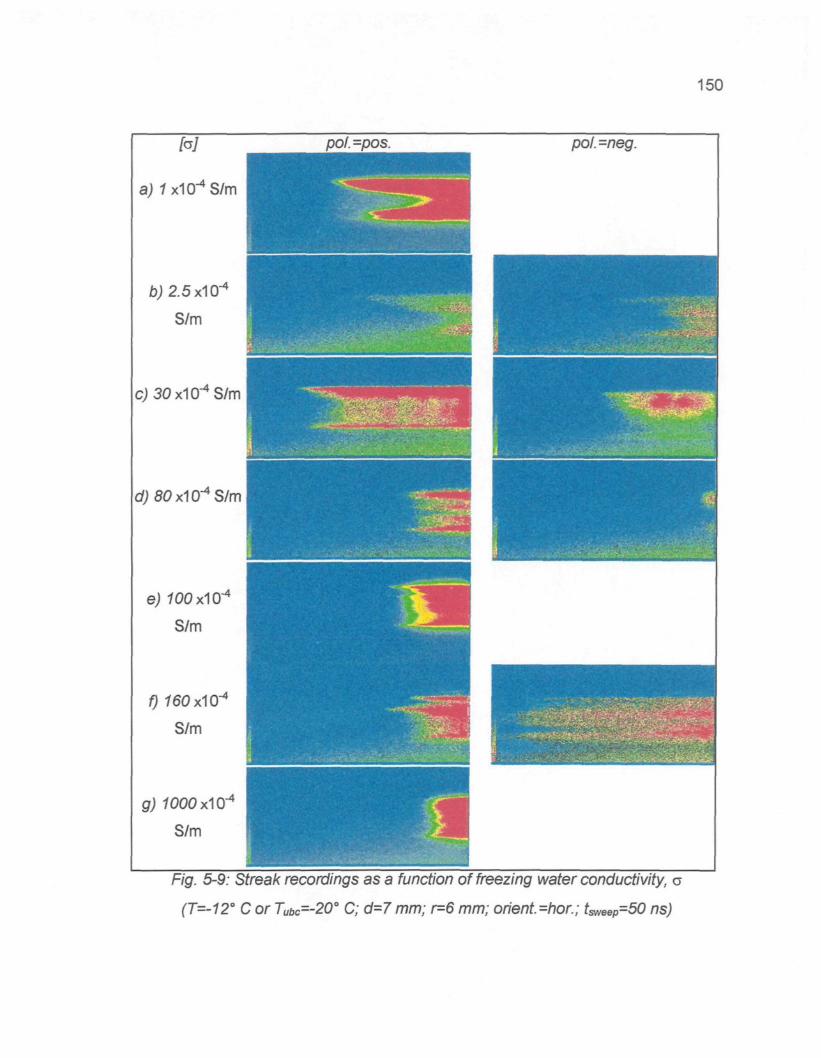
150
a) 7x10^ S/m
pol. =pos. pol. =-neg.
b)2.5xJ\Q-4
S/m
c) 30 x10'4S/m
d) 80 xiO"4 S/m
700x10^
S/m
f) 160 xiO"4
S/m
7000x10^
S/m
F/g. 5-9; Sfrea/c recordings as a function of freezing water conductivity, a
(T=-12° C or Tubc=-20a C; d-7 mm; r=6 mm; orient=hor; tsweeP=50 ns)
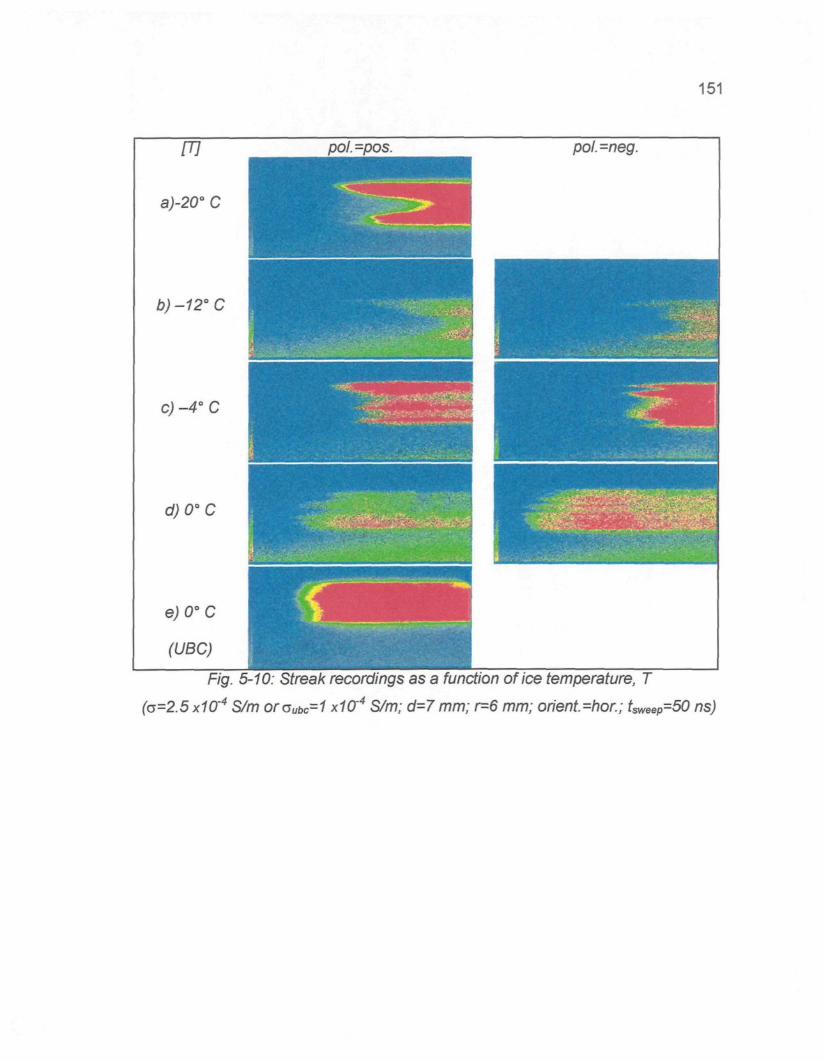
151
m
a)-20° C
pol.=pos. poi.-neg.
b) -12° C
c) -4° C
d)O°C
e)O"C
(UBC)
Fig. 5-10: Streak recordings as a function of ice temperature, T
((3=2.5 x10'4 S/m oroubc=1 x10~4 S/m; d-7 mm; r=6 mm; orient =hor; =50 ns)
152
5.4.1.2 18-mm Model
The streak recordings for the 18-mm model are presented next. Figure 5-11
shows the results as a function of freezing water conductivity, and Fig. 5-12
illustrates the influence of ice temperature on the discharge development. A series
of framing recordings in Fig. 5-13 illustrates the very fast discharge development
along the ice surface. A comparison of streak recordings for the two electrode
distances (6=7 mm and d=18 mm) is shown in Fig. 5-14. Afterwards, results are
presented for experimental parameters, which were only investigated with the
18-mm model. Figures 5-15 and 5-16 show results for different values of electrode
curvature radius. The influence of the electrode axis orientation is illustrated in Fig.
5-17.
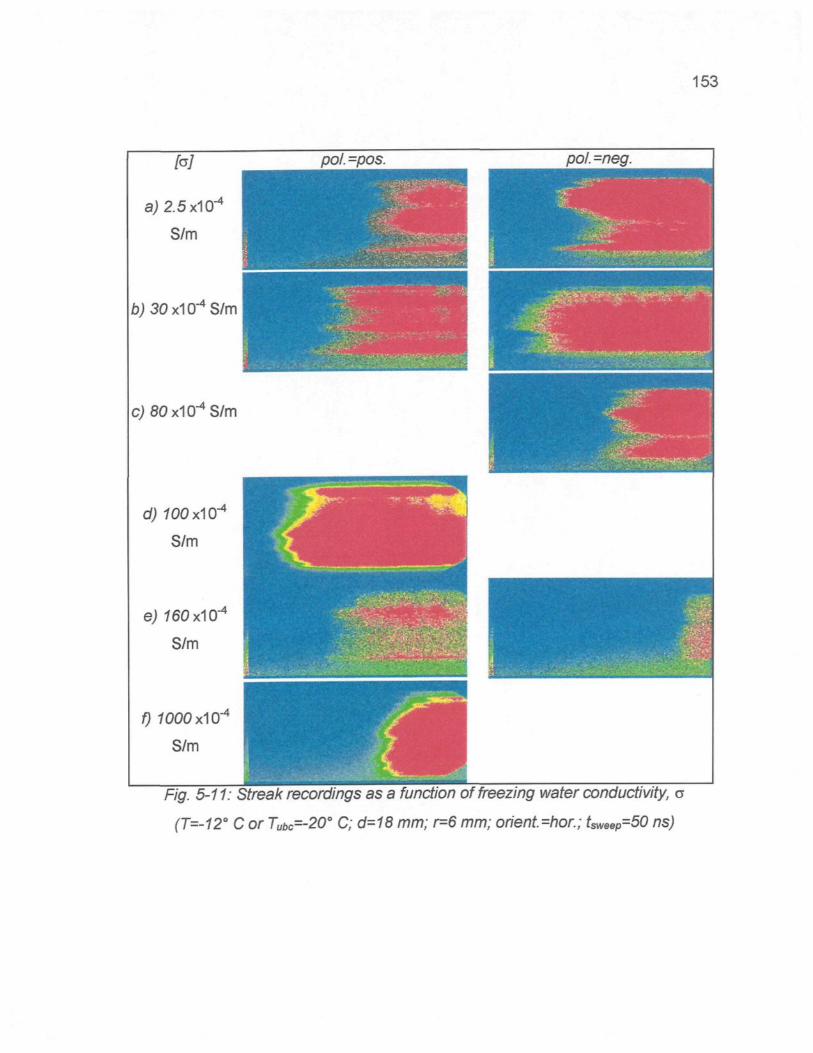
153
a) 2.5x10-*
S/m
b) 30 xKT4 S/m
pol.=pos pol. =neg.
c) 80 xKT4 S/m
S/m
; 160 xicr4
S/m
1000 xiCT4
S/m
F/g. 5-71* Sfrea/r recordings as a function of freezing water conductivity, c
(T=-12° C or Tubc=-20t> C; d=18 mm; r=6 mm; orient.=hor; tsweep=50 ns)
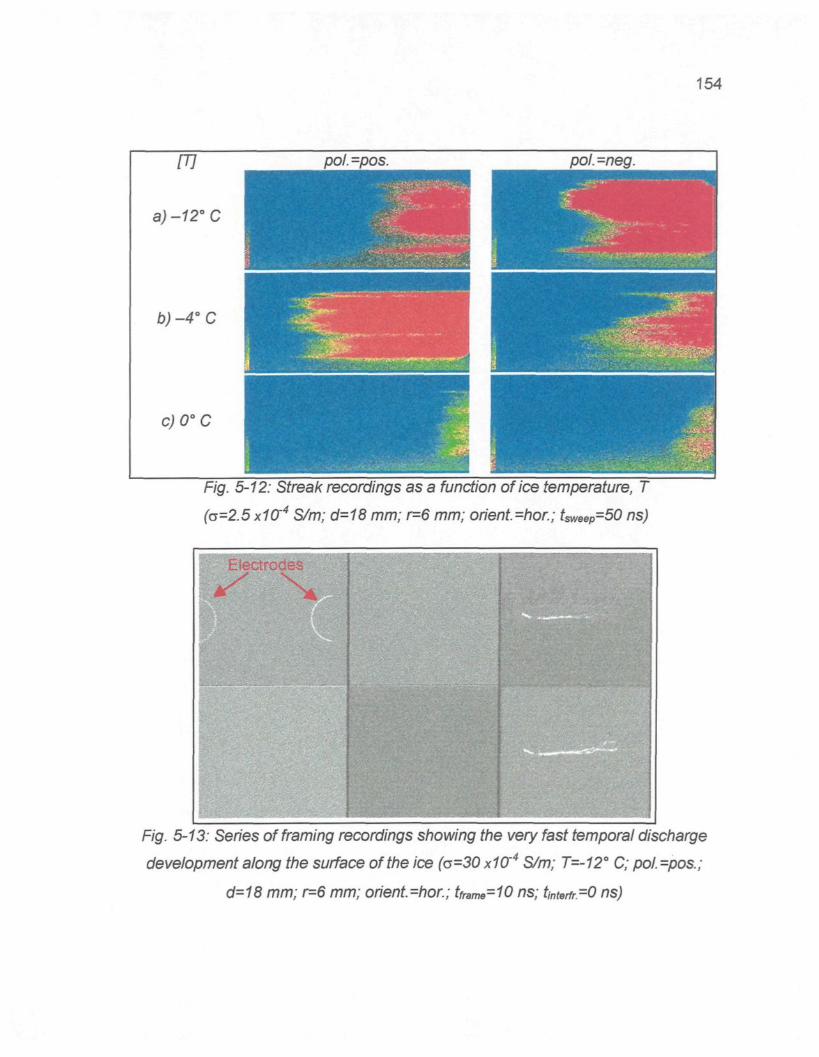
154
m
a) -12° C
b)-4°C
c)O°C
pol. =pos. pol.=neg.
\
Fig. 5-12: Streak recordings as a function of ice temperature, T
(G=2.5 x1Cr4 S/m; d=18 mm; r=6 mm; orient=hor; tsweep=50 ns)
Fig. 5-13: Series of framing recordings showing the very fast temporal discharge
development along the surface of the ice (a=30 x1(X4 S/m; T=-12° C; pol.=pos.;
d=18 mm; r=6 mm; orient=hor.; tframe=10 ns; tmterfr=O ns)
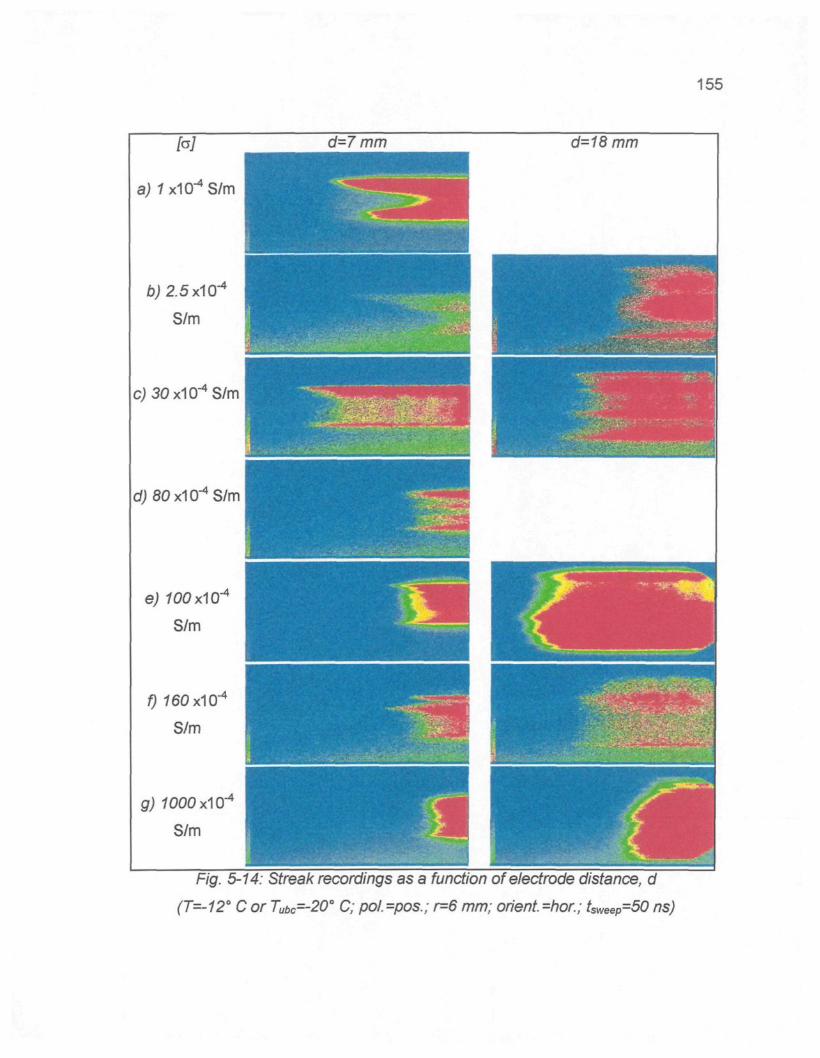
155
d=7 mm d=18 mm
-4a) 7x1 CT S/m
S/m
c) 30x10^ S/m
80 x10"4 S/m
700x1 (T
S/m
f) 760x10^
S/m
)000 xiCT
S/m
F/g. 5-74; Sfrea/f recordings as a function of electrode distance, d
(T=-12° C or Tut>c=-20° C; pol.=pos.; r=6 mm; orient =hor; fslveep=50 ns)
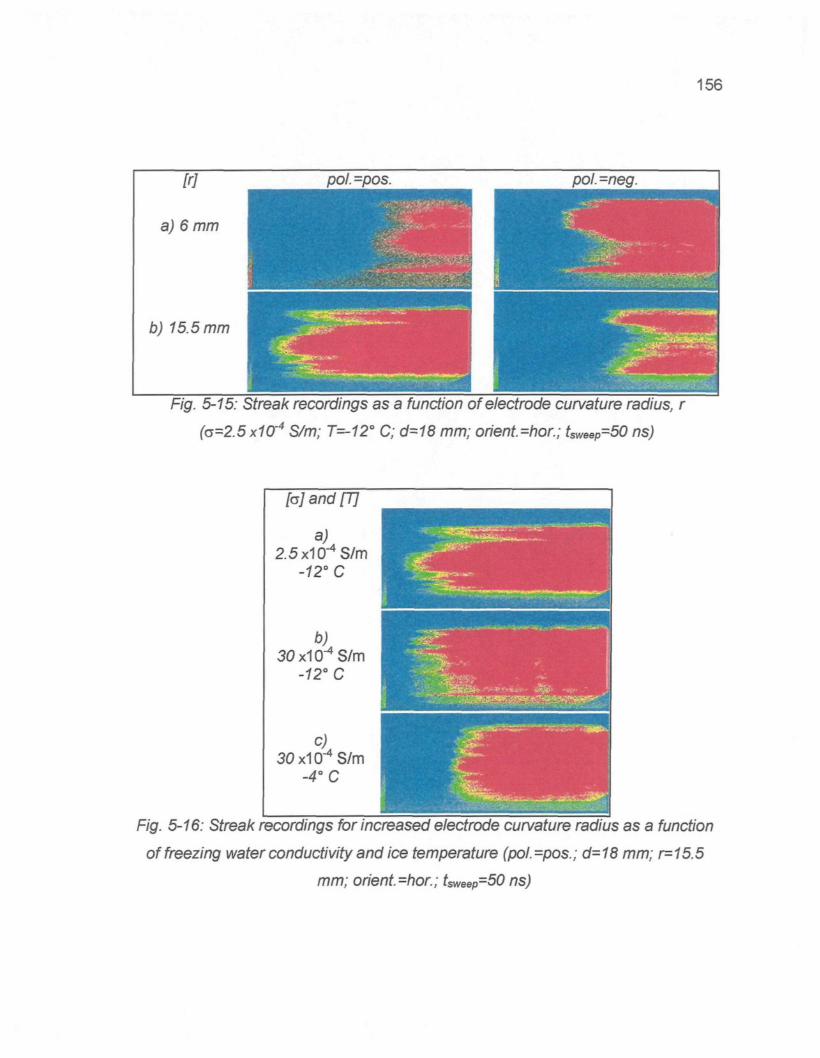
156
M
a) 6 mm
pol.=pos.
b) 15.5 mm
pol.=neg.
Fig. 5-15: Streak recordings as a function of electrode curvature radius,
(o=2.5x1Cr4 S/m; T=-12° C; d-18 mm; orient=hor.; tSweeP=50 ns)
[a] and [J]
2.5x10^ S/m-72° C
30 xiCT4 S/m-12° C
30 x10"4 S/m-4°C
:
-,, ! . . . " � � ; . » - ,
. ^ . � - . � � J
I I|E:!».-�-
be ;
Fig. 5-16: Streak recordings for increased electrode curvature radius as a function
of freezing water conductivity and ice temperature (pol.=pos.; d=18 mm; r=15,5
mm; orient. =hor.; tsweep-50 ns)
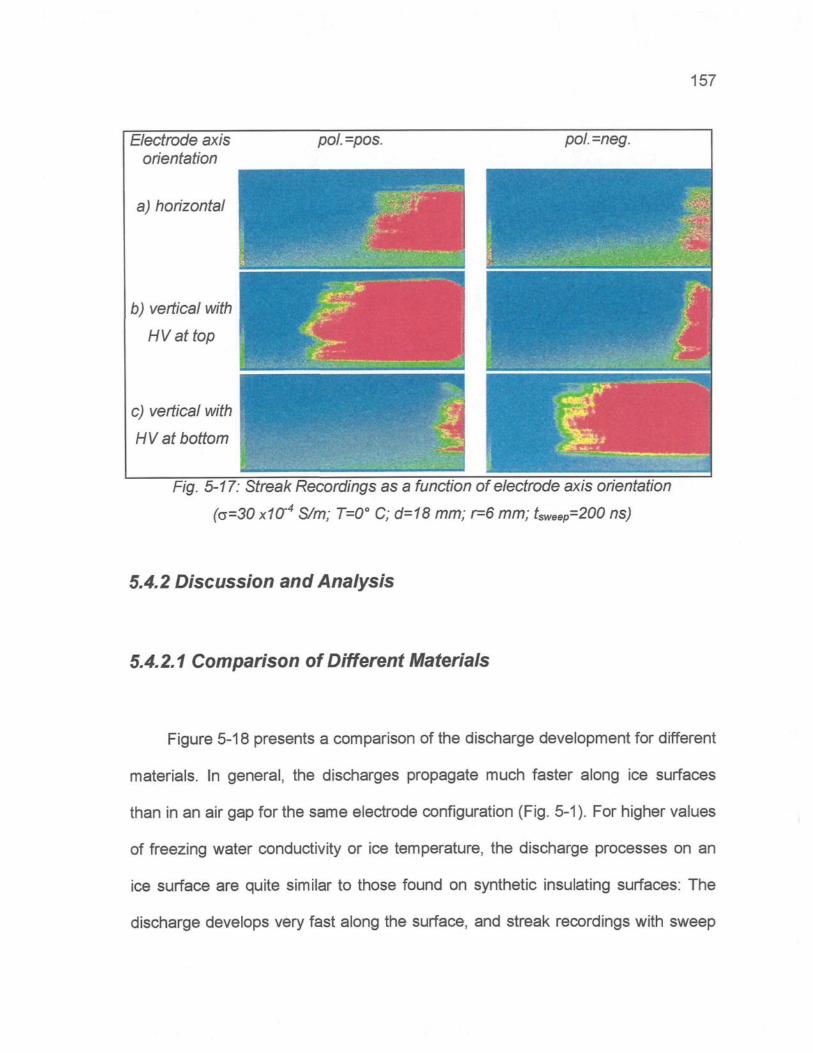
157
Electrode axisohentation
a) hon'zontal
pol.=po$ pol.=neg.
b) vertical with
HVattop
c) vertical with
HV at bottom
Fig. 5-17: Streak Recordings as a function of electrode axis orientation
(c=30 x10~4 S/m; T=0° C; d-18 mm; r=6 mm; tsweep=200 ns)
5.4.2 Discussion and Analysis
5.4.2.1 Comparison of Different Materials
Figure 5-18 presents a comparison of the discharge development for different
materials. In general, the discharges propagate much faster along ice surfaces
than in an air gap for the same electrode configuration (Fig. 5-1). For higher values
of freezing water conductivity or ice temperature, the discharge processes on an
ice surface are quite similar to those found on synthetic insulating surfaces: The
discharge develops very fast along the surface, and streak recordings with sweep
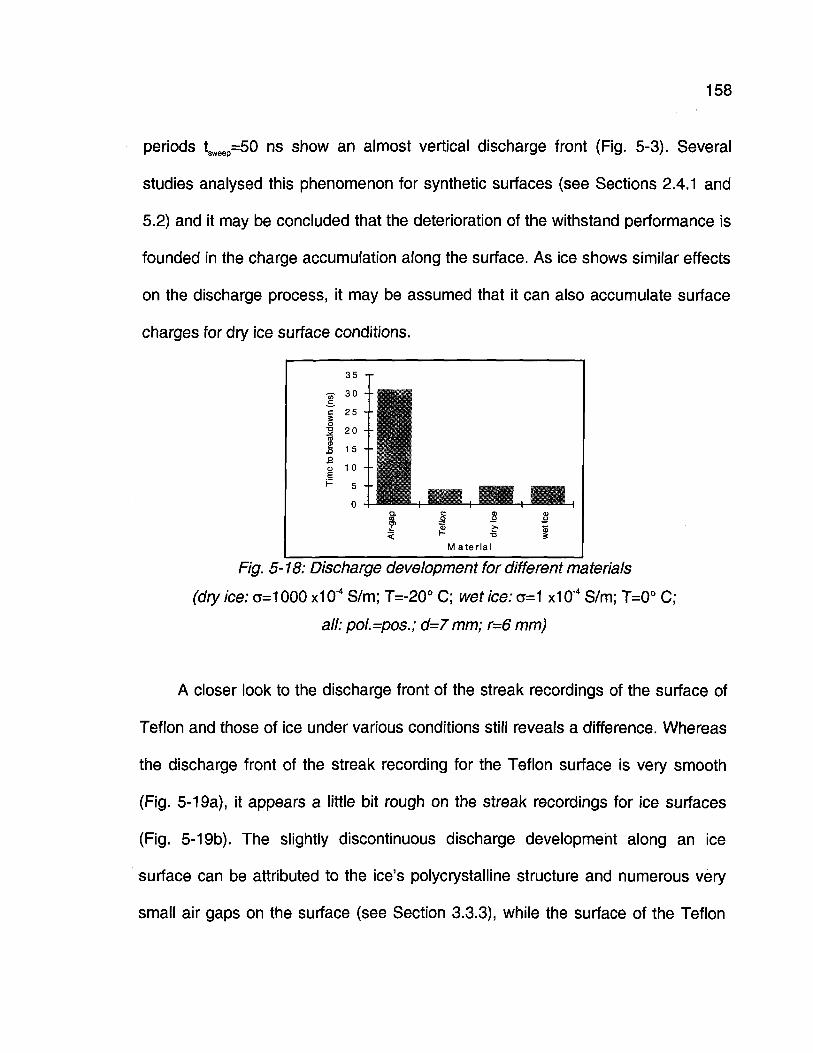
158
periods tsweep=50 ns show an almost vertical discharge front (Fig. 5-3). Several
studies analysed this phenomenon for synthetic surfaces (see Sections 2.4.1 and
5.2) and it may be concluded that the deterioration of the withstand performance is
founded in the charge accumulation along the surface. As ice shows similar effects
on the discharge process, it may be assumed that it can also accumulate surface
charges for dry ice surface conditions.
J.c
(0
SoEP
35 -
30 -
25 -
20 -
15 -
10 -
5 -
0 -
- � * '
Q .
Air
1, Wi,�o o
^ "O
M a te r ia i
_ | � i'i"aa�|
tlce
i
Fig. 5-18: Discharge development for different materials
(dry ice: c=1000 x10"4 S/m; T=-20° C; wet ice: a=1 x10⁴ S/m; T=0° C;
ail: pol.=pos.; d=7mm; r=6 mm)
A closer look to the discharge front of the streak recordings of the surface of
Teflon and those of ice under various conditions still reveals a difference. Whereas
the discharge front of the streak recording for the Teflon surface is very smooth
(Fig. 5-19a), it appears a little bit rough on the streak recordings for ice surfaces
(Fig. 5-19b). The slightly discontinuous discharge development along an ice
surface can be attributed to the ice's poiycrystaliine structure and numerous very
small air gaps on the surface (see Section 3.3.3), while the surface of the Teflon
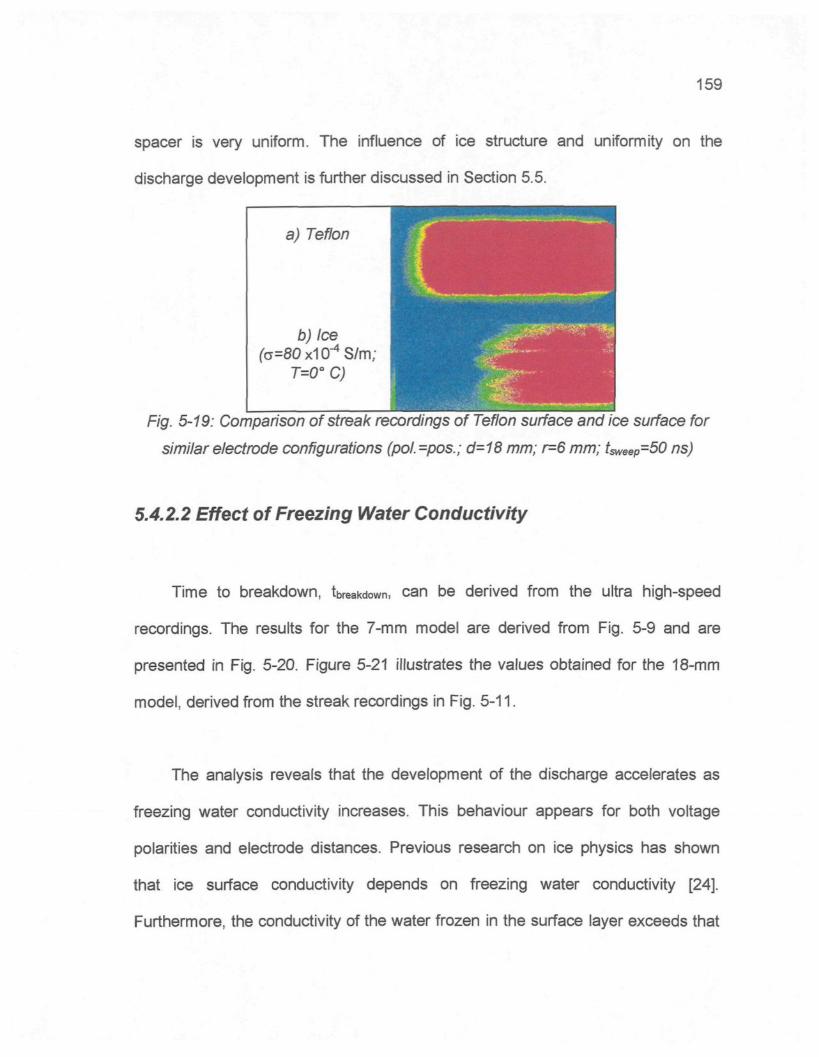
159
spacer is very uniform. The influence of ice structure and uniformity on the
discharge development is further discussed in Section 5.5.
a) Teflon
b)lce(a=80x1(r*S/m;
T=0° C)
Fig. 5-19: Comparison of streak recordings of Teflon surface and ice surface for
similar electrode configurations (pol.=pos.; d=18 mm; r=6 mm; tmmqF50 ns)
5.4.2.2 Effect of Freezing Water Conductivity
Time to breakdown, Wakdown, can be derived from the ultra high-speed
recordings. The results for the 7-mm model are derived from Fig. 5-9 and are
presented in Fig. 5-20. Figure 5-21 illustrates the values obtained for the 18-mm
model, derived from the streak recordings in Fig. 5-11.
The analysis reveals that the development of the discharge accelerates as
freezing water conductivity increases. This behaviour appears for both voltage
poiarities and electrode distances. Previous research on ice physics has shown
that ice surface conductivity depends on freezing water conductivity [24].
Furthermore, the conductivity of the water frozen in the surface layer exceeds that
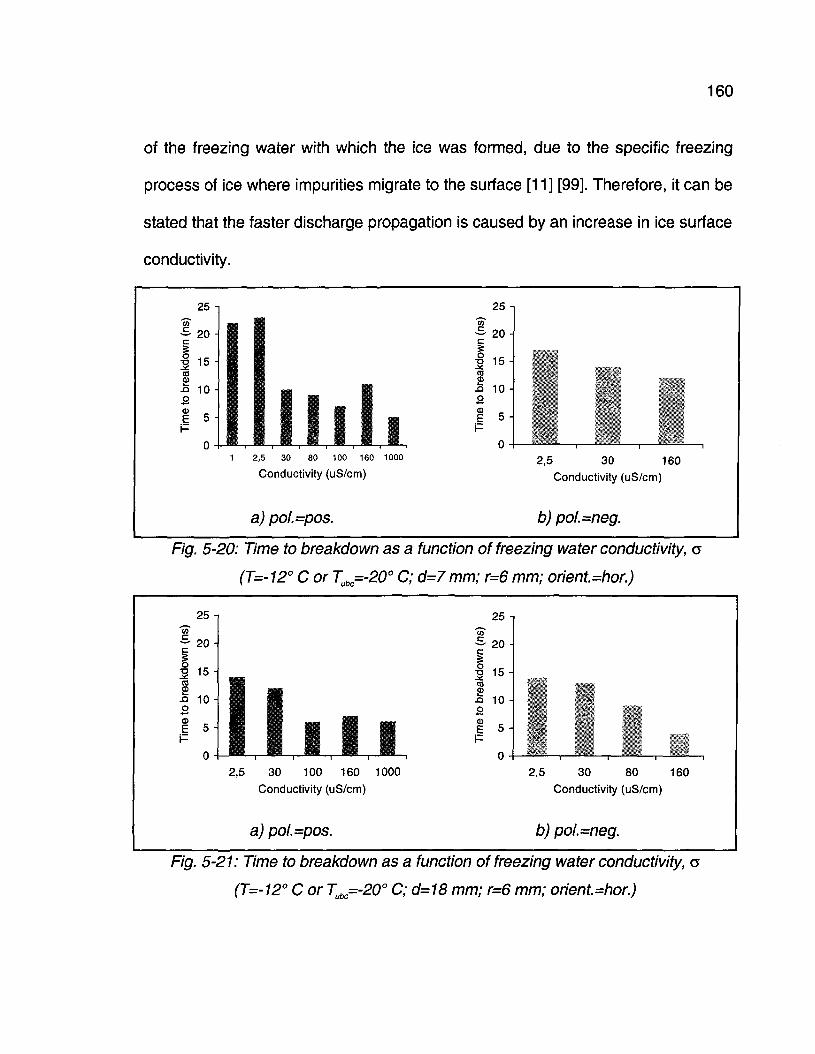
160
of the freezing water with which the ice was formed, due to the specific freezing
process of ice where impurities migrate to the surface [11] [99]. Therefore, it can be
stated that the faster discharge propagation is caused by an increase in ice surface
conductivity.
25
20 -
15 -
-Q 10 HB
.i 5 ^
1 2,5 30 80 100 160 1000
Conductivity (uS/cm)
a) pol.=pos.
2,5 30 160Conductivity (uS/cm)
b) pol.=neg.
Fig. 5-20: Time to breakdown as a function of freezing water conductivity, c
(T=-12° C or Tubc=-20° C; d=7 mm; r=6 mm; orient.=hor.)
25 -1 25
20 �
15 HCS
�o 10oCD
5 -
30 100 160 1000Conductivity (uS/cm)
a) pol.=pos.
2,5 30 80 160Conductivity (uS/cm)
b) pol.=neg.
Fig. 5-21: Time to breakdown as a function of freezing water conductivity, a
(T=-12° C or Tubc=-20° C; d=18 mm; r=6 mm; orient.=hor.)
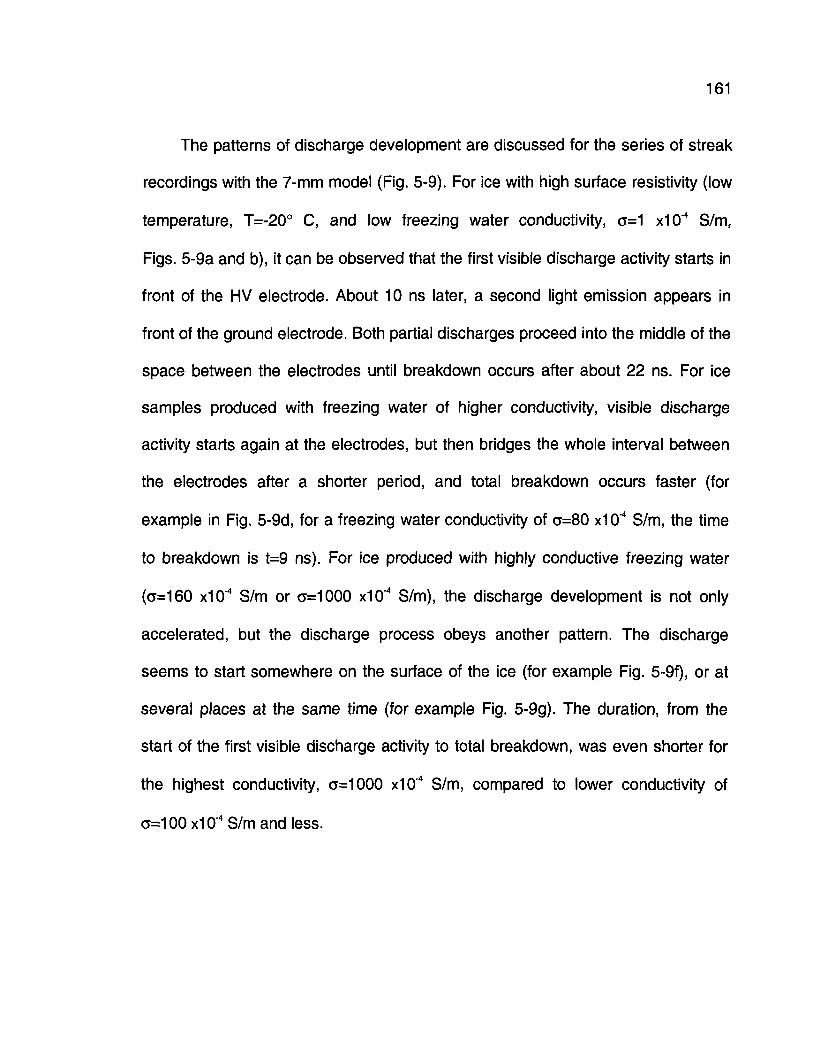
161
The patterns of discharge development are discussed for the series of streak
recordings with the 7-mm model (Fig. 5-9). For ice with high surface resistivity (low
temperature, T=-20° C, and low freezing water conductivity, a=1 x10'4 S/m,
Figs. 5-9a and b), it can be observed that the first visible discharge activity starts in
front of the HV electrode. About 10 ns later, a second light emission appears in
front of the ground electrode. Both partial discharges proceed into the middle of the
space between the electrodes until breakdown occurs after about 22 ns. For ice
samples produced with freezing water of higher conductivity, visible discharge
activity starts again at the electrodes, but then bridges the whole interval between
the electrodes after a shorter period, and total breakdown occurs faster (for
example in Fig. 5-9d, for a freezing water conductivity of c=80 x10'4 S/m, the time
to breakdown is t=9 ns). For ice produced with highly conductive freezing water
(c=160 X10"4 S/m or o=1000 x10'4 S/m), the discharge development is not only
accelerated, but the discharge process obeys another pattern. The discharge
seems to start somewhere on the surface of the ice (for example Fig. 5-9f), or at
several places at the same time (for example Fig. 5-9g). The duration, from the
start of the first visible discharge activity to total breakdown, was even shorter for
the highest conductivity, a=1000 x10'4 S/m, compared to lower conductivity of
o=100 x10"4 S/m and less.
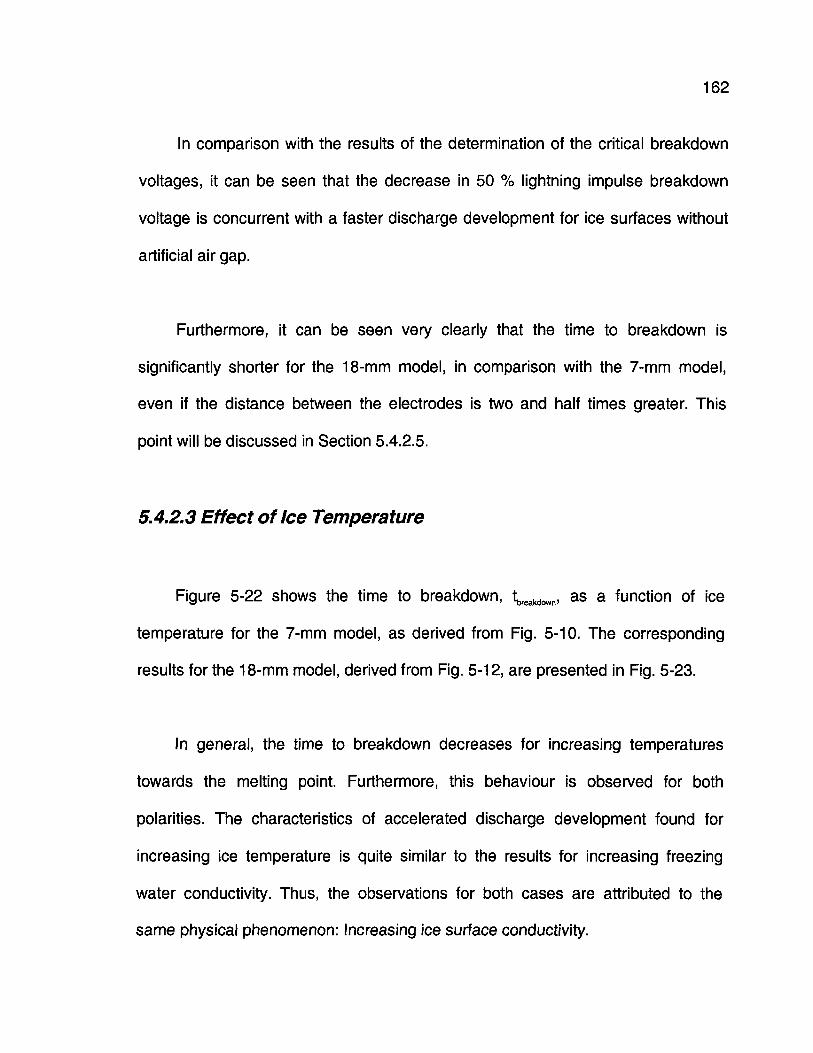
162
In comparison with the results of the determination of the critical breakdown
voltages, it can be seen that the decrease in 50 % lightning impulse breakdown
voltage is concurrent with a faster discharge development for ice surfaces without
artificial air gap.
Furthermore, it can be seen very clearly that the time to breakdown is
significantly shorter for the 18-mm model, in comparison with the 7-mm model,
even if the distance between the electrodes is two and half times greater. This
point will be discussed in Section 5.4.2.5.
5.4.2.3 Effect of Ice Temperature
Figure 5-22 shows the time to breakdown, tbreakdown, as a function of ice
temperature for the 7-mm model, as derived from Fig. 5-10. The corresponding
results for the 18-mm model, derived from Fig. 5-12, are presented in Fig. 5-23.
In general, the time to breakdown decreases for increasing temperatures
towards the melting point. Furthermore, this behaviour is observed for both
polarities. The characteristics of accelerated discharge development found for
increasing ice temperature is quite similar to the results for increasing freezing
water conductivity. Thus, the observations for both cases are attributed to the
same physical phenomenon: Increasing ice surface conductivity.
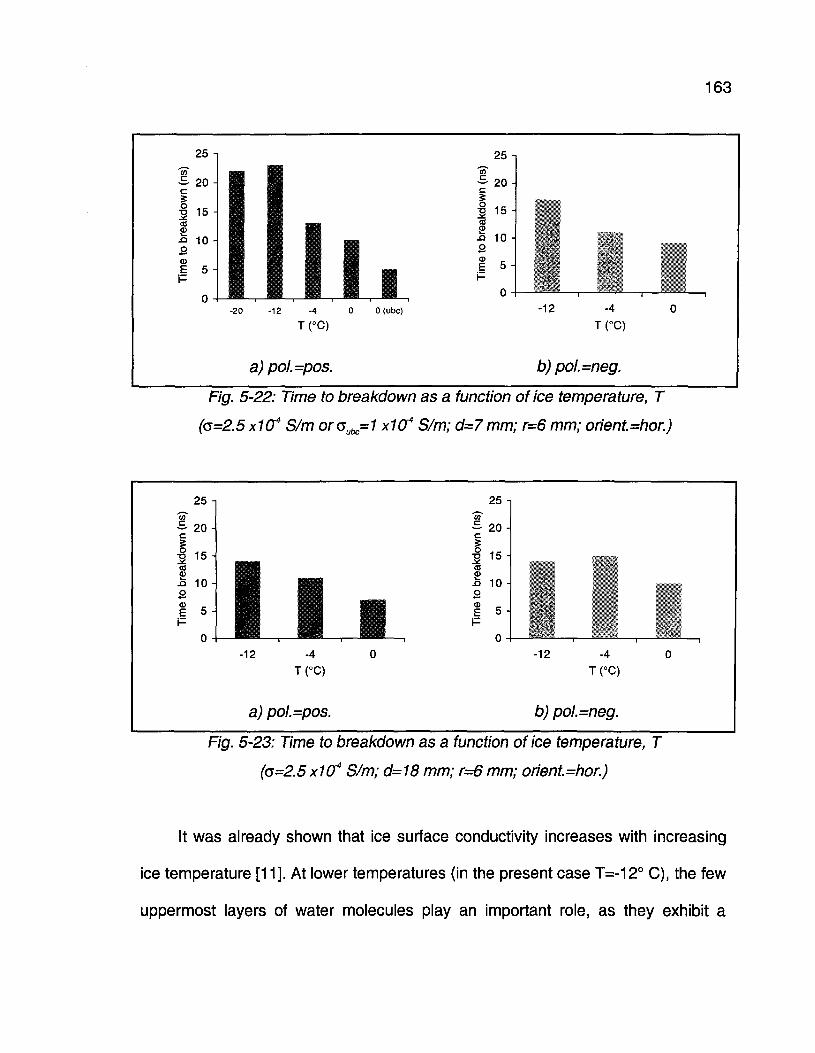
163
25 �
to b
reak
dow
n (
ns
O
Ul
O
ai.i 5 -
0 -
25 -,
II� I I I '1 1 1 1 1 Jm , 1 , 1 , � , 1 , o\-20 -12 -4 0 0(ubc)
T(°C)
a) pol.=pos.
-12 -4 0
T(°C)
b) pol.=neg.
Fig. 5-22: Time to breakdown as a function of ice temperature, T
((5=2.5 xW4 S/m orcubc=1 x10⁴ S/m; d=7 mm; r=6 mm; orient.=hor.)
25 -i"3T
c
Tim
e to
bre
akdo
v
Ol
O
Ul
n II-12 -4
T(°C)
a) pol.=pos.
|
0
25 -,
�S- 2 0 -c
Tim
e to
bre
akdo
v
Ul
O
Ol
n
-12 -4 0
T(°C)
b) pol.=neg.
Fig. 5-23: Time to breakdown as a function of ice temperature, T
(o=2.5xW4 S/m; d=18 mm; r=6 mm; orient.=hor.)
It was already shown that ice surface conductivity increases with increasing
ice temperature [11]. At lower temperatures (in the present case T=-12° C), the few
uppermost layers of water molecules play an important role, as they exhibit a
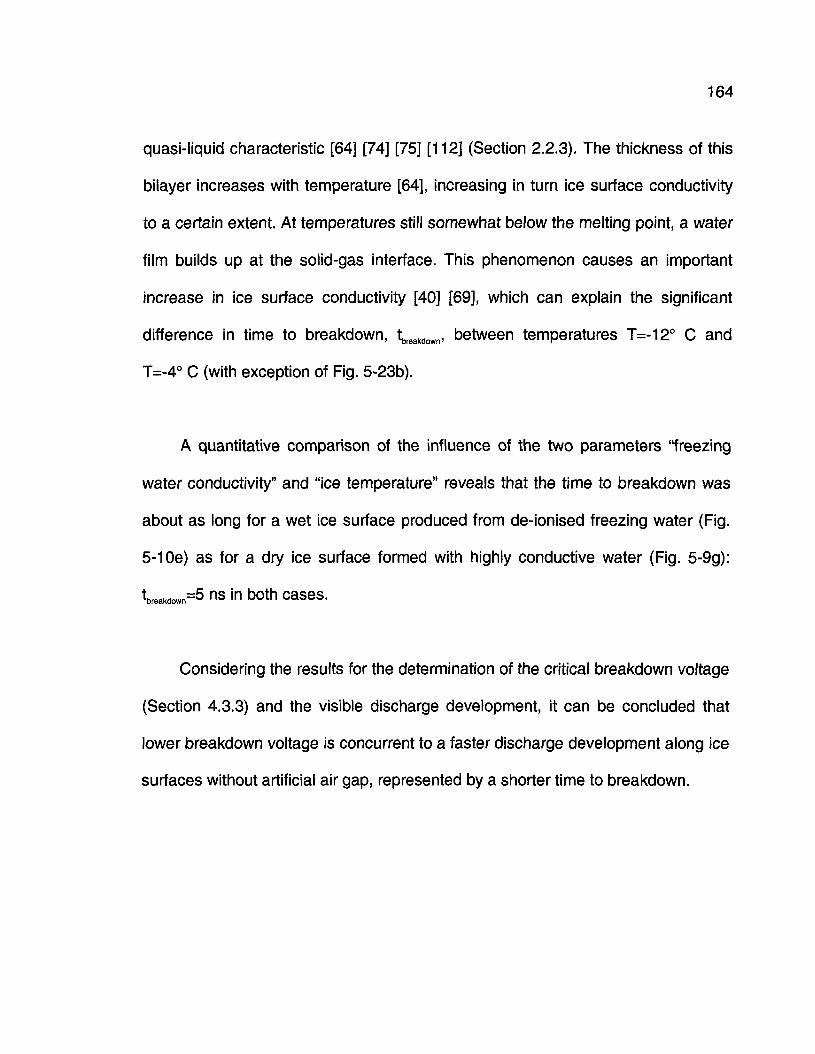
164
quasi-liquid characteristic [64] [74] [75] [112] (Section 2.2.3). The thickness of this
bilayer increases with temperature [64], increasing in turn ice surface conductivity
to a certain extent. At temperatures still somewhat below the melting point, a water
film builds up at the solid-gas interface. This phenomenon causes an important
increase in ice surface conductivity [40] [69], which can explain the significant
difference in time to breakdown, tbreakdown, between temperatures T=-12° C and
T=-4° C (with exception of Fig. 5-23b).
A quantitative comparison of the influence of the two parameters "freezing
water conductivity" and "ice temperature" reveals that the time to breakdown was
about as long for a wet ice surface produced from de-ionised freezing water (Fig.
5-1 Oe) as for a dry ice surface formed with highly conductive water (Fig. 5-9g):
n=5 ns in both cases.
Considering the results for the determination of the critical breakdown voltage
(Section 4.3.3) and the visible discharge development, it can be concluded that
lower breakdown voltage is concurrent to a faster discharge development along ice
surfaces without artificial air gap, represented by a shorter time to breakdown.
165
5.4.2.4 Effect of Voltage Polarity
To analyse the effect of voltage polarity on the visible discharge development,
the patterns of light emission in the streak recordings in front of the two electrodes
can be compared. In the case of the 18-mm model, a pronounced discharge
development was recorded for temperature T=-4° C (Fig. 5-12b). Therefore, these
images are discussed in more detail. A schematic representation of the streak
recordings is presented in Fig. 5-24.
Bent discharge front nearthe negative electrode("virtual gap")
Almost verticaldischarge front near thepositive electrode
Fig. 5-24: Schematic representation of the streak recordings (o=2.5x1(J4 S/m;
T=-12° C; pol.=neg.; d=18 mm; r=6 mm; orient.=hor.; tsweep=50 ns)
For negative voltage polarity applied to the HV electrode (HV electrode at the
top in Fig. 5-12b and Fig. 5-24), the first discharge appeared at a location on the
ice surface, not far from the grounded electrode (electrode at bottom in Fig. 5-12b).
A short period later, a second discharge started in front of the negative HV
electrode. Both activities grew together to finish in breakdown at a time t=15 ns.
166
Thus, a pronounced discharge development can be observed starting near the
grounded electrode (in this case positive pole as shown in Fig. 5-24) towards the
negative HV electrode. If the recording for positive voltage polarity is regarded
under the same aspect (Fig. 5-12b, left column), this arc-like discharge front can
also be found, this time in front of the grounded electrode at the bottom of the
photograph, which plays the role of negative pole for positive impulse voltage
applied to the HV electrode. More cases of discharge development towards
negative electrode (HV electrode for negative voltage or grounded electrode for
positive voltage) can also be found in several other streak recordings for the 7-mm
model, for example Fig. 5-9f or Fig. 5-1 Oc. Furthermore, discharge activity is
initiated first in front of the positive electrode for the 7-mm model, at very low
freezing water conductivity (o<2.5 x10'4 S/m) and low temperatures (T<-12° C) (Fig.
5-9a and b). Some nanoseconds later, a second visible discharge activity appears
in front of the negative electrode.
Generally, the first visible discharge activity is somewhat more likely to
appear in front or near the positive electrode and the succeeding growing process
develops towards the negative electrode. However, this is not always the case. For
example, a different discharge initiation near the negative HV electrode can be
seen in Fig. 5-12a. In the case that discharge activity appears in front of both
electrodes simultaneously, the discharge in front of the positive HV electrode
propagates faster in most cases (see Section 5.4.2.8). A similar polarity effect of
167
faster moving positive discharge was already observed in a study on propagation
of electrical discharges along the surface of a water bath (see Section 2.4.2) [10].
For dry ice surfaces, this observation may be related to the fact that the
electric conduction of ice is mainly of protonic nature [47] [73]. First, free charges
may be created in regions of increased electric field in the gaseous space. These
free charges may lead to surface charge accumulations similar to those proposed
for discharges on synthetic surfaces (see Section 2.4.1) [2]. Near the anode,
positive charges in the form of protons and positive ions are accumulated,
whereas, in front of the cathode, an excess of negative ions is present. A study on
streamer propagation along insulating surfaces showed that a streamer system
consisting of two components appears in the presence of a solid-gas interface [1].
The surface component travels much faster than a streamer in air alone. If we
assume that in the present case of an ice surface, the same phenomenon of a
combined streamer system exists, we can expect that it will propagate much faster
in front of the positive electrode, due to the protonic conduction characteristic of
ice.
5.4.2.5 Effect of Electrode Distance
Figure 5-14 presents a comparison of the streak recordings for the two
different electrode distances under the same experimental conditions. It can be
168
seen very clearly that the discharge development is in general faster for the 18-mm
model, even if the distance is more than twice that of the 7-mm model. Not only the
streak photographs, but also the framing recordings show the very fast discharge
development along the ice surface (Fig. 5-13). Even with the fastest framing rate
(t,rame=10 ns; tinterfr=0 ns), no gradual discharge development could be recorded.
Whereas the fourth frame does not show any visible light emission, the fifth frame
shows a local arc bridging almost the whole distance (in this case d=18 mm)
between the electrodes. In comparison with this fast ice surface discharge, the
discharge of a 7-mm air gap develops gradually over 4 frames for the same
camera adjustments (Fig. 5-2).
Previous research showed that breakdown may occur immediately without
the appearance of preceding corona discharges for very short distances between
the electrodes (see Section 2.3.3) [67]. Therefore, it is assumed that no charge
accumulation takes place in the case of the 7-mm model, as no pre-discharge
activity is encountered. The ionisation processes start in front of the electrodes
from where they proceed along dry ice surfaces until they meet to initiate ice
surface breakdown.
For the 18-mm model, the streak recordings show that the visible discharge
may start at a location on the ice surface (Fig. 5-11b, c, d, e, and f) or in front of the
electrodes (Fig. 5-11a, b, c, e, and f). Sometimes, it appears at several locations at
169
the same time (Fig. 5-11b, c and f). A previous investigation on surface flashover
under combined icing and contamination conditions reported also the possibility of
discharge initiation on the ice surface [95]. Therefore, it is assumed that some non-
visible processes take place and lead to charge accumulation along the ice surface
before the appearance of visible discharges. The electric field becomes distorted
locally due to the surface charges, and ionisation processes may start at the
locations where the critical field value is exceeded.
This hypothesis is supported by a recent publication on pre-breakdown
phenomena at a solid-gas interface in the case of SFg/N2 mixtures [85], which
reports a comparison of experimental investigations and numerical simulations of
the pre-breakdown process. The experimental investigations revealed that due to
surface charge accumulation, first appearance of visible discharges were found on
the surface, at a certain distance from the electrodes. A calculation based on a
numerical model without considering any surface charge accumulation did indicate
that the first visible discharge activity would appear in front of the electrode. A
reason for this discrepancy could be the fact that the numerical model did not take
into account surface charge accumulation. These findings, despite the different
materials investigated, may confirm the explanation for the different discharge
development processes as a function of electrode distance as found in the present
study.
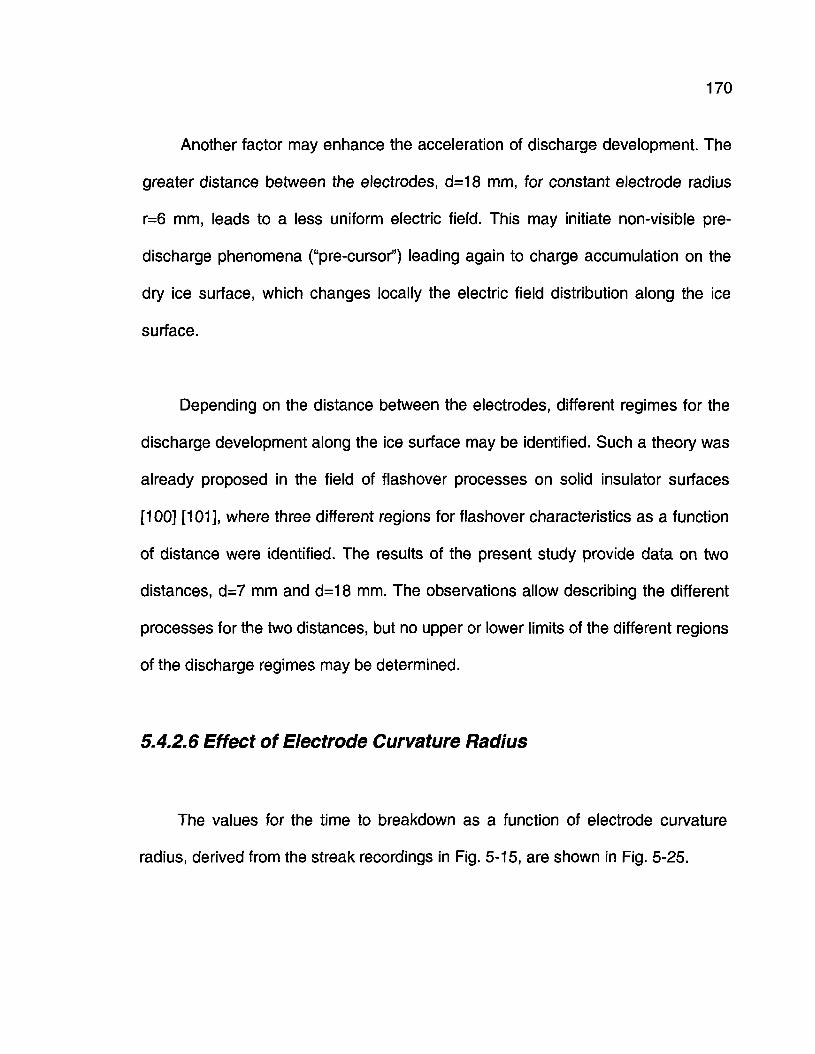
170
Another factor may enhance the acceleration of discharge development. The
greater distance between the electrodes, d=18 mm, for constant electrode radius
r=6 mm, leads to a less uniform electric field. This may initiate non-visible pre-
discharge phenomena ("pre-cursor") leading again to charge accumulation on the
dry ice surface, which changes locally the electric field distribution along the ice
surface.
Depending on the distance between the electrodes, different regimes for the
discharge development along the ice surface may be identified. Such a theory was
already proposed in the field of flashover processes on solid insulator surfaces
[100] [101], where three different regions for flashover characteristics as a function
of distance were identified. The results of the present study provide data on two
distances, d=7 mm and d=18 mm. The observations allow describing the different
processes for the two distances, but no upper or lower limits of the different regions
of the discharge regimes may be determined.
5.4.2.6 Effect of Electrode Curvature Radius
The values for the time to breakdown as a function of electrode curvature
radius, derived from the streak recordings in Fig. 5-15, are shown in Fig. 5-25.
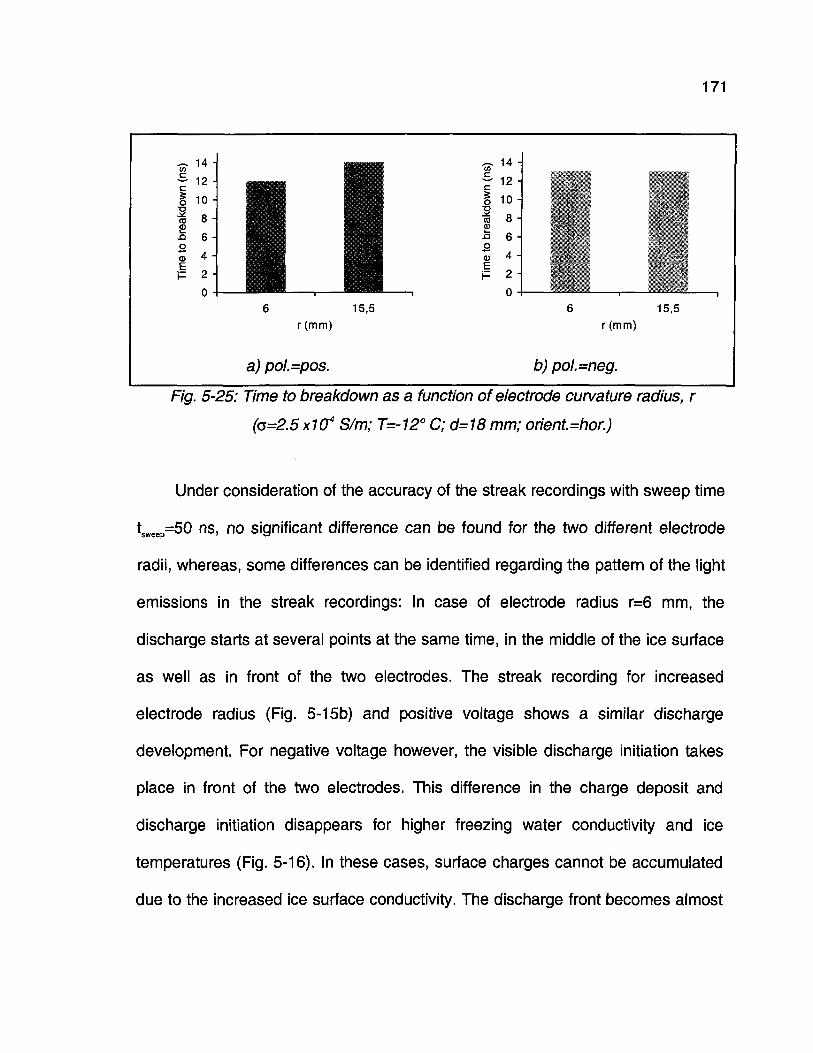
171
15,5r (mm)
a) pol.=pos. b) pol.=neg.
Fig. 5-25: Time to breakdown as a function of electrode curvature radius, r
(c=2.5x10⁴ S/m; T=-12° C; d=18 mm; orient.=hor.)
Under consideration of the accuracy of the streak recordings with sweep time
tsweep=50 ns, no significant difference can be found for the two different electrode
radii, whereas, some differences can be identified regarding the pattern of the light
emissions in the streak recordings: In case of electrode radius r=6 mm, the
discharge starts at several points at the same time, in the middle of the ice surface
as well as in front of the two electrodes. The streak recording for increased
electrode radius (Fig. 5-15b) and positive voltage shows a similar discharge
development. For negative voltage however, the visible discharge initiation takes
place in front of the two electrodes. This difference in the charge deposit and
discharge initiation disappears for higher freezing water conductivity and ice
temperatures (Fig. 5-16). In these cases, surface charges cannot be accumulated
due to the increased ice surface conductivity. The discharge front becomes almost
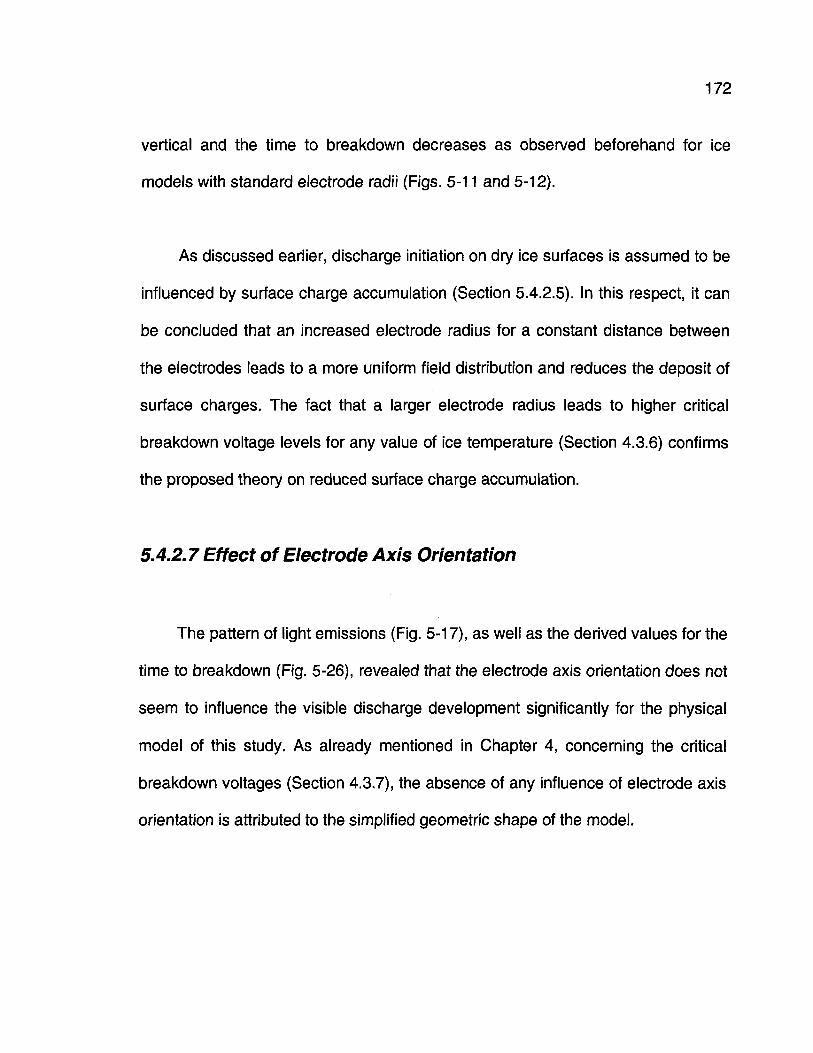
172
vertical and the time to breakdown decreases as observed beforehand for ice
models with standard electrode radii (Figs. 5-11 and 5-12).
As discussed earlier, discharge initiation on dry ice surfaces is assumed to be
influenced by surface charge accumulation (Section 5.4.2.5). In this respect, it can
be concluded that an increased electrode radius for a constant distance between
the electrodes leads to a more uniform field distribution and reduces the deposit of
surface charges. The fact that a larger electrode radius leads to higher critical
breakdown voltage levels for any value of ice temperature (Section 4.3.6) confirms
the proposed theory on reduced surface charge accumulation.
5.4.2.7 Effect of Electrode Axis Orientation
The pattern of light emissions (Fig. 5-17), as well as the derived values for the
time to breakdown (Fig. 5-26), revealed that the electrode axis orientation does not
seem to influence the visible discharge development significantly for the physical
model of this study. As already mentioned in Chapter 4, concerning the critical
breakdown voltages (Section 4.3.7), the absence of any influence of electrode axis
orientation is attributed to the simplified geometric shape of the model.
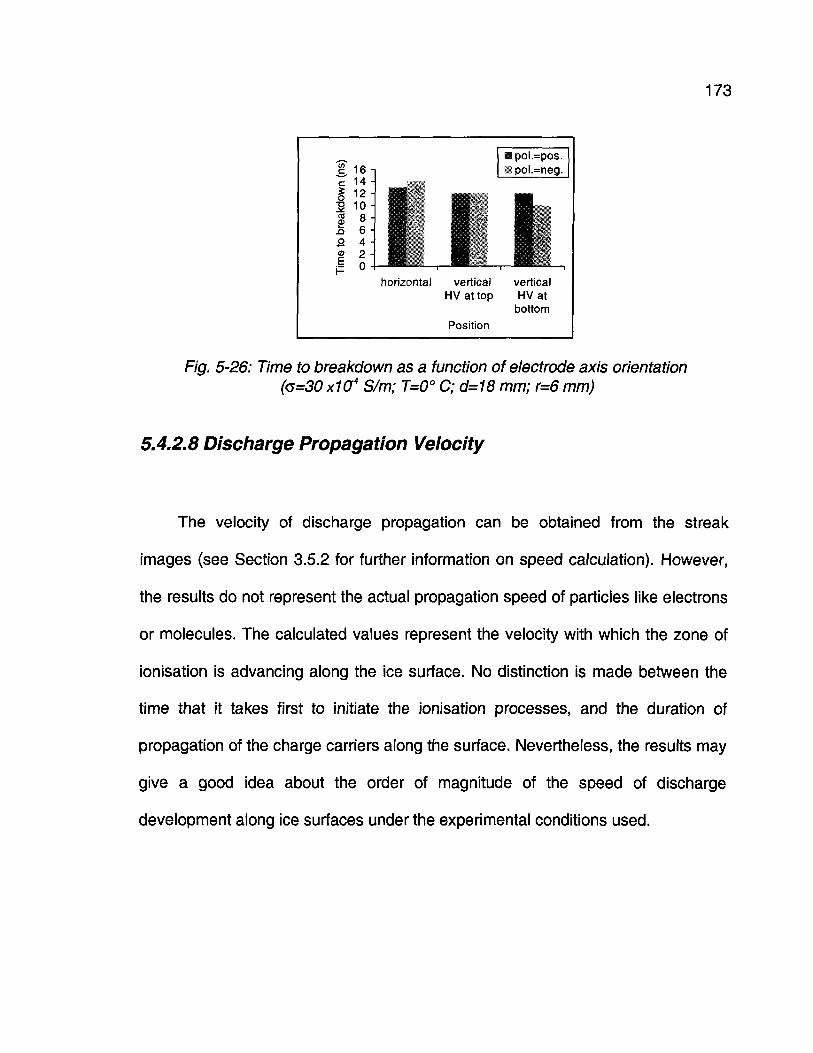
173
2 16 -ir 14 -§ 12 iS 10S 8h 6 -
4 -2 -0
2CD
� pol.=pos.gpol.=neg.
horizontal vertical verticalHV at top HV at
bottomPosition
Fig. 5-26: Time to breakdown as a function of electrode axis orientation(G=30 XIO4 S/m; T=0° C; d=18 mm; r=6 mm)
5.4.2.8 Discharge Propagation Velocity
The velocity of discharge propagation can be obtained from the streak
images (see Section 3.5.2 for further information on speed calculation). However,
the results do not represent the actual propagation speed of particles like electrons
or molecules. The calculated values represent the velocity with which the zone of
ionisation is advancing along the ice surface. No distinction is made between the
time that it takes first to initiate the ionisation processes, and the duration of
propagation of the charge carriers along the surface. Nevertheless, the results may
give a good idea about the order of magnitude of the speed of discharge
development along ice surfaces under the experimental conditions used.
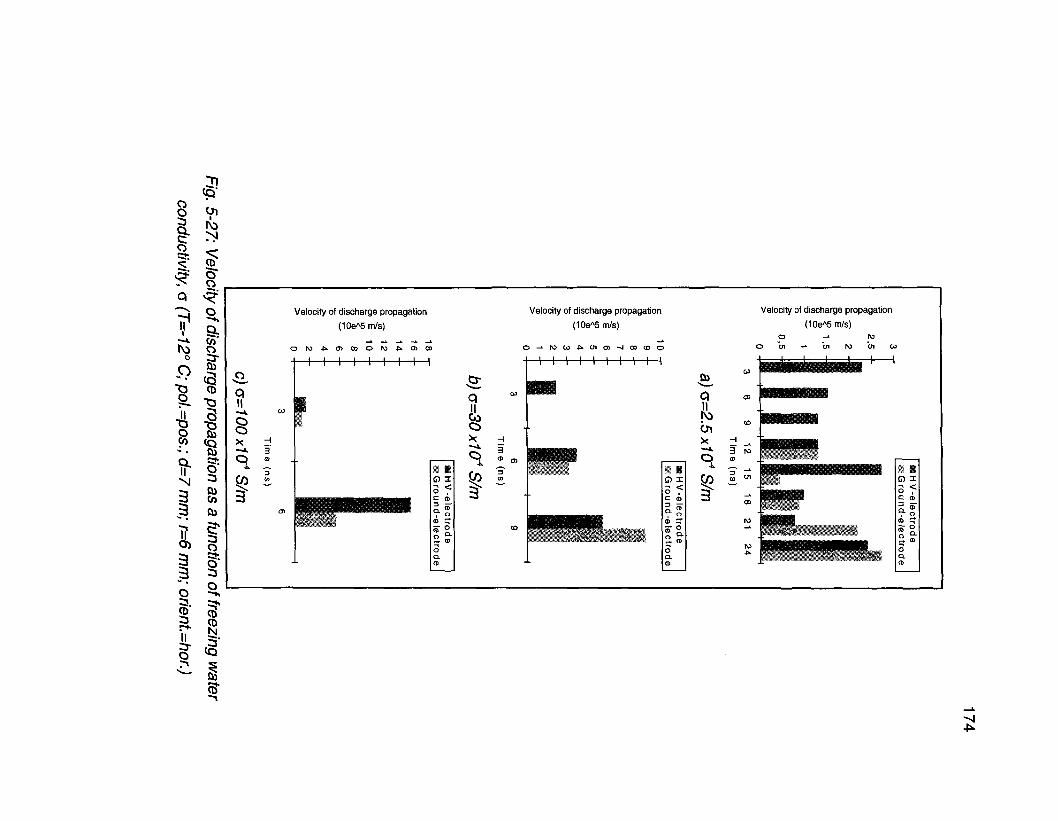
ICJlIV»NI
Q
IV)o
133
Q.en"
II!I?»Co
Velocity of discharge propagation
(106*5 m/s)
Velocity of discharge propagation
(106*5 m/s)
I I I I I I I
k
IioocQ .
CDlecti
oQ .CD
IX
CDlec
od
e
Velocity of discharge propagation
(106*5 m/s)
a x
âr(D' O
r i CD
CD" CDCD
175
As the discharge development lasts longer for the 7-mm model, calculations
of the discharge propagation velocity are carried out for the 7-mm model
representatively. Three levels of freezing water conductivity are studied and the
results are presented in Fig. 5-27. The corresponding streak recordings can be
found in Figs. 5-9b, c and e.
It can be seen that the velocity of discharge propagation is not constant. After
the discharge has started at a certain velocity, it continues to propagate somewhat
slower. This behaviour can be attributed to the distribution of the electric field in the
space between the electrodes, which is not totally uniform (see Section 3.3.2).
Then, the velocity increases again as the discharge proceeds from the electrodes
along the surface and approaches the second discharge activity, which has started
in front of the other electrode. From time to time, the velocity seems to increase in
steps, in particular in the final stage. A very fast development (like a final jump) can
be found when both partial discharges meet, leading to final breakdown along the
ice surface. The values for discharge propagation velocity range from about
1.5 x10⁵ m/s to 2.5 x10⁵ m/s in the first 3 ns-interval up to more than 10 x105 m/s for
the final jump in the last 3 ns-interval immediately before total breakdown.
Furthermore, the calculated velocity values illustrate very clearly the acceleration
effect of increasing ice surface conductivity revealed beforehand (Sections 5.4.2.2
and 5.4.2.3).
176
It can be said that the discharge growth from the positive HV electrode is
faster in most cases, in comparison with the discharge activity in front of the
negative electrode (with exception of the final stages for c=2.5 x10'4 S/m and
G=30 x10'4 S/m, Fig. 5-9a and b). A similar polarity effect of faster moving positive
discharge was already observed in a study on discharge propagation of electrical
discharges along the surface of an electrolyte [10].
In the case of the 18-mm model, propagation velocities of the visible
discharge processes are much higher than for the 7-mm model (Section 5.4.2.5).
The gradual development observed for the 7-mm model is not found for increased
electrode distance, therefore it can be concluded that another type of discharge
process takes place (see Section 5.4.2.5). For low freezing water conductivity and
low temperature, discharge propagation velocities of about 15 x10s m/s can be
observed in the case of increased electrode distance, whereas for freezing water
conductivity exceeding a=100 x10"4 S/m and temperatures near the melting point,
T=0° C, the discharge development becomes so fast that it cannot be resolved with
the experimental set-up used. The front of the visible discharge phenomenon
appears as a vertical line on the streak photograph.
In summary, it can be said that the values obtained for the discharge
development velocity along the ice surfaces are in the same range as results of a
study on streamer propagation on different synthetic insulating surfaces [1].
177
5.4.2.9 Effect of Steepness of Voltage Rise
Another experimental parameter should be mentioned: The steepness of the
applied impulse voltage. During the preliminary test series at UBC, some
experiments were carried out using a 7-mm Teflon spacer. The streak recordings
did change if the steepness of the applied voltage was increased. The assumption
was established that there may be a dependence of the waveform of the applied
impulse voltage on the discharge development process. However, no other results
or discussions on this point were found in the literature, in spite of the numerous
studies in the field of discharges on synthetic insulator surfaces.
Some tests were carried out with ice models in the first experimental phase at
UBC. The images obtained are shown in Fig. 5-28, related to the U50%-t
characteristic. The streak recordings show a change in the light emissions: The
discharge propagation velocity seems to decrease for decreasing steepness of
voltage rise. It is assumed that longer voltage application time allows the non-
visible pre-discharge phenomena to accumulate more surface charges on dry ice
surfaces, which leads in turn to faster visible discharge development leading to
breakdown. However, no general tendency can be concluded at this moment, as
experiments on the parameter "voltage rise time" did not always reveal the same
results for constant experimental conditions. Furthermore, the experimental set-up
at UQAC did not allow continuing the recordings of very early breakdown.

178
Therefore, no conclusion can be drawn at this moment, but it is proposed that the
gradient of increase of applied voltage may be considered as one of the
experimental parameters in further investigations. A new control unit of the HV
system at UQAC will render the observation of very early discharge phenomena
possible in the future.
Voltage rise time (ns)
Fig. 5-28: Streak recordings as a function of the steepness of voltage rise
((5=30 xiO4 S/m; T=-12° C; pol.=pos.; d=7 mm; r=6 mm; orient.=hor.)
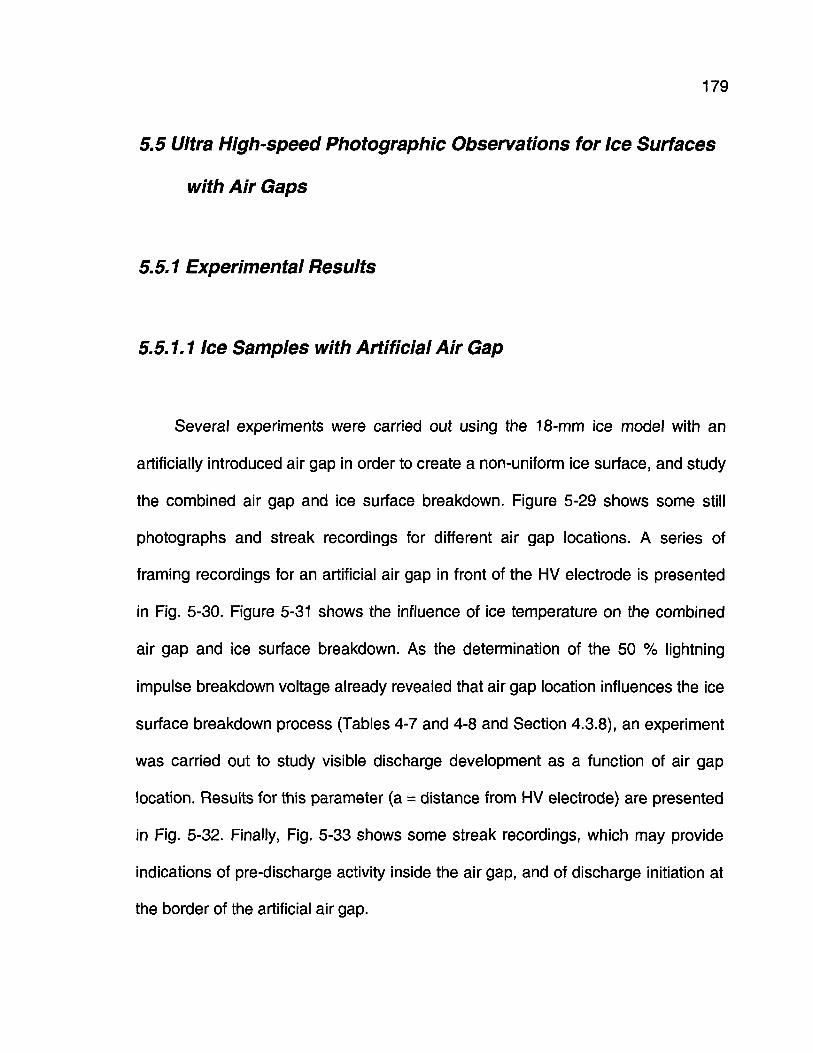
179
5.5 Ultra High-speed Photographie Observations for Ice Surfaces
with Air Gaps
5.5.1 Experimental Results
5.5.1.1 Ice Samples with Artificial Air Gap
Several experiments were carried out using the 18-mm ice model with an
artificially introduced air gap in order to create a non-uniform ice surface, and study
the combined air gap and ice surface breakdown. Figure 5-29 shows some still
photographs and streak recordings for different air gap locations. A series of
framing recordings for an artificial air gap in front of the HV electrode is presented
in Fig. 5-30. Figure 5-31 shows the influence of ice temperature on the combined
air gap and ice surface breakdown. As the determination of the 50 % lightning
impulse breakdown voltage already revealed that air gap location influences the ice
surface breakdown process (Tables 4-7 and 4-8 and Section 4.3.8), an experiment
was carried out to study visible discharge development as a function of air gap
location. Results for this parameter (a = distance from HV electrode) are presented
in Fig. 5-32. Finally, Fig. 5-33 shows some streak recordings, which may provide
indications of pre-discharge activity inside the air gap, and of discharge initiation at
the border of the artificial air gap.
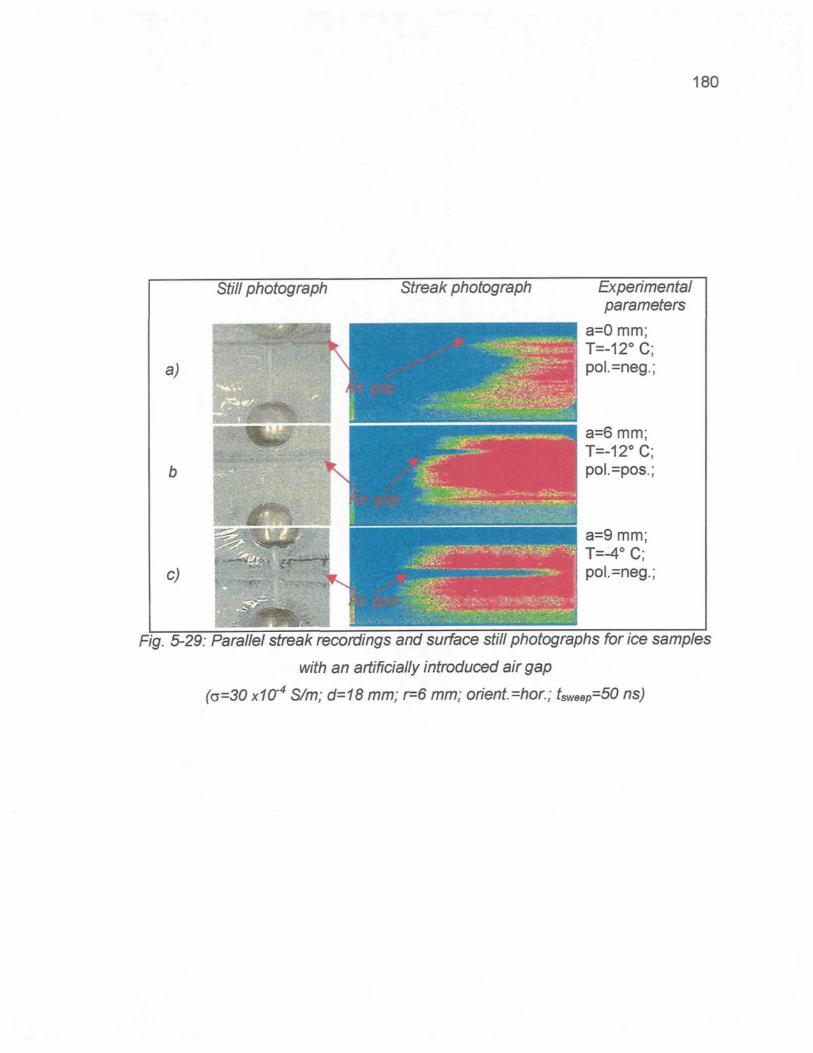
180
Still photograph Streak photograph
c)
Experimentalparameters
a=0 mm;T=-12° C;pol.=neg.;
a=6 mm;T=-12°C;pol.=pos.;
a=9 mm;T=-4° C;pol.=neg.;
Fig. 5-29: Parallel streak recordings and surface still photographs for ice samples
with an artificially introduced air gap
(o=30 x1CT4 S/m; d=18 mm; r=6 mm; orient=hor; tSWBBp=50 ns)
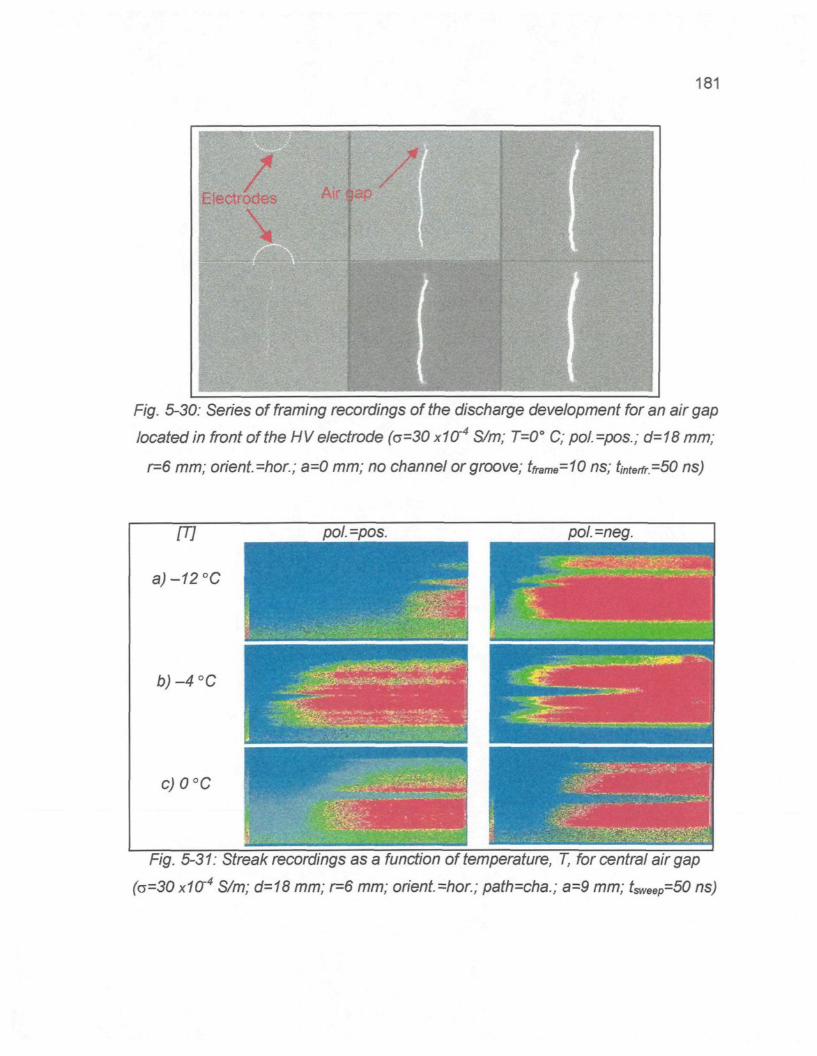
181
Fig. 5-30: Series of framing recordings of the discharge development for an air gap
located in front of the HV electrode (o=30 x1CT4 S/m; T=0" C; pol.=po$.; d=18 mm;
r=6 mm; orient.-hor.; a=0 mm; no channel or groove; tftsme=10 ns; tinterfr.=50 ns)
m
a)-12°C
b)-4°C
c) 0°C
pol.=pos. pol.-neg.
Fig. 5-31: Streak recordings as a function of temperature, T, for central air gap
(G=30X10~4 S/m; d=18 mm; r=6 mm; orient.=hor.; path=cha.; a=9 mm; fsweep=50 ns)
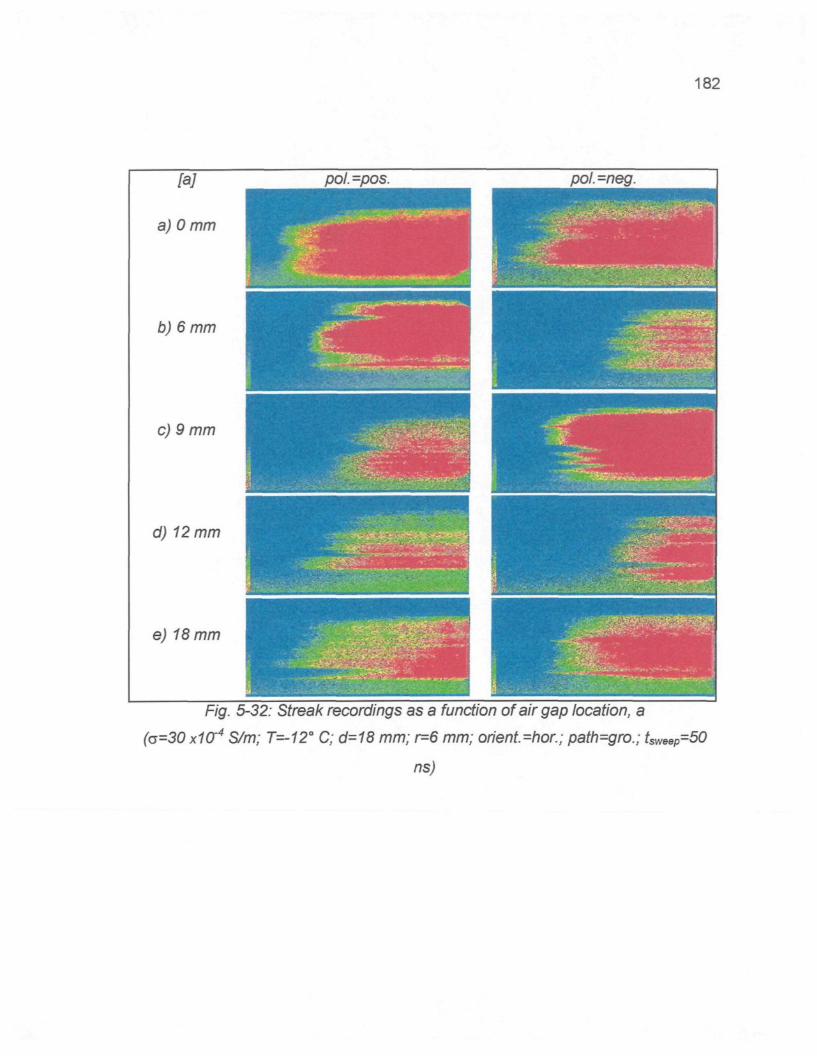
182
Fig, 5-32: Streak recordings as a function of air gap location, a
(v=30 X10'4 S/m; T=-12° C; d=18 mm; r=6 mm; orient.=hor.; path=gro.;
ns)
183
Streak recordings
a) wammgwÉmKÊtmmmm
HGtWÊÊÊk
HT'
Experimental parameters\ T=-12°C;
pol.=neg.;| path=gro.;
a=6 mm;| W200 ns
T=-0° C;pol.=pos.;path=cha.;a=9 mm;tsweep=200 ns
T=-12° C;pol.=pos.;path=cha.;a=9 mm;tsweep=200 ns
T=-4° C;pol.=pos.;path=cha.;a=9 mm;tsweep=50 ns
Fig. 5-33: Streak recordings for ice models with artificial air gap showing visible
pre-discharge phenomena (a=30 x104 S/m; d=18 mm; r=6 mm; orient. =hor.)
5.5.1.2 Ice Samples with Natural Air Gaps
Figure 5-34 presents the results of the investigations with the streak camera
for different cooling rates; Fig. 5-35 shows the streak recordings for different ice
accumulation processes. Still photographs of the ice surfaces were already
presented in Section 4.2.2, to analyse ice surface morphology.
184
Cooling rate
a) slow
b) normal
c) fast
Streak photograph�
ï � � � �
Fig, 5-34: Streak recordings as a function of cooling rate (G=30 X10~4 S/m; T=-12C
C; pol.=pos.; d=18 mm; r=6 mm; orient.=hor; path=gro.; fsweep=50 ns)
Iceaccumulation
processa) Normal
freezing with
electric field
b)
Atmospheric
icing
Streak photograph
�. . . _ � T _ z _ d - . ) ^ ~ � . .. . : .. L : : "�^nfl
Fig. 5-35: Streak recordings as a function the ice accumulation process
(c=30x10~4 S/m; T=-12" C; pol.=neg.; d-18 mm; r=6 mm; orient=hor.; path=gro.;
185
5.5.2 Discussion and Analysis
The streak recordings (Fig. 5-29) as well as the series of framing recordings
(Fig. 5-30) show that the discharge propagates very fast along the ice surface,
whereas breakdown inside the artificial air gap occurs somewhat later. Two
different time values can be derived for the combined air gap and ice surface
breakdown:
� Time to breakdown inside the air gap alone;
� Overall time to breakdown, tbreakdown.
5.5.2.1 Effect of Ice Temperature
The streak photographs reveal that the time to breakdown for combined air
gap and ice surface breakdown is dependent on ice temperature. The two possible
time to breakdown values are presented in Fig. 5-36 as a function of the ice
temperature (derived from Fig. 5-31). An interesting difference can be observed in
comparison to the results for ice surfaces without artificial air gap. Figure 5-37
compares the times to breakdown for ice surfaces without artificial air gap and for
an ice model with a centrally located air gap.
186
It was shown in Section 5.4.2.3 that the time to breakdown for the latter case
decreases for an increase in ice temperature from T=-12° C to T=0° C (Fig. 5-10
and Fig 5-12). In the presence of a centrally located air gap and temperature
increasing towards the melting point, the time to breakdown inside the air gap
increases. Thus, the overall time to breakdown increases. This observation may be
related to the fact that more energy is consumed by the partial discharge process
along the ice surface for increased ice temperature due to increased ice surface
conductivity. Therefore, it takes more time to establish favourable breakdown
conditions inside the air gap for increased ice temperature, leading to an increase
in overall time to breakdown.
40-,
m
oCO
CO
SU) U
Ni 25 "g 20-
<D 1 0 "
F 5-0 -
� Total time to breakdown� Breakdown time in air-gap
11
Hi JB IB^� i i 1" � i � � i � i
-12 -4 0
T(°C)
a) pol.=pos.
40 -]
f 35 �r 30-�8 2 5 -
$ 2 0 -
Tim
e to
br
en
o en
0 -
«Total time to breakdown� Breakdown time in air-gap
i 1S m m
-12 -4 0T(X)
b) pol.=neg.
Fig. 5-36: Time to breakdown values as a function of ice temperature, T, fora
centrally located air gap (a=30x10* S/m; T=-12° C;
d= 18 mm; r=6 mm; orient.=hor.)
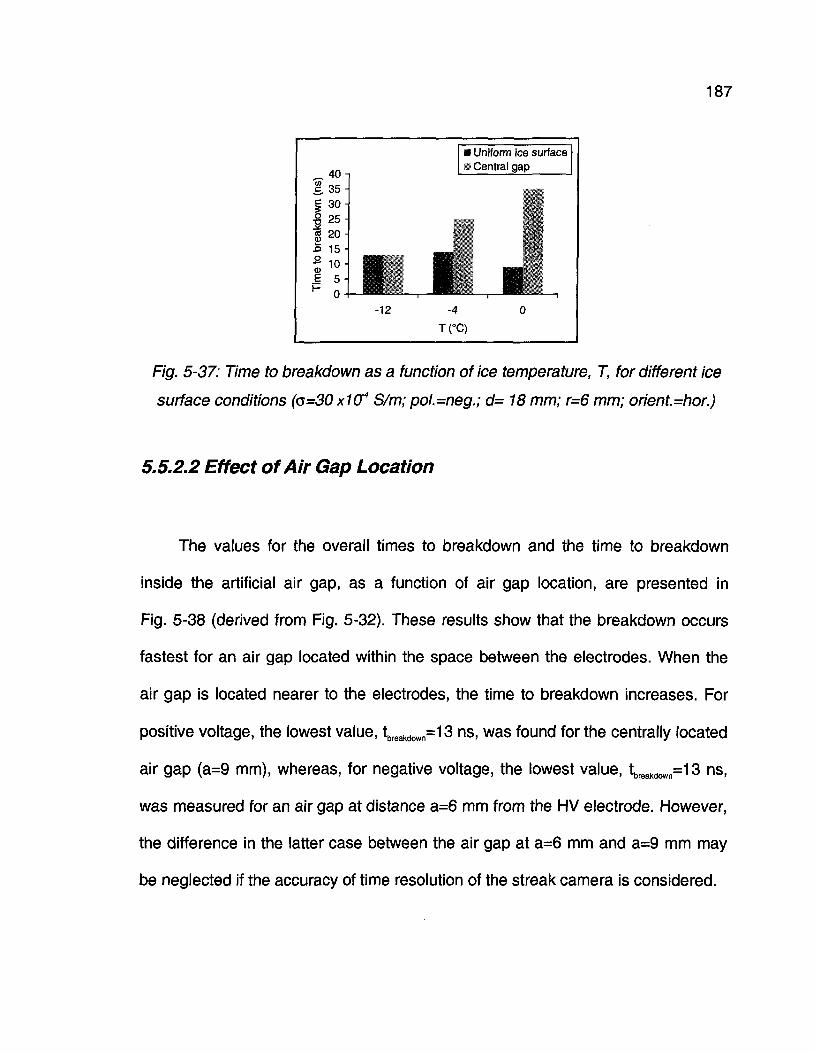
187
su)
c
�g
s£3
eto
fcp
40-i
35-30 -25-20 -15-10-
5 �
0 --12
� Uniform ice surface� Central gap
-4T(°C)
Fig. 5-37: Time to breakdown as a function of ice temperature, T, for different ice
surface conditions (G=30X1CT4 S/m; pol.=neg.; d= 18 mm; r=6 mm; orient.=hor.)
5.5.2.2 Effect of Air Gap Location
The values for the overall times to breakdown and the time to breakdown
inside the artificial air gap, as a function of air gap location, are presented in
Fig. 5-38 (derived from Fig. 5-32). These results show that the breakdown occurs
fastest for an air gap located within the space between the electrodes. When the
air gap is located nearer to the electrodes, the time to breakdown increases. For
positive voltage, the lowest value, tbreakdown=13 ns, was found for the centrally located
air gap (a=9 mm), whereas, for negative voltage, the lowest value, tbreakdown=13 ns,
was measured for an air gap at distance a=6 mm from the HV electrode. However,
the difference in the latter case between the air gap at a=6 mm and a=9 mm may
be neglected if the accuracy of time resolution of the streak camera is considered.
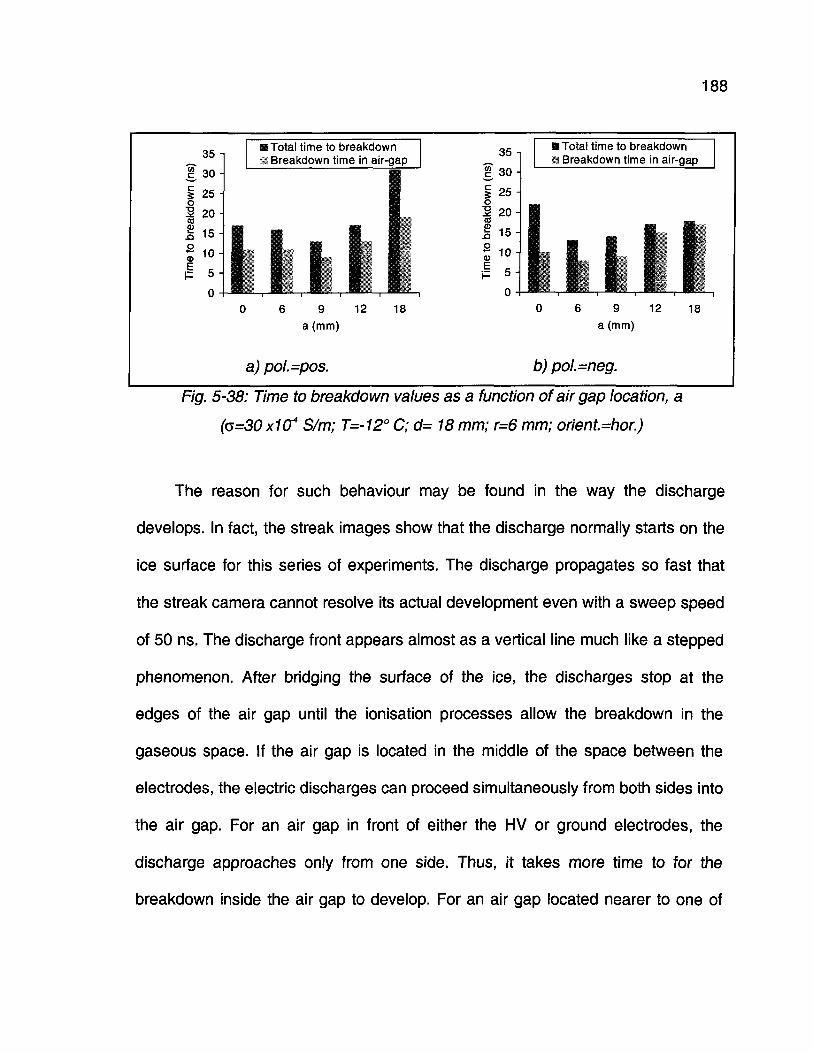
35 i
? 30I 25I 2 0
J16
� Total time to breakdownm Breakdown time in air-gap
6 9 12a (mm)
18
a) pol.=pos.
188
H Total time to breakdownm Breakdown time in air-gap
6 9 12a (mm)
18
b) pol.=neg.
Fig. 5-38: Time to breakdown values as a function of air gap location, a
(<5=30 xKJ4 S/m; T=-12° C; d= 18 mm; r=6 mm; orienl=hor.)
The reason for such behaviour may be found in the way the discharge
develops. In fact, the streak images show that the discharge normally starts on the
ice surface for this series of experiments. The discharge propagates so fast that
the streak camera cannot resolve its actual development even with a sweep speed
of 50 ns. The discharge front appears almost as a vertical line much like a stepped
phenomenon. After bridging the surface of the ice, the discharges stop at the
edges of the air gap until the ionisation processes allow the breakdown in the
gaseous space. If the air gap is located in the middle of the space between the
electrodes, the electric discharges can proceed simultaneously from both sides into
the air gap. For an air gap in front of either the HV or ground electrodes, the
discharge approaches only from one side. Thus, it takes more time to for the
breakdown inside the air gap to develop. For an air gap located nearer to one of
189
the electrodes (Fig. 5-32b and d), the time to breakdown is intermediate for the
extreme cases (Fig. 5-32a, c and e).
It is very interesting to observe that for positive voltage polarity, Fig. 5-38a
presents almost the mirrored image of Fig. 5-38b, for negative polarity. In the case
of positive voltage, longest time to breakdown, tbrealatom=31 ns, was found for an air
gap in front of the grounded electrode (Fig. 5-38a, a=18 mm). On the other hand,
for negative voltage, the longest time to breakdown, tbreakdown=22 ns, was measured
for an air gap in front of the negative HV electrode (Fig. 5-38b, a=0 mm). A
previous investigation [13] on the effects of an air gap in front of either the HV or
ground electrodes showed that there exists a quite strong effect of air gap location
on the flashover voltage of an ice-covered cylinder. Although the physical models
and the type of high voltage were different in that study compared to the present
investigation, those results suggest a possible explanation for the phenomena
observed: It was found that the voltage drop is lower along the air gap if it is
located in front of the ground electrode. The results of the present study show a
similar behaviour despite symmetrical electrode configuration. As the surrounding
climate chamber is connected to ground potential, the electric field distribution is
slightly non-symmetrical (see also Section 4.3.4). For positive voltage applied to
the HV electrode, longer time to breakdown is observed for an air gap in front of
the ground electrode (Fig. 5-38a), which may be explained by the findings of the
cited study [13], showing a lower voltage drop along an air gap in front of the
190
ground electrode, as opposed to the HV electrode. When negative voltage was
applied, the grounded electrode became positively charged. As may be expected,
observations revealed a shorter time to breakdown for an air gap in front of the
positive electrode, rather than in front of the negative HV electrode, which explains
the mirrored appearance of the two graphs for both voltage polarities.
5.5.2.3 Discharge Initiation for ice Surfaces with Artificial Air Gap
The behaviour of the discharge observed in the case of a combined air gap
and ice surface breakdown may seem surprising at first. The experiments with an
artificially introduced air gap were carried out with the idea that the discharge
would be initiated at the location of non-uniformity, and bridge first the air gap
before progressing along the ice surface. Under consideration of the fact that the
air gap covers almost 10 % of the space between the electrodes (as already
discussed in Section 4.3.8), the results can be explained. Therefore, the applied
voltage may not be high enough to create immediate breakdown inside the gap
before any discharge development occurs on the surface. It seems that first visible
ionisation processes start at the border of the air gap for the geometric
configuration used. From there, the discharge grows towards the electrodes due to
the favourable conditions on the ice surface, which leads to very fast discharge
development along the surface. Once discharge activity has bridged the ice
surface, it stops at the borders of the air gap. At the same time, ionisation
191
processes take place inside the air gap, but they proceed more slowly than the
discharge development along the ice surface. After a certain period, the breakdown
conditions are fulfilled inside the small void and total breakdown of the distance
between the electrodes can take place.
Several streak recordings (Figure 5-33) can help to strengthen this theory of
discharge initiation at the borders of the air gap, first development along the ice
surfaces, and final breakdown inside the air gap. The photographs in Figs. 5-33a
and 5-33b show first light emissions at the border of the artificial air gap. The
discharge development from these locations towards the metallic electrodes can
be clearly observed in Figs. 5-33c and 5-33d. The whole light emission
phenomenon has the form of a tip of a left-wing oriented arrow with a crack in the
middle (at the location of the void).
5.5.2.4 Effect of Cooling Rate
The still photographs of the ice samples formed with different cooling rates
(see Section 4.2.2) show that the number and size of the voids vary depending on
the cooling rate (Section 4.3.9). The streak photographs for these cases show
some interesting details in the discharge front, which seem to be related to the ice
structure. For normal and fast cooling rates (cooling period of six hours and one
hour, respectively), the streak recordings show a slightly rugged front of the
192
discharge (Fig. 5-34b and Fig. 5-34c). Fewer, but larger virtual gaps are present in
the streak recording (Fig. 5-34a) in the case of slow cooling (cooling period of
30 hours).
These results can be explained with the findings of the experiment with an
artificially introduced air gap (Section 5.5.2.1), where it was shown that a non-
uniformity of larger size delays discharge development. The appearance of virtual
gaps in the discharge front of the streak recordings seems to be dependent on the
concentration, distribution, and dimension of the natural air gaps on the ice
surface. If the number of voids is low, but they are relatively large (the case of slow
cooling rate), the streak recording of the discharge exhibits a rough front with
several significant virtual gaps. With an increase in the number of voids under a
faster cooling rate, the number of virtual gaps in the light phenomenon increases.
As the gaps in the ice surface become smaller, the front of the discharge gets
smoother. This behaviour is also demonstrated by the derivation of the time to
breakdown values from the streak images in Fig. 5-34. It can be seen in Fig. 5-39
that the time to breakdown becomes shorter for an accelerated cooling rate.
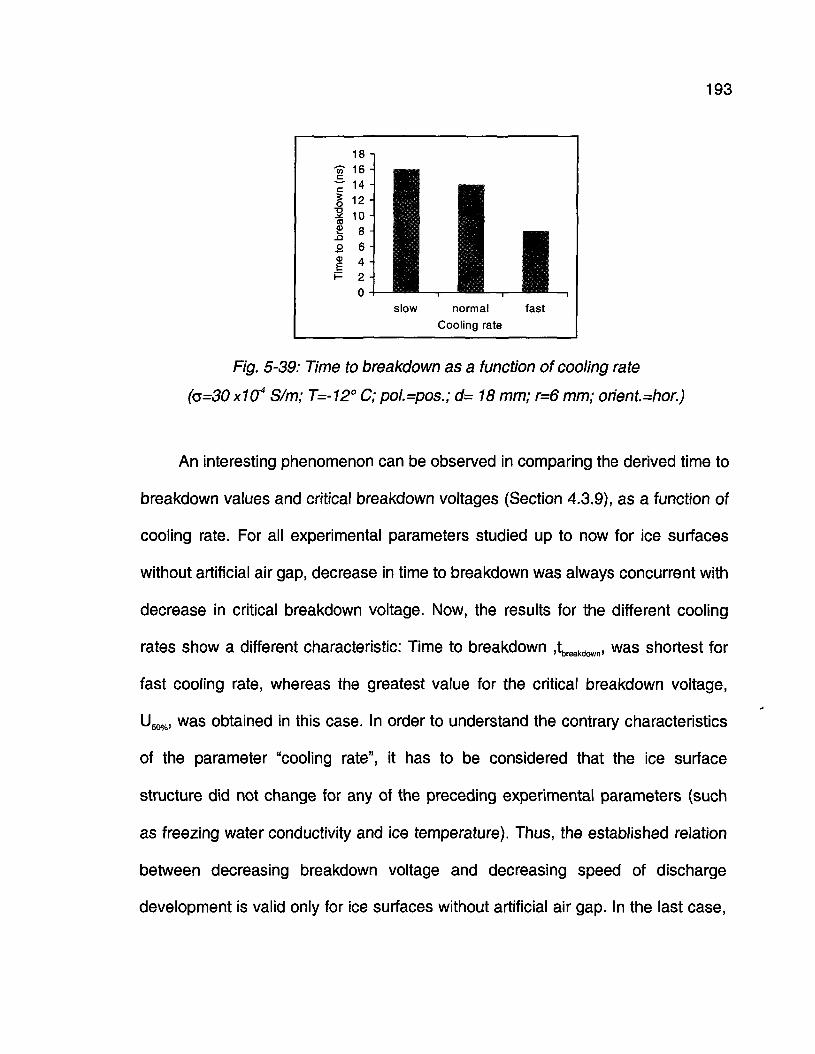
193
Incc
I
akd
SSm
F
18 -16 -14 -12 -10 �
8 -6 �
4 -2 -0 -
� �1 1� 1 H� 1 1� I I� � �� � , f , » ,slow normal fast
Cooling rate
Fig. 5-39: Time to breakdown as a function of cooling rate
(G=30X104 S/m; T=-12° C; pol.=pos.; d= 18 mm; r=6 mm; orient.=hor.)
An interesting phenomenon can be observed in comparing the derived time to
breakdown values and critical breakdown voltages (Section 4.3.9), as a function of
cooling rate. For all experimental parameters studied up to now for ice surfaces
without artificial air gap, decrease in time to breakdown was always concurrent with
decrease in critical breakdown voltage. Now, the results for the different cooling
rates show a different characteristic: Time to breakdown ,tbreakdown, was shortest for
fast cooling rate, whereas the greatest value for the critical breakdown voltage,
U50%, was obtained in this case. In order to understand the contrary characteristics
of the parameter "cooling rate", it has to be considered that the ice surface
structure did not change for any of the preceding experimental parameters (such
as freezing water conductivity and ice temperature). Thus, the established relation
between decreasing breakdown voltage and decreasing speed of discharge
development is valid only for ice surfaces without artificial air gap. In the last case,
194
ice morphology was altered by changing the cooling rate, which can explain that an
accelerated discharge development does not cause a decrease in critical
breakdown voltage at the same time.
5.5.2.5 Effect of Electric Field during Cooling
It was already mentioned in the analysis of the critical breakdown voltages
that the still photograph of the ice sample formed with an electric field applied
during cooling period at a normal cooling rate (Fig. 4-2a) shows a comparable
appearance as that of an ice sample formed at a fast cooling rate (Fig. 4-1 c)
(Section 4.3.10). The discharge development recorded with the streak camera
coincides with the observations of the surface photographs for the two cases: Both
times, a fast development of the light emission and a smooth discharge front was
found. This observation indicates that the growing discharge could bridge the small
irregularities almost immediately, and the overall breakdown was not delayed.
It can be concluded from previous research that the electric field does not
seem to have any significant influence on the crystalline microstructure of the ice
[9], whereas an influence on the morphology can be noticed [30] [59], which in turn
alters the ice surface uniformity. Considering these findings, it can be concluded
that the acceleration of the discharge development observed in the present study,
with an electric field applied during the cooling period, is caused by the alteration of
195
the ice surface uniformity. However, it is impossible to come to any final
conclusion, as no measurements were made on the effect of polarisation or
accumulation of charges on the surface or in the bulk of the ice. Any further
unambiguous interpretation will need more data on surface charge accumulation
on the ice surface as a function of the electric field during ice formation. Therefore,
it is recommended to carry out some experiments on this aspect in the future.
5.5.2.6 Effect of Type of Ice Accumulation Process
In the case of atmospheric ice accretion, the surface still photograph
(Fig. 4-2b) clearly shows that the ice is not as semi-transparent as that obtained
with the normal freezing method. This appearance is caused by the porous
structure of atmospheric ice accretion and a rough ice surface due to successive
impinging of supercooled water droplets that froze immediately upon impact.
Furthermore, it can be seen that the electrodes are totally covered with an ice layer
due to the accumulation process. The streak photograph (Fig. 5-35b) shows a very
rugged front of discharge phenomenon, which can be related to the rough and
porous structure of the ice surface. Light emissions appear at several locations
somewhere on the ice surface, between the electrodes, at the beginning of the
visual discharge development. These light spots grow over a short period until they
join the neighbouring discharge activity.
196
Besides this effect of "virtual gaps" in the discharge front, the behaviour of the
discharge development does not seem to be very different from all preceding
experiments with ice formed by normal freezing method. Therefore, it can be
concluded that all experimental results of the present study, obtained with ordinary
frozen ice, are also valid to deduce general conclusions on initiation and
development of ice surface discharges. However, as atmospheric ice formation is
the type of ice found on actual insulators, it may be recommended that further
studies with larger models also include this type of ice in the experimental
parameters, to provide conditions as close as possible to real conditions.
5.6 Conclusions of Chapter 5
From the results of the presented experiments on the visible discharge
development along ice surface using ultra high-speed photography, several
conclusions can be made:
1) The experimental methodology of streak photography is an adequate
technique for the observation and analysis of very fast discharge initiation and
propagation processes in small intervals along ice surfaces, under various
experimental conditions. Several verification recordings provided data that
allow to assume that the preparations of the ice model, which are necessary
197
to keep the discharge on a straight path, do not influence the general
characteristics of ice surface discharges.
2) Increasing freezing water conductivity (in the range from a=2.5 x10"4 S/m to
G=160 x10"4 S/m) leads to faster discharge development along the ice surface,
as more dissolved faults migrate to the surface increasing the ice surface
conductivity: tbreakdovm(c=2.5 x10'4 S/m)=23 ns decreases to
tbreakdown(a=160 xiCT4 S/m)=11 ns for the 7-mm model and positive voltage
polarity. Thus, ionisation processes in the air next to the ice surface may be
enhanced, and streamer propagation along the solid-gas interface may be
accelerated. In extreme cases, the discharge appears immediately over the
whole space between the electrodes.
3) An increase in ice temperature, from the value T=- -12° C to T=0° C, also
causes a significant acceleration of the discharge development:
UKdown(T=-12° C)=23 ns decreases to tbreakdown(T=0° C)=10 ns for the 7-mm
model and positive voltage polarity. As the temperature increases towards the
melting point, a phase transition from solid to liquid enables faster discharge
propagation due to the higher mobility of the ionic charges in the water film on
the ice surface.
198
4) Several observations indicate that local distortion of the electric field leads to
discharge initiation on the ice surface in the space between the electrodes.
The study carried out within the framework of this thesis did not allow to
distinguish if this field distortion is created by space charge accumulation on
the surface or by charge injection from the electrodes. With no quantitative
data available, the present study proposes that charge deposit on the ice
surface under conditions of low temperature and low conductivity seems to
exist, as already shown for various other dielectric solid materials. These
surface charge accumulations distort the electric field. Visible discharge
activity may start at any location on the ice between the electrodes, where the
local electric field exceeds the critical value for discharge initiation. However,
from the experimental data obtained, it seems more probable that visible
discharge processes start nearer to the positive HV electrode, in the
presence of an ice surface in the space between the electrodes.
5) Two different patterns of visible discharge development could be observed for
the two electrode distances chosen (d=7 mm and d=18 mm). Therefore, it is
assumed that due to the lack of pre-discharge activity, no charge
accumulation prior to breakdown can take place on the ice surface for very
short distances. Visible discharges start at the tip of the electrodes. Both
processes progress into the space between the electrodes and meet
somewhere in the middle. The transition from one development pattern to the
199
other is thought to happen for a distance between the two chosen distance
values.
6) An air gap in the ice surface presents a non-uniformity leading to a field
enhancement and to the initiation of partial discharge activity at its borders. If
the voids are microscopic, they may be bridged immediately by the discharge;
therefore, they will have no influence on the discharge development. On the
other hand, larger gaps (in the present case g=1.6 mm) may cause an
increase in time to breakdown, as they interrupt a continuous, fast discharge
development along the surface. Due to the rapid discharge development
along the ice surface, which proceeds faster than the ionisation of the air in
the gap, visible light emissions appear first along the ice surface. Later, the
air gap gets ionised as well, and combined air gap and ice surface breakdown
occurs. The time to breakdown inside the air gap is increased for ice
temperatures near the melting point: tbreakdown(T=-12° C)=11 ns increases to
tbreakdown(T=0° C)=28 ns for the 18-mm model and positive voltage polarity.
CHAPTER 6
STUDY OF THE VOLTAGE AND CURRENT
WAVEFORMS
201
CHAPTER 6
STUDY OF THE VOLTAGE AND CURRENT
WAVEFORMS
6.1 Introduction to Chapter 6
The preceding studies on critical breakdown voltages (Chapter 4) and visible
discharge development (Chapter 5) revealed numerous aspects of discharge
initiation and development on ice surfaces. Nevertheless, these experiments
turned out to be insufficient to prove the existence of pre-discharge activity before
the occurrence of visible ionisation processes leading to final breakdown. It may be
assumed that the first discharges are very weak, so they might not necessarily be
visible to the streak camera. Therefore, waveform measurements of current and
voltage were carried out to obtain more data on possible early pre-discharge
activity. The distance between the electrodes was fixed at d=18 mm, and the
electrode axis was always kept in horizontal orientation for these measurements.
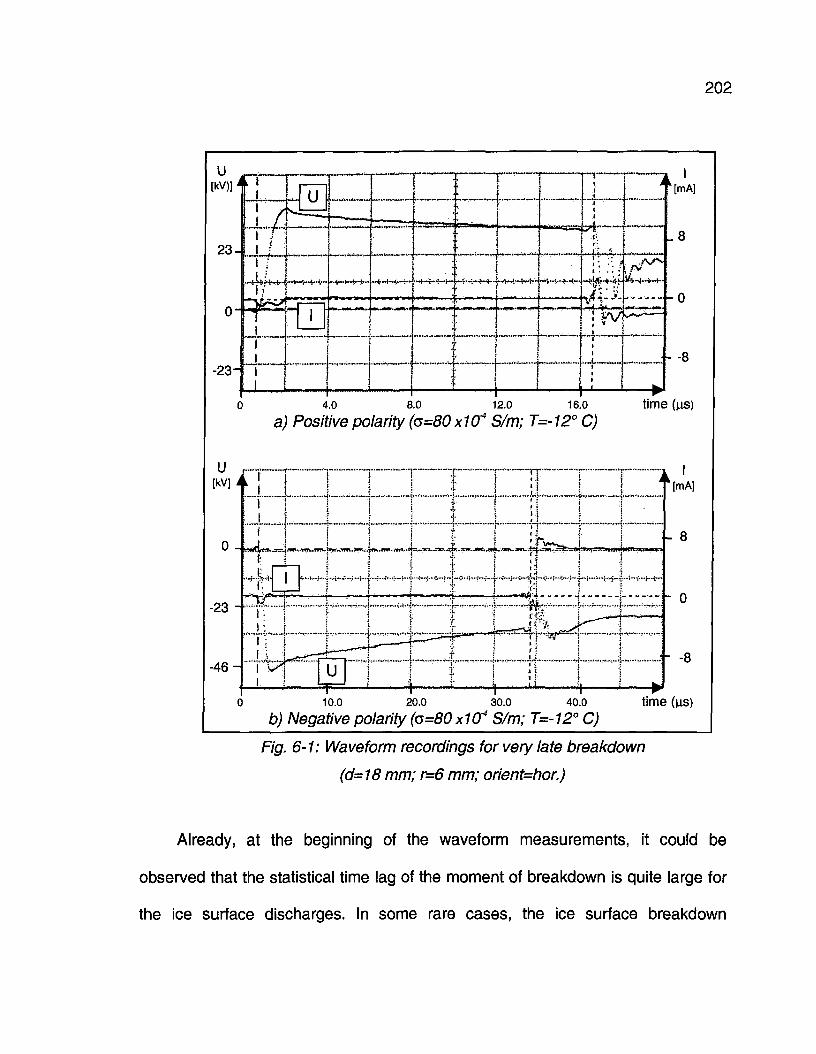
202
U[KV)]
23-
-23"
[mA]
o 4.o 8.0 12.0 16.0 time (us)
a) Positive polarity (a=80 x1O4 S/m; T=-12° C)
- 4 6 -
- o
" � -8
0 10.0 20.0 30.0 40.0
b) Negative polarity (o=80 x1O4 S/m; T=-12° C)time (us)
Fig. 6-1: Waveform recordings for very late breakdown
(d=18 mm; r=6 mm; orient=hor.)
Already, at the beginning of the waveform measurements, it could be
observed that the statistical time lag of the moment of breakdown is quite large for
the ice surface discharges. In some rare cases, the ice surface breakdown
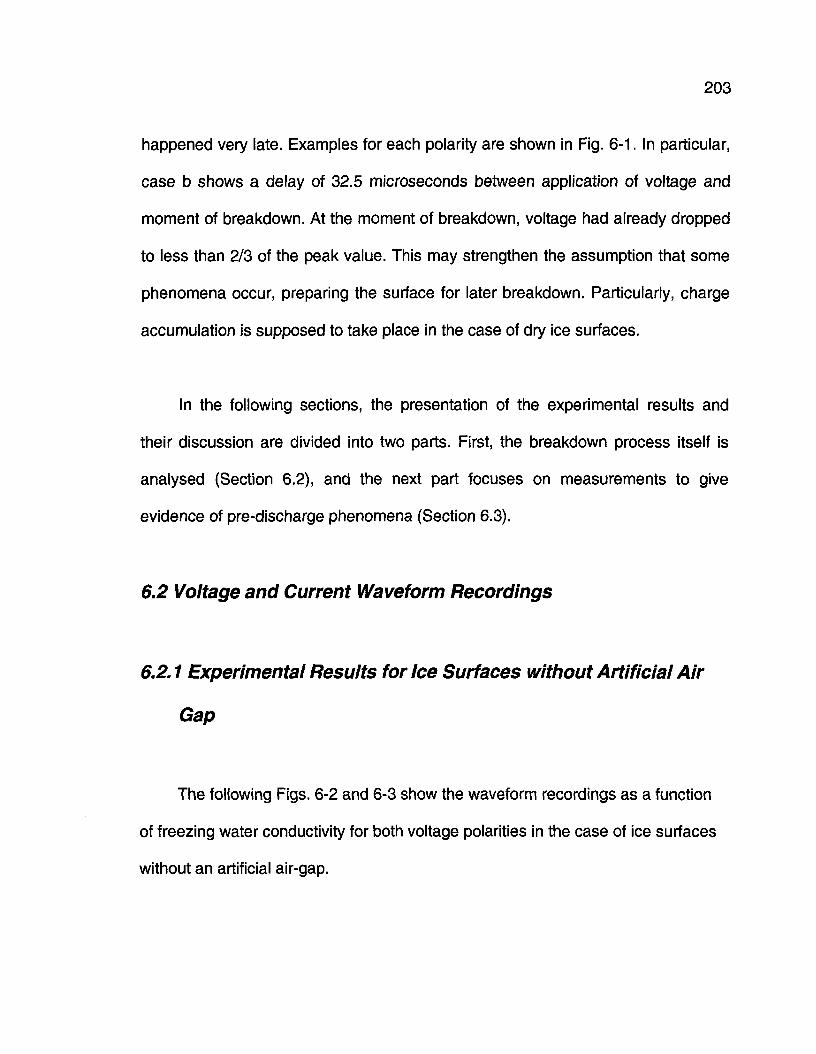
203
happened very late. Examples for each polarity are shown in Fig. 6-1. In particular,
case b shows a delay of 32.5 microseconds between application of voltage and
moment of breakdown. At the moment of breakdown, voltage had already dropped
to less than 2/3 of the peak value. This may strengthen the assumption that some
phenomena occur, preparing the surface for later breakdown. Particularly, charge
accumulation is supposed to take place in the case of dry ice surfaces.
In the following sections, the presentation of the experimental results and
their discussion are divided into two parts. First, the breakdown process itself is
analysed (Section 6.2), and the next part focuses on measurements to give
evidence of pre-discharge phenomena (Section 6.3).
6.2 Voltage and Current Waveform Recordings
6.2.1 Experimental Results for Ice Surfaces without Artificial Air
Gap
The following Figs. 6-2 and 6-3 show the waveform recordings as a function
of freezing water conductivity for both voltage polarities in the case of ice surfaces
without an artificial air-gap.
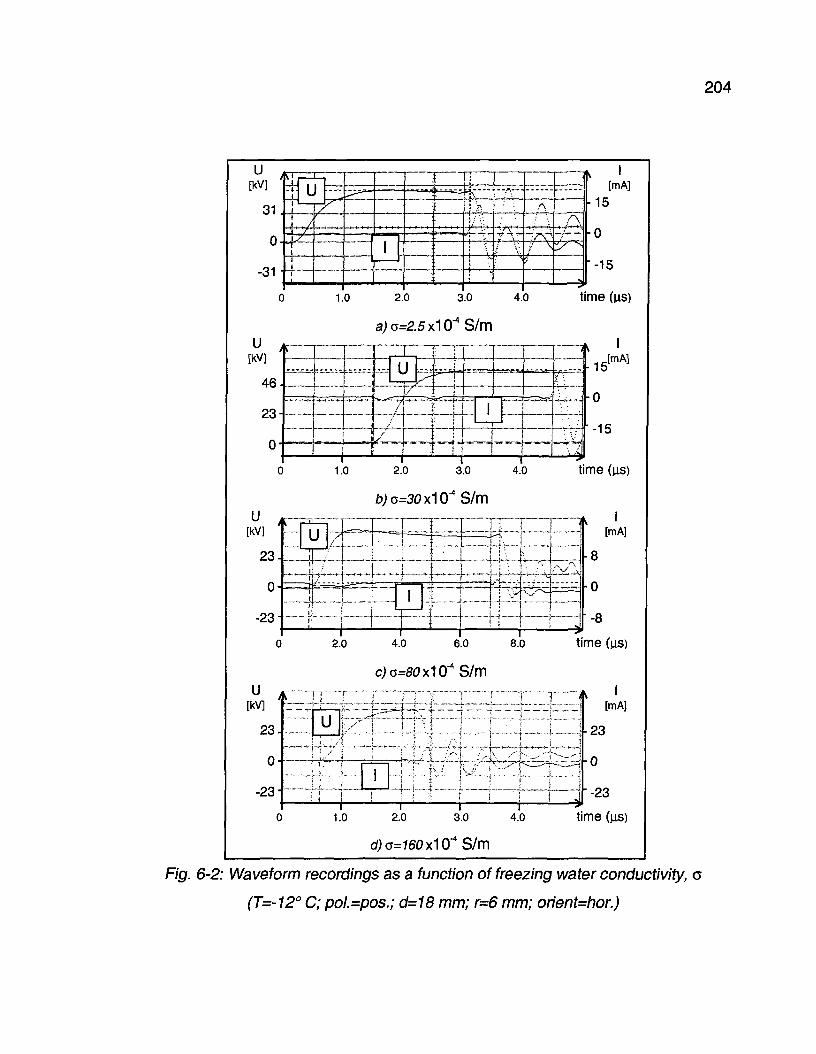
204
u y
31
0-
31"
0
-
� i �
U
/
t �
i1.
�_
0
I
2 0 3
-
tL-i->-
\
' =
0
' � / \ r . ' "
; \ -
��:.
f, , �
4.
A
/
[)
A
ti
[mA]
15
0
�-15
a;c=2.5x10~4S/m
u[kV]
46
23
0
- f - -� f �
*~ !
T 1.u v.
s*\ / ' � ' �
� '
��;�
: ;
V.
"T
" ;'"J
r "
1' f
1
y \
: v
time (us)
� 1 5 [ m A ]
�0
-15
U[kV]
23.
0-
-23
U
1.0 2.0 3.0 4.0
b) G=30 x10"4S/m
time (us)
= = #
l �H - 1
f ï
[mA]
�8
0
� - 8
2.0 4.0 6.0 8.0
S/m
time (us)
u[kV]
23-
0-
-23
u
I
I[mA]
23
0
� - 2 3
1.0 2.0
d) G=I60 x10'4 S/m
3.0 4.0
'4
4time (us)
F/g. 6-2: Waveform recordings as a function of freezing water conductivity, a
(T=-12° C; pol.=pos.; d=18 mm; r=6 mm; orient=hor.)
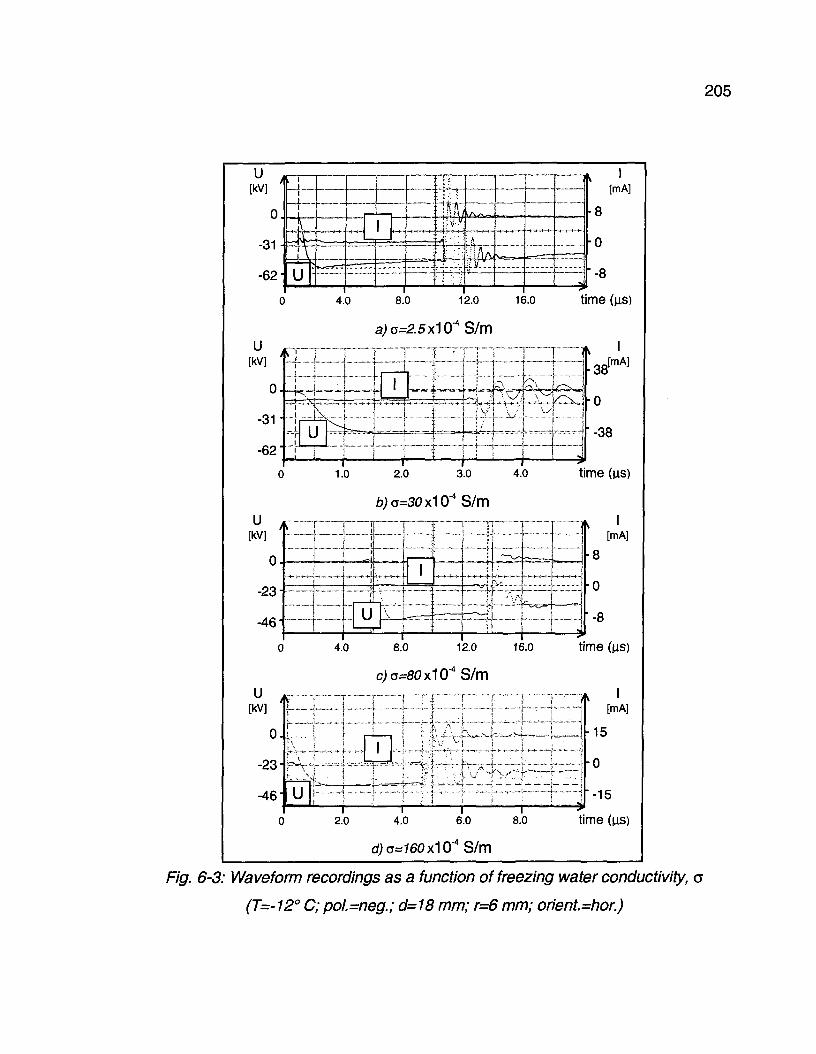
205
U[kV]J
0.
o i �
62-
iii
~l�
Jp l __
�
: ;!: !; � ;
- n i � ' ; ;
--j-~r�:
1
*
[mA]
8
0
� - 8
4.0 8.0 12.0 16.0
a)a=2.5x10'4S/Vf)U
[kV]
-31"
-62"
T 1 1��-:- 1 �� !"
-j j - : j� � " . � � - . �
It1
| ! 1 i ! iI; j i l-> l s \ I
{.. ; i \ -. . . !�j�,�i�!- . . . - ,_ - ,� i�,-._,�*�«�t-.^-..,..^�J...^�,
U- i
-
time (us)
I
� 3 8 [ m A ]
� 0
-38
i3.0
U[kV]
0
-23
-46"
1.0 2.0 3.0 4.0
b)o=30 x10"4S/m�|--
. _ ] . . . _ _ _ !;
~ r U
4.0
time (us)
I[mA]
12.0 16.0 time (us)
U[kV]
0.
-23
-46"
o
�i
uI
2.0
I[mA]
15
�0
-15
4.0 6.0 8.0 time (us)
Fig. 6-3: Waveform recordings as a function of freezing water conductivity, a
(T=-12° C; po!.=neg.; d=18 mm; r=6 mm; orient=hor.)
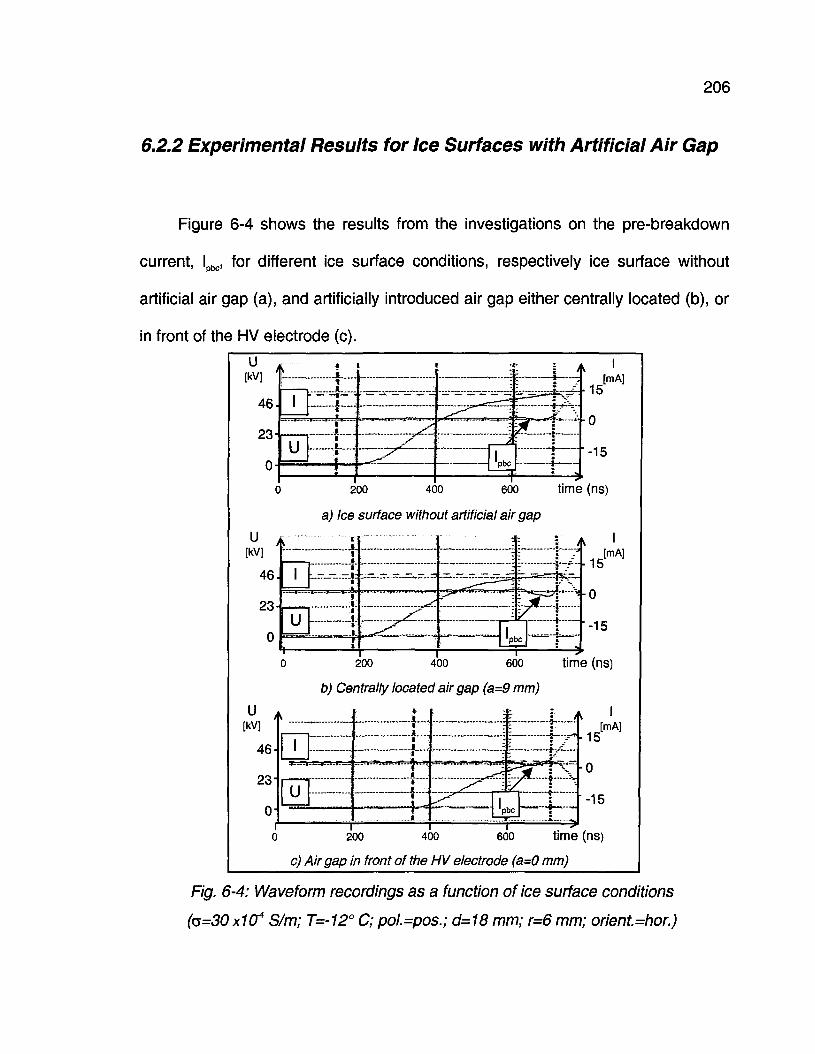
206
6.2.2 Experimental Results for Ice Surfaces with Artificial Air Gap
Figure 6-4 shows the results from the investigations on the pre-breakdown
current, lpbc, for different ice surface conditions, respectively ice surface without
artificial air gap (a), and artificially introduced air gap either centrally located (b), or
in front of the HV electrode (c).
200 400 600 time (ns)
a) Ice surface without artificial air gap
U[kV]
46.
23-
u
U[kV]
46
23"
200 400 600 time (ns)
b) Centrally located air gap (a=9 mm)
I[mA]
u -15
200 400 600 time (ns)
c) Air gap in front of the HV electrode (a=0 mm)
Fig. 6-4: Waveform recordings as a function of ice surface conditions
(<5=30 xMJ4 S/m; T=-12° C; pol.=pos.; d=18 mm; r=6 mm; orient.=hor.)
207
6.2.3 Discussion and Analysis
The waveform measurements for ice surfaces without artificial air gap (Figs.
6-2 and 6-3) do not show any significant influence of freezing water conductivity or
voltage polarity on the general shape of the current. The peak values of the voltage
curves decreases with increasing conductivity, which was already shown in the
experiments on the determination of the critical breakdown voltages (Chapter 4).
The current signal showed strong oscillations after the occurrence of
breakdown, which are attributed to the magnitude and nature of parasitic
impedances in the HV circuit (Section 3.5.5). This may obstruct the determination
of the exact peak value of the breakdown current. Nevertheless, it may be seen
that the current oscillations vary around comparable values in most cases. Thus, it
can be concluded that ice surface conductivity decreases with increasing freezing
water conductivity, due to the fact that the current at the moment of breakdown
stays roughly stable, whereas the voltage peak value decreases. This result
matches with measurements on the surface conductivity of ice [11] [24] [34] and
confirms the assumption that critical leakage currents leading to breakdown may
be reached at lower voltage levels for increasing surface conductivity (Section
4.3.2), thus decreasing the critical breakdown voltage.
208
Changes of the "pre-breakdown current", 1^, could be detected as a function
of the ice surface uniformity. The waveform recordings for the three cases
(Fig. 6-4) show that the current impulse lasts somewhat longer when there is an air
gap on the ice surface (Fig. 6-4b and Fig.6-4c). The photographic ultra high-speed
observations (Figs. 5-29 to 5-33) have already revealed a longer time to
breakdown for ice samples with an air gap (Section 5.5), which is in good
agreement with the detection of extended pre-breakdown currents for ice surfaces
of substantial non-uniformity. Furthermore, the results give indications that the rise
in pre-breakdown current is less steep in the presence of an air gap. The
waveforms recorded do not have enough resolution to determine the exact values
in order to prove this assumption, but the attenuated onset of the discharge current
may be attributed to the initiation of the first visible discharges along the ice
surfaces adjacent to the void, whereas the space inside the gap still remains free
of visible discharges (Section 5.5.2.3).
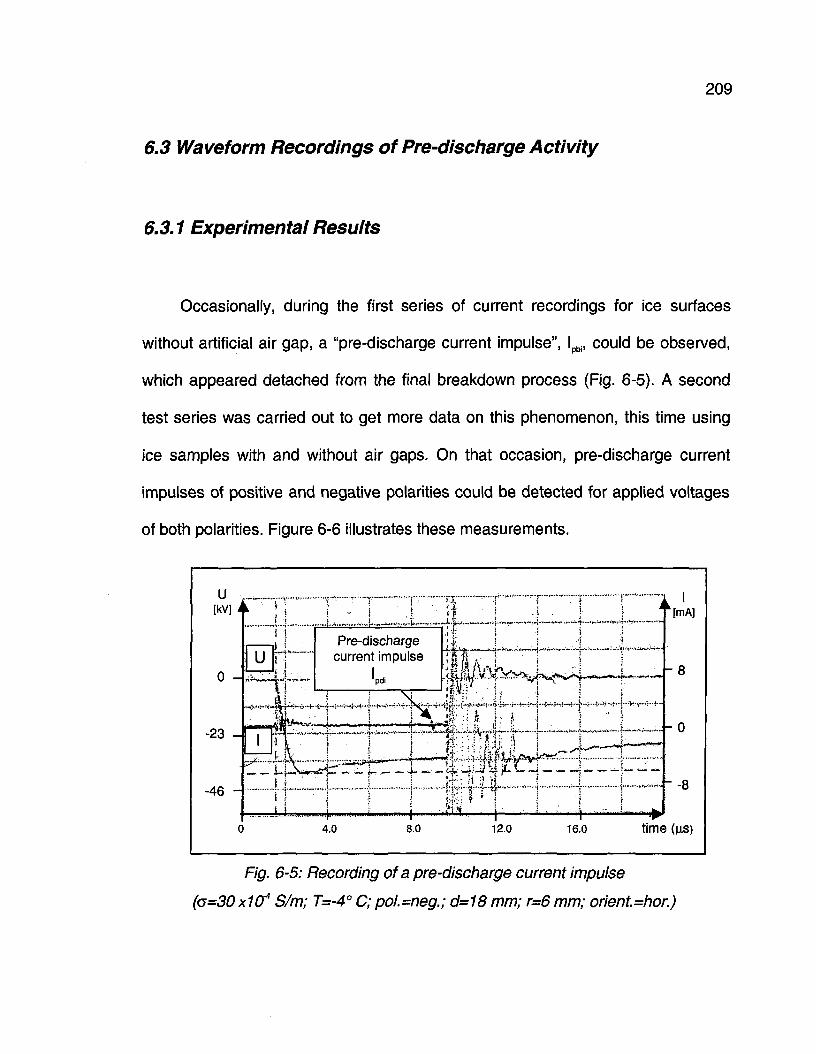
209
6.3 Waveform Recordings of Pre-discharge Activity
6.3.1 Expérimentai Results
Occasionally, during the first series of current recordings for ice surfaces
without artificial air gap, a "pre-discharge current impulse", lpbi, could be observed,
which appeared detached from the final breakdown process (Fig. 6-5). A second
test series was carried out to get more data on this phenomenon, this time using
ice samples with and without air gaps. On that occasion, pre-discharge current
impulses of positive and negative polarities could be detected for applied voltages
of both polarities. Figure 6-6 illustrates these measurements.
-23 -
-46 -
Pre-dischargecurrent impulse
I
" -8
12.0 16.0 time (us)
Fig. 6-5: Recording of a pre-discharge current impulse
(0=30x10* S/m; T=-4° C; pol.=neg.; d=18 mm; r=6 mm; orient. =hor.)
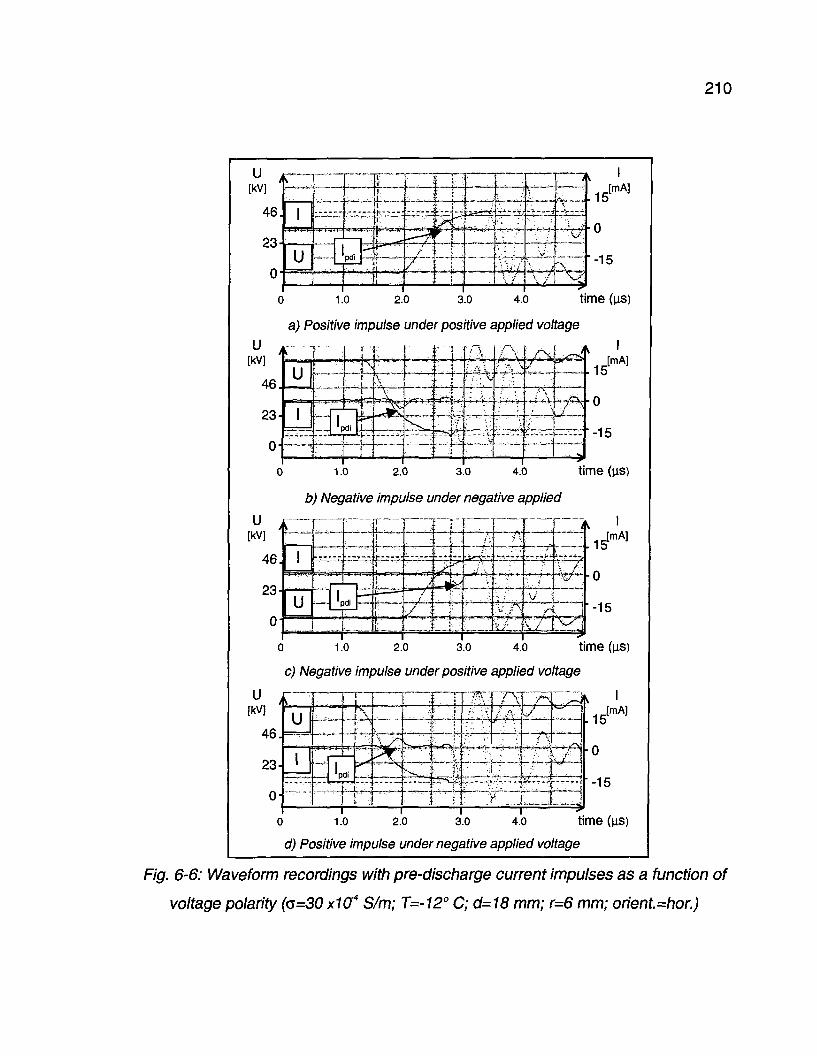
210
xs
U[kV]
o 1.0 2.0 3.0 4.0 time (us)
a) Positive impulse under positive applied voltage
ImA]
46
23-
o-
U
-15
1.0 4.0 time (us)
b) Negative impulse under negative applied
o 1 .o 2.o 3.0 4.o time (us)
c) Negative impulse under positive applied voltage
JmA]
o 1.0 2.0 3.0 4.o time (us)
d) Positive impulse under negative applied voltage
Fig. 6-6: Waveform recordings with pre-discharge current impulses as a function of
voltage polarity (c=30 x1Cf S/m; T=-12° C; d=18 mm; r=6 mm; orient=hor.)
211
6.3.2 Discussion and Analysis
These "pre-discharge current impulses" are attributed to partial discharge
activity, which do not directly lead to breakdown, as the voltage waveform does not
show any significant voltage decrease at the moment when the current impulse
appears. Thus, these measurements of current impulses can be interpreted as
being a conclusive confirmation of the existence of pre-discharge activity on the ice
surface, preceding the final breakdown process. On some occasions, these
impulses were detected relatively late, when the voltage value was already
decreasing (for example Fig. 6-5). It does not seem logical that a charging process
happens at this moment, but on the assumption that electric charges are
accumulated on the ice surface during voltage rise (which may not be visible in the
current recording due to the displacement current, lddc, see Section 3.5.5), this
impulse could indicate partial discharge activity leading to a neutralisation of the
accumulated charges without initiating immediate breakdown.
Table 6-1 shows the number of detected current impulses as a function of ice
surface conditions for different polarities of applied voltage and pre-discharge
current. With the exception that no negative current impulses could be observed for
test models with an air gap under positive voltage, all possible combinations of
applied voltage polarity with current impulse polarity were observed for all three
surface conditions, but they did not appear with the same frequency.
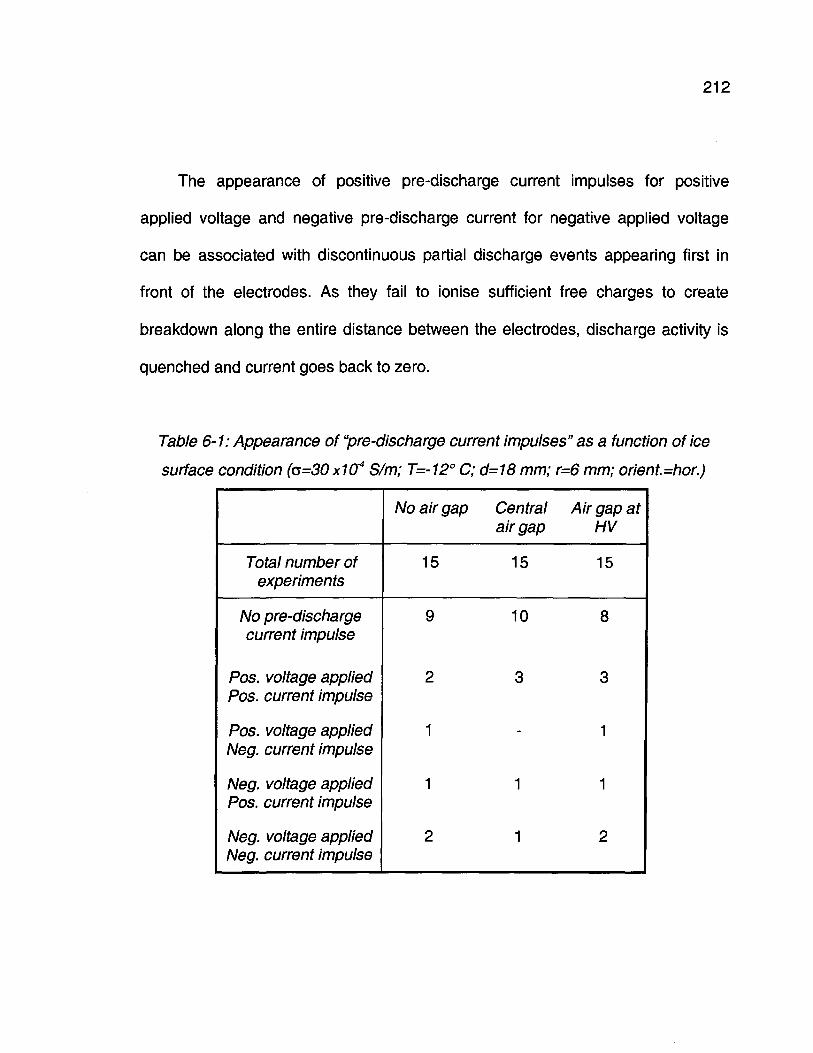
212
The appearance of positive pre-discharge current impulses for positive
applied voltage and negative pre-discharge current for negative applied voltage
can be associated with discontinuous partial discharge events appearing first in
front of the electrodes. As they fail to ionise sufficient free charges to create
breakdown along the entire distance between the electrodes, discharge activity is
quenched and current goes back to zero.
Table 6-1 : Appearance of "pre-discharge current impulses" as a function of ice
surface condition (0=30x10* S/m; T=-12° C; d=18 mm; r=6 mm; orient.=hor.)
Total number ofexperiments
No pre-dischargecurrent impulse
Pos. voltage appliedPos. current impulse
Pos. voltage appliedNeg. current impulse
Neg. voltage appliedPos. current impulse
Neg. voltage appliedNeg. current impulse
No air gap
15
9
2
1
1
2
Centralair gap
15
10
3
-
1
1
Air gap atHV
15
8
3
1
1
2
213
Current impulses of opposite polarity than the applied voltage were first
attributed to charge accumulation at the borders of the air gap, leading to partial
discharges between one electrode and the edge of the air gap. This explanation
would only be valid for ice surfaces with artificial air gap, whereas the pre-
discharge current impulses were also observed for ice surfaces without an artificial
air gap (Fig. 6-5).
Another hypothesis is proposed attributing these partial discharge activities to
charge accumulation on dry ice surfaces, which was already indicated by several
other observations (Sections 4.3.10, 5.4.2.5, and 5.5.2.5). Such surface charge
accumulations were also found on various synthetic materials [14] [85] [103] [117].
Previous studies revealed that charges can be accumulated in the ice and on its
surface [48] [78] [104]. Locally limited areas along the dry ice surface between the
two electrodes may accumulate charges of a certain polarity, while charges of
opposite polarity are trapped at another location. If sufficient charges are
accumulated, a discharge process may take place only between the two locations,
or one of these locations and an electrode, without creating total breakdown. An
example for such a process, called "back-discharge" was reported between a rod
electrode and space charge deposit on an acrylic plate [101].
Even if the ice surface seems relatively uniform to the human eye, it may
show a certain roughness on a microscopic level, due to the fact that the
214
uppermost layer of water molecules has no neighbouring water molecules above
them, thus they tend to interact with other molecules in the atmosphere [74] [112].
Also, the surface layer contains a significant number of enclosed impurities due to
the particular freezing process of ice, where pollution particles in the water will be
ejected to the surface during the freezing process [11] [99]. These impurities may
present propitious locations for charge accumulations. In order to gain reliable data
on this subject, more experiments will be necessary. A promising methodology
would be surface charge measurements, which was already proposed as a tool to
explain discharge development on non-uniform ice surfaces (Sections 4.3.10,
5.4.2.5, and 5.5.2.5).
Another proposal for future investigations concerns the measuring circuit. As
the focus in the present project was directed towards photographic observation of
the visible discharge phenomena, the elaboration of the experimental set-up for the
waveform measurements was limited. In particular, no measure was applied to
suppress the dielectric displacement current that appears during voltage
application. As this current impulse may cover weak pre-discharge processes in
the early stages of the discharge process, it would be necessary to introduce a
differential circuit to suppress the dielectric displacement current, in order to obtain
measurements of the precise discharge current values. Previous investigations in
the field of gaseous discharges may give examples on how to construct this circuit
[46] [117]. The connection of the current shunt to the oscilloscope caused some
215
reflections. Therefore, it is proposed to change the value of the current shunt to
50 Q or to use an optical link between shunt and measuring apparatuses. The
second measure would also help to avoid any electromagnetic interference from
the HV-generator to the measuring circuit.
6.4 Conclusions of Chapter 6
Several voltage and current waveform recordings were carried out to study
both the breakdown process and pre-discharge activity prior to breakdown. The
experimental set-up was found to be unsuitable for quantitative current
measurements. The current measuring system may obscure the earlier current
pulses due to the larger magnitude of the displacement current. Nevertheless, it
helped to provide evidences for two questions that remained open after the
preceding experiments:
1) An increase in ice surface conductivity (due to increased freezing water
conductivity or increased ice temperature near the melting point leading to the
appearance of a water film on the ice surface) leads to critical current values
at lower voltages. Therefore, a correlation between increase in ice surface
conductivity and decrease in critical breakdown voltage can be identified.
216
2) The detection of current impulses, detached from later breakdown processes,
gives evidence of non-visible (with the means of the used ultra high-speed
camera systems) pre-discharges before the occurrence of breakdown. This
pre-breakdown activity is supposed to alter and prepare the surface. As
experiments on various insulating surfaces proved the existence of surface
charge accumulation, it may be assumed that these processes also take
place on dry ice surfaces (under low temperature and low conductivity
conditions). Clusters of surface charges change the electric field distribution
locally and may enhance the ionisation processes in the gaseous space next
to the ice-air interface, which can explain discharge onset at lower voltages
and faster discharge propagation respectively.

CHAPTER 7
GENERAL CONCLUSIONS AND
RECOMMENDATIONS FOR FUTURE WORK
218
CHAPTER 7
GENERAL CONCLUSIONS AND
RECOMMENDATIONS FOR FUTURE WORK
7.1 General Conclusions
In the framework of the present Ph.D. Thesis, the first nanoseconds of visible
discharge initiation and development on ice surfaces were studied, using various
experimental methodologies, in particular a streak camera to study visible
discharge processes. To the best knowledge of the author, this is the first
application of ultra high-speed streak photography to observe the first
nanoseconds of the electrical discharge development on ice surfaces. It was found
that this technique is an adequate method for such an application. It was also
shown that the method of ice sample preparation has no effect on discharge
initiation and development. The effects of various experimental parameters on the
discharge process on ice surfaces were determined. The parameters investigated
can be classified as follows: Environmental parameters (freezing water
219
conductivity, ice temperature, ice surface uniformity, cooling rate, ice accumulation
process), electrical parameters (voltage polarity, voltage waveform, electric field
during cooling period), and geometrical parameters (electrode distance, electrode
curvature radius, electrode axis orientation). Furthermore, data on time to
breakdown and discharge propagation velocity along the ice surface is provided.
The results can be concluded as follows:
1) General nature of discharge process
The presence of an ice surface has a clearly deteriorating effect on withstand
performance, similar to the effect of other dielectric surfaces - it leads to a
significant decrease in critical breakdown voltage, combined with an increase in
discharge propagation velocity, compared to an air gap with similar dimensions.
However, under normal atmospheric conditions, the breakdown process on an ice
surface exhibits important changes, depending on ice surface conditions:
a) On a clean ice surface (c<2.5 x10'4 S/m) at cold temperatures (T<-12° C), the
discharge is in some aspects similar to an air gap discharge, i.e. discharge
initiation appears in front of the electrodes and then the visible discharges
develop gradually along the ice surface. However, the critical breakdown
voltage is lower (decrease of about 40 % for the 7-mm model), and the
velocity of discharge development is greater (decrease of time to breakdown
of about 50 %) than in the case of an air gap.
220
b) For polluted ice (a>160 x10'4 S/m), or for temperatures near or at the melting
point, the processes of discharge initiation and development are comparable
to those observed previously on solid insulating surfaces: Visible discharge
activity can start anywhere on the surface. It bridges very rapidly the whole
electrode distance, so that no distinct discharge development can be
identified even by the means of ultra high-speed photography in the range of
nanoseconds. Critical breakdown voltage is significantly lower in this case,
(decrease of about 40 % in comparison with the case of dry, clean ice surface
conditions).
2) Freezing water conductivity
Increasing freezing water conductivity leads to a gradual increase in the
velocity of discharge development (decrease of time to breakdown from
tbreakdown(°=2-5 x-IO"4 S/m)=14 ns to tbreakdown (a=160 x104 S/m)=5 ns for 18-mm model),
combined with a simultaneous decrease in critical breakdown voltage
(U50%(G=2.5 X10 4 S/m)=43.7 kV decreases to U50%(c=160 x10'4 S/m)=25.8 kV for 18-
mm model), for ice surfaces without artificial air gap. The reason for these two
phenomena is the gradual increase in ice surface conductivity with increasing
freezing water conductivity due to the fact that impurities diffuse to the liquid
surface layer during the freezing process. With increasing ice surface conductivity,
a critical leakage current value leading to ice surface breakdown is reached at
lower voltage levels. The effect tends to saturate for higher values of freezing water
221
conductivity. As the surface layer of the ice has a quasi-liquid characteristic, even
for temperatures far below the melting point, the behaviour is also observed for dry
ice surface conditions at low temperatures.
3) Ice temperature
Increasing ice temperatures, from below freezing towards the melting point,
have a comparable effect to that of increasing freezing water conductivity: In the
case of a weakly polluted ice surface (o=30 x10'4 S/m) without artificial air gap,
decreasing critical breakdown voltage (U50%(T=-12° C)=41.9 kV decreases to
U50%(T=0° C)=24.3 kV for 18-mm model) is concurrent with increasing velocity of
discharge development (tbreakdown(T="12° C)=13 ns decreases to
tbreakdown(T=0° C)=9 ns for 18-mm model). However, the effect is not gradual, but
appears abruptly for a certain temperature value located between Tice=-12° C and
Tice=-4° C. This behaviour is caused by the formation of a water film on the ice
surface, leading in turn to a significant increase in ice surface conductivity. A
combination of increased ice temperature and increased freezing water
conductivity increases the deteriorating effect on the critical breakdown voltage.
4) Uniformity of Ice Surface
The present study shows that the introduction of air gaps in the ice cover may
not automatically lead to an increase in withstand performance of the whole
electrode configuration. Very small air gaps may act as initiators of partial
222
discharge activity, due to the discontinuity of the electric permittivity constants. The
size of voids seems to be a decisive factor: They may act as discharge initiators
decreasing the breakdown voltage, or improve the withstand performance.
5) Discharge Propagation Velocity
The velocity of discharge propagation is affected by ice surface conductivity
(latter influenced by the environmental parameters such as freezing water
conductivity and ice temperature), as well as the ice surface uniformity. Different
characteristics can be identified:
a) In the case of ice surfaces without artificial air gap, the discharge propagation
velocity is directly correlated with ice surface conductivity: Increased ice
surface conductivity leads to an increased speed of discharge development.
As the discharge develops faster it leads to a lower critical breakdown
voltage.
b) In the case of ice surfaces with air gaps, the discharge propagation velocity
depends strongly on the ice morphology, in particular on the number and size
of air gaps at the ice surface. The discharge activity can bridge microscopic
gaps immediately, whereas it develops first along the ice surface before
leading to breakdown inside larger gaps. Thus, a void of sufficient size (in the
present case g=1.6 mm) delays the discharge development, but this delaying
effect is not directly correlated with an increase in critical breakdown voltage.
223
6) Surface charging
It may be assumed that a dry ice surface (at low temperature and low
conductivity conditions) accumulates surface charges as previously observed on
various other solid insulating materials, as the process of discharge development in
the presence of an ice surface between the electrodes changes clearly in
comparison with an air gap alone. The accelerated discharge developments, as
well as waveform recordings of current impulses prior to breakdown, provide some
evidence of such phenomena. However, no published information was found to
substantiate surface charge accumulation on ice at any temperature or surface
conductivity.
7) Influence of distance
Two distinct patterns of discharge development are observed as a function of
electrode distance: In the case of very short electrode distance, d=7 mm, the
visible discharge first appears in front of the electrodes. On the other hand,
discharge may be initiated at any location along the ice surface for an electrode
distance of d=18 mm. The differing observations for very short electrode distances
are attributed to the lack of non-visible pre-breakdown phenomena leading to
surface charge accumulation on dry ice surfaces. The minimal distance value for
appearance of pre-breakdown activities on the ice surface is situated between the
two chosen values of electrode distance, d=7 mm and d=18 mm.
224
As a first step towards the establishment of a theory on initiation and
development of electrical discharges on ice surfaces, it is proposed to distinguish
different regimes for the process of ice surface breakdown:
Two different regimes depending on the ice surface condition:
A) Dry ice surface (Tice=-12° C)
B) Wet ice surface (ice surface covered with a water film
for -4° C< Ti� <0° C)
Two different sub-regimes in the case of dry ice surface depending on the
electrode distance:
A.1) Very short distances (experimental value d=7 mm)
A.2) Short distances (experimental value d=18 mm)
A change in freezing water conductivity does not seem to alter the regime of
discharge process, but the critical breakdown voltage is gradually reduced as
conductivity increases. Investigations on the determination of the critical
breakdown voltage were carried out only for electrode distance d=18 mm, thus,
equations are given for the two regimes "A.2" and "B".
The regimes can be characterised as follows:
A. 1 Discharge initiation for very short distances on dry ice surface
Visible discharge activity starts in front of the electrodes and grows
continuously along the surface into the space between the electrodes. It is
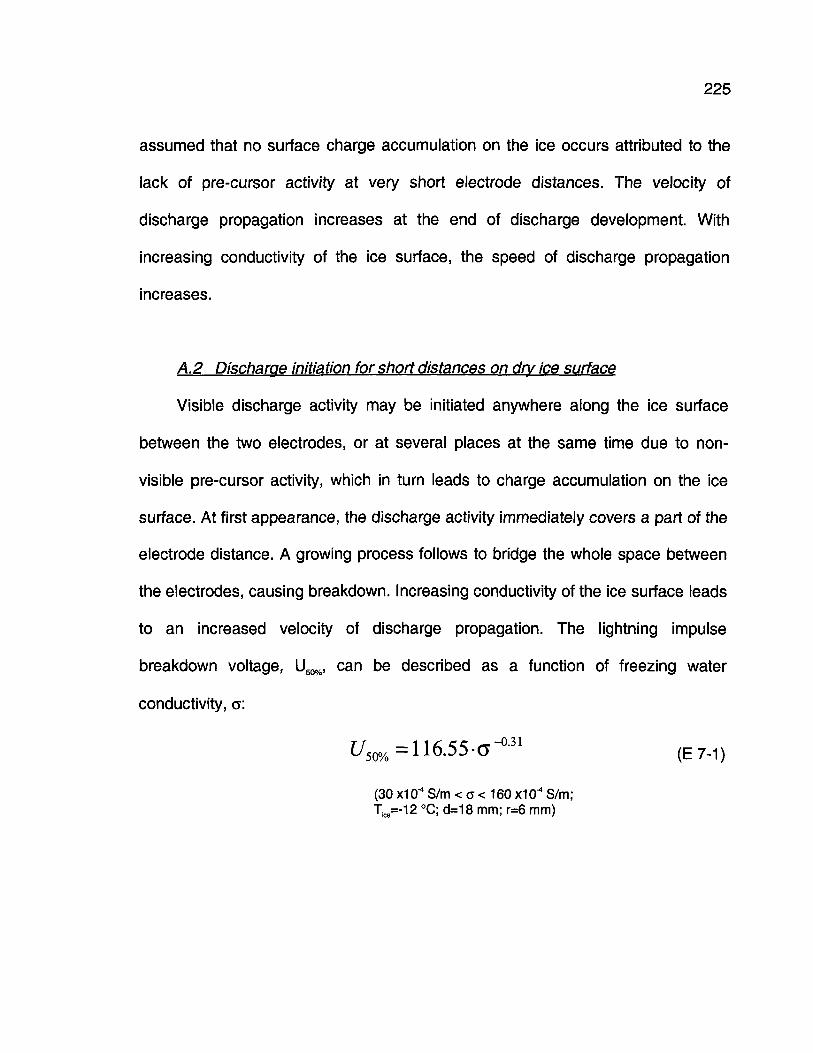
225
assumed that no surface charge accumulation on the ice occurs attributed to the
lack of pre-cursor activity at very short electrode distances. The velocity of
discharge propagation increases at the end of discharge development. With
increasing conductivity of the ice surface, the speed of discharge propagation
increases.
A.2 Discharge initiation for short distances on dry ice surface
Visible discharge activity may be initiated anywhere along the ice surface
between the two electrodes, or at several places at the same time due to non-
visible pre-cursor activity, which in turn leads to charge accumulation on the ice
surface. At first appearance, the discharge activity immediately covers a part of the
electrode distance. A growing process follows to bridge the whole space between
the electrodes, causing breakdown. Increasing conductivity of the ice surface leads
to an increased velocity of discharge propagation. The lightning impulse
breakdown voltage, U50%, can be described as a function of freezing water
conductivity, c:
t / 1 1 6 5 5 a ^ 3 1 (EM)
(30 X10"4 S/m < a < 160 X10"4 S/m;Ttee=-12 °C; d=18 mm; r=6 mm)
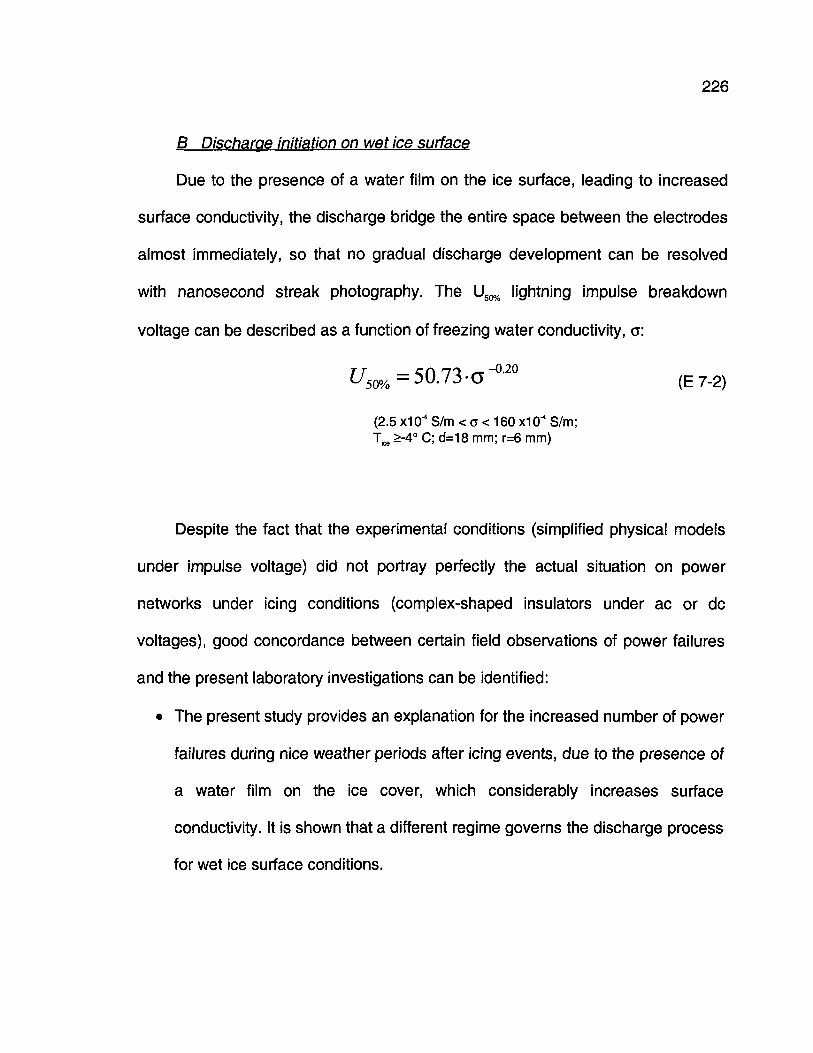
226
B Discharge initiation on wet ice surface
Due to the presence of a water film on the ice surface, leading to increased
surface conductivity, the discharge bridge the entire space between the electrodes
almost immediately, so that no gradual discharge development can be resolved
with nanosecond streak photography. The Uso% lightning impulse breakdown
voltage can be described as a function of freezing water conductivity, a:
(E7-2)
(2.5 x10"4 S/m < a < 160 x10"4 S/m;Tice >-4° C; d=18 mm; r=6 mm)
Despite the fact that the experimental conditions (simplified physical models
under impulse voltage) did not portray perfectly the actual situation on power
networks under icing conditions (complex-shaped insulators under ac or dc
voltages), good concordance between certain field observations of power failures
and the present laboratory investigations can be identified:
� The present study provides an explanation for the increased number of power
failures during nice weather periods after icing events, due to the presence of
a water film on the ice cover, which considerably increases surface
conductivity. It is shown that a different regime governs the discharge process
for wet ice surface conditions.
227
� The present study shows that the particular characteristics of the ice surface
layer and the freezing process of water lead to an increase in surface
conductivity due to increasing pollution content of the freezing water, even for
low temperatures. If partial discharge activity is initiated on power network
equipment, it may quickly lead to local melting, which in turn further increases
the danger of flashover and consequent power outages when significant
pollution levels are present, also for temperatures well below the melting
point.
Furthermore, the present study provides numerical data on critical conditions
of discharge initiation, on time delay between start of pre-discharge activities and
occurrence of breakdown, as well as on velocity of discharge development. This
data may be integrated into software codes in order to develop numerical tools for
flashover prediction and for new insulator design for application to power networks
in cold regions. It is revealed that any model that aims to reproduce the complete
ice surface breakdown process has to consider different regimes for discharge
initiation and development, depending on ice surface conditions.
228
7.2 Recommendations for Future Work
The present investigations can hopefully contribute to further the
understanding of ice surface discharge processes, but several aspects still remain
unexplained as the time frame of a Ph.D. project sets some limits. Four fields are
identified, where further research is expected to reveal more worthwhile data:
1) In the present study, the size of the air gap was identified as an important
parameter (Sections 4.3.8 and 5.5.2). Therefore, it is proposed to investigate
different ratios g/d (air gap length in relation to the electrode distance) in
order to determine the critical air gap length, at which the void would increase
the withstand performance of insulating devices.
2) This study provides some evidence of surface charge accumulation on dry,
low conductive ice surfaces (Sections 4.3.10, 5.4.2.5, 5.5.2.5 and 6.3.2), but
the experimental methods used did not permit to quantify the processes of
surface charging. Therefore, it is proposed to measure surface charge
deposits for the different discharge regimes of dry and wet ice surfaces. The
experiments may analyse the influence of various parameters, i.e. freezing
water conductivity, ice temperature, and ice surface uniformity. Experimental
methods to measure surface charges have already been elaborated in the
229
fields of surface discharges on synthetic insulating surfaces (for example [14]
[52] [117]) and may be adapted to the field of ice surface discharges.
3) The investigations of visible discharge phenomena are powerful tools to
explain the processes of partial discharges. However, in the early stages of
discharge development, phenomena that show only very weak light emission
or no emission in the visible electromagnetic spectrum may exist (Section
6.3.2). Therefore, it is proposed to carry out experiments on pre-discharge
current measurements in order to obtain more precise data on non-visible
discharge modes. Sophisticated measuring instruments will be necessary to
detect the very weak current signals and to resolve the fast running
processes. So as to concentrate on the current signals originating from partial
discharge phenomena, it is proposed to integrate a differential circuit in the
measuring set-up to suppress the dielectric displacement current (Section
6.3.2).
4) Investigations with simplified physical models enable the study of each
individual experimental parameter, but the question remains how the
knowledge obtained may be applied to complex systems, where several
processes may interact and create synergetic effects. Effects by geometric
form and orientation may appear, which could not be studied using simplified
models (Sections 4.3.7 and 5.4.2.7). Therefore, it is proposed to carry out
230
such fundamental experiments on the discharge processes using larger
physical models and small HV insulators covered with atmospheric ice, in
order to verify the results of basic studies under experimental conditions that
closely resemble conditions on actual power network equipment. As a
discharge process cannot be limited to a one-dimensional path for such
complex-shaped test objects, it will be necessary to use framing photographic
technologies with two-dimensional representation of the dynamic processes.
The use of a streak camera may still be recommended for continuous
observations of limited regions on a complex-shaped test object, for example
the air gap next to the HV terminal on an ice-covered insulator. New
numerical framing cameras with faster framing rates and "stand-by" modes
will be available in the near future. Thereby, the trigger signal stops the
continuous recording and images for the time period before the trigger
moment are obtained. These new technologies will be very helpful for the
study of the fast processes along ice surfaces under impulse as well as under
power frequency voltages. The necessary infrastructure to provide realistic
atmospheric icing conditions in a controlled laboratory environment, in
combination with sufficient high voltage power supplies, is already available
at the new icing research pavilion at the University of Quebec in Chicoutimi.
Finally, other experimental tools may be chosen. As the research field of
electric discharge initiation and development along ice surfaces is very young, we
231
still need to advance our knowledge in many aspects. It is conceivable to calculate
the energy of the current pulses during partial discharge activity in order to find out
if local melting of the ice surface occurs. Surface temperature measurements and
the use of infrared cameras may also provide data for this question. Spectral
analysis of the light emitted may yield more information about which molecules
contribute to the ionisation processes and thus may help to clarify the question of
whether the discharge processes take place in the gaseous space in the vicinity of
or directly on the ice surface. Simultaneous measurements of discharge current
and light emission using photomultiplier technology may give more information on
the correlation between discharge current and the intensity of the visible
phenomena, which will help with the interpretation of the ultra high-speed
recordings.
REFERENCES
233
REFERENCES
[1] N.L.ALLEN, P.N.MIKROPOULOS, "Streamer Propagation along InsulatingSurfaces", IEEE Transactions on Dielectrics and Electrical Insulation, Vol.6,No.3, pp.357-362, June 1999.
[2] T.ASOKAN, T.S.SUDARSHAN, "Role of Coulombic Centers on Insulator SurfaceBreakdown Characteristics", IEEE Transactions on Electrical Insulation,Vol.EI-27, No.5, pp.1040-1049, October 1992.
[3] T.ASOKAN, T.S.SUDARSHAN, "Insulator Surface Flashover Conditioning: AStreak Photographie Investigation", IEEE Transactions on Plasma Science,Vol.21, No.3, pp.298-304, June 1993.
[4] R.BADENT, "Hochspannungstechnik l+ll", Course Notes, 1995/96.
[5] R.BADENT, K.KIST, A.J.SCHWAB, "Streamer Inception and Propagation inTransformer Oil at kHz and MHz Frequencies", Proceedings of 9th
International Symposium on High-Voltage Engineering (ISH), Vol.1,pp. 1024.1-1024.4, Graz, Austria, August 1995.
[6] H.W.BANDEL, "Corona from Ice Points", Journal of Applied Physics, Vol.22,pp.984-985, 1951.
[7] A.BEROUAL, M.ZAHN, A.BADENT, K.KIST, A.J.SCHWAB H.YAMASHITA,
K.YAMAZAWA, M.DANIKAS, W.G.CHADBAND, Y.TORSHIN, "Propagation andStructure of Streamers in Liquid Dielectrics", IEEE Electrical InsulationMagazine, Vol.14, No.2, pp.6-17, March/April 1998.
[8] M.BEYER, W.BOECK, K.MOELLER, W.ZAENGL, "Hochspannungstechnik",Springer-Verlag, Berlin, 1986.
[9] J.BOUILLOT, M.FARZANEH, E.C.SVENSSON, R.L.DONABERGER, Y.TEISSEYRE,
"Modifications structurales induites dans la glace déposée sur les lignes
234
électriques à très haute tension par la présence du champ électrique local",Présentation at 67th ACFAS, Ottawa, Canada, Mail 998.
[10] F.D.A.BOYLETT, I.G.MACLEAN, "The propagation of electric discharges acrossthe surface of an electrolyte", Proc. Roy. Soc, 324 A, pp.469-489,1971.
[11] P.G.BUCHAN, "Electrical Conductivity of Insulator Surface Ices", OntarioHydro Internal Report, May 1989.
[12] H.T.Bui, "Contribution a l'étude du mécanisme de développement de ladécharge électrique en arc de contournement sur la surface de la glaceconductrice", Master Thesis, Université du Québec à Chicoutimi, Canada,June 1984.
[13] X.CHEN, M.FARZANEH, J.ZHANG, "Factors Influencing FlashoverCharacteristics along Ice Surfaces", Proceedings of 7th InternationalWorkshop on Atmospheric Icing of Structures, pp.77-81, Chicoutimi, Canada,June 1996.
[14] S.E.CHERUKUPALLI, "Surface Charge Accumulation on Spacers UnderSwitching Impulses in Sulphur Hexafluoride Gas", Ph.D. Thesis, University ofBritish Columbia, Canada, July 1987.
[15] W.A.CHISHOLM, Y.T.TAM, T.O.MELO, I.K.PAVERS, C.C.ERVEN, "60-HZ
Performance of 500-kV Insulators under Light Contamination, Ice, Fog andRising Temperatures: Operating Experience and Field Studies", IEEE PowerEngineering Summer Meeting, pp.1-8,1993.
[16] B.CIESLIK, Hamamatsu, Private Communication, 1999.
[17] J.D.CROSS, "The Electret Effect in Ice", Journal Electrochem. Society,Vol.115, pp.42-45, 1968.
[18] J.D.CROSS, B.MAZUREK, "Fast Cathode Processes in Conditioning of VacuumElectrodes", IEEE Transactions on Electrical Insulation, Vol.23, No.1, pp.87-89, January 1988.
[19] G.DJOGO, "Transient Behaviour of Vacuum Gaps during ElectricalBreakdown", Ph.D. Thesis, University of Waterloo, Canada, 1995.
[20] DRS Hadland, "IMACON 468", Product Brochure.
235
[21] H.ENGELHARDT, N.RIEHL, "Space-charge limited proton currents in ice", Phys.Lett., Vol.14, pp.20-21, 1965.
[22] W.N.ENGLISH, "Corona from a Water Drop", Physical Review, New York,pp.179,1948.
[23] M.FARZANEH, G.BOUCHARD, "A Major Infrastructure for Meeting a World-wideNeed in the Field of Atmospheric Icing Research and Development",Proceedings of 9th International Workshop on Atmospheric Icing of Structures,Chester, United Kingdom, June 2000.
[24] M.FARZANEH, X.CHEN, J.ZHANG, "A Study of Surface Conductivity andFlashover Voltage of Ice Samples Formed Under Various FreezingConditions", International Journal of Offshore and Polar Engineering, Vol.6,No.4, pp.298-303, December 1996.
[25] M.FARZANEH, J.F.DRAPEAU, "AC Flashover Performance of InsulatorsCovered with Artificial Ice", IEEE Transactions on Power Delivery, Vol.10,No.2, pp.1038-1051, April 1995.
[26] M.FARZANEH, J.KIERNICKI, "Flashover Problems Caused by Ice Build-up onInsulators", IEEE Electrical Insulation Magazine, Vol.11, No.2, pp.5-17,March/April 1995.
[27] M.FARZANEH, J.KIERNICKI, "Contournement électrique des isolateursrecouverts de glace", Canadian Journal of Electrical and ComputerEngineering, Vol.22, No.3, pp.95-109, July 1997.
[28] M.FARZANEH, J.KIERNICKI, "Flashover Performance of IEEE StandardInsulators under Ice Conditions", IEEE Transactions on Power Delivery,Vol.12, No.4, pp. 1602-1613, October 1997.
[29] M.FARZANEH, J.KIERNICKI, J.F.DRAPEAU, "AC Flashover Performance of Ice-coated Post Insulators", Proceedings of 6th International Workshop onAtmospheric Icing of Structures, Budapest, Hungary, pp.253-257, September1993.
[30] M.FARZANEH, J.L.LAFORTE, "The Effect of Voltage Polarity on Ice Accretion onShort String Insulators", Journal of Offshore Mechanics and ArcticEngineering, Vol.113, pp.179-184, May 1991.
236
[31] M.FARZANEH, J.L.LAFORTE, "Effect of Voltage Polarity on Icicles Grown onLine Insulators", International Journal of Offshore and Polar Engineering,Vol.2, pp.297-302, December 1992
[32] M.FARZANEH, J.L.LAFORTE, "Ice Accretion on Conductors Energized by AC orDC: A Laboratory Investigation of Ice Treeing", Proceedings of 3rd
International Offshore and Polar Engineering Conference, Singapore, pp.663-673, June1993.
[33] M.FARZANEH, S.Y.L I , K.D.SRIVASTAVA, "Flashover on Ice Surface",Atmospheric Research, Vol.46, pp.37-47, 1998.
[34] M.FARZANEH, O.T.MELO, "Properties and Effect of Freezing Rain and WinterFog on Outline Insulators", Cold Regions Science and Technology, Vol.19,pp. 33-46,1990.
[35] M. FARZANEH, C. VOLAT AND A. GAKWAYA, "Electric Field Calculation aroundIce-covered Insulator Using Boundary Element Method". Proceedings of IEEEInternational Symposium on Electrical Insulation ISEI2000, Anaheim,California, pp.349-355, April 2000.
[36] M.FARZANEH, J.ZHANG, "Propagation of AC Arc on Ice Surfaces",Proceedings of IEEE International. Symposium on Electrical Insulation 1998,Washington, DC. USA, June 1998.
[37] M.FARZANEH, J.ZHANG, S.BRETTSCHNEIDER, A.M.MIRI , "DC FlashoverPerformance of Ice-Covered Insulators", Proceedings of 10th InternationalSymposium on High-Voltage Engineering (ISH), Montreal, Canada, Vol.3,pp.77-80, August 1997.
[38] M.FARZANEH, J.ZHANG, X.CHEN, "Modelling of the AC Discharge on IceSurfaces", IEEE Transactions on Power Delivery, Vol.12, No.1, pp.325-338,January 1997.
[39] S.M.FIKKE, J.E.HANSSEN, L.ROLFSENG, "Long Range Transported Pollutantsand Conductivity of Atmospheric Ice on Insulators", IEEE Transactions onPower Delivery, Vol.PWRD-8, No.3, pp.1311-1321, July 1993.
[40] N.H.FLETCHER, "The Surface of Ice", Proceedings of the InternationalSymposium on Physics and Chemistry of Ice, Ottawa, Canada, pp. 132-136,August 1972.
237
[41 ] V.GAGLIARDO, "Discharges in Very-short Air Gaps in Plane-parallel Electrodesand under ac Voltage", IEEE Transactions on Dielectrics and ElectricalInsulation, Vol.1, No.6, pp.1156-1166, December 1994.
[42] I.M.GAVRILOV, V.R.KUKHTA, V.V.LOPATIN, P.G.PETROV, "Dynamics ofPrebreakdown Phenomena in a Uniform Field in Water", IEEE Transactionson Dielectrics and Electrical Insulation, Vol.1, No.3, pp.496-502, June 1994.
[43] H.H.R.GAXIOLA, J.M.WETZER, "Prebreakdown Phenomena in Dry Air alongPTFE Spacers", Proceedings of 8th International Symposium on GaseousDielectrics, Virginia Beach, USA, pp.57.l-57.VI, June 1998.
[44] H.GELIN, R.STUBBS, "Ice Electrets", Journal chem. Phys, Vol.42, pp.967-971,1965.
[45] A.I.GRIGOR'EV, "Some Features of the Corona Discharge from the Surface ofSnow and Ice", Sov. Tech. Phys. Letters, Vol.11, No.8, pp.415-417, August1985.
[46] H.HIESINGER, "Statistical Time-Lag in Case of Very Fast TransientBreakdown", 6th International Symposium on High Voltage Engineering, NewOrleans, USA, Paper 32.23, pp.1-4, August/September 1989
[47] A.V.HIPPEL, "The Dielectric Relaxation Spectra of Water, Ice and AqueousSolutions, and their Interpretation - 3. Proton Organization and ProtonTranfer in Ice", IEEE Transactions on Electrical Insulation, Vol.23, No.5,pp.825-840, October 1988.
[48] P.V.HOBBS, "Ice Physics", Clarendon Press, Oxford, 1974.
[49] N.lKEDA, I.KlTAMURA, K.IWAZUMI, T.KASHIO, T.OHARA, S.YOSHINO, T.TAMURA,"Influence of Water Drops for AC Flashover Voltage on Porcelain Surface andSilicone Rubber Surface", Poster presented at Tenth InternationalSymposium on High Voltage Engineering (ISH), Montreal, Canada, Août1997.
[50] INTERNATIONAL ELECTROTECHNICAL COMMISSION, "High-Voltage TestTechniques - Part 2: Test Procedures", International Standard IEC 60-2,1973.
[51] INTERNATIONAL ELECTROTECHNICAL COMMISSION, "Artificial Pollution Tests onHigh Voltage Insulators to be Used on AC Systems", International StandardIEC 507, April 1991.
238
[52] N.C.JAITLY, T.S.SUDARSHAN, "In-situ Surface Charge Measurement inDielectric Bridged Vacuum Gaps", IEEE Transactions on Electrical Insulation,Vol.23, pp.261-273, 1988.
[53] K.KANNUS, K.LAHTI, K-NOUSIAINEN, "Comparisons between Experiments andCalculations of the Electrical Behaviour of Ice-Covered High VoltageInsulators", Proceedings of the 8th International Workshop on AtmosphericIcing of Structures, Iceland, pp. 325-331, June 1998.
[54] K.KANNUS, V.VERKKONEN, E.LAKERVI, "Effects of Ice Coating on the ACPerformance of Medium Voltage Insulators", Proceedings of NordicSymposium of Electrical Insulation, NORD-IS 86, Esbo, Finland, pp.1-11,June 1986.
[55] M.KAWAI, "AC Flashover Test at Project UHV on Ice-Coated Insulators", IEEETransactions on Power Apparatus & Systems, Vol.PAS-89, No.8, pp.1800-1804, December 1970.
[56] E.F.KELLEY, M.NEHMADI, R.E.HEBNER, M.O.PACE, A.L.WINTENBERG,
T.V.BLALOCK, J.V.FOUST, "Measurement of Partial Discharges in Hexaneunder dc Voltages", IEEE Transactions on Electrical Insulation, Vol.24, No.6,pp. 1109-1119, December 1989.
[57] M.S.KHALIL, B.S.HANSEN, "Investigation of Space Charge in Low-DensityPolyethylene Using a Field Probe Technique", IEEE Transactions onElectrical Insulation, Vol.23, No.3, pp.441-445, June 1988.
[58] KUFFEL, ZAENGL, "High Voltgae Engineering", Pergamon Press, 1985.
[59] J.L.LAFORTE, C.LPHAN, J.DRUEZ, "Ice Accretion on Conductors Energized byAC or DC", Proceedings of 6th International Conference on Port and OnceanEngineering and Arctic Conditions, pp. 1057-1066. 1983.
[60] G.LE ROY, C.GARY, B.HUTZLER, J.LALOT, C.DUBANTON, "Les propriétésdiélectriques de l'air et les très hautes tensions", Éditions Eyrolles, Paris,1984.
[61] S.Y.Li, K.D.SRIVASTAVA, G.D.THEOPHILUS, "Nanosecond Streak Photographyof Discharges on Spacer Surface in Gases", IEEE Transactions on Dielectricsand Electrical Insulation, Vol.2, No.1, pp.-114-120, February 1995.
239
[62] S.Y.Li, G.D.THEOPHILUS, K.D.SRIVASTAVA, "Early Stages of DischargeDevelopment on Insulating Spacers in Gases - A Photographic Study",Proceedings of 5th International Conference on Conduction and Breakdown inSolid Electrics", United Kingdom, pp. 1-5, July 1995.
[63] S.Y.Li, G.D.THEOPHILUS, K.D.SRIVASTAVA, "Photographic Observations ofDischarge development on Spacers under Combined DC and ImpulseVoltages in SF6", Private Communication, 1998.
[64] K.L.IBBRECHT, "Snow Crystals - Ice Crystal Surface Physics", CaliforniaInstitute of Technology,http://www.its.caltech.edu/~atomic/snowcrystals/surface/surface.htm.
[65] I.V.LISITSYN, H.NOMIYAMA, S.KATSUKI, H.AKIYAMA, "Thermal Processes in aStreamer Discharge in Water", IEEE Transactions on Dielectrics andElectrical Insulation, Vol.6, No.3, pp. 351-356, June 1999.
[66] L.B.LOEB, "Electrical Breakdown of Gases with Steady or Direct CurrentImpulses Potentials", Handbuch der Physik, Springer-Verlag, Berlin, BandXXII, pp.445-530, 1956.
[67] L.B.LOEB, "Electrical Coronas - Their Basic Physical Mechanisms", Universityof California Press, Berkeley, 1965.
[68] V.LOPATIN, M.D.NOSKOV, R.BADENT, K.KIST, A.J.SCHWAB, "PositiveDischarge Development in Insulating Oil", IEEE Transactions on Dielectricsand Electrical Insulation, Vol.5, No.2, pp.250-255, April 1998.
[69] N.MAENO, "Measurements of Surface and Volume Conductivities of Single IceCrystals", Proceedings of the International Symposium on Physics andChemistry of Ice, Ottawa, Canada, pp. 140-143, August 1972.
[70] C.MAGANO, H.SHIO, "Frictional Electrification of Ice and Change in its ContactSurface", Physics of Snow and Ice, pp.137-150,1967.
[71] H.MATSUDA, H.KOMURO, K.TAKASU, "Withstand Voltage Characteristics ofInsulator String Covered with Snow or Ice", IEEE Transactions on PowerDelivery, Vol.PWRD-6, No.3, pp.1243-1250, July 1991.
[72] T.MATSUMOTO, M.ISHII, T.KAWAMURA, "Optoelectronic Measurement of PartialArcs on a Contaminated Surface", IEEE Transactions on Electrical Insulation,Vol.EI-19, No.6, pp.543-544, December 1984.
240
[73] MAX PLANK INSTITUT FUER FESTKOERPERFORSCHUNG, "Ich bin schon da - DieDiffusion des Protons im Wasser", Spektrum der Wissenschaft,http://www.spektrum.de/themen/Proton-text.html.
[74] MAX PLANCK SOCIETY, "Why is Ice so Slippery? Mysteries of the Invisible IceSurface", http://www.mpg.de/ice2.htm.
[75] J.MCNAMARA, "The Structure of Ice and its Role in Stratospheric", Universityof Manchester, http://mchhpi.ch.man.ac.uk/~mbdtsma/poster.ice.html.
[76] J.M.MEEK, J.D.CRAGGS, "Electrical Breakdown of Gases", Wiley-lntersciencePublication, Chichester, 1978.
[77] A.MEIER, W.M.NIGGLI, "The Influence of Snow and Ice Deposit onSupertensison Transmission Line Insulator Strings with Special Reference toHigh Altitude Operation", IEEE Conference Publ.44, London, England,pp.386-395, September 1968.
[78] M.MELLOR, "Properties of Snow", Cold Regions Science and Engineering,Part III, Sec.AI, December 1964.
[79] B. MICHEL, "Éléments de la physique de la neige et de la glace", Les pressesde l'Université Laval, Québec, 1964.
[80] MICROSOFT ENCARTA ONLINE ENCYCLOPEDIA 2000, "Ice",http://encarta.msn.com, (20 July 2000).
[81] H.C.MILLER, "Surface Flashover of Insulators", IEEE Transactions onElectrical Insulation, Vol.24, No.5, pp.765-786, October 1989.
[82] Y.NAKAO, H.ITOH, Y.SAKAI, H.TAGASHIRA, "Studies of the CreepageDischarge on the Surface of Liquids", IEEE Transactions on ElectricalInsulation, Vol.23, No.4, pp.677-687, August 1988.
[83] E.NASSER, "Fundamentals of Gaseous lonization and Plasma Electronics",Wiley-lnterscience, New York, 1971.
[84] W.PFEIFFER, M.GIESSELMANN, P.VOLKER, "Predischarge Development atInterface between Gaseous and Solid Dielectrics", IEEE InternationalSymposium Electrical Insulation, Philadelphia, USA, pp.216-219, 1982.
[85] W.PFEIFFER, D.SCHOEN, L.Z.TONG, "Simulation of Prebreakdown Phenomenaat a Gas/Solid Interface in a 10% SF6/N2 Mixture Stressed by Very Fast
241
Transient Voltages", Proceedings of IEEE International Symposium onElectrical Insulation ISEI2000, Anaheim, USA, paper 14-7,pp.408-411, April2000.
[86] W.PFEIFFER, D.SCHOEN, C.ZENDER, "Dielectric Strength of SF/N2 Mixtures forNonuniform Field Distribution and Very Fast Transient Voltage Stress",Private Communication, 1997.
[87] L-C.PHAN, J.-L.LAFORTE, D.D.NGUYEN, "The Lobe Structure in Ice Accretedon an Aluminium Conductor in the Presence of a DC Electric Field", Annals ofGlaciology, Vol.4, pp.228-235,1983.
[88] A.J.PHILLIPS, I.R.JANDRELL, J.P.REYNDERS, "The Effect of Corona in Volumeand Air-Density on the Corona Onset Potential of Water Drops", Proceedingsof 9th International Symposium on High Voltage Engineering, Graz, pp.2166-1-4, August 1995.
[89] M.PIDWIRNY, "Introduction to Physical Geography 1, Physical Properties ofWater", Okanagan University College,http://www.geog.ouc.bc.ca/conted/onlinecourses/geog_111/6a.html.
[90] E.R.POUNDER, "Physics of Ice", Pergamon Press .Oxford, 1965
[91] S.E.REYNOLDS, M.BROOK, M.F.GOURLEY, "Thunderstorm Charge Separation",Journal. Met, Vol.14, pp.426-436,1957.
[92] N.RIEHL, B.BULLEMER, H.ENGELHARDT, "Physics of Ice", Plenum Press, NewYork 1969
[93] M.ROULLEAU, "The Influence of an Electric Field on the Freezing of Water",Proceedings of the International Symposium on Physics of Ice, Munich,Germany, pp.631-640, September 1968.
[94] R.RUPP, "Electrical Properties of Ice Ih Single Crystals", Proceedings of theInternational Symposium on Physics and Chemistry of Ice, Ottawa, Canada,August 1972.
[95] M.SATO, H.SAITO, A.KAGA, H.AKAGAMI, "Fundamental Characteristics of ACFlashover on Contaminated Insulators Covered with Ice", Japanese Journalof Applied Physics, Vol.28, No.5, pp.889-896, May 1989.
242
[96] H.M. SCHNEIDER, "Artificial Ice Tests on Transmission Line Insulators - AProgress Report", IEEE/PES Summer Meeting, San Francisco, USA, PaperA75-491-1, pp.347-353, July 1975.
[97] G.SCHROEDER, "SF6-N2 Gas Mixtures - Electrical Insulation and DischargeDevelopment under Fast Oscillating Impulse Conditions in a Non-UniformGap", Proceedings of IEEE International Symposium on Electrical InsulationISEI 2000, Anaheim, USA, paper 10-1, pp.280-283, April 2000.
[98] SCIENTIFIC VISUALIZATION LABORATORY, "Water and Ice", New York University,http://cwis.nyu.edu/pages/mathmol/modules/water/info_water.html.
[99] T.SEELIG, J.PILLING, L.BERNDT, "Physikalische Zusammenhange beimGefrieren und Schmelzen wâBriger Elektrolytlôsungen an Freiluftisolatoren",Wiss. Berichte THZ 1234, pp.34-38, 1990.
[100]T.SHIMAZAKI, I.TSUNEYASU, "Flashover Processes on the Surface of SolidInsulators under Positive Impulse Voltage in the Atmosphere", IEEETransactions on Electrical Insulation, Vol.25, No.6, pp.1161-1169, December1990.
[101]T.SHIMAZAKI, "Flashover Characteristics and Surface Processes underNegative Impulse Voltage in Atmospheric Air", IEEE Transactions onElectrical Insulation, Vol.27, No.3, pp.488-495, June 1992.
[102]M.L.-A.SJOEBERG, H.J.BLENNOW, S.M.GUBANSKI, M.A.S.LEIJON, "On
Discharge Phenomena in a Covered Electrode System in Air", Proceedings ofIEEE International Symposium on Electrical Insulation ISEI 2000, Anaheim,USA, paper 12-3, pp.345-348, April 2000.
[103]T.S.SUDARSHAN, R.A.DOUGAL, "Mechanism of Surface Flashover along SolidDielectrics in Compressed Gases: A Review", IEEE Transactions onElectrical Insulation, Vol.EI-21, No.5, pp.727-746, October 1986.
[104]T.TAKAHASHI, "Electric Potential of Liquid Water on an Ice Surface", Journalatmospheric Science, Vol.26, pp.1253-1258,1969.
[105]T.TAKAHASHI, "Electric Potential of a Rubbed Ice Surface", Journalatmos.Science, Vol.26, pp. 1259-1265, 1969.
[106]Y.TEISSEYRE, M.FARZANEH, "Effect of Corona Discharge on the Ice Accretion",Proceedings of 4th Conference on Atmospheric Icing of Structures, Paris,France, paper B5.5, pp.1-4, September 1988.
243
[107]S.TENBOHLEN, "Particle-Initiated Surface Discharges in SF6 under FastOscillating Impulse Voltages", Proceedings of 10th International Symposiumon High-Voltage Engineering (ISH), Montreal, Canada, Vol.2, pp.101-104,August 1997.
[108]C.Volat, Internal Research Report, University of Québec in Chicoutimi,Canada, 1998.
[109]Z.VUCKOVIC, Z.ZDRAVKOVIC, S.PLAZINIC, G.HRABAK-TUMPA, "Effect of PollutedIce and Snow Accretions on High-Voltage Transmission Line Insulators",Proceedings of 5th International Workshop on Atmospheric Icing of Structures,Tokyo, Paper B4-3, pp.1-6, October/November 1990.
[110]D.Wu, R.HARTINGS, S.M.FIKKE, "The Performance of Vertically InstalledInsulator Strings under Ice and Snow Conditions", Proceedings of 8th
International Workshop on Atmospheric Icing of Structures, Iceland, pp. 205-208, June 1998.
[111]T.YAMASHITA, G.SATOH, T.FUJISHIMA, H.MATSUO, T.SHIBATA, "PropagationCharacteristics of a Surface Discharge on Covered Conductors andCylindrical Dielectric Materials", Proceedings of 10th International Symposiumon High-Voltage Engineering (ISH), Montreal, Canada, Vol.2, pp. 145-148,August 1997.
[112] L.YARRIS, "Theory on Antarctic Ozone Hole Boosted by New ObservationsConfirming Wet Surface of Ice", Berkley Lab, http://www.lbl.gov/Science-Articles/Archive/ice-ozone-link.html.
[113] M.YASHIMA, T.KAWAMOTO, H.FUJINAMI, T.TAKUMA, "A Study on BreakdownCharacteristics of Hybrid Gas Insulated Transmission Line (H-GIL)",Proceedings of 10th International Symposium on High-Voltage Engineering(ISH), Montreal, Canada, Vol.2, pp.5-8, August 1997.
[114] Z.YOSHIDA, "The Mechanism of Charge Generation in Friction and Destructionof Ice and in Thunderclouds", Low Temp. Science, A1, pp.149-187,1944.
[115]M.YUMUTO, T.SAKAI, "Photo Electron Emission from Dielectric Materials byUltra-violet-ray Irridiation", Annual Report of Conference on Electricalinsulation and Dielectric Phenomena, Boston, USA, pp.75-81,1981.
244
[116] J.ZHANG, M.FARZANEH, "Propagation of DC Arc on Ice Surfaces",Proceedings of 8th International Offshore and Polar Engineering Conference,Montréal, Canada, Vol.2, pp.5547-550, May 1998.
[117] J.ZHOU, "A Study of Charge Accumulation and Spacer Flashover inCompressed Gas Insulation", Ph.D. Thesis, University of British Columbia,Canada, June 1991.
[118] http://www.geo.fmi.fi/~hlaakso/Rosetta/Complex.GIF,"Complex Permittivity"

APPENDICES
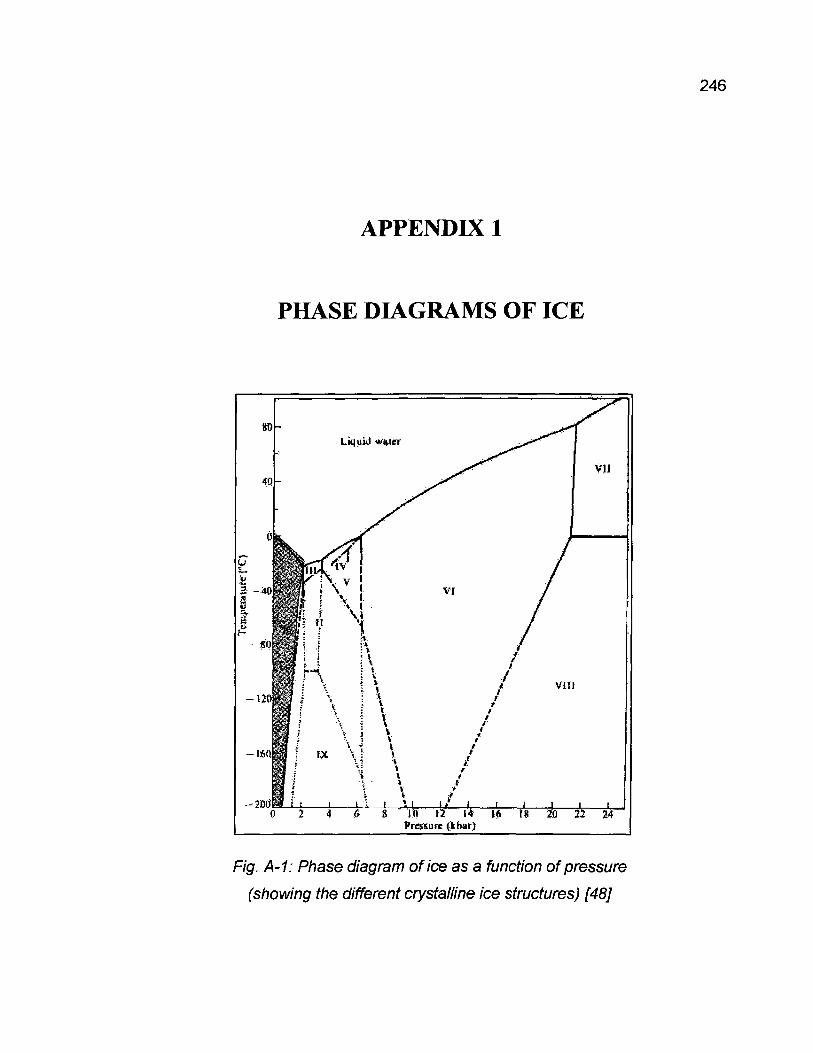
246
APPENDIX 1
PHASE DIAGRAMS OF ICE
8 10 12 14 16Pressure (kbar)
Fig. A-1: Phase diagram of ice as a function of pressure
(showing the different crystalline ice structures) [48]
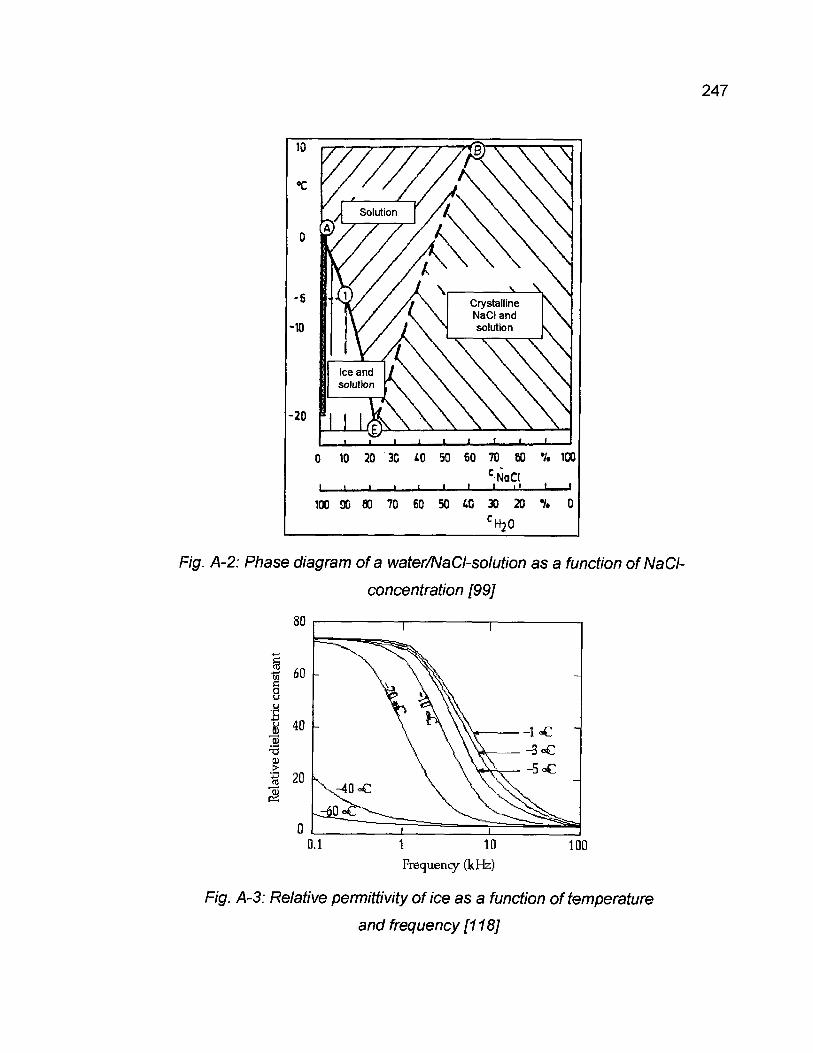
247
10
°c
-6
-10
-20
CrystallineNaCI andsolution
0 10 20 3C 40 50 60 70 80 7t ICOc-NaCI
I I I
100 90 80 70 60 50 40 30 20 % 0c H 2 0
Fig. A-2: Phase diagram of a water/NaCI-solution as a function ofNaCI-
concentration [99]
80
J.s
t 10
Frequency (kHz)100
Fig. A-3: Relative permittivity of ice as a function of temperature
and frequency [118]
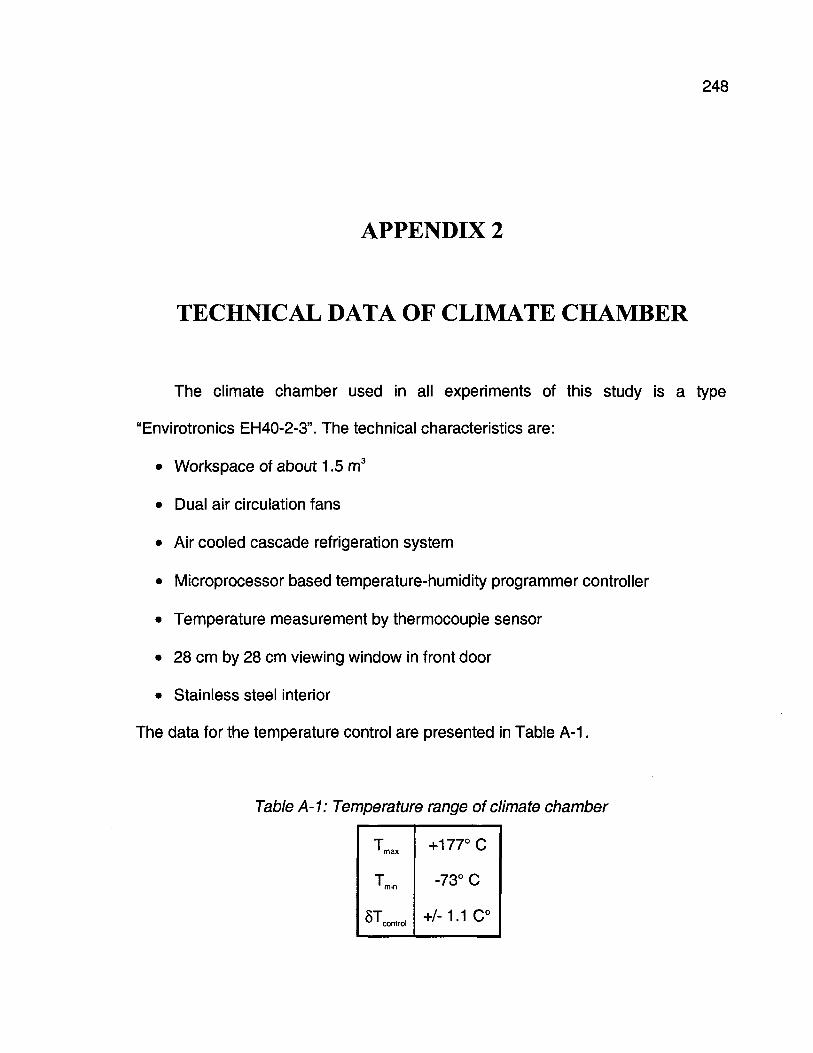
248
APPENDIX 2
TECHNICAL DATA OF CLIMATE CHAMBER
The climate chamber used in all experiments of this study is a type
"Envirotronics EH40-2-3". The technical characteristics are:
� Workspace of about 1.5 m3
� Dual air circulation fans
� Air cooled cascade refrigeration system
� Microprocessor based temperature-humidity programmer controller
� Temperature measurement by thermocouple sensor
� 28 cm by 28 cm viewing window in front door
� Stainless steel interior
The data for the temperature control are presented in Table A-1.
Table A-1: Temperature range of climate chamber
max
min
° ' control
+177
-73°
+/-1.1
>C
C
C°
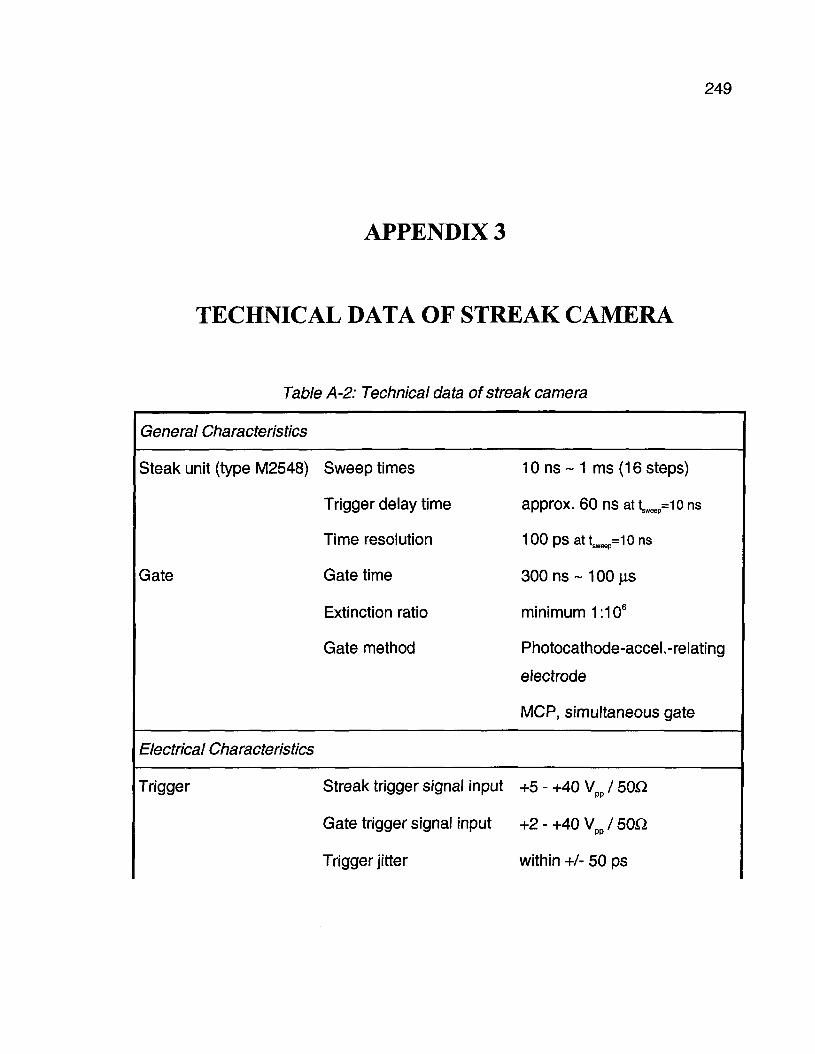
249
APPENDIX 3
TECHNICAL DATA OF STREAK CAMERA
Table
General Characteristics
Steak unit (type M2548)
Gate
Electrical Characteristics
Trigger
A-2: Technical data of streak camera
Sweep times
Trigger delay time
Time resolution
Gate time
Extinction ratio
Gate method
Streak trigger signal input
Gate trigger signal input
Trigger jitter
10ns~ 1 ms (16 steps)
approx. 60 ns at tsweep=io ns
100psattsweep=10ns
300 ns~ 100 fis
minimum 1:106
Photocathode-accel.-relating
electrode
MCP, simultaneous gate
+5 - +40 Vpp / 50Q
+2-+40Vp p /50Q
within +/- 50 ps
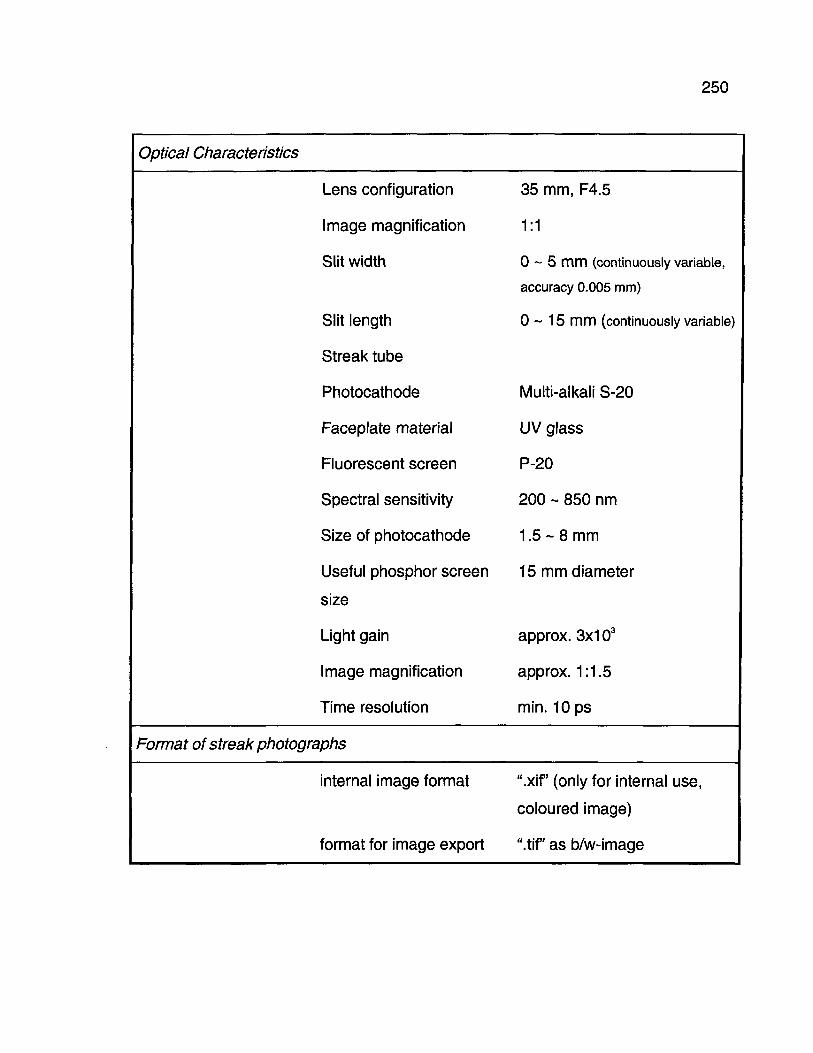
250
Optical Characteristics
Lens configuration
Image magnification
Slit width
Slit length
Streak tube
Photocathode
Faceplate material
Fluorescent screen
Spectral sensitivity
Size of photocathode
Useful phosphor screen
size
Light gain
Image magnification
Time resolution
Format of streak photographs
internal image format
format for image export
35 mm, F4.5
1:1
0 ~ 5 mm (continuously variable,
accuracy 0.005 mm)
0 - 1 5 mm (continuously variable)
Multi-alkali S-20
UV glass
P-20
200 ~ 850 nm
1.5-8 mm
15 mm diameter
approx. 3x10³
approx. 1:1.5
min. 10 ps
".xif" (only for internal use,
coloured image)
".tif" as b/w-image
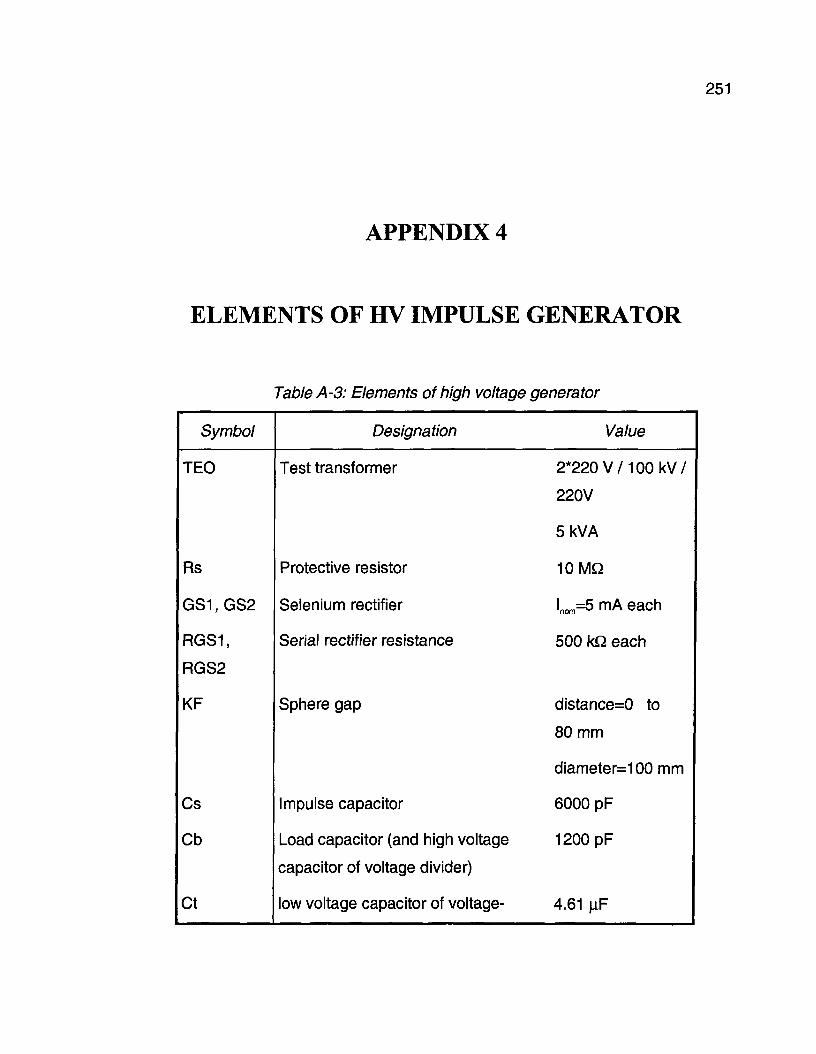
251
APPENDIX 4
ELEMENTS OF HV IMPULSE GENERATOR
Table A-3: Elements of high voltage generator
Symbol
TEO
Rs
GS1.GS2
RGS1,
RGS2
KF
Cs
Cb
Ct
Designation
Test transformer
Protective resistor
Selenium rectifier
Serial rectifier resistance
Sphere gap
Impulse capacitor
Load capacitor (and high voltage
capacitor of voltage divider)
low voltage capacitor of voltage-
Value
2*220 V / 100 kV/
220V
5kVA
10 MQ
lnom=5 mA each
500 kQ each
distance=0 to
80 mm
diameter=100 mm
6000 pF
1200 pF
4.61 nF
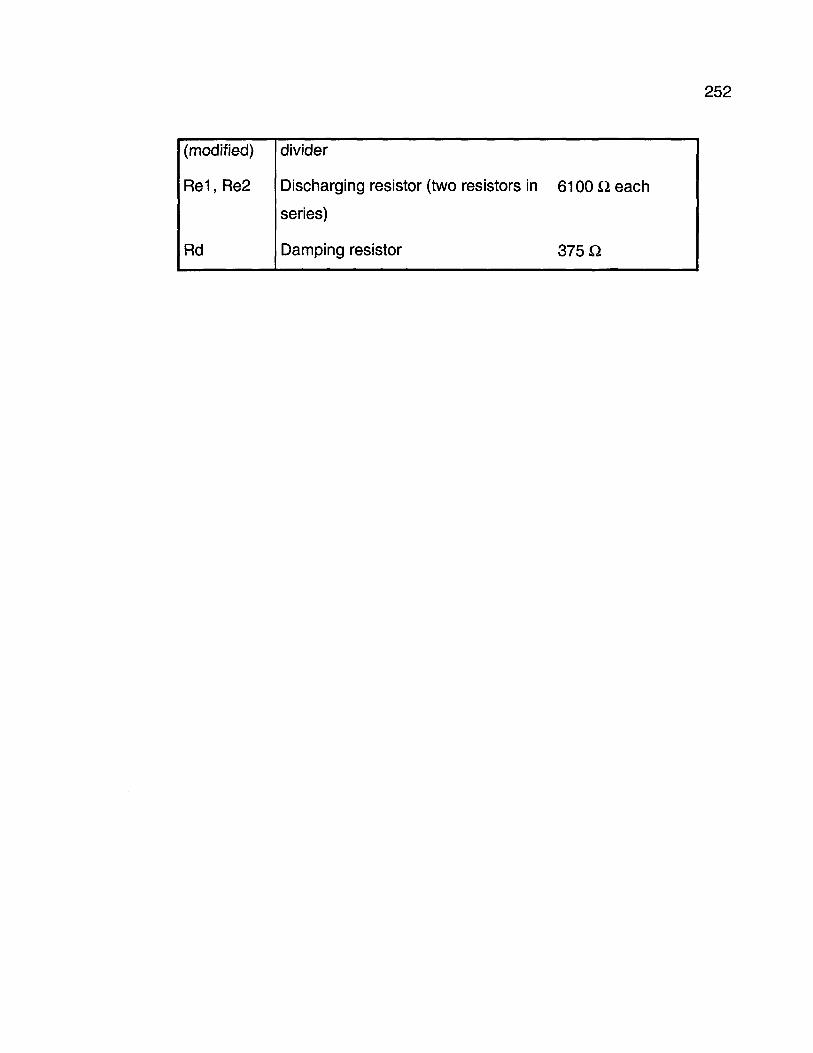
252
(modified)
Re1, Re2
Rd
divider
Discharging resistor
series)
Damping resistor
(two resistors in 6100 a each
375 Q
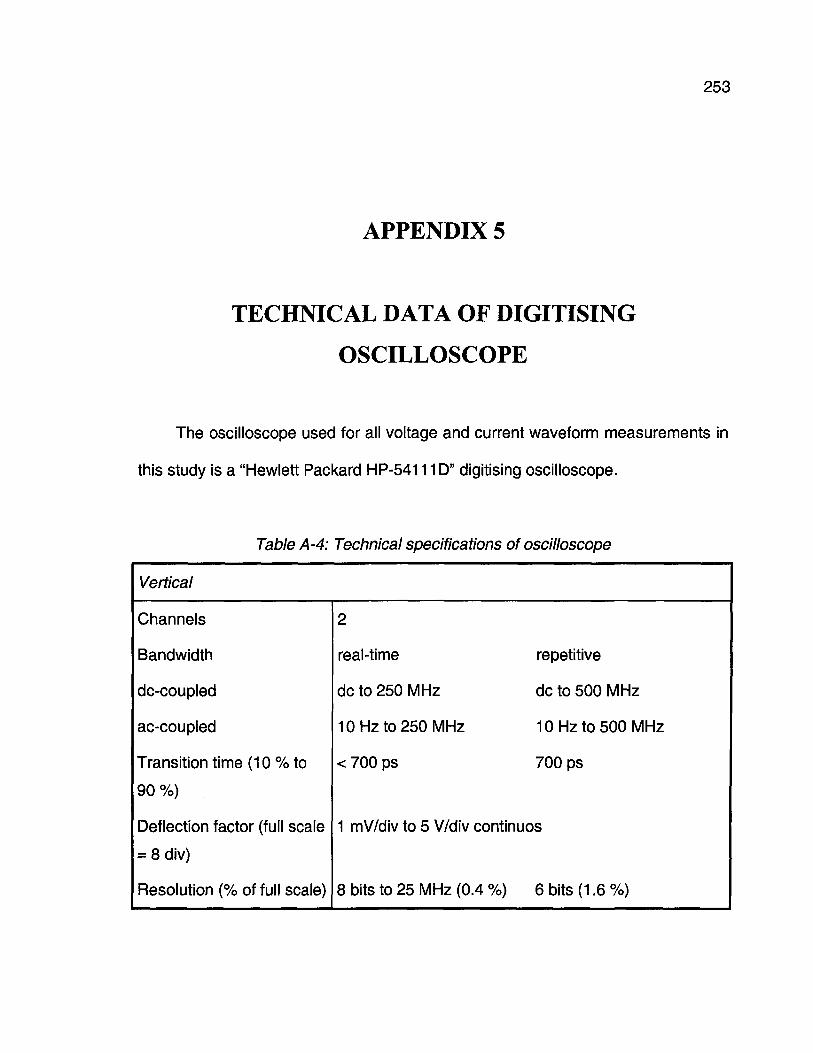
253
APPENDIX 5
TECHNICAL DATA OF DIGITISING
OSCILLOSCOPE
The oscilloscope used for all voltage and current waveform measurements in
this study is a "Hewlett Packard HP-54111D" digitising oscilloscope.
Table A-4:
Vertical
Channels
Bandwidth
dc-coupled
ac-coupled
Transition time (10 % to
90 %)
Deflection factor (full scale
= 8 div)
Resolution (% of full scale)
Technical specifications of oscilloscope
2
real-time
dc to 250 MHz
10 Hz to 250 MHz
< 700 ps
repetitive
dc to 500 MHz
10 Hz to 500 MHz
700 ps
1 mV/div to 5 V/div continuos
8 bits to 25 MHz (0.4 %) 6 bits (1.6 %)
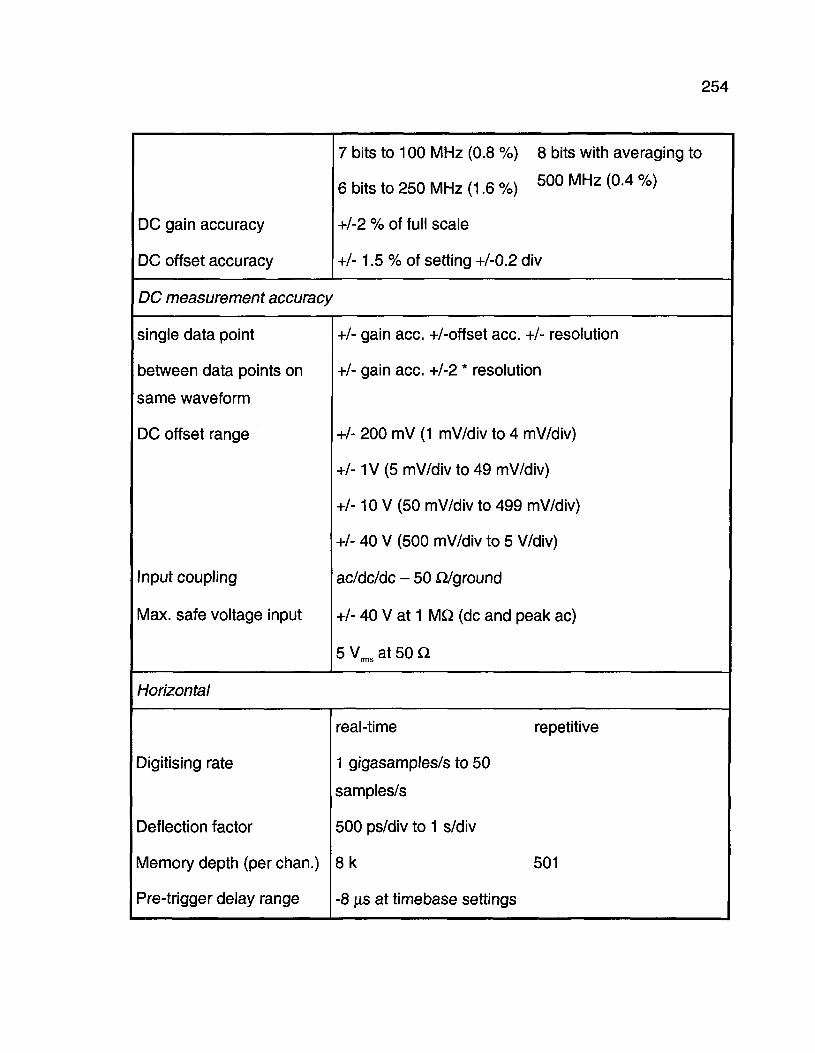
254
DC gain accuracy
DC offset accuracy
DC measurement accuracy
single data point
between data points on
same waveform
DC offset range
Input coupling
Max. safe voltage input
7 bits to 100 MHz (0.8 %) 8 bits with averaging to
6 bits to 250 MHz (1.6 %) 5 0 0 M H z <0-4 %>
+/-2 % of full scale
+/-1.5 % of setting +/-0.2 div
+/- gain ace. +/-offset ace. +/- resolution
+/- gain ace. +1-2 * resolution
+/- 200 mV (1 mV/div to 4 mV/div)
+/-1V (5 mV/div to 49 mV/div)
+/-10 V (50 mV/div to 499 mV/div)
+/- 40 V (500 mV/div to 5 V/div)
ac/dc/dc - 50 Q/ground
+/- 40 V at 1 MQ (dc and peak ac)
5 Vrms at 50 Q
Horizontal
Digitising rate
Deflection factor
Memory depth (per chan.)
Pre-trigger delay range
real-time repetitive
1 gigasamples/s to 50
samples/s
500 ps/div to 1 s/div
8 k 501
-8 jis at timebase settings
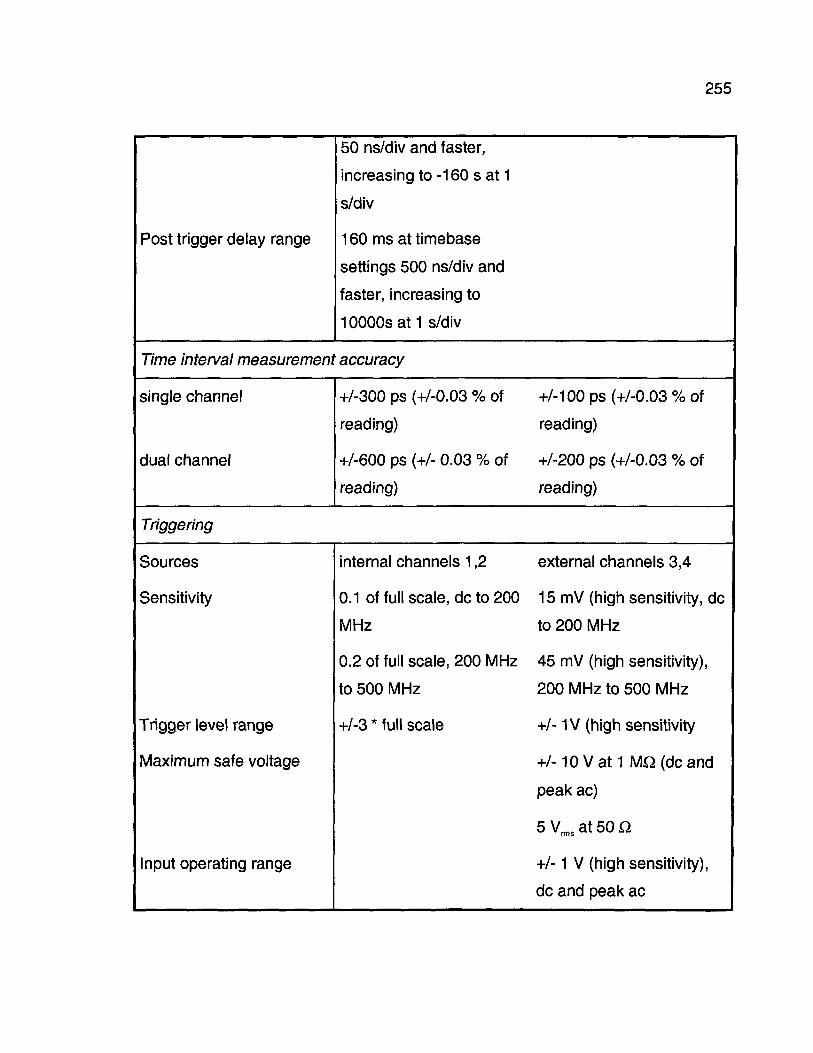
255
Post trigger delay range
50 ns/div and faster,
increasing to -160 s at 1
s/div
160 ms at timebase
settings 500 ns/div and
faster, increasing to
10000s at 1 s/div
Time interval measurement accuracy
single channel
dual channel
Triggering
Sources
Sensitivity
Trigger level range
Maximum safe voltage
Input operating range
+/-300 ps (+/-0.03 % of
reading)
+/-600 ps (+/- 0.03 % of
reading)
internal channels 1,2
0.1 of full scale, dcto200
MHz
0.2 of full scale, 200 MHz
to 500 MHz
+/-3 * full scale
+/-100ps(+/-0.03%of
reading)
+/-200 ps (+/-0.03 % of
reading)
external channels 3,4
15 mV (high sensitivity, dc
to 200 MHz
45 mV (high sensitivity),
200 MHz to 500 MHz
+/- 1V (high sensitivity
+ / -10Vat1 MQ(dcand
peak ac)
5V m s at50Q
+/-1 V (high sensitivity),
dc and peak ac
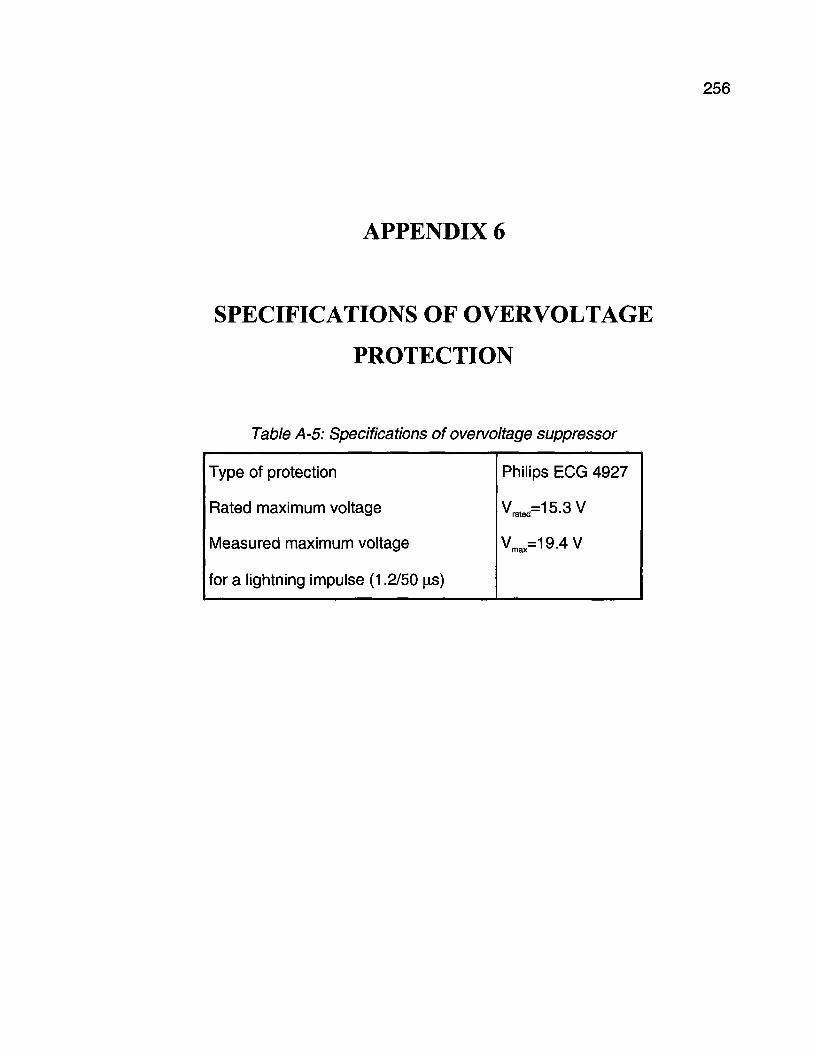
256
APPENDIX 6
SPECIFICATIONS OF OVERVOLTAGE
PROTECTION
Table A-5: Specifications of overvoltage suppressor
Type of protection
Rated maximum voltage
Measured maximum voltage
for a lightning impulse (1.2/50 |is)
Philips ECG 4927
Vrated=15.3V
Vmax=19.4V
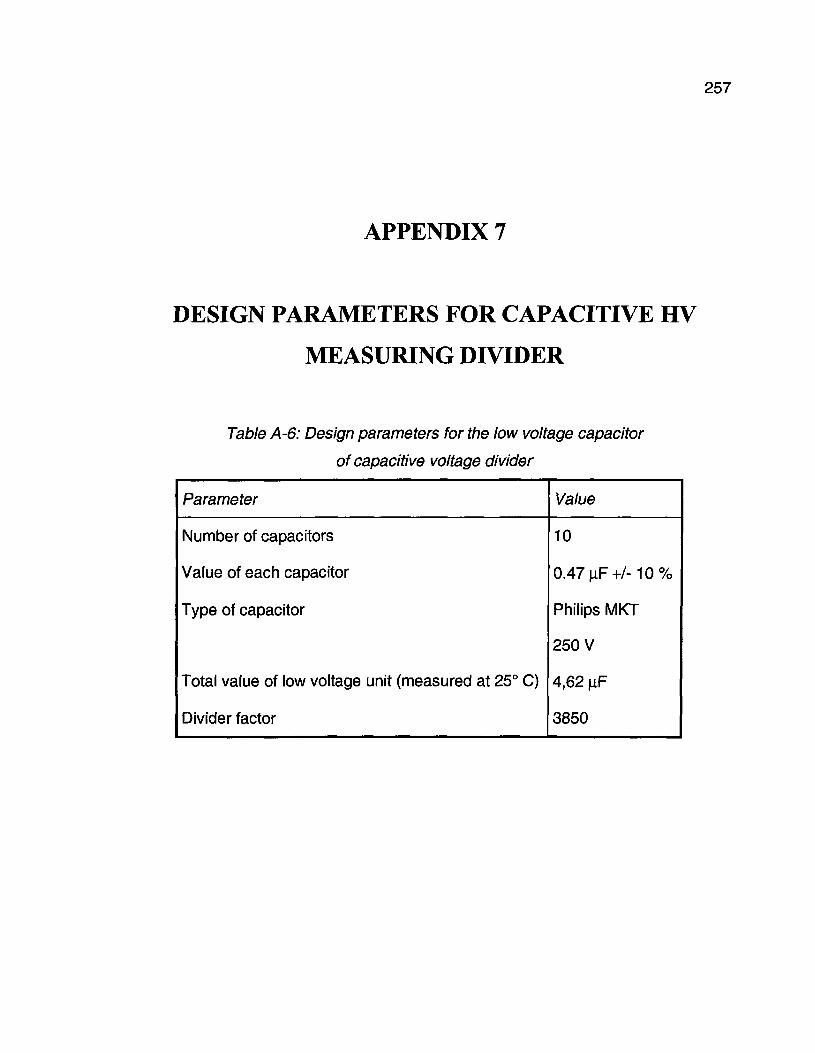
257
APPENDIX 7
DESIGN PARAMETERS FOR CAPACITIVE HV
MEASURING DIVIDER
Table A-6: Design parameters for the low voltage capacitor
of capacitive voltage divider
Parameter
Number of capacitors
Value of each capacitor
Type of capacitor
Total value of low voltage unit (measured at 25° C)
Divider factor
Value
10
0.47[iF+/-10%
Philips MKT
250 V
4,62 nF
3850
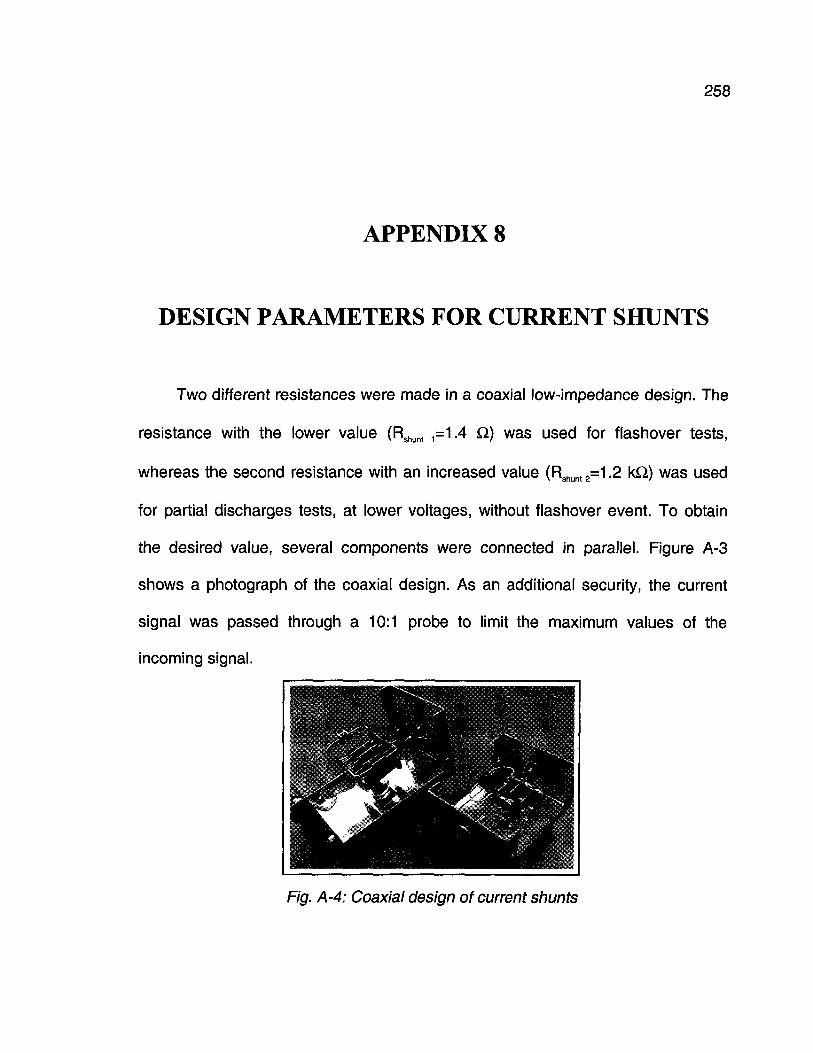
258
APPENDIX 8
DESIGN PARAMETERS FOR CURRENT SHUNTS
Two different resistances were made in a coaxial low-impedance design. The
resistance with the lower value (Rshunt ,=1.4 Q) was used for flashover tests,
whereas the second resistance with an increased value (Rshunt2=1.2 kQ) was used
for partial discharges tests, at lower voltages, without flashover event. To obtain
the desired value, several components were connected in parallel. Figure A-3
shows a photograph of the coaxial design. As an additional security, the current
signal was passed through a 10:1 probe to limit the maximum values of the
incoming signal.
> ��"-�-� � . .-JSjiS^"* ,<î^::--"
Fig. A-4: Coaxial design of current shunts
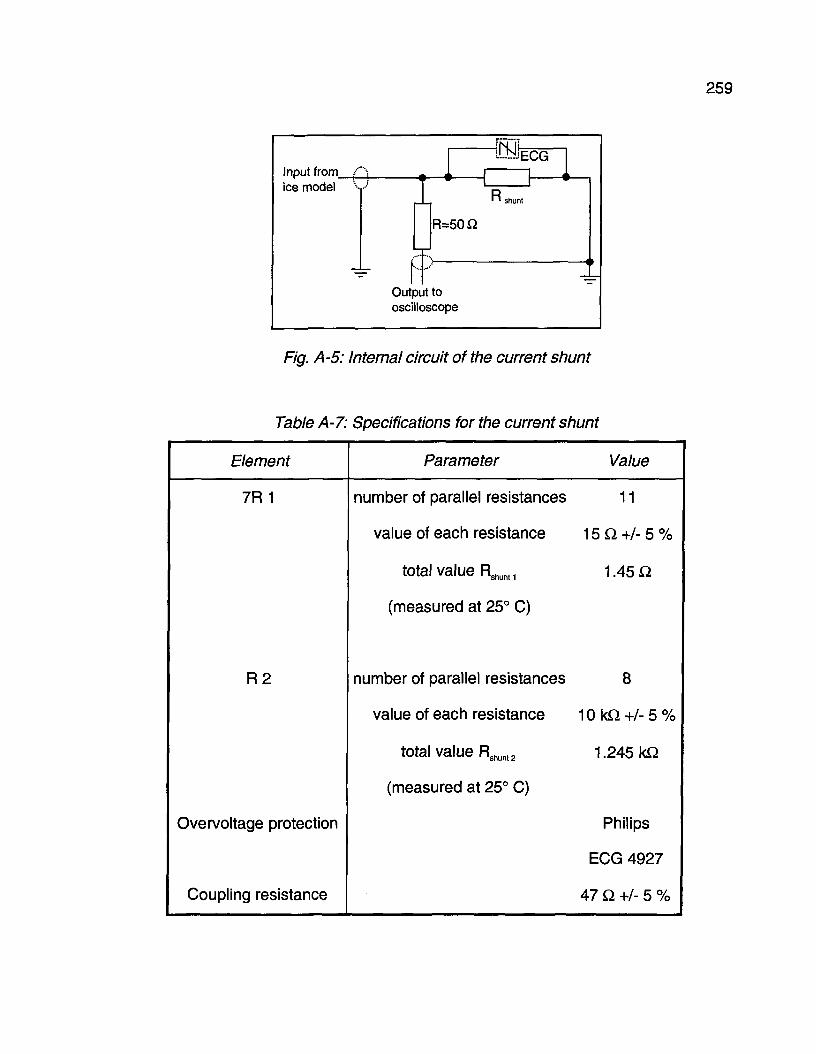
Input from £ice model
259
IECG
R shunt
R=50Q
Output tooscilloscope
Fig. A-5: Internai circuit of the current shunt
Table A-7.
Element
7R1
R2
Overvoltage protection
Coupling resistance
Specifications for the current shunt
Parameter
number of parallel resistances
value of each resistance
total value Rshunt1
(measured at 25° C)
number of parallel resistances
value of each resistance
total value Rshunt2
(measured at 25° C)
Value
11
15Q+/-5%
1.45 Q
8
10kQ+ / -5%
1.245 kQ
Philips
ECG 4927
47 Q +/- 5 %
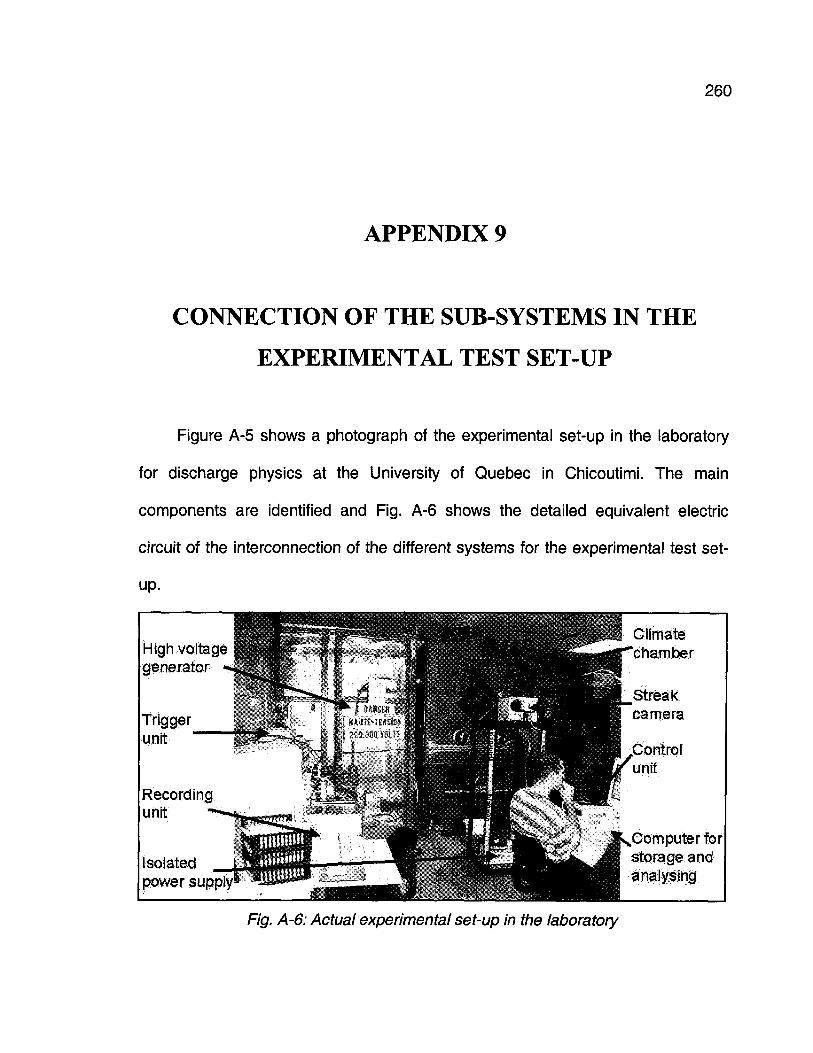
260
APPENDIX 9
CONNECTION OF THE SUB-SYSTEMS IN THE
EXPERIMENTAL TEST SET-UP
Figure A-5 shows a photograph of the experimental set-up in the laboratory
for discharge physics at the University of Quebec in Chicoutimi. The main
components are identified and Fig. A-6 shows the detailed equivalent electric
circuit of the interconnection of the different systems for the experimental test set-
up.
Highvoltage-generator
Triggerunit-
Recordingunit
isolatedpower supply1
Climatechamber
Streakcamera
.Controlunit
Computer forstorage andanalysing
Fig. A-6: Actual experimental set-up in the laboratory
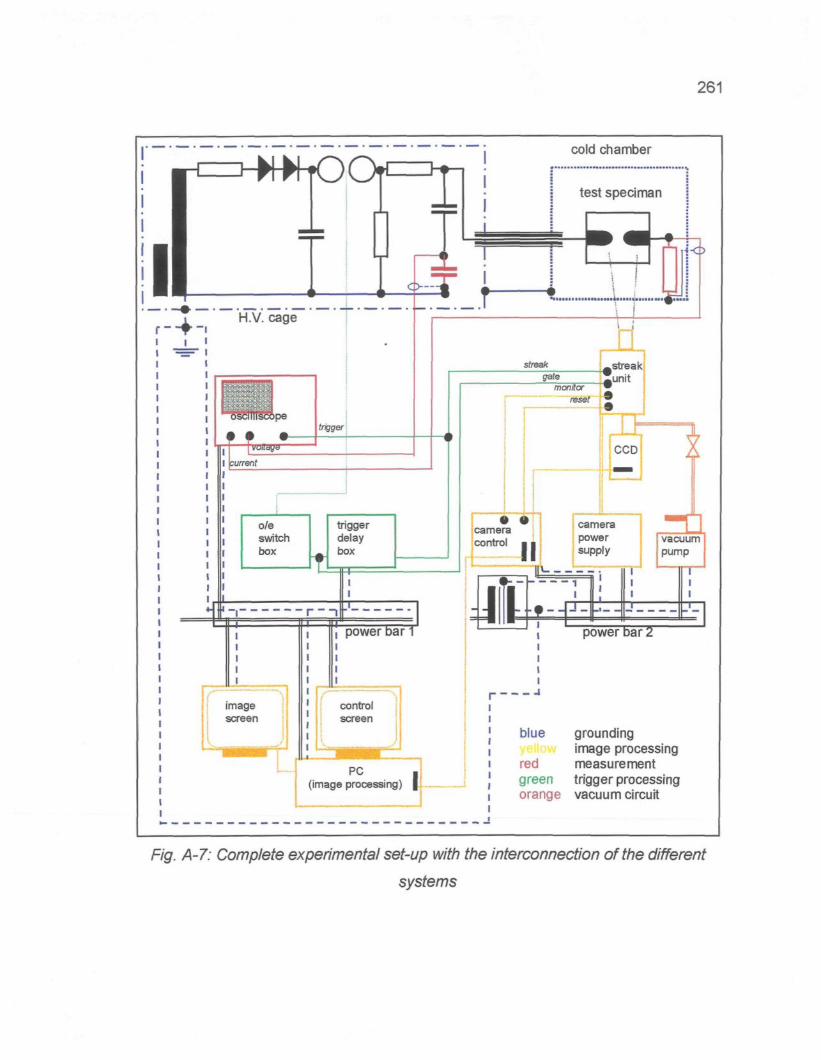
261
cold chamber
groundingimage processing
red measurementgreen trigger processingorange vacuum circuit
Fig. A-7: Complete experimental set-up with the interconnection of the different
systems
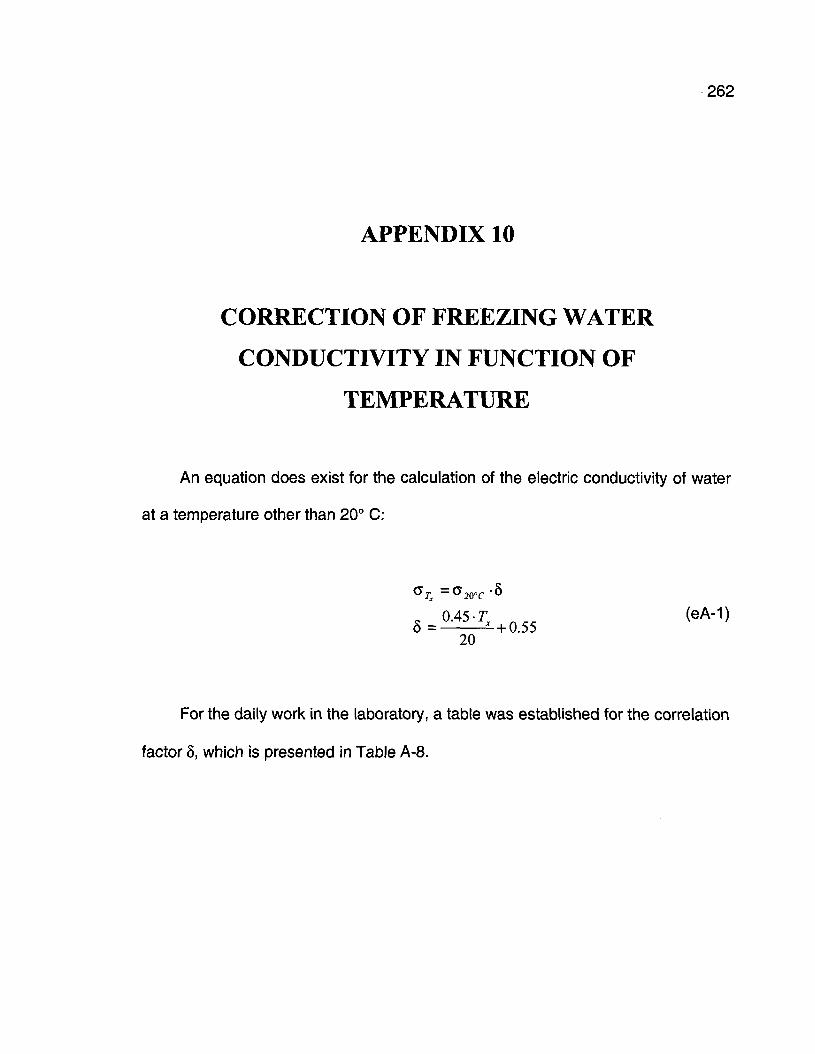
262
APPENDIX 10
CORRECTION OF FREEZING WATER
CONDUCTIVITY IN FUNCTION OF
TEMPERATURE
An equation does exist for the calculation of the electric conductivity of water
at a temperature other than 20° C:
20
For the daily work in the laboratory, a table was established for the correlation
factor 5, which is presented in Table A-8.
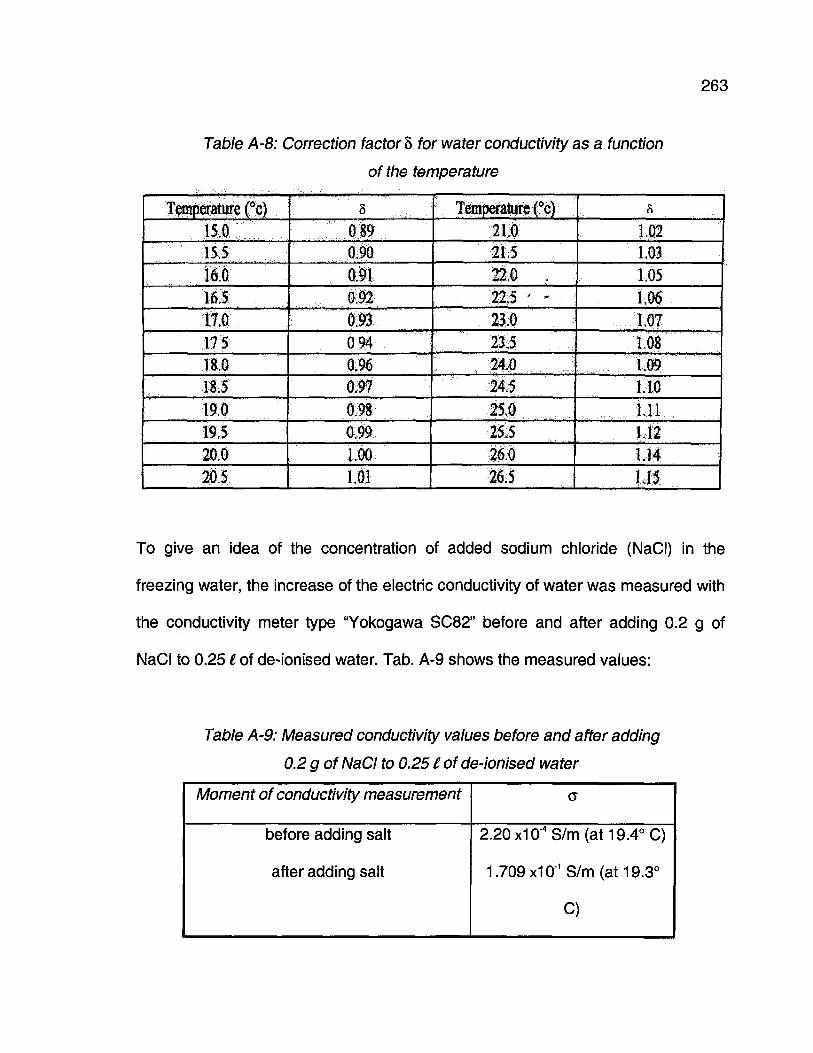
263
Table A-8: Correction factor Ô for water conductivity as a function
of the temperature
Temperature (°c)15.015.5
16.016.5
17.0
17518.018.5
19.0
19.5
20.0
20.5
80890.90
0.91
0.92
0.93
0 94
0.960.97
0.980,99
1.00
1.01
Temperature ( %
21.021.5
22.0 ,22.5 ' -
23.0
23.524.0
24.5
25.0
25.5
26.0
26.5
1.021.03
1.05
1.06
1.07
1.081.09
1.10
1.111.121J41.15
To give an idea of the concentration of added sodium chloride (NaCI) in the
freezing water, the increase of the electric conductivity of water was measured with
the conductivity meter type "Yokogawa SC82" before and after adding 0.2 g of
NaCI to 0.25 £ of de-ionised water. Tab. A-9 shows the measured values:
Table A-9: Measured conductivity values before and after adding
0.2 g of NaCI to 0.25 £ of de-ionised water
Moment of conductivity measurement
before adding salt
after adding salt
(5
2.20 x10"4S/m (at 19.4° C)
1.709 x10"1S/m (at 19.3°
C)
264
APPENDIX 11
NON-LINEAR REGRESSION ANALYSIS OF THE
EFFECT OF FREEZING WATER CONDUCTIVITY
ON CRITICAL BREAKDOWN VOLTAGE
The experimental results give evidence that different regimes for the
breakdown process exist depending on parameters "ice surface condition" and
"electrode distance". On the other hand, the parameter "freezing water
conductivity" does not seem to provoke the change of the regime of the discharge
process, but it influences the velocity for the execution of discharge development.
Therefore, a regression analysis of the effect of freezing water conductivity was
carried out in order to determine the relation between the critical breakdown
voltage and the freezing water conductivity in form of a mathematical equation.
Due to the non-linear characteristic of the results, a regression type "power" was
used.
The experimental values used for the regression analysis are presented in
Tables 4-1 to 4-3. Table A-10a shows the different results for each value of the
265
parameters "ice temperature" and "voltage polarity". In addition, results of
regression analysis based on the average values from the results of both voltage
polarities are presented in Table A-10b for the three different temperature values. It
is interesting to observe the accordance of the results for the two equations based
on mean values for the two temperature values T=-4° C and T=0° C, whereas the
results for a temperature T=-12° C is significantly different. This may be seen as
confirmation of the hypothesis that the discharge process appears in two different
regimes: one for temperatures far below the melting point, were the ice surface
conditions can be identified as "dry", the second for temperatures near and at the
melting point, where a water film exists on the ice surface.
In the case of temperature T=-12° C, the regression type "power" showed
significant deviation from the experimental results for low values. As the results for
the lowest freezing water conductivity (c=2.5 x10'4 S/m) was excluded, a quite good
regression agreement of regression and measurements could be obtained. Table
A-11 finally presents the two retained equations describing the effect of the
freezing water conductivity on the critical breakdown voltage for the two different
discharge regimes. The curves for the different measurements and the two
retained equations are presented in Fig. A-7.
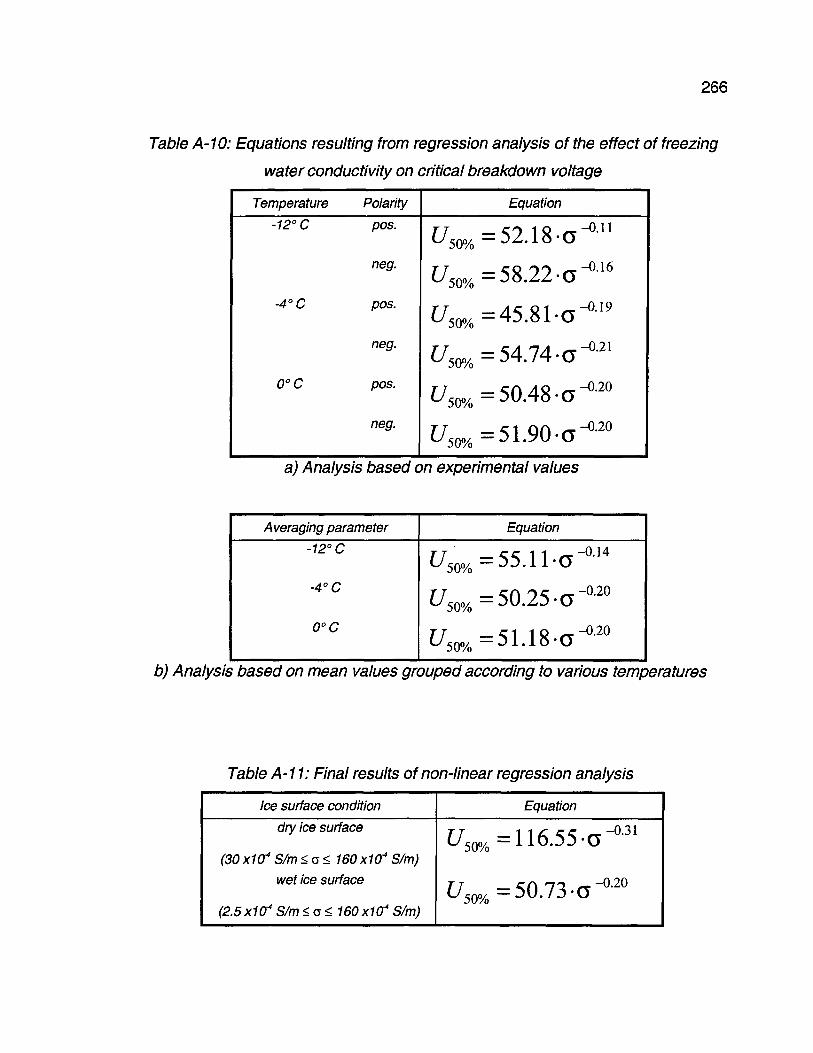
266
Table A-10: Equations resulting from regression analysis of the effect of freezing
water conductivity on critical breakdown voltage
Temperature
-12° C
-4°C
0°C
Polarity
pos.
neg.
pos.
neg.
pos.
neg.
^ 5 0 %
^ 5 0 %
^ 5 0 %
^ 5 0 %
^ 5 0 %
^ 5 0 %
Equation
= 52.18-o
= 58.22-a
= 45.81-o
= 54.74-a
= 50.48-a
= 51.90-o
-0.11
-0.16
-0.19
-0.21
-0.20
-0.20
a) Analysis based on experimental values
Averaging parameter
-12° C
-4°C
0°C
^ 5 0 %
^ 5 0 %
^ 5 0 %
Equation
= 55.
= 50.
= 51.
11-
25
18
a
�o
o
-0.14
-0.20
-0.20
b) Analysis based on mean values grouped according to various temperatures
Table A-11: Final results of non-linear regression analysis
Ice surface condition
dry ice surface
(30X104 S/m<c< 160xKS4 S/m)
wet ice surface
(2.5x10* S/m<G< 160x10* S/m)
Equation
U^a= 116.55 -a -31
t/50%= 50.73-o^-20
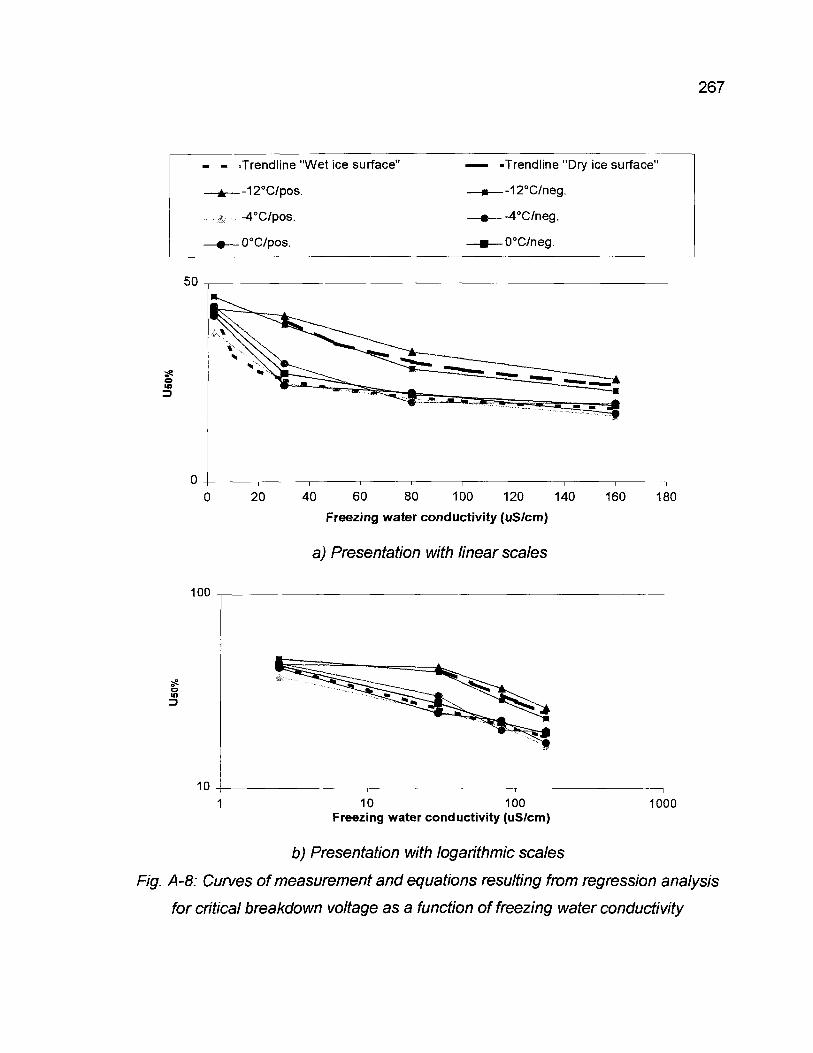
267
- - .Trendline "Wet ice surface"
�±�12°C/pos.
A -4°C/pos.
0 0°C/pos.
-Trendline "Dry ice surface"
-12°C/neg.
--4°C/neg.
-O°C/neg.
50
u>
A A
20 40 60 80 100 120 140
Freezing water conductivity (uS/cm)
a) Presentation with linear scales
160 180
100
3?
S
1010 100
Freezing water conductivity (uS/cm)1000
b) Presentation with logarithmic scales
Fig. A-8: Curves of measurement and equations resulting from regression analysis
for critical breakdown voltage as a function of freezing water conductivity