Embed Size (px)
Citation preview
FACULTY OF ENGINEERING AND SUSTAINABLE DEVELOPMENT
Cooking Fuels in China:
Contaminant Emission and Energy Aspects
Dou Chang
May 2012
Master’s Thesis in Energy Systems
Master program in Energy Systems
Examiner: Mats Sandberg
Supervisor: Magnus Mattsson


i
Acknowledgements
First of all, I would like to express my sincere gratitude to my supervisor, Magnus
Mattsson, for his encouragement and guidance. During my thesis work, he has spent
much time reading through each of my drafts and gave me many professional
suggestions. I am deeply grateful of his help in the completion of this thesis.
I am also greatly indebted to all the teachers for their academic courses and generous
help during my study in Gavle University. Any progress that I have made is the result
of their profound concern and selfless devotion.
I also owe my sincere gratitude to the teachers who have helped me directly and
indirectly, and gave valuable advice and help during my thesis.
Special thanks would go to my friends who kindly gave me a hand during my
questionnaire work.
Dou Chang

ii
iii
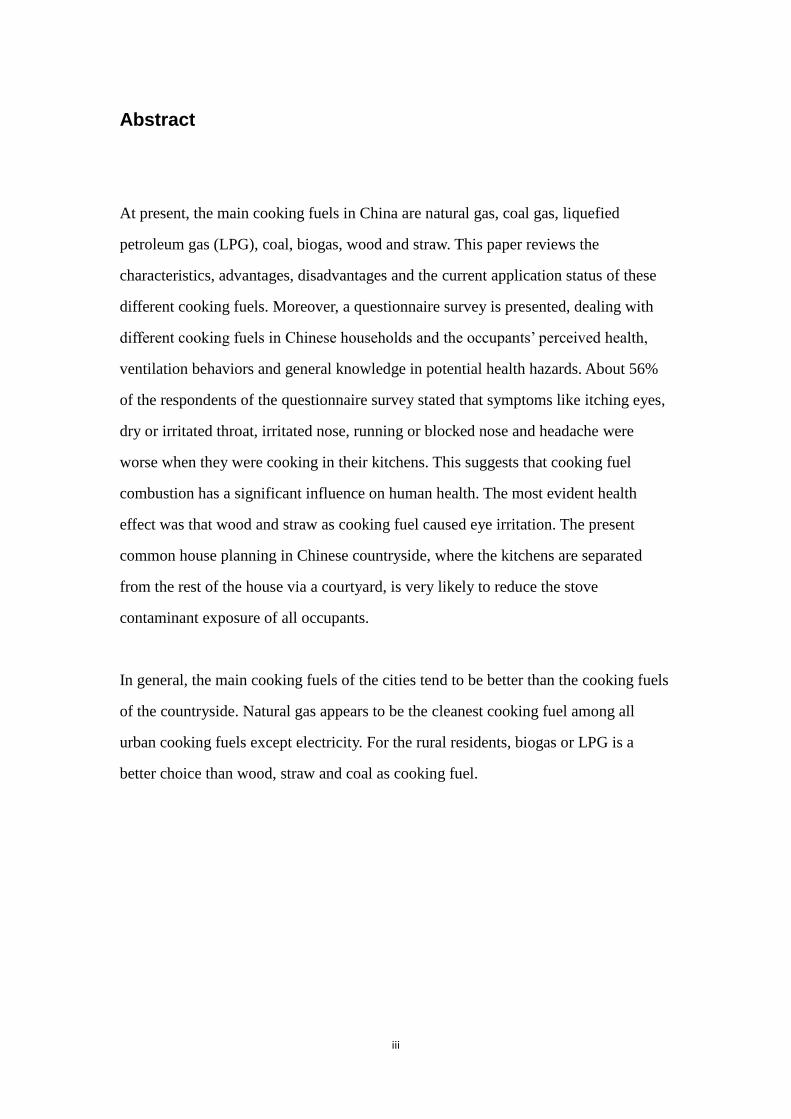
Abstract
At present, the main cooking fuels in China are natural gas, coal gas, liquefied
petroleum gas (LPG), coal, biogas, wood and straw. This paper reviews the
characteristics, advantages, disadvantages and the current application status of these
different cooking fuels. Moreover, a questionnaire survey is presented, dealing with
different cooking fuels in Chinese households and the occupants’ perceived health,
ventilation behaviors and general knowledge in potential health hazards. About 56%
of the respondents of the questionnaire survey stated that symptoms like itching eyes,
dry or irritated throat, irritated nose, running or blocked nose and headache were
worse when they were cooking in their kitchens. This suggests that cooking fuel
combustion has a significant influence on human health. The most evident health
effect was that wood and straw as cooking fuel caused eye irritation. The present
common house planning in Chinese countryside, where the kitchens are separated
from the rest of the house via a courtyard, is very likely to reduce the stove
contaminant exposure of all occupants.
In general, the main cooking fuels of the cities tend to be better than the cooking fuels
of the countryside. Natural gas appears to be the cleanest cooking fuel among all
urban cooking fuels except electricity. For the rural residents, biogas or LPG is a
better choice than wood, straw and coal as cooking fuel.

iv
v
Table of Contents
Acknowledgements ......................................................................................................... i
Abstract ........................................................................................................................ iii
Table of Contents ........................................................................................................... v
1. Introduction ................................................................................................................ 1
2. Review: General characteristics of cooking fuels ...................................................... 3
2.1 Natural Gas ....................................................................................................... 3
2.2 Coal Gas ............................................................................................................ 5
2.3 Coal ................................................................................................................... 6
2.4 Wood and straw ................................................................................................. 7
2.5 Biogas ............................................................................................................... 8
2.6 Liquefied Petroleum Gas (LPG) ..................................................................... 13
3. Review: Airborne pollutions from cooking fuels..................................................... 15
3.1 Comparison of contaminants from rural cooking fuels .................................. 15
3.2 Comparison of contaminants of urban cooking fuels ..................................... 22
3.3 The characteristics of contaminants from cooking fuels combustion and their
effect on human and environment ......................................................................... 26
3.4 The influence of ventilation on contaminant concentration............................ 27
4. Field study: Questionnaire survey ........................................................................... 30
4.1 Method ............................................................................................................ 30
4.2 Results ............................................................................................................. 31
4.2.1 Answers from the person who most often do the cooking of food in the
household ....................................................................................................... 31
4.2.2 Answers regarding a possible child in the household ........................... 44
4.2.3 Answers from a person in the household who usually don’t do the
cooking of food .............................................................................................. 46
4.2.4 Comparison between cooking adult, non-cooking adult and children .. 48
4.2.5 Other field survey data on participating households and their cooking

vi
fuels ................................................................................................................ 49
5. Discussion ................................................................................................................ 51
6. Conclusions .............................................................................................................. 56
7. References ................................................................................................................ 60
Appendix ........................................................................................................................ a

vii
1
1. Introduction
A lot of factors can affect indoor air quality and cause indoor environment pollution.
For example, firstly, outdoor atmospheric pollutants come into the room by
infiltration and ventilation systems. Secondly, furniture, paint and other materials will
release contaminants to the indoor air. Thirdly, contaminants come from cooking fuels
combustion, cigarettes and human [1]. Of these, in many countries the combustion
products of cooking fuels are common and important contaminants related to the
indoor environment and human health. This part of pollutants directly affects people’s
daily life.
At present, in rural China, the main cooking fuels are wood, straw, coal, biogas and
LPG (liquefied petroleum gas). And in the cities of China, natural gas, coal gas and
LPG are the main cooking fuels of households. Lots of researches show that the
contaminants from daily cooking fuels have serious influence on indoor air quality. If
people live in the environment which contains a lot of these kinds of contaminants for
a long time, it may cause many diseases and even lead to death [2] [3] [4] [5]. The
extensive and effective dissemination of this kind of knowledge is very necessary in
China. Choosing a good and suitable cooking fuel is not only beneficial to indoor air
quality and human health, but may also be helpful to reduce the outdoor environment
pollution. Through a literature review and a questionnaire investigation, the aim of
this study is to know more about the contaminants from cooking fuels combustion,
other related characteristics and the current application status of these different kinds
of cooking fuels.
In the sequel, this paper presents two review chapters on general characteristics of
cooking fuels and airborne pollutions from cooking fuels, and then describes a

2
questionnaire survey in the field.
3
2. Review: General characteristics of cooking fuels
2.1 Natural Gas
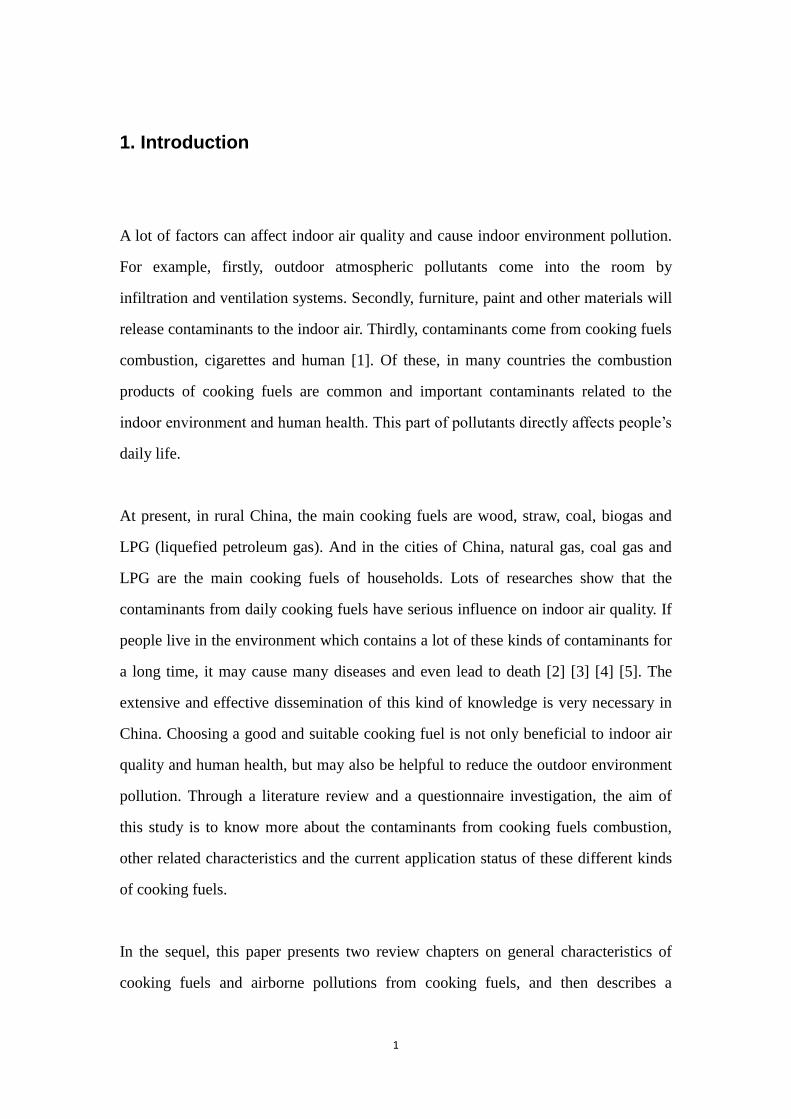
Natural gas is a kind of fossil fuel in the gaseous state consisting primarily of methane,
ethane as well as small amounts of impurities such as carbon dioxide. The table below
shows the typical composition of natural gas before it is refined [9].
Table 1. Composition of natural gas [9].
Before the natural gas is used as a fuel, it must undergo a purification process to clean
and remove impurities such as propane, butane and hydrogen sulfide. The natural gas
which is delivered to a residence is almost pure methane. Because natural gas is
colorless, shapeless, and odorless in its pure form, so before it is transmitted to
household users, mercaptan is added to the gas and makes a rotten egg smell to it.
This odor can aid leak detection.
In addition, natural gas is also one of the safest fuel gases, not containing carbon
monoxide, and it is lighter than air. Hence it will diffuse upward immediately when
there is a leakage, so it is hard to accumulate and form a kind of explosive gas.
4
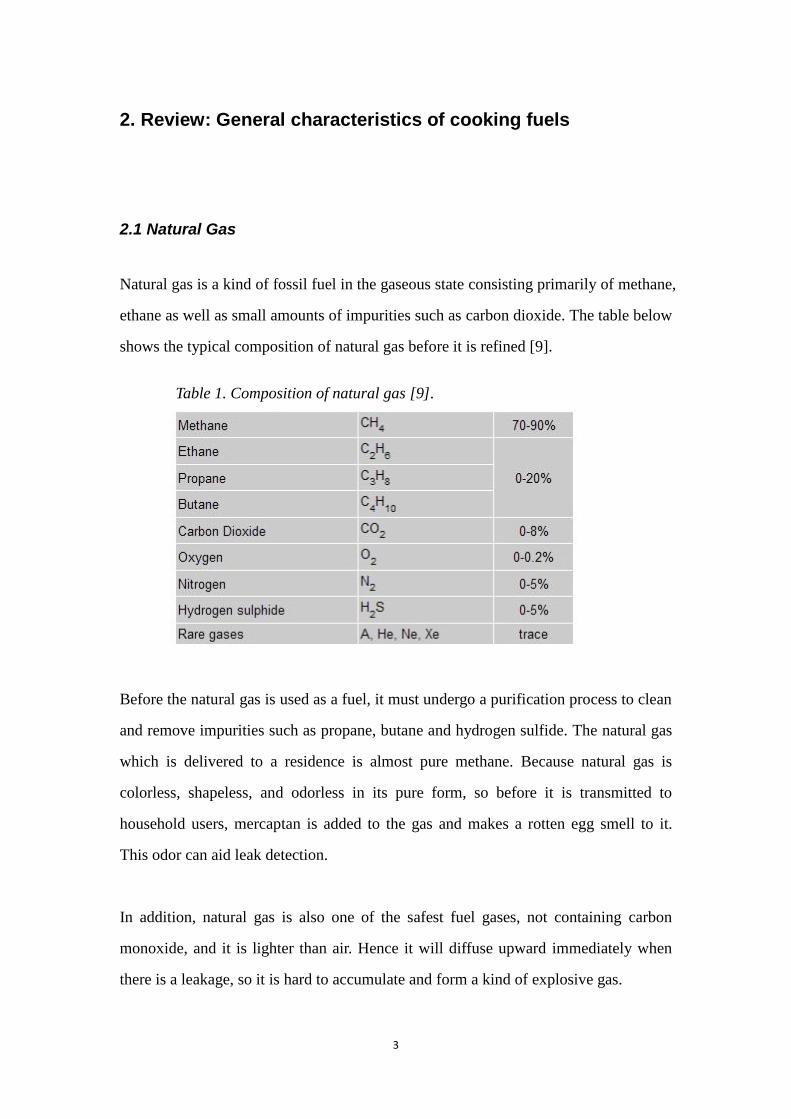
Natural gas mainly exists in oil field gas, gas field gas, coal bed gas, mud volcano gas
and biogenetic gas. It also can be divided into associated gas and non-associated gas.
Fig. 1. Proved natural gas reserves [10].
There is an abundance of natural gas in the world. It is widely used as domestic fuel,
industrial fuel, chemical fuel and so forth.
In China, amount of total natural gas resource is about 38 trillion cubic meters, and
the proven recoverable reserve is about 14 trillion cubic meters [11]. The continental
natural gas resources accounts for 79% of the total. It is mainly distributed in western
and central China. But in the rest of China, there are also some large natural gas fields.
The government has built a lot of natural gas pipeline and distribution network. China
has large scale used natural gas in electricity generation, chemical engineering, fuel
gas and other areas.
Natural gas is the cleanest of all the fossil fuels [9]. Compared with coal and oil, there
is a lower level of potentially harmful byproducts and little contaminations which can
affect respiratory system of human when the natural gas is burning. The contaminants
from different fuels burning are shown in table 2. Coal and oil consist of much more
complex molecules, with a higher carbon ratio and higher nitrogen and sulfur contents.
5
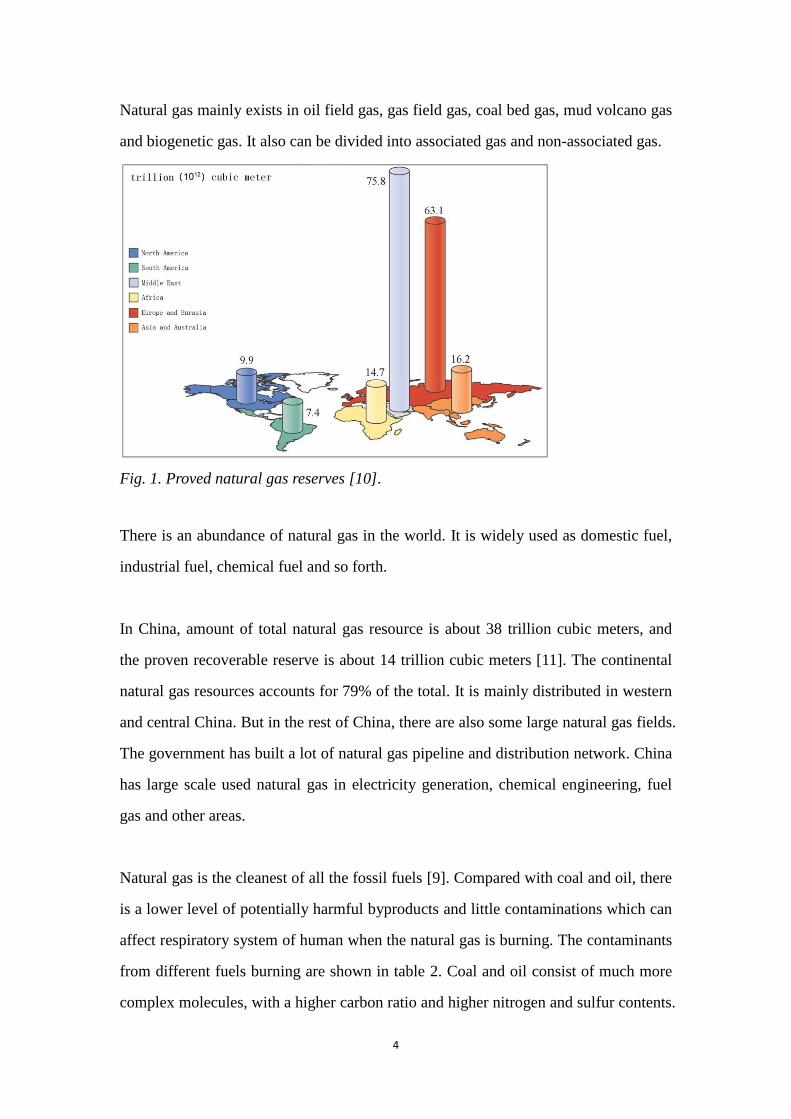
They release higher levels of harmful emissions, such as NOx, SO2 and a higher ratio
of carbon emissions when burning (Table 2). Meanwhile, a lot of ash particles are
released into the environment from coal and fuel oil. Natural gas is composed
primarily of methane. The main products of the combustion of natural gas are carbon
dioxide and water vapor, the same compounds we exhale when we breathe. The
combustion of natural gas releases little sulfur dioxide and nitrogen oxides, no ash or
particulate matter, and lower levels of CO and other reactive hydrocarbons. At the
same time, due to the clean characteristic, it will prolong the service life of stoves and
will be benefit to reduce the maintenance costs.
Table 2. Contaminants from fossil fuels during combustion [9].
In order to reduce pollution and maintain a clean and healthy environment, natural gas
is an extremely important source of energy. Being a domestically abundant, clean and
secure source of energy, natural gas offers a number of environmental benefits over
other fossil fuels.
2.2 Coal Gas
Coal gas is a kind of gas fuel consisting of multiple combustible components [12].
Generally it can be classified into two categories: natural or manufactured gas.
According to the calorific value, coal gas can be divided into high calorific value gas,
middle calorific value gas and low calorific value gas. Based on the medium, coal gas
6
can be classified into air gas, water gas and semi water gas. Coal gas also can be
divided into producer gas, blast furnace gas and coke-oven gas according to the type
of gasifier.
In most parts of China, especially in cities, coal gas is one of the most common
cooking fuels for households. The main combustible component of coal gas is CO
alkane, olefin, aromatic hydrocarbon and H2. CO is a colorless, odorless, poisonous
gas. If there is a leakage and CO releases into indoor environment, it may cause CO
poisoning of humans. The main combustion product is CO2. Huge quantities of
carbon dioxide are produced by coal gas combustion, and it aggravates the
greenhouse effect.
2.3 Coal
In China, the energy structure is rich in coal. Coal plays an important role in the
energy component and utilization. The proved directly usable coal reserve in China is
about 1.89*1011
tons and the average reserve per capita is 145 tons. The coal resource
proved in China account for 33.8% of the world total.
In China, the coal consumption was 20*108
tons in 2007. It is predicted that in 2020,
the coal consumption will be more than 62*108
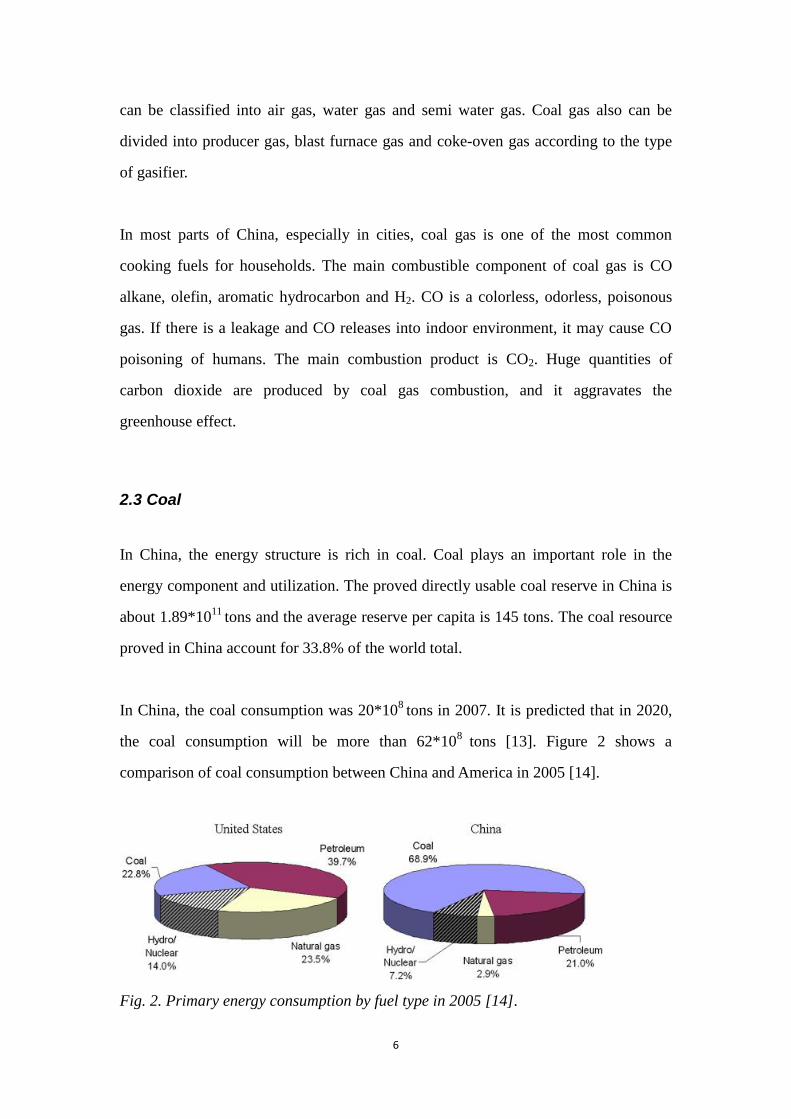
tons [13]. Figure 2 shows a
comparison of coal consumption between China and America in 2005 [14].
Fig. 2. Primary energy consumption by fuel type in 2005 [14].
7
As shown in this Figure, in 2005, the coal consumption accounted for only 22.8% of
the total energy in the USA. Japan, France, and several other developed countries had
similar conditions. But in China, the energy relied on coal. The proportion was about
68.9%.
So the greatest atmospheric pollution source in China is coal combustion [15]. The
combustion products of coal mainly include CO, CO2, SOx, NOx, benzopyrene,
aldehydes [16], metallic oxide, non- metallic oxide and suspended solid particles. Of
these, benzopyrene, aldehydes, metallic oxide and non- metallic oxide are great toxic
and danger to human health [5]. The total emission amounts of SO2 in China are
23.46 million tons in 1997, which is the first place in the world. The NOx emission
takes about 10.1% and CO2 takes 9.6% in the world. About 87% of SO2, 71% of CO2,
67% of NOx and 60% of dusts in all kinds of emission sources in China are from coal
combustion.
It is easy to see from the above data that coal is widely used in China. Although large
numbers of contaminants are produced by coal combustion, people still use coal for
cooking in some parts of rural China. Because China is rich is coal resource, and the
price is relatively cheap.
2.4 Wood and straw
From ancient times to now, firewood is a necessary and important material in
production and life of China [17]. A Chinese proverb is “Firewood, rice, oil, salt, soy,
vinegar and tea begin a day.” Chinese put firewood in the first place. People have
attached great importance to firewood.
In some remote rural parts of China, residents use wood for cooking, because in the
vast rural areas of China there is lack of construction of natural gas and coal gas
8
pipelines. But direct combustion wood will cause serious environmental degradation
problems such as indoor air pollution, deforestation, and superfluous emissions of
greenhouse gas (GHG) [18] [19]. In recent several hundred years, the forest resources
have suffered serious devastation.
China is an agricultural big country, and there are a large number of agricultural
wastes every year. The production of crop straw was about 6.91*108
tons in 2004 [20].
As a consequence, in recent years many people who live in countryside prefer to use
straw as their cooking fuel.
The main combustion products of wood and straw are CO2, CO, CH4, SO2, NOx, NH3.
In particular, large numbers of particulate matters such as PM10, PM2.5 are produced
during wood and straw combustion [21] [22]. It can irritate eyes and has harmful
effects on respiratory system [23].
2.5 Biogas
Biogas is a kind of combustible gas which is formed by microbial fermentation when
organic substances are under anaerobic condition [24]. Biogas can be obtained from
straw, stalk, human waste, livestock manure, organic wastes, etc. Its main
composition is methane (CH4), about 50%-70% of total volume, and then about
25%-45% of biogas is carbon dioxide (CO2). In addition, there are a little nitrogen
(N2), hydrogen (H2), oxygen (O2), ammonia (NH3), carbon monoxide (CO), and
hydrogen sulfide (H2S). The main combustion products of biogas are CO2, nitrogen
oxides such as NO, NO2 and small amounts of SO2. CO will also be produced when
incomplete combustion.
In many parts of rural China, wood, straw and stalk are the primary energy sources for
daily cooking [25] [26]. Large quantities of biomass energy are wasted because of low
9
utilization efficiency through incomplete combustion in the fire stoves [27]. Biogas is
a clean, efficient, and renewable source of energy. Production and utilization of biogas
in the countryside can not only effectively reduce the per capita fuel consumption in
rural families by replacing partly wood, straw, and coal[28] [29], then solve the
problem of energy shortage, but also the most important objective is to improve the
problem of environmental pollution such as greenhouse effect.
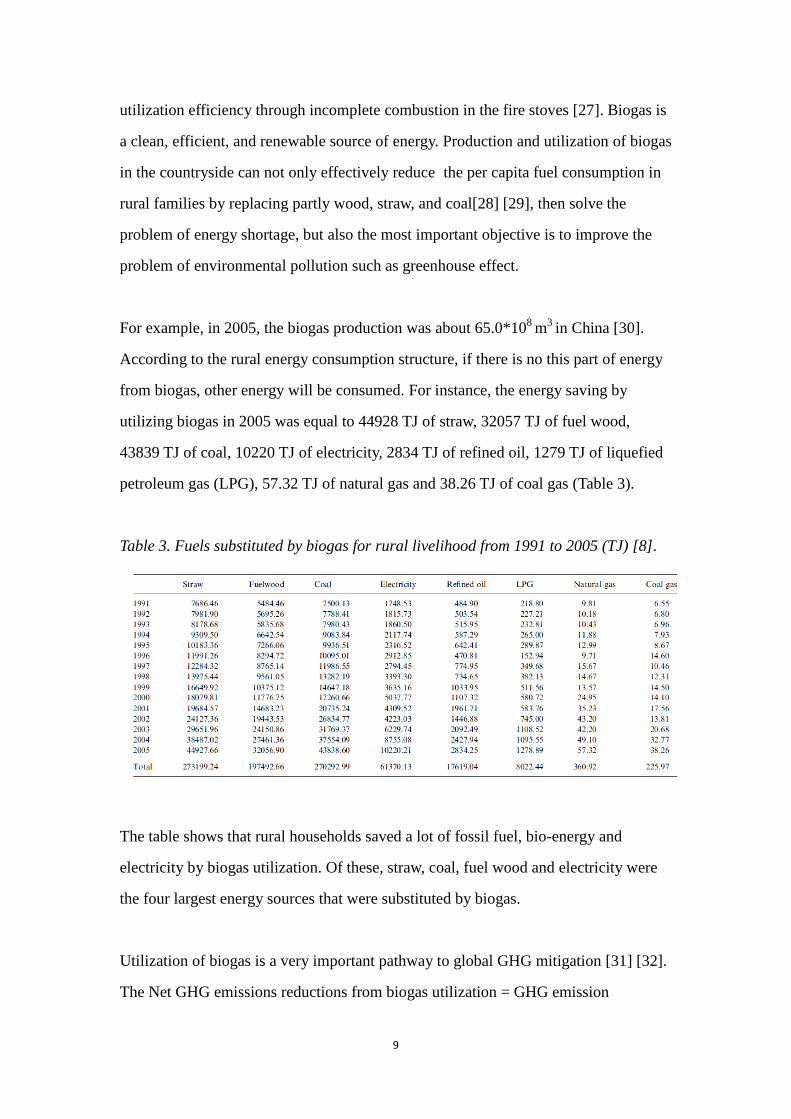
For example, in 2005, the biogas production was about 65.0*108
m3
in China [30].
According to the rural energy consumption structure, if there is no this part of energy
from biogas, other energy will be consumed. For instance, the energy saving by
utilizing biogas in 2005 was equal to 44928 TJ of straw, 32057 TJ of fuel wood,
43839 TJ of coal, 10220 TJ of electricity, 2834 TJ of refined oil, 1279 TJ of liquefied
petroleum gas (LPG), 57.32 TJ of natural gas and 38.26 TJ of coal gas (Table 3).
Table 3. Fuels substituted by biogas for rural livelihood from 1991 to 2005 (TJ) [8].
The table shows that rural households saved a lot of fossil fuel, bio-energy and
electricity by biogas utilization. Of these, straw, coal, fuel wood and electricity were
the four largest energy sources that were substituted by biogas.
Utilization of biogas is a very important pathway to global GHG mitigation [31] [32].
The Net GHG emissions reductions from biogas utilization = GHG emission
10
reduction by energy substitution (ERES) + GHG emission reduction from manure
management (ERMM) - GHG emissions from combustion (EBC)
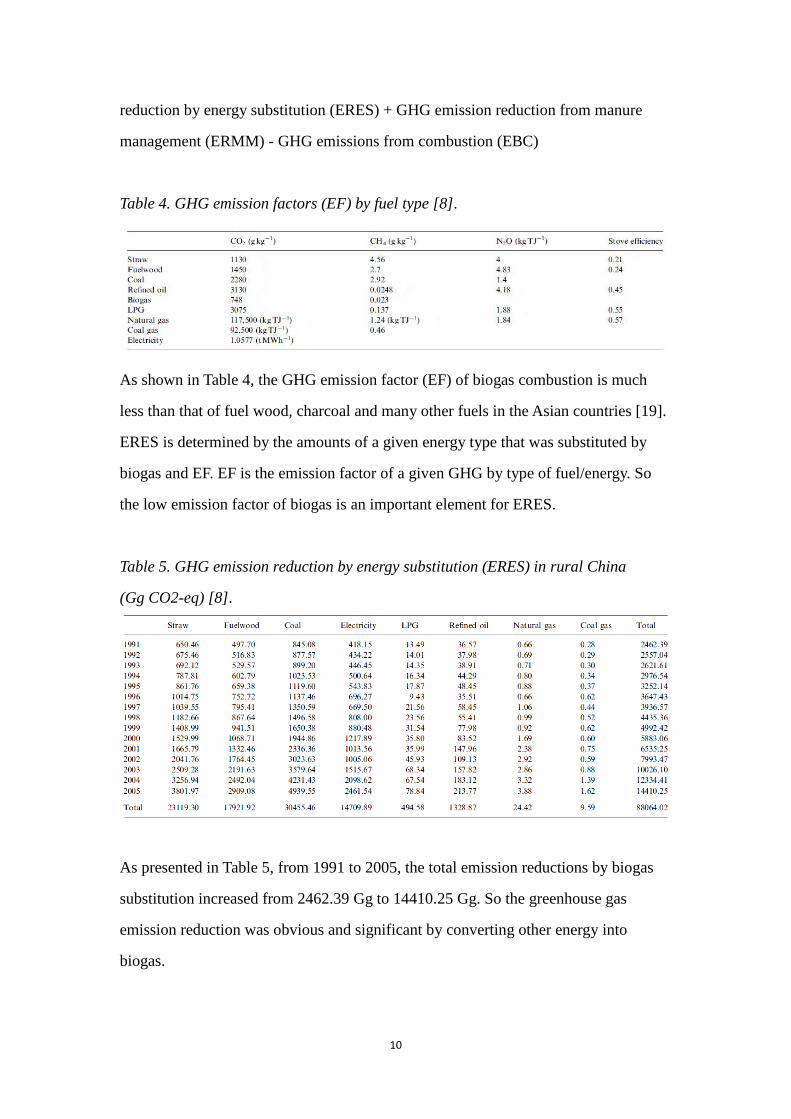
Table 4. GHG emission factors (EF) by fuel type [8].
As shown in Table 4, the GHG emission factor (EF) of biogas combustion is much
less than that of fuel wood, charcoal and many other fuels in the Asian countries [19].
ERES is determined by the amounts of a given energy type that was substituted by
biogas and EF. EF is the emission factor of a given GHG by type of fuel/energy. So
the low emission factor of biogas is an important element for ERES.
Table 5. GHG emission reduction by energy substitution (ERES) in rural China
(Gg CO2-eq) [8].
As presented in Table 5, from 1991 to 2005, the total emission reductions by biogas
substitution increased from 2462.39 Gg to 14410.25 Gg. So the greenhouse gas
emission reduction was obvious and significant by converting other energy into
biogas.
11
ERMM is determined by the management of manure and the emission factor of a
given GHG by type of fuel/energy (EF). A good manure management is a significant
method for mitigating GHGs. Human waste and livestock manure are centralized
management and treated anaerobic digestion in family-size biogas tanks to produce
biogas, so that greenhouse gas emission especially methane emission can be reduced
or avoided [33].
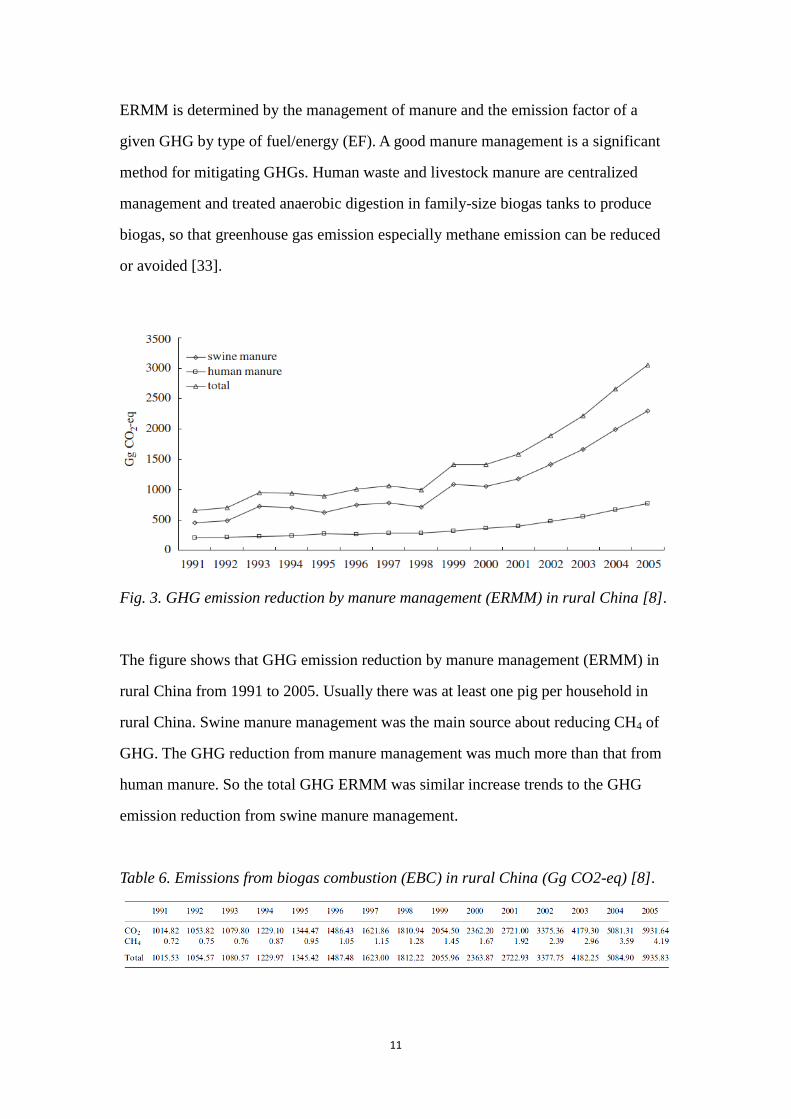
Fig. 3. GHG emission reduction by manure management (ERMM) in rural China [8].
The figure shows that GHG emission reduction by manure management (ERMM) in
rural China from 1991 to 2005. Usually there was at least one pig per household in
rural China. Swine manure management was the main source about reducing CH4 of
GHG. The GHG reduction from manure management was much more than that from
human manure. So the total GHG ERMM was similar increase trends to the GHG
emission reduction from swine manure management.
Table 6. Emissions from biogas combustion (EBC) in rural China (Gg CO2-eq) [8].
12
As can be seen in Table 6, CO2 accounted for most of the EBC, and the proportion of
CH4 emission of the total EBC was relatively low.
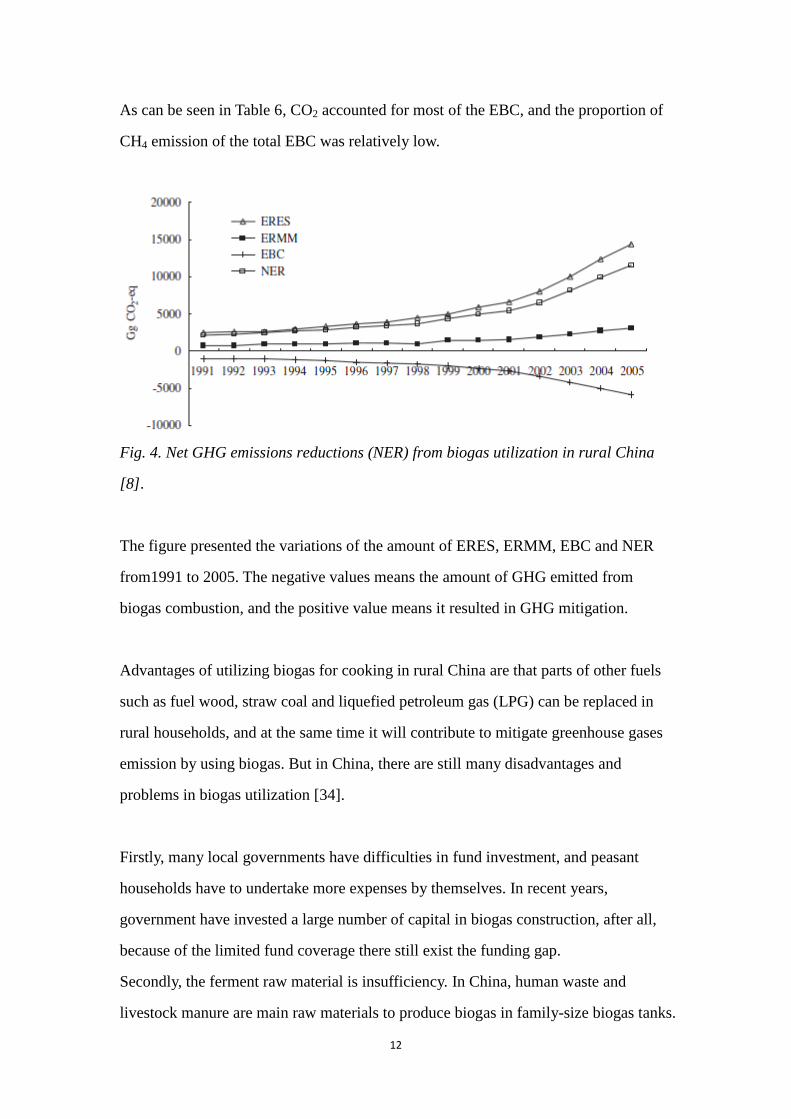
Fig. 4. Net GHG emissions reductions (NER) from biogas utilization in rural China
[8].
The figure presented the variations of the amount of ERES, ERMM, EBC and NER
from1991 to 2005. The negative values means the amount of GHG emitted from
biogas combustion, and the positive value means it resulted in GHG mitigation.
Advantages of utilizing biogas for cooking in rural China are that parts of other fuels
such as fuel wood, straw coal and liquefied petroleum gas (LPG) can be replaced in
rural households, and at the same time it will contribute to mitigate greenhouse gases
emission by using biogas. But in China, there are still many disadvantages and
problems in biogas utilization [34].
Firstly, many local governments have difficulties in fund investment, and peasant
households have to undertake more expenses by themselves. In recent years,
government have invested a large number of capital in biogas construction, after all,
because of the limited fund coverage there still exist the funding gap.
Secondly, the ferment raw material is insufficiency. In China, human waste and
livestock manure are main raw materials to produce biogas in family-size biogas tanks.
13
For one peasant household, it is difficult to meet the need of biogas production by
their own waste and livestock manure. Usually they have to go to another village to
buy swine manure or cattle dung. Virtually it will reduce the production benefit of
biogas tank. Thirdly, there is a shortage of rural laborers. The whole process of biogas
production needs a lot of labor. Currently, in many parts of rural China, most young
adults of go out to work, and woman and old people stay in the countryside. The ratio
of labor force shifting in rural China is more than 80 percent. So the biogas utilization
is severely affected by the shortage of labor force and their relatively low standard of
culture. In addition, neglected management, lagging follow-up service, low
comprehensive energy utilization efficiency add to the present problems in biogas
utilization.
2.6 Liquefied Petroleum Gas (LPG)
Liquefied petroleum gas (LPG) is a kind of by-product from catalytic cracking and
thermal cracking of crude oil in refineries [35]. The main components of catalytic
cracking are hydrogen (5%-6%), methane (10%), ethane (3%-5%), ethylene (3%),
propane (16%-20%), propylene (6%-11%), butane (42%-46%), butene (5%-6%), and
hydrocarbon with more than five carbon atoms (5%-12%). The essential compositions
of thermal cracking are hydrogen (12%), methane (5%-7%), ethane (5%-7%),
ethylene (16%-18%), propane (0.5%), propylene (7%-8%), butane (0.2%), butene
(4%-5%), and hydrocarbon with more than five carbon atoms (2%-3%). These
hydrocarbons are easy to liquefy. The volume of the LPG is only 1/250-1/33 of the
original volume after been liquefied. Then it is stored in high pressure resistant steel
bottles.
Liquefied petroleum gas is widely used in nonferrous metal smelting, car fuel,
chemical material, and many other areas [35]. In civil fields, many households who do
not have pipeline coal gas or natural gas in their residential districts use liquefied
14
petroleum gas for cooking. They have liquefied petroleum gas tanks in their houses.
When using it, people just screw off the valve of the liquefied petroleum gas tank, and
then flammable hydrocarbon gas will go into burner by pipeline. When the LPG is
finished, the empty tank is exchanged for a new one at a LPG supply station. The
main contaminants from LPG combustion are NOx and CO [36]. There is no dust after
combustion. It is quite convenient for users, but there are some hidden problems. If
the gas leaks from the pipe or a leaking valve, the inflammable gas will spread to
rooms. When the gas concentration reaches the explosive limits and contacts open
flame or electric spark, it will cause explosion.
15
3. Review: Airborne pollutions from cooking fuels
As has been mentioned above, in rural China the main cooking fuels are wood, straw,
coal, biogas and LPG, whereas in the cities of China it is natural gas, coal gas and
LPG. In the sequel, cooking fuel pollutions are compared respectively regarding rural
cooking fuels and urban cooking fuels.
3.1 Comparison of contaminants from rural cooking fuels
The coal combustion is one of the main sources of rural indoor air pollution. It is
harmful to human body and environment. An investigation [7] shows that in 2000,
Disability-adjusted life Year (DALYs) caused by the smoke which comes from indoor
burning solid fuels rank 6th in all DALYs on a global scale. About 80% of rural
household energy comes from bio-fuel, whereas 10% comes from coal. With the
improvement of living standards of rural people, more and more rural households
abandon the use of some fuels with low heat energy such as wood and straw, and
choose coal or liquefied petroleum gas (LPG) as their cooking fuels. At the same time,
in recent years, China carries out biogas construction, so some rural areas are now
using biogas.
One very relevant experimental study, [7], was performed in the rural area of the north
of Anhui province, investigating the influence of daily fuels (biogas, straw, coal and
liquefied petroleum gas) on the levels of SO2, NO2 and CO of indoor air. Twenty
households with completely separated kitchens were chosen as the objects. And the
house structure, size, ventilation and stoves of these households were very similar.
They used biogas, straw, coal, LPG as the daily fuel respectively. The amount of
households of each kind of fuel was 5. The plan of the studied houses is shown in the
following illustration. This is a typical house plan on Chinese countryside.
16
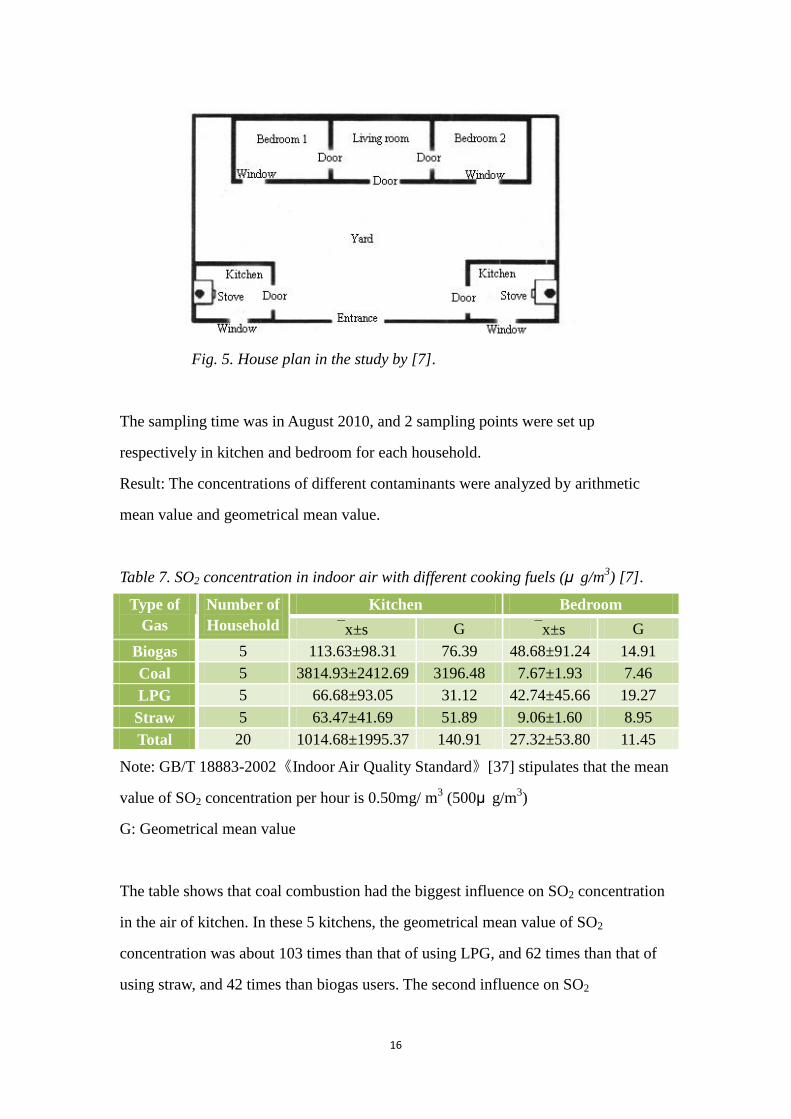
Fig. 5. House plan in the study by [7].
The sampling time was in August 2010, and 2 sampling points were set up
respectively in kitchen and bedroom for each household.
Result: The concentrations of different contaminants were analyzed by arithmetic
mean value and geometrical mean value.
Table 7. SO2 concentration in indoor air with different cooking fuels (μ g/m3) [7].
Type of
Gas
Number of
Household
Kitchen Bedroom
x±s G x±s G
Biogas 5 113.63±98.31 76.39 48.68±91.24 14.91
Coal 5 3814.93±2412.69 3196.48 7.67±1.93 7.46
LPG 5 66.68±93.05 31.12 42.74±45.66 19.27
Straw 5 63.47±41.69 51.89 9.06±1.60 8.95
Total 20 1014.68±1995.37 140.91 27.32±53.80 11.45
Note: GB/T 18883-2002《Indoor Air Quality Standard》[37] stipulates that the mean
value of SO2 concentration per hour is 0.50mg/ m3 (500μ g/m
3)
G: Geometrical mean value
The table shows that coal combustion had the biggest influence on SO2 concentration
in the air of kitchen. In these 5 kitchens, the geometrical mean value of SO2
concentration was about 103 times than that of using LPG, and 62 times than that of
using straw, and 42 times than biogas users. The second influence on SO2
17
concentration was biogas. The SO2 concentration with this kind of fuel was 2.5 times
than that of using LPG, and 1.5 times than straw users. As a whole, the SO2
concentrations in bedroom were much lower than those in kitchen. The value of SO2
concentration from LPG combustion was the highest, followed by biogas, straw and
coal.
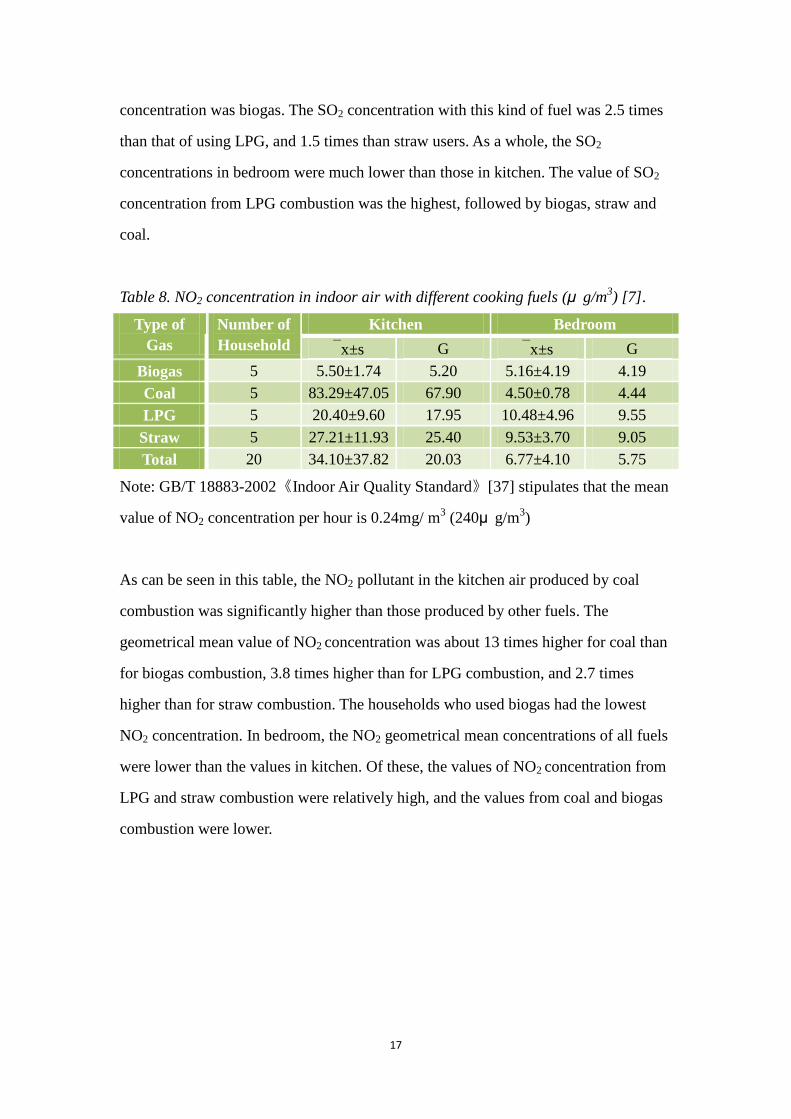
Table 8. NO2 concentration in indoor air with different cooking fuels (μ g/m3) [7].
Type of
Gas
Number of
Household
Kitchen Bedroom
x±s G x±s G
Biogas 5 5.50±1.74 5.20 5.16±4.19 4.19
Coal 5 83.29±47.05 67.90 4.50±0.78 4.44
LPG 5 20.40±9.60 17.95 10.48±4.96 9.55
Straw 5 27.21±11.93 25.40 9.53±3.70 9.05
Total 20 34.10±37.82 20.03 6.77±4.10 5.75
Note: GB/T 18883-2002《Indoor Air Quality Standard》[37] stipulates that the mean
value of NO2 concentration per hour is 0.24mg/ m3 (240μ g/m
3)
As can be seen in this table, the NO2 pollutant in the kitchen air produced by coal
combustion was significantly higher than those produced by other fuels. The
geometrical mean value of NO2 concentration was about 13 times higher for coal than
for biogas combustion, 3.8 times higher than for LPG combustion, and 2.7 times
higher than for straw combustion. The households who used biogas had the lowest
NO2 concentration. In bedroom, the NO2 geometrical mean concentrations of all fuels
were lower than the values in kitchen. Of these, the values of NO2 concentration from
LPG and straw combustion were relatively high, and the values from coal and biogas
combustion were lower.
18
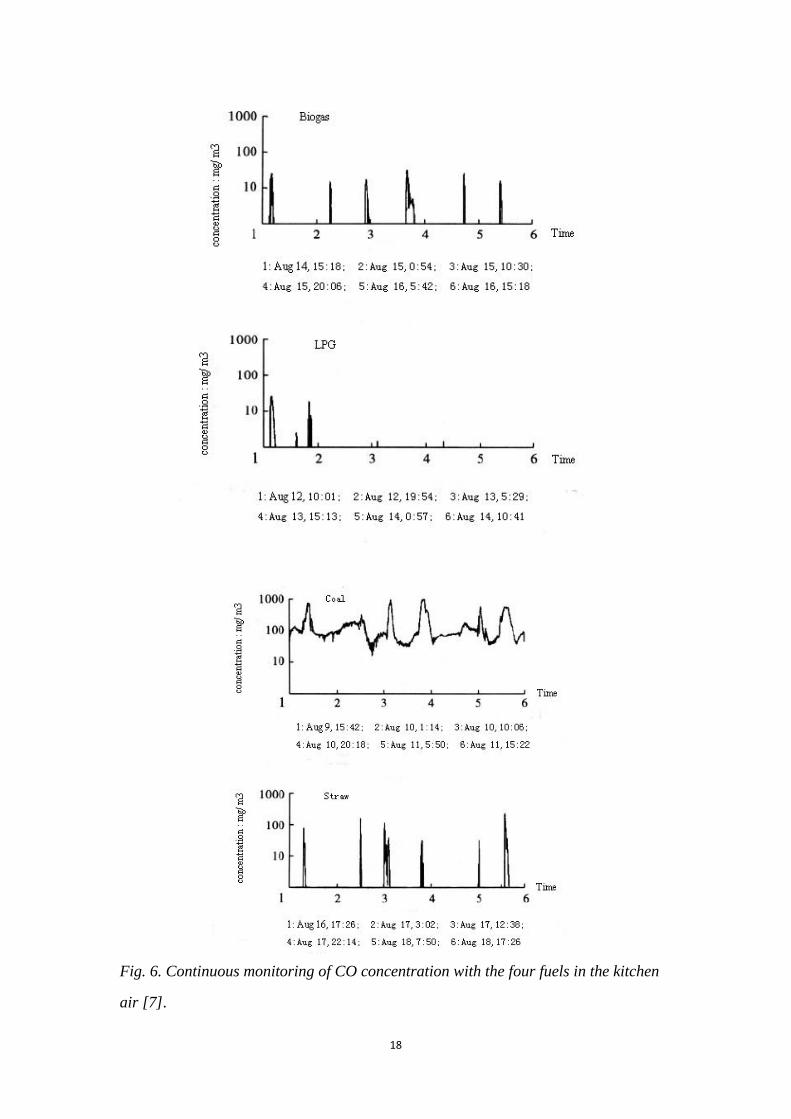
Fig. 6. Continuous monitoring of CO concentration with the four fuels in the kitchen
air [7].
19
As shown in these curves, there were 6 peak values about the CO concentrations for
each kind of fuels in the testing 48h. Most of them exceeded the standard (the mean
value per hour is 10mg/ m3) of GB/T 18883-2002《Indoor Air Quality Standard》[37].
Contrasting the cooking time of household, it was found that the peak values appeared
in the cooking time, so the CO concentration in kitchen was effected by cooking fuel.
At the same time, there was no curve of CO concentration in bedroom. So the
combustion of cooking fuel has no influence on CO concentration change of
bedroom.
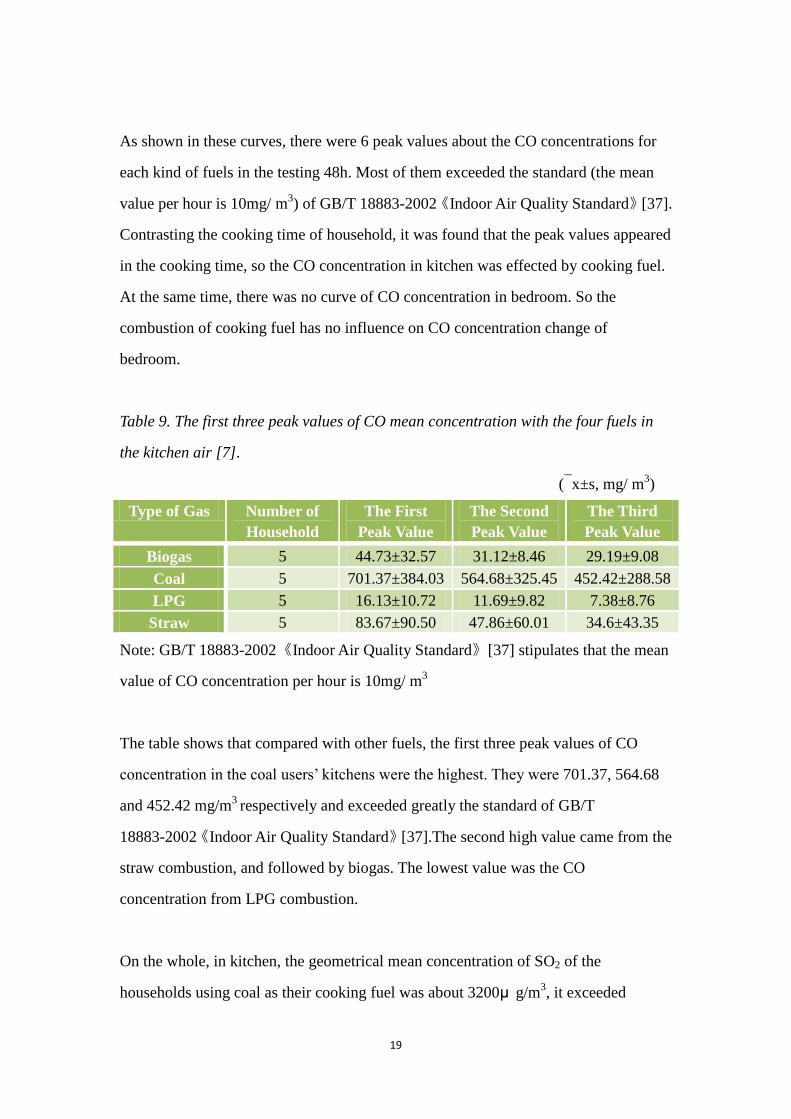
Table 9. The first three peak values of CO mean concentration with the four fuels in
the kitchen air [7].
(x±s, mg/ m3)
Type of Gas Number of
Household
The First
Peak Value
The Second
Peak Value
The Third
Peak Value
Biogas 5 44.73±32.57 31.12±8.46 29.19±9.08
Coal 5 701.37±384.03 564.68±325.45 452.42±288.58
LPG 5 16.13±10.72 11.69±9.82 7.38±8.76
Straw 5 83.67±90.50 47.86±60.01 34.6±43.35
Note: GB/T 18883-2002《Indoor Air Quality Standard》[37] stipulates that the mean
value of CO concentration per hour is 10mg/ m3
The table shows that compared with other fuels, the first three peak values of CO
concentration in the coal users’ kitchens were the highest. They were 701.37, 564.68
and 452.42 mg/m3
respectively and exceeded greatly the standard of GB/T
18883-2002《Indoor Air Quality Standard》[37].The second high value came from the
straw combustion, and followed by biogas. The lowest value was the CO
concentration from LPG combustion.
On the whole, in kitchen, the geometrical mean concentration of SO2 of the
households using coal as their cooking fuel was about 3200μ g/m3, it exceeded
20
greatly the standard (the mean value per hour is 500μ g/m3) of GB/T 18883-2002
《Indoor Air Quality Standard》.The values of other three fuels did not exceed the
standard. Among these, the concentration of LPG was the lowest. About NO2, the
geometrical mean concentrations about these four fuels not exceeded the standard (the
mean value per hour is 240μ g/m3) of GB/T 18883-2002《Indoor Air Quality
Standard》. The geometrical mean value of NO2 concentration by burning coal was
significantly higher than other fuels. The value of biogas users was the lowest.
Some researches suggested that exposing to SO2 of the mean concentration per year
over 50-75μ g/m3
with a long time, the respiratory symptoms of children may worsen.
It also can cause a certain degree of damage to lung. In this study, the geometrical
mean of SO2 concentration was about 67.90μ g/m3, so if these households used coal
as their long term cooking fuels, it would be harmful to the people health, especially
for children. About CO, almost all the first three peak values about the CO
concentration of these four fuels were over the standard (the mean value per hour is
10mg/m3) of GB/T 18883-2002《Indoor Air Quality Standard》. The averages of the
first three peak concentrations of the coal users were the highest among other fuels.
Of which, the concentration of LPG was the lowest.
The above experiment showed clearly the difference of contaminants’ concentrations
of the four main rural cooking fuels. There were also another two experiments to
compare coal with LPG, and coal with wood respectively.
①Six household users of liquefied petroleum gas (LPG) and six household users of
coal were randomly chosen as subjects of this study in Yinchuan, China [38]. The
residence structures of these 12 households are basically the same. In the center of
bedroom and kitchen of each household, two sample points were selected respectively.
This experiment was made in three successive days of December. The sampling times
were before cooking fuel burning and after 10min of extinguishing.
21
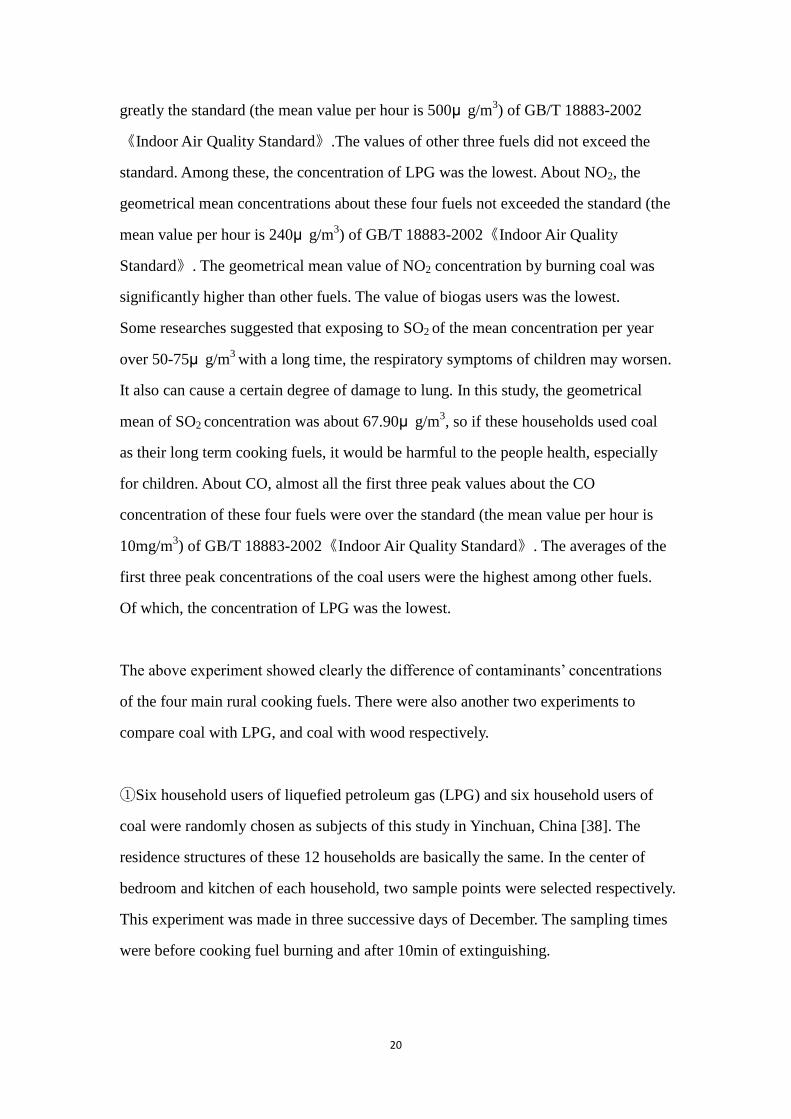
Table 10. Indoor average contaminant concentration of coal and LPG[38].
Contaminant Outdoor
Concentration
(mg/m3)
Household of Coal
(mg/m3)
Household of LPG
(mg/m3)
n x n x n x
IP 18 0.789 18 0.853 18 0.372
NOx 18 0.048 18 0.157 18 0.154
SO2 18 0.054 18 0.394 18 0.067
Table 10 shows that these three contaminants concentrations from coal combustion
were higher than those from liquefied petroleum gas.
②Four household users of wood and five household users of coal were randomly
chosen as subjects of this study in Hengshan, China, investigating the influence of
these fuels on the levels of SO2, NO2, CO2 and CO of kitchen air [23].
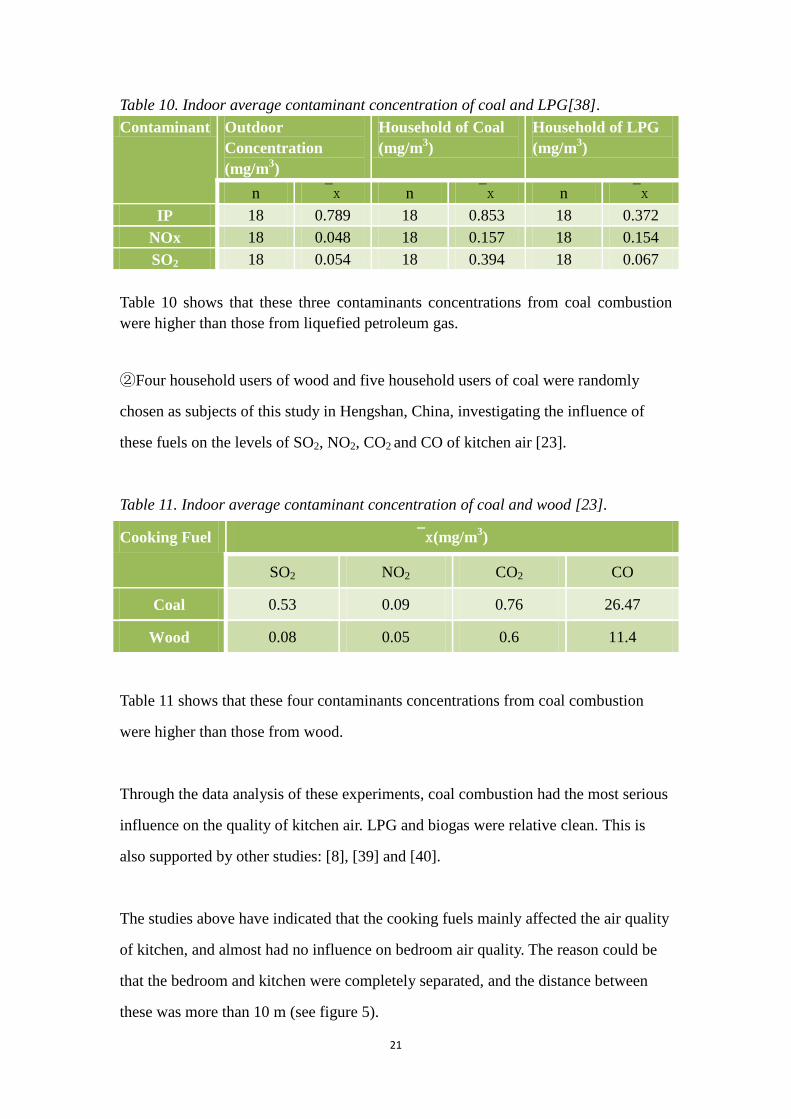
Table 11. Indoor average contaminant concentration of coal and wood [23].
Cooking Fuel x(mg/m3)
SO2 NO2 CO2 CO
Coal 0.53 0.09 0.76 26.47
Wood 0.08 0.05 0.6 11.4
Table 11 shows that these four contaminants concentrations from coal combustion
were higher than those from wood.
Through the data analysis of these experiments, coal combustion had the most serious
influence on the quality of kitchen air. LPG and biogas were relative clean. This is
also supported by other studies: [8], [39] and [40].
The studies above have indicated that the cooking fuels mainly affected the air quality
of kitchen, and almost had no influence on bedroom air quality. The reason could be
that the bedroom and kitchen were completely separated, and the distance between
these was more than 10 m (see figure 5).
22
In recent years, more and more rural households abandon to use straw and choose
coal and liquefied petroleum gas (LPG) as their cooking fuels [7]. But indoor air
pollutant in the kitchen air produced by coal combustion is very serious. Therefore,
some relatively clean fuels such as LPG or biogas should be promoted in rural areas
of China. Moreover, the housing planning with a separate kitchen will reduce the
effect on bedroom from fuel combustion, and then reduce the harm to human health.
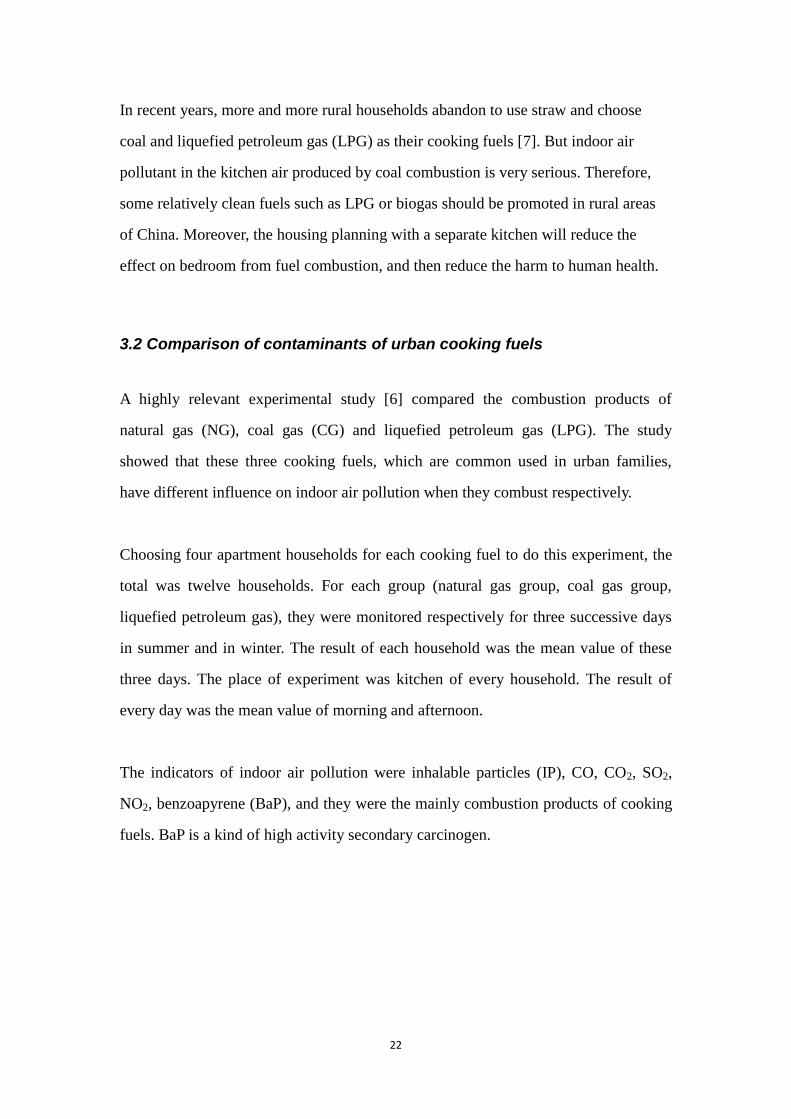
3.2 Comparison of contaminants of urban cooking fuels
A highly relevant experimental study [6] compared the combustion products of
natural gas (NG), coal gas (CG) and liquefied petroleum gas (LPG). The study
showed that these three cooking fuels, which are common used in urban families,
have different influence on indoor air pollution when they combust respectively.
Choosing four apartment households for each cooking fuel to do this experiment, the
total was twelve households. For each group (natural gas group, coal gas group,
liquefied petroleum gas), they were monitored respectively for three successive days
in summer and in winter. The result of each household was the mean value of these
three days. The place of experiment was kitchen of every household. The result of
every day was the mean value of morning and afternoon.
The indicators of indoor air pollution were inhalable particles (IP), CO, CO2, SO2,
NO2, benzoapyrene (BaP), and they were the mainly combustion products of cooking
fuels. BaP is a kind of high activity secondary carcinogen.
23
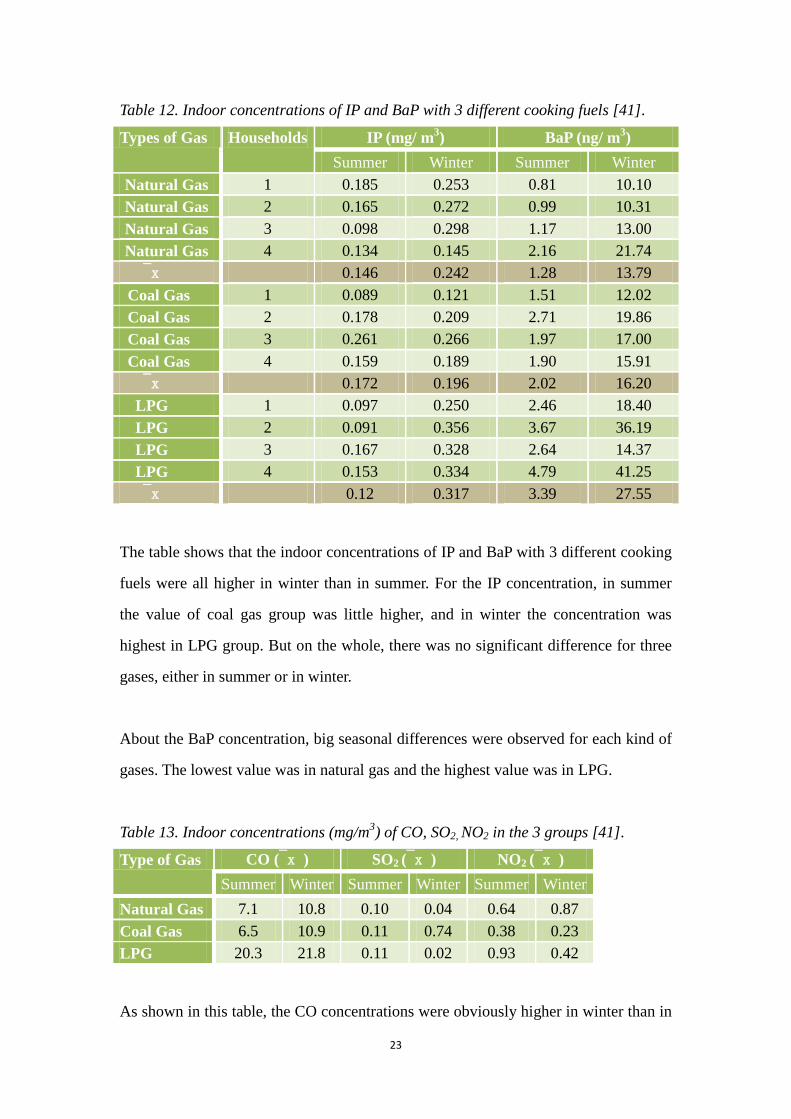
Table 12. Indoor concentrations of IP and BaP with 3 different cooking fuels [41].
Types of Gas Households IP (mg/ m3) BaP (ng/ m
3)
Summer Winter Summer Winter
Natural Gas 1 0.185 0.253 0.81 10.10
Natural Gas 2 0.165 0.272 0.99 10.31
Natural Gas 3 0.098 0.298 1.17 13.00
Natural Gas 4 0.134 0.145 2.16 21.74
x 0.146 0.242 1.28 13.79
Coal Gas 1 0.089 0.121 1.51 12.02
Coal Gas 2 0.178 0.209 2.71 19.86
Coal Gas 3 0.261 0.266 1.97 17.00
Coal Gas 4 0.159 0.189 1.90 15.91
x 0.172 0.196 2.02 16.20
LPG 1 0.097 0.250 2.46 18.40
LPG 2 0.091 0.356 3.67 36.19
LPG 3 0.167 0.328 2.64 14.37
LPG 4 0.153 0.334 4.79 41.25
x 0.12 0.317 3.39 27.55
The table shows that the indoor concentrations of IP and BaP with 3 different cooking
fuels were all higher in winter than in summer. For the IP concentration, in summer
the value of coal gas group was little higher, and in winter the concentration was
highest in LPG group. But on the whole, there was no significant difference for three
gases, either in summer or in winter.
About the BaP concentration, big seasonal differences were observed for each kind of
gases. The lowest value was in natural gas and the highest value was in LPG.
Table 13. Indoor concentrations (mg/m3) of CO, SO2, NO2 in the 3 groups [41].
Type of Gas CO (x ) SO2 (x ) NO2 (x )
Summer Winter Summer Winter Summer Winter
Natural Gas 7.1 10.8 0.10 0.04 0.64 0.87
Coal Gas 6.5 10.9 0.11 0.74 0.38 0.23
LPG 20.3 21.8 0.11 0.02 0.93 0.42
As shown in this table, the CO concentrations were obviously higher in winter than in
24
summer. And the values of LPG group were far higher than the other two groups. SO2
concentrations were all quite low of each group, both in summer and in winter. Only
the value of coal gas group in winter was relatively high. There was not much
difference between the groups about NO2 concentrations. The values of coal gas
group were relatively low comparing with the other groups.
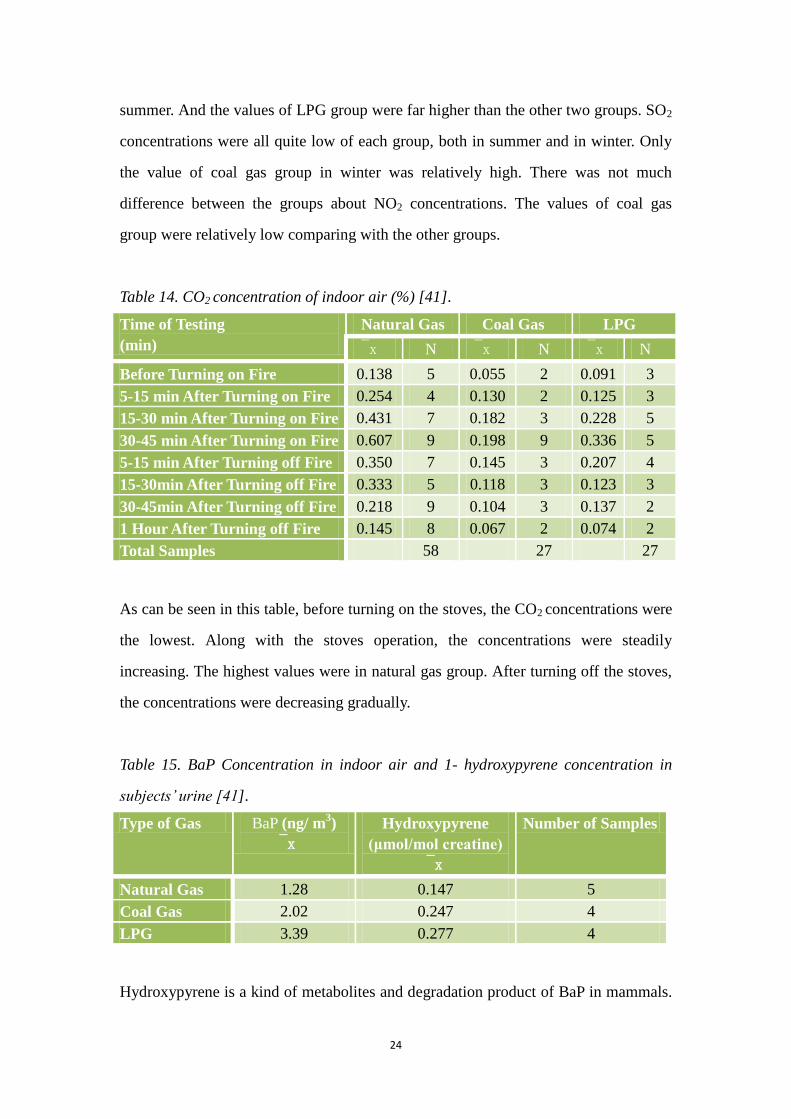
Table 14. CO2 concentration of indoor air (%) [41].
Time of Testing
(min)
Natural Gas Coal Gas LPG
x N x N x N
Before Turning on Fire 0.138 5 0.055 2 0.091 3
5-15 min After Turning on Fire 0.254 4 0.130 2 0.125 3
15-30 min After Turning on Fire 0.431 7 0.182 3 0.228 5
30-45 min After Turning on Fire 0.607 9 0.198 9 0.336 5
5-15 min After Turning off Fire 0.350 7 0.145 3 0.207 4
15-30min After Turning off Fire 0.333 5 0.118 3 0.123 3
30-45min After Turning off Fire 0.218 9 0.104 3 0.137 2
1 Hour After Turning off Fire 0.145 8 0.067 2 0.074 2
Total Samples 58 27 27
As can be seen in this table, before turning on the stoves, the CO2 concentrations were
the lowest. Along with the stoves operation, the concentrations were steadily
increasing. The highest values were in natural gas group. After turning off the stoves,
the concentrations were decreasing gradually.
Table 15. BaP Concentration in indoor air and 1- hydroxypyrene concentration in
subjects’ urine [41].
Type of Gas BaP (ng/ m3)
x
Hydroxypyrene
(μmol/mol creatine)
x
Number of Samples
Natural Gas 1.28 0.147 5
Coal Gas 2.02 0.247 4
LPG 3.39 0.277 4
Hydroxypyrene is a kind of metabolites and degradation product of BaP in mammals.
25
As shown in the table, the concentration of hydroxypyrene was directly proportional
to the concentration of BaP. The concentration of either BaP or hydroxypyrene was
the highest in LPG group and lowest in natural gas group.
To sum up, the study above showed that the indoor air pollution caused by natural gas,
coal gas or liquefied petroleum gas was more serious in winter than in summer. For all
the contaminant concentration measured in this experiment, except CO2, the values of
others were the lowest in natural gas group. And the values of liquefied petroleum gas
group were relatively high.
The above experiment can give a detailed comparison and analysis about the
contaminants concentrations of the three main urban cooking fuels. There was also
another experiment to compare natural gas with LPG:
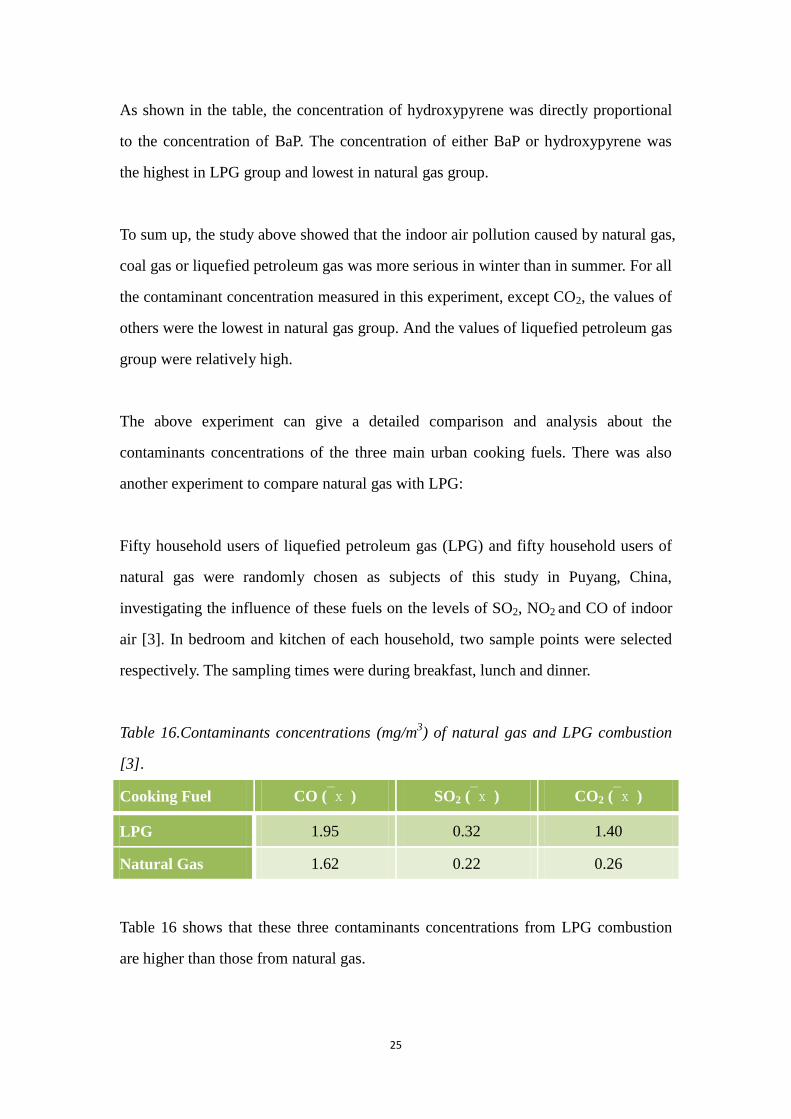
Fifty household users of liquefied petroleum gas (LPG) and fifty household users of
natural gas were randomly chosen as subjects of this study in Puyang, China,
investigating the influence of these fuels on the levels of SO2, NO2 and CO of indoor
air [3]. In bedroom and kitchen of each household, two sample points were selected
respectively. The sampling times were during breakfast, lunch and dinner.
Table 16.Contaminants concentrations (mg/m3) of natural gas and LPG combustion
[3].
Cooking Fuel CO (x ) SO2 (x ) CO2 (x )
LPG 1.95 0.32 1.40
Natural Gas 1.62 0.22 0.26
Table 16 shows that these three contaminants concentrations from LPG combustion
are higher than those from natural gas.
26
Through the data analysis of these experiments, natural gas combustion had the
lightest influence on indoor air quality. This is also supported by other studies: [11]
and [42].
3.3 The characteristics of contaminants from cooking fuels combustion
and their effect on human and environment
During the combustion of cooking fuels, affected by surrounding air and temperature
level, many kinds of noxious substances are produced. The main components are
carbon oxides, nitrogen oxides, sulfur oxides, oxygen-containing hydrocarbon,
polycyclic aromatic hydrocarbon, fluoride, metal oxide, non- metal oxide and
suspended particulate matter.
NO2: Nitrogen oxide is identified as the important pathogen of allergic rhinitis,
chronic bronchitis, chronic cough and many diseases [43]. At the initial period of
breathing NO2, throat discomfort or dry cough will appear [44]. This kind of gas
easily enters human pulmonary alveolus and cause chronic damage to lung tissues. If
inhaling large quantities, it will enter the blood and combine with hemoglobin to form
denatured hemoglobin, then lose oxygen carrying capacity and lead to tissue hypoxia.
Long-term inhalation may cause neurasthenic syndrome and chronic respiratory
disease [45].
CO: CO is easier to combine with hemoglobin of blood than O2, and it will lead to
inadequate oxygen supply in the blood. Long-term inhalation CO will cause dizziness,
nauseation, rapid heartbeat and so forth.
CO2: A very high concentration of CO2 can not only affect human health, but also
reduce the oxygen content of indoor air and result in human hypoxia. At the same
time, CO2 is also the main component of greenhouse gases. The total CO2 emission of
27
China is number two in the world [15].
SO2: SO2 can injure respiratory organs and lead to bronchitis, pneumonia, even
pulmonary edema or respiratory paralysis when inhaled by human body [46]. It
always enters the body attached to particulate matter, and then passes into trachea and
pulmonary alveolus. When it gets to the deep of lung, a part of it is absorbed. Another
part deposit in pulmonary alveolus or adheres to alveolar wall, and produce
stimulation and corrosion. In addition, SO2 will give rise to acid rain. The areas where
the pH of rainwater is less than 5.6 have expanded to 40% of the total area of China
[15]. These areas are mostly in the developed areas of China. Acid rain is seriously
harmful to building, plants, water quality and other parts of environment. It has made
a lot of economic and social damages.
Suspended particulate matter: The main part of toxic particulate matter is smaller than
10 micrometer in diameter (PM10) [46]. The particles which are more than 10
micrometer in diameter will be excluded by nose and mucosa fluid, and they are
usually less harmful to human. But the PM10 is easy to inhale into respiratory tract and
directly into pulmonary alveolus. It has harmful effects on respiratory system, heart,
hematological system, immune system and endocrine system.
3.4 The influence of ventilation on contaminant concentration
In order to investigate contaminant concentrations occurring at different types of
ventilation arrangements, 194 Beijing households using natural gas as their cooking
fuels were randomly included in an experiment [1]. The place of this experiment was
the kitchen of each household.
There were three kinds of ventilation arrangements:
①The unfavorable ventilation condition: closed door and window; no cooker hood or
kitchen ventilator.
②Natural ventilation: opened door and window; kitchen ventilator was turned off..
28
③Mechanical ventilation: closed door and window; kitchen ventilator was turned on..
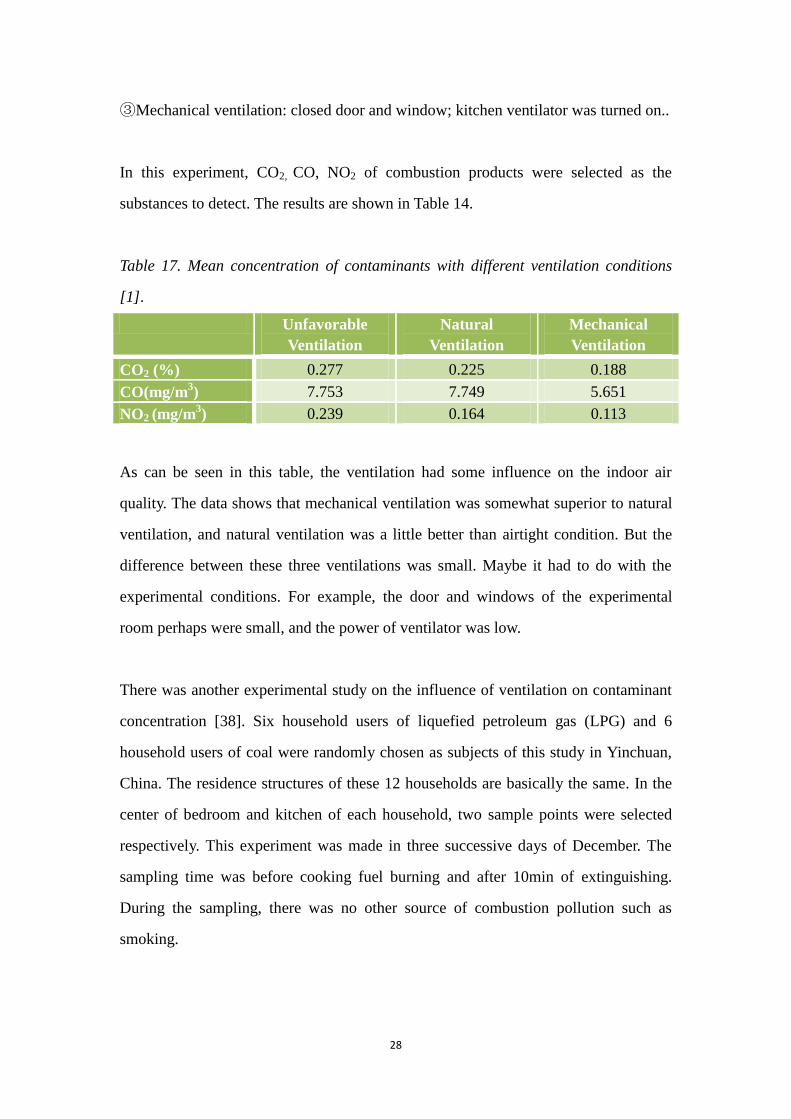
In this experiment, CO2, CO, NO2 of combustion products were selected as the
substances to detect. The results are shown in Table 14.
Table 17. Mean concentration of contaminants with different ventilation conditions
[1].
Unfavorable
Ventilation
Natural
Ventilation
Mechanical
Ventilation
CO2 (%) 0.277 0.225 0.188
CO(mg/m3) 7.753 7.749 5.651
NO2 (mg/m3) 0.239 0.164 0.113
As can be seen in this table, the ventilation had some influence on the indoor air
quality. The data shows that mechanical ventilation was somewhat superior to natural
ventilation, and natural ventilation was a little better than airtight condition. But the
difference between these three ventilations was small. Maybe it had to do with the
experimental conditions. For example, the door and windows of the experimental
room perhaps were small, and the power of ventilator was low.
There was another experimental study on the influence of ventilation on contaminant
concentration [38]. Six household users of liquefied petroleum gas (LPG) and 6
household users of coal were randomly chosen as subjects of this study in Yinchuan,
China. The residence structures of these 12 households are basically the same. In the
center of bedroom and kitchen of each household, two sample points were selected
respectively. This experiment was made in three successive days of December. The
sampling time was before cooking fuel burning and after 10min of extinguishing.
During the sampling, there was no other source of combustion pollution such as
smoking.
29
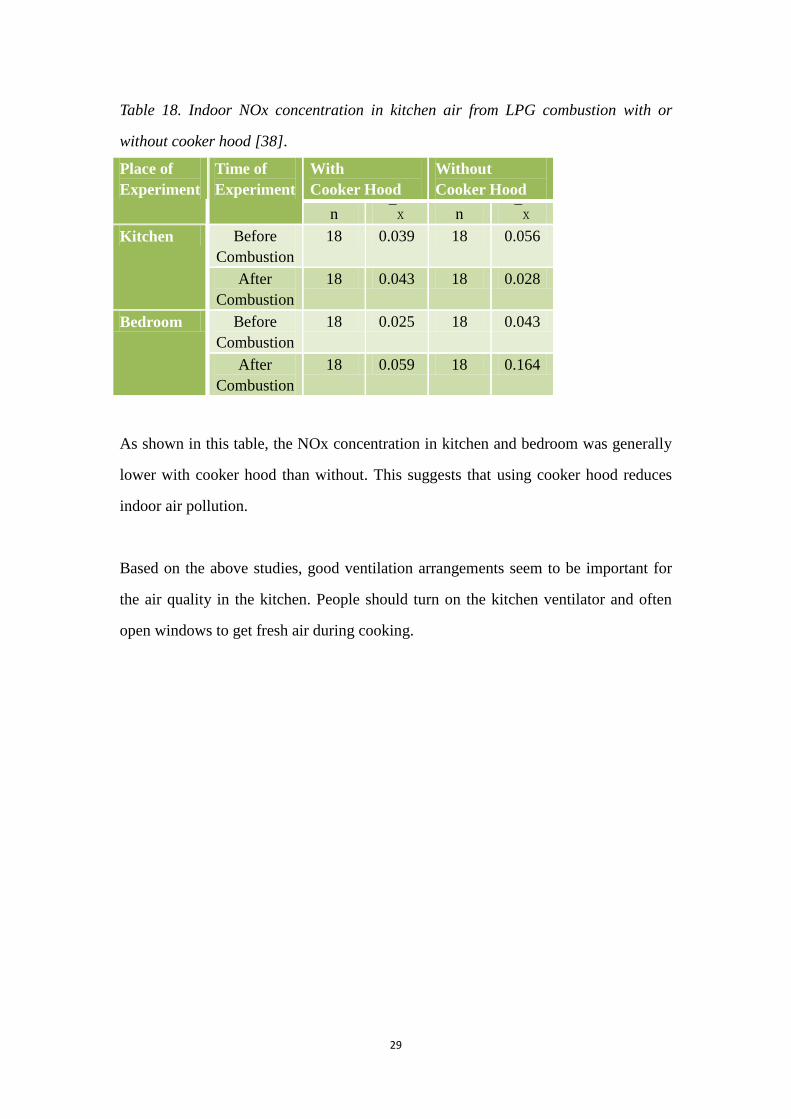
Table 18. Indoor NOx concentration in kitchen air from LPG combustion with or
without cooker hood [38].
Place of
Experiment
Time of
Experiment
With
Cooker Hood
Without
Cooker Hood
n x n x
Kitchen Before
Combustion
18 0.039 18 0.056
After
Combustion
18 0.043 18 0.028
Bedroom Before
Combustion
18 0.025 18 0.043
After
Combustion
18 0.059 18 0.164
As shown in this table, the NOx concentration in kitchen and bedroom was generally
lower with cooker hood than without. This suggests that using cooker hood reduces
indoor air pollution.
Based on the above studies, good ventilation arrangements seem to be important for
the air quality in the kitchen. People should turn on the kitchen ventilator and often
open windows to get fresh air during cooking.
30
4. Field study: Questionnaire survey
A questionnaire survey was conducted in 93 Chinese households which were using
different cooking fuels. The main purposes of the study were to see differences in the
occupants’ perceived health, ventilation behaviors and general knowledge in potential
health hazards. The studied households covered the most common cooking fuels in
China: natural gas, coal gas wood and straw, coal and liquefied petroleum gas (LPG).
4.1 Method
The study was performed in two cities of Shandong province, where willing assisting
field workers were at hand. Some of the respondents live in Qingdao, and the others
live in Dongying, which are two cities of the Shandong province. Three of my friends
volunteered as assistants to make interviews in China. Two of them live in Qingdao,
so they interviewed the residents of Qingdao. And the other lives in Dongying, so she
interviewed the residents of Dongying. The questionnaire (see Appendix) was
constructed in collaboration with the supervisor of the present study. A Chinese
version of the questionnaire was sent to assistants in advance, and they printed it out.
They took the questionnaire to each household, interviewed them face to face, and
wrote down their answers. During the interviewing, my friends used their mobile
telephones to connect to the Internet, and logged in to skype (skype is a kind of voice
software). I communicated with my friends by this software and explained their doubt
in time. During the investigation, most of people actively and friendly took part in this
questionnaire survey.
As previously mentioned, most of urban residents in China use natural gas, coal gas or
LPG as their cooking fuels, whereas in rural China, the main cooking fuels are coal,
biogas, LPG, wood and straw. But in Shandong province, few households use biogas
31
for cooking, so we could not cover that cooking fuel in this study.
4.2 Results
In the diagrams below, the results about rural cooking fuels are showed in green color,
and the results about urban cooking fuels are showed in blue color. LPG was used
both in the cities and on the countryside; thus some diagrams show double bars of
LPG, differentiated by color.
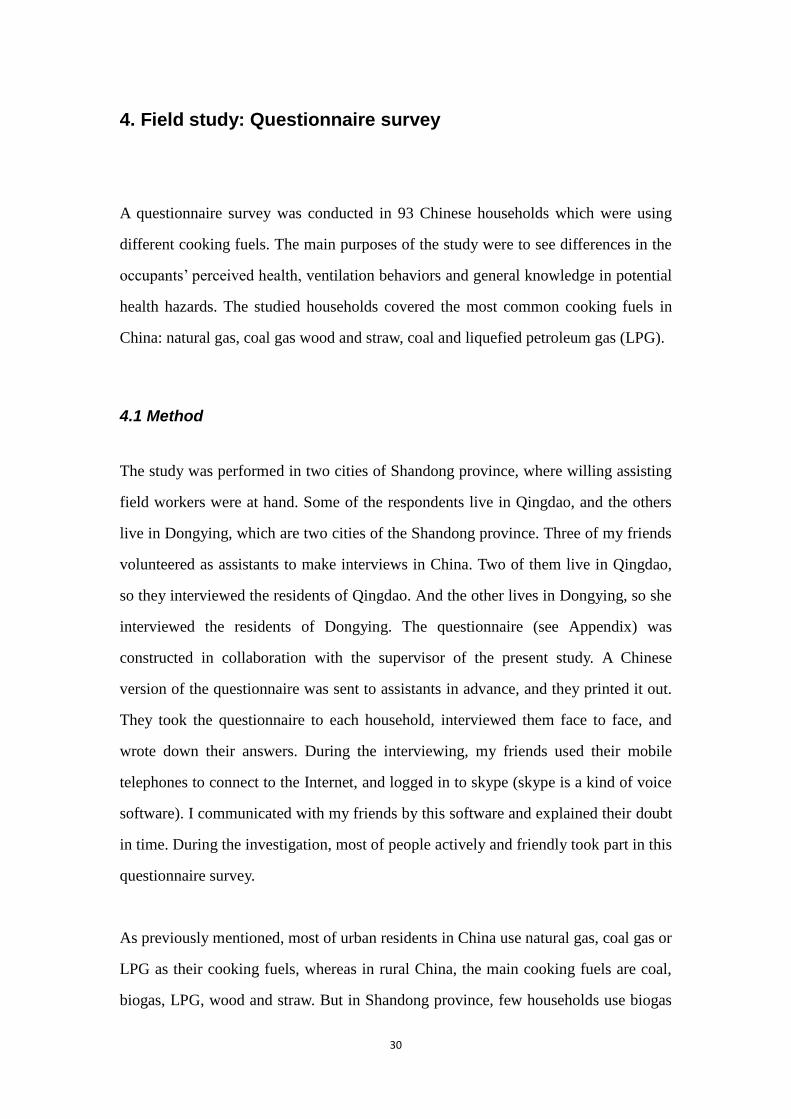
4.2.1 Answers from the person who most often do the cooking of food in
the household
Fig. 7. Age of the person who most often do the cooking in the household.
As shown in figure 7, most of people who are responsible for cooking in the
households are between 25-40 years old.
0
10
20
30
40
50
15-25 years 25-40 years 40-60 years More than 60 years
9
42
31
11
Age
32
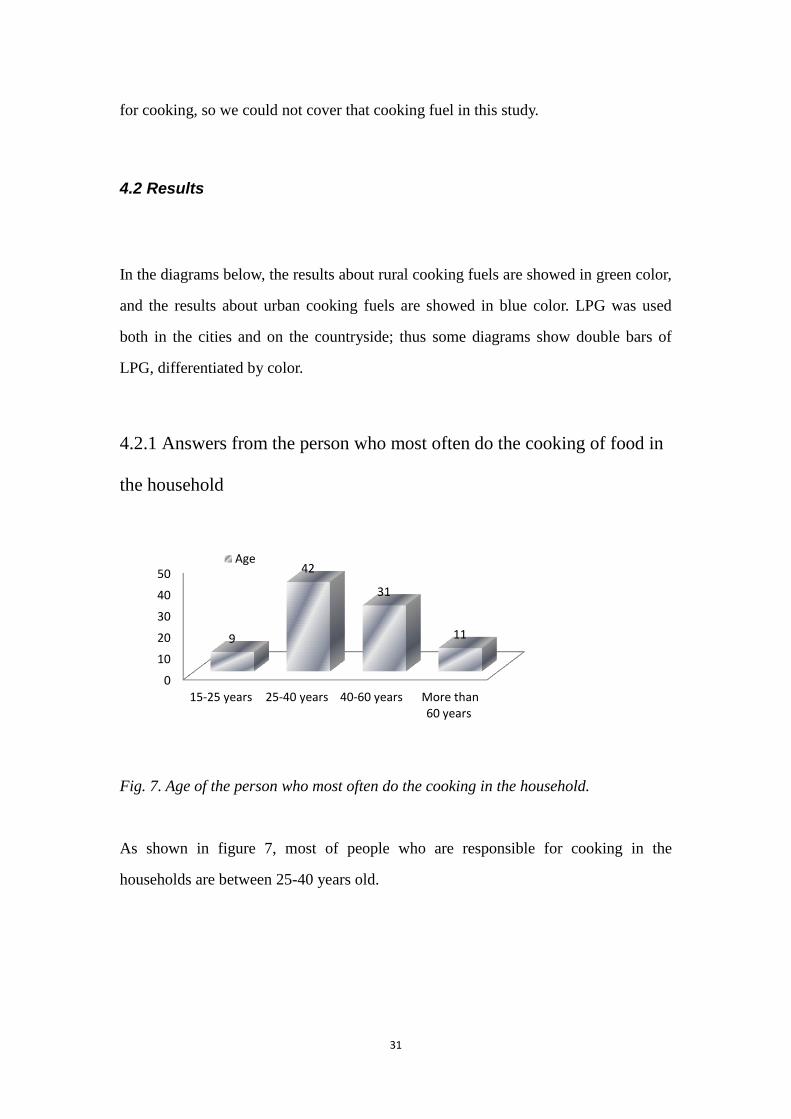
Fig. 8. Sex of people who most often do the cooking in the households
As can be seen in figure 8, in all the 93 investigated persons who often do the cooking
of food, about 69 of them are women. To the author’s experience, in most of
households in China, women often do the cooking of food.
Fig. 9. History in using the present cooking fuel.
Figure 9 shows that most of persons who were investigated has been using the one
and same cooking fuel for a long time (N = Number of households). A separate
question also revealed that most of them do not want to change their cooking fuels:
Only about 10 of them wanted to change their cooking fuels to natural gas.
0
50
100
Male Female
24
69
Sex
0%
20%
40%
60%
80%
100%
Less than one year 1-3 years All along
3%
13%
84%
0%
27%
73%
0% 4%
96%
0%
13%
87%
0%
23%
77%
0%
15%
85%
LPG users(N=39)
Coal users(N=11)
Wood and Straw users(N=25)
Natural gas users(N=24)
Coal gas users(N=13)
LPG users(N=13)
Rural cooking fuels :
Urban cooking fuels :
33
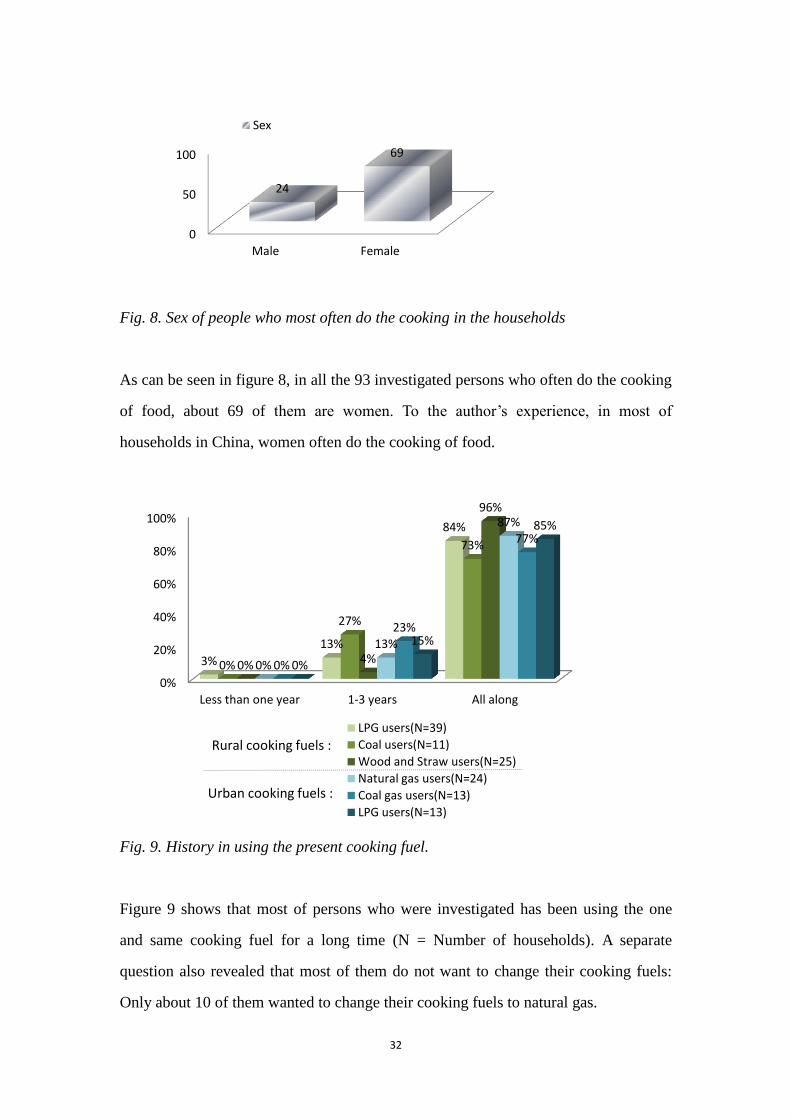
Fig. 10. Answers to the questions “Is your kitchen a separate room or joint with a
dining area?” “Do you often open the door of the kitchen when you are cooking?”
and “Do you often open the window when you are cooking?”
As can be seen in Fig. 10, most people often open the door and windows of the
kitchen when they are cooking, and more than 90 percent have a separate room as
their kitchens. At the same time, in most of rural households, the door of the kitchen is
facing an outdoor yard (Figure 5). So it has little negative effect on other rooms.
0%
20%
40%
60%
80%
100%
Have a separate room for kitchen
Often opening the door of the kitchen
during cooking
Often opening the window during
cooking
100%
82%
62%
90% 80%
100% 95%
75%
100% 90%
45%
83% 90%
67%
100% 100% 92%
60%
LPG users(N=39) Coal users(N=11) Wood and straw users(N=25) Natural users(N=24) Coal gas users(N=13) LPG users(N=13)
Rural cooking fuels :
Urban cooking fuels :
34
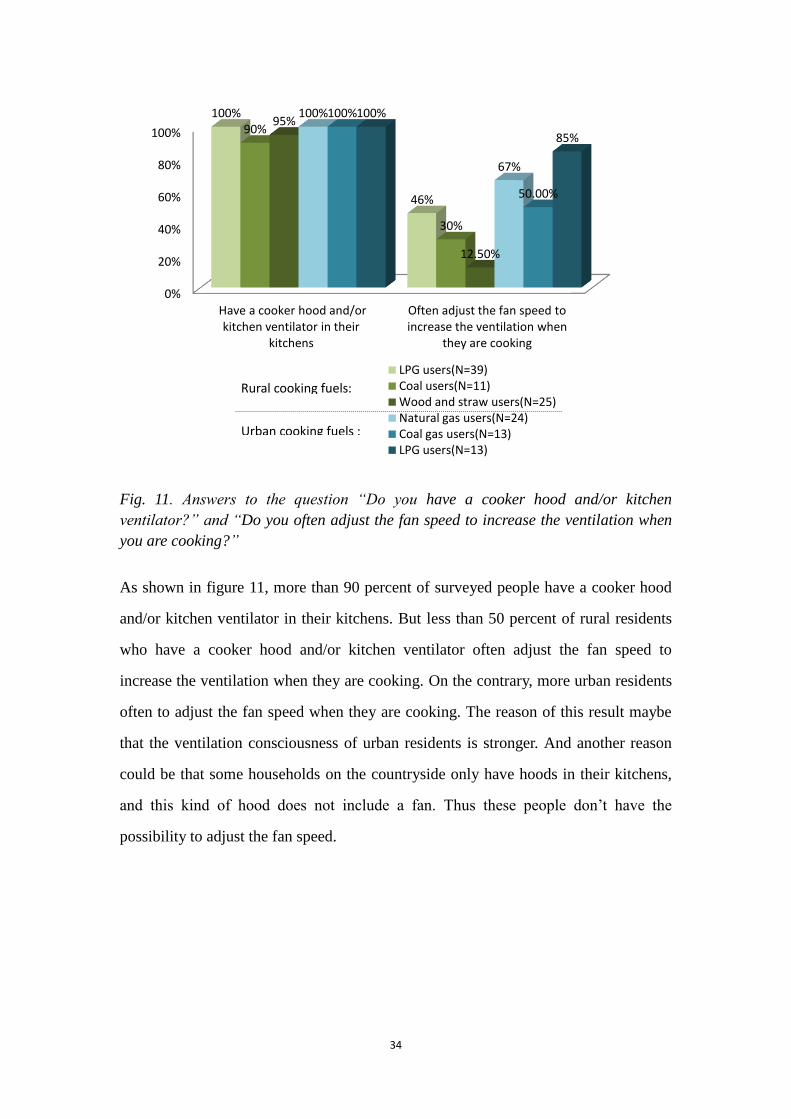
Fig. 11. Answers to the question “Do you have a cooker hood and/or kitchen
ventilator?” and “Do you often adjust the fan speed to increase the ventilation when
you are cooking?”
As shown in figure 11, more than 90 percent of surveyed people have a cooker hood
and/or kitchen ventilator in their kitchens. But less than 50 percent of rural residents
who have a cooker hood and/or kitchen ventilator often adjust the fan speed to
increase the ventilation when they are cooking. On the contrary, more urban residents
often to adjust the fan speed when they are cooking. The reason of this result maybe
that the ventilation consciousness of urban residents is stronger. And another reason
could be that some households on the countryside only have hoods in their kitchens,
and this kind of hood does not include a fan. Thus these people don’t have the
possibility to adjust the fan speed.
0%
20%
40%
60%
80%
100%
Have a cooker hood and/or kitchen ventilator in their
kitchens
Often adjust the fan speed to increase the ventilation when
they are cooking
100%
46%
90%
30%
95%
12.50%
100%
67%
100%
50.00%
100%
85%
LPG users(N=39) Coal users(N=11) Wood and straw users(N=25) Natural gas users(N=24) Coal gas users(N=13) LPG users(N=13)
Rural cooking fuels:
Urban cooking fuels :
35
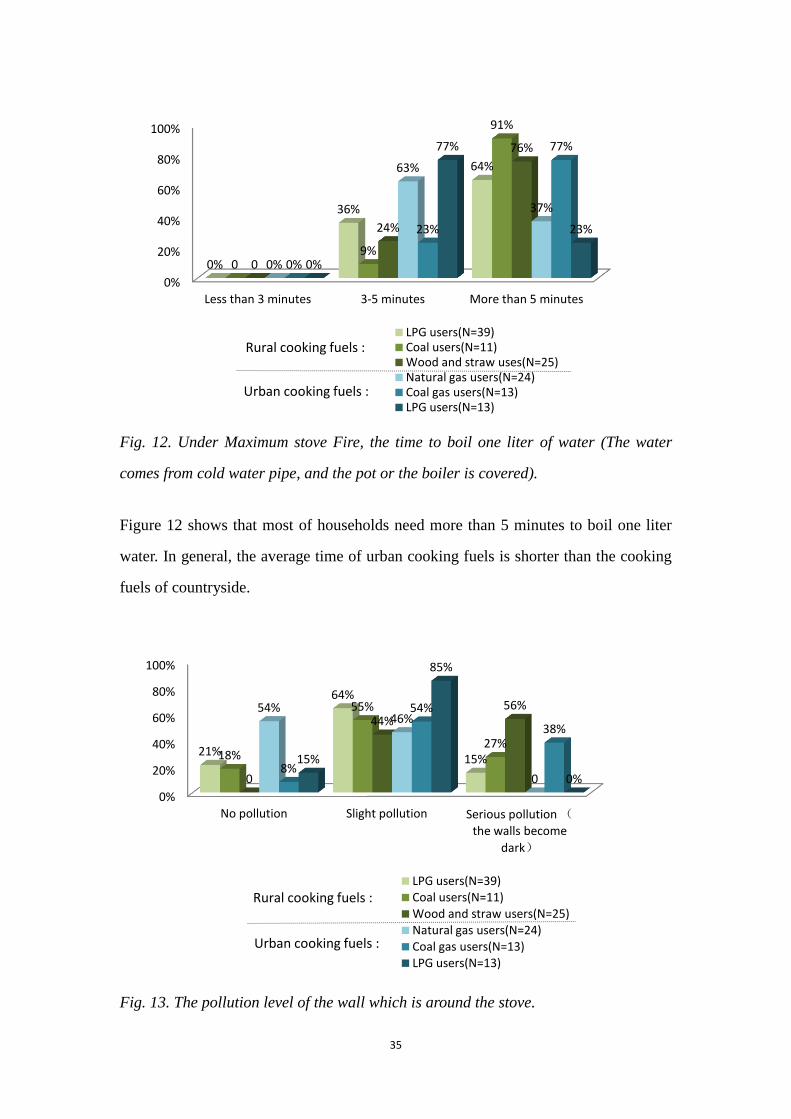
Fig. 12. Under Maximum stove Fire, the time to boil one liter of water (The water
comes from cold water pipe, and the pot or the boiler is covered).
Figure 12 shows that most of households need more than 5 minutes to boil one liter
water. In general, the average time of urban cooking fuels is shorter than the cooking
fuels of countryside.
Fig. 13. The pollution level of the wall which is around the stove.
0%
20%
40%
60%
80%
100%
Less than 3 minutes 3-5 minutes More than 5 minutes
0%
36%
64%
0 9%
91%
0
24%
76%
0%
63%
37%
0%
23%
77%
0%
77%
23%
LPG users(N=39) Coal users(N=11) Wood and straw uses(N=25) Natural gas users(N=24) Coal gas users(N=13) LPG users(N=13)
Rural cooking fuels :
Urban cooking fuels :
0%
20%
40%
60%
80%
100%
No pollution Slight pollution Serious pollution (
the walls become
dark)
21%
64%
15% 18%
55%
27%
0
44% 56% 54%
46%
0 8%
54%
38%
15%
85%
0%
LPG users(N=39) Coal users(N=11) Wood and straw users(N=25) Natural gas users(N=24) Coal gas users(N=13) LPG users(N=13)
Rural cooking fuels :
Urban cooking fuels :
36
As presented in figure 13, in general, the blackening of the walls around the stoves is
more serious in rural than in urban households. In particular, the wall of the wood and
straw users is most affected, whereas the cleanest is with natural gas.
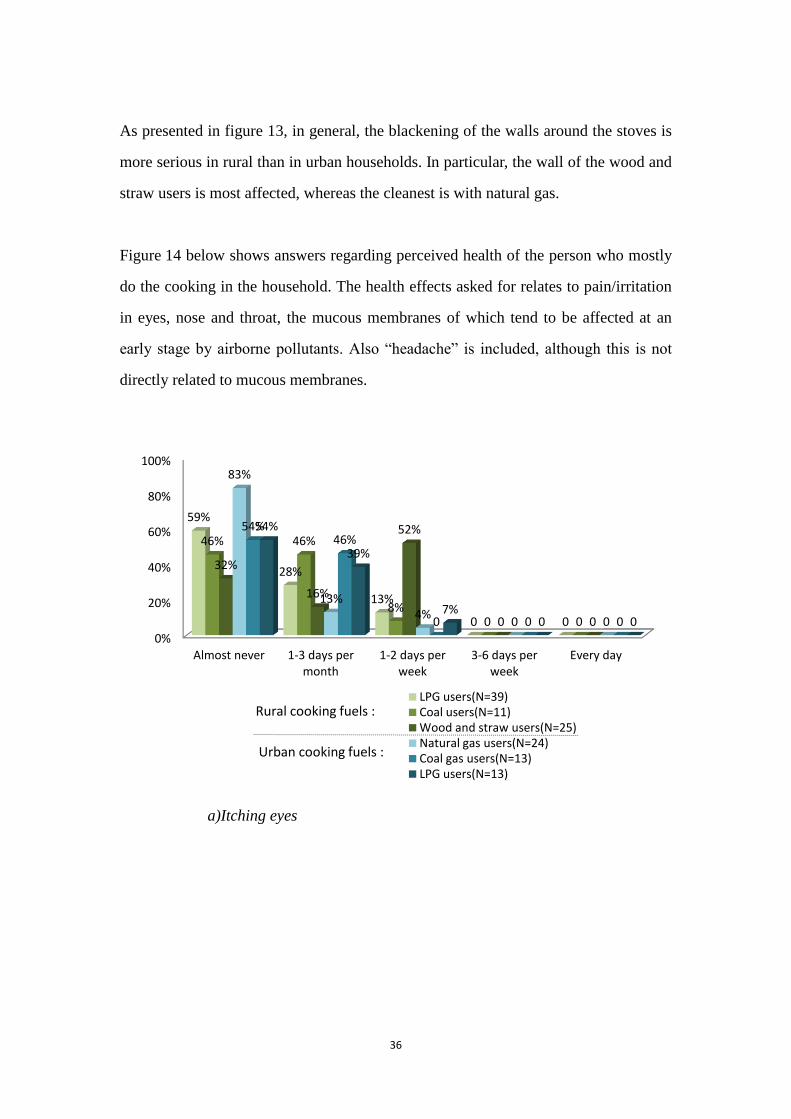
Figure 14 below shows answers regarding perceived health of the person who mostly
do the cooking in the household. The health effects asked for relates to pain/irritation
in eyes, nose and throat, the mucous membranes of which tend to be affected at an
early stage by airborne pollutants. Also “headache” is included, although this is not
directly related to mucous membranes.
a)Itching eyes
0%
20%
40%
60%
80%
100%
Almost never 1-3 days per month
1-2 days per week
3-6 days per week
Every day
59%
28%
13%
0 0
46% 46%
8% 0 0
32%
16%
52%
0 0
83%
13% 4%
0 0
54% 46%
0 0 0
54%
39%
7% 0 0
LPG users(N=39) Coal users(N=11) Wood and straw users(N=25) Natural gas users(N=24) Coal gas users(N=13) LPG users(N=13)
Rural cooking fuels :
Urban cooking fuels :
37
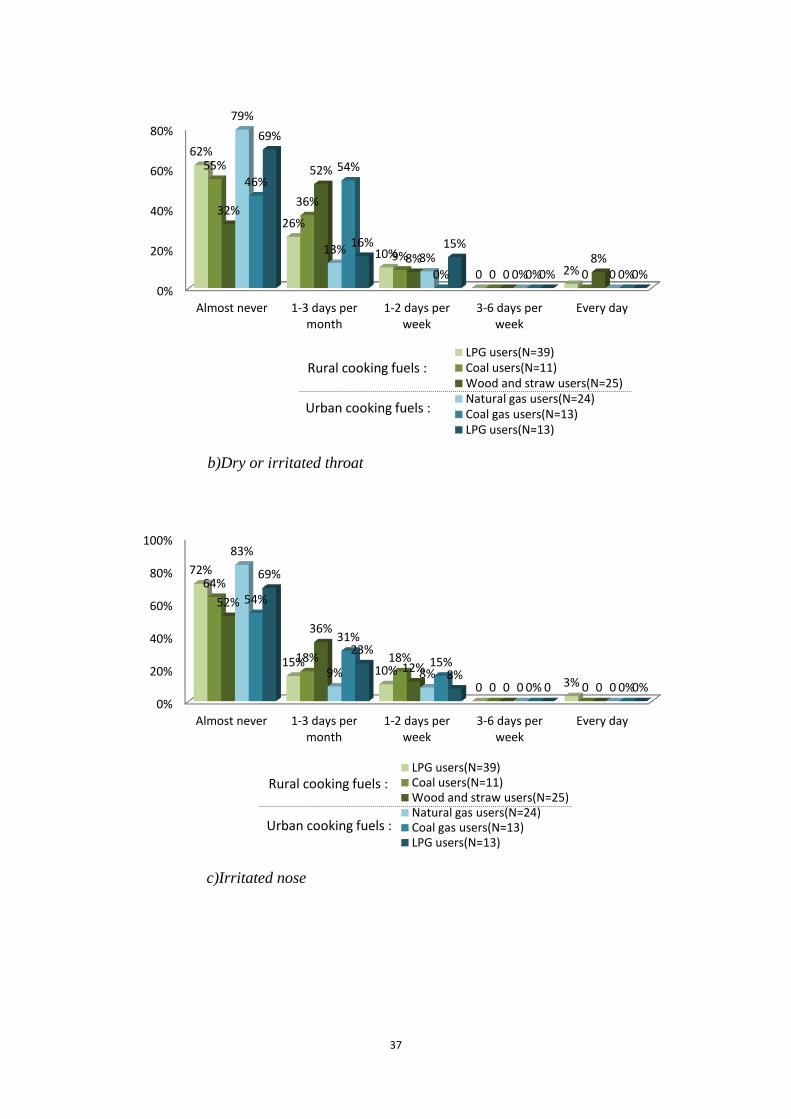
b)Dry or irritated throat
c)Irritated nose
0%
20%
40%
60%
80%
Almost never 1-3 days per month
1-2 days per week
3-6 days per week
Every day
62%
26%
10%
0 2%
55%
36%
9%
0 0
32%
52%
8% 0
8%
79%
13% 8%
0% 0
46% 54%
0% 0% 0%
69%
16% 15%
0% 0%
LPG users(N=39) Coal users(N=11) Wood and straw users(N=25) Natural gas users(N=24) Coal gas users(N=13) LPG users(N=13)
Rural cooking fuels :
Urban cooking fuels :
0%
20%
40%
60%
80%
100%
Almost never 1-3 days per month
1-2 days per week
3-6 days per week
Every day
72%
15% 10%
0 3%
64%
18% 18%
0 0
52%
36%
12%
0 0
83%
9% 8% 0 0
54%
31%
15%
0% 0%
69%
23%
8% 0 0%
LPG users(N=39) Coal users(N=11) Wood and straw users(N=25) Natural gas users(N=24) Coal gas users(N=13) LPG users(N=13)
Rural cooking fuels :
Urban cooking fuels :
38
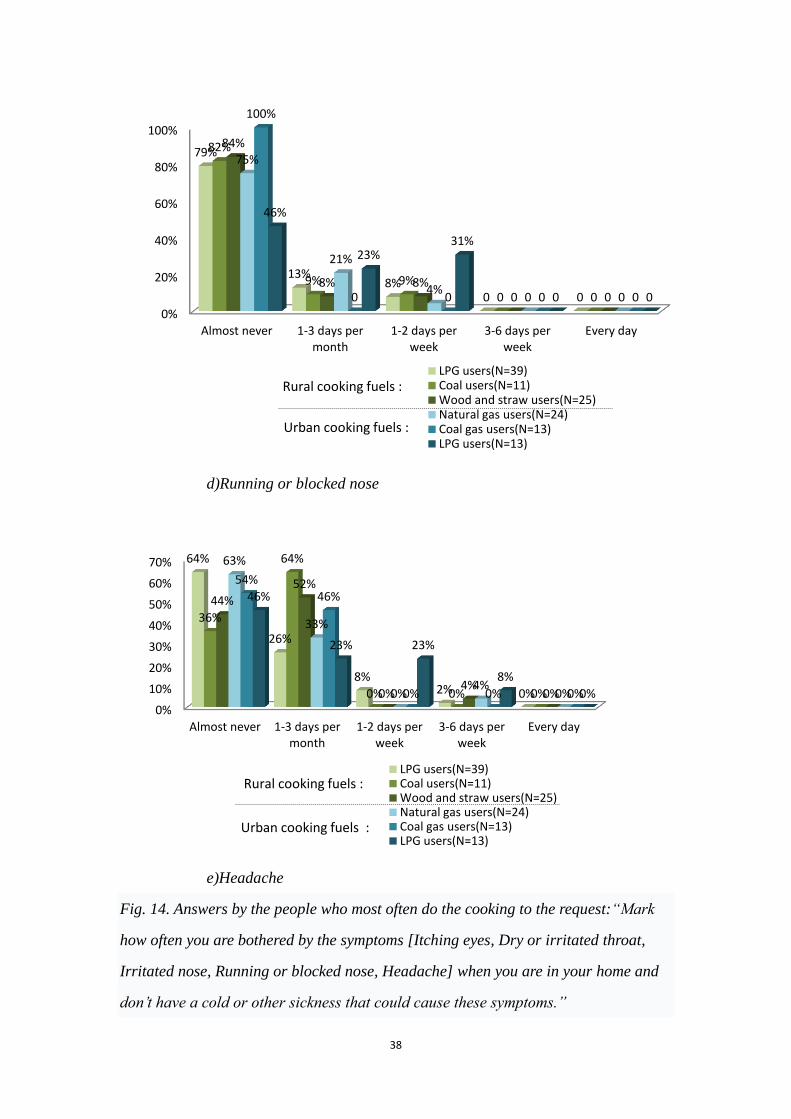
d)Running or blocked nose
e)Headache
Fig. 14. Answers by the people who most often do the cooking to the request:“Mark
how often you are bothered by the symptoms [Itching eyes, Dry or irritated throat,
Irritated nose, Running or blocked nose, Headache] when you are in your home and
don’t have a cold or other sickness that could cause these symptoms.”
0%
20%
40%
60%
80%
100%
Almost never 1-3 days per month
1-2 days per week
3-6 days per week
Every day
79%
13% 8%
0 0
82%
9% 9%
0 0
84%
8% 8% 0 0
75%
21%
4% 0 0
100%
0 0 0 0
46%
23% 31%
0 0
LPG users(N=39) Coal users(N=11) Wood and straw users(N=25) Natural gas users(N=24) Coal gas users(N=13) LPG users(N=13)
Rural cooking fuels :
Urban cooking fuels :
0%
10%
20%
30%
40%
50%
60%
70%
Almost never 1-3 days per month
1-2 days per week
3-6 days per week
Every day
64%
26%
8% 2% 0%
36%
64%
0% 0% 0%
44%
52%
0% 4%
0%
63%
33%
0% 4%
0%
54%
46%
0% 0% 0%
46%
23% 23%
8%
0%
LPG users(N=39) Coal users(N=11) Wood and straw users(N=25) Natural gas users(N=24) Coal gas users(N=13) LPG users(N=13)
Rural cooking fuels :
Urban cooking fuels :
39
As can be seen in these diagrams, in general, the condition of urban residents is better
than rural residents. From the results in Figure 14 it appears that wood and straw
combustion has big influence on eyes, and that headache and blocked nose of LPG
users who live in cities is unexpectedly outstanding.
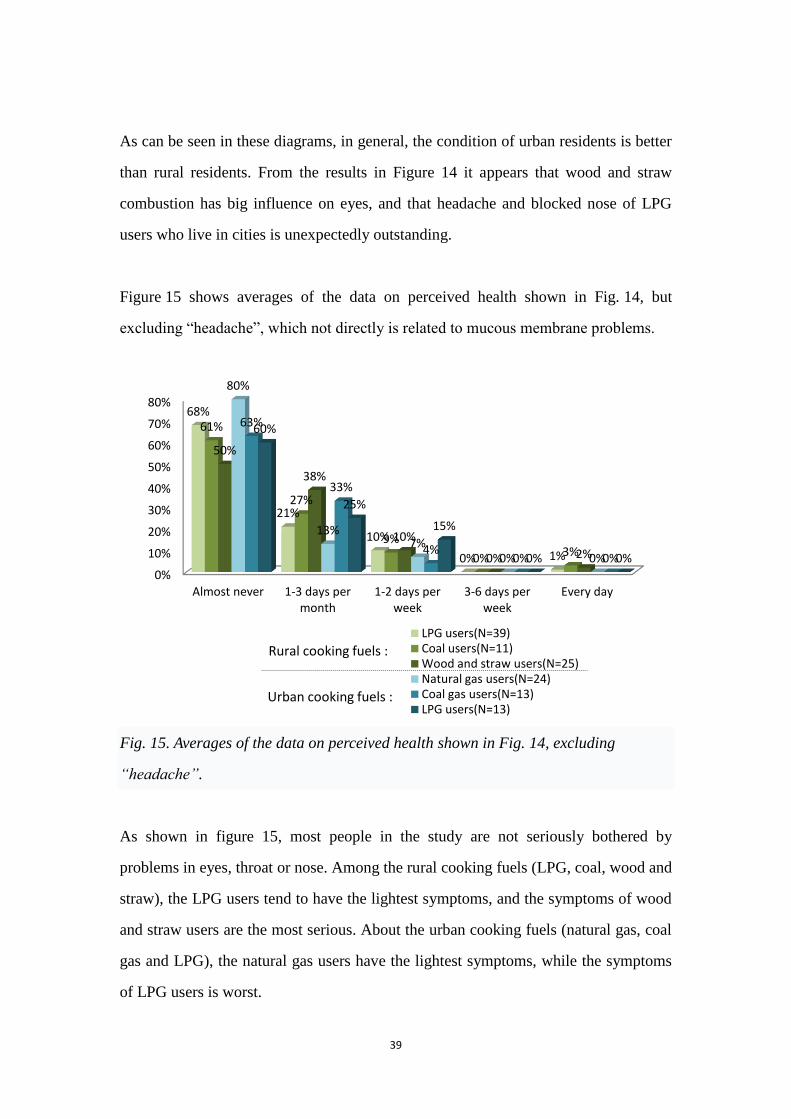
Figure 15 shows averages of the data on perceived health shown in Fig. 14, but
excluding “headache”, which not directly is related to mucous membrane problems.
Fig. 15. Averages of the data on perceived health shown in Fig. 14, excluding
“headache”.
As shown in figure 15, most people in the study are not seriously bothered by
problems in eyes, throat or nose. Among the rural cooking fuels (LPG, coal, wood and
straw), the LPG users tend to have the lightest symptoms, and the symptoms of wood
and straw users are the most serious. About the urban cooking fuels (natural gas, coal
gas and LPG), the natural gas users have the lightest symptoms, while the symptoms
of LPG users is worst.
0%
10%
20%
30%
40%
50%
60%
70%
80%
Almost never 1-3 days per month
1-2 days per week
3-6 days per week
Every day
68%
21%
10%
0% 1%
61%
27%
9%
0% 3%
50%
38%
10%
0% 2%
80%
13% 7%
0% 0%
63%
33%
4% 0% 0%
60%
25%
15%
0% 0%
LPG users(N=39) Coal users(N=11) Wood and straw users(N=25) Natural gas users(N=24) Coal gas users(N=13) LPG users(N=13)
Rural cooking fuels :
Urban cooking fuels :
40
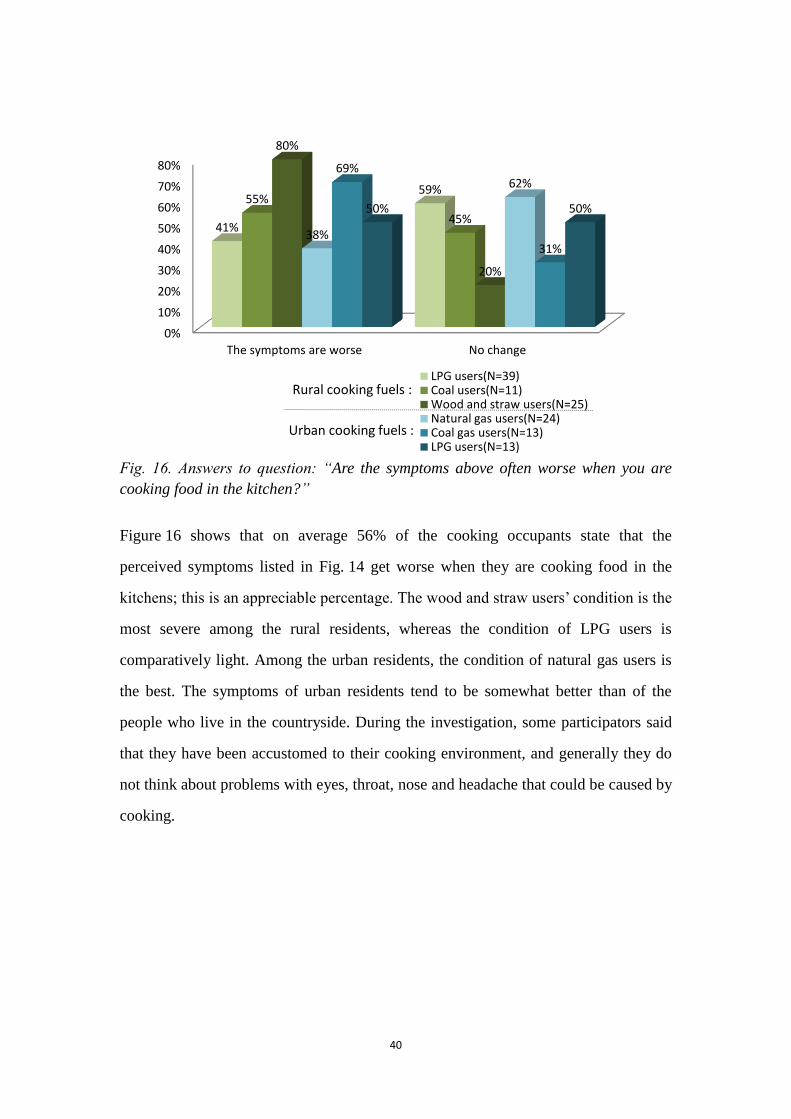
Fig. 16. Answers to question: “Are the symptoms above often worse when you are
cooking food in the kitchen?”
Figure 16 shows that on average 56% of the cooking occupants state that the
perceived symptoms listed in Fig. 14 get worse when they are cooking food in the
kitchens; this is an appreciable percentage. The wood and straw users’ condition is the
most severe among the rural residents, whereas the condition of LPG users is
comparatively light. Among the urban residents, the condition of natural gas users is
the best. The symptoms of urban residents tend to be somewhat better than of the
people who live in the countryside. During the investigation, some participators said
that they have been accustomed to their cooking environment, and generally they do
not think about problems with eyes, throat, nose and headache that could be caused by
cooking.
0%
10%
20%
30%
40%
50%
60%
70%
80%
The symptoms are worse No change
41%
59% 55%
45%
80%
20%
38%
62% 69%
31%
50% 50%
LPG users(N=39) Coal users(N=11) Wood and straw users(N=25) Natural gas users(N=24) Coal gas users(N=13) LPG users(N=13)
Rural cooking fuels :
Urban cooking fuels :
41
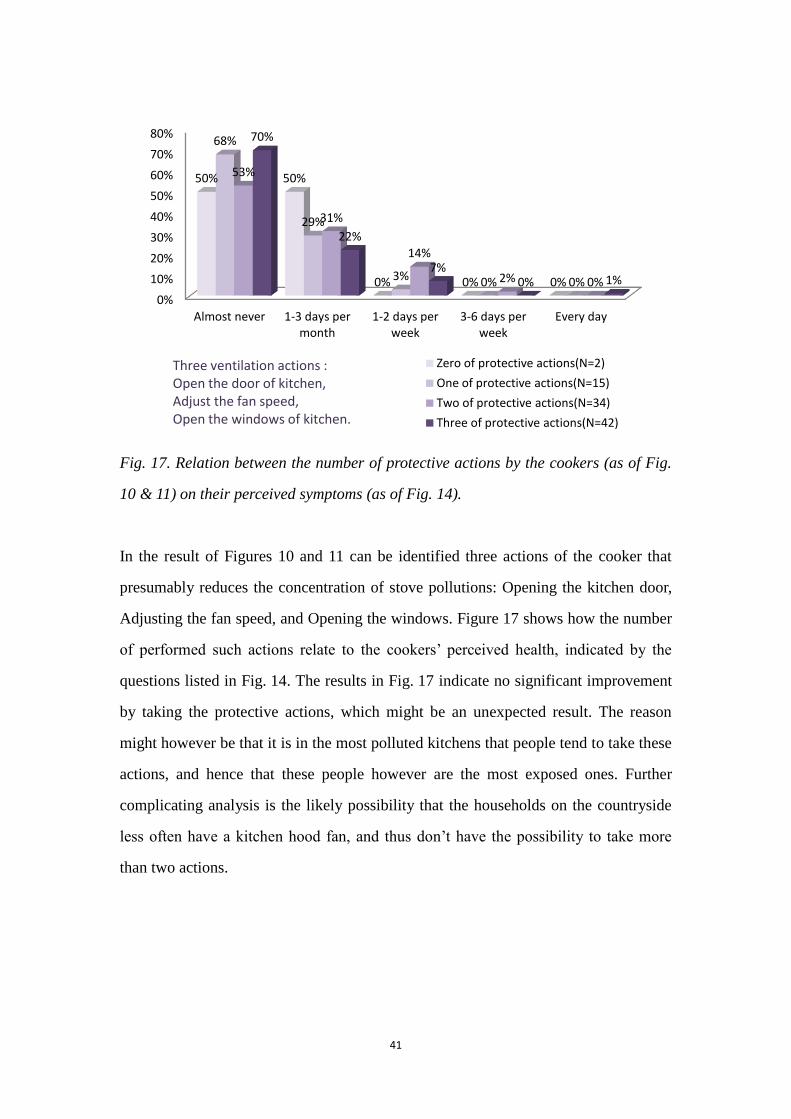
Fig. 17. Relation between the number of protective actions by the cookers (as of Fig.
10 & 11) on their perceived symptoms (as of Fig. 14).
In the result of Figures 10 and 11 can be identified three actions of the cooker that
presumably reduces the concentration of stove pollutions: Opening the kitchen door,
Adjusting the fan speed, and Opening the windows. Figure 17 shows how the number
of performed such actions relate to the cookers’ perceived health, indicated by the
questions listed in Fig. 14. The results in Fig. 17 indicate no significant improvement
by taking the protective actions, which might be an unexpected result. The reason
might however be that it is in the most polluted kitchens that people tend to take these
actions, and hence that these people however are the most exposed ones. Further
complicating analysis is the likely possibility that the households on the countryside
less often have a kitchen hood fan, and thus don’t have the possibility to take more
than two actions.
0%
10%
20%
30%
40%
50%
60%
70%
80%
Almost never 1-3 days per month
1-2 days per week
3-6 days per week
Every day
50% 50%
0% 0% 0%
68%
29%
3% 0% 0%
53%
31%
14%
2% 0%
70%
22%
7% 0% 1%
Zero of protective actions(N=2)
One of protective actions(N=15)
Two of protective actions(N=34)
Three of protective actions(N=42)
Three ventilation actions : Open the door of kitchen, Adjust the fan speed, Open the windows of kitchen.
42
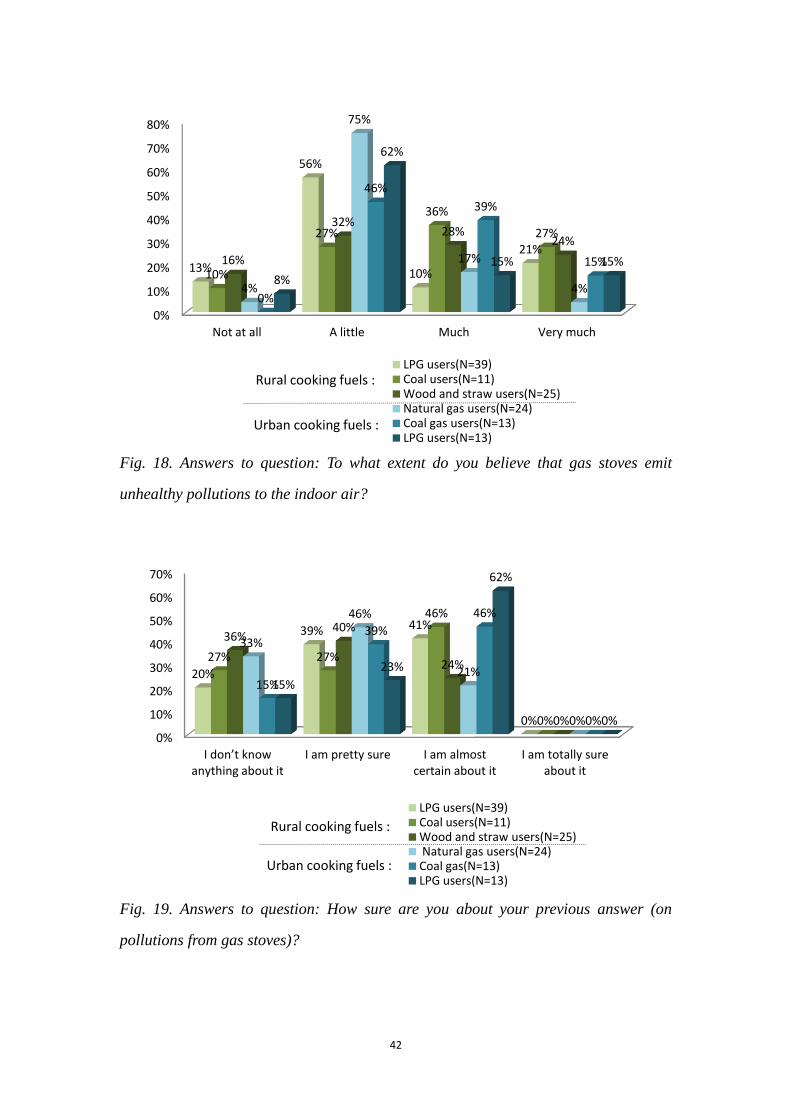
Fig. 18. Answers to question: To what extent do you believe that gas stoves emit
unhealthy pollutions to the indoor air?
Fig. 19. Answers to question: How sure are you about your previous answer (on
pollutions from gas stoves)?
0%
10%
20%
30%
40%
50%
60%
70%
80%
Not at all A little Much Very much
13%
56%
10%
21%
10%
27%
36%
27%
16%
32% 28%
24%
4%
75%
17%
4% 0%
46%
39%
15%
8%
62%
15% 15%
LPG users(N=39) Coal users(N=11) Wood and straw users(N=25) Natural gas users(N=24) Coal gas users(N=13) LPG users(N=13)
Rural cooking fuels :
Urban cooking fuels :
0%
10%
20%
30%
40%
50%
60%
70%
I don’t know anything about it
I am pretty sure I am almost certain about it
I am totally sure about it
20%
39% 41%
0%
27% 27%
46%
0%
36% 40%
24%
0%
33%
46%
21%
0%
15%
39%
46%
0%
15%
23%
62%
0%
LPG users(N=39) Coal users(N=11) Wood and straw users(N=25) Natural gas users(N=24) Coal gas(N=13) LPG users(N=13)
Rural cooking fuels :
Urban cooking fuels :
43
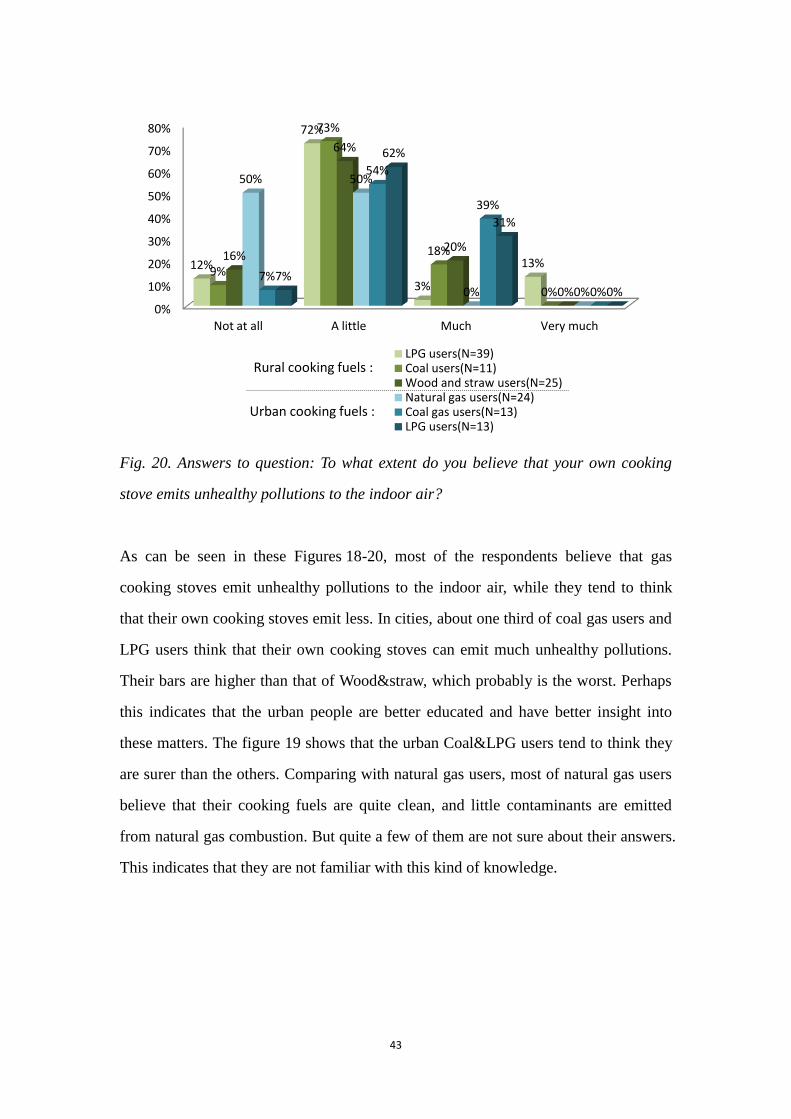
Fig. 20. Answers to question: To what extent do you believe that your own cooking
stove emits unhealthy pollutions to the indoor air?
As can be seen in these Figures 18-20, most of the respondents believe that gas
cooking stoves emit unhealthy pollutions to the indoor air, while they tend to think
that their own cooking stoves emit less. In cities, about one third of coal gas users and
LPG users think that their own cooking stoves can emit much unhealthy pollutions.
Their bars are higher than that of Wood&straw, which probably is the worst. Perhaps
this indicates that the urban people are better educated and have better insight into
these matters. The figure 19 shows that the urban Coal&LPG users tend to think they
are surer than the others. Comparing with natural gas users, most of natural gas users
believe that their cooking fuels are quite clean, and little contaminants are emitted
from natural gas combustion. But quite a few of them are not sure about their answers.
This indicates that they are not familiar with this kind of knowledge.
0%
10%
20%
30%
40%
50%
60%
70%
80%
Not at all A little Much Very much
12%
72%
3%
13% 9%
73%
18%
0%
16%
64%
20%
0%
50% 50%
0% 0% 7%
54%
39%
0% 7%
62%
31%
0%
LPG users(N=39) Coal users(N=11) Wood and straw users(N=25) Natural gas users(N=24) Coal gas users(N=13) LPG users(N=13)
Rural cooking fuels :
Urban cooking fuels :
44
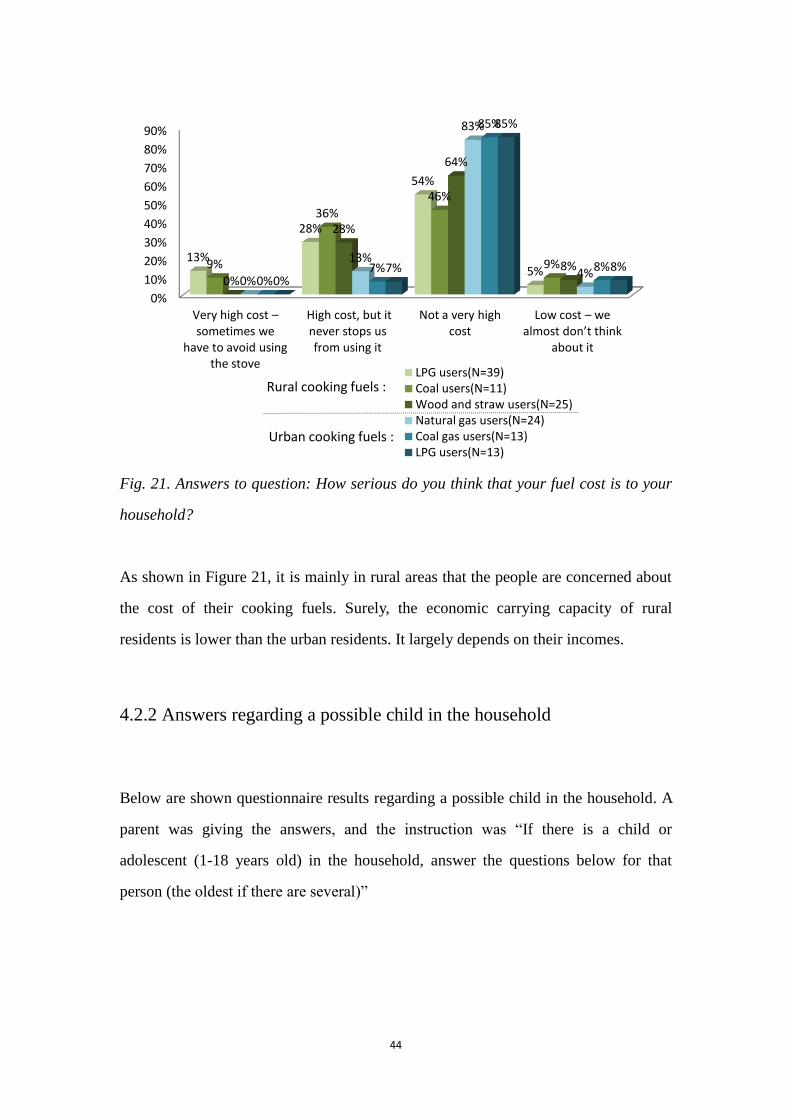
Fig. 21. Answers to question: How serious do you think that your fuel cost is to your
household?
As shown in Figure 21, it is mainly in rural areas that the people are concerned about
the cost of their cooking fuels. Surely, the economic carrying capacity of rural
residents is lower than the urban residents. It largely depends on their incomes.
4.2.2 Answers regarding a possible child in the household
Below are shown questionnaire results regarding a possible child in the household. A
parent was giving the answers, and the instruction was “If there is a child or
adolescent (1-18 years old) in the household, answer the questions below for that
person (the oldest if there are several)”
0%
10%
20%
30%
40%
50%
60%
70%
80%
90%
Very high cost – sometimes we
have to avoid using the stove
High cost, but it never stops us from using it
Not a very high cost
Low cost – we almost don’t think
about it
13%
28%
54%
5% 9%
36%
46%
9%
0%
28%
64%
8% 0%
13%
83%
4% 0%
7%
85%
8% 0%
7%
85%
8%
LPG users(N=39) Coal users(N=11) Wood and straw users(N=25) Natural gas users(N=24) Coal gas users(N=13) LPG users(N=13)
Rural cooking fuels :
Urban cooking fuels :
45
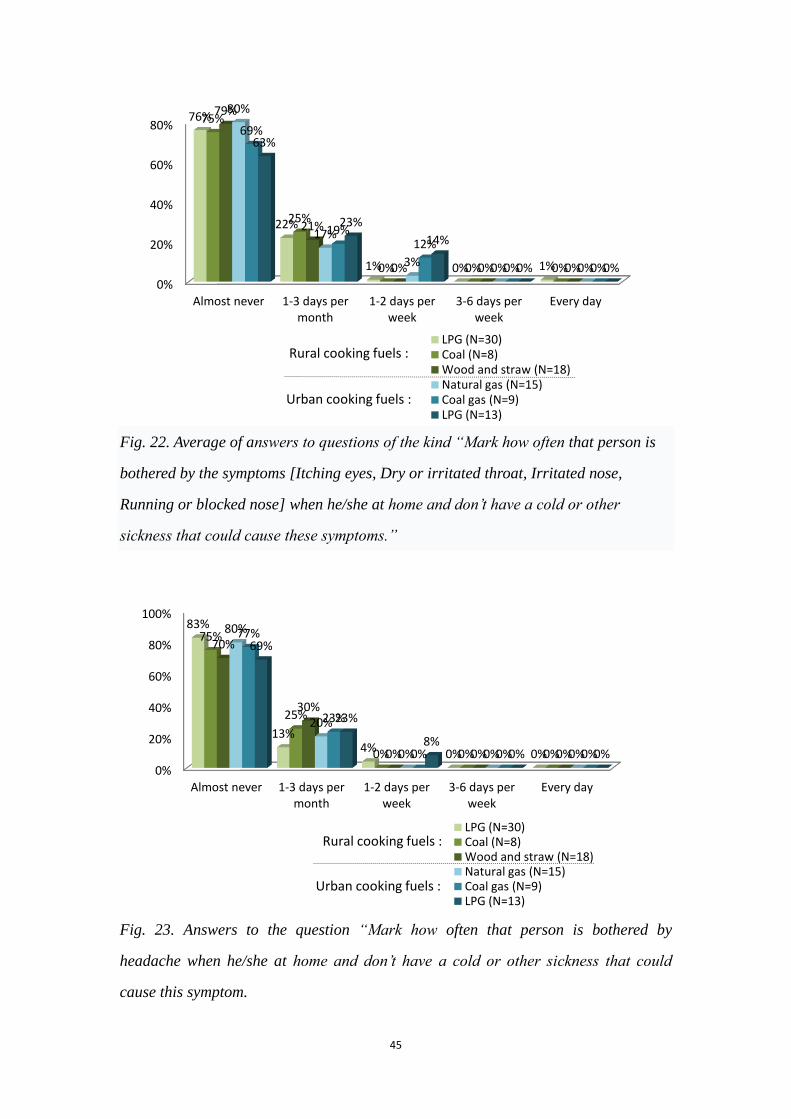
Fig. 22. Average of answers to questions of the kind “Mark how often that person is
bothered by the symptoms [Itching eyes, Dry or irritated throat, Irritated nose,
Running or blocked nose] when he/she at home and don’t have a cold or other
sickness that could cause these symptoms.”
Fig. 23. Answers to the question “Mark how often that person is bothered by
headache when he/she at home and don’t have a cold or other sickness that could
cause this symptom.
0%
20%
40%
60%
80%
Almost never 1-3 days per month
1-2 days per week
3-6 days per week
Every day
76%
22%
1% 0% 1%
75%
25%
0% 0% 0%
79%
21%
0% 0% 0%
80%
17%
3% 0% 0%
69%
19% 12%
0% 0%
63%
23%
14%
0% 0%
LPG (N=30) Coal (N=8) Wood and straw (N=18) Natural gas (N=15) Coal gas (N=9) LPG (N=13)
Rural cooking fuels :
Urban cooking fuels :
0%
20%
40%
60%
80%
100%
Almost never 1-3 days per month
1-2 days per week
3-6 days per week
Every day
83%
13% 4% 0% 0%
75%
25%
0% 0% 0%
70%
30%
0% 0% 0%
80%
20%
0% 0% 0%
77%
23%
0% 0% 0%
69%
23%
8% 0% 0%
LPG (N=30) Coal (N=8) Wood and straw (N=18) Natural gas (N=15) Coal gas (N=9) LPG (N=13)
Rural cooking fuels :
Urban cooking fuels :
46
As shown in figure 22, about the symptoms of children when they are at home and
don’t have a cold or other sickness, there tend to be more symptoms in the urban
children than in the rural ones. Overall, however, the difference of all the cooking
fuels is not so big, and most of children have light or no symptoms.
4.2.3 Answers from a person in the household who usually don’t do the
cooking of food
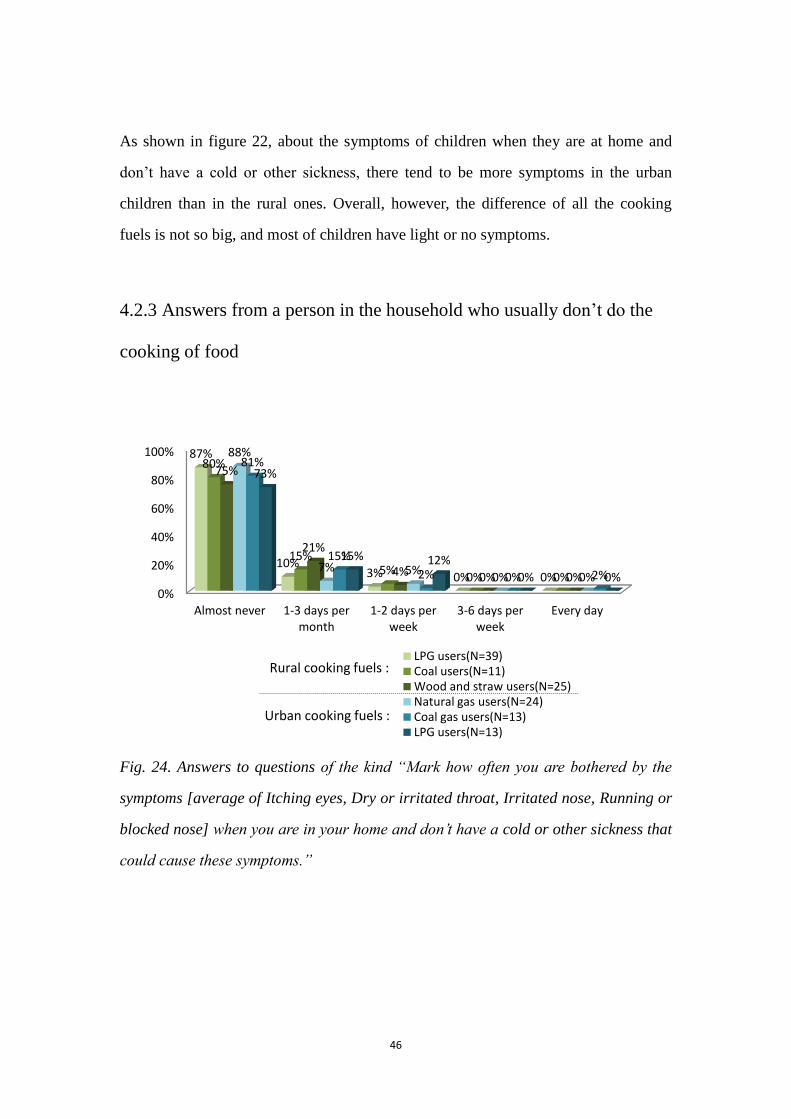
Fig. 24. Answers to questions of the kind “Mark how often you are bothered by the
symptoms [average of Itching eyes, Dry or irritated throat, Irritated nose, Running or
blocked nose] when you are in your home and don’t have a cold or other sickness that
could cause these symptoms.”
0%
20%
40%
60%
80%
100%
Almost never 1-3 days per month
1-2 days per week
3-6 days per week
Every day
87%
10% 3% 0% 0%
80%
15% 5%
0% 0%
75%
21%
4% 0% 0%
88%
7% 5% 0% 0%
81%
15%
2% 0% 2%
73%
15% 12%
0% 0%
LPG users(N=39) Coal users(N=11) Wood and straw users(N=25) Natural gas users(N=24) Coal gas users(N=13) LPG users(N=13)
Rural cooking fuels :
Urban cooking fuels :
47
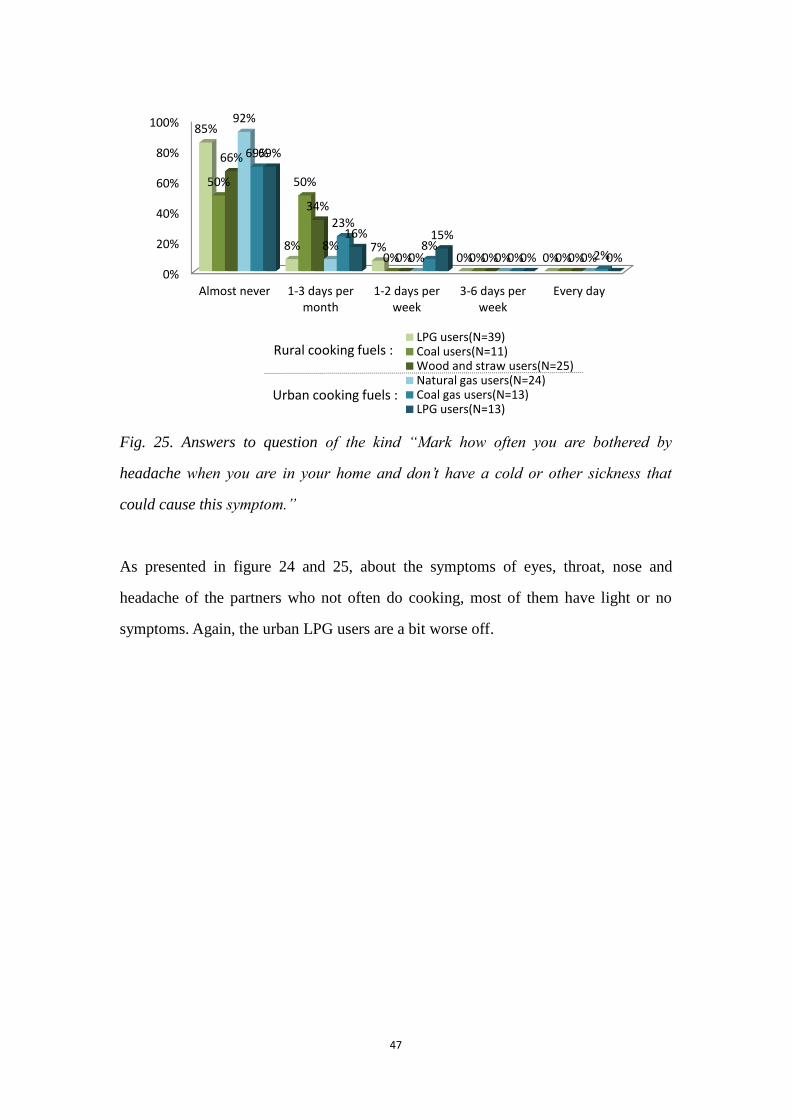
Fig. 25. Answers to question of the kind “Mark how often you are bothered by
headache when you are in your home and don’t have a cold or other sickness that
could cause this symptom.”
As presented in figure 24 and 25, about the symptoms of eyes, throat, nose and
headache of the partners who not often do cooking, most of them have light or no
symptoms. Again, the urban LPG users are a bit worse off.
0%
20%
40%
60%
80%
100%
Almost never 1-3 days per month
1-2 days per week
3-6 days per week
Every day
85%
8% 7% 0% 0%
50% 50%
0% 0% 0%
66%
34%
0% 0% 0%
92%
8% 0% 0% 0%
69%
23%
8% 0% 2%
69%
16% 15%
0% 0%
LPG users(N=39) Coal users(N=11) Wood and straw users(N=25) Natural gas users(N=24) Coal gas users(N=13) LPG users(N=13)
Rural cooking fuels :
Urban cooking fuels :
48
4.2.4 Comparison between cooking adult, non-cooking adult and children
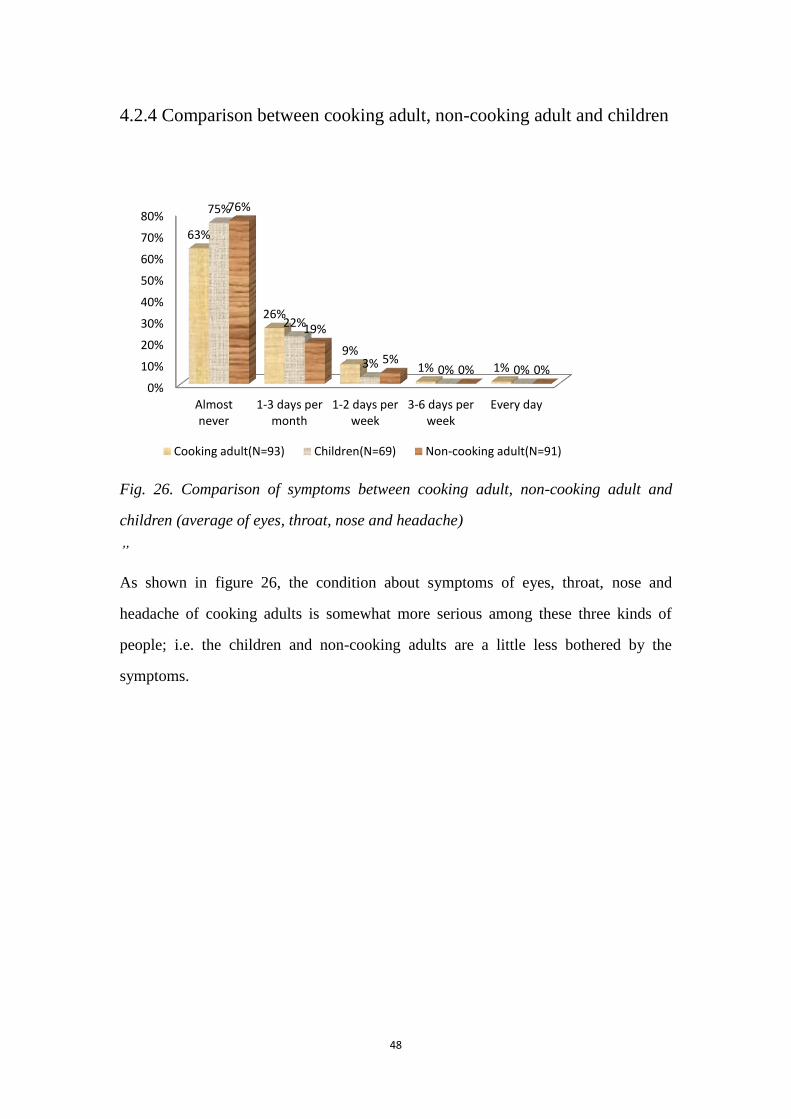
Fig. 26. Comparison of symptoms between cooking adult, non-cooking adult and
children (average of eyes, throat, nose and headache)
”
As shown in figure 26, the condition about symptoms of eyes, throat, nose and
headache of cooking adults is somewhat more serious among these three kinds of
people; i.e. the children and non-cooking adults are a little less bothered by the
symptoms.
0%
10%
20%
30%
40%
50%
60%
70%
80%
Almost never
1-3 days per month
1-2 days per week
3-6 days per week
Every day
63%
26%
9%
1% 1%
75%
22%
3% 0% 0%
76%
19%
5% 0% 0%
Cooking adult(N=93) Children(N=69) Non-cooking adult(N=91)
49
4.2.5 Other field survey data on participating households and their
cooking fuels
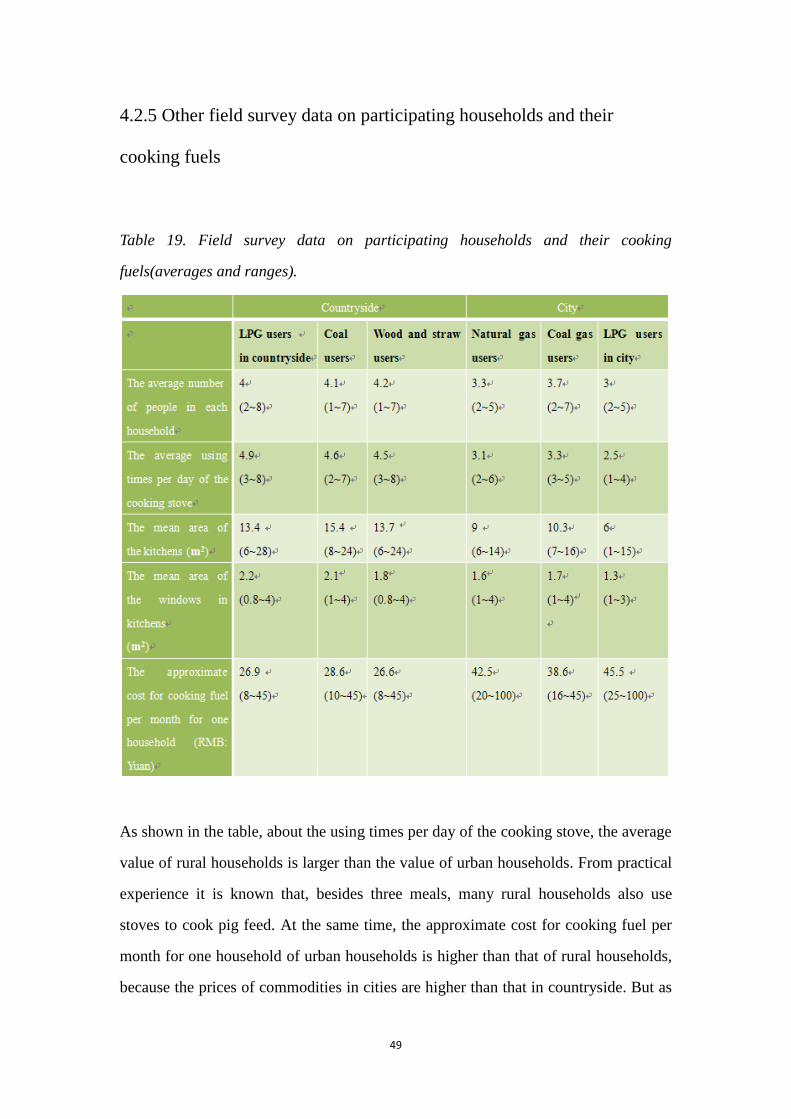
Table 19. Field survey data on participating households and their cooking
fuels(averages and ranges).
As shown in the table, about the using times per day of the cooking stove, the average
value of rural households is larger than the value of urban households. From practical
experience it is known that, besides three meals, many rural households also use
stoves to cook pig feed. At the same time, the approximate cost for cooking fuel per
month for one household of urban households is higher than that of rural households,
because the prices of commodities in cities are higher than that in countryside. But as
50
was noticed in Figure 21, it is mainly in rural areas that the people are concerned
about the cost of their cooking fuels. The reason is probably that the economic
carrying capacity of rural residents is lower than the urban residents. It largely
depends on their incomes.
Because in China the population density of cities is much higher than countryside, the
mean area of rooms in rural households is larger than that in urban households. So the
mean area of the kitchens in rural China is larger than that in cities. In general, the
cooking fuels of rural households are not so good, but the relatively large kitchen
space is in favor of reducing the contaminants concentrations from cooking fuels
combustion of kitchen air.
51
5. Discussion
Indubitably, electricity is the cleanest cooking fuel, because with this there is no fuel
combustion in the kitchen. But the heating power of electricity is relatively low
compared with other cooking fuels, and many Chinese foods need high heating
capacity to cook. So in China, it is not one of the main cooking fuels, and only a small
number of people choose electricity for cooking. Meanwhile, this part of people also
have other cooking fuels in their families, and electricity is only a spare fuel for them.
So other main cooking fuels in China are studied and discussed in this paper.
From the results of questionnaire investigation, it can be found that in China, most of
people who often do the cooking of food are female, and the average age is between
25-40 years old. It means that women are more affected by the contaminants from
cooking fuel combustion.
Most people have used their one and same kind of cooking fuel for a long time. Only
a few of them want to change their cooking fuels although their cooking fuels are not
environment-friendly, probably because they are accustomed to using the present fuel.
Through the field survey, it was found that in the countryside, almost all villages do
not have schools, the children have to go to schools of nearby towns or cities, and
only go back home one night per week, or even once per month. So most of the time
the children are not at home. And when they are at home, they practically always stay
in another room than the kitchen. In cities, the children usually also stay in another
room when the adult is cooking. Similarly, the person who is not responsible for
cooking usually stays in another room when his/her partner is cooking in kitchen. And
the field survey shows that most of households have a separate kitchen. At the same
time, the literature review above shows that the cooking fuels mainly affect the air
52
quality of the kitchens, and almost have no influence on bedroom air quality. For the
above reasons, the pollutions from cooking fuels seem to have little effect on the
children and non-cooking adults.
Figure 26 shows that comparing with non-cooking adults and children, the condition
about symptoms of eyes, throat, nose and headache of cooking adults is the more
serious. Children and non-cooking adult are a bit less bothered by the symptoms. This
indicates that the cooking environment have an influence on human health. The main
influence factor about the cooking environment is probably the contaminants from
cooking fuels combustion.
About the symptoms of “itching eyes, dry or irritated throat, irritated nose, running or
blocked nose and headache when cooking adults are at home and don’t have a cold or
other sickness that could cause these symptoms”, in general, most of cooking adults
state that they are not seriously bothered by them, and the conditions of urban
residents tend to be better than rural residents. The symptoms of LPG users who live
in the countryside are the lightest comparing with other rural cooking fuels users, and
the condition of wood and straw users is the worst. Of these, it was obvious that wood
and straw combustion has great influence on eyes. In the city, the condition of natural
gas users is the best among all the urban cooking fuels users.
About the LPG, the symptoms of cooking adults who live in the countryside are better
than the urban users. About these symptoms of children when they are at home and
don’t have a cold or other sickness, figure 22 shows that there tend to be more
symptoms in the urban children than in the rural ones. This might be due to probably
more other air pollutions in outdoor air in the cities. For example, the traffic pollution
in cities is more serious than on the countryside. This has adverse influence on city
ambient air and human health.
As can be seen in Figure 14, it appears that headache of LPG users who live in cities
53
is unexpectedly outstanding. It is correlated with the cooking fuel, but maybe there
are some other reasons. For example, urban residents might be more stressed than
those on the countryside, or the source of LPG in this area where this investigation
was conducted is not so good. In addition, because the range of participants is narrow,
some the possible error and inaccuracy maybe exist.
From the results of the questionnaire investigation, it can be found that most of people
feel that their symptoms of itching eyes, dry or irritated throat, irritated nose, running
or blocked nose and headache are worse when they are cooking in the kitchens. This
suggests that the cooking environment has a great influence on human health. And the
main influence factor about the cooking environment is most likely the contaminants
from cooking fuels combustion. Of these, wood and straw users’ condition is the most
severe in all rural residents, where the condition of LPG users instead is
comparatively good. In the city, the condition of natural gas users is relatively better.
This indicates that cooking has more serious influence on eyes, throat, nose and
headache by wood and straw, and the effect from natural gas is relatively light. In
summary, the cooking conditions of urban residents seem to be better than that of the
people who live in the countryside.
Through the investigation, some of the respondents said that they have been
accustomed to the cooking environment, and generally they do not consider much
about the feelings of eyes, throat nose and headache which are caused by cooking.
Most of the respondents believe that cooking stoves can emit unhealthy pollutions to
the indoor air, while they tend to think that their own cooking stoves emit not so much.
Perhaps this indicates a kind of escapism or self-deception: “I don’t want to believe
that it is bad in my household”. Quite a few of the respondents state that they are not
particularly sure about their answers. This indicates that they are not familiar with this
kind of knowledge, and that more information on these matters might be needed to
Chinese citizens.
54
The literatures about ventilation experiments, reviewed above, suggest that ventilation
has influence on indoor air quality. The data showed that mechanical ventilation was
superior to natural ventilation, and natural ventilation was better than airtight
condition. Through the questionnaire investigation, it was found that almost all the
kitchens have windows, and that people often open them when they are cooking. At
the same time, most of households have cooker hoods in their kitchens, but quite a
few of rural residents do not often adjust the fan speed to increase the ventilation
when they are cooking. So it is essential to strengthen their consciousness about this
field.
The survey shows that in rural China, many stoves which use wood and coal as
cooking fuels are installed in the yard, so the contaminants from the cooking fuels
combustion are probably to a little extent entering the rest of the household, but will
still have great influence on the outdoor environment.
To sum up, extensive and effective information about cooking fuels is very necessary
in China. Choosing a good and suitable cooking fuel is not only beneficial to indoor
air quality and human health, but also helpful to reduce the outdoor environment
pollution. So promoting the consciousness of this area is important for people.
Some uncertainties of the present study should be noted. Firstly, there appears to be
no accurate statistical data to show the number of users and the consumption about
each kind of cooking fuel in China. So in this study it is difficult to exactly compare
the usage amount and other relevant information of different cooking fuels. Secondly,
the questionnaire investigation was conducted only in the two cities of China, and the
number of respondents is quite restricted. If conditions permit, a similar study with
broader and wider scope of investigation would better reflect the actual situation. The
symptoms of eyes, nose and throat are also related to the pollution of the traffic. So
these symptoms from different cooking fuels should be compared according to the

55
different areas with different traffic situations. If possible, more related literature
should be read and used for reference, thus it will be more evidence-based and
powerful to explain the studied topics.
56
6. Conclusions
In China, natural gas, coal gas and liquefied petroleum gas (LPG) are the main
cooking fuels of urban residents. About the heating values of these three fuels, LPG is
the highest one, followed by natural gas and coal gas. Although the heating value of
natural gas is little lower that LPG, the concentrations of CO, NO2 and other
contaminants from cooking fuels combustion are the lowest in natural gas households.
In contrast, the contaminant values of liquefied petroleum gas group are relatively
high. At the same time, from the results of the questionnaire, it was easy to see that
the pollution level of the wall which is around stove was lowest with natural gas
among these three cooking fuels. About the symptoms of “itching eyes, dry or
irritated throat, irritated nose, running or blocked nose and headache when people are
at home and don’t have a cold or other sickness that could cause these symptoms”, the
condition of natural gas users was the best among all the urban cooking fuels users.
Also, about the symptoms above often being worse when people are cooking food in
the kitchen, the condition of natural gas users was relatively better.
In addition, natural gas is composed primarily of methane. This is a relatively safe
fuel. In contrast, the mainly combustible component of coal gas is CO. If there is a
leakage and CO releases into indoor environment, there is a risk to cause CO
poisoning. And when the gas concentration reaches the explosive limits and contacts
open flame or electric spark, it will cause explosion. So from the health, safety and
environment perspectives, utilization of natural gas as the cooking fuel is a good
choice for people. In recent years, more and more cities of China have united in
installing the natural gas pipelines in each household. This brings many conveniences
to people.
In rural China, wood, straw, coal, biogas and LPG are the main cooking fuels. About
57
the heating values of these three fuels, LPG is the highest one, followed by wood,
biogas and coal. Thanks to effective information, many people know that exceeding
cut of trees will consume great amount of forest, and further destroy ecological
environment. So in recent years, more and more rural households have abandoned
wood and choose coal and liquefied petroleum gas (LPG) as their cooking fuels.
According to the reviewed experimental studies, coal combustion has the most serious
influence on the quality of kitchen air, while LPG and biogas are relatively clean.
Although large numbers of contaminants are produced by coal combustion, many
people who live in the countryside still use coal as their cooking fuel. This is because
China is rich in coal resource, and at the same time the price of this fuel is relatively
cheap.
Based on reviewed studies, biogas is a clean, efficient, and renewable source of
energy. Production and utilization of biogas in countryside can not only effectively
reduce the per capita fuel consumption in rural families by replacing partly wood,
straw, and coal, – thus improving the problem of energy shortage –, but also reduce
the environmental pollutions which cause e.g. the greenhouse effect. Although there
are some advantages of utilizing biogas for cooking in rural China, there are still
many disadvantages and problems in biogas utilization. Firstly, many local
governments have difficulties in fund investment, and peasant households have to
undertake more expenses by themselves. Secondly, the ferment raw material is
insufficiency. Thirdly, there is a shortage of rural laborers. Besides, neglecting
management, lagging follow-up service, low comprehensive energy utilization
efficiency are additional problems in biogas projects. For these reasons, the promotion
of using biogas for cooking appears not a very good and effective action.
The main contaminants from cooking fuels combustion are carbon oxides, nitrogen
oxides, sulfur oxides, oxygen-containing hydrocarbon, polycyclic aromatic
hydrocarbon, fluoride, metal oxide, non- metal oxide and suspended particulate matter.
58
They are harmful to human health. Long-term inhalation may cause many diseases
such as dizziness, chronic cough, chronic bronchitis, allergic rhinitis and neurasthenic
syndrome. In severe cases, it will affect respiratory system, heart, hematological
system, immune system and endocrine system.
From the field survey above, it was found that many people seem to be uncertain
about how hazardous cooking emissions are. This indicates that they are not familiar
with this kind of knowledge. Therefore, it is necessary to reinforce the education and
strengthen their consciousness about this field. For example, government can
publicize strongly the knowledge about contaminants from cooking fuels combustion,
encourage residents to choose a clean cooking fuel, adopt efficient ventilation and so
on. Further, it is important to cultivate this consciousness from childhood.
Among all the factors which are related to the indoor environment and human health,
the pollution from cooking fuels combustion is one of the most important aspects.
Since there is circulation and exchange of indoor air and outdoor air, and at the same
time, in rural China, many stoves which use wood and coal as cooking fuels are
installed in the yard, the contaminants from cooking fuel combustion have influence
on the outdoor environment.
In conclusion, the factors about contaminants from the fuel combustion,
environmental protection, safety and human health should be comprehensively
considered when choosing fuel for cooking.
More work need to be done in order to acquire more knowledge about the cooking
fuels in the future. For example, the combustion characteristics, present resources and
cost of production, pollutant emission and utilization condition of each kind of
cooking fuels in China should be researched and studied in more detail. Some more
thorough analysis and comparisons are necessary. Especially, the contaminants from

59
cooking fuels combustion seriously affect human health. Further explorations about
the harm of cooking fuels to human need to be carried on. The utilization condition of
cooking fuels differs radically in the various regions of China, so more investigations
would be carried out in order to acquire reliable and accurate information.
60
7. References
[1] J.J. Sun, T. Wang and Y. Wang, The influence of natural gas combustion on air
quality of kitchen, Safety, vol. 03, Mar. 2006.
[2] H.E.S. Mestl, K. Aunan and H.M. Seip, Health benefits from reducing indoor air
pollution from household solid fuel use in China — Three abatement scenarios,
Environment International, vol. 33, pp. 831-840, Aug. 2007.
[3] Q.S. Jing, S.Q. Yang and X.M. Cheng, Indoor air pollution and human health
from fuels combustion in Puyang, Journal of Hygiene Research, vol. 01, Jan.
2007.
[4] Y.X. Wei, Daily fuels have influence on human health, Practical Preventive
Medicine, vol. 02, Apr. 2004.
[5] X.T. Zhou, X.Z. He and Y.T. Jin, Effects of Indoor Air Pollution by Cooking
Fuel on Respiratory Symptoms, Journal of environment and health, vol. 06, Nov.
1995.
[6] J.N. Wang, B.S. Chen, G.Q. Liu, Y. Zhang, Z.H. Zhao and L.Q. Lin, Hygienic
Evaluation of indoor Air Pollution Caused by Domestic Natural Gas, Chinese
Journal of Environmental Science, vol. 03, May. 1995.
[7] Q. Liu, L. Liu, X.Y. Wang, G.L. Chen, B. Wang, X.C. Pan and J.L. Zhang,
The Effects of Daily Fuels Combustion on Indoor Air Quality in Rural Area of
Northern Anhui Province, Journal of Environment and Health, vol. 08, Aug.
2011.
[8] Y. Liu, Y.Q. Kuang, N.S. Huang, Z.F. Wu and L.Z. Xu, Popularizing
household-scale biogas digesters for rural sustainable energy development and
greenhouse gas mitigation, Renewable Energy, vol. 33, pp. 2027-2035, Sep.
2008.
[9] NaturalGas.Org. Overview of Natural Gas.
http://www.naturalgas.org/overview/background.asp, downloaded on May 7,
61
2012.
[10] The proved natural gas reserves all over the world, Petroleum & Petrochemical
Today, vol. 08, Aug. 2011.
[11] X.Q. Ma, Analysis on combustion characteristics of natural gas and
interchangeability of other fuel gases with natural gas, Energy For Metallurgical
Industry, vol. 03, Jun. 2001.
[12] Baidu encyclopaedia website of China
http://baike.baidu.com/view/23992.htm, download on Mar 10, 2012.
[13] J. Zhang, China Has Overdraw the Coal Consumption of Ten Years, Energy and
Energy Conservation, vol. 01, Jan. 2011.
[14] C.F. You and X.C. Xu, Coal combustion and its pollution control in China,
Energy, vol. 35, pp. 4467-4472, Nov. 2010.
[15] X.C. Xu, C.H. Chen, H.Y. Qi, R. He, C.F. You and G.M. Xiang, Development of
coal combustion pollution control for SO2 and NOx in China, Fuel Processing
Technology, vol. 62, pp. 153-160, Feb. 2000.
[16] L.Y. Ma, Study on the Effecting Factors of Indoor Air Pollution Caused by
Domestic Fuel Use in Rural Guizhou, M.Sc. thesis, Dept. Environment and
Science, Guizhou Normal University, Guizhou, China, 2008.
[17] Q.S. Huang and Z.Y. Liu, Relationship between Replacement of Western Rural
Fuel and Environmental Protection, China Three Gorges Tribune, vol. 5, Sep.
2010.
[18] D.G. Streets and S.T. Waldhoff, Greenhouse-gas emissions from biofuel
combustion in Asia, Energy, vol. 24, pp. 841-855, Oct. 1999.
[19] S.C. Bhattacharya, P. A. Salam and M. Sharma, Emissions from biomass energy
use in some selected Asian countries, Energy, vol. 25, pp. 169-188, Feb. 2000.
[20] P.D. Zhang, Y.L. Yang and X.R. Li, Present Situation and Potentiality of Biogas
Comprehensive Utilization in China, China Biogas, vol. 5, Oct. 2007.
[21] W.D. Zhang and S. Atkiston, The characterization of polycyclic aromatic
hydrocarbons in particle emitted from different firewood burning in two
condition, Environmental Monitoring In China, vol. 5, Oct. 2003.
62
[22] B. Lu, S.F.Kong and B. Han, Inventory of atmospheric pollutants discharged
from biomass burning in China continent in 2007, China Environmental Science,
vol. 02, Feb. 2011.
[23] Z.X. Gao, M.D. Tang and Z.Y. Yi, Liquefied petroleum gas (LPG), coal and
wood combustions have influence on indoor air pollution and human health,
Chinese Journal of Public Health, vol. 01, Jan. 1993.
[24] Baidu encyclopaedia website of China
http://baike.baidu.com/view/43456.htm, download on Apr 09, 2012.
[25] J.J. Li, X. Zhuang, P. DeLaquil and E.D. Larson, Biomass energy in China and its
potential, Energy for Sustainable Development, vol. 5, pp. 66-80, Dec. 2001.
[26] X.Y. Zeng, Y.T. Ma and L.R. Ma, Utilization of straw in biomass energy in China,
Renewable and Sustainable Energy Reviews, vol. 11, pp. 976-987, Jun. 2007.
[27] K.R. Smith, Health, energy, and greenhouse-gas impacts of biomass combustion
in household stoves, Energy for Sustainable Development, vol. 1, pp. 23-29, Nov.
1994.
[28] X.H. Wang and J.F. Li, Influence of using household biogas digesters on
household energy consumption in rural areas—a case study in Lianshui County
in China, Renewable and Sustainable Energy Reviews, vol. 9, pp. 229-236, Apr.
2005.
[29] Z.M. Li, R.S. Tang, C.F. Xia, H.L. Luo and H. Zhong, Towards green rural
energy in Yunnan, China, Renewable Energy, vol. 30, pp. 99-108, Feb. 2005.
[30] Y. Liu, Y.Q. Kuang and N.S. Huang, Rural Biogas Development and Greenhouse
Gas Emission Mitigation, China Population Resources and Environment, vol. 03,
May. 2008.
[31] P.D. Zhang, G.M. Jia and G. Wang, Contribution to emission reduction of CO2
and SO2 by household biogas construction in rural China, Renewable and
Sustainable Energy Reviews, vol. 11, pp. 1903-1912, Oct. 2007.
[32] S.C. Bhattacharya, J.M. Thomas and P.A. Salam, Greenhouse gas emissions and
the mitigation potential of using animal wastes in Asia, Energy, vol. 22, pp.
1079-1085, Nov. 1997.
63
[33] G.J. Monteny, A. Bannink and D. Chadwick, Greenhouse gas abatement
strategies for animal husbandry, Agriculture, Ecosystems & Environment, vol.
112, pp. 163-170, Feb. 2006.
[34] S.P. Wang and J. Zheng, Current Situation,Problems and Countermeasures of the
Rural Household Biogas in Shandong Province, Management of Agricultural
Science and Technology, vol. 01, Feb. 2012.
[35] Baidu encyclopaedia website of China
http://baike.baidu.com/view/15037.htm, download on Apr 19, 2012
[36] Y.H. Ma, H. Man, L.Y. Liang and W.Y. Zhao, Study of Indoor Air Pollution due
to Combustion of Liquefied Petroleum Gas, Journal of Environment and Health,
vol. 5, Sep. 1998.
[37] Indoor Air Quality Standard, GB/T 18883-2002, The State Administration of
Quality Supervision, Inspection and Quarantine, Mar. 2003.
[38] L. Li, H.M. Liu, X.M. De and M.X. Tao, A research about indoor air pollution
from different fuels of Yinchuan in winter, Journal of Ningxia Medical College,
vol. 01, Feb. 2001.
[39] Z.W. Li, A.G. Ren and L.X. Guan, Investigation on indoor air pollution from coal
burning in rural area of Shanxi province, Chinese Journal of Public Health, vol.
06, Jun. 2006.
[40] B.Y.Xiao, Y. Hu and W.D. Luo, A study of the influence of winter heating on
indoor air quality in different type rural houses, Modern preventive medicine, vol.
03, Sep. 1995.
[41] Y. Zhang, J.N. Wang, B.S. Chen, G.Q. Liu, Z.H. Zhao and L.Q. Lin, Natural Gas
and Indoor Air Pollution: A Comparison With Coal Gas and Liquefied Petroleum
Gas, Biomedical and Environmental Sciences, vol. 03, Sep. 2003.
[42] J. Dou, Pollution situation and control of liquefied petroleum gas (LPG) and coal
gas, Railway Occupational Safety, Health & Environmental Protection, vol. 04,
Dec. 1986.
[43] B. Yi, Indoor air pollution and human health, Foreign Medical Sciences, vol. 03.
May. 2001.

64
[44] F.L. Wu, The harm of liquefied petroleum gas (LPG) and natural gas to human,
Fireprotection in Henan, vol. 11, Nov. 2003.
[45] J. Li, Indoor air pollution and human health effects from domestic gas fuels,
Chinese journal of coal, industry and medicine, vol. 04, Aug. 1998.
[46] S.G. Liu and Z.S. He, Study of the Relationship between Air Pollution in the
Kitchens and Health, Occupation and Health, vol. 12, Jun. 2008.
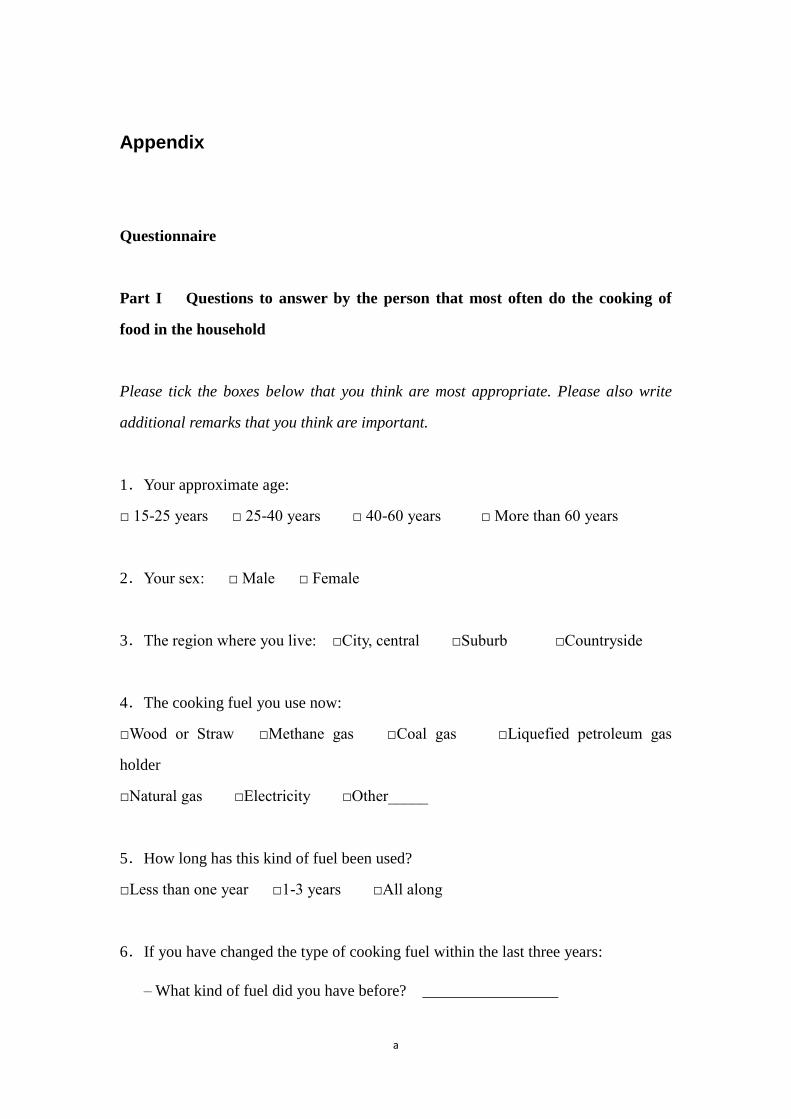
a
Appendix
Questionnaire
Part I Questions to answer by the person that most often do the cooking of
food in the household
Please tick the boxes below that you think are most appropriate. Please also write
additional remarks that you think are important.
1.Your approximate age:
□ 15-25 years □ 25-40 years □ 40-60 years □ More than 60 years
2.Your sex: □ Male □ Female
3.The region where you live: □City, central □Suburb □Countryside
4.The cooking fuel you use now:
□Wood or Straw □Methane gas □Coal gas □Liquefied petroleum gas
holder
□Natural gas □Electricity □Other_____
5.How long has this kind of fuel been used?
□Less than one year □1-3 years □All along
6.If you have changed the type of cooking fuel within the last three years:
– What kind of fuel did you have before? _________________
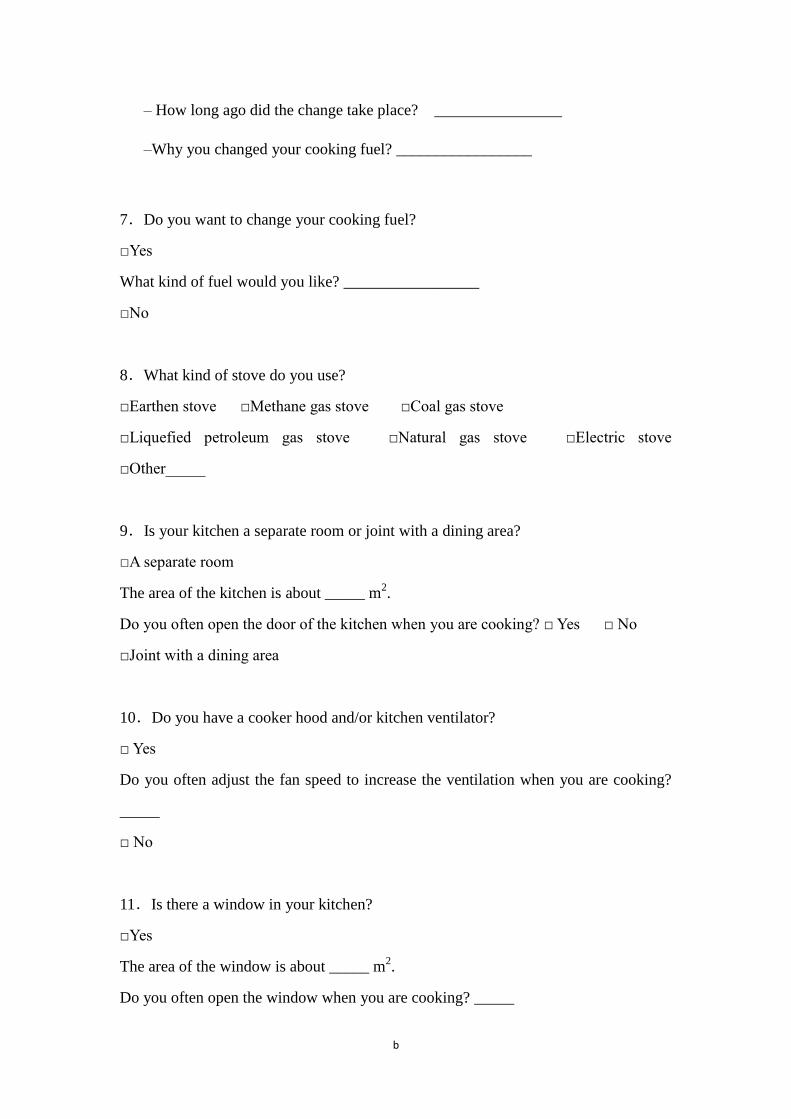
b
– How long ago did the change take place? ________________
–Why you changed your cooking fuel? _________________
7.Do you want to change your cooking fuel?
□Yes
What kind of fuel would you like? _________________
□No
8.What kind of stove do you use?
□Earthen stove □Methane gas stove □Coal gas stove
□Liquefied petroleum gas stove □Natural gas stove □Electric stove
□Other_____
9.Is your kitchen a separate room or joint with a dining area?
□A separate room
The area of the kitchen is about _____ m2.
Do you often open the door of the kitchen when you are cooking? □ Yes □ No
□Joint with a dining area
10.Do you have a cooker hood and/or kitchen ventilator?
□ Yes
Do you often adjust the fan speed to increase the ventilation when you are cooking?
_____
□ No
11.Is there a window in your kitchen?
□Yes
The area of the window is about _____ m2.
Do you often open the window when you are cooking? _____
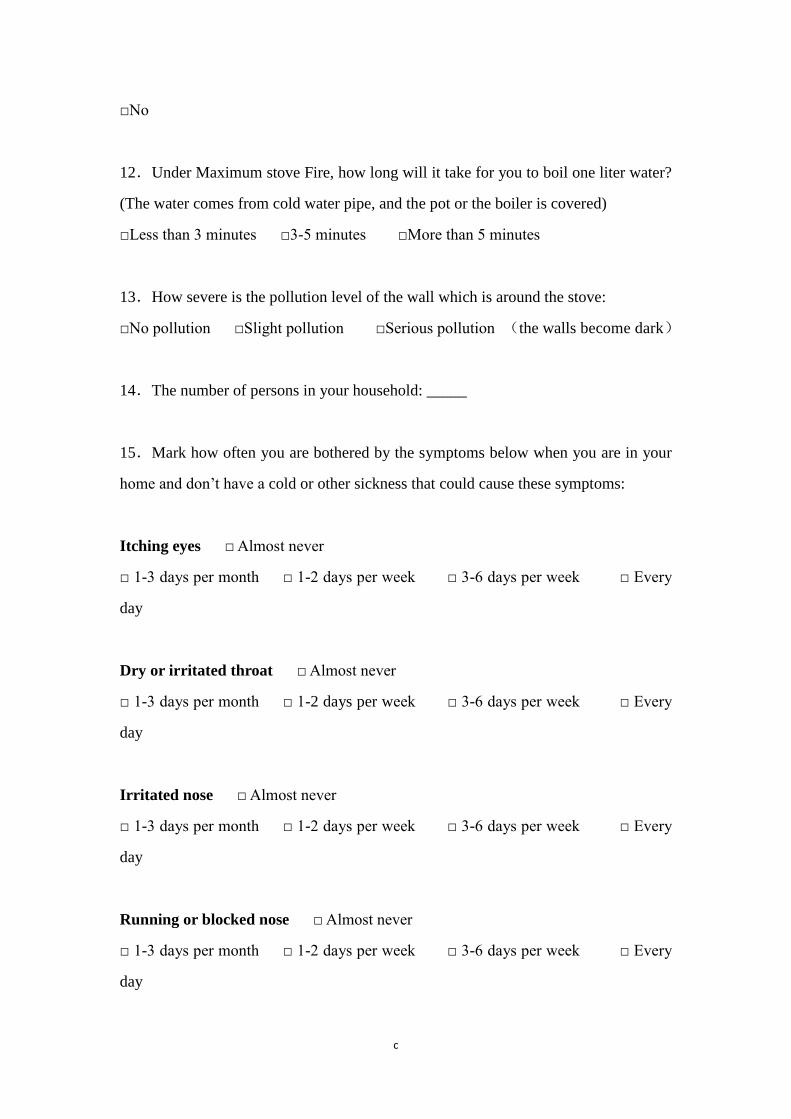
c
□No
12.Under Maximum stove Fire, how long will it take for you to boil one liter water?
(The water comes from cold water pipe, and the pot or the boiler is covered)
□Less than 3 minutes □3-5 minutes □More than 5 minutes
13.How severe is the pollution level of the wall which is around the stove:
□No pollution □Slight pollution □Serious pollution (the walls become dark)
14.The number of persons in your household: _____
15.Mark how often you are bothered by the symptoms below when you are in your
home and don’t have a cold or other sickness that could cause these symptoms:
Itching eyes □ Almost never
□ 1-3 days per month □ 1-2 days per week □ 3-6 days per week □ Every
day
Dry or irritated throat □ Almost never
□ 1-3 days per month □ 1-2 days per week □ 3-6 days per week □ Every
day
Irritated nose □ Almost never
□ 1-3 days per month □ 1-2 days per week □ 3-6 days per week □ Every
day
Running or blocked nose □ Almost never
□ 1-3 days per month □ 1-2 days per week □ 3-6 days per week □ Every
day
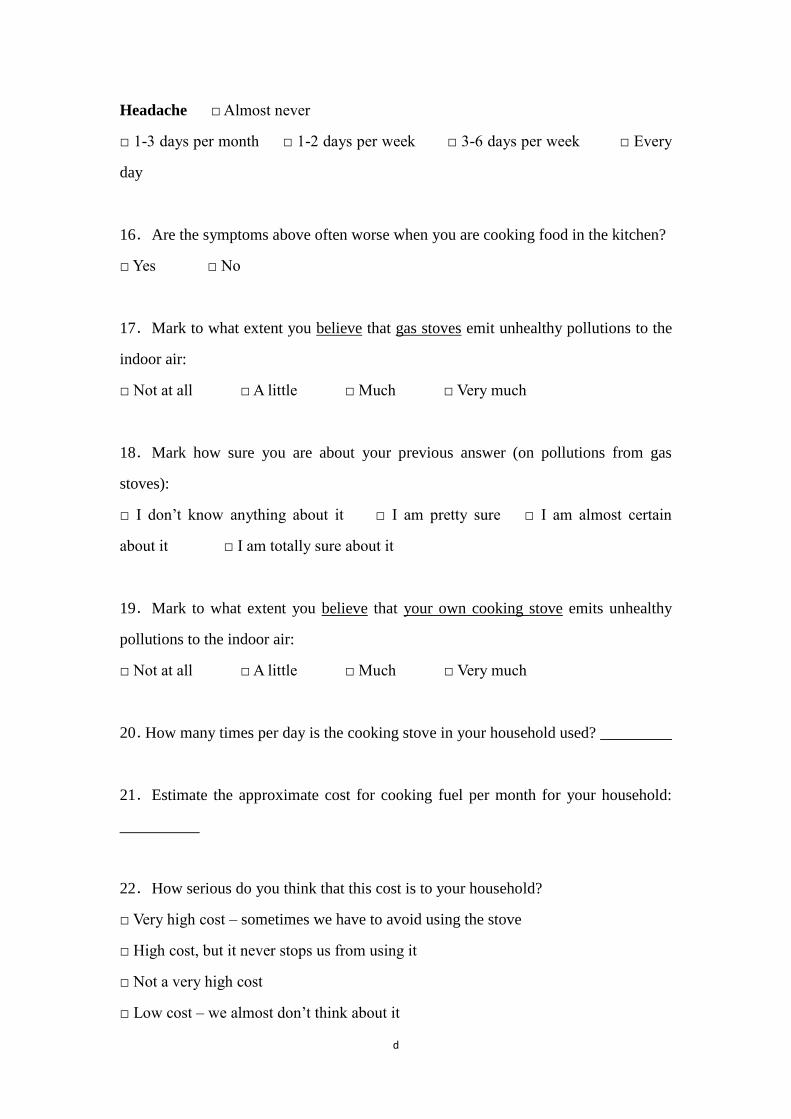
d
Headache □ Almost never
□ 1-3 days per month □ 1-2 days per week □ 3-6 days per week □ Every
day
16.Are the symptoms above often worse when you are cooking food in the kitchen?
□ Yes □ No
17.Mark to what extent you believe that gas stoves emit unhealthy pollutions to the
indoor air:
□ Not at all □ A little □ Much □ Very much
18.Mark how sure you are about your previous answer (on pollutions from gas
stoves):
□ I don’t know anything about it □ I am pretty sure □ I am almost certain
about it □ I am totally sure about it
19.Mark to what extent you believe that your own cooking stove emits unhealthy
pollutions to the indoor air:
□ Not at all □ A little □ Much □ Very much
20.How many times per day is the cooking stove in your household used? _________
21.Estimate the approximate cost for cooking fuel per month for your household:
__________
22.How serious do you think that this cost is to your household?
□ Very high cost – sometimes we have to avoid using the stove
□ High cost, but it never stops us from using it
□ Not a very high cost
□ Low cost – we almost don’t think about it
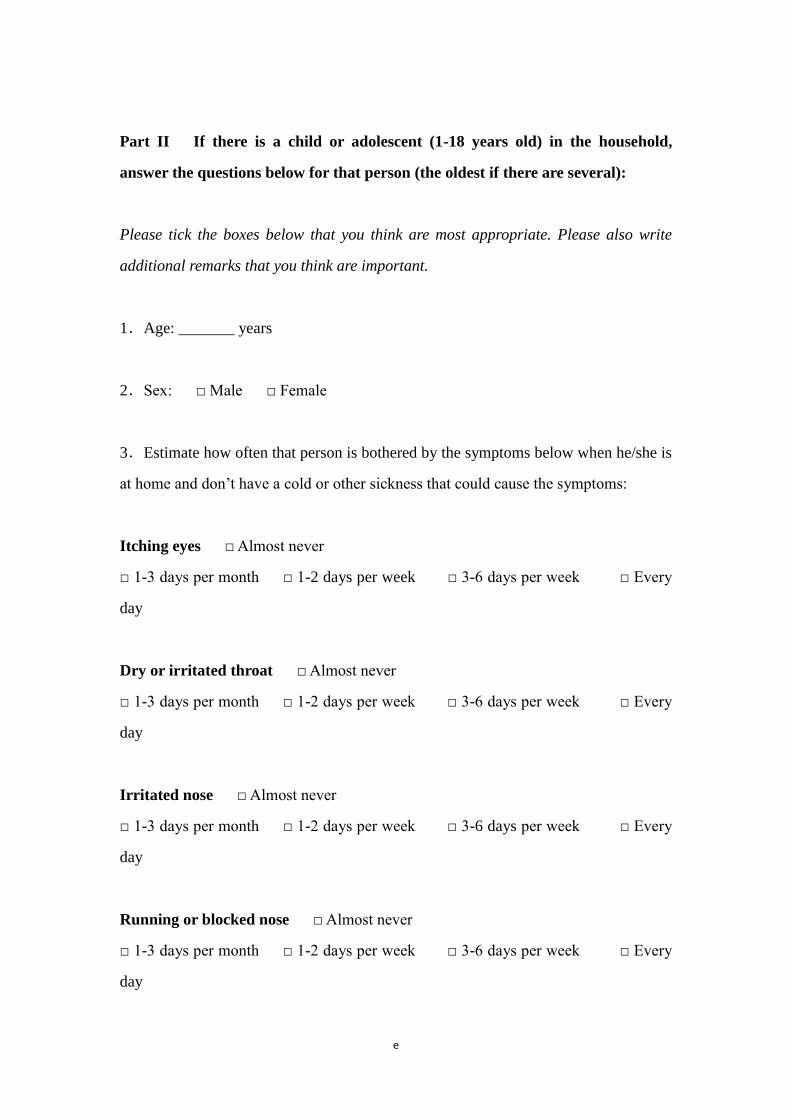
e
Part II If there is a child or adolescent (1-18 years old) in the household,
answer the questions below for that person (the oldest if there are several):
Please tick the boxes below that you think are most appropriate. Please also write
additional remarks that you think are important.
1.Age: _______ years
2.Sex: □ Male □ Female
3.Estimate how often that person is bothered by the symptoms below when he/she is
at home and don’t have a cold or other sickness that could cause the symptoms:
Itching eyes □ Almost never
□ 1-3 days per month □ 1-2 days per week □ 3-6 days per week □ Every
day
Dry or irritated throat □ Almost never
□ 1-3 days per month □ 1-2 days per week □ 3-6 days per week □ Every
day
Irritated nose □ Almost never
□ 1-3 days per month □ 1-2 days per week □ 3-6 days per week □ Every
day
Running or blocked nose □ Almost never
□ 1-3 days per month □ 1-2 days per week □ 3-6 days per week □ Every
day
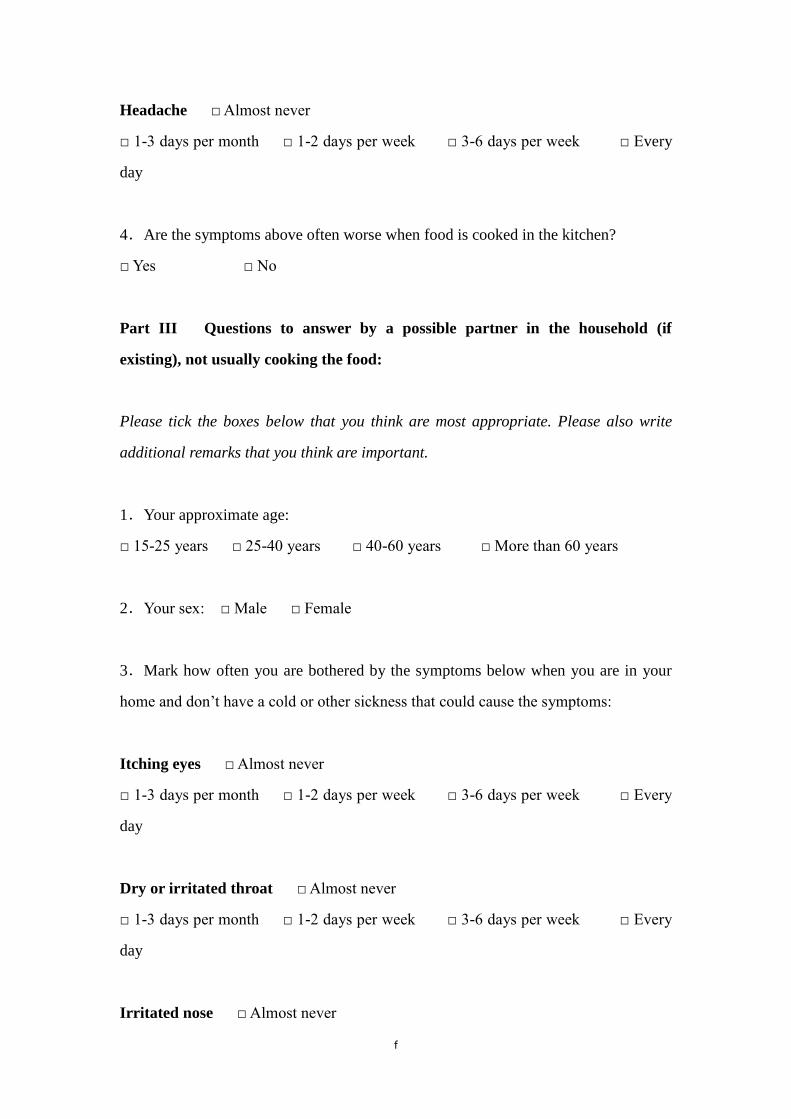
f
Headache □ Almost never
□ 1-3 days per month □ 1-2 days per week □ 3-6 days per week □ Every
day
4.Are the symptoms above often worse when food is cooked in the kitchen?
□ Yes □ No
Part III Questions to answer by a possible partner in the household (if
existing), not usually cooking the food:
Please tick the boxes below that you think are most appropriate. Please also write
additional remarks that you think are important.
1.Your approximate age:
□ 15-25 years □ 25-40 years □ 40-60 years □ More than 60 years
2.Your sex: □ Male □ Female
3.Mark how often you are bothered by the symptoms below when you are in your
home and don’t have a cold or other sickness that could cause the symptoms:
Itching eyes □ Almost never
□ 1-3 days per month □ 1-2 days per week □ 3-6 days per week □ Every
day
Dry or irritated throat □ Almost never
□ 1-3 days per month □ 1-2 days per week □ 3-6 days per week □ Every
day
Irritated nose □ Almost never
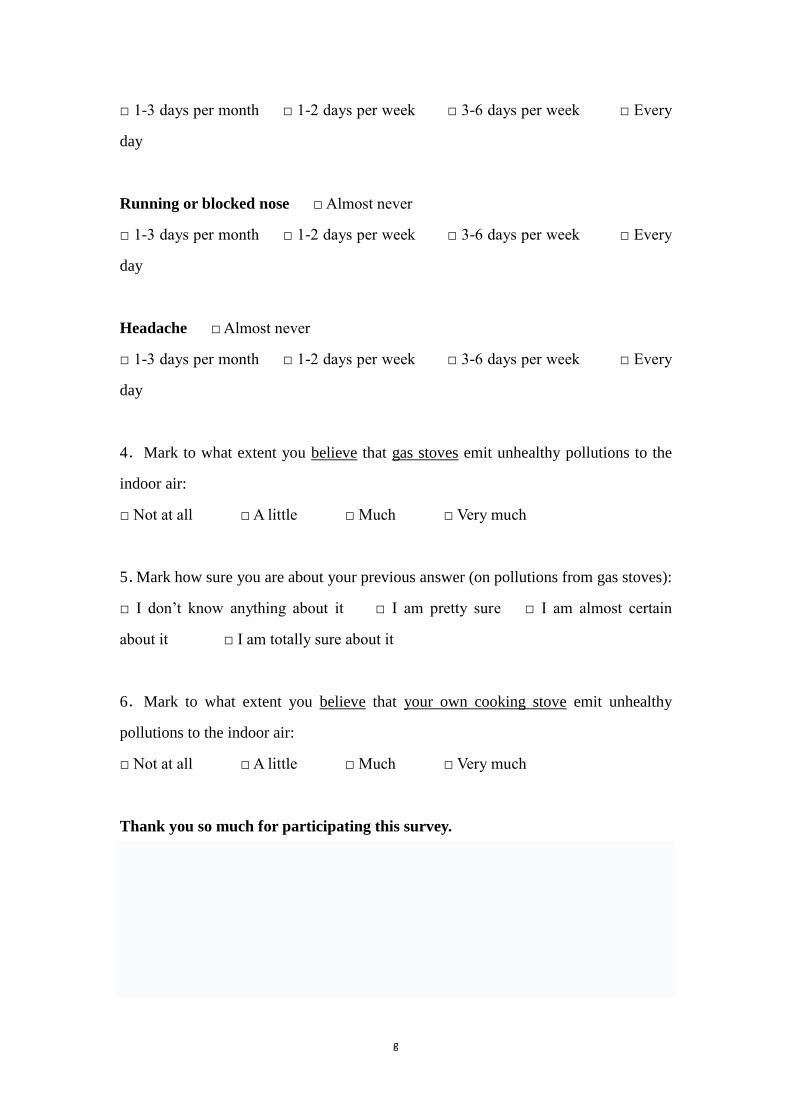
g
□ 1-3 days per month □ 1-2 days per week □ 3-6 days per week □ Every
day
Running or blocked nose □ Almost never
□ 1-3 days per month □ 1-2 days per week □ 3-6 days per week □ Every
day
Headache □ Almost never
□ 1-3 days per month □ 1-2 days per week □ 3-6 days per week □ Every
day
4.Mark to what extent you believe that gas stoves emit unhealthy pollutions to the
indoor air:
□ Not at all □ A little □ Much □ Very much
5.Mark how sure you are about your previous answer (on pollutions from gas stoves):
□ I don’t know anything about it □ I am pretty sure □ I am almost certain
about it □ I am totally sure about it
6.Mark to what extent you believe that your own cooking stove emit unhealthy
pollutions to the indoor air:
□ Not at all □ A little □ Much □ Very much
Thank you so much for participating this survey.