Embed Size (px)
Citation preview
Copper and Copper Alloys:
Studies of Additives
Igor Volov
Submitted in partial fulfillment of the requirements for the degree of Doctor of Philosophy in the Graduate School of Arts and Sciences
COLUMBIA UNIVERSITY
2013

© 2012
Igor Volov All rights reserved
Abstract
Copper and Copper Alloys:
Studies of Additives
Igor Volov
Electrodeposition of copper is used extensively for the fabrication of electrical
interconnects in semiconductor device manufacturing and in printed circuit board
production, as well as other industries. Copper is often plated from an acidic copper sulfate
electrolyte with a number of inorganic and organic constituents. Electrolyte enables filling
of complex surface geometries with desired internal and surface properties. Continuing
miniaturization of modern microelectronics requires a highly controlled electrodeposition
process and also requires interconnect materials with improved electromigration and stress
migration resistances. Thus, current research deals with two avenues that have a potential to
improve the process of copper electroplating and extend copper technology to meet the
challenges of future device dimensions.
The improvement in the plating process of copper is being sought by the integration
of an iron redox couple (Fe3+/Fe2+) to copper electrolytes. Certain benefits of incorporating
Fe3+/Fe2+ subsystem in combination with inert anode to the electrolyte have been previously
recognized, though without regards to the impact that Fe3+/Fe2+ can exert on the behavior of
additives. Organic additives are essential constituents of all copper plating baths. Therefore,
we studied how the presence of Fe3+/Fe2+ affects organics additives, with focus on two
representative components: polyethylene glycol (PEG) and bis(3-sulfopropyl)-disulfide
(SPS).
Electrochemical studies on a rotating disk electrode (RDE) and microfluidic device
showed that the behavior of PEG during copper deposition is not affected in the presence of
Fe3+ and Fe2+ ions. Kinetics of adsorption and desorption of PEG on copper electrode were
also unaffected. In contrast, the activity of SPS increased when Fe3+/Fe2+ were present in a
copper-plating bath. By means of the electrochemical analysis and investigation by high
performance liquid chromatography (HPLC), it was revealed that the Fe3+/Fe2+ redox couple
reacts with SPS to form 3-mercaptopropyl sulfonate (MPS) in the bulk solution. The ratio of
Fe3+/Fe2+ determined the reducing power of the electrolyte by changing the concentration of
MPS derived from SPS. The estimates of the standard reduction potential of SPS to MPS
reduction, based on equilibrium calculation with reference to HPLC results, put the
reduction potential in the range between 0.3 – 0.4 V vs. standard hydrogen electrode (SHE).
To facilitate the study SPS/MPS equilibrium in the presence of ferrous and ferric
ions, a new chromatographic method was developed for the detection of SPS, MPS,
monoxide-of-SPS, and dioxide-of-SPS from a copper electrolyte. An HPLC tool was
coupled with an electrochemical detector, which enabled concentration sampling in a range
of just a few parts per billion (ppb). Due to its low limit of detection and effective separation
of detectable compounds, this method can prove crucial for plating bath control, where very
little amount of certain byproducts may significantly decrease performance of the
electrolyte.
As technology advances to create smaller microelectronics, copper interconnects are
becoming more prone to failures by electromigration and stress migration effects. Copper
can potentially be made less susceptible to these effects if alloyed with about one weight
percent of another metal. Accordingly our research examined copper-silver (Cu-Ag) and
copper-tin (Cu-Sn) alloys as two possible applications in interconnect technology.
The main challenge for depositing silver from copper plating electrolytes, which
contain about 50 ppm of chloride, is the low solubility of silver ions with chloride. Together
with other additives, chloride is a crucial component promoting defect-free filling of surface
features. To overcome this challenge, it was shown that the application of pulse-plating
instead of direct current plating enabled the use of chloride at a substantial concentration,
while also allowing a wide range of Cu-Ag alloy compositions. Theoretical estimates of
alloy compositions were in agreement with experimental values at various pulse frequencies
and duty cycles, electrode rotation speeds, and electrolyte concentrations. However, organic
additives decreased incorporation of Ag into the alloy due to a possible complexing effect
on silver ion. It was also discovered that salt of copper (CuSO4·5H2O) from a number of
major chemical suppliers contains Ag as an impurity. Pulsating conditions were responsible
for an unwanted increased in surface roughness of the plated film alloys. However, the
addition of a leveling agent polyvinylpyrrolidone (PVP) at 10 ppm of chloride improved
roughness and surface quality of the deposited Cu-Ag thin films.
Electrodeposits of copper-tin alloy thin films were prepared from acidic copper
sulfate electrolytes by polarizing copper deposition into the region where Sn deposition
became possible. The ability to polarize copper deposition demonstrated with the use of
EPE, poly(ethylene glycol)-block-poly(propylene glycol)-block-poly(ethylene glycol), and
bromide in comparison to several other chemistries. Sn content between 0 – 7 at% was
obtained above the reduction potential of Sn2+. High Sn content of up to 20 at% was
achieved when Cu deposition was suppressed below the deposition potential of Sn2+ by the
combination of Br and EPE. A positive correlation between Sn content and concentration of
Sn2+ in the electrolyte was observed. Higher tin content in the alloy was also correlated with
low rotation speeds.
i
Table of Contents
CHAPTER 1
INTRODUCTION …………………………………………….…………………………. 1
Overview of Copper Interconnect Technology ………………………………..... 1
Copper Electroplating Electrolyte and Additives …………………………….... 2
Iron Redox Couple for Copper Deposition ………………………...…………... 3
Electrodeposition of Copper Alloys ………………………………………...…... 4
CHAPTER 2
INVESTIGATION OF COPPER PLATING AND ADDITIVE
INTERACTIONS IN THE PRESENCE OF FE3+/FE2+ REDOX COUPLE …..….. 11
ABSTRACT ……………………………………………………………………………………..… 11
INTRODUCTION ……………………………………………………………………………….... 12
EXPERIMENTAL ………………………………………………………………………………... 14
RESULTS AND DISCUSSION ………………………………………………………………….. 16
CONCLUSIONS ………………………………………………………………………………….. 21
CHAPETER 3
INTERACTION BETWEEN SPS AND MPS IN THE PRESENCE OF
FERROUS AND FERRIC IONS ………………………………………………..…….. 38
ABSTRACT ……………………………………………………………………………………..… 38
INTRODUCTION ……………………………………………………………………………….... 39
EXPERIMENTAL ………………………………………………………………………………... 42
RESULTS AND DISCUSSION ………………………………………………………………….. 44
CONCLUSIONS ………………………………………………………………………………….. 51
CHAPTER 4
ii
CHROMATOGRAPHY OF BIS-(3-SULFOPROPYL) DISULFIDE
AND ITS BREAKDOWN PRODUCTS BY HPLC COUPLED WITH
ELECTROCHEMICAL DETECTION ………………………………………………. 65
ABSTRACT ……………………………………………………………………………………..… 65
INTRODUCTION ……………………………………………………………………………….... 66
MATERIALS AND METHODS ..…………………………………………………………..….... 68
RESULTS AND DISCUSSION ……………………………………………………………….…. 70
CONCLUDING REMARKS ………………………………………………………………...…... 74
CHAPTER 5
PULSE-PLATING OF COPPER-SILVER ALLOYS FOR INTERCONNECT
APPLICATIONS ……………………………………………………………………….. 86
ABSTRACT ……………………………………………………………………………………….. 86
INTRODUCTION ……………………………………………………………………………….... 87
EXPERIMENTAL ………………………………………………………………………………... 88
RESULTS AND DISCUSSION ………………………………………………………………….. 92
CONCLUSIONS ……………………………………………………………………………….... 102
LIST OF SYMBOLS ………………………………………………………….………………... 102
CHAPTER 6
ELECTRODEPOSITION OF COPPER-TIN FILM ALLOYS FOR
INTERCONNECT APPLICATIONS ……………………………………………..… 117
ABSTRACT ……………………………………………………………………………………… 117
INTRODUCTION ……………………………………………………………………………….. 118
EXPERIMENTAL ………………………………………………………………………………. 120
RESULTS AND DISCUSSION ……………………………………………………………...…. 123
CONCLUSIONS …………………………………………………………………...……………. 128
CHAPTER 7
CONCLUSSIONS …………………………………………………………………...… 143
iii
List of Figures and Tables
Chapter 2
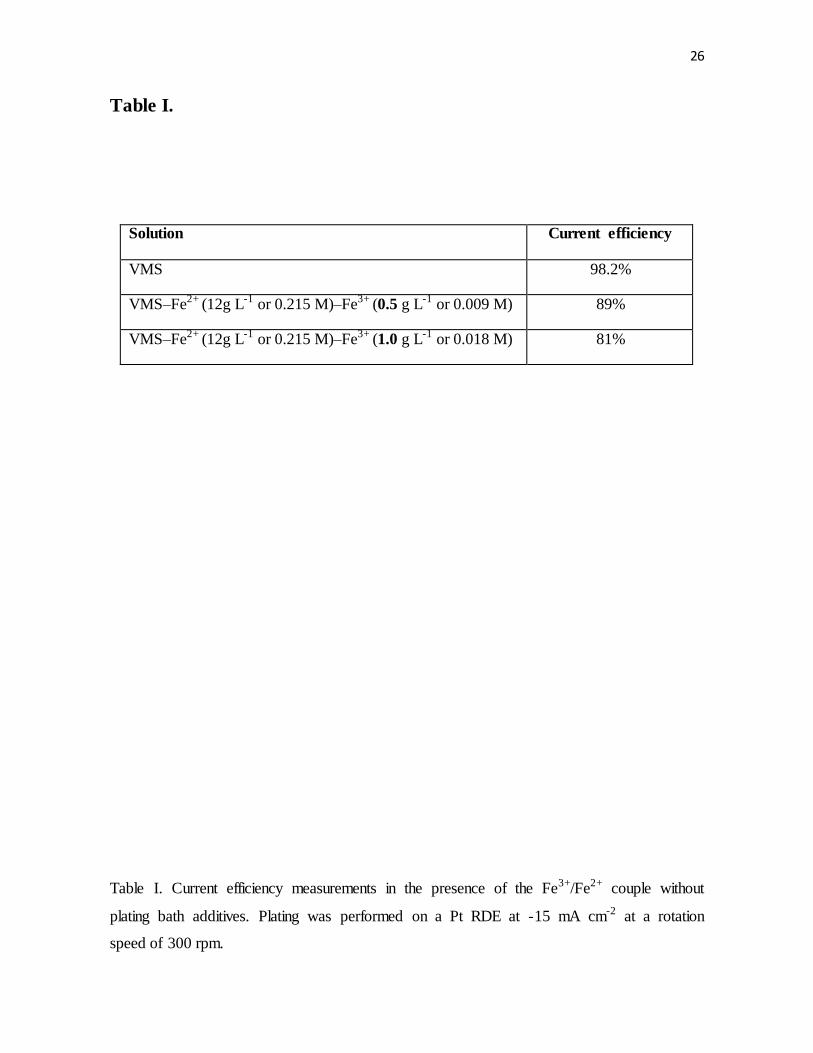
Table I. Current efficiency measurements in the presence of the Fe3+/Fe2+ couple without
plating bath additives. Plating was performed on a Pt RDE at -15 mA cm-2 at a rotation
speed of 300 rpm.
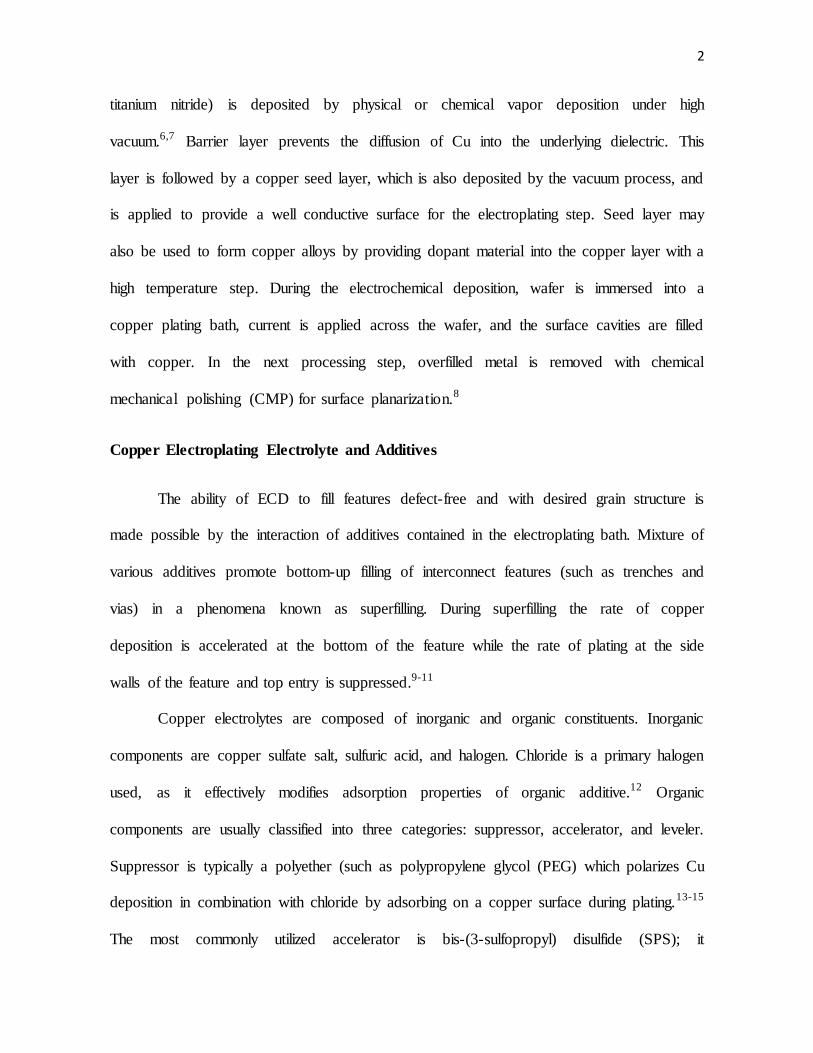
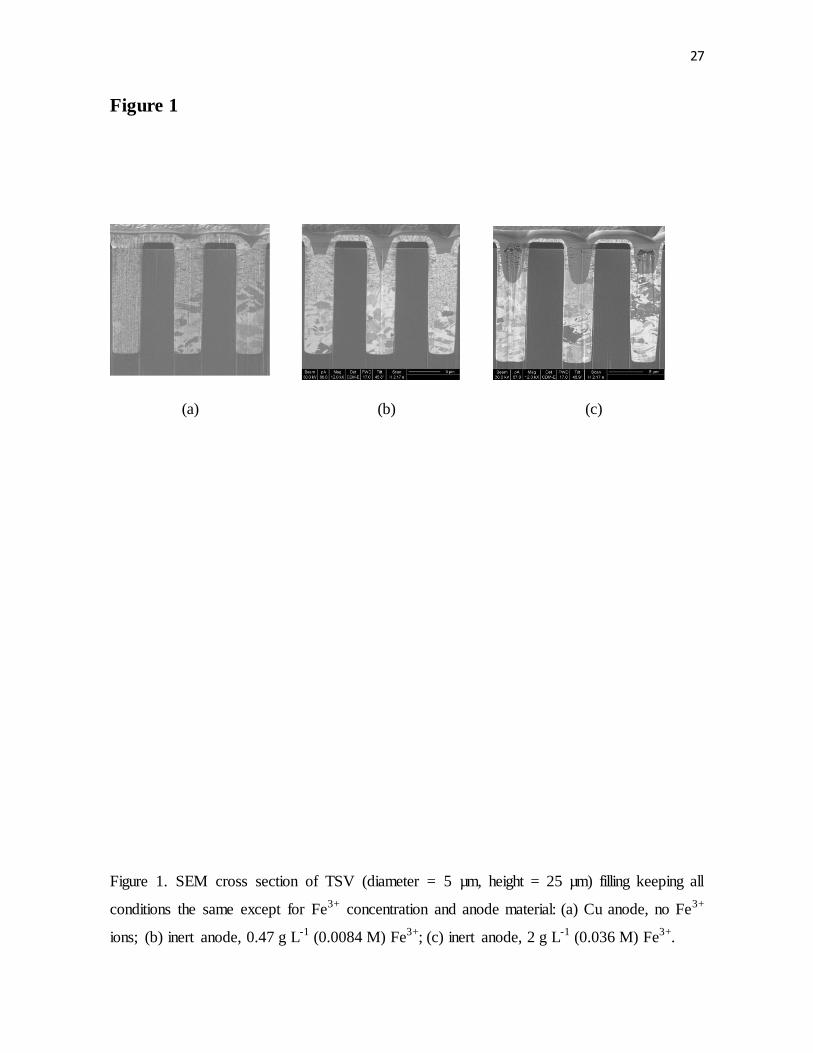
Figure 1. SEM cross sections of TSV (diameter = 5 µm, height = 25 µm) filling keeping all
conditions the same except for Fe3+ concentration and anode material: (a) Cu anode, no Fe3+
ions; (b) inert anode, 0.47 g L-1 (0.0084 M) Fe3+; (c) inert anode, 2 g L-1 (0.036 M) Fe3+.
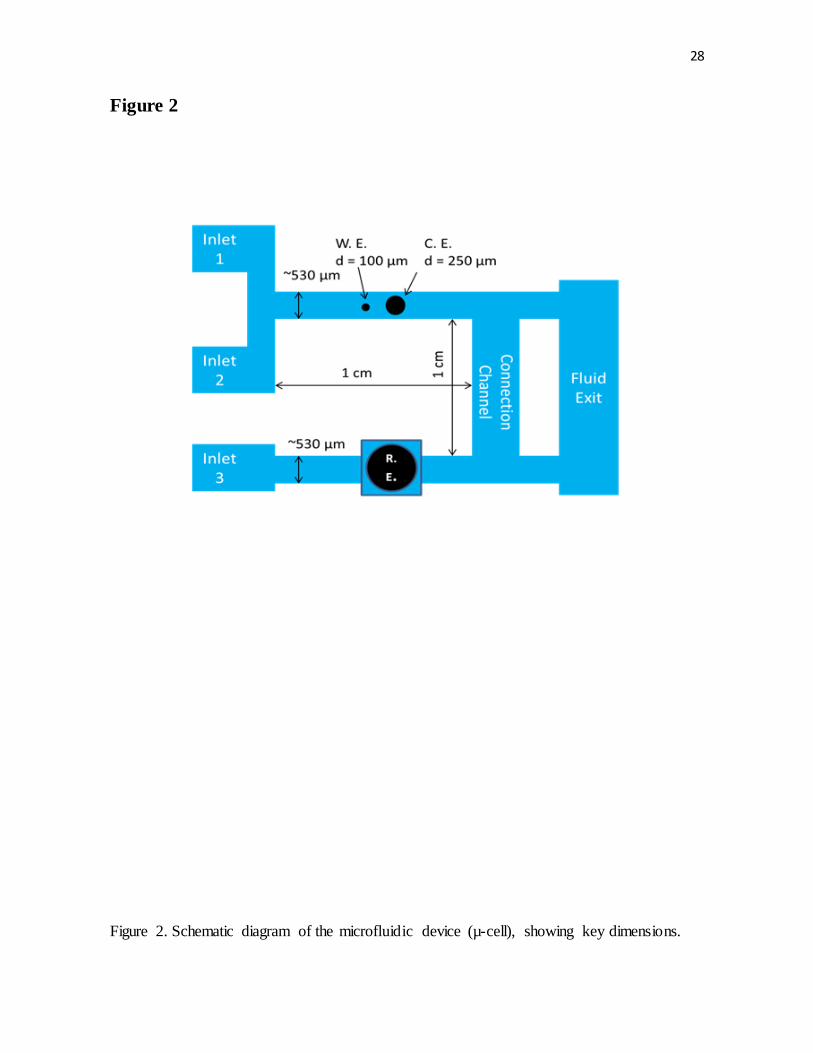
Figure 2. Schematic diagram of the microfluidic device (µ-cell), showing key dimensions.
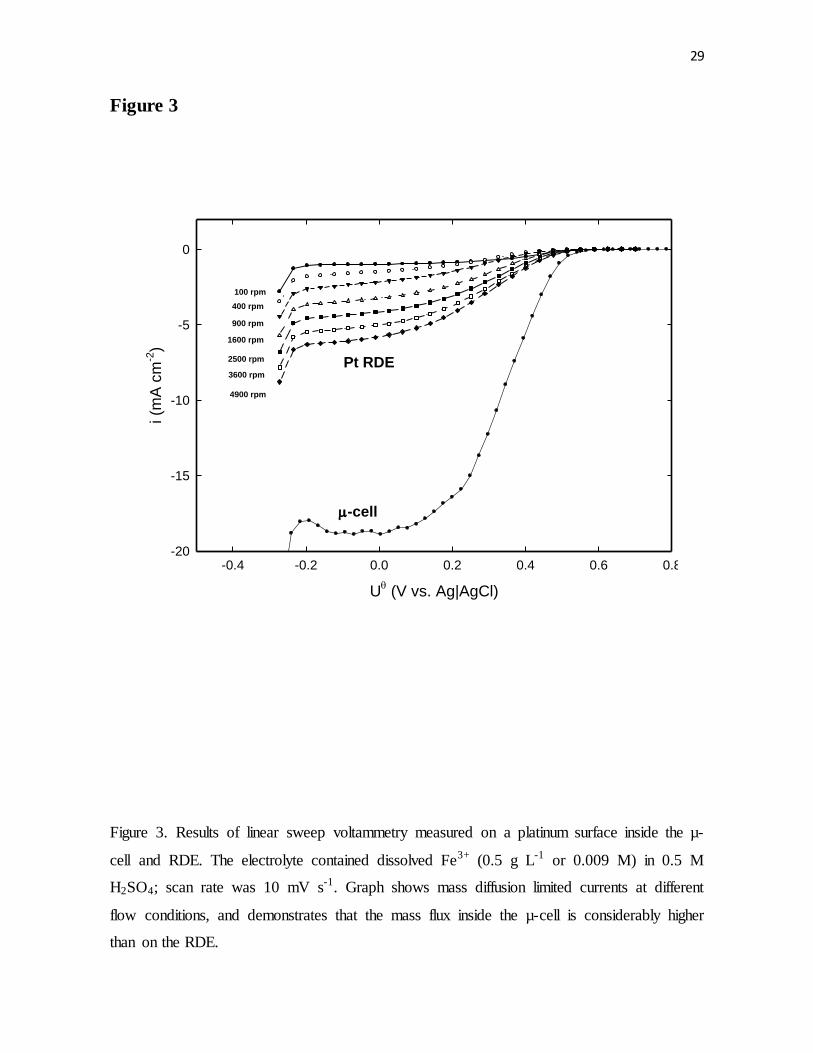
Figure 3. Results of linear sweep voltammetry measured on a platinum surface inside the µ-
cell and RDE. The electrolyte contained dissolved Fe3+ (0.5 g L-1 or 0.009 M) in 0.5 M
H2SO4; scan rate was 10 mV s-1. Graph shows mass diffusion limited currents at different
flow conditions, and demonstrates that the mass flux inside the µ-cell was considerably
higher than on the RDE.
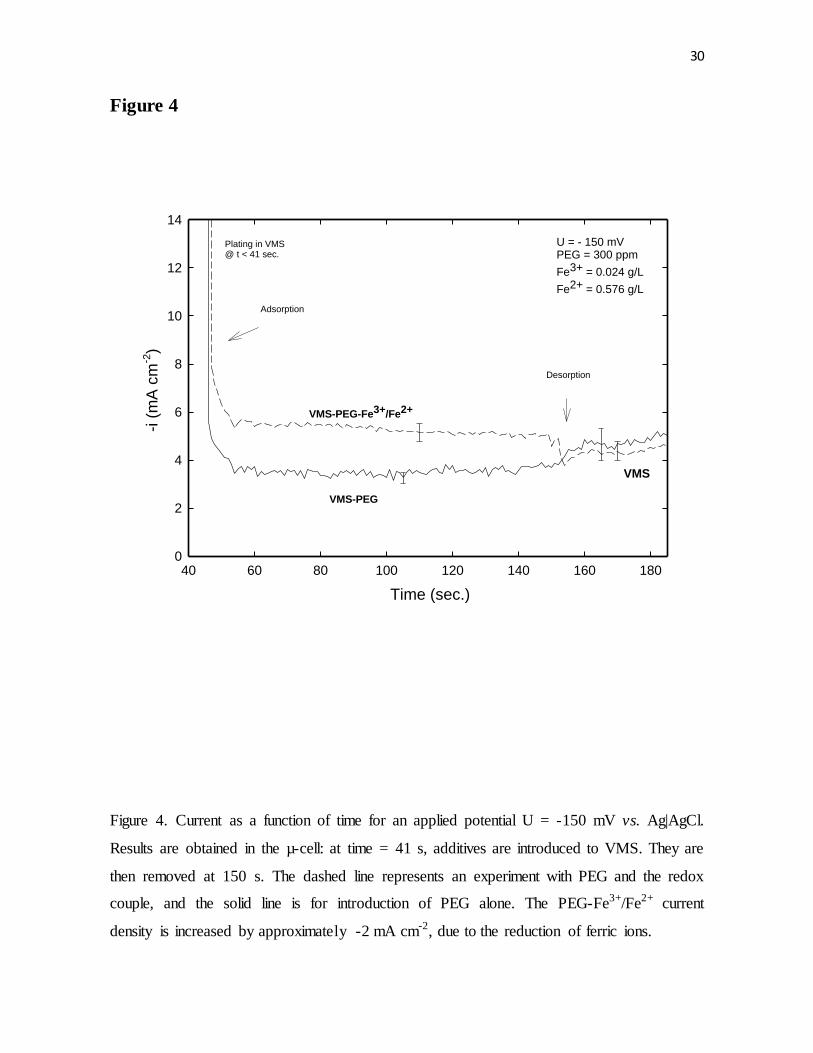
Figure 4. Current as a function of time for an applied potential U = -150 mV vs. Ag|AgCl.
Results were obtained in the µ-cell: at time = 41 s, additives were introduced to VMS. They
are then removed at 150 s. The dashed line represents an experiment with PEG and the
redox couple, and the solid line is for introduction of PEG alone. The PEG-Fe3+/Fe2+ current
density was increased by approximately -2 mA cm-2, due to the reduction of ferric ions.
iv
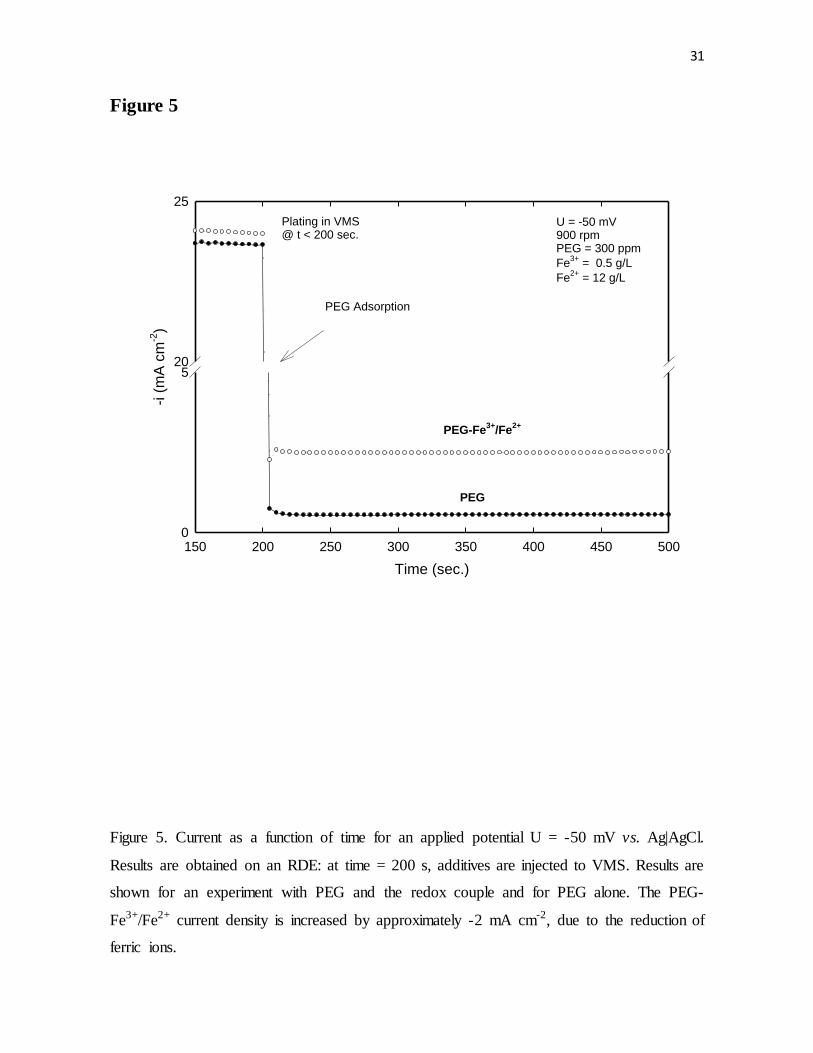
Figure 5. Current as a function of time for an applied potential U = -50 mV vs. Ag|AgCl.
Results were obtained on an RDE. At time = 200 s, additives were injected to VMS. Results
are shown for an experiment with PEG and the redox couple and for PEG alone. The PEG-
Fe3+/Fe2+ current density was increased by approximately -2 mA cm-2, due to the reduction
of ferric ions.
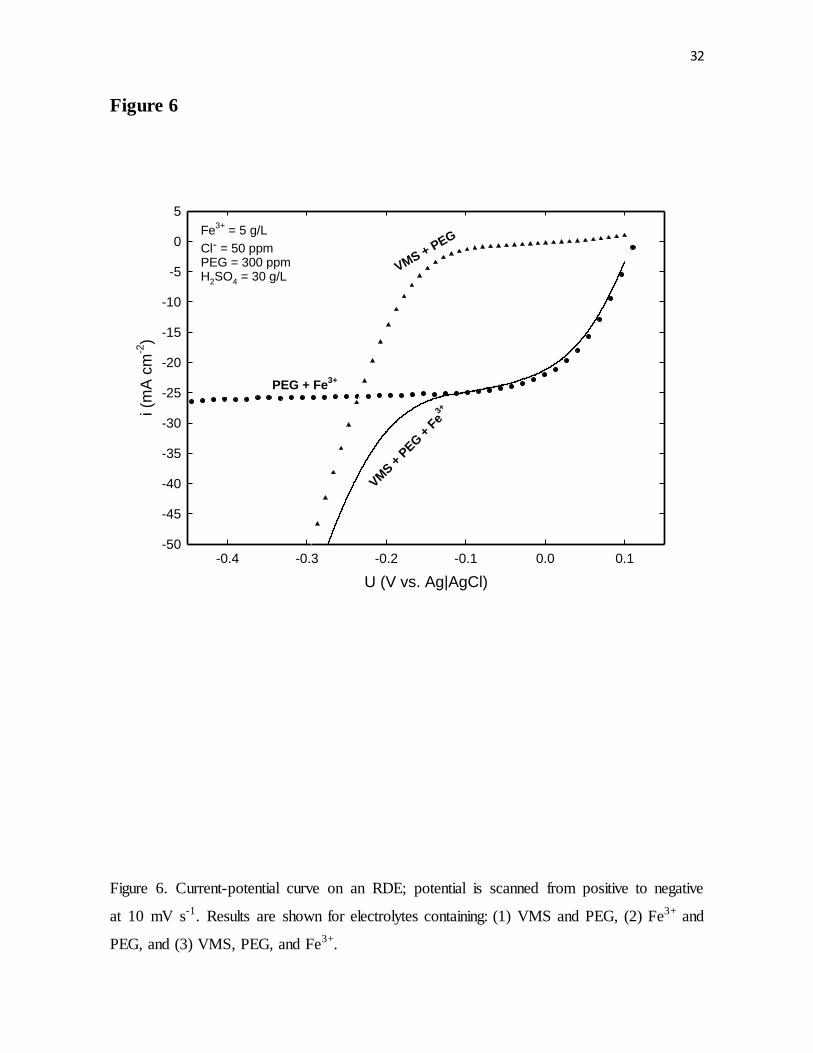
Figure 6. Current-potential curve on an RDE; potential was scanned from positive to
negative at 10 mV s-1. Results are shown for electrolytes containing: (1) VMS and PEG, (2)
Fe3+ and PEG, and (3) VMS, PEG, and Fe3+.
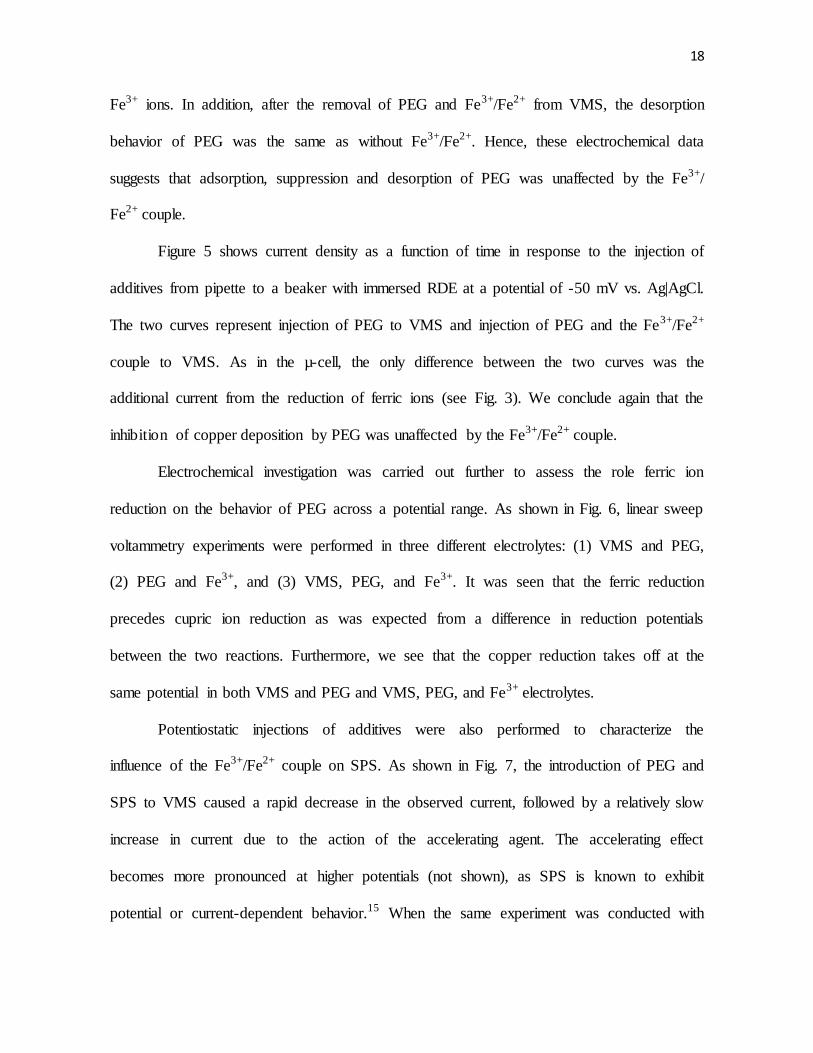
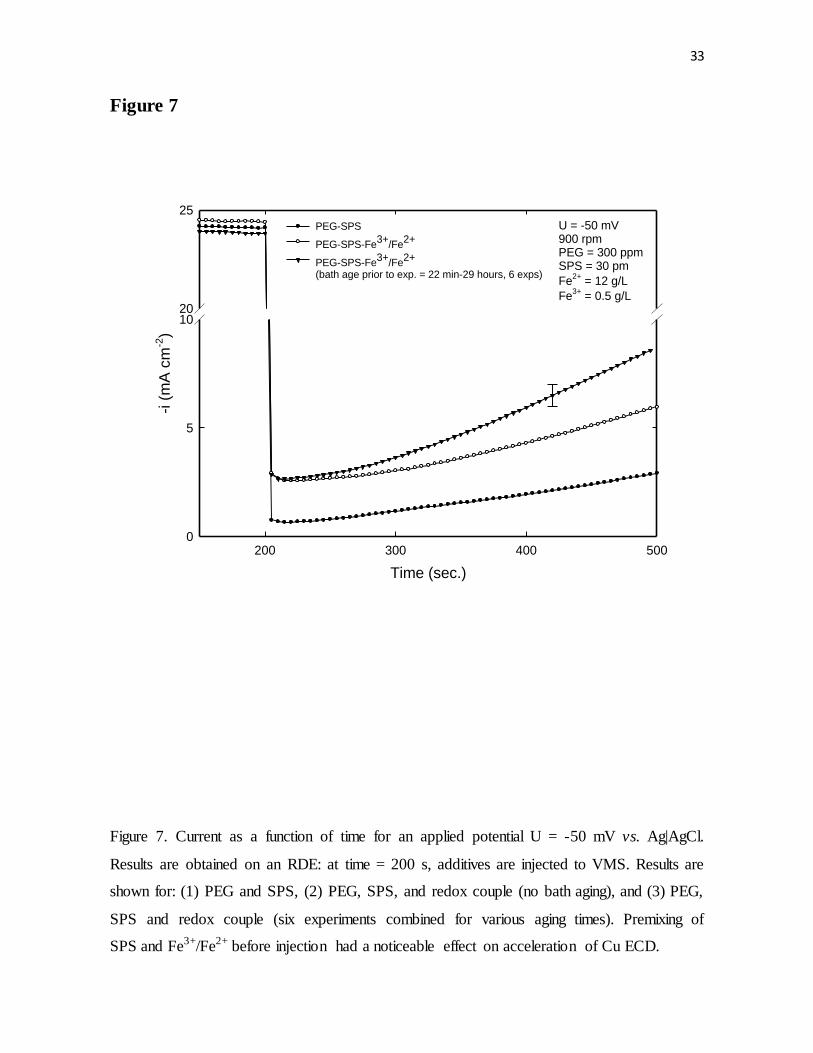
Figure 7. Current as a function of time for an applied potential U = -50 mV vs. Ag|AgCl.
Results were obtained on an RDE. At time = 200 s, additives were injected to VMS. Results
are shown for: (1) PEG and SPS, (2) PEG, SPS, and redox couple (no bath aging), and (3)
PEG, SPS and redox couple (six experiments combined for various aging times). Premixing
of SPS and Fe3+/Fe2+ before injection had a noticeable effect on acceleration of Cu ECD.
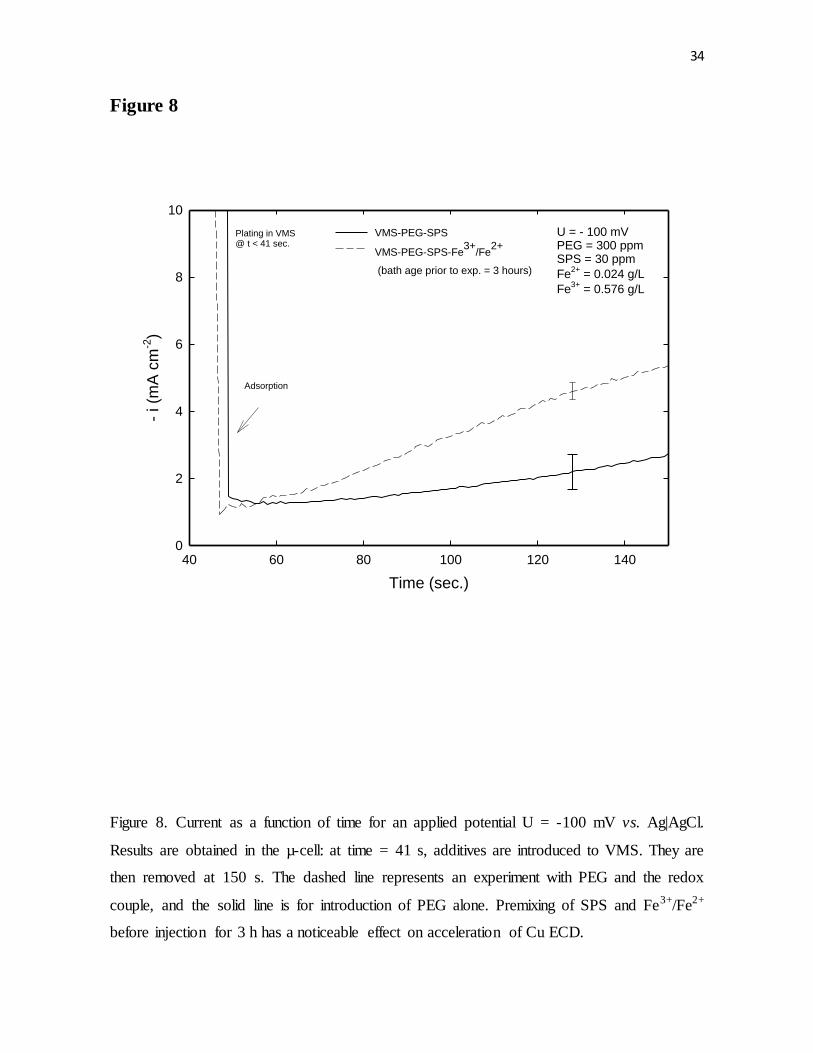
Figure 8. Current as a function of time for an applied potential U = -100 mV vs. Ag|AgCl.
Results were obtained in the µ-cell: at time = 41 s, additives were introduced to VMS. They
were then removed at 150 s. The dashed line represents an experiment with PEG and the
redox couple, and the solid line is for introduction of PEG alone. Premixing of SPS and
Fe3+/Fe2+ before injection for 3 h had a noticeable effect on acceleration of Cu ECD.
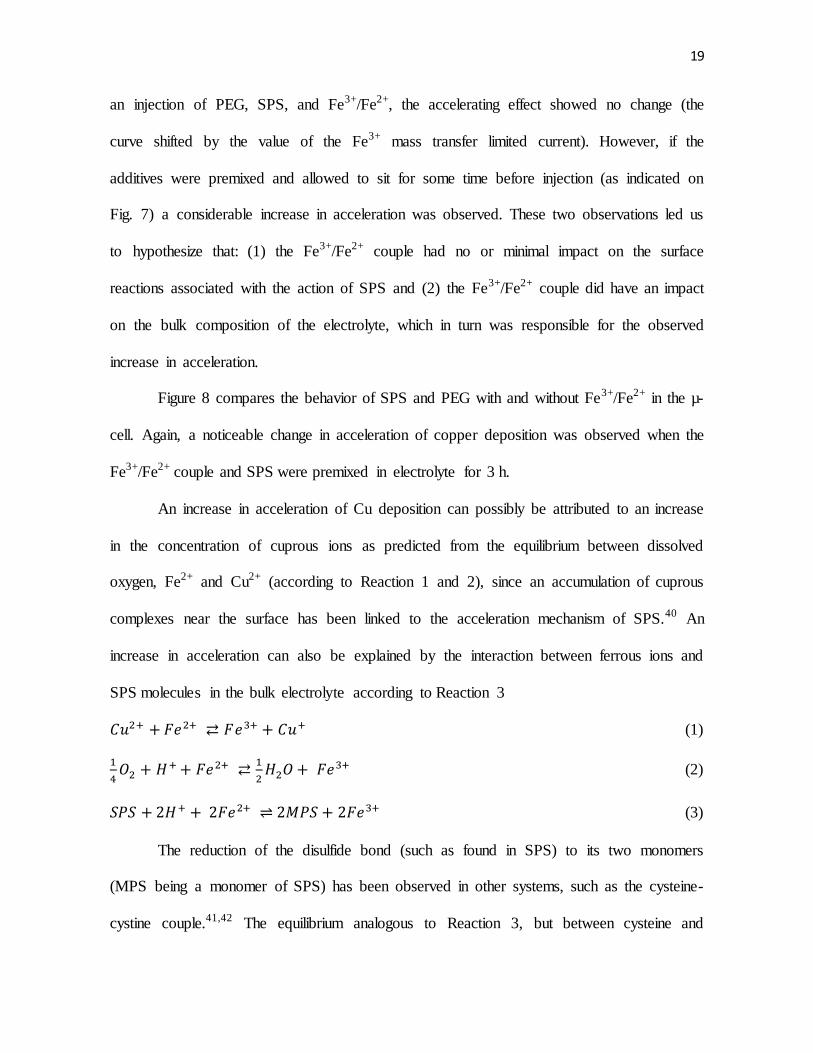
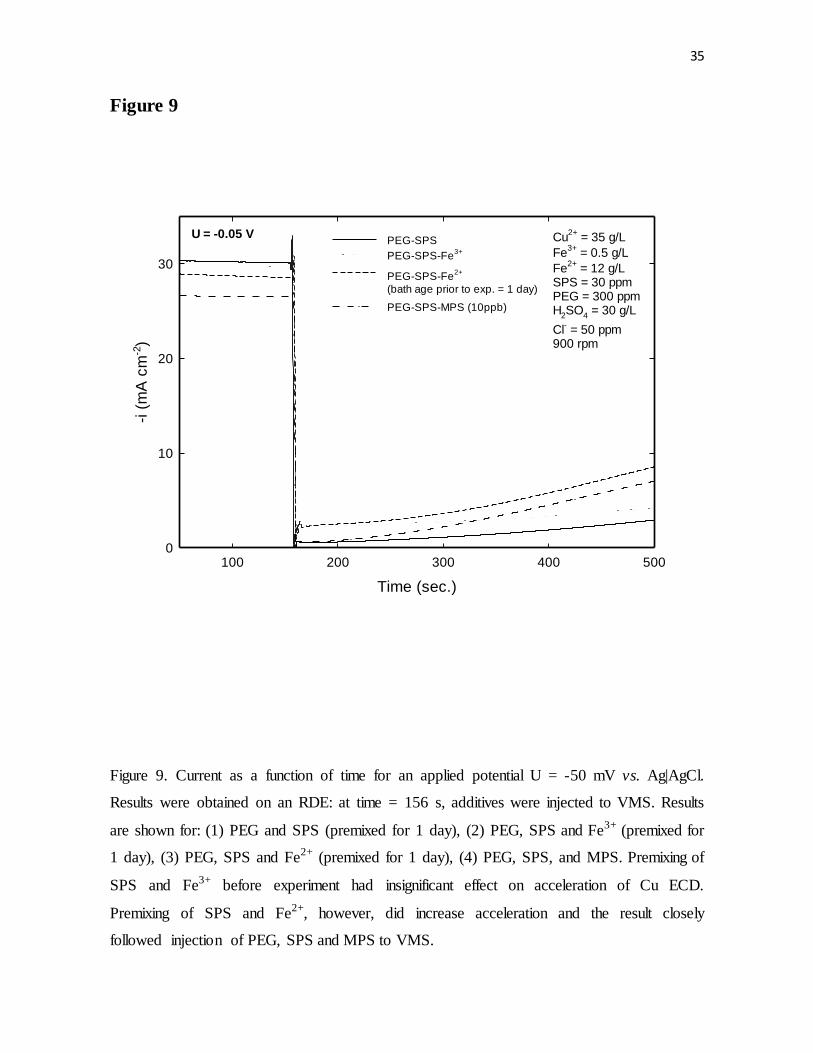
Figure 9. Current as a function of time for an applied potential U = -50 mV vs. Ag|AgCl.
Results were obtained on an RDE. At time = 156 s, additives were injected to VMS. Results
are shown for: (1) PEG and SPS (premixed for 1 day), (2) PEG, SPS and Fe3þ (premixed for
1 day), (3) PEG, SPS and Fe2+ (premixed for 1 day), (4) PEG, SPS, and MPS. Premixing of
SPS and Fe3+ before experiment showed no effect on acceleration of Cu ECD. Premixing of
SPS and Fe2+, however, did increase acceleration and the result closely follows injection of
PEG, SPS and MPS to VMS.
v
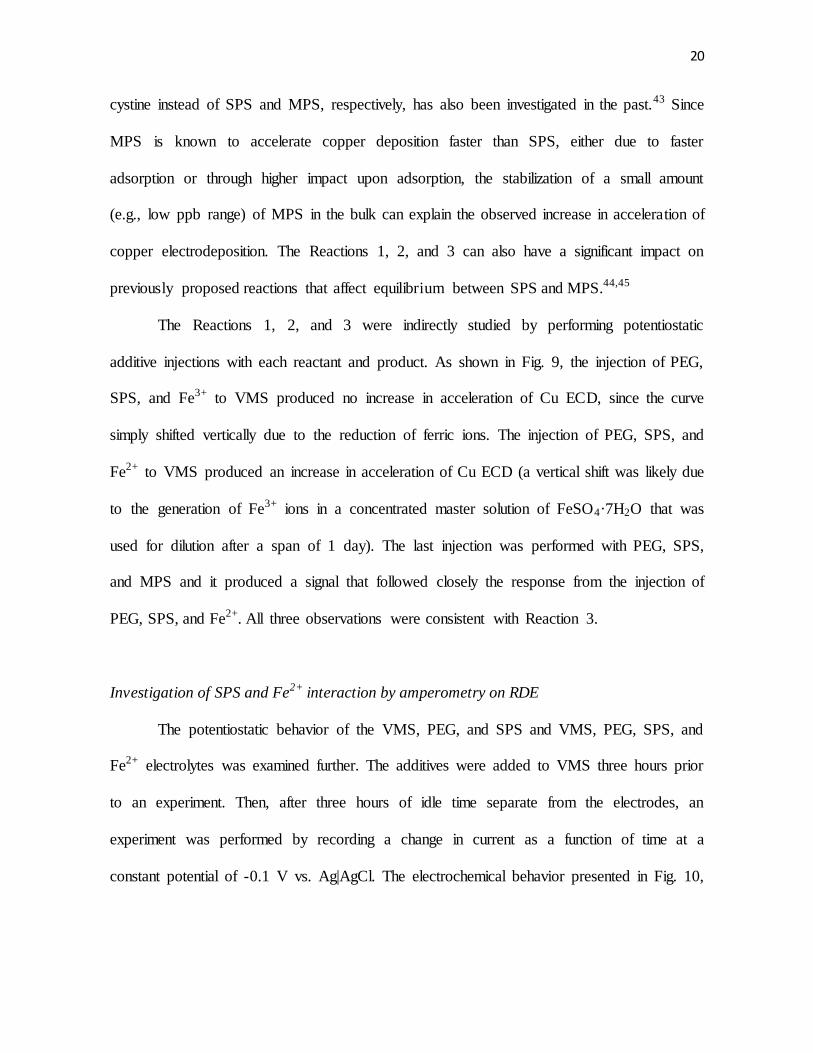
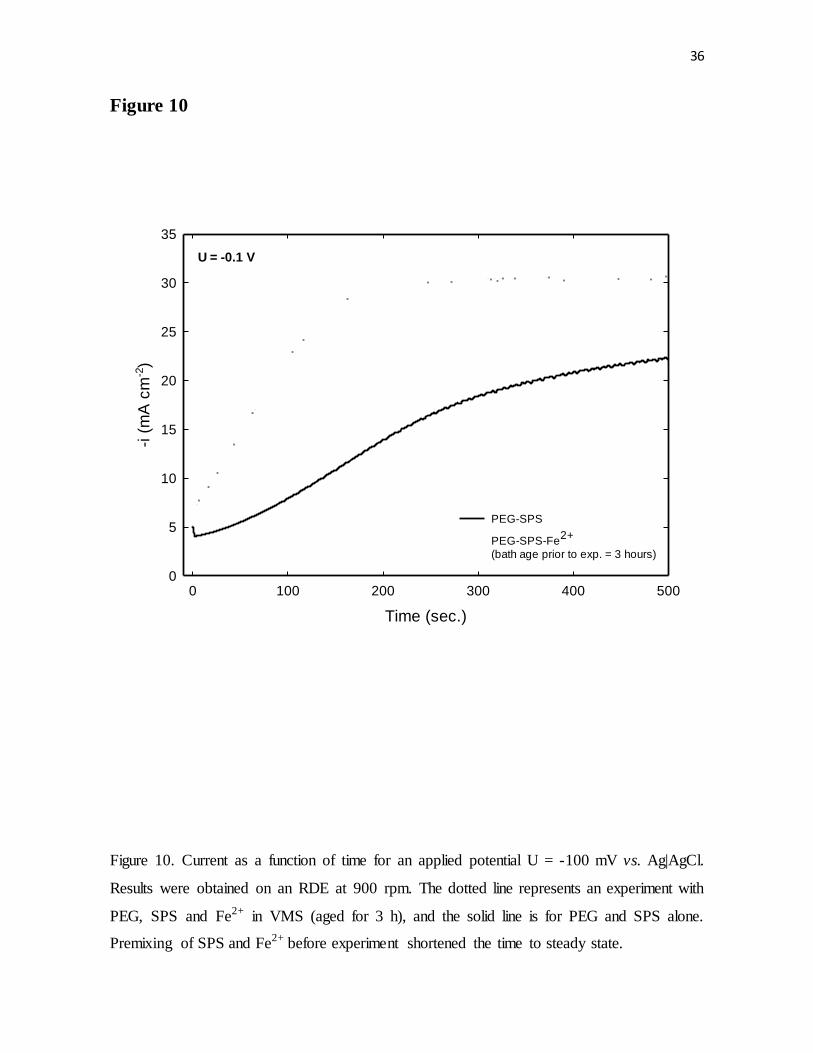
Figure 10. Current as a function of time for an applied potential U = -100 mV vs. Ag|AgCl.
Results were obtained on an RDE at 900 rpm. The dotted line represents an experiment with
PEG, SPS and Fe2+ in VMS (aged for 3 h), and the solid line is for PEG and SPS alone.
Premixing of SPS and Fe2+ before experiment shortened the time to steady state.
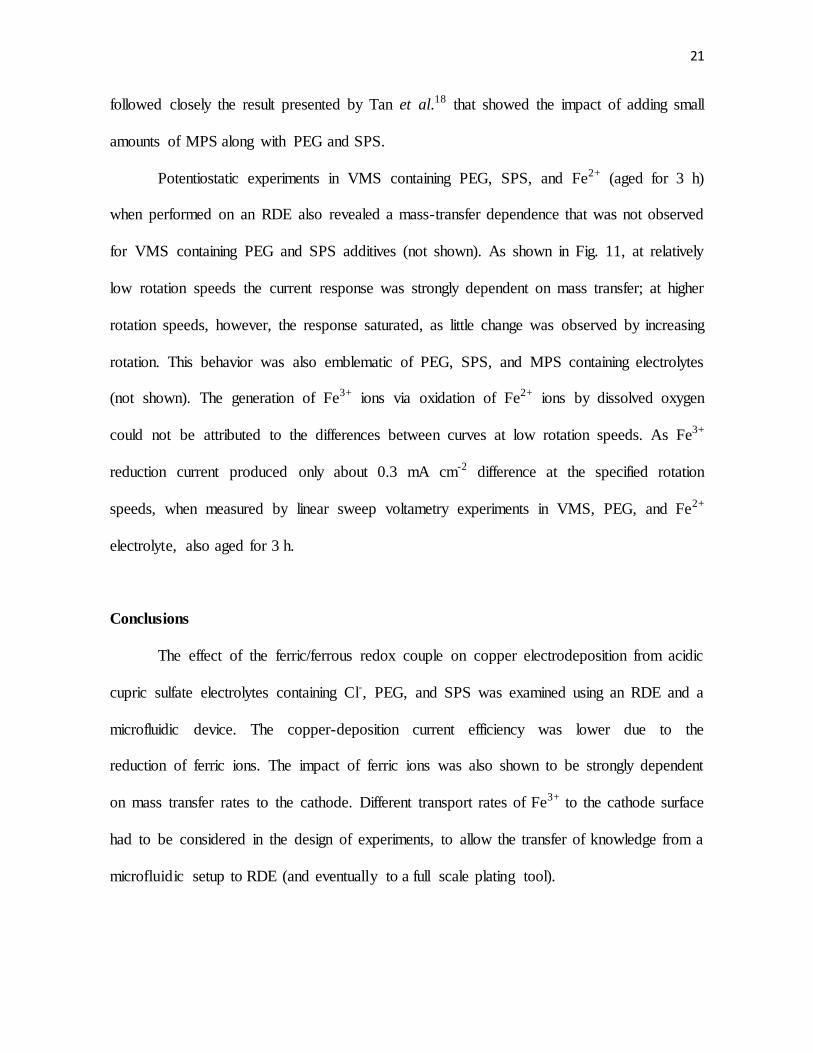
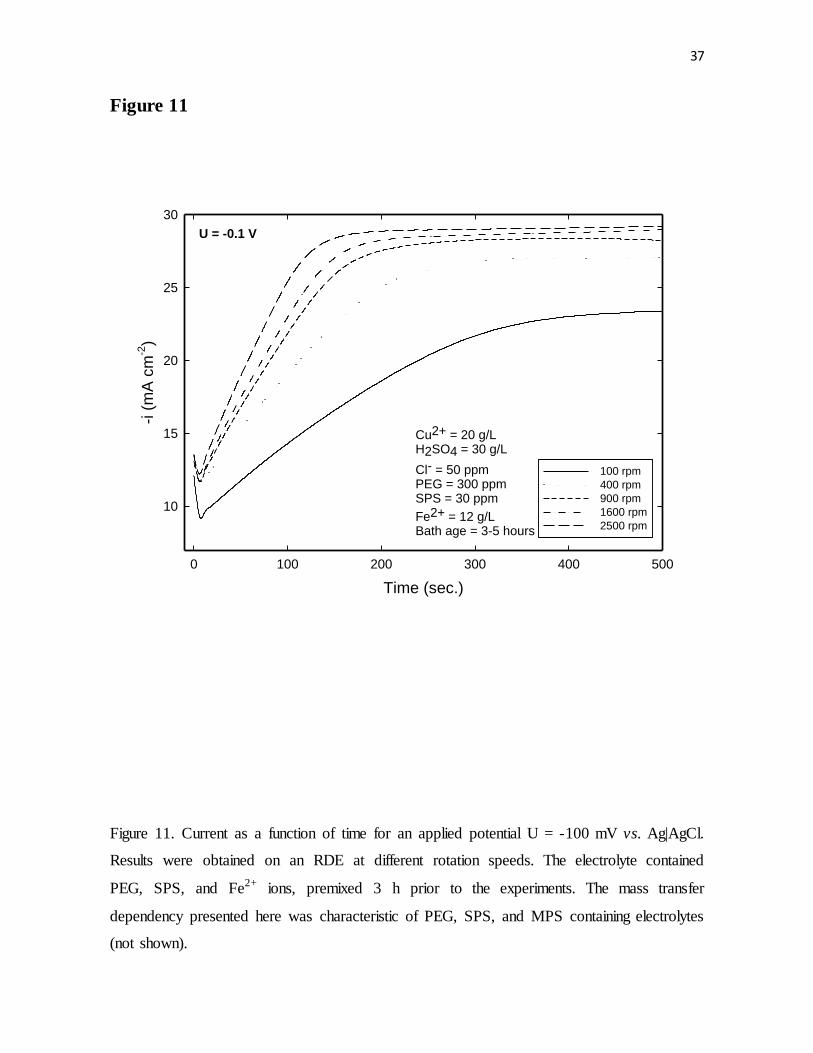
Figure 11. Current as a function of time for an applied potential U = -100 mV vs. Ag|AgCl.
Results were obtained on an RDE at different rotation speeds. The electrolyte contained
PEG, SPS, and Fe2+ ions, premixed 3 h prior to the experiments. The mass transfer
dependency presented here is characteristic of PEG, SPS, and MPS containing electrolytes
(not shown).
Chapter 3
Figure 1. Possible reduction and oxidation pathways to certain break-down products of SPS.
Figure 2. HPLC chromatogram obtained from aging of SPS (15 ppm) and Fe2+ (10 g L-1) in
0.3 M H2SO4. The peak around 17 min was attributed to MPS.
Figure 3. HPLC chromatogram obtained from aging of SPS (15 ppm) and Fe3+ (10 g L-1) in
0.3 M H2SO4.
Figure 4. HPLC chromatogram obtained from aging of SPS (15 ppm), Fe2+ (10 g L-1), and
Cu2+ (10 g L-1) in 0.3 M H2SO4. The peak around 17 min was attributed to MPS. The MPS
peak area was reduced in the presence of cupric ions.
Figure 5. Linear sweep voltammetry results obtained at a sweep rate of 10 mV s-1; the
potential was swept from positive to negative. Results were obtained on preplated with
copper, platinum RDE at 900 rpm, 1 day after bath preparation. The dashed line represents
an experiment with PEG and SPS, dotted line is an electrolyte with SPS and Fe2+, and the
vi
solid line is for SPS and MPS (using an MPS concentration taken from HPLC
measurements).
Figure 6. Current as a function of time for an applied potential of U = -100 mV vs. Ag|AgCl.
Data were obtained on an RDE at 900 rpm, 2 – 3 h after bath preparation. Results are shown
for a three pair of experiments: at 10, 35, and 65 g L-1 of cupric ions in electrolyte. As the
level of cupric ions was increased the difference in acceleration in the presence and absence
of Fe2+ was reduced.
Figure 7. Current as a function of time for an applied potential U = -100 mV vs. Ag|AgCl.
Data were obtained on an RDE at 900 rpm, 4 h after bath preparation. Results show that the
steady state current from the acceleration of copper deposition was only a function of a ratio
between ferric and ferrous ions.
Figure 8. Steady state current values, from potentiostatic plating at U = -100 mV, are plotted
as a function of the Fe3+/Fe2+ ratios. In all experiments, the ferric-ion concentration was 0.5
g L-1 and the ratio was varied by changing the ferrous-ion concentration.
Figure 9. Calculated values of MPS equilibrium concentrations as a function of Fe3+/Fe2+
ratio using several assumed SPS standard reduction potentials. The initial concentration of
SPS was 15 ppm.
Figure 10. Calculated values of MPS equilibrium concentrations as a function of Cu2+
concentration. The SPS reduction potential was chosen to be 0.33 V vs. SHE, and results are
given for various initial concentrations of ferric ions and a set concentration of ferrous ions
at 10 g L-1.
Chapter 4
Table 1. Chemical structure of SPS and its by-products.
vii
Figure 1. Scheme of HPLC-ED set-up used for the detection of SPS and its by-products.
Samples were mixed with the mobile phase at the autosampler and the effluent was sent
directly through the analytical column. Prior to chromatographic measurements, samples
were pretreated by passing the solution though an OnGuard II H ion exchange cartridge (not
shown).
Figure 2. An integrated pulsed amperometry waveform for the detection of organo-sulfur
compounds.
Figure 3. Chromatographic separation of SPS and its detectable by-products with the
Atlantis T3 column and 2% acetonitrile in 0.0125M H2SO4 as mobile phase (a.u. stands for
arbitrary units).
Table 2. Composition and chemical suppliers for all chemicals used in this chapter.
Figure 4. Current as a function of the linear potential sweep at 10 mV s-1. Results were
obtained at the rotating platinum disk electrode preplated with a thin copper layer. The
electrochemical behavior of known chemical standards in copper electrolyte is shown. A
small concentration of MPS had a significant effect on acceleration. Mono-ox-SPS and di-
ox-SPS exhibited less acceleration than SPS.
Figure 5. Example of chromatograms of standard addition recorded to evaluate
concentrations of SPS, mono-ox-SPS, and di-ox-SPS (curves recorded with a 2% ACN and
a detection range of 100 nC). Ordinate has arbitrary units (a.u.).
Figure 6. Chromatography of bath sample before and after plating for 6 Ah L-1 (detection
range of 100 nC for this set of experiments).
Figure 7. Measurement of reproducibility at various times.
viii
Chapter 5
Figure 1. Linear sweep voltammetry results obtained at a sweep rate of 5 mV s-1; the
potential was swept from less to more negative. Data were obtained on a preplated with
copper, platinum RDE at 100 rpm. Results illustrate the effect of PEG on the suppression of
copper deposition at various concentrations of chloride.
Figure 2. An example of the unipolar pulse-plating waveform that was employed for the
deposition of Cu-Ag alloys. At zero current, Cu on the surface is replaced by silver; at
negative current both Cu and Ag are galvanostatically plated. Duty cycle for the shown
pulse is equal to 9.47% and frequency is 1.38 Hz.
Figure 3. Concentration of Ag as a function of ionic copper from a specific lot of
CuSO4·5H2O. Films were plated at 400 rpm, 9.47% duty cycle, 1.38 Hz frequency. Figure
shows the presence of Ag, even though Ag was not added to solution. This is because
CuSO4·5H2O already contains Ag as an impurity.
Figure 4. Composition of Ag in the alloy as a function of ionic Ag in the electrolyte,
obtained at 400 rpm, 9.47% duty cycle, 1.38 Hz frequency, and ion = -10 mA cm-2 (the
nominal thickness is 226 nm). Straight line shows the theoretical values (assuming mass
transfer controlled Ag deposition). The data demonstrates lower plating rate of Ag in the
presence of PEG and SPS, and also how the solubility AgCl affects silver content in the
film.
Figure 5. Composition of Ag in alloy as a function of rotation speed. The electrodeposition
was performed at 1.38 Hz, 9.47% duty cycle, and ion = -10 mA cm-2. The straight line shows
theoretical estimates assuming mass transfer controlled Ag deposition. The nominal
thickness was kept at 226 nm.
Figure 6. Effect of duty cycle on the variation of Ag in the alloy. The electrodeposition was
performed at 400 rpm, 1.38 Hz, and ion = -10 mA cm-2, while keeping the nominal thickness
ix
at 50 nm. The times labeled above the data points indicate the off-time required to reach an
estimated thickness of 50 nm.
Figure 7. Roughness profile of the thin films plated at 400 rpm by (a) pulse-plating from
bath with PEG, SPS, and Cl (10 ppm); (b) DC plating with PEG, SPS, and Cl (10 ppm).
Pulse plating was done at duty cycle of 9.47% and frequency of 1.38 Hz.
Figure 8. Scanning electron images taken at the center of the Cu-Ag alloy thin films before
heat treatment. Samples were plated at 400 rpm and 9.47% duty cycle from the electrolyte
containing PEG, SPS, PVP, = 1.7 µM, at two different chloride concentrations. (a)
cross-section view, at , nominal thickness 120 nm, 0.3 wt% Ag; (b) cross-
section view, , nominal thickness 230 nm, 0.3 wt% Ag.
Figure 9. ToF-SIMS depth profile of the Cu-Ag film plated from an electrolyte with PEG,
SPS, PVP, , and . Film was deposited at 400 rpm and 9.47%
duty cycle for a nominal thickness of 230 nm. Silver content shown in the figure is about 0.3
wt%.
Chapter 6
Figure 1. Linear sweep voltametry results conducted at a sweep rate of 5 mV s-1 and rotation
speed of 100 rpm. Results show the polarization of copper deposition on preplated RDE in
the presence of Cl-PEG, Cl-EPE or Br-EPE additive systems. Two different electrolyte
compositions were used: Electrolyte A was composed of Cu2+ = 0.31 M and H2SO4 = 1.53
M and Electrolyte B was composed of Cu2+ = 0.63 M and H2SO4 = 0.31 M.
Figure 2. Linear sweep voltametry results conducted on preplated RDE at a sweep rate of 5
mV s-1 and rotation speed 100 rpm. Results show polarization of Cu deposition by Cl-PEG,
Cl-EPE, Br-PEG, and Br-EPE systems with and without SPS. In the presence of Br- ions,
SPS has little to no effect on polarization of Cu2+ reduction.
x
Figure 3. Linear sweep voltametry results conducted on preplated RDE at a sweep rate of 5
mV s-1 and rotation speed of 100 rpm. Experiments show the onset of Sn deposition and the
influence of additives on polarization of Sn2+ deposition.
Figure 4. Linear sweep voltametry results conducted on preplated RDE at a sweep rate of 5
mV s-1 and rotation speed 100 rpm. Experiments show that polarization of Cu deposition by
different halogen-suppressor pairs is almost unaffected by the presence Sn2+ ions at 84.3
mM.
Figure 5. Composition of Sn in the Cu-Sn alloy as a function of current density and Sn2+
concentration in the electrolyte containing Cl-EPE additive system. Deposition was
conducted at 100 rpm.
Figure 6. Composition of Sn in the Cu-Sn alloy as a function of rotation speed and Sn2+
concentration in the electrolyte containing Cl-EPE additive system. Deposition was
conducted at j = -20 mA cm-2.
Figure 7. Time variation of electrode potential during coupon plating at various current
densities. Electrolyte contained 84.3 mM Sn2+ and Cl-EPE additive system. Potential was
corrected for ohmic drop. The nominal thickness of each deposit was 1 µm.
Figure 8. Composition of Sn in the Cu-Sn alloy as a function of current density and Sn2+
concentration in the electrolyte containing Br-PEG additive system. Deposition was
conducted at 100 rpm.
Figure 9. Composition of Sn in the Cu-Sn alloy as a function of rotation speed and Sn2+
concentration in the electrolyte containing Br-PEG additive system. See legend for the
applied current density.
xi
Figure 10. Composition of Sn in the Cu-Sn alloy as a function of current density and Sn2+
concentration in the electrolyte containing Br-EPE additive system. Deposition was
conducted at 100 rpm.
Figure 11. Composition of Sn in the Cu-Sn alloy as a function of rotation speed and Sn2+
concentration in the electrolyte containing Br-EPE additive system. Deposition was
conducted at j = -10 mA cm-2.
xii
Acknowledgements
I would like to express sincere gratitude to my advisor Alan C. West, whose
generous support and guidance made this work possible. It is also an honor to acknowledge
contributions from all my coauthors on the academic publications, which lay at the heart of
this text. A valuable assistance from Ugur Emekli in understanding copper electrodeposition
is much appreciated. I would also like to acknowledge the support from Edward Swanson
and Greeshma Gadikota in running ICP experiments. I am very thankful to my laboratory
colleagues Asli Sahin, Xiaoxuan Sun, Ugur Emekli, Damla Eroglu, Feng Qiao, Robert J.
von Gutfeld, Jun Wu, and Joshua Gallaway for their invaluable support and encouragement
during my years in Columbia University.
I thank Atotech USA, Inc. for funding this work, and extend special thanks to Robert
Preisser for following the progress of this research and enabling my summer stay at Atotech,
Berlin GmbH. A generous help in development of the HPLC method described in chapter 4
from Yvonne Hoenersch and Olivier Mann of Atotech is also appreciated.
1
Chapter 1
Introduction
Overview of Copper Interconnect Technology
The process of copper electroplating is utilized in the fabrication of many modern
technologies, such as printed circuit boards (PCB) and semiconductor devices.1 Copper
metal is preferred due to its low resistivity and good electromigration reliability. Typically
copper is deposited from an acidic copper sulfate electrolyte by the application of a direct
current. During the electrochemical deposition (ECD) process cupric ions (Cu2+) from
electrolyte reduce at the cathode to cupreous ions (Cu+) and then to form copper metal (Cu).2
This process is shown in reactions 1 and 2.
(1)
(2)
The scope of this work is aimed towards the use of copper electroplating in creating
electrical conductors – commonly referred to as interconnects – for integrated circuits.3, 4
Copper has become a metal of choice in the semiconductor industry since the commercial
introduction of a Damascene process in 1997.5 Interconnect fabrication starts by patterning
dielectric (e.g. silicon dioxide) with desired surface topography using photolithographic
processes. Then, on top of dielectric a diffusion barrier layer (such as tantalum nitride and
2
titanium nitride) is deposited by physical or chemical vapor deposition under high
vacuum.6,7 Barrier layer prevents the diffusion of Cu into the underlying dielectric. This
layer is followed by a copper seed layer, which is also deposited by the vacuum process, and
is applied to provide a well conductive surface for the electroplating step. Seed layer may
also be used to form copper alloys by providing dopant material into the copper layer with a
high temperature step. During the electrochemical deposition, wafer is immersed into a
copper plating bath, current is applied across the wafer, and the surface cavities are filled
with copper. In the next processing step, overfilled metal is removed with chemical
mechanical polishing (CMP) for surface planarization.8
Copper Electroplating Electrolyte and Additives
The ability of ECD to fill features defect-free and with desired grain structure is
made possible by the interaction of additives contained in the electroplating bath. Mixture of
various additives promote bottom-up filling of interconnect features (such as trenches and
vias) in a phenomena known as superfilling. During superfilling the rate of copper
deposition is accelerated at the bottom of the feature while the rate of plating at the side
walls of the feature and top entry is suppressed.9-11
Copper electrolytes are composed of inorganic and organic constituents. Inorganic
components are copper sulfate salt, sulfuric acid, and halogen. Chloride is a primary halogen
used, as it effectively modifies adsorption properties of organic additive.12 Organic
components are usually classified into three categories: suppressor, accelerator, and leveler.
Suppressor is typically a polyether (such as polypropylene glycol (PEG) which polarizes Cu
deposition in combination with chloride by adsorbing on a copper surface during plating.13-15
The most commonly utilized accelerator is bis-(3-sulfopropyl) disulfide (SPS); it
3
precipitates in charge transfer reaction and determines Cu growth profile with major impact
on metallurgy.16-20 SPS is known to alleviate suppression caused by PEG and Cl-. Lastly,
leveling agents are often used to reduce surface roughness by inhibiting growth rate of
copper at protrusions.21-23 There are many variety of levelers, with polyvinylpyrrolidone
(PVP) being a model leveler in a variety of publications.24
Iron Redox Couple (Fe3+/Fe2+) for Copper Deposition
On-chip metallization of copper can possibly be improved by utilizing an iron redox
couple (Fe3+/Fe2+) in copper electrolytes. Fe3+/Fe2+ couple is already implemented in PCB
industry for filling features such as blind-microvias and through-hole vias.25-27 Anodic
oxidation of Fe2+ ions allows for the use of dimensionally stable, insoluble anode materials
without the formation of defect causing oxygen bubbles (as oppose to no redox couple and
soluble Cu anode).28 As ferrous ions are oxidized at the anode, ferric ions are reduced on the
cathode at a mass transfer limited rate. This results in lower current efficiency of copper
reduction on a surface, and relatively higher copper deposition inside a via.29 For
semiconductor chip structures, an additional benefit is that Fe3+ ions can contribute to the
reduction of overburden thickness, which is favorable for subsequent processing by CMP.
The main motivation to use iron redox mediator chemistry is to (a) reduce additive
consumption rate if no membrane (separating anolyte and catholyte) is in place, and (b)
incorporate Fe-atoms in the copper structure to enhance electromigration and stress-
migration stability. Reduced additive consumption extends bath lifetime and promotes
deposition of cleaner copper films.30 Since copper electroplating on semiconductor devices
requires stringent bath control for additive breakdown products, reduced consumption of
additives is of real advantage over conventional plating electrolytes.
4
The goal of this work is to provide a better understanding of the impact that
Fe3+/Fe2+ couple exerts on the interaction between organic additives that enable superfilling.
Since a tight control of additive formulation is necessary for the interconnect fabrication,
this investigation may facilitate the introduction of Fe3+/Fe2+–mediated chemistry to
commercial plating systems.
Chapter 2 presents mainly electrochemical investigation of the redox couple –
additive interactions, which were carried on a conventional rotating disk electrode (RDE) as
well in–lab built microfluidic cell (µ–cell).31-33 Utilization of both electrochemical setups
enables system characterization at diverse hydrodynamic conditions. Chapter 3 builds on the
study presented in chapter 2 with utilization of a newly developed high performance liquid
chromatography (HPLC) method34 described in chapter 4. The focus of chapter 3 is
interaction between SPS and Fe3+/Fe2+, where HPLC and electrochemical investigations are
complimented by equilibrium estimates.35
Electrodeposition of Copper Alloys
Electromigration is one of the main reliability issues in modern integrated circuits,
where copper interconnects are particularly affected.36-39 Accordingly, new interconnect
materials that are less susceptible to electromigration are required. It has been shown that
co-deposits of Cu with other metals (such as Ag, Sn, Co, and Mg) can potentially mitigate
both electro- and stress-migration.40-42 The content of the alloying metal needs to be small
since the resistivity of the interconnect increases with the addition of foreign metals.41
Various copper alloy compositions are possible with the application of controlled co-
electrodeposition of cupric and other metallic ions. In this study, we focus on two candidate
5
copper alloys as a possible application in interconnect technology: copper-silver (Cu-Ag)
and copper-tin (Cu-Sn) alloys.
A large difference in the standard reduction potentials between Cu2+ (
)43 and Sn2+ ( )43 is the main challenge for electrodepositing Cu-Sn
alloys (standard electrode potentials are given with respect to the standard hydrogen
electrode (SHE)). While the main challenge for depositing Cu-Ag alloys is the low solubility
of chloride with silver ions (the solubility product of AgCl in water at 250C is only 1.8×10⁻¹⁰
M2)44. However, the control of the Ag content in deposit can be readily achieved, since Ag+
reduction ( )43 occurs in a mass-transfer-controlled regime during
copper deposition.
Chapter 5 demonstrates the application of a pulsating current instead of a direct
current as it permits the use of chloride at a substantial concentration, while also allowing a
wide range of Cu-Ag alloy compositions. The aim of chapter 5 is to investigate the
composition of Cu-Ag alloys at various pulse-plating parameters, such as frequency and
duty cycle, as well as various electrolyte concentrations. The role of the displacement
reactions in pulse-plating of Cu-Ag is shown by comparing measured alloy compositions
with those predicted by theoretical estimates. Additionally, film microstructure and surface
quality of the deposited Cu-Ag alloy films is also examined.
Although Cu-Sn deposition have been studied for multiple applications and from
various electrolytes,42, 45-51 the electrochemical deposition of Cu-Sn alloys for the
microelectronic applications have received limited attention.42, 49 Chapter 6 describes
investigation into co-deposition of Cu-Sn from acidic copper sulfate solutions at currents
below the limiting current of Cu and without the use of complexing agents. The ability to
6
produce varying Cu-Sn alloy compositions is demonstrated with the use of polyethylene
glycol-block-polypropylene glycol-block-polyethylene glycol (EPE) and bromide.
Electrodeposition of copper in the presence of EPE-chloride pair52-54 and Br-suppressor
pair55 has been investigated in the past. This approach enables the use of stronger halogen-
suppressor pairs, rather than a conventional Cl-PEG, in order to polarize Cu deposition to a
greater extend so that the deposition of Sn becomes possible.
.
References
1. M. Schlesinger and M. Paunovis, Modern Electroplating, p. 888, Wiley-Interscience
(2000).
2. J. Newman and K. E. Thomas-Alyea, Electrochemical Systems, p. 672, Wiley-
Interscience (2004).
3. International Technology Roadmap for Semiconductors, Interconnect Chapter
(2009).
4. T. Osaka, M. Hasegawa, M. Yoshino and N. Yamachika, Advanced Nanoscale ULSI
Interconnects: Fundamentals and Applications, p. 183, Springer Science & Business
Media, LLC, New York (2009).
5. P. C. Andricacos, C. Uzoh, J. O. Dukovic, J. Horkans and H. Deligianni, IBM
Journal of Research & Development, 42, 567 (1998).
6. J. Baumann, T. Werner, A. Ehrlich, M. Rennau, C. Kaufmann and T. Gessner,
Microelectronic Engineering, 37–38, 221 (1997).
7. G. S. Chen and S. T. Chen, J. Appl. Phys., 87 (2000).
7
8. J. M. Steigerwald;, S. P. Murarka; and R. J. Gutmann;, Chemical Mechanical
Planarization of Microelectronic Materials, Wiley-VCH (1997).
9. T. P. Moffat, J. E. Bonevich, W. H. Huber, A. Stanishevsky, D. R. Kelly, G. R.
Stafford and D. Josell, Journal of The Electrochemical Society, 147, 4524 (2000).
10. A. C. West, S. Mayer and J. Reid, Electrochemical and Solid-State Letters, 4, C50
(2001).
11. T. P. Moffat, D. Wheeler, S. K. Kim and D. Josell, Electrochimica Acta, 53, 145
(2007).
12. W.-P. Dow and H.-S. Huang, Journal of The Electrochemical Society, 152, C67
(2005).
13. J. J. Kelly and A. C. West, Journal of The Electrochemical Society, 145, 3477
(1998).
14. J. J. Kelly and A. C. West, Journal of The Electrochemical Society, 145, 3472
(1998).
15. J. P. Healy, D. Pletcher and M. Goodenough, Journal of Electroanalytical
Chemistry, 338, 155 (1992).
16. M. Tan and J. N. Harb, Journal of The Electrochemical Society, 150, C420 (2003).
17. J. J. Kim, S.-K. Kim and Y. S. Kim, Journal of Electroanalytical Chemistry, 542, 61
(2003).
18. E. E. Farndon, F. C. Walsh and S. A. Campbell, Journal of Applied
Electrochemistry, 25, 574 (1995).
19. T. P. Moffat, D. Wheeler, M. D. Edelstein and D. Josell, IBM J. Res. Dev., 49, 19
(2005).
8
20. T. P. Moffat, D. Wheeler and D. Josell, Journal of The Electrochemical Society, 151,
C262 (2004).
21. J. J. Kelly, C. Tian and A. C. West, Journal of The Electrochemical Society, 146,
2540 (1999).
22. S. K. Kim, D. Josell and T. P. Moffat, Journal of The Electrochemical Society, 153,
C616 (2006).
23. M. Hasegawa, Y. Negishi, T. Nakanishi and T. Osaka, Journal of The
Electrochemical Society, 152, C221 (2005).
24. M. J. Willey, J. Reid and A. C. West, Electrochemical and Solid-State Letters, 10,
D38 (2007).
25. S. Kenny and B. Reents, in Proceedings of the CPCA (2005).
26. S. Kenny, B. Reents and J. Zosel, in Proceedings of the CPCA (2003).
27. S. Kenny and K. Matejat, in EPC 2000 Proceedings of the European PCB
Convention, p. 10 (2000).
28. J. Barthelmes, in Electronics Circuits World Convention 8 (1999).
29. B. Roelfs, S. Kenny and T. Fujiwara, JPCA (2008).
30. J. D. Adolf, R. Preisser and U. Landau, ECS Meeting Abstracts, 902, 2163 (2009).
31. M. J. Willey and A. C. West, Electrochemical and Solid-State Letters, 9, E17 (2006).
32. M. J. Willey and A. C. West, Journal of The Electrochemical Society, 153, C728
(2006).
33. I. Volov, T. Saito and A. C. West, Journal of The Electrochemical Society, 158,
D384.
9
34. I. Volov, O. Mann, Y. Hoenersch, B. Wahl and A. C. West, Journal of Separation
Science, 34, 2385 (2011).
35. I. Volov and A. C. West, Journal of The Electrochemical Society, 158, D456.
36. J. R. Lloyd, Microelectronic Engineering, 49, 51 (1999).
37. S. R. Wilson, C. J. Tracy and J. L. Freeman, Handbook of Multilevel Metallization
for Intergrated Circuits, p. 910, William Andrew (1994).
38. C. M. Tan, Electromigration in ULSI Interconnections, p. 312, World Scientific
Publishing Company (2012).
39. A. Heryanto, K. L. Pey, Y. K. Lim, W. Liu, N. Raghavan, J. Wei, C. L. Gan, M. K.
Lim and J. B. Tan, Journal of Applied Physics, 109, 9 (2011).
40. C.-K. Hu, M. Angyal, B. C. Baker, G. Bonilla, C. Cabral, D. F. Canaperi, S. Choi, L.
Clevenger, D. Edelstein, L. Gignac, E. Huang, J. Kelly, B. Y. Kim, V. Kyei-
Fordjour, S. L. Manikonda, J. Maniscalco, S. Mittal, T. Nogami, C. Parks, R.
Rosenberg, A. Simon, Y. Xu, T. A. Vo and C. Witt, in STRESS-INDUCED
PHENOMENA IN METALLIZATION: 11th International Workshop, E. Zschech,
P.S. Ho and S. Ogawa Editors, p. 57 (2010).
41. S. Strehle, J. W. Bartha and K. Wetzig, Thin Solid Films, 517, 3320 (2009).
42. D. Padhi, S. Gandikota, H. B. Nguyen, C. McGuirk, S. Ramanathan, J. Yahalom and
G. Dixit, Electrochimica Acta, 48, 935 (2003).
43. L. L. Shreir, R. A. Jarman and G. T. Burstein, Corrosion (3rd Edition) Volumes 1-2,
in, Elsevier (1994).
44. J. A. Dean, Lange's Handbook of Chemistry (15th Edition), in, McGraw-Hill (1999).
10
45. G. I. Medvedev, N. A. Makrushin and O. V. Ivanova, Russian Journal of Applied
Chemistry, 77, 1104 (2004).
46. A. Survila, Z. Mockus, S. Kanapeckaitė, V. Jasulaitienė and R. Juškėnas,
Electrochimica Acta, 52, 3067 (2007).
47. O. Galdikiené and Z. Mockus, Journal of Applied Electrochemistry, 24, 1009 (1994).
48. S. D. Beattie and J. R. Dahn, Journal of The Electrochemical Society, 150, A894
(2003).
49. J. Horkans, I. C. H. Chang, P. C. Andricacos and H. Deligianni, Journal of The
Electrochemical Society, 142, 2244 (1995).
50. Hiroaki Nakano, Satoshi Oue, Daisuke Yoshihara, Hisaaki Fukushima, Yoshifumi
Saka, Shigeru Sawada and Y. Hattori, Materials Transactions, 52, 1237 (2011).
51. Zhiqing Qiao, Wei Shang, Xin Zhang and C. Wang, Analytical and Bioanalytical
Chemistry, 381, 1467 (2005).
52. J. W. Gallaway, M. J. Willey and A. C. West, Journal of The Electrochemical
Society, 156, D146 (2009).
53. J. W. Gallaway, M. J. Willey and A. C. West, Journal of The Electrochemical
Society, 156, D287 (2009).
54. J. W. Gallaway and A. C. West, Journal of The Electrochemical Society, 155, D632
(2008).
55. M. Hayase, M. Taketani, T. Hatsuzawa and K. Hayabusa, Electrochemical and
Solid-State Letters, 6, C92 (2003).
11
_______________________________________________
* This work was done in collaboration with Tadashi Saito
Chapter 2
Investigation of Copper Plating and Additive Interactions in the Presence
of Fe3+
/Fe2+
redox couple*
Abstract
The impact of the ferric/ferrous (Fe3+/Fe2+) redox couple on the behavior of
polyethylene glycol (PEG) and bis-(3-sulfopropyl) disulfide (SPS) during copper
electrodeposition is investigated. The Fe3+/Fe2+ couple is used in plating of copper onto
printed circuit boards and may have advantages when implemented for on-chip metallization
of copper. Experiments show that in the presence of Fe3+/Fe2+ the suppressing behavior of
PEG does not change; in contrast, the accelerating activity of SPS increases when Fe3+/Fe2+
is present in a copper-plating bath. Furthermore, potentiostatic experiments suggest that SPS
interacts with Fe2+ ions in the bulk electrolyte, probably to produce 3-mercapto-1-propane
sulfonic acid (MPS) at low ppb levels.
12
Introduction
Copper interconnects are used extensively in semiconductor device manufacturing1
and in printed circuit board (PCB) production.2 They are fabricated using an electrochemical
deposition (ECD) procedure from an acidic CuSO4 electrolyte with organic and inorganic
constituents.3,4 The success of ECD in creating copper interconnects is attributed to its
ability to fill gaps void free with desired internal and surface properties.5 Copper features are
produced by a phenomenon known as superfilling, whereby the rate of copper deposition is
accelerated at the bottom of the feature while the rate of plating at the side walls of the
feature and top entry is suppressed.6
Superfilling is made possible by a synergetic interplay of organic additives placed in
a plating bath.7, 8 Most common additives encountered in PCB and wafer industries can be
classified into three groups: suppressor, accelerator, and leveler. Suppressors are typically
molecules like polyethylene glycol (PEG) that lower Cu deposition rates in the presence of
chloride ions.9–16 Accelerators, such as bis-(3-sulfopropyl) disulfide (SPS) and 3-mercapto-
1-propane sulfonic acid (MPS), are known to lower the suppression, leading to an
accelerated copper deposition.17–22 The role of a leveling agent, such as polyethyleneimine
or Janus Green B, is often to improve surface topography.23–26
An iron redox couple (Fe3+/Fe2+) has been extensively utilized in copper electrolytes
for filling features on printed circuit boards, such as through-holes and blind-microvias.27–29
It is known that for the PCB level metallization of copper, the anodic oxidation of Fe2+ ions
allows for the use of a dimensionally stable, insoluble anode without the formation of
oxygen bubbles. Formation of oxygen bubbles is undesired because it can lead to surface
defects, such as bubble entrapment in vias.30 At the same time Fe3+ ions can be reduced on
13
the cathode at a mass transfer limited rate. This results in lower current efficiency of copper
reduction on a surface and, because of differing mass transfer rates to an outer surface and
into a surface feature, a relatively higher copper deposition of copper inside the via.31
For semiconductor chip structures, such as interconnect lines and vias, and through-
silicon vias (TSV), the application of iron redox mediator chemistry may offer a number
advantages over the conventional plating setups32,33 including the use of insoluble,
dimensionally stable anodes,30 and a reduced consumption rate of accelerator.34 Possibly,
with fewer accelerator breakdown products, cleaner copper films can be deposited. An
added benefit is that Fe3+ ions can contribute to the reduction of overburden thickness,
which is beneficial for subsequent processing by chemical mechanical planarization.4
For example, deposition from a plating bath with the Fe3+/Fe2+ couple has shown
thinner copper thicknesses on the top surface and wider openings of through-silicon vias
(Fig. 1). With 0.47 g L-1 of Fe3+, via openings are wider, while the vias remained void free.
At the higher concentration of Fe3+, openings are even wider and the overburden is thinner.
The impact of the Fe3+/Fe2+ couple on surface reactions and organic additives in the
plating bath has not been systematically investigated. Since a tight control of additive
formulation is necessary for the on-chip metallization of copper,1 investigation of the impact
of the Fe3+/Fe2+ redox couple on plating bath additives may facilitate the introduction of an
iron-mediated system to commercial electrolytes. In this chapter we present the results of
electrochemical investigations of the redox couple–additive interactions, which were carried
on a rotating disk electrode (RDE) and an in–lab built microfluidic cell (µ–cell). Utilization
of both electrochemical setups enabled the characterization of the system under substantially
different hydrodynamic conditions.
14
Experimental
Beaker scale
Current efficiency measurements were performed on a platinum RDE (Pine
Corporation) dipped inside a 100 ml beaker with 50 ml of the copper electrolyte (termed
here VMS) containing: 0.55 M CuSO4·5H2O (Fisher Scientific, Inc.), 0.3 M H2SO4 (EMD
Chemicals, Inc.), and 1.4 mM HCl. Platinum wire (diameter = 0.5 mm) was used as a
counter electrode and Ag|AgCl as a reference electrode (BASi Re-5). Plating was performed
at a constant current of -15 mA cm-2 for 350 s at 300 rpm. The copper was then stripped at
15 mA cm-2 in concentrated phosphoric acid (H3PO4), and the stripping time was recorded.
Consequently, the current efficiency was calculated by dividing the time of stripping by the
time of plating, and multiplying the resulting ratio by 100%. Electrodes were removed
within 10 s of plating, and we assumed that any Cu dissolution during removal had
negligible impact on current efficiency results.
Injection experiments were performed at constant potential. For the injection
measurements on an RDE, the experimental procedure was standardized by preplating Pt
RDE in VMS at -40 mA cm-2 for 4 min and 900 rpm. Then, a constant potential of -50 mV
was applied and the working electrode was allowed to plate for another 200 s. At which
point, additives were injected into the plating bath from an air displacement micropipette.
The impact of Fe3+/Fe2+ couple on each additive was then observed for another 400 s. Fe2+
and Fe3+ ions were added as FeSO4·7H2O (Sigma-Aldrich) and Fe2(SO4)3·xH2O (Sigma-
Aldrich), respectively. The two organic additives used in this chapter were: PEG 3350 g L-1
(Sigma-Aldrich) and SPS (Raschtig GmbH).
15
The electrolytes prepared with SPS and Fe3+/Fe2+ couple were found to exhibit a
time dependent behavior; therefore the contact time between SPS and Fe3+/Fe2+ prior to an
experiment was recorded and is indicated where appropriate.
Microfluidic
A microfluidic device (µ-cell) to measure an electrode response to rapid changes in
composition of an electrolyte was also employed. The device was first developed by Willey
et al.35–37 and subsequently improved to its current form (Fig. 2) by Gallaway et al.38 The
channel design allows for the electrochemical monitoring of rapid changes in the electrolyte
composition while plating copper onto a working electrode with minimal ohmic losses.
The microfluidic channels were molded from polydimethylsiloxane (PDMS) over a
negative pattern formed on a silicon chip by photolithography. There were two parallel
channels: a working channel with two inlets containing working (d = 100 µm) and counter
(d = 250 µm) platinum electrodes and a parallel channel containing Ag|AgCl reference
electrode (BASi RE-6). Both channels had a rectangular cross section ~500 µm wide and
~180 µm tall, and solution was passed through them at 0.5 mL min-1, corresponding to an
average velocity of ~8.3 cm s-1. The electrode wires are embedded ~600 µm apart in Spurr
low-viscosity embedding media (Polysciences, Inc.). The embedding mold with cross-
sectioned wires was polished with silicon carbide sandpaper (Leco), and the electrode epoxy
structure formed the floor of the m-cell.
Additive transition experiments in the µ-cell were conducted by switching between
the two inlets leading to a working channel. At the beginning of each experiment, VMS was
passed through the working channel to pre-plate the Pt working electrode with copper at -15
16
mA cm-2 for 175 s. The applied potential was then set, and after 45 s of plating in VMS, the
electrolyte was switched to the one containing plating additives. After 105 s the flowing
solution was switched back to VMS. In this way a single experiment was used to study both
the adsorption and desorption behavior of additives.
Results and Discussion
Effect of current efficiency and mass transfer of the Fe3+/Fe2+ couple on Cu ECD
Current efficiency measurements were conducted, as deviations from 100% may
affect filling performance. Reduction of ferric ions is more likely to happen at the employed
cathodic current, due to a significant difference in overpotentials, where
and vs. Ag|AgCl reference. As seen in Table I, current
efficiency measurements in VMS containing Fe2+ (12 g/L or 0.215 M) and Fe3+ (0.5 g/L or
0.009 M) showed that about 9% of the applied current was consumed by the reduction of
ferric to ferrous ions rather than the reduction of cupric ions to copper metal. When Fe3+
ions are present at 1.0 g L-1 (0.018 M), the current efficiency decreased further to 81%. The
current efficiency results were consistent with analysis assuming a mass-transfer limited
reduction rate of Fe3+ and with experimental studies (Fig. 3) of the redox couple on platinum
RDE.
The current efficiency measurements in the presence of the Fe3+/Fe2+ redox couple
have also been carried out inside the µ-cell. However, the results were substantially different
from measurements with the RDE. For example after a galvanostatic current of -15 mA cm-2
was applied, there was no copper deposit, and even the pre-plated copper film had been
stripped (i.e., copper was etched by the excess of Fe3+ ions near the electrode surface). This
17
can be explained by realizing that the hydrodynamics of the µ-cell were very different from
that of the RDE. Figure 3 clearly shows the difference in mass flux of ferric ions to the
electrode surface between the RDE and the µ-cell arrangements.
As shown in Fig. 3, the limiting current plateaus on the RDE were much smaller than
the current plateau obtained inside the µ-cell. For the experimental results presented below,
it was found that inside the µ-cell the same mass diffusion limited current attained on an
RDE for Fe3+ concentration of 0.5 g L-1 (0.009 M) and a rotation rate at 300 rpm could be
achieved if the concentration of Fe3+ ions was decreased to 0.024 g/L or 0.00043 M (note
that the ratio of Fe3+/ Fe2+ was kept the same).
Potentiostatic additive transition study
Two common additives used in plating electrolytes are polyethylene glycol (PEG)
and bis-(3-sodiumsulfopropyl) disulfide (SPS). To determine the impact of the Fe3+/Fe2+
couple on these species, potentiostatic additive injection experiments were carried out inside
the µ-cell and also at the RDE setup. In the µ-cell, changes in composition were achieved by
switching between the two inlet syringes leading to the working channel (Fig. 2). Similar
experiments are discussed in detail elsewhere.16,36–39
Potentiostatic response to the introduction of 300 ppm of PEG with and without the
Fe3+/Fe2+ couple inside the µ-cell is shown in Fig. 4. The addition of PEG caused rapid
decrease in the observed current, followed by stable period of suppression, and subsequently
by slow desorption after the removal of PEG from VMS. When the same experiment was
repeated with the addition of PEG and Fe3+/ Fe2+, the curve simply shifted vertically by -2
mA cm-2, which was the value of the mass-transfer-limited current from the reduction of
18
Fe3+ ions. In addition, after the removal of PEG and Fe3+/Fe2+ from VMS, the desorption
behavior of PEG was the same as without Fe3+/Fe2+. Hence, these electrochemical data
suggests that adsorption, suppression and desorption of PEG was unaffected by the Fe3+/
Fe2+ couple.
Figure 5 shows current density as a function of time in response to the injection of
additives from pipette to a beaker with immersed RDE at a potential of -50 mV vs. Ag|AgCl.
The two curves represent injection of PEG to VMS and injection of PEG and the Fe3+/Fe2+
couple to VMS. As in the µ-cell, the only difference between the two curves was the
additional current from the reduction of ferric ions (see Fig. 3). We conclude again that the
inhibition of copper deposition by PEG was unaffected by the Fe3+/Fe2+ couple.
Electrochemical investigation was carried out further to assess the role ferric ion
reduction on the behavior of PEG across a potential range. As shown in Fig. 6, linear sweep
voltammetry experiments were performed in three different electrolytes: (1) VMS and PEG,
(2) PEG and Fe3+, and (3) VMS, PEG, and Fe3+. It was seen that the ferric reduction
precedes cupric ion reduction as was expected from a difference in reduction potentials
between the two reactions. Furthermore, we see that the copper reduction takes off at the
same potential in both VMS and PEG and VMS, PEG, and Fe3+ electrolytes.
Potentiostatic injections of additives were also performed to characterize the
influence of the Fe3+/Fe2+ couple on SPS. As shown in Fig. 7, the introduction of PEG and
SPS to VMS caused a rapid decrease in the observed current, followed by a relatively slow
increase in current due to the action of the accelerating agent. The accelerating effect
becomes more pronounced at higher potentials (not shown), as SPS is known to exhibit
potential or current-dependent behavior.15 When the same experiment was conducted with
19
an injection of PEG, SPS, and Fe3+/Fe2+, the accelerating effect showed no change (the
curve shifted by the value of the Fe3+ mass transfer limited current). However, if the
additives were premixed and allowed to sit for some time before injection (as indicated on
Fig. 7) a considerable increase in acceleration was observed. These two observations led us
to hypothesize that: (1) the Fe3+/Fe2+ couple had no or minimal impact on the surface
reactions associated with the action of SPS and (2) the Fe3+/Fe2+ couple did have an impact
on the bulk composition of the electrolyte, which in turn was responsible for the observed
increase in acceleration.
Figure 8 compares the behavior of SPS and PEG with and without Fe3+/Fe2+ in the µ-
cell. Again, a noticeable change in acceleration of copper deposition was observed when the
Fe3+/Fe2+ couple and SPS were premixed in electrolyte for 3 h.
An increase in acceleration of Cu deposition can possibly be attributed to an increase
in the concentration of cuprous ions as predicted from the equilibrium between dissolved
oxygen, Fe2+ and Cu2+ (according to Reaction 1 and 2), since an accumulation of cuprous
complexes near the surface has been linked to the acceleration mechanism of SPS.40 An
increase in acceleration can also be explained by the interaction between ferrous ions and
SPS molecules in the bulk electrolyte according to Reaction 3
(1)
(2)
(3)
The reduction of the disulfide bond (such as found in SPS) to its two monomers
(MPS being a monomer of SPS) has been observed in other systems, such as the cysteine-
cystine couple.41,42 The equilibrium analogous to Reaction 3, but between cysteine and
20
cystine instead of SPS and MPS, respectively, has also been investigated in the past.43 Since
MPS is known to accelerate copper deposition faster than SPS, either due to faster
adsorption or through higher impact upon adsorption, the stabilization of a small amount
(e.g., low ppb range) of MPS in the bulk can explain the observed increase in acceleration of
copper electrodeposition. The Reactions 1, 2, and 3 can also have a significant impact on
previously proposed reactions that affect equilibrium between SPS and MPS.44,45
The Reactions 1, 2, and 3 were indirectly studied by performing potentiostatic
additive injections with each reactant and product. As shown in Fig. 9, the injection of PEG,
SPS, and Fe3+ to VMS produced no increase in acceleration of Cu ECD, since the curve
simply shifted vertically due to the reduction of ferric ions. The injection of PEG, SPS, and
Fe2+ to VMS produced an increase in acceleration of Cu ECD (a vertical shift was likely due
to the generation of Fe3+ ions in a concentrated master solution of FeSO4·7H2O that was
used for dilution after a span of 1 day). The last injection was performed with PEG, SPS,
and MPS and it produced a signal that followed closely the response from the injection of
PEG, SPS, and Fe2+. All three observations were consistent with Reaction 3.
Investigation of SPS and Fe2+ interaction by amperometry on RDE
The potentiostatic behavior of the VMS, PEG, and SPS and VMS, PEG, SPS, and
Fe2+ electrolytes was examined further. The additives were added to VMS three hours prior
to an experiment. Then, after three hours of idle time separate from the electrodes, an
experiment was performed by recording a change in current as a function of time at a
constant potential of -0.1 V vs. Ag|AgCl. The electrochemical behavior presented in Fig. 10,
21
followed closely the result presented by Tan et al.18 that showed the impact of adding small
amounts of MPS along with PEG and SPS.
Potentiostatic experiments in VMS containing PEG, SPS, and Fe2+ (aged for 3 h)
when performed on an RDE also revealed a mass-transfer dependence that was not observed
for VMS containing PEG and SPS additives (not shown). As shown in Fig. 11, at relatively
low rotation speeds the current response was strongly dependent on mass transfer; at higher
rotation speeds, however, the response saturated, as little change was observed by increasing
rotation. This behavior was also emblematic of PEG, SPS, and MPS containing electrolytes
(not shown). The generation of Fe3+ ions via oxidation of Fe2+ ions by dissolved oxygen
could not be attributed to the differences between curves at low rotation speeds. As Fe3+
reduction current produced only about 0.3 mA cm-2 difference at the specified rotation
speeds, when measured by linear sweep voltametry experiments in VMS, PEG, and Fe2+
electrolyte, also aged for 3 h.
Conclusions
The effect of the ferric/ferrous redox couple on copper electrodeposition from acidic
cupric sulfate electrolytes containing Cl-, PEG, and SPS was examined using an RDE and a
microfluidic device. The copper-deposition current efficiency was lower due to the
reduction of ferric ions. The impact of ferric ions was also shown to be strongly dependent
on mass transfer rates to the cathode. Different transport rates of Fe3+ to the cathode surface
had to be considered in the design of experiments, to allow the transfer of knowledge from a
microfluidic setup to RDE (and eventually to a full scale plating tool).
22
The inhibition of copper metal deposition by PEG was not affected by Fe3+/Fe2+ ions.
Kinetics of adsorption and desorption of PEG on copper electrode were also unaffected by
the Fe3+/Fe2+ redox couple. The activity of SPS during copper deposition was found to
change in the presence of Fe2+ ions but not Fe3+ ions. Ferrous ions were believed to affect
SPS primarily through interactions in the bulk electrolyte. The electroanalytical response
from the baths containing Fe2+ suggested the appearance of MPS in solution via oxidation of
SPS by Fe2+.
References
1. P. Andricacos, D. S. Chung, H. Deligianni, J. E. Fluegel, K. T. Kwietniak, P. S.
Locke, D. D. Restaino, S. C. Seo, P. M. Vereecken, and E. G. Walton, Void-Free
Damascene Copper Deposition Process and Means of Monitoring Thereof, IBM
Corp., United States, 7678258 (2010).
2. T. Kobayashi, J. Kawasaki, K. Mihara, and H. Honma, Electrochim. Acta, 47, 85
(2001).
3. J. Reid, S. Mayer, E. Broadbent, E. Klawuhn, and K. Ashtiani, Solid State Technol.,
43, 86 (2000).
4. T. Osaka, M. Hasegawa, M. Yoshino, and N. Yamachika, Advanced Nanoscale
ULSI Interconnects: Fundamentals and Applications, p. 183, (Springer Science &
Business Media, LLC, New York, USA, 2009).
5. P. C. Andricacos, C. Uzoh, J. O. Dukovic, J. Horkans, and H. Deligianni, IBM J.
Res. Dev., 42, 567 (1998).
6. A. C. West, S. Mayer, and J. Reid, Electrochem. Solid-State Lett., 4, C50 (2001).
23
7. T. P. Moffat, J. E. Bonevich, W. H. Huber, A. Stanishevsky, D. R. Kelly, G. R.
Stafford, and D. Josell, J. Electrochem. Soc., 147, 4524 (2000).
8. W.-P. Dow and H.-S. Huang, J. Electrochem. Soc., 152, C67 (2005).
9. J. J. Kelly and A. C. West, J. Electrochem. Soc., 145, 3477 (1998).
10. J. D. Reid and A. P. David, Plat. Surf. Finish., 74, 66 (1987).
11. V. D. Jovic and B. M. Jovic, Copper Electrodeposition From a Copper Acid Baths in
the Presence of PEG and NaCl, p. 18, Serbian Chemical Society, Belgrade, SERBIE
(2001).
12. J. P. Healy, D. Pletcher, and M. Goodenough, J. Electroanal. Chem., 338, 155
(1992).
13. J. J. Kelly and A. C. West, J. Electrochem. Soc., 145, 3472 (1998).
14. K. R. Hebert, S. Adhikari, and J. E. Houser, J. Electrochem. Soc., 152, C324 (2005).
15. T. P. Moffat, D. Wheeler, and D. Josell, J. Electrochem. Soc., 151, C262 (2004).
16. J. W. Gallaway and A. C. West, J. Electrochem. Soc., 155, D632 (2008).
17. P. M. Vereecken, H. Deligianni, K. T. Kwietniak, P. C. Andricacos, R. A. Binstead,
J. Wu, R. Mikkola, and J. M. Calvert, Abstract Philadelphia, PA; May 13, 2002. The
201st Meeting Electrochem. Soc. 2002.
18. M. Tan, C. Guymon, D. R. Wheeler, and J. N. Harb, J. Electrochem. Soc., 154, D78
(2007).
19. M. Tan and J. N. Harb, J. Electrochem. Soc., 150, C420 (2003).
20. E. E. Farndon, F. C. Walsh, and S. A. Campbell, J. Appl. Electrochem., 25, 574
(1995).
21. T. P. Moffat, D. Wheeler, and M. D. Edelstein, IBM J. Res. Dev., 49, 19 (2005).
24
22. J. J. Kim, S.-K. Kim, and Y. S. Kim, J. Electroanal. Chem., 542, 61 (2003).
23. M. J. Willey, J. Reid, and A. C. West, Electrochem. Solid-State Lett., 10, D38
(2007).
24. S. K. Kim, D. Josell, and T. P. Moffat, J. Electrochem. Soc., 153, C616 (2006).
25. P. Taephaisitphongse, Y. Cao, and A. C. West, J. Electrochem. Soc., 148, C492
(2001).
26. M. Hasegawa, Y. Negishi, T. Nakanishi, and T. Osaka, J. Electrochem. Soc., 152,
C221 (2005).
27. S. Kenny and K. Matejat, in Proceedings of the EPC 2000 PCB Convention,
CircuiTree, February 2001, p. 10. (2000).
28. S. Kenny and B. Reents, in Proceedings of the CPCA, Atotech Deutschland GmbH
(2005).
29. S. Kenny, B. Reents, and J. Zosel, in Proceedings of the CPCA, Atotech Deutschland
GmbH (2003).
30. J. Barthelmes, in Proceedings of the Electronics Circuits World Convention 8,
Atotech Deutschland GmbH (1999).
31. B. Roelfs and T. Fujiwara, in Proceedings of the JPCA, Atotech Deutschland GmbH
(2008).
32. T. D. R. Preisser, and H. Fuerhaupter, Abstract Orlando, FL; October 13, 2003. The
204th Meeting of The Electrochemical Society, Inc., 2003.
33. J. V. Eisden, X. Kang, J. Enloe, C. G. Koh, and R. Preisser, Abstract San Francisco,
FL; May 25, 2009, p. 979, The Electrochemical Society Meeting Abstracts, Vol. 901,
2009.
25
34. J. D. Adolf, R. Preisser, and U. Landau, Abstract Vienna, Australia; October 5, 2009,
p. 2163, The Electrochemical Society Meeting Abstracts, Vol. 902, 2009.
35. M. J. Willey and A. C. West, Electrochem. and Solid-State Lett., 9, E17 (2006).
36. M. J. Willey and A. C. West, J. Electrochem. Soc., 153, C728 (2006).
37. M. J. Willey and A. C. West, J. Electrochem. Soc., 154, D156 (2007).
38. J. W. Gallaway, M. J. Willey, and A. C. West, J. Electrochem. Soc., 156, D146
(2009).
39. J. W. Gallaway, M. J. Willey, and A. C. West, J. Electrochem. Soc., 156, D287
(2009).
40. P. M. Vereecken, R. A. Binstead, H. Deligianni, and P. C. Andricacos, IBM J. Res.
Dev., 49, 3, (2005).
41. T. R. Ralph, M. L. Hitchman, J. P. Millington, and F. C. Walsh, J. Electroanal.
Chem., 375, 17 (1994).
42. C. V. Krishnan, M. Garnett, and B. Chu, Int. J. Electrochem. Sci., 3, 854 (2008).
43. N. Tanaka, I. M. Kolthoff, and W. Stricks, J. Am. Chem. Soc., 77, 2004 (1955).
44. T. P. Moffat, B. Baker, D. Wheeler, and D. Josell, Electrochem. Solid-State Lett., 6,
C59 (2003).
45. L. D’Urzo, H. Wang, A. Pa, and C. Zhi, J. Electrochem. Soc., 152, C243 (2005).
26
Table I.
Solution Current efficiency
VMS 98.2%
VMS–Fe2+ (12g L-1 or 0.215 M)–Fe3+ (0.5 g L-1 or 0.009 M) 89%
VMS–Fe2+ (12g L-1 or 0.215 M)–Fe3+ (1.0 g L-1 or 0.018 M) 81%
Table I. Current efficiency measurements in the presence of the Fe3+/Fe2+ couple without
plating bath additives. Plating was performed on a Pt RDE at -15 mA cm-2 at a rotation
speed of 300 rpm.
27
Figure 1
(a) (b) (c)
Figure 1. SEM cross section of TSV (diameter = 5 µm, height = 25 µm) filling keeping all
conditions the same except for Fe3+ concentration and anode material: (a) Cu anode, no Fe3+
ions; (b) inert anode, 0.47 g L-1 (0.0084 M) Fe3+; (c) inert anode, 2 g L-1 (0.036 M) Fe3+.
28
Figure 2
Figure 2. Schematic diagram of the microfluidic device (µ-cell), showing key dimensions.
29
Figure 3
U (V vs. Ag|AgCl)
-0.4 -0.2 0.0 0.2 0.4 0.6 0.8
i (m
A c
m- 2
)
-20
-15
-10
-5
0
100 rpm
400 rpm
900 rpm
1600 rpm
2500 rpm
3600 rpm
4900 rpm
-cell
Pt RDE
Figure 3. Results of linear sweep voltammetry measured on a platinum surface inside the µ-
cell and RDE. The electrolyte contained dissolved Fe3+ (0.5 g L-1 or 0.009 M) in 0.5 M
H2SO4; scan rate was 10 mV s-1. Graph shows mass diffusion limited currents at different
flow conditions, and demonstrates that the mass flux inside the µ-cell is considerably higher
than on the RDE.
30
Figure 4
Time (sec.)
40 60 80 100 120 140 160 180
-i (
mA
cm
- 2)
0
2
4
6
8
10
12
14
VMS-PEG-Fe3+/Fe2+
VMS-PEG
VMS
Adsorption
Desorption
Plating in VMS@ t < 41 sec.
U = - 150 mVPEG = 300 ppm
Fe3+ = 0.024 g/L
Fe2+ = 0.576 g/L
Figure 4. Current as a function of time for an applied potential U = -150 mV vs. Ag|AgCl.
Results are obtained in the µ-cell: at time = 41 s, additives are introduced to VMS. They are
then removed at 150 s. The dashed line represents an experiment with PEG and the redox
couple, and the solid line is for introduction of PEG alone. The PEG-Fe3+/Fe2+ current
density is increased by approximately -2 mA cm-2, due to the reduction of ferric ions.
31
Figure 5
Time (sec.)
150 200 250 300 350 400 450 500
-i (
mA
cm
-2)
0
520
25
PEG-Fe3+
/Fe2+
PEG
U = -50 mV900 rpmPEG = 300 ppm
Fe3+
= 0.5 g/L
Fe2+
= 12 g/L
PEG Adsorption
Plating in VMS@ t < 200 sec.
Figure 5. Current as a function of time for an applied potential U = -50 mV vs. Ag|AgCl.
Results are obtained on an RDE: at time = 200 s, additives are injected to VMS. Results are
shown for an experiment with PEG and the redox couple and for PEG alone. The PEG-
Fe3+/Fe2+ current density is increased by approximately -2 mA cm-2, due to the reduction of
ferric ions.
32
Figure 6
U (V vs. Ag|AgCl)
-0.4 -0.3 -0.2 -0.1 0.0 0.1
i (m
A c
m-2
)
-50
-45
-40
-35
-30
-25
-20
-15
-10
-5
0
5
Fe3+
= 5 g/L
Cl- = 50 ppmPEG = 300 ppmH2SO4 = 30 g/L
PEG + Fe3+
VMS + PEG
VM
S +
PEG
+ F
e3+
Figure 6. Current-potential curve on an RDE; potential is scanned from positive to negative
at 10 mV s-1. Results are shown for electrolytes containing: (1) VMS and PEG, (2) Fe3+ and
PEG, and (3) VMS, PEG, and Fe3+.
33
Figure 7
Time (sec.)
200 300 400 500
-i (
mA
cm
-2)
0
5
1020
25
PEG-SPS
PEG-SPS-Fe3+
/Fe2+
PEG-SPS-Fe3+
/Fe2+
(bath age prior to exp. = 22 min-29 hours, 6 exps)
U = -50 mV900 rpmPEG = 300 ppmSPS = 30 pm
Fe2+
= 12 g/L
Fe3+
= 0.5 g/L
Figure 7. Current as a function of time for an applied potential U = -50 mV vs. Ag|AgCl.
Results are obtained on an RDE: at time = 200 s, additives are injected to VMS. Results are
shown for: (1) PEG and SPS, (2) PEG, SPS, and redox couple (no bath aging), and (3) PEG,
SPS and redox couple (six experiments combined for various aging times). Premixing of
SPS and Fe3+/Fe2+ before injection had a noticeable effect on acceleration of Cu ECD.
34
Figure 8
Time (sec.)
40 60 80 100 120 140
- i (m
A c
m-2
)
0
2
4
6
8
10
VMS-PEG-SPS
VMS-PEG-SPS-Fe3+
/Fe2+
(bath age prior to exp. = 3 hours)
Adsorption
Plating in VMS@ t < 41 sec.
U = - 100 mVPEG = 300 ppmSPS = 30 ppm
Fe2+
= 0.024 g/L
Fe3+
= 0.576 g/L
Figure 8. Current as a function of time for an applied potential U = -100 mV vs. Ag|AgCl.
Results are obtained in the µ-cell: at time = 41 s, additives are introduced to VMS. They are
then removed at 150 s. The dashed line represents an experiment with PEG and the redox
couple, and the solid line is for introduction of PEG alone. Premixing of SPS and Fe3+/Fe2+
before injection for 3 h has a noticeable effect on acceleration of Cu ECD.
35
Figure 9
Time (sec.)
100 200 300 400 500
-i (
mA
cm
-2)
0
10
20
30
PEG-SPS
PEG-SPS-Fe3+
PEG-SPS-Fe2+
(bath age prior to exp. = 1 day)
PEG-SPS-MPS (10ppb)
Cu2+
= 35 g/L
Fe3+
= 0.5 g/L
Fe2+
= 12 g/LSPS = 30 ppmPEG = 300 ppmH2SO4 = 30 g/L
Cl- = 50 ppm
900 rpm
U = -0.05 V
Figure 9. Current as a function of time for an applied potential U = -50 mV vs. Ag|AgCl.
Results were obtained on an RDE: at time = 156 s, additives were injected to VMS. Results
are shown for: (1) PEG and SPS (premixed for 1 day), (2) PEG, SPS and Fe3+ (premixed for
1 day), (3) PEG, SPS and Fe2+ (premixed for 1 day), (4) PEG, SPS, and MPS. Premixing of
SPS and Fe3+ before experiment had insignificant effect on acceleration of Cu ECD.
Premixing of SPS and Fe2+, however, did increase acceleration and the result closely
followed injection of PEG, SPS and MPS to VMS.
36
Figure 10
Time (sec.)
0 100 200 300 400 500
-i (
mA
cm
-2)
0
5
10
15
20
25
30
35
PEG-SPS
PEG-SPS-Fe2+
(bath age prior to exp. = 3 hours)
U = -0.1 V
Figure 10. Current as a function of time for an applied potential U = -100 mV vs. Ag|AgCl.
Results were obtained on an RDE at 900 rpm. The dotted line represents an experiment with
PEG, SPS and Fe2+ in VMS (aged for 3 h), and the solid line is for PEG and SPS alone.
Premixing of SPS and Fe2+ before experiment shortened the time to steady state.
37
Figure 11
Time (sec.)
0 100 200 300 400 500
-i (
mA
cm
-2)
10
15
20
25
30
100 rpm
400 rpm
900 rpm
1600 rpm
2500 rpm
Cu2+ = 20 g/LH2SO4 = 30 g/L
Cl- = 50 ppmPEG = 300 ppmSPS = 30 ppm
Fe2+ = 12 g/LBath age = 3-5 hours
U = -0.1 V
Figure 11. Current as a function of time for an applied potential U = -100 mV vs. Ag|AgCl.
Results were obtained on an RDE at different rotation speeds. The electrolyte contained
PEG, SPS, and Fe2+ ions, premixed 3 h prior to the experiments. The mass transfer
dependency presented here was characteristic of PEG, SPS, and MPS containing electrolytes
(not shown).
38
Chapter 3
Interaction between SPS and MPS in the Presence of Ferrous and Ferric
Ions
Abstract
The ferric/ferrous redox couple interacts with bis-(3-sulfopropyl) disulfide (SPS),
leading to increased amounts of 3-mercaptopropyl sulfonate (MPS) in solution. SPS is an
essential organic additive in the electrochemical deposition of copper from acidic cupric
sulfate electrolytes onto printed circuit boards and integrated circuits. Electrochemical
studies showed that the accelerating action of SPS was dependent on the ferric/ferrous
concentration ratio, with weakening dependence at increasing cupric sulfate concentration.
HPLC and electrochemical results suggested that an increased concentration of MPS in the
presence of the redox couple was the primary cause of the increased acceleration.
Equilibrium estimates of MPS generation by the introduced redox chemistry partially
explained these observations; the standard reduction potential of SPS to MPS reduction was
estimated to be in a range between 0.3 and 0.4 V vs. SHE. However, the magnitude of
acceleration went through a maximum at an intermediate ferric-ferrous ratio, possibly
because SPS may be converted to MPS via both an oxidative and reductive pathways.
39
Introduction
Organic additives play a crucial role in the copper electrodeposition process that is
utilized in the fabrication of modern microelectronic devices and printed circuit boards.1 A
synergetic interplay between various organic constituents of the copper plating bath leads to
a special filling behavior of inlaid features, often referred to as superfilling or bottom-up
filling.2 Superfilling makes possible the filling of inlaid cavities by electrodeposition without
voids and with desired internal and surface properties. Constituents of electrolyte that enable
this behavior are able to either suppress or alleviate suppression (i.e. accelerate) of copper
deposition. The suppressors are normally polyalkene molecules, such as polyethylene glycol
(PEG), and the accelerator is almost exclusively bis-(3-sulfopropyl) disulfide (SPS).3
Although the interaction between plating additives at the electrode surface and in the
bulk electrolyte has been a major topic of research for many years, the behavior of
accelerator in particular is still under investigation.4–9 Moffat et al. have shown that aged 3-
mercaptopropyl sulfonate (MPS) containing electrolytes exhibit the same electrochemical
behavior as SPS containing electrolytes.10 Using Raman spectroscopy and pH
measurements, Kim et al. demonstrated the appearance of disulfide bond in the mixture of
MPS and Cu2+ ions.11 These and other observations,12 led researchers to propose the
following oxidative dimerization mechanism of MPS to SPS (where = 0.16 V vs.
SHE)
(1)
It was also proposed that a conversion of SPS to MPS does not occur, because the
right side of Reaction 1 is favored due to a continuous consumption of Cu+ by dissolved
oxygen.10 D’Urzo et al. noted that in the bulk electrolyte and without electrodic activity
40
MPS molecules can combine to form SPS through the dissolved oxygen in solution, possibly
in accordance with Reaction 2.13 However, Brennan et al. saw no evidence for Reaction 2
when they analyzed MPS standards in O2 sparging water with ion chromatography.14
Nevertheless, oxygen does play a role in MPS speciation, as evidenced by the data from
Brennan et al. that shows MPS conversion to mainly SPS and 1,3 propanedisulfonic acid
(PDS) in the presence of cupric ions.14
(2)
It would seem that there may be multiple pathways by which most MPS is converted
to SPS. However, the electrodic activity of SPS is also important.15,16 Based on the mass-
spectrum data obtained by Hung et al.17 and West et al.,18 together with information from
Atotech, Berlin GmbH,19 SPS breakdown in a standard copper electrolytic bath may be
summarized by Fig. 1, although more interconversions and other breakdown products were
reported.18 SPS can be either oxidized or reduced in a plating bath during electrodic activity
on both the anode and cathode. Both pathways, however, may eventually lead to PDS,
which has been shown to be the most stable byproduct of SPS decomposition.16–18 The
reduction of SPS to MPS has also been associated with the catalytic action of SPS through
various hypothesized mechanisms, many involving stabilization of cuprous complexes at the
electrode surface.20–26
The ferric/ferrous redox couple is utilized in copper electrolytes for plating printed
circuit boards, and has been considered for implementation in on-chip metallization of
copper.27,28 One advantage of including the Fe3+/Fe2+ couple in copper electrolytes is that it
allows the use of an insoluble, dimensionally stable anode.27,29 It has also been found that
the consumption of accelerator is significantly reduced when both the Fe3+/Fe2+ redox
41
couple and an insoluble anode are used (as oppose to no redox couple and Cu anode).30 It
may be useful to note that a similar or even better prevention of SPS break down can
possibly be achieved by separating anode and cathode compartments with a cation-selective
membrane.10,31
This chapter builds on the study of interaction between the Fe3+/Fe2+ couple and
plating bath additives presented in chapter 3.32 It was suggested that SPS interacts with
ferrous ions in solution to generate MPS at sub-ppm concentration levels (possibly in
accordance with Reaction 3). The cleavage of the disulfide bond in the presence of various
redox couples (that occurs during the reduction of SPS) has also been seen in analogous
systems, such as the L-cystine/L-cysteine couple.33–35
(3)
The redox couple can also potentially influence the equilibrium of Reactions 1 and 2
in favor of MPS. Especially, the concentration of dissolved oxygen can be strongly
influenced by the Fe3+/Fe2+ couple, due to a thermodynamically favored consumption of
dissolved oxygen via oxidation of ferrous ions (where = 0.77V vs. SHE).
(4)
Furthermore, the amount of Cu+, which has been attributed to the catalytic action of SPS,23
can be altered either through an impact of the Fe3+/Fe2+ couple on the concentration of
dissolved oxygen or directly via the reduction of Fe3+ to Fe2+.
(5)
(6)
In the previous chapter, no direct measurement of MPS in the bulk electrolyte has
been performed.32 To address this issue, a chromatographic method has been developed for

42
high performance liquid chromatography coupled with electrochemical detection (HPLC-
ED) to allow a resolution of minute quantities of MPS (i.e. low ppb levels).36 A few efforts
have been described in the literature for analysis of SPS and its byproducts by HPLC with
various detection schemes, such as UV spectroscopy,13,37 mass spectrometry,17 and
electrochemical detection.38 However, we are not aware of studies that show an adequate
separation of SPS by-products, unambiguously assign chromatographic peaks, and have
detection sensitivity in the nano-molar range.
In this chapter we present the results of electrochemical investigation and HPLC-ED
examination which were used to determine the action of SPS in the presence of ferric and
ferrous ions. Theoretical predictions based on equilibrium constants are also included as a
complement to the HPLC and electrochemical results.
Experimental
HPLC-ED
All chromatographic analyses were performed on an in-house developed system at
Atotech, Berlin GmbH. A more detailed description of the methodologies is found in chapter
4.36 The set-up consisted of a K-120 gradient pump (Knauer, Inc.) connected to a PEEK
pulsation damper (Metrohm, Inc.), which, over a T-piece, led to a Triathlon Spark auto-
sampler (Metrohm, Inc.). At the T-piece, an eluent stream split in two streams: one half was
sent to the auto-sampler and the other half was passed through an equivalent back pressure
column, to maintain the electrochemical cell under flow when the matrix from an analytical
column was directed to waste. At the auto-sampler, an eluent was mixed with a sample of
interest and was sent to an analytical column. Atlantis T3 (column dimensions 4.6×100 mm,
43
particle size 3 µm) C18 reversed-phase analytical column from Waters, Inc. was used for all
chromatographic measurements.
The effluent from the analytical column was passed through an ED50A
Electrochemical Detector (ED) obtained from Dionex, Inc. with Au working electrode and
Ag|AgCl reference electrode. The ED detector worked on a waveform specially designed to
oxidize sulfur atoms; therefore PDS could not be detected. The optimal waveform for the
integrated pulsed amperometric detection was developed by Atotech, Inc.39 Each 1 s cycle
included an adsorption delay step at U = 0.5 V for 0.1 s, followed by the detection step,
where the potential was ramped to 1.7 V in 0.2 s and then decreased back to -0.5 V in 0.2 s;
the third and final step was used for electrode cleaning and included a jump in potential to
1.6 V in 0.01 s, keeping potential steady at 1.6 V for 0.1 s, decrease in potential to -0.6 V in
0.01 s, and finally keeping potential steady at -0.6 V for 0.38 s.
To prevent an influence of the matrix, metallic ions were removed from electrolytes
by passing a sample through OnGuard II H proton exchange cartridge (Dionex, Inc.). All
separations were conducted in an isocratic mode (0.25 ml min-1 per column) at room
temperature without temperature control. Instrument control and data acquisition were
handled by the EZChrom Elite software (Agilent Technologies, Inc.).
The optimal method developed for the Atlantis T3 column allowed for a
measurement time of ~70 min per run. Separation of chromatographic peaks was achieved
by using a mobile phase that consisted of 2% HPLC grade acetonitrile and 0.0125 M H2SO4
in deaerated Millipore water. The retention times of all detectable species have been
established with the use of commercially available (SPS and MPS) as well as in-company
synthesized (mono-ox-SPS and di-ox-SPS) chemical standards. The retention times were
44
based on peak matching relative to standards and were found to be as follows: ~11 min for
mono-oxide-SPS, ~16.5 min for MPS, ~19 min di-oxide-SPS, and ~64 min for SPS. Further,
details on the method development can be found in work by chapter 4.36
Electrochemistry
The electrochemical cell consisted of a platinum rotating disk electrode (diameter 3
mm), Ag|AgCl reference electrode (BASi Re-5), and a platinum wire as a counter electrode.
Prior to every experiment, the platinum RDE was pretreated in 0.5 M H2SO4 solution by
cycling the electrode potential repeatedly from -0.173 to 1.2 V at 1 V s-1 until a
characteristic cyclic voltammogram was observed. Then platinum surface was modified by
preplating a thin copper layer from a copper sulfate electrolyte at -40 mA cm2 for 120 s. At
the end of every experiment, a nitric acid solution was used to strip the plated copper from
the platinum surface. This electrode preparation procedure led to a highly reproducible
polarization data.
Copper baths were prepared from CuSO4·5H2O (VWR International), Fe2SO4·7H2O
(Sigma-Aldrich), concentrated H2SO4 (EMD Chemicals, Inc.), PEG 3350 g mol-1 (Sigma-
Aldrich), HCl, SPS (96% mass fraction,14 Raschig GmbH), and MPS (87.2% mass
fraction,14 Raschig GmbH). The organic additives were individually added to the plating
bath through dilution from master solutions that were dissolved in water. PEG was always
used in the amount of 300 ppm (9×10⁻⁵ M). During aging, solutions were kept at a room
temperature in a beaker exposed to atmosphere for electrochemical experiments and sealed
in plastic containers for HPLC experiments.
45
Results and Discussion
Chromatographic results
The chromatographic measurements were first performed in 0.3 M sulfuric acid
solution with 10 g L-1 (0.18 M) of Fe2+ and 15 ppm (4.23×10⁻⁵ M) of SPS, without cupric
ions and without electrodic activity. The results of these measurements at 1, 4, and 7 days
after sample preparation are shown in Fig. 2. The MPS peak became readily visible in the
chromatograms, and the peak area continued to grow even after 4 days, suggesting a slow
equilibration time (in contrast to solutions with Cu2+, see below). The SPS peak appeared at
64 min (not shown). The areas of chromatographic peaks seen around 17 min were linked to
MPS concentrations via an external calibration of peak areas versus known amounts of MPS
(not shown). The concentration of MPS corresponding to the data presented in Fig. 2, are as
follows: 78 ppb (4.38×10⁻⁷) after 1 day, 240 ppb (1.35×10⁻⁶) after 4 days, and 510 ppb
(2.88×10⁻⁶) after 7 days.
The chromatographic analysis was then performed in a solution with 10 g L-1 (0.18
M) of Fe3+ and 15 ppm (4.23×10⁻⁵ M) of SPS in 0.3 M sulfuric acid solution, again without
cupric ions and without electrodic activity. Figure 3 shows the results 1, 4, and 7 days after
sample preparation. The chromatographs demonstrate the absence of MPS and di-ox-SPS
peaks. The absence of MPS could have also been predicted from Reaction 3, since SPS
requires ferrous ions (i.e. a reducing agent), to be converted to MPS. However, the absence
of di-ox-SPS peak was unclear to us.
Similar to Figs. 2 and 3, the chromatographic measurements were carried out in the
0.3 M sulfuric acid solution of SPS (15 ppm), Fe2+ (10 g L-1), and 10 g L-1 (0.157 M) of Cu2+
ions. As shown in Fig. 4, the magnitude of the chromatographic peak attributed to MPS
46
decreased in the presence of cupric ions. The peak areas of MPS, after 1, 4 and 7 days,
correspond to a concentration value of around 24 ppb (1.35×10⁻⁷ M) and appear stable over
time. The reason for faster equilibration time in solutions containing Cu2+ was unclear. It is
also worth noting that the peak for di-ox-SPS appears only in the presence of ferrous ions
(i.e. solutions with and without Cu2+ and/or Fe3+ showed no sign of di-ox-SPS).
The small shifts in elution time of the various peaks in Figs. 2 – 4 could be due to
several external and internal factors. The elution time depends on the interaction of
molecules with stationary and mobile phases. The degree of interaction could be affected by
several factors, such as temperature (which was not controlled) and small variations in the
concentration of the mobile phase (which could happen upon replenishment of the mobile
phase, for example). Since the experiments in Figs. 2 – 4 were performed over a span of 7
days, small changes in elution time were hard to control.
Electrochemical results
An electroanalytical investigation was performed to check whether the
electrochemical behavior is consisted with the chromatographic data, and to further
investigate the role of Reaction 3 in copper deposition. We hypothesized that MPS was the
primary species responsible for the acceleration of copper deposition. Based on this
hypothesis, a similar electroanalytical response was expected during the electrochemical
deposition of copper from the copper electrolyte of PEG, SPS (15 ppm), and Fe2+ (10 g L-1)
and the electrolyte of PEG, SPS (15 ppm), and MPS at 24 ppb (as predicted from Fig. 3).
Based on linear sweep voltammetry measurements (Fig. 5), the two electrolytes indeed
exhibit a similar electrochemical behavior.
47
Deviation of PEG, SPS, and Fe2+ curve from PEG, SPS, and MPS curve,
notwithstanding experimental uncertainties and scatter, may be correlated with the presence
of di-ox-SPS species in the PEG, SPS, Fe2+ electrolyte (as suggested by Figs. 2 and 4). The
same deviation can also be attributed to the variation in the bulk concentration of Cu+, which
was affected by Fe2+ ions in solution.
As measured by HPLC, the bulk concentration of MPS was a function of Cu2+ level
in electrolyte. To see whether an increase in acceleration due to the presence of ferrous ions
was also a function of Cu2+ concentration, chronoamperometric plating of copper was
conducted at various levels of cupric ions under two conditions: (1) PEG and SPS, and (2)
PEG, SPS, and Fe2+. Figure 6 demonstrates that the impact of Fe2+ on the acceleration of
copper deposition was dependent on amount of cupric ions in solution. As the concentration
of Cu2+ increased, the increase in acceleration in the presence of Fe2+ was diminished. It
even appears that at a sufficiently high concentration of cupric ions, ferrous ions had no
impact on the acceleration of copper deposition.
It was also expected, based on Reaction 3, that with a decreasing ratio of ferric to
ferrous ions, the equilibrium amount of MPS (and hence the degree of acceleration) could
increase. However, as shown in Fig. 8, the steady state current only follows this trend at
relatively high ratios. As the Fe3+/Fe2+ ratio decreases, the steady state current goes through
a maximum and then decreases. One possible explanation is the grossly simplified
equilibrium considerations.
Based on Fig. 1, it can be hypothesized that, in the presence of the redox couple,
MPS was produced via both a reductive pathway (i.e. Reaction 3) and an oxidative
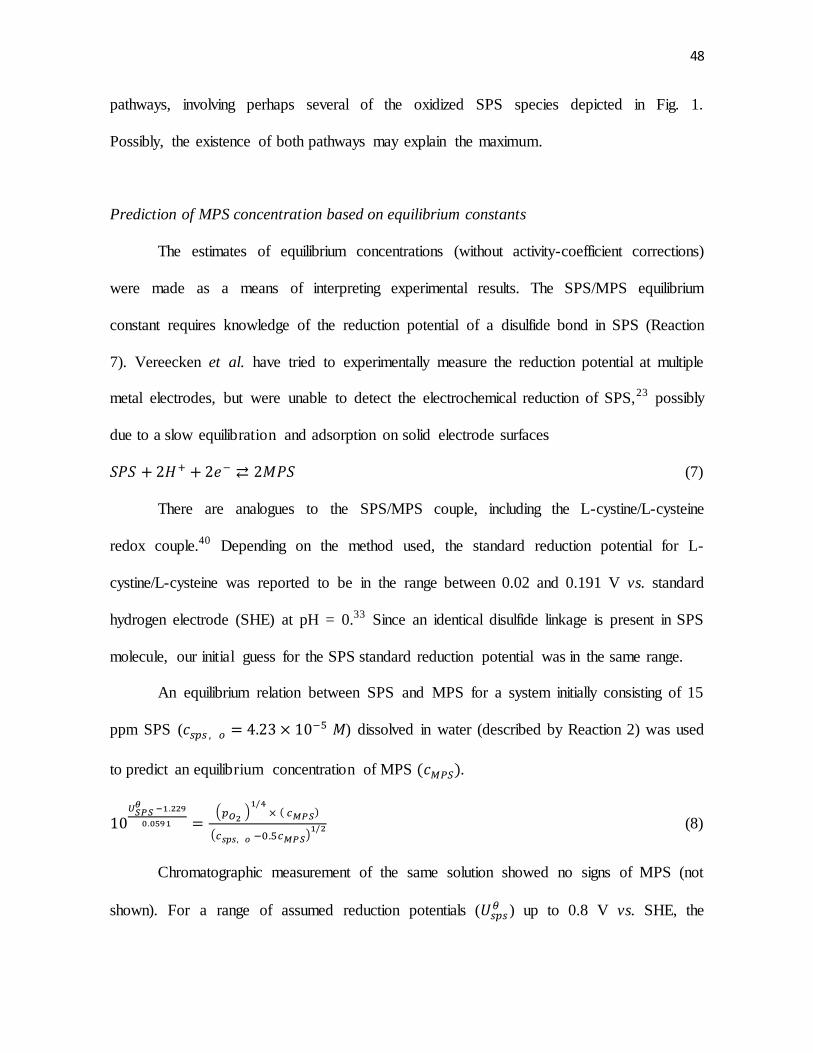
48
pathways, involving perhaps several of the oxidized SPS species depicted in Fig. 1.
Possibly, the existence of both pathways may explain the maximum.
Prediction of MPS concentration based on equilibrium constants
The estimates of equilibrium concentrations (without activity-coefficient corrections)
were made as a means of interpreting experimental results. The SPS/MPS equilibrium
constant requires knowledge of the reduction potential of a disulfide bond in SPS (Reaction
7). Vereecken et al. have tried to experimentally measure the reduction potential at multiple
metal electrodes, but were unable to detect the electrochemical reduction of SPS,23 possibly
due to a slow equilibration and adsorption on solid electrode surfaces
(7)
There are analogues to the SPS/MPS couple, including the L-cystine/L-cysteine
redox couple.40 Depending on the method used, the standard reduction potential for L-
cystine/L-cysteine was reported to be in the range between 0.02 and 0.191 V vs. standard
hydrogen electrode (SHE) at pH = 0.33 Since an identical disulfide linkage is present in SPS
molecule, our initial guess for the SPS standard reduction potential was in the same range.
An equilibrium relation between SPS and MPS for a system initially consisting of 15
ppm SPS ( ) dissolved in water (described by Reaction 2) was used
to predict an equilibrium concentration of MPS .
(
)
( ) (8)
Chromatographic measurement of the same solution showed no signs of MPS (not
shown). For a range of assumed reduction potentials ( ) up to 0.8 V vs. SHE, the
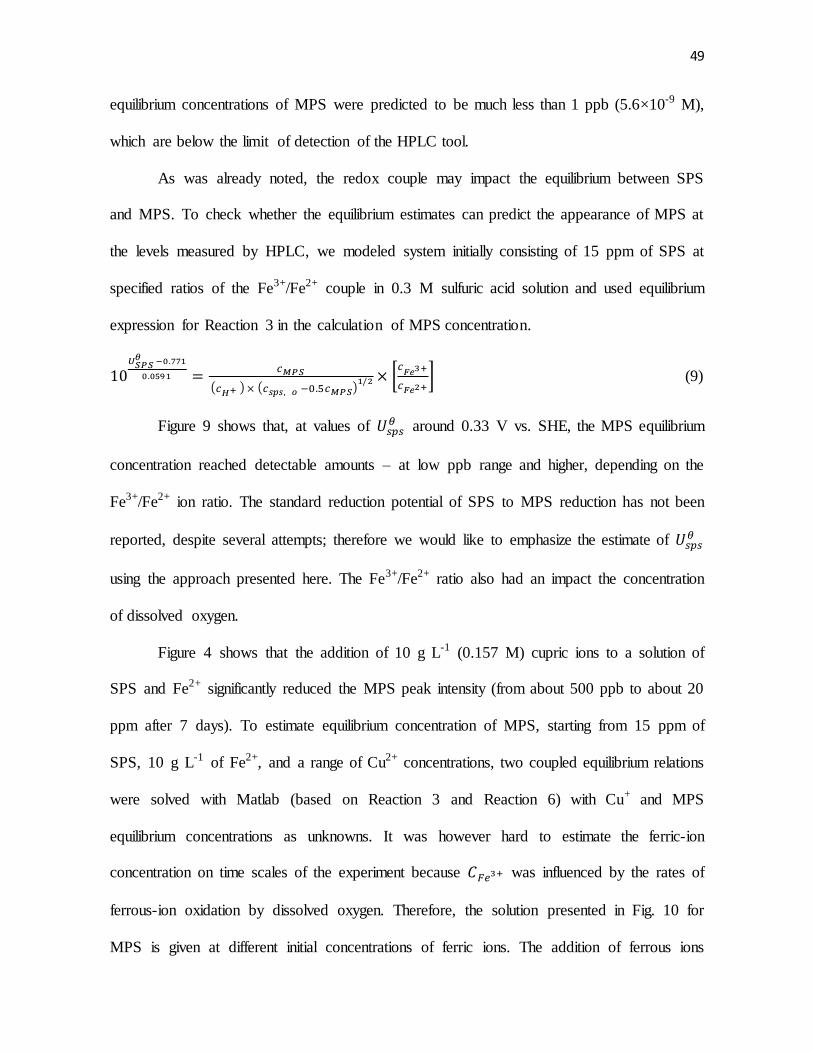
49
equilibrium concentrations of MPS were predicted to be much less than 1 ppb (5.6×10⁻⁹ M),
which are below the limit of detection of the HPLC tool.
As was already noted, the redox couple may impact the equilibrium between SPS
and MPS. To check whether the equilibrium estimates can predict the appearance of MPS at
the levels measured by HPLC, we modeled system initially consisting of 15 ppm of SPS at
specified ratios of the Fe3+/Fe2+ couple in 0.3 M sulfuric acid solution and used equilibrium
expression for Reaction 3 in the calculation of MPS concentration.
( ) ( )
[
] (9)
Figure 9 shows that, at values of around 0.33 V vs. SHE, the MPS equilibrium
concentration reached detectable amounts – at low ppb range and higher, depending on the
Fe3+/Fe2+ ion ratio. The standard reduction potential of SPS to MPS reduction has not been
reported, despite several attempts; therefore we would like to emphasize the estimate of
using the approach presented here. The Fe3+/Fe2+ ratio also had an impact the concentration
of dissolved oxygen.
Figure 4 shows that the addition of 10 g L-1 (0.157 M) cupric ions to a solution of
SPS and Fe2+ significantly reduced the MPS peak intensity (from about 500 ppb to about 20
ppm after 7 days). To estimate equilibrium concentration of MPS, starting from 15 ppm of
SPS, 10 g L-1 of Fe2+, and a range of Cu2+ concentrations, two coupled equilibrium relations
were solved with Matlab (based on Reaction 3 and Reaction 6) with Cu+ and MPS
equilibrium concentrations as unknowns. It was however hard to estimate the ferric-ion
concentration on time scales of the experiment because was influenced by the rates of
ferrous-ion oxidation by dissolved oxygen. Therefore, the solution presented in Fig. 10 for
MPS is given at different initial concentrations of ferric ions. The addition of ferrous ions
50
should immediately lead to ferric ions in solution through Reaction 4. For example, Reaction
4 predicts that 1 mole of oxygen produces 4 moles of ferric ions, so if we assume all
dissolved oxygen is consumed, then the initial concentration of Fe3+ would be equal to four
times the initial concentration of dissolved oxygen ( ), where
was
assumed to be 2.6×10⁻⁴ M.41 Figure 10 shows that the drop in MPS concentration
comparable to chromatographic measurements, when copper level goes from g/L
to g/L, could be also be predicted based on equilibrium estimates. The best
agreement between estimates and HPLC findings, as seen in Fig. 10, was obtained at low
values.
Conclusions
The interaction between SPS and MPS in the presence Fe2+ and Fe3+ ions was
examined using chromatographic and electrochemical methods. The Fe3+/Fe2+ ratio was a
means of varying the reducing power of the electrolyte, through changing the concentration
of MPS derived from SPS in the bulk electrolyte. When 15 ppm of SPS was mixed with 10 g
L-1 of Fe2+ in 0.3 M H2SO4, HPLC chromatograms showed a distinct peak corresponding to
MPS (~500 ppb, 2.81×10⁻⁶ M, after 7 days). When the same solution was prepared with 10 g
L-1 of Cu2+, the MPS peak intensity was significantly reduced (~20 ppb, 1.12×10⁻⁷ M, after 7
days). A very similar electrochemical response was achieved by adding either Fe2+ or MPS,
suggesting that the enhanced acceleration by adding redox mediator was the result of
elevation of bulk MPS concentration. This enhancement had a maximum at an intermediate
Fe3+/Fe2+ concentration ratio, suggesting perhaps that MPS was derived from SPS by both
reductive and oxidative pathways. The estimates of the standard reduction potential of SPS
51
to MPS reduction, based on equilibrium calculations with reference to HPLC results,
predicted the reduction potential in a range of 0.3 – 0.4 V vs. SHE.
References
1. T. Osaka, M. Hasegawa, M. Yoshino and N. Yamachika, in Advanced Nanoscale
ULSI Interconnects: Fundamentals and Applications, p. 183, Springer, New York
(2009).
2. T. P. Moffat, J. E. Bonevich, W. H. Huber, A. Stanishevsky, D. R. Kelly, G. R.
Stafford and D. Josell, Journal of The Electrochemical Society, 147, 4524 (2000).
3. T. P. Moffat, D. Wheeler and D. Josell, Journal of The Electrochemical Society, 151,
C262 (2004).
4. P. Taephaisitphongse, Y. Cao and A. C. West, Journal of The Electrochemical
Society, 148, C492 (2001).
5. A. C. West, S. Mayer and J. Reid, Electrochemical and Solid-State Letters, 4, C50
(2001).
6. J. J. Kelly and A. C. West, Journal of The Electrochemical Society, 145, 3477
(1998).
7. P. C. Andricacos, C. Uzoh, J. O. Dukovic, J. Horkans and H. Deligianni, IBM
Journal of Research & Development, 42, 567 (1998).
8. J. W. Gallaway, M. J. Willey and A. C. West, Journal of The Electrochemical
Society, 156, D146 (2009).
9. M. J. Willey and A. C. West, Journal of The Electrochemical Society, 154, D156
(2007).
52
10. T. P. Moffat, B. Baker, D. Wheeler and D. Josell, Electrochemical and Solid-State
Letters, 6, C59 (2003).
11. J. J. Kim, S.-K. Kim and Y. S. Kim, Journal of Electroanalytical Chemistry, 542, 61
(2003).
12. L. Y. Valentelis, Protection of Metals, 32, 38 (1996).
13. L. D'Urzo, H. Wang, A. Pa and C. Zhi, Journal of The Electrochemical Society, 152,
C243 (2005).
14. R. G. Brennan, M. M. Phillips, L.-Y. O. Yang and T. P. Moffat, Journal of The
Electrochemical Society, 158, D178 (2011).
15. A. Frank and A. J. Bard, Journal of The Electrochemical Society, 150, C244 (2003).
16. W.-H. Lee, C.-C. Hung, S.-C. Chang and Y.-L. Wang, Journal of The
Electrochemical Society, 157, H131 (2010).
17. C. C. Hung, K. W. Chen and Y. L. Wang, J. Vac. Sci. Technol. B, 26(1), 255 (2008).
18. T. H. Bailey, Q. Wang and M. West, ECS Transactions, 2, 131 (2007).
19. H. Brunner, Private Communication, Berlin, Germany (2010).
20. N. Zukauskaite and A. Malinauskas, Elektrokhimiya, 24, 1691 (1988).
21. H. D. Philippe M. Vereecken, Keith T. Kwietniak, Panayotis C. Andricacos, Robert
A. Binstead, Janet Wu, Robert Mikkola, Jeffrey M. Calvert, The Role of SPS in
Damascene Copper Electroplating, in 201st Meeting of The Electrochemical Society
(2002).
22. E. E. Farndon, F. C. Walsh and S. A. Campbell, Journal of Applied
Electrochemistry, 25, 574 (1995).
53
23. P. M. Vereecken, R. A. Binstead, H. Deligianni and P. C. Andricacos, The chemistry
of additives in damascene copper plating, in IBM Journal of Research &
Development, p. 3, IBM Corporation/IBM Journals (2005).
24. K. Kondo, T. Matsumoto and K. Watanabe, Journal of The Electrochemical Society,
151, C250 (2004).
25. J. P. Healy, D. Pletcher and M. Goodenough, Journal of Electroanalytical
Chemistry, 338, 167 (1992).
26. A. Survila, S. Kanapeckaite and R. Pauliukaite, Chemija (Vilnius), 21 (1998).
27. T. D. R. Preisser, and H. Fuerhaupter, in 204th Meeting, The Electrochemical
Society, Inc. (2003).
28. J. Barthelmes, in Electronics Circuits World Convention 8, Tokyo, Japan (1999).
29. J. V. Eisden, X. Kang, J. Enloe, C. G. Koh and R. Preisser, ECS Meeting Abstracts,
901, 979 (2009).
30. J. D. Adolf, R. Preisser and U. Landau, ECS Meeting Abstracts, 902, 2163 (2009).
31. C. L. Beaudry and J. O. Dukovic, Interface, 13, 40 (2004).
32. I. Volov, T. Saito and A. C. West, Journal of The Electrochemical Society, 158,
D384 (2011).
33. T. R. Ralph, M. L. Hitchman, J. P. Millington and F. C. Walsh, Journal of
Electroanalytical Chemistry, 375, 17 (1994).
34. N. Tanaka, I. M. Kolthoff and W. Stricks, Journal of the American Chemical
Society, 77, 2004 (1955).
35. P. J. Vandeberg and D. C. Johnson, Analytical Chemistry, 65, 2713 (1993).
54
36. I. Volov, O. Mann, Y. Hoenersch, B. Wahl and A. C. West, Journal of Separation
Science, 34, 2385–2390 (2011).
37. R. Palmans, S. Claes, L. E. Vanatta and D. E. Coleman, Journal of Chromatography
A, 1085, 147 (2005).
38. P. Andricacos, D. S. Chung, H. Deligianni, J. E. Fluegel, K. T. Kwietniak, P. S.
Locke, D. D. Restaino, S. C. Seo, P. M. Vereecken and E. G. Walton, Void-Free
Damascene Copper Deposition Process and Means of Monitoring Thereof, in, IBM
Corp, United States (2010).
39. B. Wahl, Bestimmung von Glanzzusätzen in sauren Kupferelektrolyten mittels
HPLC und unterschiedlichen Detektionsmethoden, in, Unpublished Master thesis,
TFH Berlin (2005).
40. C. V. Krishnan, M. Garnett and B. Chu, Int. J. Electrochem. Sci., 3, 854 (2008).
41. L. L. Shreir, R. A. Jarman and G. T. Burstein, Corrosion (3rd Edition) Volumes 1-2,
in, Elsevier (1994).
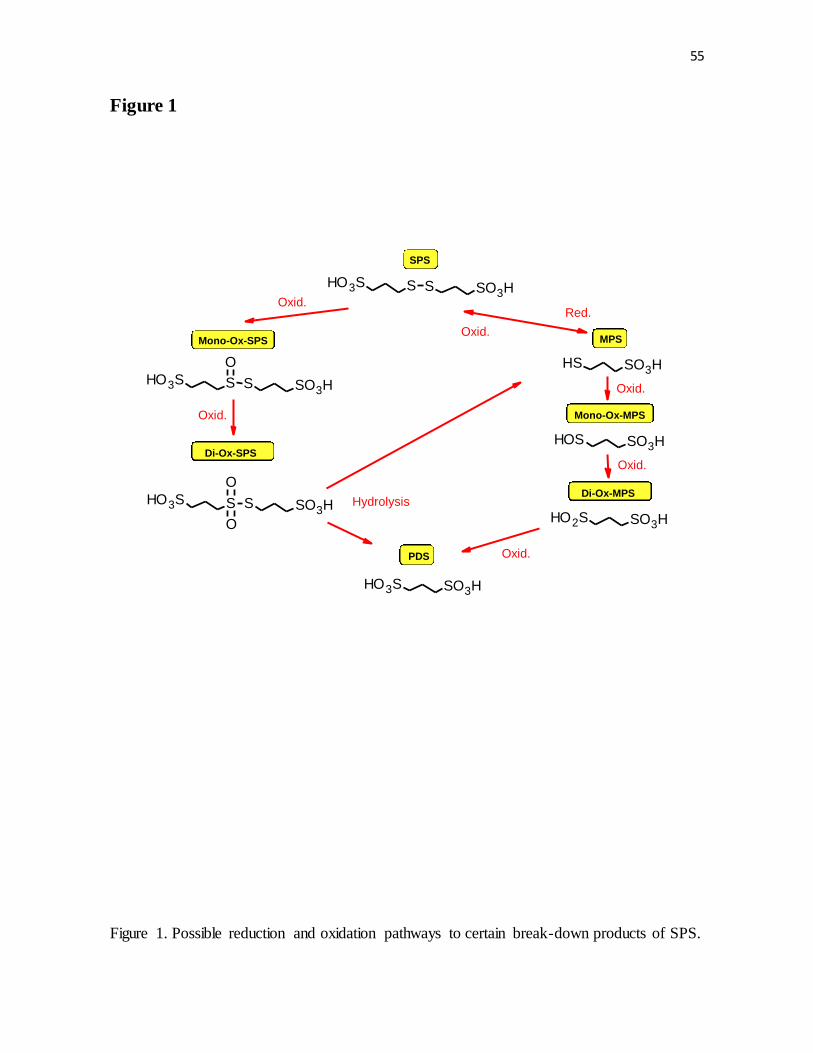
55
Figure 1
SPS
Mono-Ox-SPS
Di-Ox-SPS
MPS
Mono-Ox-MPS
Di-Ox-MPS
Oxid.
Oxid.
Oxid.
Oxid.
Oxid.
Red.
PDS Oxid.
Hydrolysis
S SHO3S SO3H
S SHO3S SO3H
O
S SHO3S SO3H
O
O
SH SO3H
HOS SO3H
HO2S SO3H
HO3S SO3H
Figure 1. Possible reduction and oxidation pathways to certain break-down products of SPS.
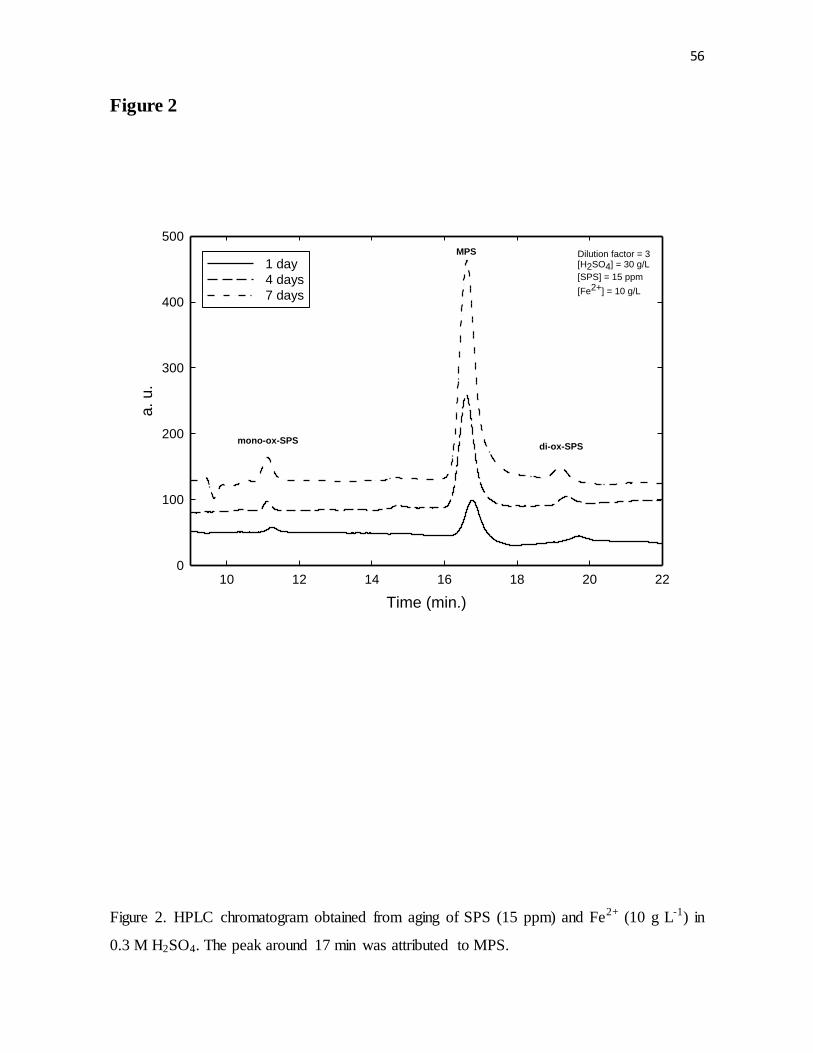
56
Figure 2
Time (min.)
10 12 14 16 18 20 22
a.
u.
0
100
200
300
400
500
1 day
4 days
7 days
Dilution factor = 3[H2SO4] = 30 g/L
[SPS] = 15 ppm
[Fe2+] = 10 g/L
MPS
mono-ox-SPSdi-ox-SPS
Figure 2. HPLC chromatogram obtained from aging of SPS (15 ppm) and Fe2+ (10 g L-1) in
0.3 M H2SO4. The peak around 17 min was attributed to MPS.
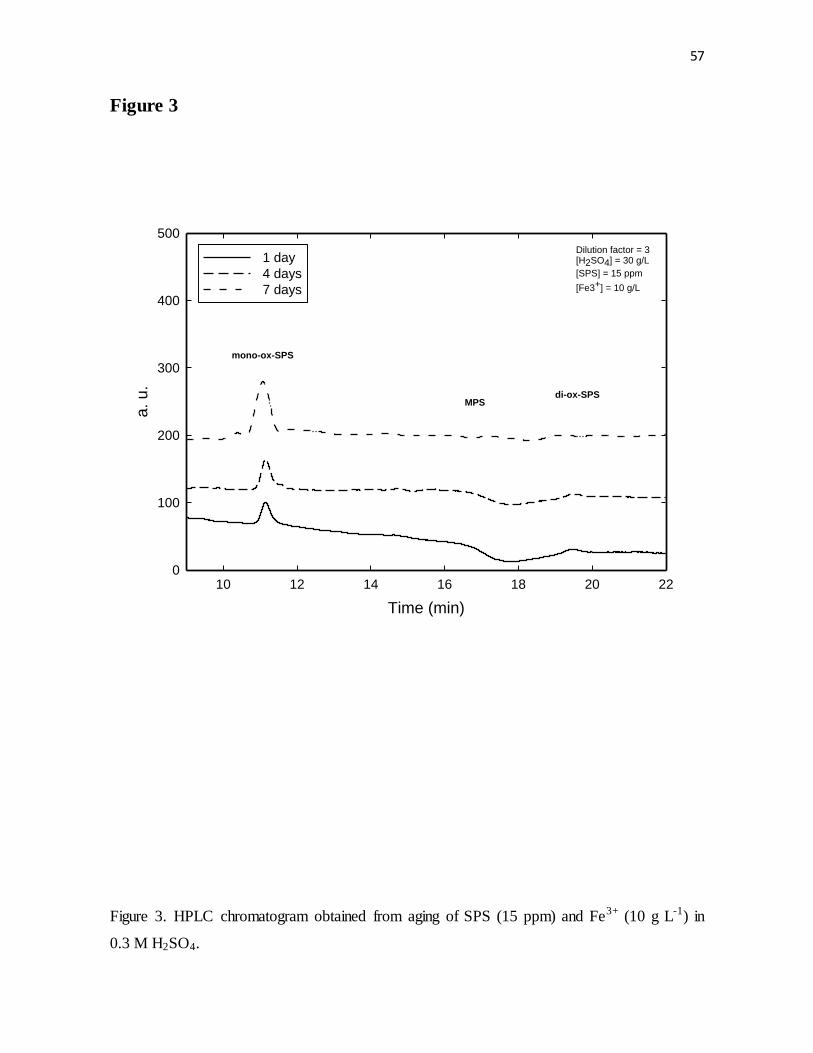
57
Figure 3
Time (min)
10 12 14 16 18 20 22
a.
u.
0
100
200
300
400
500
1 day
4 days
7 days
Dilution factor = 3[H2SO4] = 30 g/L
[SPS] = 15 ppm
[Fe3+] = 10 g/L
MPS
mono-ox-SPS
di-ox-SPS
Figure 3. HPLC chromatogram obtained from aging of SPS (15 ppm) and Fe3+ (10 g L-1) in
0.3 M H2SO4.
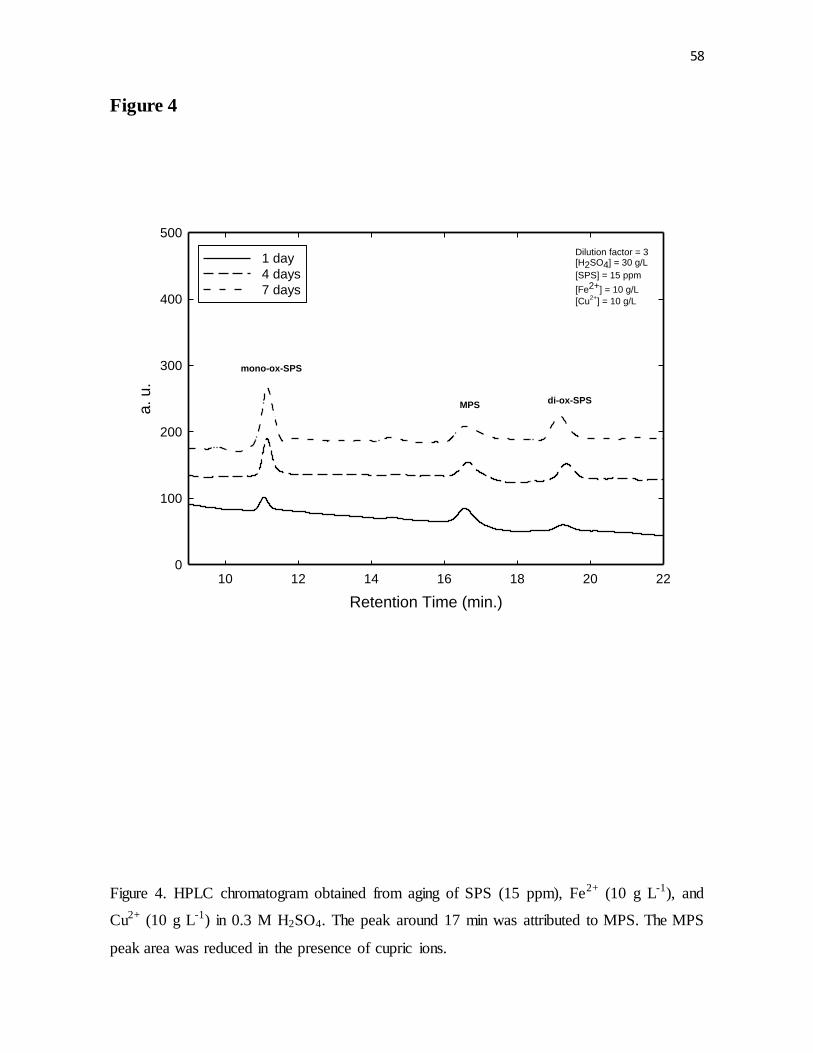
58
Figure 4
Retention Time (min.)
10 12 14 16 18 20 22
a.
u.
0
100
200
300
400
500
1 day
4 days
7 days
Dilution factor = 3[H2SO4] = 30 g/L
[SPS] = 15 ppm
[Fe2+] = 10 g/L
[Cu2+
] = 10 g/L
MPS
mono-ox-SPS
di-ox-SPS
Figure 4. HPLC chromatogram obtained from aging of SPS (15 ppm), Fe2+ (10 g L-1), and
Cu2+ (10 g L-1) in 0.3 M H2SO4. The peak around 17 min was attributed to MPS. The MPS
peak area was reduced in the presence of cupric ions.
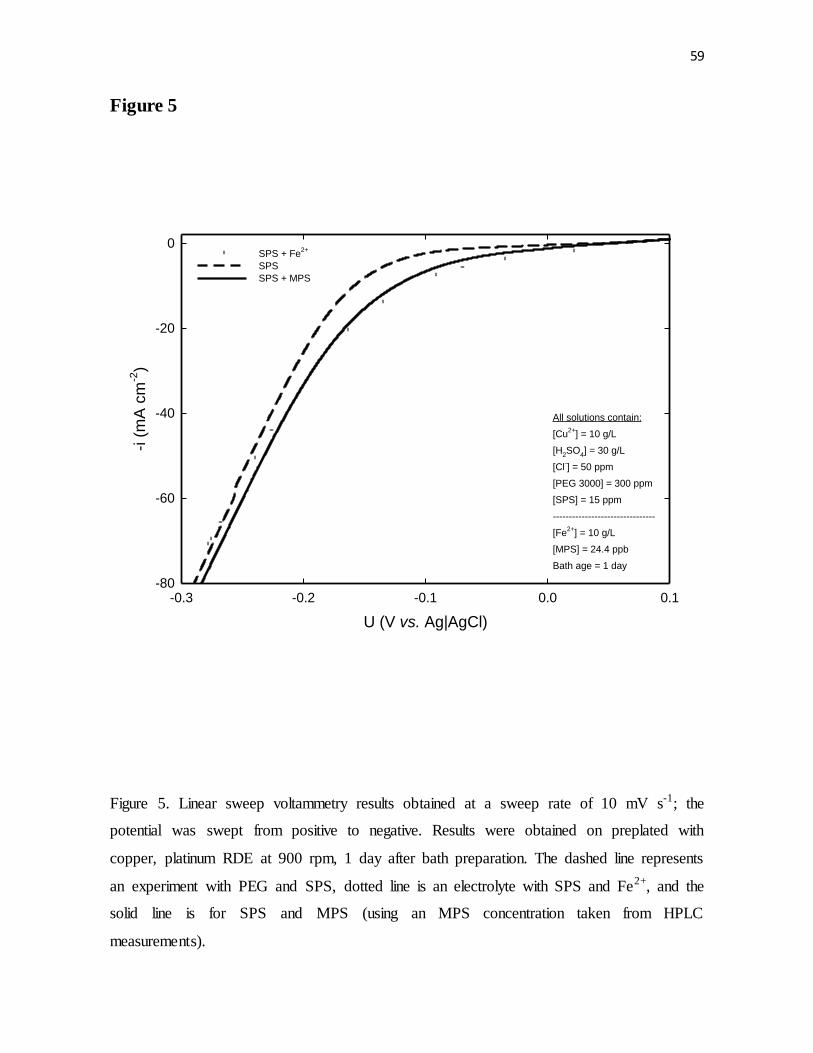
59
Figure 5
U (V vs. Ag|AgCl)
-0.3 -0.2 -0.1 0.0 0.1
-i (
mA
cm
-2)
-80
-60
-40
-20
0SPS + Fe
2+
SPS
SPS + MPS
All solutions contain:
[Cu2+
] = 10 g/L
[H2SO
4] = 30 g/L
[Cl-] = 50 ppm
[PEG 3000] = 300 ppm
[SPS] = 15 ppm
--------------------------------
[Fe2+
] = 10 g/L
[MPS] = 24.4 ppb
Bath age = 1 day
Figure 5. Linear sweep voltammetry results obtained at a sweep rate of 10 mV s-1; the
potential was swept from positive to negative. Results were obtained on preplated with
copper, platinum RDE at 900 rpm, 1 day after bath preparation. The dashed line represents
an experiment with PEG and SPS, dotted line is an electrolyte with SPS and Fe2+, and the
solid line is for SPS and MPS (using an MPS concentration taken from HPLC
measurements).
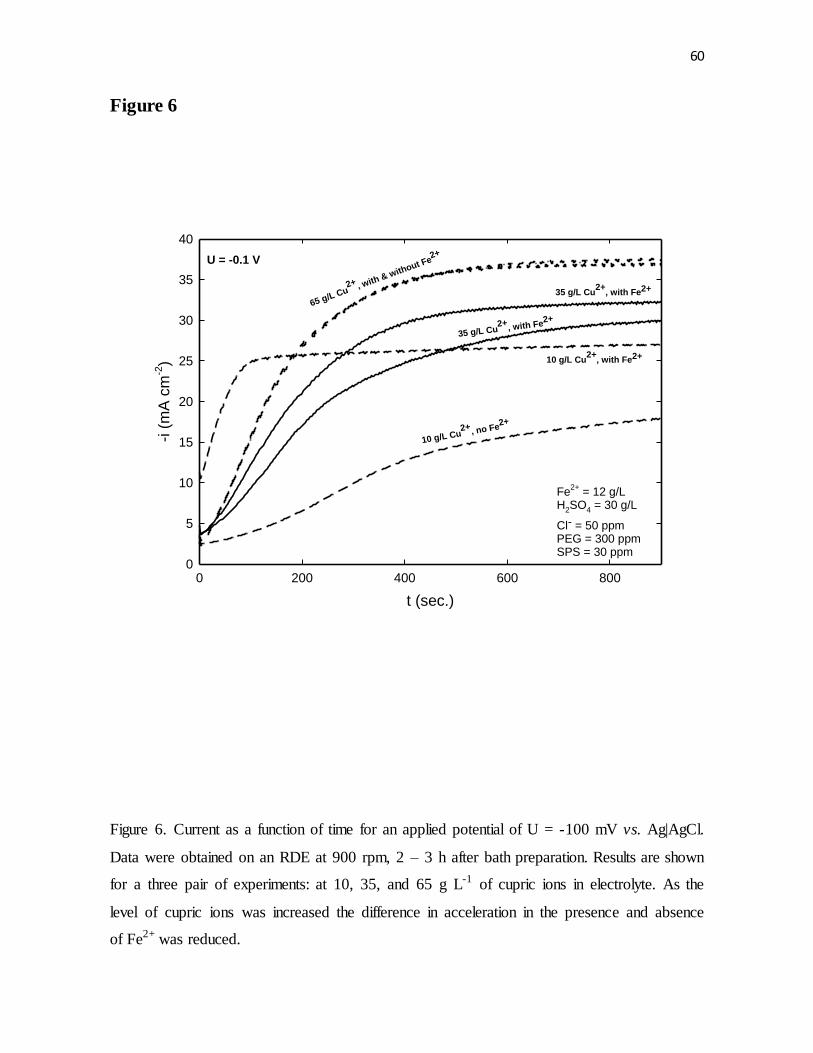
60
Figure 6
t (sec.)
0 200 400 600 800
-i (
mA
cm
-2)
0
5
10
15
20
25
30
35
40
Fe2+
= 12 g/LH2SO4 = 30 g/L
Cl- = 50 ppmPEG = 300 ppmSPS = 30 ppm
U = -0.1 V
10 g/L Cu2+
, with Fe2+
10 g/L Cu2+, no Fe
2+
35 g/L Cu2+
, with Fe2+
35 g/L Cu2+
, with Fe2+
65 g/L Cu2+ , with & without Fe
2+
Figure 6. Current as a function of time for an applied potential of U = -100 mV vs. Ag|AgCl.
Data were obtained on an RDE at 900 rpm, 2 – 3 h after bath preparation. Results are shown
for a three pair of experiments: at 10, 35, and 65 g L-1 of cupric ions in electrolyte. As the
level of cupric ions was increased the difference in acceleration in the presence and absence
of Fe2+ was reduced.
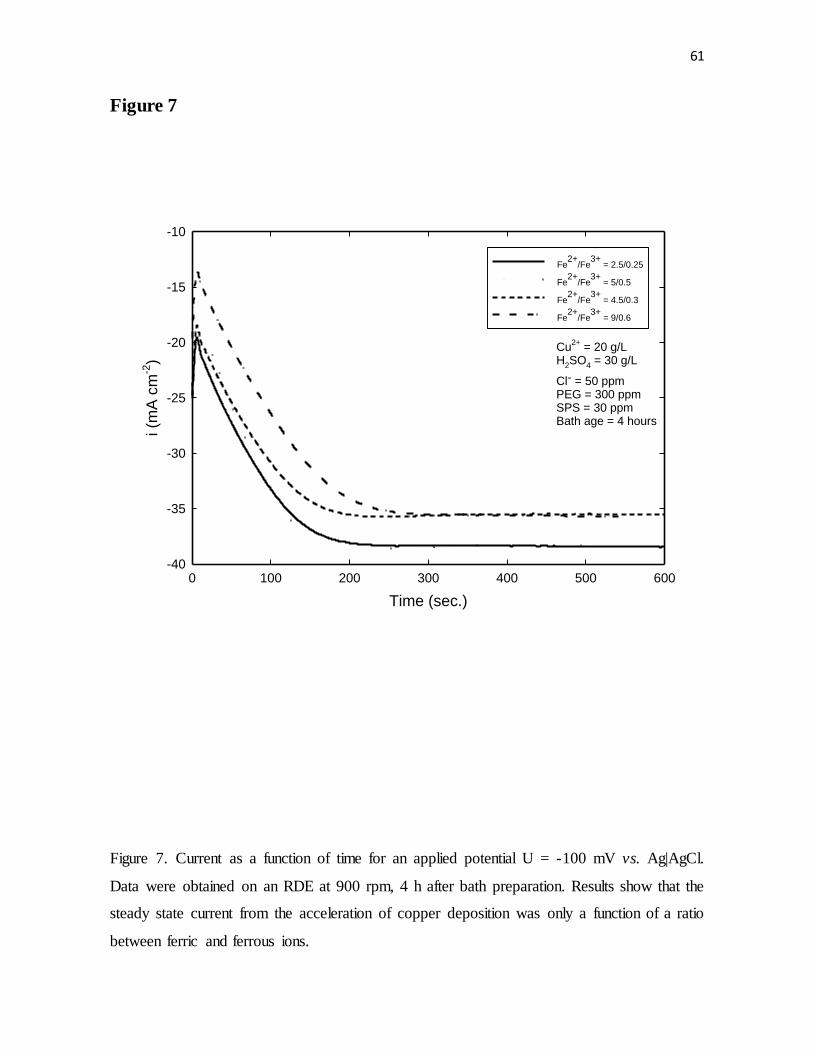
61
Figure 7
Time (sec.)
0 100 200 300 400 500 600
i (m
A c
m-2
)
-40
-35
-30
-25
-20
-15
-10
Fe2+
/Fe3+
= 2.5/0.25
Fe2+
/Fe3+
= 5/0.5
Fe2+
/Fe3+
= 4.5/0.3
Fe2+
/Fe3+
= 9/0.6
Cu2+
= 20 g/LH2SO4 = 30 g/L
Cl- = 50 ppmPEG = 300 ppmSPS = 30 ppmBath age = 4 hours
Figure 7. Current as a function of time for an applied potential U = -100 mV vs. Ag|AgCl.
Data were obtained on an RDE at 900 rpm, 4 h after bath preparation. Results show that the
steady state current from the acceleration of copper deposition was only a function of a ratio
between ferric and ferrous ions.
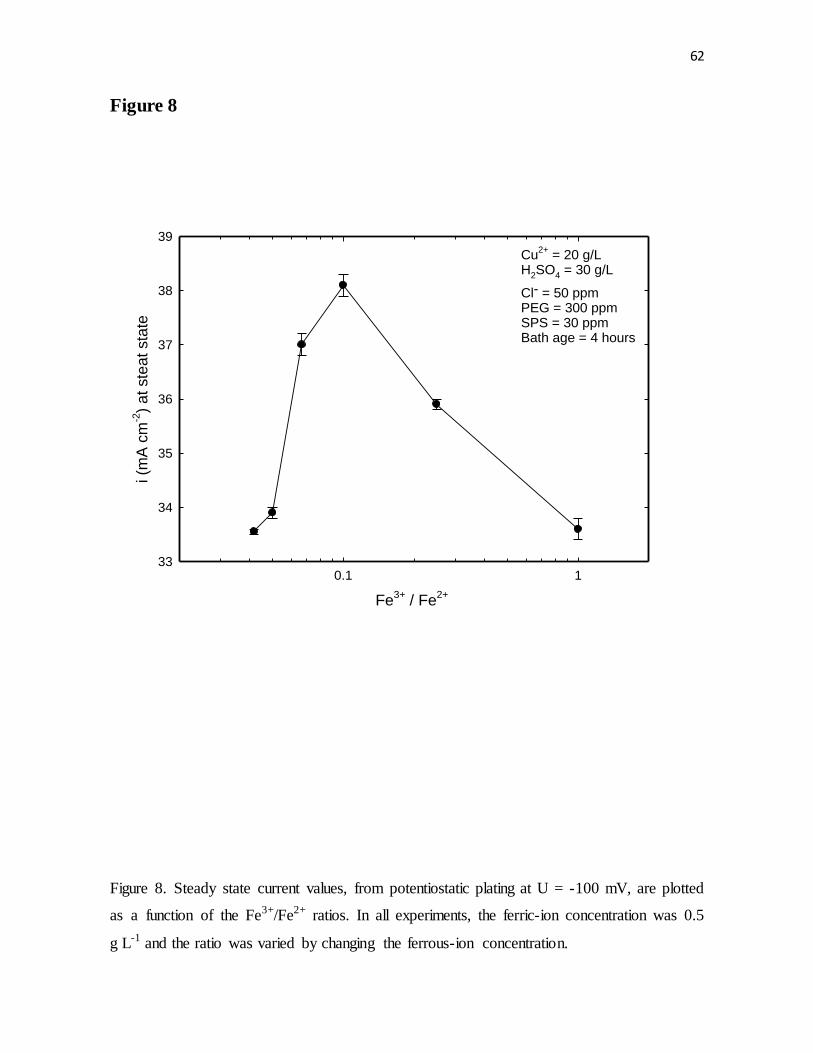
62
Figure 8
Fe3+
/ Fe2+
0.1 1
i (m
A c
m-2
) a
t ste
at
sta
te
33
34
35
36
37
38
39
Cu2+
= 20 g/LH2SO4 = 30 g/L
Cl- = 50 ppmPEG = 300 ppmSPS = 30 ppmBath age = 4 hours
Figure 8. Steady state current values, from potentiostatic plating at U = -100 mV, are plotted
as a function of the Fe3+/Fe2+ ratios. In all experiments, the ferric-ion concentration was 0.5
g L-1 and the ratio was varied by changing the ferrous-ion concentration.
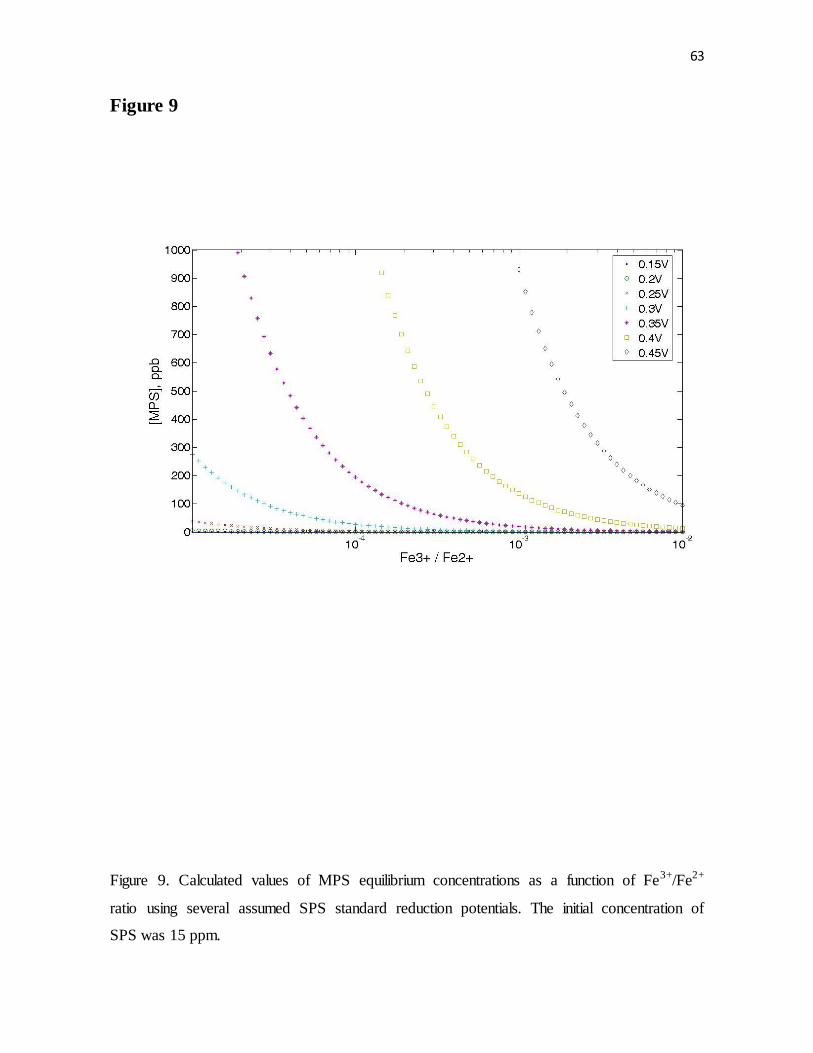
63
Figure 9
Figure 9. Calculated values of MPS equilibrium concentrations as a function of Fe3+/Fe2+
ratio using several assumed SPS standard reduction potentials. The initial concentration of
SPS was 15 ppm.
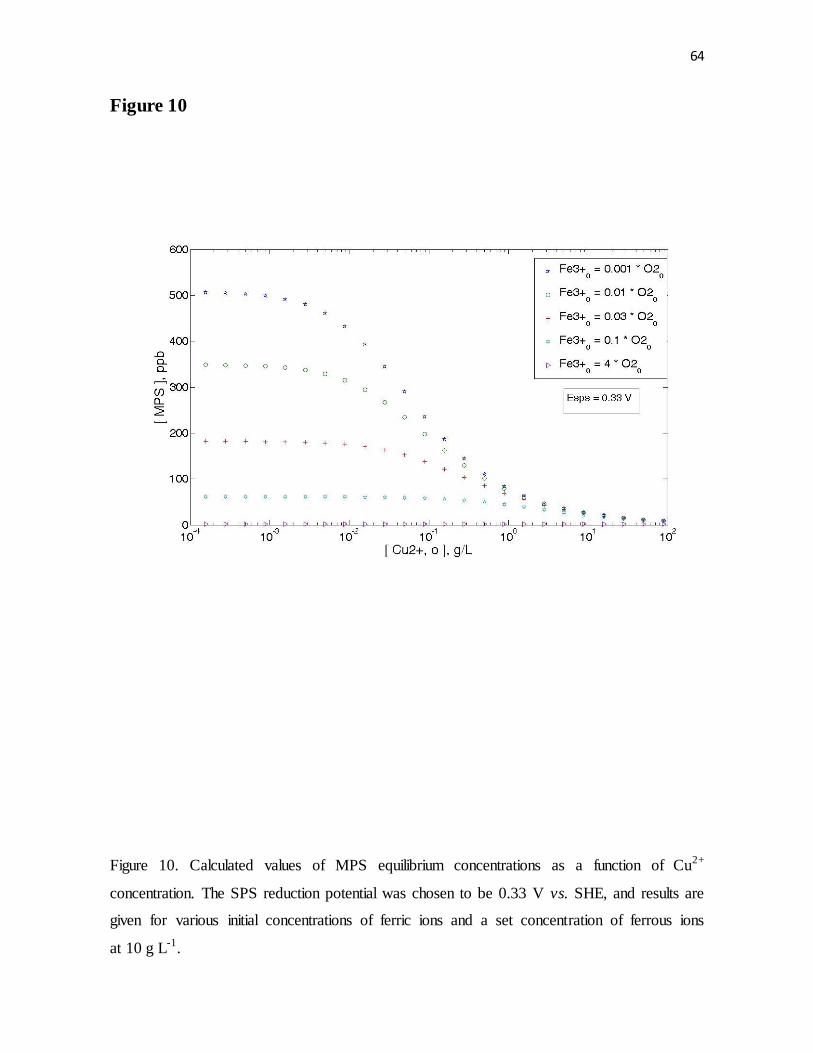
64
Figure 10
Figure 10. Calculated values of MPS equilibrium concentrations as a function of Cu2+
concentration. The SPS reduction potential was chosen to be 0.33 V vs. SHE, and results are
given for various initial concentrations of ferric ions and a set concentration of ferrous ions
at 10 g L-1.
65
_____________________________________________________________________________
* This work was done in collaboration with Olivier Mann, Yvonne Hoenersch, and Björn Wahl.
Chapter 4
Chromatography of Bis-(3-Sulfopropyl) Disulfide and Its
Breakdown Products by HPLC Coupled with Electrochemical Detection*
Abstract
A chromatographic method for the detection of bis-(3-sulfopropyl) disulfide (SPS), a
common additive in acidic copper plating baths, and its breakdown products was
demonstrated. The detection scheme involved a combination of solid-phase extraction for
sample pre-treatment, C18 reversed-phase high-performance liquid chromatography column
for separation, and electrochemical sensor for detection of all non-fully oxidized sulfur
containing compounds. We were able to achieve an effective separation and accurately
assign chromatographic peaks to all detectable species. Owing to a high sensitivity of the
utilized electrochemical detector, detection in low parts per billion range was possible. This
can prove crucial for plating bath control, since minute amounts of certain byproducts
significantly affect the bath performance.
66
Introduction
Copper plating baths are used extensively for the electrochemical deposition (ECD)
of copper onto complex surface geometries. The main application of copper ECD is
encountered in semiconductor and printed circuit board industries, where copper metal
serves as a conductor for wiring purposes.1 Electrolytic copper plating is performed in acidic
copper sulfate solutions with a number of organic constituents, which enable desired filling
of surface features. The quality of the deposited copper metal is a major concern for the
present and future dual damascene metallization schemes, as well as through-silicon-via
(TSV) applications.2,3 This requires stringent control of the bath composition for inorganic
(Cl-, H2SO4, Cu2+) and organic components. Two organic additives that are included in
almost all copper plating baths are an accelerator and a suppressor component,4–10 The
accelerator and suppressor decompose during electrolysis as well as during idle periods.11–14
Owing to the adverse effects of the accelerator breakdown products on copper film
properties, in particular, the accelerator and its by-products require frequent monitoring.15
The main accelerator used in acidic copper plating electrolytes is the compound bis-
(3-sulfopropyl) disulfide, commonly known under the acronym SPS. This additive helps to
promote the so-called superfilling or bottom-up fill of fine features with desired metal
properties; however, the precise mechanism of action of SPS is still lacking.16 The main by-
products of SPS (Table 1) are thought to include mono-oxide of SPS, di-oxide of SPS, and
1,3-propanedisulfonic acid (PDS) as oxidation by-products, and 3-mercaptopropyl sulfonate
(MPS) as a reduction by product.17
Currently, the most widely used method for the analysis of the organic additives is
cyclic voltammetric stripping (CVS), which relates organic concentration to the copper
67
plating rate.18–21 Since cyclic voltammetric stripping works by monitoring the effective
activity of each component in the plating process, it does not give a direct measurement of
the concentrations of organics and only indirect evidence of species in electrolyte can be
obtained. A more reliable and quantitative analysis method for SPS and its breakdown
products is possible with high-performance liquid chromatography (HPLC). A few efforts
have already been described in the literature for analysis of SPS and its byproducts by HPLC
with various detection schemes, such as UV spectroscopy22,23, mass spectrometry,17 and
others. However, we are not aware of studies that show an adequate separation of SPS by-
products, unambiguously assign chromatographic peaks, and have detection sensitivity in
the nano-molar range.
In this chpater, the development of an HPLC procedure using a C18 reversed-phase
column is presented for analysis of SPS and its breakdown products from an acidic copper
plating bath. An electrochemical method of detection (HPLC-ED) has been chosen due to its
superior detection sensitivity to the non-fully oxidized sulfur-containing molecules. An
HPLC-ED method for plating bath monitoring has been disclosed in US Patent 7 678 258
B2;15 however, the patent neither does specify detection limits, nor does it accurately
identify chromatographic peaks. Moreover, the presented chromatograms showed poor peak
separation. In contrast, we were able to achieve a satisfactory separation and unambiguously
assign chromatographic peaks to the detectable species, while lowering the limit of detection
to only a few parts per billion (ppb). Another unique feature of this work is the use of
chemical standards specifically synthesized for precise determination of all chromatographic
peaks. This technique has already been utilized in chapter 3 to study the impact of an iron
redox couple on SPS.24
68
Material and Methods
Chromatographic set-up
All chromatographic analyses were performed on in-house developed system (Fig. 1)
at Atotech, Berlin GmbH. The set-up consisted of a K-120 Pump (Knauer), a PEEK
Pulsation Damper (Metrohm), a T-piece, a Triathlon Spark Auto-Sampler (Metrohm), two
Atlantis T3 columns (4.6×100 mm, 3 mm, Waters, Inc.), an electrically driven 6-port-3-
channel valve A1370 with valve drive K-6 (both Knauer), and an ED50A Electrochemical
Detector (Dionex) equipped with a thin-layer channel cell containing Au working electrode
and Ag|AgCl reference electrode (1 M KCl plus 1 M HCl). To protect the electrochemical
cell from matrix impact, the liquid flow was split before sample introduction with a T-piece.
One path was used for the analytical separation, and the other to maintain the
electrochemical cell under flow when the matrix from the analytical column was directed to
waste. This was realized by a switching valve. The similar flow rates on both paths were
obtained by using two identical columns (Fig. 1). The electrochemical detector (ED)
operated with a waveform specially designed to detect non-fully oxidized sulfur-containing
molecules (Fig. 2). To further prevent the influence of the matrix, metal ions were removed
from the sample by passing it through a proton exchange cartridge OnGuard II H (Dionex)
prior to the chromatographic analysis. All separations were conducted in an isocratic mode
at room temperature. The flow rate through the system was 0.5 mL min-1 and the injection
volume was 20 mL. Instrument control and data acquisition were handled by the EZChrom
Elite Software (Agilent Technologies).
69
Electrochemical detection with ED cell
The knowledge of SPS and its by-products concentrations is a problem of critical
significance for predicting the filling performance of a plating bath.15,17 These organic
sulfur-containing compounds can be separated from the interfering matrix by using reverse-
phase chromatography; however, the UV detection is hindered by poor spectroscopic
properties.22, 25 An alternative method is based on electrochemical detection with Au
working electrode, which is commercially available and has been used in determination of
sulfur-containing amino acids26 and pesticides.27
It has been previously established that the most suitable electrochemical technique
for the detection of organic sulfur-containing compounds is integrated pulsed amperometric
detection (IPAD).25 In this technique a repetitive potential pulse is applied to a noble metal
electrode – oxidizing the analyte molecules at its surface and the resulting current is
measured. In this way, compounds in which the sulfur atom has an unshared pair of
electrons are detectable (e.g. thiols and disulfides), but sulfur-containing molecules with
fully oxidized sulfur atoms (e.g. PDS) cannot be detected.
An optimal IPAD waveform for the use with the present ED (Fig. 3) was developed
at Atotech, Berlin GmbH by Mr. Wahl (details are available in unpublished Master Thesis,
TFH Berlin, 2005). The waveform consisted of a 1-s cycle, which included an adsorption
delay, detection, and a cleaning step. The adsorption delay step began at U = -0.5 V for 0.1
s, followed by the detection step, where the potential was ramped to 1.7 V in 0.2 s and then
decreased back to -0.5 V in 0.2 s. The third and final step was used for the surface cleaning
and included a jump in potential to 1.6 V in 0.01 s, keeping the potential steady at 1.6 V for
70
0.1 s, a decrease in potential to -0.6 V in 0.01 s, and finally a constant potential of -0.6 V for
0.38 s.
Plating set-up
Plating experiments were performed under air agitation in a 10-L cell composed of
two soluble copper anode plates (1.5 dm2 active area) between which the sample to be plated
was under horizontal motion. Plain copper printed circuit boards were plated for 90 min at a
current density of 1 A dm-2 to achieve a plating thickness of ~20 µm. Between each test the
plating bath was continuously in operation in order to increase the concentrations of
byproducts. Overnight, the plating bath was on idle time.
Chemicals and standards
The suppliers and composition of all chemicals used for the chromatographic runs
and bath sample preparation are summarized in Table 2.
This study benefits from the use of in-house synthesized chemical standards:
OxSPS_1 (mainly mono-oxidation product of SPS) and OxSPS_2 (mainly di-oxidation
product of SPS). The synthesis of these compounds was conducted with H2O2 and specific
catalysts. Both standards were characterized by liquid chromatography coupled with mass
spectrometry (LC-MS) by the organic synthesis group at Atotech, Berlin GmbH. OxSPS_1
was found to be mainly composed of mono-oxidation product of SPS (~80%), relatively
high percentages of SPS (~10%) and its di-oxidation product (~10%), and a small amount of
PDS. OxSPS_2 was determined to be composed of a mixture of SPS (~23%), its di-
oxidation product (~77%), with small amount of the mono-ox-SPS and PDS.
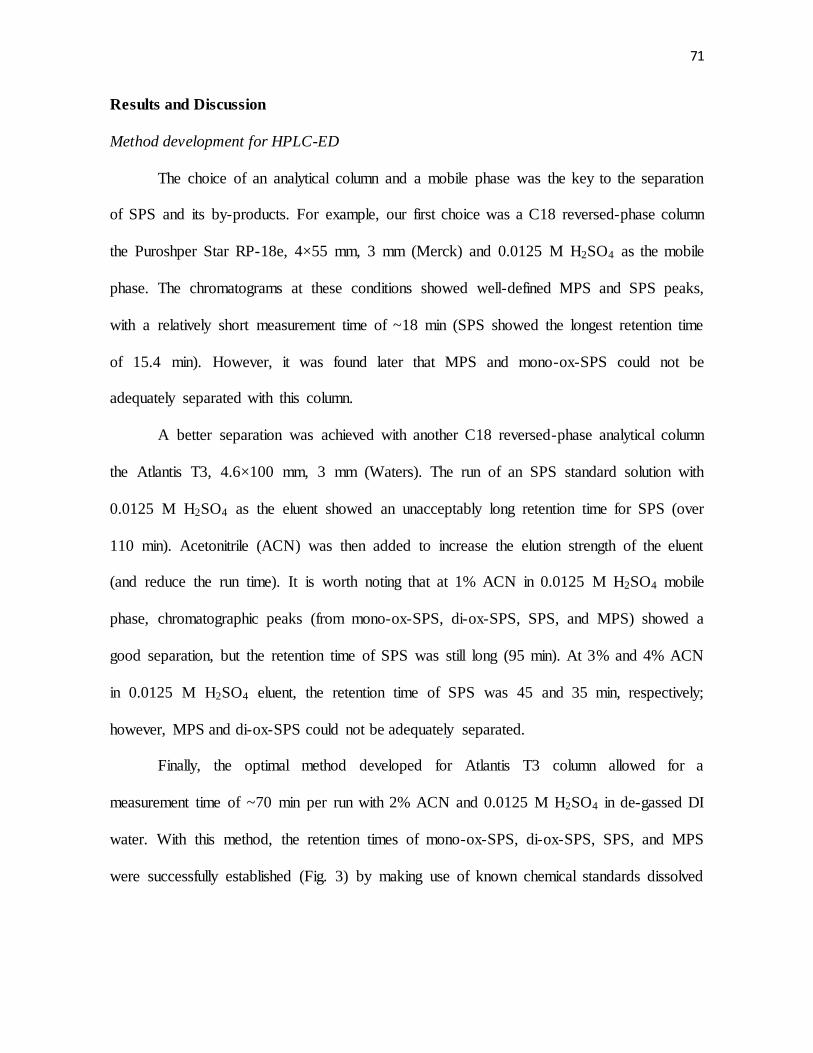
71
Results and Discussion
Method development for HPLC-ED
The choice of an analytical column and a mobile phase was the key to the separation
of SPS and its by-products. For example, our first choice was a C18 reversed-phase column
the Puroshper Star RP-18e, 4×55 mm, 3 mm (Merck) and 0.0125 M H2SO4 as the mobile
phase. The chromatograms at these conditions showed well-defined MPS and SPS peaks,
with a relatively short measurement time of ~18 min (SPS showed the longest retention time
of 15.4 min). However, it was found later that MPS and mono-ox-SPS could not be
adequately separated with this column.
A better separation was achieved with another C18 reversed-phase analytical column
the Atlantis T3, 4.6×100 mm, 3 mm (Waters). The run of an SPS standard solution with
0.0125 M H2SO4 as the eluent showed an unacceptably long retention time for SPS (over
110 min). Acetonitrile (ACN) was then added to increase the elution strength of the eluent
(and reduce the run time). It is worth noting that at 1% ACN in 0.0125 M H2SO4 mobile
phase, chromatographic peaks (from mono-ox-SPS, di-ox-SPS, SPS, and MPS) showed a
good separation, but the retention time of SPS was still long (95 min). At 3% and 4% ACN
in 0.0125 M H2SO4 eluent, the retention time of SPS was 45 and 35 min, respectively;
however, MPS and di-ox-SPS could not be adequately separated.
Finally, the optimal method developed for Atlantis T3 column allowed for a
measurement time of ~70 min per run with 2% ACN and 0.0125 M H2SO4 in de-gassed DI
water. With this method, the retention times of mono-ox-SPS, di-ox-SPS, SPS, and MPS
were successfully established (Fig. 3) by making use of known chemical standards dissolved
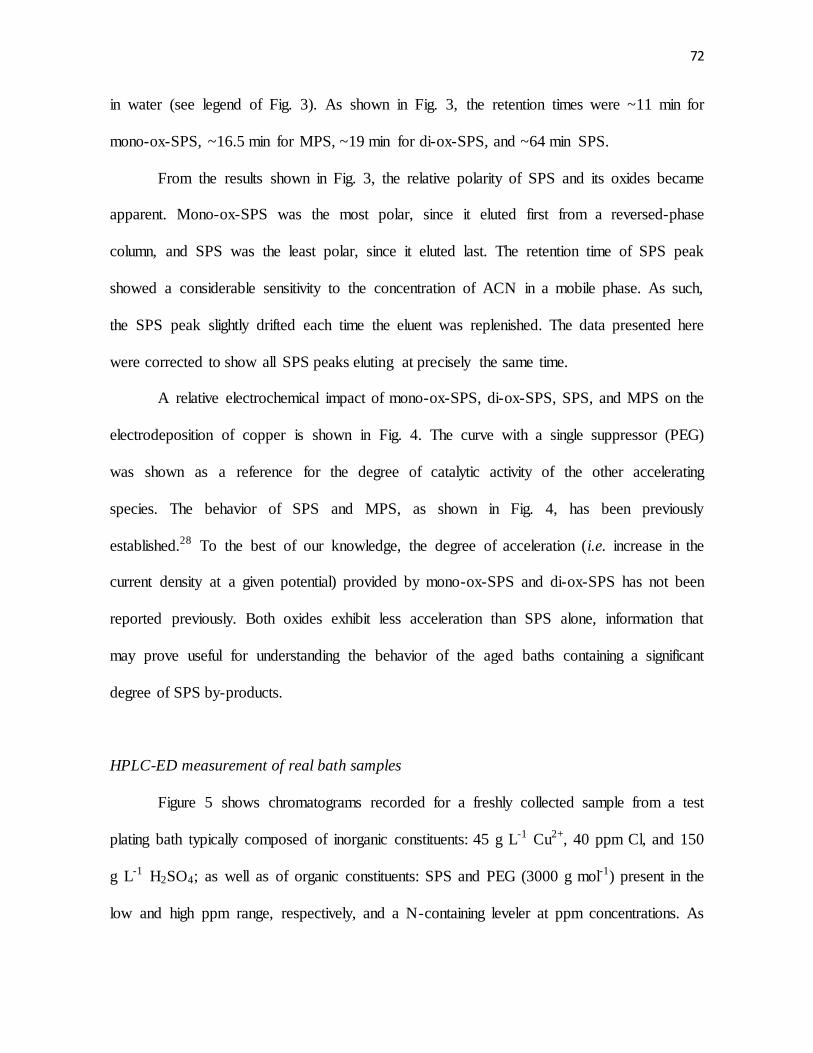
72
in water (see legend of Fig. 3). As shown in Fig. 3, the retention times were ~11 min for
mono-ox-SPS, ~16.5 min for MPS, ~19 min for di-ox-SPS, and ~64 min SPS.
From the results shown in Fig. 3, the relative polarity of SPS and its oxides became
apparent. Mono-ox-SPS was the most polar, since it eluted first from a reversed-phase
column, and SPS was the least polar, since it eluted last. The retention time of SPS peak
showed a considerable sensitivity to the concentration of ACN in a mobile phase. As such,
the SPS peak slightly drifted each time the eluent was replenished. The data presented here
were corrected to show all SPS peaks eluting at precisely the same time.
A relative electrochemical impact of mono-ox-SPS, di-ox-SPS, SPS, and MPS on the
electrodeposition of copper is shown in Fig. 4. The curve with a single suppressor (PEG)
was shown as a reference for the degree of catalytic activity of the other accelerating
species. The behavior of SPS and MPS, as shown in Fig. 4, has been previously
established.28 To the best of our knowledge, the degree of acceleration (i.e. increase in the
current density at a given potential) provided by mono-ox-SPS and di-ox-SPS has not been
reported previously. Both oxides exhibit less acceleration than SPS alone, information that
may prove useful for understanding the behavior of the aged baths containing a significant
degree of SPS by-products.
HPLC-ED measurement of real bath samples
Figure 5 shows chromatograms recorded for a freshly collected sample from a test
plating bath typically composed of inorganic constituents: 45 g L-1 Cu2+, 40 ppm Cl, and 150
g L-1 H2SO4; as well as of organic constituents: SPS and PEG (3000 g mol-1) present in the
low and high ppm range, respectively, and a N-containing leveler at ppm concentrations. As
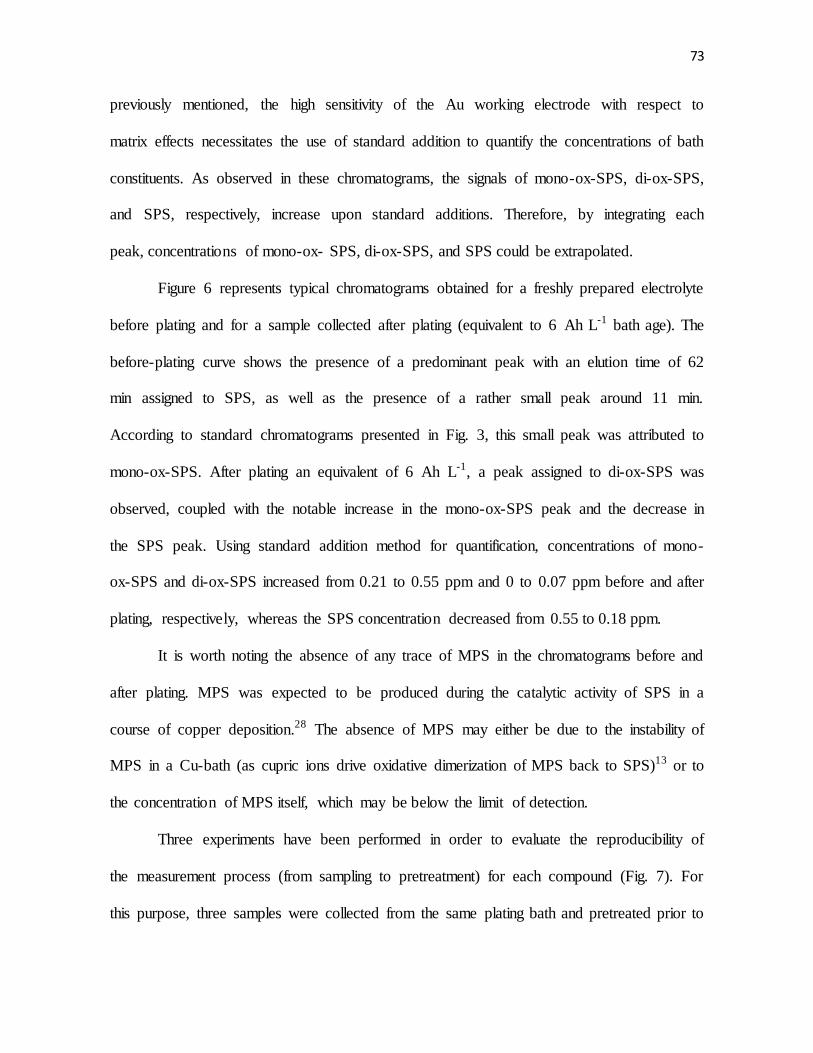
73
previously mentioned, the high sensitivity of the Au working electrode with respect to
matrix effects necessitates the use of standard addition to quantify the concentrations of bath
constituents. As observed in these chromatograms, the signals of mono-ox-SPS, di-ox-SPS,
and SPS, respectively, increase upon standard additions. Therefore, by integrating each
peak, concentrations of mono-ox- SPS, di-ox-SPS, and SPS could be extrapolated.
Figure 6 represents typical chromatograms obtained for a freshly prepared electrolyte
before plating and for a sample collected after plating (equivalent to 6 Ah L-1 bath age). The
before-plating curve shows the presence of a predominant peak with an elution time of 62
min assigned to SPS, as well as the presence of a rather small peak around 11 min.
According to standard chromatograms presented in Fig. 3, this small peak was attributed to
mono-ox-SPS. After plating an equivalent of 6 Ah L-1, a peak assigned to di-ox-SPS was
observed, coupled with the notable increase in the mono-ox-SPS peak and the decrease in
the SPS peak. Using standard addition method for quantification, concentrations of mono-
ox-SPS and di-ox-SPS increased from 0.21 to 0.55 ppm and 0 to 0.07 ppm before and after
plating, respectively, whereas the SPS concentration decreased from 0.55 to 0.18 ppm.
It is worth noting the absence of any trace of MPS in the chromatograms before and
after plating. MPS was expected to be produced during the catalytic activity of SPS in a
course of copper deposition.28 The absence of MPS may either be due to the instability of
MPS in a Cu-bath (as cupric ions drive oxidative dimerization of MPS back to SPS)13 or to
the concentration of MPS itself, which may be below the limit of detection.
Three experiments have been performed in order to evaluate the reproducibility of
the measurement process (from sampling to pretreatment) for each compound (Fig. 7). For
this purpose, three samples were collected from the same plating bath and pretreated prior to
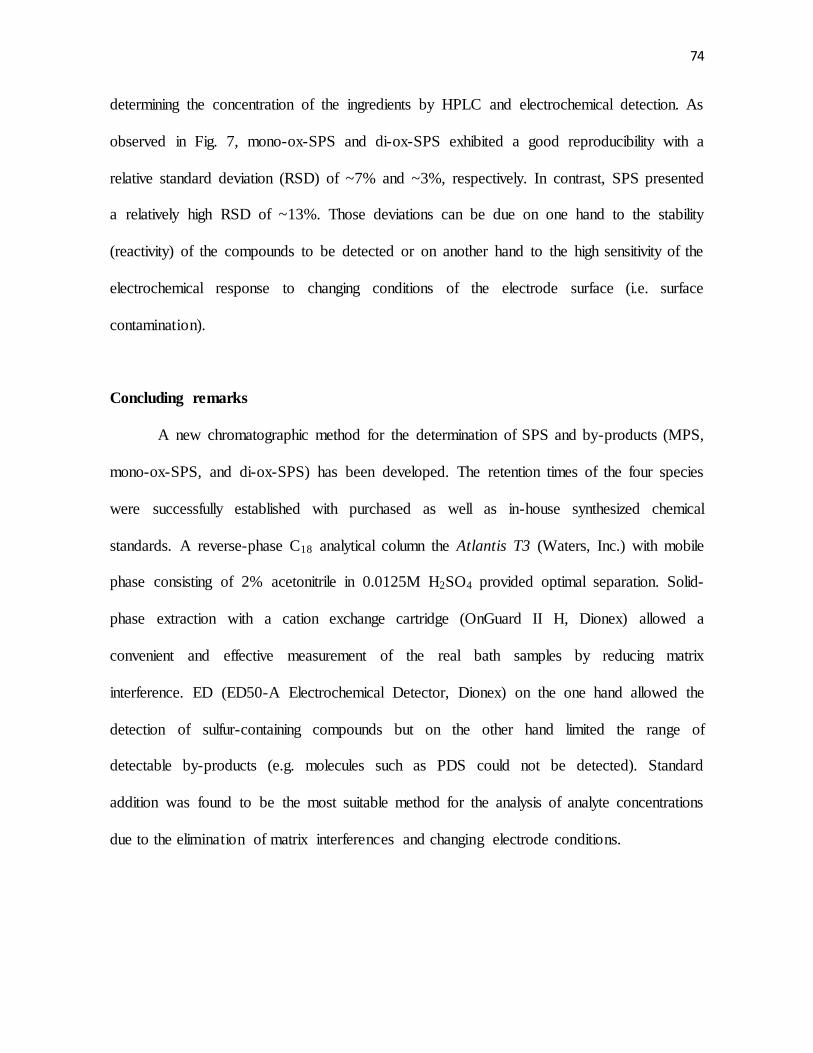
74
determining the concentration of the ingredients by HPLC and electrochemical detection. As
observed in Fig. 7, mono-ox-SPS and di-ox-SPS exhibited a good reproducibility with a
relative standard deviation (RSD) of ~7% and ~3%, respectively. In contrast, SPS presented
a relatively high RSD of ~13%. Those deviations can be due on one hand to the stability
(reactivity) of the compounds to be detected or on another hand to the high sensitivity of the
electrochemical response to changing conditions of the electrode surface (i.e. surface
contamination).
Concluding remarks
A new chromatographic method for the determination of SPS and by-products (MPS,
mono-ox-SPS, and di-ox-SPS) has been developed. The retention times of the four species
were successfully established with purchased as well as in-house synthesized chemical
standards. A reverse-phase C18 analytical column the Atlantis T3 (Waters, Inc.) with mobile
phase consisting of 2% acetonitrile in 0.0125M H2SO4 provided optimal separation. Solid-
phase extraction with a cation exchange cartridge (OnGuard II H, Dionex) allowed a
convenient and effective measurement of the real bath samples by reducing matrix
interference. ED (ED50-A Electrochemical Detector, Dionex) on the one hand allowed the
detection of sulfur-containing compounds but on the other hand limited the range of
detectable by-products (e.g. molecules such as PDS could not be detected). Standard
addition was found to be the most suitable method for the analysis of analyte concentrations
due to the elimination of matrix interferences and changing electrode conditions.
75
References
1. Paunovic, M., Schlesinger, M., Fundamentals of Electrochemical Deposition, John
Wiley & Sons, Inc., 2006.
2. International Technology Roadmap for Semiconductors,Interconnect Chapter, 2009.
3. Beica, R., Sharbono, C., Ritzdorf, T., Electronic Components and Technology
Conference 2008, 58, 577.
4. Kondo, K., Yamakawa, N., Tanaka, Z., Hayashi, K., J. Electroanal. Chem. 2003,
559, 137.
5. Vereecken, P. M., Binstead, R. A., Deligianni, H., Andricacos, P. C., IBM Journal of
Research & Development, 2005, 3.
6. Healy, J. P., Pletcher, D., Goodenough, M., J. Electroanal. Chem. 1992, 338, 155.
7. Healy, J. P., Pletcher, D., Goodenough, M., J. Electroanal. Chem.1992, 338, 167.
8. Moffat, T. P., Wheeler, D., Huber, W. H., Josell, D., Electrochem. and Solid-State
Lett. 2001, C26.
9. Moffat, T. P., Wheeler, D., Josell, D., J. Electrochem. Soc. 2004, 151, C262.
10. Willey, M. J., West, A. C., J. Electrochem. Soc.2007, 154, D156.
11. Frank, A., Bard, A. J., J. Electrochem. Soc.2003, 150, C244.
12. Lee, W.-H., Hung, C. C., Chang, S. C., Wang, Y. L., J. Electrochem. Soc. 2010, 157,
H131.
13. Moffat, T. P., Baker, B., Wheeler, D., Josell, D., Electrochem. and Solid-State
Lett.2003, 6, C59.
14. Volov, I., Saito, T., West, A. C., J. Electrochem. Soc. 2011,158, D384.
76
15. Andricacos, P., Chung, D. S., Deligianni, H., Fluegel,J. E., Kwietniak,K. T.,
Locke,P. S., Restaino,D. D., Seo,S. C., Vereecken,P. M., Walton, E. G., Patent
7678258, IBM Corp, United States, 2010.
16. Moffat, T. P., Wheeler, D., Kim, S. K., Josell, D., Electrochim. Acta. 2007, 53, 145.
17. Hung,C. C. , Chen,K. W., Wang, Y. L., J. Vac. Sci. Technol. B, 2008, 26(1), 255.
18. Chalyt, G., Bratin, P., Pavlov, M., Kogan, A., Perpich, M., Patent 6572753, ECI
Technology, Inc., United States, 2003.
19. Shalyt, E., Pavlov, M., Bratin, P., Kogan, A., Perpich, M. J., Patent 7186326, ECI
Technology, Inc., U.S., 2007.
20. Tench, D., Ogden, C., J. Electrochem. Soc. 1978, 125, 194.
21. Taephaisitphongse, P., Cao, Y., West, A. C., J. Electrochem. Soc. 2001, 148, C492.
22. D'Urzo, L., Wang, H., Pa, A., Zhi, C., J. Electrochem. Soc. 2005, 152, C243.
23. Palmans, R., Claes, S., Vanatta, L. E., Coleman, D. E., J. Chromatogr. A, 2005,
1085, 147.
24. Volov, I., West, A. C., J. Electrochem. Soc.2011, 158 (7), D456-D461.
25. Owens,G.S., LaCourse, W. R., Current Separations. 1996, 14, 82.
26. Vandeberg, P. J., Johnson, D. C., Anal. Chem. 1993, 65, 2713.
27. Ngoviwatchai, A., Johnson, D. C., Anal. Chim. Acta. 1998, 215, 1.
28. Tan, M., Guymon, C., Wheeler, D. R., Harb, J. N., J. Electrochem. Soc. 2007, 154,
D78.
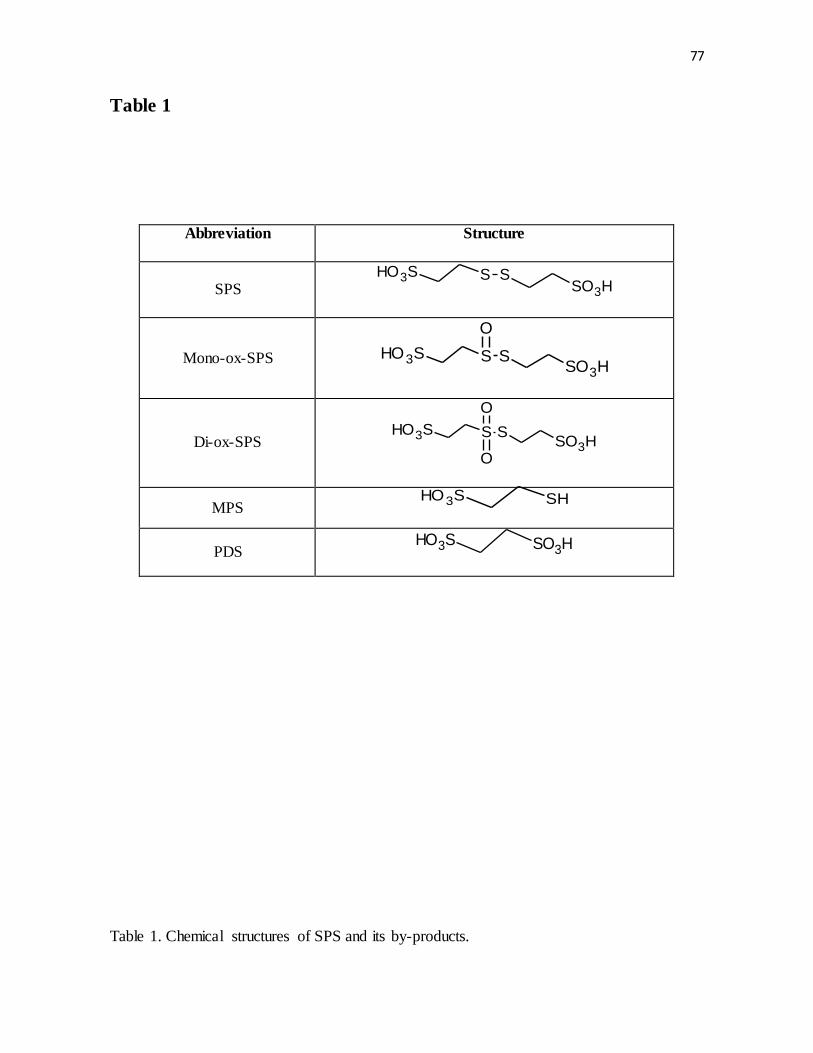
77
Table 1
Abbreviation Structure
SPS S S
SO3HHO3S
Mono-ox-SPS S SSO3H
HO3S
O
Di-ox-SPS S S
SO3HHO3S
O
O
MPS SHHO3S
PDS SO3HHO3S
Table 1. Chemical structures of SPS and its by-products.
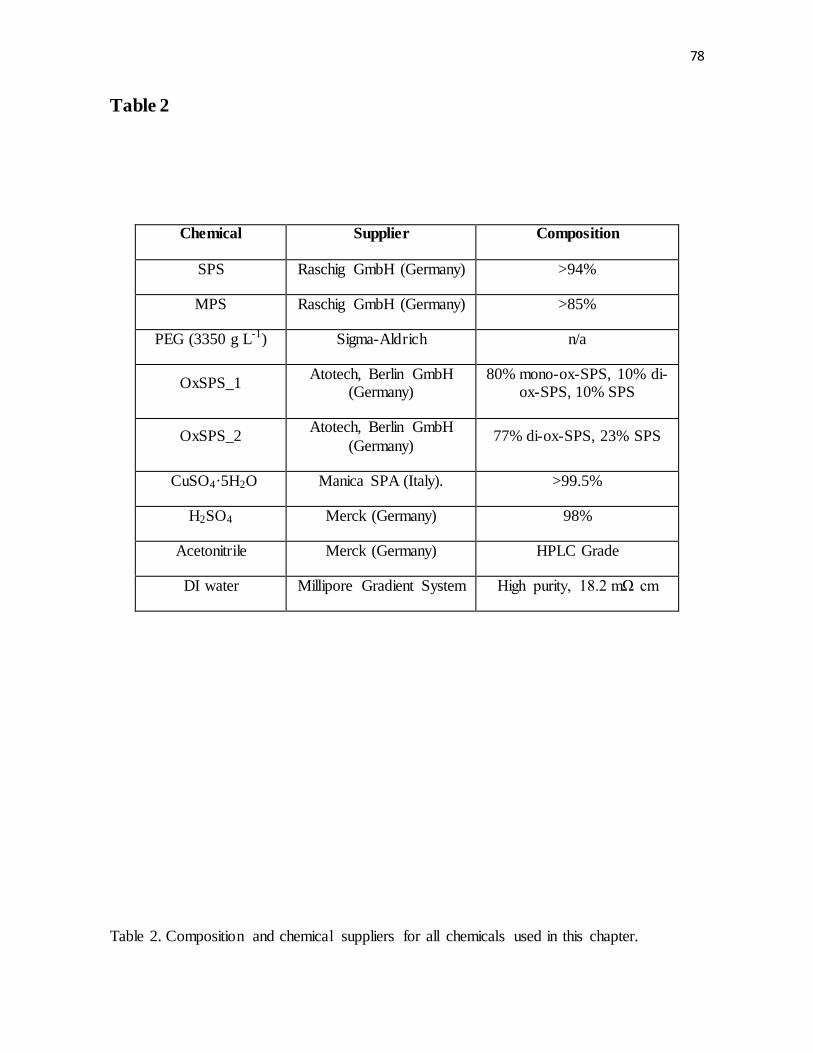
78
Table 2
Chemical Supplier Composition
SPS Raschig GmbH (Germany) >94%
MPS Raschig GmbH (Germany) >85%
PEG (3350 g L-1) Sigma-Aldrich n/a
OxSPS_1 Atotech, Berlin GmbH
(Germany) 80% mono-ox-SPS, 10% di-
ox-SPS, 10% SPS
OxSPS_2 Atotech, Berlin GmbH
(Germany) 77% di-ox-SPS, 23% SPS
CuSO4·5H2O Manica SPA (Italy). >99.5%
H2SO4 Merck (Germany) 98%
Acetonitrile Merck (Germany) HPLC Grade
DI water Millipore Gradient System High purity, 18.2 mΩ cm
Table 2. Composition and chemical suppliers for all chemicals used in this chapter.
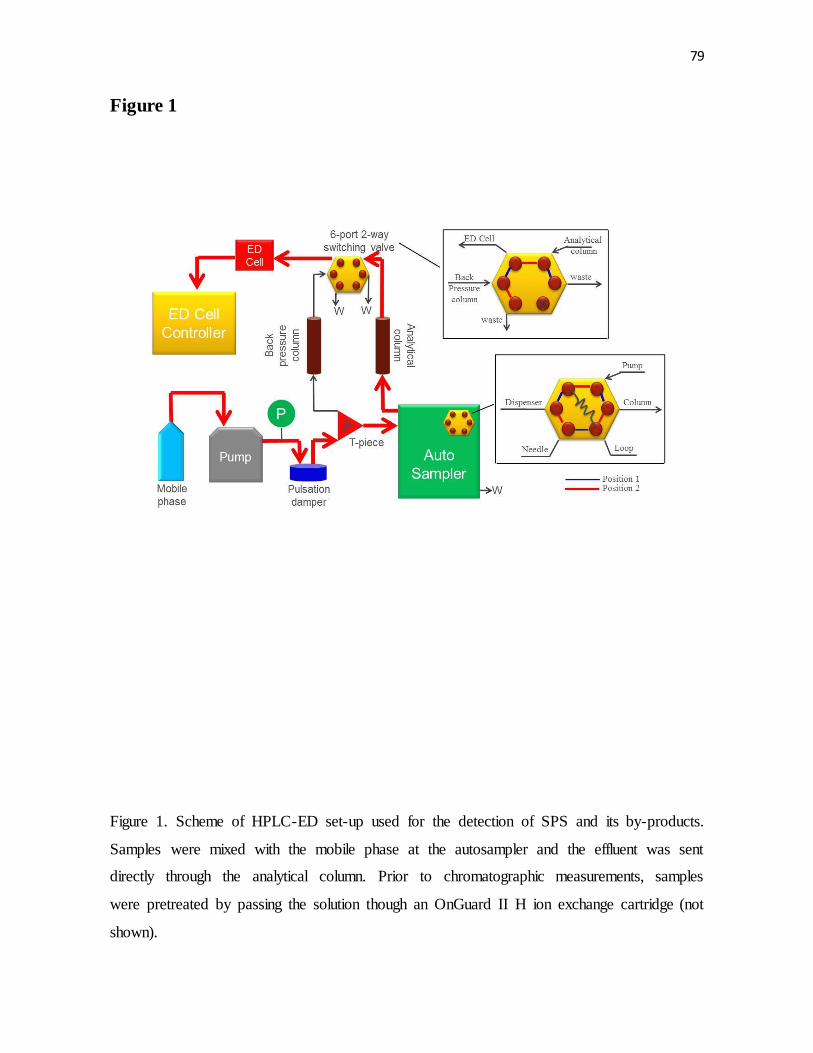
79
Figure 1
Figure 1. Scheme of HPLC-ED set-up used for the detection of SPS and its by-products.
Samples were mixed with the mobile phase at the autosampler and the effluent was sent
directly through the analytical column. Prior to chromatographic measurements, samples
were pretreated by passing the solution though an OnGuard II H ion exchange cartridge (not
shown).
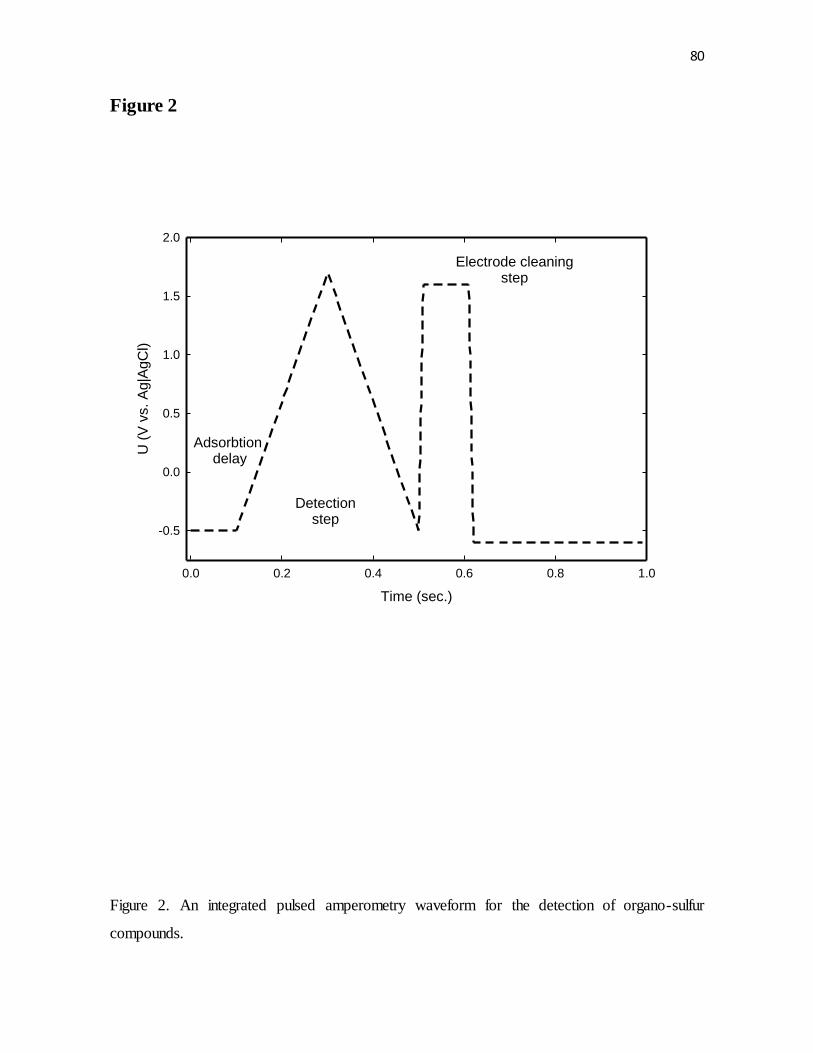
80
Figure 2
Time (sec.)
0.0 0.2 0.4 0.6 0.8 1.0
U (
V v
s. A
g|A
gC
l)
-0.5
0.0
0.5
1.0
1.5
2.0
Detectionstep
Electrode cleaningstep
Adsorbtion delay
Figure 2. An integrated pulsed amperometry waveform for the detection of organo-sulfur
compounds.
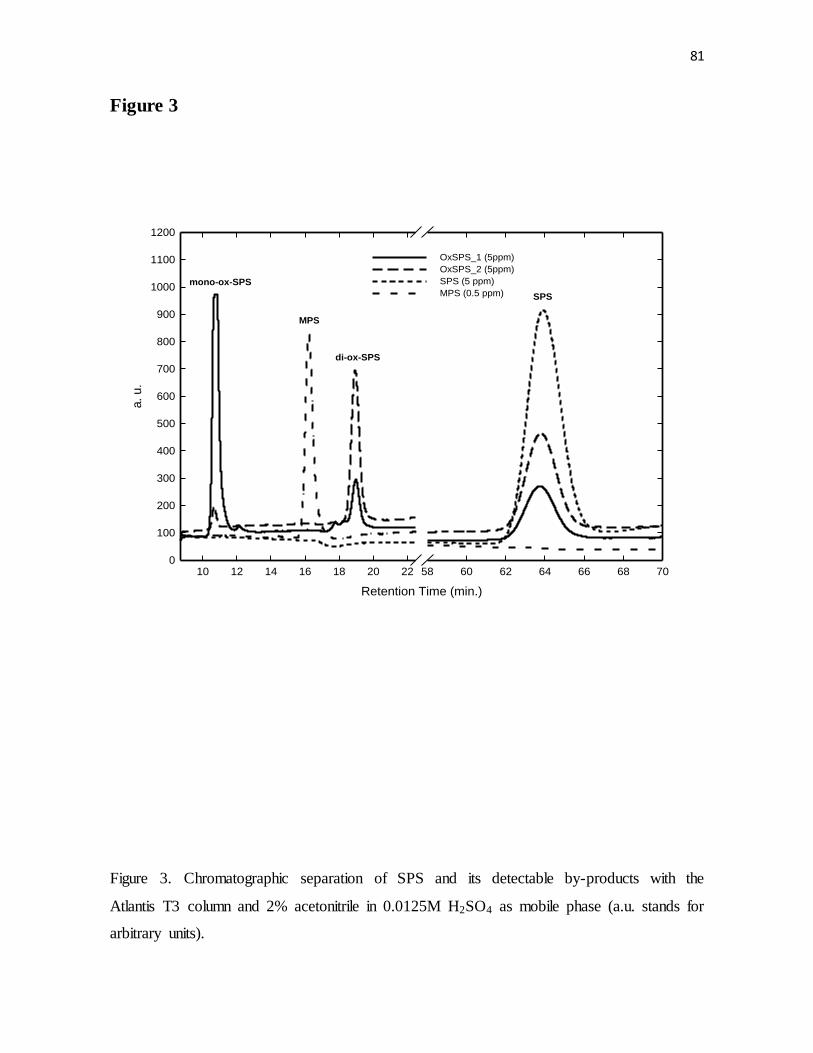
81
Figure 3
Retention Time (min.)
10 12 14 16 18 20 22 58 60 62 64 66 68 70
a. u.
0
100
200
300
400
500
600
700
800
900
1000
1100
1200
OxSPS_1 (5ppm)
OxSPS_2 (5ppm)
SPS (5 ppm)
MPS (0.5 ppm)
MPS
mono-ox-SPS
di-ox-SPS
SPS
Figure 3. Chromatographic separation of SPS and its detectable by-products with the
Atlantis T3 column and 2% acetonitrile in 0.0125M H2SO4 as mobile phase (a.u. stands for
arbitrary units).
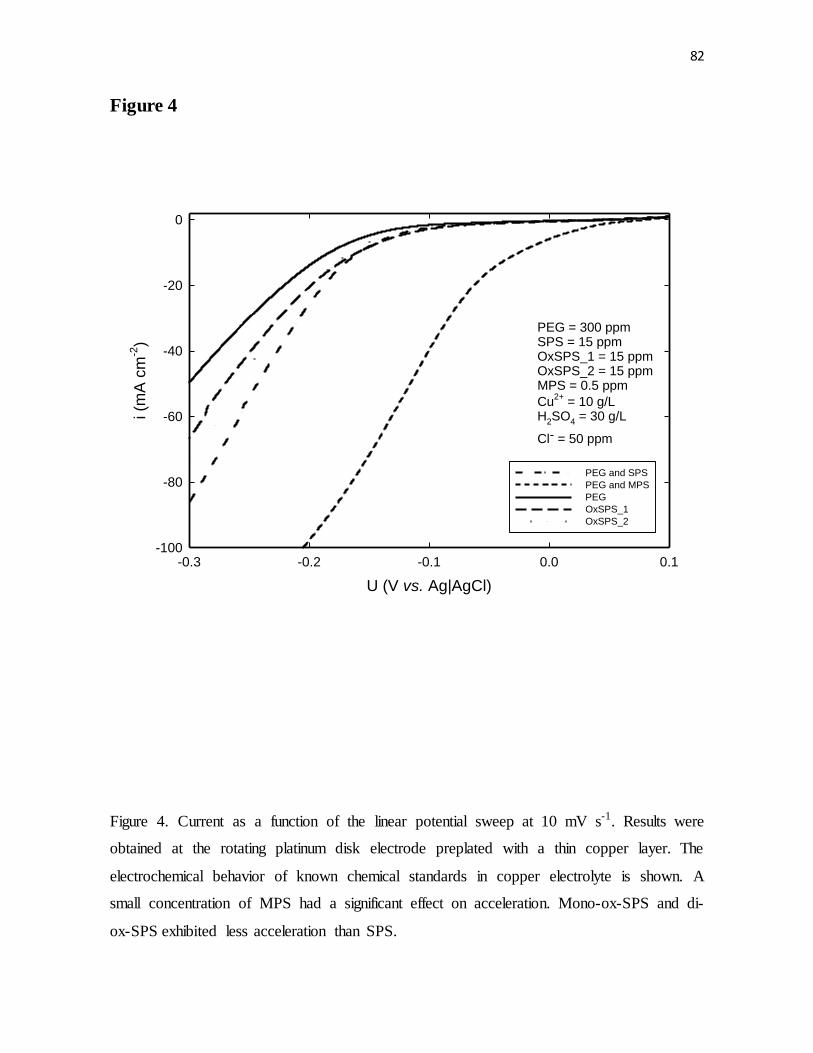
82
Figure 4
U (V vs. Ag|AgCl)
-0.3 -0.2 -0.1 0.0 0.1
i (m
A c
m-2
)
-100
-80
-60
-40
-20
0
PEG and SPS
PEG and MPS
PEG
OxSPS_1
OxSPS_2
PEG = 300 ppmSPS = 15 ppmOxSPS_1 = 15 ppmOxSPS_2 = 15 ppmMPS = 0.5 ppm
Cu2+
= 10 g/LH2SO4 = 30 g/L
Cl- = 50 ppm
Figure 4. Current as a function of the linear potential sweep at 10 mV s-1. Results were
obtained at the rotating platinum disk electrode preplated with a thin copper layer. The
electrochemical behavior of known chemical standards in copper electrolyte is shown. A
small concentration of MPS had a significant effect on acceleration. Mono-ox-SPS and di-
ox-SPS exhibited less acceleration than SPS.
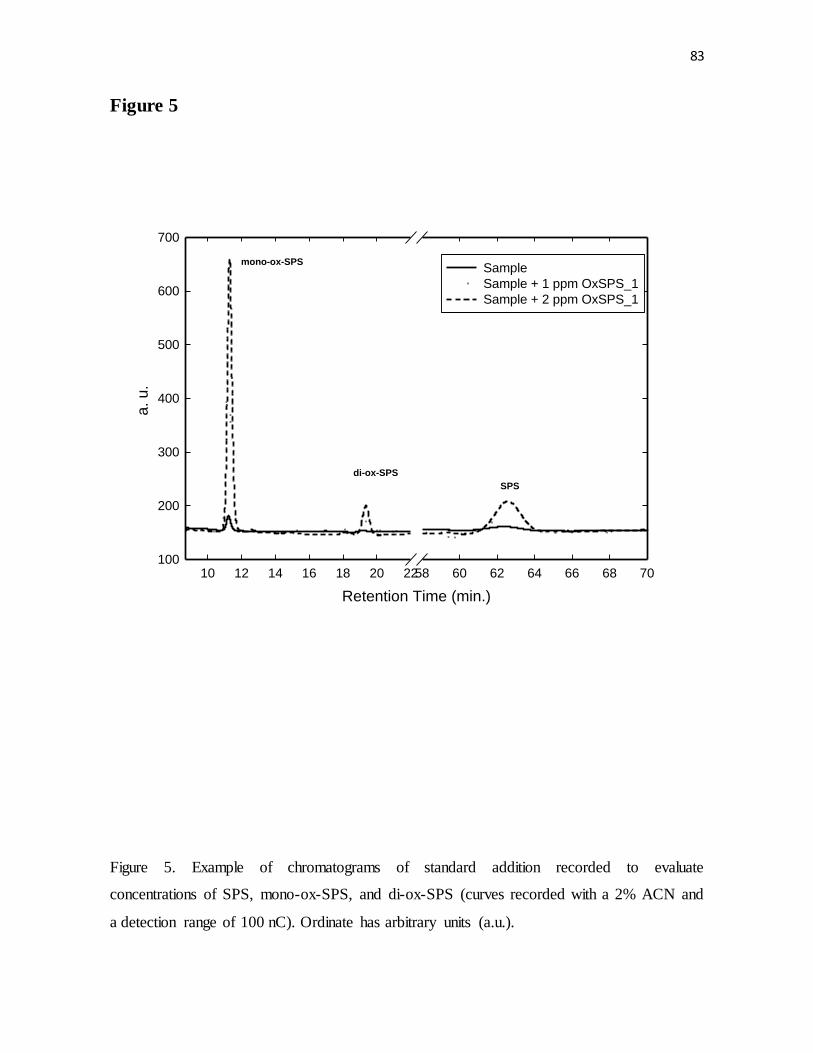
83
Figure 5
Retention Time (min.)
10 12 14 16 18 20 2258 60 62 64 66 68 70
a. u
.
100
200
300
400
500
600
700
Sample
Sample + 1 ppm OxSPS_1
Sample + 2 ppm OxSPS_1
mono-ox-SPS
di-ox-SPS
SPS
Figure 5. Example of chromatograms of standard addition recorded to evaluate
concentrations of SPS, mono-ox-SPS, and di-ox-SPS (curves recorded with a 2% ACN and
a detection range of 100 nC). Ordinate has arbitrary units (a.u.).
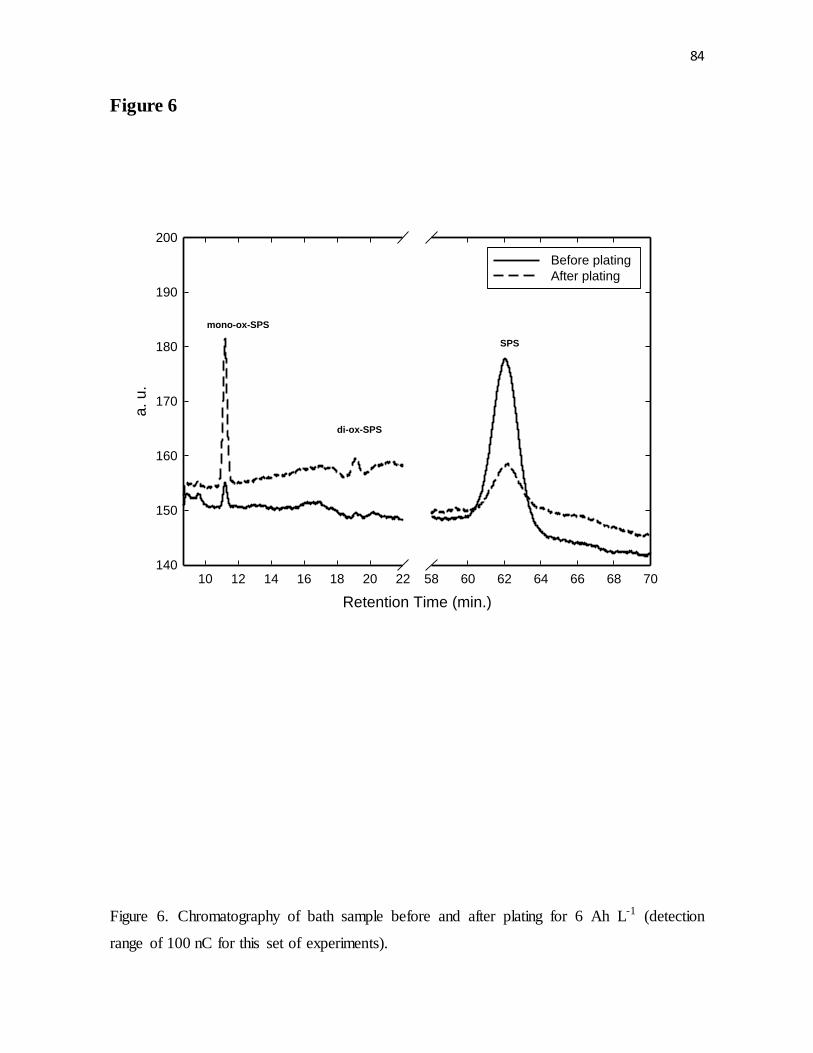
84
Figure 6
Retention Time (min.)
10 12 14 16 18 20 22 58 60 62 64 66 68 70
a. u
.
140
150
160
170
180
190
200
Before plating
After plating
mono-ox-SPS
di-ox-SPS
SPS
Figure 6. Chromatography of bath sample before and after plating for 6 Ah L-1 (detection
range of 100 nC for this set of experiments).
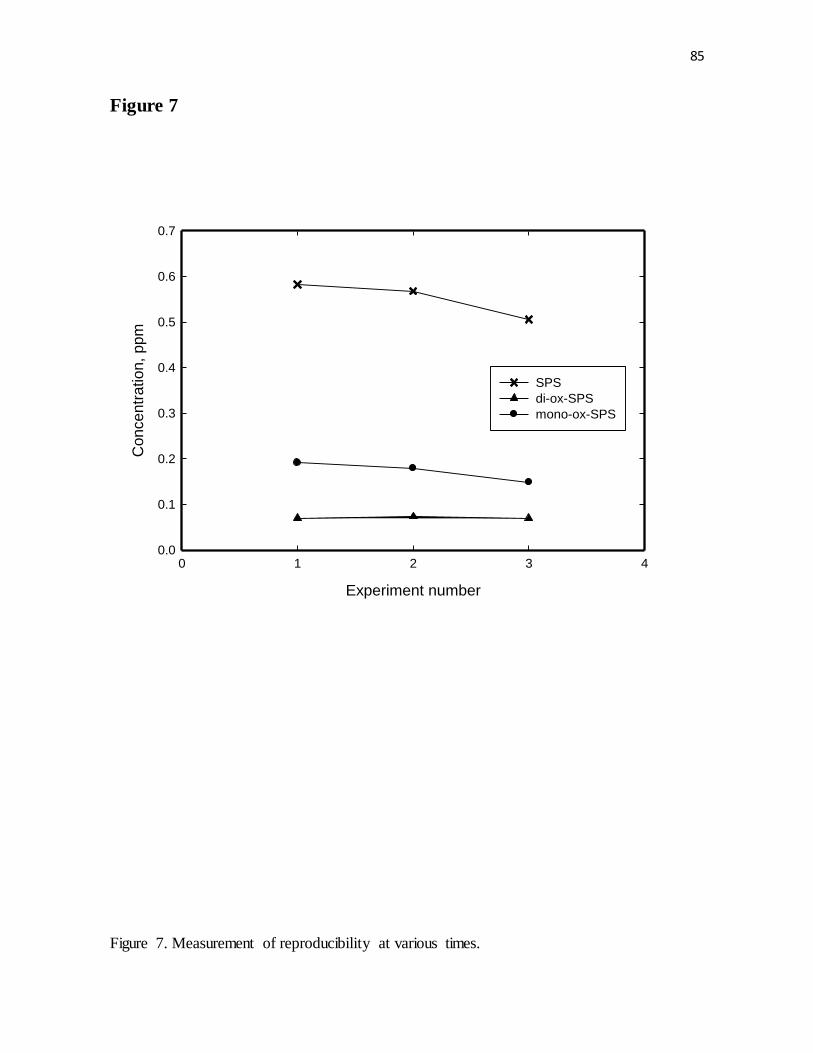
85
Figure 7
Experiment number
0 1 2 3 4
Concentr
ation,
pp
m
0.0
0.1
0.2
0.3
0.4
0.5
0.6
0.7
SPS
di-ox-SPS
mono-ox-SPS
Figure 7. Measurement of reproducibility at various times.
86
_________________________________________________________________________________
* This work was done in collaboration with Edward Swanson, Brendan O’Brien, Steven W. Novak,
Ruud van den Boom, and Kathleen Dunn
Chapter 5
Pulse-plating of Copper-Silver Alloys for Interconnect Applications
Abstract
The electrodeposition of Cu-Ag alloys was studied as a possible application for
interconnect technology, where Cu-Ag alloys may be less susceptible to electromigration
than Cu alone. The presence of chloride in state-of-the-art copper plating electrolytes limited
the solubility of Ag. However, pulse-plating approach enabled a wide range of Cu-Ag alloy
compositions at substantial chloride concentration levels. The deposition of Ag was driven
by the displacement reactions between the metallic copper and ionic silver during the off-
time. Measured alloy compositions were consistent with theoretical estimates at various
electrolyte concentrations, electrode rotation speeds, pulse frequencies and duty cycles.
However, organic additives decreased incorporation of Ag into the alloy. It was also
discovered that CuSO4·5H2O from a number of major chemical suppliers contained Ag as an
impurity. The roughness of the films was significant when produced by pulsed plating, but
was shown to be substantially reduced in the presence of a leveling agent. Additionally, the
concentration of chloride in the electrolyte was shown to significantly affect surface quality
of the deposited Cu-Ag thin films.
87
Introduction
With the continuing miniaturization of microelectronics, electromigration effects in
copper interconnect systems are becoming a major factor in determining device lifetime and
reliability.1-3 Accordingly, there is a need for interconnect materials with improved
electromigration resistance, while maintaining adequate electrical resistivity. It has been
shown that co-deposits of Cu with small amount of other metals (such as Ag, Sn, Co, and
Mg) can potentially mitigate both electro- and stress-migration.4-8 However, the resistivity of
the interconnect increases with the addition of foreign metals. The International Technology
Roadmap of Semiconductors (ITRS) has set the resistivity criterion at ρ < 2.2 μΩ·cm,9 only
slightly above the bulk resistivity of pure copper at 1.68 μΩ·cm. Alloying copper with silver
( = 1.59 μΩ·cm) was shown to increase the resistivity of post-anneal electrochemically
deposited Cu-Ag films the least when compared to other copper alloys.10 For Ag content
between 0.17 and 3.2 wt% the resistivity ranges 1.8 to 3.1 μΩ·cm.10 For this reason Cu-Ag
alloys, especially at the lower Ag weight percentages, are potential candidates for the
fabrication of interconnects in microelectronic devices.
Acidic copper-sulfate electrolytes containing chloride have been successfully applied
for many years to the electrochemical fabrication of copper interconnects.11-13 Chloride in
these electrolytes is known to be one of the critical constituents enabling defect-free filling
of surface features.14-20 The main challenge for depositing silver from copper-plating
electrolytes, which contain about 50 ppm of chloride, is the low solubility of silver in the
presence of chloride ions (the solubility product of AgCl in water at 25oC is 1.8×10⁻¹⁰ M2).21
While Strehle et al. demonstrated a controlled electrodeposition of Cu-Ag alloys from
88
chloride-free acidic copper sulfate electrolytes,22 the deposition in the presence of chloride is
probably necessary.
We demonstrate that the application of a pulsating current instead of a direct current
permits the use of chloride at a substantial concentration, while also allowing a wide range
of Cu-Ag alloy compositions. The literature contains numerous descriptions of pulse-plating
of different binary and ternary metal alloys with copper from a variety of electrolytes: Cu-
Co from citrate and boric acid electrolyte,23 Cu-Ni from trisodium citrate electrolyte,24 Cu-
Sn from Lucent’s SnTech line of electroplating baths,25 Cu-Mg from ammonium sulfate
electrolyte,26 Ni-Cu-Mo from ammonia citrate electrolyte,27 etc. However, this is the first
investigation to look at the pulse-plating approach for the electrochemical deposition of Cu-
Ag thin films from the conventional copper plating electrolytes containing chloride and
organic additives.
The aim of chapter 5 is to investigate the composition of Cu-Ag alloys at various
plating conditions, electrolyte concentrations, and applied pulse parameters. We show the
role of the displacement reactions in pulse-plating of Cu-Ag by comparing measured alloy
compositions with those predicted by theoretical estimates. Additionally, the film
microstructure and film quality of the deposited alloys was also examined.
Experimental
Electrochemistry on rotating disk electrode
For the electrochemical investigation, a three-electrode cell was employed. The
working electrode was a platinum rotating disk electrode (RDE) with 4 mm diameter (Pine
Corporation). The counter electrode was a gold wire. A double junction reference electrode
89
Hg|Hg2SO4 (Pine RREF0026) was chosen to avoid problems associated with leakage from
such reference electrodes as Ag|AgCl. Prior to each experiment, the platinum surface of the
RDE was electrochemically treated in 0.5 M H2SO4 solution by cycling the electrode
potential repeatedly from -0.66 V to 8.5 V at 1 V s-1 until a characteristic cyclic
voltammogram developed. Then, the working electrode was modified by plating about 1.8
µm layer of copper from a copper sulfate electrolyte without additives at - 40 mA cm-2.
Copper oxidation was found to be an important parameter during pulse-plating. The
measurement of the oxidation rate of copper was conducted in 0.63 M CuSO4·5H2O and 0.3
M H2SO4 electrolyte. First, a copper film was electrochemically plated at -10 mA cm-2 onto
platinum RDE for 271.5 s at 400 rpm. According to Faraday’s law, this corresponds to a
film thickness of about 1 µm. Then, current was switched to zero and, depending on the
desired experiment, the electrode was either immediately rinsed with DI water or allowed to
stay in the electrolyte for 15 min at 400 rpm. Afterwards, the RDE was transferred to a
concentrated phosphoric acid; there copper was stripped from RDE at 10 mA cm-2 and the
stripping time was recorded (it was previously demonstrated that stripping of Cu in H3PO4
occurs nearly at 100% current efficiency).28 The time required to dissolve copper was
determined by observing a sharp potential increase at the completion of the dissolution
process, when the potential reached 1.39 V vs. Hg|Hg2SO4 up from a dissolution potential of
-0.325 V. Comparing the time of deposition to the time of stripping allowed for the
determination of the oxidation rate of copper.
90
Electroplating of alloy films
Coupon squares were used for the electrochemical deposition of thin films. Coupons
were cleaved from 300 mm silicon wafer that had Ta/TaN barrier layer and PVD plated
copper-seed layer (thickness of 50 nm) on the surface. After cleaving the wafer, the coupon
was cleared of dust by blowing pre-purified compressed nitrogen to the surface. Then, the
coupon was attached to the coupon holder, designed by Atotech USA, Inc., to approximate
an RDE. The electrical contact to the wafer segments was achieved by applying Cu adhesive
tape to all four sides of the square coupon, and then Kapton tape was applied to define a
circular surface area of deposition. A hole in the Kapton tape was cut using a craft punch
(Marvy Uchida), with 5/8 inch hole diameter (surface area 1.98 cm2).
After attaching the coupon, the holder was mounted on a rotatory shaft at the RDE
stand (Pine), rinsed in deionized (DI) water (18.2 MΩ·cm), and immersed in a 200 ml of
electrolyte contained in a 325 ml Pyrex crystallizing dish for the deposition experiment. The
counter electrode for the preparation of thin films was a gold wire. The entire stand was
inclined 5 degrees to prevent the entrapment of air bubbles on the coupon surface during the
immersion of coupon into solution. A pulse current was controlled through Nova 1.5
electrochemical software (Metrohm Autolab B.V.), by FRA2 µAutolab Type III
potentiostat/galvanostat (Metrohm Autolab B.V.). After the deposition experiment, the
coupon was rinsed with DI water and blown dry with compressed nitrogen. Composition of
the alloy was examined by inductively coupled plasma – atomic emission spectroscopy
(ICP-AES). For this analysis, the whole deposit (including the seed layer) was dissolved in 1
ml of 35% concentrated nitric acid, and afterwards diluted in DI water to make 10 ml of
volume for analysis by ICP-AES.
91
Electrolytes for all plating experiments were prepared using the following materials:
CuSO4.5H2O, 99+ % (Fisher Scientific, Acros Organics), H2SO4, 95-98% (EMD Chemicals,
Inc.), AgNO3, 99.9+ % (Alfa Aesar), PEG 3350 g/mol (Sigma-Aldrich), HCl, 12.1 M
(VWR, BDH Aristar), SPS, 96% mass fraction29 (Raschig GmbH), Polyvinylpyrrolidone
29,000 g/mol (Sigma-Aldrich). For all experiments conducted in this chapter, the
concentration of PEG was 300 ppm (8.95×10⁻⁵ M), the concentration of SPS was 30 ppm
(8.46×10⁻⁴ M), and the concentration of PVP was 200 ppm (6.9×10⁻⁶ M). The organic
additives, silver, and chloride were individually added to the plating bath through dilution
from concentrated solutions made with DI water.
Metrology
ICP-AES tool (Horiba Jobin Yvon) controlled by ACTIVAnalyst 5.4 software was
used to determine the total amount of silver in the electroplated films. The quantification of
the silver concentration was done through the calibration of the signal intensities with
known amounts of silver. Calibration standards were prepared using 1000 ppm silver ICP
standard, silver nitrate in 3% nitric acid (Ricca Chemical Company). The emission
wavelength for silver analysis was chosen to be 328.068 nm.
The surface quality and thickness of plated films were examined by plan view and
cross-sectional imaging in an FEI Nova NanoLab 600 Dual Beam Focused Ion Beam-
Scanning Electron Microscope (FIB-SEM). The SEM column was operated at 5 kV for
imaging while the FIB column was operated at 30kV for cross sectioning. Depth profiling of
the film composition was determined by IonTOF 5-300 Time-of-flight Secondary Ion Mass
spectrometry (ToF-SIMS). The analysis beam was pulsed 1nA Bi+ at 25keV and 45 degrees
92
incidence across a 50 µm area. The sputtering beam was 100 nA Cs+ at 2 keV and 45
degrees incidence. The analysis and sputtering beams were used in interlace
mode. Negative secondary ions were monitored with a mass resolution of about
4000. Calibration of the depth scales and conversion of ion counts to concentrations were
made using an ion implanted Cu standard. Calculated concentrations should be accurate to
within 15% and depth scales should be accurate to within 5%.
Results and Discussion
Rationale for choosing pulse-plating approach
The electrochemical deposition of Ag from copper electrolytes that contain chloride
ions as a critical component is made difficult by the low solubility of silver ions with
chloride (Ksp of AgCl in water is 1.8×10⁻¹⁰ M2 at room temperature21). One possible way to
avoid the issue of AgCl solubility is to find a substitute for chloride. Bromide has been
reported to have a similar effect as chloride when used with organic additives,30 however
AgBr is even less soluble (Ksp = 5×10-13 M2) than AgCl. Another halogen, fluoride was
tested by linear sweep voltametry technique to observe whether it exerts any effect on
organic additives. The critical suppression of copper deposition by PEG was not achieved in
the presence of fluoride ions. The solubility of AgCl can be improved by complexing or
chelating Ag+ ions. However, known chelating agents for Ag+ (such as ammonia,
thiosulfate, and EDTA) adversely affect and/or complex cupric ions, which are present in
much larger concentration levels than silver ions. Yet another way to avoid the problem of
low solubility of AgCl, is to find organic additives that enable feature filling without
chloride. However, most reported organic additives are used in the presence of chloride.31
93
Suppressors, such as PEG, PPG, EPE, PEP, 32, 33 were tested by linear sweep voltammetry to
evaluate their behavior in the absence of chloride during the electrodeposition of Cu. The
experimental results showed that all these substances do not to provide an adequate
suppression without chloride.
In order to deposit Cu-Ag alloys, the approach taken in the present chapter was to
maintain a silver concentration below the solubility limit of AgCl, while keeping the
concentration of chloride, (2.82×10⁻⁴ M). The surface quality of the plated
films was found to be adversely affected at lower chloride concentration levels (discussed
below). Additionally, Dow et al. has shown that in order to obtain good filling of fine
features a must be maintained.34
Electroanalytical investigation was carried out to observe how the suppression of
copper deposition by PEG is affected by the concentration of chloride, and more importantly
to determine if adequate suppression can be obtained at = 10 ppm. Polarization curves
in Figure 1 show the effect of chloride at different potentials. Until the potential reached
about 0.67 V vs. Hg|Hg2SO4, the suppression of copper deposition at = 10 ppm
(2.82×10⁻⁴ M) and the conventionally used = 50 ppm (1.41×10⁻³ M) was almost
unchanged.
According to Ksp value of AgCl in water and at 10 ppm of Cl-, the concentration of
silver ions ( ) at saturation is 9.87×10⁻⁷ M. However, in higher ionic strength solutions,
such as sulfuric acid based copper electrolytes, solubility of Ag+ may be somewhat higher.
To determine the effect of copper electrolyte on the solubility of AgCl, 4.63×10⁻⁴ M of Ag+
and 4.63×10⁻⁴ of Cl- were combined in 0.63 M CuSO4.5H2O and 0.3 M H2SO4 solution.
Silver chloride precipitate began forming almost instantaneously upon the contact. After
94
several days, about 10 ml of solution at the top was withdrawn and filtered through Steriflip-
GV, 0.22 µm (Millipore) to ensure that no precipitate was left in the saturated solution.
From the measured silver concentration, Ksp value of AgCl in the specified copper
electrolyte was 5.4×10⁻¹⁰ M2. Based on this solubility product, cannot exceed 1.9 µM
before AgCl would precipitate.
Since the concentrations of copper and silver have to be so different, the plating
mode required careful consideration. The direct-current (DC) deposition would limit the
possible fraction of Ag in a Cu-Ag alloy. For example, based on Faraday’s law, the mass
fraction of Ag in a 100 nm film would be limited to 0.26 wt% if the deposition were to be
carried at the saturation concentration of Ag+ ( = 1.9 µM) and a typical applied current
density of -10 mA cm-2 and 400 rpm.
Description of the pulse-plating method
We thus investigated pulse-plating as a more promising option. Figure 2 shows an
example of the unipolar pulse-plating waveform that was chosen for the deposition of Cu-
Ag alloys. The current is pulsed between ioff = 0 mA cm-2 (i.e. off-time) and ion = -10 mA
cm-2 (i.e. on-time). During the off-time, metallic copper on the surface is expected to be
spontaneously replaced by silver (reaction 1), driven by the difference of standard reduction
potentials between silver (Uθ = 0.799 V vs. SHE) and copper (Uθ = 0.337 V vs. SHE)
reactions. During the on-time, both Cu2+ and Ag+ ions are electrolytically plated on the
cathode surface. Based on reaction 1, during the off-time, for every one atom of Cu leaving
the surface two atoms of Ag are deposited.
(1)
95
The amount of Ag versus Cu in the alloy can be controlled by varying the duty cycle
of the pulse (equation 2) and by regulating the pulse amplitude. However, to allow for the
adequate deposition of Ag, duty cycle needs to be low (e.g. below 15%). The distribution of
silver in the alloy can possibly be controlled by changing frequency of the pulse (equation
3), as was demonstrated by other researchers for similar systems.23, 35 Due to the self-
limiting nature of the displacement reactions and to ensure uniform metal distribution
between Ag and Cu, the frequency was chosen as to deposit less than a monolayer of silver
during a single pulse cycle based on Faraday’s law.
(2)
(3)
To gain insight about the surface composition during deposition of Ag, the potential
of the working electrode was measured at zero current. The measurements of the open-
circuit potential (OCP) were performed at different concentrations of silver after an initial 30
seconds of plating at -10 mA cm-2. The thermodynamic difference between the reversible
potentials of Cu and Ag is 0.46 V. However, the difference between the OCP of copper in
the presence of a copper sulfate electrolyte without silver and the electrolyte with various
amounts of silver (0.01 M, 0.0001 M, and 0.00001 M) was only about 7 mV. This behavior
probably indicates that Ag does not form a complete monolayer on the Cu surface.
Estimation of the Cu-Ag alloy composition
The transport of silver ions to the surface can be well understood theoretically since
the deposition of Cu-Ag films was conducted in a rotating disk electrode configuration.
Based on the concentration of silver used, the flux of silver ions to the surface is mass-
96
transport-limited and can be calculated using the Levich equation for a given and
rotation speed. In calculating the flux of ions, the kinematic viscosity was taken to be that of
water, ν = 0.01 cm2 s-1. The diffusion coefficient of silver ion in various supporting
electrolytes, such as KNO3 and HClO4, ranges from 1.53×10⁻⁵ to 1.62×10⁻⁵ cm2 s-1 at 25
oC.36 Hotlos et al. measured diffusion coefficients of silver ion at various concentrations of
CuSO4 and H2SO4.37 For the calculations of the limiting current of silver ions,
=1.03×10⁻⁵ cm2 s-1 was used, which was determined by Hotlos et al. in the electrolyte of
similar composition to that used in this chapter.
During both on- and off- times silver ions discharge on the cathode at its limiting
current. Accordingly, the rate of silver incorporation into the alloy can be directly calculated
based on Faraday’s law. For example, starting with = 3.0 µM and rotation of 400 rpm,
the limiting current is -1.18 µA cm-2 and the plating rate of Ag is then 2.62 ng s-1. Thus, to
achieve an appreciable Ag content, the time-average Cu deposition rate must be
substantially lowered. At such a slow deposition rate, one may worry about the practicality
of the present deposition scheme. However, the rate is not unreasonable if one-wt% alloys
are to be deposited in the narrow geometries of microelectronic devices where feature sizes
may be less than 20 nm.9 For the subsequent deposition of the overburden where the Ag
incorporation rate is not important, a DC plating protocol could be adopted to increase the
deposition rate.
The weight percent of Ag in the Cu-Ag alloy was predicted by accounting for the
mass-transfer-controlled deposition of Ag during both the off- and on-times, the
galvanostatic deposition of Cu based on 100% current efficiency, and the oxidation of Cu
during the off-times as shown in equation 4 (where w corresponds to the weight of species).
97
(
)
(
) (
)
× 100% (4)
It was important to account for the loss of Cu by oxidation due to the long periods of
off-time. The oxidation of the metallic copper can possibly happen both due to oxidation by
the dissolved oxygen (reaction 5) and the comproportionation reaction between cupric ions
and copper (reaction 6), which is driven by a difference in cuprous ion concentration
between the surface and the bulk electrolyte.
(5)
(6)
Both reactions 5 and 6 can be anticipated to proceed in the forward direction since
is positive. Based on thermodynamics, Cu should be oxidized by cupric ions until the
surface concentration reaches a value at which overall reaction is not possible. Using the
Nernst equation the equilibrium surface concentration of Cu+ can be estimated by setting ΔU
= 0, which gives, according to equation 7, = 6.13×10⁻⁴ M.
(
) (7)
The oxidation rate of Cu can then be approximated by equation 8, where is the
cuprous-ion flux across the diffusion layer. The diffusion layer thickness diff can be defined
by equation 9, where ν is a kinematic viscosity, Ω is a rotation rate, and = 0.43×10⁻⁵
cm2 s-1 ( was assumed to be equal to the reported by Noulty et al.).38
(8)
diff = 1.61×
×ν1/6×Ω-1/2 (9)
98
The rate of oxidation of Cu due to etching by cupric-ions at 400 rpm is then predicted as 2.9
nm min-1.
The oxidation rate of Cu by dissolved oxygen is more difficult to predict because the
dissolved oxygen concentration is not known with precision, and large discrepancies
between the measured rate and that expected from the oxygen reduction current were
reported.39 Therefore, the oxidation rate of Cu by O2 was instead estimated by experiment.
When 1 µm of copper film was plated and directly removed from the electrolyte (0.63 M
CuSO4·5H2O and 0.3 M H2SO4) and rinsed immediately after the deposition, the measured
film amount was 99% of the expectation, indicating a near 100% current efficiency of
copper plating. However, when plated copper film was left in the electrolyte for 15 minutes
at 400 rpm, only 89.9% of copper remained on the electrode due to oxidation. Then, the
oxidation rate of copper at 400 rpm due to both reactions 5 and 6 was determined from
equation 10.
(10)
When copper film was left in 0.3 M H2SO4, 95% of the film remained. The oxidation
rate of copper in sulfuric acid solution at 400 rpm was then equal to 2.7 nm min-1. Since Cu
is not susceptible to corrosion by H2SO4, the oxidation in 0.3 M H2SO4 was probably due to
the presence of dissolved O2. The measured oxidation rate was assumed to be constant and
applied in the prediction of the weight percent of Ag in the alloy (see equation 4).
Measurement of the Cu-Ag alloy composition under various conditions
In the process of measuring silver concentrations with ICP-AES, it was discovered
that the source of cupric ions (CuSO4·5H2O) contained trace silver impurity. As shown in
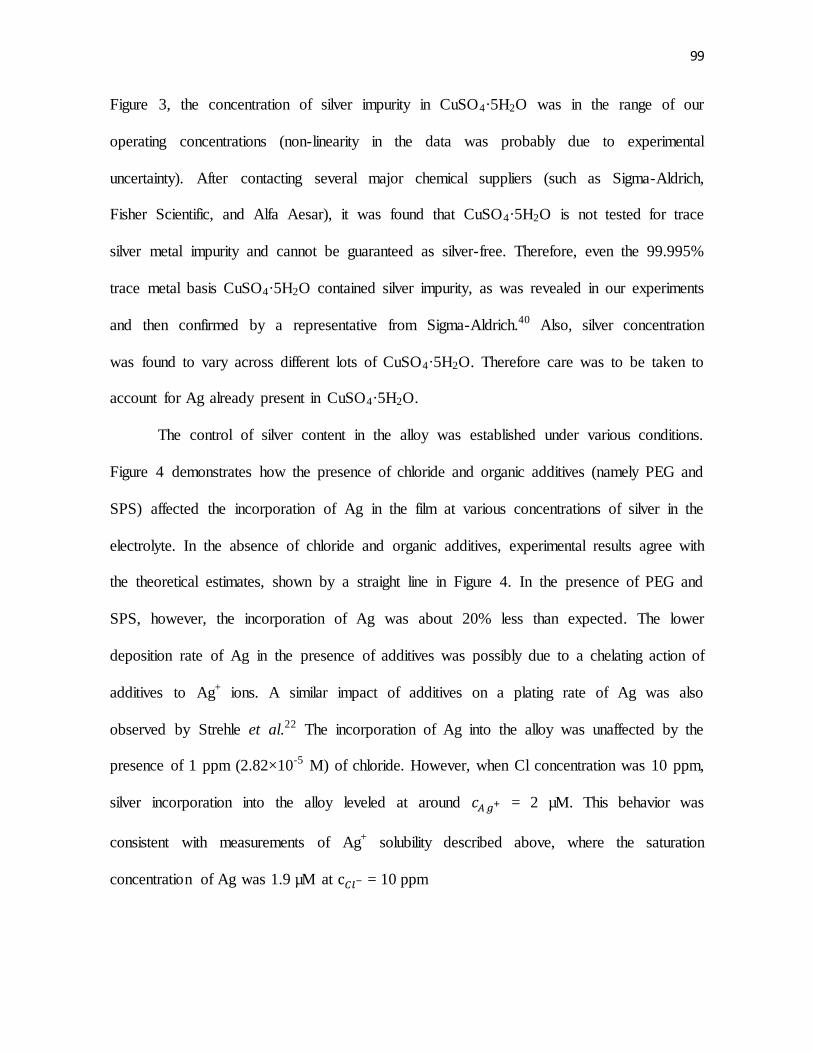
99
Figure 3, the concentration of silver impurity in CuSO4·5H2O was in the range of our
operating concentrations (non-linearity in the data was probably due to experimental
uncertainty). After contacting several major chemical suppliers (such as Sigma-Aldrich,
Fisher Scientific, and Alfa Aesar), it was found that CuSO4·5H2O is not tested for trace
silver metal impurity and cannot be guaranteed as silver-free. Therefore, even the 99.995%
trace metal basis CuSO4·5H2O contained silver impurity, as was revealed in our experiments
and then confirmed by a representative from Sigma-Aldrich.40 Also, silver concentration
was found to vary across different lots of CuSO4·5H2O. Therefore care was to be taken to
account for Ag already present in CuSO4·5H2O.
The control of silver content in the alloy was established under various conditions.
Figure 4 demonstrates how the presence of chloride and organic additives (namely PEG and
SPS) affected the incorporation of Ag in the film at various concentrations of silver in the
electrolyte. In the absence of chloride and organic additives, experimental results agree with
the theoretical estimates, shown by a straight line in Figure 4. In the presence of PEG and
SPS, however, the incorporation of Ag was about 20% less than expected. The lower
deposition rate of Ag in the presence of additives was possibly due to a chelating action of
additives to Ag+ ions. A similar impact of additives on a plating rate of Ag was also
observed by Strehle et al.22 The incorporation of Ag into the alloy was unaffected by the
presence of 1 ppm (2.82×10⁻⁵ M) of chloride. However, when Cl concentration was 10 ppm,
silver incorporation into the alloy leveled at around = 2 µM. This behavior was
consistent with measurements of Ag+ solubility described above, where the saturation
concentration of Ag was 1.9 µM at = 10 ppm
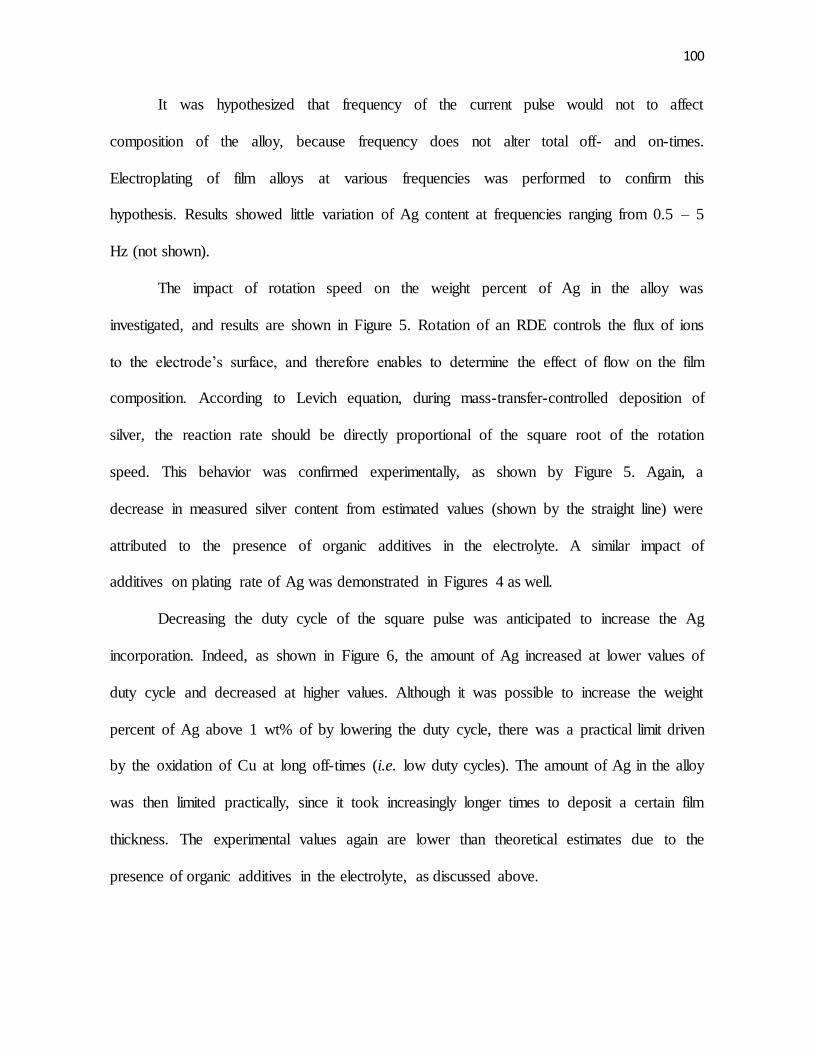
100
It was hypothesized that frequency of the current pulse would not to affect
composition of the alloy, because frequency does not alter total off- and on-times.
Electroplating of film alloys at various frequencies was performed to confirm this
hypothesis. Results showed little variation of Ag content at frequencies ranging from 0.5 – 5
Hz (not shown).
The impact of rotation speed on the weight percent of Ag in the alloy was
investigated, and results are shown in Figure 5. Rotation of an RDE controls the flux of ions
to the electrode’s surface, and therefore enables to determine the effect of flow on the film
composition. According to Levich equation, during mass-transfer-controlled deposition of
silver, the reaction rate should be directly proportional of the square root of the rotation
speed. This behavior was confirmed experimentally, as shown by Figure 5. Again, a
decrease in measured silver content from estimated values (shown by the straight line) were
attributed to the presence of organic additives in the electrolyte. A similar impact of
additives on plating rate of Ag was demonstrated in Figures 4 as well.
Decreasing the duty cycle of the square pulse was anticipated to increase the Ag
incorporation. Indeed, as shown in Figure 6, the amount of Ag increased at lower values of
duty cycle and decreased at higher values. Although it was possible to increase the weight
percent of Ag above 1 wt% of by lowering the duty cycle, there was a practical limit driven
by the oxidation of Cu at long off-times (i.e. low duty cycles). The amount of Ag in the alloy
was then limited practically, since it took increasingly longer times to deposit a certain film
thickness. The experimental values again are lower than theoretical estimates due to the
presence of organic additives in the electrolyte, as discussed above.
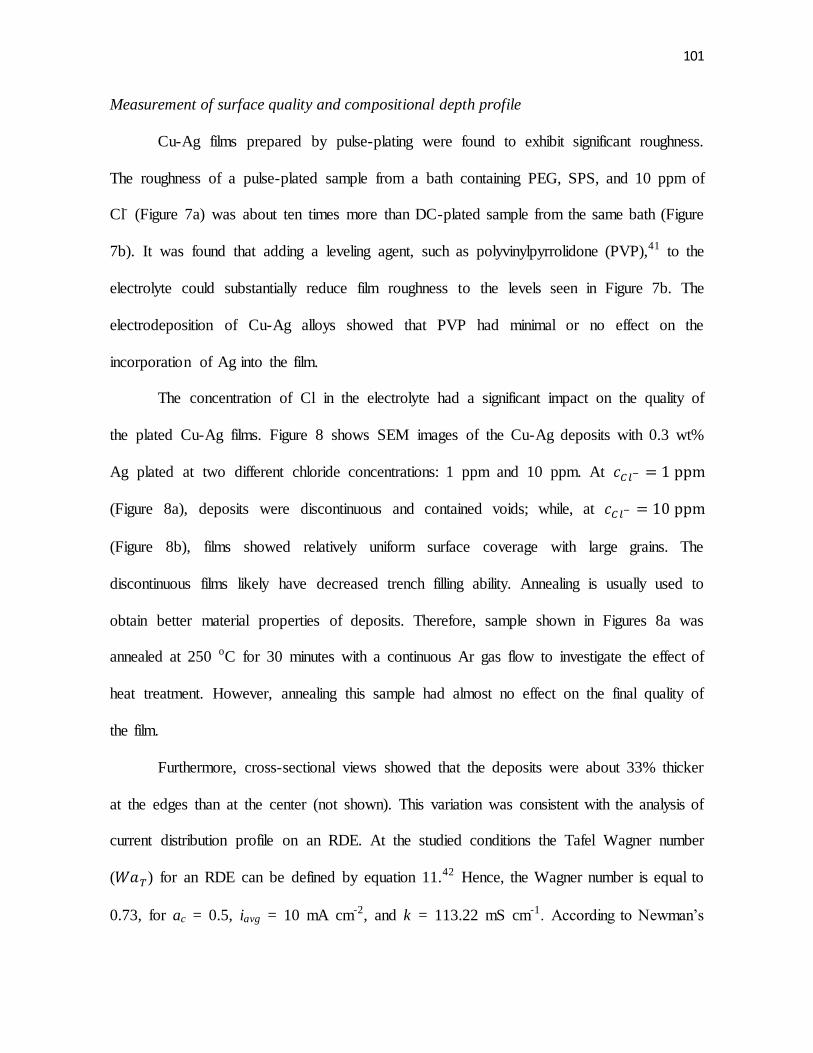
101
Measurement of surface quality and compositional depth profile
Cu-Ag films prepared by pulse-plating were found to exhibit significant roughness.
The roughness of a pulse-plated sample from a bath containing PEG, SPS, and 10 ppm of
Cl- (Figure 7a) was about ten times more than DC-plated sample from the same bath (Figure
7b). It was found that adding a leveling agent, such as polyvinylpyrrolidone (PVP),41 to the
electrolyte could substantially reduce film roughness to the levels seen in Figure 7b. The
electrodeposition of Cu-Ag alloys showed that PVP had minimal or no effect on the
incorporation of Ag into the film.
The concentration of Cl in the electrolyte had a significant impact on the quality of
the plated Cu-Ag films. Figure 8 shows SEM images of the Cu-Ag deposits with 0.3 wt%
Ag plated at two different chloride concentrations: 1 ppm and 10 ppm. At
(Figure 8a), deposits were discontinuous and contained voids; while, at
(Figure 8b), films showed relatively uniform surface coverage with large grains. The
discontinuous films likely have decreased trench filling ability. Annealing is usually used to
obtain better material properties of deposits. Therefore, sample shown in Figures 8a was
annealed at 250 oC for 30 minutes with a continuous Ar gas flow to investigate the effect of
heat treatment. However, annealing this sample had almost no effect on the final quality of
the film.
Furthermore, cross-sectional views showed that the deposits were about 33% thicker
at the edges than at the center (not shown). This variation was consistent with the analysis of
current distribution profile on an RDE. At the studied conditions the Tafel Wagner number
( ) for an RDE can be defined by equation 11.42 Hence, the Wagner number is equal to
0.73, for ac = 0.5, iavg = 10 mA cm-2, and k = 113.22 mS cm-1. According to Newman’s
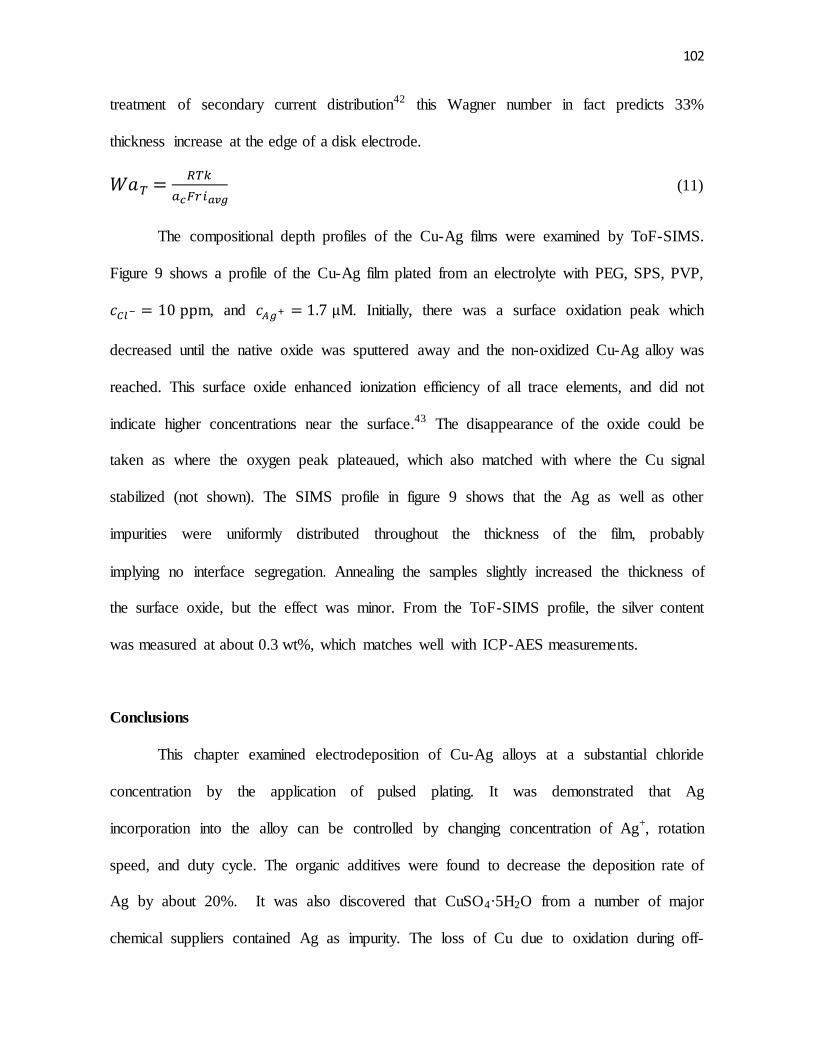
102
treatment of secondary current distribution42 this Wagner number in fact predicts 33%
thickness increase at the edge of a disk electrode.
(11)
The compositional depth profiles of the Cu-Ag films were examined by ToF-SIMS.
Figure 9 shows a profile of the Cu-Ag film plated from an electrolyte with PEG, SPS, PVP,
, and . Initially, there was a surface oxidation peak which
decreased until the native oxide was sputtered away and the non-oxidized Cu-Ag alloy was
reached. This surface oxide enhanced ionization efficiency of all trace elements, and did not
indicate higher concentrations near the surface.43 The disappearance of the oxide could be
taken as where the oxygen peak plateaued, which also matched with where the Cu signal
stabilized (not shown). The SIMS profile in figure 9 shows that the Ag as well as other
impurities were uniformly distributed throughout the thickness of the film, probably
implying no interface segregation. Annealing the samples slightly increased the thickness of
the surface oxide, but the effect was minor. From the ToF-SIMS profile, the silver content
was measured at about 0.3 wt%, which matches well with ICP-AES measurements.
Conclusions
This chapter examined electrodeposition of Cu-Ag alloys at a substantial chloride
concentration by the application of pulsed plating. It was demonstrated that Ag
incorporation into the alloy can be controlled by changing concentration of Ag+, rotation
speed, and duty cycle. The organic additives were found to decrease the deposition rate of
Ag by about 20%. It was also discovered that CuSO4·5H2O from a number of major
chemical suppliers contained Ag as impurity. The loss of Cu due to oxidation during off-
103
time considerably influenced the fraction of Ag in the alloy. The pulse-plating conditions
created significant film roughness. However, addition of a leveling agent helped to reduce
roughness of the plated Cu-Ag films. The chloride concentration was shown to have a
critical impact on the behavior of a leveling agent. At 1 ppm of chloride, films contained
voids and were discontinuous, while at 10 ppm of chloride continuous deposits with large
grains were obtained.
List of Symbols
cathodic transfer coefficient
c concentration, M or ppm or g L-1
D diffusion coefficient, cm2 s-1
δdiff diffusion layer thickness, cm
F Faraday’s constant, C mol-1
k conductivity, mS cm-1
Ksp solubility product
N molar flux, mol cm-2
r radius, cm
R universal gas constant, J mol-1 K-1
T temperature, K
104
Uθ standard reduction potential, V
kinematic viscosity, cm2 s-1
Ω Rotation speed, rpm
WaT tafel Wagner number
w weight, g
References
1. J.R. Lloyd, Microelectron. Eng., 49, 51 (1999).
2. S. R. Wilson, C. J. Tracy and J. L. Freeman, Handbook of Multilevel Metallization
for Intergrated Circuits, p. 910, William Andrew (1994).
3. M. Tan, C. Guymon, D. R. Wheeler and J. N. Harb, J. Electrochem. Soc., 154, D78
(2007).
4. C.-K. Hu, M. Angyal, B. C. Baker, G. Bonilla, C. Cabral, D. F. Canaperi, S. Choi, L.
Clevenger, D. Edelstein, L. Gignac, E. Huang, J. Kelly, B. Y. Kim, V. Kyei-
Fordjour, S. L. Manikonda, J. Maniscalco, S. Mittal, T. Nogami, C. Parks, R.
Rosenberg, A. Simon, Y. Xu, T. A. Vo and C. Witt, AIP Conf. Proc., 1300, 57
(2010).
5. S. Strehle, S. Menzel, A. Jahn, U. Merkel, J. W. Bartha and K. Wetzig,
Microelectron. Eng., 86, 2396 (2009).
6. D. Padhi, S. Gandikota, H. B. Nguyen, C. McGuirk, S. Ramanathan, J. Yahalom and
G. Dixit, Electrochim. Acta, 48, 935 (2003).
105
7. C. K. Hu, B. Luther, F. B. Kaufman, J. Hummel, C. Uzoh and D. J. Pearson, Thin
Solid Films, 262, 84 (1995).
8. K. Barmak, C. Cabral, K. P. Rodbell and J. M. E. Harper, J. Vac. Sci. & Tech. B, 24,
2485 (2006).
9. ITRS, International Technology Roadmap for Semiconductors (2011).
10. S. Strehle, J. W. Bartha and K. Wetzig, Thin Solid Films, 517, 3320 (2009).
11. I. Volov and A. C. West, J. Electrochem. Soc., 158, D456 (2011)
12. A. C. West, S. Mayer and J. Reid, Electrochem. and Solid-State Lett., 4, C50 (2001).
13. P. C. Andricacos, C. Uzoh, J. O. Dukovic, J. Horkans and H. Deligianni, IBM J. Res.
Dev., 42, 567 (1998).
14. J. W. Gallaway, M. J. Willey and A. C. West, J. Electrochem. Soc., 156, D287
(2009).
15. P. M. Vereecken, R. A. Binstead, H. Deligianni and P. C. Andricacos, IBM J. Res.
Dev., 49, 3 (2005).
16. W.-P. Dow, H.-S. Huang, M.-Y. Yen and H.-H. Chen, J. Electrochem. Soc., 152,
C77 (2005).
17. J. P. Healy, D. Pletcher and M. Goodenough, J. Electroanal. Chem., 338, 155
(1992).
18. J. J. Kelly and A. C. West, J. Electrochem. Soc., 145, 3477 (1998).
19. P. Taephaisitphongse, Y. Cao and A. C. West, J. Electrochem. Soc., 148, C492
(2001).
20. I. Volov, O. Mann, Y. Hoenersch, B. Wahl and A. C. West, J. Sep. Sci., 34, 2385
(2011).
106
21. J. A. Dean, Lange's Handbook of Chemistry (15th Edition), McGraw-Hill (1999).
22. S. Strehle, S. Menzel, J. W. Bartha and K. Wetzig, Microelectron. Eng., 87, 180
(2010).
23. P. E. Bradley and D. Landolt, Electrochim. Acta, 45, 1077 (1999).
24. I. Baskaran, T. S. N. Sankara Narayanan and A. Stephen, Mater. Lett., 60, 1990
(2006).
25. S. D. Beattie and J. R. Dahn, J. Electrochem. Soc., 150, A894 (2003).
26. F. Mangolini, L. Magagnin and P. L. Cavallotti, J. Electrochem. Soc., 153, C623
(2006).
27. E. Beltowska-Lehman, P. Ozga and E. Chassaing, Surf. and Coat. Tech., 78, 233
(1996).
28. I. Volov, T. Saito and A. C. West, J. Electrochem. Soc., 158, D384 (2011).
29. R. G. Brennan, M. M. Phillips, L.-Y. O. Yang and T. P. Moffat, J. Electrochem.
Soc., 158, D178 (2011).
30. M. Hayase, M. Taketani, T. Hatsuzawa and K. Hayabusa, Electrochem. and Solid-
State Lett., 6, C92 (2003).
31. J. Mendez, R. Akolkar and U. Landau, J. Electrochem. Soc., 156, D474 (2009).
32. J. W. Gallaway and A. C. West, J. Electrochem. Soc., 155, D632 (2008).
33. J. W. Gallaway, M. J. Willey and A. C. West, J. Electrochem. Soc., 156, D146
(2009).
34. W.-P. Dow, M.-Y. Yen, C.-W. Liu and C.-C. Huang, Electrochim. Acta, 53, 3610
(2008).
35. W. Schwarzacher and D. S. Lashmore, IEEE T. Magn., 32, 3133 (1996).
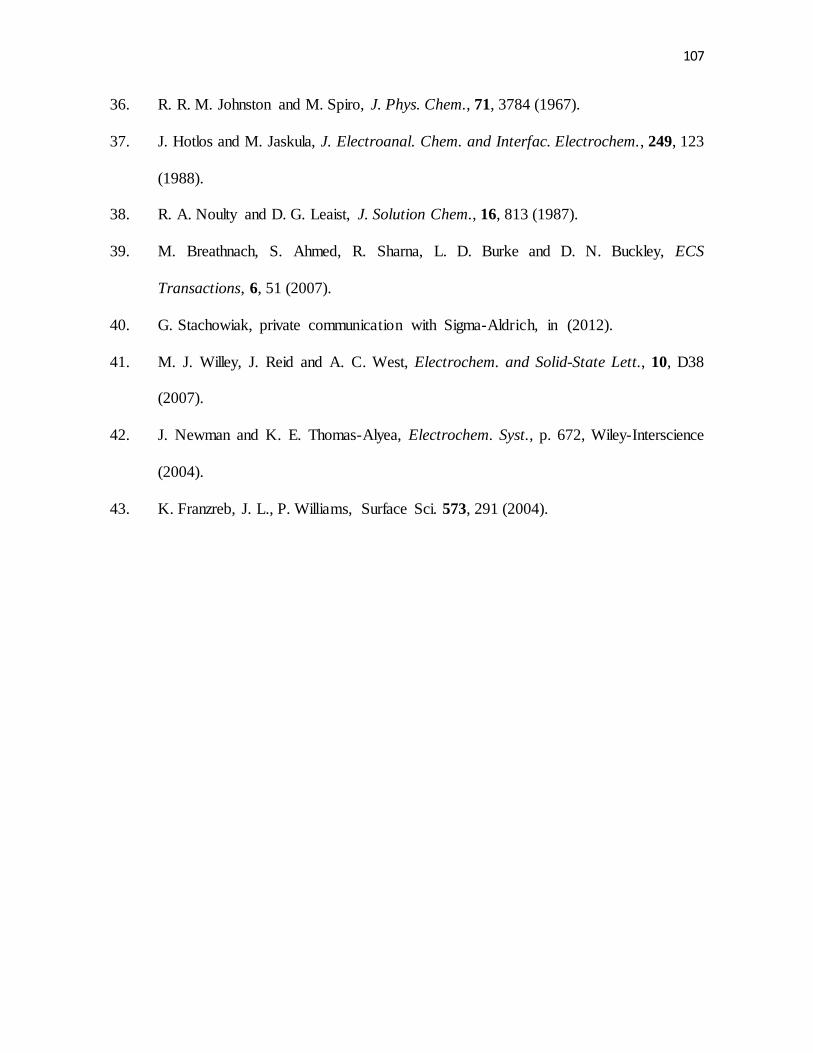
107
36. R. R. M. Johnston and M. Spiro, J. Phys. Chem., 71, 3784 (1967).
37. J. Hotlos and M. Jaskula, J. Electroanal. Chem. and Interfac. Electrochem., 249, 123
(1988).
38. R. A. Noulty and D. G. Leaist, J. Solution Chem., 16, 813 (1987).
39. M. Breathnach, S. Ahmed, R. Sharna, L. D. Burke and D. N. Buckley, ECS
Transactions, 6, 51 (2007).
40. G. Stachowiak, private communication with Sigma-Aldrich, in (2012).
41. M. J. Willey, J. Reid and A. C. West, Electrochem. and Solid-State Lett., 10, D38
(2007).
42. J. Newman and K. E. Thomas-Alyea, Electrochem. Syst., p. 672, Wiley-Interscience
(2004).
43. K. Franzreb, J. L., P. Williams, Surface Sci. 573, 291 (2004).
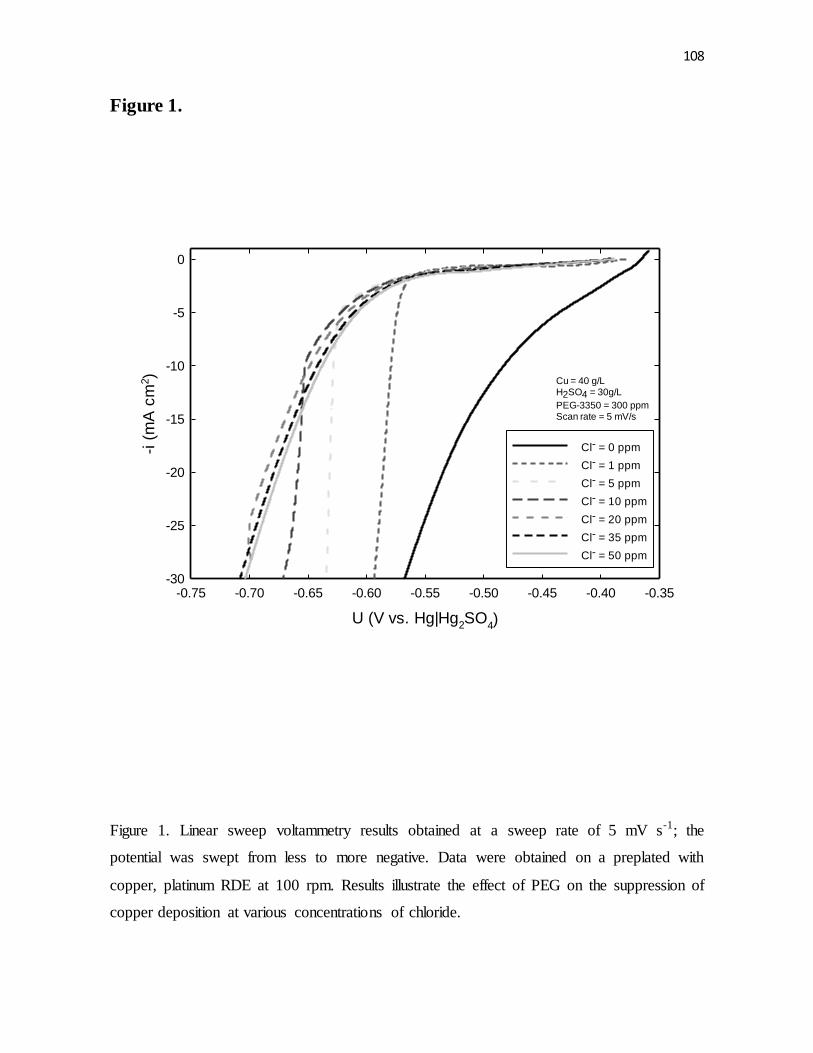
108
Figure 1.
U (V vs. Hg|Hg2SO
4)
-0.75 -0.70 -0.65 -0.60 -0.55 -0.50 -0.45 -0.40 -0.35
-i (
mA
cm
2)
-30
-25
-20
-15
-10
-5
0
Cl- = 0 ppm
Cl- = 1 ppm
Cl- = 5 ppm
Cl- = 10 ppm
Cl- = 20 ppm
Cl- = 35 ppm
Cl- = 50 ppm
Cu = 40 g/LH2SO4 = 30g/L
PEG-3350 = 300 ppmScan rate = 5 mV/s
Figure 1. Linear sweep voltammetry results obtained at a sweep rate of 5 mV s-1; the
potential was swept from less to more negative. Data were obtained on a preplated with
copper, platinum RDE at 100 rpm. Results illustrate the effect of PEG on the suppression of
copper deposition at various concentrations of chloride.
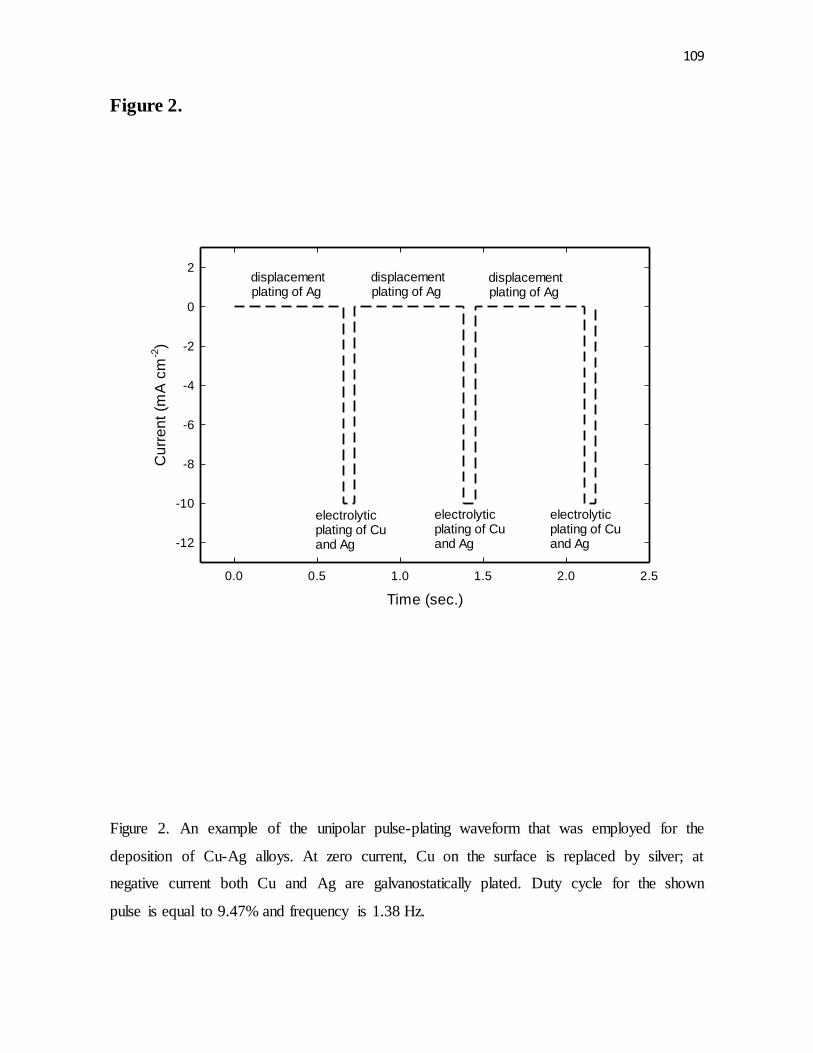
109
Figure 2.
Time (sec.)
0.0 0.5 1.0 1.5 2.0 2.5
Cu
rre
nt
(mA
cm
-2)
-12
-10
-8
-6
-4
-2
0
2
electrolyticplating of Cuand Ag
electrolyticplating of Cuand Ag
electrolyticplating of Cuand Ag
displacementplating of Ag
displacementplating of Ag
displacementplating of Ag
Figure 2. An example of the unipolar pulse-plating waveform that was employed for the
deposition of Cu-Ag alloys. At zero current, Cu on the surface is replaced by silver; at
negative current both Cu and Ag are galvanostatically plated. Duty cycle for the shown
pulse is equal to 9.47% and frequency is 1.38 Hz.
110
Figure 3.
CCu
2+ in electrolyte (g/L)
0 10 20 30 40 50 60 70
CA
g+ in
ele
ctr
oly
te (
0.0
0.2
0.4
0.6
0.8
1.0
Figure 3. Concentration of Ag as a function of ionic copper from a specific lot of
CuSO4·5H2O. Films were plated at 400 rpm, 9.47% duty cycle, 1.38 Hz frequency. Figure
shows the presence of Ag, even though Ag was not added to solution. This is because
CuSO4·5H2O already contains Ag as an impurity.
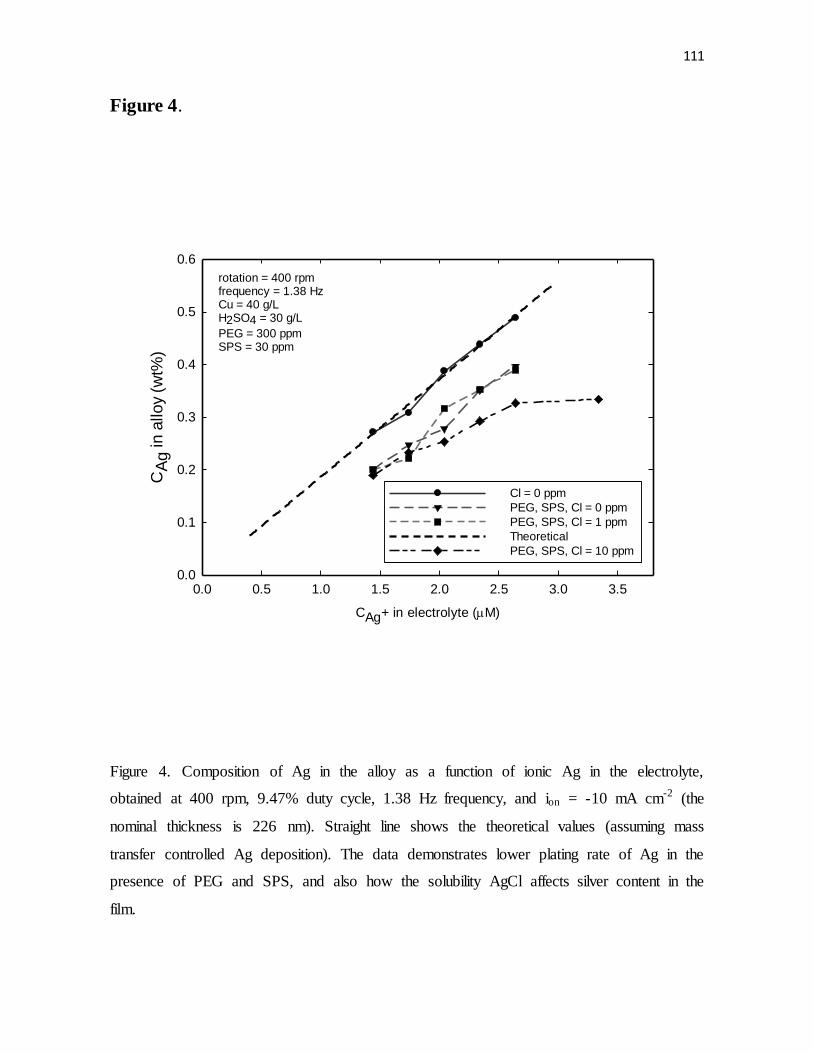
111
Figure 4.
CAg+ in electrolyte (M)
0.0 0.5 1.0 1.5 2.0 2.5 3.0 3.5
CA
g in a
lloy
(wt%
)
0.0
0.1
0.2
0.3
0.4
0.5
0.6
Cl = 0 ppm
PEG, SPS, Cl = 0 ppm
PEG, SPS, Cl = 1 ppm
Theoretical
PEG, SPS, Cl = 10 ppm
rotation = 400 rpmfrequency = 1.38 HzCu = 40 g/LH2SO4 = 30 g/L
PEG = 300 ppmSPS = 30 ppm
Figure 4. Composition of Ag in the alloy as a function of ionic Ag in the electrolyte,
obtained at 400 rpm, 9.47% duty cycle, 1.38 Hz frequency, and ion = -10 mA cm-2 (the
nominal thickness is 226 nm). Straight line shows the theoretical values (assuming mass
transfer controlled Ag deposition). The data demonstrates lower plating rate of Ag in the
presence of PEG and SPS, and also how the solubility AgCl affects silver content in the
film.
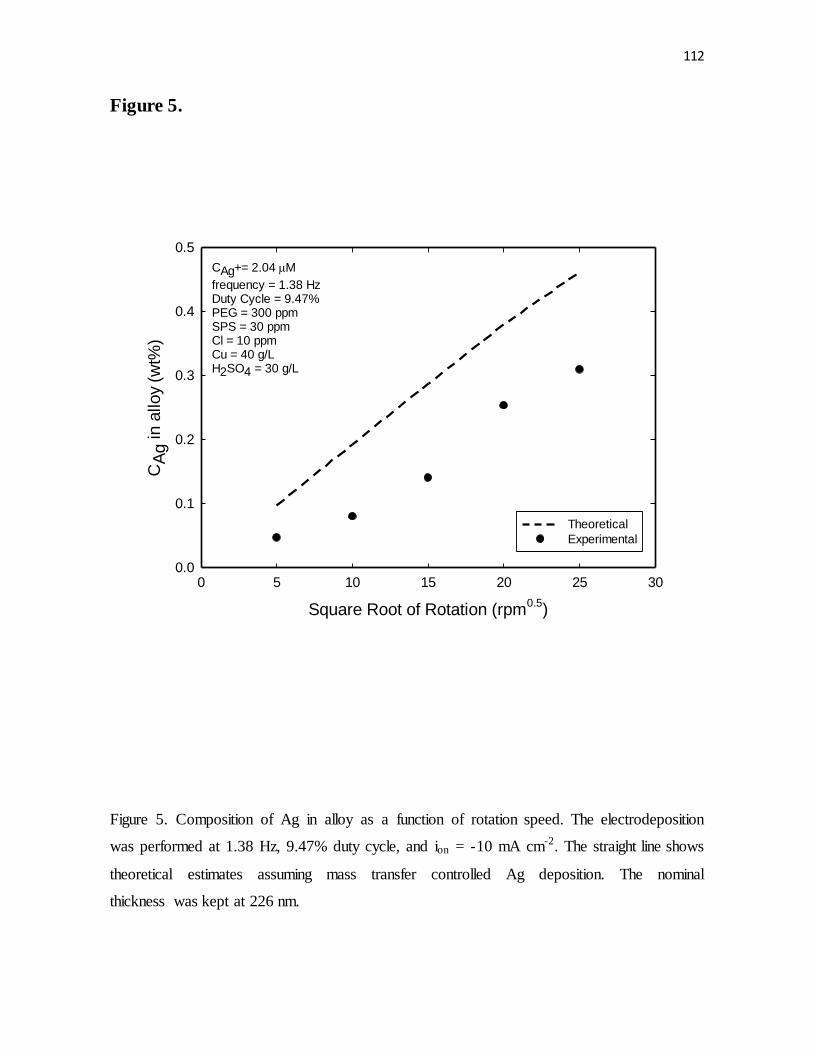
112
Figure 5.
Square Root of Rotation (rpm0.5
)
0 5 10 15 20 25 30
CA
g in a
lloy
(wt%
)
0.0
0.1
0.2
0.3
0.4
0.5
Theoretical
Experimental
CAg+= 2.04 M
frequency = 1.38 HzDuty Cycle = 9.47% PEG = 300 ppmSPS = 30 ppmCl = 10 ppmCu = 40 g/LH2SO4 = 30 g/L
Figure 5. Composition of Ag in alloy as a function of rotation speed. The electrodeposition
was performed at 1.38 Hz, 9.47% duty cycle, and ion = -10 mA cm-2. The straight line shows
theoretical estimates assuming mass transfer controlled Ag deposition. The nominal
thickness was kept at 226 nm.
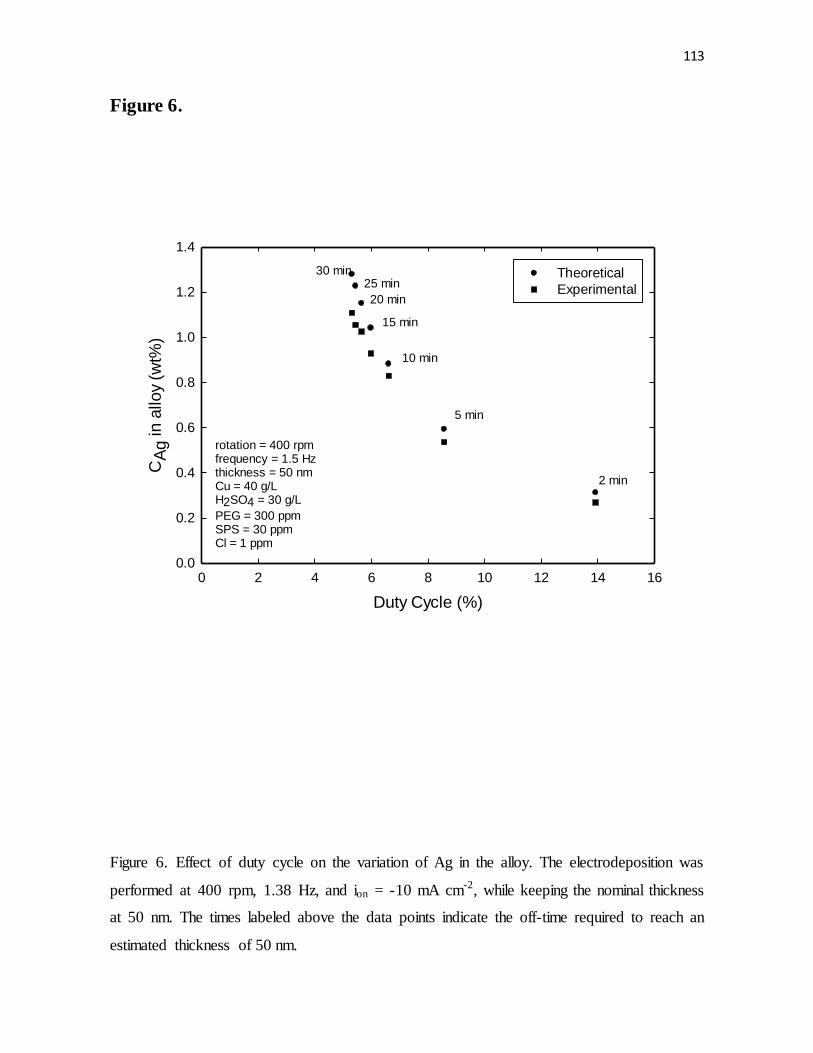
113
Figure 6.
Duty Cycle (%)
0 2 4 6 8 10 12 14 16
CA
g in a
lloy
(wt%
)
0.0
0.2
0.4
0.6
0.8
1.0
1.2
1.4
Theoretical
Experimental
rotation = 400 rpmfrequency = 1.5 Hzthickness = 50 nmCu = 40 g/LH2SO4 = 30 g/L
PEG = 300 ppmSPS = 30 ppmCl = 1 ppm
2 min
5 min
10 min
15 min
20 min
25 min30 min
Figure 6. Effect of duty cycle on the variation of Ag in the alloy. The electrodeposition was
performed at 400 rpm, 1.38 Hz, and ion = -10 mA cm-2, while keeping the nominal thickness
at 50 nm. The times labeled above the data points indicate the off-time required to reach an
estimated thickness of 50 nm.
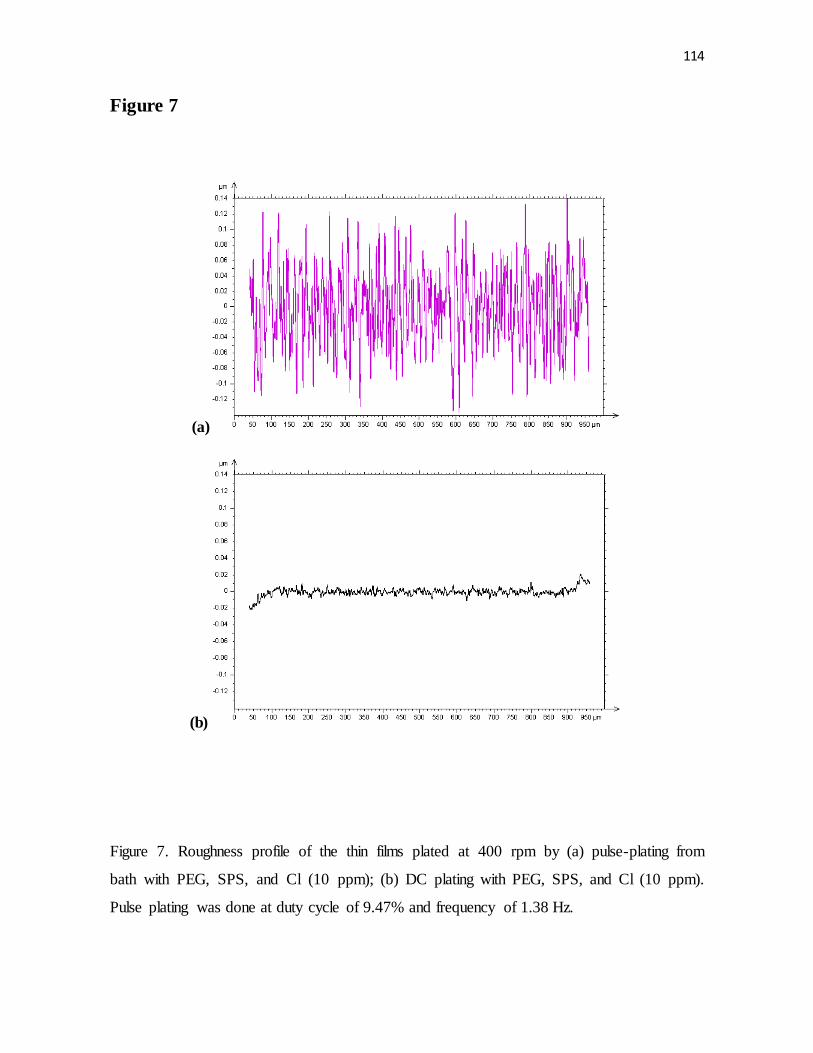
114
Figure 7
(a)
(b)
Figure 7. Roughness profile of the thin films plated at 400 rpm by (a) pulse-plating from
bath with PEG, SPS, and Cl (10 ppm); (b) DC plating with PEG, SPS, and Cl (10 ppm).
Pulse plating was done at duty cycle of 9.47% and frequency of 1.38 Hz.
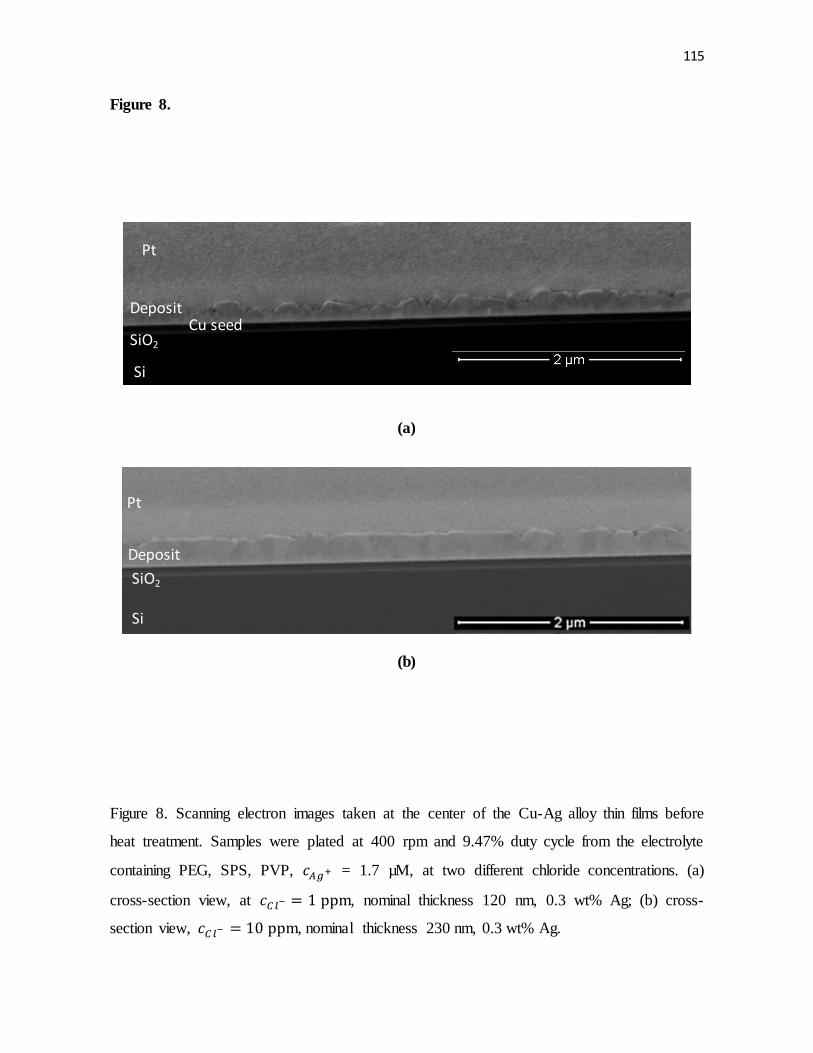
115
Figure 8.
(a)
(b)
Figure 8. Scanning electron images taken at the center of the Cu-Ag alloy thin films before
heat treatment. Samples were plated at 400 rpm and 9.47% duty cycle from the electrolyte
containing PEG, SPS, PVP, = 1.7 µM, at two different chloride concentrations. (a)
cross-section view, at , nominal thickness 120 nm, 0.3 wt% Ag; (b) cross-
section view, , nominal thickness 230 nm, 0.3 wt% Ag.
Si
SiO2
Deposit
Pt
Cu seed
Si
SiO2
Pt
Deposit
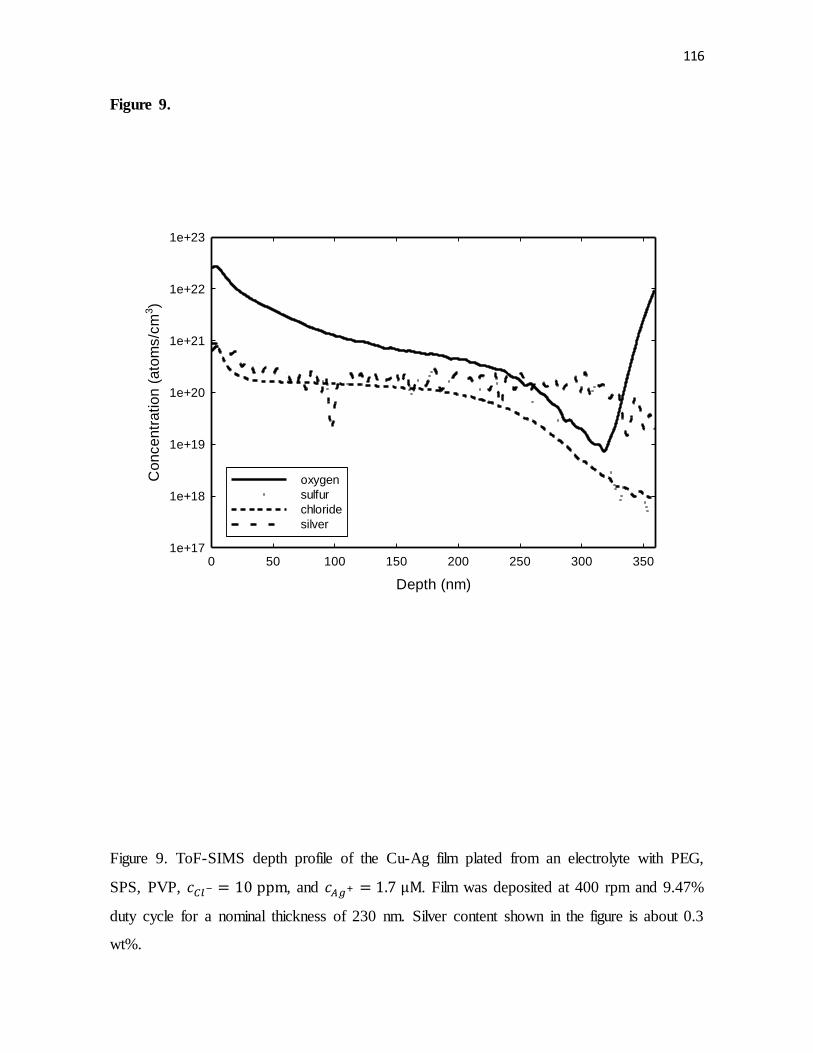
116
Figure 9.
Depth (nm)
0 50 100 150 200 250 300 350
Con
cen
tratio
n (
ato
ms/c
m3)
1e+17
1e+18
1e+19
1e+20
1e+21
1e+22
1e+23
oxygen
sulfur
chloride
silver
Figure 9. ToF-SIMS depth profile of the Cu-Ag film plated from an electrolyte with PEG,
SPS, PVP, , and . Film was deposited at 400 rpm and 9.47%
duty cycle for a nominal thickness of 230 nm. Silver content shown in the figure is about 0.3
wt%.
117
_______________________________________________________________________
* This work was done in collaboration with Xiaoxuan Sun, Greeshma Gadikota, Ping Shi
Chapter 6
Electrodeposition of Copper-Tin Film Alloys for Interconnect
Applications
Abstract
The electrodeposition of copper-tin alloy thin films was studied as a potential
application for on-chip interconnection, where Cu-Sn alloys may be less susceptible to
failure caused by electro- and stress-migration than pure copper. Alloys with variable Sn
content were plated from acidic copper sulfate electrolytes by polarizing copper deposition
into the region where Sn deposition became possible. The effective polarization was
demonstrated by means of several halogen-polyether pairs, with Br-EPE (poly(ethylene
glycol)-block-poly(propylene glycol)-block-poly(ethylene glycol)) pair exhibiting the
strongest polarization. Alloy content of Sn between 0 – 7 at% was obtained above the
reduction potential of Sn2+, which can be attributed to UPD mechanism. Higher Sn content
of up to 20 at% was achieved when Cu deposition was suppressed below the reduction
potential of Sn2+ by the combination of Br- and EPE. A positive correlation between Sn
content and concentration of Sn2+ in the electrolyte was observed. At low rotation speeds of
a disk electrode (i.e. 25 rpm versus 100 rpm) the tin content in the alloy was higher, possibly
due to stronger suppression of copper deposition at low rotation speeds. The relationship
between Sn content and the applied current density was specific to the employed additive
chemistry.
118
Introduction
Resistances to electromigration and stress migration are becoming dominant factors
for enabling miniaturization of modern microelectronic devices.1-3 Present generation
devices utilize electrochemically deposited copper as a preferred material for interconnect
fabrication.4 The resistance of copper to electromigration and stress migration failure can be
improved by alloying a small amount of another metal with copper, such as Sn, Ag, and Co.
2,5,6 The content of the alloying metal needs to be small in order to keep the electrical
resistivity low.7 For the application of Cu-Sn alloys in the interconnect fabrication, a
controlled method for the deposition of Cu-Sn alloys needs to be established.
Acidic copper sulfate electrolytes have been successfully utilized for the on-chip
metallization of copper.8 The filling of surface features by electrodeposition without voids
and with desired material properties is made possible by a combination of certain additives:
suppressor, chloride, accelerator, and leveler.9-13 Suppressors are typically polymers such as
polyethylene glycol (PEG) that polarize Cu deposition in the presence of chloride ions.14-16
The accelerator molecule is almost exclusively bis-(3-sulfopropyl) disulfide (SPS), which
can alleviate suppression caused by the Cl-PEG pair.17-20 The role of a leveling agent, such
as polyvinylpyrrolidone (PVP) and Janus Green B, is to improve surface topography. 9,21
The large difference between the standard reduction potentials of Cu2+ and Sn2+
( ) is a major challenge for electrodepositing Cu-Sn alloys. Although Cu-Sn
deposition has been studied for multiple applications and from various electrolytes, 22-29 the
electrochemical deposition of Cu-Sn alloys specifically for microelectronic applications has
received limited attention. Padhi et al. used acidic copper sulfate electrolytes with
commercial additives to obtain Cu-Sn deposits.23 However, under the activation control
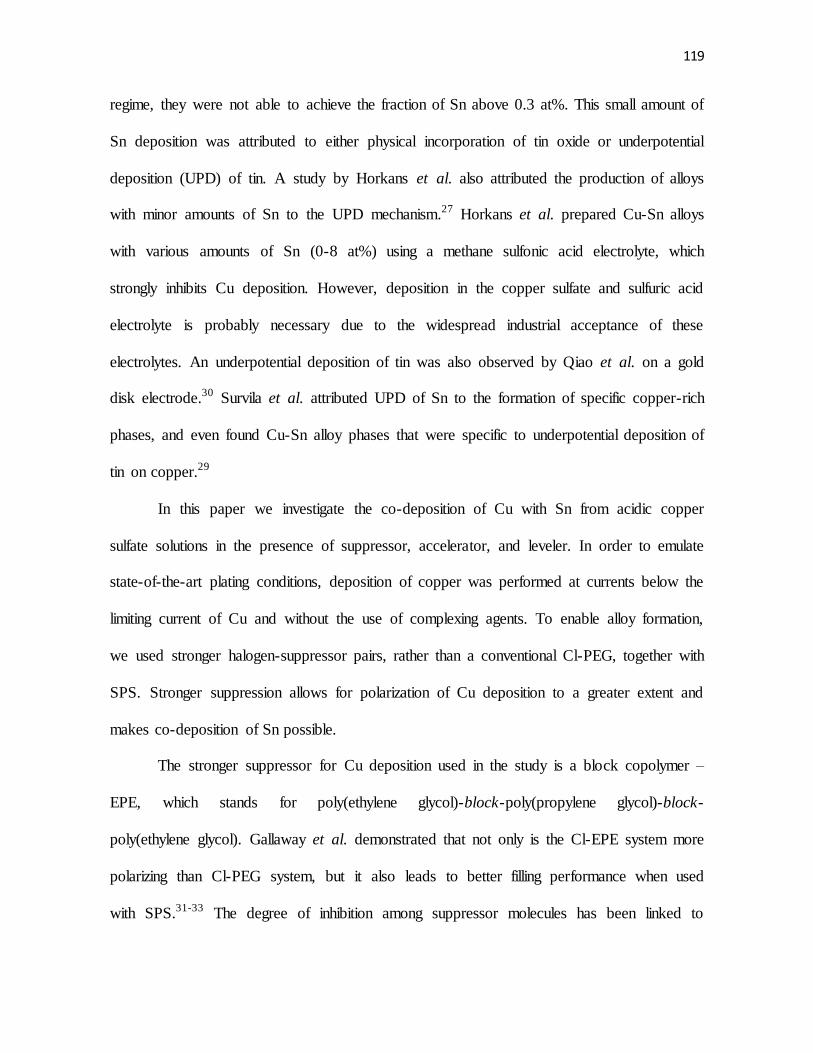
119
regime, they were not able to achieve the fraction of Sn above 0.3 at%. This small amount of
Sn deposition was attributed to either physical incorporation of tin oxide or underpotential
deposition (UPD) of tin. A study by Horkans et al. also attributed the production of alloys
with minor amounts of Sn to the UPD mechanism.27 Horkans et al. prepared Cu-Sn alloys
with various amounts of Sn (0-8 at%) using a methane sulfonic acid electrolyte, which
strongly inhibits Cu deposition. However, deposition in the copper sulfate and sulfuric acid
electrolyte is probably necessary due to the widespread industrial acceptance of these
electrolytes. An underpotential deposition of tin was also observed by Qiao et al. on a gold
disk electrode.30 Survila et al. attributed UPD of Sn to the formation of specific copper-rich
phases, and even found Cu-Sn alloy phases that were specific to underpotential deposition of
tin on copper.29
In this paper we investigate the co-deposition of Cu with Sn from acidic copper
sulfate solutions in the presence of suppressor, accelerator, and leveler. In order to emulate
state-of-the-art plating conditions, deposition of copper was performed at currents below the
limiting current of Cu and without the use of complexing agents. To enable alloy formation,
we used stronger halogen-suppressor pairs, rather than a conventional Cl-PEG, together with
SPS. Stronger suppression allows for polarization of Cu deposition to a greater extent and
makes co-deposition of Sn possible.
The stronger suppressor for Cu deposition used in the study is a block copolymer –
EPE, which stands for poly(ethylene glycol)-block-poly(propylene glycol)-block-
poly(ethylene glycol). Gallaway et al. demonstrated that not only is the Cl-EPE system more
polarizing than Cl-PEG system, but it also leads to better filling performance when used
with SPS.31-33 The degree of inhibition among suppressor molecules has been linked to
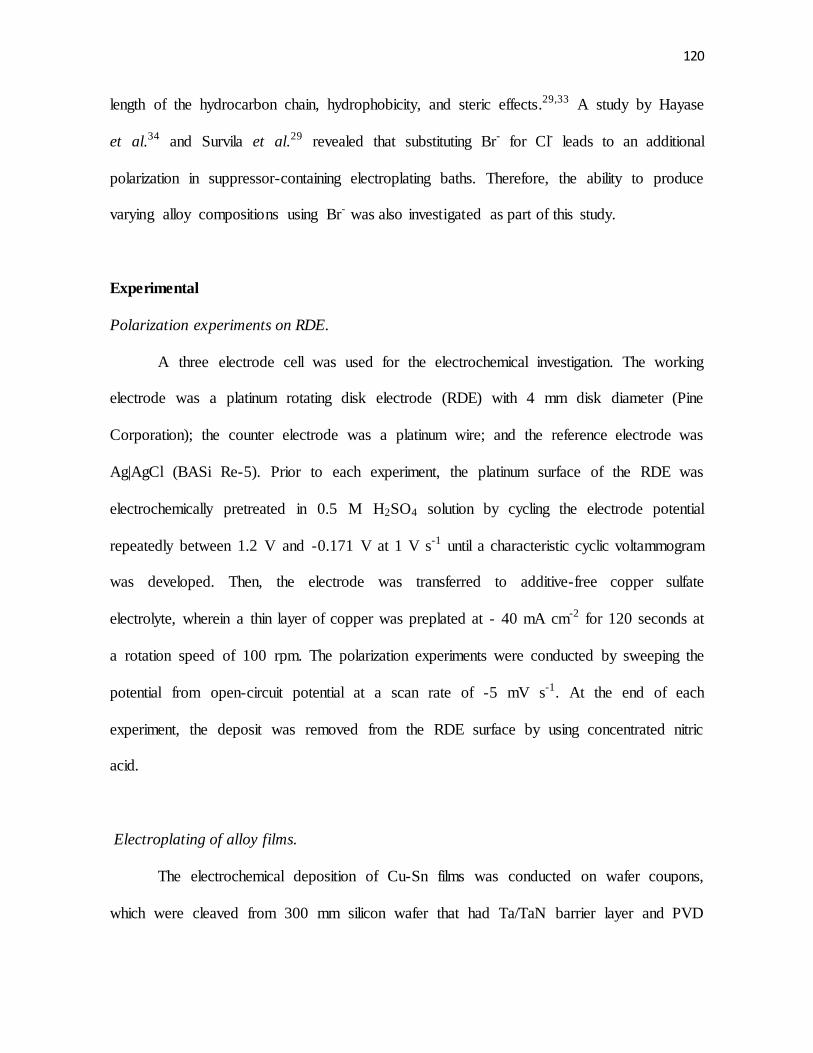
120
length of the hydrocarbon chain, hydrophobicity, and steric effects.29,33 A study by Hayase
et al.34 and Survila et al.29 revealed that substituting Br- for Cl- leads to an additional
polarization in suppressor-containing electroplating baths. Therefore, the ability to produce
varying alloy compositions using Br- was also investigated as part of this study.
Experimental
Polarization experiments on RDE.
A three electrode cell was used for the electrochemical investigation. The working
electrode was a platinum rotating disk electrode (RDE) with 4 mm disk diameter (Pine
Corporation); the counter electrode was a platinum wire; and the reference electrode was
Ag|AgCl (BASi Re-5). Prior to each experiment, the platinum surface of the RDE was
electrochemically pretreated in 0.5 M H2SO4 solution by cycling the electrode potential
repeatedly between 1.2 V and -0.171 V at 1 V s-1 until a characteristic cyclic voltammogram
was developed. Then, the electrode was transferred to additive-free copper sulfate
electrolyte, wherein a thin layer of copper was preplated at - 40 mA cm-2 for 120 seconds at
a rotation speed of 100 rpm. The polarization experiments were conducted by sweeping the
potential from open-circuit potential at a scan rate of -5 mV s-1. At the end of each
experiment, the deposit was removed from the RDE surface by using concentrated nitric
acid.
Electroplating of alloy films.
The electrochemical deposition of Cu-Sn films was conducted on wafer coupons,
which were cleaved from 300 mm silicon wafer that had Ta/TaN barrier layer and PVD
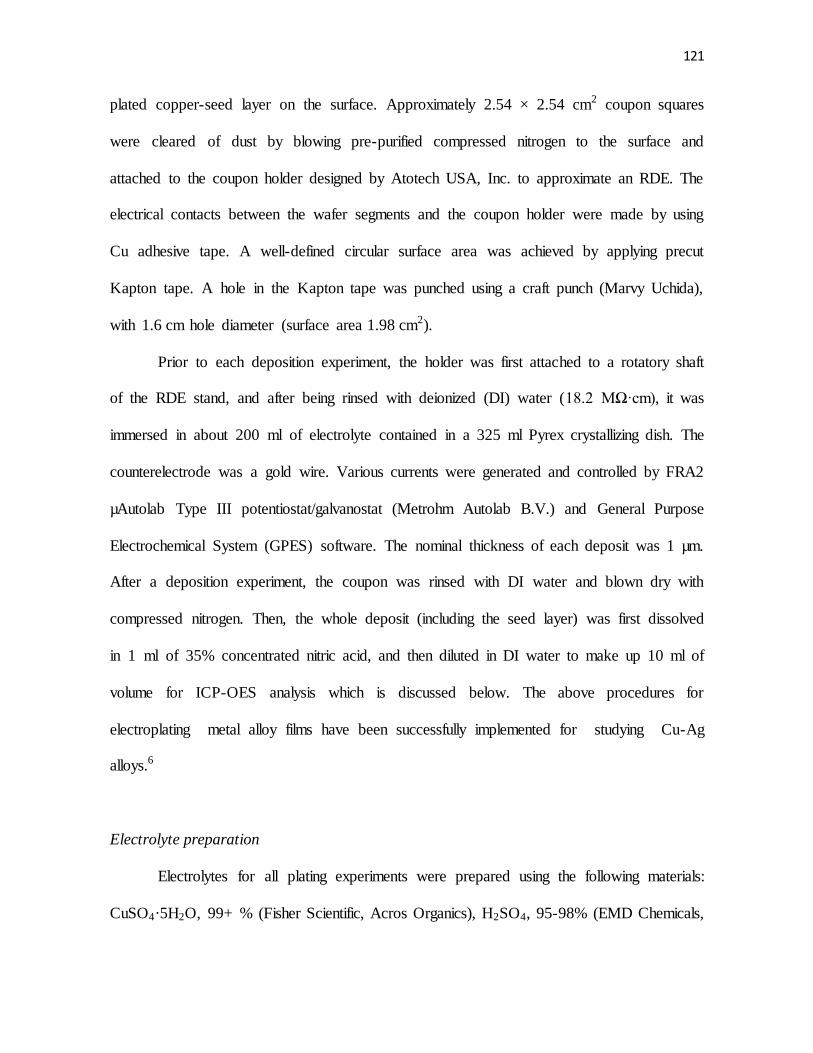
121
plated copper-seed layer on the surface. Approximately 2.54 × 2.54 cm2 coupon squares
were cleared of dust by blowing pre-purified compressed nitrogen to the surface and
attached to the coupon holder designed by Atotech USA, Inc. to approximate an RDE. The
electrical contacts between the wafer segments and the coupon holder were made by using
Cu adhesive tape. A well-defined circular surface area was achieved by applying precut
Kapton tape. A hole in the Kapton tape was punched using a craft punch (Marvy Uchida),
with 1.6 cm hole diameter (surface area 1.98 cm2).
Prior to each deposition experiment, the holder was first attached to a rotatory shaft
of the RDE stand, and after being rinsed with deionized (DI) water (18.2 MΩ·cm), it was
immersed in about 200 ml of electrolyte contained in a 325 ml Pyrex crystallizing dish. The
counterelectrode was a gold wire. Various currents were generated and controlled by FRA2
µAutolab Type III potentiostat/galvanostat (Metrohm Autolab B.V.) and General Purpose
Electrochemical System (GPES) software. The nominal thickness of each deposit was 1 µm.
After a deposition experiment, the coupon was rinsed with DI water and blown dry with
compressed nitrogen. Then, the whole deposit (including the seed layer) was first dissolved
in 1 ml of 35% concentrated nitric acid, and then diluted in DI water to make up 10 ml of
volume for ICP-OES analysis which is discussed below. The above procedures for
electroplating metal alloy films have been successfully implemented for studying Cu-Ag
alloys.6
Electrolyte preparation
Electrolytes for all plating experiments were prepared using the following materials:
CuSO4·5H2O, 99+ % (Fisher Scientific, Acros Organics), H2SO4, 95-98% (EMD Chemicals,
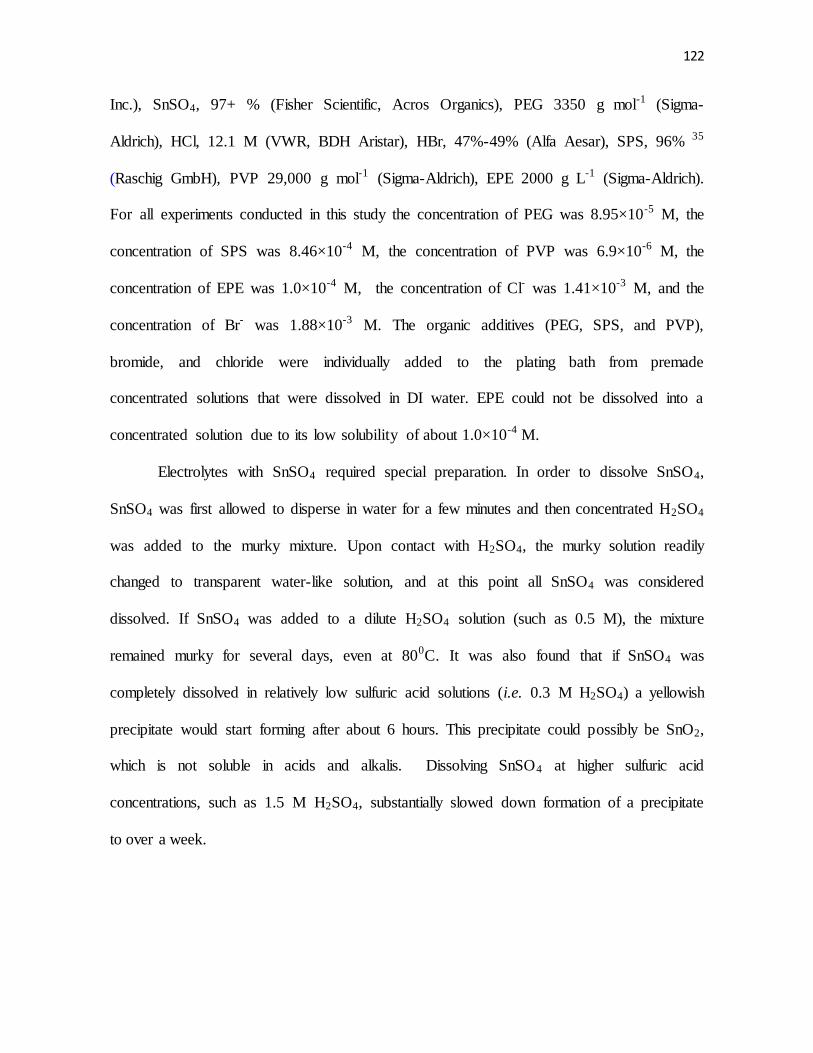
122
Inc.), SnSO4, 97+ % (Fisher Scientific, Acros Organics), PEG 3350 g mol-1 (Sigma-
Aldrich), HCl, 12.1 M (VWR, BDH Aristar), HBr, 47%-49% (Alfa Aesar), SPS, 96% 35
(Raschig GmbH), PVP 29,000 g mol-1 (Sigma-Aldrich), EPE 2000 g L-1 (Sigma-Aldrich).
For all experiments conducted in this study the concentration of PEG was 8.95×10⁻⁵ M, the
concentration of SPS was 8.46×10⁻⁴ M, the concentration of PVP was 6.9×10⁻⁶ M, the
concentration of EPE was 1.0×10⁻⁴ M, the concentration of Cl- was 1.41×10⁻³ M, and the
concentration of Br- was 1.88×10⁻³ M. The organic additives (PEG, SPS, and PVP),
bromide, and chloride were individually added to the plating bath from premade
concentrated solutions that were dissolved in DI water. EPE could not be dissolved into a
concentrated solution due to its low solubility of about 1.0×10⁻⁴ M.
Electrolytes with SnSO4 required special preparation. In order to dissolve SnSO4,
SnSO4 was first allowed to disperse in water for a few minutes and then concentrated H2SO4
was added to the murky mixture. Upon contact with H2SO4, the murky solution readily
changed to transparent water-like solution, and at this point all SnSO4 was considered
dissolved. If SnSO4 was added to a dilute H2SO4 solution (such as 0.5 M), the mixture
remained murky for several days, even at 800C. It was also found that if SnSO4 was
completely dissolved in relatively low sulfuric acid solutions (i.e. 0.3 M H2SO4) a yellowish
precipitate would start forming after about 6 hours. This precipitate could possibly be SnO2,
which is not soluble in acids and alkalis. Dissolving SnSO4 at higher sulfuric acid
concentrations, such as 1.5 M H2SO4, substantially slowed down formation of a precipitate
to over a week.
123
Metrology
Inductively Coupled Plasma – Atomic Emission Spectroscopy, ICP-AES (Horiba
JobinYvon) controlled by ACTIVAnalyst 5.4 software was used to determine the total
amount of tin in the electroplated films. Tin concentrations were quantified by calibrating
the signal intensities with known concentrations of tin. Calibration standards were prepared
using 1000 ppm ICP standard of tin metal in 3% nitric acid (Ricca Chemical Company). The
emission wavelength that was chosen for tin analysis is 242.949 nm.
Results and Discussion
Polarization of Cu and Sn deposition on RDE
In order to electrodeposit Cu-Sn alloys, it is necessary to selectively inhibit Cu
deposition until the onset of Sn deposition. Various combinations of halogen with
suppressor molecules, such as Cl-PEG, Cl-EPE, Br-PEG, and Br-EPE, were found to
polarize the reduction of copper to a varying degree, with Br-EPE couple being the most
suppressing (Figure 1). The polarization characteristics of these additive systems were
substantially influenced by the concentrations of copper sulfate and sulfuric acid in the
electrolyte. As shown in Figure 1, it was possible to increase the polarization of Cu2+
reduction by about 70 mV when 0.63 M of Cu2+ and 0.31 M of H2SO4 were substituted with
0.31 M Cu2+ and 150 1.53 M of H2SO4. Also, selection of a halogen molecule had a large
effect on the polarization of copper deposition. It was found that when 1.41×10⁻³ M of Cl-
was replaced with 1.88×10⁻³ M of Br- ions, the polarization of Cu2+ reduction increased by
an additional 150 mV.
124
For the successful filling of sub-micron features, it is necessary to add an accelerator
component, such as SPS, to a chloride-suppressor system [10,36]. Figure 2 shows the
change in polarization of copper deposition when SPS is added to the four different halogen-
suppressor systems: Cl-PEG, Cl-EPE, Br-PEG, and Br-EPE. In the presence of Cl- ions, SPS
depolarizes suppression in Cl-PEG and Cl-EPE systems by about 100 mV and 150 mV,
respectively. However, in the presence of Br- ions, SPS has a much smaller depolarizing
effect on Br-PEG system and little to no effect on polarization by Br-EPE.
The polarization curves shown in Figure 3 reveal that in the absence of additives the
reduction of Sn2+ begins at a potential of about -0.47 V vs. Ag|AgCl when = 84.3 mM
and at about -0.5 V vs. Ag|AgCl when = 8.43 mM. This dependence on concentration
is expected from the Nernst equation (Eqn. 1). Both curves reach a diffusion limited plateau
at more negative potentials. Figure 3 also shows the impact of additives on polarization of
tin deposition. As can be seen from the inset to Figure 3, Cl-EPE and Br-EPE do not seem to
have a significant impact on the onset of tin reduction. However, the rate of reduction of
Sn2+ is substantially hindered by these additives. Small cathodic currents seen at potentials
higher than the reduction of Sn2+ could in part be due to UPD mechanism, as well as
reductions of Sn4+ (Reaction 2) and/or dissolved oxygen. Although Sn4+ was not added to
the electrolyte, it could be present via oxidation of Sn2+ ions by dissolved oxygen (Reaction
3). Since for Reaction 3 is positive, reaction will proceed spontaneously in the forward
direction. The presence of Sn4+ ions could also potentially explain the appearance of
precipitate in dilute sulfuric acid solutions (see experimental section).
( ) (1)
(2)
125
(3)
A study by Padhi et al. demonstrated that the addition of SnSO4 to the additive-free
copper electrolyte did not change the polarization behavior of Cu2+ deposition [23]. To
measure the impact of SnSO4 on the polarization of Cu2+ reduction in the presence of
additives, linear sweep experiments were performed. Figure 4 shows that the polarization of
Cu2+ reduction by Cl-PEG, Br-PEG, Cl-EPE, and Br-EPE was also almost unaffected in the
presence of Sn2+ at 84.3 mM.
Co-deposition of Cu-Sn thin films
The co-deposition of Cu-Sn alloys was attempted utilizing a number of halogen-
suppressor combinations. The atomic fraction of Sn in a Cu-Sn alloy was computed by
dividing the molar concentration of Sn measured from ICP by the total number of moles
deposited according to the Faraday’s law (Eqn. 4).
(
)
(4)
In equation 2, numerator is the concentration of Sn measured by ICP-AES, i is
current density, A is the electrode surface area, n is the number of electrons transferred per
ion in reaction, t the deposition time, and F is the Faraday’s constant.
Based on Figures 2 and 3, only the Br-EPE pair polarized copper deposition enough
to reach the deposition potential of Sn2+. However, the co-deposition of Cu-Sn alloys with
substantial Sn contents were obtained using a variety of different halogen-suppressor pairs
possibly due to the existence of UPD of Sn.27,30 Tin was not detected in the alloy when the
electrolyte contained Cl-EPE-SPS (which polarized Cu2+ deposition by only about 0.2 V)
126
and 84.3 mM of Sn2+ ions. However, the deposition of Cu-Sn from a bath containing Cl-
PEG couple (which polarized Cu2+ deposition by about 0.25 V at higher current densities)
showed already a detectible but small incorporation of 0.06 at% Sn at 100 rpm and current
densities up to -22 mA cm-2. Decreasing the rotation speed from 100 rpm to 25 rpm in Cl-
PEG system increased Sn content to 0.48 at%. This effect can possibly be attributed to
stronger suppression rate of Cu2+ reduction by halogen-suppressor pairs at lower rotation
speeds, as was both noted by Survila et al.29 and observed in our experiments (not shown).
When Cu deposition becomes more polarized, electrode potential shifts to negative and
allows for higher rate of Sn deposition.
The Cl-EPE system polarized copper deposition more than Cl-SPS-EPE and Cl-PEG
systems by about 0.3 V. The deposition of Cu-Sn alloy from a Cl-EPE-containing electrolyte
at different current densities and revealed that a substantial Sn content of over 6 at%
could be achieved. Figure 5 shows that Sn composition in the alloy increased linearly with
an increase in current density at three different . There was a positive correlation
between Sn content in the alloy and the ionic concentration of Sn2+ in the Cl-EPE
electrolyte. Figure 6 shows the effect of rotation speed on the Sn content. Analogous to Cl-
EPE system, at low rotation speeds Sn contents were higher.
Figure 7 shows time variation of electrode potential under various current densities
during coupon plating in the electrolyte containing Cl-EPE additive system and 84.3 mM of
Sn2+. Graphed potentials were corrected for ohmic drop according to Newman’s treatment of
primary current distribution on an RDE.37 Electrode potentials became more negative with
increasing current densities, approaching reduction potential of tin in the highest current
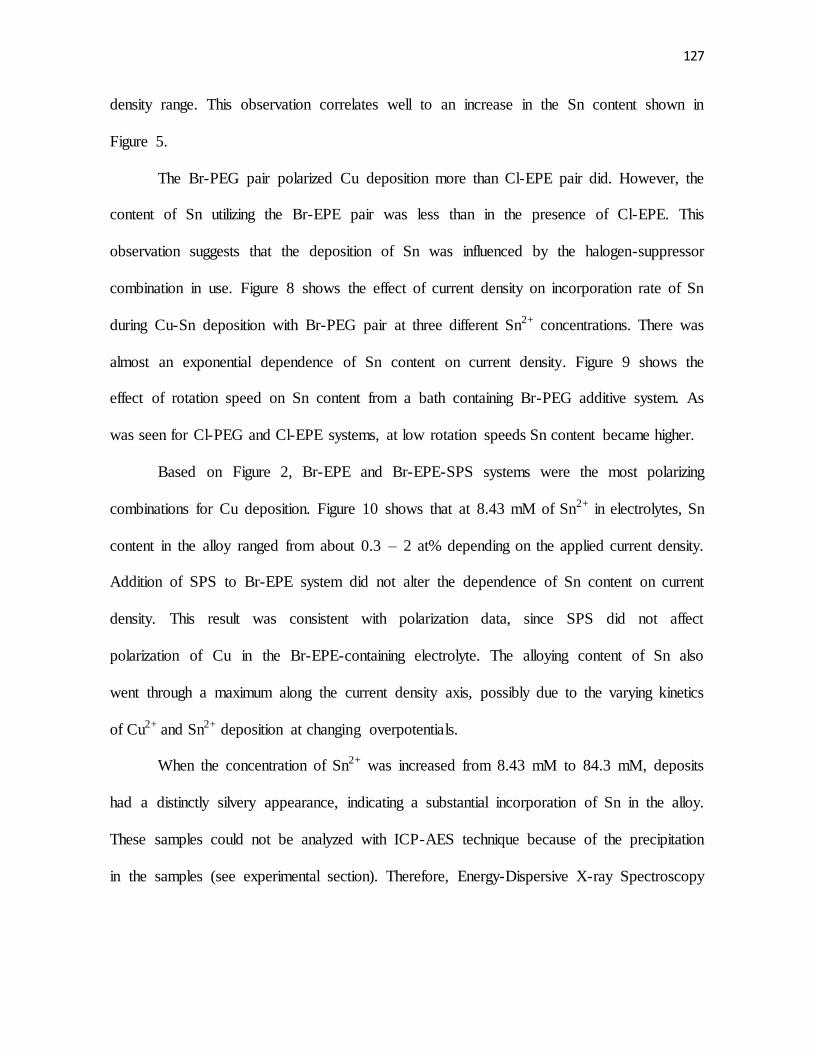
127
density range. This observation correlates well to an increase in the Sn content shown in
Figure 5.
The Br-PEG pair polarized Cu deposition more than Cl-EPE pair did. However, the
content of Sn utilizing the Br-EPE pair was less than in the presence of Cl-EPE. This
observation suggests that the deposition of Sn was influenced by the halogen-suppressor
combination in use. Figure 8 shows the effect of current density on incorporation rate of Sn
during Cu-Sn deposition with Br-PEG pair at three different Sn2+ concentrations. There was
almost an exponential dependence of Sn content on current density. Figure 9 shows the
effect of rotation speed on Sn content from a bath containing Br-PEG additive system. As
was seen for Cl-PEG and Cl-EPE systems, at low rotation speeds Sn content became higher.
Based on Figure 2, Br-EPE and Br-EPE-SPS systems were the most polarizing
combinations for Cu deposition. Figure 10 shows that at 8.43 mM of Sn2+ in electrolytes, Sn
content in the alloy ranged from about 0.3 – 2 at% depending on the applied current density.
Addition of SPS to Br-EPE system did not alter the dependence of Sn content on current
density. This result was consistent with polarization data, since SPS did not affect
polarization of Cu in the Br-EPE-containing electrolyte. The alloying content of Sn also
went through a maximum along the current density axis, possibly due to the varying kinetics
of Cu2+ and Sn2+ deposition at changing overpotentials.
When the concentration of Sn2+ was increased from 8.43 mM to 84.3 mM, deposits
had a distinctly silvery appearance, indicating a substantial incorporation of Sn in the alloy.
These samples could not be analyzed with ICP-AES technique because of the precipitation
in the samples (see experimental section). Therefore, Energy-Dispersive X-ray Spectroscopy
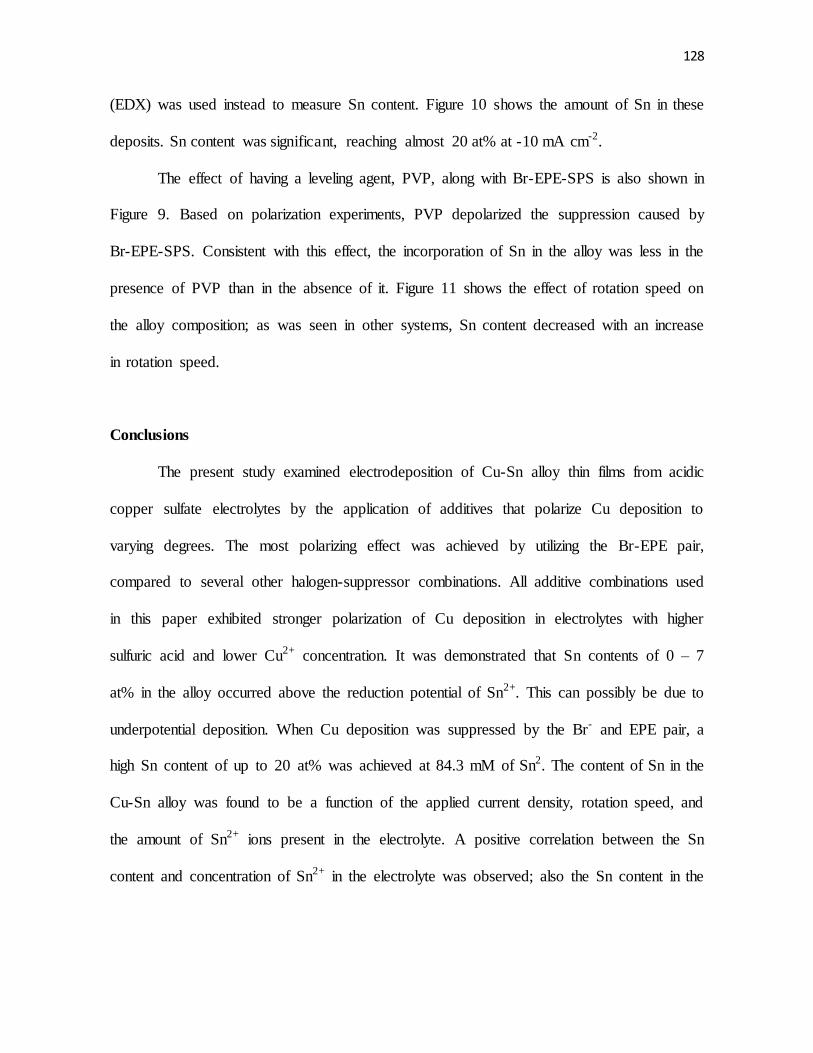
128
(EDX) was used instead to measure Sn content. Figure 10 shows the amount of Sn in these
deposits. Sn content was significant, reaching almost 20 at% at -10 mA cm-2.
The effect of having a leveling agent, PVP, along with Br-EPE-SPS is also shown in
Figure 9. Based on polarization experiments, PVP depolarized the suppression caused by
Br-EPE-SPS. Consistent with this effect, the incorporation of Sn in the alloy was less in the
presence of PVP than in the absence of it. Figure 11 shows the effect of rotation speed on
the alloy composition; as was seen in other systems, Sn content decreased with an increase
in rotation speed.
Conclusions
The present study examined electrodeposition of Cu-Sn alloy thin films from acidic
copper sulfate electrolytes by the application of additives that polarize Cu deposition to
varying degrees. The most polarizing effect was achieved by utilizing the Br-EPE pair,
compared to several other halogen-suppressor combinations. All additive combinations used
in this paper exhibited stronger polarization of Cu deposition in electrolytes with higher
sulfuric acid and lower Cu2+ concentration. It was demonstrated that Sn contents of 0 – 7
at% in the alloy occurred above the reduction potential of Sn2+. This can possibly be due to
underpotential deposition. When Cu deposition was suppressed by the Br- and EPE pair, a
high Sn content of up to 20 at% was achieved at 84.3 mM of Sn2. The content of Sn in the
Cu-Sn alloy was found to be a function of the applied current density, rotation speed, and
the amount of Sn2+ ions present in the electrolyte. A positive correlation between the Sn
content and concentration of Sn2+ in the electrolyte was observed; also the Sn content in the
129
alloy was higher at lower rotation speeds. The relationship between the Sn content and the
applied current density was specific to the utilized additive combination.
References
1. C. M. Tan, Electromigration in ULSI Interconnections, World Scientific Publishing
Company, 2012.
2. C.-K. Hu, M. Angyal, B. C. Baker, G. Bonilla, C. Cabral, D. F. Canaperi, S. Choi,L.
Clevenger, D. Edelstein, L. Gignac, E. Huang, J. Kelly, B. Y. Kim, V. Kyei-
Fordjour, S. L. Manikonda, J. Maniscalco, S. Mittal, T. Nogami, C. Parks, R.
Rosenberg, A. Simon, Y. Xu, T. A. Vo, C. Witt, in E. Zschech, P. S. Ho, S. Ogawa
(Editors), Stress-Induced Phenomena in Metallization: 11th International Workshop,
2010, p. 57.
3. A. Heryanto, K. L. Pey, Y. K. Lim, W. Liu, N. Raghavan, J. Wei, C. L. Gan, M. K.
Lim, Tan, J. B., J. App. Phys. 109 (2011) 9.
4. International Technology Roadmap for Semiconductors, Interconnect Chapter
(2009).
5. C. K. Hu, B. Luther, F. B. Kaufman, J. Hummel, C. Uzoh, D. J. Pearson, Thin Solid
Films 262 (1995) 84.
6. I. Volov, E. Swanson, B. O’Brien, K. Dunn, A. C. West, J. Electrochem. Soc. 159
(2012) D677.
7. S. Strehle, J. W. Bartha, K. Wetzig, Thin Solid Films 517 (2009) 3320.
8. P. C. Andricacos, C. Uzoh, J. O. Dukovic, J. Horkans, H. Deligianni, IBM J. Res. &
Dev. 42 (1998) 567.
130
9. J. J. Kelly, C. Tian, A. C. West, J. Electrochem. Soc. 146 (1999) 2540.
10. T. P. Moffat, D. Wheeler, S. K. Kim, D. Josell, Electrochim. Acta 53 (2007) 145.
11. T. P. Moffat, D. Wheeler, D. Josell, J. Electrochem. Soc. 151 (2004) C262.
12. K. Kondo, N. Yamakawa, Z. Tanaka, K. Hayashi, J. Electroanal. Chem. 559 (2003)
137.
13. I. Volov, T. Saito, A. C. West, J. Electrochem. Soc. 158 (2011) D384.
14. J. P. Healy, D. Pletcher, M. Goodenough, J. Electroanal. Chem. 338 (1992) 155.
15. J. J. Kelly, A. C. West, J. Electrochem. Soc. 145 (1998) 3477.
16. J. J. Kelly, A. C. West, J. Electrochem. Soc. 145 (1998) 3472.
17. M. Tan, J. N. Harb, J. Electrochem. Soc. 150 (2003) C420.
18. J. J. Kim, S.-K. Kim, Y. S. Kim, J. Electroanal. Chem. 542 (2003) 61.
19. I. Volov, O. Mann, Y. Hoenersch, B. Wahl, A. C. West, J. Sep. Sci. 34 (2011) 2385.
20. I. Volov, A. C. West, J. Electrochem. Soc. 158 (2011) D456.
21. M. J. Willey, J. Reid, A. C. West, Electrochem. and S.-S. Lett. 10 (2007) D38.
22. G. I. Medvedev, N. A. Makrushin, O. V. Ivanova, Russ. J. App. Chem. 77 (2004)
1104.
23. D. Padhi, S. Gandikota, H. B. Nguyen, C. McGuirk, S. Ramanathan, J. Yahalom, G.
Dixit, Electrochim. Acta 48 (2003) 935.
24. A. Survila, Z. Mockus, S. Kanapeckate, V. Jasulaitiene, R. Juekenas, Electrochim.
Acta 52 (2007) 3067.
25. O. Galdikiené, Z. Mockus, J. App. Electrochem. 24 (1994) 1009.
26. S. D. Beattie, J. R. Dahn, J. Electrochem. Soc. 150 (2003) A894.
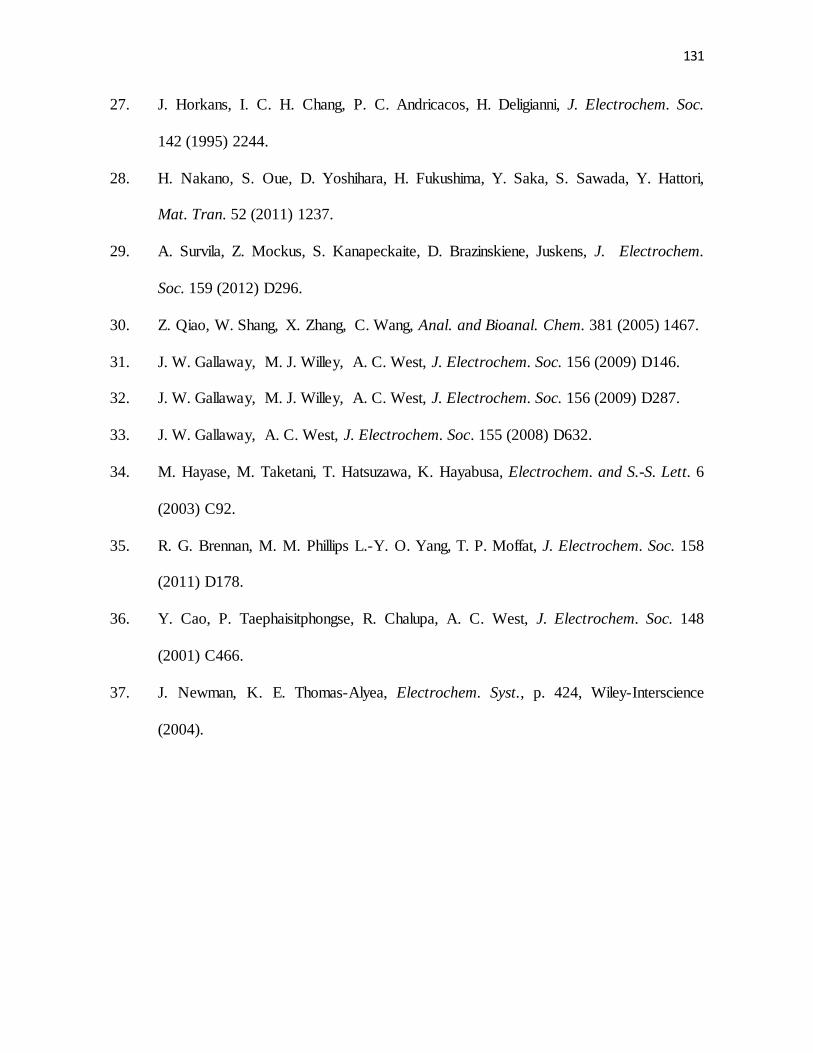
131
27. J. Horkans, I. C. H. Chang, P. C. Andricacos, H. Deligianni, J. Electrochem. Soc.
142 (1995) 2244.
28. H. Nakano, S. Oue, D. Yoshihara, H. Fukushima, Y. Saka, S. Sawada, Y. Hattori,
Mat. Tran. 52 (2011) 1237.
29. A. Survila, Z. Mockus, S. Kanapeckaite, D. Brazinskiene, Juskens, J. Electrochem.
Soc. 159 (2012) D296.
30. Z. Qiao, W. Shang, X. Zhang, C. Wang, Anal. and Bioanal. Chem. 381 (2005) 1467.
31. J. W. Gallaway, M. J. Willey, A. C. West, J. Electrochem. Soc. 156 (2009) D146.
32. J. W. Gallaway, M. J. Willey, A. C. West, J. Electrochem. Soc. 156 (2009) D287.
33. J. W. Gallaway, A. C. West, J. Electrochem. Soc. 155 (2008) D632.
34. M. Hayase, M. Taketani, T. Hatsuzawa, K. Hayabusa, Electrochem. and S.-S. Lett. 6
(2003) C92.
35. R. G. Brennan, M. M. Phillips L.-Y. O. Yang, T. P. Moffat, J. Electrochem. Soc. 158
(2011) D178.
36. Y. Cao, P. Taephaisitphongse, R. Chalupa, A. C. West, J. Electrochem. Soc. 148
(2001) C466.
37. J. Newman, K. E. Thomas-Alyea, Electrochem. Syst., p. 424, Wiley-Interscience
(2004).
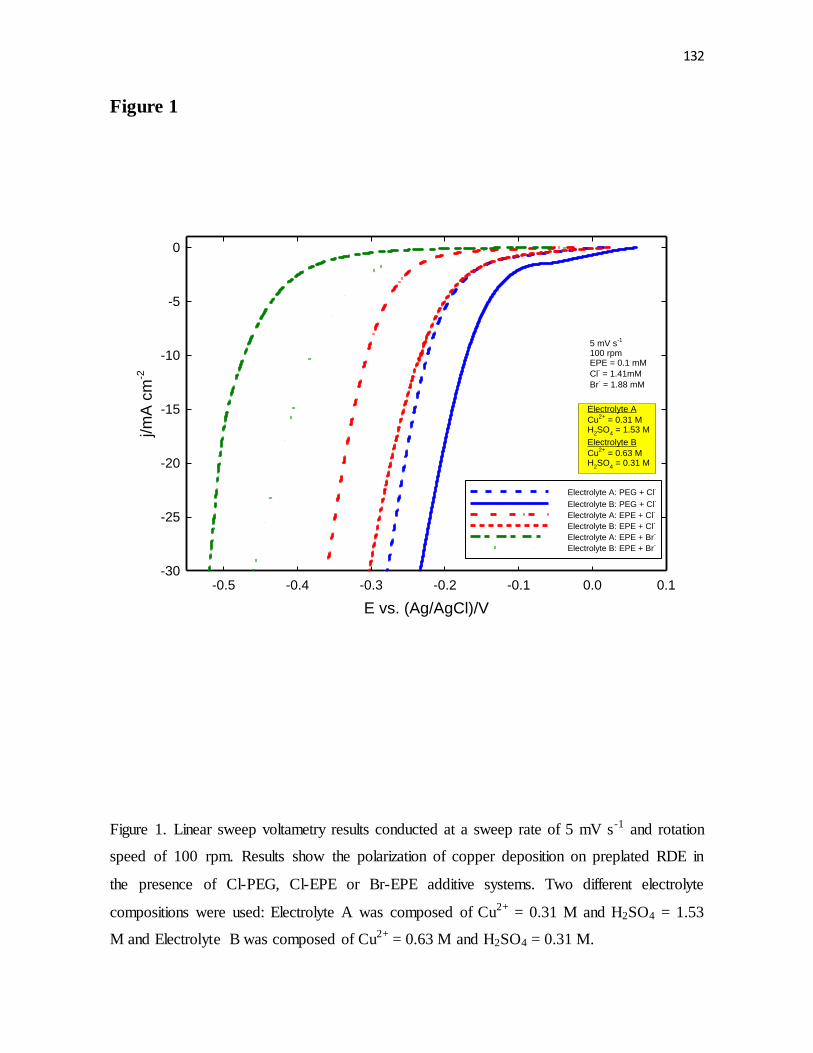
132
Figure 1
E vs. (Ag/AgCl)/V
-0.5 -0.4 -0.3 -0.2 -0.1 0.0 0.1
j/m
A c
m-2
-30
-25
-20
-15
-10
-5
0
Electrolyte A: PEG + Cl-
Electrolyte B: PEG + Cl-
Electrolyte A: EPE + Cl-
Electrolyte B: EPE + Cl-
Electrolyte A: EPE + Br-
Electrolyte B: EPE + Br-
5 mV s-1
100 rpmEPE = 0.1 mM
Cl- = 1.41mM
Br- = 1.88 mM
Electrolyte A
Cu2+
= 0.31 MH
2SO
4 = 1.53 M
Electrolyte B
Cu2+
= 0.63 MH
2SO
4 = 0.31 M
Figure 1. Linear sweep voltametry results conducted at a sweep rate of 5 mV s-1 and rotation
speed of 100 rpm. Results show the polarization of copper deposition on preplated RDE in
the presence of Cl-PEG, Cl-EPE or Br-EPE additive systems. Two different electrolyte
compositions were used: Electrolyte A was composed of Cu2+ = 0.31 M and H2SO4 = 1.53
M and Electrolyte B was composed of Cu2+ = 0.63 M and H2SO4 = 0.31 M.
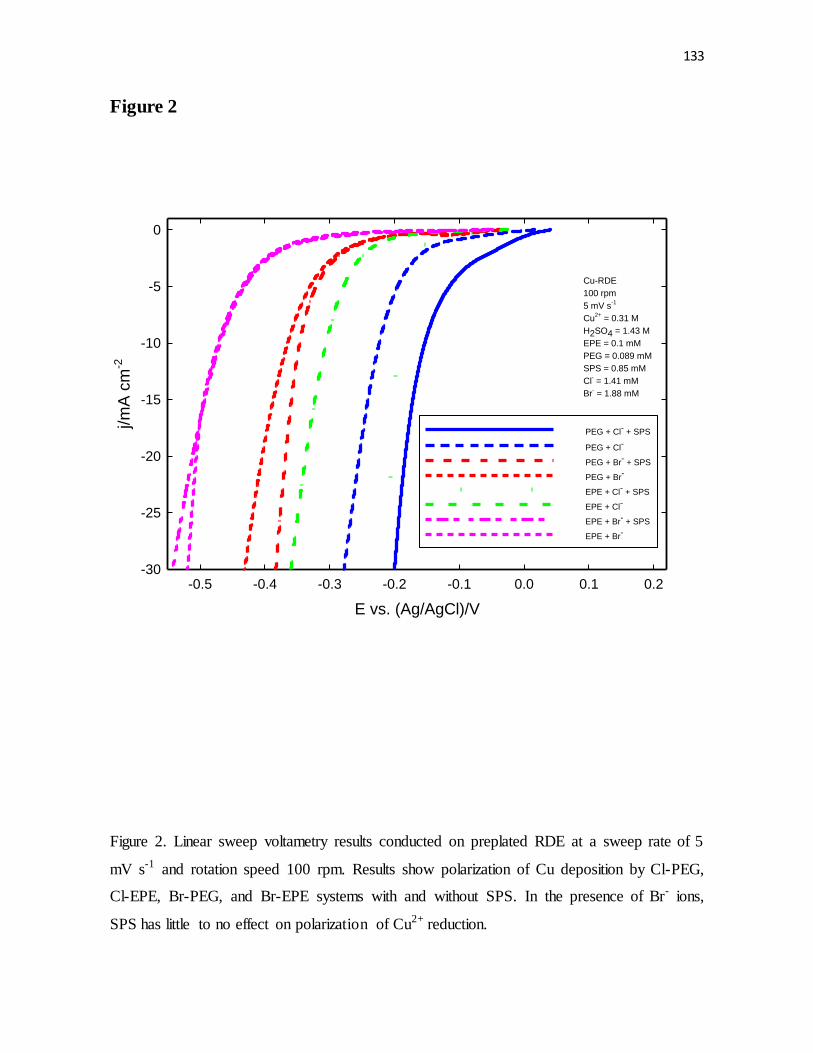
133
Figure 2
E vs. (Ag/AgCl)/V
-0.5 -0.4 -0.3 -0.2 -0.1 0.0 0.1 0.2
j/m
A c
m-2
-30
-25
-20
-15
-10
-5
0
PEG + Cl- + SPS
PEG + Cl-
PEG + Br- + SPS
PEG + Br-
EPE + Cl- + SPS
EPE + Cl-
EPE + Br- + SPS
EPE + Br-
Cu-RDE
100 rpm
5 mV s-1
Cu2+
= 0.31 M
H2SO4 = 1.43 M
EPE = 0.1 mM
PEG = 0.089 mM
SPS = 0.85 mM
Cl- = 1.41 mM
Br- = 1.88 mM
Figure 2. Linear sweep voltametry results conducted on preplated RDE at a sweep rate of 5
mV s-1 and rotation speed 100 rpm. Results show polarization of Cu deposition by Cl-PEG,
Cl-EPE, Br-PEG, and Br-EPE systems with and without SPS. In the presence of Br- ions,
SPS has little to no effect on polarization of Cu2+ reduction.
134
Figure 3
E vs. (Ag/AgCl)/V
-0.6 -0.5 -0.4 -0.3 -0.2 -0.1
j/m
A c
m-2
-30
-25
-20
-15
-10
-5
0
Sn2+
= 84.3 mM
Cl-, EPE, Sn
2+ = 84.3 mM
Sn2+
= 8.43 mM
Br-, EPE, Sn
2+ = 8.43 mM
Cu-RDE
5 mV s-1
100 rpmH2SO4 = 1.53 M
EPE = 0.1 mM
Br- = 1.88 mM
Cl- = 1.41 mM
-0.6 -0.5 -0.4 -0.3 -0.2 -0.1-0.6
-0.5
-0.4
-0.3
-0.2
-0.1
0.0
Figure 3. Linear sweep voltametry results conducted on preplated RDE at a sweep rate of 5
mV s-1 and rotation speed of 100 rpm. Experiments show the onset of Sn deposition and the
influence of additives on polarization of Sn2+ deposition.
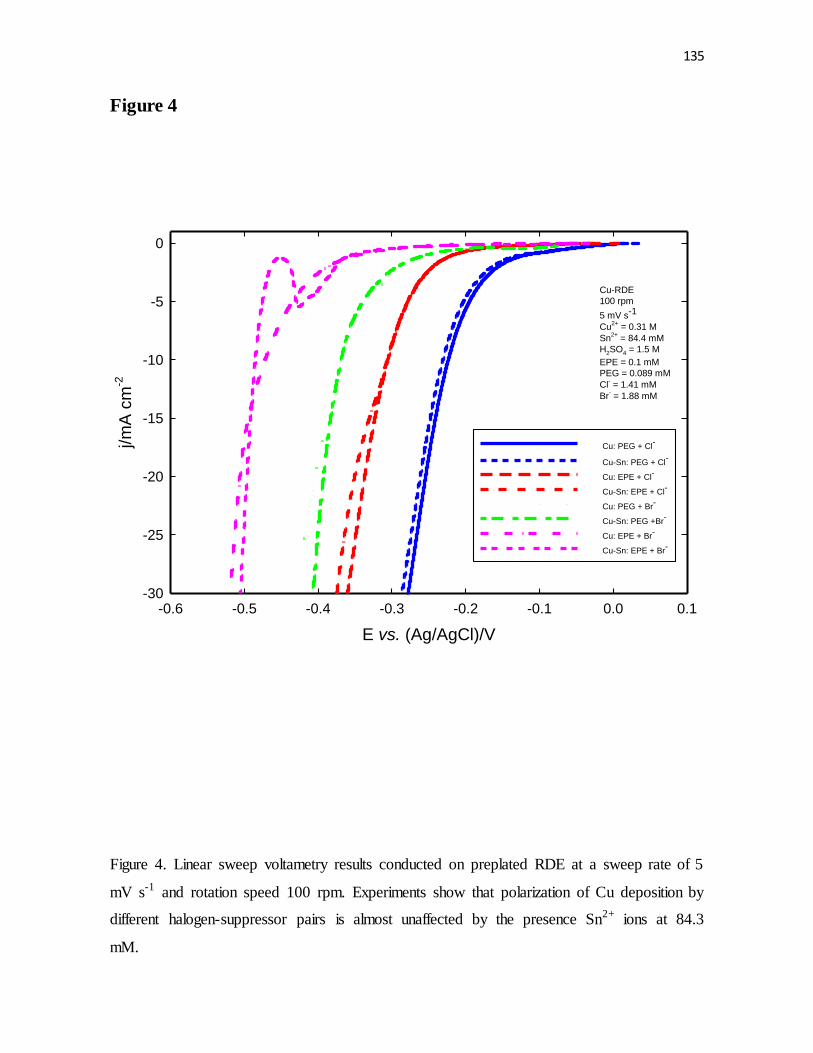
135
Figure 4
E vs. (Ag/AgCl)/V
-0.6 -0.5 -0.4 -0.3 -0.2 -0.1 0.0 0.1
j/m
A c
m-2
-30
-25
-20
-15
-10
-5
0
Cu: PEG + Cl-
Cu-Sn: PEG + Cl-
Cu: EPE + Cl-
Cu-Sn: EPE + Cl-
Cu: PEG + Br-
Cu-Sn: PEG +Br-
Cu: EPE + Br-
Cu-Sn: EPE + Br-
Cu-RDE
100 rpm
5 mV s-1
Cu2+
= 0.31 M
Sn2+
= 84.4 mM
H2SO4 = 1.5 M
EPE = 0.1 mM
PEG = 0.089 mM
Cl- = 1.41 mM
Br- = 1.88 mM
Figure 4. Linear sweep voltametry results conducted on preplated RDE at a sweep rate of 5
mV s-1 and rotation speed 100 rpm. Experiments show that polarization of Cu deposition by
different halogen-suppressor pairs is almost unaffected by the presence Sn2+ ions at 84.3
mM.
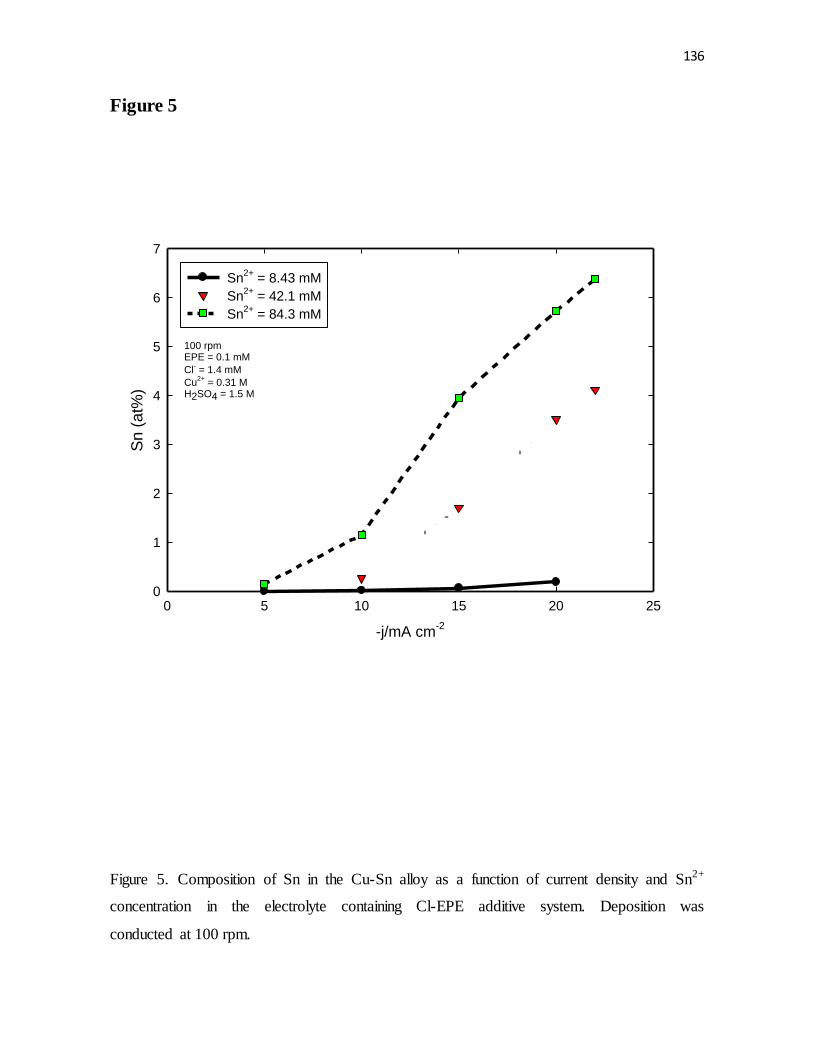
136
Figure 5
-j/mA cm-2
0 5 10 15 20 25
Sn (
at%
)
0
1
2
3
4
5
6
7
Sn2+
= 8.43 mM
Sn2+
= 42.1 mM
Sn2+
= 84.3 mM
100 rpmEPE = 0.1 mM
Cl- = 1.4 mM
Cu2+
= 0.31 MH2SO4 = 1.5 M
Figure 5. Composition of Sn in the Cu-Sn alloy as a function of current density and Sn2+
concentration in the electrolyte containing Cl-EPE additive system. Deposition was
conducted at 100 rpm.
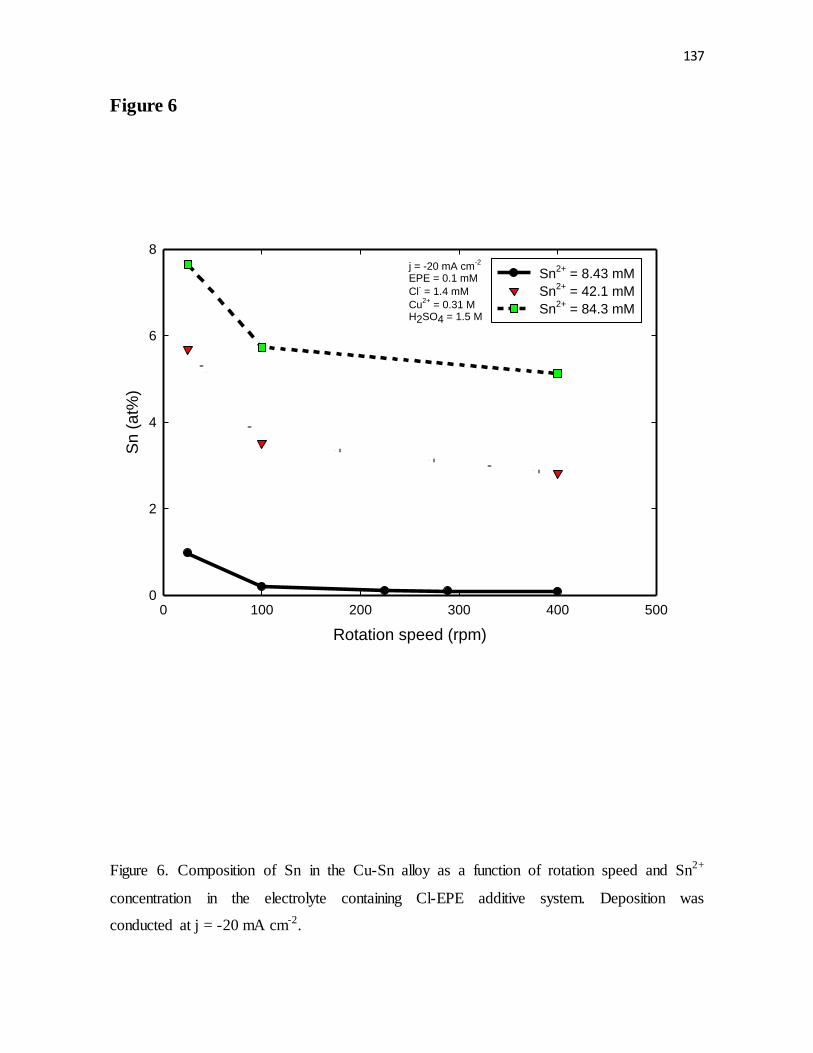
137
Figure 6
Rotation speed (rpm)
0 100 200 300 400 500
Sn
(a
t%)
0
2
4
6
8
Sn2+
= 8.43 mM
Sn2+
= 42.1 mM
Sn2+
= 84.3 mM
j = -20 mA cm-2
EPE = 0.1 mM
Cl- = 1.4 mM
Cu2+
= 0.31 MH2SO4 = 1.5 M
Figure 6. Composition of Sn in the Cu-Sn alloy as a function of rotation speed and Sn2+
concentration in the electrolyte containing Cl-EPE additive system. Deposition was
conducted at j = -20 mA cm-2.
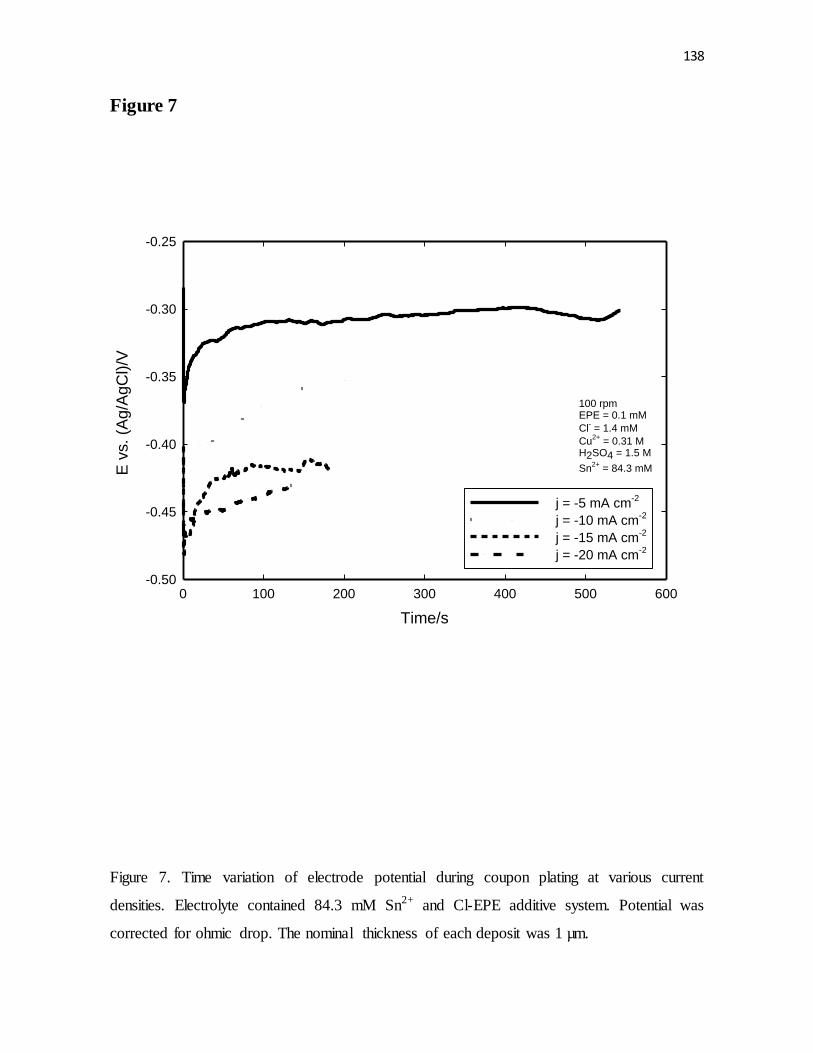
138
Figure 7
Time/s
0 100 200 300 400 500 600-0.50
-0.45
-0.40
-0.35
-0.30
-0.25
j = -5 mA cm-2
j = -10 mA cm-2
j = -15 mA cm-2
j = -20 mA cm-2
E v
s.
(Ag
/Ag
Cl)/V
100 rpmEPE = 0.1 mM
Cl- = 1.4 mM
Cu2+
= 0.31 MH2SO4 = 1.5 M
Sn2+
= 84.3 mM
Figure 7. Time variation of electrode potential during coupon plating at various current
densities. Electrolyte contained 84.3 mM Sn2+ and Cl-EPE additive system. Potential was
corrected for ohmic drop. The nominal thickness of each deposit was 1 µm.
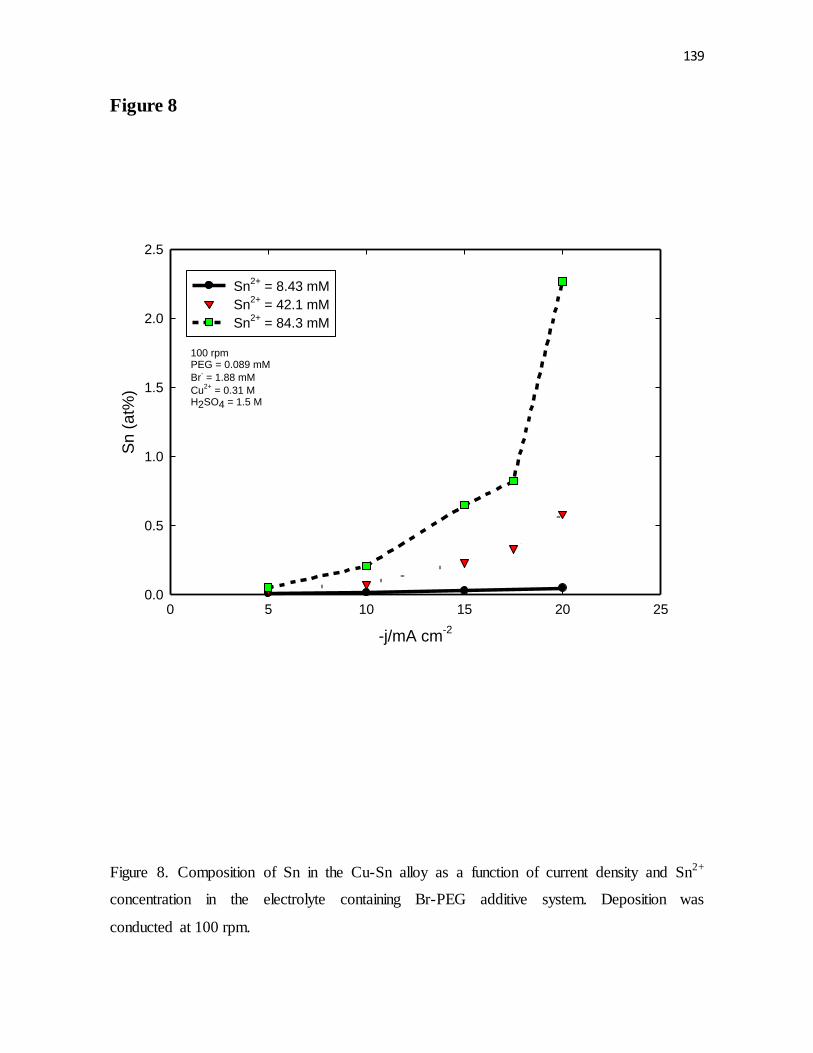
139
Figure 8
-j/mA cm-2
0 5 10 15 20 25
Sn
(a
t%)
0.0
0.5
1.0
1.5
2.0
2.5
Sn2+
= 8.43 mM
Sn2+
= 42.1 mM
Sn2+
= 84.3 mM
100 rpmPEG = 0.089 mM
Br- = 1.88 mM
Cu2+
= 0.31 MH2SO4 = 1.5 M
Figure 8. Composition of Sn in the Cu-Sn alloy as a function of current density and Sn2+
concentration in the electrolyte containing Br-PEG additive system. Deposition was
conducted at 100 rpm.
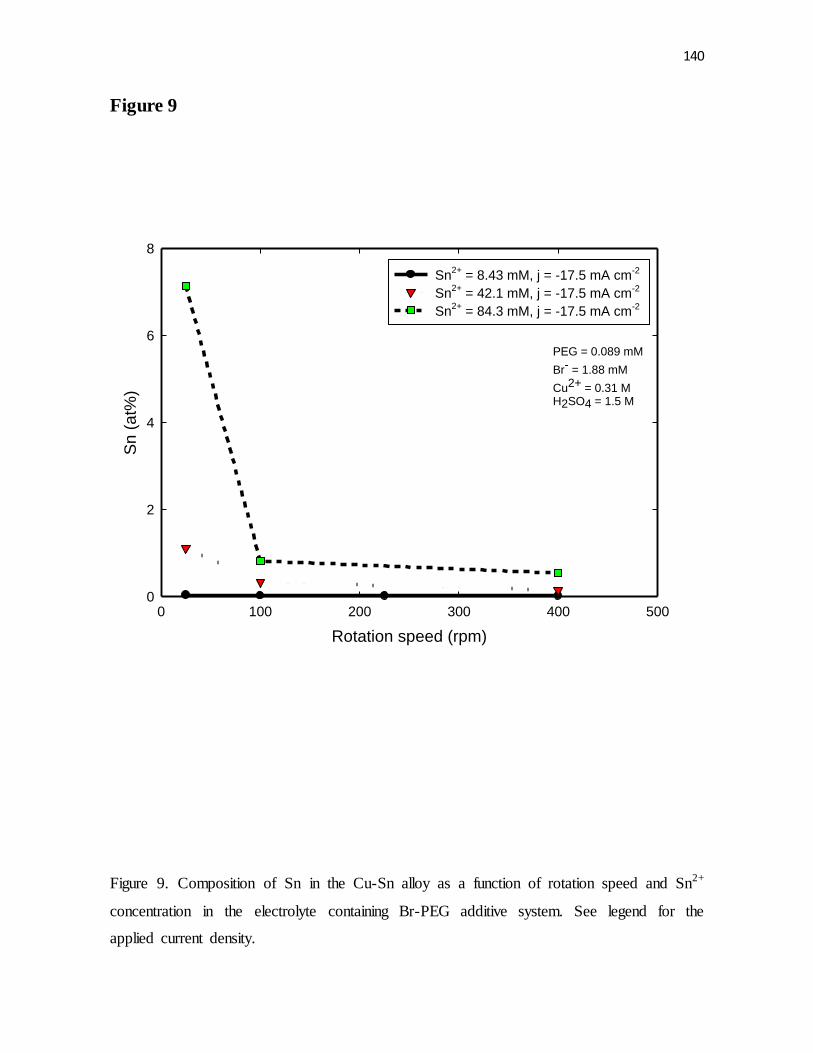
140
Figure 9
Rotation speed (rpm)
0 100 200 300 400 500
Sn
(a
t%)
0
2
4
6
8
Sn2+
= 8.43 mM, j = -17.5 mA cm-2
Sn2+
= 42.1 mM, j = -17.5 mA cm-2
Sn2+
= 84.3 mM, j = -17.5 mA cm-2
PEG = 0.089 mM
Br- = 1.88 mM
Cu2+ = 0.31 MH2SO4 = 1.5 M
Figure 9. Composition of Sn in the Cu-Sn alloy as a function of rotation speed and Sn2+
concentration in the electrolyte containing Br-PEG additive system. See legend for the
applied current density.
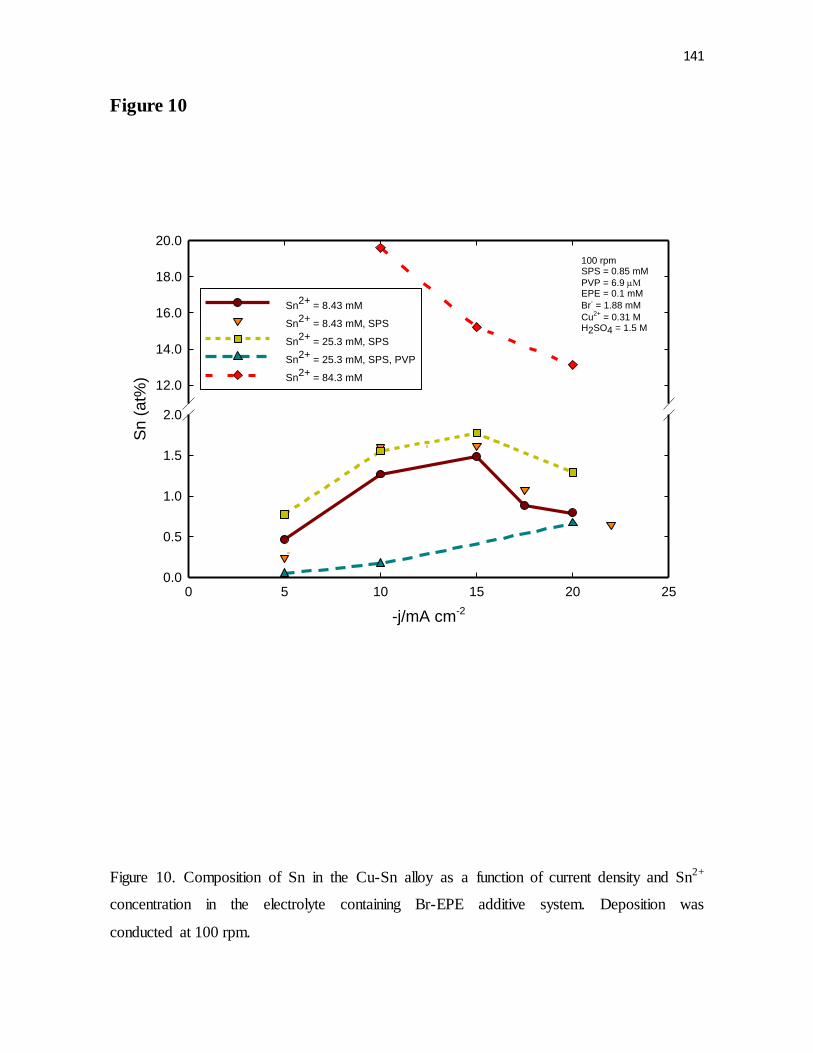
141
Figure 10
-j/mA cm-2
0 5 10 15 20 25
Sn (
at%
)
0.0
0.5
1.0
1.5
2.0
12.0
14.0
16.0
18.0
20.0
Sn2+
= 8.43 mM
Sn2+
= 8.43 mM, SPS
Sn2+
= 25.3 mM, SPS
Sn2+
= 25.3 mM, SPS, PVP
Sn2+
= 84.3 mM
100 rpmSPS = 0.85 mM
PVP = 6.9 EPE = 0.1 mM
Br- = 1.88 mM
Cu2+
= 0.31 MH2SO4 = 1.5 M
Figure 10. Composition of Sn in the Cu-Sn alloy as a function of current density and Sn2+
concentration in the electrolyte containing Br-EPE additive system. Deposition was
conducted at 100 rpm.
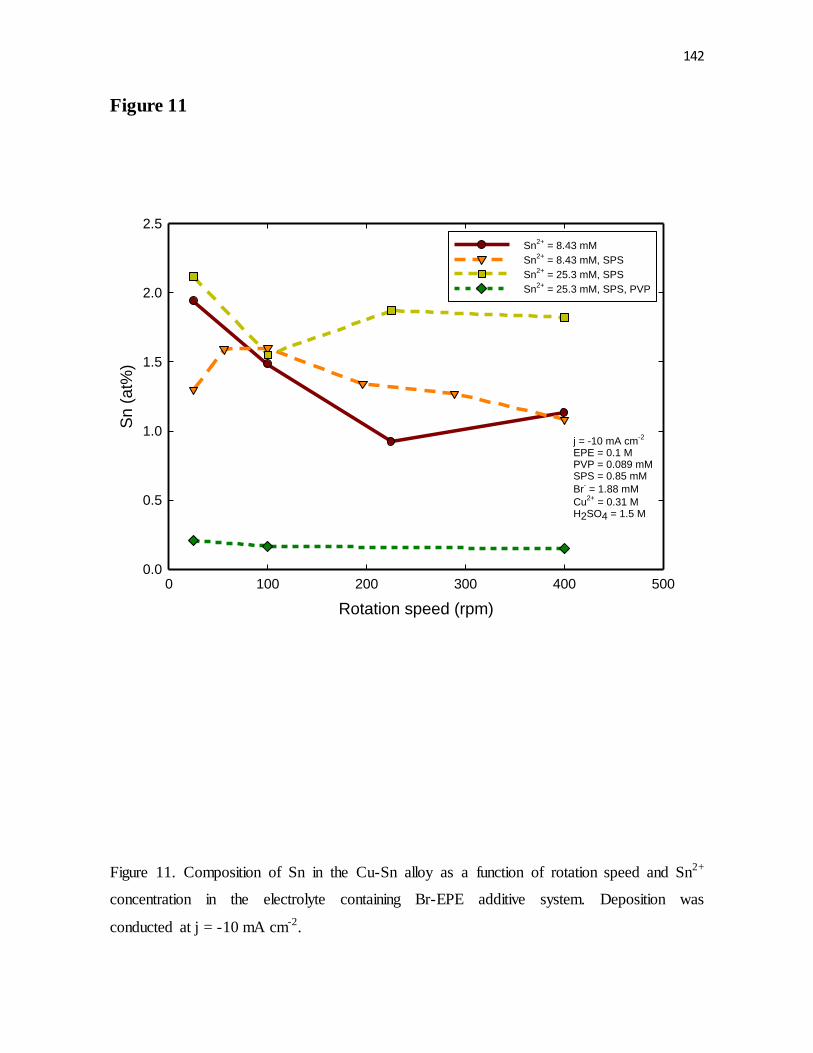
142
Figure 11
Rotation speed (rpm)
0 100 200 300 400 500
Sn (
at%
)
0.0
0.5
1.0
1.5
2.0
2.5
Sn2+
= 8.43 mM
Sn2+
= 8.43 mM, SPS
Sn2+
= 25.3 mM, SPS
Sn2+
= 25.3 mM, SPS, PVP
j = -10 mA cm-2
EPE = 0.1 MPVP = 0.089 mMSPS = 0.85 mM
Br- = 1.88 mM
Cu2+
= 0.31 MH2SO4 = 1.5 M
Figure 11. Composition of Sn in the Cu-Sn alloy as a function of rotation speed and Sn2+
concentration in the electrolyte containing Br-EPE additive system. Deposition was
conducted at j = -10 mA cm-2.
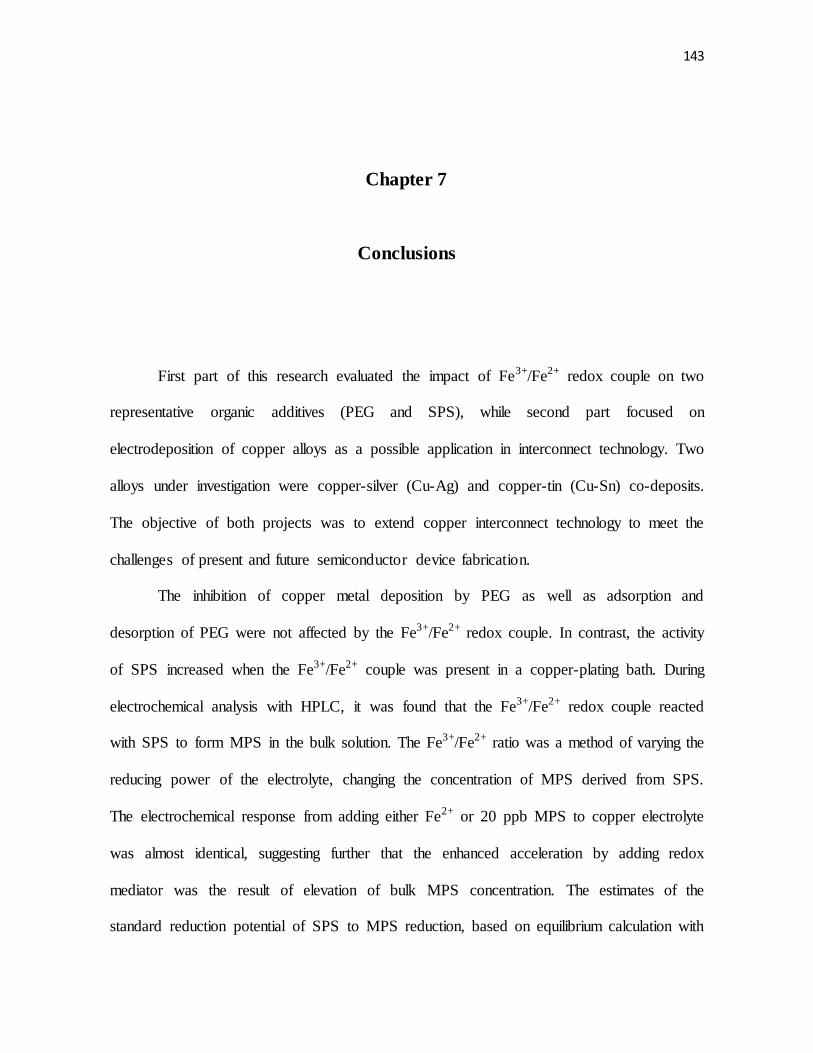
143
Chapter 7
Conclusions
First part of this research evaluated the impact of Fe3+/Fe2+ redox couple on two
representative organic additives (PEG and SPS), while second part focused on
electrodeposition of copper alloys as a possible application in interconnect technology. Two
alloys under investigation were copper-silver (Cu-Ag) and copper-tin (Cu-Sn) co-deposits.
The objective of both projects was to extend copper interconnect technology to meet the
challenges of present and future semiconductor device fabrication.
The inhibition of copper metal deposition by PEG as well as adsorption and
desorption of PEG were not affected by the Fe3+/Fe2+ redox couple. In contrast, the activity
of SPS increased when the Fe3+/Fe2+ couple was present in a copper-plating bath. During
electrochemical analysis with HPLC, it was found that the Fe3+/Fe2+ redox couple reacted
with SPS to form MPS in the bulk solution. The Fe3+/Fe2+ ratio was a method of varying the
reducing power of the electrolyte, changing the concentration of MPS derived from SPS.
The electrochemical response from adding either Fe2+ or 20 ppb MPS to copper electrolyte
was almost identical, suggesting further that the enhanced acceleration by adding redox
mediator was the result of elevation of bulk MPS concentration. The estimates of the
standard reduction potential of SPS to MPS reduction, based on equilibrium calculation with
144
reference to HPLC results, predicted the reduction potential in the range between 0.3 – 0.4 V
vs. SHE.
The study of SPS/MPS equilibrium in the presence of Fe3+/Fe2+ redox couple was
facilitated by the development a novel chromatographic method for the effective detection
of SPS, MPS, monoxide-of-SPS, and dioxide-of-SPS from a copper electrolyte. A HPLC
tool was coupled with an electrochemical detector, which enabled concentration sampling in
a range of just a few parts per billion. This method can also prove crucial for a plating bath
control, where a small amount of certain byproducts significantly affect performance of the
electrolyte.
Electrodeposition of Cu-Ag alloys at a substantial chloride concentration by the
application of pulsed plating was demonstrated. It was shown that Ag incorporation into the
alloy can be controlled by varying pulse frequencies and duty cycles, electrode rotation
speeds, and electrolyte concentrations. However, organic additives decreased incorporation
of Ag into the alloy due to a possible complexing effect on silver ion. It was also discovered
that CuSO4·5H2O from a number of major chemical suppliers contained Ag as impurity. The
pulse-plating conditions created significant film roughness. However, addition of a leveling
agent substantially reduced roughness of the Cu-Ag films. Chloride concentration was
shown to have a critical impact on behavior of a leveling agent. At 1 ppm of chloride films
contained voids and were discontinuous, while at 10 ppm of chloride continuous deposits
with large grains were obtained.
The final chapter of this work examined electrodeposition of Cu-Sn alloy thin films
from acidic copper sulfate electrolytes. Co-deposition of Sn with Cu was enabled by the
polarization of copper deposition into the region where Sn deposition became possible. The
145
most polarizing effect was achieved by utilizing the Br-EPE pair, compared to several other
halogen-suppressor combinations. All additive combinations used also exhibited stronger
polarization of Cu deposition in electrolytes with higher sulfuric acid and lower Cu2+
concentration. The content of Sn in the Cu-Sn alloy was found to be a function of the
applied current density, rotation speed, and the amount of Sn2+ present in the electrolyte. It
was demonstrated that Sn content between 0 – 7 at% in the alloy occurred above the
reduction potential of Sn2+, possibly due to underpotential deposition. Higher Sn content of
up to 20 at% was achieved when Cu deposition was suppressed below the deposition
potential of Sn2+ by the combination of Br and EPE at 10 g L-1 of Sn2+. A positive
correlation between Sn content and concentration of Sn2+ in the electrolyte was observed.
Higher tin content in the alloy also correlated to low rotation speeds. The relationship
between the Sn content and the applied current density was specific to the utilized additive
combination.