Embed Size (px)
Citation preview

Copyright
by
Claudia Isela Torres Garibay
2007
The Dissertation Committee for Claudia Isela Torres Garibay Certifies that this is the approved version of the following dissertation:
MANUFACTURING OF INTERMEDIATE-TEMPERATURE
SOLID OXIDE FUEL CELLS USING NOVEL CATHODE
COMPOSITIONS
Committee:
Desiderio Kovar, Supervisor
Arumugam Manthiram
David L. Bourell
Harovel G. Wheat
John R. Howell

MANUFACTURING OF INTERMEDIATE-TEMPERATURE
SOLID OXIDE FUEL CELLS USING NOVEL CATHODE
COMPOSITIONS
by
Claudia Isela Torres Garibay, B.S., M.S.
Dissertation Presented to the Faculty of the Graduate School of
The University of Texas at Austin
in Partial Fulfillment
of the Requirements
for the Degree of
Doctor of Philosophy
The University of Texas at Austin
May, 2007

Dedication
Para mis padres, Armando y Elia,
que siempre han estado ahí por mí,
apoyando ilimitadamente mis sueños.
Mi red de seguridad. Viento bajo mis alas.
Sin ellos no sería quien soy, ni estaría donde estoy.
y sobre todas las cosas
AMDG

v
Acknowledgements
This project would not be possible with out the guidance, support, encouragement
and patience of my advisor, Dr. Desi Kovar, to whom I am deeply thankful. I would also
like particularly to thank Dr. Arumugam Manthiram for his advice during this project. I
must recognize the invaluable assistance of people like Dr. Ki-Tae Lee, who trained me
in many of the methods used in this work; Dr. Ronald Dass, from whom I learned some
of the chemical synthesis techniques and always had a wise word to share; and Jung
Hyun Kim, for precious “thinking aloud” conversations.
My most sincere appreciation to everybody at the Texas Materials Institute for
their help and friendship, particularly former and current Kovar’s research group
members: Jue Wang who introduced me to tape casting; Sven Kerzenmaher who build
the fuel cell test set up; James Ma who took the pictures in Appendix A; Andre Albert,
who became my personal coach on to the proper and improper uses of English language;
and Jesus Gallegos and Jim Mikulak for his advice. Special thanks to Dr. Kenneth Ralls
and my former and current ME111L TA colleagues for their support.
A big thank you to my family, members of UGAP group at UCC, and my dear
friends who are always a phone call away. Your love fuels my life.
Financial support provided by Conacyt, Mechanical Engineering Department and
the Institute of Advance Technology has been highly appreciated during my doctoral
studies.
vi
MANUFACTURING OF INTERMEDIATE-TEMPERATURE
SOLID OXIDE FUEL CELLS USING NOVEL CATHODE
COMPOSITIONS
Publication No._____________
Claudia Isela Torres Garibay, Ph.D.
The University of Texas at Austin, 2007
Supervisor: Desiderio Kovar
The development of intermediate temperatures solid oxide fuel cells (IT-SOFC) with
YSZ electrolytes imposes a double requirement in their manufacturing. First, the
electrolyte has to be kept as thin as possible to minimize ohmic polarization losses.
Second, the cathode compositions used must exhibit an adequate catalytic activity at the
operating temperature (600 – 800 ºC). Current methods to manufacture thin YSZ
electrolytes require complex processes, and sometimes costly equipment. Cathode
compositions traditionally used for high temperature solid oxide fuel cells, such as
(La,Sr)MnO3 do not exhibit good catalytic properties at intermediate temperatures. These
challenges present areas of opportunity in the development of original manufacturing
techniques and new cathode compositions. This study presents a low-cost fabrication
vii
procedure for IT-SOFC using tape casting, co-firing and screen printing. The
electrochemical performance of the cells is evaluated using a known cathode composition
for IT-SOFC, such as La0.6Sr0.4CoO3-δ (LSC), novel perovskite oxides, such as
Nd0.6Sr0.4CoO3-δ (NSC), and perovskite-related intergrowth oxides compositions, like
Sr0.7La0.3Fe1.4Co0.6O7-δ (SLFCO7) and LaSr3Fe1.5Co1.5O10-δ (LSFCO10). The impact of
conductivity is studied by substituting Fe for Co in the case of the perovskite oxides, with
compositions such as La0.6Sr0.4Co0.5Fe0.5O3-δ (LSCF), and Nd0.6Sr0.4Co0.5Fe0.5O3-δ (NSCF)
and by infiltration of NSCF with silver. The effect of the cathode sintering temperature is
studied using LSC and LSCF cathodes. It is found that there is generally a correlation
between cell performance and conductivity. However, the microstructure of the cathode
is also important in determining cell performance by tailoring the cathode sintering
temperature. IT-SOFC with SLFCO7 cathodes show a performance comparable to cells
with LSFC cathode. In the case of LSFCO10, the performance loss associated with its
lower conductivity compared to LSC can be more than offset by tailoring the
microstructure.
viii
Table of Contents
List of Tables ......................................................................................................... xi
List of Figures ....................................................................................................... xii
Chapter 1: Introduction ...........................................................................................1 1.1 Fuel Cells Advantages ..............................................................................1 1.2 Fuel Cells Classification ...........................................................................2 1.3 Solid Oxide Fuel Cells ..............................................................................5
1.3.1 Historical Background of SOFC...................................................5 1.3.1 Operation Principle .......................................................................6 1.3.2 SOFC components ......................................................................13
1.3.2.1 Electrolyte .......................................................................14 1.3.2.2 Anode..............................................................................16 1.3.2.3 Cathode ...........................................................................17
1.3.3 SOFC geometry ..........................................................................19 1.3.4 Seals ............................................................................................19 1.3.5 Disadvantages of SOFC..............................................................20
1.4 Intermediate-Temperature Solid Oxide Fuel Cells (IT-SOFC) ..............20 1.4.1 Requirements ..............................................................................21 1.4.2 Thin Electrolytes Manufacturing Techniques.............................21 1.4.3 Current Status..............................................................................25
1.5 Scope of this Study .................................................................................26
Chapter 2: Experimental Procedures ....................................................................27 2.1 Manufacturing of IT-SOFC ....................................................................27
2.1.1 YSZ Electrolyte ..........................................................................28 2.1.2 NiO/YSZ Anode .........................................................................29
2.1.2.1 Effect of the binder .........................................................31 2.1.2.2 Effect of the plasticizer ...................................................33
ix
2.1.2.3 Effect of the powder load................................................35 2.1.2.4 Processing of Anode .......................................................36
2.1.3 Interlayer material.......................................................................37 2.1.5 Cell preparation...........................................................................38
2.2 Characterization Techniques...................................................................39 2.2.1 X-Ray Diffraction (XRD) ...........................................................39 2.2.2 Scanning Electron Microscopy (SEM) .......................................40 2.2.3 Electrochemical Characterization ...............................................40
2.2.3.1 Seal formation.................................................................40 2.2.3.2 Anode reduction..............................................................42 2.2.3.3 Electrochemical performance evaluation........................42
Chapter 3: IT-SOFC with Perovskite Cathodes: Ln0.6Sr0.4Co1-yFeyO3 (Ln = La, Nd, y = 0, 0.5) cathodes..........................................................................................43 3.1 Cathode Materials Evolution ..................................................................43 3.2 Experimental Procedure..........................................................................45
3.2.1 Synthesis and Characterization of Ln0.6Sr0.4CoO3-δ (Ln = La, Nd).....................................................................................................45
3.2.2 Synthesis and Characterization of Ln0.6Sr0.4Co0.5Fe0.5O3-δ (Ln = La, Nd) ..............................................................................................46
3.2.3 Synthesis of Nd0.6Sr0.4Co0.5Fe0.5O3-δ - Ag...................................47 3.2.4 GDC Interlayer............................................................................48
3.3 Results.....................................................................................................49 3.4 Discussion ...............................................................................................64
3.4.1 Influence of Cathode Sintering Temperature for LSC and LSCF .......................................................................................................64
3.4.2 Comparison between NSC and LSC-Based Cells ......................70 3.4.3 Comparison between LSC and LSCF-Based Cells and NSC and
NSCF-Based Cells ......................................................................70 3.4.4 Influence of Impregnation of NSCF with Ag .............................71
3.4 Conclusions.............................................................................................74
x
Chapter 4: IT-SOFC with Intergrowth Perovskite Oxides Cathodes: (La,Sr)n+1(Fe,Co)nO3n+1, (n = 2, 3, ∞) cathodes ............................................75 4.1 Introduction.............................................................................................75 4.2 Experimental ...........................................................................................77 4.3 Results.....................................................................................................77 4.4 Discussion ...............................................................................................86 4.5 Conclusions.............................................................................................89
Chapter 5: Summary .............................................................................................91
Appendix A: Preparation of Anode/Electrolyte assemblies for co-firing..............94
Appendix B: Conductivity and Thermal Expansion Coefficients Data..............110
Appendix C: Electrochemical data of tested cells. .............................................111 C.1 LSC1000...............................................................................................111 C.2 LSC1100...............................................................................................114 C.3 LSCF1000 ............................................................................................115 C.4 LSCF1100 ............................................................................................116 C.5 NSC ......................................................................................................117 C.6 NSCF....................................................................................................119 C7 NSCF-Ag...............................................................................................121 C.8 SLFCO7 ...............................................................................................124 C.9 LSFCO10 .............................................................................................127
Abbreviations and Symbols .................................................................................129 Abbreviations..............................................................................................129 Symbols.......................................................................................................130
References............................................................................................................132
Vita .....................................................................................................................137
xi
List of Tables
Table 1.1. Characteristics of different types of fuel cells.4 .....................................4
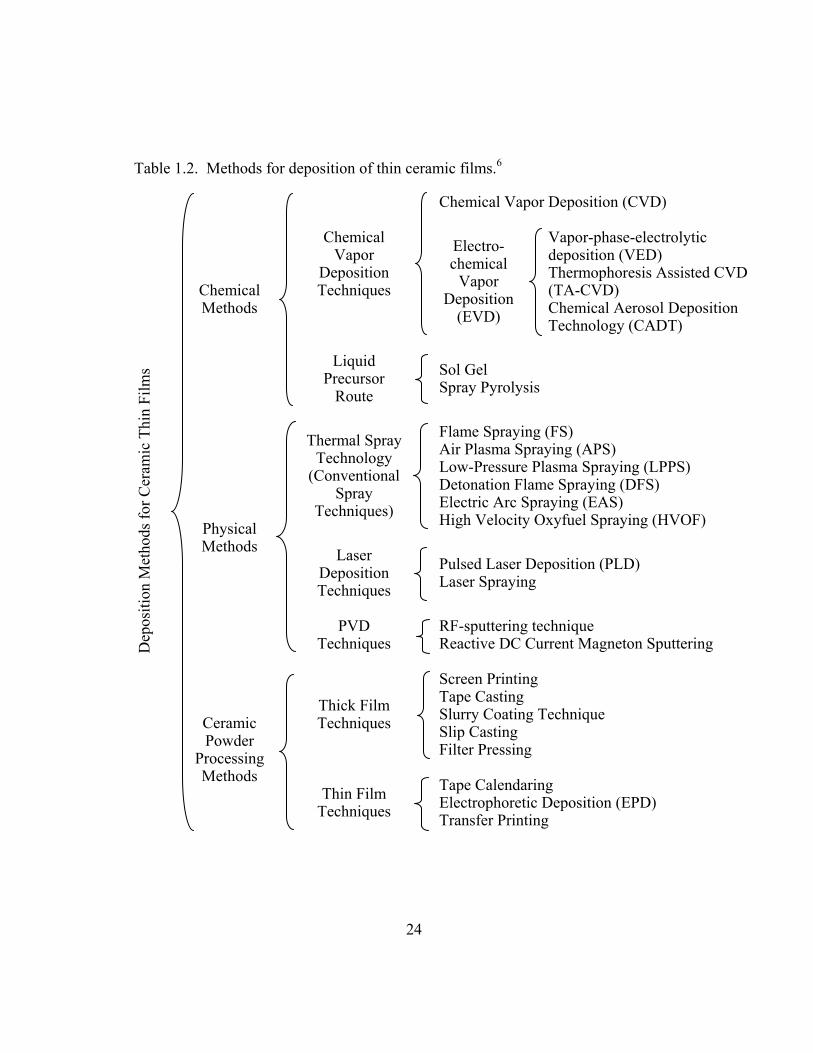
Table 1.2. Methods for deposition of thin ceramic films.6 ...................................24
Table 2.1. Electrolyte slurry for tape casting.7......................................................29
Table 2.2. Volume fractions of anode slurries studied. ........................................31
Table 2.3. Anode slurry for tape casting (adapted from Mistler47).......................37
Table 3.1 Maximum power densities (W/cm2) obtained at operating temperatures of 600 ˚C – 800 ˚C for IT-SOFC using perovskites cathodes............59
Table 4.1 Maximum power densities (W/cm2) obtained at operating temperatures of 600 ºC – 800 ºC, for IT-SOFC using (La,Sr)n+1(Fe,Co)nO3n+1 cathodes.........................................................................................................83
xii
List of Figures
Figure 1.1. Operating principle of a SOFC.............................................................7
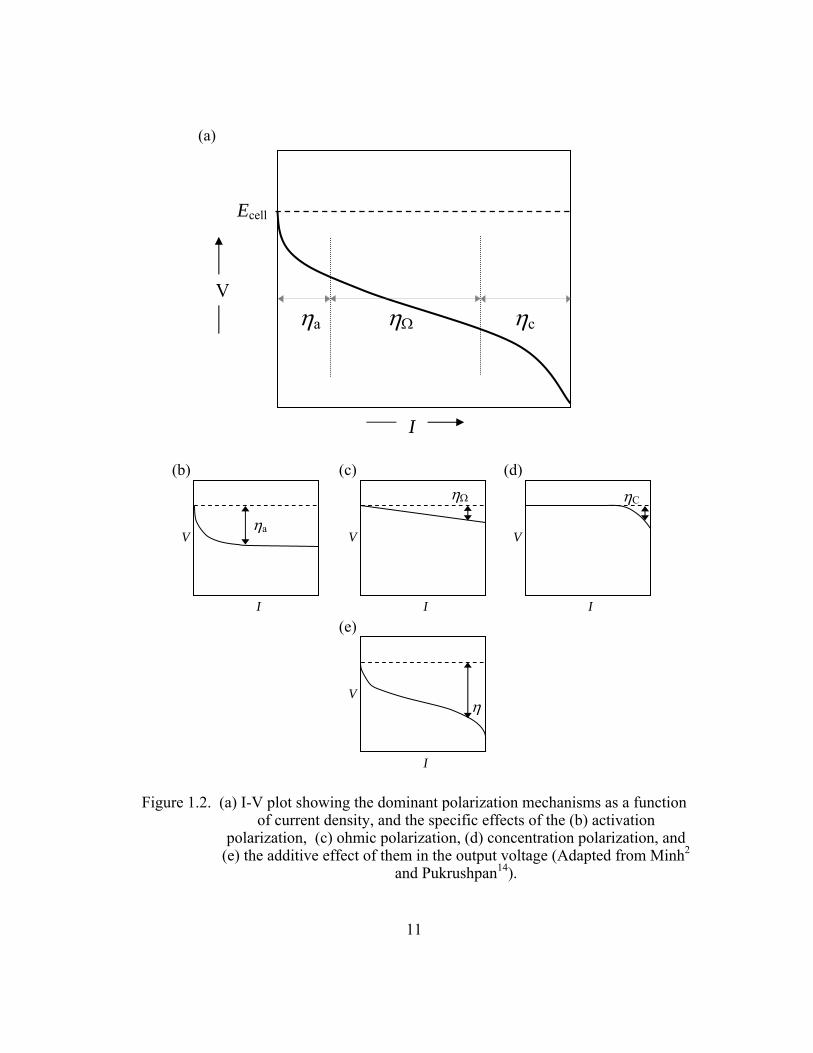
Figure 1.2. (a) I-V plot showing the dominant polarization mechanisms as a function of current density, and the specific effects of the (b) activation polarization, (c) ohmic polarization, (d) concentration polarization, and (e) the additive effect of them in the output voltage (Adapted from Minh2 and Pukrushpan14). ..............................................................11
Figure 2.1. Manufacturing process. ......................................................................28
Figure 2.2. A/E assembly after pyrolysis. Anode was prepared with anode composition # 6..............................................................................34
Figure 2.3. A/E assembly after pyrolysis. Anode was prepared with anode composition # 7..............................................................................35
Figure 2.4. Schematic of SOFC testing set up. .....................................................41
Figure 3.1. SEM of LSC (top) and LSCF (bottom) powders produced by solid state reaction and dry ball-milling..........................................................50
Figure 3.2. SEM of NSC (top) and NSCF (bottom) powders produced by solid state reaction and manual grinding using a mortar and pestle. ..............51
Figure 3.3. Reactivity test for NSC and YSZ. ......................................................53
Figure 3.4. Reactivity test for NSCF and YSZ. ....................................................54
Figure 3.5. Reactivity test for LSC and GDC.......................................................55
Figure 3.6. Reactivity test for LSCF and GDC.....................................................56
Figure 3.7. Reactivity test for NSC and GDC. .....................................................57
Figure 3.8. Reactivity test for NSCF and GDC. ...................................................58
Figure 3.9. I-V curves (open symbols) and power densities (closed symbols) of IT-SOFC with LSC cathodes fired at 1000 ºC....................................61
Figure 3.10. I-V curves (open symbols) and power densities (closed symbols) of IT-SOFC with LSC cathodes fired at 1100 ºC....................................61
xiii
Figure 3.11. I-V curves (open symbols) and power densities (closed symbols) of IT-SOFC with LSCF cathodes fired at 1000 ºC. ................................62
Figure 3.12. I-V curves (open symbols) and power densities (closed symbols) of IT-SOFC with LSCF cathodes fired at 1100 ºC. ................................62
Figure 3.13. I-V curves (open symbols) and power densities (closed symbols) of IT-SOFC with NSC cathodes..............................................................63
Figure 3.14. I-V curves (open symbols) and power densities (closed symbols) of IT-SOFC with NSCF cathodes. ..........................................................63
Figure 3.15. I-V curves (open symbols) and power densities (closed symbols) of IT-SOFC with NSC-Ag. .....................................................................64
Figure 3.16. Comparison of average I-V traces at low current densities at 800 ºC..........................................................................................................66
Figure 3.17. Comparison of average I-V traces at low current densities at 700 ºC..........................................................................................................66
Figure 3.18. Comparison of average I-V traces at low current densities at 600 ºC..........................................................................................................67
Figure 3.19. SEM of IT-SOFC with LSC cathodes fired at (a) 1000 ºC, and (b) 1100 ºC....................................................................................................68
Figure 3.20. SEM of IT-SOFC with LSCF cathodes fired at (a) 1000 ºC, and (b) 1100 ºC...........................................................................................69
Figure 3.21. SEM of IT-SOFC with (a) NSC, (b) NSCF, and (c) NSCF-Ag cathodes.........................................................................................................73
Figure 4.1. Crystalline structures of perovskite (n = ∞) (left) and perovskite related intergrowth oxides (n = 2 and 3) (center and right). ......................76
Figure 4.2. SEM of SLFCO7 (top) and LSFCO10 (bottom) powders produced by solid state reaction and hand milled...............................................78
Figure 4.3. Reactivity test for SLFCO7 and YSZ.................................................79
Figure 4.4. Reactivity test for LSFCO10 and YSZ...............................................80
Figure 4.5. Reactivity test for SLFCO7 and GDC................................................81
Figure 4.6. Reactivity test for LSFCO10 and GDC..............................................82
xiv
Figure 4.7. I-V curves (open symbols) and power densities (closed symbols) of IT-SOFC with SLFCO7 cathodes. ......................................................84
Figure 4.8. I-V curves (open symbols) and power densities (closed symbols) of IT-SOFC with LSFCO10 cathodes. ....................................................85
Figure 4.9. I-V curves (open symbols) and power densities (closed symbols) of IT-SOFC with LSCF1000 cathodes. (same as Figure 3.12) ...............85
Figure 4.10. Comparison of average I-V traces at low current densities at 800 ºC..........................................................................................................87
Figure 4.11. Comparison of average I-V traces at low current densities at 700 ºC..........................................................................................................87
Figure 4.12. Comparison of average I-V traces at low current densities at 600 ºC..........................................................................................................88
Figure 4.13. SEM of IT-SOFC with SLFCO7 (a) and LSFCO10 (b) cathodes....90
Figure A.1. Punching and anode disc. ..................................................................94
Figure A.2. Punched disc (bottom). ......................................................................95
Figure A.3. Removing anode disc and surrounding area from glass substrate.....96
Figure A.4. Detaching excess material from anode disc. .....................................96
Figure A.5. Anode disc with side that was in contact with glass up.....................97
Figure A.6. Removing excess material surrounding electrolyte disc. ..................97
Figure A.7. Removing electrolyte disc from glass substrate. ...............................98
Figure A.8. Anode disks stacked on aluminum foil..............................................99
Figure A.9. Electrolyte disk on top of anode disks...............................................99
Figure A.10. A/E assembly after lamination. .....................................................100
Figure A.11. Removal of the aluminum foil from the anode side. .....................101
Figure A.12. Removal of aluminum foil from the electrolyte side......................101
Figure A.13. A/E assembly after hot lamination. ...............................................102
xv
Figure A.14. Edge trimming. ..............................................................................103
Figure A.15. A/E assembly ready to be co-fired. ...............................................103
Figure A.16. Depositing coarsen YSZ................................................................104
Figure A.17. Flattening coarsen YSZ out on alumina plate. ..............................105
Figure A.18. The A/E assembly is covered with graphite. .................................106
Figure A.19. Placing graphite-covered A/E assembly on coarsen YSZ powder with anode side up................................................................................106
Figure A.20. Two assemblies were fired simultaneously in the same crucible..107
Figure A.21. The coarsened YSZ layer that covers the cells is flattened. ..........108
Figure A.22. Alumina plate on top of coarsen YSZ. ..........................................108
1
Chapter 1: Introduction
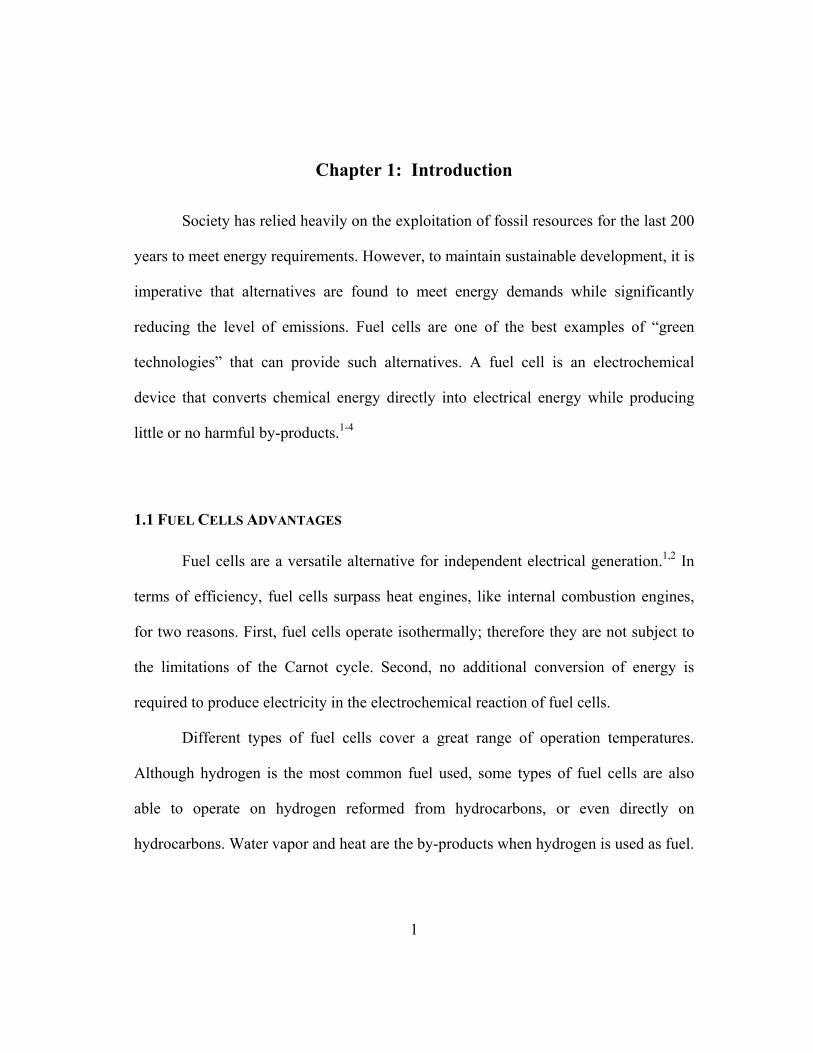
Society has relied heavily on the exploitation of fossil resources for the last 200
years to meet energy requirements. However, to maintain sustainable development, it is
imperative that alternatives are found to meet energy demands while significantly
reducing the level of emissions. Fuel cells are one of the best examples of “green
technologies” that can provide such alternatives. A fuel cell is an electrochemical
device that converts chemical energy directly into electrical energy while producing
little or no harmful by-products.1-4
1.1 FUEL CELLS ADVANTAGES
Fuel cells are a versatile alternative for independent electrical generation.1,2 In
terms of efficiency, fuel cells surpass heat engines, like internal combustion engines,
for two reasons. First, fuel cells operate isothermally; therefore they are not subject to
the limitations of the Carnot cycle. Second, no additional conversion of energy is
required to produce electricity in the electrochemical reaction of fuel cells.
Different types of fuel cells cover a great range of operation temperatures.
Although hydrogen is the most common fuel used, some types of fuel cells are also
able to operate on hydrogen reformed from hydrocarbons, or even directly on
hydrocarbons. Water vapor and heat are the by-products when hydrogen is used as fuel.
2
In other cases, the levels of emissions are very low. Waste heat can also be used,
further increasing the efficiency of a fuel cell system.
Minimal maintenance is required for fuel cells because they do not have
moving components and their performance is free of noise and vibration. They offer
great siting capability as they can be placed in a variety of locations, and their
modularity makes their power output easily scalable by connecting fuel cells in series.
Fuel cells offer advantages with respect to batteries, which are also
electrochemical devices.1-3 Reactants are part of the structure of a battery; once they are
consumed, the battery has to be recharged or replaced. In principle, a fuel cell can
operate as long as the externally stored reactants are fed into the reaction areas and the
reaction products are removed. Fuel cells only provide the sites for the electrochemical
reaction to occur. The life span of a fuel cell is also potentially longer as ideally no
reactions occur at their electrodes.
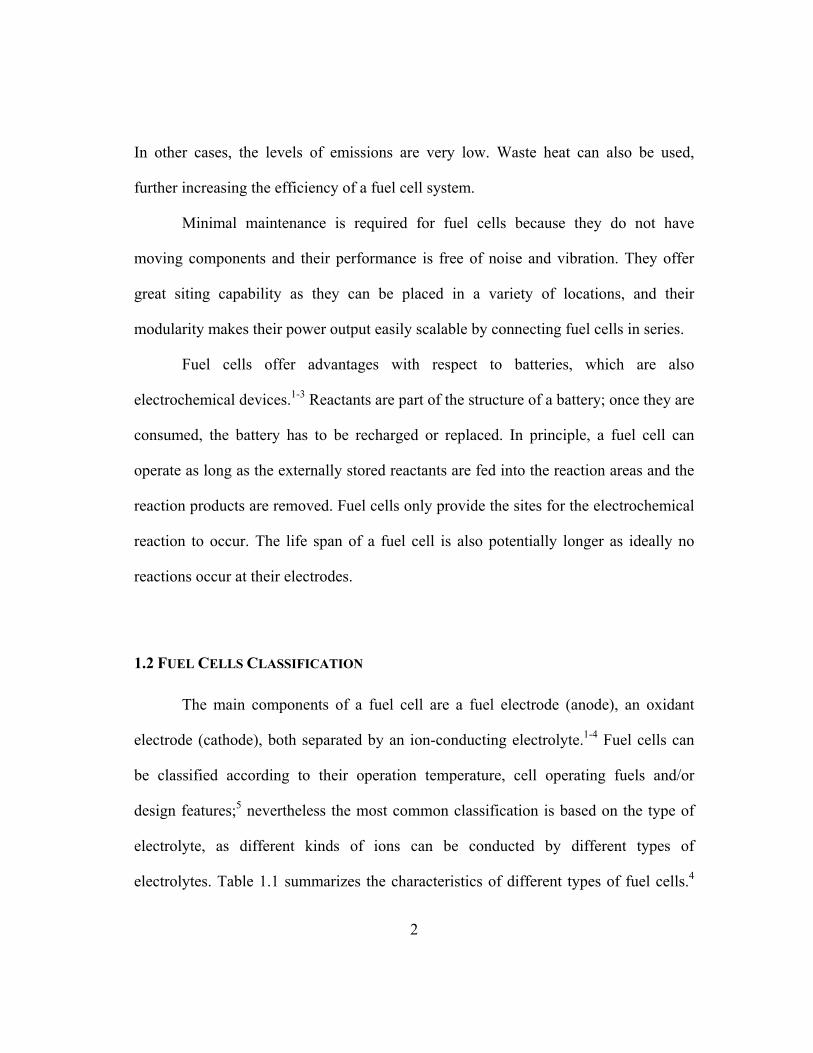
1.2 FUEL CELLS CLASSIFICATION
The main components of a fuel cell are a fuel electrode (anode), an oxidant
electrode (cathode), both separated by an ion-conducting electrolyte.1-4 Fuel cells can
be classified according to their operation temperature, cell operating fuels and/or
design features;5 nevertheless the most common classification is based on the type of
electrolyte, as different kinds of ions can be conducted by different types of
electrolytes. Table 1.1 summarizes the characteristics of different types of fuel cells.4

3
Polymer electrolyte fuel cells, alkaline fuel cells, and phosphoric acid fuel cells operate
in the low-temperature range. Molten carbonate fuel cells and solid oxide fuel cells are
high temperature fuel cells. For solid oxide fuel cells, temperatures below 800 ºC are
considered intermediate operation temperatures.
4
Table 1.1. Characteristics of different types of fuel cells (adapted from Minh4).
Polymer
Electrolyte Fuel Cell
Alkaline Fuel Cell Phosphoric Acid Fuel Cell
Molten Carbonate Fuel Cell
Solid Oxide Fuel Cell
Electrolyte Ion-exchange membrane
Mobilized or immobilized KOH
Immobilized liquid H3PO4
Immobilized liquid molten
carbonate Ceramic
Operating Temperature (ºC) 80 65-220 205 650 600-1000
Charge Carrier H+ OH- H+ CO32- O2-
External reformer for CH4
Yes Yes Yes No No
Prime cell components Carbon-based Carbon-based Graphite-based Stainless Steel-
based Ceramic
Catalyst Platinum Platinum Platinum Nickel Oxide perovskites or metal ceramic
composites Product water management Evaporative Evaporative Evaporative Gaseous product Gaseous product
5
1.3 SOLID OXIDE FUEL CELLS
Solid oxide fuel cells (SOFC) exhibit various advantages over other types of
fuel cells.1,2,6 The use of a solid electrolyte instead of a liquid one makes SOFC easier
to maintain, and there are no pore flooding or catalyst wetting problems.1 The
electrolyte is made usually from yttria doped zirconia (YSZ), a highly chemically and
thermally stable material.7 At high temperatures, YSZ can serve as a solid-state
electrolyte as it becomes sufficiently conductive to oxide ions, while remaining non-
conductive to electrons.
A major benefit of SOFC is that hydrocarbons can be directly used as fuel in a
SOFC,1-4 without the need for further transformation. The high operating temperature
ensures that fuels will spontaneously internally reform and then oxidize rapidly to
chemical completion without the need for specialized and expensive catalysts, as can
be seen in Table 1.1. The lack of high-activity catalysts that can be easily poisoned also
gives SOFC a high tolerance to impurities. SOFC can achieve the highest total energy
efficiency among all types of fuel cells. The use of a solid oxide electrolyte reduces
corrosion problems. Generated heat can be easily utilized in a simple and economical
way.
1.3.1 Historical Background of SOFC
There has been great development of SOFC technologies in the last forty years,
but fuel cells have been around for many years.1,2,8 In 1839 Sir William Grove
6
demonstrated the operating principle of fuel cells by reversing the electrolysis of water.
His cell used dilute sulfuric acid as electrolyte and operated at room temperature.9 By
the end of the century, certain oxide compositions, such as the so-called Nernst mass,
were identified as ionic conductors at high temperatures.10 The Nernst mass consisted
of zirconia doped with 15 % yttria which is an insulator at room temperature, an ionic
conductor when red hot (600 – 1000 °C) and both an electronic and ionic conductor at
white heat (~ 1500 °C). Schottky suggested the use of the Nernst mass as a fuel cell
solid electrolyte in 1935.11 The operation of the first SOFC was demonstrated two
years later, in 1937, by Baur and Preis, using magnesia- or yttria-stabilized zirconia as
electrolytes at temperatures higher than 1000 °C.12
The study of yttria-doped zirconia electrolytes continued for the next decades,
but it was until the early 60’s when real efforts for practical applications of SOFC were
made. Since then, research has focused on improving the design as well as the
materials used in the components of the cells.
1.3.1 Operation Principle
The operating principle of a fuel cell1,2,5,13 is shown in Figure 1, using common
reactants for SOFC. A fuel, such as hydrogen, is fed to the anode and an oxidant, such
as oxygen from air, is fed to the cathode. Hydrogen is oxidized at the anode and
electrons are released to an external circuit, providing DC current to a load. Oxygen is
reduced at the cathode, accepting incoming electrons from the external circuit. The
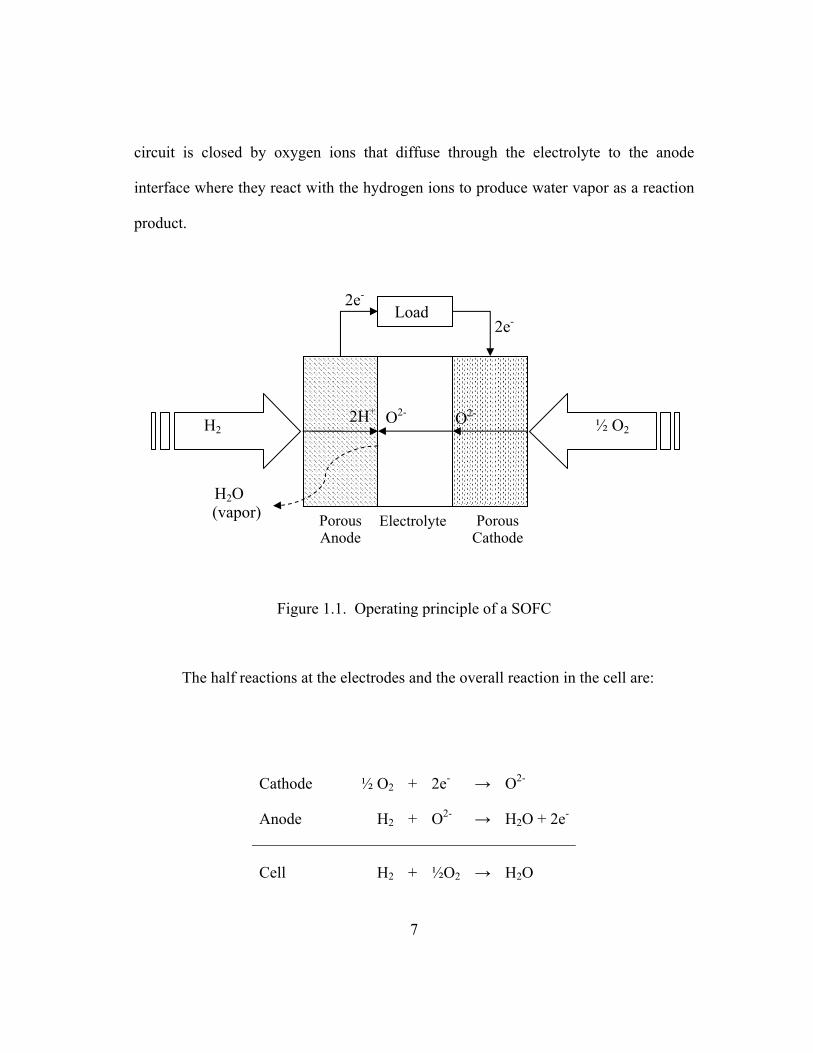
7
circuit is closed by oxygen ions that diffuse through the electrolyte to the anode
interface where they react with the hydrogen ions to produce water vapor as a reaction
product.
Figure 1.1. Operating principle of a SOFC
The half reactions at the electrodes and the overall reaction in the cell are:
Cathode ½ O2 + 2e- → O2-
Anode H2 + O2- → H2O + 2e-
Cell H2 + ½O2 → H2O
H2O(vapor) Porous
Cathode Electrolyte Porous
Anode
Load
H2 ½ O2 O2-O2-
2e-
2e-
2H+
8
The efficiency ε of a fuel cell is the ratio of the electrical energy produced by
the cell to the chemical energy of the reaction. The energy output is expressed as the
Gibbs free energy change ΔG of the combustion reaction of the fuel. The chemical
energy of the reaction is expressed in terms of enthalpy change ∆H or heat of
combustion of the fuel. Thermodynamically
HST
HSTH
HG
ΔΔ
−=Δ
Δ−Δ=
ΔΔ
= 1ε (1.1)
where ΔS is the entropy change of the reaction at the temperature T.
The net work done by a cell, or the standard electromotive force (emf) E0 of a
cell, is measured as the voltage between the electrodes in open circuit conditions and
when all species involved in a reversible reaction are in their standard state. In terms of
the standard Gibbs free energy change ΔG0 of the combustion reaction, the standard
cell voltage is
nFGE
oΔ−=0 (1.2)
where n is the number of electrons involved in the reaction and F is Faraday’s constant.
In the above example, if hydrogen and oxygen at standard conditions combine to
produce water vapor, the standard Gibbs free energy change ΔG0 for the reaction is -
9
228.5 kJ/mol. Therefore, the standard cell voltage in open circuit conditions should be
1.18 V. However, when there is a load connected to the electrodes, the reversible cell
voltage Ecell is less than the standard cell voltage E0. The reversible voltage Ecell is
given by the Nernst equation. If the fuel used is hydrogen, the reversible cell voltage is
FGEcell 2
Δ−=
( )F
OpHpOHpRTG
Ecell 2)(
)(ln2
1
22
20⎟⎟⎠
⎞⎜⎜⎝
⎛+Δ−
=
( ) 21
)(
)(ln
222
2
OpHp
OHpF
RTEE ocell −= (1.3)
where R is the gas constant, and p(H2O), p(H2) and p(O2) are the partial pressures of
the species at the anode and cathode.
The driving force for a SOFC is the difference in oxygen partial pressure on
either side of the electrolyte. The SOFC can be considered as an oxygen concentration
cell, as the oxygen partial pressure on the anode side is extremely low, corresponding
to the value of the dissociation of water vapor (H2 + ½ O2 ↔ H2O). In this case,
10
21
2
21
2
)(
)(ln
2an
catcell
Op
OpF
RTE = (1.4)
Equation (1.4) gives the voltage for a reversible oxygen concentration cell with
an oxide ion transport number of 1, in other words, with a pure ionic conductor. If the
oxygen partial pressure is kept constant at the cathode (cat), Ecell is a function of only
the oxygen partial pressure at the anode (an). The presence of oxygen in contact with
the anode side of the cell decreases Ecell.
In an operating cell, the real voltage output V drops from the ideal Ecell as the
current density I drawn from the cell increases by an amount known as polarization or
overpotential, η. The total polarization η, which reflects the additive effects of three
main types of polarization: activation polarization ηa, ohmic polarization ηΩ, and
concentration polarization ηc. Mathematically
cacellEV ηηη −−−= Ω (1.5)
The dominant mechanism of polarization is a function of the current density. A plot of
V versus I (I-V curve) depicts how V is affected by η, as can be seen in Figure 1.2. The
voltage output at zero current density is known as the open circuit voltage (OCV).
11
(b)
(c)
(d)
(e)
Figure 1.2. (a) I-V plot showing the dominant polarization mechanisms as a function of current density, and the specific effects of the (b) activation
polarization, (c) ohmic polarization, (d) concentration polarization, and (e) the additive effect of them in the output voltage (Adapted from Minh2
and Pukrushpan14).
I
V
ηa ηΩ ηc
Ecell
V
I
I
V
ηC
I
V
ηΩ
I
V ηa
η
(a)
12
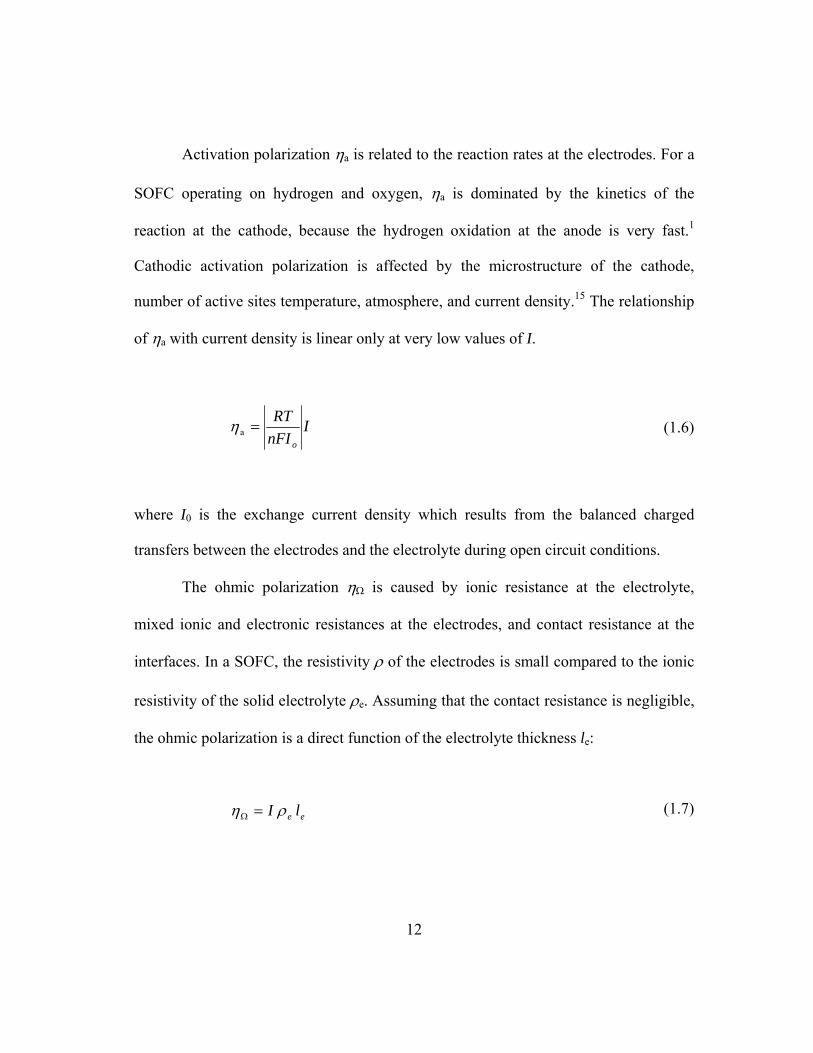
Activation polarization ηa is related to the reaction rates at the electrodes. For a
SOFC operating on hydrogen and oxygen, ηa is dominated by the kinetics of the
reaction at the cathode, because the hydrogen oxidation at the anode is very fast.1
Cathodic activation polarization is affected by the microstructure of the cathode,
number of active sites temperature, atmosphere, and current density.15 The relationship
of ηa with current density is linear only at very low values of I.
InFIRT
o
=aη (1.6)
where I0 is the exchange current density which results from the balanced charged
transfers between the electrodes and the electrolyte during open circuit conditions.
The ohmic polarization ηΩ is caused by ionic resistance at the electrolyte,
mixed ionic and electronic resistances at the electrodes, and contact resistance at the
interfaces. In a SOFC, the resistivity ρ of the electrodes is small compared to the ionic
resistivity of the solid electrolyte ρe. Assuming that the contact resistance is negligible,
the ohmic polarization is a direct function of the electrolyte thickness le:
ee lI ρη =Ω (1.7)
13
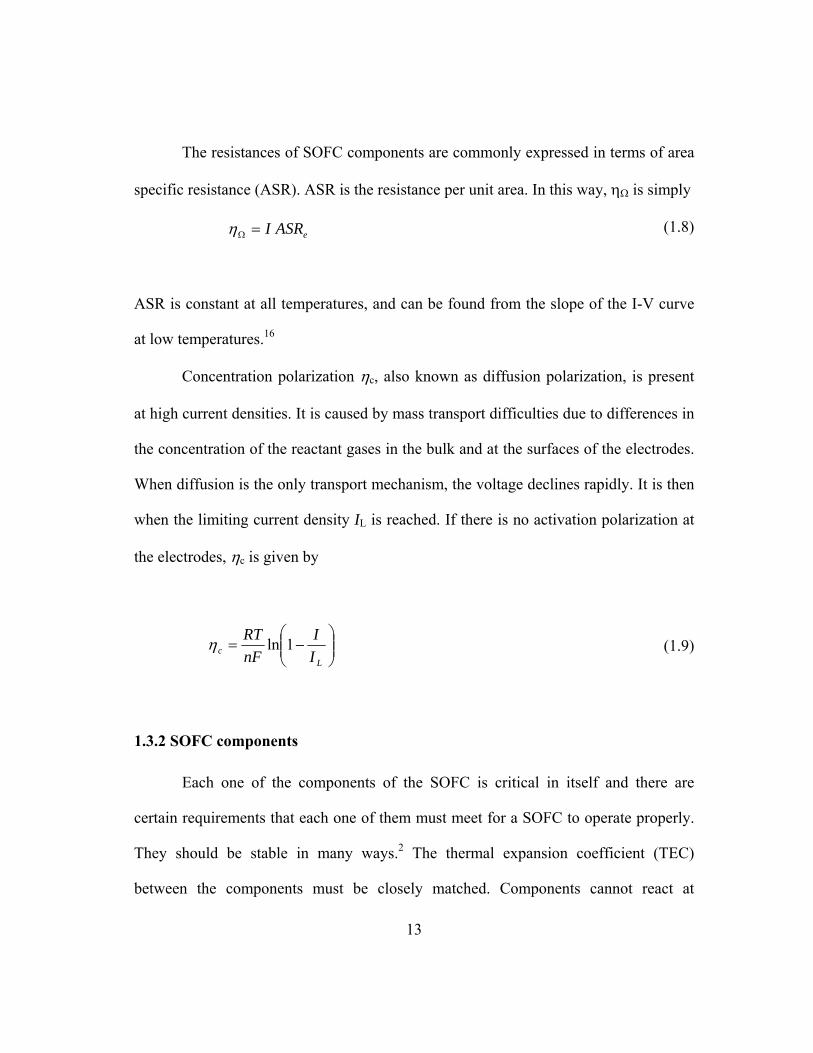
The resistances of SOFC components are commonly expressed in terms of area
specific resistance (ASR). ASR is the resistance per unit area. In this way, ηΩ is simply
eASRI=Ωη (1.8)
ASR is constant at all temperatures, and can be found from the slope of the I-V curve
at low temperatures.16
Concentration polarization ηc, also known as diffusion polarization, is present
at high current densities. It is caused by mass transport difficulties due to differences in
the concentration of the reactant gases in the bulk and at the surfaces of the electrodes.
When diffusion is the only transport mechanism, the voltage declines rapidly. It is then
when the limiting current density IL is reached. If there is no activation polarization at
the electrodes, ηc is given by
⎟⎟⎠
⎞⎜⎜⎝
⎛−=
Lc I
InFRT 1lnη (1.9)
1.3.2 SOFC components
Each one of the components of the SOFC is critical in itself and there are
certain requirements that each one of them must meet for a SOFC to operate properly.
They should be stable in many ways.2 The thermal expansion coefficient (TEC)
between the components must be closely matched. Components cannot react at
14
fabrication temperature of the fuel cell which is higher than the operating temperature.
Ease of fabrication and low cost also must be considered when selecting materials for
fuel cells.
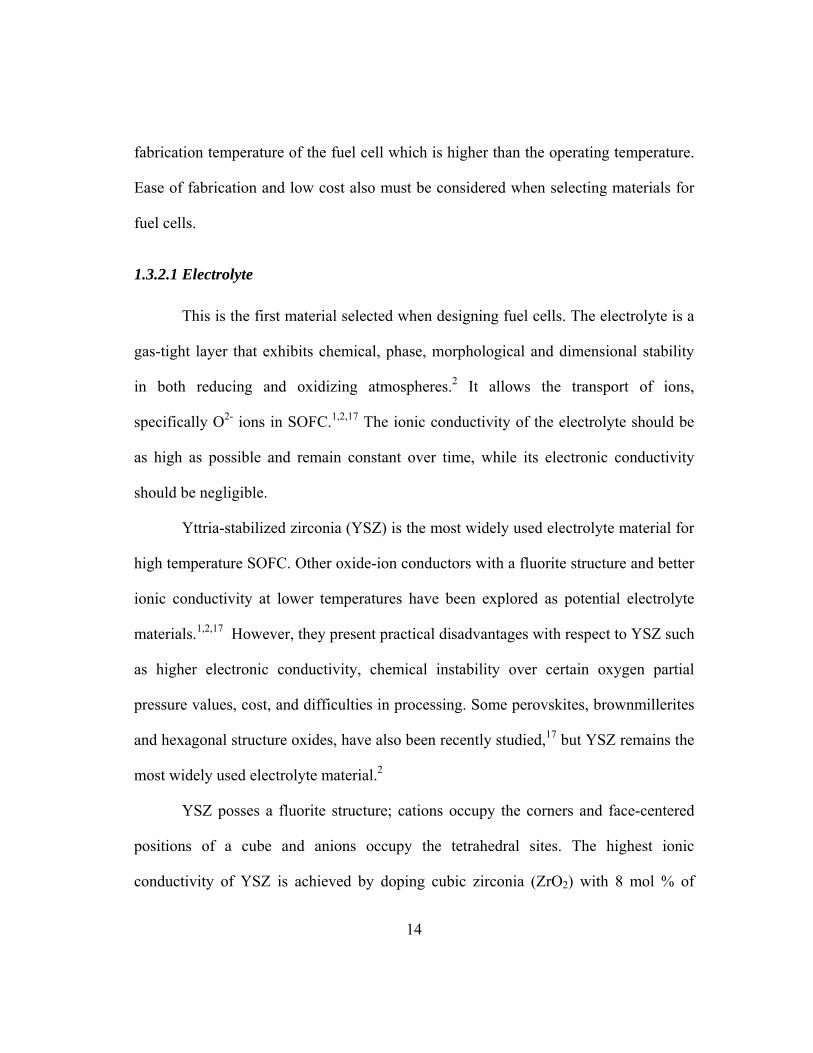
1.3.2.1 Electrolyte
This is the first material selected when designing fuel cells. The electrolyte is a
gas-tight layer that exhibits chemical, phase, morphological and dimensional stability
in both reducing and oxidizing atmospheres.2 It allows the transport of ions,
specifically O2- ions in SOFC.1,2,17 The ionic conductivity of the electrolyte should be
as high as possible and remain constant over time, while its electronic conductivity
should be negligible.
Yttria-stabilized zirconia (YSZ) is the most widely used electrolyte material for
high temperature SOFC. Other oxide-ion conductors with a fluorite structure and better
ionic conductivity at lower temperatures have been explored as potential electrolyte
materials.1,2,17 However, they present practical disadvantages with respect to YSZ such
as higher electronic conductivity, chemical instability over certain oxygen partial
pressure values, cost, and difficulties in processing. Some perovskites, brownmillerites
and hexagonal structure oxides, have also been recently studied,17 but YSZ remains the
most widely used electrolyte material.2
YSZ posses a fluorite structure; cations occupy the corners and face-centered
positions of a cube and anions occupy the tetrahedral sites. The highest ionic
conductivity of YSZ is achieved by doping cubic zirconia (ZrO2) with 8 mol % of
15
yttria (Y2O3), the minimum amount required to stabilize the cubic zirconia. This
composition is commonly known as 8YSZ. The ionic conductivity is the result of
oxygen vacancies produced to compensate the electronic imbalance created by the
substitution of a fraction of Zr4+ in zirconia by Y3+.1,2,17 At 1000 °C, the ionic
conductivity of 8YSZ is 0.13 S/cm, and decreases to 0.09 S/cm after annealing for
1000 hours.18 The electronic conductivity is negligible at SOFC operation temperatures
and pressures.
YSZ exhibits properties particularly desirable in planar cell configurations,2,17,18
such as a high bend strength of 300 MPa at room temperature and 230 MPa at 1000 °C,
high fracture toughness of 3 MPa·m1/2, and a nearly constant TEC from 20 °C to 1500
°C of 10.3 x 10⁶ /K.19
There are three ways to increase the flux of ions through the electrolyte: by
increasing the temperature, by reducing the thickness or by the development of
materials with higher ionic conductivity.1 Given the current trend of decreasing the
operation temperature, reducing the thickness of the electrolyte is the obvious choice
since YSZ meets other requirements. Ishihara et al.17 suggested that for an electrolyte
with a resistance of 0.2 Ωcm2 in a cell with efficiency greater than 50 % and operating
at 700 °C, the thickness of the electrolyte should be less than 50 microns. Reductions in
operating temperature require further decreases in electrolyte thickness.
16
1.3.2.2 Anode
The anode is a porous component in contact with the electrolyte on one side
and a current collector on the other. The current collector side of the anode is exposed
to a reducing environment at high temperatures during the operation of the SOFC.
Various important processes take place in the anode that place strict requirements on
the microstructure and materials in the anode.20 First, the reaction sites where the
oxidation of the fuel takes place must be active. Second, it must allow fuel to be
delivered and by-products to be removed from the surface sites. Finally, electronic
transport must occur in the anode from the electrolyte/anode reaction sites to the
current collector and also some ionic transport towards the electrolyte interface.
The operating conditions of the SOFC impose stringent requirements on the
materials used in the anode.2,20 The anode must be dimensionally and chemically stable
under reducing environments while exhibiting chemical compatibility and closely
matched TEC with the electrolyte and the current collector. In addition, at least 30 vol
% connected porosity is required to allow the fuel pass through the anode and for the
elimination of reaction products. Lastly, good particle contact is important to provide
electronic and ionic mass transport since the anode materials must be excellent
electronic conductors and good ionic conductors.
The most commonly used material in the manufacturing of SOFC is a Ni/YSZ
cermet21 because it fulfills fairly well the anode requirements and it has a low cost. To
produce the cermet, a NiO/YSZ composite is first produced. Before SOFC operation,
and sometimes in situ, the NiO is reduced to metallic Ni, which provides an electronic
17
path. YSZ constitutes the skeleton of the anode, providing mechanical stability,
allowing ionic transport and contributing to the presence of triple phase boundaries
(TPB) which is where the reaction occurs.
Variations in the NiO/YSZ ratio allow tailoring of the desired characteristics of
the cermet, such as electronic conductivity, thermal expansion coefficient and degree
of porosity. It is very important to find the optimum ratio of NiO (and therefore Ni) to
YSZ to maximize the performance of the fuel cell.22 The optimum NiO content is
usually 40 vol %, which correspond to 30 vol % Ni after reduction. Higher Ni content
decreases the IR resistance as the IR resistance is sensitive to the contact area of nickel
on the electrolyte. On the other hand, polarization resistance relates to the Ni/YSZ ratio
and it is very low at 30 vol. % Ni. The mismatch in the coefficient of thermal
expansion between NiO and YSZ is very low when the volume percentage of NiO in
the cermet is 40 %. Given the volume fraction v of the components, the coefficient of
thermal expansion of the cermet can be calculated according to the logarithmic rule of
mixtures.
)ln()ln()ln( / YSZYSZNiONiOYSZNiO TECvTECvTEC += (1.10)
1.3.2.3 Cathode
The cathode is the other porous component of the SOFC in contact with the
electrolyte and a current collector. The side of the cathode in contact with the current
18
collector is where the oxidant is supplied to the SOFC, and it is in the cathode where
the reduction of the oxidant occurs.1,2,17 The cathode must exhibit dimensional and
chemical stability under oxidizing environments, and chemical compatibility and close
matching of the TEC with the electrolyte and the current collector. In addition, the
cathode must have the highest electronic conductivity possible in order to minimize
ohmic losses as well as a good catalytic activity to reduce activation polarization.
There are few materials that meet the requirements to be used as cathode
materials. Platinum was used in at the beginning of the development of SOFC, but its
cost makes it unreasonable for practical uses. A realistic alternative has been the use of
conductive metal oxides with a perovskite structure. From this class of materials,
strontium-doped lanthanum manganite has been preferred over other compositions due
to its high electrical conductivity in reducing atmospheres, low reactivity with YSZ,
and tolerable thermal expansion mismatch with other cell components.
Perovskites are cubic structures with a chemical formula ABO3, in which a
large cation, A, is located in the center position, surrounded by 8 smaller cations, B, in
the corners of the cube and 12 oxygen atoms in the edge centered positions of the cube.
La3+Mn3+O2-3 has an orthorhombic structure at room temperature.2,17 Oxidation
of Mn3+ to Mn4+ at 600 °C increases the oxygen content. The stoichiometry of oxygen
strongly affects the crystallography of the material, and in this case there is a
crystallographic transformation to the rhombohedral structure. Substituting small
amounts of La3+ by Sr2+ increases the concentration of Mn4+ and therefore the oxygen
content, allowing the existence of rhombohedral LaMnO3 at lower temperatures.
19
Changes in the oxygen stoichiometry must be avoided especially during fabrication, as
this may affect the dimensional stability of the cathode.
In the high-temperature operation range, La1-xSrxMnO3-δ (LSM) has been the
preferred choice for SOFC cathodes due to its chemical 23 and mechanical 24 stability in
the presence of YSZ electrolyte, high oxygen diffusivity 25, and mixed ionic-electronic
conductivity 26.
1.3.3 SOFC geometry
There are two main configurations for a SOFC: tubular and planar.2 Tubular
and planar designs have been evaluated, with the former being more structurally stable,
but the latter having a better performance in terms of power density per mass or
volume and lower fabrication costs.2,27,28 In the case of fuel cell stacks, the dense
components, electrolyte and interconnect can be fabricated independently to avoid
difficulties in the co-sintering, allowing multiple manufacturing options. For example,
screen printing can be used to produce the electrodes on a sintered tape cast electrolyte.
1.3.4 Seals
Seals are required at the electrodes to prevent oxidant and fuel from mixing.
Gas leakage is a major problem in the testing of SOFC.29 Air leakage into the anode
compartment decreases the reversible voltage value, as mentioned in section 1.3.1.
Compressive seals lead to non-uniform stress distribution resulting in cracking of the
20
layers. Glass or glass-ceramics seals are preferred over other ceramic materials
because: (1) they are easy to place due to their softness at elevated temperatures, (2)
stresses induced during the process or by differences in thermal expansion may be
relaxed at the operating temperatures, (3) at lower temperature the rigid glass limits the
risk of fracture due to handling, (4) cracks in glass seals can be healed by heat
treatment and (5) the stoichiometry can be varied to tailor the properties of the glass
seal. All of these are further incentives to reduce the 1000 ºC operating temperature, as
most glasses are not able to withstand such high temperatures.
1.3.5 Disadvantages of SOFC
The high operating temperature of a SOFC represents a challenge as it hastens
the breakdown of cell components.2,3,30 Mechanical stresses are enhanced at high
temperatures due to mismatch in the TEC between the cell components. In addition,
interfacial reactions may occur at high temperatures during fabrication and operation of
the cells. All this makes the materials selection critical for the components to survive
over the lifetime of the SOFC.2,3,31
1.4 INTERMEDIATE-TEMPERATURE SOLID OXIDE FUEL CELLS (IT-SOFC)
The current trend in the development of SOFC is to be able to operate at
intermediate temperatures, in the range of 600 to 800 °C. Decreasing the operating
temperature for SOFC would bring some advantages6,27,31,32: the overall cost of the
21
SOFC can be decreased as interconnects, heat exchangers, and structural components
could be fabricated from relatively inexpensive metal components rather than the
oxides that are currently used. The use of low-cost materials reduces the total cost of
the SOFC. The reduced operation temperature would also enhance durability of SOFC
by reducing the temperature variations experienced by the components during thermal
cycling.
1.4.1 Requirements
The main problem with decreasing the operating temperature is the drop in the
cell voltage due to the increased polarization losses, particularly at the electrolyte. This
issue is addressed with a double requirement in design of intermediate-temperatures
SOFC (IT-SOFC): first, the electrolyte must be very thin and second, the cathode
materials must have an adequate level of catalytic activity at the intermediate operation
temperatures. From a design point of view, thinner components represent a challenge
for structural stability and manufacturability of the fuel cell.
1.4.2 Thin Electrolytes Manufacturing Techniques
The fabrication of SOFC is based in the manufacturing of their component
layers. There are a wide variety of techniques. Factors such as design, characteristics of
the raw materials, compatibility between subsequent techniques, availability of
22
equipment and cost, will determine which process is the best to use for each SOFC
configuration. Table 1.26 shows a classification of the most common methods.
Thinner electrolytes can compensate for the reduction in the ionic conductivity
of YSZ at reduced operating temperatures. In order to exhibit sufficient ionic
conductance, the thickness of the electrolyte should not exceed about 15 μm. A variety
of techniques have been proposed to produce electrolytes of reduced thickness for solid
oxide fuel cells. Common examples in the literature are chemical vapor deposition
(CVD) 6,33, electrochemical vapor deposition (EVD)6,33, electrostatic assisted vapor
deposition (EAVD)34, electrophoretic deposition35, cathodic electrodeposition36,
colloidal deposition37, spark-plasma sintering38, spin coating39, centrifugal casting16,
spray coating40, tape calendaring41, and DC magneton sputtering6,42. Most of these
techniques require special facilities that result in increased manufacturing costs. An
established technology, such as tape casting, is cost efficient, but it has until now been
used primarily to produce electrolyte-supported SOFC thick electrolytes.6 Screen
printing and tape casting are called “thick film techniques” but they can also be used to
produce films from 10 to 150 μm as the components of self-supported SOFC.
For screen printing, a ceramic powder, an organic binder and a plasticizer are
mixed to form a viscous paste that is forced through the open meshes of a screen and
deposited onto a substrate. Parameters that affect the final result are: particle size and
form, surface properties, packing density of the powder, sintering temperature, time
and atmosphere.6

23
A slurry similar to the one used for screen printing is prepared for tape casting.
Green tapes of different thickness are produced using a device called a doctor blade.
The resulting flexible tape can be cut to size, corrugated, or otherwise formed prior to
firing. This technique has been used for the fabrication of large area, thin, flat ceramic
layers for monolithic and planar SOFC with YSZ electrolytes and cermet anodes.2,6
24
Table 1.2. Methods for deposition of thin ceramic films.6
Chemical Vapor Deposition (CVD)
Chemical Vapor
Deposition Techniques
Electro-chemical
Vapor Deposition
(EVD)
Vapor-phase-electrolytic deposition (VED) Thermophoresis Assisted CVD (TA-CVD) Chemical Aerosol Deposition Technology (CADT)
Chemical Methods
Liquid Precursor
Route
Sol Gel Spray Pyrolysis
Thermal Spray Technology
(Conventional Spray
Techniques)
Flame Spraying (FS) Air Plasma Spraying (APS) Low-Pressure Plasma Spraying (LPPS) Detonation Flame Spraying (DFS) Electric Arc Spraying (EAS) High Velocity Oxyfuel Spraying (HVOF)
Laser
Deposition Techniques
Pulsed Laser Deposition (PLD) Laser Spraying
Physical Methods
PVD Techniques
RF-sputtering technique Reactive DC Current Magneton Sputtering
Thick Film Techniques
Screen Printing Tape Casting Slurry Coating Technique Slip Casting Filter Pressing
Dep
ositi
on M
etho
ds fo
r Cer
amic
Thi
n Fi
lms
Ceramic Powder
Processing Methods
Thin Film Techniques
Tape Calendaring Electrophoretic Deposition (EPD) Transfer Printing
25
1.4.3 Current Status
The use of lower operating temperatures requires the use of new material
compositions for the cathodes. LSM has been the most common cathode material used
in SOFC, but its catalytic activity decreases dramatically in the intermediate range of
operation temperatures,25,43 particularly during long duration tests.44 In an effort to
obtain similar or improved performance at intermediate operation temperatures, new
compositions have been explored. These materials should show an adequate mixed
conductivity below 800 °C, and still be compatible in all other aspects with the
electrolyte material. For this reason, other perovskite materials45,46, and perovskite-
related intergrowth structures47 have been investigated as candidates for IT-SOFC
cathodes.
Ni/YSZ cathode can be used over a wider range of temperatures than LSM.
This continues to be a common anode material for IT-SOFC.
Few groups have used both tape casting to produce SOFC with thin electrolytes
and LSM as the cathode material. For example, Ohrui et al. 48 has produced cells with a
electrolyte thickness of 15 μm and achieved a power density of 0.45 W/cm2 at 1000
°C; whereas the thickness of the electrolyte in the cells produced by Simner et al. 44
was 10 μm and the power density was between 0.20-0.35 W/cm2 at 800 °C.
26
1.5 SCOPE OF THIS STUDY
There are two main aspects in this work: first, the development of a
manufacturing method to produce IT-SOFC using an economically advantageous
process that can be easily scaled; second, the testing of IT-SOFC with cathode
compositions that exhibit an adequate catalytic activity at intermediate temperatures,
and have a smaller TEC mismatch with the electrolyte.
The anode and electrolyte material that are used in this study are the same as
those used for high temperature SOFC. The first objective is the production of anode-
supported, flat IT-SOFC with thin electrolytes by tape casting, co-firing and screen
printing. The second objective is to test the performance at 600 ºC, 700 ºC and 800 °C
of thin-electrolyte IT-SOFC focusing on cathode materials with low TEC: perovskite
oxides and perovskite-related intergrowth oxides that have been suggested as the
cathode materials for IT-SOFC 45-47,49. The compositions to be studied are:
Perovskite oxides:
• Nd0.6Sr0.4CoO3-δ (NSC)
• Nd0.6Sr0.4Co0.5Fe0.5O3-δ (NSCF)
• Nd0.6Sr0.4Co0.5Fe0.5O3-δ-Ag composite (NSCF-Ag)
Perovskite-related intergrowth oxides:
• Sr2.7 La0.3Fe1.4Co0.6O7-δ (SLFCO7)
• LaSr3Fe1.5Co1.5O10-δ (LSFCO10)
Specific details on these compositions will be given in the appropriate sections.
27
Chapter 2: Experimental Procedures
The first part of this chapter is devoted to the manufacturing of the IT-SOFC.
Each one of the components of the cell and materials used will be addressed, as well as
the overall preparation of the cells. The later part of this chapter will deal with the
characterization techniques used to analyze the performance and microstructure of the
cells.
2.1 MANUFACTURING OF IT-SOFC
To achieve the objectives of this work, SOFC with thin electrolytes were
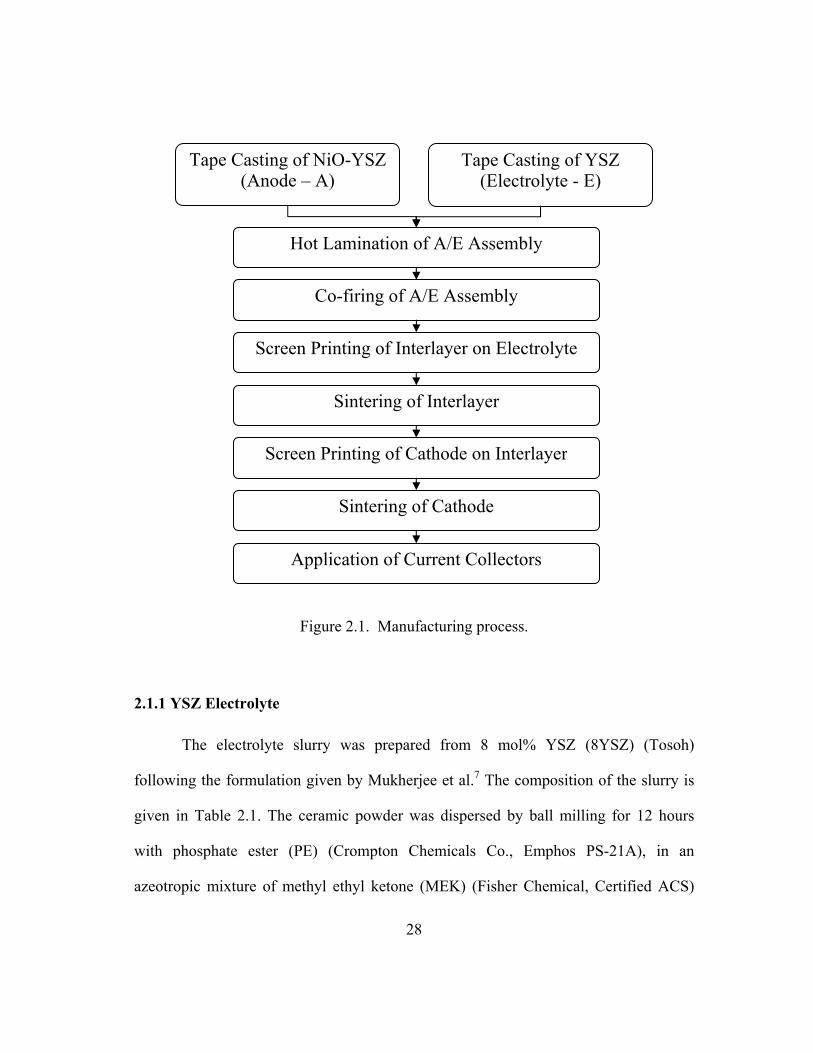
produced using tape casting, screen printing and co-firing. Figure 2.1 shows a summary
of the manufacturing processes that were followed to produce IT-SOFC. The biggest
challenge faced in the fabrication of SOFC is maintaining the structural stability of the
individual components as well as of the whole assembly during fabrication and
operation.21 The thermal expansion coefficient of adjacent materials must also be
matched to avoid cracking; thin layers produced by tape casting are difficult to handle,
and they tend to curl during sintering.
The anode and electrolyte materials were prepared by tape casting from
commercially available materials. The interlayer and cathode materials were produced
in our laboratory. Details on the synthesis of the cathode materials will be given later
in the corresponding chapter.
28
Figure 2.1. Manufacturing process.
2.1.1 YSZ Electrolyte
The electrolyte slurry was prepared from 8 mol% YSZ (8YSZ) (Tosoh)
following the formulation given by Mukherjee et al.7 The composition of the slurry is
given in Table 2.1. The ceramic powder was dispersed by ball milling for 12 hours
with phosphate ester (PE) (Crompton Chemicals Co., Emphos PS-21A), in an
azeotropic mixture of methyl ethyl ketone (MEK) (Fisher Chemical, Certified ACS)
Tape Casting of NiO-YSZ(Anode – A)
Tape Casting of YSZ (Electrolyte - E)
Hot Lamination of A/E Assembly
Co-firing of A/E Assembly
Screen Printing of Interlayer on Electrolyte
Sintering of Interlayer
Screen Printing of Cathode on Interlayer
Sintering of Cathode
Application of Current Collectors
29
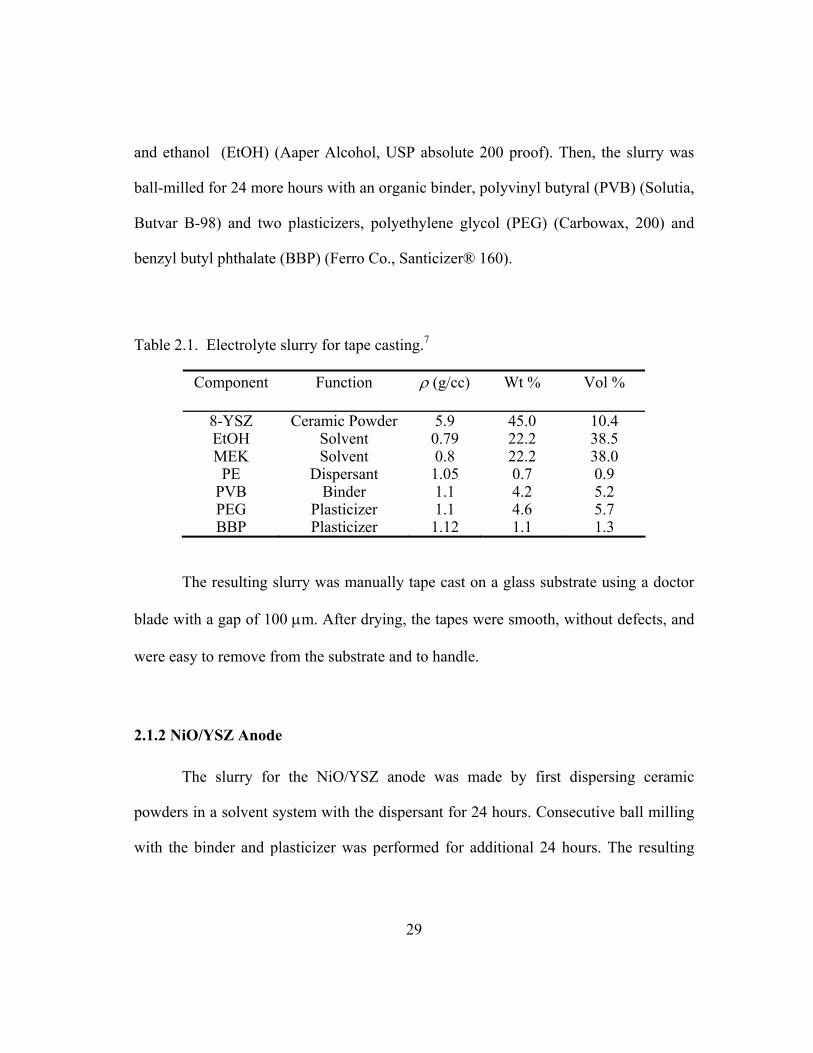
and ethanol (EtOH) (Aaper Alcohol, USP absolute 200 proof). Then, the slurry was
ball-milled for 24 more hours with an organic binder, polyvinyl butyral (PVB) (Solutia,
Butvar B-98) and two plasticizers, polyethylene glycol (PEG) (Carbowax, 200) and
benzyl butyl phthalate (BBP) (Ferro Co., Santicizer® 160).
Table 2.1. Electrolyte slurry for tape casting.7
Component Function ρ (g/cc) Wt % Vol %
8-YSZ Ceramic Powder 5.9 45.0 10.4 EtOH Solvent 0.79 22.2 38.5 MEK Solvent 0.8 22.2 38.0
PE Dispersant 1.05 0.7 0.9 PVB Binder 1.1 4.2 5.2 PEG Plasticizer 1.1 4.6 5.7 BBP Plasticizer 1.12 1.1 1.3
The resulting slurry was manually tape cast on a glass substrate using a doctor
blade with a gap of 100 μm. After drying, the tapes were smooth, without defects, and
were easy to remove from the substrate and to handle.
2.1.2 NiO/YSZ Anode
The slurry for the NiO/YSZ anode was made by first dispersing ceramic
powders in a solvent system with the dispersant for 24 hours. Consecutive ball milling
with the binder and plasticizer was performed for additional 24 hours. The resulting
30
slurry was tape cast onto a glass substrate with a doctor blade with a 400 μm gap,
unless otherwise noted.
Several different formulations were studied in order to find the best
composition. An ideal anode would have a TEC similar to that of the electrolyte, an
adequate level of porosity, and be easy to handle during the assembly of the cells. The
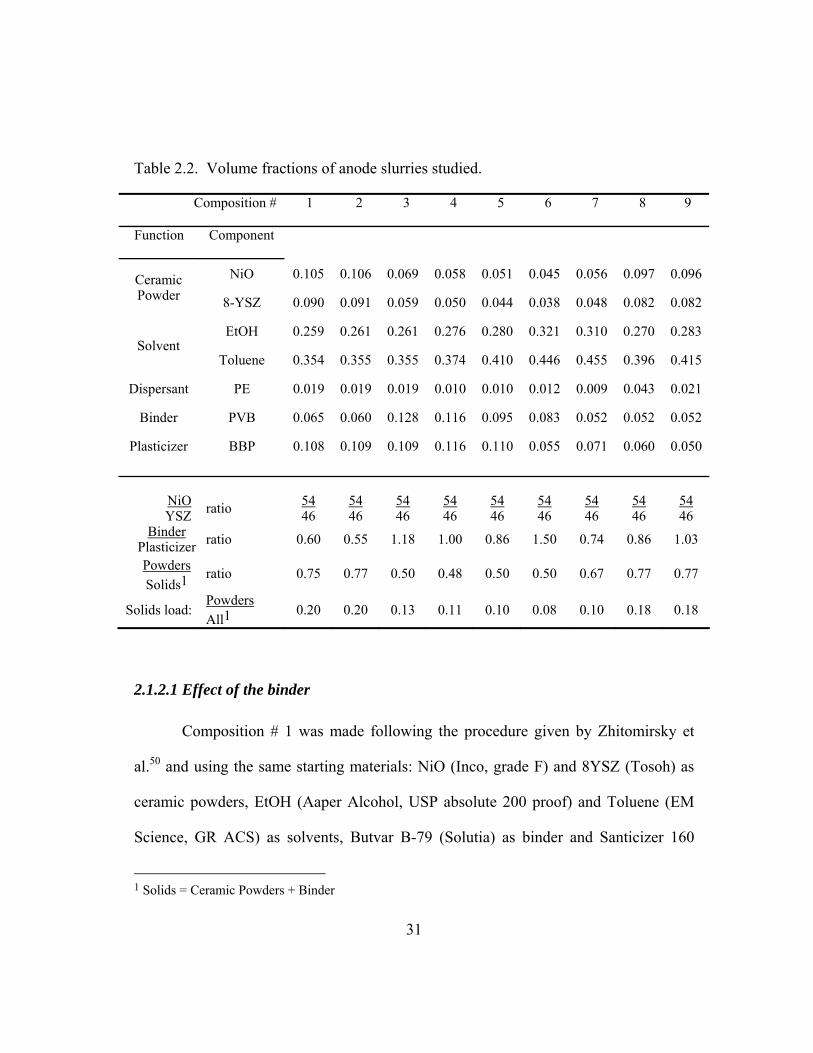
volume fraction of the components of each of the compositions that were studied is
shown in Table 2.2.
31
Table 2.2. Volume fractions of anode slurries studied.
Composition # 1 2 3 4 5 6 7 8 9
Function Component
NiO 0.105 0.106 0.069 0.058 0.051 0.045 0.056 0.097 0.096 Ceramic Powder 8-YSZ 0.090 0.091 0.059 0.050 0.044 0.038 0.048 0.082 0.082
EtOH 0.259 0.261 0.261 0.276 0.280 0.321 0.310 0.270 0.283 Solvent
Toluene 0.354 0.355 0.355 0.374 0.410 0.446 0.455 0.396 0.415
Dispersant PE 0.019 0.019 0.019 0.010 0.010 0.012 0.009 0.043 0.021
Binder PVB 0.065 0.060 0.128 0.116 0.095 0.083 0.052 0.052 0.052
Plasticizer BBP 0.108 0.109 0.109 0.116 0.110 0.055 0.071 0.060 0.050
NiO YSZ ratio 54
46 54 46
54 46
54 46
54 46
54 46
54 46
54 46
54 46
Binder Plasticizer ratio 0.60 0.55 1.18 1.00 0.86 1.50 0.74 0.86 1.03
Powders Solids1
ratio 0.75 0.77 0.50 0.48 0.50 0.50 0.67 0.77 0.77
Solids load: Powders All1
0.20 0.20 0.13 0.11 0.10 0.08 0.10 0.18 0.18
2.1.2.1 Effect of the binder
Composition # 1 was made following the procedure given by Zhitomirsky et
al.50 and using the same starting materials: NiO (Inco, grade F) and 8YSZ (Tosoh) as
ceramic powders, EtOH (Aaper Alcohol, USP absolute 200 proof) and Toluene (EM
Science, GR ACS) as solvents, Butvar B-79 (Solutia) as binder and Santicizer 160
1 Solids = Ceramic Powders + Binder
32
(Ferro) as dispersant. The only difference was the kind of dispersant used: Emphos
PS21-A (Crompton Chemicals Co.) instead of fish oil. The resulting tape was sticky
and it proved difficult to remove from the glass.
The function of the binder is to maintain the position of the ceramic powders in
the tape after solvent drying.51 The binder has a great effect in the mechanical
properties of the green tape. For the second composition, the amount of binder was
slightly reduced in order to ease the removal of the tape from the substrate. Everything
else remained the same, excepting that in this case, NiO was bought from another
supplier (Acros, Black 76 % Ni). The resulting slurry was tape cast in four different
ways:
a) using a doctor blade with a 150 μm gap onto glass.
b) using a doctor blade with a 400 μm gap onto glass.
c) using a doctor blade with a 150 μm gap onto an 8YSZ tape.
d) using a doctor blade with a 150 μm gap onto an 8YSZ tape.
The 8YSZ tape used in cases c) and d) was tape cast using a doctor blade with a 400
μm gap and it was dry.
The NiO/YSZ tapes started drying as soon as they were tape cast. Discs of 2.54
cm (1”) diameter were punched for all of the tapes. From cases a) and b), it was found
that the thicker the tape, the more difficult it was to remove from the glass substrate.
Samples from specimens c) and d) were easily removed. These ones were placed in a
1 All = Ceramic Powders + Solvents + Dispersant + Binder + Plasticizer.
33
tubular furnace to pyrolyze the organic binder using the following firing schedule:
from room temperature to 130 ºC at 3 ºC/min, to 275 ºC at 0.33 ºC/min, to 500 ºC at
0.66 ºC/min, to 600 ºC/min at 1.66 ºC/min, to room temperature at 2 ºC/min. Both
specimens exhibited cracks at the time when they were removed from the furnace. The
formation of cracks during pyrolysis was likely due to the mismatch between the TEC
of the electrolyte and the anode.
For the next trial, the relative volume of binder was increased with respect to
the ceramic powder loading with the expectation that this would cause the anode tapes
to shrink more uniformly when co-fired with the electrolyte tapes. The resulting
formulation was composition # 3. The volume fractions of ceramic powders and binder
were 1:1. The anode tapes produced with composition # 3 had a good appearance, but
they were rubbery, very deformable and difficult to remove from the glass substrate.
2.1.2.2 Effect of the plasticizer
Mistler51 recommends keeping the binder-to-plasticizer ratio larger than 1. The
effect of the variation of the relative volume of the plasticizer while keeping the same
volume fraction of ceramic powders and binder was studied in compositions 4, 5 and 6.
The tape was less rubbery and easier to handle when the binder-to-plasticizer ratio
decreased; but when the amount of plasticizer was increased, the tapes showed an
orange peel appearance soon after being tape cast. As a result, the binder to plasticizer
volume ratio was kept less than 1 for composition # 7.
34
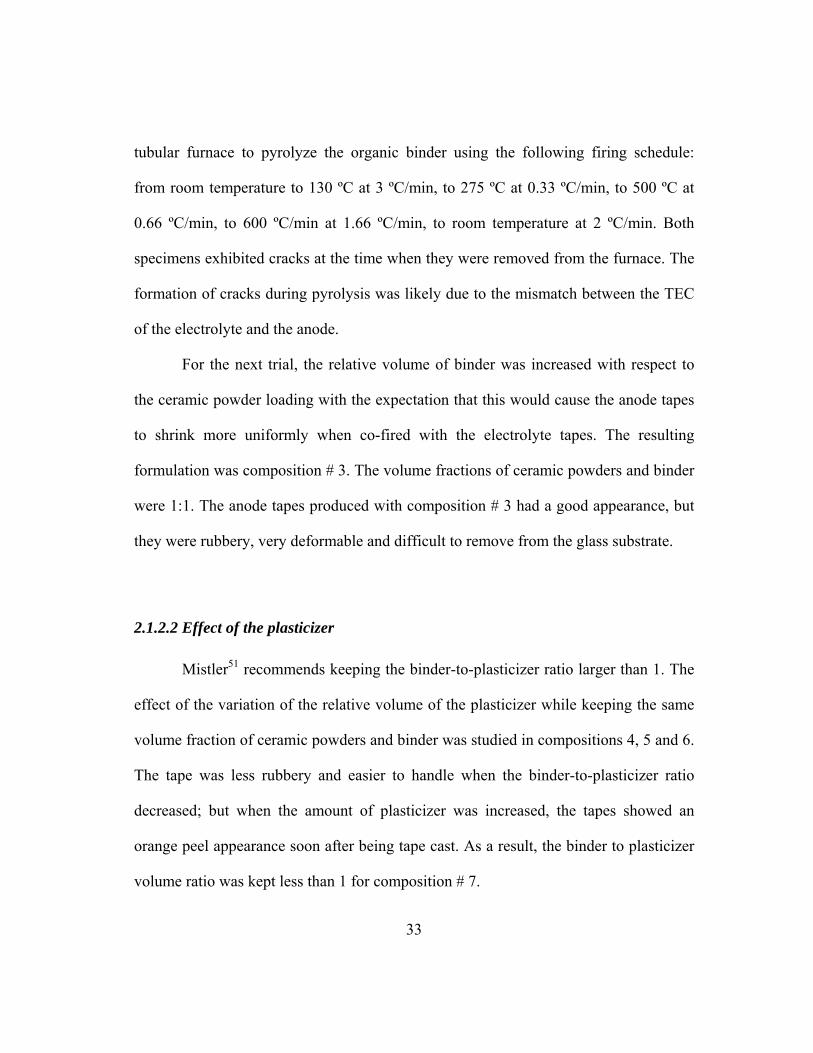
Figure 2.2. A/E assembly after pyrolysis. Anode was prepared with anode composition # 6.
In this last formulation, the ratio of ceramic powder volume fraction to the
solids fraction was the same as in the slurry used for the electrolyte. This slurry was
tape cast using two different gap thicknesses. The tapes cast with a 400 μm gap doctor
blade developed orange peel, whereas the tapes cast with a 150 μm gap doctor blade
had a nice appearance but were easily deformable. Some discs were punched from the
thick tape. Two discs of anode material were laminated with one disc of the electrolyte
material and co-fired following the schedule mentioned previously. The specimen
exhibited internal cracks after pyrolysis.
35
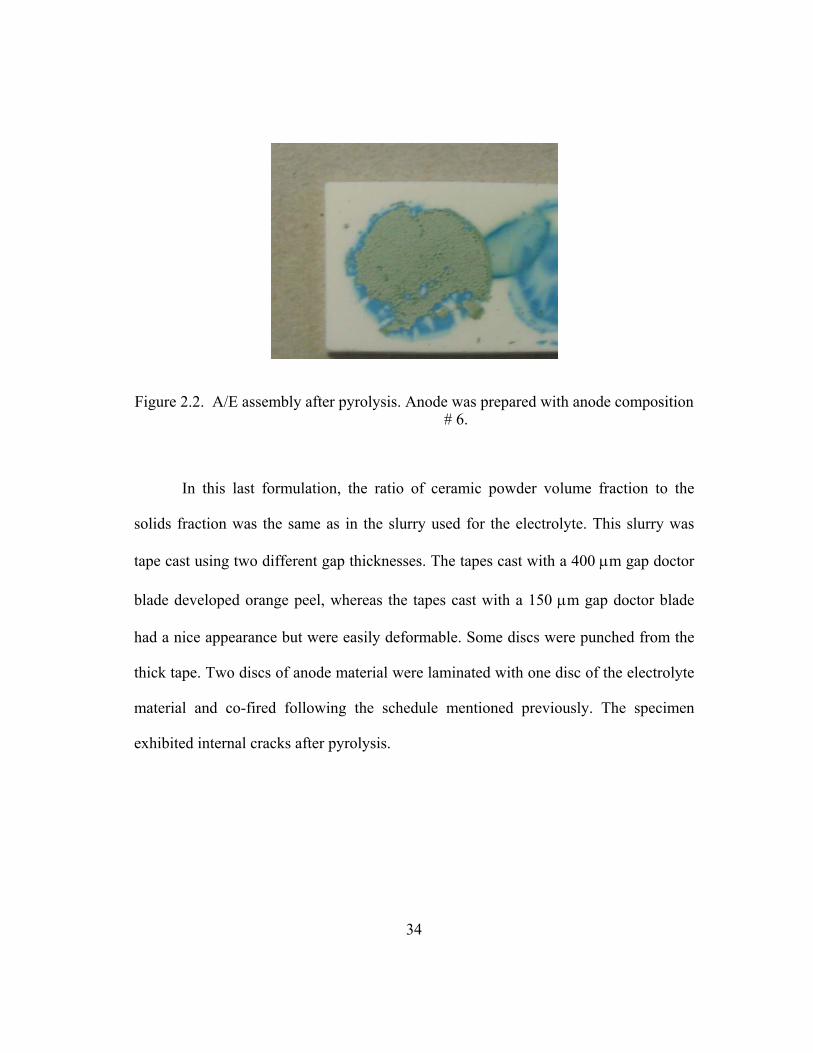
Figure 2.3. A/E assembly after pyrolysis. Anode was prepared with anode composition # 7.
2.1.2.3 Effect of the powder load
Composition # 8 was made following a formulation for powders with low
surface area in an oxidizing atmosphere found in Mistler et al.51 The main difference
from previous formulations was an increase in the volume fraction of ceramic powders
and dispersant. Tapes cast with 400 and 150 μm gap doctor blade had a smooth
appearance, although they were slightly difficult to handle. Discs were punched and
laminated with the electrolyte material. There were no major cracks during pyrolysis.
Combinations of different 8YSZ and NiO powders with different particle size
were tested to find the best match. The processability of the anode/electrolyte (A/E)
assemblies improves when using a coarser 8YSZ (Stanford). However, in terms of
electronic conductivity of the anode, it is better to have similar particle sizes for the
36
NiO and YSZ, so there is a good dispersion and the Ni particles are in contact with
each other after reduction. Tapes prepared with 8YSZ from Stanford and NiO from
Acros previously coarsened for 2 hours at 1000 ºC were too rubbery to be used. The
best tape was achieved when using 8YSZ from Tosoh and NiO from J.T. Baker.
Adjustments to the volume fractions of the dispersant and plasticizers lead to
composition # 9, which resulted in the one we used in the manufacturing of our cells.
This whole process shows the importance of using the right proportions in tape
casting formulations. The importance of the volume ratios of the binder and plasticizer
in the slurry can be particularly seen when comparing composition # 2 and 9.
2.1.2.4 Processing of Anode
The anode was prepared using a mixture of NiO (J.T. Baker) and 8 mol% YSZ
(Tosoh) at a volume ratio of 54:46. The weight ratio of NiO and YSZ was 57:43, which
should result in a 40 % volume of Ni in the anode after reduction.52 This corresponds to
a porosity level of 42 %, which is adequate to allow gas diffusion while maintaining
good electronic conductivity according to the percolation theory.20,53
37
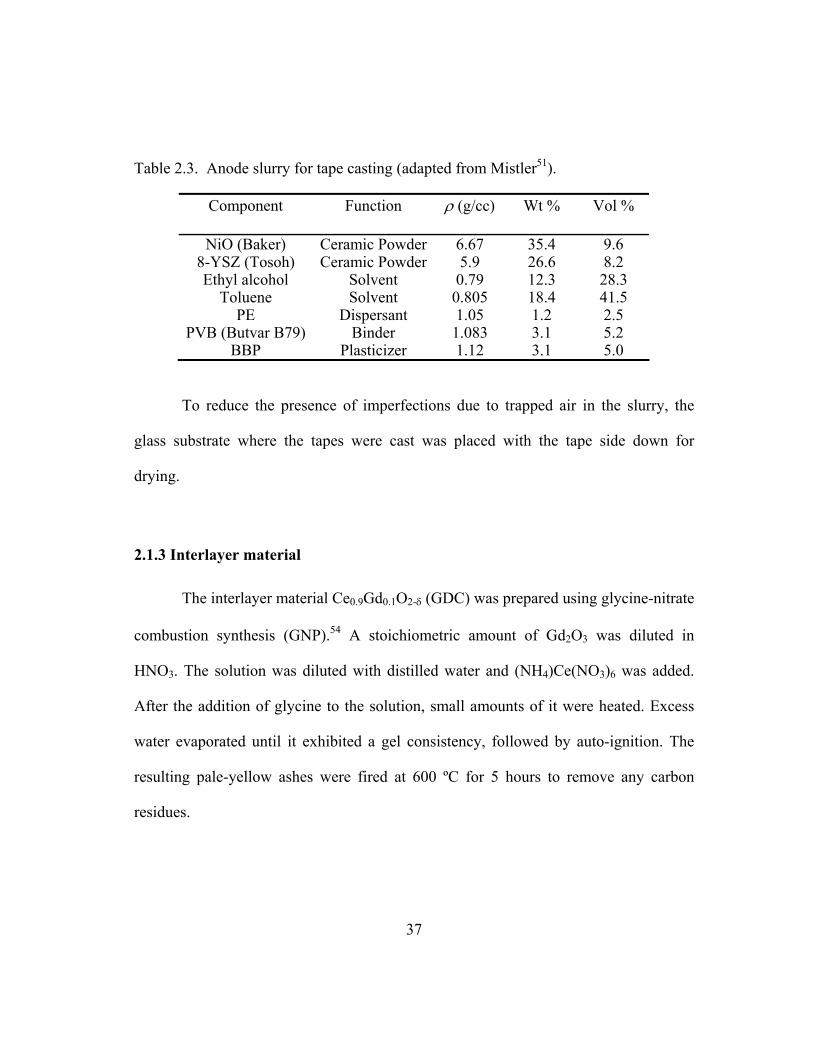
Table 2.3. Anode slurry for tape casting (adapted from Mistler51).
Component Function ρ (g/cc) Wt % Vol %
NiO (Baker) Ceramic Powder 6.67 35.4 9.6 8-YSZ (Tosoh) Ceramic Powder 5.9 26.6 8.2 Ethyl alcohol Solvent 0.79 12.3 28.3
Toluene Solvent 0.805 18.4 41.5 PE Dispersant 1.05 1.2 2.5
PVB (Butvar B79) Binder 1.083 3.1 5.2 BBP Plasticizer 1.12 3.1 5.0
To reduce the presence of imperfections due to trapped air in the slurry, the
glass substrate where the tapes were cast was placed with the tape side down for
drying.
2.1.3 Interlayer material
The interlayer material Ce0.9Gd0.1O2-δ (GDC) was prepared using glycine-nitrate
combustion synthesis (GNP).54 A stoichiometric amount of Gd2O3 was diluted in
HNO3. The solution was diluted with distilled water and (NH4)Ce(NO3)6 was added.
After the addition of glycine to the solution, small amounts of it were heated. Excess
water evaporated until it exhibited a gel consistency, followed by auto-ignition. The
resulting pale-yellow ashes were fired at 600 ºC for 5 hours to remove any carbon
residues.
38
2.1.5 Cell preparation
A detailed description of the cell preparation process is presented in Appendix
A. A summary is presented here.
After drying, 22.2 mm (7/8”) diameter discs were punched from the anode and
electrolyte tapes. Six discs of the anode material and one of the electrolyte material
were stacked and hot laminated in a manual 12 ton force Spectropress® for 10 minutes
at 85 ºC and 19.3 MPa to produce an anode/electrolyte assembly. The assemblies were
covered in non-stick, coated, ultra-heavy duty barbecue aluminum foil (All-Foils, Inc.)
and placed between ¼” thick polycarbonate plates to protect them during lamination.
The organics were pyrolyzed by heating slowly at 20 ºC/h from room
temperature to 160 ºC, followed by 40 ºC/h to 400 ºC, 100 ºC/h to 500 ºC, and cooled
at 2 ºC/min. The anode/electrolyte assembly was then co-fired for 2 h at 1400 ºC.
Heating and cooling ramps during the entire manufacturing process were 2 ºC/min. To
maintain the flatness of the assembly during pyrolysis, they were covered by graphite
and placed with the anode side facing up on a flat layer of coarsened YSZ in an
alumina crucible. The coated specimens were covered by more coarsened YSZ that
was later flattened. Finally, an alumina plate was placed on top. During co-firing, an
additional mass was placed on top of the alumina plates to produce a pressure of 500
Pa on each cell.
A GDC interlayer was applied by screen printing on the co-fired electrolyte.
The interlayer paste was a mixture of GDC powder with an organic vehicle (W. C.
Heraeus, V-006) in equal amounts. The interlayer/anode/electrolyte assembly was then
39
fired for 2 h at 1300 ºC. Cathodes were applied on the sintered interlayer by screen
printing in three passes. The applied paste was a mixture of the cathode powder and an
organic vehicle (W. C. Heraeus, V-006) in a weight proportion of 3:2. The cathodes
were sintered for 2 h. The sintering temperature for each cathode composition was
determined using a reactivity test. Details are given in section 2.2.
Prior to electrochemical testing, platinum current collectors were attached to the
electrodes. The current collector consisted of a 5 mm x 5 mm platinum gauze
interweaved and welded with a 0.005” diameter platinum wire. A small amount of
platinum ink (Heraeus, CL11-5100) was applied to the contour of the gauze before it
was placed on the electrode. First, a current collector was applied on top of the
cathode, followed by a second current collector applied on the anode at an angle of 90°
with respect to the first one. The fuel cell with the current collectors was then fired at
900 ºC for 30 minutes to remove organic products in the platinum ink.
2.2 CHARACTERIZATION TECHNIQUES
2.2.1 X-Ray Diffraction (XRD)
X-ray diffraction was used to confirm the stoichiometry of the interlayer and
cathode materials synthesized in our laboratory as well as to characterize the reactivity
between components of the IT-SOFC. The equipment used was a Philips X’PERT
diffractometer. The measurements were made using a rotary stage and monochromatic
40
Cu Kα radiation. The diffracted intensity was recorded from 2θ = 10 º- 90 º with a step
size of 0.05 º and 2 seconds as the step time.
2.2.2 Scanning Electron Microscopy (SEM)
The microstructure of the IT-SOFC was analyzed with scanning electron
microscopy of the fracture surfaces with a JEOL model LSM-5610. Prior to
observation, the specimens were broken manually and sputtered for 30-40 seconds with
a Pt-Au conductive layer.
2.2.3 Electrochemical Characterization
2.2.3.1 Seal formation
The quality of the seal is critical to prevent leaks and achieve an OCV value
close to the predicted by the Nernst equation. Prior to the electrochemical test, the fuel
cell was attached to two alumina rings using a glass paste made with 95 wt % glass
powder with a high TEC (Specialty Glass, SP737 TF-200) and 5 wt % of Duco cement.
At least 3 grams of such paste were used per cell. The glass powder and Duco cement
were mixed with acetone until a homogeneous consistency was achieved. Each one of
the alumina rings had to be fully joined with the electrolyte or the anode respectively
by the glass paste to compensate for any curvature in the cell. The alumina ring in
contact with the anode was attached to the alumina tube of the testing set up with a
41
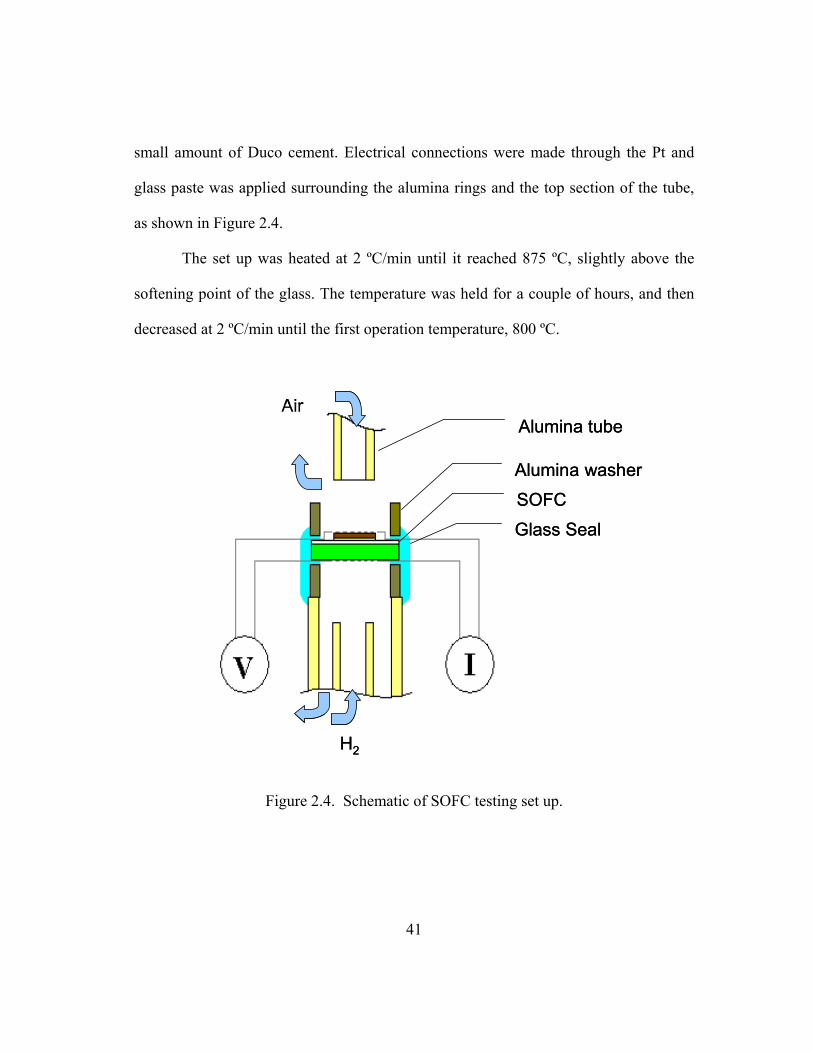
small amount of Duco cement. Electrical connections were made through the Pt and
glass paste was applied surrounding the alumina rings and the top section of the tube,
as shown in Figure 2.4.
The set up was heated at 2 ºC/min until it reached 875 ºC, slightly above the
softening point of the glass. The temperature was held for a couple of hours, and then
decreased at 2 ºC/min until the first operation temperature, 800 ºC.
H2
SOFC
Glass Seal
Alumina washer
Alumina tubeAir
H2
SOFC
Glass Seal
Alumina washer
Alumina tubeAir
Figure 2.4. Schematic of SOFC testing set up.
42
2.2.3.2 Anode reduction
Nitrogen gas was injected to the anode side of the setup to check for the
presence of leaks. If no leaks were present, the system was purged with nitrogen to
deplete oxygen from the atmosphere on the anode side. After at least a couple of hours
of running under 100 sccm of nitrogen and if no leaks were found, the nitrogen supply
was slowly decreased and replaced by hydrogen. In the mean time, air was gradually
supplied to the cathode until the flux was 100 sccm. The reduction of NiO to Ni in the
anode took place in the presence of the hydrogen at 800 ºC. Once the OCV had
stabilized at its maximum value, the electrochemical test was performed.
2.2.3.3 Electrochemical performance evaluation
The electrochemical tests were performed at three different temperatures: 800
ºC, 700 ºC and 600 ºC. Each one of the cells was tested at these temperatures in a
descending order and then in an ascending order. Humidified H2 (~ 3 % H2O at 30 ºC)
was supplied as the fuel to the anode and O2 as the oxidant to the cathode at 100 sccm.
I–V measurements were performed in situ using an Arbin BT2000 battery fuel cell test
station. At least two cells of each cathode composition tests were performed for each
material at each temperature.
43
Chapter 3: IT-SOFC with Perovskite Cathodes: Ln0.6Sr0.4Co1-yFeyO3 (Ln = La, Nd, y = 0, 0.5) cathodes
3.1 CATHODE MATERIALS EVOLUTION
As mentioned in Chapter 1, La1-xSrxMnO3-δ (LSM) exhibits multiple
advantages as a cathode material for high temperature SOFC.23-26 However, LSM is not
an attractive candidate to be used for IT-SOFC because, at temperatures below 900 ºC,
the activation polarization of LSM increases considerably.55 To improve the catalytic
activity at intermediate temperatures, Mn has been substituted with Co resulting in a
material with better performance at low temperatures.56,57 However, lanthanum
cobaltites exhibit a high TEC58 which is undesirable. A trade off between conductivity
and TEC is achieved by partially substituting Co for Fe, resulting in a
(La,Sr)(Co,Fe)O3 perovskite cathode material.58
In an attempt to reduce the TEC of cathode materials for IT-SOFC, studies have
been performed on cathodes with other lanthanides different from lanthanum in their A
sites.59-61 Even though neodymium cobaltites do not exhibit the highest catalytic
activity in the series, the TEC is decreased because the ionicity of the Nd-O bond is
smaller than for the La-O bond. Further studies have shown that the conductivity of
Nd1-xSrxCoO3 is optimized when the amount of dopant is x = 0.4.62 In an attempt to
reduce the TEC even more, studies have been performed on the effect of Fe in the B
44
sites of Nd0.6Sr0.4Co1-yFeyO3.46 However, the conductivity of this material is reduced
relative to the undoped compound. From this series, the smallest reduction in
conductivity occurs when y = 0.5. Impregnation of Nd0.6Sr0.4Co0.5Fe0.5O3 with silver
has also been attempted using La0.8Sr0.2Ga0.8Mg0.2O3-δ (LSGM) electrolytes in order to
achieve a high electrical conductivity while maintaining a low TEC.63 Thus, a number
of novel cathode materials have been studied using thick LSGM electrolytes which
have relatively poor conductance at intermediate operating temperatures. These
compounds have not been studied, however, at intermediate temperatures using YSZ
electrolytes. Since it is possible that the ohmic polarization at the electrolyte may be
dominant beyond low current densities for electrolytes with poor conductance due to
the large electrolyte thickness, it is necessary to study the behavior of these materials
using a high conductance electrolyte to know the best performance achievable. If YSZ
is used, it is important to use a thin YSZ electrolyte, which has good conductance.
The objective of this work is to evaluate the electrochemical performance of IT-
SOFC using thin YSZ electrolytes with high conductance and the following perovskite
cathode compositions:
• Nd0.6Sr0.4CoO3-δ (NSC)
• Nd0.6Sr0.4Co0.5Fe0.5O3-δ (NSCF)
• Nd0.6Sr0.4Co0.5Fe0.5-δ - Ag (NSCF-Ag)
Since the performance on SOFC are very sensitive to experimental parameters
including gas pressures and fluxes, cell geometry, and material microstructure, to draw
45
comparisons to the work of others, it is necessary to test different cathode compositions
using an identical cell geometry and experimental apparatus. Thus, although they have
higher TEC and therefore are less desirable for IT-SOFC the following cathode
compositions were also studied so that comparisons could be made with well-studied
materials:
• La0.6Sr0.4CoO3-δ (LSC)
• La0.6Sr0.4Co0.5Fe0.5O3-δ (LSCF)
3.2 EXPERIMENTAL PROCEDURE
IT-SOFC were prepared with the procedure detailed in Chapter 2. The synthesis
and characterization of the specific perovskite cathode compositions are explained in
the following sections.
3.2.1 Synthesis and Characterization of Ln0.6Sr0.4CoO3-δ (Ln = La, Nd)
LSC and NSC were synthesized by solid state reaction. The starting materials
were La2O3 (Alfa Aesar) (for LSC), Nd2O3 (Alfa Aesar) (for NSC), SrCO3 (Alfa
Aesar) and Co3O4 (GFS Chemicals). The first step in the preparation of each one of
these compounds was to dry the lanthanide oxide starting material for 2 hours at 1000
ºC to determine the weights necessary to obtain the stoichiometric mass required for
the synthesis of LSC and NSC. The dried lanthanide oxide was mixed using an agate
46
mortar and pestle with the required amounts of SrCO3 and Co3O4. The mixtures were
then fired in air for 48 hours for the LSC and for 72 hours for the NSC, with an
intermediate grinding every 24 hours. Finally, the powders were dry ball milled or
hand ground using ethanol with an agate mortar and pestle to achieve the desired
particle size. The composition of the powders was confirmed by XRD and the particle
size was observed by SEM (Figure 3.1).
3.2.2 Synthesis and Characterization of Ln0.6Sr0.4Co0.5Fe0.5O3-δ (Ln = La, Nd)
LSCF and NSCF were synthesized by co-precipitation. The starting materials
were La2O3 (Alfa Aesar) (for LSCF), Nd2O3 (Alfa Aesar) (for NSCF), SrCO3 (Alfa
Aesar), Co(CH3COO)2·H2O (Spectrum) and Fe(CH3COO)2 (GFS Chemicals). The first
step in the preparation of each one of these compounds was to dry the lanthanide oxide
starting material for 2 hours at 1000 ºC and weigh it shortly after to determine the
stoichiometric mass required for the synthesis of LSCF and NSCF. Required amounts
of SrCO3 and the acetates are dissolved in a dilute solution of the lanthanide oxide in
nitric acid. A 10 % (w/v) solution of equal amounts of KOH and K2CO3 were added
slowly until the pH reached a value equal to or greater than 11 which caused the
precipitation of the metal ions as carbonates and hydroxides. The precipitates were
filtered and washed with deionized water several times. The products were dried
overnight in an oven, and then calcined in air at 500 ºC for 5 hours. The calcined
powders were ground with an agate mortar and pestle. The powders were fired in air
47
for 24 hours at 1200 ºC. Finally, the powders were dry ball milled or hand ground
using ethanol with an agate mortar and pestle to achieve the desired particle size
distribution. The composition of the powders was confirmed by XRD and the particle
size was observed by SEM (Figure 3.2).
3.2.3 Synthesis of Nd0.6Sr0.4Co0.5Fe0.5O3-δ - Ag
NSCF powders were prepared by co-precipitation as described in the previous
section and applied by screen printing to IT-SOFC as explained in Chapter 2. Prior to
application of the current collector, the NSCF cathodes were loaded with 0.1 mg/cm2
(~ 0.5 wt %) of Ag by impregnation. A solution of AgNO3 (Alfa Aesar, ACS 99.9+%)
in a 1:1 (v/v) mixture of ethanol and water was used. The amount of solution required
for impregnation was calculated according to the silver content in the solution and the
cathode mass. The cathode mass was calculated from the weight difference of the cell
before screen printing the cathode and after cathode sintering.
))(()(
solutionofionConcentratmolepercationmetalofMasscationmetalofmassuiredReqonimpregnatiforvolumeSolution =
A 0.2 M solution was used to impregnate ~ 1 mg cathodes using a micropipette
by successive depositions of small amounts of the solution.
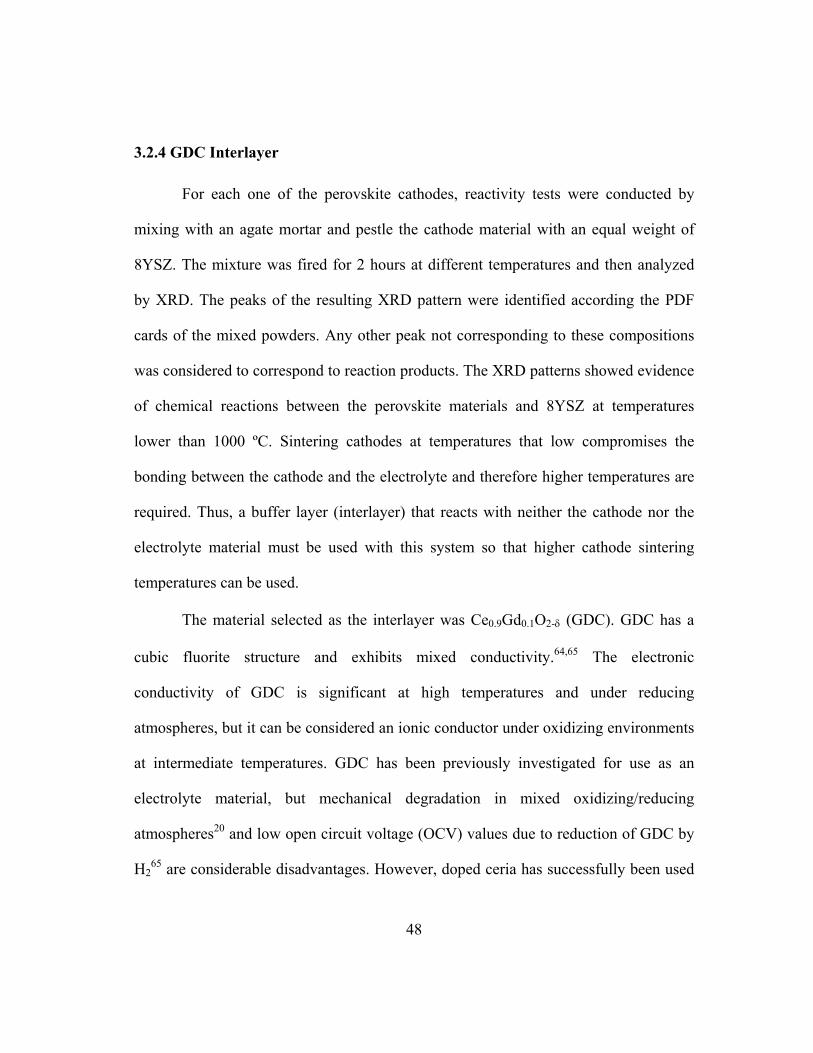
48
3.2.4 GDC Interlayer
For each one of the perovskite cathodes, reactivity tests were conducted by
mixing with an agate mortar and pestle the cathode material with an equal weight of
8YSZ. The mixture was fired for 2 hours at different temperatures and then analyzed
by XRD. The peaks of the resulting XRD pattern were identified according the PDF
cards of the mixed powders. Any other peak not corresponding to these compositions
was considered to correspond to reaction products. The XRD patterns showed evidence
of chemical reactions between the perovskite materials and 8YSZ at temperatures
lower than 1000 ºC. Sintering cathodes at temperatures that low compromises the
bonding between the cathode and the electrolyte and therefore higher temperatures are
required. Thus, a buffer layer (interlayer) that reacts with neither the cathode nor the
electrolyte material must be used with this system so that higher cathode sintering
temperatures can be used.
The material selected as the interlayer was Ce0.9Gd0.1O2-δ (GDC). GDC has a
cubic fluorite structure and exhibits mixed conductivity.64,65 The electronic
conductivity of GDC is significant at high temperatures and under reducing
atmospheres, but it can be considered an ionic conductor under oxidizing environments
at intermediate temperatures. GDC has been previously investigated for use as an
electrolyte material, but mechanical degradation in mixed oxidizing/reducing
atmospheres20 and low open circuit voltage (OCV) values due to reduction of GDC by
H265 are considerable disadvantages. However, doped ceria has successfully been used
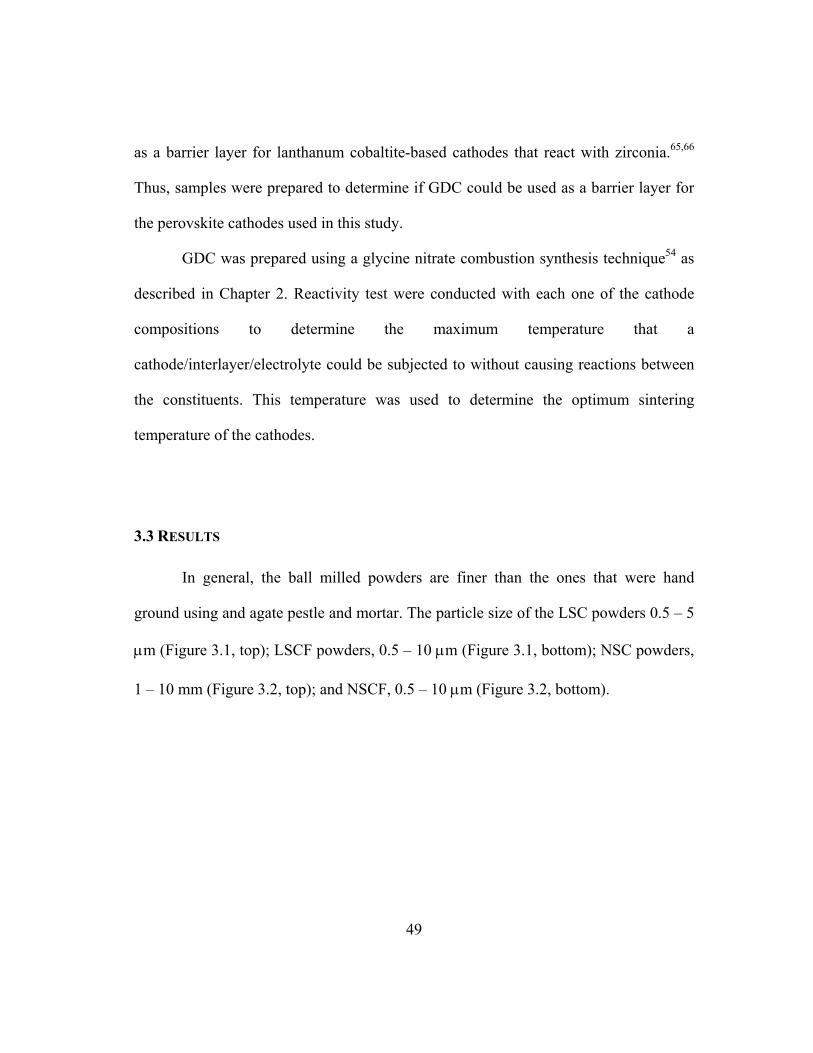
49
as a barrier layer for lanthanum cobaltite-based cathodes that react with zirconia.65,66
Thus, samples were prepared to determine if GDC could be used as a barrier layer for
the perovskite cathodes used in this study.
GDC was prepared using a glycine nitrate combustion synthesis technique54 as
described in Chapter 2. Reactivity test were conducted with each one of the cathode
compositions to determine the maximum temperature that a
cathode/interlayer/electrolyte could be subjected to without causing reactions between
the constituents. This temperature was used to determine the optimum sintering
temperature of the cathodes.
3.3 RESULTS
In general, the ball milled powders are finer than the ones that were hand
ground using and agate pestle and mortar. The particle size of the LSC powders 0.5 – 5
μm (Figure 3.1, top); LSCF powders, 0.5 – 10 μm (Figure 3.1, bottom); NSC powders,
1 – 10 mm (Figure 3.2, top); and NSCF, 0.5 – 10 μm (Figure 3.2, bottom).
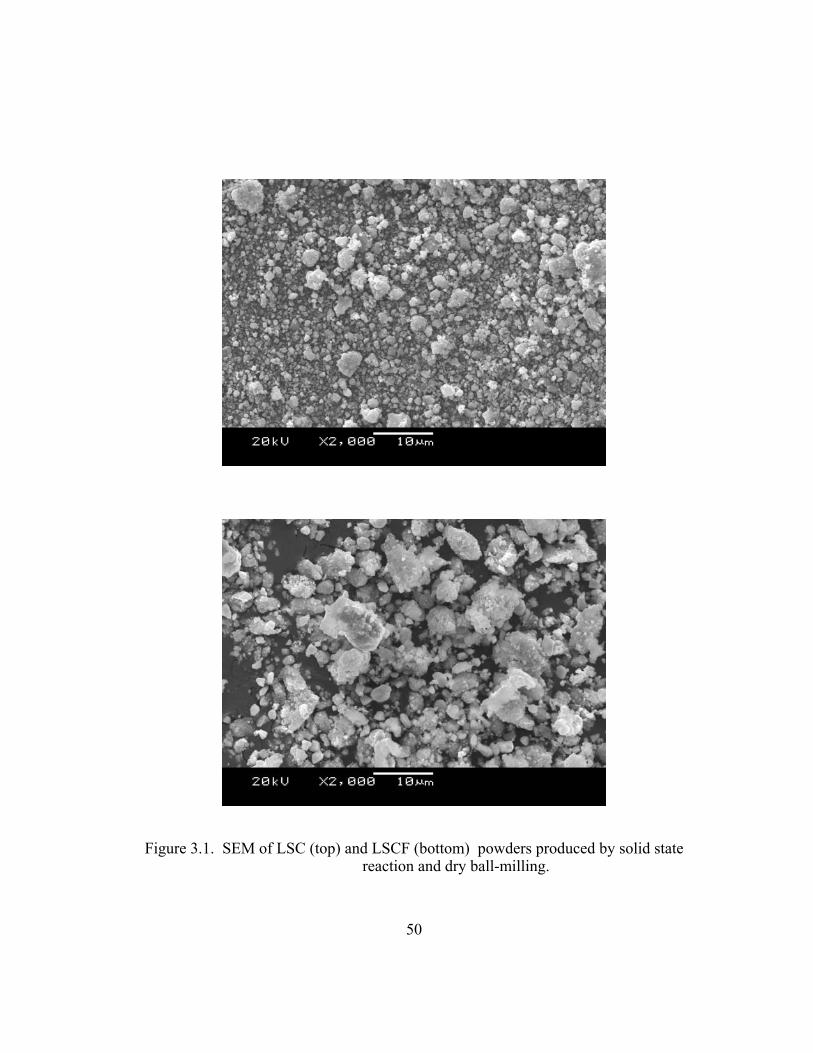
50
Figure 3.1. SEM of LSC (top) and LSCF (bottom) powders produced by solid state reaction and dry ball-milling.
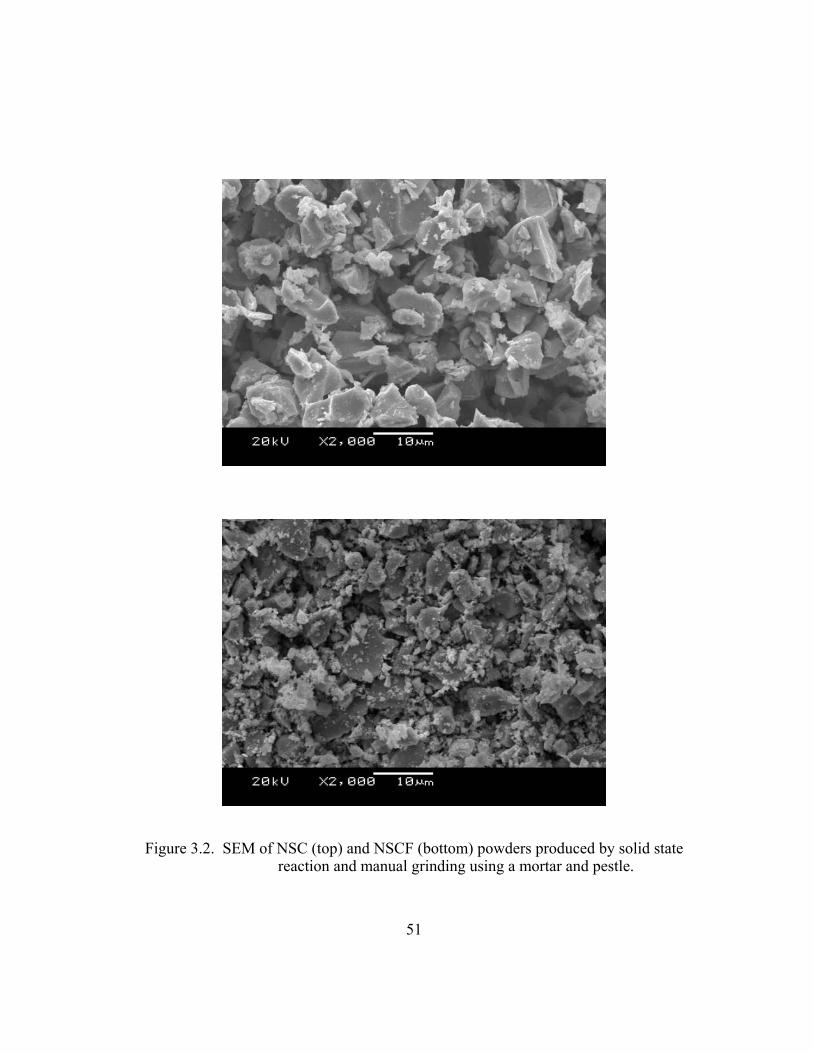
51
Figure 3.2. SEM of NSC (top) and NSCF (bottom) powders produced by solid state reaction and manual grinding using a mortar and pestle.
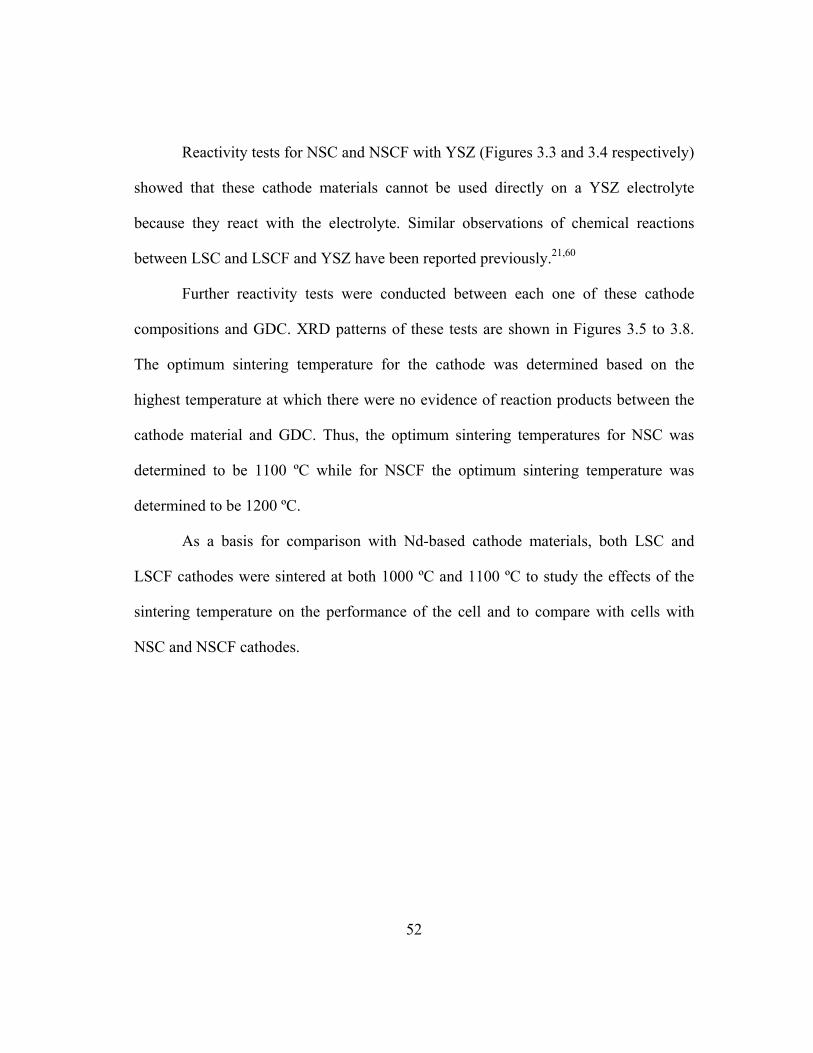
52
Reactivity tests for NSC and NSCF with YSZ (Figures 3.3 and 3.4 respectively)
showed that these cathode materials cannot be used directly on a YSZ electrolyte
because they react with the electrolyte. Similar observations of chemical reactions
between LSC and LSCF and YSZ have been reported previously.21,60
Further reactivity tests were conducted between each one of these cathode
compositions and GDC. XRD patterns of these tests are shown in Figures 3.5 to 3.8.
The optimum sintering temperature for the cathode was determined based on the
highest temperature at which there were no evidence of reaction products between the
cathode material and GDC. Thus, the optimum sintering temperatures for NSC was
determined to be 1100 ºC while for NSCF the optimum sintering temperature was
determined to be 1200 ºC.
As a basis for comparison with Nd-based cathode materials, both LSC and
LSCF cathodes were sintered at both 1000 ºC and 1100 ºC to study the effects of the
sintering temperature on the performance of the cell and to compare with cells with
NSC and NSCF cathodes.
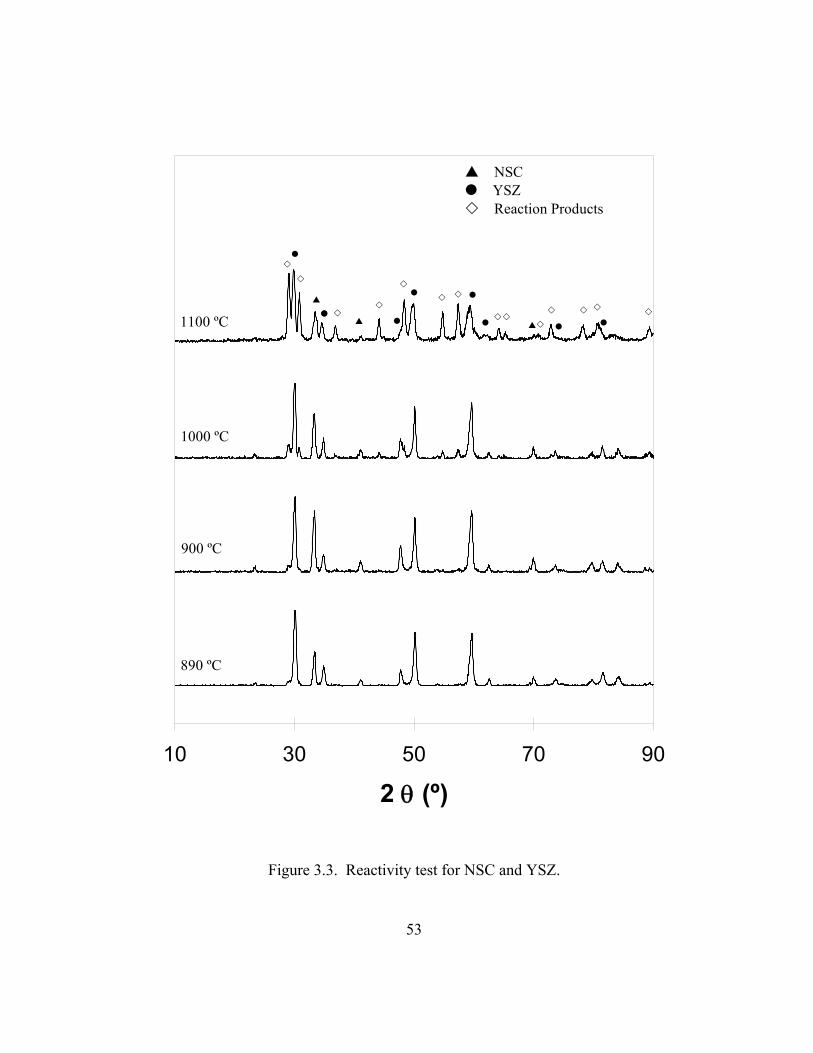
53
10 30 50 70 90
2 θ (º)
890 ºC
1100 ºC
1000 ºC
900 ºC
NSC YSZ Reaction Products
Figure 3.3. Reactivity test for NSC and YSZ.
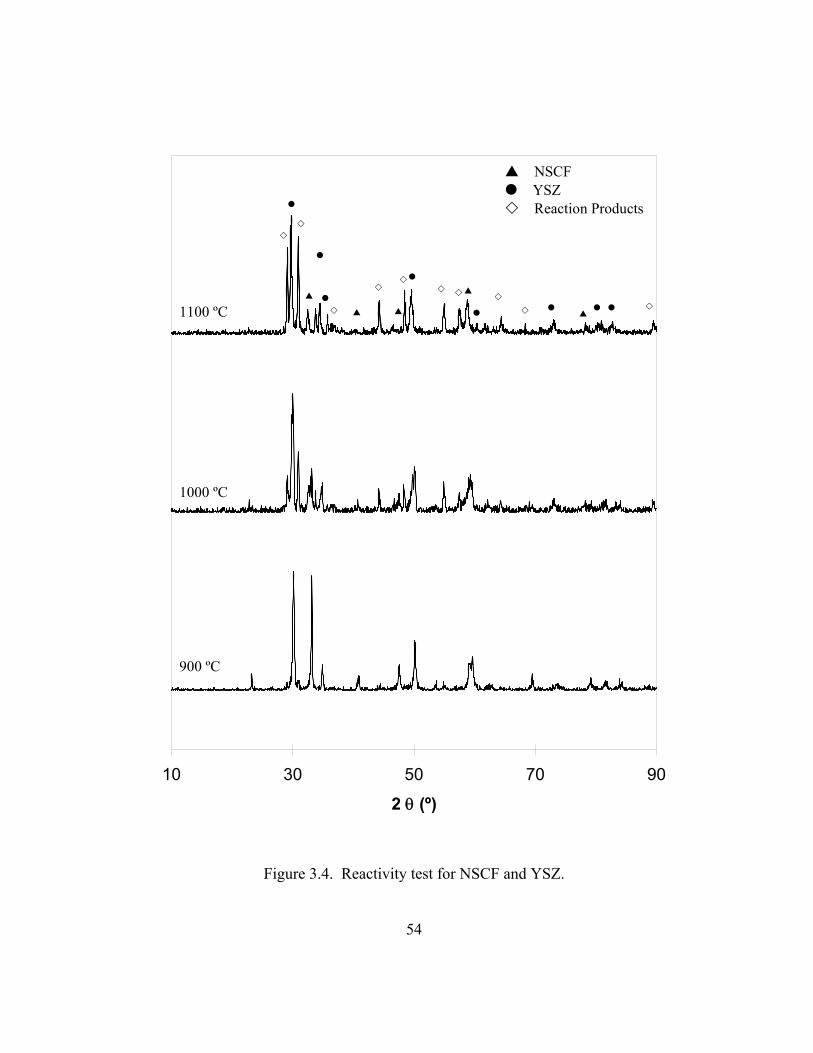
54
10 30 50 70 90
2 θ (º)
900 ºC
1100 ºC
1000 ºC
NSCF YSZ Reaction Products
Figure 3.4. Reactivity test for NSCF and YSZ.
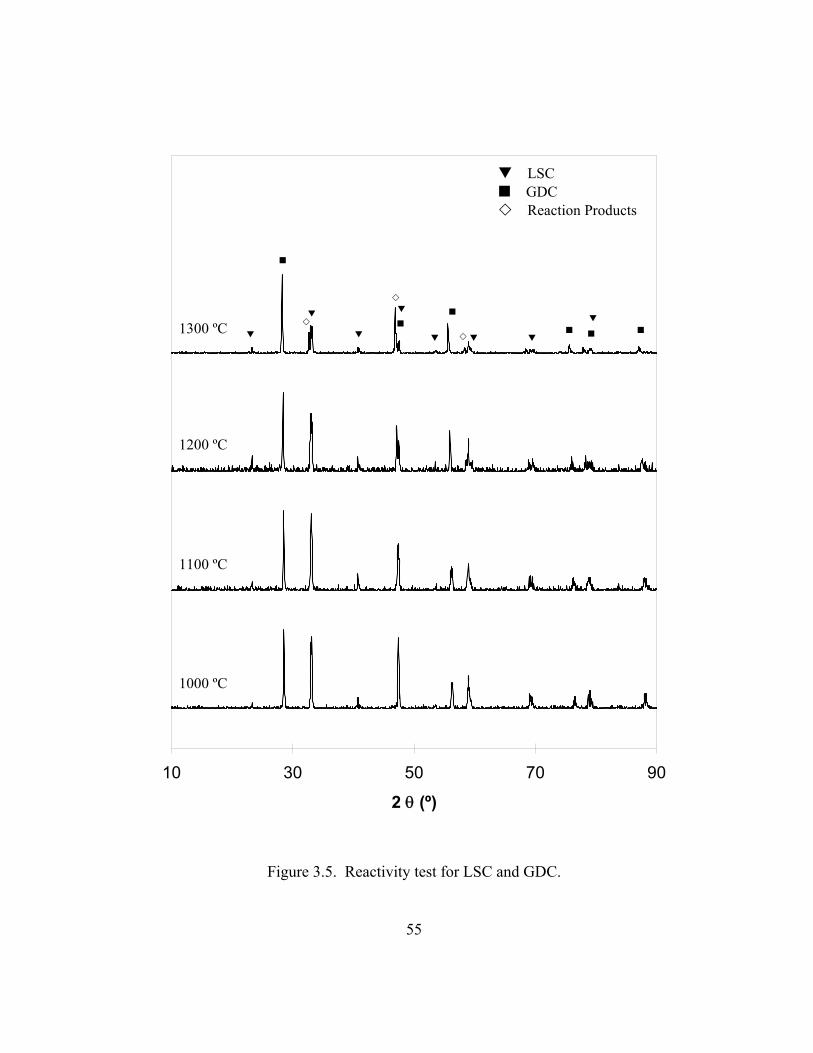
55
10 30 50 70 90
2 θ (º)
1000 ºC
1300 ºC
1200 ºC
1100 ºC
LSC GDC Reaction Products
Figure 3.5. Reactivity test for LSC and GDC.
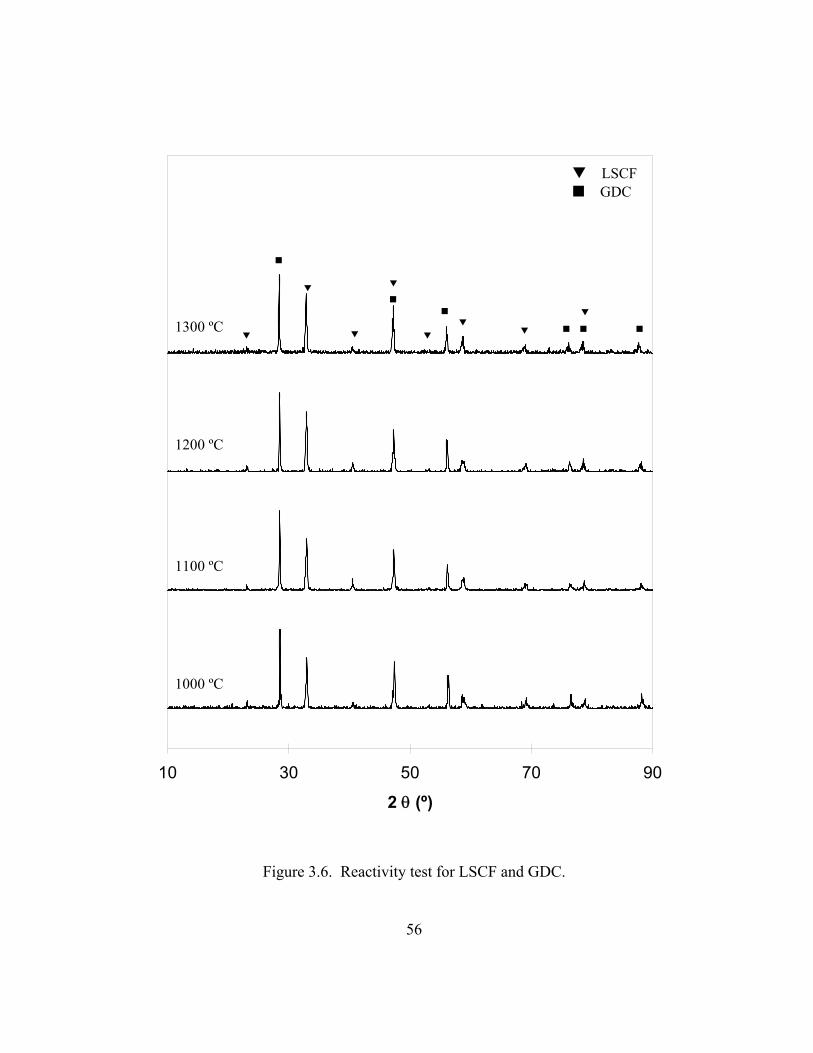
56
10 30 50 70 90
2 θ (º)
1000 ºC
1300 ºC
1200 ºC
1100 ºC
LSCF GDC
Figure 3.6. Reactivity test for LSCF and GDC.
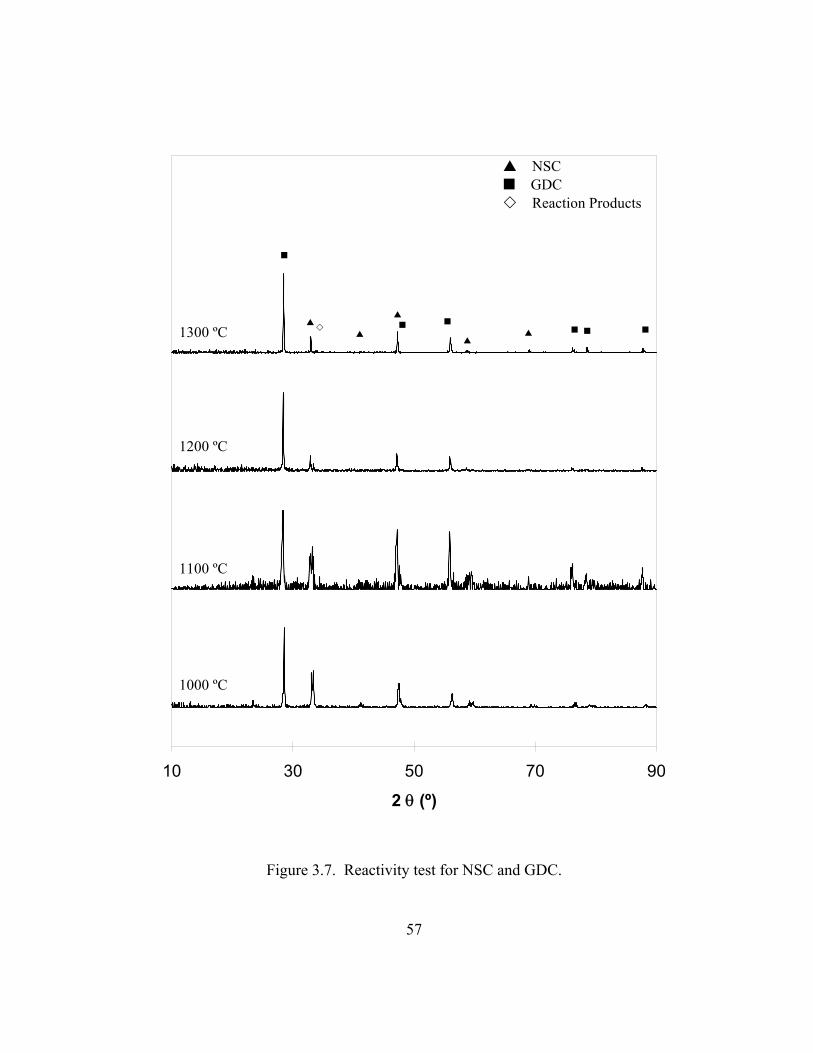
57
10 30 50 70 90
2 θ (º)
1000 ºC
1300 ºC
1200 ºC
1100 ºC
NSC GDC Reaction Products
Figure 3.7. Reactivity test for NSC and GDC.
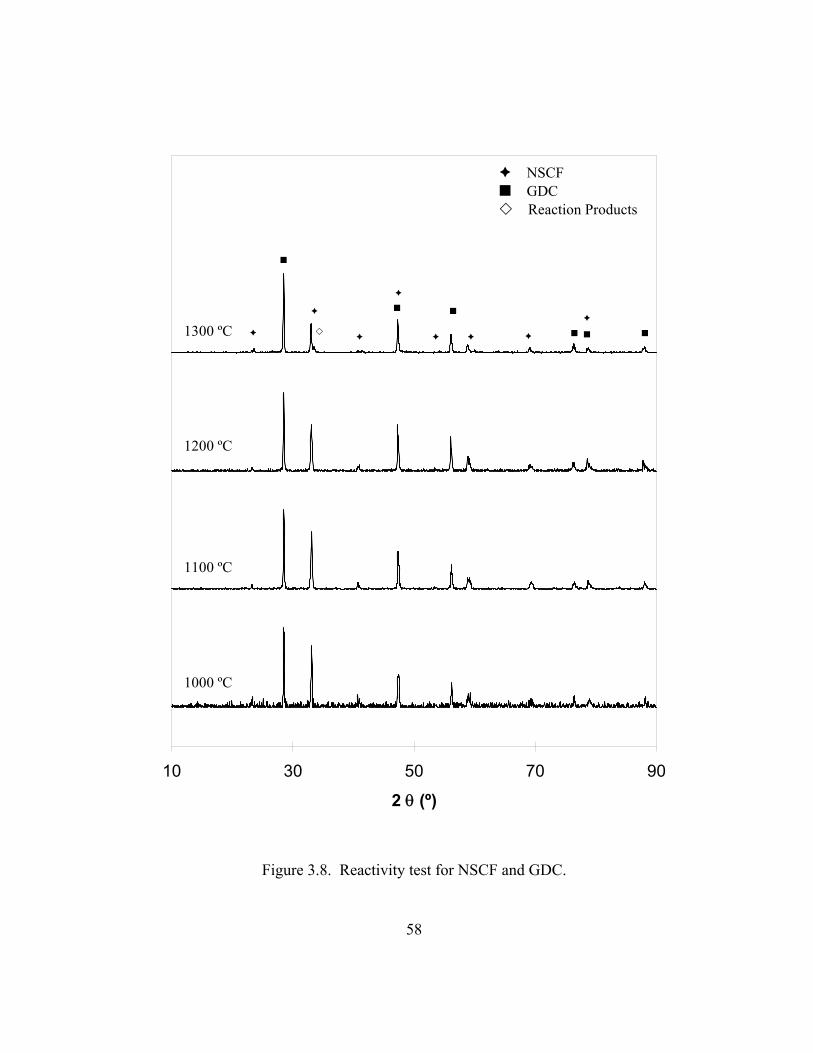
58
10 30 50 70 90
2 θ (º)
1000 ºC
1300 ºC
1200 ºC
1100 ºC
NSCF GDC Reaction Products
Figure 3.8. Reactivity test for NSCF and GDC.
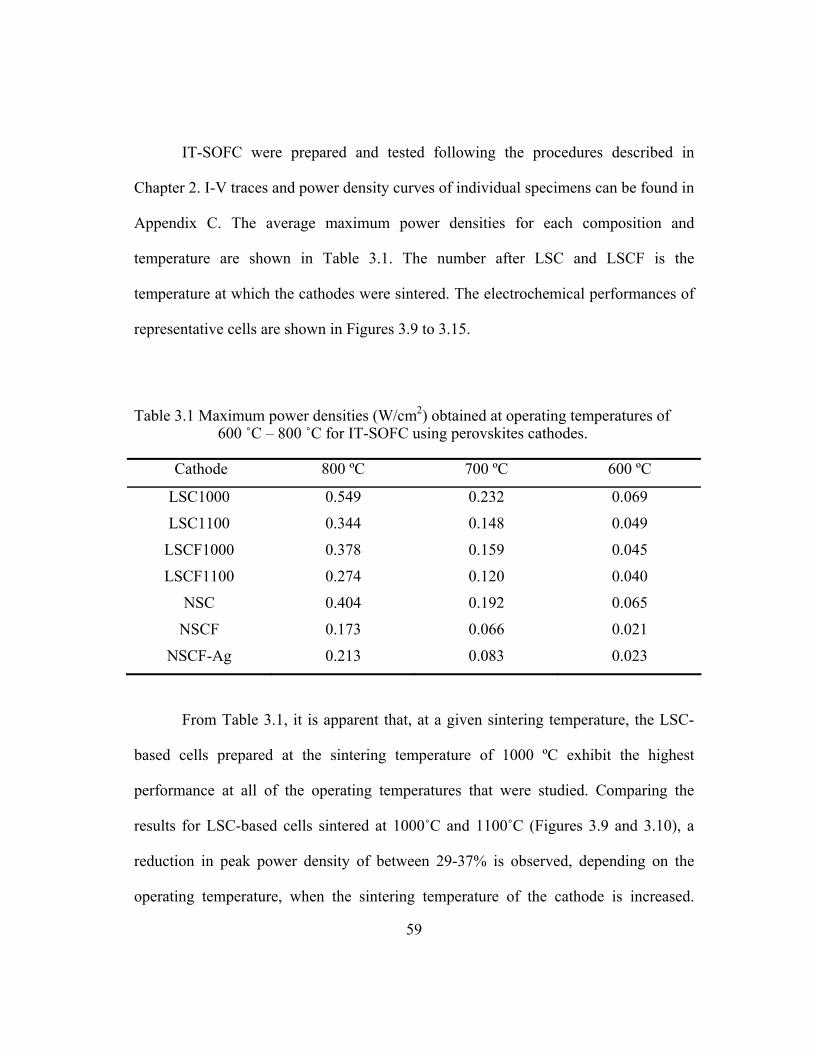
59
IT-SOFC were prepared and tested following the procedures described in
Chapter 2. I-V traces and power density curves of individual specimens can be found in
Appendix C. The average maximum power densities for each composition and
temperature are shown in Table 3.1. The number after LSC and LSCF is the
temperature at which the cathodes were sintered. The electrochemical performances of
representative cells are shown in Figures 3.9 to 3.15.
Table 3.1 Maximum power densities (W/cm2) obtained at operating temperatures of 600 ˚C – 800 ˚C for IT-SOFC using perovskites cathodes.
Cathode 800 ºC 700 ºC 600 ºC
LSC1000 0.549 0.232 0.069
LSC1100 0.344 0.148 0.049
LSCF1000 0.378 0.159 0.045
LSCF1100 0.274 0.120 0.040
NSC 0.404 0.192 0.065
NSCF 0.173 0.066 0.021
NSCF-Ag 0.213 0.083 0.023
From Table 3.1, it is apparent that, at a given sintering temperature, the LSC-
based cells prepared at the sintering temperature of 1000 ºC exhibit the highest
performance at all of the operating temperatures that were studied. Comparing the
results for LSC-based cells sintered at 1000˚C and 1100˚C (Figures 3.9 and 3.10), a
reduction in peak power density of between 29-37% is observed, depending on the
operating temperature, when the sintering temperature of the cathode is increased.
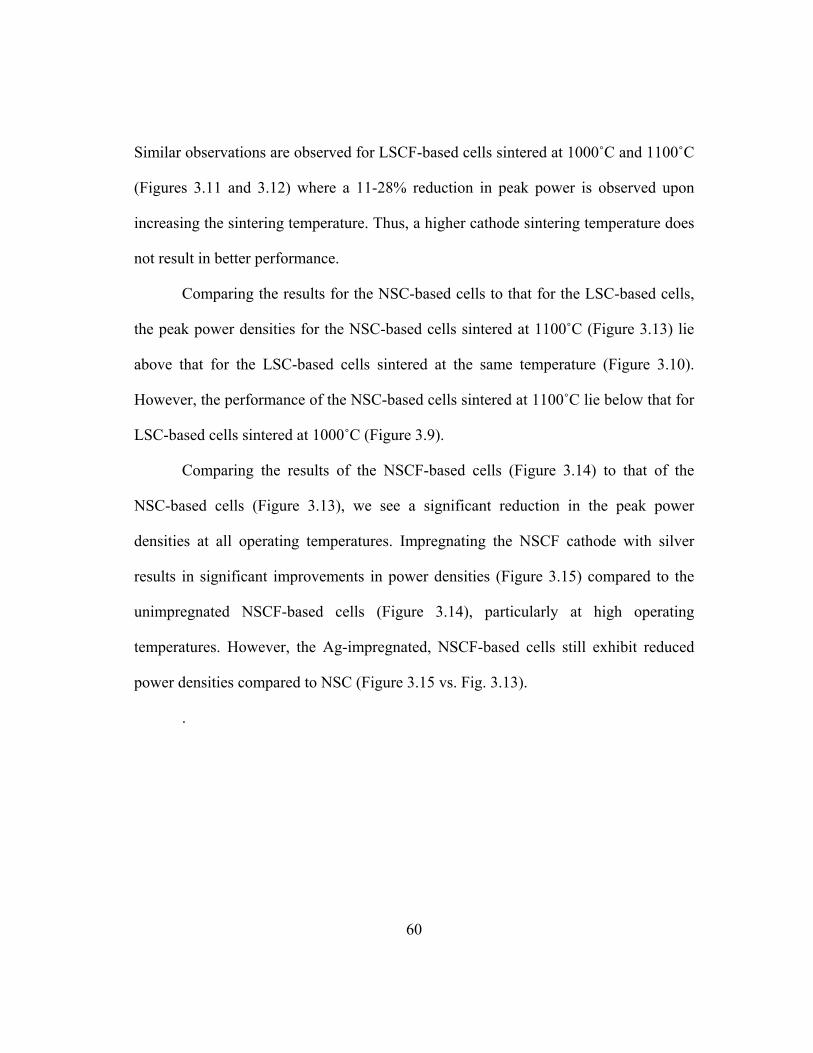
60
Similar observations are observed for LSCF-based cells sintered at 1000˚C and 1100˚C
(Figures 3.11 and 3.12) where a 11-28% reduction in peak power is observed upon
increasing the sintering temperature. Thus, a higher cathode sintering temperature does
not result in better performance.
Comparing the results for the NSC-based cells to that for the LSC-based cells,
the peak power densities for the NSC-based cells sintered at 1100˚C (Figure 3.13) lie
above that for the LSC-based cells sintered at the same temperature (Figure 3.10).
However, the performance of the NSC-based cells sintered at 1100˚C lie below that for
LSC-based cells sintered at 1000˚C (Figure 3.9).
Comparing the results of the NSCF-based cells (Figure 3.14) to that of the
NSC-based cells (Figure 3.13), we see a significant reduction in the peak power
densities at all operating temperatures. Impregnating the NSCF cathode with silver
results in significant improvements in power densities (Figure 3.15) compared to the
unimpregnated NSCF-based cells (Figure 3.14), particularly at high operating
temperatures. However, the Ag-impregnated, NSCF-based cells still exhibit reduced
power densities compared to NSC (Figure 3.15 vs. Fig. 3.13).
.
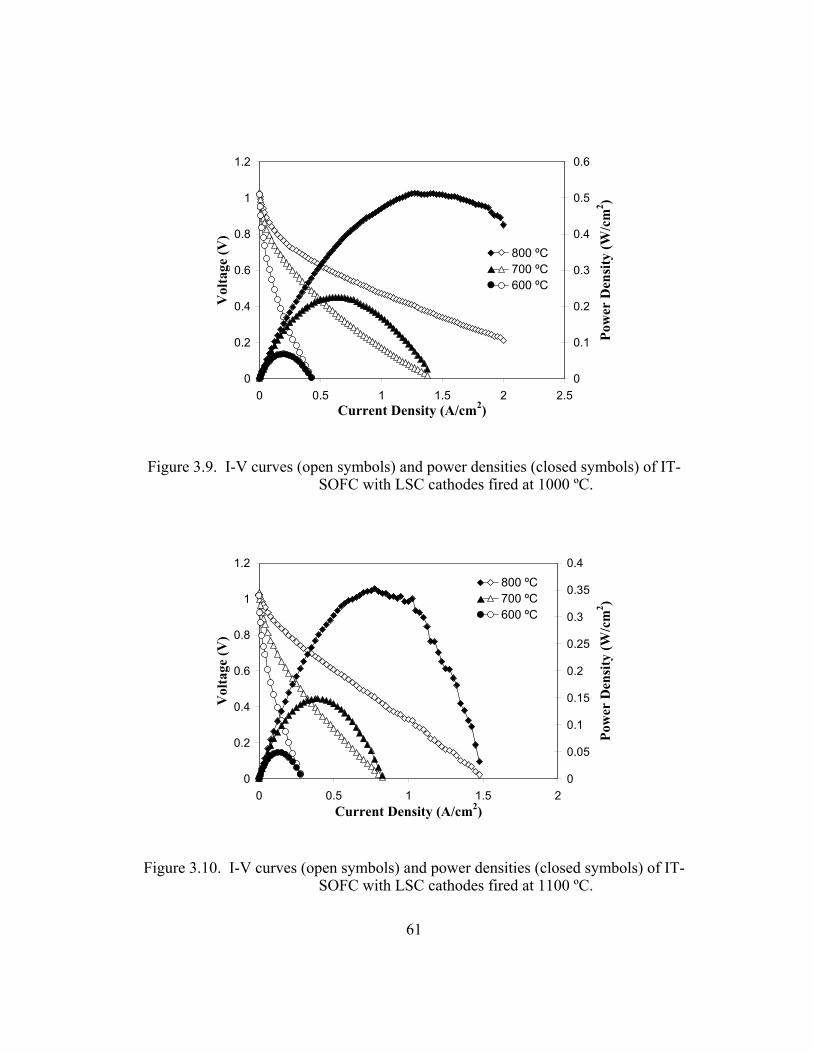
61
0
0.2
0.4
0.6
0.8
1
1.2
0 0.5 1 1.5 2 2.5Current Density (A/cm2)
Vol
tage
(V)
0
0.1
0.2
0.3
0.4
0.5
0.6
Pow
er D
ensi
ty (W
/cm
2 )
800 ºC700 ºC600 ºC
Figure 3.9. I-V curves (open symbols) and power densities (closed symbols) of IT-SOFC with LSC cathodes fired at 1000 ºC.
0
0.2
0.4
0.6
0.8
1
1.2
0 0.5 1 1.5 2Current Density (A/cm2)
Vol
tage
(V)
0
0.05
0.1
0.15
0.2
0.25
0.3
0.35
0.4
Pow
er D
ensi
ty (W
/cm
2 )
800 ºC700 ºC600 ºC
Figure 3.10. I-V curves (open symbols) and power densities (closed symbols) of IT-SOFC with LSC cathodes fired at 1100 ºC.
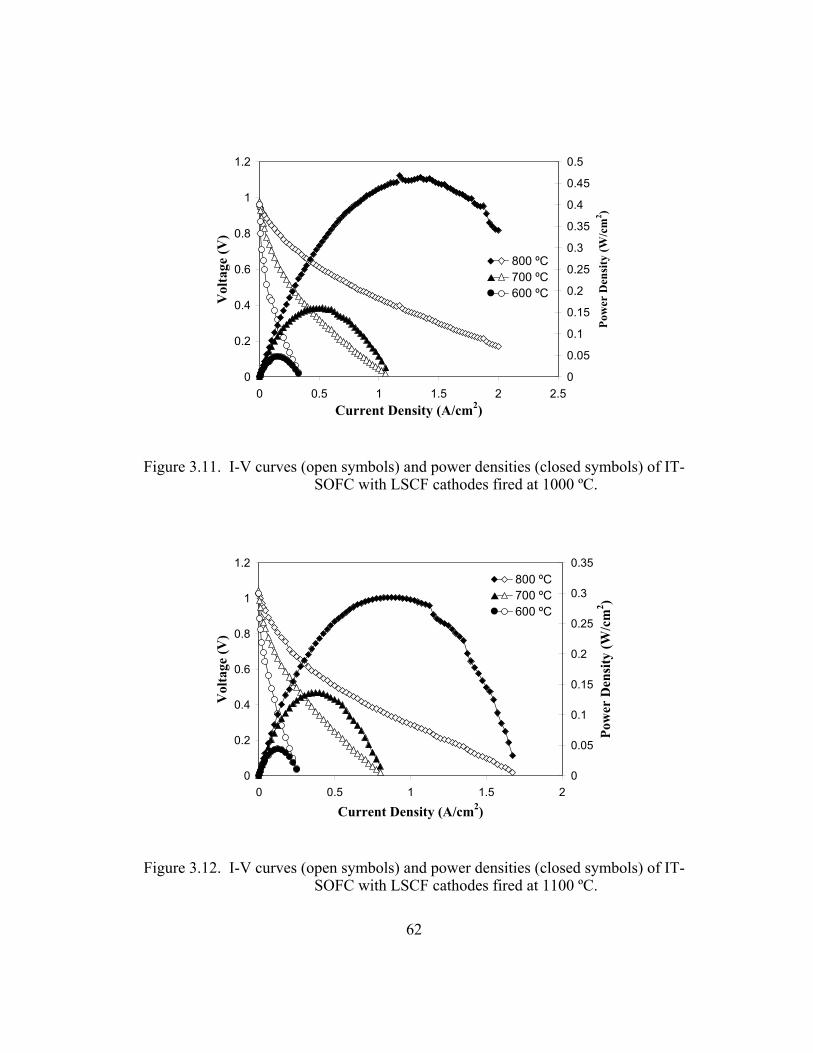
62
0
0.2
0.4
0.6
0.8
1
1.2
0 0.5 1 1.5 2 2.5Current Density (A/cm2)
Vol
tage
(V)
0
0.05
0.1
0.15
0.2
0.25
0.3
0.35
0.4
0.45
0.5
Pow
er D
ensi
ty (W
/cm
2 )
800 ºC700 ºC600 ºC
Figure 3.11. I-V curves (open symbols) and power densities (closed symbols) of IT-SOFC with LSCF cathodes fired at 1000 ºC.
0
0.2
0.4
0.6
0.8
1
1.2
0 0.5 1 1.5 2
Current Density (A/cm2)
Vol
tage
(V)
0
0.05
0.1
0.15
0.2
0.25
0.3
0.35
Pow
er D
ensi
ty (W
/cm
2 )
800 ºC700 ºC600 ºC
Figure 3.12. I-V curves (open symbols) and power densities (closed symbols) of IT-SOFC with LSCF cathodes fired at 1100 ºC.
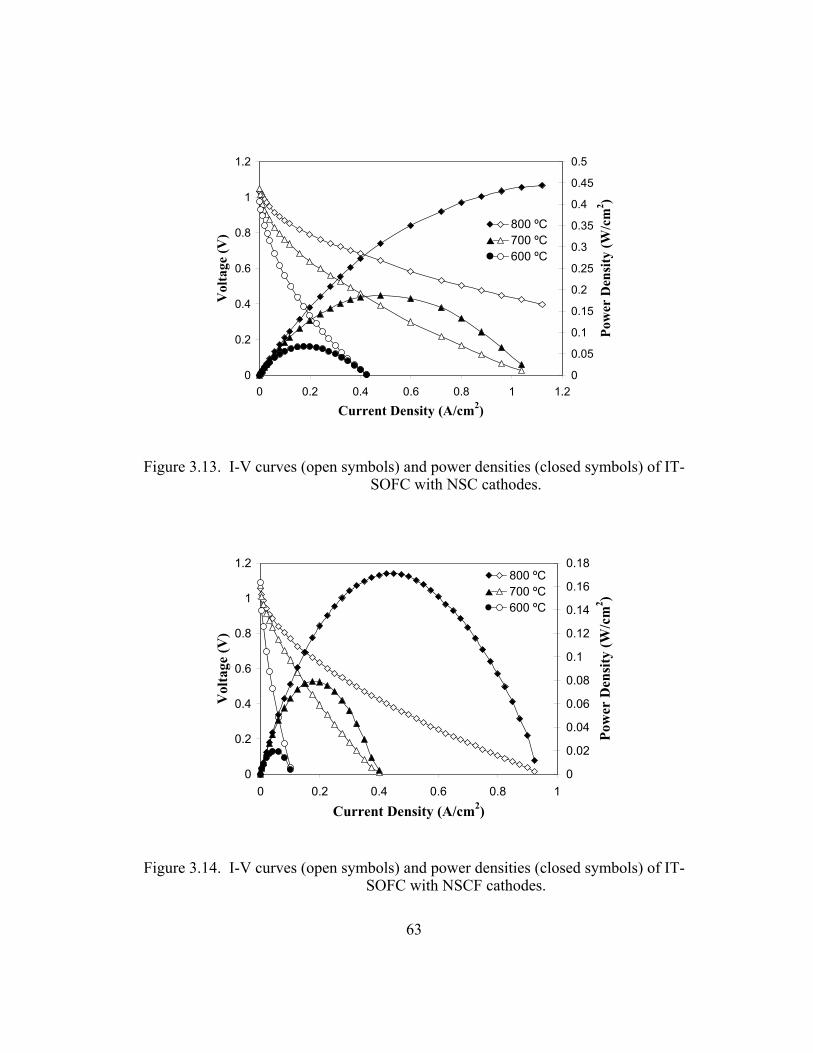
63
0
0.2
0.4
0.6
0.8
1
1.2
0 0.2 0.4 0.6 0.8 1 1.2
Current Density (A/cm2)
Vol
tage
(V)
0
0.05
0.1
0.15
0.2
0.25
0.3
0.35
0.4
0.45
0.5
Pow
er D
ensi
ty (W
/cm
2 )
800 ºC700 ºC600 ºC
Figure 3.13. I-V curves (open symbols) and power densities (closed symbols) of IT-SOFC with NSC cathodes.
0
0.2
0.4
0.6
0.8
1
1.2
0 0.2 0.4 0.6 0.8 1
Current Density (A/cm2)
Vol
tage
(V)
0
0.02
0.04
0.06
0.08
0.1
0.12
0.14
0.16
0.18
Pow
er D
ensi
ty (W
/cm
2 )
800 ºC700 ºC600 ºC
Figure 3.14. I-V curves (open symbols) and power densities (closed symbols) of IT-SOFC with NSCF cathodes.
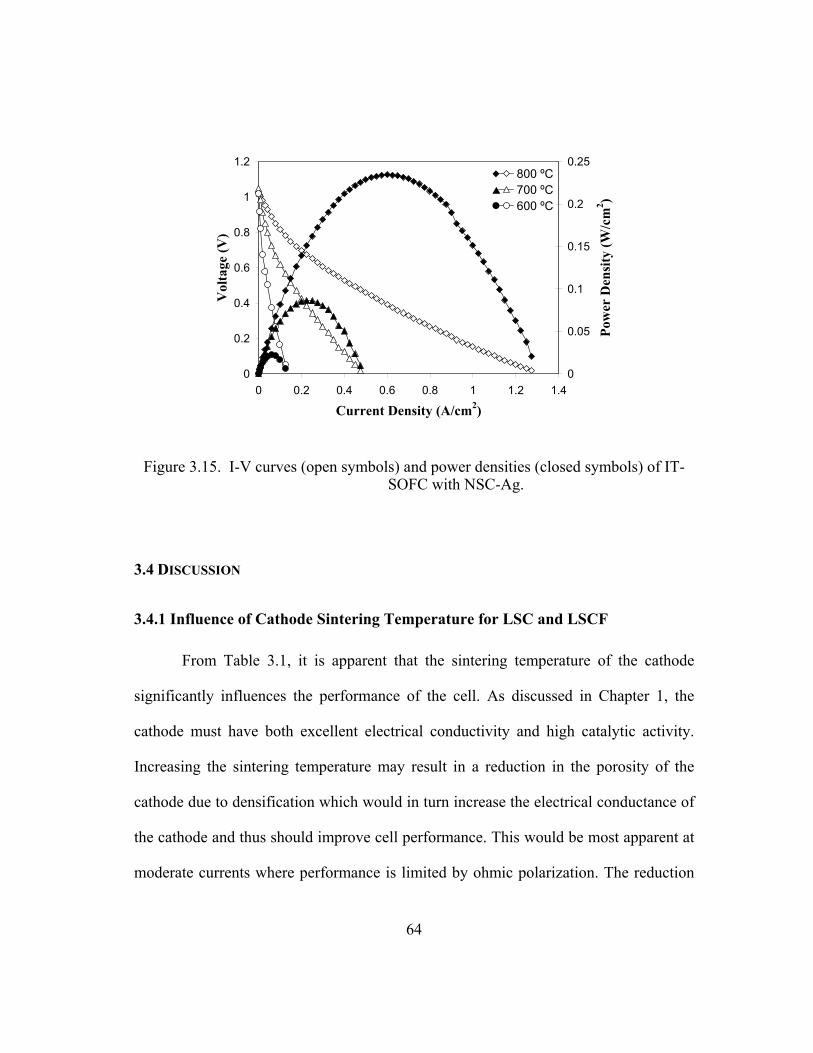
64
0
0.2
0.4
0.6
0.8
1
1.2
0 0.2 0.4 0.6 0.8 1 1.2 1.4
Current Density (A/cm2)
Vol
tage
(V)
0
0.05
0.1
0.15
0.2
0.25
Pow
er D
ensi
ty (W
/cm
2 )
800 ºC700 ºC600 ºC
Figure 3.15. I-V curves (open symbols) and power densities (closed symbols) of IT-SOFC with NSC-Ag.
3.4 DISCUSSION
3.4.1 Influence of Cathode Sintering Temperature for LSC and LSCF
From Table 3.1, it is apparent that the sintering temperature of the cathode
significantly influences the performance of the cell. As discussed in Chapter 1, the
cathode must have both excellent electrical conductivity and high catalytic activity.
Increasing the sintering temperature may result in a reduction in the porosity of the
cathode due to densification which would in turn increase the electrical conductance of
the cathode and thus should improve cell performance. This would be most apparent at
moderate currents where performance is limited by ohmic polarization. The reduction
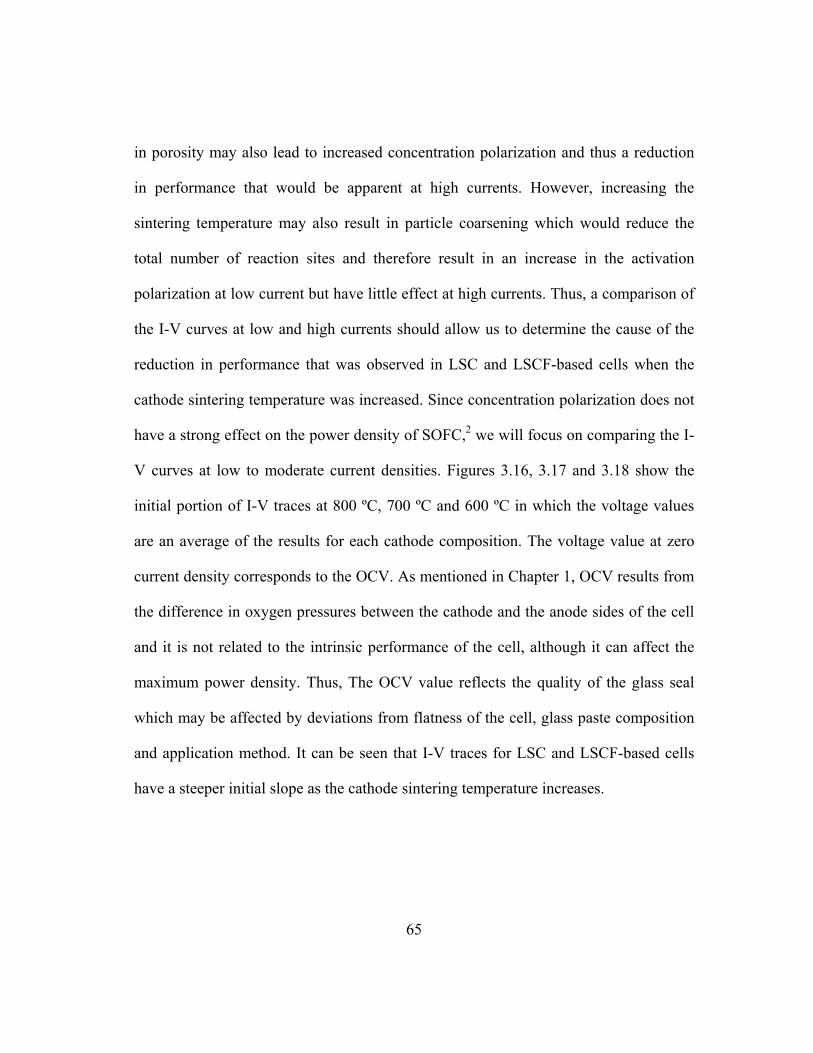
65
in porosity may also lead to increased concentration polarization and thus a reduction
in performance that would be apparent at high currents. However, increasing the
sintering temperature may also result in particle coarsening which would reduce the
total number of reaction sites and therefore result in an increase in the activation
polarization at low current but have little effect at high currents. Thus, a comparison of
the I-V curves at low and high currents should allow us to determine the cause of the
reduction in performance that was observed in LSC and LSCF-based cells when the
cathode sintering temperature was increased. Since concentration polarization does not
have a strong effect on the power density of SOFC,2 we will focus on comparing the I-
V curves at low to moderate current densities. Figures 3.16, 3.17 and 3.18 show the
initial portion of I-V traces at 800 ºC, 700 ºC and 600 ºC in which the voltage values
are an average of the results for each cathode composition. The voltage value at zero
current density corresponds to the OCV. As mentioned in Chapter 1, OCV results from
the difference in oxygen pressures between the cathode and the anode sides of the cell
and it is not related to the intrinsic performance of the cell, although it can affect the
maximum power density. Thus, The OCV value reflects the quality of the glass seal
which may be affected by deviations from flatness of the cell, glass paste composition
and application method. It can be seen that I-V traces for LSC and LSCF-based cells
have a steeper initial slope as the cathode sintering temperature increases.
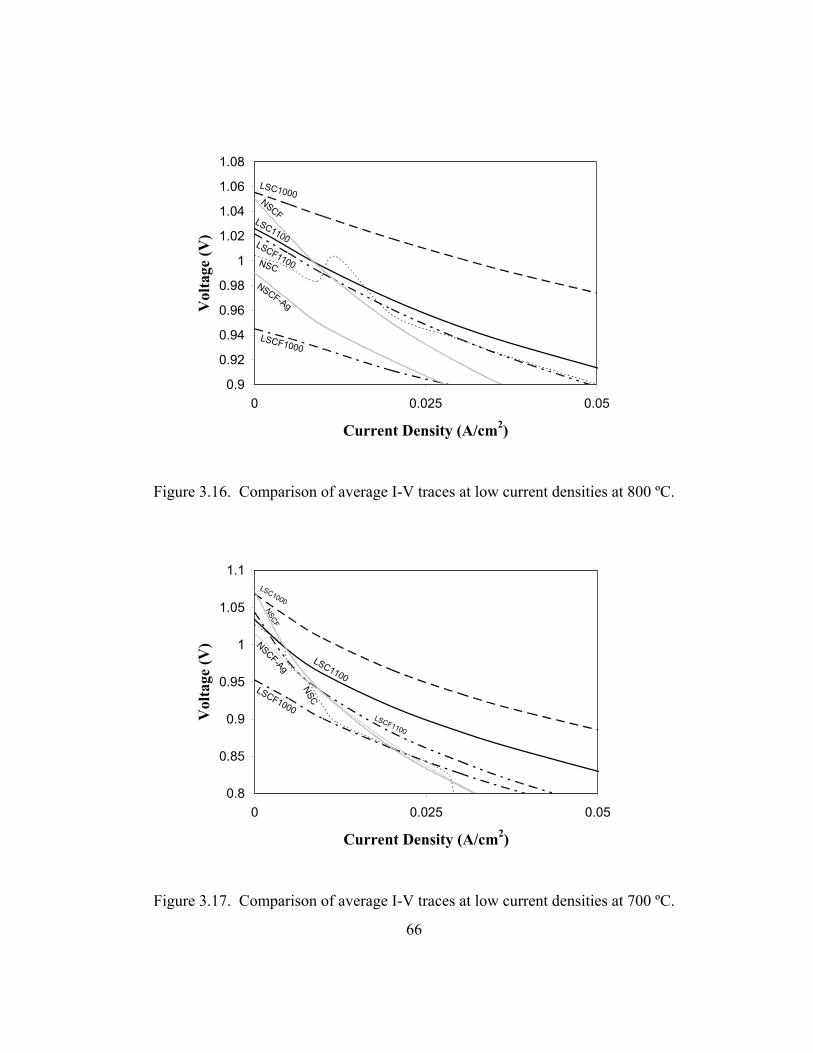
66
LSC1000
LSC1100
LSCF1000
LSCF1100NSC
NSCF
NSCF-Ag
0.9
0.92
0.94
0.96
0.98
1
1.02
1.04
1.06
1.08
0 0.025 0.05
Current Density (A/cm2)
Vol
tage
(V)
Figure 3.16. Comparison of average I-V traces at low current densities at 800 ºC.
LSC1000
LSC1100LSCF1000
LSCF1100
NSC
NSCF
NSCF-Ag
0.8
0.85
0.9
0.95
1
1.05
1.1
0 0.025 0.05
Current Density (A/cm2)
Vol
tage
(V)
Figure 3.17. Comparison of average I-V traces at low current densities at 700 ºC.
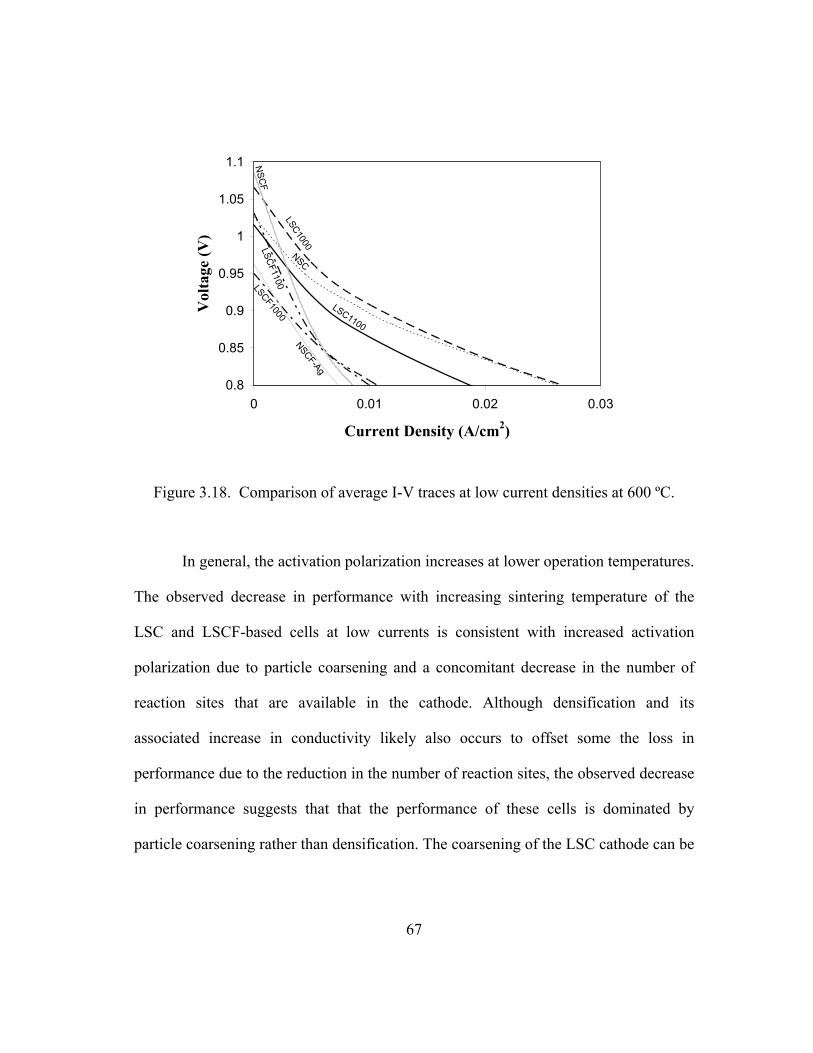
67
LSC1000
LSC1100
LSCF1000
LSCF1100
NSC
NSC
F
NSCF-Ag
0.8
0.85
0.9
0.95
1
1.05
1.1
0 0.01 0.02 0.03
Current Density (A/cm2)
Vol
tage
(V)
Figure 3.18. Comparison of average I-V traces at low current densities at 600 ºC.
In general, the activation polarization increases at lower operation temperatures.
The observed decrease in performance with increasing sintering temperature of the
LSC and LSCF-based cells at low currents is consistent with increased activation
polarization due to particle coarsening and a concomitant decrease in the number of
reaction sites that are available in the cathode. Although densification and its
associated increase in conductivity likely also occurs to offset some the loss in
performance due to the reduction in the number of reaction sites, the observed decrease
in performance suggests that that the performance of these cells is dominated by
particle coarsening rather than densification. The coarsening of the LSC cathode can be
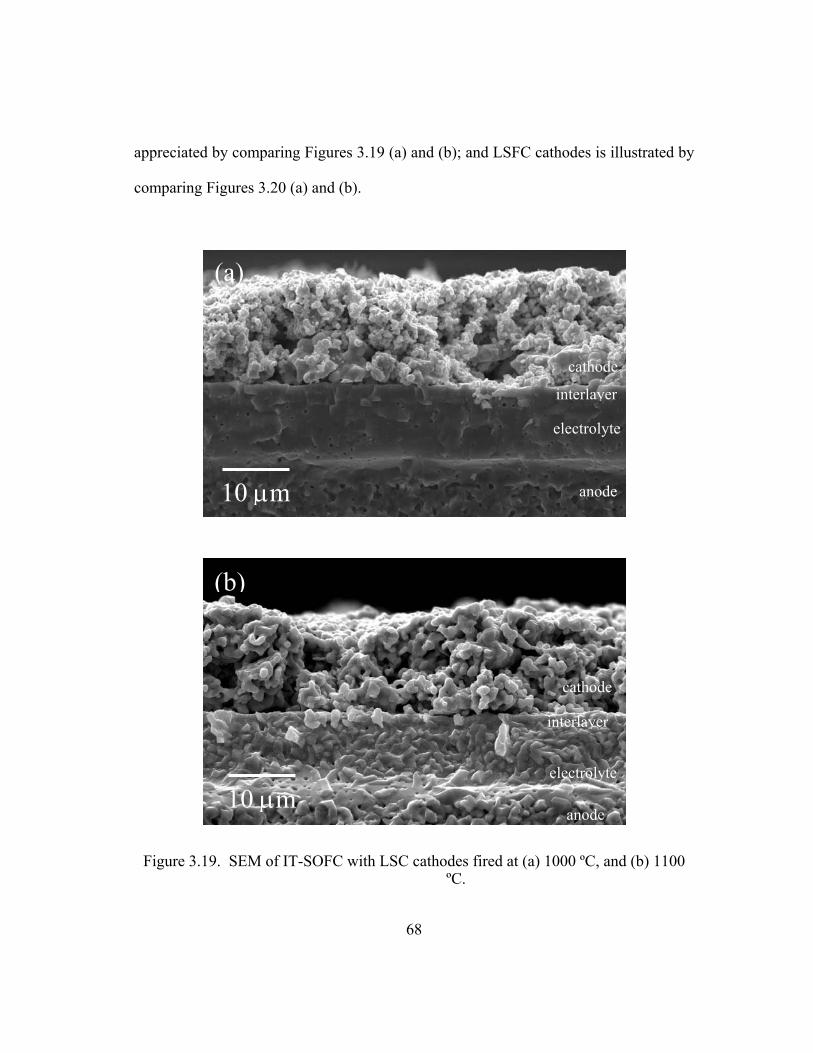
68
appreciated by comparing Figures 3.19 (a) and (b); and LSFC cathodes is illustrated by
comparing Figures 3.20 (a) and (b).
Figure 3.19. SEM of IT-SOFC with LSC cathodes fired at (a) 1000 ºC, and (b) 1100 ºC.
(a)
(b)
10 μm
10 μm
cathode
interlayer
electrolyte
anode
electrolyte
interlayer
cathode
anode
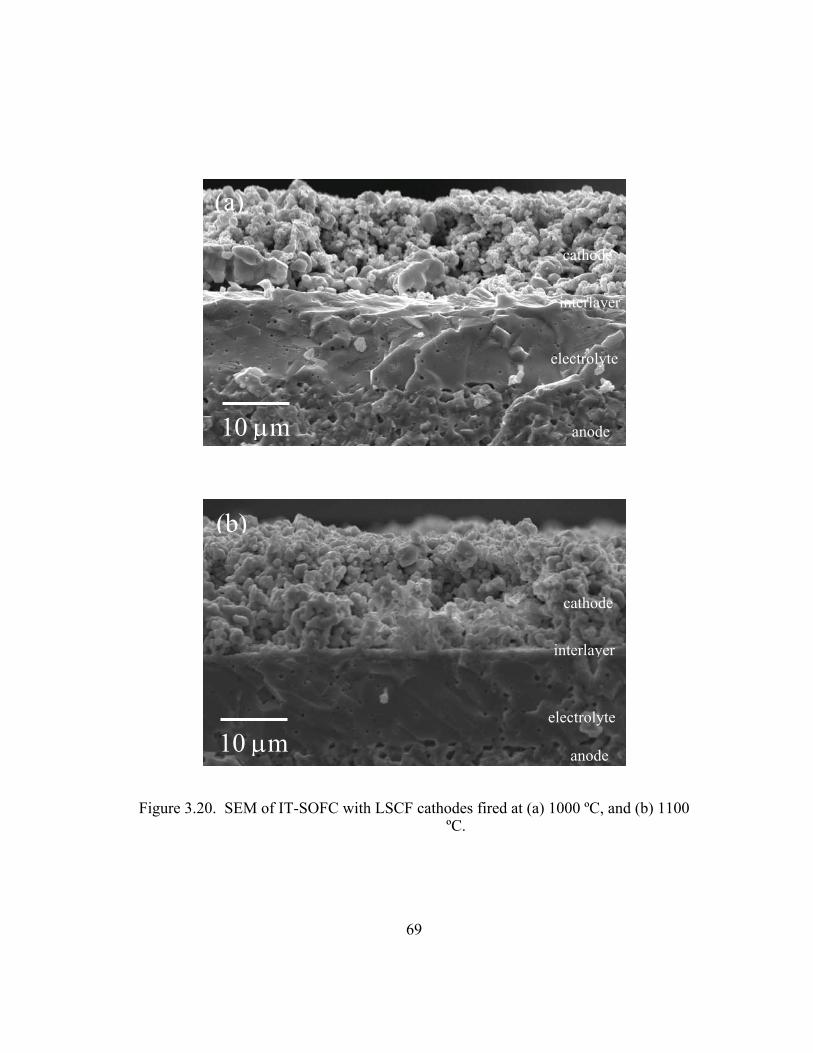
69
Figure 3.20. SEM of IT-SOFC with LSCF cathodes fired at (a) 1000 ºC, and (b) 1100 ºC.
10 μm
(a)
(b)
10 μm
cathode
cathode
interlayer
interlayer
electrolyte
electrolyte
anode
anode
70
3.4.2 Comparison between NSC and LSC-Based Cells
Substituting lanthanum by neodymium in the cathode composition has a
positive effect on the performance of the cell even though the conductivity and
electrocatalytic activity for oxygen reduction reaction are higher for LSC than for
NSC.61 This effect has not been observed in SOFC with thick LSGM electrolytes
because the conductivity of LSC is only approximately two orders of magnitude larger
than the conductivity of NSC (see Appendix B). It is likely that the effects of chemistry
on conductivity are being masked by small differences in microstructure that occur
during processing or sintering.
3.4.3 Comparison between LSC and LSCF-Based Cells and NSC and NSCF-Based Cells
Figures 3.21 (a) and (b) show micrographs of fracture surfaces of cells with
NSC and NSCF cathodes. The decrease in the performance on cells with Fe-doped
cathodes is expected, given that substitution of Co by Fe causes a decrease in the
conductivity of the perovskite of ~ 32 % (LSC1000 vs LSFC1000), ~ 20 % (LSC1100
vs LSFC1100), and ~ 63 % (NSCF vs NSCF). The I-V curves for all the cells have a
positive curvature, except at very high current densities. The negative of slope of the
curve at very low current densities represents the area specific resistance of the cell.
This resistance involves the ohmic resistance of the electrolyte and the effective charge
transfer resistance that is a measure of the activation energy of the cathode. Given the
thickness of the electrolyte and interlayer and its ionic resistivity, we can see that the
71
major contributor to this overpotential is the conductivity of the cathode. The fact that
the slope of the I-V curves for Fe-doped cathodes is more pronounced than for when
the cathode has only Co in the B sites is clear evidence that the presence of Fe
decreases the conductivity of the cathode, leading to higher ohmic polarization at
moderate currents.
The very poor performance of the NSCF-based cells sintered at 1200 ˚C
relative to the LSCF-based cells sintered at 1100 ˚C and 1000 ˚C suggests that the
higher sintering temperature used to produce the NSCF-based cells may have
decreased the number of reaction sites, leading to activation polarization. This suggests
that a lower sintering temperature for the NSCF-based cells may lead to improved
performance.
3.4.4 Influence of Impregnation of NSCF with Ag
Figure 3.21 (c) shows the fracture surface of a IT-SOFC with NSCF-Ag
cathode. The poor performance of the Fe-doped perovskites-based cells relative to the
undoped NSC and LSC-based cells suggests that developing a strategy for improving
the electrical conductivity of the cathode materials should improve cell performance.
This was attempted by impregnating NSCF with silver which should cause an increase
in electrical conductivity of the cathode by creating a continuous Ag phase with high
electrical conductivity. Comparison of the NSCF and the NSCF-Ag confirms that the
presence of the conducting Ag increases the performance of the cell by reducing the
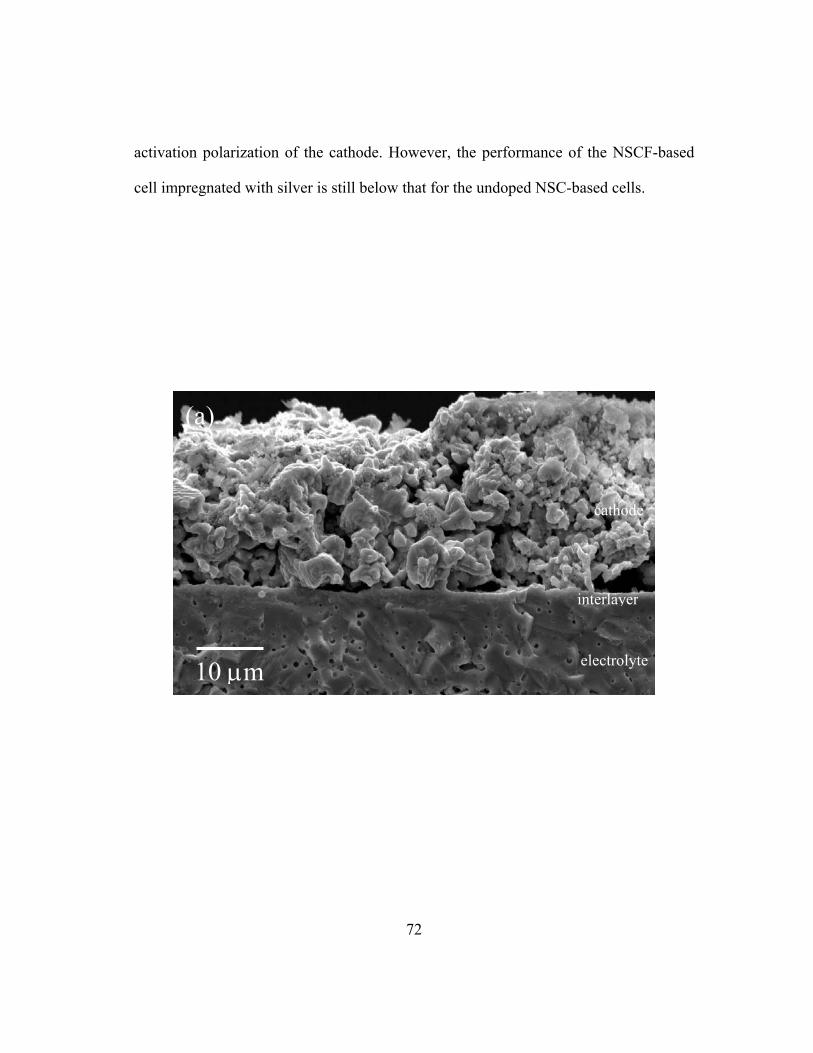
72
activation polarization of the cathode. However, the performance of the NSCF-based
cell impregnated with silver is still below that for the undoped NSC-based cells.
10 μm
(a)
electrolyte
interlayer
cathode
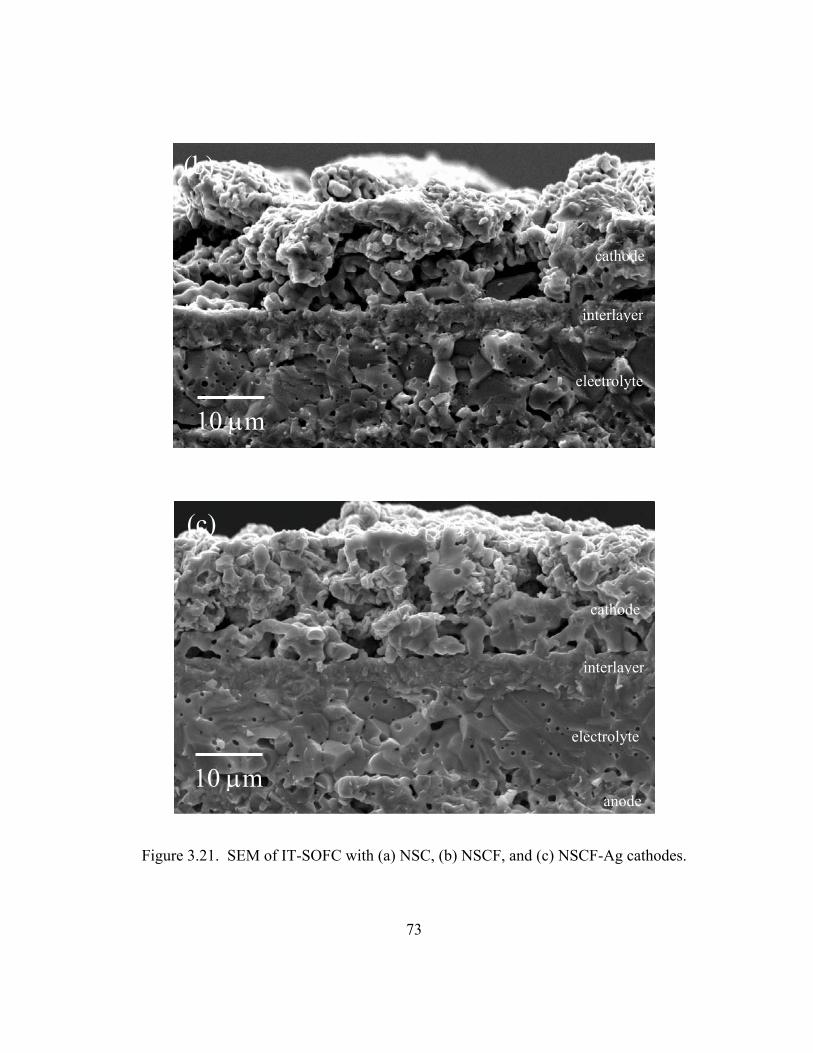
73
Figure 3.21. SEM of IT-SOFC with (a) NSC, (b) NSCF, and (c) NSCF-Ag cathodes.
10 μm
10 μm
(b)
(c)
anode
electrolyte
electrolyte
interlayer
interlayer
cathode
cathode
74
3.4 CONCLUSIONS
These results show that the sintering temperature of the cathode plays an
important role in determining cell performance for perovskite-based cathodes.
Increasing the cathode sintering temperature results in a reduction in cell performance
that was attributed to particle coarsening. The increase in the particle size and neck
diameter during coarsening reduces the number of active reaction sites in the cathode.
However, it is expected that very low sintering temperatures would also result in poor
performance due to poor conductivity due to poor connectivity between the particles
and the large fraction of pores. Thus, an optimum cathode sintering temperature must
be determined for each cathode composition.
Although the performance of cells made NSC cathodes are comparable to
those of cells produced with LSC cathodes, NSC cathodes offers another advantage for
IT-SOFC because NSC has a lower TEC mismatch with YSZ. The lower TEC
mismatch may result in reduced long-term degradation that is typically observed during
thermal cycling of SOFC.21 Although NSCF cathodes exhibit an even lower TEC
mismatch with YSZ than NSC, the performance of this cathode is very low and thus it
is not a good candidate for IT-SOFC cathodes. However, impregnation of the NSCF
cathodes with silver increases the electrical conductivity of the cathode which results in
improved performance of the cell, while still maintaining a low TEC mismatch with
YSZ. This material should be studied under long term operating conditions to
determine if its long-term performance is better than LSC and NSC-based SOFC.
75
Chapter 4: IT-SOFC with Intergrowth Perovskite Oxides Cathodes: (La,Sr)n+1(Fe,Co)nO3n+1, (n = 2, 3, ∞) cathodes
4.1 INTRODUCTION
Perovskite-related intergrowth oxides from the Ruddlesden-Popper series
(La,Sr)n+1(Fe,Co)nO3n+1 with n = 2 67 and n = 3 68 have been identified as good
candidates for cathode materials for IT-SOFC due to their stability and oxygen ion
conductivity. Recently, Sr2.7La0.3Fe2-yCoyO7-δ (n =2)47 and LaSr3Fe3-yCoyO10 (n = 3)69
have been explored as cathodes with La0.8Sr0.2Ga0.8Mn0.2O2.8 electrolytes for
electrolyte-supported IT-SOFC. It was shown that these compositions exhibit good
mixed electronic-ionic conductivity and structural stability. From these series,
Sr2.7La0.3Fe1.4Co0.6O7-δ and LaSr3Fe1.5Co1.5O10 exhibited the best performance. In this
study we explore the use of the perovskite-related intergrowth oxides
Sr2.7La0.3Fe1.4Co0.6O7-δ (SLFCO7) and LaSr3Fe1.5Co1.5O10 (LSFCO10) as cathodes of
IT-SOFC with thin YSZ electrolytes, and compare these cathodes to the
La0.6Sr0.4Co0.5Fe0.5O3 (LSCF) perovskite cathode studied in Chapter 3.
The crystalline structures of the Ruddlesden-Popper series consist of n
consecutive perovskite layers along the z axis, separated by a double rock salt layer
formed by lanthanide and oxygen atoms.70 A simple perovskite structure results when n
= ∞ to produce LSCF. Thus, n = 2 results in SLFCO7 and n = 3 results in LSFCO10.
Figure 4.1 shows the crystalline structures for these compounds.
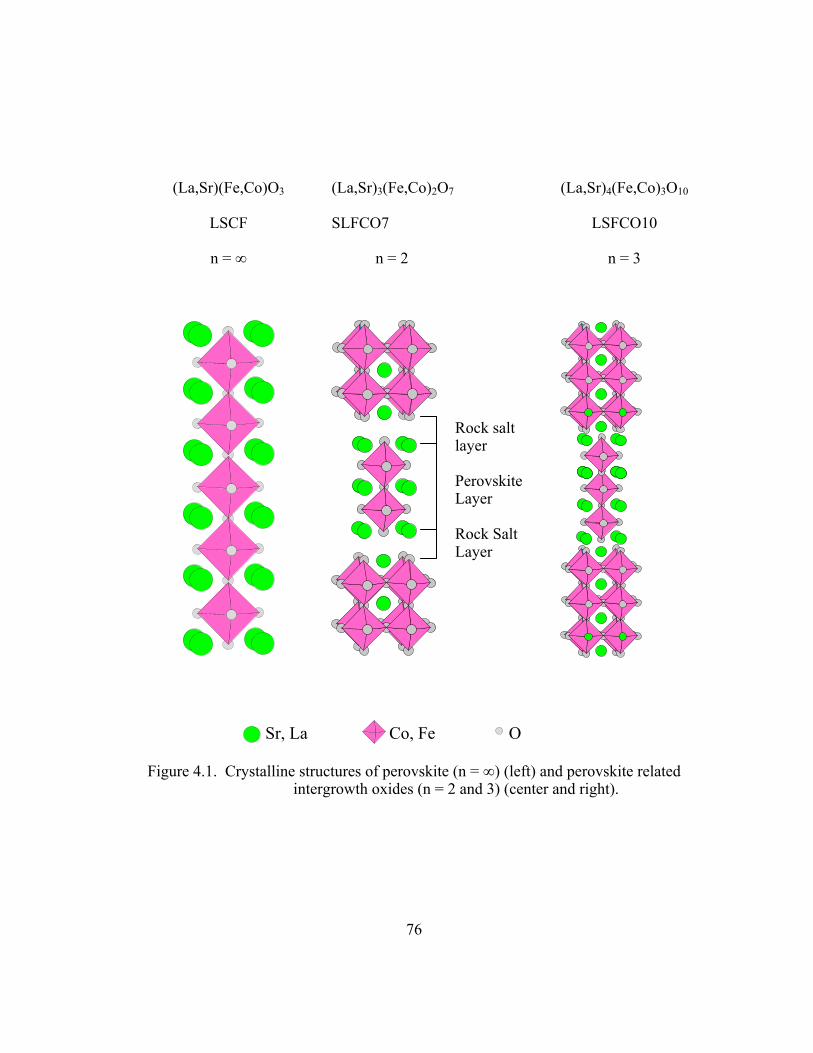
76
(La,Sr)(Fe,Co)O3
LSCF
n = ∞
(La,Sr)3(Fe,Co)2O7
SLFCO7
n = 2
(La,Sr)4(Fe,Co)3O10
LSFCO10
n = 3
Figure 4.1. Crystalline structures of perovskite (n = ∞) (left) and perovskite related intergrowth oxides (n = 2 and 3) (center and right).
Rock salt layer Perovskite Layer Rock Salt Layer
Sr, La Co, Fe O
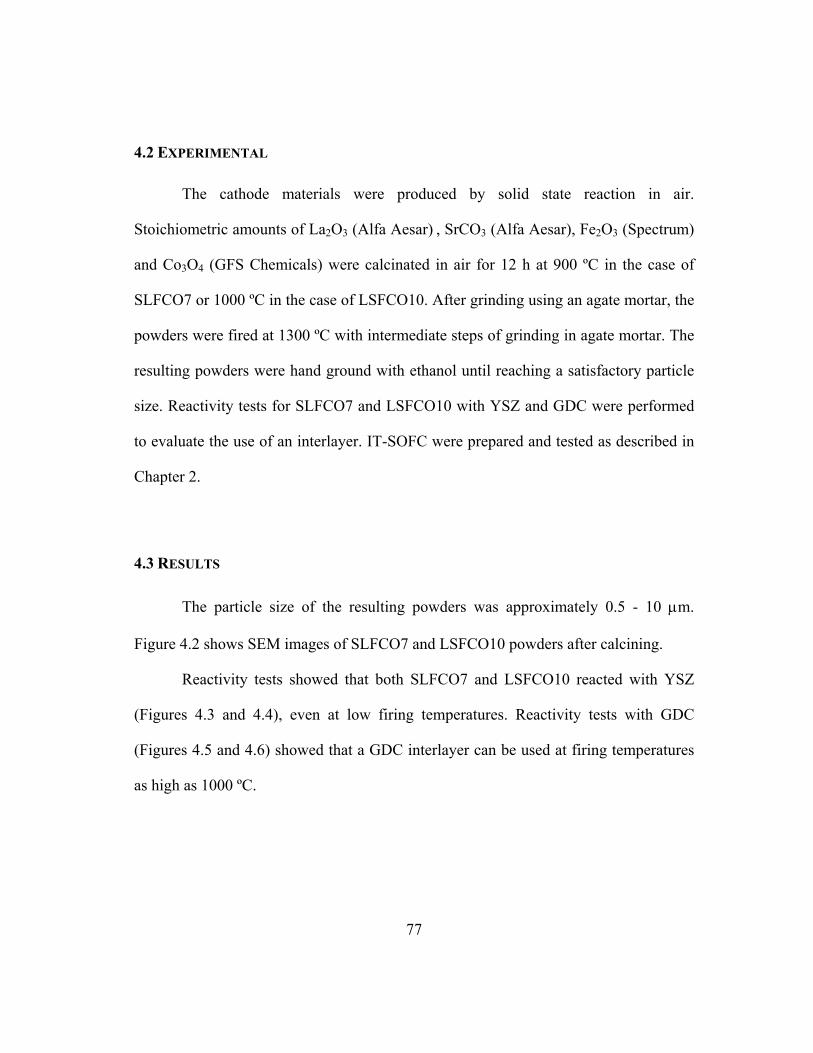
77
4.2 EXPERIMENTAL
The cathode materials were produced by solid state reaction in air.
Stoichiometric amounts of La2O3 (Alfa Aesar) , SrCO3 (Alfa Aesar), Fe2O3 (Spectrum)
and Co3O4 (GFS Chemicals) were calcinated in air for 12 h at 900 ºC in the case of
SLFCO7 or 1000 ºC in the case of LSFCO10. After grinding using an agate mortar, the
powders were fired at 1300 ºC with intermediate steps of grinding in agate mortar. The
resulting powders were hand ground with ethanol until reaching a satisfactory particle
size. Reactivity tests for SLFCO7 and LSFCO10 with YSZ and GDC were performed
to evaluate the use of an interlayer. IT-SOFC were prepared and tested as described in
Chapter 2.
4.3 RESULTS
The particle size of the resulting powders was approximately 0.5 - 10 μm.
Figure 4.2 shows SEM images of SLFCO7 and LSFCO10 powders after calcining.
Reactivity tests showed that both SLFCO7 and LSFCO10 reacted with YSZ
(Figures 4.3 and 4.4), even at low firing temperatures. Reactivity tests with GDC
(Figures 4.5 and 4.6) showed that a GDC interlayer can be used at firing temperatures
as high as 1000 ºC.

78
Figure 4.2. SEM of SLFCO7 (top) and LSFCO10 (bottom) powders produced by solid state reaction and hand milled.
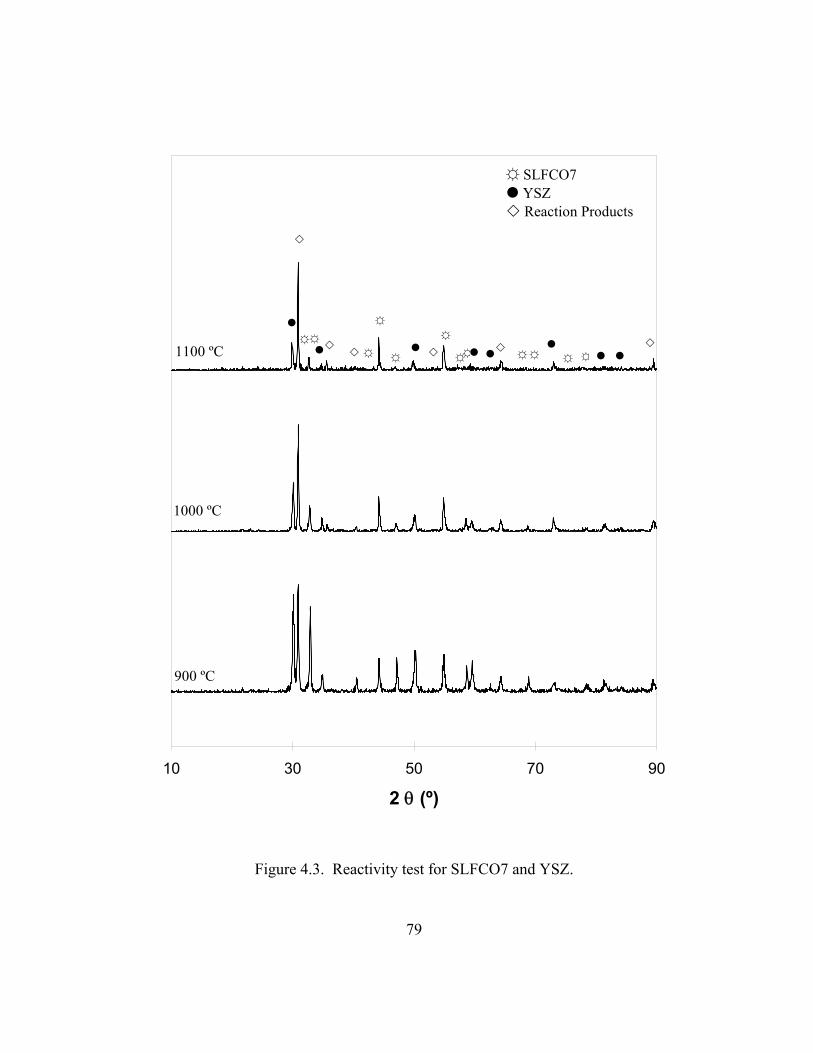
79
10 30 50 70 90
2 θ (º)
900 ºC
1100 ºC
1000 ºC
☼ SLFCO7 YSZ Reaction Products
☼☼☼
☼
☼ ☼☼☼
☼
☼ ☼ ☼
Figure 4.3. Reactivity test for SLFCO7 and YSZ.
80
10 30 50 70 90
2 θ (º)
900 ºC
1100 ºC
1000 ºC
LSFCO10 YSZ Reaction Products
Figure 4.4. Reactivity test for LSFCO10 and YSZ.
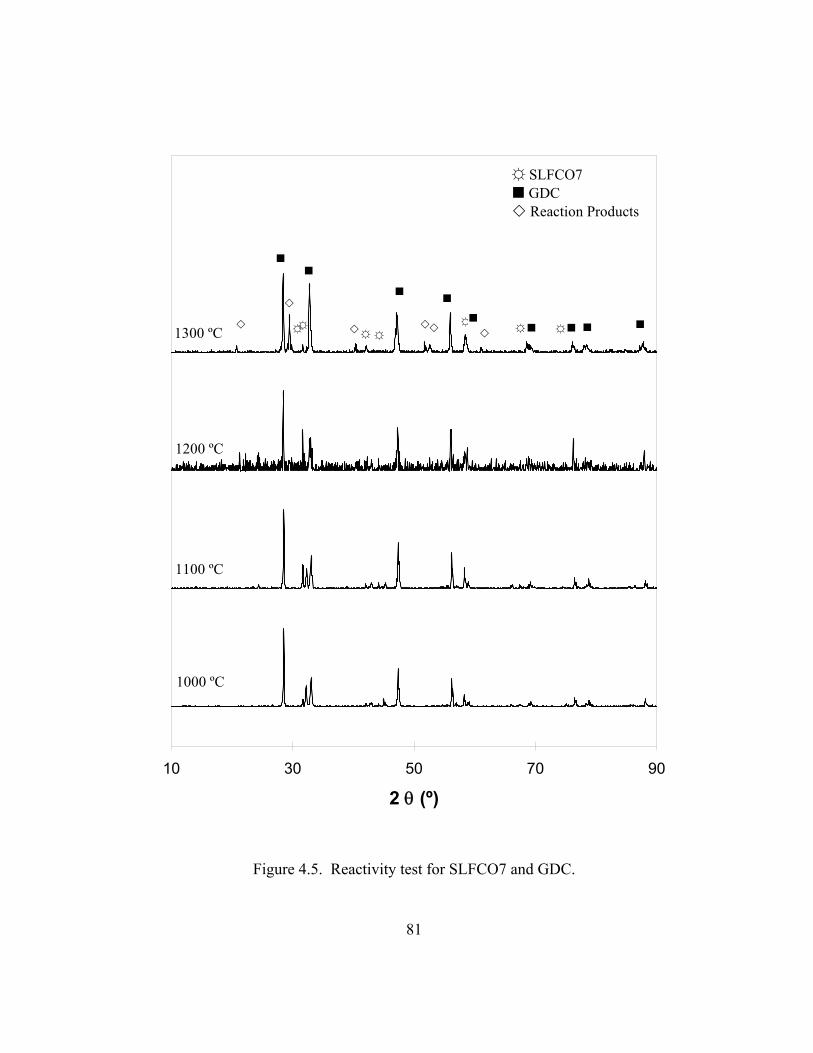
81
10 30 50 70 90
2 θ (º)
1000 ºC
1300 ºC
1200 ºC
1100 ºC
☼ SLFCO7 GDC Reaction Products
☼☼☼
☼☼ ☼☼
Figure 4.5. Reactivity test for SLFCO7 and GDC.
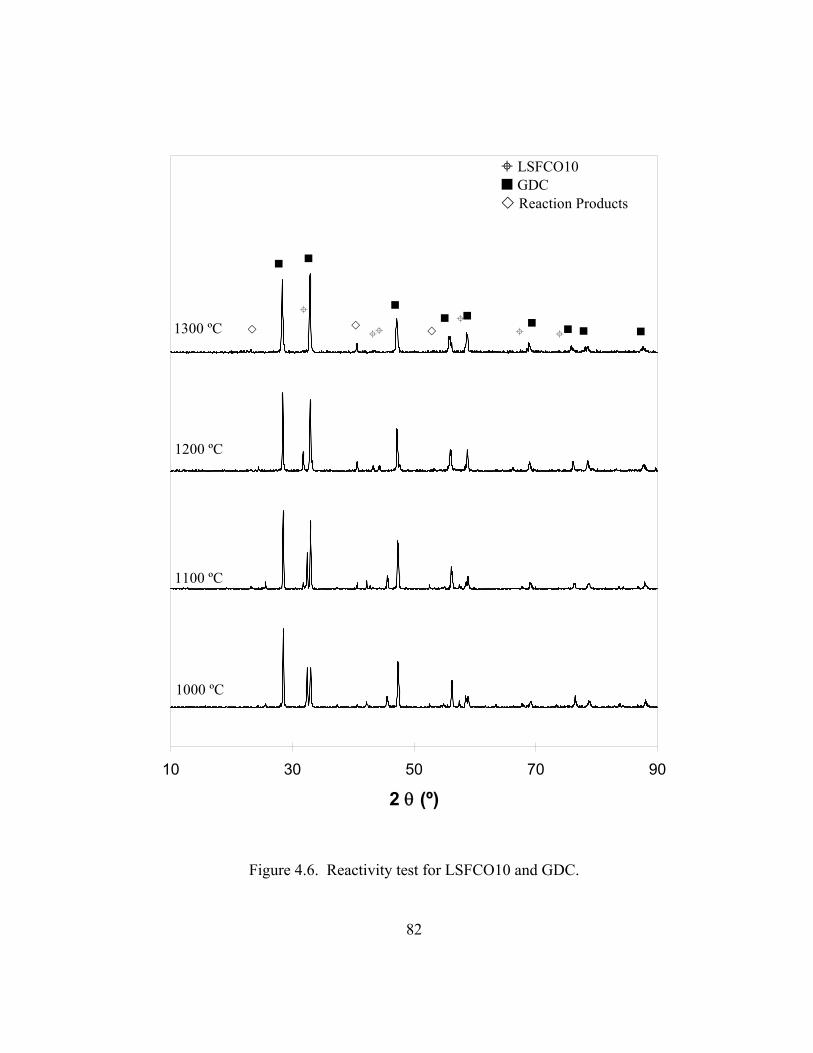
82
10 30 50 70 90
2 θ (º)
1000 ºC
1300 ºC
1200 ºC
1100 ºC
LSFCO10 GDC Reaction Products
Figure 4.6. Reactivity test for LSFCO10 and GDC.
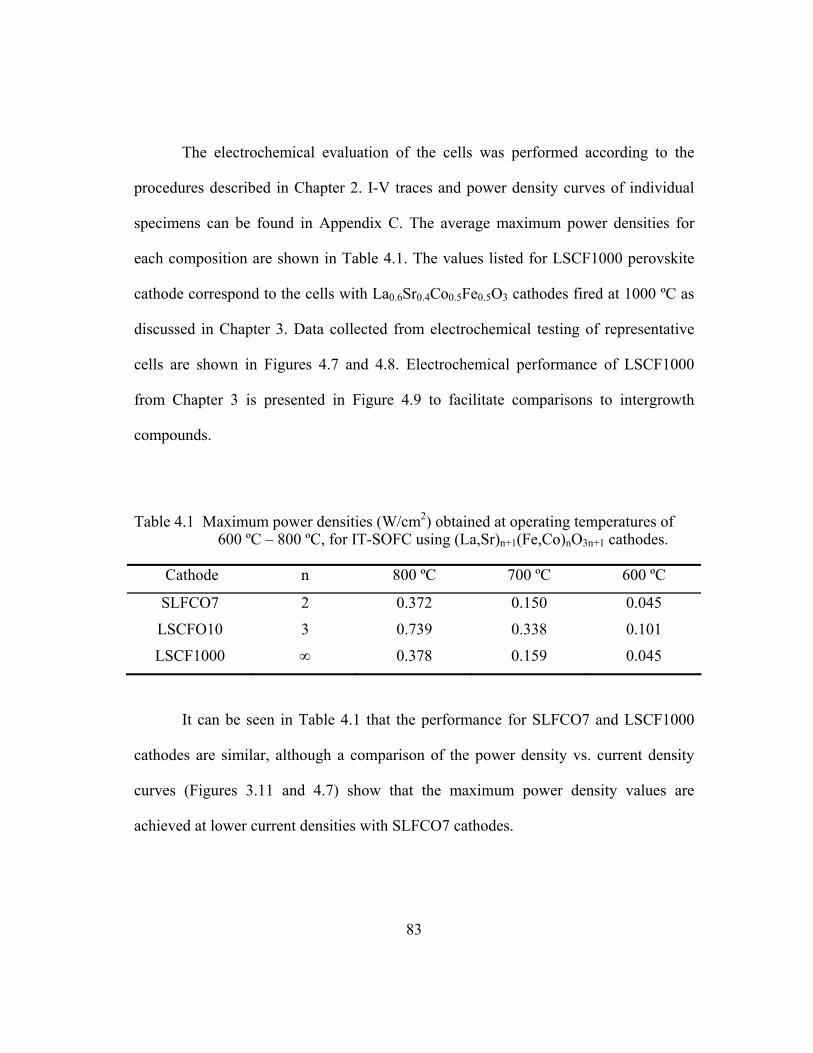
83
The electrochemical evaluation of the cells was performed according to the
procedures described in Chapter 2. I-V traces and power density curves of individual
specimens can be found in Appendix C. The average maximum power densities for
each composition are shown in Table 4.1. The values listed for LSCF1000 perovskite
cathode correspond to the cells with La0.6Sr0.4Co0.5Fe0.5O3 cathodes fired at 1000 ºC as
discussed in Chapter 3. Data collected from electrochemical testing of representative
cells are shown in Figures 4.7 and 4.8. Electrochemical performance of LSCF1000
from Chapter 3 is presented in Figure 4.9 to facilitate comparisons to intergrowth
compounds.
Table 4.1 Maximum power densities (W/cm2) obtained at operating temperatures of 600 ºC – 800 ºC, for IT-SOFC using (La,Sr)n+1(Fe,Co)nO3n+1 cathodes.
Cathode n 800 ºC 700 ºC 600 ºC
SLFCO7 2 0.372 0.150 0.045
LSCFO10 3 0.739 0.338 0.101
LSCF1000 ∞ 0.378 0.159 0.045
It can be seen in Table 4.1 that the performance for SLFCO7 and LSCF1000
cathodes are similar, although a comparison of the power density vs. current density
curves (Figures 3.11 and 4.7) show that the maximum power density values are
achieved at lower current densities with SLFCO7 cathodes.
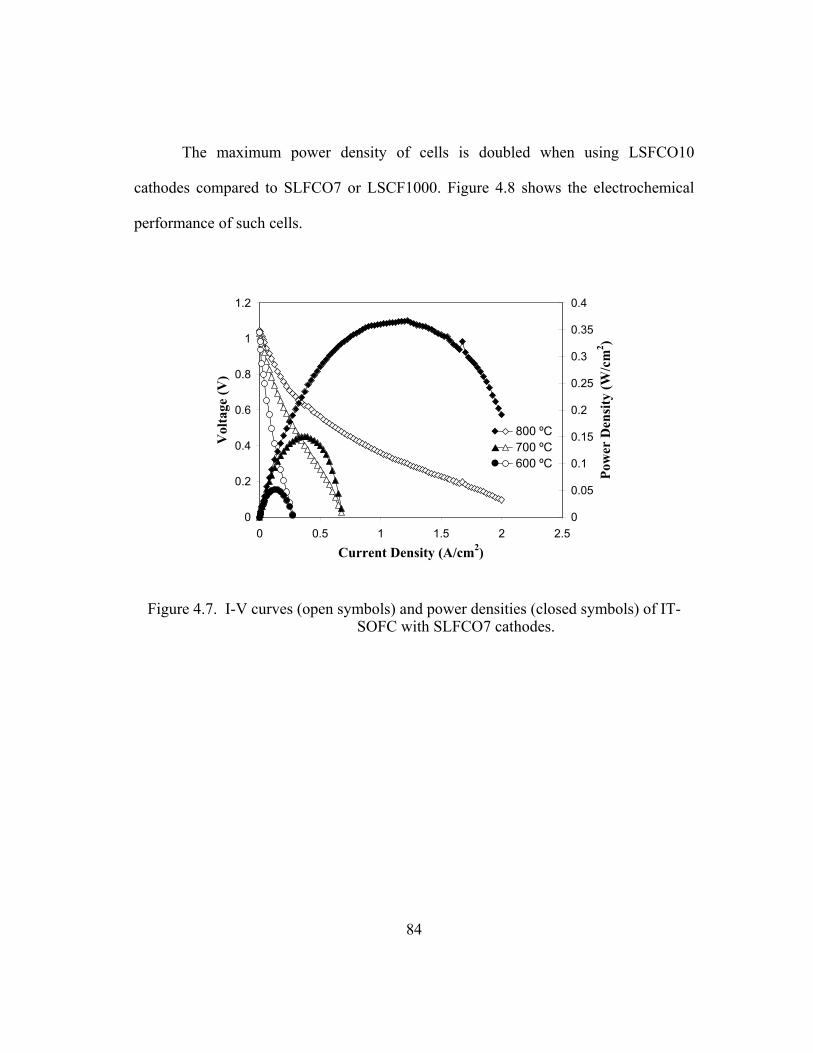
84
The maximum power density of cells is doubled when using LSFCO10
cathodes compared to SLFCO7 or LSCF1000. Figure 4.8 shows the electrochemical
performance of such cells.
0
0.2
0.4
0.6
0.8
1
1.2
0 0.5 1 1.5 2 2.5
Current Density (A/cm2)
Vol
tage
(V)
0
0.05
0.1
0.15
0.2
0.25
0.3
0.35
0.4
Pow
er D
ensi
ty (W
/cm
2 )
800 ºC700 ºC600 ºC
Figure 4.7. I-V curves (open symbols) and power densities (closed symbols) of IT-SOFC with SLFCO7 cathodes.
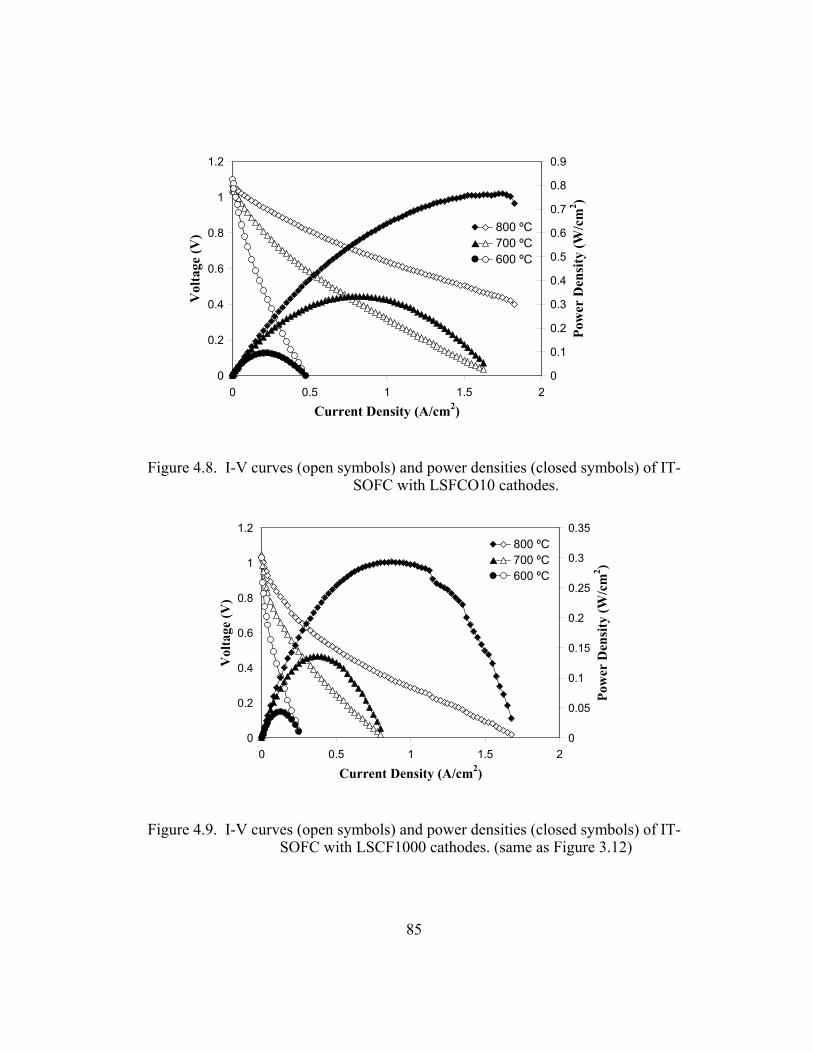
85
0
0.2
0.4
0.6
0.8
1
1.2
0 0.5 1 1.5 2
Current Density (A/cm2)
Vol
tage
(V)
0
0.1
0.2
0.3
0.4
0.5
0.6
0.7
0.8
0.9
Pow
er D
ensi
ty (W
/cm
2 )
800 ºC700 ºC600 ºC
Figure 4.8. I-V curves (open symbols) and power densities (closed symbols) of IT-SOFC with LSFCO10 cathodes.
0
0.2
0.4
0.6
0.8
1
1.2
0 0.5 1 1.5 2
Current Density (A/cm2)
Vol
tage
(V)
0
0.05
0.1
0.15
0.2
0.25
0.3
0.35
Pow
er D
ensi
ty (W
/cm
2 )
800 ºC700 ºC600 ºC
Figure 4.9. I-V curves (open symbols) and power densities (closed symbols) of IT-SOFC with LSCF1000 cathodes. (same as Figure 3.12)
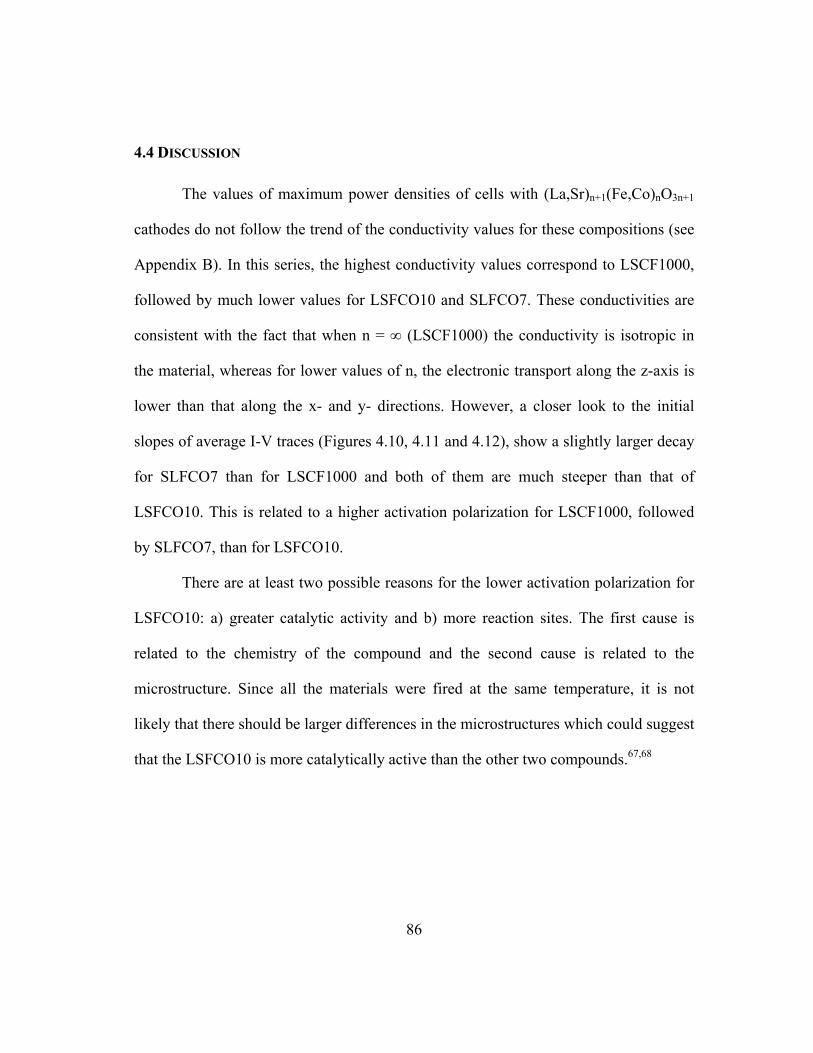
86
4.4 DISCUSSION
The values of maximum power densities of cells with (La,Sr)n+1(Fe,Co)nO3n+1
cathodes do not follow the trend of the conductivity values for these compositions (see
Appendix B). In this series, the highest conductivity values correspond to LSCF1000,
followed by much lower values for LSFCO10 and SLFCO7. These conductivities are
consistent with the fact that when n = ∞ (LSCF1000) the conductivity is isotropic in
the material, whereas for lower values of n, the electronic transport along the z-axis is
lower than that along the x- and y- directions. However, a closer look to the initial
slopes of average I-V traces (Figures 4.10, 4.11 and 4.12), show a slightly larger decay
for SLFCO7 than for LSCF1000 and both of them are much steeper than that of
LSFCO10. This is related to a higher activation polarization for LSCF1000, followed
by SLFCO7, than for LSFCO10.
There are at least two possible reasons for the lower activation polarization for
LSFCO10: a) greater catalytic activity and b) more reaction sites. The first cause is
related to the chemistry of the compound and the second cause is related to the
microstructure. Since all the materials were fired at the same temperature, it is not
likely that there should be larger differences in the microstructures which could suggest
that the LSFCO10 is more catalytically active than the other two compounds.67,68
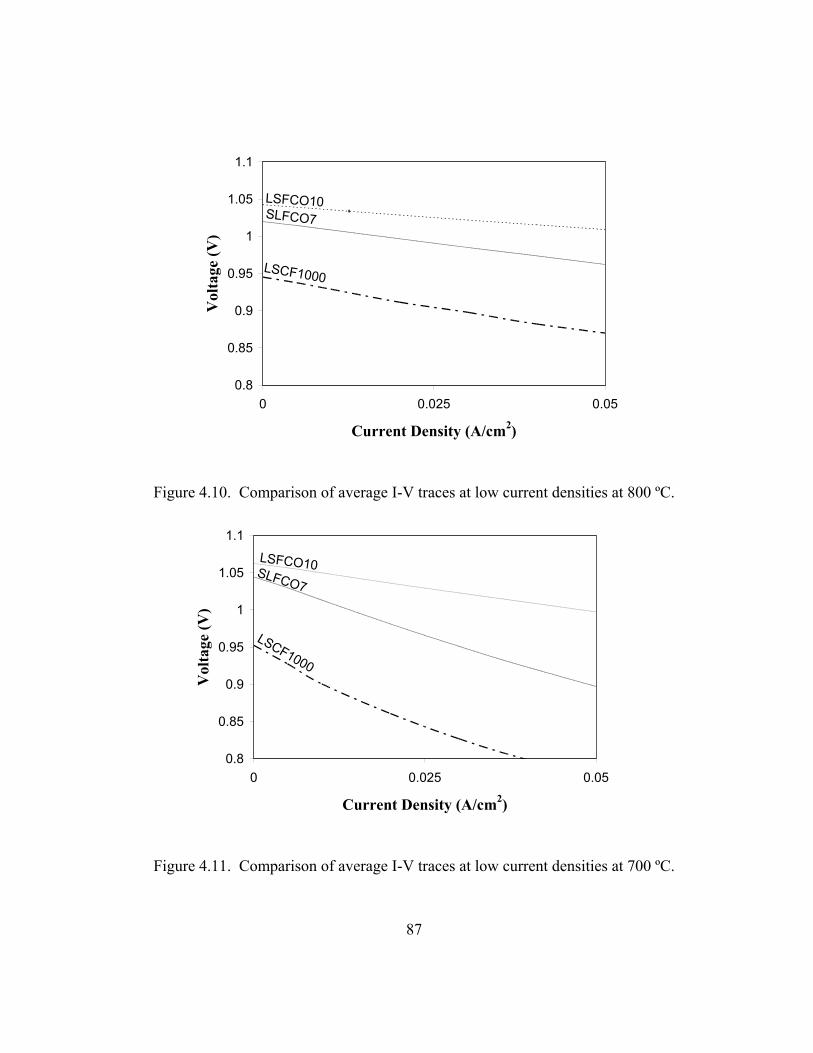
87
LSCF1000
LSFCO10SLFCO7
0.8
0.85
0.9
0.95
1
1.05
1.1
0 0.025 0.05
Current Density (A/cm2)
Vol
tage
(V)
Figure 4.10. Comparison of average I-V traces at low current densities at 800 ºC.
LSCF1000
LSFCO10SLFCO7
0.8
0.85
0.9
0.95
1
1.05
1.1
0 0.025 0.05
Current Density (A/cm2)
Vol
tage
(V)
Figure 4.11. Comparison of average I-V traces at low current densities at 700 ºC.
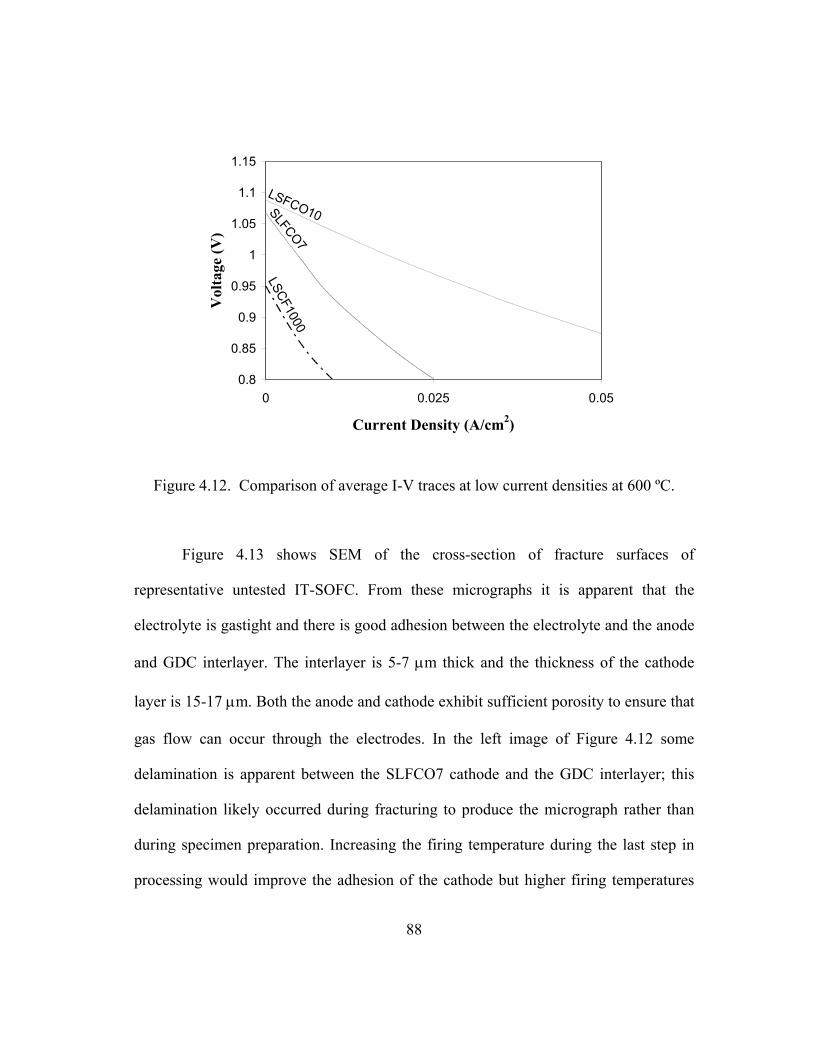
88
LSCF1000
LSFCO10SLFCO7
0.8
0.85
0.9
0.95
1
1.05
1.1
1.15
0 0.025 0.05
Current Density (A/cm2)
Vol
tage
(V)
Figure 4.12. Comparison of average I-V traces at low current densities at 600 ºC.
Figure 4.13 shows SEM of the cross-section of fracture surfaces of
representative untested IT-SOFC. From these micrographs it is apparent that the
electrolyte is gastight and there is good adhesion between the electrolyte and the anode
and GDC interlayer. The interlayer is 5-7 μm thick and the thickness of the cathode
layer is 15-17 μm. Both the anode and cathode exhibit sufficient porosity to ensure that
gas flow can occur through the electrodes. In the left image of Figure 4.12 some
delamination is apparent between the SLFCO7 cathode and the GDC interlayer; this
delamination likely occurred during fracturing to produce the micrograph rather than
during specimen preparation. Increasing the firing temperature during the last step in
processing would improve the adhesion of the cathode but higher firing temperatures
89
lead to reactions at the interface between GDC and SLFCO7, and possible coarsening,
which affect the cell performance in a negative way. The poor adhesion between the
SLFCO7 cathode and the interlayer make difficult to confirm the effect of the
activation polarization in the value of maximum power density, as this is also the
cathode composition that presents the lowest conductivity (See Appendix B). The
better structural stability of LSFCO10 may also contribute to the higher performance,
but this would also be most apparent at moderate currents since delamination would
most likely affect the ohmic polarization.
4.5 CONCLUSIONS
SLFCO7 and LSFCO10 are attractive cathode materials for IT-SOFC because
they exhibit adequate conductivity. Despite having conductivity values lower than the
perovskite material LSCF, their performance in cells using thin YSZ electrolytes and
GDC interlayers is comparable (in the case of SLFCO7) or superior (with LSFCO10)
than using LSCF. LSFCO10 appears particularly promising for long term testing at
intermediate temperatures, given the excellent performance it shows in this and other
studies.47,69
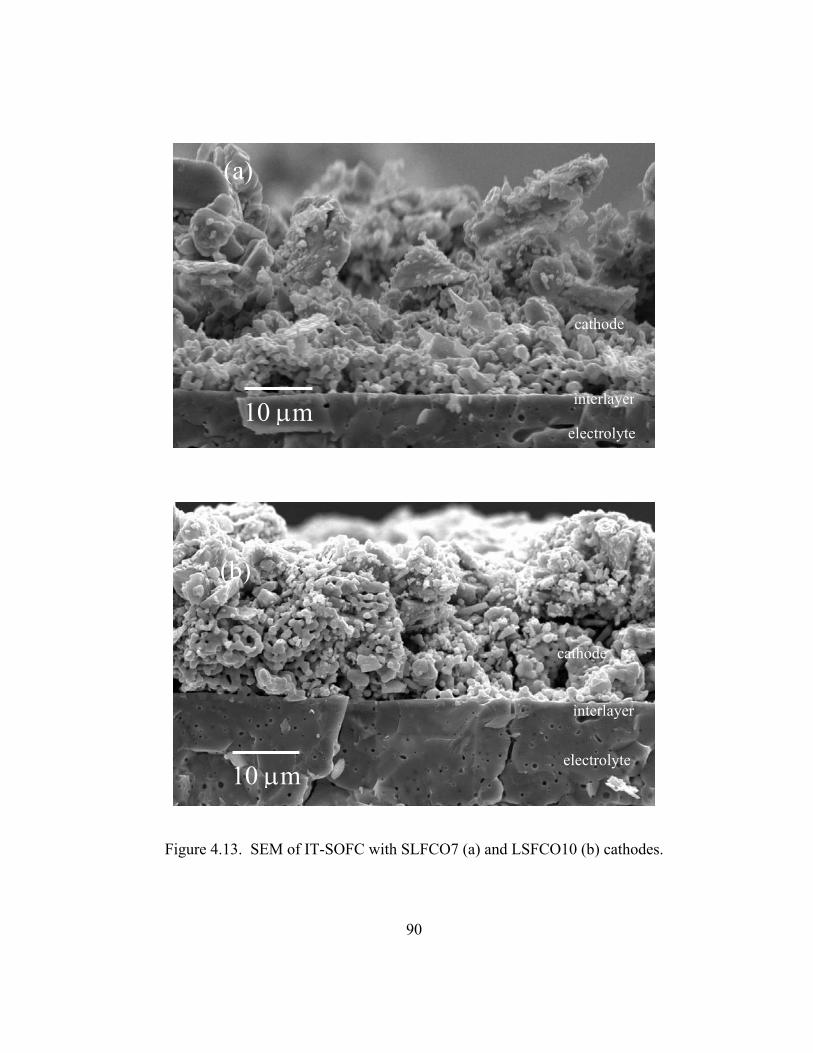
90
Figure 4.13. SEM of IT-SOFC with SLFCO7 (a) and LSFCO10 (b) cathodes.
10 μm
10 μm
(a)
(b)
cathode
cathode
interlayer
interlayer
electrolyte
electrolyte
91
Chapter 5: Summary
The increase in the demand for economically available alternative sources of
energy has driven the study of SOFC. YSZ has been the preferred electrolyte material
for SOFC, but at intermediate temperatures the ionic conductivity of YSZ decreases.
Reducing the thickness of the electrolyte allows for a conductance similar to that of
thick YSZ electrolytes at elevated temperatures. The production of SOFC with thin
YSZ electrolytes has been studied previously, but many of the methods involve
complicated steps or suffer from high equipment costs. This work has demonstrated the
feasibility of producing SOFC with thin YSZ electrolytes by inexpensive ceramic
techniques. The importance of the steps and parameters used during tape casting and
co-firing has been evident during this process. The manufacturing process proposed
can be easily adapted to an industrial level, where automated processes could help to
minimize variances in the final product.
Along with thin YSZ electrolytes, cathodes that exhibit adequate catalytic
activity at intermediate temperatures are important for good performance of IT-SOFC.
Perovskite materials, like (La,Sr)(Co,Fe)O3 (LSCF) were investigated as cathodes. The
effect of cathode sintering temperature was studied, and it was found that at higher
sintering temperatures the cathodes exhibited some coarsening, which reduces the
number of active sites and increases activation polarization. However, a very low
temperature may inhibit the adherence of the cathode to the interlayer, resulting in high
92
contact resistance. Therefore, it is important to determine the optimal cathode sintering
temperature.
Materials with lower TEC are required for IT-SOFC so that they can survive
long-term operation, even with multiple thermal cycles. Substitution of Nd by La
decreases the TEC due to the more covalent Nd-O bonds, but also decreases the
conductivity of the material. The presence of Fe in the B sites contributes to further
decrease in TEC and conductivity. Impregnation with a noble metal, like silver, helps
to increase the conductivity while retaining a low TEC. The performance of
neodymium cobaltites was in general lower than that of cells with lanthanum
cobaltites. From these, NSC cathodes showed better performance than NSCF cathodes,
although silver impregnation helped to improve the performance of NSCF.
Some intergrowth perovskite oxide cathodes from the Ruddlesden-Popper
series (La,Sr)n+1(Fe,Co)nO3n+1, the n = 2 (SLFCO7) and 3 (LSFCO10) members, have
been studied as cathode materials for intermediate temperatures given their high oxide
ion conductivity and structural stability. Testing of our cells with cathode material
SLFCO7 resulted in power density values similar to that of cells with LSFC fired at the
same temperature, but LSFCO10 cathode material resulted in power density values
twice as large as that of cells with SLFCO7, which is an unexpected result. It was
postulated that the reason for the enhanced performance of LSFC10 could be higher
catalytic activity.
This work presents further research opportunities. It could be of interest to
study how the performance of the cells can be explored as a function of the mechanical
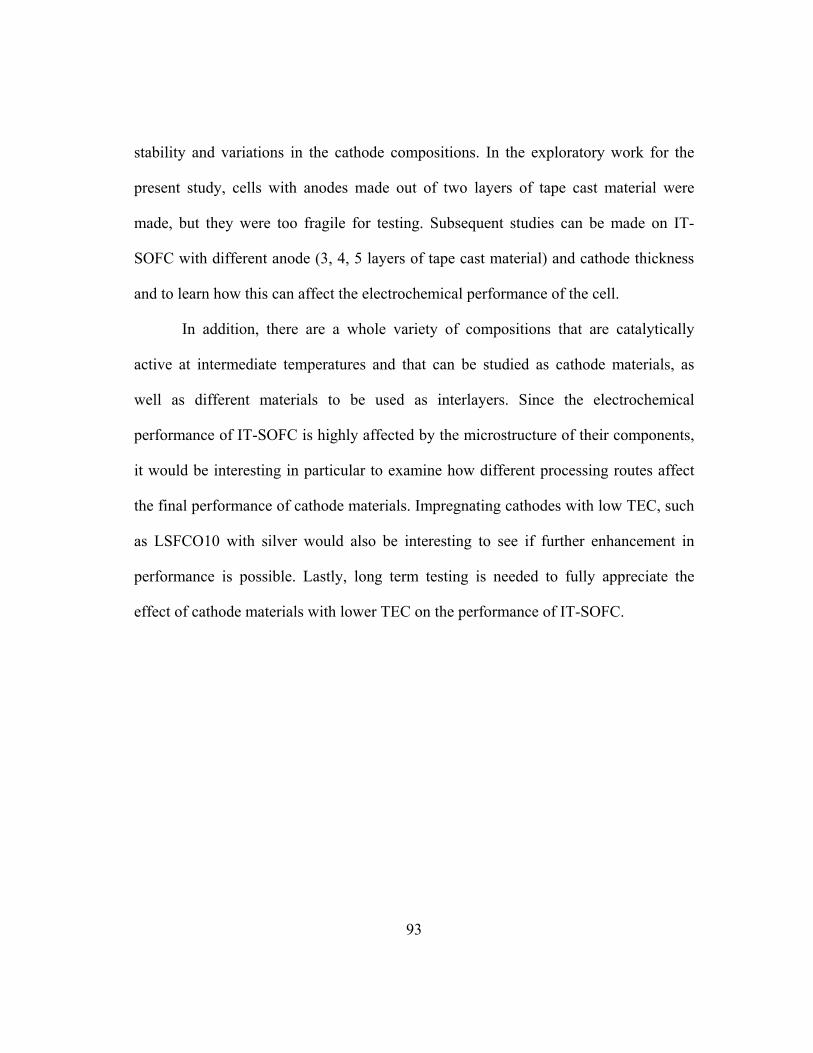
93
stability and variations in the cathode compositions. In the exploratory work for the
present study, cells with anodes made out of two layers of tape cast material were
made, but they were too fragile for testing. Subsequent studies can be made on IT-
SOFC with different anode (3, 4, 5 layers of tape cast material) and cathode thickness
and to learn how this can affect the electrochemical performance of the cell.
In addition, there are a whole variety of compositions that are catalytically
active at intermediate temperatures and that can be studied as cathode materials, as
well as different materials to be used as interlayers. Since the electrochemical
performance of IT-SOFC is highly affected by the microstructure of their components,
it would be interesting in particular to examine how different processing routes affect
the final performance of cathode materials. Impregnating cathodes with low TEC, such
as LSFCO10 with silver would also be interesting to see if further enhancement in
performance is possible. Lastly, long term testing is needed to fully appreciate the
effect of cathode materials with lower TEC on the performance of IT-SOFC.
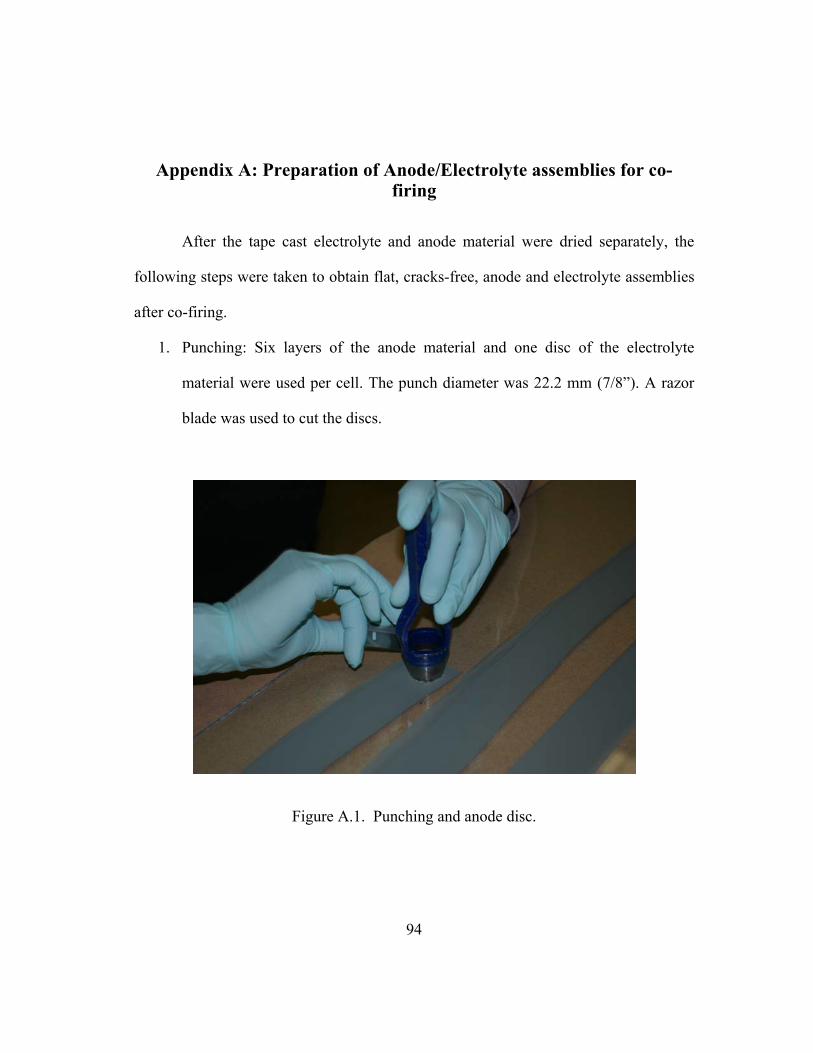
94
Appendix A: Preparation of Anode/Electrolyte assemblies for co-firing
After the tape cast electrolyte and anode material were dried separately, the
following steps were taken to obtain flat, cracks-free, anode and electrolyte assemblies
after co-firing.
1. Punching: Six layers of the anode material and one disc of the electrolyte
material were used per cell. The punch diameter was 22.2 mm (7/8”). A razor
blade was used to cut the discs.
Figure A.1. Punching and anode disc.
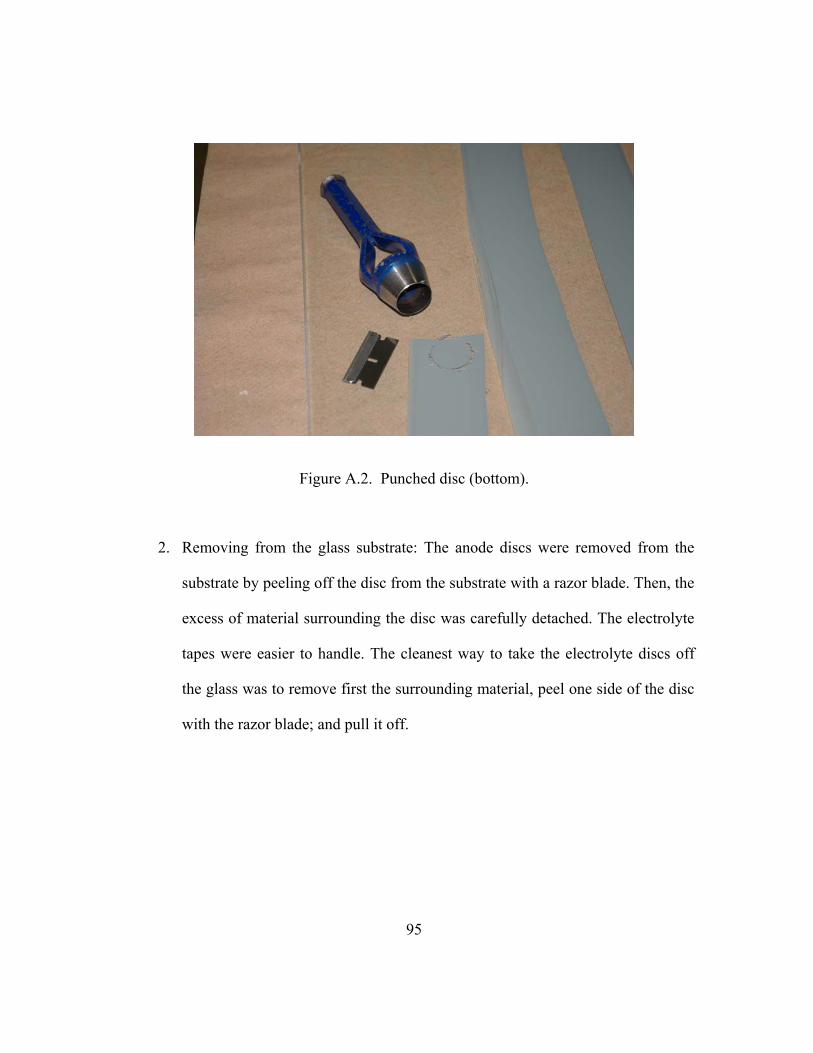
95
Figure A.2. Punched disc (bottom).
2. Removing from the glass substrate: The anode discs were removed from the
substrate by peeling off the disc from the substrate with a razor blade. Then, the
excess of material surrounding the disc was carefully detached. The electrolyte
tapes were easier to handle. The cleanest way to take the electrolyte discs off
the glass was to remove first the surrounding material, peel one side of the disc
with the razor blade; and pull it off.
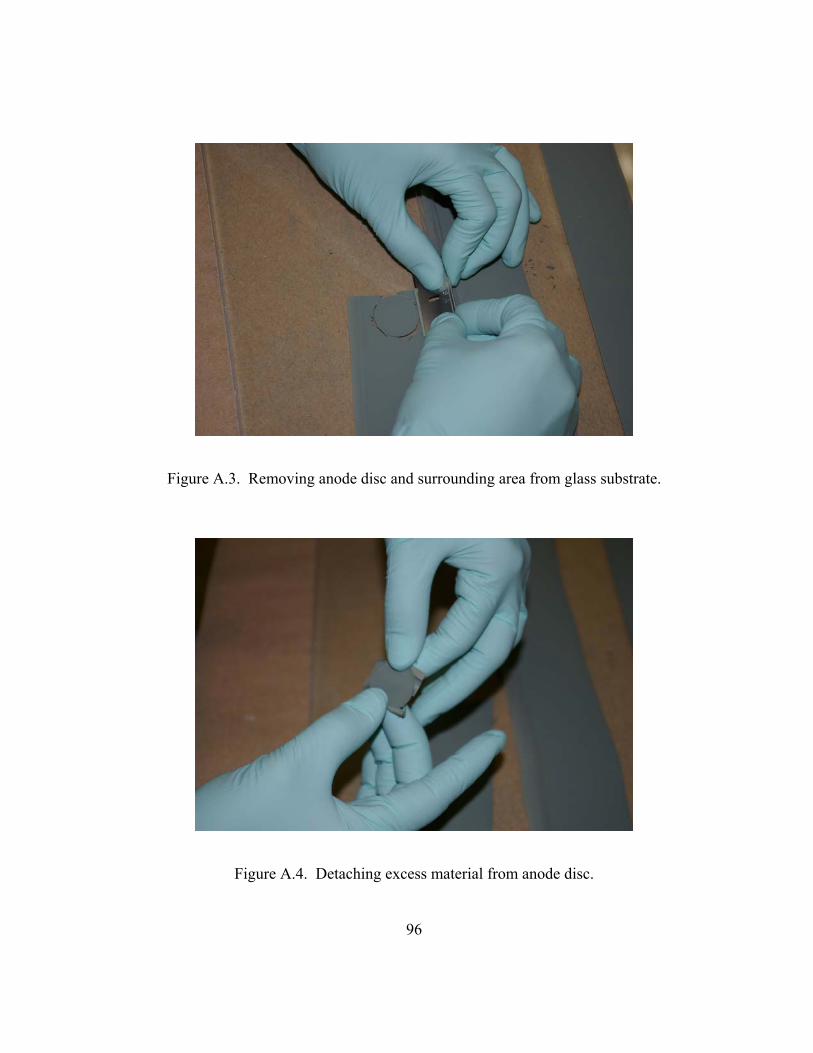
96
Figure A.3. Removing anode disc and surrounding area from glass substrate.
Figure A.4. Detaching excess material from anode disc.
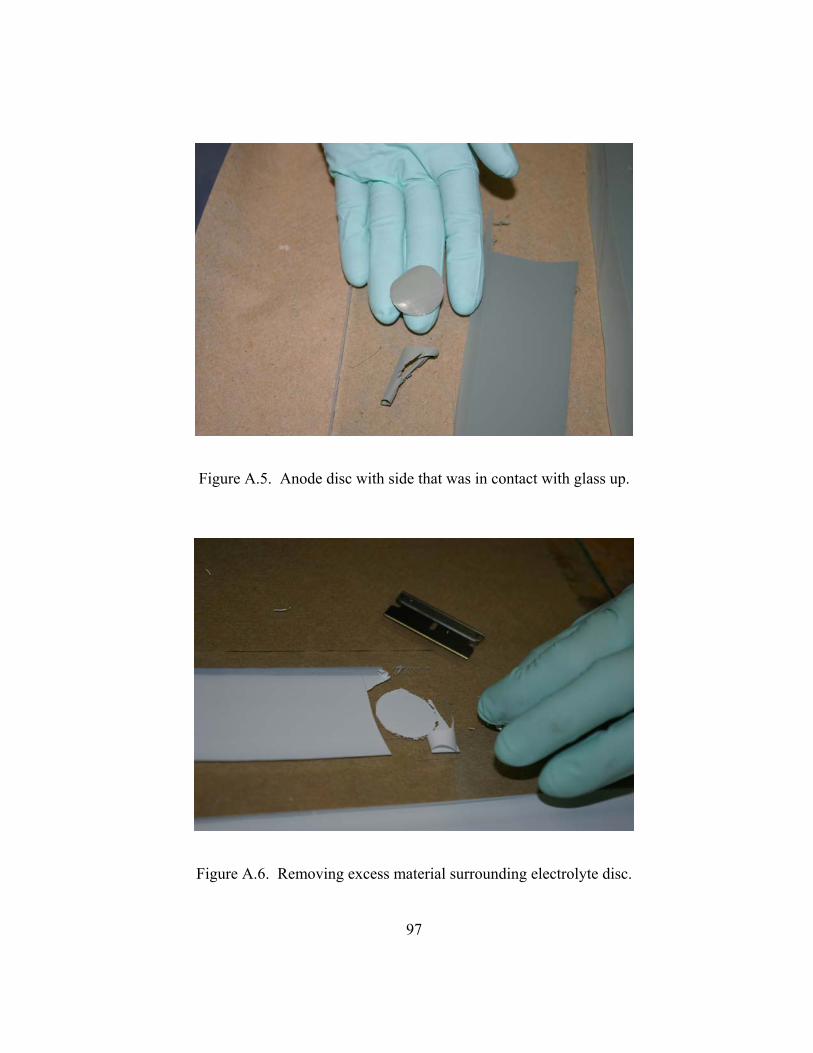
97
Figure A.5. Anode disc with side that was in contact with glass up.
Figure A.6. Removing excess material surrounding electrolyte disc.
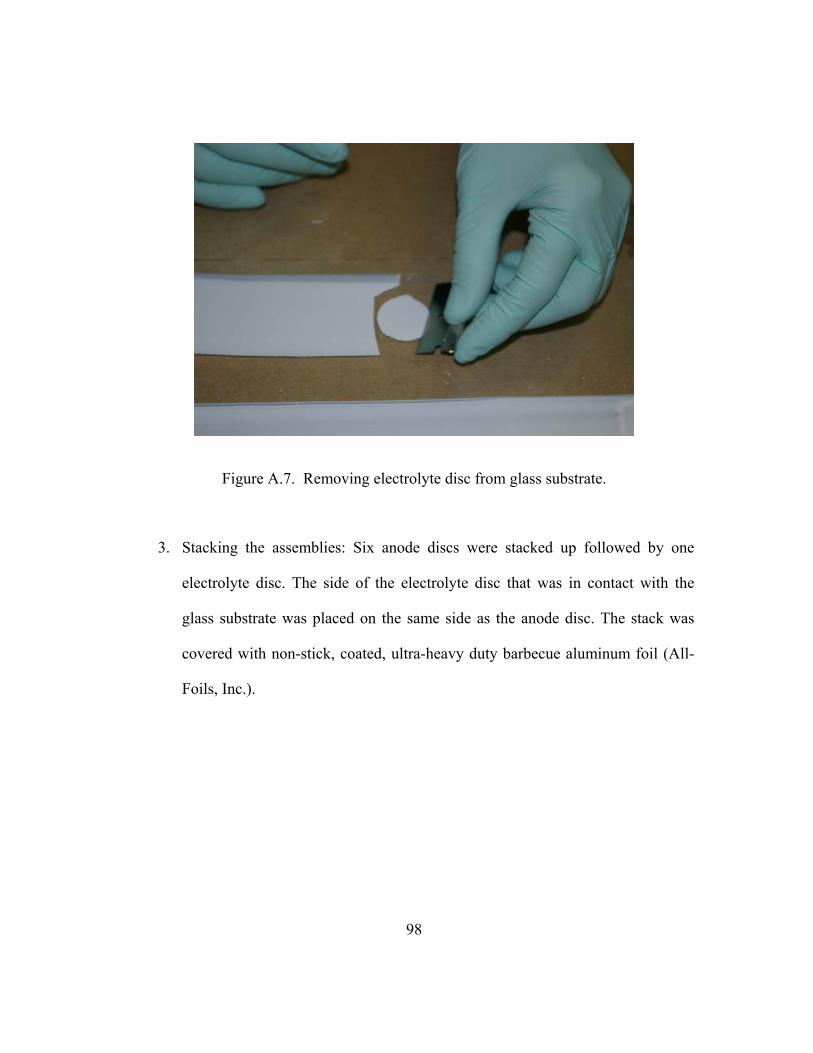
98
Figure A.7. Removing electrolyte disc from glass substrate.
3. Stacking the assemblies: Six anode discs were stacked up followed by one
electrolyte disc. The side of the electrolyte disc that was in contact with the
glass substrate was placed on the same side as the anode disc. The stack was
covered with non-stick, coated, ultra-heavy duty barbecue aluminum foil (All-
Foils, Inc.).
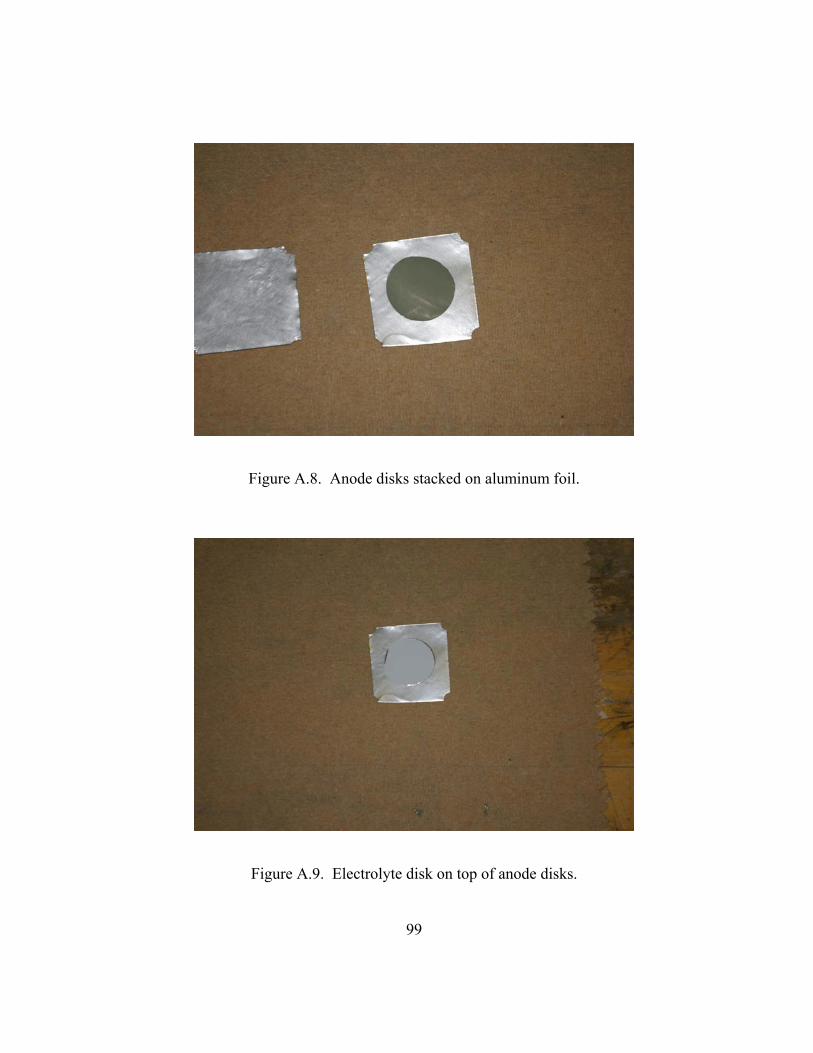
99
Figure A.8. Anode disks stacked on aluminum foil.
Figure A.9. Electrolyte disk on top of anode disks.
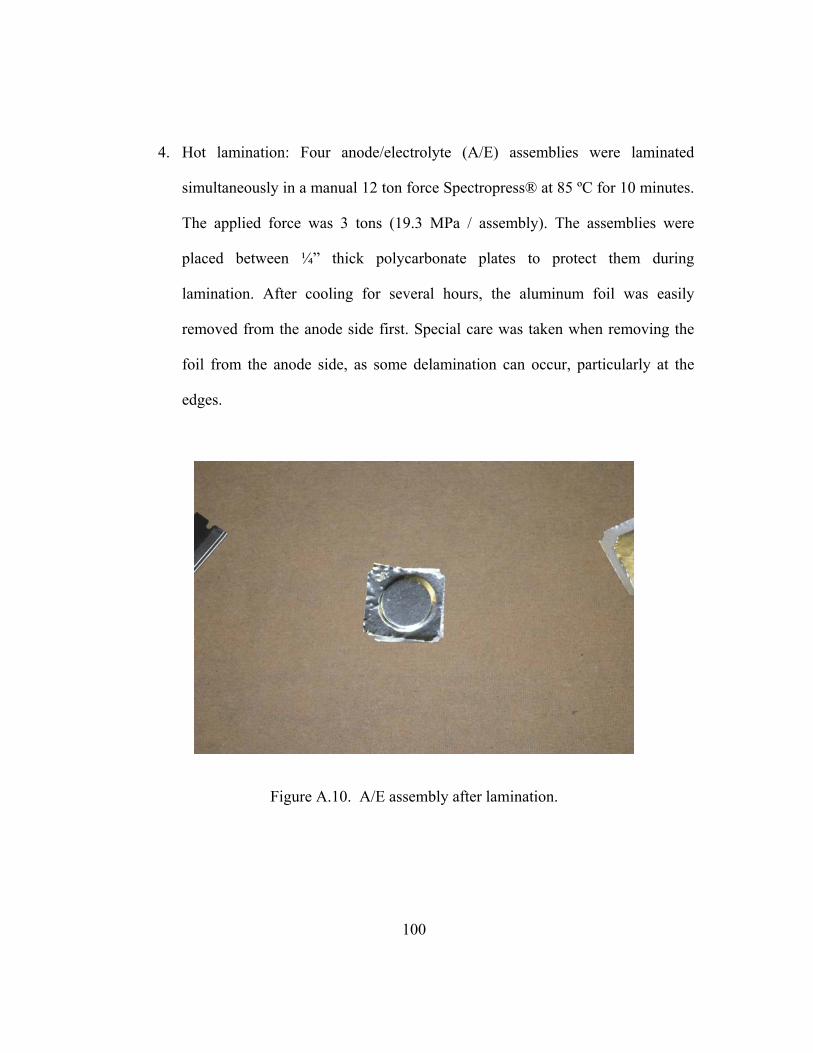
100
4. Hot lamination: Four anode/electrolyte (A/E) assemblies were laminated
simultaneously in a manual 12 ton force Spectropress® at 85 ºC for 10 minutes.
The applied force was 3 tons (19.3 MPa / assembly). The assemblies were
placed between ¼” thick polycarbonate plates to protect them during
lamination. After cooling for several hours, the aluminum foil was easily
removed from the anode side first. Special care was taken when removing the
foil from the anode side, as some delamination can occur, particularly at the
edges.
Figure A.10. A/E assembly after lamination.
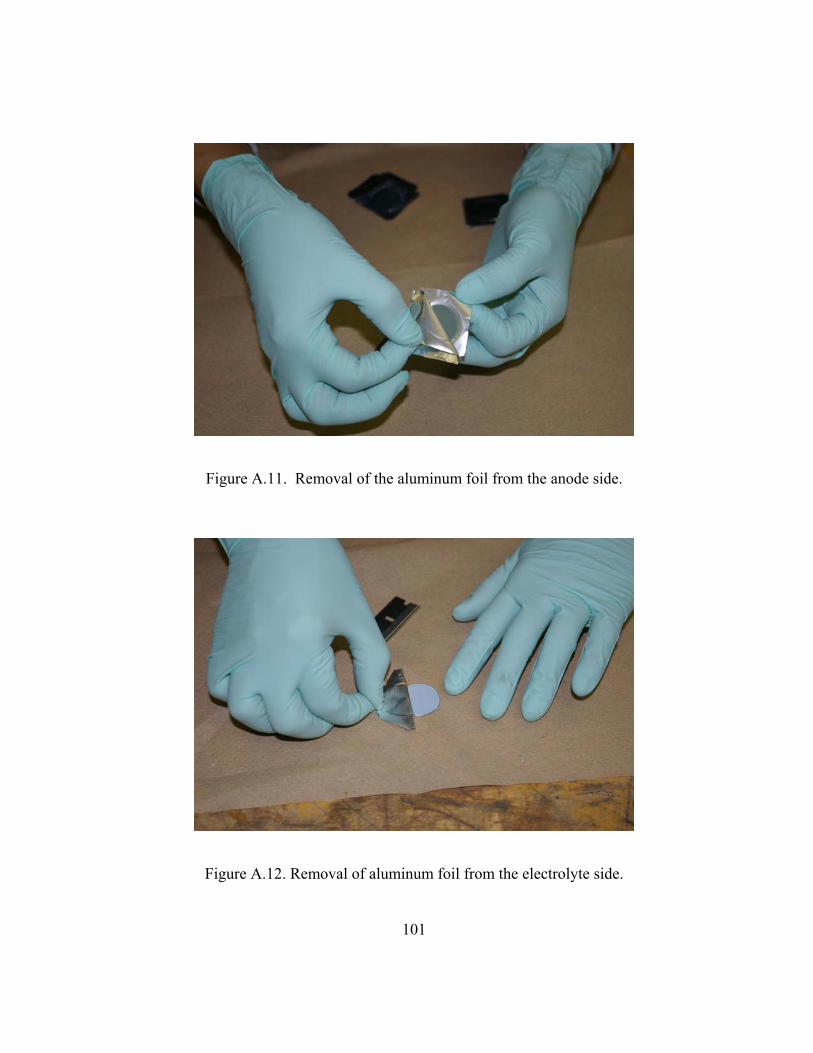
101
Figure A.11. Removal of the aluminum foil from the anode side.
Figure A.12. Removal of aluminum foil from the electrolyte side.
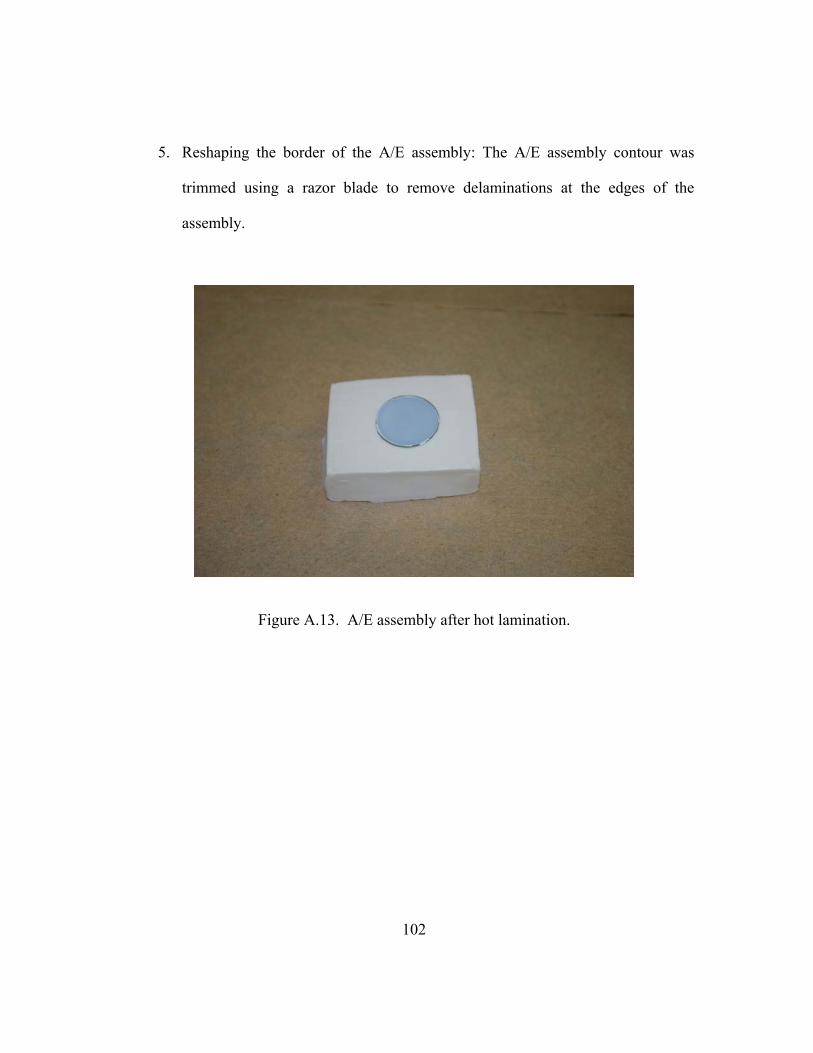
102
5. Reshaping the border of the A/E assembly: The A/E assembly contour was
trimmed using a razor blade to remove delaminations at the edges of the
assembly.
Figure A.13. A/E assembly after hot lamination.
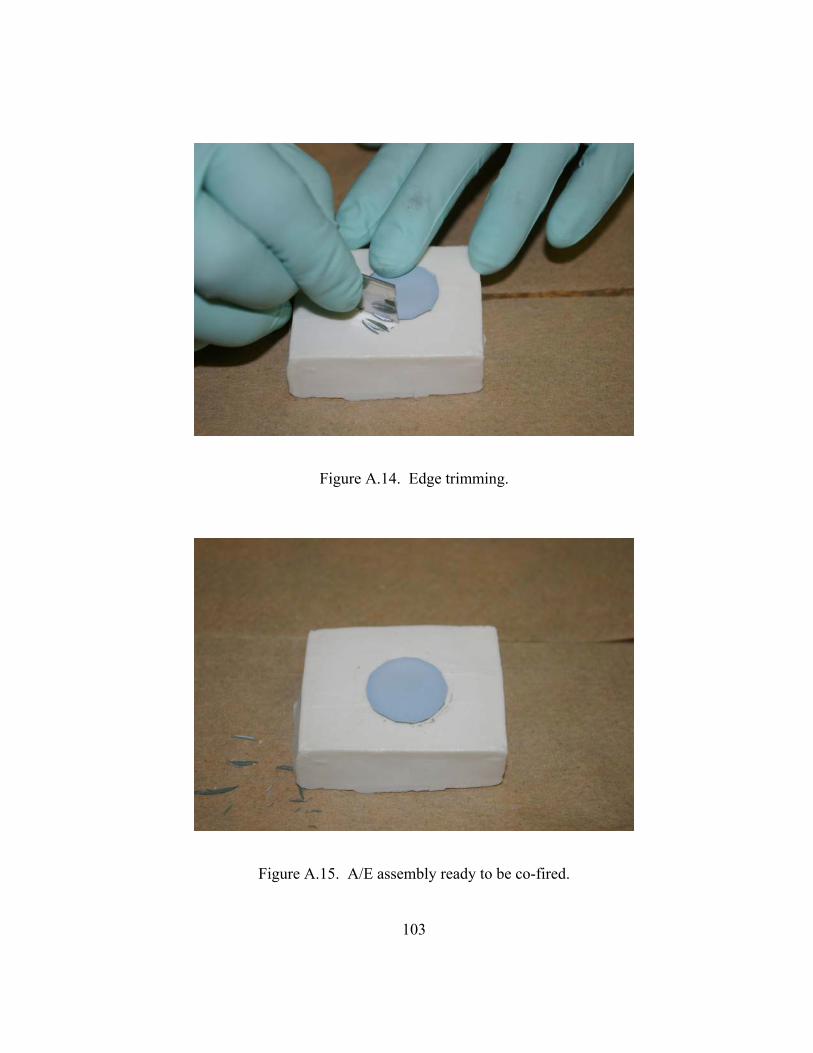
103
Figure A.14. Edge trimming.
Figure A.15. A/E assembly ready to be co-fired.
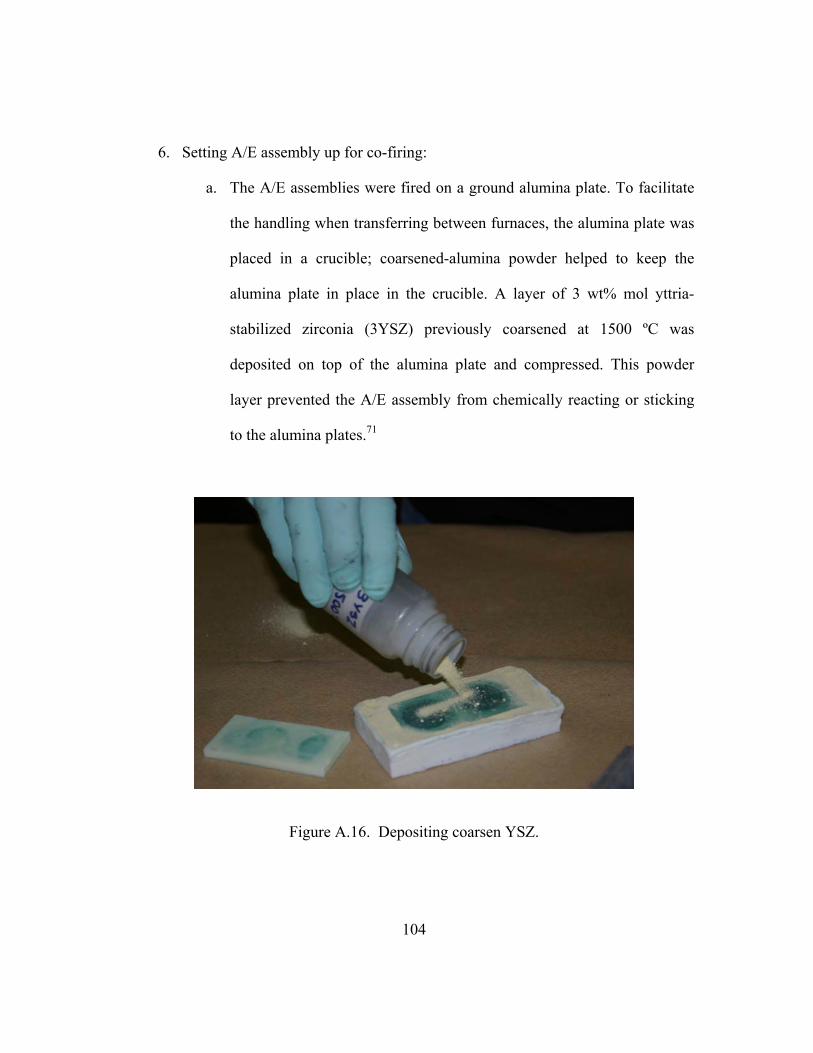
104
6. Setting A/E assembly up for co-firing:
a. The A/E assemblies were fired on a ground alumina plate. To facilitate
the handling when transferring between furnaces, the alumina plate was
placed in a crucible; coarsened-alumina powder helped to keep the
alumina plate in place in the crucible. A layer of 3 wt% mol yttria-
stabilized zirconia (3YSZ) previously coarsened at 1500 ºC was
deposited on top of the alumina plate and compressed. This powder
layer prevented the A/E assembly from chemically reacting or sticking
to the alumina plates.71
Figure A.16. Depositing coarsen YSZ.
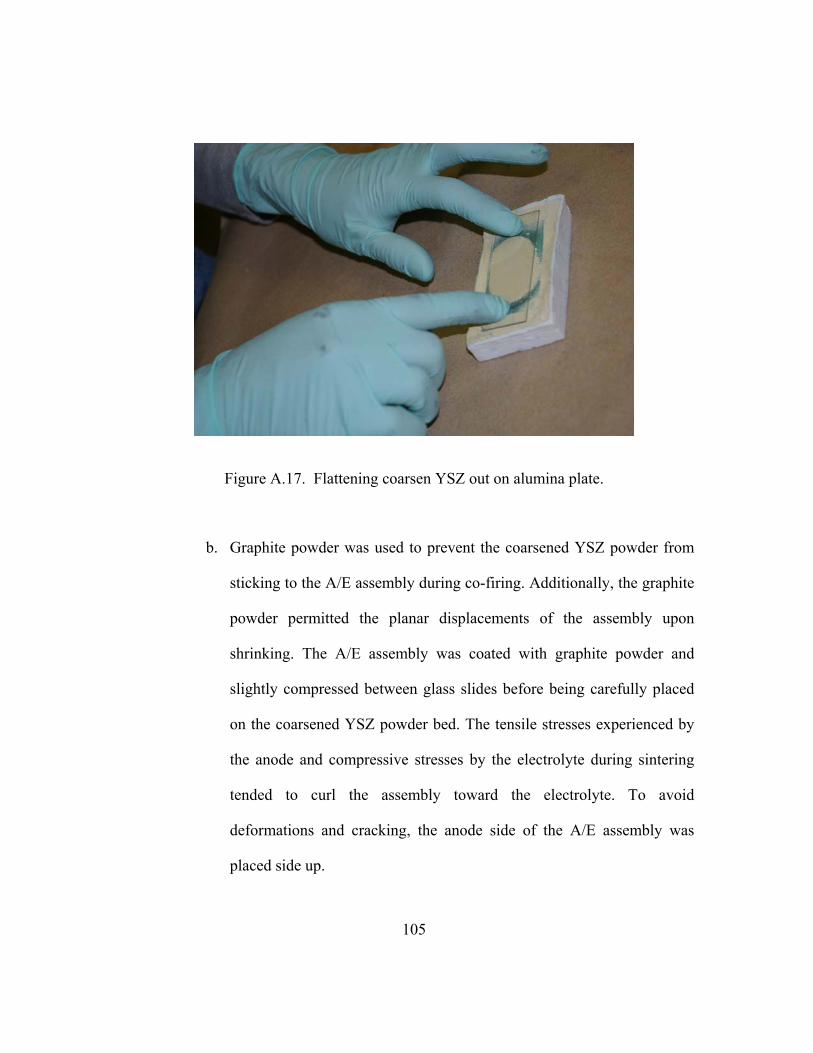
105
Figure A.17. Flattening coarsen YSZ out on alumina plate.
b. Graphite powder was used to prevent the coarsened YSZ powder from
sticking to the A/E assembly during co-firing. Additionally, the graphite
powder permitted the planar displacements of the assembly upon
shrinking. The A/E assembly was coated with graphite powder and
slightly compressed between glass slides before being carefully placed
on the coarsened YSZ powder bed. The tensile stresses experienced by
the anode and compressive stresses by the electrolyte during sintering
tended to curl the assembly toward the electrolyte. To avoid
deformations and cracking, the anode side of the A/E assembly was
placed side up.
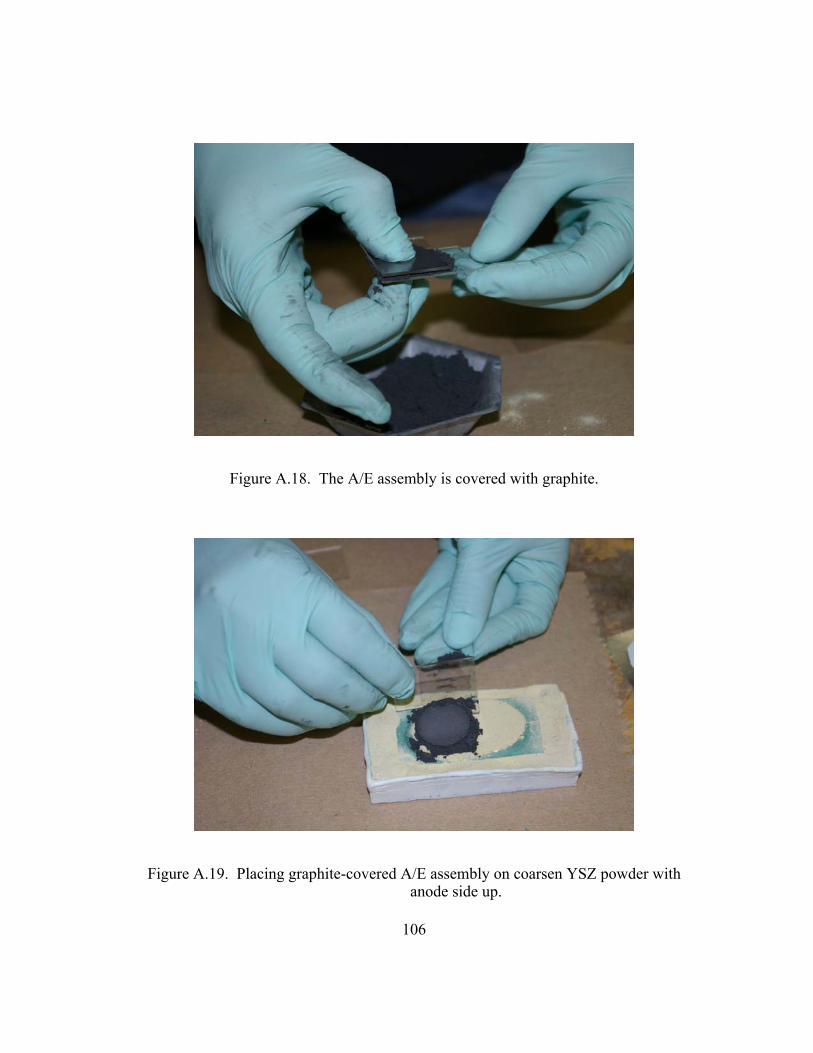
106
Figure A.18. The A/E assembly is covered with graphite.
Figure A.19. Placing graphite-covered A/E assembly on coarsen YSZ powder with anode side up.
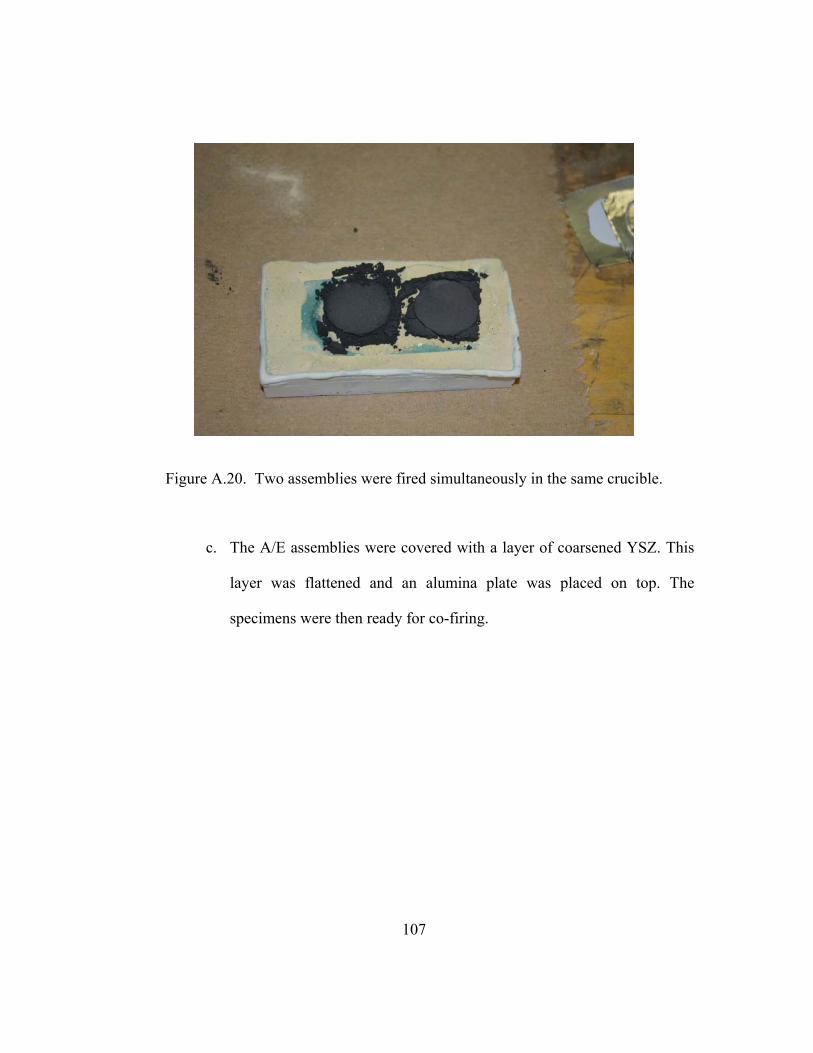
107
Figure A.20. Two assemblies were fired simultaneously in the same crucible.
c. The A/E assemblies were covered with a layer of coarsened YSZ. This
layer was flattened and an alumina plate was placed on top. The
specimens were then ready for co-firing.
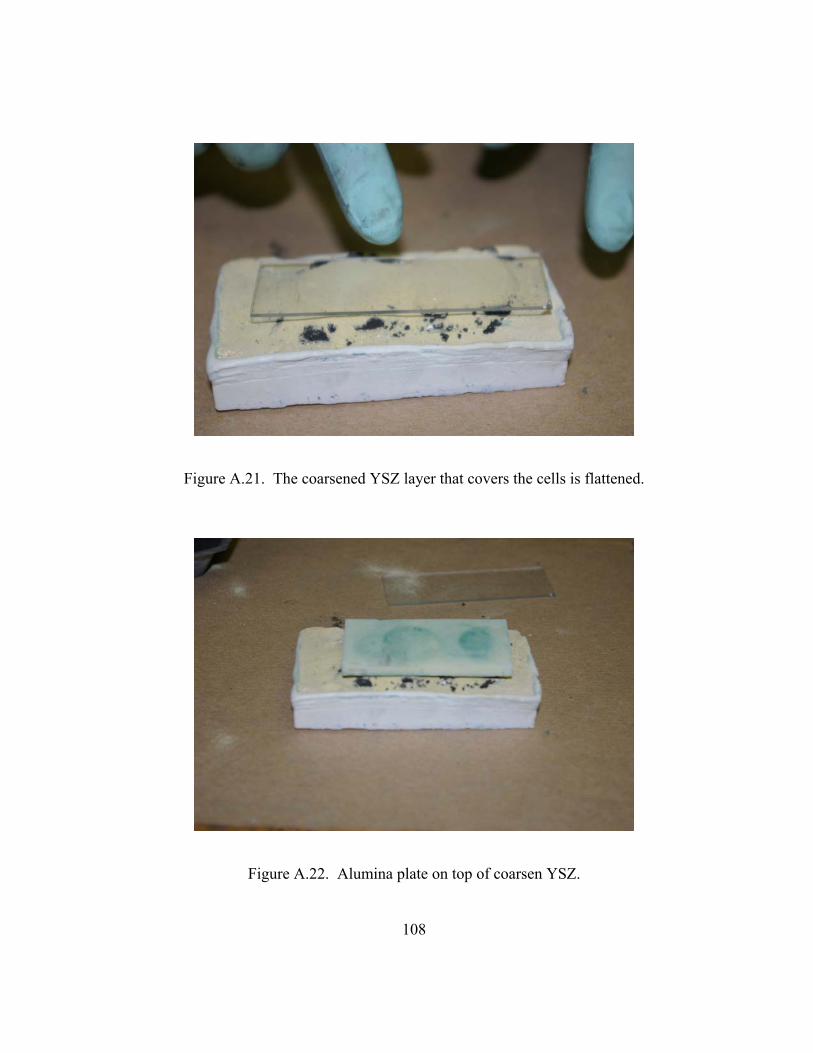
108
Figure A.21. The coarsened YSZ layer that covers the cells is flattened.
Figure A.22. Alumina plate on top of coarsen YSZ.
109
7. The co-firing was made in two separate steps. The organics were removed in a
tubular furnace. Then, the A/E assemblies were transferred to a box furnace for
sintering. At this point the specimens were extremely brittle. An additional
mass was placed on top of the crucibles to produce a pressure of about 500 Pa
during sintering.
8. A soft plastic spatula can was used to remove any coarsened YSZ that was
attached to the specimen after sintering.
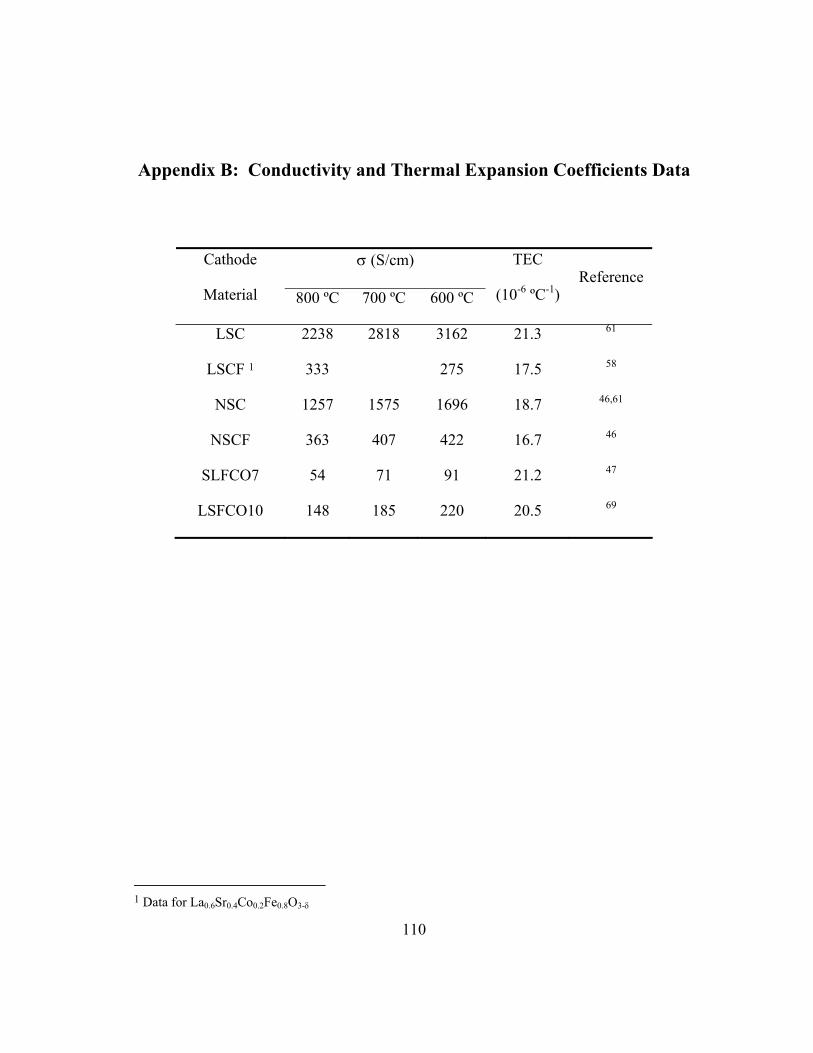
110
Appendix B: Conductivity and Thermal Expansion Coefficients Data
σ (S/cm) Cathode
Material 800 ºC 700 ºC 600 ºC
TEC
(10-6 ºC-1) Reference
LSC 2238 2818 3162 21.3 61
LSCF 1 333 275 17.5 58
NSC 1257 1575 1696 18.7 46,61
NSCF 363 407 422 16.7 46
SLFCO7 54 71 91 21.2 47
LSFCO10 148 185 220 20.5 69
1 Data for La0.6Sr0.4Co0.2Fe0.8O3-δ
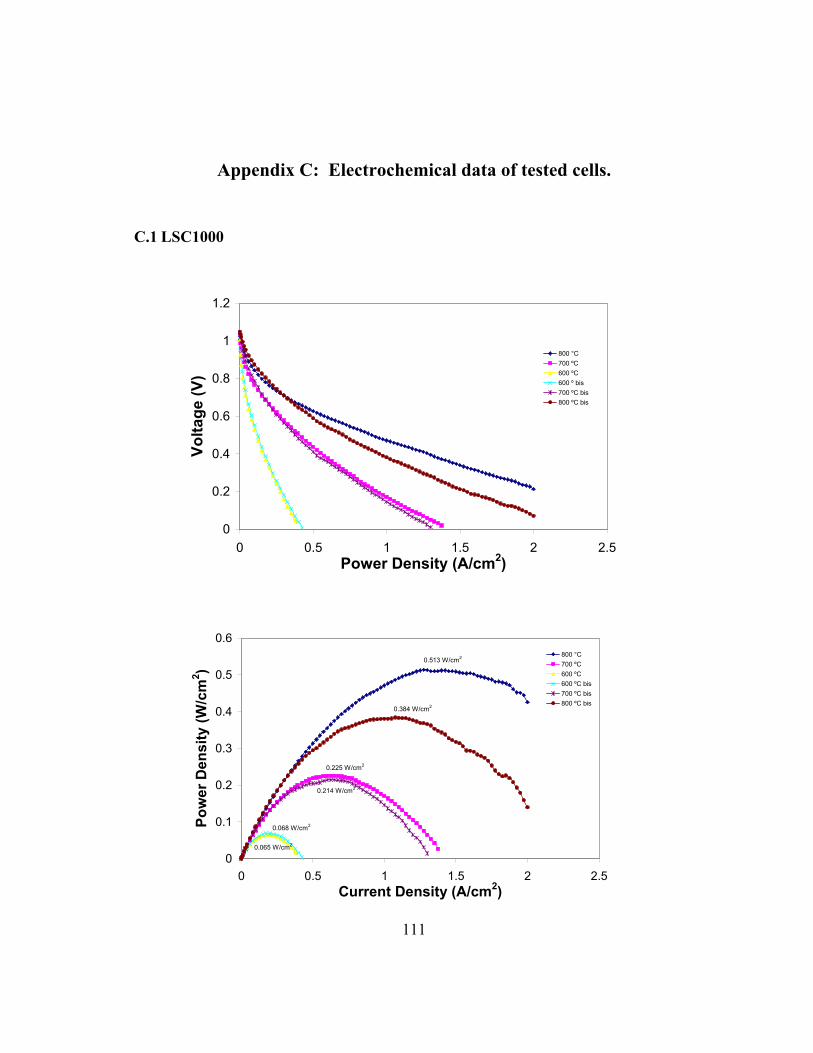
111
Appendix C: Electrochemical data of tested cells.
C.1 LSC1000
0
0.2
0.4
0.6
0.8
1
1.2
0 0.5 1 1.5 2 2.5Power Density (A/cm2)
Volta
ge (V
)
800 °C700 ºC600 ºC600 º bis700 ºC bis800 ºC bis
0.513 W/cm2
0.225 W/cm2
0.065 W/cm2
0.068 W/cm2
0.214 W/cm2
0.384 W/cm2
0
0.1
0.2
0.3
0.4
0.5
0.6
0 0.5 1 1.5 2 2.5Current Density (A/cm2)
Pow
er D
ensi
ty (W
/cm
2 )
800 °C700 ºC600 ºC600 ºC bis700 ºC bis800 ºC bis
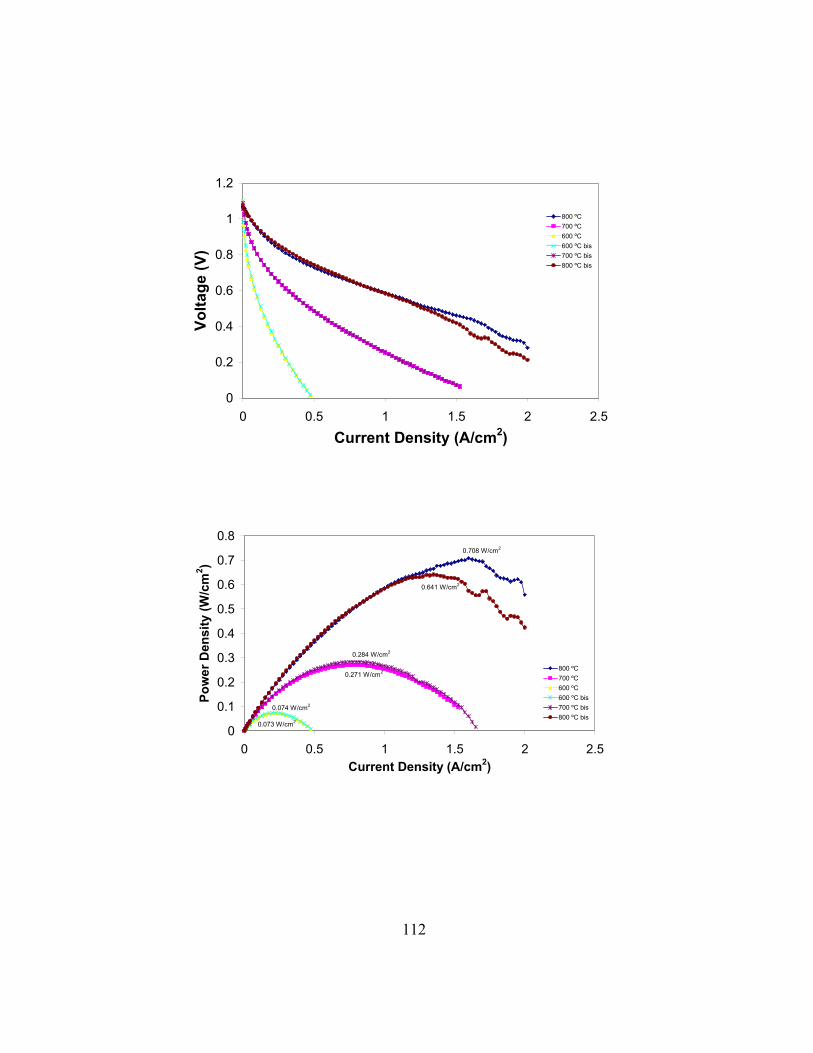
112
0
0.2
0.4
0.6
0.8
1
1.2
0 0.5 1 1.5 2 2.5
Current Density (A/cm2)
Volta
ge (V
)800 ºC700 ºC600 ºC600 ºC bis700 ºC bis800 ºC bis
0.708 W/cm2
0.271 W/cm2
0.073 W/cm2
0.074 W/cm2
0.284 W/cm2
0.641 W/cm2
0
0.1
0.2
0.3
0.4
0.5
0.6
0.7
0.8
0 0.5 1 1.5 2 2.5Current Density (A/cm2)
Pow
er D
ensi
ty (W
/cm
2 )
800 ºC700 ºC600 ºC600 ºC bis700 ºC bis800 ºC bis
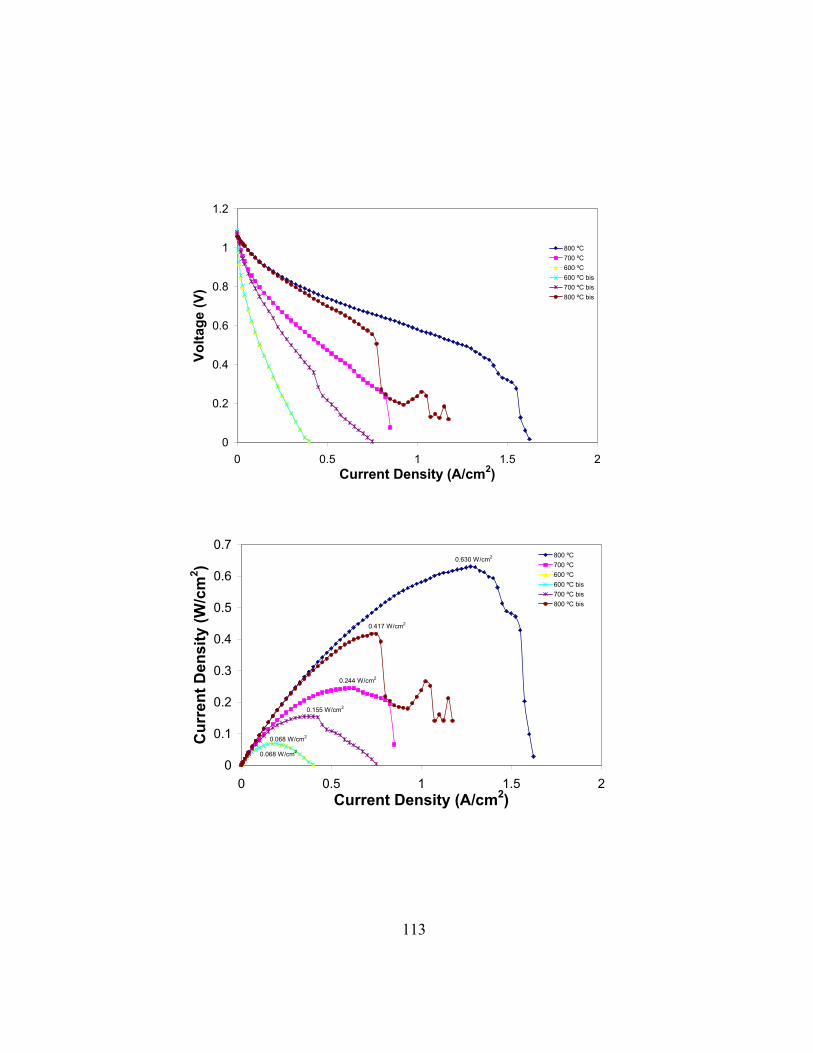
113
0
0.2
0.4
0.6
0.8
1
1.2
0 0.5 1 1.5 2Current Density (A/cm2)
Volta
ge (V
)
800 ºC700 ºC600 ºC600 ºC bis700 ºC bis800 ºC bis
0.630 W/cm2
0.244 W/cm2
0.068 W/cm2
0.068 W/cm2
0.155 W/cm2
0.417 W/cm2
0
0.1
0.2
0.3
0.4
0.5
0.6
0.7
0 0.5 1 1.5 2Current Density (A/cm2)
Cur
rent
Den
sity
(W/c
m2 )
800 ºC700 ºC600 ºC600 ºC bis700 ºC bis800 ºC bis
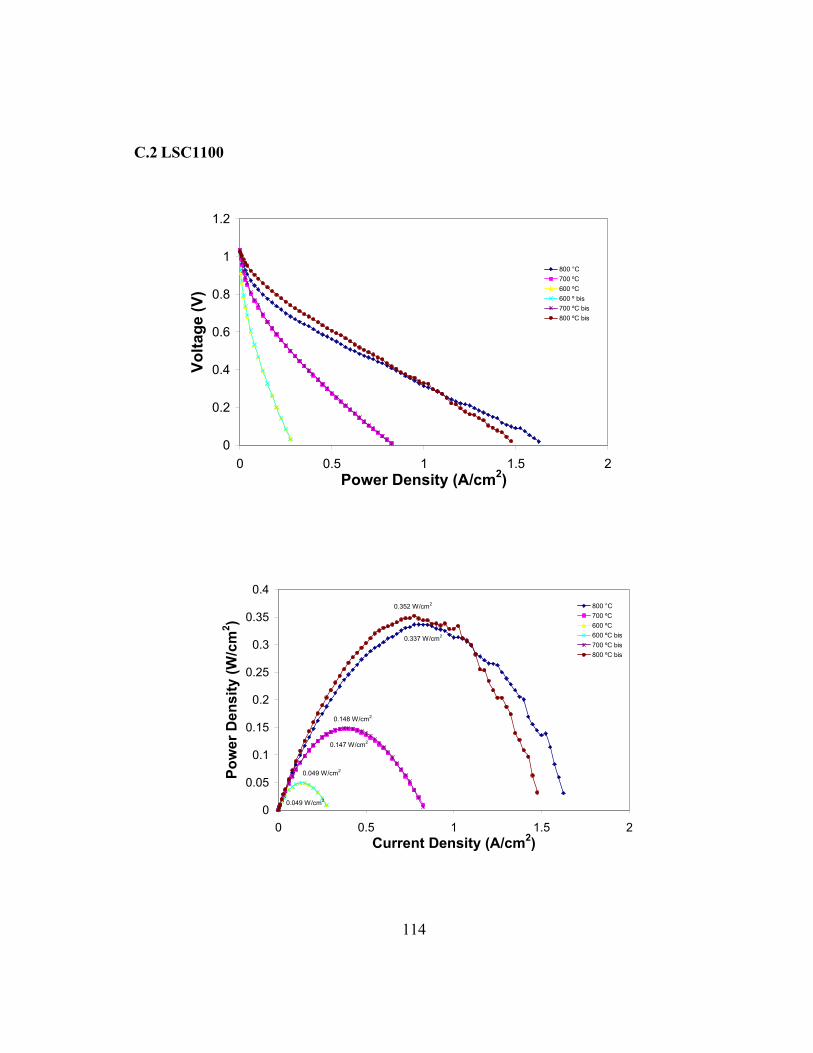
114
C.2 LSC1100
0
0.2
0.4
0.6
0.8
1
1.2
0 0.5 1 1.5 2Power Density (A/cm2)
Volta
ge (V
)
800 °C700 ºC600 ºC600 º bis700 ºC bis800 ºC bis
0.337 W/cm2
0.148 W/cm2
0.049 W/cm2
0.049 W/cm2
0.147 W/cm2
0.352 W/cm2
0
0.05
0.1
0.15
0.2
0.25
0.3
0.35
0.4
0 0.5 1 1.5 2Current Density (A/cm2)
Pow
er D
ensi
ty (W
/cm
2 )
800 °C700 ºC600 ºC600 ºC bis700 ºC bis800 ºC bis
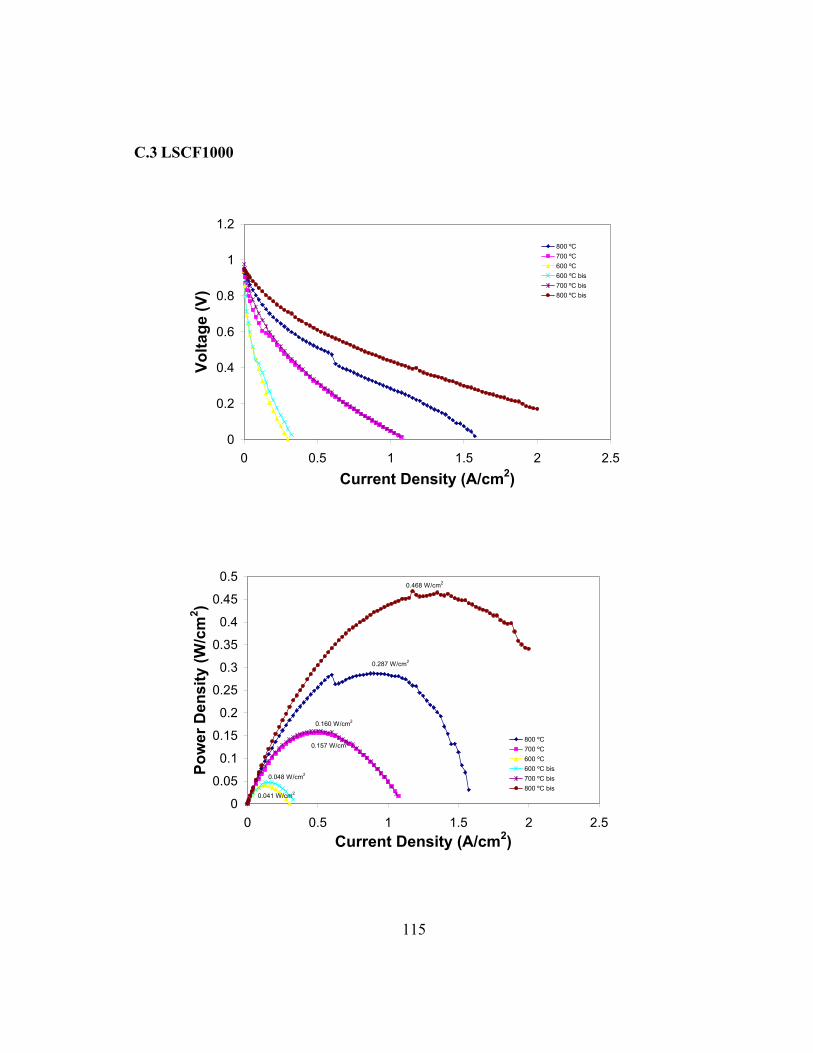
115
C.3 LSCF1000
0
0.2
0.4
0.6
0.8
1
1.2
0 0.5 1 1.5 2 2.5
Current Density (A/cm2)
Volta
ge (V
)
800 ºC700 ºC600 ºC600 ºC bis700 ºC bis800 ºC bis
0.287 W/cm2
0.157 W/cm2
0.041 W/cm2
0.048 W/cm2
0.160 W/cm2
0.468 W/cm2
0
0.05
0.1
0.15
0.2
0.25
0.3
0.35
0.4
0.45
0.5
0 0.5 1 1.5 2 2.5Current Density (A/cm2)
Pow
er D
ensi
ty (W
/cm
2 )
800 ºC700 ºC600 ºC600 ºC bis700 ºC bis800 ºC bis
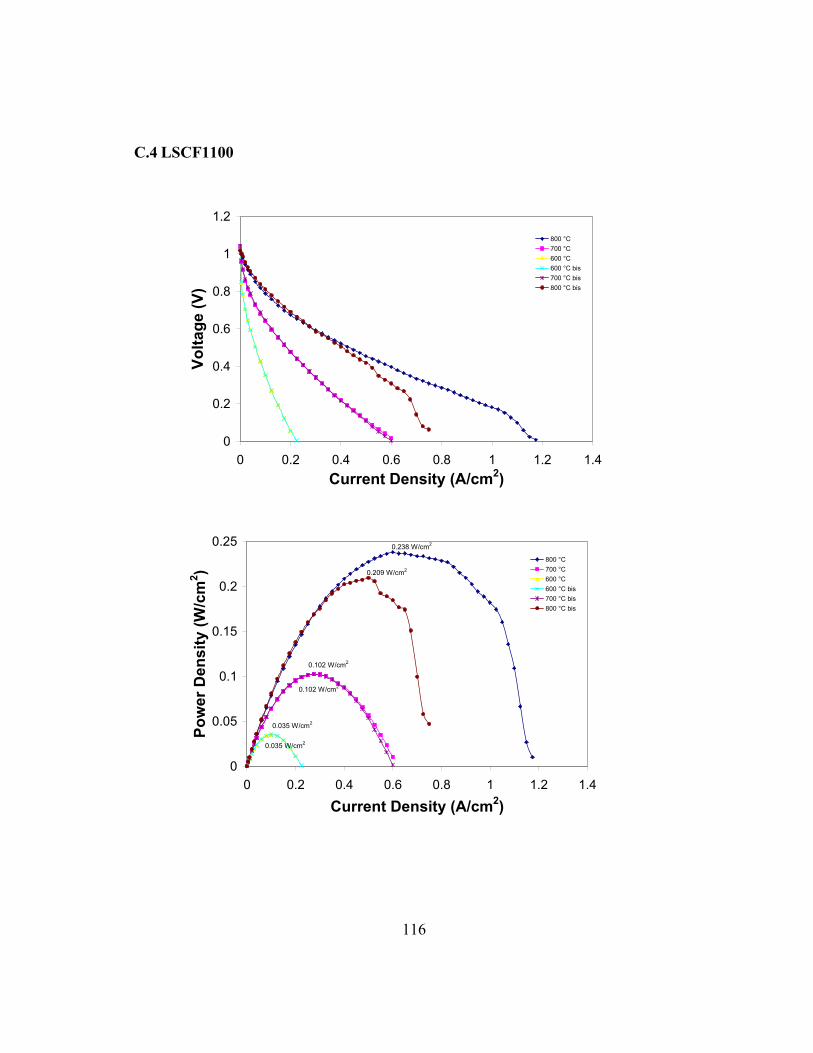
116
C.4 LSCF1100
0
0.2
0.4
0.6
0.8
1
1.2
0 0.2 0.4 0.6 0.8 1 1.2 1.4Current Density (A/cm2)
Volta
ge (V
)
800 °C700 °C600 °C600 °C bis700 °C bis800 °C bis
0.238 W/cm2
0.102 W/cm2
0.035 W/cm2
0.035 W/cm2
0.102 W/cm2
0.209 W/cm2
0
0.05
0.1
0.15
0.2
0.25
0 0.2 0.4 0.6 0.8 1 1.2 1.4
Current Density (A/cm2)
Pow
er D
ensi
ty (W
/cm
2 )
800 °C700 °C600 °C600 °C bis700 °C bis800 °C bis
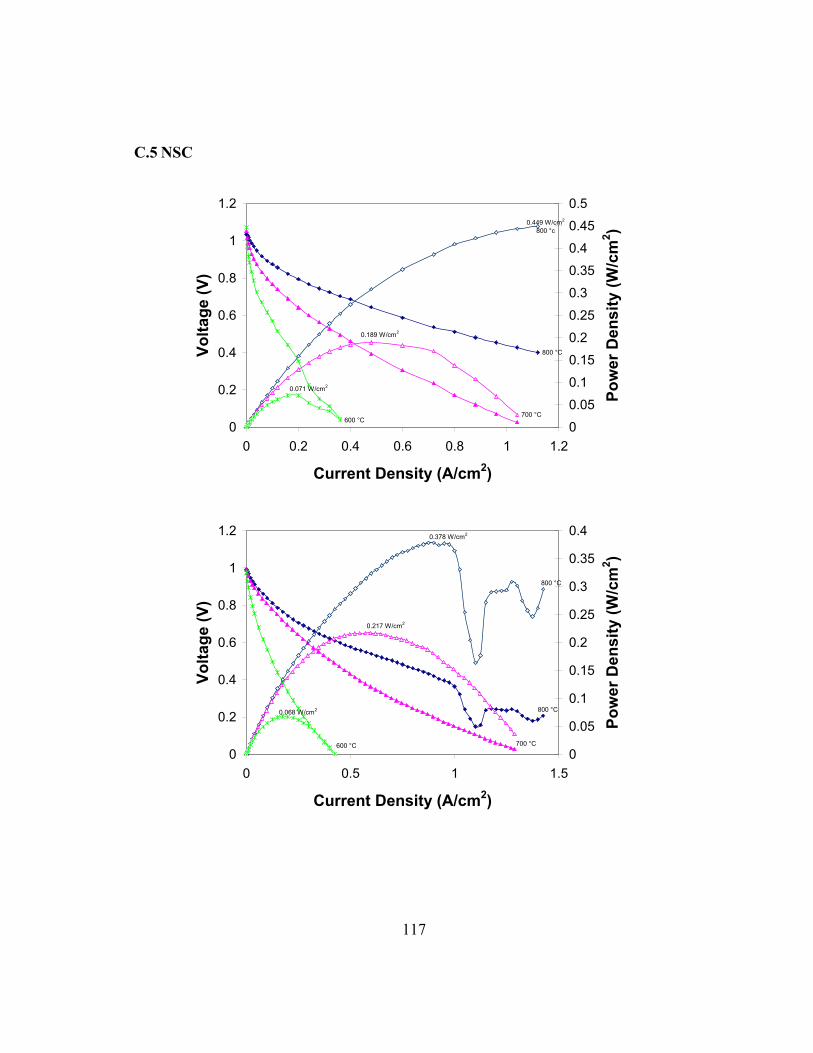
117
C.5 NSC
800 °C
0.449 W/cm2
800 °c
0.189 W/cm2
700 °C
0.071 W/cm2
600 °C0
0.2
0.4
0.6
0.8
1
1.2
0 0.2 0.4 0.6 0.8 1 1.2
Current Density (A/cm2)
Volta
ge (V
)
0
0.05
0.1
0.15
0.2
0.25
0.3
0.35
0.4
0.45
0.5
Pow
er D
ensi
ty (W
/cm
2 )
800 °C
0.378 W/cm2
800 °C
700 °C
0.217 W/cm2
600 °C
0.068 W/cm2
0
0.2
0.4
0.6
0.8
1
1.2
0 0.5 1 1.5
Current Density (A/cm2)
Volta
ge (V
)
0
0.05
0.1
0.15
0.2
0.25
0.3
0.35
0.4
Pow
er D
ensi
ty (W
/cm
2 )
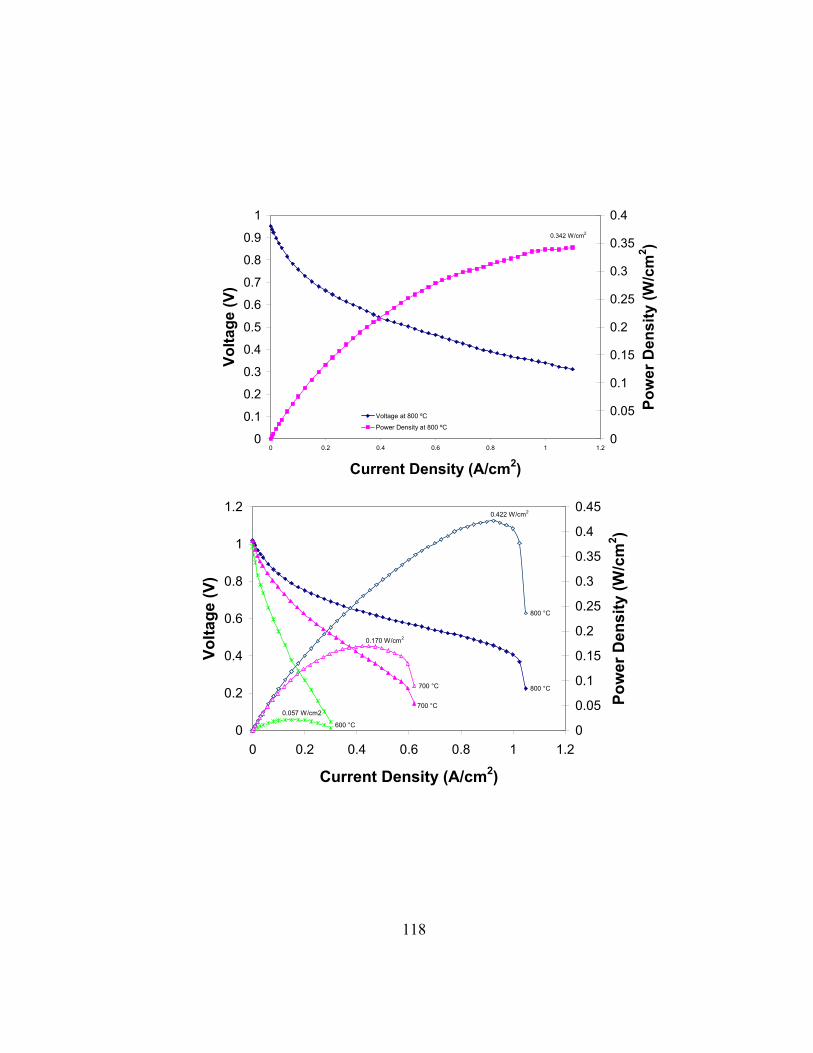
118
0.342 W/cm2
0
0.1
0.2
0.3
0.4
0.5
0.6
0.7
0.8
0.9
1
0 0.2 0.4 0.6 0.8 1 1.2
Current Density (A/cm2)
Volta
ge (V
)
0
0.05
0.1
0.15
0.2
0.25
0.3
0.35
0.4
Pow
er D
ensi
ty (W
/cm
2 )
Voltage at 800 ºC
Power Density at 800 ºC
800 °C
700 °C
600 °C
0.057 W/cm2
0.422 W/cm2
800 °C
0.170 W/cm2
700 °C
0
0.2
0.4
0.6
0.8
1
1.2
0 0.2 0.4 0.6 0.8 1 1.2
Current Density (A/cm2)
Volta
ge (V
)
0
0.05
0.1
0.15
0.2
0.25
0.3
0.35
0.4
0.45
Pow
er D
ensi
ty (W
/cm
2 )
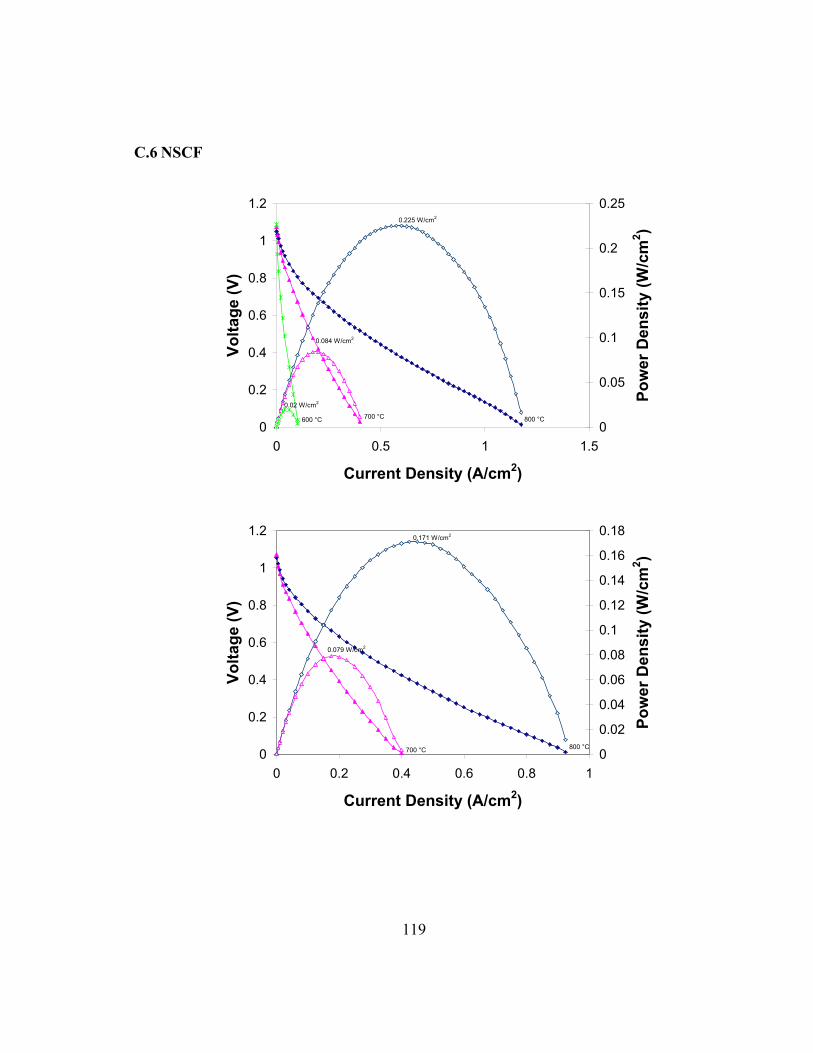
119
C.6 NSCF
600 °C 800 °C
0.225 W/cm2
0.084 W/cm2
700 °C
0.02 W/cm2
0
0.2
0.4
0.6
0.8
1
1.2
0 0.5 1 1.5
Current Density (A/cm2)
Volta
ge (V
)
0
0.05
0.1
0.15
0.2
0.25
Pow
er D
ensi
ty (W
/cm
2 )
800 °C
0.171 W/cm2
700 °C
0.079 W/cm2
0
0.2
0.4
0.6
0.8
1
1.2
0 0.2 0.4 0.6 0.8 1
Current Density (A/cm2)
Volta
ge (V
)
0
0.02
0.04
0.06
0.08
0.1
0.12
0.14
0.16
0.18
Pow
er D
ensi
ty (W
/cm
2 )
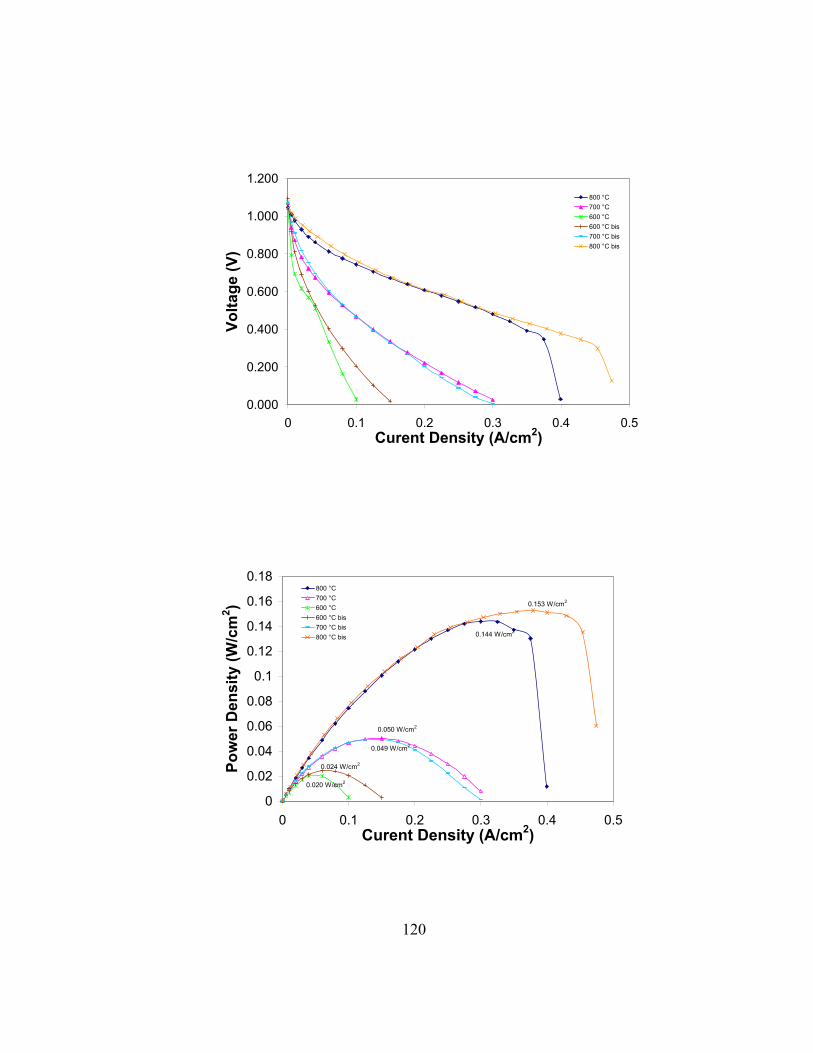
120
0.000
0.200
0.400
0.600
0.800
1.000
1.200
0 0.1 0.2 0.3 0.4 0.5Curent Density (A/cm2)
Volta
ge (V
)
800 °C700 °C600 °C600 °C bis700 °C bis800 °C bis
0.144 W/cm2
0.050 W/cm2
0.020 W/cm2
0.024 W/cm2
0.049 W/cm2
0.153 W/cm2
0
0.02
0.04
0.06
0.08
0.1
0.12
0.14
0.16
0.18
0 0.1 0.2 0.3 0.4 0.5Curent Density (A/cm2)
Pow
er D
ensi
ty (W
/cm
2 )
800 °C700 °C600 °C600 °C bis700 °C bis800 °C bis
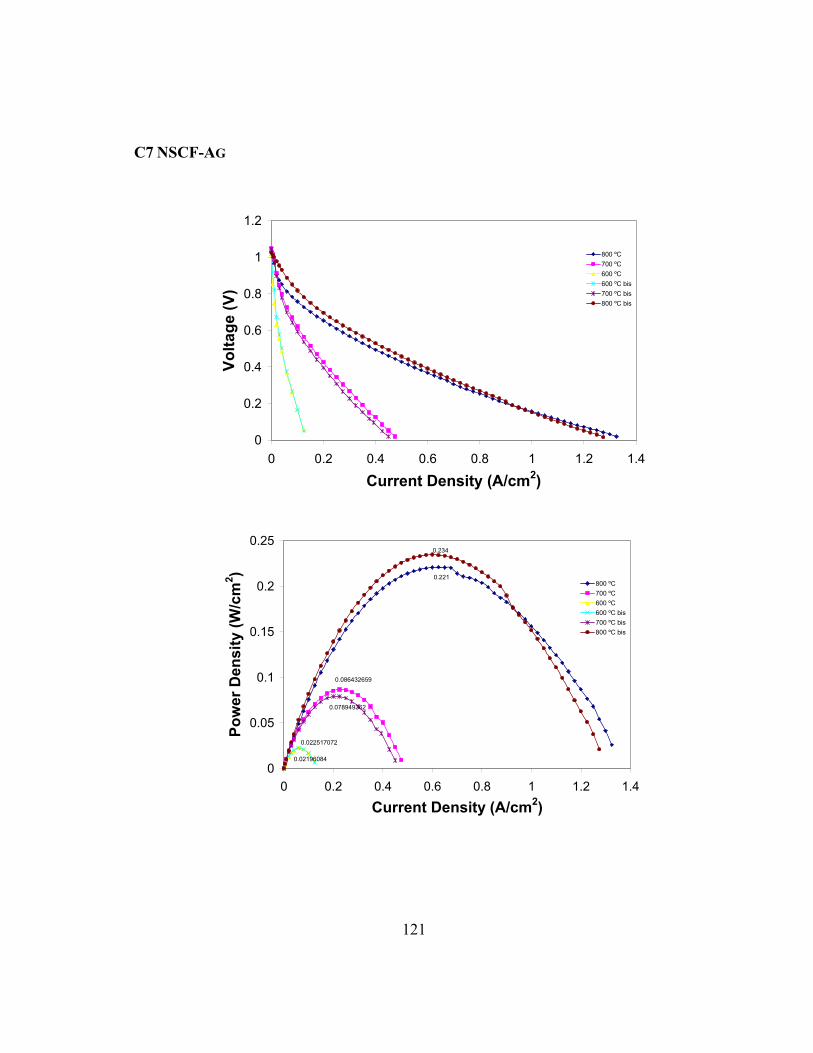
121
C7 NSCF-AG
0
0.2
0.4
0.6
0.8
1
1.2
0 0.2 0.4 0.6 0.8 1 1.2 1.4
Current Density (A/cm2)
Volta
ge (V
)800 ºC700 ºC600 ºC600 ºC bis700 ºC bis800 ºC bis
0.221
0.086432659
0.02196084
0.022517072
0.078949362
0.234
0
0.05
0.1
0.15
0.2
0.25
0 0.2 0.4 0.6 0.8 1 1.2 1.4
Current Density (A/cm2)
Pow
er D
ensi
ty (W
/cm
2 )
800 ºC700 ºC600 ºC600 ºC bis700 ºC bis800 ºC bis
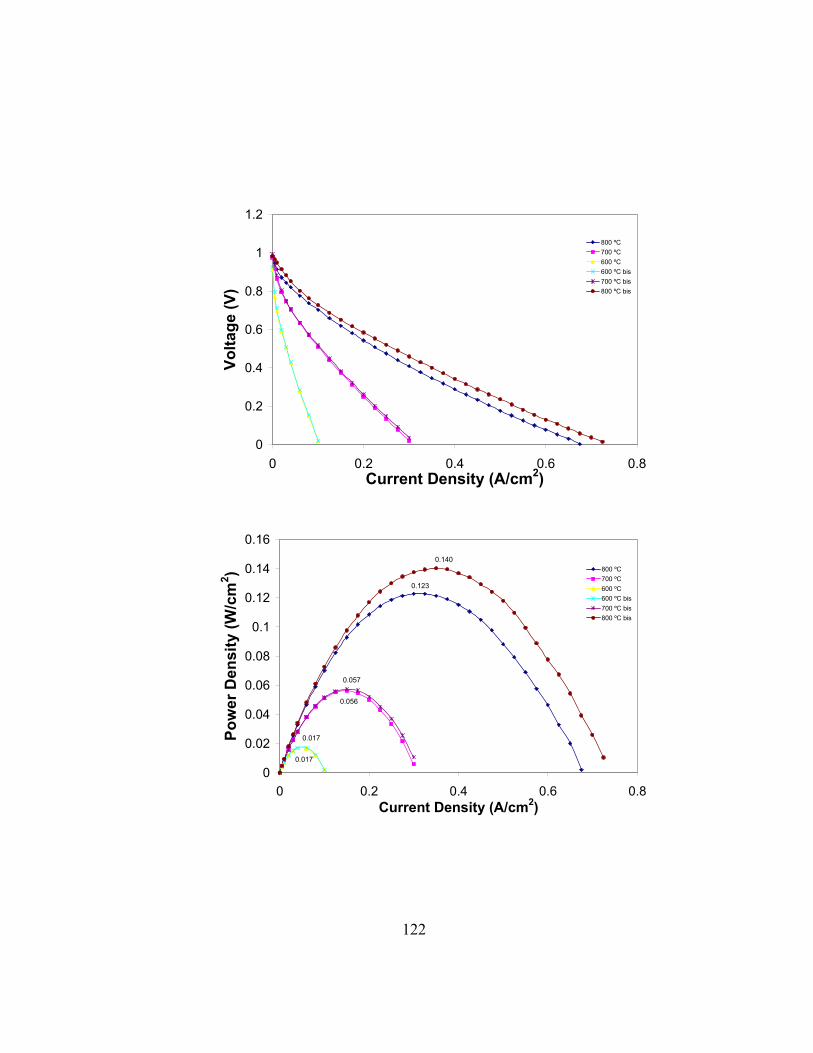
122
0
0.2
0.4
0.6
0.8
1
1.2
0 0.2 0.4 0.6 0.8Current Density (A/cm2)
Volta
ge (V
)800 ºC700 ºC600 ºC600 ºC bis700 ºC bis800 ºC bis
0.123
0.056
0.017
0.017
0.057
0.140
0
0.02
0.04
0.06
0.08
0.1
0.12
0.14
0.16
0 0.2 0.4 0.6 0.8Current Density (A/cm2)
Pow
er D
ensi
ty (W
/cm
2 ) 800 ºC700 ºC600 ºC600 ºC bis700 ºC bis800 ºC bis
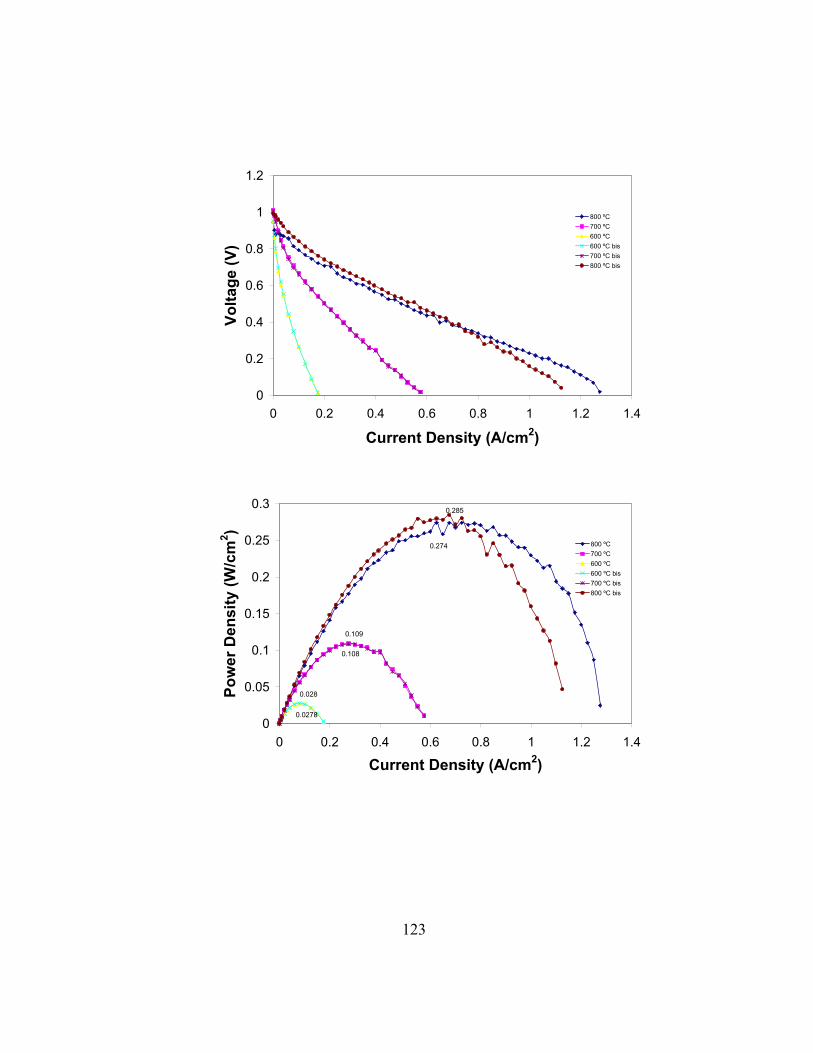
123
0
0.2
0.4
0.6
0.8
1
1.2
0 0.2 0.4 0.6 0.8 1 1.2 1.4
Current Density (A/cm2)
Volta
ge (V
)800 ºC700 ºC600 ºC600 ºC bis700 ºC bis800 ºC bis
0.274
0.109
0.0278
0.028
0.108
0.285
0
0.05
0.1
0.15
0.2
0.25
0.3
0 0.2 0.4 0.6 0.8 1 1.2 1.4
Current Density (A/cm2)
Pow
er D
ensi
ty (W
/cm
2 )
800 ºC700 ºC600 ºC600 ºC bis700 ºC bis800 ºC bis
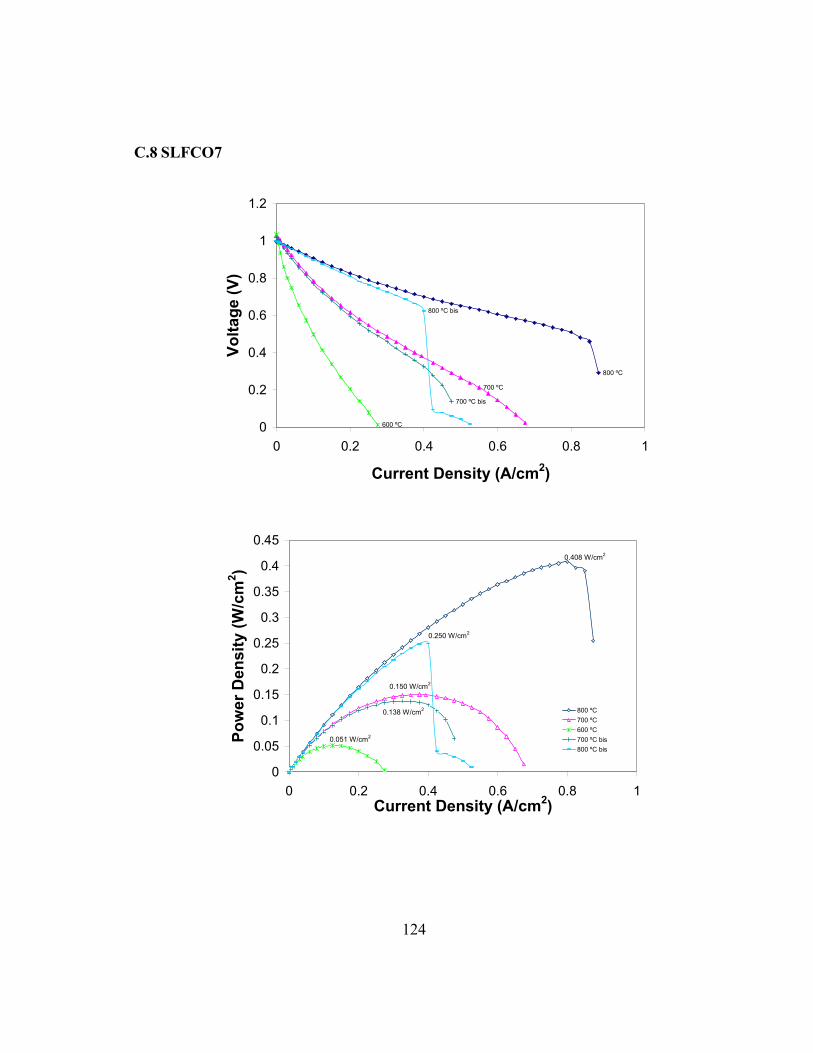
124
C.8 SLFCO7
800 ºC
700 ºC
600 ºC
700 ºC bis
800 ºC bis
0
0.2
0.4
0.6
0.8
1
1.2
0 0.2 0.4 0.6 0.8 1
Current Density (A/cm2)
Volta
ge (V
)
0.408 W/cm2
0.150 W/cm2
0.051 W/cm2
0.138 W/cm2
0.250 W/cm2
0
0.05
0.1
0.15
0.2
0.25
0.3
0.35
0.4
0.45
0 0.2 0.4 0.6 0.8 1Current Density (A/cm2)
Pow
er D
ensi
ty (W
/cm
2 )
800 ºC700 ºC600 ºC700 ºC bis800 ºC bis
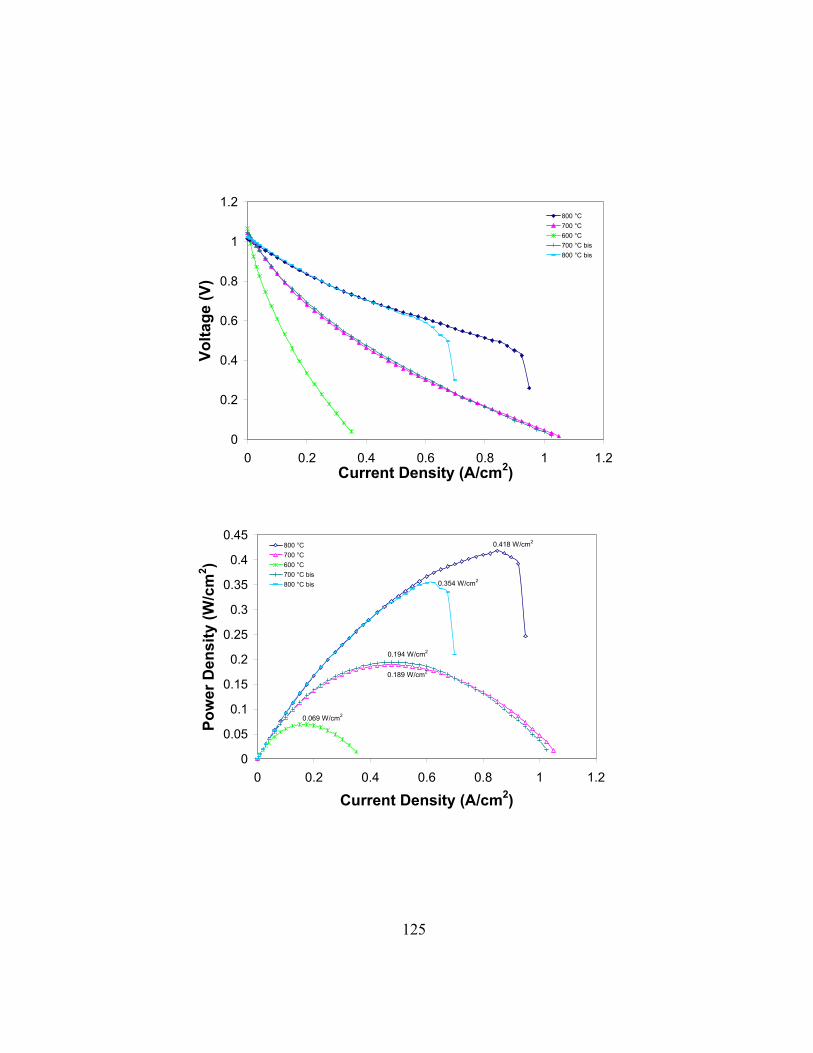
125
0
0.2
0.4
0.6
0.8
1
1.2
0 0.2 0.4 0.6 0.8 1 1.2Current Density (A/cm2)
Volta
ge (V
)800 °C700 °C600 °C700 °C bis800 °C bis
0.418 W/cm2
0.189 W/cm2
0.069 W/cm2
0.194 W/cm2
0.354 W/cm2
0
0.05
0.1
0.15
0.2
0.25
0.3
0.35
0.4
0.45
0 0.2 0.4 0.6 0.8 1 1.2
Current Density (A/cm2)
Pow
er D
ensi
ty (W
/cm
2 )
800 °C700 °C600 °C700 °C bis800 °C bis
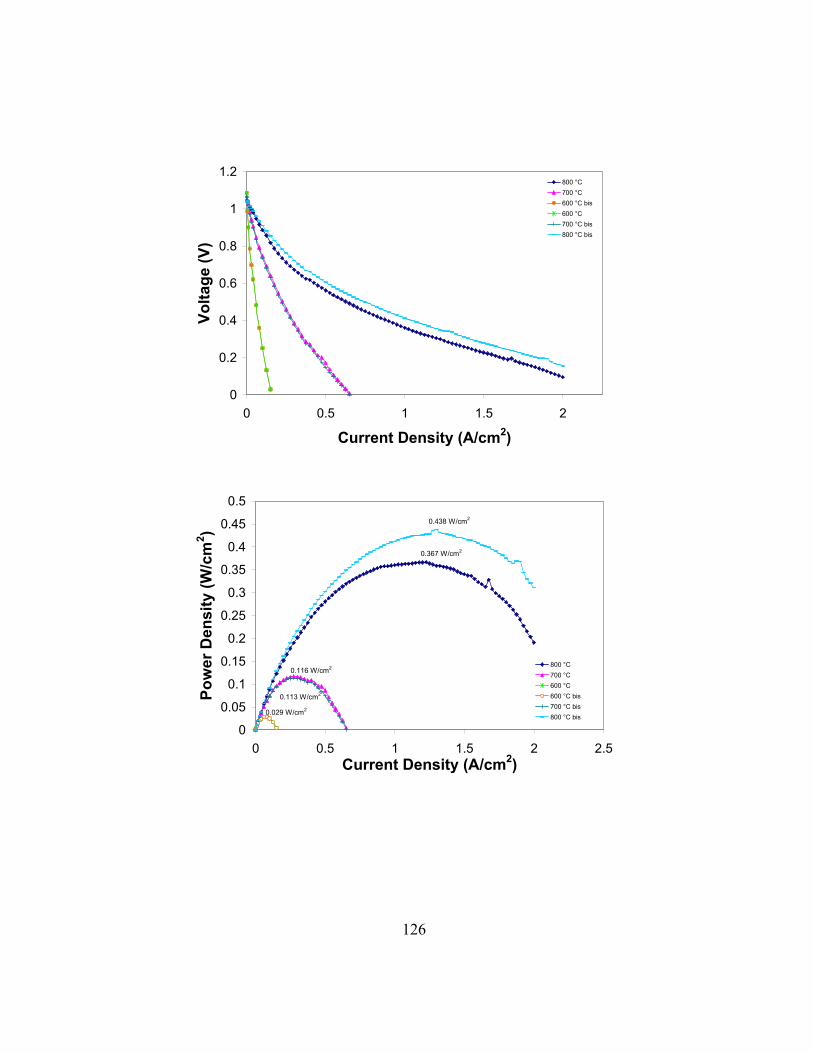
126
0
0.2
0.4
0.6
0.8
1
1.2
0 0.5 1 1.5 2
Current Density (A/cm2)
Volta
ge (V
)800 °C 700 °C600 °C bis600 °C700 °C bis800 °C bis
0.367 W/cm2
0.116 W/cm2
0.029 W/cm2
0.113 W/cm2
0.438 W/cm2
0
0.05
0.1
0.15
0.2
0.25
0.3
0.35
0.4
0.45
0.5
0 0.5 1 1.5 2 2.5Current Density (A/cm2)
Pow
er D
ensi
ty (W
/cm
2 )
800 °C 700 °C 600 °C600 °C bis700 °C bis800 °C bis
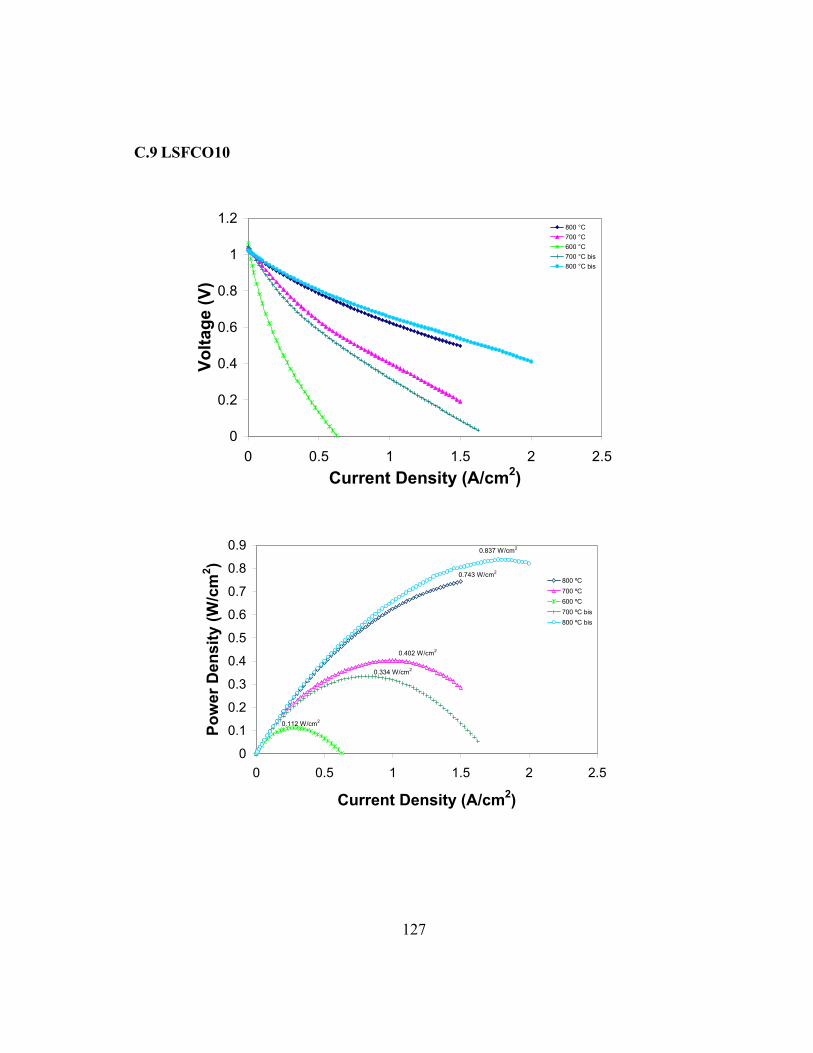
127
C.9 LSFCO10
0
0.2
0.4
0.6
0.8
1
1.2
0 0.5 1 1.5 2 2.5Current Density (A/cm2)
Volta
ge (V
)800 °C700 °C600 °C700 °C bis800 °C bis
0.743 W/cm2
0.402 W/cm2
0.112 W/cm2
0.334 W/cm2
0.837 W/cm2
0
0.1
0.2
0.3
0.4
0.5
0.6
0.7
0.8
0.9
0 0.5 1 1.5 2 2.5
Current Density (A/cm2)
Pow
er D
ensi
ty (W
/cm
2 )
800 ºC700 ºC600 ºC700 ºC bis800 ºC bis
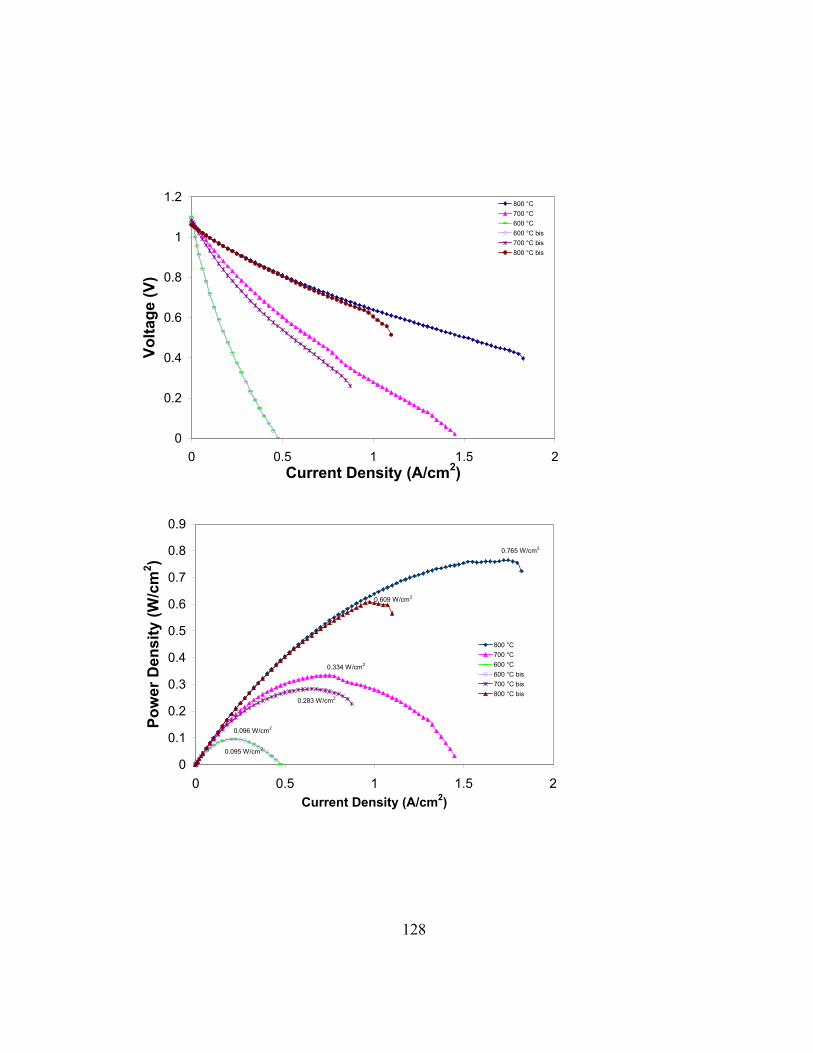
128
0
0.2
0.4
0.6
0.8
1
1.2
0 0.5 1 1.5 2Current Density (A/cm2)
Volta
ge (V
)
800 °C700 °C600 °C600 °C bis 700 °C bis800 °C bis
0.765 W/cm2
0.334 W/cm2
0.096 W/cm2
0.095 W/cm2
0.283 W/cm2
0.609 W/cm2
0
0.1
0.2
0.3
0.4
0.5
0.6
0.7
0.8
0.9
0 0.5 1 1.5 2Current Density (A/cm2)
Pow
er D
ensi
ty (W
/cm
2 )
800 °C700 °C600 °C600 °C bis700 °C bis800 °C bis
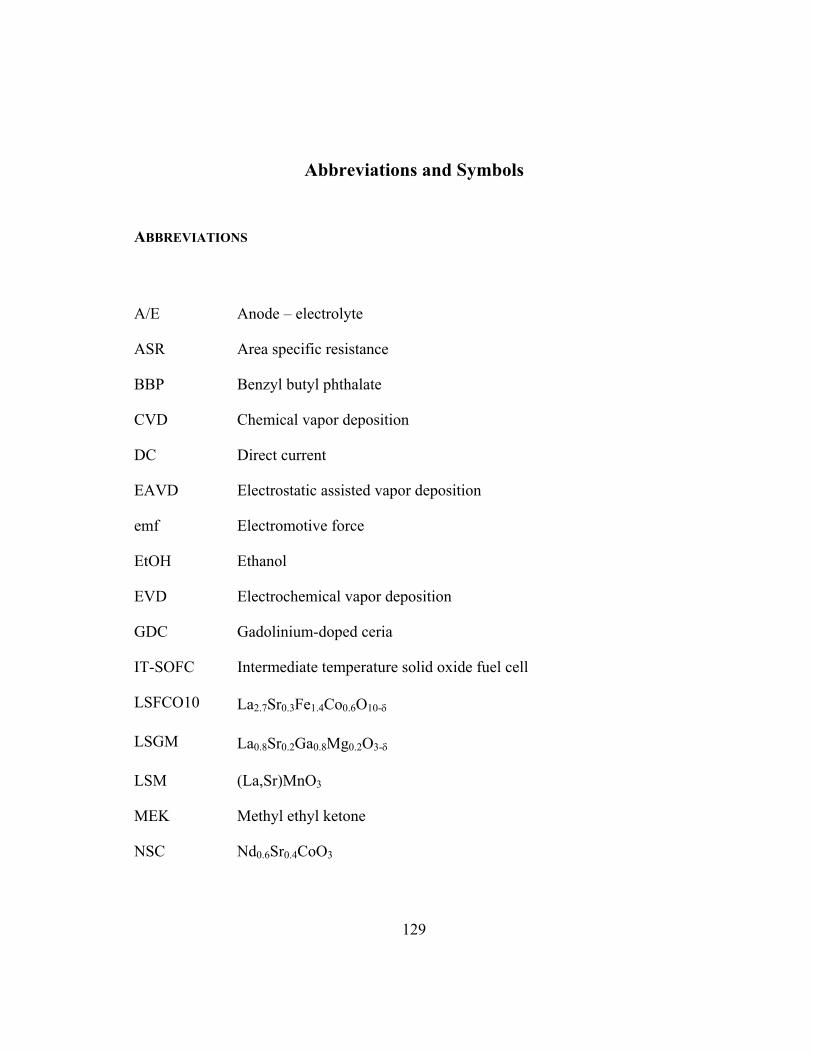
129
Abbreviations and Symbols
ABBREVIATIONS
A/E Anode – electrolyte
ASR Area specific resistance
BBP Benzyl butyl phthalate
CVD Chemical vapor deposition
DC Direct current
EAVD Electrostatic assisted vapor deposition
emf Electromotive force
EtOH Ethanol
EVD Electrochemical vapor deposition
GDC Gadolinium-doped ceria
IT-SOFC Intermediate temperature solid oxide fuel cell
LSFCO10 La2.7Sr0.3Fe1.4Co0.6O10-δ
LSGM La0.8Sr0.2Ga0.8Mg0.2O3-δ
LSM (La,Sr)MnO3
MEK Methyl ethyl ketone
NSC Nd0.6Sr0.4CoO3
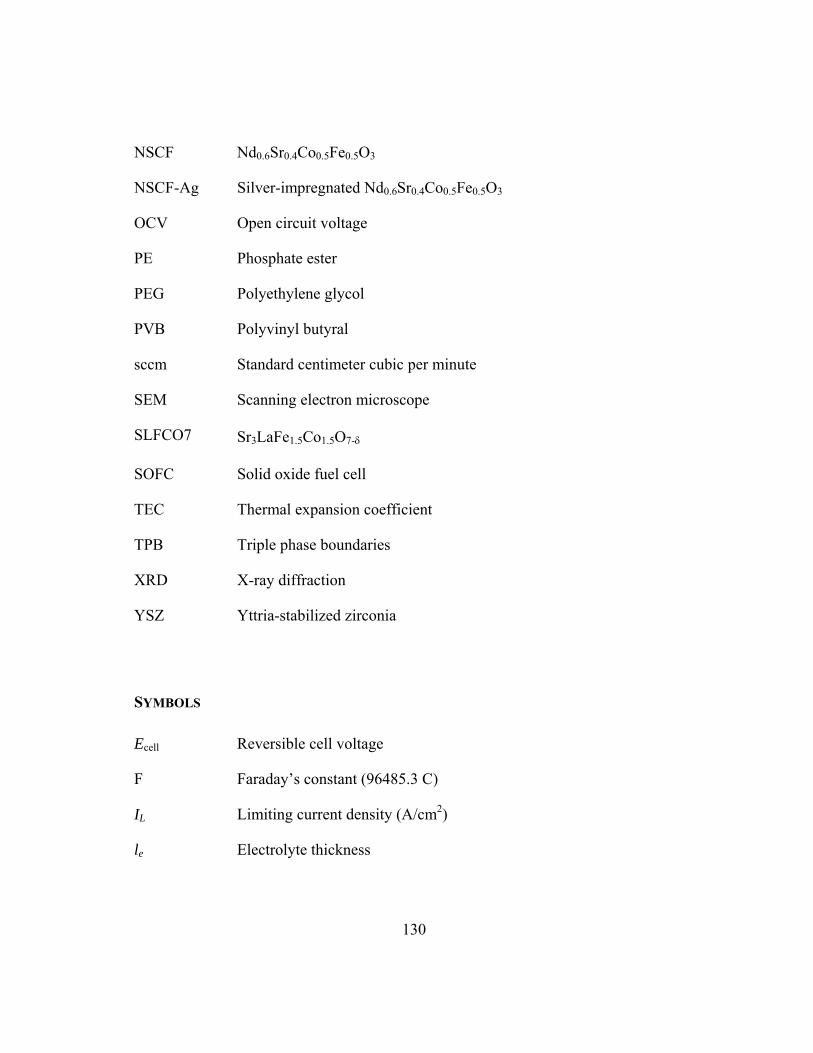
130
NSCF Nd0.6Sr0.4Co0.5Fe0.5O3
NSCF-Ag Silver-impregnated Nd0.6Sr0.4Co0.5Fe0.5O3
OCV Open circuit voltage
PE Phosphate ester
PEG Polyethylene glycol
PVB Polyvinyl butyral
sccm Standard centimeter cubic per minute
SEM Scanning electron microscope
SLFCO7 Sr3LaFe1.5Co1.5O7-δ
SOFC Solid oxide fuel cell
TEC Thermal expansion coefficient
TPB Triple phase boundaries
XRD X-ray diffraction
YSZ Yttria-stabilized zirconia
SYMBOLS
Ecell Reversible cell voltage
F Faraday’s constant (96485.3 C)
IL Limiting current density (A/cm2)
le Electrolyte thickness
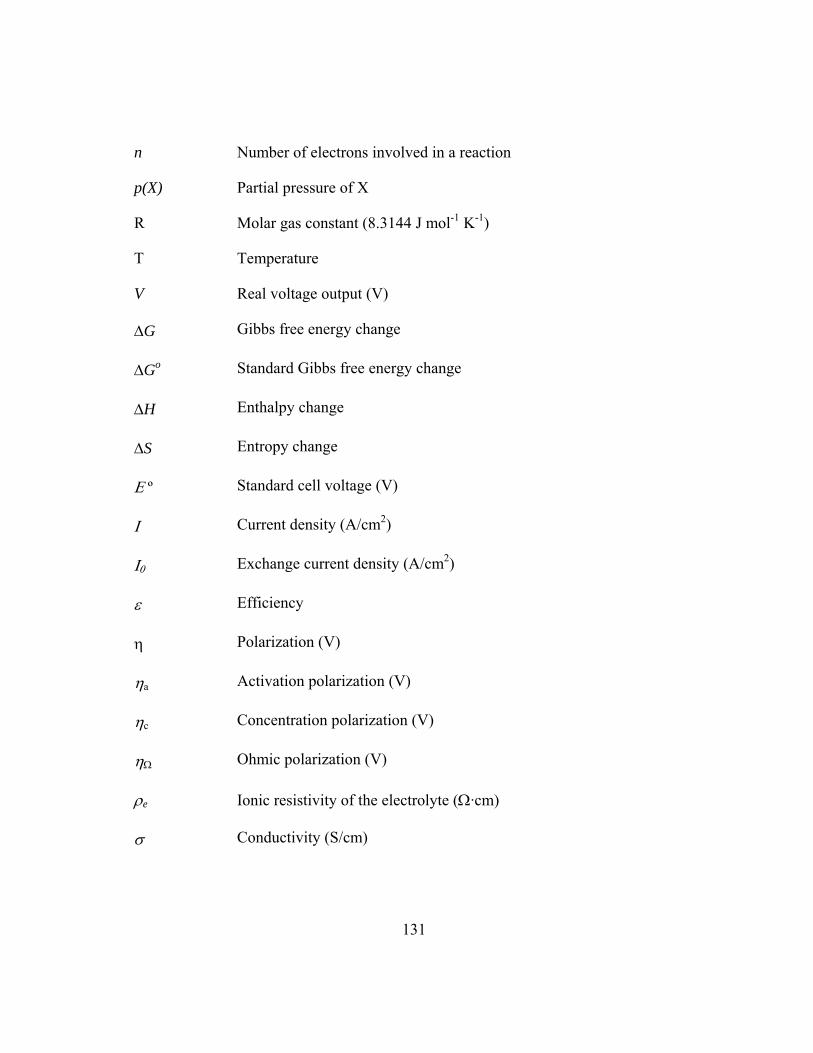
131
n Number of electrons involved in a reaction
p(X) Partial pressure of X
R Molar gas constant (8.3144 J mol-1 K-1)
T Temperature
V Real voltage output (V)
ΔG Gibbs free energy change
ΔGo Standard Gibbs free energy change
ΔH Enthalpy change
ΔS Entropy change
Ε º Standard cell voltage (V)
Ι Current density (A/cm2)
Ι0 Exchange current density (A/cm2)
ε Efficiency
η Polarization (V)
ηa Activation polarization (V)
ηc Concentration polarization (V)
ηΩ Ohmic polarization (V)
ρe Ionic resistivity of the electrolyte (Ω·cm)
σ Conductivity (S/cm)
132
References
1. Appleby, A. J. and Foulkes, F. R., Fuel Cell Handbook, Krieger Publishing
Company, Malabar, FL, (1993).
2. Minh, N. Q. and Takahashi, T., Science and Technology of Ceramic Fuel Cells, Elsevier, The Netherlands, (1995).
3. Thomas, S. and Zalbowitz, M., Fuel Cells - Green Power, Los Alamos National Laboratory, http://education.lanl.gov/resources/fuelcells/ (1999).
4. Williams, M. C. In ASM Handbook. Corrosion: Fundamentals, Testing and Protection; Cramer, S. D. and Covino, B. S., Jr., Eds.; ASM International: Materials Park, OH 44073-0002, Vol. 13-A, p. 178 (2003).
5. Hart, A. B. and Womack, G. J., Fuel Cells: Theory and Application, London, Chapman & Hall, (1967).
6. Will, J., Mitterdorfer, A., Kleinlogel, C., Perednis, D. and Gauckler, L. J., Solid State Ionics, 131, 79 (2000).
7. Mukherjee, A., Maiti, B., Das Sharma, A., Basu, R. N. and Maiti, H. S., Ceram. Int., 27, 731 (2001).
8. Singhal, S. C. and Kendall, K., High temperature solid oxide fuel cells: fundamentals, design and applications, Elsevier Advanced Technology, Oxford, (2003).
9. Grove, W. R., Philos. Mag., 14, 127 (1839).
10. Nernst, W. H., Z. Elektrochem., 6, 41 (1899).
11. Schottky, W., Wiss. Veröff. Siemens Werken, 14, 1 (1935).
12. Baur, E. and Preis, H., Z. Elektrochem., 43, 727 (1937).
13. McDougall, A., Fuel Cells, John Wiley & Sons, New York, (1976).
133
14. Pukrushpan, J. T., Stefanopoulou, A. G. and Peng, H., Control of fuel cell power systems: principles, modeling, analysis and feedback design., Springer-Verlag, London, (2004).
15. Ivers-Tiffee, E. and Virkar, A. V. In High temperature solid oxide fuel cells: fundamentals, design and applications; Singhal, S. C. and Kendall, K., Eds.; Elsevier Advanced Technology: Oxford, p. 229 (2003).
16. Liu, J. and Barnett, S. A., J. Am. Ceram. Soc., 85, 3096 (2002).
17. Singhal, S. C., Solid State Ionics, 135, 305 (2000).
18. Ishihara, T., Sammes, N. M. and Yamamoto, O. In High temperature solid oxide fuel cells: fundamentals, design and applications; Singhal, S. C. and Kendall, K., Eds.; Elsevier Advanced Technology: Oxford, p. 83 (2003).
19. Mori, M., Yamamoto, T. and Itoh, H. in Considerations on Thermal Expansion of Nickel-Zirconia Anode in SOFC during Fabrication and Operation, Stimming, U., Singhal, S. C., Tagawa, H. and Lehnert, W., editors, PV 97-40, p. 869, Solid Oxide Fuel Cells V, Aachen, Germany (1997).
20. Zhu, W. Z. and Deevi, S. C., Mater. Sci. Eng., A, 362, 228 (2003).
21. Minh, N. Q., J. Am. Ceram. Soc., 76, 563 (1993).
22. Koide, H., Someya, Y., Yoshida, T. and Maruyama, T., Solid State Ionics, 132, 253 (2000).
23. Van Roosmalen, J. A. M. and Cordfunke, E. H. P., Solid State Ionics, 52, 303 (1992).
24. Hammouche, A., Siebert, E. and Hammou, A., Mater. Res. Bull., 24, 367 (1989).
25. De Souza, R. A. and Kliner, J. A., Solid State Ionics, 106, 175 (1998).
26. Skinner, S. J., Int. J. Inorg. Mat., 3, 113 (2001).
27. Krist, K. and Wright, J. D. in Fabrication methods for reduced temperature solid oxide fuel cells, Singhal, S. C. and Iwahara, H., editors, PV 93-4, p. 782, Third International Symposium on Solid Oxide Fuel Cells, Honolulu, HI (1993).
28. Itoh, H., Mori, M., Mori, N. and Abe, T., J. Pow. Sour., 49, 315 (1994).
134
29. Mogensen, M. and Hendriksen, P. V. In High temperature solid oxide fuel cells: fundamentals, design and applications; Singhal, S. C. and Kendall, K., Eds.; Elsevier Advanced Technology: Oxford, p. 261 (2003).
30. Brown, F. T., Energy, 11, 209 (1986).
31. Barnett, S. A., Energy, 15, 1 (1990).
32. Tietz, F., Buchkremer, H. P. and Stöver, D., Solid State Ionics, 152-153, 373 (2002).
33. Van Dieten, V. E. J. and Schoonman, J., Solid State Ionics, 57, 141 (1992).
34. Bai, W., Choy, K. L., Rudkin, R. A. and Steele, B. C. H., Solid State Ionics, 113-115, 259 (1998).
35. Ishihara, T., Shimose, K., Kudo, T., Nishiguchi, H., Akbay, T. and Takita, Y., J. Am. Ceram. Soc., 83, 1921 (2000).
36. Zhitomirsky, I. and Petric, A., Mater. Sci. Eng., B, 78, 125 (2000).
37. De Souza, S., Visco, S. J. and De Jonghe, L. C., J. Electrochem. Soc., 144, L35 (1997).
38. Chen, X. J., Khor, K. A., Chan, S. H. and Yu, L. G., Mater. Sci. Eng., A, 341, 43 (2003).
39. Chen, C. C., Nasrallah, M. M. and Anderson, H. U., Solid State Ionics, 70/71, 101 (1994).
40. Wang, C., Worrell, W. L., Park, S., Vohs, J. M. and Gorte, R. J., J. Electrochem. Soc., 148, A864 (2001).
41. Minh, N. Q. and Montgomery, K. in Performance of Reduced-Temperature SOFC stacks, Stimming, U., Singhal, S. C., H., T. and Lehnert, W., editors, PV 97-40, p. 153, Fifth International Symposium on Solid Oxide Fuel Cells (SOFC-V), Aachen, Germany (1997).
42. Srivastava, P. K., Quach, T., Duan, Y. Y., Donelson, R., Jiang, S. P., Ciacchi, F. T. and Badwal, S. P. S., Solid State Ionics, 99, 311 (1997).
43. Otoshi, S., Sasaki, Y., Ohnishi, H., Hase, M., Ishimaru, K., Ippommatsu, M., Higuchi, T., Miyayama, M. and Yanagida, H., J. Electrochem. Soc., 138, 1519 (1991).
135
44. Simner, S. P., Stevenson, J. W., Meinhardt, K. D. and Canfield, N. L. in Development of Fabrication Techniques and Electrodes for Solid Oxide Fuel Cells, Singhal, S. C. and Yokokawa, H., editors, PV 2001-16, p. 1051, Seventh International Symposium on Solid Oxide Fuel Cells (SOFC-VII), Tsukuba, Ibaraki, Japan (2001).
45. Lee, K. T. and Manthiram, A. in Investigation of Nd0.6Sr0.4Co1-yMyO3-δ (M = Fe and Mn) as cathode materials for intermediate temperature solid oxide fuel cells, editors, 179, p. 131, Baltimore, MD, United States (2006).
46. Lee, K. T. and Manthiram, A., Solid State Ionics, 176, 1521 (2005).
47. Lee, K. T., Bierschenk, D. M. and Manthiram, A., J. Electrochem. Soc., 153, A1255 (2006).
48. Ohrui, H., Matsushima, T. and Hirai, T., J. Pow. Sour., 71, 185 (1998).
49. Lee, K. T. and Manthiram, A. in Investigation of Nd1-xSrxCoO3 as cathodes for intermediate temperature solid oxide fuel cells, editors, p. 5, San Antonio, TX, United States (2004).
50. Zhitomirsky, I. and Petric, A., J. Eur. Ceram. Soc., 20, 2055 (2000).
51. Mistler, R. E. and Twiname, E. R., Tape Casting: theory and practice, The American Ceramic Society, Westerville, OH 43081, (2000).
52. Cassidy, M., Lindsay, G. and Kendall, K., J. Pow. Sour., 61, 189 (1996).
53. Dees, D. W., Claar, T. D., Easler, T. E., Fee, D. C. and Mrazek, F. C., J. Electrochem. Soc., 134, 2141 (1987).
54. Chick, L. A., Pederson, L. R., Maupin, G. D., Bates, J. L., Thomas, L. E. and Exarhos, G. J., Mater. Lett., 10, 6 (1990).
55. Yokokawa, H. and Horita, T. In High Temperature Solid Oxide Fuel Cells: Fundamentals, Design and Applications; Singhal, S. C. and Kendall, K., Eds.; Elsevier Advanced Technology: Oxford, UK, (2003).
56. Adler, S. B., Solid State Ionics, 111, 125 (1998).
57. Badwal, S. P. S., Jiang, S. P., Love, J., Nowotny, J., Rekas, M. and Vance, E. R., Ceram. Int., 27, 419 (2001).
58. Petric, A., Huang, P. and Tietz, F., Solid State Ionics, 135, 719 (2000).
136
59. Sakaki, Y., Takeda, Y., Kato, A., Imanishi, N., Yamamoto, O., Hattori, M., Iio, M. and Esaki, Y., Solid State Ionics, 118, 187 (1999).
60. Tu, H. Y., Takeda, Y., Imanishi, N. and Yamamoto, O., Solid State Ionics, 117, 277 (1999).
61. Lee, K. T. and Manthiram, A., J. Electrochem. Soc., 153, A794 (2006).
62. Lee, K. T. and Manthiram, A., J. Electrochem. Soc., 152, A197 (2005).
63. Lee, K. T. and Manthiram, A., J. Pow. Sour., 160, 903 (2006).
64. Steele, B. C. H., Solid State Ionics, 129, 95 (2000).
65. Mogensen, M., Sammes, N. M. and Tompsett, G. A., Solid State Ionics, 129, 63 (2000).
66. Mai, A., Haanappel, V. A. C., Uhlenbruck, S., Tietz, F. and Stover, D., Solid State Ionics, 176, 1341 (2005).
67. Prado, F., Armstrong, T., Caneiro, A. and Manthiram, A., J. Electrochem. Soc., 148, J7 (2001).
68. Armstrong, T., Prado, F. and Manthiram, A., Solid State Ionics, 140, 89 (2001).
69. Lee, K. T. and Manthiram, A., Chem. Mater., 18, 1621 (2006).
70. Ruddelsen, S. N. and Popper, P., Acta Crystallogr., 11, 54 (1958).
71. Hellebrand, H. In Materials science and technology : a comprehensive treatment Cahn, R. W., Haasen, P. and Kramer, E. J., Eds.; VCH: New York, Vol. 17A, p. 195 (1991).
137
Vita
Claudia Isela Torres Garibay was born on April 26th, 1972 in Chihuahua,
Chihuahua, Mexico to Armando Torres Magallanes and Elia Garibay Sosa. She got a
B.S. in Electrical and Industrial Engineering from the Instituto Tecnológico de
Chihuahua in 1996 and a M.S. in Materials Science from the Centro de Investigacion
en Materiales Avanzados (Advanced Materials Research Center) in 2000; both
institutions located in her hometown. Between her undergraduate studies and master
studies, she worked in industry in different engineering departments for three and half
years. After the completion of her master degree, she lectured Vectorial Calculus and
Physics Fundamentals at the Institute Tecnológico de Chihuahua for one year. She
joined the University of Texas at Austin in Fall 2001. During her doctoral studies she
worked as teaching assistant of Materials Engineering Laboratory and research
assistant for the Institute of Advanced Technology.
Permanent address: Santo Domingo # 2920 Parques de San Felipe Chihuahua, Chih. 31203 Mexico
This dissertation was typed by the author.