Embed Size (px)
Citation preview
2016 Corporate Board GovernanCe and direCtor Compensation report
Corporate Board Governance and Director Compensation in Canada
A Review of 2016
In Partnership with Patrick O’Callaghan and Associates
®

$110.00 per copy © Korn Ferry, January 2017
All rights reserved. No part of the contents of this report
may be reproduced or transmitted in any form or by any
means without the written permission of the Publisher.
This report is also available in French.KORN FERRY Canada
2016 Corporate Board GovernanCe and direCtor Compensation report 1
Table of contents
The Surveyed Companies 2
Emerging Governance Issues Report 2016: Are Risk Management and Strategy Enough? Making Succession and Talent Management True Board Priorities. 6
Board Independence 26
Board Composition 34
Board Size 46
Board Assessments, Director Selection and Director Development 50
Meetings and Attendance 56
Board Committees 60
Director Compensation 66
Board Chair Compensation 74
Lead Director Compensation 80
Committee Chair Compensation 82
Committee Member Compensation 88
Stock-Based Compensation 94
Compensation Summary 98
Director Share Ownership 100
Company Data 105
End Notes 116
Korn Ferry 119
Patrick O’Callaghan and Associates 121
KORN FERRY Canada2
KORN FERRY Canada
TheSurveyedCompanies
2
32016 CORPORATE BOARD GOvERNANCE AND DIRECTOR COMPENSATION REPORT
The Most Comprehensive Canadian Governance Study
We are pleased to present the most comprehensive review of public issuer governance data available in Canada. This twenty-fourth annual report examines governance in Canadian companies and includes our Emerging Issues Report: Are Risk Management and Strategy Enough? Making Succession and Talent Management True Board Priorities. Our commitment is to provide directors and trustees with accurate and relevant Canadian data across a wide spectrum.
The data is collected from publicly traded companies that were on one or more of the following lists:
− The Financial Post Top 185 (June 2016)
− The Report on Business Top 185 (July 2016)
− The S&P/TSX Composite Index (at any time during 2015)
• Wesourcedatafromcorporatefilingsincludingannualreports,managementproxycircularsandannualinformationformsforfiscalyear-endsinlate2015,orthefirstfewmonthsof2016.Allreferencesto“2015”dataincludesdataforfiscalyear-endsinearly2016.
• AllfiguresreportedinUnitedStatesdollarshavebeenconvertedto Canadiandollarsatanexchangerateof1.28,whichwastheaverage exchangeratefor2015.
• Allfractionshavebeenroundedofftothenearestwholenumber,thusalltotalsdonotadduptoexactly100%.
• WherethisreportusescomparativeU.S.data,itisdrawnfromthe2015-2016DirectorCompensationReportpublishedbytheNationalAssociationofCorporateDirectors(datafromthe2015DirectorCompensationSurvey byPearlMeyers).Thestudyisbasedon1,400companiesacross24 industriesthatfiledaproxystatementorotherfinancialstatementwithdirectorcompensationinformationforthefiscalyearendingbetween February1,2014andJanuary31,2015.
4 KORN FERRY Canada
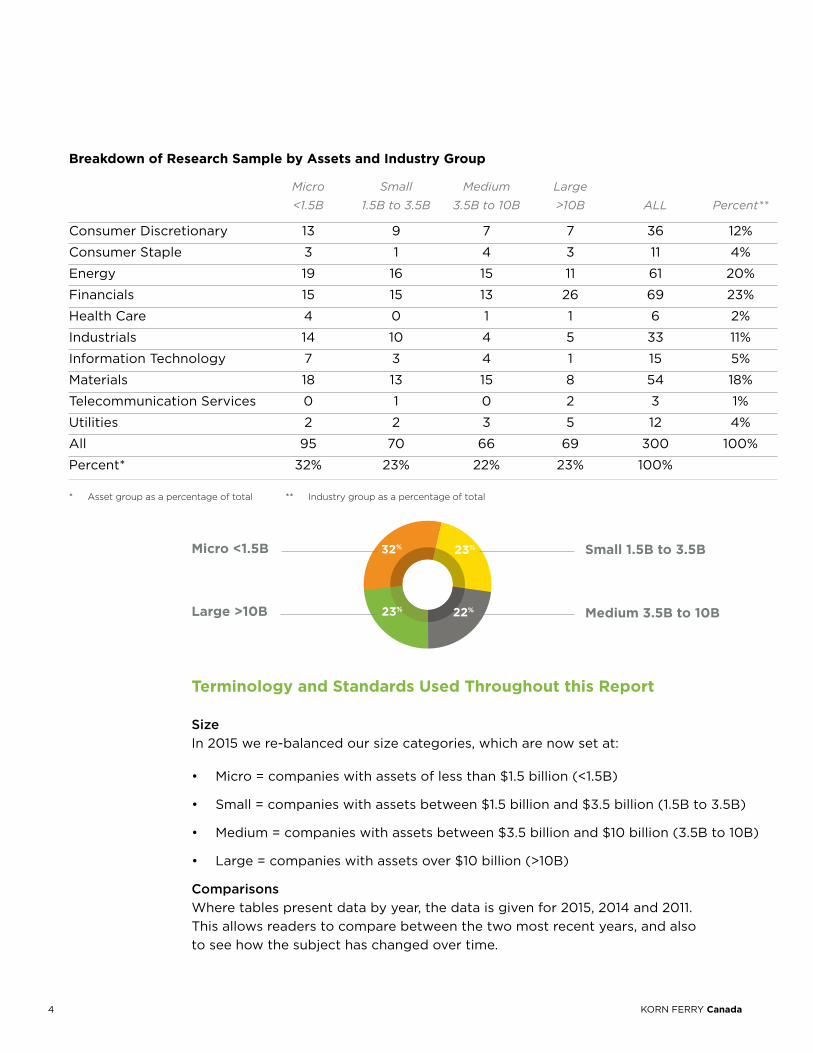
Breakdown of Research Sample by Assets and Industry Group
Micro Small Medium Large
<1.5B 1.5B to 3.5B 3.5B to 10B >10B ALL Percent**
Consumer Discretionary 13 9 7 7 36 12%
Consumer Staple 3 1 4 3 11 4%
Energy 19 16 15 11 61 20%
Financials 15 15 13 26 69 23%
Health Care 4 0 1 1 6 2%
Industrials 14 10 4 5 33 11%
Information Technology 7 3 4 1 15 5%
Materials 18 13 15 8 54 18%
Telecommunication Services 0 1 0 2 3 1%
Utilities 2 2 3 5 12 4%
All 95 70 66 69 300 100%
Percent* 32% 23% 22% 23% 100%
* Assetgroupasapercentageoftotal** Industrygroupasapercentageoftotal
Small 1.5B to 3.5B
Medium 3.5B to 10B
Micro <1.5B
Large >10B 23%
32% 23%
22%
Terminology and Standards Used Throughout this Report
SizeIn 2015 we re-balanced our size categories, which are now set at:
• Micro=companieswithassetsoflessthan$1.5billion(<1.5B)
• Small=companieswithassetsbetween$1.5billionand$3.5billion(1.5Bto3.5B)
• Medium=companieswithassetsbetween$3.5billionand$10billion(3.5Bto10B)
• Large=companieswithassetsover$10billion(>10B)
ComparisonsWhere tables present data by year, the data is given for 2015, 2014 and 2011. This allows readers to compare between the two most recent years, and also to see how the subject has changed over time.
52016 Corporate Board GovernanCe and direCtor Compensation report
Regulatory Documents• Whereweuse“CSAdisclosurerequirements”,wearereferringtotheCanadian
Securities Administrators’ National Instrument 58-101, Disclosure of Corporate Governance Practices.
* Whereweuse“CSAgovernanceguidelines”,wearereferringtotheCanadianSecurities Administrators’ National Policy 58-201, Corporate Governance Guidelines.
Independent DirectorsWherewerefertodirectorsas“independent”,wearebasingthecategorizationonthecompany’s assignment of the term to individual directors under the definition in the CSA disclosurerequirements.
Directors and TrusteesWith the inclusion of income trusts, we are now including organizations with both directors and trustees. For the sake of brevity in this document, where we refer to “director”,wearereferringtobothdirectorsandtrustees.
Types of OrganizationsWhereweuse“company”wearereferringtoanymemberoftheresearchsampleasawhole,whichcouldbeeitheranequityoranincometrust.
Income Trust NamesIn some cases, income trusts presented governance data for a board other than its own boardoftrustees(e.g.,fortheboardofan“Administrator”or“Manager”).Thenamecitedis always the name we have drawn from one of the three sources we used to compile the research sample.
RetainersWhenevertheterm“retainer”isusedalone,itreferstowhatevercombinationofcashand shares is paid to directors by the company as a retainer for services, unless we refer specificallytothe“cashportionofaretainer”orthe“shareportionofaretainer”.
Compensation based on Shares, Trust Units and EquivalentsWhere we discuss compensation in the form of shares, trust units, deferred share units, etc.,weuse“shares”unlessreferringtoonespecifictypeofcompensationinthisgroup.This does not include compensation in the form of stock or trust options.
Emerging Governance Issues Report: Are Risk Management and Strategy Enough? Making Succession and Talent Management True Board Priorities
Korn/Ferry and Patrick O’Callaghan and Associates surveyed 185 Board Chairs, directors and CEOs to produce this year’s Emerging Governance Issues Report, which can be found on pages 6 to 25. Respondents were either personally interviewed or completed an on-line survey.
ARE RISK MANAGEMENT AND STRATEGY ENOUGH?
Emerging Governance Issues Report. Are Risk Management and Strategy Enough? Making Succession and Talent Management True Board Priorities.
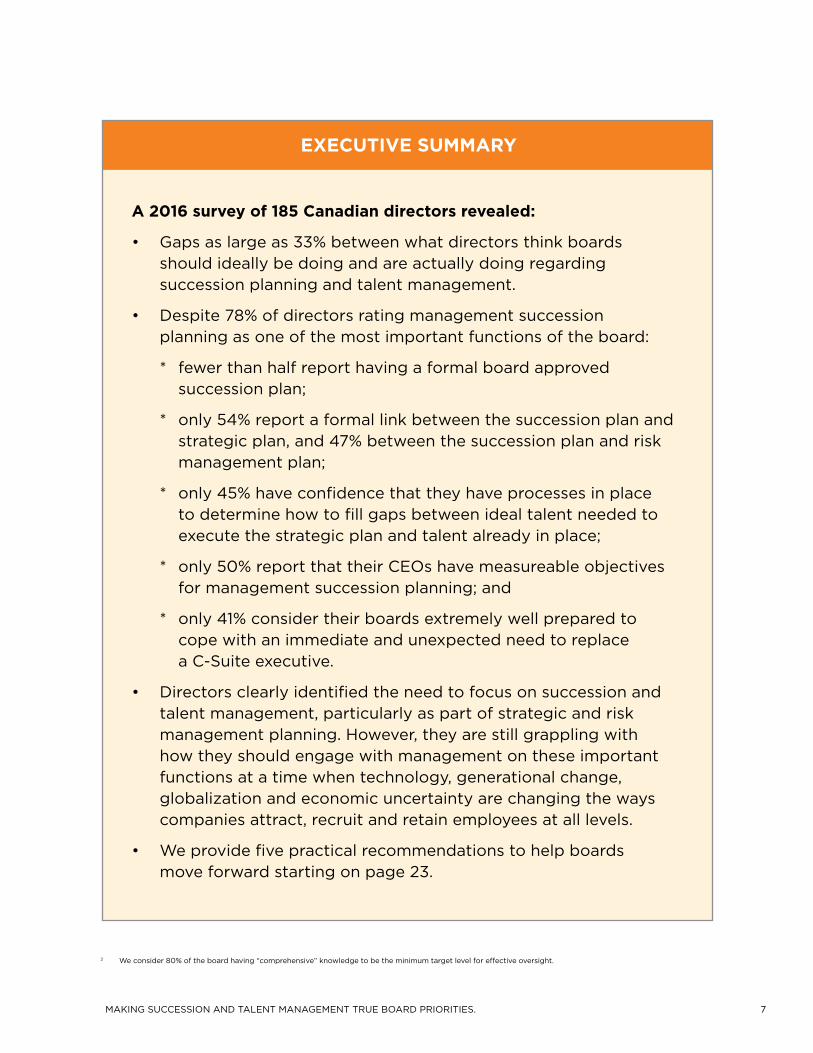
A 2016 survey of 185 Canadian directors revealed:
• Gapsaslargeas33%betweenwhatdirectorsthinkboardsshould ideally be doing and are actually doing regarding succession planning and talent management.
• Despite78%ofdirectorsratingmanagementsuccessionplanning as one of the most important functions of the board:
* fewer than half report having a formal board approved succession plan;
* only 54% report a formal link between the succession plan and strategic plan, and 47% between the succession plan and risk management plan;
* only 45% have confidence that they have processes in place to determine how to fill gaps between ideal talent needed to execute the strategic plan and talent already in place;
* only 50% report that their CEOs have measureable objectives for management succession planning; and
* only 41% consider their boards extremely well prepared to cope with an immediate and unexpected need to replace a C-Suite executive.
• Directorsclearlyidentifiedtheneedtofocusonsuccessionandtalent management, particularly as part of strategic and risk management planning. However, they are still grappling with how they should engage with management on these important functions at a time when technology, generational change, globalization and economic uncertainty are changing the ways companies attract, recruit and retain employees at all levels.
• Weprovidefivepracticalrecommendationstohelpboards move forward starting on page 23.
ExECUTIvE SUMMARy
7
2 Weconsider80%oftheboardhaving“comprehensive”knowledgetobetheminimumtargetlevelforeffectiveoversight.
MAKING SUCCESSION AND TALENT MANAGEMENT TRUE BOARD PRIORITIES.
8
Why dId WE SURvEy dIRECToRS on ThIS ToPIC?
Every year Korn Ferry and Patrick O’Callaghan and Associates interview Canadian directors about an emerging governance issue. In 2016 we focused on board engagement in succession and talent management because:
• Inrecentyearsthedemarcationbetweenmanagementandboardresponsibilities has become less defined as more boards work in partnership with the CEO and the executive team rather than in a pure oversight role.
• Directorsaremoredeeplyengagedwithmanagementinthedevelopmentofstrategy,itseffectiveimplementation,thefinancialconsequences.Directorshave an understanding and are engaged in the oversight of risk and risk management processes. However, human capital 1 management issues are not a high priority at the boardroom table other than the traditional board role of selecting the CEO and approving compensation for the C-suite 2.
• Overthepastdecade,changinggenerationalexpectations,thespeedandnature of technological change, the impact of the new digital environment, globalization, and economic uncertainty have had a significant impact on how organizations attract, recruit and retain employees at all levels. Employees have always been a critical factor in an organization’s success. Over the past decade ofrapidchange,attentiontohumancapitalhasrequiredmoreboardfocusasnewriskfactorshaveaffectedtheabilitytodeliveronstrategicplans.
• Increasingly,wearebeingaskedtoassistboardswithintegratingriskandstrategic planning with succession and talent management. We wanted to know how pervasive and widespread this practice is on Canadian boards.
• Inthespringof2016,weinterviewedandsurveyed185Canadiandirectors(breakdownonoppositepage)abouttheappropriatelevelofboardengagement in succession planning 3 and talent management 4. The results revealed that succession and talent management are critical and need to be on the board’s radar, but directors are clearly struggling with how they should integrate them given the continuing pace and extent of change.
• Asalways,weextendoursinceregratitudetothosedirectorsthattookthetime to share with us their experience and views regarding the board’s role in succession planning and talent management.
1. Humancapitalisareferencetotalentasavaluableandintegralassetofanorganization.
2. Theseniorgroupofexecutivesintheorganization.
3. ManagementSuccession:Aprocesstounderstandtheneedsofanorganizationintermsofkeybusinessleadershippositions, andthendeveloptheinternalsupplyofleaders/employeeswiththepotentialtomeetthoseneeds.Successionmanagement increasesthesupplyofreadyinternalcandidatesforthosekeybusinessleadershippositions.
4. TalentManagement:Asetofintegratedbusinessandpeopleprocessesthatattract,develop,retainandengagethepeoplethe organizationneedstodeliveronitsstrategyandbusinessobjectives.Truetalentmanagementisdifferentiatedfrombasic HRpracticebyitsintegratednature,itsformalizedalignmenttodefinedbusinessneedsnowandinthefutureanditstreatment asanessentialbusinessprocess.
ARE RISK MANAGEMENT AND STRATEGY ENOUGH?

9
Who WAS InTERvIEWEd?
MAKING SUCCESSION AND TALENT MANAGEMENT TRUE BOARD PRIORITIES.
10
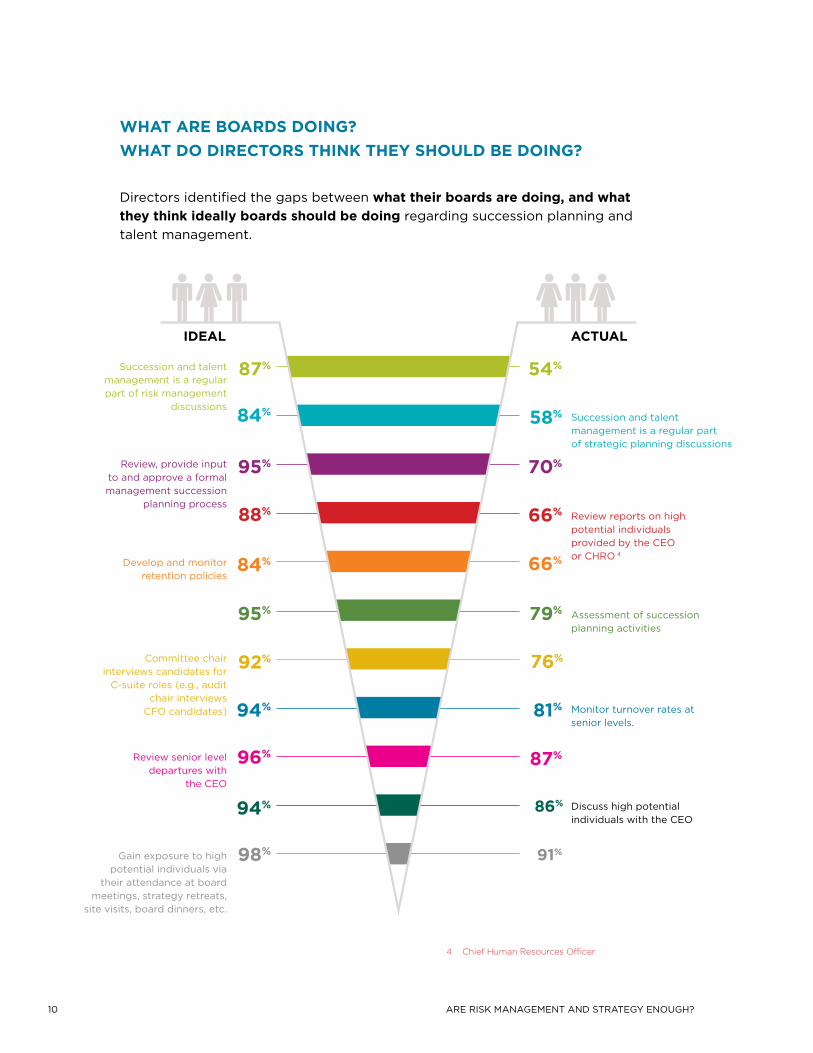
WhAT ARE BoARdS doInG? WhAT do dIRECToRS ThInk ThEy ShoULd BE doInG?
Directors identified the gaps between what their boards are doing, and what they think ideally boards should be doing regarding succession planning and talent management.
Succession and talent management is a regular part of risk management
discussions
IdEAL ACTUAL
Succession and talent management is a regular part of strategic planning discussions
Review reports on high potential individuals provided by the CEO or CHRO 4
Assessment of succession planning activities
Monitor turnover rates at senior levels.
Discuss high potential individuals with the CEO
Review, provide input to and approve a formal management succession
planning process
Committee chair interviews candidates for C-suiteroles(e.g.,audit
chair interviews CFOcandidates)
Gain exposure to high potential individuals via
their attendance at board meetings, strategy retreats,
site visits, board dinners, etc.
Develop and monitor retention policies
Review senior level departures with
the CEO
87% 54%
84% 58%
95% 70%
88% 66%
84% 66%
95% 79%
92% 76%
94% 81%
96% 87%
94% 86%
98% 91%
4ChiefHumanResourcesOfficer
ARE RISK MANAGEMENT AND STRATEGY ENOUGH?
11
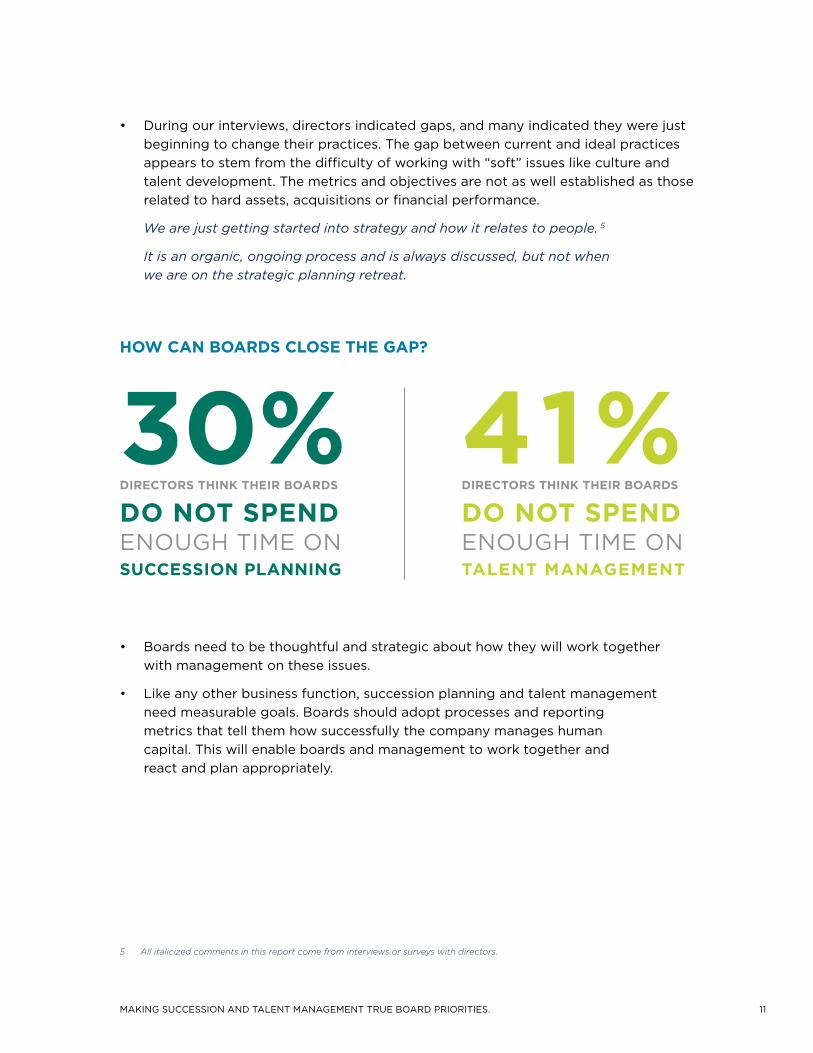
hoW CAn BoARdS CLoSE ThE GAP?
• Duringourinterviews,directorsindicatedgaps,andmanyindicatedtheywerejustbeginning to change their practices. The gap between current and ideal practices appearstostemfromthedifficultyofworkingwith“soft”issueslikecultureandtalent development. The metrics and objectives are not as well established as those relatedtohardassets,acquisitionsorfinancialperformance.
We are just getting started into strategy and how it relates to people. 5
It is an organic, ongoing process and is always discussed, but not when we are on the strategic planning retreat.
• Boardsneedtobethoughtfulandstrategicabouthowtheywillworktogetherwith management on these issues.
• Likeanyotherbusinessfunction,successionplanningandtalentmanagementneed measurable goals. Boards should adopt processes and reporting metrics that tell them how successfully the company manages human capital. This will enable boards and management to work together and react and plan appropriately.
5 All italicized comments in this report come from interviews or surveys with directors.
dIRECToRS ThInk ThEIR BoARdS
do noT SPEnd
SUCCESSIon PLAnnInGENOUGH TIME ON
30%dIRECToRS ThInk ThEIR BoARdS
do noT SPEnd
TALEnT MAnAGEMEnTENOUGH TIME ON
41%
MAKING SUCCESSION AND TALENT MANAGEMENT TRUE BOARD PRIORITIES.
12
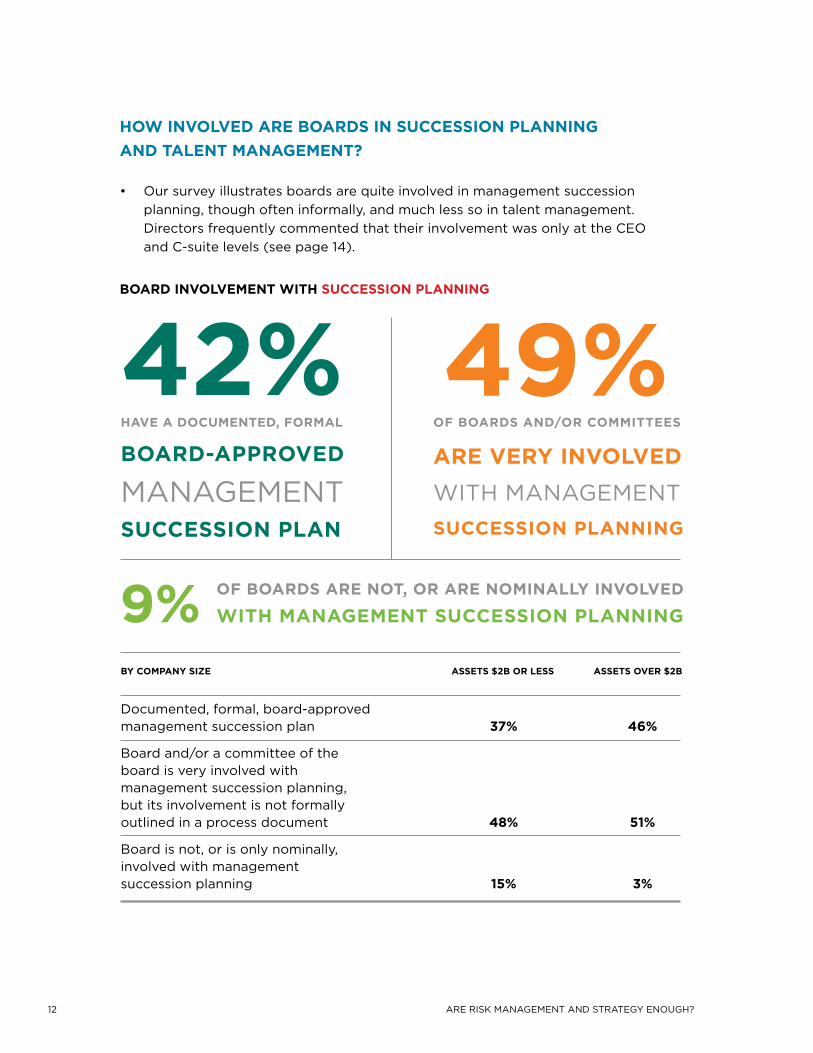
Documented, formal, board-approved management succession plan 37% 46%
Board and/or a committee of the board is very involved with management succession planning, but its involvement is not formally outlined in a process document 48% 51%
Board is not, or is only nominally, involved with management succession planning 15% 3%
ASSETS $2B oR LESSBy CoMPAny SIzE ASSETS ovER $2B
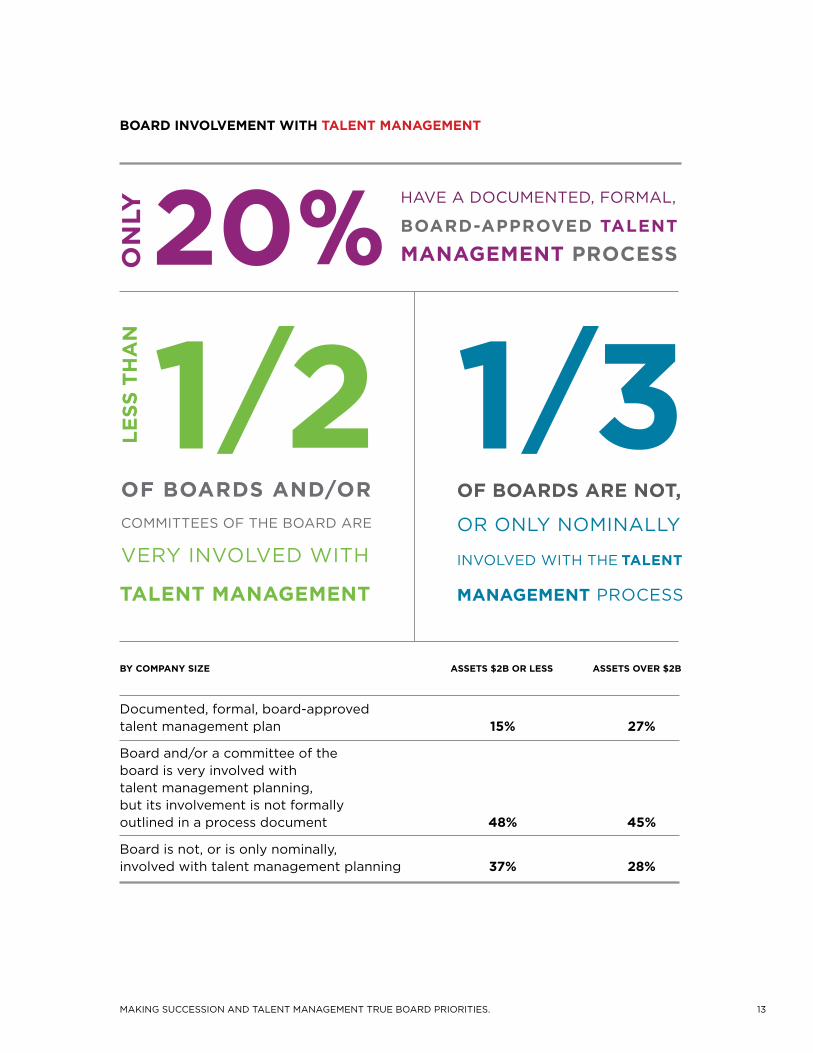
hoW InvoLvEd ARE BoARdS In SUCCESSIon PLAnnInG And TALEnT MAnAGEMEnT?
BoARd InvoLvEMEnT WITh SUCCESSIon PLAnnInG
• Oursurveyillustratesboardsarequiteinvolvedinmanagementsuccessionplanning, though often informally, and much less so in talent management. DirectorsfrequentlycommentedthattheirinvolvementwasonlyattheCEO andC-suitelevels(seepage14).
hAvE A doCUMEnTEd, FoRMAL
oF BoARdS ARE noT, oR ARE noMInALLy InvoLvEd
WITh MAnAGEMEnT SUCCESSIon PLAnnInG
BoARd-APPRovEd
SUCCESSIon PLAnMANAGEMENT
42%
9%
oF BoARdS And/oR CoMMITTEES
ARE vERy InvoLvEd
SUCCESSIon PLAnnInG
WITH MANAGEMENT
49%
ARE RISK MANAGEMENT AND STRATEGY ENOUGH?
13
Documented, formal, board-approved talent management plan 15% 27%
Board and/or a committee of the board is very involved with talent management planning, but its involvement is not formally outlined in a process document 48% 45%
Board is not, or is only nominally, involved with talent management planning 37% 28%
ASSETS $2B oR LESSBy CoMPAny SIzE ASSETS ovER $2B
BoARd InvoLvEMEnT WITh TALEnT MAnAGEMEnT
TALEnT MAnAGEMEnT
MAKING SUCCESSION AND TALENT MANAGEMENT TRUE BOARD PRIORITIES.
14
6 Criticaltalentincludespeoplethatmaynotbemanagementlevelbutarecrucialtothesuccessoftheorganization. Theyholdknowledgeorskillsthatarehighlysoughtafterintheindustryandaredifficulttoattractandretain.
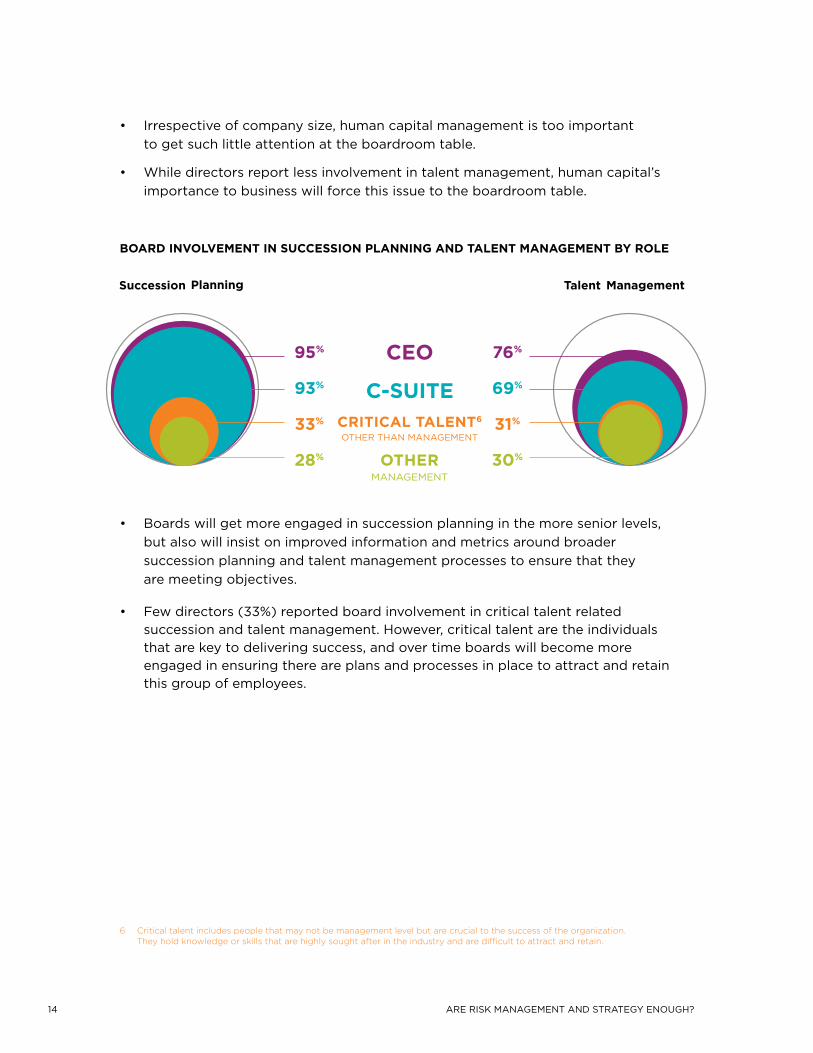
• Irrespectiveofcompanysize,humancapitalmanagementistooimportant to get such little attention at the boardroom table.
• Whiledirectorsreportlessinvolvementintalentmanagement,humancapital’simportance to business will force this issue to the boardroom table.
• Boardswillgetmoreengagedinsuccessionplanninginthemoreseniorlevels, but also will insist on improved information and metrics around broader succession planning and talent management processes to ensure that they are meeting objectives.
• Fewdirectors(33%)reportedboardinvolvementincriticaltalentrelatedsuccession and talent management. However, critical talent are the individuals that are key to delivering success, and over time boards will become more engaged in ensuring there are plans and processes in place to attract and retain this group of employees.
BoARd InvoLvEMEnT In SUCCESSIon PLAnnInG And TALEnT MAnAGEMEnT By RoLE
ARE RISK MANAGEMENT AND STRATEGY ENOUGH?
15
• Thecostoftalentissignificant.CongerandLawlercommentthat,“Itisatimehonored adage that CEOs often repeat: ‘People are our greatest asset’, but is it more than talk? Probably not. Research confirms the adage, showing a linkage between superior human capital management practices and superior organizational performance. In addition, talent is a major cost in many organizations, particularly those that are labour or intellect intensive, whereitcanaccountfor70%or80%ofanorganization’scosts.” 7
Is there any other operational cost so significant to the balance sheet that is so casually addressed by the board?
Management succession has become a key initiative for the Board only in the past year. Nothing formally existed before this. It is probably one of the most important functions we do as a board. Talent is now discussed at almost every board meeting.
The Board needs to ask more questions about the talent pipeline. It needs to hold the CEO more accountable for the health of the talent pipeline. You can’t have an effective management succession plan without a talent management process; they go hand in hand. Talent management is reported to the Board, but not with the same level of detail as succession planning.
We don’t really have a formal CEO succession plan. The CEO has been there close to 20 years and we all just pray he doesn’t want to leave. We ask him annually about his plan and if we anticipated a change, we’d have to do something. We do have an emergency or short-term succession plan.
The Board has asked about talent management, but hasn’t forced the dialogue. It is concerning if boards or committees get too involved in the details of management succession and talent management. We have a plan, but the board is not heavily involved.
7 IsyourboardMIAonHR?Conger,J.A.andLawlerIII,E.E.ExcerptedfromThe handbook of corporate governance. EditedbyRichardLeblanc.2016
MAKING SUCCESSION AND TALENT MANAGEMENT TRUE BOARD PRIORITIES.
16
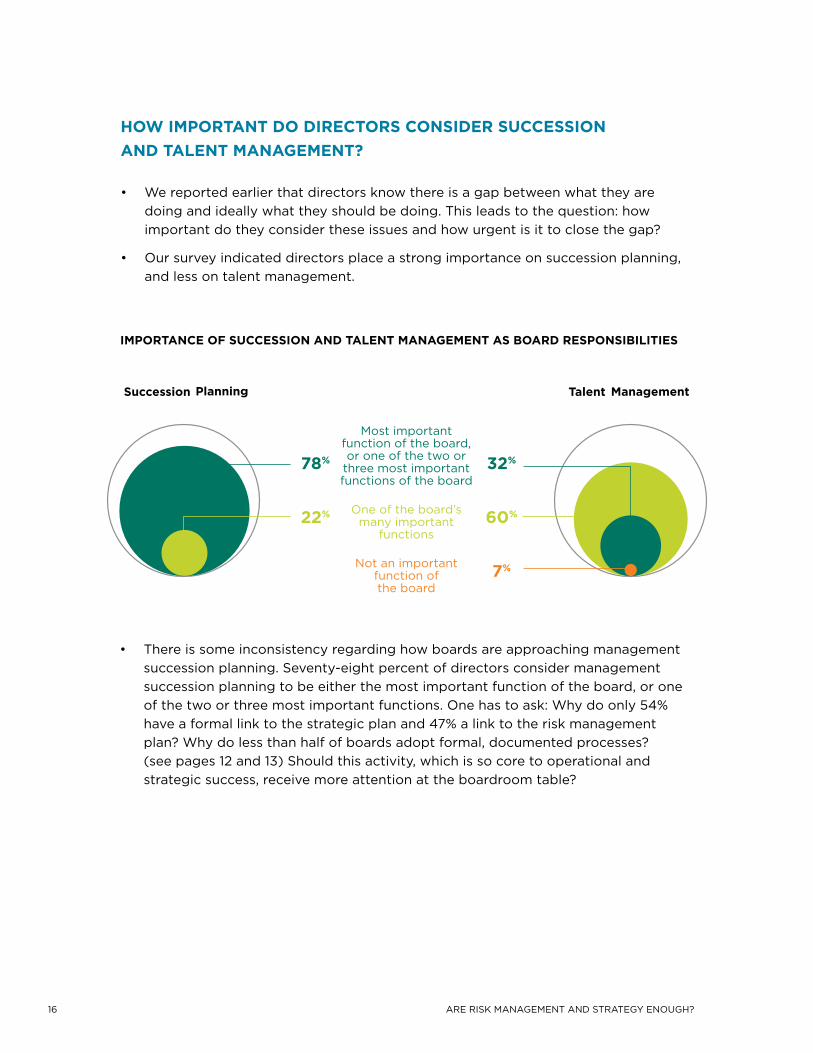
• Thereissomeinconsistencyregardinghowboardsareapproachingmanagementsuccession planning. Seventy-eight percent of directors consider management succession planning to be either the most important function of the board, or one of the two or three most important functions. One has to ask: Why do only 54% have a formal link to the strategic plan and 47% a link to the risk management plan? Why do less than half of boards adopt formal, documented processes? (seepages12and13)Shouldthisactivity,whichissocoretooperationalandstrategic success, receive more attention at the boardroom table?
hoW IMPoRTAnT do dIRECToRS ConSIdER SUCCESSIon And TALEnT MAnAGEMEnT?
• Wereportedearlierthatdirectorsknowthereisagapbetweenwhattheyaredoingandideallywhattheyshouldbedoing.Thisleadstothequestion:howimportant do they consider these issues and how urgent is it to close the gap?
• Oursurveyindicateddirectorsplaceastrongimportanceonsuccessionplanning,and less on talent management.
IMPoRTAnCE oF SUCCESSIon And TALEnT MAnAGEMEnT AS BoARd RESPonSIBILITIES
ARE RISK MANAGEMENT AND STRATEGY ENOUGH?
17
• Talentmanagementisgivenlessimportanceasaboardfunctionbydirectors.We believe that it plays an essential role in delivering on strategy. We would not expect boards to be involved in minute details of talent management. However, they should have this issue regularly on the agenda to know exactly what plans and processes are in place. Directors should have metrics that demonstrate whether these processes will support the achievement of current and longer-term strategy. Assessing the appropriateness of these processes is increasingly being addressed by directors.
Leadership and talent drive shareholder value. The best companies have the best teams and leaders.
The board needs to ensure there is a robust process, but not have its fingers in.
Talent management isn’t as obvious or discussed. It should rise in importance.
IF SUCCESSIon PLAnnInG IS IMPoRTAnT, hoW IS IT RECoGnIzEd AT ThE BoARd LEvEL?
• Boardshaveclarifiedandarticulatedtheirroles,responsibilitiesandprocessesoverthe last 10 to 15 years. They are actively engaged in the strategic planning process, risk management, financial oversight and also understand how these processes interrelate.
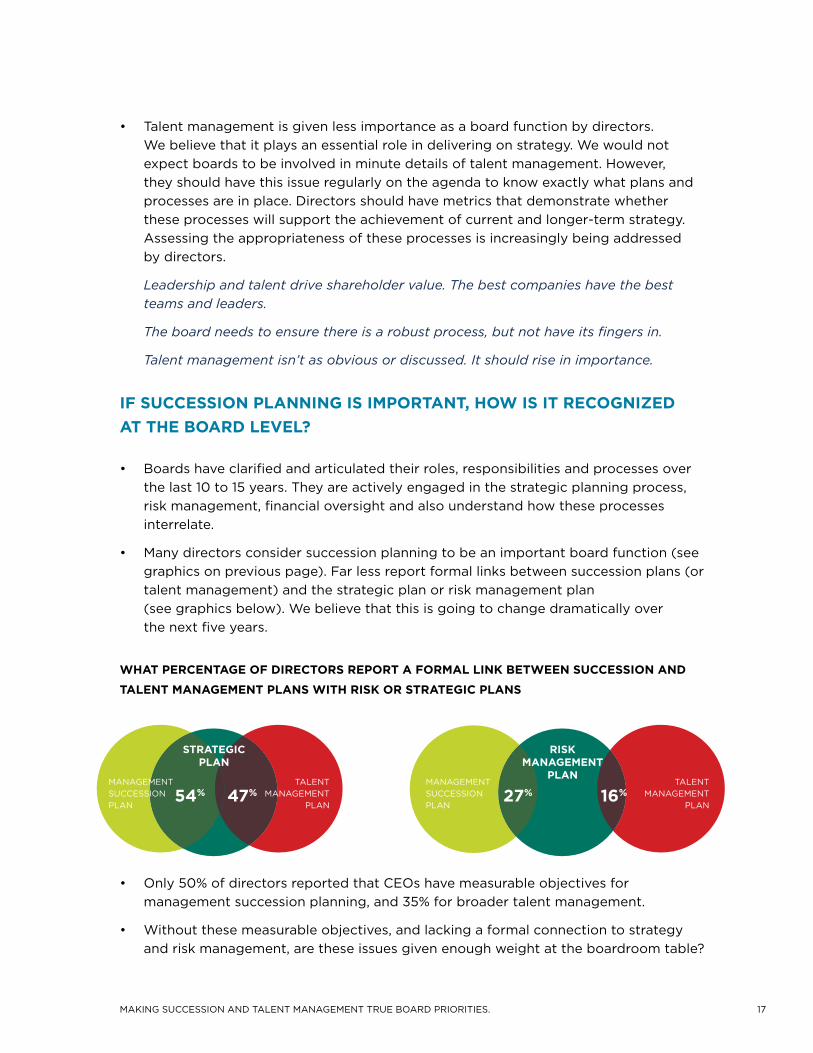
• Manydirectorsconsidersuccessionplanningtobeanimportantboardfunction(seegraphicsonpreviouspage).Farlessreportformallinksbetweensuccessionplans(ortalentmanagement)andthestrategicplanorriskmanagementplan (seegraphicsbelow).Webelievethatthisisgoingtochangedramaticallyover the next five years.
WhAT PERCEnTAGE oF dIRECToRS REPoRT A FoRMAL LInk BETWEEn SUCCESSIon And
TALEnT MAnAGEMEnT PLAnS WITh RISk oR STRATEGIC PLAnS
• Only50%ofdirectorsreportedthatCEOshavemeasurableobjectivesformanagement succession planning, and 35% for broader talent management.
• Withoutthesemeasurableobjectives,andlackingaformalconnectiontostrategy and risk management, are these issues given enough weight at the boardroom table?
MAKING SUCCESSION AND TALENT MANAGEMENT TRUE BOARD PRIORITIES.

18
dIRECToR’S ConFIdEnCE In ThE CoMPAny’S ABILITy To dETERMInE TALEnT nEEdS, RESoURCES
And GAPS To ExECUTE ThE STRATEGIC PLAn
CONFIDENCE IN PROCESSES TO DETERMINE
THE TALEnT nEEdEd TO ExECUTE THE
STRATEGIC PLAN
CONFIDENCE IN PROCESSES TO
DETERMINE TALEnT In PLACE TO
ExECUTE THE STRATEGIC PLAN
CONFIDENCE IN PROCESSES TO CLOSE
GAPS BETWEEn TALEnT nEEdEd
AND TALEnT ALREAdy In PLACE TO
ExECUTE THE STRATEGIC PLAN
• Directorsdonothaveasmuchconfidenceaswewouldexpecttoseeregardingtalentrequiredtoexecuteonstrategy.
What is the leadership skill set required for the future? We don’t know and should.
There is a link with strategy and risk management, but it is not as direct as it should be. Making the link is an explicit expectation for the CEO this year.
The CEO succession plan and emergency plan are linked directly to the strategy, but less so below CEO. Risk, which the whole board reviews, includes executive leadership and retention as a key risk for the company.
A few years ago, our board didn’t think that management succession and talent management were part of our responsibility. We then decided they were but we didn’t have the relevant information. Linking this information with strategy is the next step.
Planning is all good and well, but action is the differentiator. I would prefer to see more middle management executives ready for succession, which only happens by actively assisting them in making the moves incrementally. We have some processes in place but I think we could be better prepared on how best to fill the gaps.
ARE RISK MANAGEMENT AND STRATEGY ENOUGH?
19
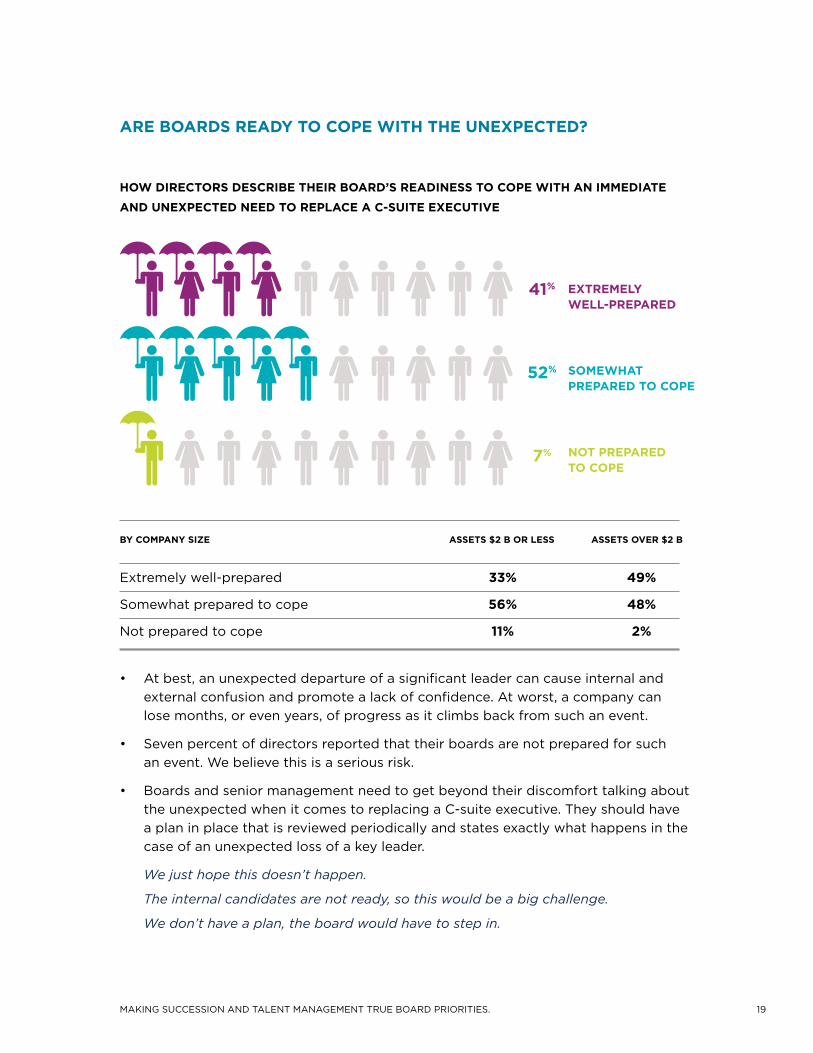
hoW dIRECToRS dESCRIBE ThEIR BoARd’S REAdInESS To CoPE WITh An IMMEdIATE
And UnExPECTEd nEEd To REPLACE A C-SUITE ExECUTIvE
ARE BoARdS REAdy To CoPE WITh ThE UnExPECTEd?
Extremely well-prepared 33% 49%
Somewhat prepared to cope 56% 48%
Not prepared to cope 11% 2%
ASSETS $2 B oR LESSBy CoMPAny SIzE ASSETS ovER $2 B
• Atbest,anunexpecteddepartureofasignificantleadercancauseinternalandexternal confusion and promote a lack of confidence. At worst, a company can lose months, or even years, of progress as it climbs back from such an event.
• Sevenpercentofdirectorsreportedthattheirboardsarenotpreparedforsuch an event. We believe this is a serious risk.
• Boardsandseniormanagementneedtogetbeyondtheirdiscomforttalkingaboutthe unexpected when it comes to replacing a C-suite executive. They should have a plan in place that is reviewed periodically and states exactly what happens in the case of an unexpected loss of a key leader.
We just hope this doesn’t happen.
The internal candidates are not ready, so this would be a big challenge.
We don’t have a plan, the board would have to step in.
MAKING SUCCESSION AND TALENT MANAGEMENT TRUE BOARD PRIORITIES.
20
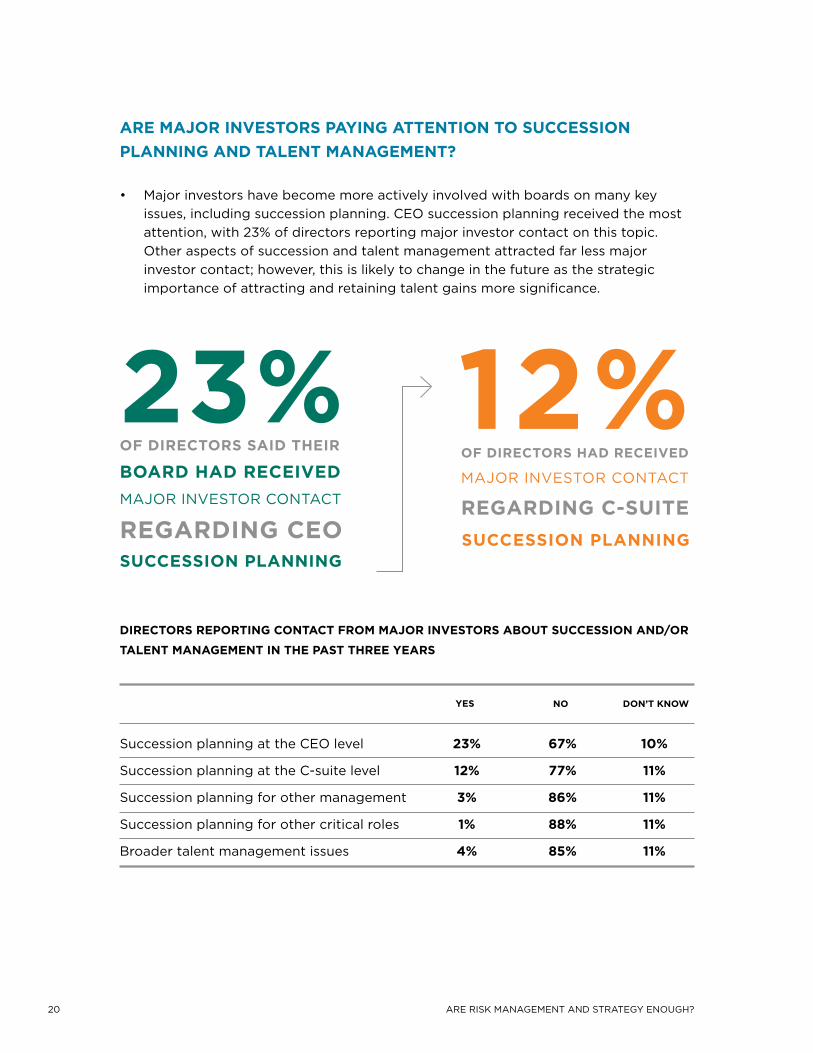
• Majorinvestorshavebecomemoreactivelyinvolvedwithboardsonmanykeyissues, including succession planning. CEO succession planning received the most attention, with 23% of directors reporting major investor contact on this topic. Other aspects of succession and talent management attracted far less major investor contact; however, this is likely to change in the future as the strategic importance of attracting and retaining talent gains more significance.
ARE MAjoR InvESToRS PAyInG ATTEnTIon To SUCCESSIon PLAnnInG And TALEnT MAnAGEMEnT?
Succession planning at the CEO level 23% 67% 10%
Succession planning at the C-suite level 12% 77% 11%
Succession planning for other management 3% 86% 11%
Succession planning for other critical roles 1% 88% 11%
Broader talent management issues 4% 85% 11%
yES no don’T knoW
dIRECToRS REPoRTInG ConTACT FRoM MAjoR InvESToRS ABoUT SUCCESSIon And/oR
TALEnT MAnAGEMEnT In ThE PAST ThREE yEARS
oF dIRECToRS SAId ThEIR oF dIRECToRS hAd RECEIvEd
REGARdInG CEoREGARdInG C-SUITE
BoARd hAd RECEIvEd
SUCCESSIon PLAnnInGSUCCESSIon PLAnnInG
MAJOR INvESTOR CONTACTMAJOR INvESTOR CONTACT
23% 12%
ARE RISK MANAGEMENT AND STRATEGY ENOUGH?
21
• Smallercompaniesaremorelikelytoattractinvestorattentionaboutsuccession;24% of directors from companies with $2 billion or less in assets had major investor contact regarding CEO succession compared to 18% of directors from larger companies. Fourteen percent of smaller company directors had major investor contact regarding C-suite succession compared to 8% of directors from larger companies. This may tie into the fact that boards of larger companies aremorelikelytohaveformalsuccessionplanningprocesses(seepage12). The lack of a formal process may leave major investors looking for more information,aswellasquestioningwhethertheboardrecognizesthe importance of succession planning.
I find it startling that investors have not been interested in our leadership succession.
It was a major topic during a dissident shareholder discussion in the last year.
It happens at the CEO level - especially if a CEO is long-tenured or there are performance issues.
There were inquiries as to strength of the C-suite since the market downturn.
Attention from our independent outside investors highlighted the need for deeper discussion regarding succession, cross-training and what an appropriate “plan B” would look like. This commenced about 18 months ago and we are in very good shape now, but essentially nothing existed before this.
WhAT SIGnIFICAnT ChAnGES hAvE dIRECToRS oBSERvEd ovER ThE PAST ThREE yEARS?
• 37%ofdirectorsindicatedanincreasedlevelofboardinvolvementinsuccessionandtalent management, and there was a strong sense in most interviews that there is discussionregardinghowtoworkwithmanagementmoreeffectivelyintheseareas.
We’ve made it clear - as a Board we want very regular involvement in management succession planning and talent development.
I see it as being more hands on now than previously, and boards want to talk about it and expect they should know what is happening, and that it should not be left to management or just one committee.
The Board has increased its level of oversight, interest and participation in succession. Now need to move more actively to talent management.
MAKING SUCCESSION AND TALENT MANAGEMENT TRUE BOARD PRIORITIES.
22
• Welearnedthatthereisaconsiderableunderstandingoftheimportance of these topics at the table, but that boards are struggling with how they should be engaging.
The questions posed here have caused me to pause and realize our Board needs to bring more rigor and focus to management succession planning and talent development.
The world is changing so quickly and in so many different ways that if our focus drifts away from the capacity and potential of our employees, we risk becoming irrelevant.
The time has come to put action behind the words in the CEO’s letter to shareholders where he or she writes about “our people being our most important resource”. Our most important resource needs a higher profile, more scrutiny at the Board level.
SUMMARy And ACTIon
The Board recently asked that succession planning and talent management be “hard” linked to the financial business plan.
Used to be the HR Committee only, now it is the full Board.
The shift in attention to these topics is driven by Boards now being increasingly independent of the CEO and they have their own view. Boards have upped their game by way of capacity. There is more tolerance for open constructive dialogue around human resource topics.
• Changesarenotoccurringuniversallythough,12%ofdirectorsreported no change at all:
We lack the rigor here at the board.
There has been little change. We are a smaller company. In big companies you tend to see this a lot more.
ARE RISK MANAGEMENT AND STRATEGY ENOUGH?
23
1. ASSESS CURREnT PRACTICES
Assess the board’s current practices and human capital related information and
metrics, and determine whether they are appropriate. How are they linked with
risk management and strategic planning processes? If they are not, why not?
To what extent does the board engage with the CEO and executive management
team on succession and talent management?
Boards should also consider who is at the table. Are there enough directors
withtherequisiteknowledgeandexpertiseincontemporaryhumancapital
management(notjustcompensation)foreffectiveboardoversightand
engagement?
Is the CHRO present at all board meetings? Does he or she participate in a
meaningful way, comparable with other senior executives such as the CFO?
2. FoRMALIzE ThE PRoCESS
Formal succession and talent management processes add weight, importance,
and ensure a regular presence on the agenda. Boards should periodically take a
deep dive into these processes, including an examination of internal and external
human capital factors.
Is the CEO held accountable for ensuring that robust succession plans and talent
management programs are in place? Formalizing this accountability contributes
to the weight and importance of these topics.
Boards and management need to be on the same page as to how they will
interact on human capital issues. How deep does the board need to go on the
details? Where does the board need to know what processes are in place but
doesn’t need to know the details?
Metrics are most powerful when directors and management agree the metrics
effectivelyindicatehowsuccessfullyplansandprocessesarebeingimplemented.
Based on our experience and the survey results, we believe that every board should consider the following:
MAKING SUCCESSION AND TALENT MANAGEMENT TRUE BOARD PRIORITIES.
24
3. ConnECT ThE CRITICAL PLAnnInG PRoCESSES
Talent is a key element in creating and delivering on strategy, and loss of talent
and institutional knowledge or the inability to attract talent is a major risk factor.
Formal connections between strategic planning, risk management and human
capital management are an essential function of contemporary board governance.
4. dEFInE ThE RoLES And ACCoUnTABILITy
When asked about what has changed in the last three years, directors responded
that boards are much more engaged and demanding more of management on
these issues. However, less than half report a formal, board-approved process.
A definition of the board’s role and accountability in human capital
management processes conveys to management that the board is focused
and taking these issues seriously. It sends the message to investors that the
board understands the importance of these issues and its role in them to the
long-term success of the company.
5. STAy FLExIBLE And PRoACTIvE
The optimization of talent is one of the most dynamic issues facing organizations
today.Generationaldifferencesarecreatingnewworkplacecultureswithdifferent
factorsaffectingretentionandrecruitment.Fast-movingtechnologicalchanges
are creating the need for new, highly-skilled employees and leaders. The focus of
investors, social media and regulators are putting workplace culture under
the microscope.
This means that the board’s work in this area is never static. We heard from
many directors that the impetus behind the board getting more involved with
succession and talent management was the demand for growth and
theabilitytoadapttochangequicklyifrequired.
ARE RISK MANAGEMENT AND STRATEGY ENOUGH?
25
We heard a great deal from many experienced directors during our interviews. In particular, one very experienced and thoughtful director made a comment that captures what many Canadian directors are struggling with as they work to make succession and talent management board priorities:
The role of boards in strategy, risk management, succession planning is getting better defined and better understood. There is general alignment between boards and management as to the role of boards and the role of management in terms of these responsibilities.
I question whether there is as clear alignment with management with respect to the role of the board in terms of talent management and culture. I believe that boards must ensure that a company has and continues to have the necessary talent to deliver on the strategy, to remain competitive, and to deliver overall value to the shareholders. I also believe that boards must understand and regularly review the talent management programs. They are at the very heart of the organization’s culture. These responsibilities cannot be in the hands of management alone.
MAKING SUCCESSION AND TALENT MANAGEMENT TRUE BOARD PRIORITIES.
26 KORN FERRY Canada26
BoardIndependence

272016 Corporate Board GovernanCe and direCtor Compensation report
• 94%ofboardshadamajorityofindependentdirectors.
• In2015,92%ofboardshadsomeformofindependentleadership, which is the highest level we have seen since boards began reporting on independence in 2005.
• In2015,only6%ofboardsreportedmorethantwoinside directors.
• OfthecompaniesthatcombinetheCEOandChairroles, 25% are in the Financials Industry, 18% are Energy companies and 15% are Information Technology companies.
• 39%ofCanadianboardshadaleaddirectorin2015.
• In 2015, 94% of boards had a majority of independent directors, following 96% for the previous two years. This percentage has fluctuated between 92% and 96% since we began tracking it in 2005. We consider the drop from 96% to 94% to be representativeoffluctuationofdifferentcompaniesmoving in and out of the sample from year-to-year rather than a cause for concern.
• Largecompanieshavebeenthemostconsistentwithmaintaining a majority of independent directors. For the past 6 years, this percentage has stayed relatively stable between 96% and 98% while companies in the other categories have fluctuated between 90% and 98%.
kEy FIndInGS
Percentage of Boards with a Majority of Independent directors
Micro <1.5B
Small 1.5B to 3.5B
Medium 3.5B to 10B
Large >10B All
2015 97% 94% 95% 98% 94% 2014 97% 90% 98% 98% 96%
2011 91% 94% 96% 97% 94%
94%
had a majority of
independent
directors

28 KORN FERRY Canada
Boards Without a Majority of Independent directors
BMTC Group Inc. Lassonde Industries Inc.
BRP Inc. Linamar Corporation
Cara Operations Limited MainstreetEquityCorp.
Centric Health Corporation Nobord Inc.
China Gold International Resources Corp. Ltd. Sears Canada Inc.
FCF Capital Inc. Spin Master Corp.
Gemworth MI Canada Inc. TransAlta Renewables Inc.
IGM Financial Inc. Winpak Ltd.
Labrador Iron Ore Royalty
IndEPEndEnT dIRECToR MEETInGS
• Ninety-eight percent of boards reported that they held meetings of only independent directors, as recommended in the CSA guidelines.In2005,whenboardswerefirstrequiredto report on this practice, only 79% of boards held meetings of only the independent directors.
• Eighty-fivepercentofboardsdisclosedthenumberofmeetings held by the independent directors. The average number of meetings has been seven for the past nine years.
98%of boards held meetings
of only independent
directors
ALL
Meetings of only Independent directors
Average 2015 7
2014 7
2011 7
Median 2015 7
2014 6
2011 6
Range 2015 0 to 21
2014 0 to 19
2011 0 to 34
292016 Corporate Board GovernanCe and direCtor Compensation report
InSIdE dIRECToRS
• Aninsidedirectorisadirectorwhoservesontheboardofthecompany that employs the director. As the trend for independent boards has remained strong in Canada since 2005, the number of inside directors has declined. Most boards today will have only one inside director, usually the CEO.
• Theaveragenumberofinsidedirectorsisone,asithasbeenforthe past nine years. The median is also one, as it has been for the past thirteen years.
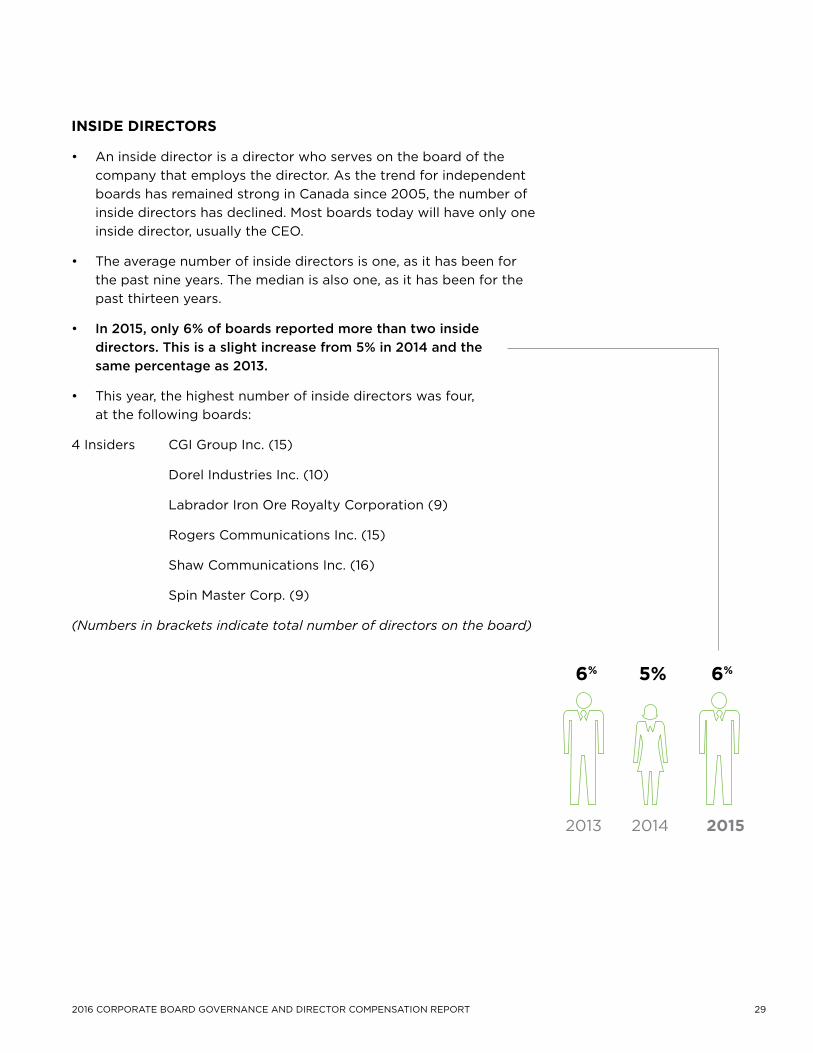
• In 2015, only 6% of boards reported more than two inside directors. This is a slight increase from 5% in 2014 and the same percentage as 2013.
• Thisyear,thehighestnumberofinsidedirectorswasfour, at the following boards:
4Insiders CGIGroupInc.(15)
DorelIndustriesInc.(10)
LabradorIronOreRoyaltyCorporation(9)
RogersCommunicationsInc.(15)
ShawCommunicationsInc.(16)
SpinMasterCorp.(9)
(Numbers in brackets indicate total number of directors on the board)
2013 2014 2015
5%6% 6%

30 KORN FERRY Canada
IndEPEndEnT BoARd LEAdERShIP
• TheCSAgovernanceguidelinesstatethatboardchairsshouldbeindependent directors, and where this is not appropriate, the board should appoint an independent lead director.
• In2015,92%ofboardshadsomeformofindependentleadership,which is the highest level we have seen since boards began reporting on independence in 2005. In 2014, 91% of boards had independent leadership, and 88% were in this category in 2011.
• MediumandSmallcompanieshadthehighestpercentageofindependent leadership at 97% compared to Micro companies where only 86% of boards had some form of independent leadership.
• Themannerinwhichboardsestablishindependentboardleadershiphas remained relatively stable since 2005:
* Between 51% and 58% have had an Independent Chair.
* Between 29% and 36% have had a Lead Director.
• AtcompanieswithnoIndependentChair,82%hadaLeadDirector in 2015:
* 87%ofboardswithanExecutive(inside)Chairhadalead director, compared to 82% in 2014; and
* 74% of boards with a Non-Executive, Non-Independent chair had a Lead Director, compared to 73% in 2014.
* Anindependentboardchairand/orindependentleaddirector
Percentage of Boards with Independent Leadership*
Micro <1.5B
Small 1.5B to 3.5B
Medium 3.5B to 10B
Large >10B All
2015 86% 97% 97% 91% 92% 2014 86% 92% 98% 90% 91%
2011 83% 92% 96% 83% 88%
312016 Corporate Board GovernanCe and direCtor Compensation report
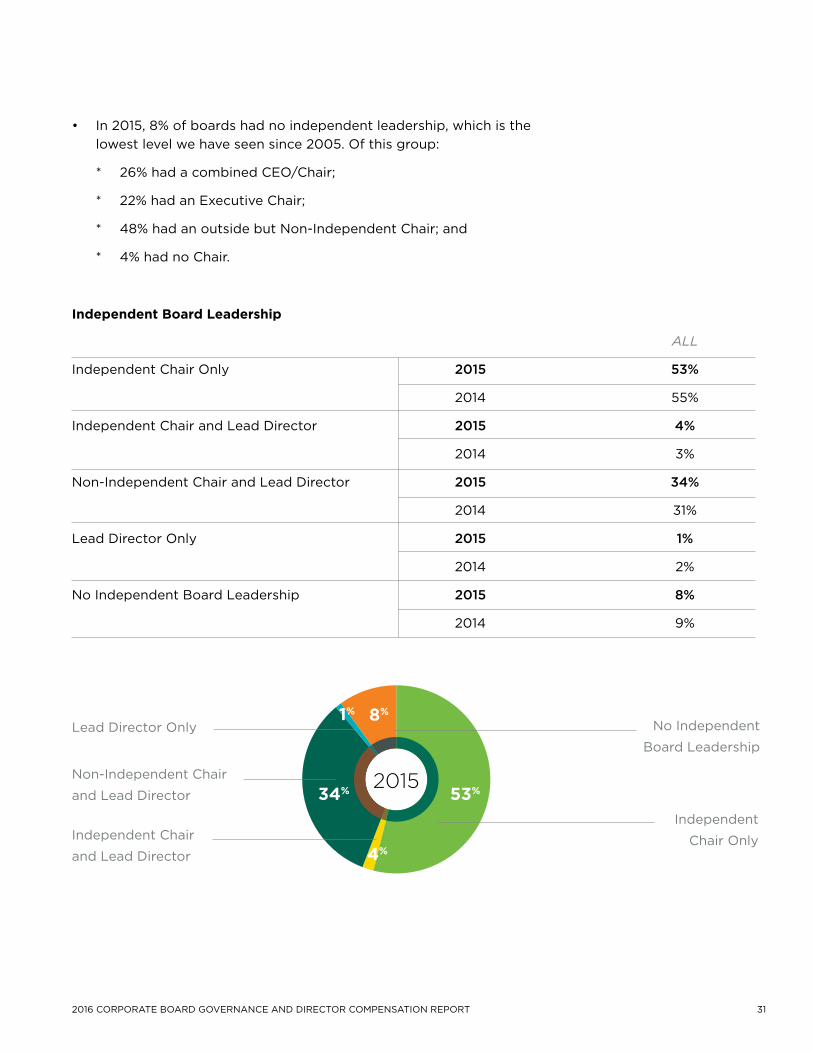
• In2015,8%ofboardshadnoindependentleadership,whichisthelowest level we have seen since 2005. Of this group:
* 26% had a combined CEO/Chair;
* 22% had an Executive Chair;
* 48% had an outside but Non-Independent Chair; and
* 4% had no Chair.
Independent Board Leadership
ALL
Independent Chair Only 2015 53%
2014 55%
Independent Chair and Lead Director 2015 4%
2014 3%
Non-Independent Chair and Lead Director 2015 34%
2014 31%
Lead Director Only 2015 1%
2014 2%
No Independent Board Leadership 2015 8%
2014 9%
2015
Independent
Chair Only
No Independent
Board Leadership
Independent Chair
and Lead Director
Non-Independent Chair
and Lead Director
Lead Director Only
53%
8%1%
34%
4%
32 KORN FERRY Canada
BoARd ChAIRS
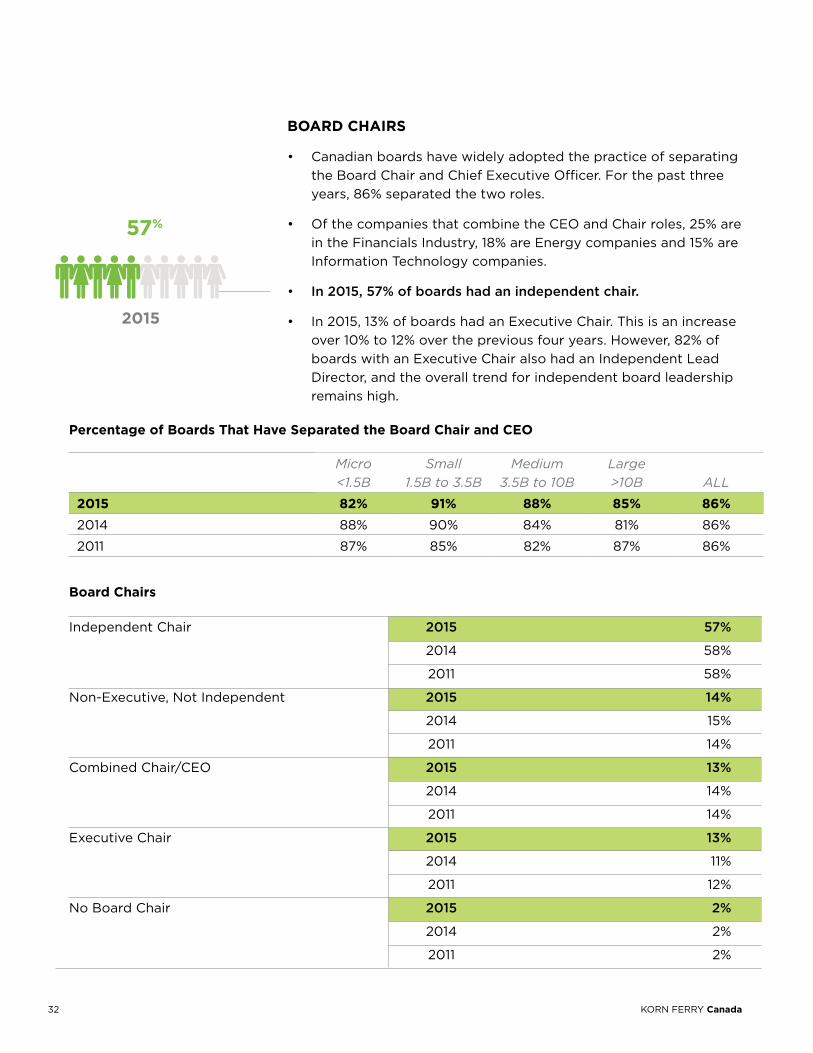
• Canadianboardshavewidelyadoptedthepracticeofseparatingthe Board Chair and Chief Executive Officer. For the past three years, 86% separated the two roles.
• OfthecompaniesthatcombinetheCEOandChairroles,25%arein the Financials Industry, 18% are Energy companies and 15% are Information Technology companies.
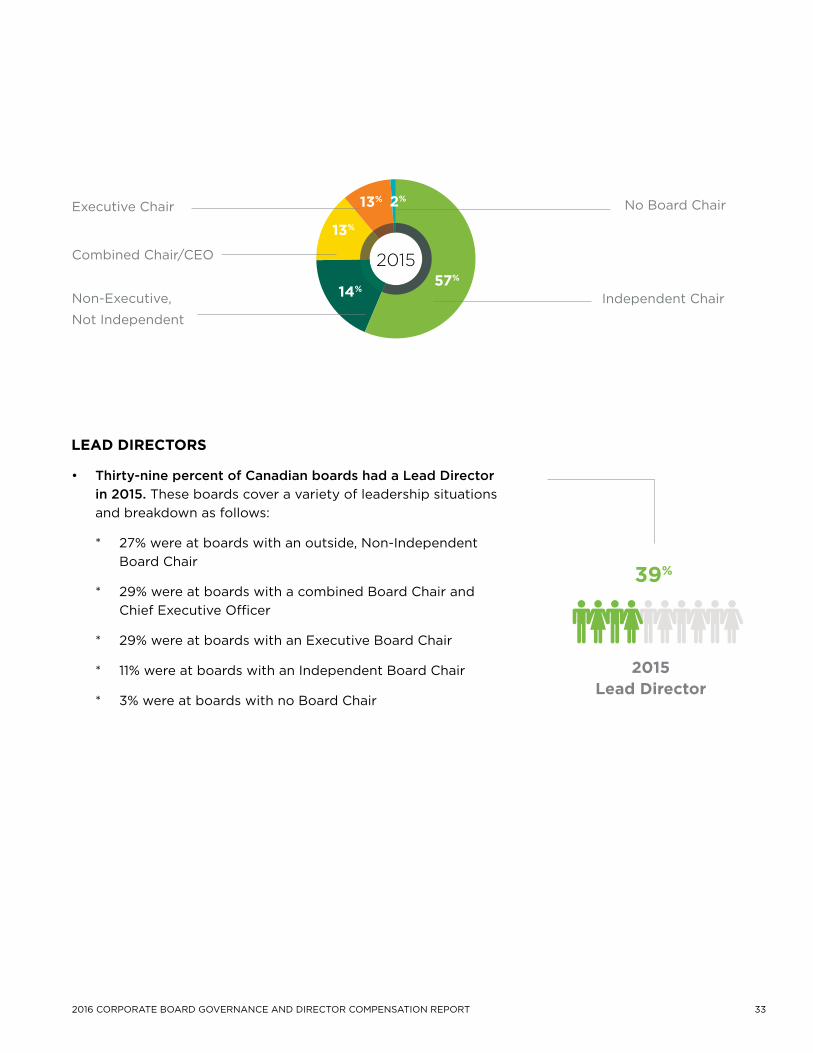
• In 2015, 57% of boards had an independent chair.
• In2015,13%ofboardshadanExecutiveChair.Thisisanincreaseover 10% to 12% over the previous four years. However, 82% of boards with an Executive Chair also had an Independent Lead Director, and the overall trend for independent board leadership remains high.
Percentage of Boards That have Separated the Board Chair and CEo
Micro <1.5B
Small 1.5B to 3.5B
Medium 3.5B to 10B
Large >10B ALL
2015 82% 91% 88% 85% 86% 2014 88% 90% 84% 81% 86%
2011 87% 85% 82% 87% 86%
Independent Chair 2015 57%
2014 58%
2011 58%
Non-Executive, Not Independent 2015 14%
2014 15%
2011 14%
Combined Chair/CEO 2015 13%
2014 14%
2011 14%
Executive Chair 2015 13%
2014 11%
2011 12%
No Board Chair 2015 2%
2014 2%
2011 2%
Board Chairs
2015
57%
332016 Corporate Board GovernanCe and direCtor Compensation report
LEAd dIRECToRS
• Thirty-nine percent of Canadian boards had a Lead Director in 2015. These boards cover a variety of leadership situations and breakdown as follows:
* 27% were at boards with an outside, Non-Independent Board Chair
* 29% were at boards with a combined Board Chair and Chief Executive Officer
* 29% were at boards with an Executive Board Chair
* 11% were at boards with an Independent Board Chair
* 3% were at boards with no Board Chair
201557%
13% 2%
13%
14%Independent Chair
No Board Chair
Non-Executive,
Not Independent
Combined Chair/CEO
Executive Chair
2015Lead director
39%
34 KORN FERRY Canada
BoardComposition
352016 Corporate Board GovernanCe and direCtor Compensation report
• Boardscontinuetoincreasethetypeandqualityofinformation they disclose about directors. In 2015, 90% of boards exceeded the CSA minimum requirementsfordisclosureaboutindividualdirectors,compared to 87% in 2014 and 77% in 2011.
• 78%ofboardshadatleastonefemaledirectorin2015 compared to 68% in 2014. This is the largest representation of women on Canadian boards that we have ever seen. The most substantial increase was at Micro companies, at which 63% had at least one female director in 2015 compared to 44% in 2014.
• Womencomprised17%ofthedirectorsontheboardsin our sample. This is an increase of 2% over last year and is the highest level we have seen since we began tracking this information 22 years ago.
• Ofthedirectorsthatwerenewlyelectedtoboards in 2015, 33% were female, compared to 27% in 2014.
• 94%ofcompaniesdisclosedamajorityvotingpolicy for fiscal year 2015, compared to 91% in 2014.
• Agewasprovidedfor90%ofdirectorsinoursurveythis year. Seventy-six percent of those directors were in the 51 to 70 range. Sixteen percent of directors in 2015 were 71 or older.
• Themostcommonretirementageis75years,whichwas reported by 15% of boards in 2015 compared to 13% in 2014 and 5% in 2011.
kEy FIndInGS
36 KORN FERRY Canada
BILL C-25 And BoARd CoMPoSITIon
• On September 28, 2016, the Government of Canada introduced Bill C-25, an Act to amend the Canada Business Corporations Act, the Canada Cooperatives Act, the Canada Not-for-profit Corporations Act and the Competition Act. If passed as presented inthefirstreading,therearesomeprovisionsthatwillaffectboardcomposition, including:
* Boardswillberequiredtoelectdirectorsannually.Asthis isalreadyarequirementoftheTSX,andallcompaniesinour research sample are TSx listed, we do not expect this to have anyeffectonthesecompanies.
* Directorelectionswillbeindividualbydirector(ratherthan slatesofcandidates).
* Voteswillbecast“for”or“againstdirectors”(notwithheld.) Nomineeswithmore“for”than“against”voteswillbeelected. Therefore a nominee for the board that receives a majority of“against”votesisnotelectedtotheboard.Thiscouldresult in unexpected vacancies on the board, and potentially leave a boardwithoutenoughdirectorstoconstituteaquorum.
* Companieswillberequiredtodiscloseinformationabout diversity among directors and senior management. The details about this disclosure are not provided yet.
dIRECToR InFoRMATIon
• In2015,90%ofboardsexceededtheCSAminimumrequirementsfor disclosure about individual directors, compared to 87% in 2014 and 77% in 2011. We anticipate that fulsome reporting about director skills and backgrounds will continue to be the norm, regardless of regulation. Information about nominees will be particularly important if Bill C-25 passes and there is a possibility ofanomineefailingtogainamajorityof“for”votes.
• In2015,47%ofcompaniesincludedinformationontheirdirectors’areas of expertise, compared to 44% for the previous two years.
SEPT 282016
BILLC-25
372016 Corporate Board GovernanCe and direCtor Compensation report
• Twentypercentofdirectorswerenewly-electedin2015,whichwas the same as last year. Of these newly-elected directors:
* 33% were female directors, compared to 27% in 2014,
* 28%wereinternationaldirectors(residentoutsideof Canada)comparedto29%in2014,
* 47% had a financial background, compared to 42% in 2014,
* 18% were active CEOs, compared to 23% in 2014,
* 40%hadaCEObackground(includingtheactiveCEOs) compared to 42% in 2014, and
* 32%wereactiveC-suiteexecutives(includingtheactive CEOs)comparedto38%lastyear.
• Companiesarerequiredtodisclosewhethertheyhaveadoptedamajorityvotingpolicy.Iftheyhavenot,theyarerequiredtoexplain their practices for electing directors.
* Ninety-four percent of companies disclosed a majority voting policy for fiscal year 2015, compared to 91% in 2014.
* Of those companies that did not indicate a majority voting policy, 75% of them had a controlling shareholder.
• Fifty-threepercentofcompaniesincludedinformationonboardinterlocks(wheretwoormoredirectorsalsoservetogetherontheboardofanotherreportingissuer).Ofthosecompanies, 16% stated that they have a formal board policy on interlocks. A majority of companies that report on interlocks have a limit on the number of board interlocks allowed, with two being the most common.
dIRECToR AGE
• Disclosureofeachdirector’sageisanincreasinglycommon,but not mandatory, practice. In 2015, 80% of boards disclosed director age, compared to 79% in 2014 and 67% in 2011.
• Forthepastfouryears,theaverageandmedianageofdirectors was 63, while in 2011, the average age was 62 and the median age was 63. Seventy-six percent of directors were in the 51 to 70 range. Sixteen percent of directors in 2015 were 71 or older.
• IntheUnitedStates,themedianageofdirectorsatthe Top 200 companies was 64. 1
1 2015-2016 Director Compensation Report, published by the NACD with data from the 2015 Director Compensation Survey by Pearl Meyer.
38 KORN FERRY Canada
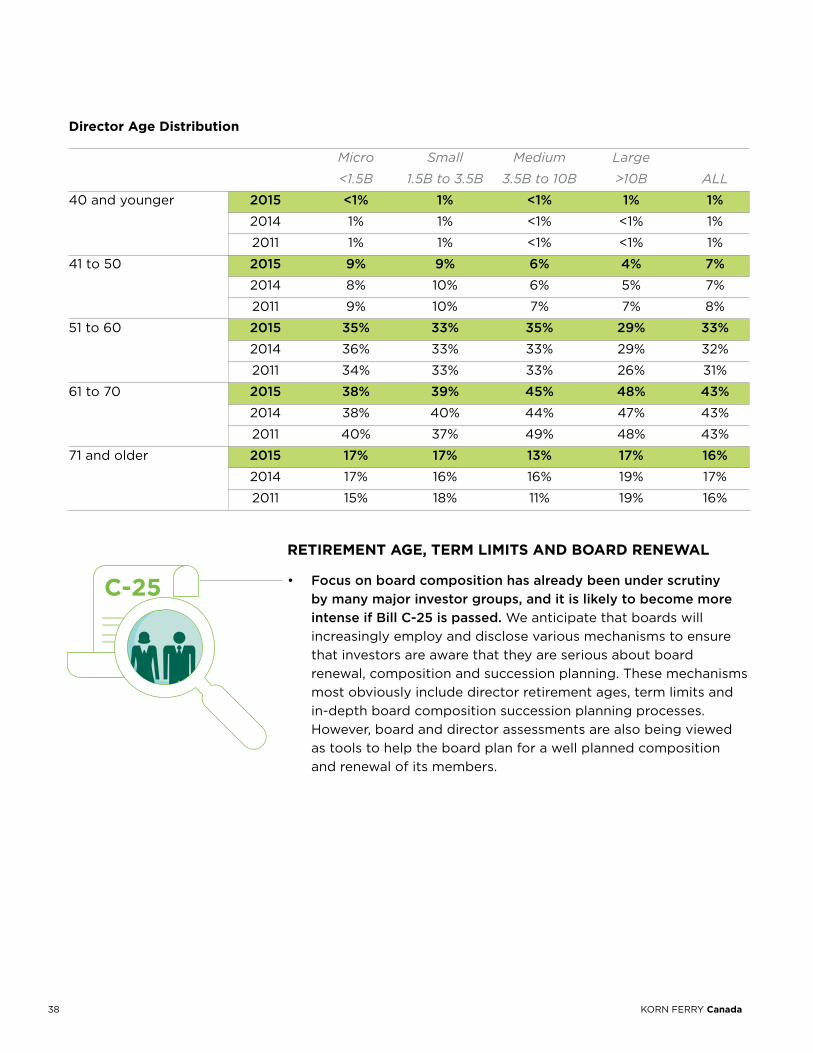
director Age distribution
Micro Small Medium Large
<1.5B 1.5B to 3.5B 3.5B to 10B >10B ALL
40 and younger 2015 <1% 1% <1% 1% 1% 2014 1% 1% <1% <1% 1%
2011 1% 1% <1% <1% 1%
41 to 50 2015 9% 9% 6% 4% 7% 2014 8% 10% 6% 5% 7%
2011 9% 10% 7% 7% 8%
51 to 60 2015 35% 33% 35% 29% 33% 2014 36% 33% 33% 29% 32%
2011 34% 33% 33% 26% 31%
61 to 70 2015 38% 39% 45% 48% 43% 2014 38% 40% 44% 47% 43%
2011 40% 37% 49% 48% 43%
71 and older 2015 17% 17% 13% 17% 16% 2014 17% 16% 16% 19% 17%
2011 15% 18% 11% 19% 16%
RETIREMEnT AGE, TERM LIMITS And BoARd REnEWAL
• Focus on board composition has already been under scrutiny by many major investor groups, and it is likely to become more intense if Bill C-25 is passed. We anticipate that boards will increasingly employ and disclose various mechanisms to ensure that investors are aware that they are serious about board renewal, composition and succession planning. These mechanisms most obviously include director retirement ages, term limits and in-depth board composition succession planning processes. However, board and director assessments are also being viewed as tools to help the board plan for a well planned composition and renewal of its members.
C-25
392016 Corporate Board GovernanCe and direCtor Compensation report
• Initsproxycircularthisyear,GeorgeWestonLimitedprovidedadetaileddescription of their renewal practices:
“The Board has adopted a Board Tenure Policy stating that the Executive Chairman and the Governance Committee will undertake an assessment of a director’s continued participation on the Board upon reaching the age of 75 or a change in principal occupation, whichever occurs first. The Board Tenure Policy does not apply to the Executive Chairman or any management directors.
In addition to its formal Board Tenure Policy, the Governance Committee:
1. undertakes an annual Board effectiveness evaluation that enables the Governance Committee and the Board to solicit feedback regarding director contribution, skill set and expertise;
2. maintains a director skills matrix to ensure that, in choosing director candidates, it focuses appropriately on critical skills and experience;
3. monitors director turnover through the evaluation process and, to the extent appropriate, from time to time requests directors who are long serving and who have a readily replaceable skill set or experience not to stand for re-election;
4. annually reviews Board committee chairs and memberships with a view to balancing the desire for fresh perspectives with the need for experience and subject matter expertise; and
5. provides disclosure in the Circular of director tenure, the evaluation process and turnover with an explanation of how the Corporation’s approach ensures diversity of skills, experience and background and an appropriate level of turnover.
In summary, each year, the Governance Committee undertakes a review of the composition of the Board, the performance of the individual directors and the mandate and composition of the Committees of the Board. Recommendations for changes, if any, are developed and subsequently discussed with the full Board and with the controlling shareholder. The Board is of the view that these processes have worked well and have resulted in governance that has been both effective and adaptive to the changing nature of the business and the markets in which the Corporation operates. (George Weston Limited, Management Proxy Circular, May 10, 2016)
40 KORN FERRY Canada
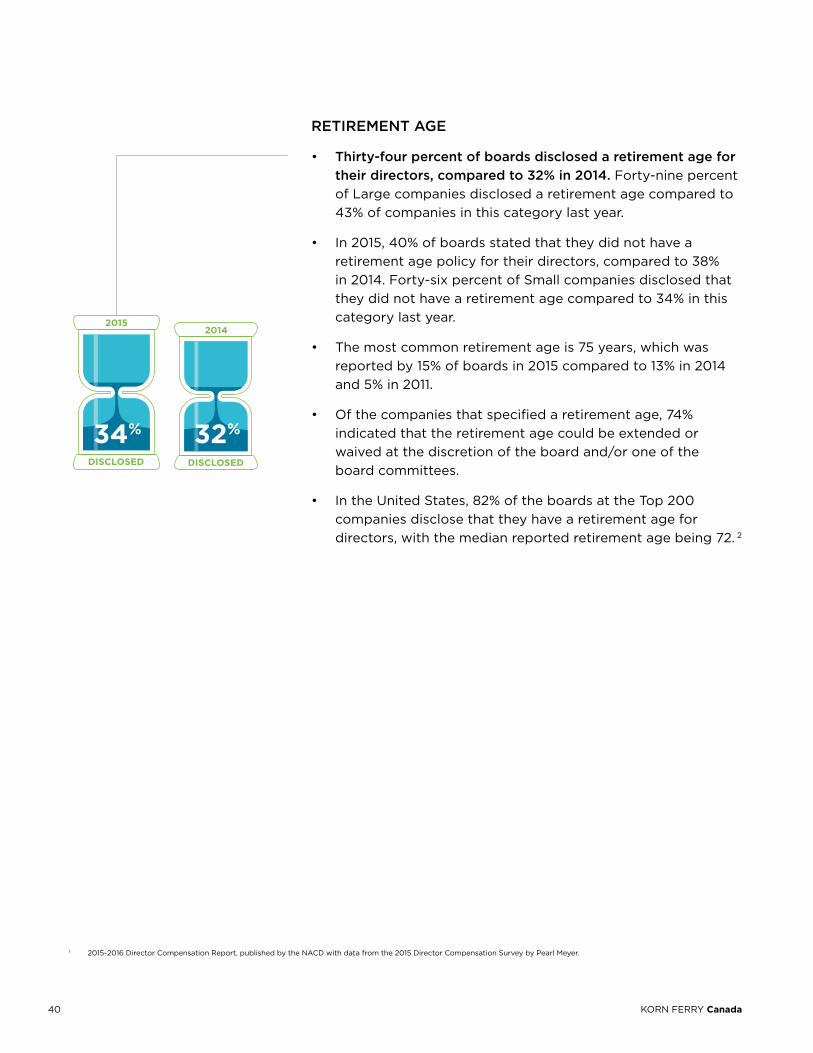
RETIREMENT AGE
• Thirty-four percent of boards disclosed a retirement age for their directors, compared to 32% in 2014. Forty-nine percent of Large companies disclosed a retirement age compared to 43% of companies in this category last year.
• In2015,40%ofboardsstatedthattheydidnothavearetirement age policy for their directors, compared to 38% in 2014. Forty-six percent of Small companies disclosed that they did not have a retirement age compared to 34% in this category last year.
• Themostcommonretirementageis75years,whichwasreported by 15% of boards in 2015 compared to 13% in 2014 and 5% in 2011.
• Ofthecompaniesthatspecifiedaretirementage,74%indicated that the retirement age could be extended or waived at the discretion of the board and/or one of the board committees.
• IntheUnitedStates,82%oftheboardsattheTop200companies disclose that they have a retirement age for directors, with the median reported retirement age being 72. 2
34% 32%
20152014
dISCLoSEd dISCLoSEd
1 2015-2016 Director Compensation Report, published by the NACD with data from the 2015 Director Compensation Survey by Pearl Meyer.

412016 Corporate Board GovernanCe and direCtor Compensation report
Prevalence of Retirement Age Practices
Micro Small Medium Large <1.5B 1.5B to 3.5B 3.5B to 10B >10B ALL
Retirement Age 2015 23% 33% 36% 49% 34% 2014 22% 32% 34% 43% 32%
Waiver Possible* 2015 68% 65% 79% 82% 74% 2014 70% 65% 78% 73% 72%
No Retirement Age 2015 34% 46% 45% 38% 40% 2014 34% 34% 40% 43% 38%
No Disclosure 2015 43% 21% 18% 13% 26% 2014 44% 27% 19% 10% 30%
* Percentageofthoseboardsthathavearetirementagefordirectors.
director Retirement Ages
2015 2014 2011
Retirement from the board at age 70 7% 8% 12%
Retirement from the board at age 71 <1% <1% <1%
Retirement from the board at age 72 10% 10% 7%
Retirement from the board at age 73 1% 1% 1%
Retirement from the board at age 75 15% 13% 5%
Formal Policy, age not specified <1% 0 0
Specify there is no director retirement age 40% 38% 26%
Combined retirement age/term limit 7% 5% 1%
No disclosure 26% 30% 48%
42 KORN FERRY Canada
Term Limits
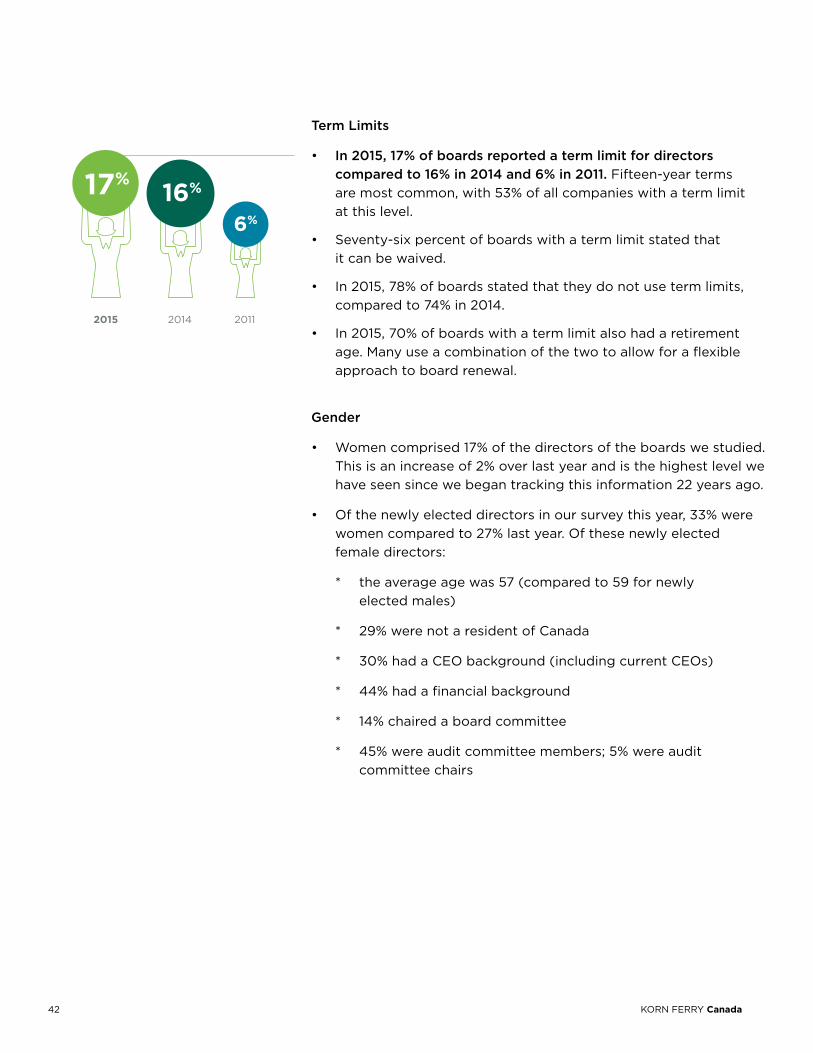
• In 2015, 17% of boards reported a term limit for directors compared to 16% in 2014 and 6% in 2011. Fifteen-year terms are most common, with 53% of all companies with a term limit at this level.
• Seventy-sixpercentofboardswithatermlimitstatedthat it can be waived.
• In2015,78%ofboardsstatedthattheydonotusetermlimits,compared to 74% in 2014.
• In2015,70%ofboardswithatermlimitalsohadaretirementage. Many use a combination of the two to allow for a flexible approach to board renewal.
Gender
• Womencomprised17%ofthedirectorsoftheboardswestudied.This is an increase of 2% over last year and is the highest level we have seen since we began tracking this information 22 years ago.
• Ofthenewlyelecteddirectorsinoursurveythisyear,33%werewomen compared to 27% last year. Of these newly elected female directors:
* theaverageagewas57(comparedto59fornewly electedmales)
* 29% were not a resident of Canada
* 30%hadaCEObackground(includingcurrentCEOs)
* 44% had a financial background
* 14% chaired a board committee
* 45% were audit committee members; 5% were audit committee chairs
2015 2014 2011
17%16%
6%
432016 Corporate Board GovernanCe and direCtor Compensation report
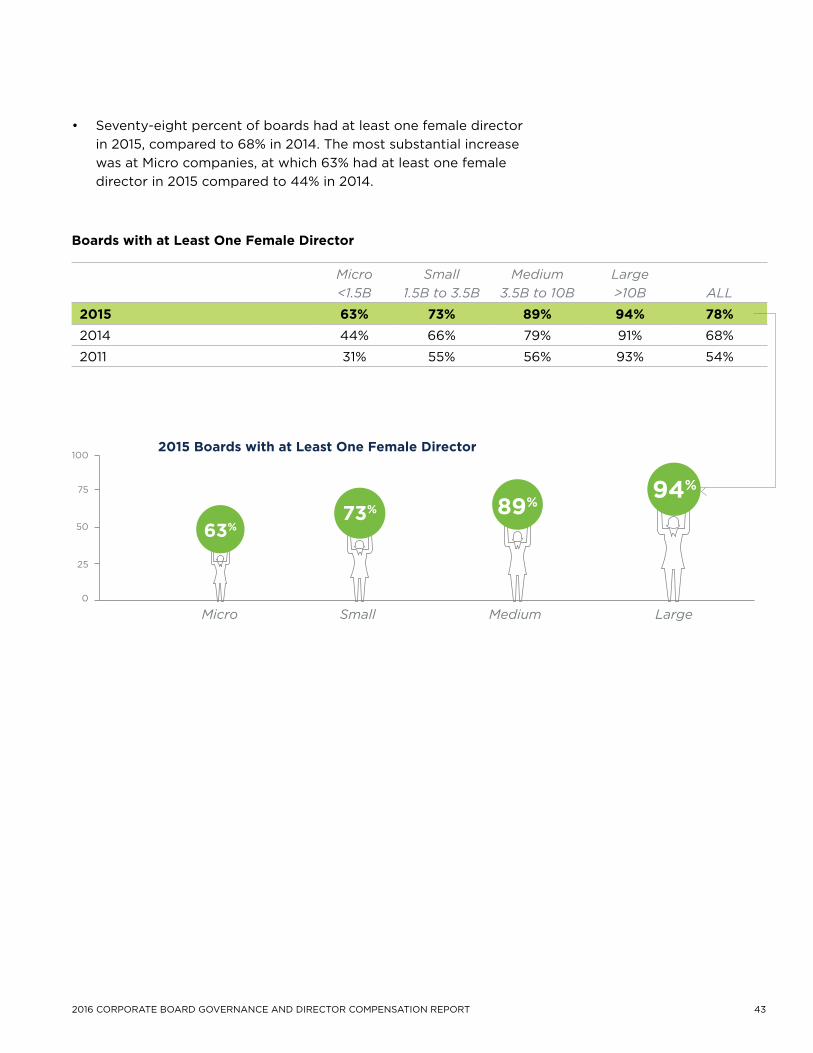
• Seventy-eightpercentofboardshadatleastonefemaledirectorin 2015, compared to 68% in 2014. The most substantial increase was at Micro companies, at which 63% had at least one female director in 2015 compared to 44% in 2014.
Boards with at Least one Female director
Micro <1.5B
Small 1.5B to 3.5B
Medium 3.5B to 10B
Large >10B ALL
2015 63% 73% 89% 94% 78% 2014 44% 66% 79% 91% 68%
2011 31% 55% 56% 93% 54%
100
50
75
25
0
94%
89%73%
63%
Micro
2015 Boards with at Least one Female director
Small Medium Large
44 KORN FERRY Canada
Boards with at Least one Female director, By Industry
2015 2014 2011
Consumer Discretionary 94% 88% 87%
Consumer Staple 100% 100% 100%
Energy 62% 48% 38%
Financials 80% 76% 64%
Health Care 100% 100% 83%
Industrials 85% 73% 50%
Information Technology 47% 58% 50%
Materials 76% 59% 34%
Telecommunication Services 100% 100% 100%
Utilities 100% 92% 90%
ALL 78% 68% 54%
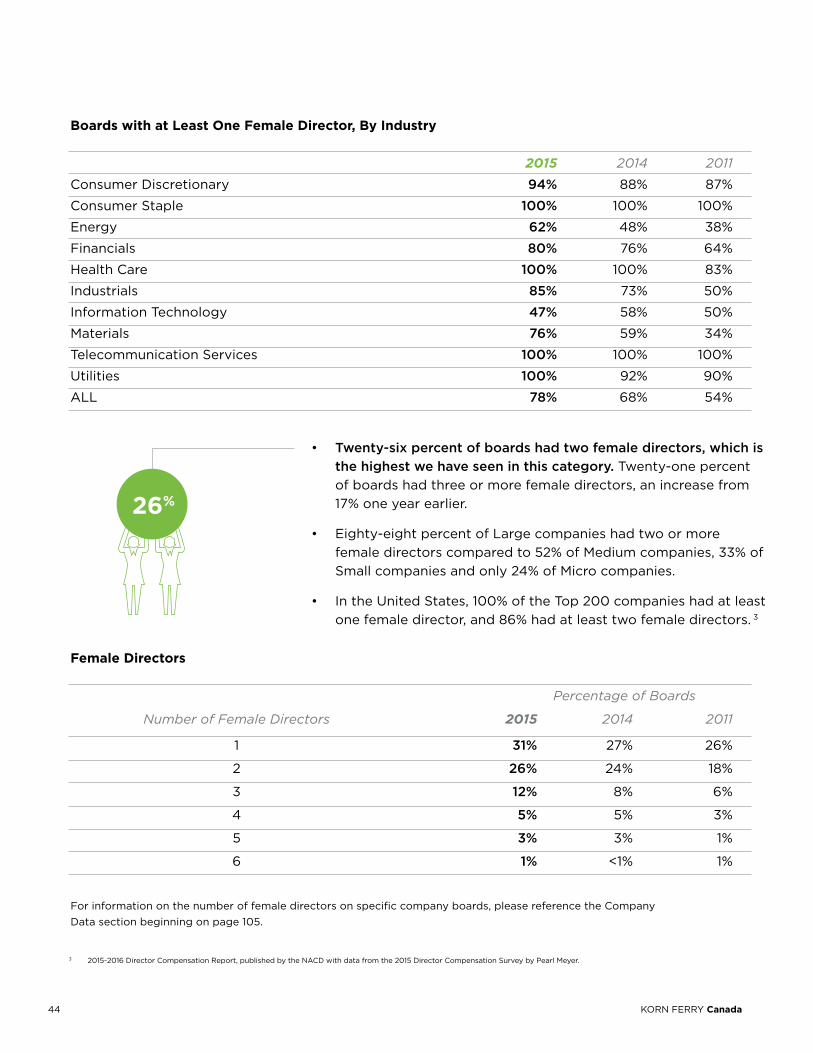
• Twenty-six percent of boards had two female directors, which is the highest we have seen in this category. Twenty-one percent of boards had three or more female directors, an increase from 17% one year earlier.
• Eighty-eightpercentofLargecompanieshadtwoormorefemale directors compared to 52% of Medium companies, 33% of Small companies and only 24% of Micro companies.
• IntheUnitedStates,100%oftheTop200companieshadatleastone female director, and 86% had at least two female directors. 3
3 2015-2016 Director Compensation Report, published by the NACD with data from the 2015 Director Compensation Survey by Pearl Meyer.
Female directors
Percentage of Boards
Number of Female Directors 2015 2014 2011
1 31% 27% 26%
2 26% 24% 18%
3 12% 8% 6%
4 5% 5% 3%
5 3% 3% 1%
6 1% <1% 1%
For information on the number of female directors on specific company boards, please reference the Company Data section beginning on page 105.
26%
452016 Corporate Board GovernanCe and direCtor Compensation report
Diversity Policies
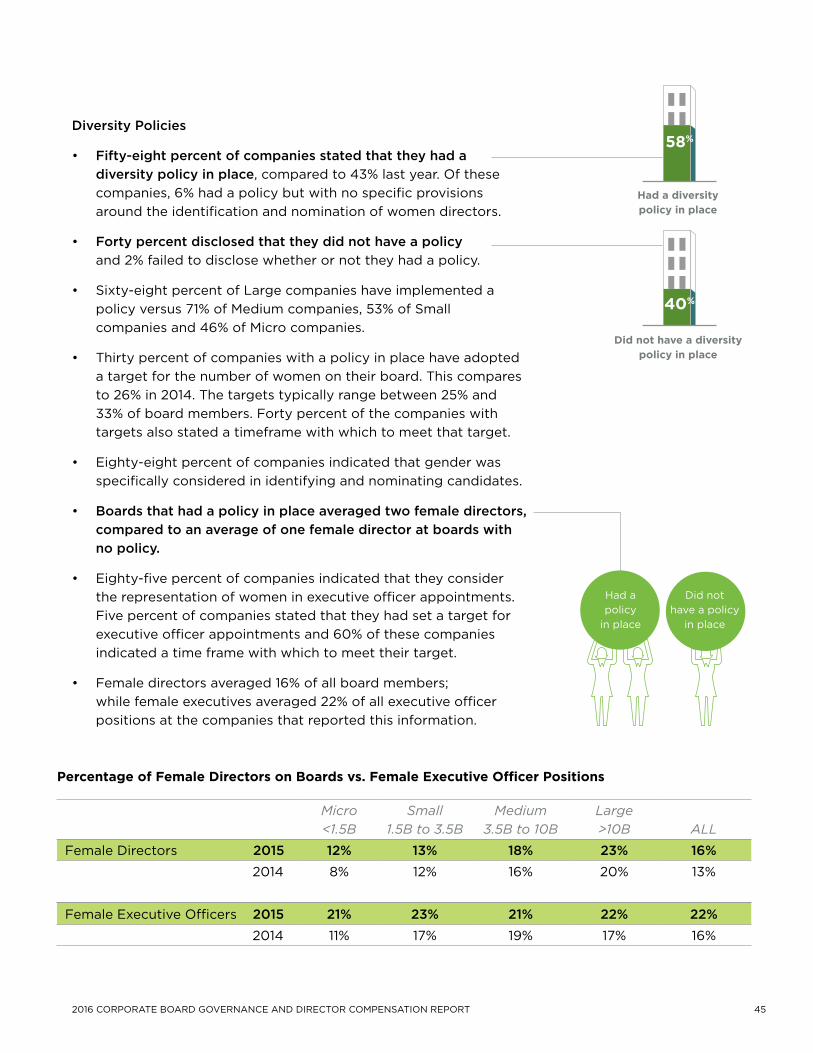
• Fifty-eight percent of companies stated that they had a diversity policy in place, compared to 43% last year. Of these companies, 6% had a policy but with no specific provisions around the identification and nomination of women directors.
• Forty percent disclosed that they did not have a policy and 2% failed to disclose whether or not they had a policy.
• Sixty-eightpercentofLargecompanieshaveimplementedapolicy versus 71% of Medium companies, 53% of Small companies and 46% of Micro companies.
• Thirtypercentofcompanieswithapolicyinplacehaveadopteda target for the number of women on their board. This compares to 26% in 2014. The targets typically range between 25% and 33% of board members. Forty percent of the companies with targets also stated a timeframe with which to meet that target.
• Eighty-eightpercentofcompaniesindicatedthatgenderwasspecifically considered in identifying and nominating candidates.
• Boards that had a policy in place averaged two female directors, compared to an average of one female director at boards with no policy.
• Eighty-fivepercentofcompaniesindicatedthattheyconsiderthe representation of women in executive officer appointments. Five percent of companies stated that they had set a target for executive officer appointments and 60% of these companies indicated a time frame with which to meet their target.
• Femaledirectorsaveraged16%ofallboardmembers; while female executives averaged 22% of all executive officer positions at the companies that reported this information.
Had a policy
in place
Did not have a policy
in place
Female Executive Officers 2015 21% 23% 21% 22% 22% 2014 11% 17% 19% 17% 16%
Percentage of Female directors on Boards vs. Female Executive officer Positions
Micro <1.5B
Small 1.5B to 3.5B
Medium 3.5B to 10B
Large >10B ALL
Female Directors 2015 12% 13% 18% 23% 16% 2014 8% 12% 16% 20% 13%
had a diversity policy in place
did not have a diversity policy in place
58%
40%
46 KORN FERRY Canada
BoardSize
472016 Corporate Board GovernanCe and direCtor Compensation report
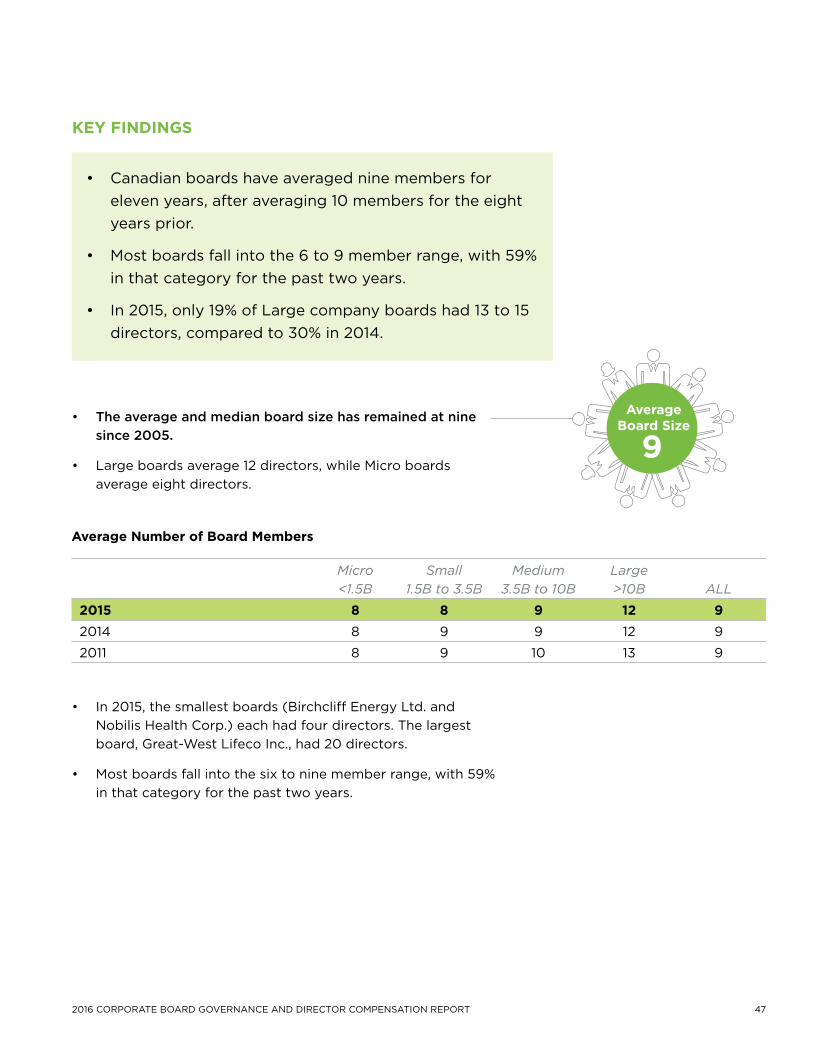
• The average and median board size has remained at nine since 2005.
• Largeboardsaverage12directors,whileMicroboardsaverage eight directors.
Average number of Board Members
Micro <1.5B
Small 1.5B to 3.5B
Medium 3.5B to 10B
Large >10B ALL
2015 8 8 9 12 9 2014 8 9 9 12 9
2011 8 9 10 13 9
• In2015,thesmallestboards(BirchcliffEnergyLtd.andNobilisHealthCorp.)eachhadfourdirectors.Thelargestboard, Great-West Lifeco Inc., had 20 directors.
• Mostboardsfallintothesixtoninememberrange,with59%in that category for the past two years.
9Average
Board Size
• Canadianboardshaveaveragedninemembersforeleven years, after averaging 10 members for the eight years prior.
• Mostboardsfallintothe6to9memberrange,with59%in that category for the past two years.
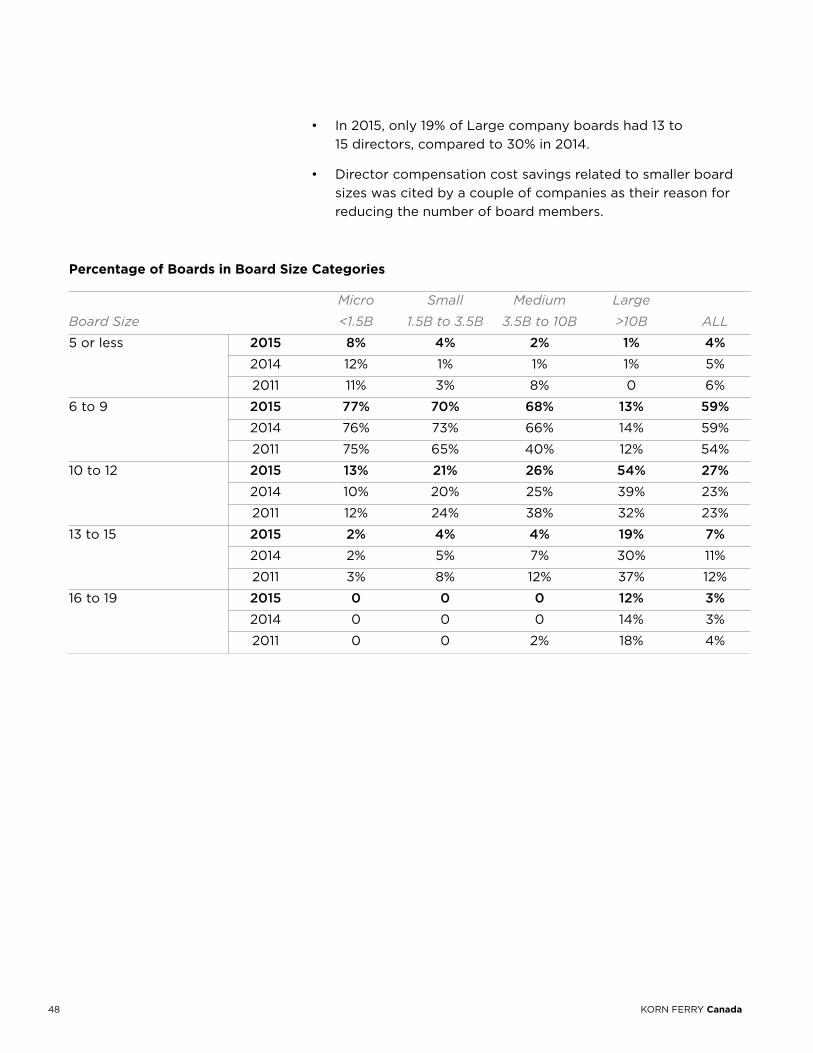
• In2015,only19%ofLargecompanyboardshad13to15directors, compared to 30% in 2014.
kEy FIndInGS
48 KORN FERRY Canada
Percentage of Boards in Board Size Categories
Micro Small Medium Large
Board Size <1.5B 1.5B to 3.5B 3.5B to 10B >10B ALL 5 or less 2015 8% 4% 2% 1% 4% 2014 12% 1% 1% 1% 5%
2011 11% 3% 8% 0 6%
6 to 9 2015 77% 70% 68% 13% 59% 2014 76% 73% 66% 14% 59%
2011 75% 65% 40% 12% 54%
10 to 12 2015 13% 21% 26% 54% 27% 2014 10% 20% 25% 39% 23%
2011 12% 24% 38% 32% 23%
13 to 15 2015 2% 4% 4% 19% 7% 2014 2% 5% 7% 30% 11%
2011 3% 8% 12% 37% 12%
16 to 19 2015 0 0 0 12% 3% 2014 0 0 0 14% 3%
2011 0 0 2% 18% 4%
• In2015,only19%ofLargecompanyboardshad13to 15 directors, compared to 30% in 2014.
• Directorcompensationcostsavingsrelatedtosmallerboardsizes was cited by a couple of companies as their reason for reducing the number of board members.
492016 Corporate Board GovernanCe and direCtor Compensation report
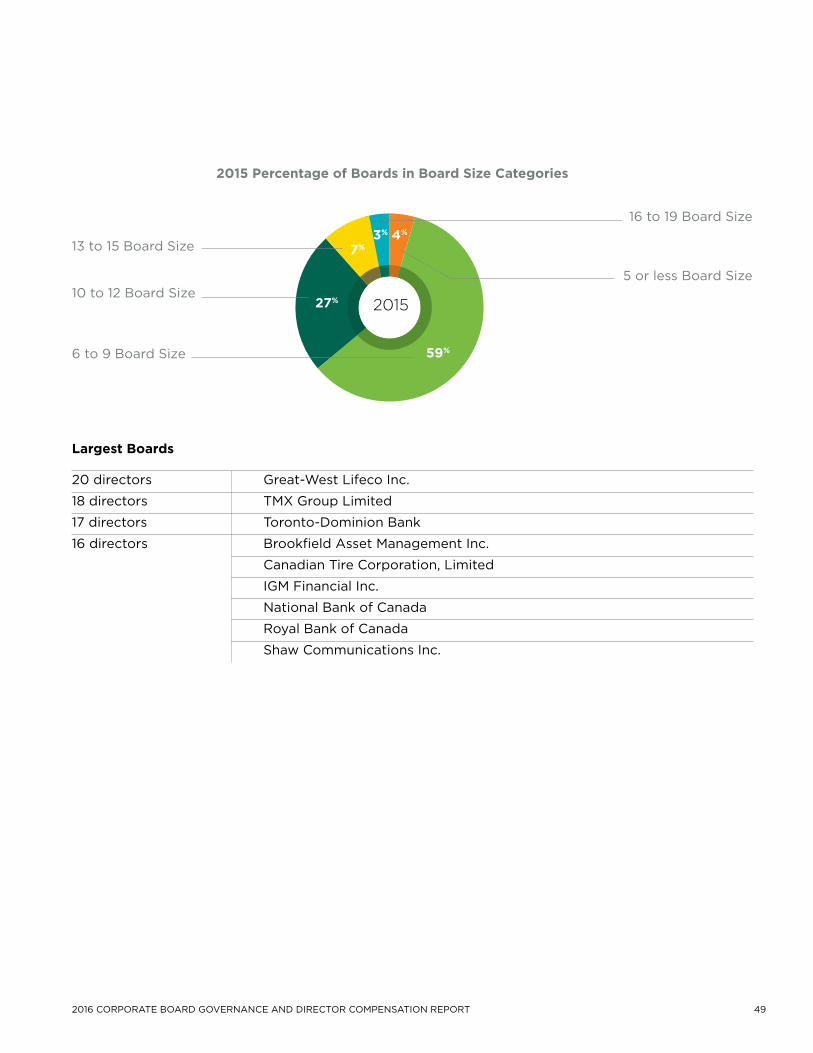
2015
5 or less Board Size
16 to 19 Board Size
6 to 9 Board Size
10 to 12 Board Size
13 to 15 Board Size
59%
7%3% 4%
27%
2015 Percentage of Boards in Board Size Categories
Largest Boards
20 directors Great-West Lifeco Inc.
18 directors TMx Group Limited
17 directors Toronto-Dominion Bank
16 directors Brookfield Asset Management Inc.
Canadian Tire Corporation, Limited
IGM Financial Inc.
National Bank of Canada
Royal Bank of Canada
Shaw Communications Inc.
50 KORN FERRY Canada
Board Assessments, director Selection and director development
512016 Corporate Board GovernanCe and direCtor Compensation report
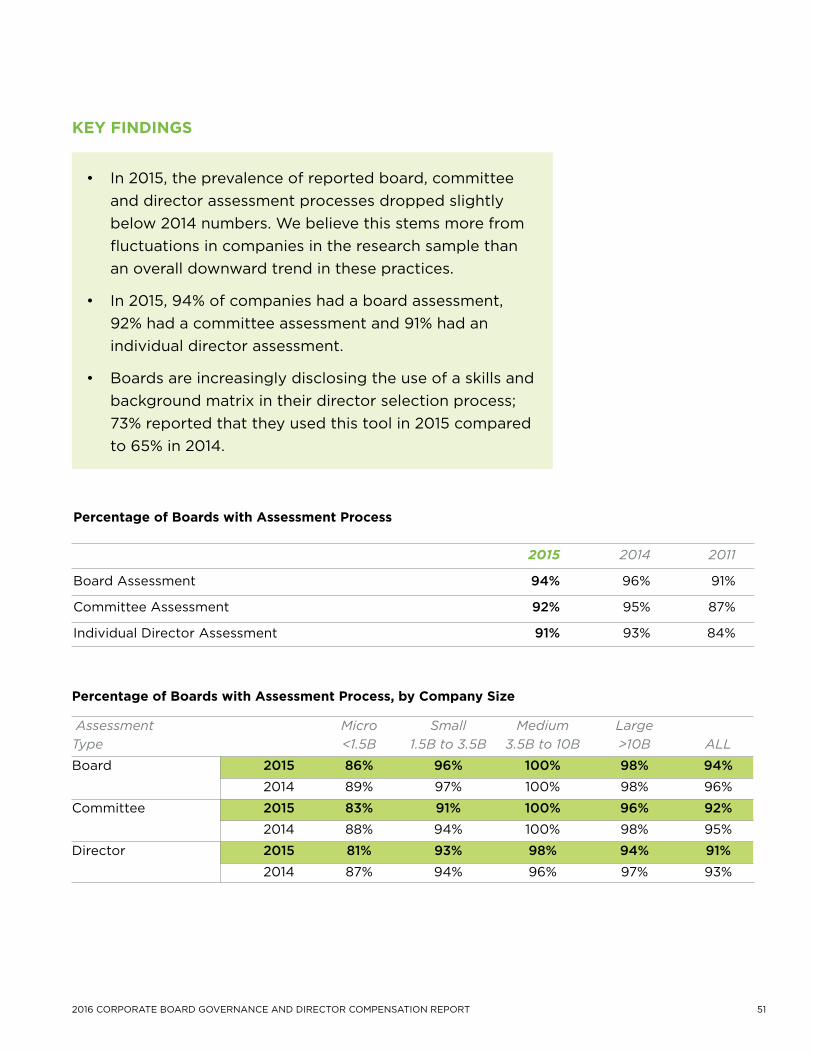
Percentage of Boards with Assessment Process
2015 2014 2011
Board Assessment 94% 96% 91%
Committee Assessment 92% 95% 87%
Individual Director Assessment 91% 93% 84%
Percentage of Boards with Assessment Process, by Company Size
Assessment Micro Small Medium Large Type <1.5B 1.5B to 3.5B 3.5B to 10B >10B ALL
Board 2015 86% 96% 100% 98% 94% 2014 89% 97% 100% 98% 96%
Committee 2015 83% 91% 100% 96% 92% 2014 88% 94% 100% 98% 95%
Director 2015 81% 93% 98% 94% 91% 2014 87% 94% 96% 97% 93%
• In2015,theprevalenceofreportedboard,committeeand director assessment processes dropped slightly below 2014 numbers. We believe this stems more from fluctuations in companies in the research sample than an overall downward trend in these practices.
• In2015,94%ofcompanieshadaboardassessment,92% had a committee assessment and 91% had an individual director assessment.
• Boardsareincreasinglydisclosingtheuseofaskillsandbackground matrix in their director selection process; 73% reported that they used this tool in 2015 compared to 65% in 2014.
kEy FIndInGS
52 KORN FERRY Canada
Assessment Practices
• In2015,theprevalenceofreportedboard,committeeanddirector assessment processes dropped slightly below 2014 numbers. We believe this stems more from fluctuations in companies in the research sample than an overall downward trend in these practices.
• BoardChairandLeadDirectorAssessment
* Of the boards that report a chair assessment practice (whichisnotmandatorydisclosure),31%areatLarge companies and 30% are at Medium companies.
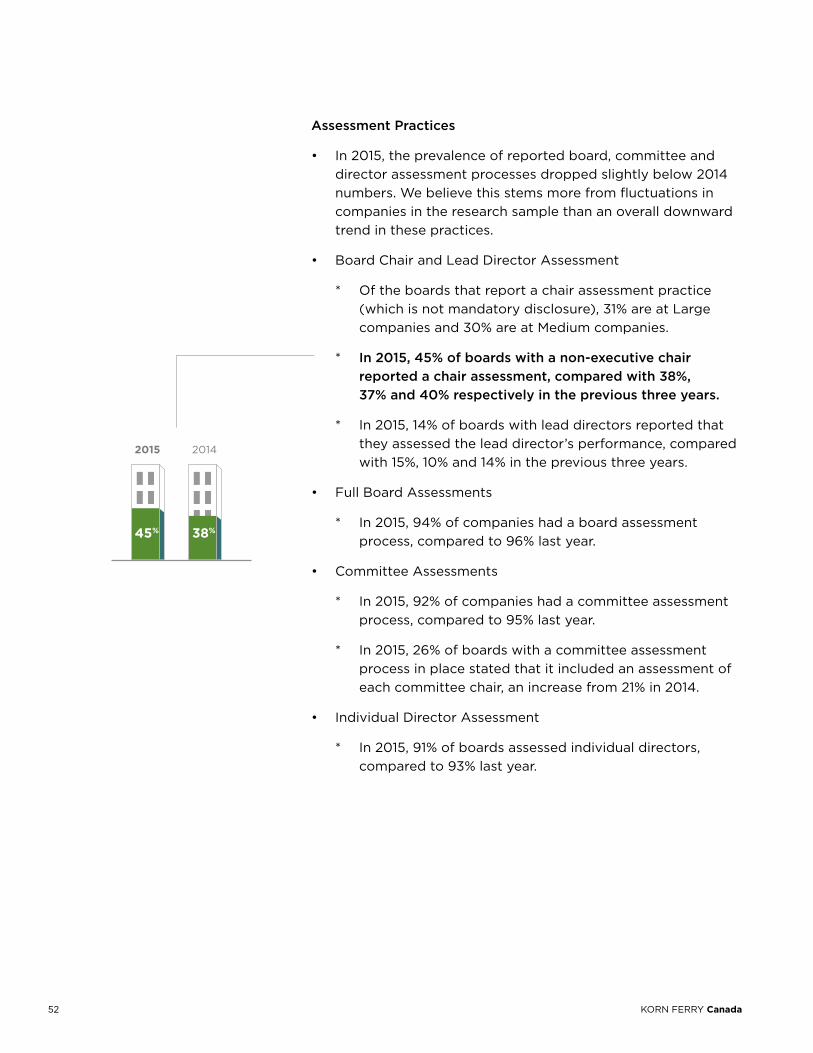
* In 2015, 45% of boards with a non-executive chair reported a chair assessment, compared with 38%, 37% and 40% respectively in the previous three years.
* In 2015, 14% of boards with lead directors reported that they assessed the lead director’s performance, compared with 15%, 10% and 14% in the previous three years.
• FullBoardAssessments
* In 2015, 94% of companies had a board assessment process, compared to 96% last year.
• CommitteeAssessments
* In 2015, 92% of companies had a committee assessment process, compared to 95% last year.
* In 2015, 26% of boards with a committee assessment process in place stated that it included an assessment of each committee chair, an increase from 21% in 2014.
• IndividualDirectorAssessment
* In 2015, 91% of boards assessed individual directors, compared to 93% last year.
2015 2014
45% 38%
532016 Corporate Board GovernanCe and direCtor Compensation report
• AssessmentMethodology
* Of those companies that conducted a full board, committee or individual assessment in 2015, 89% described the process they used. Between 81% and 89% of companies have disclosed their assessment methodology for the past seven years.
* There were fluctuations in reported assessment methods, whichwebelieveisaffectedbybothchangesin composition in the companies in the research sample, and boards changing approaches periodically to meet their needs at the time they are implementing their assessment processes.
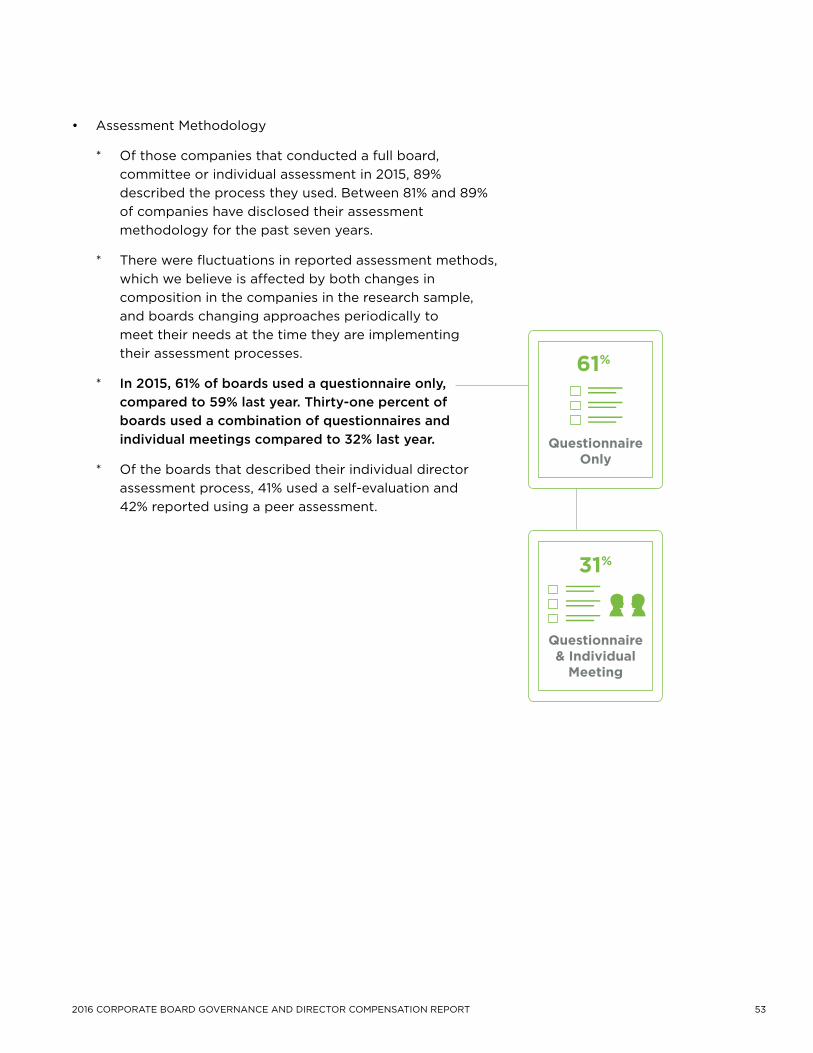
* In 2015, 61% of boards used a questionnaire only, compared to 59% last year. Thirty-one percent of boards used a combination of questionnaires and individual meetings compared to 32% last year.
* Of the boards that described their individual director assessment process, 41% used a self-evaluation and 42% reported using a peer assessment.
61%
31%
Questionnaireonly
Questionnaire& Individual
Meeting
54 KORN FERRY Canada
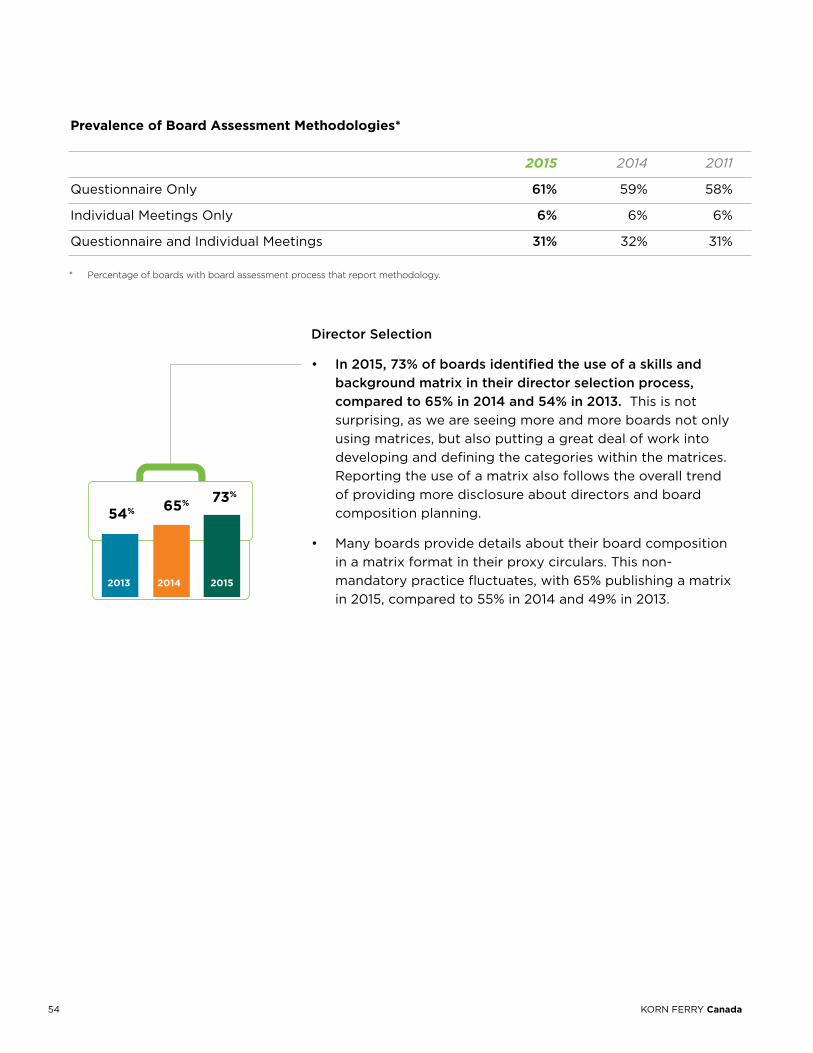
Director Selection
• In 2015, 73% of boards identified the use of a skills and background matrix in their director selection process, compared to 65% in 2014 and 54% in 2013. This is not surprising, as we are seeing more and more boards not only using matrices, but also putting a great deal of work into developing and defining the categories within the matrices. Reporting the use of a matrix also follows the overall trend of providing more disclosure about directors and board composition planning.
• Manyboardsprovidedetailsabouttheirboardcompositionin a matrix format in their proxy circulars. This non-mandatory practice fluctuates, with 65% publishing a matrix in 2015, compared to 55% in 2014 and 49% in 2013.
* Percentageofboardswithboardassessmentprocessthatreportmethodology.
Prevalence of Board Assessment Methodologies*
2015 2014 2011
Questionnaire Only 61% 59% 58%
Individual Meetings Only 6% 6% 6%
Questionnaire and Individual Meetings 31% 32% 31%
201520142013
73%65%
54%
552016 Corporate Board GovernanCe and direCtor Compensation report
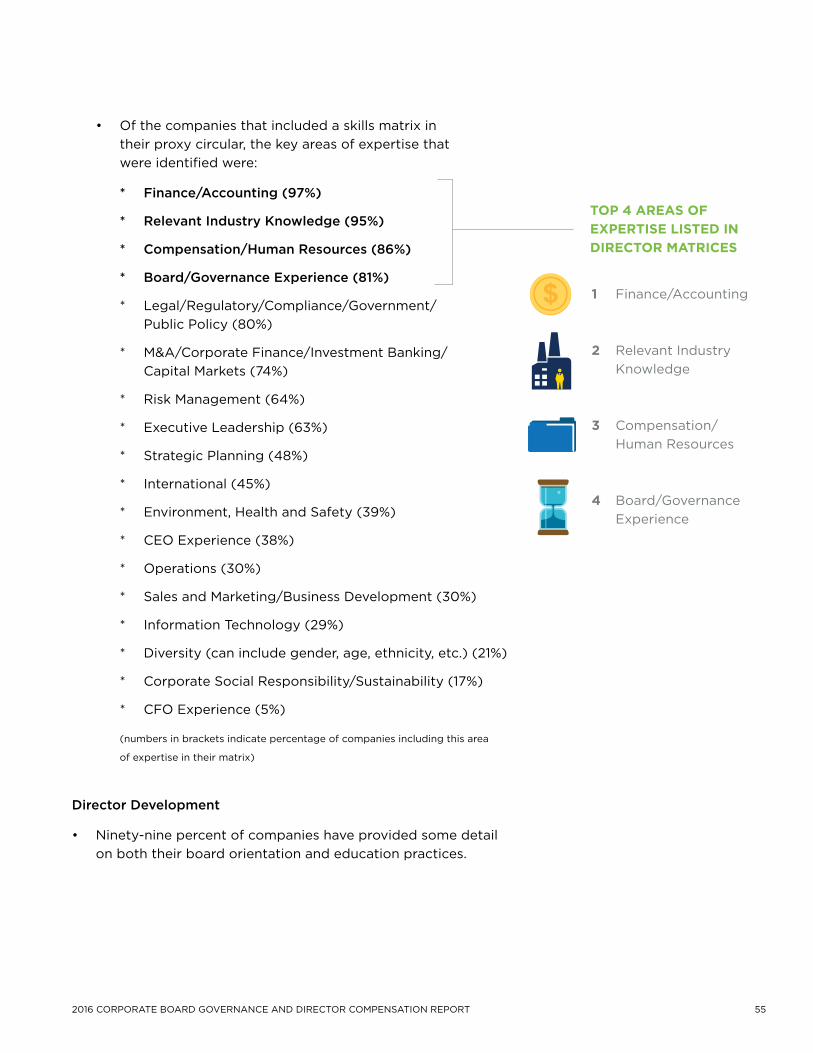
• Ofthecompaniesthatincludedaskillsmatrixin their proxy circular, the key areas of expertise that were identified were:
* Finance/Accounting (97%)
* Relevant Industry Knowledge (95%)
* Compensation/Human Resources (86%)
* Board/Governance Experience (81%)
* Legal/Regulatory/Compliance/Government/ PublicPolicy(80%)
* M&A/Corporate Finance/Investment Banking/ CapitalMarkets(74%)
* RiskManagement(64%)
* ExecutiveLeadership(63%)
* StrategicPlanning(48%)
* International(45%)
* Environment,HealthandSafety(39%)
* CEOExperience(38%)
* Operations(30%)
* SalesandMarketing/BusinessDevelopment(30%)
* InformationTechnology(29%)
* Diversity(canincludegender,age,ethnicity,etc.)(21%)
* CorporateSocialResponsibility/Sustainability(17%)
* CFOExperience(5%)
(numbersinbracketsindicatepercentageofcompaniesincludingthisarea
ofexpertiseintheirmatrix)
Director Development
• Ninety-ninepercentofcompanieshaveprovidedsomedetailon both their board orientation and education practices.
1 Finance/Accounting
2 Relevant Industry Knowledge
3 Compensation/Human Resources
4 Board/Governance Experience
ToP 4 AREAS oF ExPERTISE LISTEd In dIRECToR MATRICES

56 KORN FERRY Canada
Meetings and Attendance
572016 Corporate Board GovernanCe and direCtor Compensation report
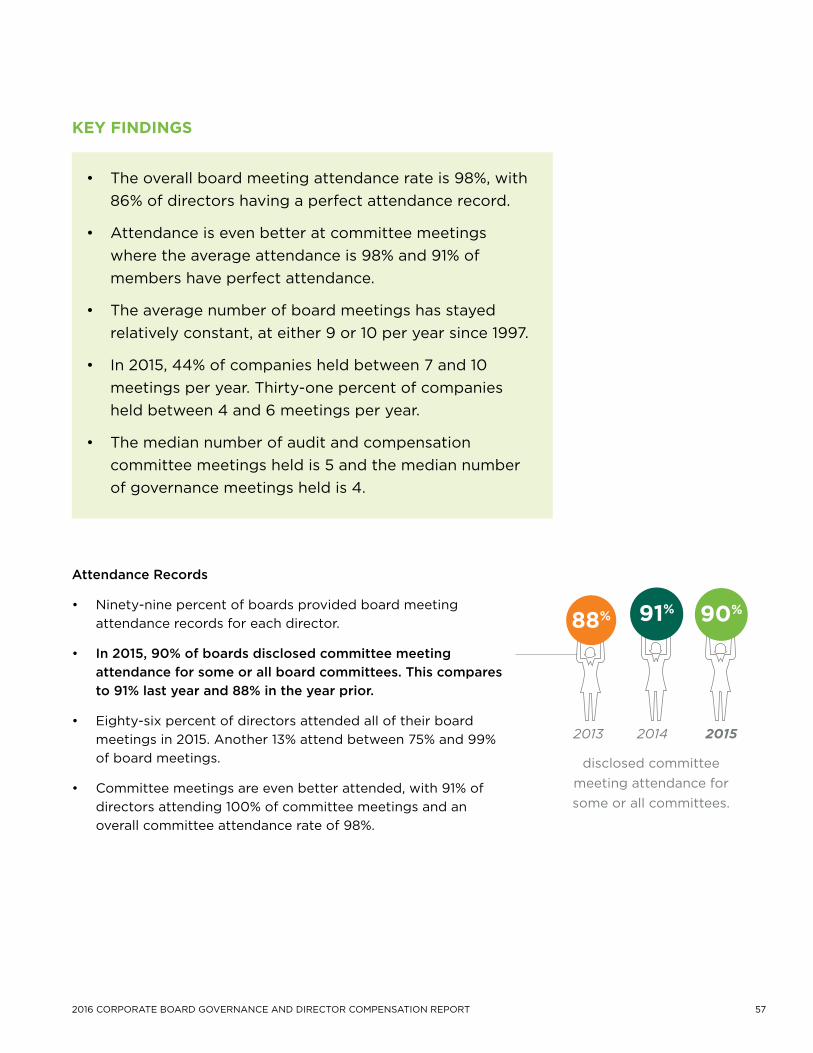
Attendance Records
• Ninety-ninepercentofboardsprovidedboardmeetingattendance records for each director.
• In 2015, 90% of boards disclosed committee meeting attendance for some or all board committees. This compares to 91% last year and 88% in the year prior.
• Eighty-sixpercentofdirectorsattendedalloftheirboardmeetings in 2015. Another 13% attend between 75% and 99% of board meetings.
• Committeemeetingsareevenbetterattended,with91%ofdirectors attending 100% of committee meetings and an overall committee attendance rate of 98%.
90%91%88%
2013 2014 2015
disclosed committee meeting attendance for some or all committees.
• Theoverallboardmeetingattendancerateis98%,with86% of directors having a perfect attendance record.
• Attendanceisevenbetteratcommitteemeetingswhere the average attendance is 98% and 91% of members have perfect attendance.
• Theaveragenumberofboardmeetingshasstayedrelatively constant, at either 9 or 10 per year since 1997.
• In2015,44%ofcompaniesheldbetween7and10meetings per year. Thirty-one percent of companies held between 4 and 6 meetings per year.
• Themediannumberofauditandcompensationcommittee meetings held is 5 and the median number of governance meetings held is 4.
kEy FIndInGS
58 KORN FERRY Canada
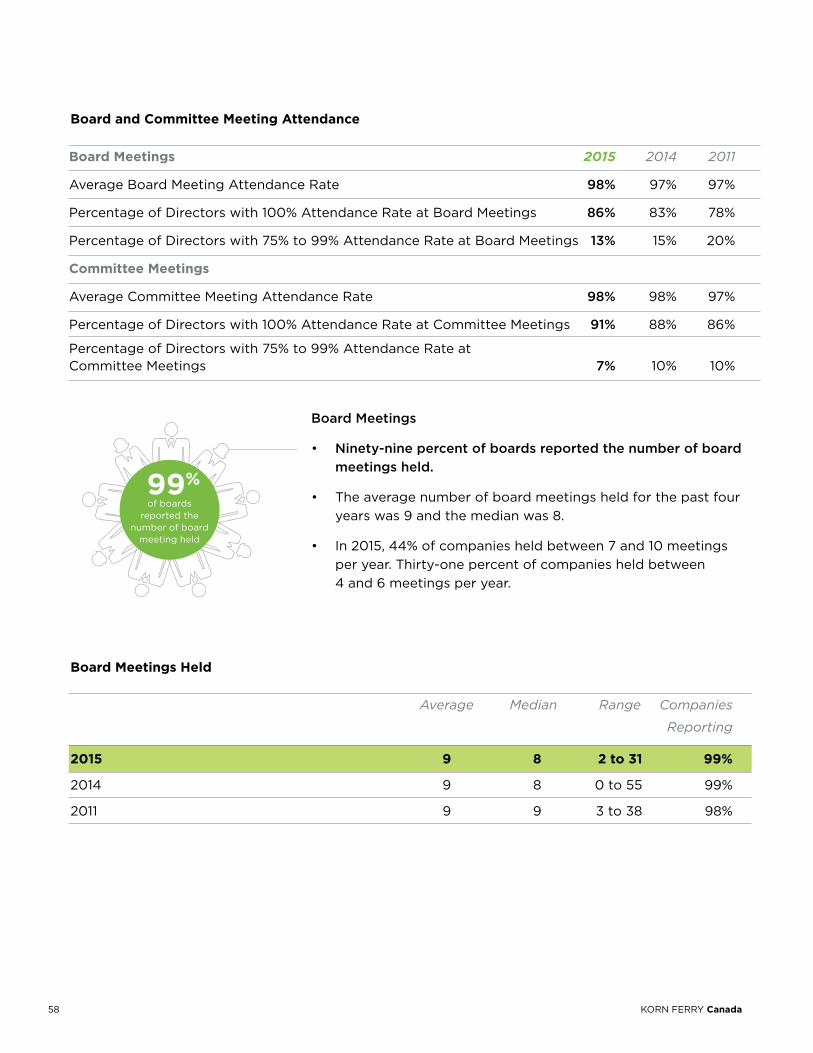
Board and Committee Meeting Attendance
Board Meetings 2015 2014 2011
Average Board Meeting Attendance Rate 98% 97% 97%
Percentage of Directors with 100% Attendance Rate at Board Meetings 86% 83% 78%
Percentage of Directors with 75% to 99% Attendance Rate at Board Meetings 13% 15% 20%
Committee Meetings
Average Committee Meeting Attendance Rate 98% 98% 97%
Percentage of Directors with 100% Attendance Rate at Committee Meetings 91% 88% 86%
Percentage of Directors with 75% to 99% Attendance Rate at Committee Meetings 7% 10% 10%
Board Meetings
• Ninety-nine percent of boards reported the number of board meetings held.
• Theaveragenumberofboardmeetingsheldforthepastfouryears was 9 and the median was 8.
• In2015,44%ofcompaniesheldbetween7and10meetingsper year. Thirty-one percent of companies held between 4 and 6 meetings per year.
Board Meetings held
Average Median Range Companies
Reporting
2015 9 8 2 to 31 99%
2014 9 8 0 to 55 99%
2011 9 9 3 to 38 98%
99%of boards
reported thenumber of board
meeting held
592016 Corporate Board GovernanCe and direCtor Compensation report
* Percentagesarebasedonlyonthoseboardsthatdisclosedmeetingfrequency.
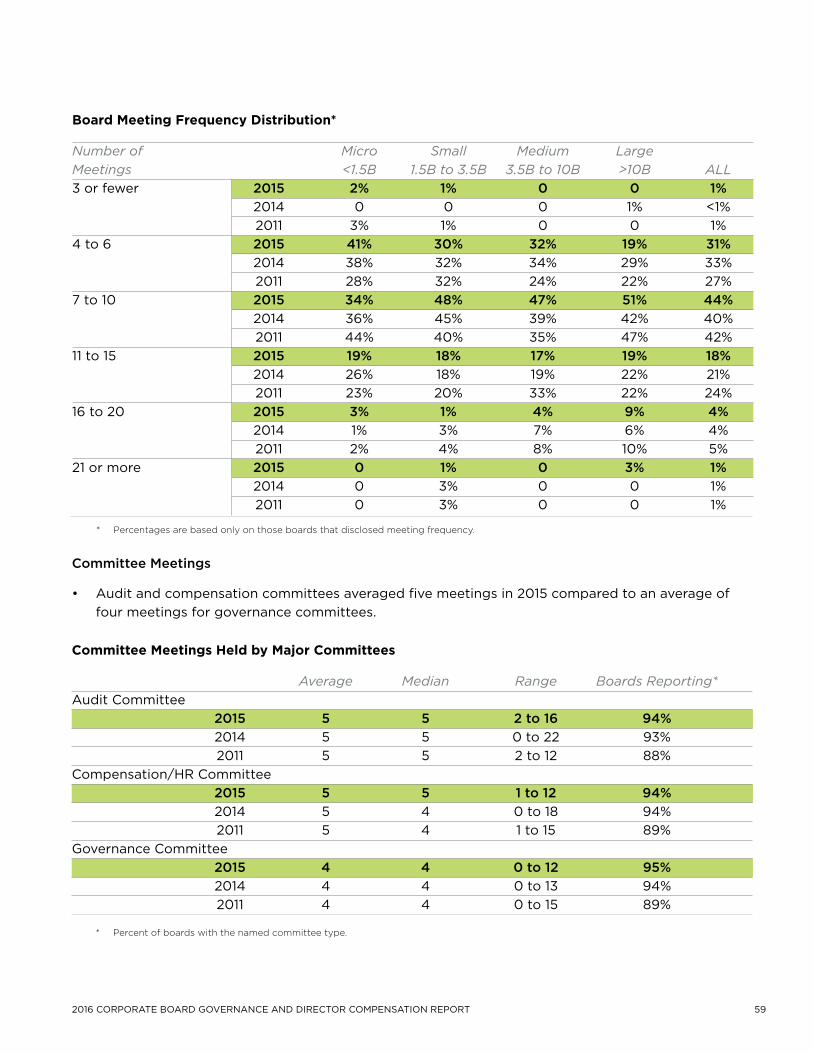
Board Meeting Frequency distribution*
Number of Micro Small Medium Large Meetings <1.5B 1.5B to 3.5B 3.5B to 10B >10B ALL 3 or fewer 2015 2% 1% 0 0 1% 2014 0 0 0 1% <1% 2011 3% 1% 0 0 1%4 to 6 2015 41% 30% 32% 19% 31% 2014 38% 32% 34% 29% 33% 2011 28% 32% 24% 22% 27%7 to 10 2015 34% 48% 47% 51% 44% 2014 36% 45% 39% 42% 40% 2011 44% 40% 35% 47% 42%11 to 15 2015 19% 18% 17% 19% 18% 2014 26% 18% 19% 22% 21% 2011 23% 20% 33% 22% 24%16 to 20 2015 3% 1% 4% 9% 4% 2014 1% 3% 7% 6% 4% 2011 2% 4% 8% 10% 5%21 or more 2015 0 1% 0 3% 1% 2014 0 3% 0 0 1% 2011 0 3% 0 0 1%
Committee Meetings
• Auditandcompensationcommitteesaveragedfivemeetingsin2015comparedtoanaverageoffour meetings for governance committees.
* Percentofboardswiththenamedcommitteetype.
Committee Meetings held by Major Committees
Average Median Range Boards Reporting* Audit Committee 2015 5 5 2 to 16 94% 2014 5 5 0 to 22 93% 2011 5 5 2 to 12 88%Compensation/HR Committee 2015 5 5 1 to 12 94% 2014 5 4 0 to 18 94% 2011 5 4 1 to 15 89%Governance Committee 2015 4 4 0 to 12 95% 2014 4 4 0 to 13 94% 2011 4 4 0 to 15 89%
60 KORN FERRY Canada
Board Committees
612016 Corporate Board GovernanCe and direCtor Compensation report
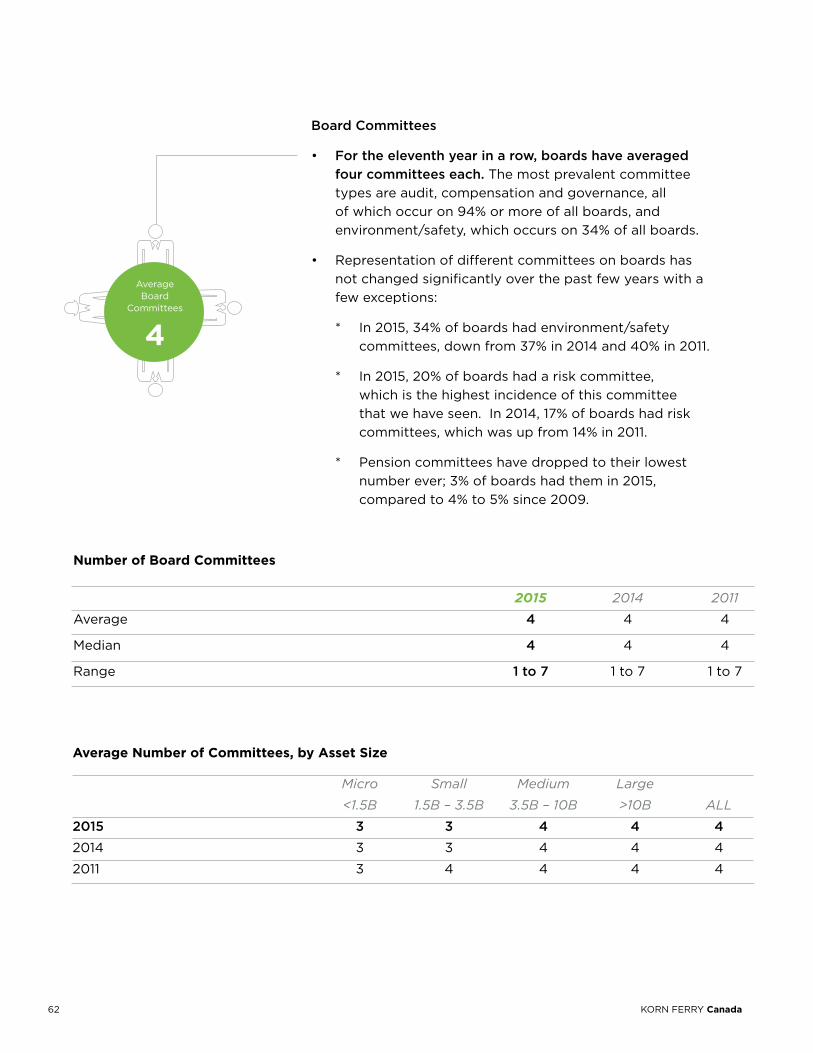
• Forthepastelevenyears,boardshaveaveraged four committees.
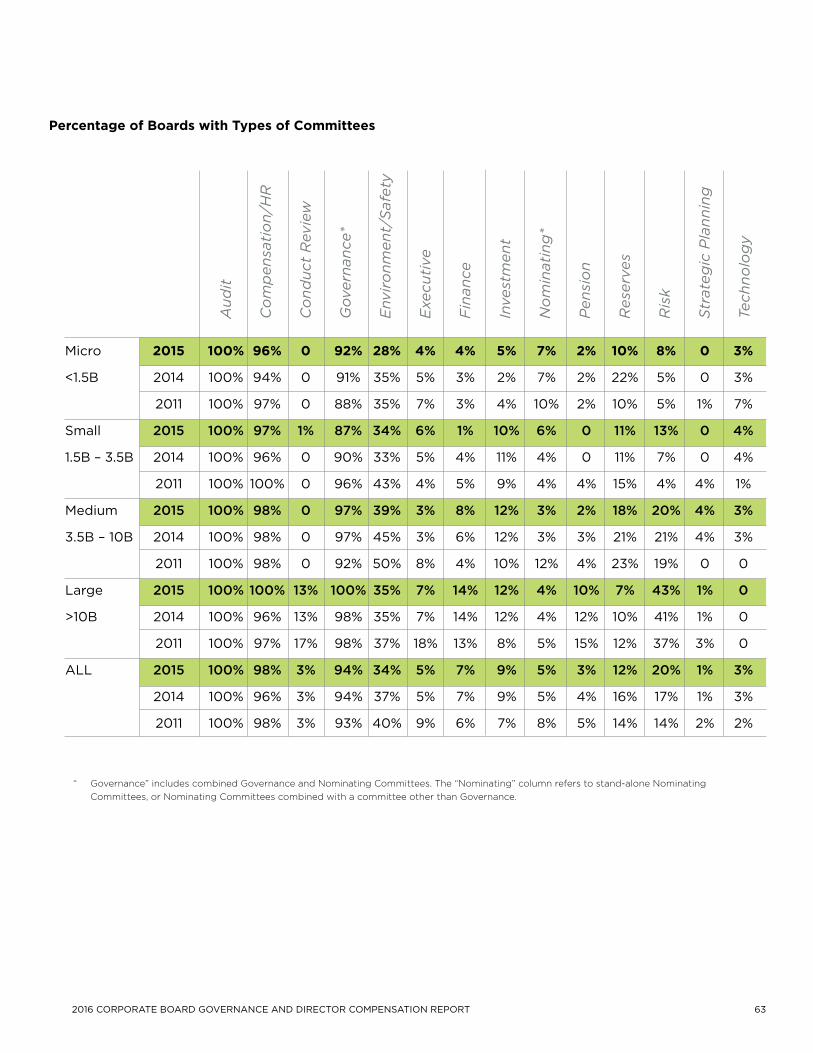
• Themostprevalentcommitteetypesareaudit,compensation and governance, which occur respectively on 100%, 98% and 94% of boards; followed by environment/safety, which occur on 34% of all boards.
• In2015,20%ofboardshadariskcommittee,whichisthe highest incidence of this committee we have seen.
• In2015,95%ofindependentdirectorshadatleastonecommittee membership.
• Independentdirectorsaveragedtwocommittees each and non-independent directors averaged one committee each if they were outside directors, or zero committees each if they were inside directors.
kEy FIndInGS
62 KORN FERRY Canada
number of Board Committees
2015 2014 2011
Average 4 4 4
Median 4 4 4
Range 1 to 7 1 to 7 1 to 7
Average number of Committees, by Asset Size
Micro Small Medium Large
<1.5B 1.5B – 3.5B 3.5B – 10B >10B ALL
2015 3 3 4 4 42014 3 3 4 4 4
2011 3 4 4 4 4
Board Committees
• For the eleventh year in a row, boards have averaged four committees each. The most prevalent committee types are audit, compensation and governance, all of which occur on 94% or more of all boards, and environment/safety, which occurs on 34% of all boards.
• Representationofdifferentcommitteesonboardshasnot changed significantly over the past few years with a few exceptions:
* In 2015, 34% of boards had environment/safety committees, down from 37% in 2014 and 40% in 2011.
* In 2015, 20% of boards had a risk committee, which is the highest incidence of this committee that we have seen. In 2014, 17% of boards had risk committees, which was up from 14% in 2011.
* Pension committees have dropped to their lowest number ever; 3% of boards had them in 2015, compared to 4% to 5% since 2009.
4
AverageBoard
Committees
632016 Corporate Board GovernanCe and direCtor Compensation report
“ Governance”includescombinedGovernanceandNominatingCommittees.The“Nominating”columnreferstostand-aloneNominating Committees,orNominatingCommitteescombinedwithacommitteeotherthanGovernance.
Aud
it
Co
mp
ensa
tio
n/H
R
Co
nduc
t R
evie
w
Gov
erna
nce*
Env
iro
nmen
t/S
afet
y
Exe
cuti
ve
Fin
ance
Inve
stm
ent
No
min
atin
g*
Pen
sio
n
Res
erve
s
Ris
k
Str
ateg
ic P
lann
ing
Tech
nolo
gy
Micro 2015 100% 96% 0 92% 28% 4% 4% 5% 7% 2% 10% 8% 0 3%
<1.5B 2014 100% 94% 0 91% 35% 5% 3% 2% 7% 2% 22% 5% 0 3%
2011 100% 97% 0 88% 35% 7% 3% 4% 10% 2% 10% 5% 1% 7%
Small 2015 100% 97% 1% 87% 34% 6% 1% 10% 6% 0 11% 13% 0 4%
1.5B – 3.5B 2014 100% 96% 0 90% 33% 5% 4% 11% 4% 0 11% 7% 0 4%
2011 100% 100% 0 96% 43% 4% 5% 9% 4% 4% 15% 4% 4% 1%
Medium 2015 100% 98% 0 97% 39% 3% 8% 12% 3% 2% 18% 20% 4% 3%
3.5B – 10B 2014 100% 98% 0 97% 45% 3% 6% 12% 3% 3% 21% 21% 4% 3%
2011 100% 98% 0 92% 50% 8% 4% 10% 12% 4% 23% 19% 0 0
Large 2015 100% 100% 13% 100% 35% 7% 14% 12% 4% 10% 7% 43% 1% 0
>10B 2014 100% 96% 13% 98% 35% 7% 14% 12% 4% 12% 10% 41% 1% 0
2011 100% 97% 17% 98% 37% 18% 13% 8% 5% 15% 12% 37% 3% 0
ALL 2015 100% 98% 3% 94% 34% 5% 7% 9% 5% 3% 12% 20% 1% 3%
2014 100% 96% 3% 94% 37% 5% 7% 9% 5% 4% 16% 17% 1% 3%
2011 100% 98% 3% 93% 40% 9% 6% 7% 8% 5% 14% 14% 2% 2%
Percentage of Boards with Types of Committees
64 KORN FERRY Canada
Independent directors averaged two committees
Non-Independent outside directors averaged
one committee
Committee Membership
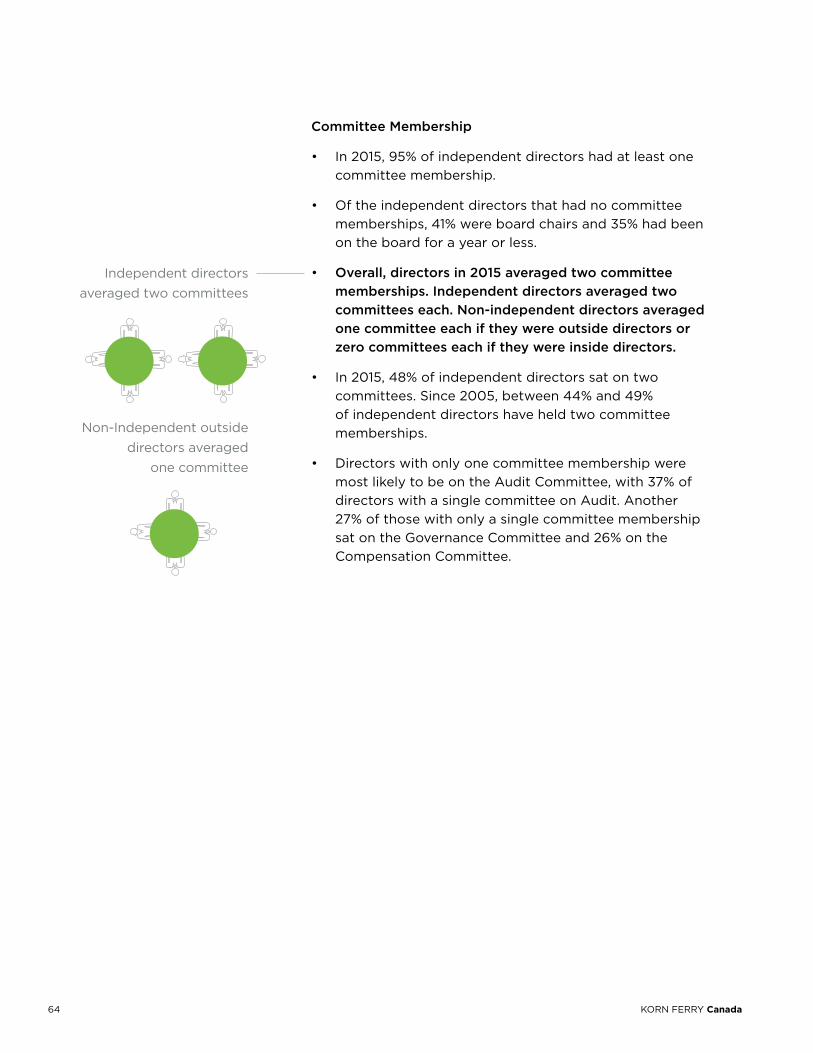
• In2015,95%ofindependentdirectorshadatleastonecommittee membership.
• Oftheindependentdirectorsthathadnocommitteememberships, 41% were board chairs and 35% had been on the board for a year or less.
• Overall, directors in 2015 averaged two committee memberships. Independent directors averaged two committees each. Non-independent directors averaged one committee each if they were outside directors or zero committees each if they were inside directors.
• In2015,48%ofindependentdirectorssatontwocommittees. Since 2005, between 44% and 49% of independent directors have held two committee memberships.
• Directorswithonlyonecommitteemembershipweremost likely to be on the Audit Committee, with 37% of directors with a single committee on Audit. Another 27% of those with only a single committee membership sat on the Governance Committee and 26% on the Compensation Committee.

652016 Corporate Board GovernanCe and direCtor Compensation report
Percentage of Percentage of Non- Percentage of Non- Independent Directors Independent (Inside) Directors Independent (Outside) Directors
2015 2014 2015 2014 2015 2014
0 5% 6% 80% 79% 46% 46%
1 29% 28% 17% 17% 34% 32%
2 48% 48% 2% 3% 12% 16%
3 14% 14% <1% 0 3% 2%
4 2% 3% <1% <1% 2% 3%
5 1% 1% 0 0 2% 0
Number of Committee Memberships
Percentage of directors with Committee Memberships
66 KORN FERRY Canada
director Compensation
672016 Corporate Board GovernanCe and direCtor Compensation report
Introduction
• Inordertothoroughlyaccountforthecompensationpaidtodirectors, we combine the cash amounts with values of shares, trustunitsorshare/trustunitequivalentssuchasdeferredshareunits. We refer collectively to all compensation in the form of shares,trustunitsorshare/trustunitequivalentsas“shares”or“sharecompensation”.
• In2015,41%ofcompanieschosearetainer-onlymethodof paying their directors, compared to 38% in 2014. This category has been growing steadily, with more boards paying directors solely with a retainer every year since 2001. Companies that recently moved to this method include Bank of Nova Scotia, Canadian National Railway Company and West Fraser Timber Co. Ltd.
• Thirtypercentofcompaniesthatpaysolelyaboardretainer paid a retainer valued at over $175,000 in 2015, compared to 25% in 2014 and 9% in 2011.
• In2015,theaverageretainerthatincludedsharesorshareequivalentswastwicethevalueoftheaverageretainerthat was cash-only or had a voluntary portion in shares or shareequivalents.Thiscomparestoadifferentialof130%for the previous two years and 120% in 2011.
• Despiteanoverallincreaseindirectorcompensation,many companies announced or implemented reductions. These were mostly in the energy sector and often accompanied by an explanation that the decrease was due to difficult market conditions.
• Themedianretaineratcompaniesthatdonotpayameeting fee was $129,871, and the median retainer at companies that do pay a meeting fee was $96,000.
kEy FIndInGS

68 KORN FERRY Canada
• Whereaboardhasnotgivenacashvalueofshareequivalents,wehavecalculatedbasedonthenumber of shares awarded and the fiscal year-end closing price.
• Wehavenotestimatedthevalueofstockoptions. However, we do report on the number of boards that grantstockoptionstodirectorsinthe“Stock-BasedCompensation”section,whichbeginsonpage94.
How are Directors Compensated?
• In 2015, 41% of companies chose a retainer-only option of paying their directors, compared to 38% in 2014.
• Thepracticeofpayingdirectorswitharetaineronly(nomeetingfees)hasbeengrowingsteadily,withmoreboardspaying directors solely with a retainer every year since 2001. Some of the companies that changed to retainer-only compensation in 2015 or announced it for 2016 include:
* Bank of Nova Scotia
* Canadian National Railway Company
* CGI Group Inc.
* EnCana Corporation
* First Capital Realty Inc.
* Intact Financial Corporation
* Just Energy Group Inc.
* Martinrea International Inc.
* Stantec Inc.
* Tourmaline Oil Corp.
* West Fraser Timber Co. Ltd.
• IntheUnitedStates,99%oftheTop200companiespayacash retainer, 97% provide directors with full value shares and 18% pay meeting fees. 4
• TheaverageretainerforCanadianboardsincreasedby13%at companies that paid only a retainer, compared to 2% at those that also paid a meeting fee. The average meeting fee at these companies also grew by 2% over last year.
Retainer-only option
of paying their directors.
41%38%
2015 2014
4 2015-2016 Director Compensation Report, published by the NACD with data from the 2015 Director Compensation Survey by Pearl Meyer.
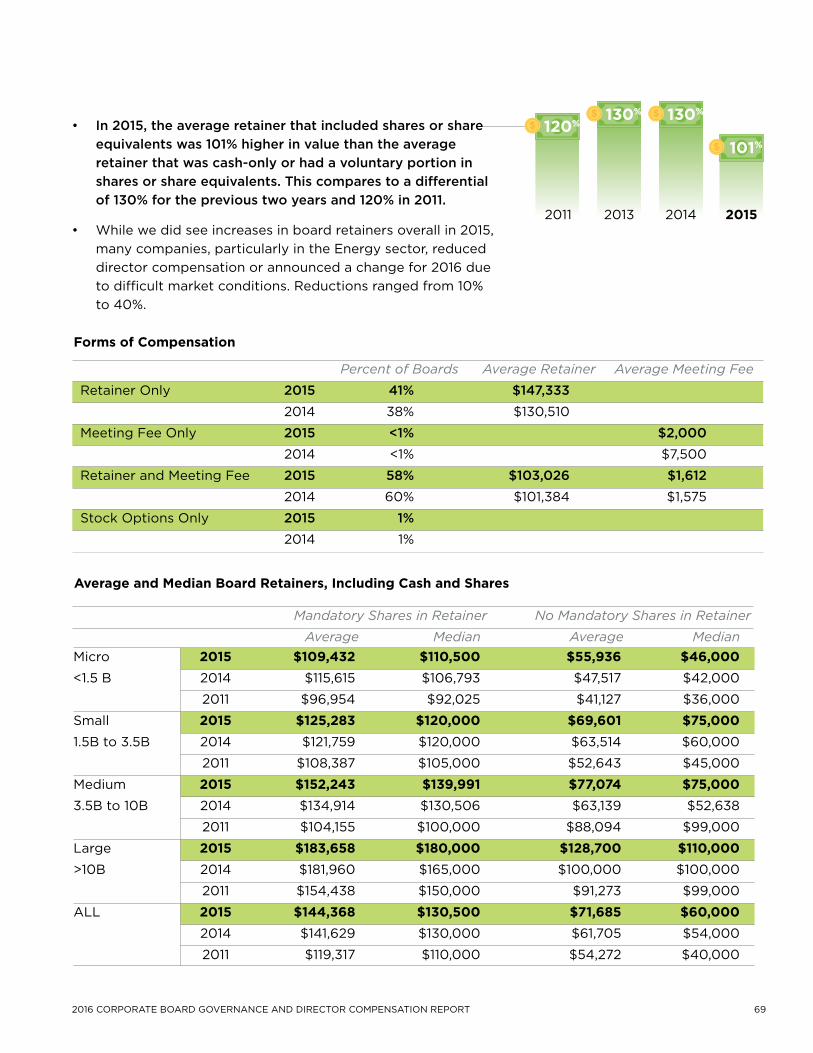
692016 Corporate Board GovernanCe and direCtor Compensation report
• In 2015, the average retainer that included shares or share equivalents was 101% higher in value than the average retainer that was cash-only or had a voluntary portion in shares or share equivalents. This compares to a differential of 130% for the previous two years and 120% in 2011.
• Whilewedidseeincreasesinboardretainersoverallin2015,many companies, particularly in the Energy sector, reduced director compensation or announced a change for 2016 due to difficult market conditions. Reductions ranged from 10% to 40%.
Forms of Compensation
Percent of Boards Average Retainer Average Meeting Fee
Retainer Only 2015 41% $147,333
2014 38% $130,510
Meeting Fee Only 2015 <1% $2,000 2014 <1% $7,500
Retainer and Meeting Fee 2015 58% $103,026 $1,612 2014 60% $101,384 $1,575
Stock Options Only 2015 1%
2014 1%
Average and Median Board Retainers, Including Cash and Shares
Mandatory Shares in Retainer No Mandatory Shares in Retainer
Average Median Average MedianMicro 2015 $109,432 $110,500 $55,936 $46,000<1.5B 2014 $115,615 $106,793 $47,517 $42,000
2011 $96,954 $92,025 $41,127 $36,000
Small 2015 $125,283 $120,000 $69,601 $75,0001.5B to 3.5B 2014 $121,759 $120,000 $63,514 $60,000
2011 $108,387 $105,000 $52,643 $45,000
Medium 2015 $152,243 $139,991 $77,074 $75,0003.5B to 10B 2014 $134,914 $130,506 $63,139 $52,638
2011 $104,155 $100,000 $88,094 $99,000
Large 2015 $183,658 $180,000 $128,700 $110,000>10B 2014 $181,960 $165,000 $100,000 $100,000
2011 $154,438 $150,000 $91,273 $99,000
ALL 2015 $144,368 $130,500 $71,685 $60,000 2014 $141,629 $130,000 $61,705 $54,000
2011 $119,317 $110,000 $54,272 $40,000
101%
130%130%
120%
20152013 20142011
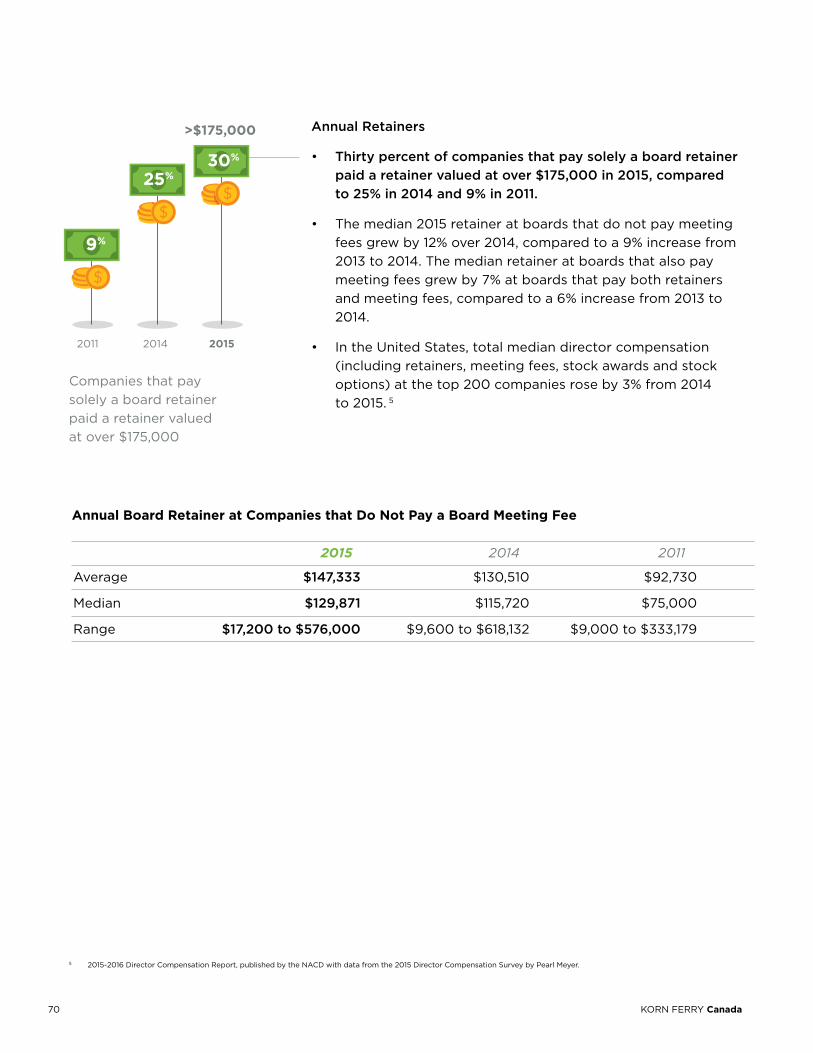
70 KORN FERRY Canada
Annual Retainers
• Thirty percent of companies that pay solely a board retainer paid a retainer valued at over $175,000 in 2015, compared to 25% in 2014 and 9% in 2011.
• Themedian2015retaineratboardsthatdonotpaymeetingfees grew by 12% over 2014, compared to a 9% increase from 2013 to 2014. The median retainer at boards that also pay meeting fees grew by 7% at boards that pay both retainers and meeting fees, compared to a 6% increase from 2013 to 2014.
• IntheUnitedStates,totalmediandirectorcompensation(includingretainers,meetingfees,stockawardsandstockoptions)atthetop200companiesroseby3%from2014 to 2015. 5
Annual Board Retainer at Companies that do not Pay a Board Meeting Fee
2015 2014 2011
Average $147,333 $130,510 $92,730
Median $129,871 $115,720 $75,000
Range $17,200 to $576,000 $9,600 to $618,132 $9,000 to $333,179
30%
25%
9%
20142011 2015
Companies that pay solely a board retainer paid a retainer valued at over $175,000
>$175,000
5 2015-2016 Director Compensation Report, published by the NACD with data from the 2015 Director Compensation Survey by Pearl Meyer.
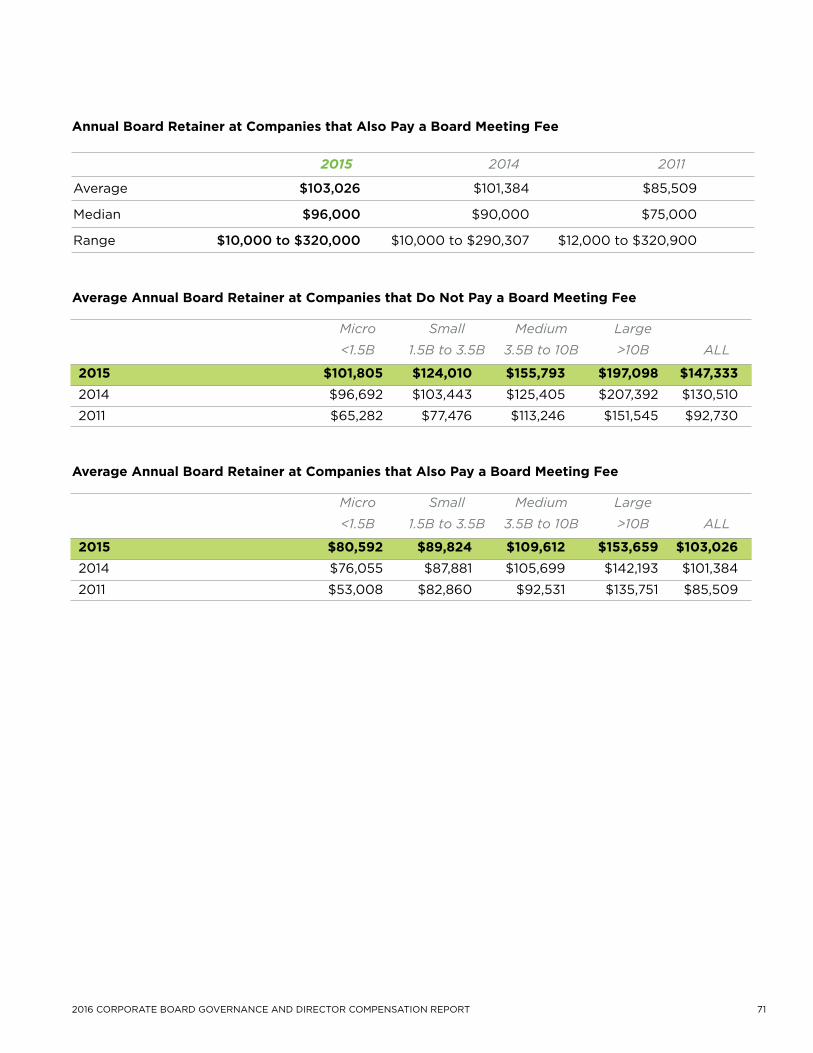
712016 Corporate Board GovernanCe and direCtor Compensation report
Annual Board Retainer at Companies that Also Pay a Board Meeting Fee
2015 2014 2011
Average $103,026 $101,384 $85,509
Median $96,000 $90,000 $75,000
Range $10,000 to $320,000 $10,000 to $290,307 $12,000 to $320,900
Average Annual Board Retainer at Companies that do not Pay a Board Meeting Fee
Micro Small Medium Large
<1.5B 1.5B to 3.5B 3.5B to 10B >10B ALL
2015 $101,805 $124,010 $155,793 $197,098 $147,333 2014 $96,692 $103,443 $125,405 $207,392 $130,510
2011 $65,282 $77,476 $113,246 $151,545 $92,730
Average Annual Board Retainer at Companies that Also Pay a Board Meeting Fee
Micro Small Medium Large
<1.5B 1.5B to 3.5B 3.5B to 10B >10B ALL
2015 $80,592 $89,824 $109,612 $153,659 $103,026 2014 $76,055 $87,881 $105,699 $142,193 $101,384
2011 $53,008 $82,860 $92,531 $135,751 $85,509
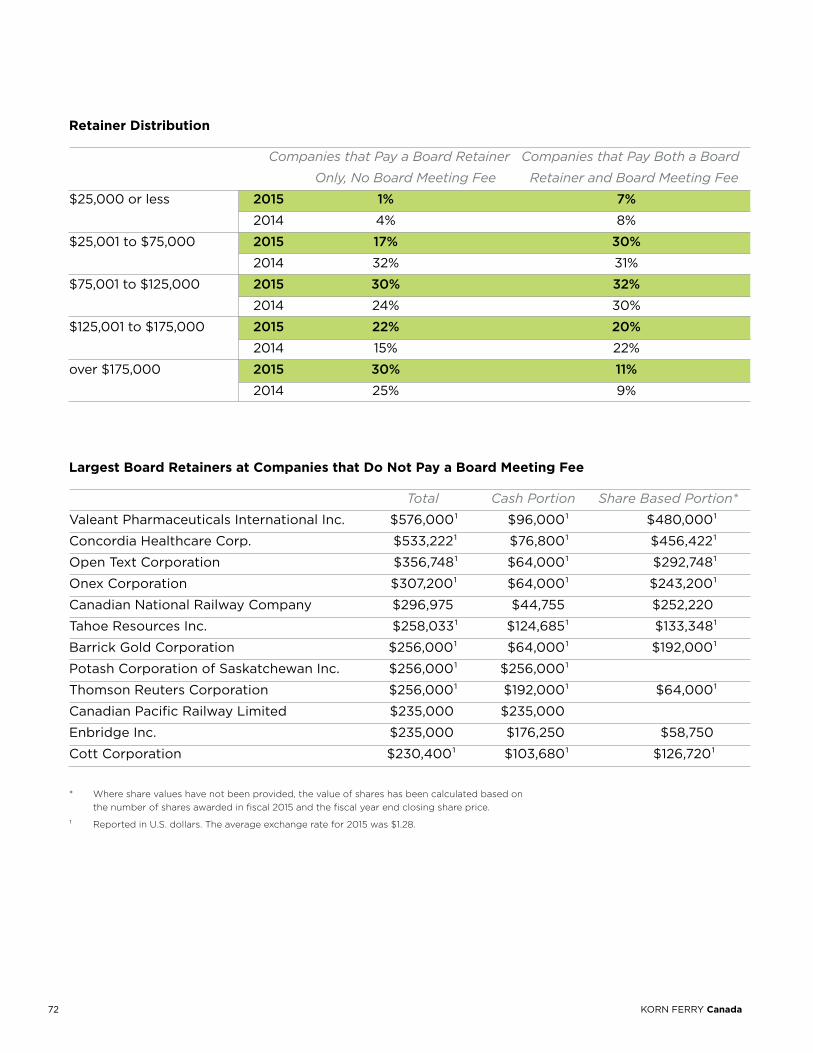
72 KORN FERRY Canada
* Wheresharevalueshavenotbeenprovided,thevalueofshareshasbeencalculatedbasedon thenumberofsharesawardedinfiscal2015andthefiscalyearendclosingshareprice.
¹ ReportedinU.S.dollars.Theaverageexchangeratefor2015was$1.28.
Largest Board Retainers at Companies that do not Pay a Board Meeting Fee
Total Cash Portion Share Based Portion*
valeant Pharmaceuticals International Inc. $576,000¹ $96,000¹ $480,000¹
Concordia Healthcare Corp. $533,222¹ $76,800¹ $456,422¹
Open Text Corporation $356,748¹ $64,000¹ $292,748¹
Onex Corporation $307,200¹ $64,000¹ $243,200¹
Canadian National Railway Company $296,975 $44,755 $252,220
Tahoe Resources Inc. $258,033¹ $124,685¹ $133,348¹
Barrick Gold Corporation $256,000¹ $64,000¹ $192,000¹
Potash Corporation of Saskatchewan Inc. $256,000¹ $256,000¹
Thomson Reuters Corporation $256,000¹ $192,000¹ $64,000¹
Canadian Pacific Railway Limited $235,000 $235,000
Enbridge Inc. $235,000 $176,250 $58,750
Cott Corporation $230,400¹ $103,680¹ $126,720¹
Retainer distribution
Companies that Pay a Board Retainer Companies that Pay Both a Board
Only, No Board Meeting Fee Retainer and Board Meeting Fee $25,000 or less 2015 1% 7% 2014 4% 8%
$25,001 to $75,000 2015 17% 30% 2014 32% 31%
$75,001 to $125,000 2015 30% 32% 2014 24% 30%
$125,001 to $175,000 2015 22% 20% 2014 15% 22%
over $175,000 2015 30% 11% 2014 25% 9%
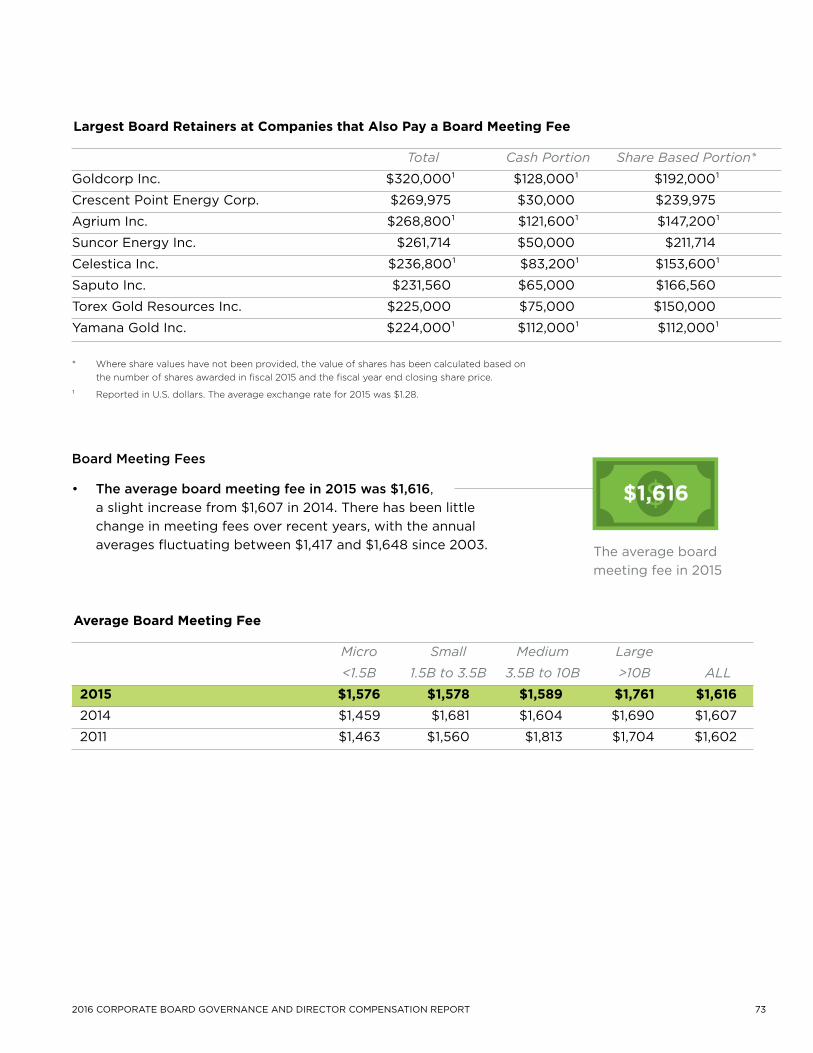
732016 Corporate Board GovernanCe and direCtor Compensation report
Board Meeting Fees
• The average board meeting fee in 2015 was $1,616, a slight increase from $1,607 in 2014. There has been little change in meeting fees over recent years, with the annual averages fluctuating between $1,417 and $1,648 since 2003.
Average Board Meeting Fee
Micro Small Medium Large
<1.5B 1.5B to 3.5B 3.5B to 10B >10B ALL
2015 $1,576 $1,578 $1,589 $1,761 $1,616 2014 $1,459 $1,681 $1,604 $1,690 $1,607
2011 $1,463 $1,560 $1,813 $1,704 $1,602
* Wheresharevalueshavenotbeenprovided,thevalueofshareshasbeencalculatedbasedon thenumberofsharesawardedinfiscal2015andthefiscalyearendclosingshareprice.
¹ ReportedinU.S.dollars.Theaverageexchangeratefor2015was$1.28.
Largest Board Retainers at Companies that Also Pay a Board Meeting Fee
Total Cash Portion Share Based Portion*
Goldcorp Inc. $320,000¹ $128,000¹ $192,000¹
Crescent Point Energy Corp. $269,975 $30,000 $239,975
Agrium Inc. $268,800¹ $121,600¹ $147,200¹
Suncor Energy Inc. $261,714 $50,000 $211,714
Celestica Inc. $236,800¹ $83,200¹ $153,600¹
Saputo Inc. $231,560 $65,000 $166,560
Torex Gold Resources Inc. $225,000 $75,000 $150,000
Yamana Gold Inc. $224,000¹ $112,000¹ $112,000¹
$1,616
The average board meeting fee in 2015
74 KORN FERRY Canada
Board Chair Compensation
752016 Corporate Board GovernanCe and direCtor Compensation report
• The2015averageNon-ExecutiveChairretainerof$261,424 was 2% higher than in 2014, following a 5% increase last year and a 3% increase the previous year. The median Non-Executive Chair retainer of $244,528 in 2015 was a 4% increase over the 2014 median of $235,000.
• AverageNon-ExecutiveChairretainersdropped over the previous year by 5% at both Micro and Small companies. They rose by 6% at Medium and Large companies.
• Non-ExecutiveChairretainersarelargerwhenthereisamandatoryportioninsharesorshareequivalents.The average Non-Executive Chair retainer that includedsharesorshareequivalentsin2015was54% higher in value than one that was cash-only or had only a voluntary portion in shares or share equivalents.Thiscomparestoadifferentialof36%last year and 44% the year prior.
• Thereisaslow,butsteady,increaseincompaniespaying Non-Executive Chairs retainers valued at more than $350,000. In 2015, 22% fell into this category, compared to 20%, 16%, and 15% respectively in the previous three years.
kEy FIndInGS
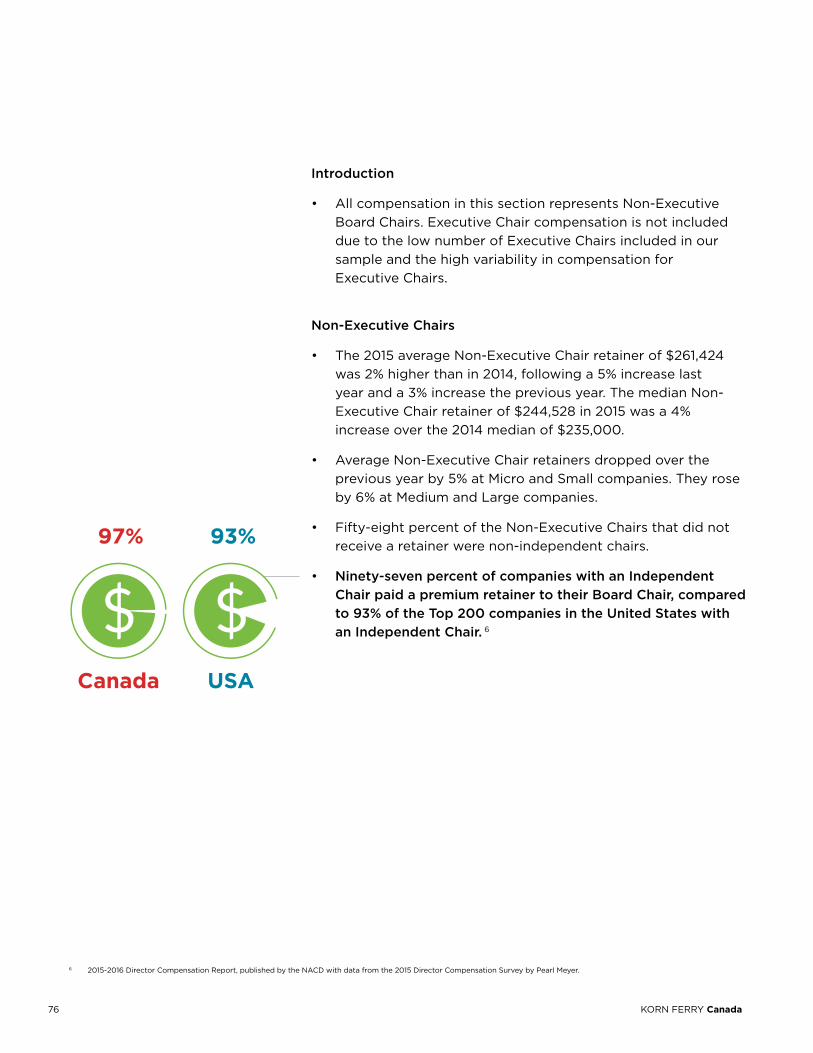
76 KORN FERRY Canada
6 2015-2016 Director Compensation Report, published by the NACD with data from the 2015 Director Compensation Survey by Pearl Meyer.
Introduction
• AllcompensationinthissectionrepresentsNon-ExecutiveBoard Chairs. Executive Chair compensation is not included due to the low number of Executive Chairs included in our sample and the high variability in compensation for Executive Chairs.
Non-Executive Chairs
• The2015averageNon-ExecutiveChairretainerof$261,424was 2% higher than in 2014, following a 5% increase last year and a 3% increase the previous year. The median Non-Executive Chair retainer of $244,528 in 2015 was a 4% increase over the 2014 median of $235,000.
• AverageNon-ExecutiveChairretainersdroppedovertheprevious year by 5% at Micro and Small companies. They rose by 6% at Medium and Large companies.
• Fifty-eightpercentoftheNon-ExecutiveChairsthatdidnotreceive a retainer were non-independent chairs.
• Ninety-seven percent of companies with an Independent Chair paid a premium retainer to their Board Chair, compared to 93% of the Top 200 companies in the United States with an Independent Chair. 6
Canada USA
97% 93%
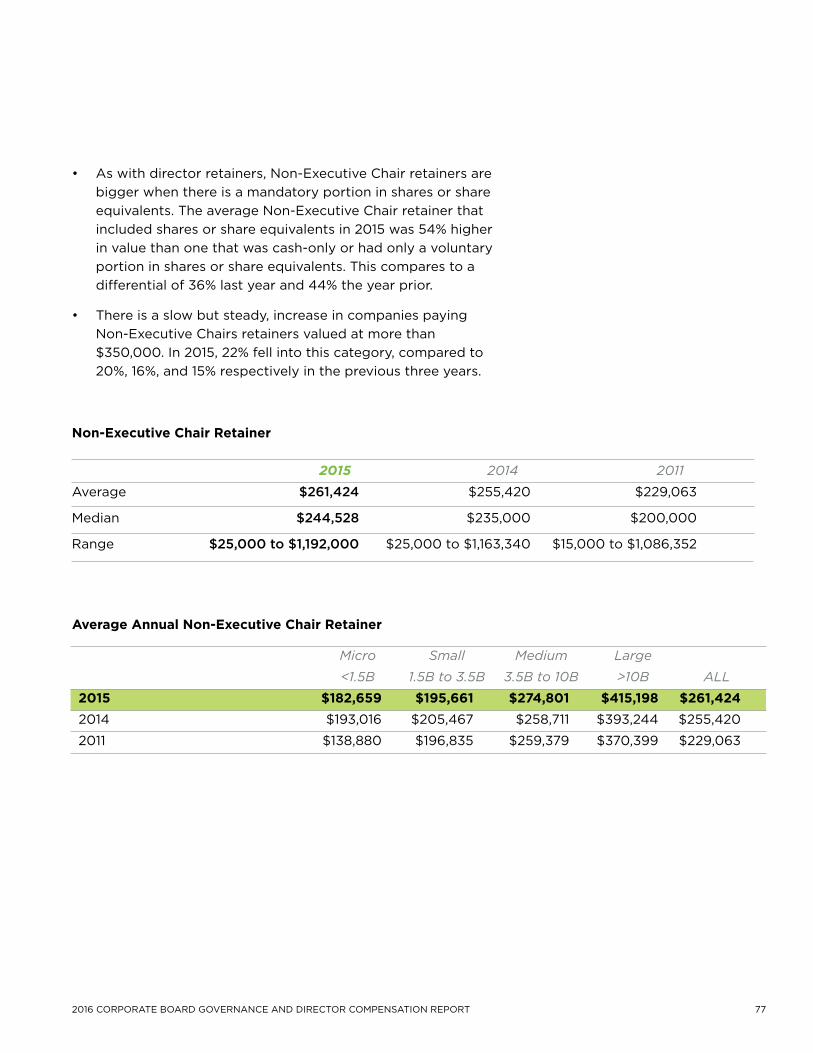
772016 Corporate Board GovernanCe and direCtor Compensation report
• Aswithdirectorretainers,Non-ExecutiveChairretainersarebigger when there is a mandatory portion in shares or share equivalents.TheaverageNon-ExecutiveChairretainerthatincludedsharesorshareequivalentsin2015was54%higherin value than one that was cash-only or had only a voluntary portioninsharesorshareequivalents.Thiscomparestoadifferentialof36%lastyearand44%theyearprior.
• Thereisaslowbutsteady,increaseincompaniespayingNon-Executive Chairs retainers valued at more than $350,000. In 2015, 22% fell into this category, compared to 20%, 16%, and 15% respectively in the previous three years.
Average Annual non-Executive Chair Retainer
Micro Small Medium Large
<1.5B 1.5B to 3.5B 3.5B to 10B >10B ALL
2015 $182,659 $195,661 $274,801 $415,198 $261,424 2014 $193,016 $205,467 $258,711 $393,244 $255,420
2011 $138,880 $196,835 $259,379 $370,399 $229,063
non-Executive Chair Retainer
2015 2014 2011
Average $261,424 $255,420 $229,063
Median $244,528 $235,000 $200,000
Range $25,000 to $1,192,000 $25,000 to $1,163,340 $15,000 to $1,086,352
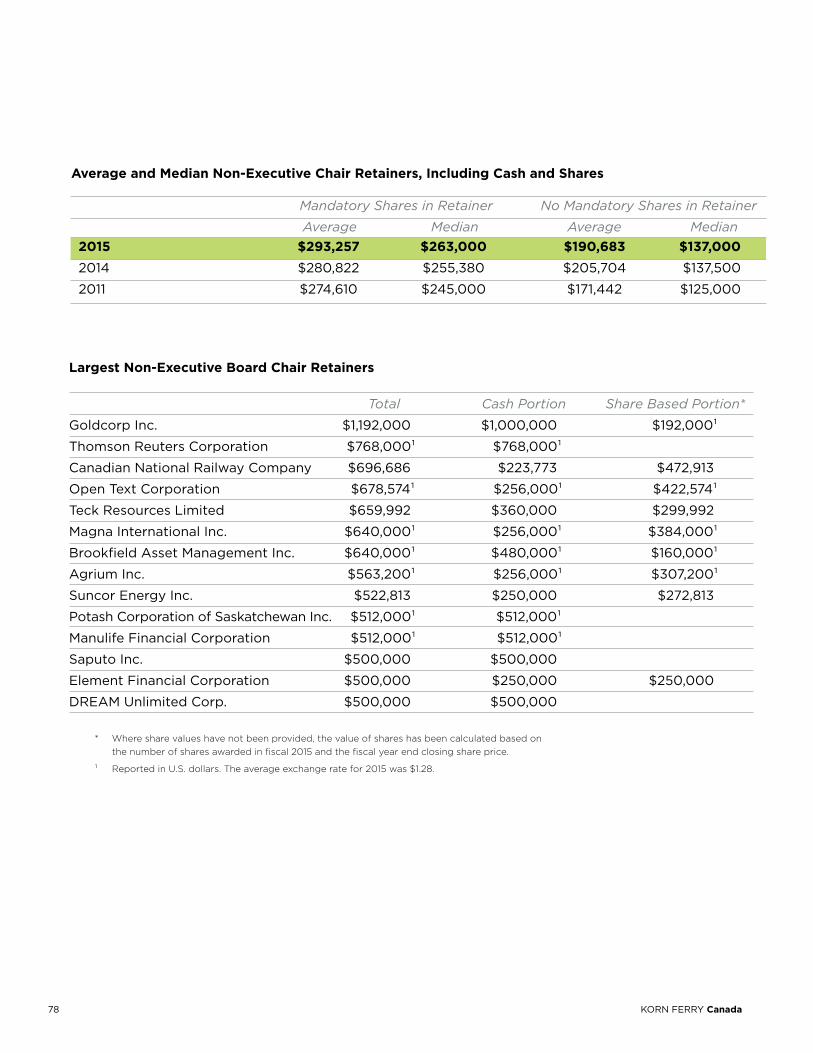
78 KORN FERRY Canada
Largest non-Executive Board Chair Retainers
Total Cash Portion Share Based Portion*
Goldcorp Inc. $1,192,000 $1,000,000 $192,000¹
Thomson Reuters Corporation $768,000¹ $768,000¹
Canadian National Railway Company $696,686 $223,773 $472,913
Open Text Corporation $678,574¹ $256,000¹ $422,574¹
Teck Resources Limited $659,992 $360,000 $299,992
Magna International Inc. $640,000¹ $256,000¹ $384,000¹
Brookfield Asset Management Inc. $640,000¹ $480,000¹ $160,000¹
Agrium Inc. $563,200¹ $256,000¹ $307,200¹
Suncor Energy Inc. $522,813 $250,000 $272,813
Potash Corporation of Saskatchewan Inc. $512,000¹ $512,000¹
Manulife Financial Corporation $512,000¹ $512,000¹
Saputo Inc. $500,000 $500,000
Element Financial Corporation $500,000 $250,000 $250,000
DREAM Unlimited Corp. $500,000 $500,000
* Wheresharevalueshavenotbeenprovided,thevalueofshareshasbeencalculatedbasedon thenumberofsharesawardedinfiscal2015andthefiscalyearendclosingshareprice.
¹ ReportedinU.S.dollars.Theaverageexchangeratefor2015was$1.28.
Average and Median non-Executive Chair Retainers, Including Cash and Shares
Mandatory Shares in Retainer No Mandatory Shares in Retainer
Average Median Average Median 2015 $293,257 $263,000 $190,683 $137,000 2014 $280,822 $255,380 $205,704 $137,500
2011 $274,610 $245,000 $171,442 $125,000
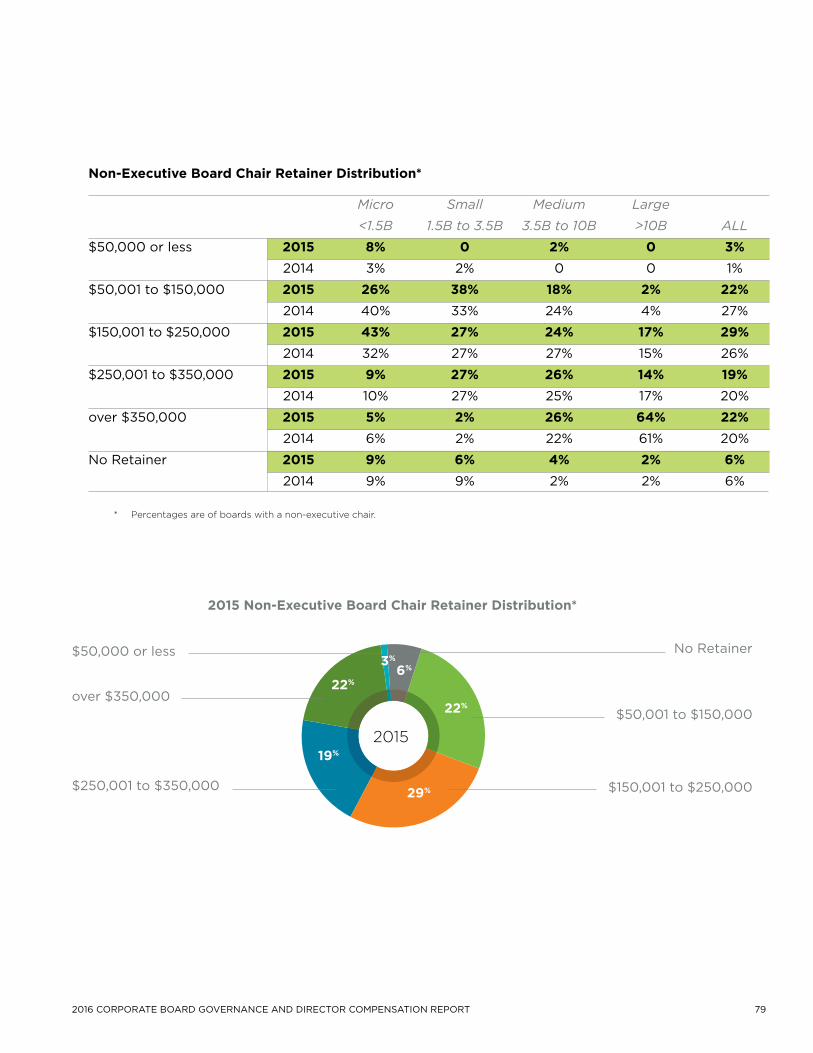
792016 Corporate Board GovernanCe and direCtor Compensation report
* Percentagesareofboardswithanon-executivechair.
non-Executive Board Chair Retainer distribution*
Micro Small Medium Large
<1.5B 1.5B to 3.5B 3.5B to 10B >10B ALL
$50,000 or less 2015 8% 0 2% 0 3% 2014 3% 2% 0 0 1%
$50,001 to $150,000 2015 26% 38% 18% 2% 22% 2014 40% 33% 24% 4% 27%
$150,001 to $250,000 2015 43% 27% 24% 17% 29% 2014 32% 27% 27% 15% 26%
$250,001 to $350,000 2015 9% 27% 26% 14% 19% 2014 10% 27% 25% 17% 20%
over $350,000 2015 5% 2% 26% 64% 22% 2014 6% 2% 22% 61% 20%
No Retainer 2015 9% 6% 4% 2% 6% 2014 9% 9% 2% 2% 6%
$50,001 to $150,000
$150,001 to $250,000
No Retainer
$250,001 to $350,000
over $350,000
$50,000 or less
2015
29%
19%
22%
3%
6%
22%
2015 non-Executive Board Chair Retainer distribution*

80 KORN FERRY Canada
Lead director Compensation

812016 Corporate Board GovernanCe and direCtor Compensation report
• Forthepasttwoyears,72%ofboardswithaLeadDirectorpaid additional compensation to the Lead Director.
• IntheUnitedStates,77% 7 of boards at the Top 200 companieswithanindependent“lead”or“presiding” director or an independent vice chair pay premium compensation for this role.
• In2015,100%ofLargecompanieswithaLeadDirector paid a premium to their Lead Directors versus 71% of Medium companies, 68% of Small companies and 59% of Micro companies.
• For the past two years, the median Lead Director additional retainer has been $25,000.
2015 median lead director retainer
$25,000
* AdditionaltoDirectorRetainer
Lead director Additional Retainer*, Including Cash and Shares
2015 2014 2011
Average $38,312 $36,266 $35,111
Median $25,000 $25,000 $27,350
Range $3,000 to $192,000 $3,000 to $165,000 $2,500 to $101,534
* Additionaltodirectorretainer
Average Annual Lead director Additional Retainer* Including Cash and Shares
Micro Small Medium Large
<1.5B 1.5B to 3.5B 3.5B to 10B >10B ALL
2015 $31,068 $27,873 $34,025 $60,418 $38,312 2014 $22,536 $28,868 $25,346 $59,688 $36,266
2011 $24,132 $35,569 $30,098 $53,140 $35,111
7 2015-2016 Director Compensation Report, published by the NACD with data from the 2015 Director Compensation Survey by Pearl Meyer.
• 72%ofboardspaidadditionalcompensationto Lead Directors.
• In2015,therewasa6%increaseintheaverage Lead Director retainer, following a 1% decrease the previous year.
• 100%ofLargecompanieswithaLeadDirector paid a premium to their lead directors.
kEy FIndInGS
82 KORN FERRY Canada
Committee Chair Compensation
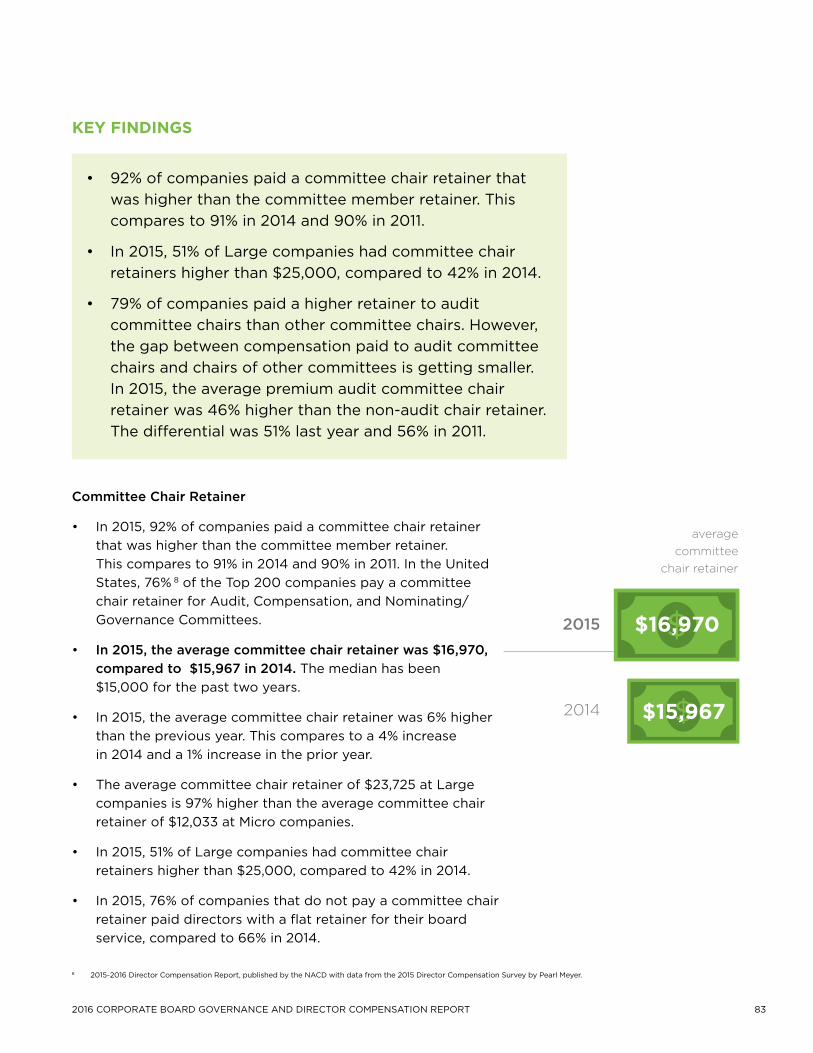
832016 Corporate Board GovernanCe and direCtor Compensation report
Committee Chair Retainer
• In2015,92%ofcompaniespaidacommitteechairretainer that was higher than the committee member retainer. This compares to 91% in 2014 and 90% in 2011. In the United States, 76% 8 of the Top 200 companies pay a committee chair retainer for Audit, Compensation, and Nominating/Governance Committees.
• In 2015, the average committee chair retainer was $16,970, compared to $15,967 in 2014. The median has been $15,000 for the past two years.
• In2015,theaveragecommitteechairretainerwas6%higherthan the previous year. This compares to a 4% increase in 2014 and a 1% increase in the prior year.
• Theaveragecommitteechairretainerof$23,725atLargecompanies is 97% higher than the average committee chair retainer of $12,033 at Micro companies.
• In2015,51%ofLargecompanieshadcommitteechair retainers higher than $25,000, compared to 42% in 2014.
• In2015,76%ofcompaniesthatdonotpayacommitteechairretainer paid directors with a flat retainer for their board service, compared to 66% in 2014.
averagecommittee
chair retainer
2015
2014
• 92%ofcompaniespaidacommitteechairretainerthatwas higher than the committee member retainer. This compares to 91% in 2014 and 90% in 2011.
• In2015,51%ofLargecompanieshadcommitteechairretainers higher than $25,000, compared to 42% in 2014.
• 79%ofcompaniespaidahigherretainertoauditcommittee chairs than other committee chairs. However, the gap between compensation paid to audit committee chairs and chairs of other committees is getting smaller. In 2015, the average premium audit committee chair retainer was 46% higher than the non-audit chair retainer. Thedifferentialwas51%lastyearand56%in2011.
kEy FIndInGS
$16,970
$15,967
8 2015-2016 Director Compensation Report, published by the NACD with data from the 2015 Director Compensation Survey by Pearl Meyer.
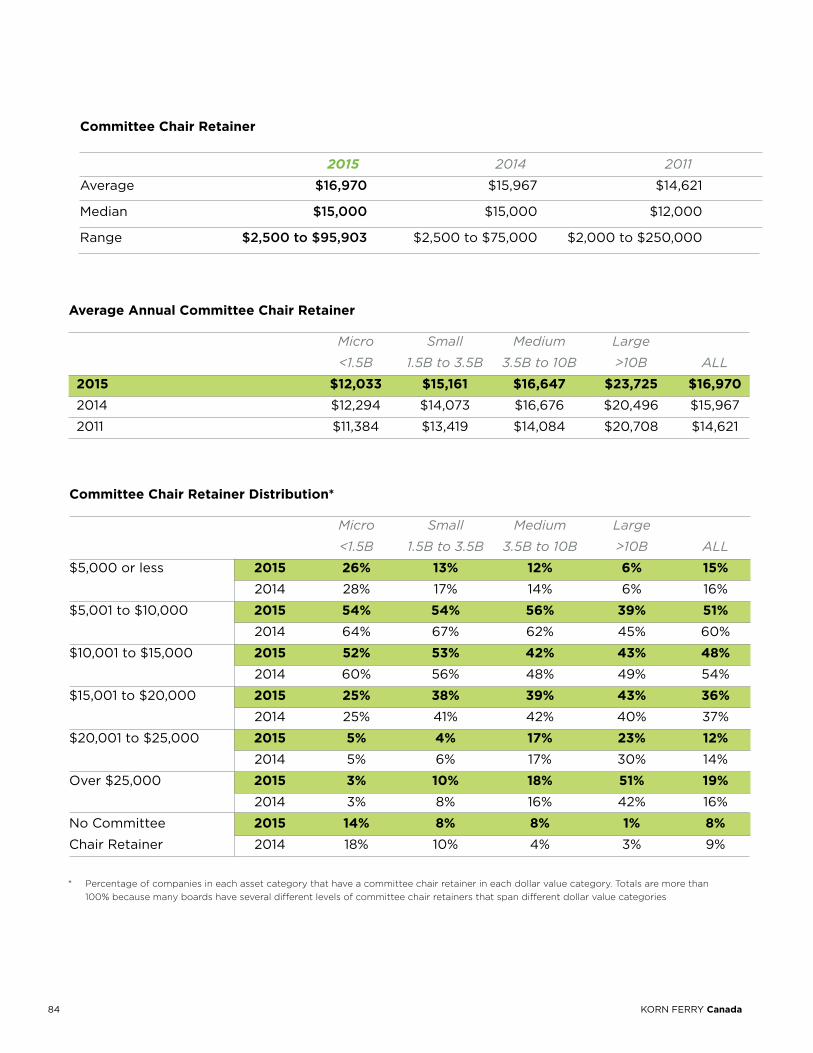
84 KORN FERRY Canada
* Percentageofcompaniesineachassetcategorythathaveacommitteechairretainerineachdollarvaluecategory.Totalsaremorethan 100%becausemanyboardshaveseveraldifferentlevelsofcommitteechairretainersthatspandifferentdollarvaluecategories
Committee Chair Retainer distribution*
Micro Small Medium Large
<1.5B 1.5B to 3.5B 3.5B to 10B >10B ALL
$5,000 or less 2015 26% 13% 12% 6% 15% 2014 28% 17% 14% 6% 16%
$5,001 to $10,000 2015 54% 54% 56% 39% 51% 2014 64% 67% 62% 45% 60%
$10,001 to $15,000 2015 52% 53% 42% 43% 48% 2014 60% 56% 48% 49% 54%
$15,001 to $20,000 2015 25% 38% 39% 43% 36% 2014 25% 41% 42% 40% 37%
$20,001 to $25,000 2015 5% 4% 17% 23% 12% 2014 5% 6% 17% 30% 14%
Over $25,000 2015 3% 10% 18% 51% 19% 2014 3% 8% 16% 42% 16%
No Committee 2015 14% 8% 8% 1% 8%
Chair Retainer 2014 18% 10% 4% 3% 9%
Average Annual Committee Chair Retainer
Micro Small Medium Large
<1.5B 1.5B to 3.5B 3.5B to 10B >10B ALL
2015 $12,033 $15,161 $16,647 $23,725 $16,970 2014 $12,294 $14,073 $16,676 $20,496 $15,967
2011 $11,384 $13,419 $14,084 $20,708 $14,621
Committee Chair Retainer
2015 2014 2011
Average $16,970 $15,967 $14,621
Median $15,000 $15,000 $12,000
Range $2,500 to $95,903 $2,500 to $75,000 $2,000 to $250,000
852016 Corporate Board GovernanCe and direCtor Compensation report
Differential Committee Chair Retainers
• Manyboardspaydifferentlevelsofretainersfordifferenttypesofcommittees:
* For the past two years, 79% of companies paid a higher retainer to audit committee chairs than other committee chairs. This compares to 82% in 2011.
* The gap between compensation paid to audit committee chairs and chairs of other committees is decreasing. In 2015, the average premium audit committee chair retainer was 46% higherthanthenon-auditchairretainer.Thedifferentialwas 51% last year and 56% in 2011.
* In 2015, 29% of boards with a compensation committee paid a higher retainer to that committee chair than some other committees, compared to 27% in 2014 and 21% in 2011.
• In2015,therewasa5%increaseintheaveragepremiumauditcommittee chair retainer over 2014 and this follows increases over the previous years of 3% and 1% consecutively.

86 KORN FERRY Canada
* “Non-Audit”includesauditcommitteesatthosecompaniesthatdonotpayapremiumforauditcommitteemembership.
Average Premium Audit Committee and non-Audit* Committee Chair Retainer, By Board Size
Percentage of Asset Group Average Audit that Pay a Premium Committee Chair Average Non-Audit Audit Committee Retainer at Companies Committee Chair Chair Retainer that Pay a Premium Retainer
Micro<1.5B 76% $15,219 $9,715
Small 1.5B – 3.5B 80% $19,735 $11,959
Medium 3.5B – 10B 85% $22,170 $12,876
Large>10B 75% $29,270 $21,239
ALL 79% $21,036 $14,42
* “Non-Audit”includesauditcommitteesatthosecompaniesthatdonotpayapremiumforauditcommitteemembership.
Average Premium Audit Committee and non-Audit* Committee Chair Retainer
Percentage that Pay a Average Audit Committee Premium Audit Committee Chair Retainer at Companies Average Non-Audit
Chair Retainer that Pay a Premium Chair Retainer
2015 79% $21,036 $14,425
2014 79% $20,070 $13,295
2011 82% $18,500 $11,858
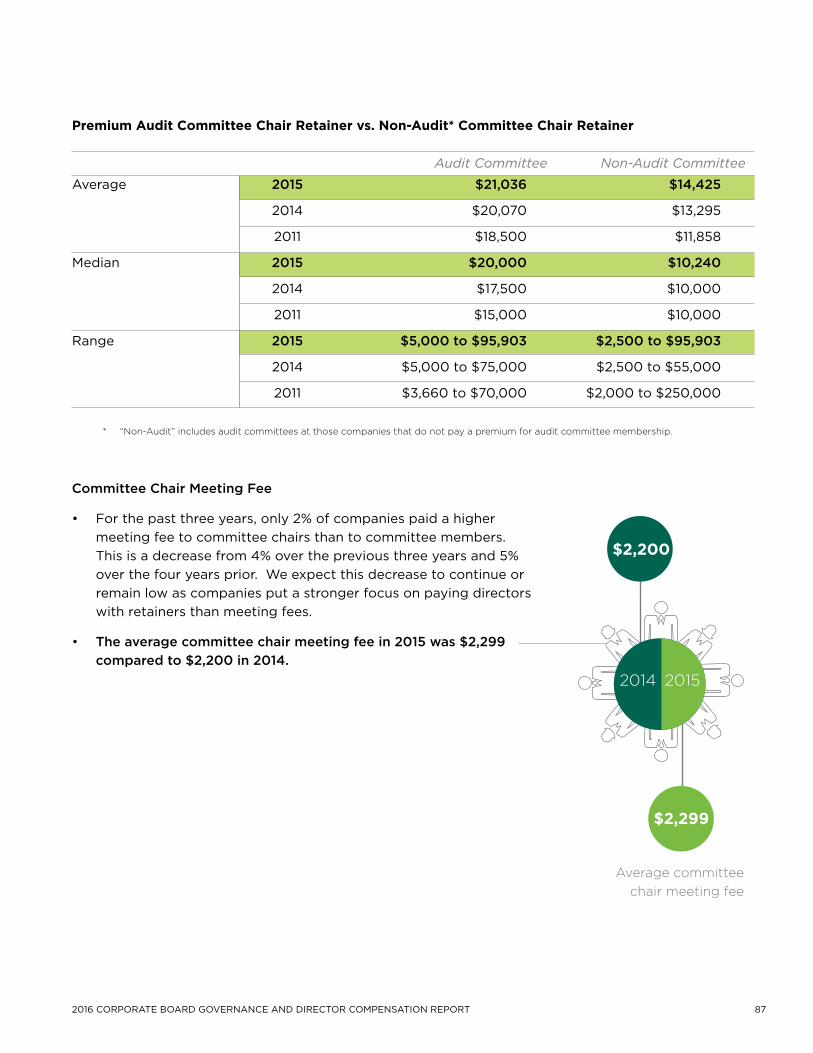
872016 Corporate Board GovernanCe and direCtor Compensation report
$2,200
$2,299
Averagecommitteechair meeting fee
2014 2015
* “Non-Audit”includesauditcommitteesatthosecompaniesthatdonotpayapremiumforauditcommitteemembership.
Premium Audit Committee Chair Retainer vs. non-Audit* Committee Chair Retainer
Audit Committee Non-Audit Committee
Average 2015 $21,036 $14,425
2014 $20,070 $13,295
2011 $18,500 $11,858
Median 2015 $20,000 $10,240
2014 $17,500 $10,000
2011 $15,000 $10,000
Range 2015 $5,000 to $95,903 $2,500 to $95,903
2014 $5,000 to $75,000 $2,500 to $55,000
2011 $3,660 to $70,000 $2,000 to $250,000
Committee Chair Meeting Fee
• Forthepastthreeyears,only2%ofcompaniespaidahighermeeting fee to committee chairs than to committee members. This is a decrease from 4% over the previous three years and 5% over the four years prior. We expect this decrease to continue or remain low as companies put a stronger focus on paying directors with retainers than meeting fees.
• The average committee chair meeting fee in 2015 was $2,299 compared to $2,200 in 2014.
88 KORN FERRY Canada
Committee Member Compensation
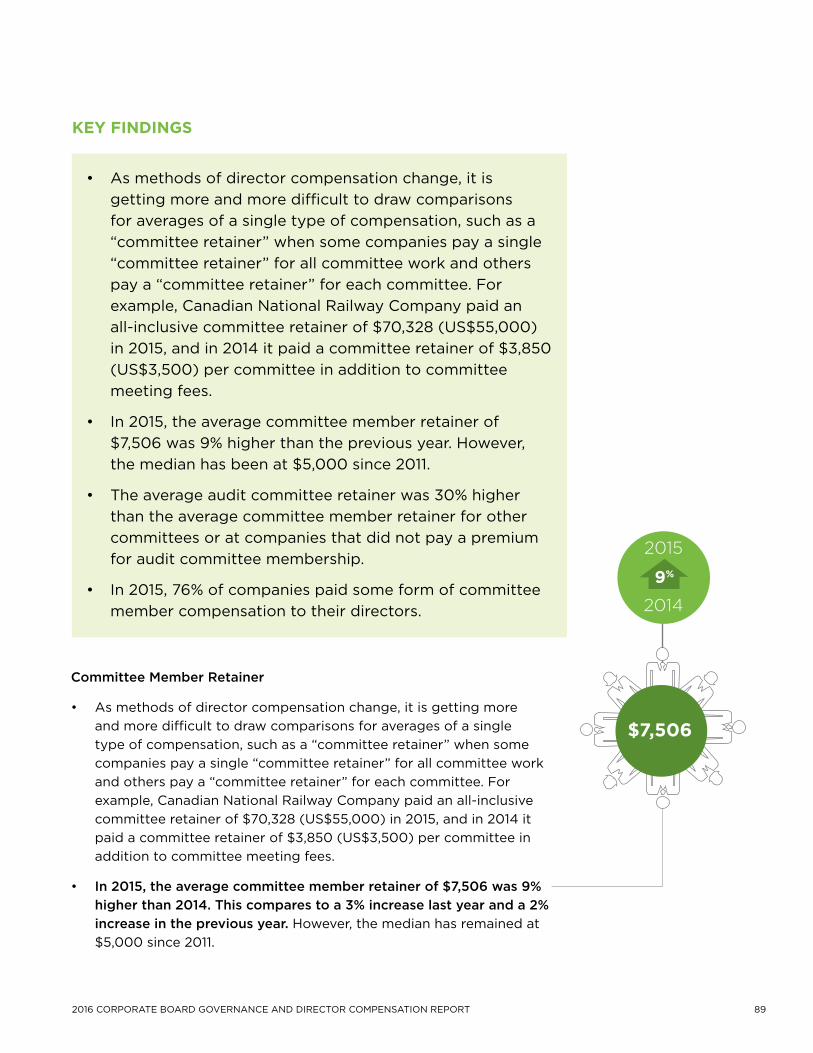
892016 Corporate Board GovernanCe and direCtor Compensation report
Committee Member Retainer
• Asmethodsofdirectorcompensationchange,itisgettingmoreand more difficult to draw comparisons for averages of a single typeofcompensation,suchasa“committeeretainer”whensomecompaniespayasingle“committeeretainer”forallcommitteeworkandotherspaya“committeeretainer”foreachcommittee.Forexample, Canadian National Railway Company paid an all-inclusive committeeretainerof$70,328(US$55,000)in2015,andin2014itpaidacommitteeretainerof$3,850(US$3,500)percommitteeinaddition to committee meeting fees.
• In 2015, the average committee member retainer of $7,506 was 9% higher than 2014. This compares to a 3% increase last year and a 2% increase in the previous year. However, the median has remained at $5,000 since 2011.
9%
$7,506
2015
2014
• Asmethodsofdirectorcompensationchange,itisgetting more and more difficult to draw comparisons for averages of a single type of compensation, such as a “committeeretainer”whensomecompaniespayasingle“committeeretainer”forallcommitteeworkandotherspaya“committeeretainer”foreachcommittee.Forexample, Canadian National Railway Company paid an all-inclusivecommitteeretainerof$70,328(US$55,000)in 2015, and in 2014 it paid a committee retainer of $3,850 (US$3,500)percommitteeinadditiontocommitteemeeting fees.
• In2015,theaveragecommitteememberretainerof$7,506 was 9% higher than the previous year. However, the median has been at $5,000 since 2011.
• Theaverageauditcommitteeretainerwas30%higherthan the average committee member retainer for other committees or at companies that did not pay a premium for audit committee membership.
• In2015,76%ofcompaniespaidsomeformofcommitteemember compensation to their directors.
kEy FIndInGS
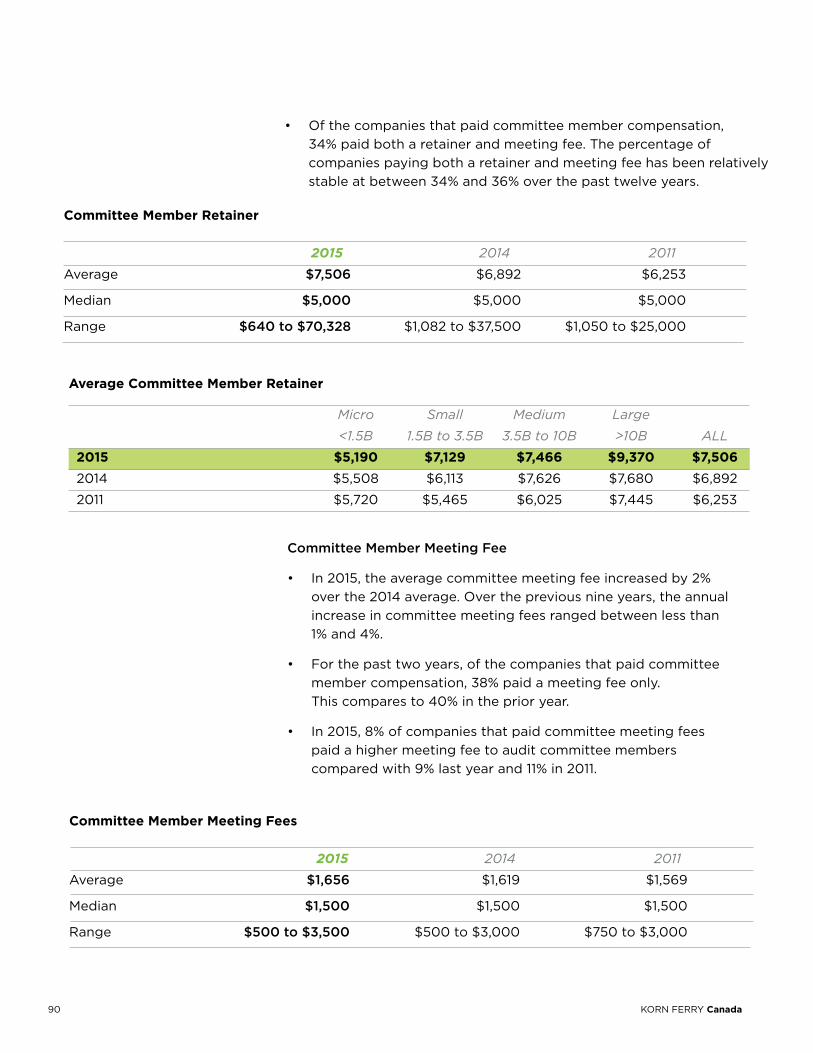
90 KORN FERRY Canada
Average Committee Member Retainer
Micro Small Medium Large
<1.5B 1.5B to 3.5B 3.5B to 10B >10B ALL
2015 $5,190 $7,129 $7,466 $9,370 $7,506 2014 $5,508 $6,113 $7,626 $7,680 $6,892
2011 $5,720 $5,465 $6,025 $7,445 $6,253
Committee Member Meeting Fee
• In2015,theaveragecommitteemeetingfeeincreasedby2%over the 2014 average. Over the previous nine years, the annual increase in committee meeting fees ranged between less than 1% and 4%.
• Forthepasttwoyears,ofthecompaniesthatpaidcommitteemember compensation, 38% paid a meeting fee only. This compares to 40% in the prior year.
• In2015,8%ofcompaniesthatpaidcommitteemeetingfees paid a higher meeting fee to audit committee members compared with 9% last year and 11% in 2011.
Committee Member Meeting Fees
2015 2014 2011
Average $1,656 $1,619 $1,569
Median $1,500 $1,500 $1,500
Range $500 to $3,500 $500 to $3,000 $750 to $3,000
Committee Member Retainer
2015 2014 2011
Average $7,506 $6,892 $6,253
Median $5,000 $5,000 $5,000
Range $640 to $70,328 $1,082 to $37,500 $1,050 to $25,000
• Ofthecompaniesthatpaidcommitteemembercompensation, 34% paid both a retainer and meeting fee. The percentage of companies paying both a retainer and meeting fee has been relatively stable at between 34% and 36% over the past twelve years.
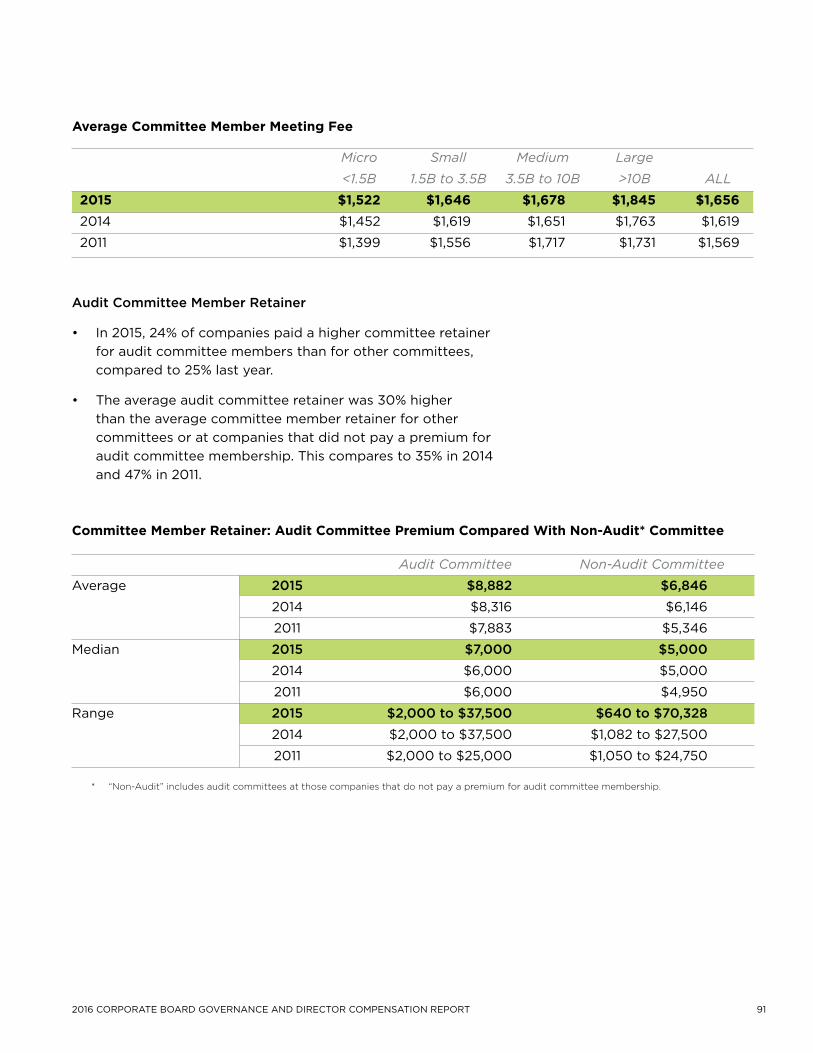
912016 Corporate Board GovernanCe and direCtor Compensation report
Audit Committee Member Retainer
• In2015,24%ofcompaniespaidahighercommitteeretainerfor audit committee members than for other committees, compared to 25% last year.
• Theaverageauditcommitteeretainerwas30%higherthan the average committee member retainer for other committees or at companies that did not pay a premium for audit committee membership. This compares to 35% in 2014 and 47% in 2011.
Average Committee Member Meeting Fee
Micro Small Medium Large
<1.5B 1.5B to 3.5B 3.5B to 10B >10B ALL
2015 $1,522 $1,646 $1,678 $1,845 $1,656 2014 $1,452 $1,619 $1,651 $1,763 $1,619
2011 $1,399 $1,556 $1,717 $1,731 $1,569
* “Non-Audit”includesauditcommitteesatthosecompaniesthatdonotpayapremiumforauditcommitteemembership.
Committee Member Retainer: Audit Committee Premium Compared With non-Audit* Committee
Audit Committee Non-Audit Committee
Average 2015 $8,882 $6,846 2014 $8,316 $6,146
2011 $7,883 $5,346
Median 2015 $7,000 $5,000 2014 $6,000 $5,000
2011 $6,000 $4,950
Range 2015 $2,000 to $37,500 $640 to $70,328 2014 $2,000 to $37,500 $1,082 to $27,500
2011 $2,000 to $25,000 $1,050 to $24,750
92 KORN FERRY Canada
How Are Committee Members Compensated?
• Committeemembercompensationtendstobequitevaried,withsomeboardsprovidingdifferentamountsfordifferenttypesofcommittees,orpayingaboardretainerintended to include compensation for committee service, but no specific amounts for committee service.
• In 2015, 76% of companies paid some form of committee member compensation to their directors.
• Forthepasttwoyears,oftheboardsthatdidnotpayanycompensation to committee members, 22% paid a board retainer only, with no further compensation for committee chairs or members. This means that 5% of all boards surveyedpayasingle“flatfee”compensationstructure.These companies are:
* Advantage Oil and Gas Ltd.
* Alaris Royalty Corp.
* Amaya Inc.
* BMTC Group Inc.
* Bonterra Energy Corp.
* Cara Operations Limited
* Chemtrade Logistics Income Fund
* China Gold International Resources Corp. Ltd.
* Concordia Healthcare Corp.
* FCF Capital Inc.
* Granite Oil Corp.
* MainstreetEquityCorp.
* Nevsun Resources Ltd.
* OceanaGold Corporation
* Tourmaline Oil Corp.
* Whitecap Resources Inc.
2015
76%
932016 Corporate Board GovernanCe and direCtor Compensation report
• Fivepercentofcompaniesprovidedcompensationforsome, but not all committees. Of these companies:
* 80% paid a meeting fee for all committees, but a retainer only to the audit committee;
* 20% paid only a retainer, and only to audit committee members.
Breakdown of Compensation Method for Committee Members
Meeting Fee only 29%
Retainer and Meeting Fee 26%
Retainer Only 15%
Stock Options only 1%
Compensation for some, but not all, Committee Types 5%
No Specific Committee Member Compensation 24%
94 KORN FERRY Canada
Stock-Based Compensation
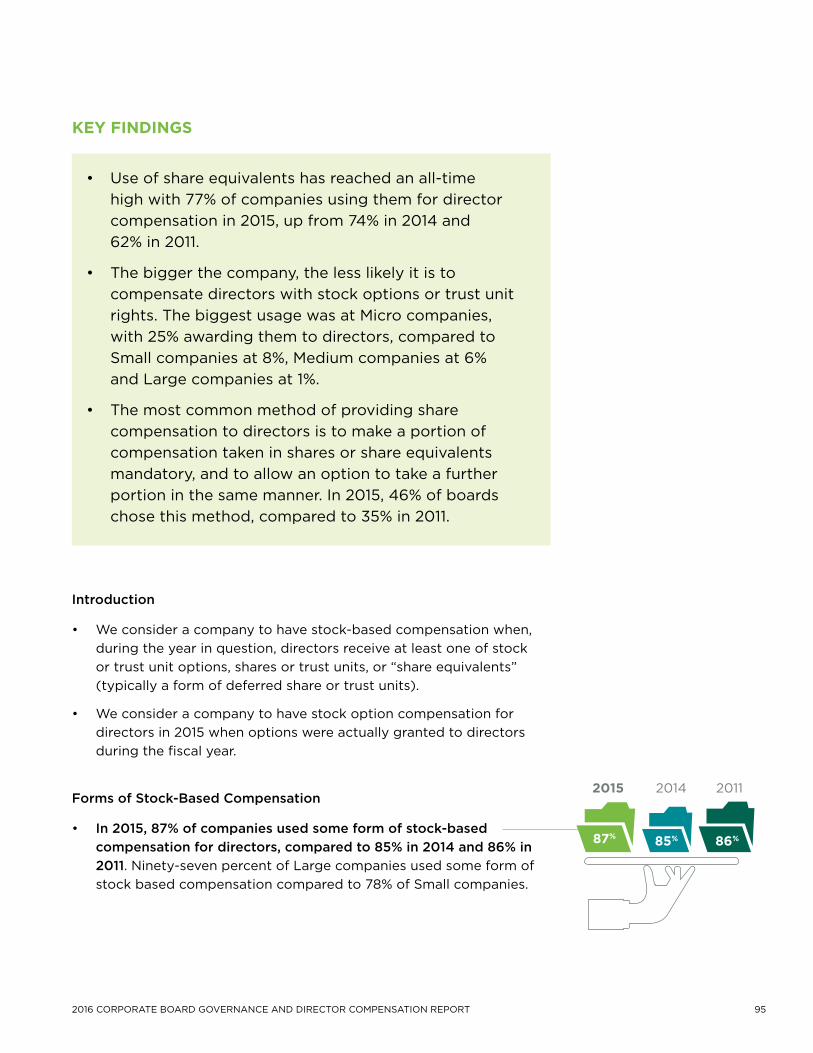
952016 Corporate Board GovernanCe and direCtor Compensation report
Introduction
• Weconsideracompanytohavestock-basedcompensationwhen,duringtheyearinquestion,directorsreceiveatleastoneofstockortrustunitoptions,sharesortrustunits,or“shareequivalents”(typicallyaformofdeferredshareortrustunits).
• Weconsideracompanytohavestockoptioncompensationfordirectors in 2015 when options were actually granted to directors during the fiscal year.
Forms of Stock-Based Compensation
• In 2015, 87% of companies used some form of stock-based compensation for directors, compared to 85% in 2014 and 86% in 2011. Ninety-seven percent of Large companies used some form of stock based compensation compared to 78% of Small companies.
2015 2014 2011
85% 86%87%
• Useofshareequivalentshasreachedanall-timehigh with 77% of companies using them for director compensation in 2015, up from 74% in 2014 and 62% in 2011.
• Thebiggerthecompany,thelesslikelyitistocompensate directors with stock options or trust unit rights. The biggest usage was at Micro companies, with 25% awarding them to directors, compared to Small companies at 8%, Medium companies at 6% and Large companies at 1%.
• Themostcommonmethodofprovidingsharecompensation to directors is to make a portion of compensationtakeninsharesorshareequivalentsmandatory, and to allow an option to take a further portion in the same manner. In 2015, 46% of boards chose this method, compared to 35% in 2011.
kEy FIndInGS
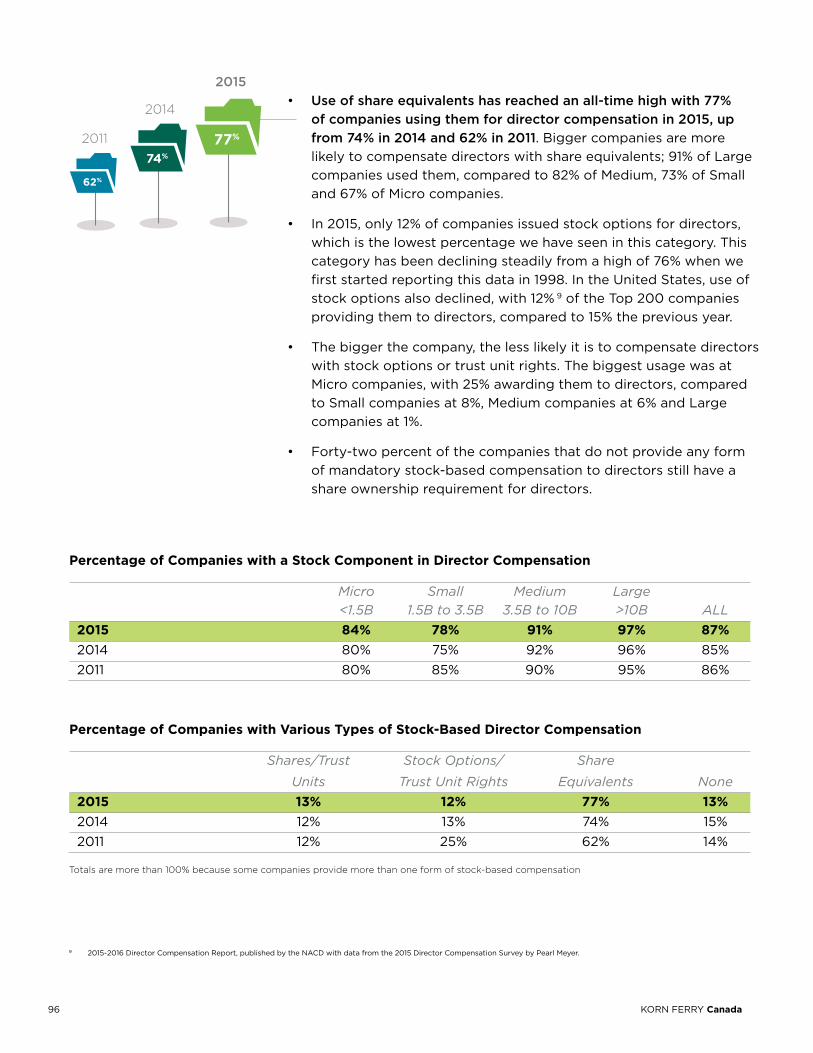
96 KORN FERRY Canada
• Use of share equivalents has reached an all-time high with 77% of companies using them for director compensation in 2015, up from 74% in 2014 and 62% in 2011. Bigger companies are more likelytocompensatedirectorswithshareequivalents;91%ofLargecompanies used them, compared to 82% of Medium, 73% of Small and 67% of Micro companies.
• In2015,only12%ofcompaniesissuedstockoptionsfordirectors,which is the lowest percentage we have seen in this category. This category has been declining steadily from a high of 76% when we first started reporting this data in 1998. In the United States, use of stock options also declined, with 12% 9 of the Top 200 companies providing them to directors, compared to 15% the previous year.
• Thebiggerthecompany,thelesslikelyitistocompensatedirectorswith stock options or trust unit rights. The biggest usage was at Micro companies, with 25% awarding them to directors, compared to Small companies at 8%, Medium companies at 6% and Large companies at 1%.
• Forty-twopercentofthecompaniesthatdonotprovideanyformof mandatory stock-based compensation to directors still have a shareownershiprequirementfordirectors.
9 2015-2016 Director Compensation Report, published by the NACD with data from the 2015 Director Compensation Survey by Pearl Meyer.
Percentage of Companies with various Types of Stock-Based director Compensation
Shares/Trust Stock Options/ Share
Units Trust Unit Rights Equivalents None 2015 13% 12% 77% 13% 2014 12% 13% 74% 15% 2011 12% 25% 62% 14%
Totalsaremorethan100%becausesomecompaniesprovidemorethanoneformofstock-basedcompensation
Percentage of Companies with a Stock Component in director Compensation
Micro Small Medium Large <1.5B 1.5B to 3.5B 3.5B to 10B >10B ALL 2015 84% 78% 91% 97% 87% 2014 80% 75% 92% 96% 85% 2011 80% 85% 90% 95% 86%
2015
2014
2011 77%
74%
62%
972016 Corporate Board GovernanCe and direCtor Compensation report
Use of Stock Components in director Compensation, by Company Size
Micro Small Medium Large
<1.5B 1.5B to 3.5B 3.5B to 10B >10B ALL
Shares/Trust Units 2015 3% 7% 11% 35% 13% 2014 4% 7% 10% 28% 12%
Stock Options/ 2015 25% 8% 6% 1% 12%Trust Unit Rights 2014 25% 12% 9% 1% 13%
ShareEquivalents 2015 67% 73% 82% 91% 77% 2014 63% 63% 82% 93% 74%
None 2015 16% 21% 9% 3% 13% 2014 20% 25% 7% 4% 15%
Mandatory vs. Voluntary Compensation in Shares or Share Equivalents
• Themostcommonwayofprovidingsharecompensationtodirectorsistomakeaportionofcompensationinsharesorshareequivalentsmandatory,and to allow an option to take a further portion in the same manner. In 2015, 46% of boards chose this method, compared to 43% in 2014 and 35% in 2011.
• Thebiggerthecompany,themorelikelyitistohavebothmandatoryandoptional share compensation for directors. In 2015, 74% of Large companies used this method, compared to 28% at Micro companies.
• Seventypercentofcompaniesthatcompensatedirectorswithonlyaretainerrequiredirectorstotakeallorpartoftheretainerinsharesorshareequivalents,comparedto67%ofboardsthatalsopayameetingfee.
Percentage of Companies with Compensation in Share or Share Equivalents, by Asset Size
Micro Small Medium Large
<1.5B 1.5B to 3.5B 3.5B to 10B >10B ALL
Option to take all or part of 12% 16% 17% 12% 14% compensation in shares or shareequivalents
Must take all or part of compensation 28% 16% 26% 12% 21% insharesorshareequivalents, no option of taking a further portion in the same manner
At least a portion of compensation 28% 44% 45% 74% 46% mustbeinshareorshareequivalents
Percentage of Companies with Compensation in Shares or Share Equivalents
2015 2014 2011
Optiontotakeallorpartofcompensationinsharesorshareequivalents 14% 15% 16%
Musttakeallorpartofcompensationinsharesorshareequivalents, no option of taking a further portion in the same manner 21% 19% 16%
Atleastaportionofcompensationmustbeinshareorshareequivalents 46% 43% 35%
98 KORN FERRY Canada
Compensation Summary
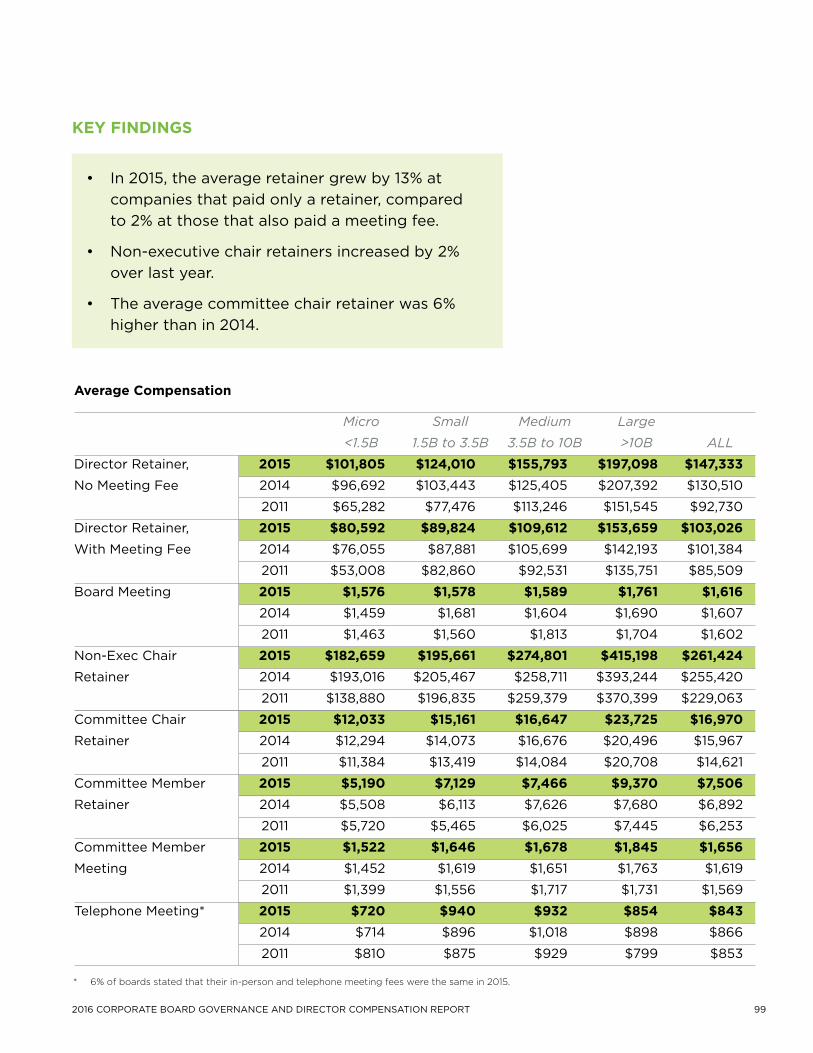
992016 Corporate Board GovernanCe and direCtor Compensation report
Average Compensation
Micro Small Medium Large
<1.5B 1.5B to 3.5B 3.5B to 10B >10B ALL
Director Retainer, 2015 $101,805 $124,010 $155,793 $197,098 $147,333No Meeting Fee 2014 $96,692 $103,443 $125,405 $207,392 $130,510
2011 $65,282 $77,476 $113,246 $151,545 $92,730
Director Retainer, 2015 $80,592 $89,824 $109,612 $153,659 $103,026With Meeting Fee 2014 $76,055 $87,881 $105,699 $142,193 $101,384
2011 $53,008 $82,860 $92,531 $135,751 $85,509
Board Meeting 2015 $1,576 $1,578 $1,589 $1,761 $1,616 2014 $1,459 $1,681 $1,604 $1,690 $1,607
2011 $1,463 $1,560 $1,813 $1,704 $1,602
Non-Exec Chair 2015 $182,659 $195,661 $274,801 $415,198 $261,424Retainer 2014 $193,016 $205,467 $258,711 $393,244 $255,420
2011 $138,880 $196,835 $259,379 $370,399 $229,063
Committee Chair 2015 $12,033 $15,161 $16,647 $23,725 $16,970Retainer 2014 $12,294 $14,073 $16,676 $20,496 $15,967
2011 $11,384 $13,419 $14,084 $20,708 $14,621
Committee Member 2015 $5,190 $7,129 $7,466 $9,370 $7,506Retainer 2014 $5,508 $6,113 $7,626 $7,680 $6,892
2011 $5,720 $5,465 $6,025 $7,445 $6,253
Committee Member 2015 $1,522 $1,646 $1,678 $1,845 $1,656Meeting 2014 $1,452 $1,619 $1,651 $1,763 $1,619
2011 $1,399 $1,556 $1,717 $1,731 $1,569
Telephone Meeting* 2015 $720 $940 $932 $854 $843 2014 $714 $896 $1,018 $898 $866
2011 $810 $875 $929 $799 $853
* 6%ofboardsstatedthattheirin-personandtelephonemeetingfeeswerethesamein2015.
• In2015,theaverageretainergrewby13%atcompanies that paid only a retainer, compared to 2% at those that also paid a meeting fee.
• Non-executivechairretainersincreasedby2% over last year.
• Theaveragecommitteechairretainerwas6% higher than in 2014.
kEy FIndInGS
100 KORN FERRY Canada
director Share ownership
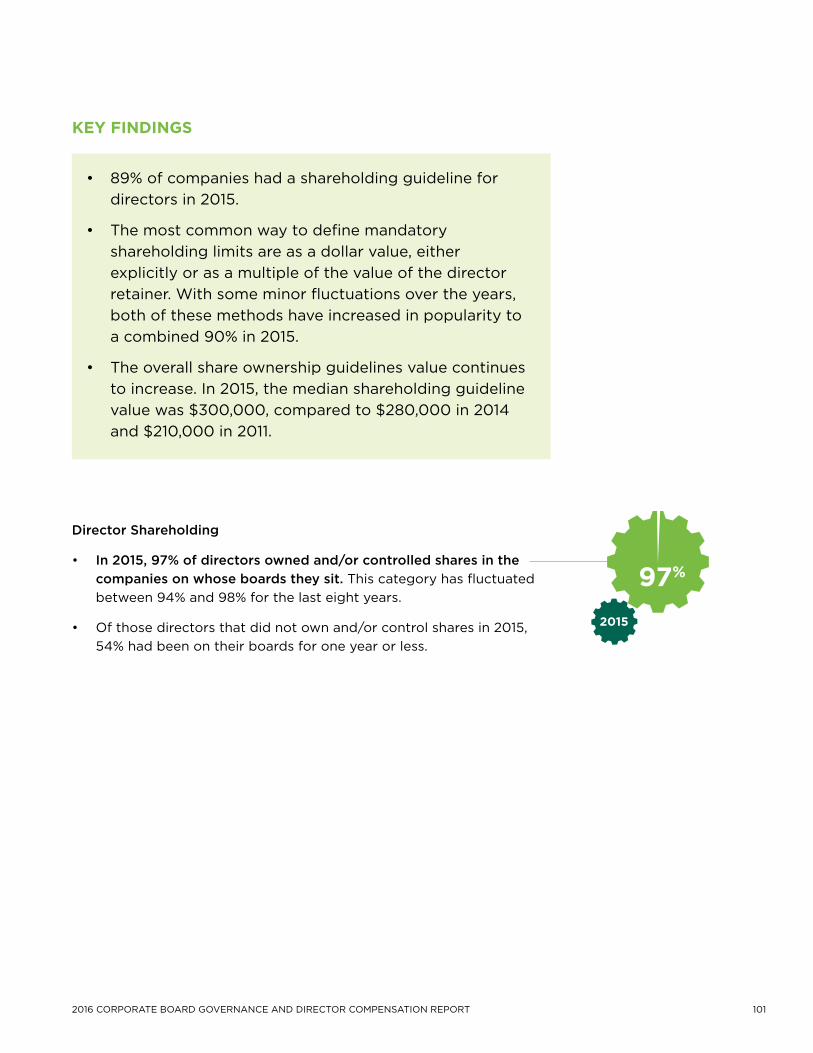
1012016 Corporate Board GovernanCe and direCtor Compensation report
Director Shareholding
• In 2015, 97% of directors owned and/or controlled shares in the companies on whose boards they sit. This category has fluctuated between 94% and 98% for the last eight years.
• Ofthosedirectorsthatdidnotownand/orcontrolsharesin2015,54% had been on their boards for one year or less.
2015
97%
• 89%ofcompanieshadashareholdingguidelinefordirectors in 2015.
• Themostcommonwaytodefinemandatoryshareholding limits are as a dollar value, either explicitly or as a multiple of the value of the director retainer. With some minor fluctuations over the years, both of these methods have increased in popularity to a combined 90% in 2015.
• Theoverallshareownershipguidelinesvaluecontinuesto increase. In 2015, the median shareholding guideline value was $300,000, compared to $280,000 in 2014 and $210,000 in 2011.
kEy FIndInGS
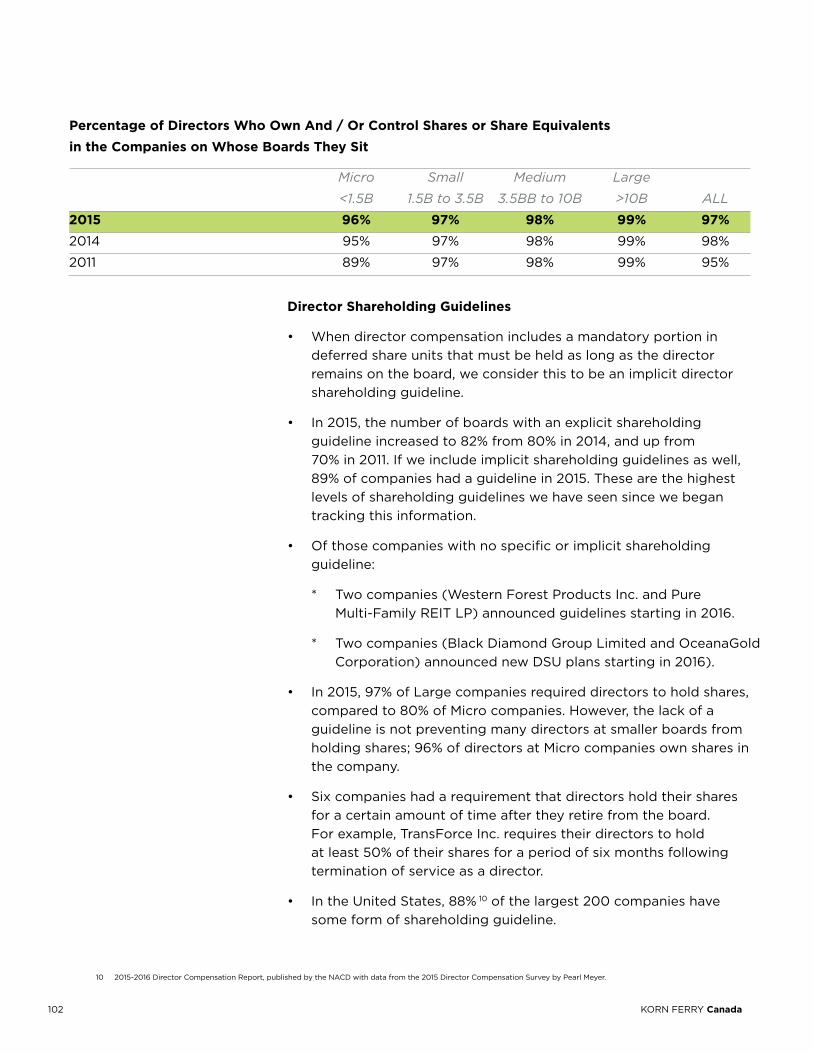
102 KORN FERRY Canada
Percentage of directors Who own And / or Control Shares or Share Equivalents in the Companies on Whose Boards They Sit
Micro Small Medium Large
<1.5B 1.5B to 3.5B 3.5BB to 10B >10B ALL
2015 96% 97% 98% 99% 97%2014 95% 97% 98% 99% 98%
2011 89% 97% 98% 99% 95%
director Shareholding Guidelines
• Whendirectorcompensationincludesamandatoryportionindeferred share units that must be held as long as the director remains on the board, we consider this to be an implicit director shareholding guideline.
• In2015,thenumberofboardswithanexplicitshareholdingguideline increased to 82% from 80% in 2014, and up from 70% in 2011. If we include implicit shareholding guidelines as well, 89% of companies had a guideline in 2015. These are the highest levels of shareholding guidelines we have seen since we began tracking this information.
• Ofthosecompanieswithnospecificorimplicitshareholdingguideline:
* Twocompanies(WesternForestProductsInc.andPure Multi-FamilyREITLP)announcedguidelinesstartingin2016.
* Twocompanies(BlackDiamondGroupLimitedandOceanaGold Corporation)announcednewDSUplansstartingin2016).
• In2015,97%ofLargecompaniesrequireddirectorstoholdshares,compared to 80% of Micro companies. However, the lack of a guideline is not preventing many directors at smaller boards from holding shares; 96% of directors at Micro companies own shares in the company.
• Sixcompanieshadarequirementthatdirectorsholdtheirsharesfor a certain amount of time after they retire from the board. Forexample,TransForceInc.requirestheirdirectorstohold at least 50% of their shares for a period of six months following termination of service as a director.
• IntheUnitedStates,88% 10 of the largest 200 companies have some form of shareholding guideline.
10 2015-2016 Director Compensation Report, published by the NACD with data from the 2015 Director Compensation Survey by Pearl Meyer.
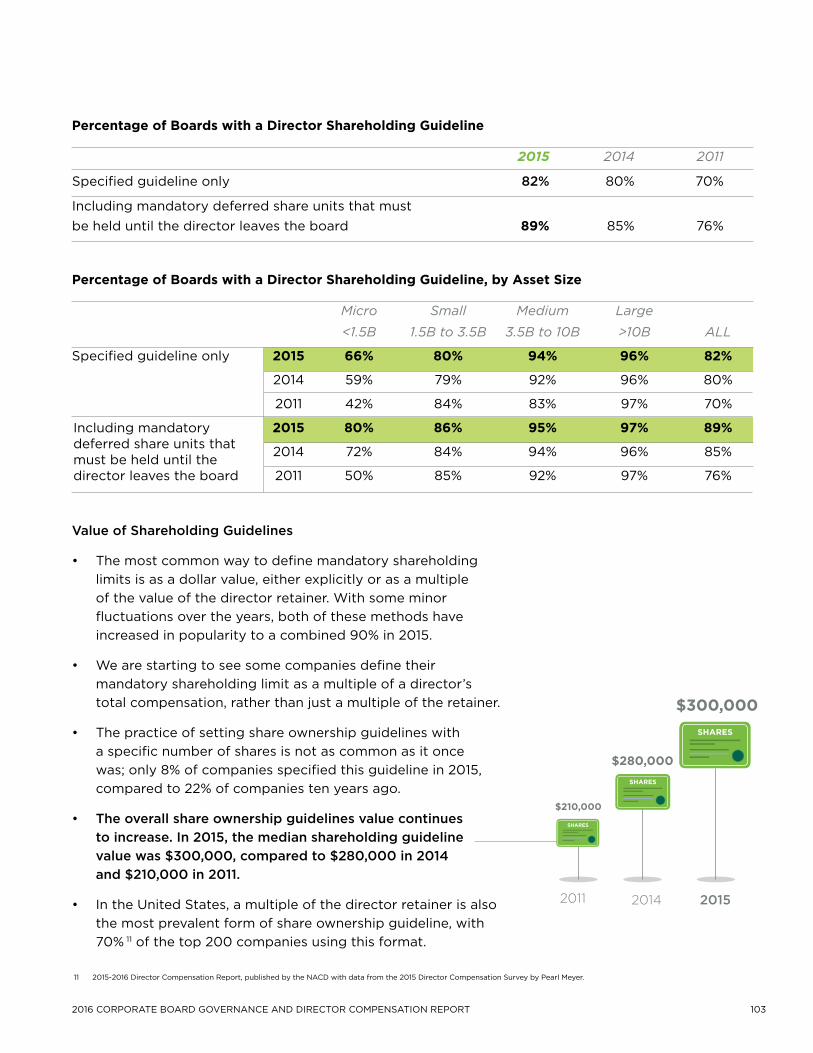
1032016 Corporate Board GovernanCe and direCtor Compensation report
Percentage of Boards with a director Shareholding Guideline
2015 2014 2011
Specified guideline only 82% 80% 70%
Including mandatory deferred share units that must be held until the director leaves the board 89% 85% 76%
Micro Small Medium Large
<1.5B 1.5B to 3.5B 3.5B to 10B >10B ALL
Specified guideline only 2015 66% 80% 94% 96% 82%
2014 59% 79% 92% 96% 80%
2011 42% 84% 83% 97% 70%
2015 80% 86% 95% 97% 89%
2014 72% 84% 94% 96% 85%
2011 50% 85% 92% 97% 76%
Percentage of Boards with a director Shareholding Guideline, by Asset Size
Including mandatory deferred share units that must be held until the director leaves the board
Value of Shareholding Guidelines
• Themostcommonwaytodefinemandatoryshareholdinglimits is as a dollar value, either explicitly or as a multiple of the value of the director retainer. With some minor fluctuations over the years, both of these methods have increased in popularity to a combined 90% in 2015.
• Wearestartingtoseesomecompaniesdefinetheirmandatory shareholding limit as a multiple of a director’s total compensation, rather than just a multiple of the retainer.
• Thepracticeofsettingshareownershipguidelineswitha specific number of shares is not as common as it once was; only 8% of companies specified this guideline in 2015, compared to 22% of companies ten years ago.
• The overall share ownership guidelines value continues to increase. In 2015, the median shareholding guideline value was $300,000, compared to $280,000 in 2014 and $210,000 in 2011.
• IntheUnitedStates,amultipleofthedirectorretainerisalsothe most prevalent form of share ownership guideline, with 70% 11 of the top 200 companies using this format.
201520142011
$210,000
$280,000
$300,000
11 2015-2016 Director Compensation Report, published by the NACD with data from the 2015 Director Compensation Survey by Pearl Meyer.
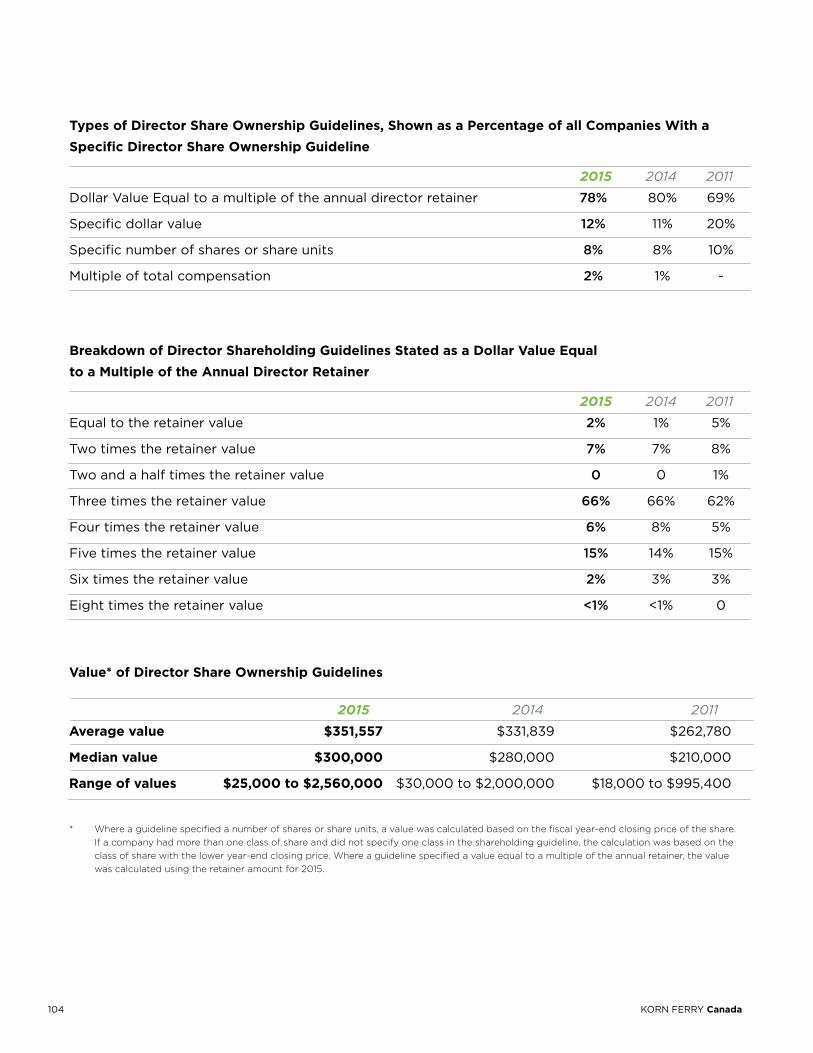
104 KORN FERRY Canada
Types of director Share ownership Guidelines, Shown as a Percentage of all Companies With a Specific director Share ownership Guideline
2015 2014 2011
DollarValueEqualtoamultipleoftheannualdirectorretainer 78% 80% 69%
Specific dollar value 12% 11% 20%
Specific number of shares or share units 8% 8% 10%
Multiple of total compensation 2% 1% -
Breakdown of director Shareholding Guidelines Stated as a dollar value Equal to a Multiple of the Annual director Retainer
2015 2014 2011
Equaltotheretainervalue 2% 1% 5%
Two times the retainer value 7% 7% 8%
Two and a half times the retainer value 0 0 1%
Three times the retainer value 66% 66% 62%
Four times the retainer value 6% 8% 5%
Five times the retainer value 15% 14% 15%
Six times the retainer value 2% 3% 3%
Eight times the retainer value <1% <1% 0
value* of director Share ownership Guidelines
2015 2014 2011
Average value $351,557 $331,839 $262,780
Median value $300,000 $280,000 $210,000
Range of values $25,000 to $2,560,000 $30,000 to $2,000,000 $18,000 to $995,400
* Whereaguidelinespecifiedanumberofsharesorshareunits,avaluewascalculatedbasedonthefiscalyear-endclosingpriceoftheshare.Ifacompanyhadmorethanoneclassofshareanddidnotspecifyoneclassintheshareholdingguideline,thecalculationwasbasedontheclassofsharewiththeloweryear-endclosingprice.Whereaguidelinespecifiedavalueequaltoamultipleoftheannualretainer,thevaluewascalculatedusingtheretaineramountfor2015.
1052016 Corporate Board GovernanCe and direCtor Compensation report
Company Data
The following pages contain data collected from annual reports, management proxy circulars and annual information forms regarding fiscal year-ends in late 2015 and early 2016. It is in alphabetical order by company name.
AnyadditionalexplanationrequiredforentriesisdetailedintheCompany Data Endnotes on pages 116 to 118.
Stock compensation is an increasingly important part of director compensation. It is represented in the Appendix as follows:
• Req’d: “X”inthiscolumnindicatesthatdirectorsmust take all or some of their compensation in either sharesorshareequivalents.
• Elect: “X”inthiscolumnindicatesthatdirectorscan elect to take all or some of their cash compensation in the form of shares or shareequivalents.
• Options: Valuesofstockoptionsarenotstated,however we do indicate which companies granted stock options to directors in fiscal 2015.
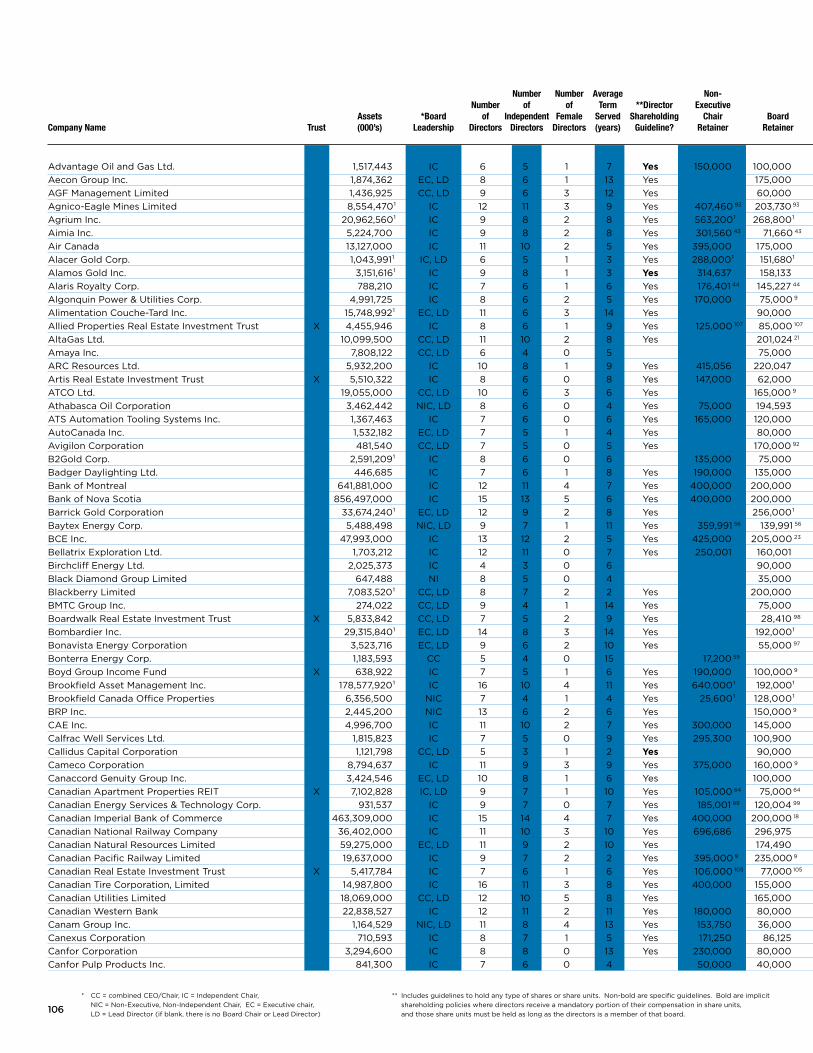
106106
Number Number Average Non- Number of of Term **Director Executive Lead Committee Chair Fee Stock Component Assets *Board of Independent Female Served Shareholding Chair Board Board Director Company Name Trust (000’s) Leadership Directors Directors Directors (years) Guideline? Retainer Retainer Meeting Fee Retainer Committee Retainer Committee Meeting Fee Regular: Retainer Bold: Meeting Fees Req’d Elect Options
Advantage Oil and Gas Ltd. 1,517,443 IC 6 5 1 7 yes 150,000 100,000 25,000 x Aecon Group Inc. 1,874,362 EC, LD 8 6 1 13 Yes 175,000 1,500 75,000 4,000 1,500 12,500 20,000 4,29 x x AGF Management Limited 1,436,925 CC, LD 9 6 3 12 Yes 60,000 30,000 2,000 4,000 17 6,000 4 4,000 7,000 17 20,000 4 x Agnico-Eagle Mines Limited 8,554,470¹ IC 12 11 3 9 Yes 407,460 93 203,730 93 10,000 25,000 4 x Agrium Inc. 20,962,560¹ IC 9 8 2 8 Yes 563,200¹ 268,800¹ 1,280¹ 4,480¹ 1,280¹ 1,920 1,4 11,520¹ 19,200 1,8 25,600 1,4 x x Aimia Inc. 5,224,700 IC 9 8 2 8 Yes 301,560 43 71,660 43 1,500 2,500 5,000 4 1,500 12,000 13,000 8 18,000 4 x x Air Canada 13,127,000 IC 11 10 2 5 Yes 395,000 175,000 5,000 10,000 24,39 10,000 20,000 24,39 x x Alacer Gold Corp. 1,043,991¹ IC, LD 6 5 1 3 Yes 288,000¹ 151,680¹ 12,800¹ 19,200 1,4 x Alamos Gold Inc. 3,151,616¹ IC 9 8 1 3 yes 314,637 158,133 5,000 6,000³ 10,000 4,96 20,000 x x Alaris Royalty Corp. 788,210 IC 7 6 1 6 Yes 176,401 44 145,227 44 x AlgonquinPower&UtilitiesCorp. 4,991,725 IC 8 6 2 5 Yes 170,00075,000 9 1,500 9 1,500 9 7,500 12,000 4 x x Alimentation Couche-Tard Inc. 15,748,992¹ EC, LD 11 6 3 14 Yes 90,000 2,000 30,000 3,060 2,000 25,000 x x Allied Properties Real Estate Investment Trust x 4,455,946 IC 8 6 1 9 Yes 125,000 107 85,000 107 10,000 25,000 4 x x AltaGas Ltd. 10,099,500 CC, LD 11 10 2 8 Yes 201,024 21 60,000 4,000 10,000 20,000 4 x x Amaya Inc. 7,808,122 CC, LD 6 4 0 5 75,000 xARC Resources Ltd. 5,932,200 IC 10 8 1 9 Yes 415,056 220,047 6,000 10,000 4 x x Artis Real Estate Investment Trust x 5,510,322 IC 8 6 0 8 Yes 147,000 62,000 2,000 71 4,500 7,000 4 2,000 71 10,000 30,000 4 x ATCO Ltd. 19,055,000 CC, LD 10 6 3 6 Yes 165,000 9 2,000 9,46 50,000 7,500 35 1,500 9 2,000 9,35 8,500 25,000 9,35 x x Athabasca Oil Corporation 3,462,442 NIC, LD 8 6 0 4 Yes 75,000 194,593 25,000 7,500 15,000 4 x x ATS Automation Tooling Systems Inc. 1,367,463 IC 7 6 0 6 Yes 165,000 120,000 1,500 1,500 10,000 20,000 67 x x AutoCanada Inc. 1,532,182 EC, LD 7 5 1 4 Yes 80,000 2,000 20,000 2,000 15,000 x x Avigilon Corporation 481,540 CC, LD 7 5 0 5 Yes 170,000 92 30,000 20,000 x B2Gold Corp. 2,591,209¹ IC 8 6 0 6 135,000 75,000 10,000 20,000 4 xBadger Daylighting Ltd. 446,685 IC 7 6 1 8 Yes 190,000 135,000 1,500 1,500 7,500 12,000 8 15,000 4 x x Bank of Montreal 641,881,000 IC 12 11 4 7 Yes 400,000 200,000 2,000 13 10,000 12 1,500 14 25,000 50,000 3,5,15 x x Bank of Nova Scotia 856,497,000 IC 15 13 5 6 Yes 400,000 200,000 25,000 50,000 3,5,15 x x Barrick Gold Corporation 33,674,240¹ EC, LD 12 9 2 8 Yes 256,000¹ 38,400¹ 3,840 1,4 19,200¹ 32,000 1,4 x x Baytex Energy Corp. 5,488,498 NIC, LD 9 7 1 11 Yes 359,991 56 139,991 56 1,500 25,000 10,000 4 1,500 8,000 25,000 4 x BCE Inc. 47,993,000 IC 13 12 2 5 Yes 425,000 205,000 23 20,000 2,24 45,000 4,17 x x Bellatrix Exploration Ltd. 1,703,212 IC 12 11 0 7 Yes 250,001 160,001 1,500 1,500 10,000 18,500 4 x x BirchcliffEnergyLtd. 2,025,373 IC 4 3 0 6 90,000 1,500 1,500 Black Diamond Group Limited 647,488 NI 8 5 0 4 35,000 1,500 1,500 5,000 4 xBlackberry Limited 7,083,520¹ CC, LD 8 7 2 2 Yes 200,000 20,000 25,000 35 x x BMTC Group Inc. 274,022 CC, LD 9 4 1 14 Yes 75,000 x Boardwalk Real Estate Investment Trust x 5,833,842 CC, LD 7 5 2 9 Yes 28,410 98 1,700 98 22,660 98 5,680 98 1,700 98 9,090 98 17,040 35,98 x Bombardier Inc. 29,315,840¹ EC, LD 14 8 3 14 Yes 192,000¹ 19,200¹ 6,400¹ 12,800¹ 25,600 1,4 x x Bonavista Energy Corporation 3,523,716 EC, LD 9 6 2 10 Yes 55,000 97 1,500 20,000 6,000 10,000 4 1,500 10,000 20,000 4 Bonterra Energy Corp. 1,183,593 CC 5 4 0 15 17,200 59 xBoyd Group Income Fund x 638,922 IC 7 5 1 6 Yes 190,000 100,000 9 2,500 17 5,000 4 Brookfield Asset Management Inc. 178,577,920¹ IC 16 10 4 11 Yes 640,000¹ 192,000¹ 12,800 1,4 19,200 1,5,31 44,800 1,4 x x Brookfield Canada Office Properties 6,356,500 NIC 7 4 1 4 Yes 25,600¹ 128,000¹ 25,600 1,4 x BRP Inc. 2,445,200 NIC 13 6 2 6 Yes 150,000 9 10,000 9 15,000 4 x x CAE Inc. 4,996,700 IC 11 10 2 7 Yes 300,000 145,000 10,000 25,000 x x Calfrac Well Services Ltd. 1,815,823 IC 7 5 0 9 Yes 295,300 100,900 1,200 1,200 2,000 4 8,000 12,000 17,102 16,000 4 x Callidus Capital Corporation 1,121,798 CC, LD 5 3 1 2 yes 90,000 2,500 2,500 x x Cameco Corporation 8,794,637 IC 11 9 3 9 Yes 375,000 160,000 9 1,500 9 5,000 9 1,500 9 2,000 8,9,67 11,000 20,000 8,9,67 x Canaccord Genuity Group Inc. 3,424,546 EC, LD 10 8 1 6 Yes 100,000 1,500 40,000 1,500 10,000 20,000 4 x x Canadian Apartment Properties REIT x 7,102,828 IC, LD 9 7 1 10 Yes 105,000 64 75,000 64 15,000 10,000 17,500 4 x Canadian Energy Services & Technology Corp. 931,537 IC 9 7 0 7 Yes 185,001 99 120,004 99 1,500 1,500 9,000 17,25 12,000 4 x x Canadian Imperial Bank of Commerce 463,309,000 IC 15 14 4 7 Yes 400,000 200,000 18 15,000 19 50,000 x x Canadian National Railway Company 36,402,000 IC 11 10 3 10 Yes 696,686 296,975 70,328 131 83,116 30 95,903 4,8,30 x x Canadian Natural Resources Limited 59,275,000 EC, LD 11 9 2 10 Yes 174,490 1,500 25,000 5,000 1,500 10,000 15,000 17 25,000 4 x Canadian Pacific Railway Limited 19,637,000 IC 9 7 2 2 Yes 395,000 9 235,000 9 30,000 9 x Canadian Real Estate Investment Trust x 5,417,784 IC 7 6 1 6 Yes 106,000 105 77,000 105 5,000 10,000 4,72 x Canadian Tire Corporation, Limited 14,987,800 IC 16 11 3 8 Yes 400,000 155,000 2,000 5,000 2,000 2,750 4 11,000 17,500 2,31 30,000 4 x Canadian Utilities Limited 18,069,000 CC, LD 12 10 5 8 Yes 165,000 2,000 78 75,000 7,500 35 1,500 79 2,000 35 8,500 25,000 35 x x Canadian Western Bank 22,838,527 IC 12 11 2 11 Yes 180,000 80,000 1,500 4,000 2,3 8,000 1,500 3,000 4,5 7,500² 15,000 x x Canam Group Inc. 1,164,529 NIC, LD 11 8 4 13 Yes 153,750 36,000 1,500 3,000 5,000 4 1,500 6,000 12,000 4 Canexus Corporation 710,593 IC 8 7 1 5 Yes 171,250 86,125 1,500 2,775 1,500 4,625 9,250 4 x x Canfor Corporation 3,294,600 IC 8 8 0 13 Yes 230,000 80,000 2,000 5,000 10,000 4,38 2,000 10,000 20,000 4,38 Canfor Pulp Products Inc. 841,300 IC 7 6 0 4 50,000 40,000 1,500 5,000 10,000 4,38 1,500 10,000 20,000 4,38
** Includes guidelines to hold any type of shares or share units. Non-bold are specific guidelines. Bold are implicit shareholding policies where directors receive a mandatory portion of their compensation in share units, and those share units must be held as long as the directors is a member of that board.
* CC=combinedCEO/Chair,IC=IndependentChair, NIC=Non-Executive,Non-IndependentChair,EC=Executivechair, LD=LeadDirector(ifblank,thereisnoBoardChairorLeadDirector)
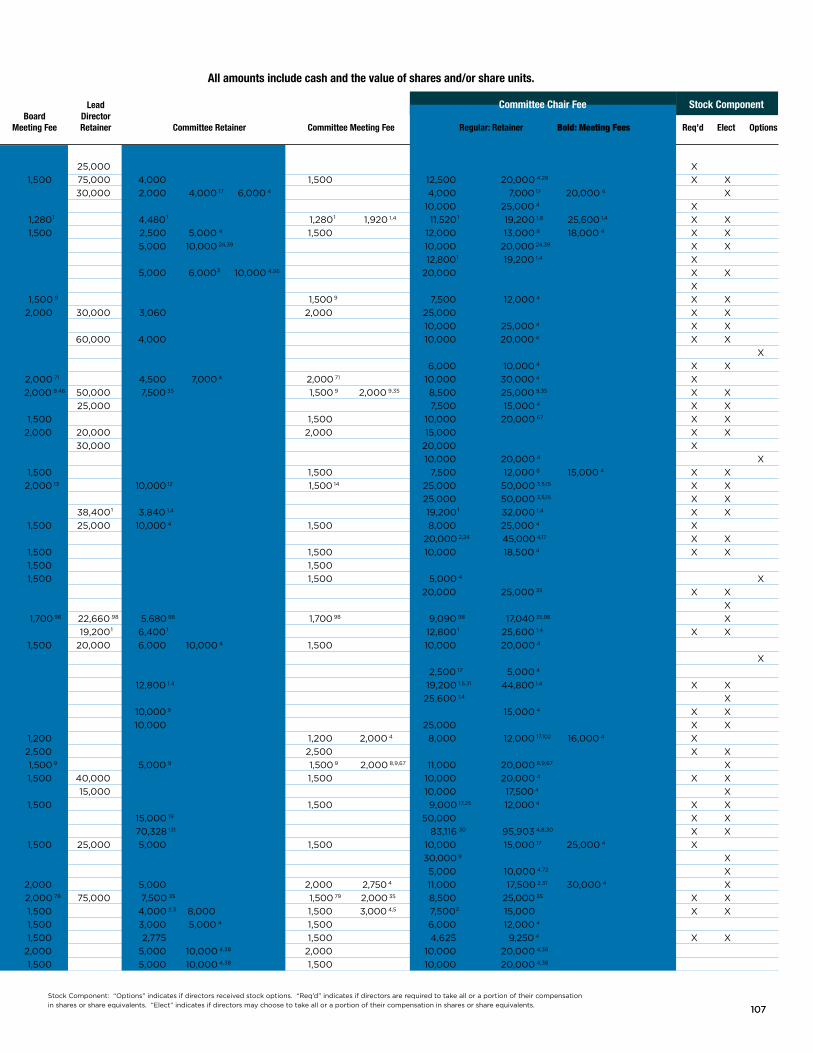
107
StockComponent:“Options”indicatesifdirectorsreceivedstockoptions.“Req’d”indicatesifdirectorsarerequiredtotakealloraportionoftheircompensationinsharesorshareequivalents.“Elect”indicatesifdirectorsmaychoosetotakealloraportionoftheircompensationinsharesorshareequivalents. 107
Number Number Average Non- Number of of Term **Director Executive Lead Committee Chair Fee Stock Component Assets *Board of Independent Female Served Shareholding Chair Board Board Director Company Name Trust (000’s) Leadership Directors Directors Directors (years) Guideline? Retainer Retainer Meeting Fee Retainer Committee Retainer Committee Meeting Fee Regular: Retainer Bold: Meeting Fees Req’d Elect Options
All amounts include cash and the value of shares and/or share units.
Advantage Oil and Gas Ltd. 1,517,443 IC 6 5 1 7 yes 150,000 100,000 25,000 x Aecon Group Inc. 1,874,362 EC, LD 8 6 1 13 Yes 175,000 1,500 75,000 4,000 1,500 12,500 20,000 4,29 x x AGF Management Limited 1,436,925 CC, LD 9 6 3 12 Yes 60,000 30,000 2,000 4,000 17 6,000 4 4,000 7,000 17 20,000 4 x Agnico-Eagle Mines Limited 8,554,470¹ IC 12 11 3 9 Yes 407,460 93 203,730 93 10,000 25,000 4 x Agrium Inc. 20,962,560¹ IC 9 8 2 8 Yes 563,200¹ 268,800¹ 1,280¹ 4,480¹ 1,280¹ 1,920 1,4 11,520¹ 19,200 1,8 25,600 1,4 x x Aimia Inc. 5,224,700 IC 9 8 2 8 Yes 301,560 43 71,660 43 1,500 2,500 5,000 4 1,500 12,000 13,000 8 18,000 4 x x Air Canada 13,127,000 IC 11 10 2 5 Yes 395,000 175,000 5,000 10,000 24,39 10,000 20,000 24,39 x x Alacer Gold Corp. 1,043,991¹ IC, LD 6 5 1 3 Yes 288,000¹ 151,680¹ 12,800¹ 19,200 1,4 x Alamos Gold Inc. 3,151,616¹ IC 9 8 1 3 yes 314,637 158,133 5,000 6,000³ 10,000 4,96 20,000 x x Alaris Royalty Corp. 788,210 IC 7 6 1 6 Yes 176,401 44 145,227 44 x AlgonquinPower&UtilitiesCorp. 4,991,725 IC 8 6 2 5 Yes 170,00075,000 9 1,500 9 1,500 9 7,500 12,000 4 x x Alimentation Couche-Tard Inc. 15,748,992¹ EC, LD 11 6 3 14 Yes 90,000 2,000 30,000 3,060 2,000 25,000 x x Allied Properties Real Estate Investment Trust x 4,455,946 IC 8 6 1 9 Yes 125,000 107 85,000 107 10,000 25,000 4 x x AltaGas Ltd. 10,099,500 CC, LD 11 10 2 8 Yes 201,024 21 60,000 4,000 10,000 20,000 4 x x Amaya Inc. 7,808,122 CC, LD 6 4 0 5 75,000 xARC Resources Ltd. 5,932,200 IC 10 8 1 9 Yes 415,056 220,047 6,000 10,000 4 x x Artis Real Estate Investment Trust x 5,510,322 IC 8 6 0 8 Yes 147,000 62,000 2,000 71 4,500 7,000 4 2,000 71 10,000 30,000 4 x ATCO Ltd. 19,055,000 CC, LD 10 6 3 6 Yes 165,000 9 2,000 9,46 50,000 7,500 35 1,500 9 2,000 9,35 8,500 25,000 9,35 x x Athabasca Oil Corporation 3,462,442 NIC, LD 8 6 0 4 Yes 75,000 194,593 25,000 7,500 15,000 4 x x ATS Automation Tooling Systems Inc. 1,367,463 IC 7 6 0 6 Yes 165,000 120,000 1,500 1,500 10,000 20,000 67 x x AutoCanada Inc. 1,532,182 EC, LD 7 5 1 4 Yes 80,000 2,000 20,000 2,000 15,000 x x Avigilon Corporation 481,540 CC, LD 7 5 0 5 Yes 170,000 92 30,000 20,000 x B2Gold Corp. 2,591,209¹ IC 8 6 0 6 135,000 75,000 10,000 20,000 4 xBadger Daylighting Ltd. 446,685 IC 7 6 1 8 Yes 190,000 135,000 1,500 1,500 7,500 12,000 8 15,000 4 x x Bank of Montreal 641,881,000 IC 12 11 4 7 Yes 400,000 200,000 2,000 13 10,000 12 1,500 14 25,000 50,000 3,5,15 x x Bank of Nova Scotia 856,497,000 IC 15 13 5 6 Yes 400,000 200,000 25,000 50,000 3,5,15 x x Barrick Gold Corporation 33,674,240¹ EC, LD 12 9 2 8 Yes 256,000¹ 38,400¹ 3,840 1,4 19,200¹ 32,000 1,4 x x Baytex Energy Corp. 5,488,498 NIC, LD 9 7 1 11 Yes 359,991 56 139,991 56 1,500 25,000 10,000 4 1,500 8,000 25,000 4 x BCE Inc. 47,993,000 IC 13 12 2 5 Yes 425,000 205,000 23 20,000 2,24 45,000 4,17 x x Bellatrix Exploration Ltd. 1,703,212 IC 12 11 0 7 Yes 250,001 160,001 1,500 1,500 10,000 18,500 4 x x BirchcliffEnergyLtd. 2,025,373 IC 4 3 0 6 90,000 1,500 1,500 Black Diamond Group Limited 647,488 NI 8 5 0 4 35,000 1,500 1,500 5,000 4 xBlackberry Limited 7,083,520¹ CC, LD 8 7 2 2 Yes 200,000 20,000 25,000 35 x x BMTC Group Inc. 274,022 CC, LD 9 4 1 14 Yes 75,000 x Boardwalk Real Estate Investment Trust x 5,833,842 CC, LD 7 5 2 9 Yes 28,410 98 1,700 98 22,660 98 5,680 98 1,700 98 9,090 98 17,040 35,98 x Bombardier Inc. 29,315,840¹ EC, LD 14 8 3 14 Yes 192,000¹ 19,200¹ 6,400¹ 12,800¹ 25,600 1,4 x x Bonavista Energy Corporation 3,523,716 EC, LD 9 6 2 10 Yes 55,000 97 1,500 20,000 6,000 10,000 4 1,500 10,000 20,000 4 Bonterra Energy Corp. 1,183,593 CC 5 4 0 15 17,200 59 xBoyd Group Income Fund x 638,922 IC 7 5 1 6 Yes 190,000 100,000 9 2,500 17 5,000 4 Brookfield Asset Management Inc. 178,577,920¹ IC 16 10 4 11 Yes 640,000¹ 192,000¹ 12,800 1,4 19,200 1,5,31 44,800 1,4 x x Brookfield Canada Office Properties 6,356,500 NIC 7 4 1 4 Yes 25,600¹ 128,000¹ 25,600 1,4 x BRP Inc. 2,445,200 NIC 13 6 2 6 Yes 150,000 9 10,000 9 15,000 4 x x CAE Inc. 4,996,700 IC 11 10 2 7 Yes 300,000 145,000 10,000 25,000 x x Calfrac Well Services Ltd. 1,815,823 IC 7 5 0 9 Yes 295,300 100,900 1,200 1,200 2,000 4 8,000 12,000 17,102 16,000 4 x Callidus Capital Corporation 1,121,798 CC, LD 5 3 1 2 yes 90,000 2,500 2,500 x x Cameco Corporation 8,794,637 IC 11 9 3 9 Yes 375,000 160,000 9 1,500 9 5,000 9 1,500 9 2,000 8,9,67 11,000 20,000 8,9,67 x Canaccord Genuity Group Inc. 3,424,546 EC, LD 10 8 1 6 Yes 100,000 1,500 40,000 1,500 10,000 20,000 4 x x Canadian Apartment Properties REIT x 7,102,828 IC, LD 9 7 1 10 Yes 105,000 64 75,000 64 15,000 10,000 17,500 4 x Canadian Energy Services & Technology Corp. 931,537 IC 9 7 0 7 Yes 185,001 99 120,004 99 1,500 1,500 9,000 17,25 12,000 4 x x Canadian Imperial Bank of Commerce 463,309,000 IC 15 14 4 7 Yes 400,000 200,000 18 15,000 19 50,000 x x Canadian National Railway Company 36,402,000 IC 11 10 3 10 Yes 696,686 296,975 70,328 131 83,116 30 95,903 4,8,30 x x Canadian Natural Resources Limited 59,275,000 EC, LD 11 9 2 10 Yes 174,490 1,500 25,000 5,000 1,500 10,000 15,000 17 25,000 4 x Canadian Pacific Railway Limited 19,637,000 IC 9 7 2 2 Yes 395,000 9 235,000 9 30,000 9 x Canadian Real Estate Investment Trust x 5,417,784 IC 7 6 1 6 Yes 106,000 105 77,000 105 5,000 10,000 4,72 x Canadian Tire Corporation, Limited 14,987,800 IC 16 11 3 8 Yes 400,000 155,000 2,000 5,000 2,000 2,750 4 11,000 17,500 2,31 30,000 4 x Canadian Utilities Limited 18,069,000 CC, LD 12 10 5 8 Yes 165,000 2,000 78 75,000 7,500 35 1,500 79 2,000 35 8,500 25,000 35 x x Canadian Western Bank 22,838,527 IC 12 11 2 11 Yes 180,000 80,000 1,500 4,000 2,3 8,000 1,500 3,000 4,5 7,500² 15,000 x x Canam Group Inc. 1,164,529 NIC, LD 11 8 4 13 Yes 153,750 36,000 1,500 3,000 5,000 4 1,500 6,000 12,000 4 Canexus Corporation 710,593 IC 8 7 1 5 Yes 171,250 86,125 1,500 2,775 1,500 4,625 9,250 4 x x Canfor Corporation 3,294,600 IC 8 8 0 13 Yes 230,000 80,000 2,000 5,000 10,000 4,38 2,000 10,000 20,000 4,38 Canfor Pulp Products Inc. 841,300 IC 7 6 0 4 50,000 40,000 1,500 5,000 10,000 4,38 1,500 10,000 20,000 4,38
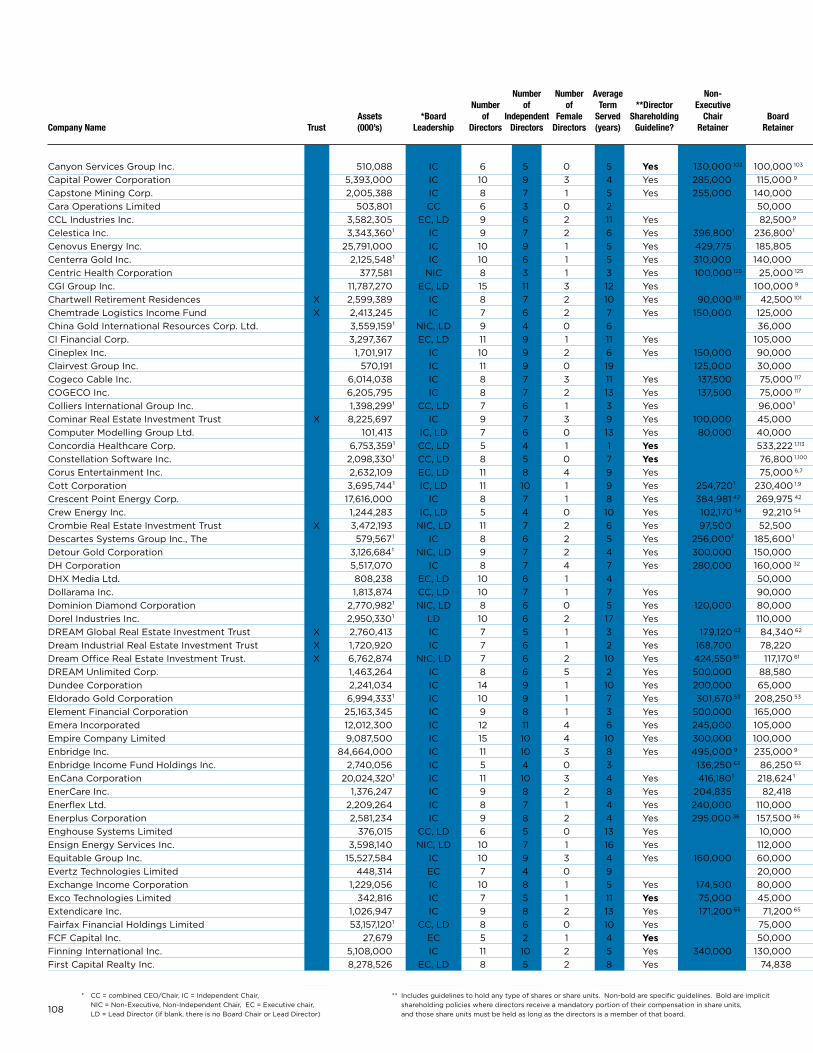
108
Number Number Average Non- Number of of Term **Director Executive Lead Committee Chair Fee Stock Component Assets *Board of Independent Female Served Shareholding Chair Board Board Director Company Name Trust (000’s) Leadership Directors Directors Directors (years) Guideline? Retainer Retainer Meeting Fee Retainer Committee Retainer Committee Meeting Fee Regular: Retainer Bold: Meeting Fees Req’d Elect Options
Canyon Services Group Inc. 510,088 IC 6 5 0 5 yes 130,000 103 100,000 103 1,250 1,250 5,000 15,000 4 x Capital Power Corporation 5,393,000 IC 10 9 3 4 Yes 285,000 115,000 9 1,500 9 1,500 9 10,000 9 16,000 4,29 x x Capstone Mining Corp. 2,005,388 IC 8 7 1 5 Yes 255,000 140,000 10,000 15,000 8 20,000 4 x x xCara Operations Limited 503,801 CC 6 3 0 2 50,000 x CCL Industries Inc. 3,582,305 EC, LD 9 6 2 11 Yes 82,500 9 2,000 9 12,500 2,000 9 7,500 9 12,500 4 x Celestica Inc. 3,343,360¹ IC 9 7 2 6 Yes 396,800¹ 236,800¹ 3,200 1,16 3,200 1,16 19,200 1,17 25,600 1,4 x x Cenovus Energy Inc. 25,791,000 IC 10 9 1 5 Yes 429,775 185,805 1,500 1,500 7,500 15,000 4 x x Centerra Gold Inc. 2,125,548¹ IC 10 6 1 5 Yes 310,000 140,000 1,500 1,500 10,000 25 16,000 8 25,000 4 x Centric Health Corporation 377,581 NIC 8 3 1 3 Yes 100,000 125 25,000 125 1,500 750 1,000 4 3,500 8,25 15,000 4 x CGI Group Inc. 11,787,270 EC, LD 15 11 3 12 Yes 100,000 9 1,500 9,10 15,000 2,000 9 2,500 9,10 10,000² 15,000 x x xChartwell Retirement Residences x 2,599,389 IC 8 7 2 10 Yes 90,000 101 42,500 101 1,500 101 1,500 101 12,500 101 x Chemtrade Logistics Income Fund x 2,413,245 IC 7 6 2 7 Yes 150,000 125,000 x x China Gold International Resources Corp. Ltd. 3,559,159¹ NIC, LD 9 4 0 6 36,000 6,000 CI Financial Corp. 3,297,367 EC, LD 11 9 1 11 Yes 105,000 25,000 40,000 4 Cineplex Inc. 1,701,917 IC 10 9 2 6 Yes 150,000 90,000 15,000 20,000 4 x Clairvest Group Inc. 570,191 IC 11 9 0 19 125,000 30,000 1,500 1,500 3,000 10,000 4 x Cogeco Cable Inc. 6,014,038 IC 8 7 3 11 Yes 137,500 75,000 117 1,500 3,000 4,000³ 5,000 4 1,500 7,000² 10,000 15,000 4 x COGECO Inc. 6,205,795 IC 8 7 2 13 Yes 137,500 75,000 117 1,500 3,000 4,000³ 5,000 4 1,500 7,000² 10,000 15,000 4 x Colliers International Group Inc. 1,398,299¹ CC, LD 7 6 1 3 Yes 96,000¹ 1,920¹ 64,000¹ 1,920¹ 6,400¹ 19,200 1,35 xCominar Real Estate Investment Trust x 8,225,697 IC 9 7 3 9 Yes 100,000 45,000 1,500 5,000 1,500 8,500 15,000 4 Computer Modelling Group Ltd. 101,413 IC, LD 7 6 0 13 Yes 80,000 40,000 2,000 5,000 11,000 2,000 14,000 17,000 4 xConcordia Healthcare Corp. 6,753,359¹ CC, LD 5 4 1 1 yes 533,222 1,113 x Constellation Software Inc. 2,098,330¹ CC, LD 8 5 0 7 yes 76,800 1,100 25,600 1,100 x Corus Entertainment Inc. 2,632,109 EC, LD 11 8 4 9 Yes 75,000 6,7 10,000 5,000 8,500 15,000 4,8 x Cott Corporation 3,695,744¹ IC, LD 11 10 1 9 Yes 254,720¹ 230,400 1,9 38,400 1,9 12,800 1,9 19,200 1,9,17 22,400 1,4 x Crescent Point Energy Corp. 17,616,000 IC 8 7 1 8 Yes 384,981 42 269,975 42 1,500 1,500 6,000 10,000 17 12,500 4 x Crew Energy Inc. 1,244,283 IC, LD 5 4 0 10 Yes 102,170 54 92,210 54 5,000 10,000 17 7,500 4 x Crombie Real Estate Investment Trust x 3,472,193 NIC, LD 11 7 2 6 Yes 97,500 52,500 1,500 14,000 3,500 8,000 10,000³ 15,000 4 x x Descartes Systems Group Inc., The 579,567¹ IC 8 6 2 5 Yes 256,000¹ 185,600¹ 1,600¹ 4,800 1,2 6,400 1,17 12,800 1,4 3,200¹ 10,240 1,2 12,800 1,17 19,200 1,4 x x Detour Gold Corporation 3,126,684¹ NIC, LD 9 7 2 4 Yes 300,000 150,000 1,500 25,000 1,500 10,000 18,000 8 20,000 4 x x xDH Corporation 5,517,070 IC 8 7 4 7 Yes 280,000 160,000 32 34 5,000 33 10,000 20,000 4 x x DHx Media Ltd. 808,238 EC, LD 10 6 1 4 50,000 2,000 10,000 2,000 15,000 xDollarama Inc. 1,813,874 CC, LD 10 7 1 7 Yes 90,000 1,500 20,000 3,000 5,000 4 1,500 6,000 12,500 4 x x Dominion Diamond Corporation 2,770,982¹ NIC, LD 8 6 0 5 Yes 120,000 80,000 1,500 20,000 1,500 5,000 10,000 8 15,000 4 x Dorel Industries Inc. 2,950,330¹ LD 10 6 2 17 Yes 110,000 1,500 35,000 3,000 5,000 4 1,500 10,000 15,000 8 25,000 4 x DREAM Global Real Estate Investment Trust x 2,760,413 IC 7 5 1 3 Yes 179,120 62 84,340 62 1,500 1,500 3,000 20,000 4 x x Dream Industrial Real Estate Investment Trust x 1,720,920 IC 7 6 1 2 Yes 168,700 78,220 1,500 1,500 5,000 20,000 4 x x Dream Office Real Estate Investment Trust. x 6,762,874 NIC, LD 7 6 2 10 Yes 424,550 61 117,170 61 1,500 10,000 4 1,500 5,000 20,000 4 x x DREAM Unlimited Corp. 1,463,264 IC 8 6 5 2 Yes 500,000 88,580 1,500 5,000 4 1,500 5,000 20,000 4 x x Dundee Corporation 2,241,034 IC 14 9 1 10 Yes 200,000 65,000 1,500 7,500 1,500 15,000 35,000 4 x x Eldorado Gold Corporation 6,994,333¹ IC 10 9 1 7 Yes 301,670 53 208,250 53 1,500 1,500 15,000 25,000 17 40,000 4 x x xElement Financial Corporation 25,163,345 IC 9 8 1 3 Yes 500,000 165,000 1,500 6,750 1,500 13,500 x x Emera Incorporated 12,012,300 IC 12 11 4 6 Yes 245,000 105,000 3,000 5,000 4 10,000 15,000 31 20,000 4 x x Empire Company Limited 9,087,500 IC 15 10 4 10 Yes 300,000 100,000 2,000 4,000 5,000 3,4 2,000 15,000 25,000³ 30,000 4 x Enbridge Inc. 84,664,000 IC 11 10 3 8 Yes 495,000 9 235,000 9 10,000 9 15,000 40 20,000 8 25,000 9,39 x xEnbridge Income Fund Holdings Inc. 2,740,056 IC 5 4 0 3 136,250 63 86,250 63 24,000 39,63 EnCana Corporation 20,024,320¹ IC 11 10 3 4 Yes 416,180¹ 218,624¹ 10,010¹ 15,014 1,8 20,019 1,4 x x EnerCare Inc. 1,376,247 IC 9 8 2 8 Yes 204,835 82,418 1,500 3,000 5,000 4 1,500 8,000 15,000 4 x x Enerflex Ltd. 2,209,264 IC 8 7 1 4 Yes 240,000 110,000 2,000 5,000 2,000 10,000 12,000 8 20,000 4 x x Enerplus Corporation 2,581,234 IC 9 8 2 4 Yes 295,000 36 157,500 36 10,000 20,000 8,35 x x Enghouse Systems Limited 376,015 CC, LD 6 5 0 13 Yes 10,000 1,250 1,250 15,000 4 xEnsign Energy Services Inc. 3,598,140 NIC, LD 10 7 1 16 Yes 112,000 1,200 8,000 2,400 4,000 4 1,200 6,000 12,000 4 x x EquitableGroupInc. 15,527,584 IC 10 9 3 4 Yes 160,000 60,000 1,500 1,500 10,00015,000 8 20,000 4 x Evertz Technologies Limited 448,314 EC 7 4 0 9 20,000 1,000 3,000 1,000 5,000 10,000 4 Exchange Income Corporation 1,229,056 IC 10 8 1 5 Yes 174,500 80,000 1,500 5,000 1,500 10,000 15,000 4 x Exco Technologies Limited 342,816 IC 7 5 1 11 yes 75,000 45,000 1,500 1,500 5,000 10,000 4 x Extendicare Inc. 1,026,947 IC 9 8 2 13 Yes 171,200 65 71,200 65 2,000 5,000 4 2,000 10,000 25,000 4 x Fairfax Financial Holdings Limited 53,157,120¹ CC, LD 8 6 0 10 Yes 75,000 10,000 5,000 10,000 4 FCF Capital Inc. 27,679 EC 5 2 1 4 yes 50,000 x Finning International Inc. 5,108,000 IC 11 10 2 5 Yes 340,000 130,000 1,500 40,000 3,000 6,000 4 1,500 10,000 15,000 3 20,000 4 x x First Capital Realty Inc. 8,278,526 EC, LD 8 5 2 8 Yes 74,838 1,500 10,000 5,000 4 1,500 10,000 72 15,000 4 x x
** Includes guidelines to hold any type of shares or share units. Non-bold are specific guidelines. Bold are implicit shareholding policies where directors receive a mandatory portion of their compensation in share units, and those share units must be held as long as the directors is a member of that board.
* CC=combinedCEO/Chair,IC=IndependentChair, NIC=Non-Executive,Non-IndependentChair,EC=Executivechair, LD=LeadDirector(ifblank,thereisnoBoardChairorLeadDirector)
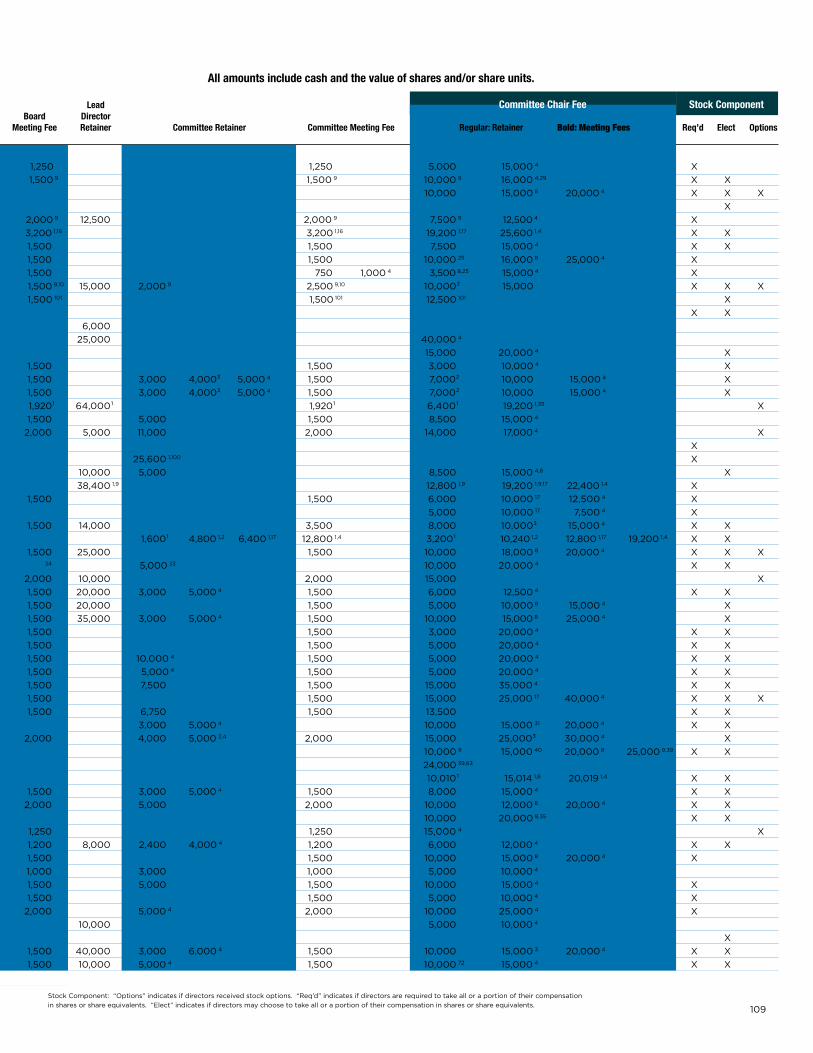
109
Number Number Average Non- Number of of Term **Director Executive Lead Committee Chair Fee Stock Component Assets *Board of Independent Female Served Shareholding Chair Board Board Director Company Name Trust (000’s) Leadership Directors Directors Directors (years) Guideline? Retainer Retainer Meeting Fee Retainer Committee Retainer Committee Meeting Fee Regular: Retainer Bold: Meeting Fees Req’d Elect Options
All amounts include cash and the value of shares and/or share units.
Canyon Services Group Inc. 510,088 IC 6 5 0 5 yes 130,000 103 100,000 103 1,250 1,250 5,000 15,000 4 x Capital Power Corporation 5,393,000 IC 10 9 3 4 Yes 285,000 115,000 9 1,500 9 1,500 9 10,000 9 16,000 4,29 x x Capstone Mining Corp. 2,005,388 IC 8 7 1 5 Yes 255,000 140,000 10,000 15,000 8 20,000 4 x x xCara Operations Limited 503,801 CC 6 3 0 2 50,000 x CCL Industries Inc. 3,582,305 EC, LD 9 6 2 11 Yes 82,500 9 2,000 9 12,500 2,000 9 7,500 9 12,500 4 x Celestica Inc. 3,343,360¹ IC 9 7 2 6 Yes 396,800¹ 236,800¹ 3,200 1,16 3,200 1,16 19,200 1,17 25,600 1,4 x x Cenovus Energy Inc. 25,791,000 IC 10 9 1 5 Yes 429,775 185,805 1,500 1,500 7,500 15,000 4 x x Centerra Gold Inc. 2,125,548¹ IC 10 6 1 5 Yes 310,000 140,000 1,500 1,500 10,000 25 16,000 8 25,000 4 x Centric Health Corporation 377,581 NIC 8 3 1 3 Yes 100,000 125 25,000 125 1,500 750 1,000 4 3,500 8,25 15,000 4 x CGI Group Inc. 11,787,270 EC, LD 15 11 3 12 Yes 100,000 9 1,500 9,10 15,000 2,000 9 2,500 9,10 10,000² 15,000 x x xChartwell Retirement Residences x 2,599,389 IC 8 7 2 10 Yes 90,000 101 42,500 101 1,500 101 1,500 101 12,500 101 x Chemtrade Logistics Income Fund x 2,413,245 IC 7 6 2 7 Yes 150,000 125,000 x x China Gold International Resources Corp. Ltd. 3,559,159¹ NIC, LD 9 4 0 6 36,000 6,000 CI Financial Corp. 3,297,367 EC, LD 11 9 1 11 Yes 105,000 25,000 40,000 4 Cineplex Inc. 1,701,917 IC 10 9 2 6 Yes 150,000 90,000 15,000 20,000 4 x Clairvest Group Inc. 570,191 IC 11 9 0 19 125,000 30,000 1,500 1,500 3,000 10,000 4 x Cogeco Cable Inc. 6,014,038 IC 8 7 3 11 Yes 137,500 75,000 117 1,500 3,000 4,000³ 5,000 4 1,500 7,000² 10,000 15,000 4 x COGECO Inc. 6,205,795 IC 8 7 2 13 Yes 137,500 75,000 117 1,500 3,000 4,000³ 5,000 4 1,500 7,000² 10,000 15,000 4 x Colliers International Group Inc. 1,398,299¹ CC, LD 7 6 1 3 Yes 96,000¹ 1,920¹ 64,000¹ 1,920¹ 6,400¹ 19,200 1,35 xCominar Real Estate Investment Trust x 8,225,697 IC 9 7 3 9 Yes 100,000 45,000 1,500 5,000 1,500 8,500 15,000 4 Computer Modelling Group Ltd. 101,413 IC, LD 7 6 0 13 Yes 80,000 40,000 2,000 5,000 11,000 2,000 14,000 17,000 4 xConcordia Healthcare Corp. 6,753,359¹ CC, LD 5 4 1 1 yes 533,222 1,113 x Constellation Software Inc. 2,098,330¹ CC, LD 8 5 0 7 yes 76,800 1,100 25,600 1,100 x Corus Entertainment Inc. 2,632,109 EC, LD 11 8 4 9 Yes 75,000 6,7 10,000 5,000 8,500 15,000 4,8 x Cott Corporation 3,695,744¹ IC, LD 11 10 1 9 Yes 254,720¹ 230,400 1,9 38,400 1,9 12,800 1,9 19,200 1,9,17 22,400 1,4 x Crescent Point Energy Corp. 17,616,000 IC 8 7 1 8 Yes 384,981 42 269,975 42 1,500 1,500 6,000 10,000 17 12,500 4 x Crew Energy Inc. 1,244,283 IC, LD 5 4 0 10 Yes 102,170 54 92,210 54 5,000 10,000 17 7,500 4 x Crombie Real Estate Investment Trust x 3,472,193 NIC, LD 11 7 2 6 Yes 97,500 52,500 1,500 14,000 3,500 8,000 10,000³ 15,000 4 x x Descartes Systems Group Inc., The 579,567¹ IC 8 6 2 5 Yes 256,000¹ 185,600¹ 1,600¹ 4,800 1,2 6,400 1,17 12,800 1,4 3,200¹ 10,240 1,2 12,800 1,17 19,200 1,4 x x Detour Gold Corporation 3,126,684¹ NIC, LD 9 7 2 4 Yes 300,000 150,000 1,500 25,000 1,500 10,000 18,000 8 20,000 4 x x xDH Corporation 5,517,070 IC 8 7 4 7 Yes 280,000 160,000 32 34 5,000 33 10,000 20,000 4 x x DHx Media Ltd. 808,238 EC, LD 10 6 1 4 50,000 2,000 10,000 2,000 15,000 xDollarama Inc. 1,813,874 CC, LD 10 7 1 7 Yes 90,000 1,500 20,000 3,000 5,000 4 1,500 6,000 12,500 4 x x Dominion Diamond Corporation 2,770,982¹ NIC, LD 8 6 0 5 Yes 120,000 80,000 1,500 20,000 1,500 5,000 10,000 8 15,000 4 x Dorel Industries Inc. 2,950,330¹ LD 10 6 2 17 Yes 110,000 1,500 35,000 3,000 5,000 4 1,500 10,000 15,000 8 25,000 4 x DREAM Global Real Estate Investment Trust x 2,760,413 IC 7 5 1 3 Yes 179,120 62 84,340 62 1,500 1,500 3,000 20,000 4 x x Dream Industrial Real Estate Investment Trust x 1,720,920 IC 7 6 1 2 Yes 168,700 78,220 1,500 1,500 5,000 20,000 4 x x Dream Office Real Estate Investment Trust. x 6,762,874 NIC, LD 7 6 2 10 Yes 424,550 61 117,170 61 1,500 10,000 4 1,500 5,000 20,000 4 x x DREAM Unlimited Corp. 1,463,264 IC 8 6 5 2 Yes 500,000 88,580 1,500 5,000 4 1,500 5,000 20,000 4 x x Dundee Corporation 2,241,034 IC 14 9 1 10 Yes 200,000 65,000 1,500 7,500 1,500 15,000 35,000 4 x x Eldorado Gold Corporation 6,994,333¹ IC 10 9 1 7 Yes 301,670 53 208,250 53 1,500 1,500 15,000 25,000 17 40,000 4 x x xElement Financial Corporation 25,163,345 IC 9 8 1 3 Yes 500,000 165,000 1,500 6,750 1,500 13,500 x x Emera Incorporated 12,012,300 IC 12 11 4 6 Yes 245,000 105,000 3,000 5,000 4 10,000 15,000 31 20,000 4 x x Empire Company Limited 9,087,500 IC 15 10 4 10 Yes 300,000 100,000 2,000 4,000 5,000 3,4 2,000 15,000 25,000³ 30,000 4 x Enbridge Inc. 84,664,000 IC 11 10 3 8 Yes 495,000 9 235,000 9 10,000 9 15,000 40 20,000 8 25,000 9,39 x xEnbridge Income Fund Holdings Inc. 2,740,056 IC 5 4 0 3 136,250 63 86,250 63 24,000 39,63 EnCana Corporation 20,024,320¹ IC 11 10 3 4 Yes 416,180¹ 218,624¹ 10,010¹ 15,014 1,8 20,019 1,4 x x EnerCare Inc. 1,376,247 IC 9 8 2 8 Yes 204,835 82,418 1,500 3,000 5,000 4 1,500 8,000 15,000 4 x x Enerflex Ltd. 2,209,264 IC 8 7 1 4 Yes 240,000 110,000 2,000 5,000 2,000 10,000 12,000 8 20,000 4 x x Enerplus Corporation 2,581,234 IC 9 8 2 4 Yes 295,000 36 157,500 36 10,000 20,000 8,35 x x Enghouse Systems Limited 376,015 CC, LD 6 5 0 13 Yes 10,000 1,250 1,250 15,000 4 xEnsign Energy Services Inc. 3,598,140 NIC, LD 10 7 1 16 Yes 112,000 1,200 8,000 2,400 4,000 4 1,200 6,000 12,000 4 x x EquitableGroupInc. 15,527,584 IC 10 9 3 4 Yes 160,000 60,000 1,500 1,500 10,00015,000 8 20,000 4 x Evertz Technologies Limited 448,314 EC 7 4 0 9 20,000 1,000 3,000 1,000 5,000 10,000 4 Exchange Income Corporation 1,229,056 IC 10 8 1 5 Yes 174,500 80,000 1,500 5,000 1,500 10,000 15,000 4 x Exco Technologies Limited 342,816 IC 7 5 1 11 yes 75,000 45,000 1,500 1,500 5,000 10,000 4 x Extendicare Inc. 1,026,947 IC 9 8 2 13 Yes 171,200 65 71,200 65 2,000 5,000 4 2,000 10,000 25,000 4 x Fairfax Financial Holdings Limited 53,157,120¹ CC, LD 8 6 0 10 Yes 75,000 10,000 5,000 10,000 4 FCF Capital Inc. 27,679 EC 5 2 1 4 yes 50,000 x Finning International Inc. 5,108,000 IC 11 10 2 5 Yes 340,000 130,000 1,500 40,000 3,000 6,000 4 1,500 10,000 15,000 3 20,000 4 x x First Capital Realty Inc. 8,278,526 EC, LD 8 5 2 8 Yes 74,838 1,500 10,000 5,000 4 1,500 10,000 72 15,000 4 x x
StockComponent:“Options”indicatesifdirectorsreceivedstockoptions.“Req’d”indicatesifdirectorsarerequiredtotakealloraportionoftheircompensationinsharesorshareequivalents.“Elect”indicatesifdirectorsmaychoosetotakealloraportionoftheircompensationinsharesorshareequivalents.
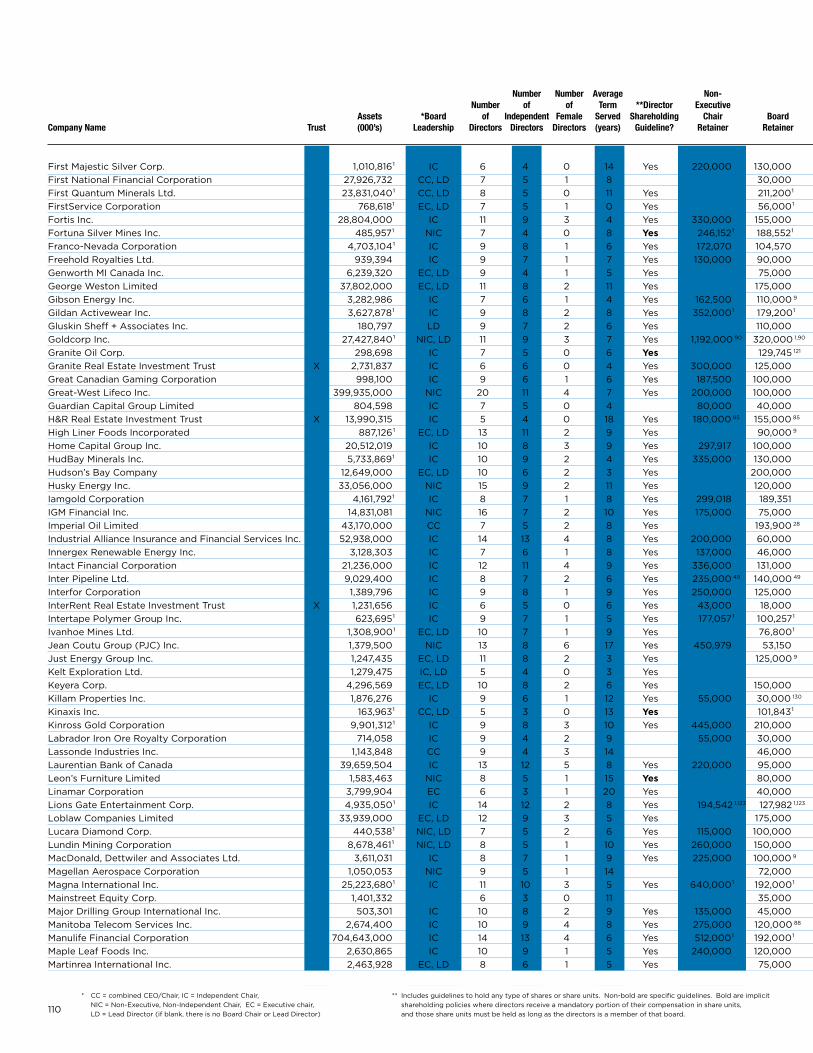
110
Number Number Average Non- Number of of Term **Director Executive Lead Committee Chair Fee Stock Component Assets *Board of Independent Female Served Shareholding Chair Board Board Director Company Name Trust (000’s) Leadership Directors Directors Directors (years) Guideline? Retainer Retainer Meeting Fee Retainer Committee Retainer Committee Meeting Fee Regular: Retainer Bold: Meeting Fees Req’d Elect Options
First Majestic Silver Corp. 1,010,816¹ IC 6 4 0 14 Yes 220,000 130,000 1,000 1,000 1,200 4 10,000 20,000 4,60 xFirst National Financial Corporation 27,926,732 CC, LD 7 5 1 8 30,000 1,500 10,000 1,500 10,000 20,000 4 First Quantum Minerals Ltd. 23,831,040¹ CC, LD 8 5 0 11 Yes 211,200¹ 64,000¹ 6,400 1,2 12,800¹ 19,200 1,4 12,800 1,2 25,600¹ 38,400 1,4 x FirstService Corporation 768,618¹ EC, LD 7 5 1 0 Yes 56,000¹ 2,240¹ 39,200¹ 2,240¹ 3,733 1,17 7,467 1,4 xFortis Inc. 28,804,000 IC 11 9 3 4 Yes 330,000 155,000 1,500 1,500 15,000 20,000 4 x x Fortuna Silver Mines Inc. 485,957¹ NIC 7 4 0 8 yes 246,152¹ 188,552¹ 1,280¹ 1,280¹ 1,920 1,4 6,400¹ 12,800 1,4 x Franco-Nevada Corporation 4,703,104¹ IC 9 8 1 6 Yes 172,070 104,570 12,500 20,000 4 x x Freehold Royalties Ltd. 939,394 IC 9 7 1 7 Yes 130,000 90,000 1,500 1,500 7,000 14,000 4 x Genworth MI Canada Inc. 6,239,320 EC, LD 9 4 1 5 Yes 75,000 25,000 2,000 10,000 19,000 4 x x George Weston Limited 37,802,000 EC, LD 11 8 2 11 Yes 175,000 50,000 7,500 15,000 25,000 47 30,000 4 x x Gibson Energy Inc. 3,282,986 IC 7 6 1 4 Yes 162,500 110,000 9 5,000 10,000 4 x x xGildan Activewear Inc. 3,627,878¹ IC 9 8 2 8 Yes 352,000¹ 179,200¹ 1,920¹ 1,920¹ 11,520¹ 19,200 1,8 25,600 1,4 x x GluskinSheff+AssociatesInc. 180,797 LD 9 7 2 6 Yes 110,000 25,000 25,000 X XGoldcorp Inc. 27,427,840¹ NIC, LD 11 9 3 7 Yes 1,192,000 90 320,000 1,90 1,920¹ 128,000¹ 1,920¹ 12,800¹ 25,600 1,4,17 x Granite Oil Corp. 298,698 IC 7 5 0 6 yes 129,745 121 x Granite Real Estate Investment Trust x 2,731,837 IC 6 6 0 4 Yes 300,000 125,000 15,000 37,500 4 30,000 75,000 4 x x Great Canadian Gaming Corporation 998,100 IC 9 6 1 6 Yes 187,500 100,000 25,000 x Great-West Lifeco Inc. 399,935,000 NIC 20 11 4 7 Yes 200,000 100,000 2,000 3,000 4 2,000 10,000 116 40,000 50,000 115 x x Guardian Capital Group Limited 804,598 IC 7 5 0 4 80,000 40,000 1,500 1,500 10,000 15,000 4 H&R Real Estate Investment Trust x 13,990,315 IC 5 4 0 18 Yes 180,000 85 155,000 85 84 84 10,000 x High Liner Foods Incorporated 887,126¹ EC, LD 13 11 2 9 Yes 90,000 9 2,000 75,000 2,000 15,000 x x xHome Capital Group Inc. 20,512,019 IC 10 8 3 9 Yes 297,917 100,000 5,000 7,500 8 30,000 4,45 x HudBay Minerals Inc. 5,733,869¹ IC 10 9 2 4 Yes 335,000 130,000 1,500 1,500 10,000 20,000 17 40,000 4 x x Hudson’s Bay Company 12,649,000 EC, LD 10 6 2 3 Yes 200,000 40,000 5,000 7,500 8 10,000 4 20,000 25,000 8 30,000 4 x x Husky Energy Inc. 33,056,000 NIC 15 9 2 11 Yes 120,000 5,000 12,500 4 10,000 20,000 4 x Iamgold Corporation 4,161,792¹ IC 8 7 1 8 Yes 299,018 189,351 15,000 25,000 8,67,82 x IGM Financial Inc. 14,831,081 NIC 16 7 2 10 Yes 175,000 75,000 1,750 2,000 4 1,750 5,000 20,000 4 x x Imperial Oil Limited 43,170,000 CC 7 5 2 8 Yes 193,900 28 20,000 27 10,000 27 x x Industrial Alliance Insurance and Financial Services Inc. 52,938,000 IC 14 13 4 8 Yes 200,000 60,000 1,500 3,000 5,000 4,41,55 1,500 5,000 10,000 4,41,55 x Innergex Renewable Energy Inc. 3,128,303 IC 7 6 1 8 Yes 137,000 46,000 2,000 3,000 6,000 4 2,000 10,000 12,000 3 20,000 4 Intact Financial Corporation 21,236,000 IC 12 11 4 9 Yes 336,000 131,000 1,500 3,000 104 6,000 1,500 9,000 104 18,000 x x Inter Pipeline Ltd. 9,029,400 IC 8 7 2 6 Yes 235,000 49 140,000 49 1,500 1,500 12,500 20,000 4 x Interfor Corporation 1,389,796 IC 9 8 1 9 Yes 250,000 125,000 10,000 15,000 4 x x InterRent Real Estate Investment Trust x 1,231,656 IC 6 5 0 6 Yes 43,000 18,000 1,000 600 5,000 10,000 4 20,000 124 x Intertape Polymer Group Inc. 623,695¹ IC 9 7 1 5 Yes 177,057¹ 100,257¹ 1,280¹ 2,560¹ 6,400 1,4 1,280¹ 6,400¹ 12,800 1,4 x x Ivanhoe Mines Ltd. 1,308,900¹ EC, LD 10 7 1 9 Yes 76,800¹ 1,920¹ 51,200¹ 1,920¹ 12,800 19,200 1,8 25,600 1,4 x JeanCoutuGroup(PJC)Inc. 1,379,500 NIC 13 8 6 17 Yes 450,979 53,150 2,000 3,0003,500 4 2,000 6,000 12,000 4 x Just Energy Group Inc. 1,247,435 EC, LD 11 8 2 3 Yes 125,000 9 25,000 9 5,000 25,000 4,9 x x Kelt Exploration Ltd. 1,279,475 IC, LD 5 4 0 3 Yes xKeyera Corp. 4,296,569 EC, LD 10 8 2 6 Yes 150,000 50,000 15,000 30,000 45,000 4 x Killam Properties Inc. 1,876,276 IC 9 6 1 12 Yes 55,000 30,000 130 1,500 3,000 1,500 6,000 12,000 4 x Kinaxis Inc. 163,963¹ CC, LD 5 3 0 13 yes 101,843¹ 8,960¹ 5,760¹ 11,520¹ x Kinross Gold Corporation 9,901,312¹ IC 9 8 3 10 Yes 445,000 210,000 15,000 20,000 35 30,000 70,000 35 x x Labrador Iron Ore Royalty Corporation 714,058 IC 9 4 2 9 55,000 30,000 1,200 1,200 10,000 20,000 4 Lassonde Industries Inc. 1,143,848 CC 9 4 3 14 46,000 2,000 4,000 8 6,000 4 2,000 8,000 8 12,000 4 Laurentian Bank of Canada 39,659,504 IC 13 12 5 8 Yes 220,000 95,000 10,000 20 15,000 x x Leon’s Furniture Limited 1,583,463 NIC 8 5 1 15 yes 80,000 1,500 2,500 4 x x Linamar Corporation 3,799,904 EC 6 3 1 20 Yes 40,000 1,630 1,085 1,630 2,710 Lions Gate Entertainment Corp. 4,935,050¹ IC 14 12 2 8 Yes 194,542 1,123 127,982 1,123 1,792¹ 12,800¹ 19,200 1,35 x x Loblaw Companies Limited 33,939,000 EC, LD 12 9 3 5 Yes 175,000 50,000 7,500 15,000 25,000 50 30,000 4 x x Lucara Diamond Corp. 440,538¹ NIC, LD 7 5 2 6 Yes 115,000 100,000 10,000 15,000 4 xLundin Mining Corporation 8,678,461¹ NIC, LD 8 5 1 10 Yes 260,000 150,000 25,000 5,000 10,000 8 15,000 4 10,000 20,000 8 25,000 4 MacDonald, Dettwiler and Associates Ltd. 3,611,031 IC 8 7 1 9 Yes 225,000 100,000 9 1,500 9 5,000 9 1,500 9 2,500 4,9 10,000 17,500 4 x x Magellan Aerospace Corporation 1,050,053 NIC 9 5 1 14 72,000 8,000 15,000 4 Magna International Inc. 25,223,680¹ IC 11 10 3 5 Yes 640,000¹ 192,000¹ 2,560¹ 32,000¹ 2,560¹ 64,000¹ x x MainstreetEquityCorp. 1,401,332 6 3 0 11 35,000 Major Drilling Group International Inc. 503,301 IC 10 8 2 9 Yes 135,000 45,000 2,000 2,000 5,000 10,000 17 15,000 4 x xManitoba Telecom Services Inc. 2,674,400 IC 10 9 4 8 Yes 275,000 120,000 88 20,000 40,000 4,8 x x Manulife Financial Corporation 704,643,000 IC 14 13 4 6 Yes 512,000¹ 192,000¹ 2,560¹ 6,400 1,25 10,240¹ 1,920¹ 32,000 1,25 51,200¹ x Maple Leaf Foods Inc. 2,630,865 IC 10 9 1 5 Yes 240,000 120,000 1,500 10,000 15,000 4 x Martinrea International Inc. 2,463,928 EC, LD 8 6 1 5 Yes 75,000 1,500 100,000 4,000 1,500 15,000 x
** Includes guidelines to hold any type of shares or share units. Non-bold are specific guidelines. Bold are implicit shareholding policies where directors receive a mandatory portion of their compensation in share units, and those share units must be held as long as the directors is a member of that board.
* CC=combinedCEO/Chair,IC=IndependentChair, NIC=Non-Executive,Non-IndependentChair,EC=Executivechair, LD=LeadDirector(ifblank,thereisnoBoardChairorLeadDirector)
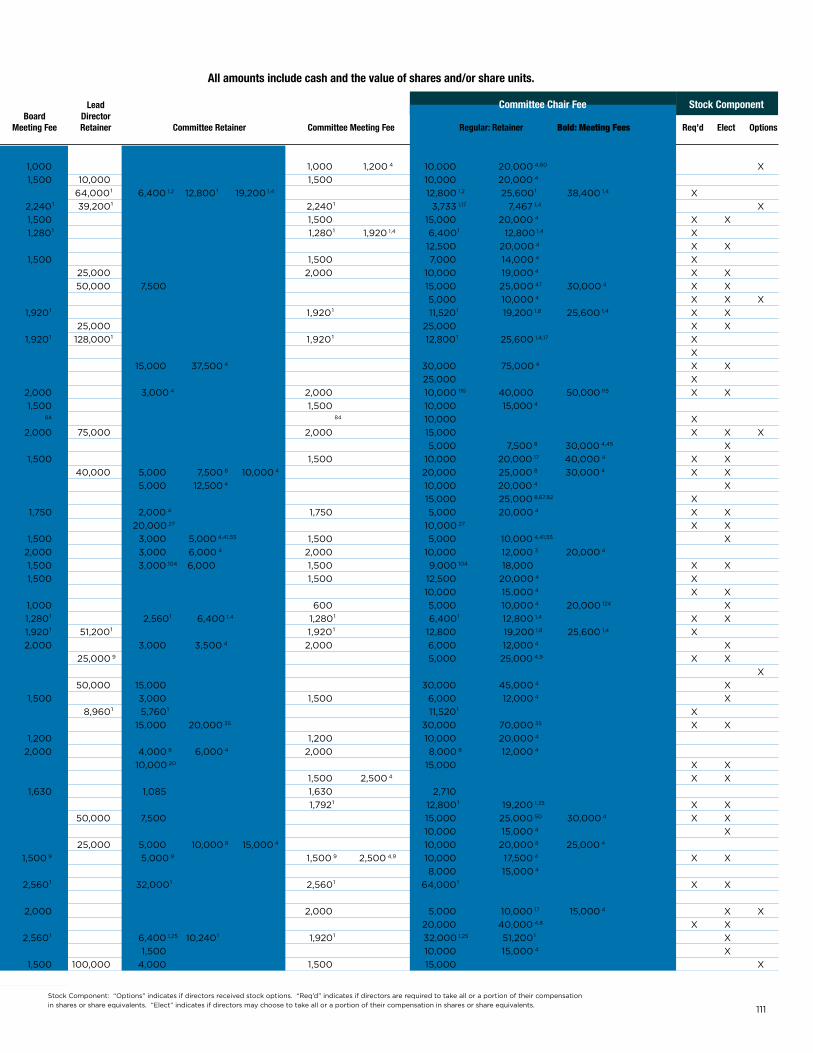
111
Number Number Average Non- Number of of Term **Director Executive Lead Committee Chair Fee Stock Component Assets *Board of Independent Female Served Shareholding Chair Board Board Director Company Name Trust (000’s) Leadership Directors Directors Directors (years) Guideline? Retainer Retainer Meeting Fee Retainer Committee Retainer Committee Meeting Fee Regular: Retainer Bold: Meeting Fees Req’d Elect Options
First Majestic Silver Corp. 1,010,816¹ IC 6 4 0 14 Yes 220,000 130,000 1,000 1,000 1,200 4 10,000 20,000 4,60 xFirst National Financial Corporation 27,926,732 CC, LD 7 5 1 8 30,000 1,500 10,000 1,500 10,000 20,000 4 First Quantum Minerals Ltd. 23,831,040¹ CC, LD 8 5 0 11 Yes 211,200¹ 64,000¹ 6,400 1,2 12,800¹ 19,200 1,4 12,800 1,2 25,600¹ 38,400 1,4 x FirstService Corporation 768,618¹ EC, LD 7 5 1 0 Yes 56,000¹ 2,240¹ 39,200¹ 2,240¹ 3,733 1,17 7,467 1,4 xFortis Inc. 28,804,000 IC 11 9 3 4 Yes 330,000 155,000 1,500 1,500 15,000 20,000 4 x x Fortuna Silver Mines Inc. 485,957¹ NIC 7 4 0 8 yes 246,152¹ 188,552¹ 1,280¹ 1,280¹ 1,920 1,4 6,400¹ 12,800 1,4 x Franco-Nevada Corporation 4,703,104¹ IC 9 8 1 6 Yes 172,070 104,570 12,500 20,000 4 x x Freehold Royalties Ltd. 939,394 IC 9 7 1 7 Yes 130,000 90,000 1,500 1,500 7,000 14,000 4 x Genworth MI Canada Inc. 6,239,320 EC, LD 9 4 1 5 Yes 75,000 25,000 2,000 10,000 19,000 4 x x George Weston Limited 37,802,000 EC, LD 11 8 2 11 Yes 175,000 50,000 7,500 15,000 25,000 47 30,000 4 x x Gibson Energy Inc. 3,282,986 IC 7 6 1 4 Yes 162,500 110,000 9 5,000 10,000 4 x x xGildan Activewear Inc. 3,627,878¹ IC 9 8 2 8 Yes 352,000¹ 179,200¹ 1,920¹ 1,920¹ 11,520¹ 19,200 1,8 25,600 1,4 x x GluskinSheff+AssociatesInc. 180,797 LD 9 7 2 6 Yes 110,000 25,000 25,000 X XGoldcorp Inc. 27,427,840¹ NIC, LD 11 9 3 7 Yes 1,192,000 90 320,000 1,90 1,920¹ 128,000¹ 1,920¹ 12,800¹ 25,600 1,4,17 x Granite Oil Corp. 298,698 IC 7 5 0 6 yes 129,745 121 x Granite Real Estate Investment Trust x 2,731,837 IC 6 6 0 4 Yes 300,000 125,000 15,000 37,500 4 30,000 75,000 4 x x Great Canadian Gaming Corporation 998,100 IC 9 6 1 6 Yes 187,500 100,000 25,000 x Great-West Lifeco Inc. 399,935,000 NIC 20 11 4 7 Yes 200,000 100,000 2,000 3,000 4 2,000 10,000 116 40,000 50,000 115 x x Guardian Capital Group Limited 804,598 IC 7 5 0 4 80,000 40,000 1,500 1,500 10,000 15,000 4 H&R Real Estate Investment Trust x 13,990,315 IC 5 4 0 18 Yes 180,000 85 155,000 85 84 84 10,000 x High Liner Foods Incorporated 887,126¹ EC, LD 13 11 2 9 Yes 90,000 9 2,000 75,000 2,000 15,000 x x xHome Capital Group Inc. 20,512,019 IC 10 8 3 9 Yes 297,917 100,000 5,000 7,500 8 30,000 4,45 x HudBay Minerals Inc. 5,733,869¹ IC 10 9 2 4 Yes 335,000 130,000 1,500 1,500 10,000 20,000 17 40,000 4 x x Hudson’s Bay Company 12,649,000 EC, LD 10 6 2 3 Yes 200,000 40,000 5,000 7,500 8 10,000 4 20,000 25,000 8 30,000 4 x x Husky Energy Inc. 33,056,000 NIC 15 9 2 11 Yes 120,000 5,000 12,500 4 10,000 20,000 4 x Iamgold Corporation 4,161,792¹ IC 8 7 1 8 Yes 299,018 189,351 15,000 25,000 8,67,82 x IGM Financial Inc. 14,831,081 NIC 16 7 2 10 Yes 175,000 75,000 1,750 2,000 4 1,750 5,000 20,000 4 x x Imperial Oil Limited 43,170,000 CC 7 5 2 8 Yes 193,900 28 20,000 27 10,000 27 x x Industrial Alliance Insurance and Financial Services Inc. 52,938,000 IC 14 13 4 8 Yes 200,000 60,000 1,500 3,000 5,000 4,41,55 1,500 5,000 10,000 4,41,55 x Innergex Renewable Energy Inc. 3,128,303 IC 7 6 1 8 Yes 137,000 46,000 2,000 3,000 6,000 4 2,000 10,000 12,000 3 20,000 4 Intact Financial Corporation 21,236,000 IC 12 11 4 9 Yes 336,000 131,000 1,500 3,000 104 6,000 1,500 9,000 104 18,000 x x Inter Pipeline Ltd. 9,029,400 IC 8 7 2 6 Yes 235,000 49 140,000 49 1,500 1,500 12,500 20,000 4 x Interfor Corporation 1,389,796 IC 9 8 1 9 Yes 250,000 125,000 10,000 15,000 4 x x InterRent Real Estate Investment Trust x 1,231,656 IC 6 5 0 6 Yes 43,000 18,000 1,000 600 5,000 10,000 4 20,000 124 x Intertape Polymer Group Inc. 623,695¹ IC 9 7 1 5 Yes 177,057¹ 100,257¹ 1,280¹ 2,560¹ 6,400 1,4 1,280¹ 6,400¹ 12,800 1,4 x x Ivanhoe Mines Ltd. 1,308,900¹ EC, LD 10 7 1 9 Yes 76,800¹ 1,920¹ 51,200¹ 1,920¹ 12,800 19,200 1,8 25,600 1,4 x JeanCoutuGroup(PJC)Inc. 1,379,500 NIC 13 8 6 17 Yes 450,979 53,150 2,000 3,0003,500 4 2,000 6,000 12,000 4 x Just Energy Group Inc. 1,247,435 EC, LD 11 8 2 3 Yes 125,000 9 25,000 9 5,000 25,000 4,9 x x Kelt Exploration Ltd. 1,279,475 IC, LD 5 4 0 3 Yes xKeyera Corp. 4,296,569 EC, LD 10 8 2 6 Yes 150,000 50,000 15,000 30,000 45,000 4 x Killam Properties Inc. 1,876,276 IC 9 6 1 12 Yes 55,000 30,000 130 1,500 3,000 1,500 6,000 12,000 4 x Kinaxis Inc. 163,963¹ CC, LD 5 3 0 13 yes 101,843¹ 8,960¹ 5,760¹ 11,520¹ x Kinross Gold Corporation 9,901,312¹ IC 9 8 3 10 Yes 445,000 210,000 15,000 20,000 35 30,000 70,000 35 x x Labrador Iron Ore Royalty Corporation 714,058 IC 9 4 2 9 55,000 30,000 1,200 1,200 10,000 20,000 4 Lassonde Industries Inc. 1,143,848 CC 9 4 3 14 46,000 2,000 4,000 8 6,000 4 2,000 8,000 8 12,000 4 Laurentian Bank of Canada 39,659,504 IC 13 12 5 8 Yes 220,000 95,000 10,000 20 15,000 x x Leon’s Furniture Limited 1,583,463 NIC 8 5 1 15 yes 80,000 1,500 2,500 4 x x Linamar Corporation 3,799,904 EC 6 3 1 20 Yes 40,000 1,630 1,085 1,630 2,710 Lions Gate Entertainment Corp. 4,935,050¹ IC 14 12 2 8 Yes 194,542 1,123 127,982 1,123 1,792¹ 12,800¹ 19,200 1,35 x x Loblaw Companies Limited 33,939,000 EC, LD 12 9 3 5 Yes 175,000 50,000 7,500 15,000 25,000 50 30,000 4 x x Lucara Diamond Corp. 440,538¹ NIC, LD 7 5 2 6 Yes 115,000 100,000 10,000 15,000 4 xLundin Mining Corporation 8,678,461¹ NIC, LD 8 5 1 10 Yes 260,000 150,000 25,000 5,000 10,000 8 15,000 4 10,000 20,000 8 25,000 4 MacDonald, Dettwiler and Associates Ltd. 3,611,031 IC 8 7 1 9 Yes 225,000 100,000 9 1,500 9 5,000 9 1,500 9 2,500 4,9 10,000 17,500 4 x x Magellan Aerospace Corporation 1,050,053 NIC 9 5 1 14 72,000 8,000 15,000 4 Magna International Inc. 25,223,680¹ IC 11 10 3 5 Yes 640,000¹ 192,000¹ 2,560¹ 32,000¹ 2,560¹ 64,000¹ x x MainstreetEquityCorp. 1,401,332 6 3 0 11 35,000 Major Drilling Group International Inc. 503,301 IC 10 8 2 9 Yes 135,000 45,000 2,000 2,000 5,000 10,000 17 15,000 4 x xManitoba Telecom Services Inc. 2,674,400 IC 10 9 4 8 Yes 275,000 120,000 88 20,000 40,000 4,8 x x Manulife Financial Corporation 704,643,000 IC 14 13 4 6 Yes 512,000¹ 192,000¹ 2,560¹ 6,400 1,25 10,240¹ 1,920¹ 32,000 1,25 51,200¹ x Maple Leaf Foods Inc. 2,630,865 IC 10 9 1 5 Yes 240,000 120,000 1,500 10,000 15,000 4 x Martinrea International Inc. 2,463,928 EC, LD 8 6 1 5 Yes 75,000 1,500 100,000 4,000 1,500 15,000 x
All amounts include cash and the value of shares and/or share units.
StockComponent:“Options”indicatesifdirectorsreceivedstockoptions.“Req’d”indicatesifdirectorsarerequiredtotakealloraportionoftheircompensationinsharesorshareequivalents.“Elect”indicatesifdirectorsmaychoosetotakealloraportionoftheircompensationinsharesorshareequivalents.
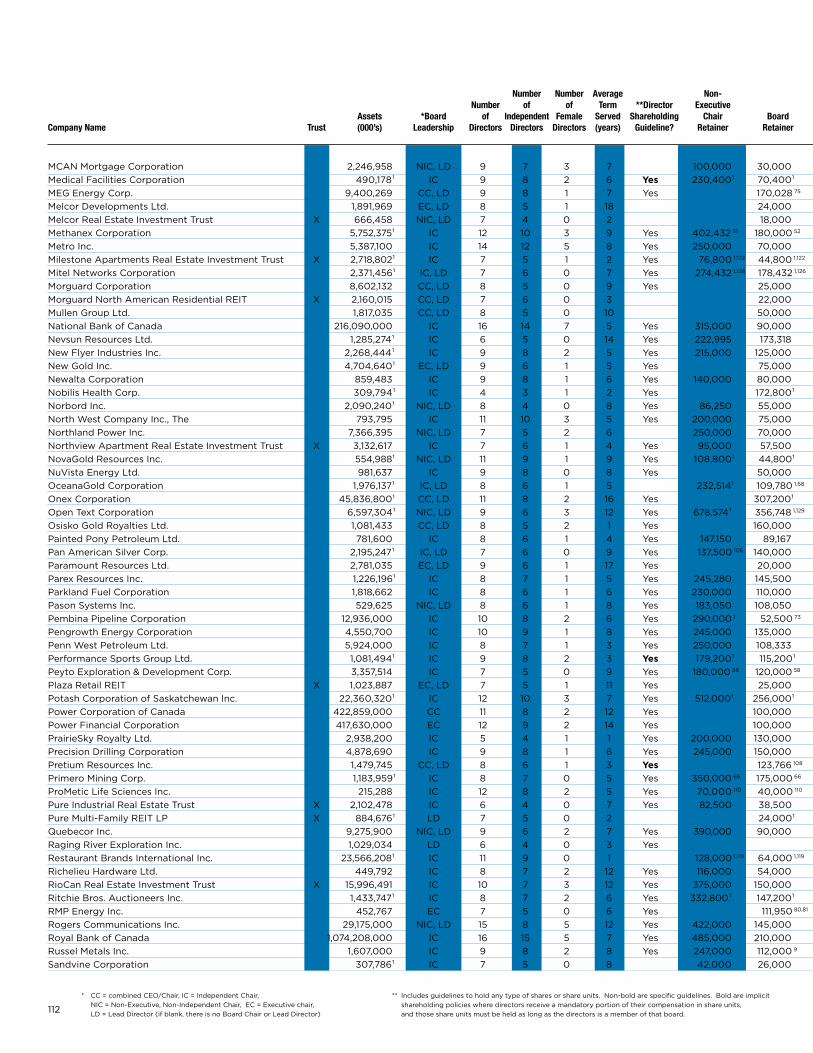
112
Number Number Average Non- Number of of Term **Director Executive Lead Committee Chair Fee Stock Component Assets *Board of Independent Female Served Shareholding Chair Board Board Director Company Name Trust (000’s) Leadership Directors Directors Directors (years) Guideline? Retainer Retainer Meeting Fee Retainer Committee Retainer Committee Meeting Fee Regular: Retainer Bold: Meeting Fees Req’d Elect Options
MCAN Mortgage Corporation 2,246,958 NIC, LD 9 7 3 7 100,000 30,000 1,500 10,000 1,500 20,000 Medical Facilities Corporation 490,178¹ IC 9 8 2 6 yes 230,400¹ 70,400¹ 1,920¹ 1,920¹ 6,400¹ 19,200 1,4 x x MEG Energy Corp. 9,400,269 CC, LD 9 8 1 7 Yes 170,028 75 1,500 5,000 5,000 7,000 4 1,500 10,000 20,000 4 x Melcor Developments Ltd. 1,891,969 EC, LD 8 5 1 18 24,000 1,500 3,000 1,500 6,000 12,000 4 Melcor Real Estate Investment Trust x 666,458 NIC, LD 7 4 0 2 18,000 1,500 1,500 5,000 72 10,000 4 Methanex Corporation 5,752,375¹ IC 12 10 3 9 Yes 402,432 51 180,000 52 10,000 39 10,000 20,000 39 x x Metro Inc. 5,387,100 IC 14 12 5 8 Yes 250,000 70,000 1,750 2,500 5,000 4 1,750 5,000 10,000 4 x x Milestone Apartments Real Estate Investment Trust x 2,718,802¹ IC 7 5 1 2 Yes 76,800 1,122 44,800 1,122 1,920 1,122 3,200 1,4,122 1,920 1,122 12,800 1,122 19,200 1,4,122 x Mitel Networks Corporation 2,371,456¹ IC, LD 7 6 0 7 Yes 274,432 1,126 178,432 1,126 10,240¹ 12,800 1,17 19,200 1,4 15,360¹ 19,200 1,17 32,000 x x xMorguard Corporation 8,602,132 CC, LD 8 5 0 9 Yes 25,000 1,500 1,500 4,000 8,000 4 Morguard North American Residential REIT x 2,160,015 CC, LD 7 6 0 3 22,000 1,000 1,000 2,500 10,000 4 Mullen Group Ltd. 1,817,035 CC, LD 8 5 0 10 50,000 1,200 3,000 1,000 10,000 15,000 4 1,200 National Bank of Canada 216,090,000 IC 16 14 7 5 Yes 315,000 90,000 15,000 20,000 4,5 20,000 25,000 4,5 x x Nevsun Resources Ltd. 1,285,274¹ IC 6 5 0 14 Yes 222,995 173,318 x xNew Flyer Industries Inc. 2,268,444¹ IC 9 8 2 5 Yes 215,000 125,000 15,000 x x New Gold Inc. 4,704,640¹ EC, LD 9 6 1 5 Yes 75,000 15,000 4 x xNewalta Corporation 859,483 IC 9 8 1 6 Yes 140,000 80,000 1,500 1,500 7,500 12,000 17 15,000 4 2,250 x xNobilis Health Corp. 309,794¹ IC 4 3 1 2 Yes 172,800¹ 12,800 1,2,17 19,200¹ 25,600 1,4 xNorbord Inc. 2,090,240¹ NIC, LD 8 4 0 8 Yes 86,250 55,000 5,000 10,000 4 x North West Company Inc., The 793,795 IC 11 10 3 5 Yes 200,000 75,000 1,500 1,500 8,000 12,000 83 15,000 4 x x Northland Power Inc. 7,366,395 NIC, LD 7 5 2 6 250,000 70,000 1,500 35,000 5,000 1,500 10,000 20,000 4 x Northview Apartment Real Estate Investment Trust x 3,132,617 IC 7 6 1 4 Yes 95,000 57,500 1,500 1,500 1,500 10,000 15,000 35 x NovaGold Resources Inc. 554,988¹ NIC, LD 11 9 1 9 Yes 108,800¹ 44,800¹ 2,240¹ 2,240¹ 12,800¹ 20,480 1,4 x x xNuvista Energy Ltd. 981,637 IC 9 8 0 8 Yes 50,000 1,500 7,500 4,000 48 6,000 4 750 48 15,000 4 OceanaGold Corporation 1,976,137¹ IC, LD 8 6 1 5 232,514¹ 109,780 1,68 Onex Corporation 45,836,800¹ CC, LD 11 8 2 16 Yes 307,200¹ 51,200¹ 5,760¹ 9,600 1,69 2,560¹ 19,200¹ 38,400 1,69 x x Open Text Corporation 6,597,304¹ NIC, LD 9 6 3 12 Yes 678,574¹ 356,748 1,129 32,000¹ 10,240¹ 19,200 1,17 32,000 1,4 17,920¹ 32,000 1,17 44,800 1,4 x x Osisko Gold Royalties Ltd. 1,081,433 CC, LD 8 5 2 1 Yes 160,000 1,500 120,000 5,000 1,500 10,000 20,000 4 x Painted Pony Petroleum Ltd. 781,600 IC 8 6 1 4 Yes 147,150 89,167 10,000 15,000 4 x Pan American Silver Corp. 2,195,247¹ IC, LD 7 6 0 9 Yes 137,500 106 140,000 1,000 10,000 6,000 4 1,000 7,500 12,000 8,102 18,000 4 x Paramount Resources Ltd. 2,781,035 EC, LD 9 6 1 17 Yes 20,000 1,250 10,000 1,250 5,000 6,500 4 Parex Resources Inc. 1,226,196¹ IC 8 7 1 5 Yes 245,280 145,500 1,500 5,000 1,500 7,500 12,500 67 x Parkland Fuel Corporation 1,818,662 IC 8 6 1 6 Yes 230,000 110,000 1,500 1,500 15,000 4,41 2,500 x x Pason Systems Inc. 529,625 NIC, LD 8 6 1 8 Yes 183,050 108,050 1,500 20,000 1,500 5,000 15,000 4 x x Pembina Pipeline Corporation 12,936,000 IC 10 8 2 6 Yes 290,000 1 52,500 73 12,500 74 15,000 4,74 10,000 15,000 8 21,000 4 x Pengrowth Energy Corporation 4,550,700 IC 10 9 1 8 Yes 245,000 135,000 1,500 5,000 10,000 35 1,500 10,000 15,000 17 20,000 35 x Penn West Petroleum Ltd. 5,924,000 IC 8 7 1 3 Yes 250,000 108,333 1,500 1,500 7,500 15,000 4 x x Performance Sports Group Ltd. 1,081,494¹ IC 9 8 2 3 yes 179,200¹ 115,200¹ 2,560¹ 2,560¹ 6,400¹ x x Peyto Exploration & Development Corp. 3,357,514 IC 7 5 0 9 Yes 180,000 58 120,000 58 10,000 20,000 4 Plaza Retail REIT x 1,023,887 EC, LD 7 5 1 11 Yes 25,000 750 750 7,500 12,500 4 x x Potash Corporation of Saskatchewan Inc. 22,360,320¹ IC 12 10 3 7 Yes 512,000¹ 256,000¹ 6,400¹ 1,920 1,111 19,200¹ 25,600 1,4,8 x Power Corporation of Canada 422,859,000 CC 11 8 2 12 Yes 100,000 2,000 5,000 6,000 17 7,500 4 2,000 15,000 20,000 17 30,000 4 x x Power Financial Corporation 417,630,000 EC 12 9 2 14 Yes 100,000 2,000 5,000 6,000 17 7,500 4 2,000 15,000 20,000 17 30,000 4 x x PrairieSky Royalty Ltd. 2,938,200 IC 5 4 1 1 Yes 200,000 130,000 10,000 15,000 4 x Precision Drilling Corporation 4,878,690 IC 9 8 1 6 Yes 245,000 150,000 1,500 7,500 1,500 2,500 4 15,000 x x Pretium Resources Inc. 1,479,745 CC, LD 8 6 1 3 yes 123,766 108 25,000 5,000 72 15,000 4 x xPrimero Mining Corp. 1,183,959¹ IC 8 7 0 5 Yes 350,000 66 175,000 66 1,500 1,500 10,000 20,000 4 x ProMetic Life Sciences Inc. 215,288 IC 12 8 2 5 Yes 70,000 110 40,000 110 1,500 5,000 7,000 35 1,500 13,000 15,000 35 xPure Industrial Real Estate Trust x 2,102,478 IC 6 4 0 7 Yes 82,500 38,500 1,500 3,000 7,000 4 1,500 5,000 20,000 4 Pure Multi-Family REIT LP x 884,676¹ LD 7 5 0 2 24,000¹ 1,280¹ 640¹ 3,200 1,4 1,280¹ 3,200¹ 6,400 1,4 Quebecor Inc. 9,275,900 NIC, LD 9 6 2 7 Yes 390,000 90,000 77 60,000 6,000 11,000 8 15,000 4 77 11,000 15,000 8 30,000 4 x x Raging River Exploration Inc. 1,029,034 LD 6 4 0 3 Yes xRestaurant Brands International Inc. 23,566,208¹ IC 11 9 0 1 128,000 1,119 64,000 1,119 12,800 1,119 x Richelieu Hardware Ltd. 449,792 IC 8 7 2 12 Yes 116,000 54,000 7,500 x RioCan Real Estate Investment Trust x 15,996,491 IC 10 7 3 12 Yes 375,000 150,000 1,500 1,500 10,000 15,000 8 20,000 4 x x Ritchie Bros. Auctioneers Inc. 1,433,747¹ IC 8 7 2 6 Yes 332,800¹ 147,200¹ 1,920¹ 1,920¹ 19,200 1,17 25,600 1,4 x RMP Energy Inc. 452,767 EC 7 5 0 6 Yes 111,950 80,81 1,000 500 x Rogers Communications Inc. 29,175,000 NIC, LD 15 8 5 12 Yes 422,000 145,000 1,500 80,000 1,500 2,000 35 10,000 20,000³ 30,000 35 2,000 3,000 3,35 x x Royal Bank of Canada 1,074,208,000 IC 16 15 5 7 Yes 485,000 210,000 25,000 50,000 3,4,5 x x Russel Metals Inc. 1,607,000 IC 9 8 2 8 Yes 247,000 112,000 9 2,000 9 4,000 9 2,000 9 8,000 10,500 31 14,000 4 x x Sandvine Corporation 307,786¹ IC 7 5 0 8 42,000 26,000 3,000 4,000 17 6,000 4 6,000 8,000 17 12,000 4 x
** Includes guidelines to hold any type of shares or share units. Non-bold are specific guidelines. Bold are implicit shareholding policies where directors receive a mandatory portion of their compensation in share units, and those share units must be held as long as the directors is a member of that board.
* CC=combinedCEO/Chair,IC=IndependentChair, NIC=Non-Executive,Non-IndependentChair,EC=Executivechair, LD=LeadDirector(ifblank,thereisnoBoardChairorLeadDirector)
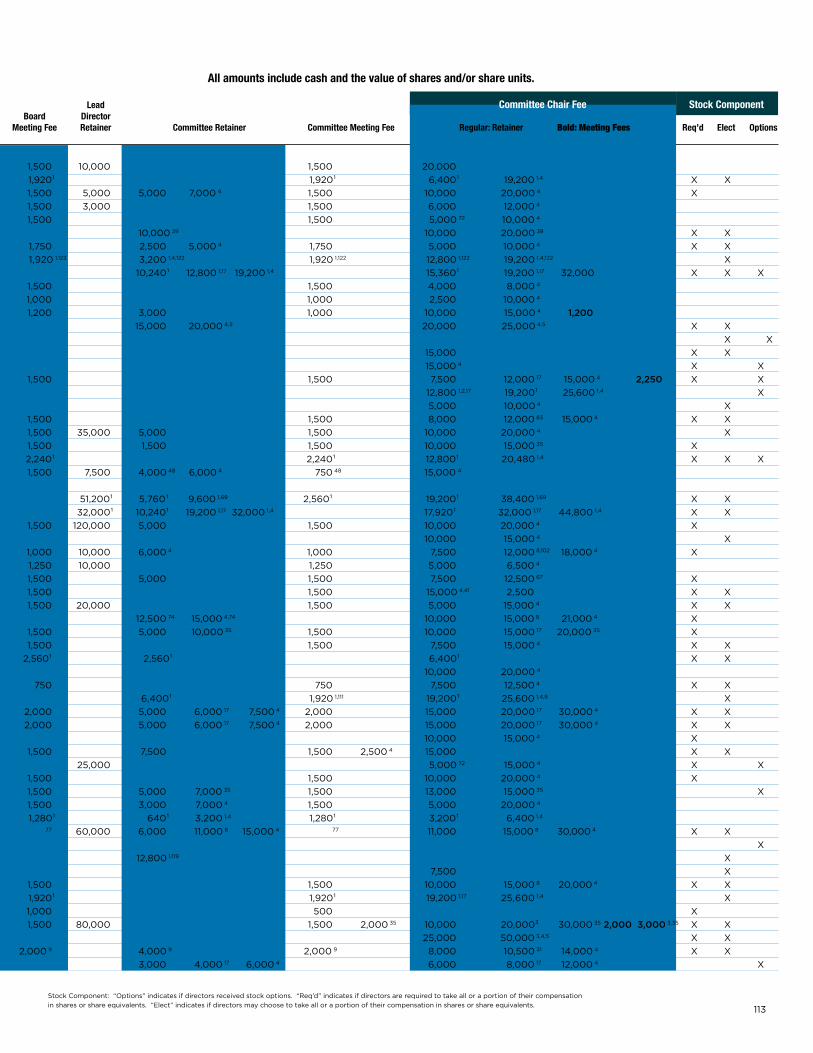
113
Number Number Average Non- Number of of Term **Director Executive Lead Committee Chair Fee Stock Component Assets *Board of Independent Female Served Shareholding Chair Board Board Director Company Name Trust (000’s) Leadership Directors Directors Directors (years) Guideline? Retainer Retainer Meeting Fee Retainer Committee Retainer Committee Meeting Fee Regular: Retainer Bold: Meeting Fees Req’d Elect Options
MCAN Mortgage Corporation 2,246,958 NIC, LD 9 7 3 7 100,000 30,000 1,500 10,000 1,500 20,000 Medical Facilities Corporation 490,178¹ IC 9 8 2 6 yes 230,400¹ 70,400¹ 1,920¹ 1,920¹ 6,400¹ 19,200 1,4 x x MEG Energy Corp. 9,400,269 CC, LD 9 8 1 7 Yes 170,028 75 1,500 5,000 5,000 7,000 4 1,500 10,000 20,000 4 x Melcor Developments Ltd. 1,891,969 EC, LD 8 5 1 18 24,000 1,500 3,000 1,500 6,000 12,000 4 Melcor Real Estate Investment Trust x 666,458 NIC, LD 7 4 0 2 18,000 1,500 1,500 5,000 72 10,000 4 Methanex Corporation 5,752,375¹ IC 12 10 3 9 Yes 402,432 51 180,000 52 10,000 39 10,000 20,000 39 x x Metro Inc. 5,387,100 IC 14 12 5 8 Yes 250,000 70,000 1,750 2,500 5,000 4 1,750 5,000 10,000 4 x x Milestone Apartments Real Estate Investment Trust x 2,718,802¹ IC 7 5 1 2 Yes 76,800 1,122 44,800 1,122 1,920 1,122 3,200 1,4,122 1,920 1,122 12,800 1,122 19,200 1,4,122 x Mitel Networks Corporation 2,371,456¹ IC, LD 7 6 0 7 Yes 274,432 1,126 178,432 1,126 10,240¹ 12,800 1,17 19,200 1,4 15,360¹ 19,200 1,17 32,000 x x xMorguard Corporation 8,602,132 CC, LD 8 5 0 9 Yes 25,000 1,500 1,500 4,000 8,000 4 Morguard North American Residential REIT x 2,160,015 CC, LD 7 6 0 3 22,000 1,000 1,000 2,500 10,000 4 Mullen Group Ltd. 1,817,035 CC, LD 8 5 0 10 50,000 1,200 3,000 1,000 10,000 15,000 4 1,200 National Bank of Canada 216,090,000 IC 16 14 7 5 Yes 315,000 90,000 15,000 20,000 4,5 20,000 25,000 4,5 x x Nevsun Resources Ltd. 1,285,274¹ IC 6 5 0 14 Yes 222,995 173,318 x xNew Flyer Industries Inc. 2,268,444¹ IC 9 8 2 5 Yes 215,000 125,000 15,000 x x New Gold Inc. 4,704,640¹ EC, LD 9 6 1 5 Yes 75,000 15,000 4 x xNewalta Corporation 859,483 IC 9 8 1 6 Yes 140,000 80,000 1,500 1,500 7,500 12,000 17 15,000 4 2,250 x xNobilis Health Corp. 309,794¹ IC 4 3 1 2 Yes 172,800¹ 12,800 1,2,17 19,200¹ 25,600 1,4 xNorbord Inc. 2,090,240¹ NIC, LD 8 4 0 8 Yes 86,250 55,000 5,000 10,000 4 x North West Company Inc., The 793,795 IC 11 10 3 5 Yes 200,000 75,000 1,500 1,500 8,000 12,000 83 15,000 4 x x Northland Power Inc. 7,366,395 NIC, LD 7 5 2 6 250,000 70,000 1,500 35,000 5,000 1,500 10,000 20,000 4 x Northview Apartment Real Estate Investment Trust x 3,132,617 IC 7 6 1 4 Yes 95,000 57,500 1,500 1,500 1,500 10,000 15,000 35 x NovaGold Resources Inc. 554,988¹ NIC, LD 11 9 1 9 Yes 108,800¹ 44,800¹ 2,240¹ 2,240¹ 12,800¹ 20,480 1,4 x x xNuvista Energy Ltd. 981,637 IC 9 8 0 8 Yes 50,000 1,500 7,500 4,000 48 6,000 4 750 48 15,000 4 OceanaGold Corporation 1,976,137¹ IC, LD 8 6 1 5 232,514¹ 109,780 1,68 Onex Corporation 45,836,800¹ CC, LD 11 8 2 16 Yes 307,200¹ 51,200¹ 5,760¹ 9,600 1,69 2,560¹ 19,200¹ 38,400 1,69 x x Open Text Corporation 6,597,304¹ NIC, LD 9 6 3 12 Yes 678,574¹ 356,748 1,129 32,000¹ 10,240¹ 19,200 1,17 32,000 1,4 17,920¹ 32,000 1,17 44,800 1,4 x x Osisko Gold Royalties Ltd. 1,081,433 CC, LD 8 5 2 1 Yes 160,000 1,500 120,000 5,000 1,500 10,000 20,000 4 x Painted Pony Petroleum Ltd. 781,600 IC 8 6 1 4 Yes 147,150 89,167 10,000 15,000 4 x Pan American Silver Corp. 2,195,247¹ IC, LD 7 6 0 9 Yes 137,500 106 140,000 1,000 10,000 6,000 4 1,000 7,500 12,000 8,102 18,000 4 x Paramount Resources Ltd. 2,781,035 EC, LD 9 6 1 17 Yes 20,000 1,250 10,000 1,250 5,000 6,500 4 Parex Resources Inc. 1,226,196¹ IC 8 7 1 5 Yes 245,280 145,500 1,500 5,000 1,500 7,500 12,500 67 x Parkland Fuel Corporation 1,818,662 IC 8 6 1 6 Yes 230,000 110,000 1,500 1,500 15,000 4,41 2,500 x x Pason Systems Inc. 529,625 NIC, LD 8 6 1 8 Yes 183,050 108,050 1,500 20,000 1,500 5,000 15,000 4 x x Pembina Pipeline Corporation 12,936,000 IC 10 8 2 6 Yes 290,000 1 52,500 73 12,500 74 15,000 4,74 10,000 15,000 8 21,000 4 x Pengrowth Energy Corporation 4,550,700 IC 10 9 1 8 Yes 245,000 135,000 1,500 5,000 10,000 35 1,500 10,000 15,000 17 20,000 35 x Penn West Petroleum Ltd. 5,924,000 IC 8 7 1 3 Yes 250,000 108,333 1,500 1,500 7,500 15,000 4 x x Performance Sports Group Ltd. 1,081,494¹ IC 9 8 2 3 yes 179,200¹ 115,200¹ 2,560¹ 2,560¹ 6,400¹ x x Peyto Exploration & Development Corp. 3,357,514 IC 7 5 0 9 Yes 180,000 58 120,000 58 10,000 20,000 4 Plaza Retail REIT x 1,023,887 EC, LD 7 5 1 11 Yes 25,000 750 750 7,500 12,500 4 x x Potash Corporation of Saskatchewan Inc. 22,360,320¹ IC 12 10 3 7 Yes 512,000¹ 256,000¹ 6,400¹ 1,920 1,111 19,200¹ 25,600 1,4,8 x Power Corporation of Canada 422,859,000 CC 11 8 2 12 Yes 100,000 2,000 5,000 6,000 17 7,500 4 2,000 15,000 20,000 17 30,000 4 x x Power Financial Corporation 417,630,000 EC 12 9 2 14 Yes 100,000 2,000 5,000 6,000 17 7,500 4 2,000 15,000 20,000 17 30,000 4 x x PrairieSky Royalty Ltd. 2,938,200 IC 5 4 1 1 Yes 200,000 130,000 10,000 15,000 4 x Precision Drilling Corporation 4,878,690 IC 9 8 1 6 Yes 245,000 150,000 1,500 7,500 1,500 2,500 4 15,000 x x Pretium Resources Inc. 1,479,745 CC, LD 8 6 1 3 yes 123,766 108 25,000 5,000 72 15,000 4 x xPrimero Mining Corp. 1,183,959¹ IC 8 7 0 5 Yes 350,000 66 175,000 66 1,500 1,500 10,000 20,000 4 x ProMetic Life Sciences Inc. 215,288 IC 12 8 2 5 Yes 70,000 110 40,000 110 1,500 5,000 7,000 35 1,500 13,000 15,000 35 xPure Industrial Real Estate Trust x 2,102,478 IC 6 4 0 7 Yes 82,500 38,500 1,500 3,000 7,000 4 1,500 5,000 20,000 4 Pure Multi-Family REIT LP x 884,676¹ LD 7 5 0 2 24,000¹ 1,280¹ 640¹ 3,200 1,4 1,280¹ 3,200¹ 6,400 1,4 Quebecor Inc. 9,275,900 NIC, LD 9 6 2 7 Yes 390,000 90,000 77 60,000 6,000 11,000 8 15,000 4 77 11,000 15,000 8 30,000 4 x x Raging River Exploration Inc. 1,029,034 LD 6 4 0 3 Yes xRestaurant Brands International Inc. 23,566,208¹ IC 11 9 0 1 128,000 1,119 64,000 1,119 12,800 1,119 x Richelieu Hardware Ltd. 449,792 IC 8 7 2 12 Yes 116,000 54,000 7,500 x RioCan Real Estate Investment Trust x 15,996,491 IC 10 7 3 12 Yes 375,000 150,000 1,500 1,500 10,000 15,000 8 20,000 4 x x Ritchie Bros. Auctioneers Inc. 1,433,747¹ IC 8 7 2 6 Yes 332,800¹ 147,200¹ 1,920¹ 1,920¹ 19,200 1,17 25,600 1,4 x RMP Energy Inc. 452,767 EC 7 5 0 6 Yes 111,950 80,81 1,000 500 x Rogers Communications Inc. 29,175,000 NIC, LD 15 8 5 12 Yes 422,000 145,000 1,500 80,000 1,500 2,000 35 10,000 20,000³ 30,000 35 2,000 3,000 3,35 x x Royal Bank of Canada 1,074,208,000 IC 16 15 5 7 Yes 485,000 210,000 25,000 50,000 3,4,5 x x Russel Metals Inc. 1,607,000 IC 9 8 2 8 Yes 247,000 112,000 9 2,000 9 4,000 9 2,000 9 8,000 10,500 31 14,000 4 x x Sandvine Corporation 307,786¹ IC 7 5 0 8 42,000 26,000 3,000 4,000 17 6,000 4 6,000 8,000 17 12,000 4 x
All amounts include cash and the value of shares and/or share units.
StockComponent:“Options”indicatesifdirectorsreceivedstockoptions.“Req’d”indicatesifdirectorsarerequiredtotakealloraportionoftheircompensationinsharesorshareequivalents.“Elect”indicatesifdirectorsmaychoosetotakealloraportionoftheircompensationinsharesorshareequivalents.
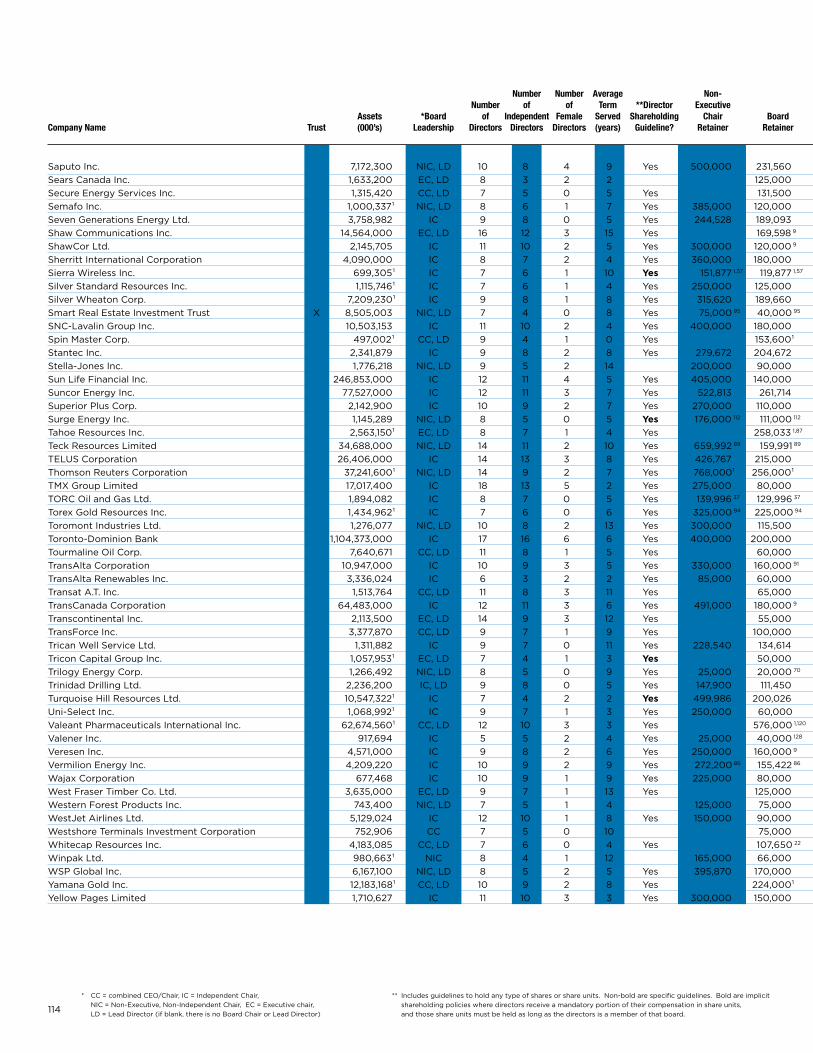
114
Number Number Average Non- Number of of Term **Director Executive Lead Committee Chair Fee Stock Component Assets *Board of Independent Female Served Shareholding Chair Board Board Director Company Name Trust (000’s) Leadership Directors Directors Directors (years) Guideline? Retainer Retainer Meeting Fee Retainer Committee Retainer Committee Meeting Fee Regular: Retainer Bold: Meeting Fees Req’d Elect Options
Saputo Inc. 7,172,300 NIC, LD 10 8 4 9 Yes 500,000 231,560 2,000 139,968 5,000 2,000 7,500 59,968 4 x Sears Canada Inc. 1,633,200 EC, LD 8 3 2 2 125,000 1,500 35,000 5,000 1,500 10,000 15,000 4 Secure Energy Services Inc. 1,315,420 CC, LD 7 5 0 5 Yes 131,500 1,350 22,500 1,350 4,500 13,500 4 x x Semafo Inc. 1,000,337¹ NIC, LD 8 6 1 7 Yes 385,000 120,000 1,250 15,000 4,000 5,000 4,41 1,250 10,000 12,500 4,41 x Seven Generations Energy Ltd. 3,758,982 IC 9 8 0 5 Yes 244,528 189,093 5,000 6,000 17 15,000 67 x x Shaw Communications Inc. 14,564,000 EC, LD 16 12 3 15 Yes 169,598 9 1,500 9 75,000 6,000 9 1,500 9 10,000 15,000 8 40,000 4 x x ShawCor Ltd. 2,145,705 IC 11 10 2 5 Yes 300,000 120,000 9 2,000 9 5,000 9 10,000 4 2,000 9 15,000 9 20,000 4 x x Sherritt International Corporation 4,090,000 IC 8 7 2 4 Yes 360,000 180,000 5,000 15,000 3,4 x Sierra Wireless Inc. 699,305¹ IC 7 6 1 10 yes 151,877 1,57 119,877 1,57 1,920¹ 7,680¹ 10,240 1,4 1,920¹ 15,360¹ 17,920 1,4 x xSilver Standard Resources Inc. 1,115,746¹ IC 7 6 1 4 Yes 250,000 125,000 5,000 10,000 15,000 17 20,000 4 x x Silver Wheaton Corp. 7,209,230¹ IC 9 8 1 8 Yes 315,620 189,660 1,500 1,500 15,000 30,000 3,4 x Smart Real Estate Investment Trust x 8,505,003 NIC, LD 7 4 0 8 Yes 75,000 95 40,000 95 2,000 35,000 2,000 2,500 4 5,000 7,500 72 10,000 4 x SNC-Lavalin Group Inc. 10,503,153 IC 11 10 2 4 Yes 400,000 180,000 2,250 2,250 12,000 16,000 4 x x Spin Master Corp. 497,002¹ CC, LD 9 4 1 0 Yes 153,600¹ 51,200¹ 6,400¹ 12,800¹ 19,200 1,4 x x Stantec Inc. 2,341,879 IC 9 8 2 8 Yes 279,672 204,672 1,800 1,800 9,000 12,000 35 x Stella-Jones Inc. 1,776,218 NIC, LD 9 5 2 14 200,000 90,000 15,000 4 Sun Life Financial Inc. 246,853,000 IC 12 11 4 5 Yes 405,000 140,000 1,750 10,000 1,750 30,000 x x Suncor Energy Inc. 77,527,000 IC 12 11 3 7 Yes 522,813 261,714 1,500 5,000 8,11 6,000 4 1,500 10,000 11 15,000 8 25,000 4 x x Superior Plus Corp. 2,142,900 IC 10 9 2 7 Yes 270,000 110,000 1,500 5,000 1,500 9,000 17,000 4 2,000 x x Surge Energy Inc. 1,145,289 NIC, LD 8 5 0 5 yes 176,000 112 111,000 112 1,000 10,000 1,000 5,000 10,000 4 x Tahoe Resources Inc. 2,563,150¹ EC, LD 8 7 1 4 Yes 258,033 1,87 25,600¹ 51,200 1,4 x Teck Resources Limited 34,688,000 NIC, LD 14 11 2 10 Yes 659,992 89 159,991 89 1,500 100,000 6,000 1,500 14,000 26,000 4 x x TELUS Corporation 26,406,000 IC 14 13 3 8 Yes 426,767 215,000 15,000 30,000 4,17 x x Thomson Reuters Corporation 37,241,600¹ NIC, LD 14 9 2 7 Yes 768,000¹ 256,000¹ 192,000 1,76 38,400 1,3,4 x x TMx Group Limited 17,017,400 IC 18 13 5 2 Yes 275,000 80,000 1,500 3,000 1,500 10,000 20,000 67 x x TORC Oil and Gas Ltd. 1,894,082 IC 8 7 0 5 Yes 139,996 37 129,996 37 5,000 7,500 4 x Torex Gold Resources Inc. 1,434,962¹ IC 7 6 0 6 Yes 325,000 94 225,000 94 1,000 1,000 15,000 x xToromont Industries Ltd. 1,276,077 NIC, LD 10 8 2 13 Yes 300,000 115,500 2,000 33,000 5,000 8,000 4 2,000 10,000 12,000 8 20,000 4 x x Toronto-Dominion Bank 1,104,373,000 IC 17 16 6 6 Yes 400,000 200,000 15,000 118 50,000 x x Tourmaline Oil Corp. 7,640,671 CC, LD 11 8 1 5 Yes 60,000 xTransAlta Corporation 10,947,000 IC 10 9 3 5 Yes 330,000 160,000 91 91 15,000 25,000 8,35 x x TransAlta Renewables Inc. 3,336,024 IC 6 3 2 2 Yes 85,000 60,000 1,500 1,500 15,000 35 x Transat A.T. Inc. 1,513,764 CC, LD 11 8 3 11 Yes 65,000 1,500 35,000 3,000 5,000 4 1,500 10,000 15,000 4 x x TransCanada Corporation 64,483,000 IC 12 11 3 6 Yes 491,000 180,000 9 1,500 9 5,500 9 1,500 9 12,000 15,000 3,9 20,000 4 x x Transcontinental Inc. 2,113,500 EC, LD 14 9 3 12 Yes 55,000 1,500 10,000 3,000 1,500 6,000 10,000 4,8 x TransForce Inc. 3,377,870 CC, LD 9 7 1 9 Yes 100,000 1,500 50,000 5,000 1,500 12,000 x x Trican Well Service Ltd. 1,311,882 IC 9 7 0 11 Yes 228,540 134,614 1,275 17,000 1,275 8,500 12,750 17 14,875 4 x x Tricon Capital Group Inc. 1,057,953¹ EC, LD 7 4 1 3 yes 50,000 2,500 10,000 2,500 5,000 10,000 4 x x xTrilogy Energy Corp. 1,266,492 NIC, LD 8 5 0 9 Yes 25,000 20,000 70 1,250 1,250 5,000 15,000 4 xTrinidad Drilling Ltd. 2,236,200 IC, LD 9 8 0 5 Yes 147,900 111,450 1,215 16,200 1,215 2,430 4 1,215 6,075 12,150 4 x TurquoiseHillResourcesLtd. 10,547,322¹ IC 7 4 2 2 yes 499,986 200,026 2,000 2,000 20,000 25 40,000 26 50,000 4 x Uni-Select Inc. 1,068,992¹ IC 9 7 1 3 Yes 250,000 60,000 1,750 1,750 8,000 12,000 4,8 x x valeant Pharmaceuticals International Inc. 62,674,560¹ CC, LD 12 10 3 3 Yes 576,000 1,120 128,000¹ 12,800 1,25 16,000¹ 19,200 1,35 19,200 1,25 25,600¹ 64,000 1,35 x x valener Inc. 917,694 IC 5 5 2 4 Yes 25,000 40,000 128 2,000 2,000 veresen Inc. 4,571,000 IC 9 8 2 6 Yes 250,000 160,000 9 1,500 9 1,500 9 10,000 20,000 4,9 x x vermilion Energy Inc. 4,209,220 IC 10 9 2 9 Yes 272,200 86 155,422 86 1,500 1,500 7,000 15,000 4 x Wajax Corporation 677,468 IC 10 9 1 9 Yes 225,000 80,000 1,500 1,500 10,000 15,000 8 17,000 4 x x West Fraser Timber Co. Ltd. 3,635,000 EC, LD 9 7 1 13 Yes 125,000 1,500 50,000 4,000 1,500 10,000 x x Western Forest Products Inc. 743,400 NIC, LD 7 5 1 4 125,000 75,000 1,000 20,000 1,000 5,000 15,000 4 x WestJet Airlines Ltd. 5,129,024 IC 12 10 1 8 Yes 150,000 90,000 6,000 8,000 15,000 4 x x Westshore Terminals Investment Corporation 752,906 CC 7 5 0 10 75,000 10,000 4 20,000 Whitecap Resources Inc. 4,183,085 CC, LD 7 6 0 4 Yes 107,650 22 x Winpak Ltd. 980,663¹ NIC 8 4 1 12 165,000 66,000 5,000 4 2,000 6,000 12,500 4 WSP Global Inc. 6,167,100 NIC, LD 8 5 2 5 Yes 395,870 170,000 60,000 5,000 10,000 4 20,000 25,000 4 x Yamana Gold Inc. 12,183,168¹ CC, LD 10 9 2 8 Yes 224,000¹ 2,560¹ 38,400¹ 2,240¹ 2,880 1,4,17 16,000¹ 25,600 1,4,17 1,920¹ 2,560 1,4,17 x x Yellow Pages Limited 1,710,627 IC 11 10 3 3 Yes 300,000 150,000 10,000 15,000 8 20,000 4 x x
** Includes guidelines to hold any type of shares or share units. Non-bold are specific guidelines. Bold are implicit shareholding policies where directors receive a mandatory portion of their compensation in share units, and those share units must be held as long as the directors is a member of that board.
* CC=combinedCEO/Chair,IC=IndependentChair, NIC=Non-Executive,Non-IndependentChair,EC=Executivechair, LD=LeadDirector(ifblank,thereisnoBoardChairorLeadDirector)
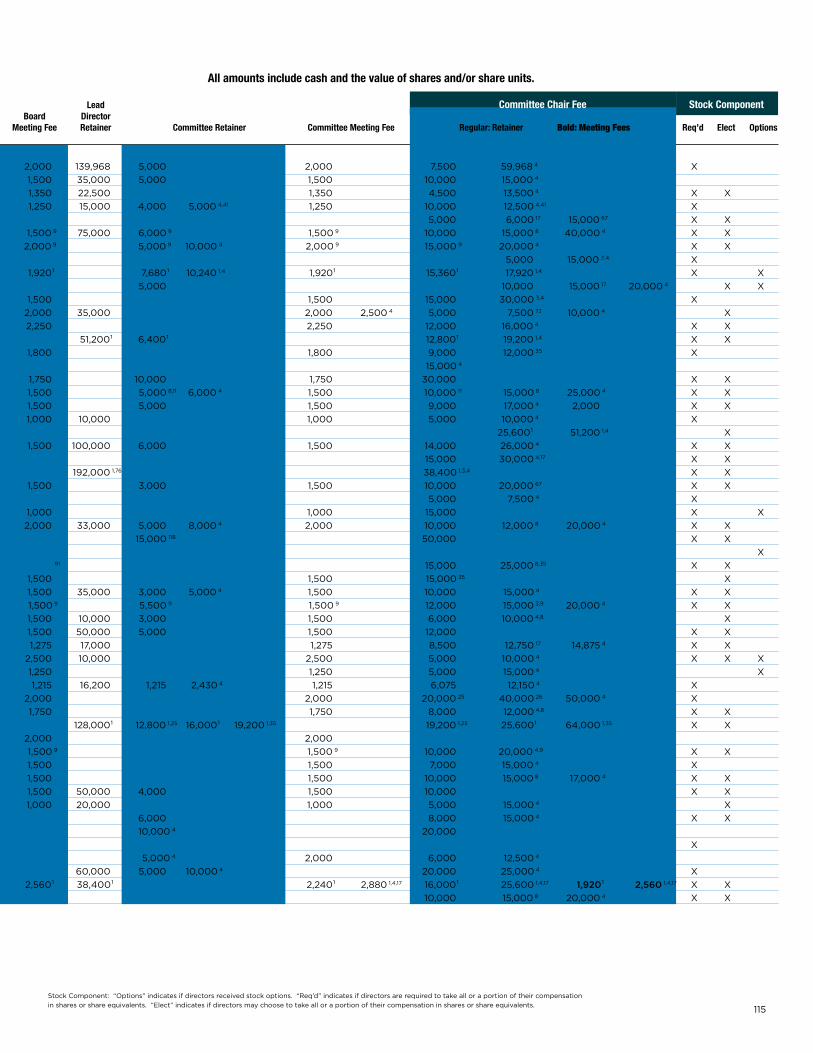
115
Number Number Average Non- Number of of Term **Director Executive Lead Committee Chair Fee Stock Component Assets *Board of Independent Female Served Shareholding Chair Board Board Director Company Name Trust (000’s) Leadership Directors Directors Directors (years) Guideline? Retainer Retainer Meeting Fee Retainer Committee Retainer Committee Meeting Fee Regular: Retainer Bold: Meeting Fees Req’d Elect Options
Saputo Inc. 7,172,300 NIC, LD 10 8 4 9 Yes 500,000 231,560 2,000 139,968 5,000 2,000 7,500 59,968 4 x Sears Canada Inc. 1,633,200 EC, LD 8 3 2 2 125,000 1,500 35,000 5,000 1,500 10,000 15,000 4 Secure Energy Services Inc. 1,315,420 CC, LD 7 5 0 5 Yes 131,500 1,350 22,500 1,350 4,500 13,500 4 x x Semafo Inc. 1,000,337¹ NIC, LD 8 6 1 7 Yes 385,000 120,000 1,250 15,000 4,000 5,000 4,41 1,250 10,000 12,500 4,41 x Seven Generations Energy Ltd. 3,758,982 IC 9 8 0 5 Yes 244,528 189,093 5,000 6,000 17 15,000 67 x x Shaw Communications Inc. 14,564,000 EC, LD 16 12 3 15 Yes 169,598 9 1,500 9 75,000 6,000 9 1,500 9 10,000 15,000 8 40,000 4 x x ShawCor Ltd. 2,145,705 IC 11 10 2 5 Yes 300,000 120,000 9 2,000 9 5,000 9 10,000 4 2,000 9 15,000 9 20,000 4 x x Sherritt International Corporation 4,090,000 IC 8 7 2 4 Yes 360,000 180,000 5,000 15,000 3,4 x Sierra Wireless Inc. 699,305¹ IC 7 6 1 10 yes 151,877 1,57 119,877 1,57 1,920¹ 7,680¹ 10,240 1,4 1,920¹ 15,360¹ 17,920 1,4 x xSilver Standard Resources Inc. 1,115,746¹ IC 7 6 1 4 Yes 250,000 125,000 5,000 10,000 15,000 17 20,000 4 x x Silver Wheaton Corp. 7,209,230¹ IC 9 8 1 8 Yes 315,620 189,660 1,500 1,500 15,000 30,000 3,4 x Smart Real Estate Investment Trust x 8,505,003 NIC, LD 7 4 0 8 Yes 75,000 95 40,000 95 2,000 35,000 2,000 2,500 4 5,000 7,500 72 10,000 4 x SNC-Lavalin Group Inc. 10,503,153 IC 11 10 2 4 Yes 400,000 180,000 2,250 2,250 12,000 16,000 4 x x Spin Master Corp. 497,002¹ CC, LD 9 4 1 0 Yes 153,600¹ 51,200¹ 6,400¹ 12,800¹ 19,200 1,4 x x Stantec Inc. 2,341,879 IC 9 8 2 8 Yes 279,672 204,672 1,800 1,800 9,000 12,000 35 x Stella-Jones Inc. 1,776,218 NIC, LD 9 5 2 14 200,000 90,000 15,000 4 Sun Life Financial Inc. 246,853,000 IC 12 11 4 5 Yes 405,000 140,000 1,750 10,000 1,750 30,000 x x Suncor Energy Inc. 77,527,000 IC 12 11 3 7 Yes 522,813 261,714 1,500 5,000 8,11 6,000 4 1,500 10,000 11 15,000 8 25,000 4 x x Superior Plus Corp. 2,142,900 IC 10 9 2 7 Yes 270,000 110,000 1,500 5,000 1,500 9,000 17,000 4 2,000 x x Surge Energy Inc. 1,145,289 NIC, LD 8 5 0 5 yes 176,000 112 111,000 112 1,000 10,000 1,000 5,000 10,000 4 x Tahoe Resources Inc. 2,563,150¹ EC, LD 8 7 1 4 Yes 258,033 1,87 25,600¹ 51,200 1,4 x Teck Resources Limited 34,688,000 NIC, LD 14 11 2 10 Yes 659,992 89 159,991 89 1,500 100,000 6,000 1,500 14,000 26,000 4 x x TELUS Corporation 26,406,000 IC 14 13 3 8 Yes 426,767 215,000 15,000 30,000 4,17 x x Thomson Reuters Corporation 37,241,600¹ NIC, LD 14 9 2 7 Yes 768,000¹ 256,000¹ 192,000 1,76 38,400 1,3,4 x x TMx Group Limited 17,017,400 IC 18 13 5 2 Yes 275,000 80,000 1,500 3,000 1,500 10,000 20,000 67 x x TORC Oil and Gas Ltd. 1,894,082 IC 8 7 0 5 Yes 139,996 37 129,996 37 5,000 7,500 4 x Torex Gold Resources Inc. 1,434,962¹ IC 7 6 0 6 Yes 325,000 94 225,000 94 1,000 1,000 15,000 x xToromont Industries Ltd. 1,276,077 NIC, LD 10 8 2 13 Yes 300,000 115,500 2,000 33,000 5,000 8,000 4 2,000 10,000 12,000 8 20,000 4 x x Toronto-Dominion Bank 1,104,373,000 IC 17 16 6 6 Yes 400,000 200,000 15,000 118 50,000 x x Tourmaline Oil Corp. 7,640,671 CC, LD 11 8 1 5 Yes 60,000 xTransAlta Corporation 10,947,000 IC 10 9 3 5 Yes 330,000 160,000 91 91 15,000 25,000 8,35 x x TransAlta Renewables Inc. 3,336,024 IC 6 3 2 2 Yes 85,000 60,000 1,500 1,500 15,000 35 x Transat A.T. Inc. 1,513,764 CC, LD 11 8 3 11 Yes 65,000 1,500 35,000 3,000 5,000 4 1,500 10,000 15,000 4 x x TransCanada Corporation 64,483,000 IC 12 11 3 6 Yes 491,000 180,000 9 1,500 9 5,500 9 1,500 9 12,000 15,000 3,9 20,000 4 x x Transcontinental Inc. 2,113,500 EC, LD 14 9 3 12 Yes 55,000 1,500 10,000 3,000 1,500 6,000 10,000 4,8 x TransForce Inc. 3,377,870 CC, LD 9 7 1 9 Yes 100,000 1,500 50,000 5,000 1,500 12,000 x x Trican Well Service Ltd. 1,311,882 IC 9 7 0 11 Yes 228,540 134,614 1,275 17,000 1,275 8,500 12,750 17 14,875 4 x x Tricon Capital Group Inc. 1,057,953¹ EC, LD 7 4 1 3 yes 50,000 2,500 10,000 2,500 5,000 10,000 4 x x xTrilogy Energy Corp. 1,266,492 NIC, LD 8 5 0 9 Yes 25,000 20,000 70 1,250 1,250 5,000 15,000 4 xTrinidad Drilling Ltd. 2,236,200 IC, LD 9 8 0 5 Yes 147,900 111,450 1,215 16,200 1,215 2,430 4 1,215 6,075 12,150 4 x TurquoiseHillResourcesLtd. 10,547,322¹ IC 7 4 2 2 yes 499,986 200,026 2,000 2,000 20,000 25 40,000 26 50,000 4 x Uni-Select Inc. 1,068,992¹ IC 9 7 1 3 Yes 250,000 60,000 1,750 1,750 8,000 12,000 4,8 x x valeant Pharmaceuticals International Inc. 62,674,560¹ CC, LD 12 10 3 3 Yes 576,000 1,120 128,000¹ 12,800 1,25 16,000¹ 19,200 1,35 19,200 1,25 25,600¹ 64,000 1,35 x x valener Inc. 917,694 IC 5 5 2 4 Yes 25,000 40,000 128 2,000 2,000 veresen Inc. 4,571,000 IC 9 8 2 6 Yes 250,000 160,000 9 1,500 9 1,500 9 10,000 20,000 4,9 x x vermilion Energy Inc. 4,209,220 IC 10 9 2 9 Yes 272,200 86 155,422 86 1,500 1,500 7,000 15,000 4 x Wajax Corporation 677,468 IC 10 9 1 9 Yes 225,000 80,000 1,500 1,500 10,000 15,000 8 17,000 4 x x West Fraser Timber Co. Ltd. 3,635,000 EC, LD 9 7 1 13 Yes 125,000 1,500 50,000 4,000 1,500 10,000 x x Western Forest Products Inc. 743,400 NIC, LD 7 5 1 4 125,000 75,000 1,000 20,000 1,000 5,000 15,000 4 x WestJet Airlines Ltd. 5,129,024 IC 12 10 1 8 Yes 150,000 90,000 6,000 8,000 15,000 4 x x Westshore Terminals Investment Corporation 752,906 CC 7 5 0 10 75,000 10,000 4 20,000 Whitecap Resources Inc. 4,183,085 CC, LD 7 6 0 4 Yes 107,650 22 x Winpak Ltd. 980,663¹ NIC 8 4 1 12 165,000 66,000 5,000 4 2,000 6,000 12,500 4 WSP Global Inc. 6,167,100 NIC, LD 8 5 2 5 Yes 395,870 170,000 60,000 5,000 10,000 4 20,000 25,000 4 x Yamana Gold Inc. 12,183,168¹ CC, LD 10 9 2 8 Yes 224,000¹ 2,560¹ 38,400¹ 2,240¹ 2,880 1,4,17 16,000¹ 25,600 1,4,17 1,920¹ 2,560 1,4,17 x x Yellow Pages Limited 1,710,627 IC 11 10 3 3 Yes 300,000 150,000 10,000 15,000 8 20,000 4 x x
All amounts include cash and the value of shares and/or share units.
StockComponent:“Options”indicatesifdirectorsreceivedstockoptions.“Req’d”indicatesifdirectorsarerequiredtotakealloraportionoftheircompensationinsharesorshareequivalents.“Elect”indicatesifdirectorsmaychoosetotakealloraportionoftheircompensationinsharesorshareequivalents.
116 KORN FERRY Canada
1 Converted from U.S. dollars at 1.28
2 Governance Committee.
3 Human Resources Committee.
4 Audit Committee.
5 Risk Committee.
6 This amount reflects the annual board retainer of $50,000 plus a $25,000 fixed annual fee received for Board/Committee Meeting attendance.
7 Directors may receive up to 25% of the value of the portion of their annual board retainer they elect to be paid in DSUs in the formofadditionalDSUs(maximumof$12,500).
8 Human Resources and Compensation Committee.
9 Directors not resident in Canada are paid in U.S. dollars.
10 Starting in January 2015, directors can elect to receive all or a portion of their per-meeting fees in DSUs.
11 Environmental, Health, Safety and Sustainable Development.
12 Fee for each additional committee membership in excess of two.
13 Fee for each special board meeting in excess of five per year.
14 Fee for each special committee meeting in excess of five per year.
15 Audit and Conduct Review Committee.
16 Annual Board and Committee per day meeting fee; paid per day of meetings, regardless of whether a director attended more than one meeting in a single day.
17 Compensation Committee.
18 Includes membership on one committee.
19 Paid for each additional committee membership in excess of one (excludingspecialadhoccommitteesandcommitteechair).
20 Fixed fee for a director sitting on more than one committee, with the exception of the Chair of the Board.
21 $81,024 of this amount represents the value of Restricted Units (RU’s)awardedtodirectorsin2015;theRU’sgrantedtodirectors vest as to one-third per year over a three year period commencing with the year of grant, contingent upon AltaGas achieving a performance milestone during each year of the vesting period.
22 $68,150 of this amount represents the value of performance share awards received by directors in 2015; awards pay out in the third year following the grant date.
23 This amount is paid to Directors who serve on two or more committees of the board; $190K is paid to directors who only serve on one committee of the board.
24 Pension Committee.
25 Governance and Nominating Committee.
26 Compensation and Benefits Committee.
27 Non employee directors are paid $20,000 for membership on all board committees; additionally, each committee chair receives a retainer of $10,000 for each committee chaired.
28 $83,900 of this amount represents the value of RSU’s awarded to directors in 2015; 50% of the RSU’s vest three years from the date of grant and the remaining 50% vests on the seventh anniversary of the grant date.
29 Corporate Governance, Compensation and Nominating Committee.
30 Committee chairs receive no additional committee chair or committee member retainer.
31 Management Resources and Compensation Committee.
32 Includes compensation for serving on one committee.
33 Additional committee fee is applied to Directors who serve on more than one committee, but does not apply to the Board Chair.
34 The Corporation’s policy is to pay to the Directors a fee of $1,500 per Board of Directors meeting attended in excess of five regularly scheduled meetings and five additional meetings.
35 Audit and Risk Committee.
36 This includes an annual meeting retainer of $25,000 for all board and committee meetings attended in 2015.
37 $99,996 of this amount represents the value of restricted share- based awards and performance share-based awards provided to directors in 2015; awards vest as to one-third per year for a period of three years commencing on September 18, 2016.
38 Joint Capital Expenditure Committee.
39 Audit, Finance and Risk Committee.
40 Safety and Reliability Committee.
41 Human Resources and Corporate Governance Committee.
42 $139,989ofthisamount($189,995inthecaseoftheChair) represents the value of DSUs awarded to directors in 2015. In addition, $99,986 of this amount represents the value of RSUs awarded to directors in 2015; RSUs vest and are paid out in three equaltranchesontheanniversarydateofthedataofgranteach year for three years.
43 Directors also receive Aeroplan Program membership privileges and a discretionary travel award of up to $20,000 per year on Star Alliance carriers; directors could elect to receive the discretionary travel award of $20,000 in DSUs.
44 $122,850ofthisamount($150,000inthecaseoftheChair) represents the value of RSUs awarded to directors in 2015; RSUs vest at the end of three years following the date of grant.
45 Risk and Capital Committee.
46 $800 is paid for routine administrative matters where the nature of the discussion is brief.
47 Governance, Human Resources, Nominating and Compensation Committee.
48 Retainer and meeting fees are not paid to the Executive Committee.
49 $90,000ofthisamount($135,000inthecaseoftheChair) represents the value of RSUs awarded to directors in 2015; RSUs vestequallyoverathreeyearperiod.
50 Governance, Employee Development, Nominating and Compensation Committee
51 $222,432 of this amount represents the value of long term incentive received. Directors can elect to receive their LTI in the form of RSUs or DSUs; RSUs vest in the 24th month following the end of the year in which the award was made.
52 $90,000 of this amount represents the value of long term incentive received. Directors can elect to receive their LTI in the form of RSUs or DSUs; RSUs vest in the 24th month following the end of the year in which the award was made.
53 In2015,directorswererequiredtoreceive$105,000inequity compensation.Theycouldelecttoreceivedeferredunits(DU’s) or stock options or a mix of DU’s and stock options in the aggregate of $105,000 in value. The value of stock options was not to exceed $100,000.
End notes
1172016 Corporate Board GovernanCe and direCtor Compensation report
54 $72,210ofthisamount($82,170inthecaseoftheChair) represents the value of restricted awards and performance awards provided to directors in 2015. The awards are paid out in equalinstallmentsinthefirst,secondandthirdanniversariesofthe date of grant.
55 Investment Committee
56 $99,991 of this amount represents the value of restricted awards and performance awards provided to directors in 2015. Awards vest as to 1/6 on the first anniversary of the grant date and a further 1/6 every six months thereafter.
57 $68,677 of this amount represents the value of RSU’s awarded to directorsin2015;RSU’svestoverthreeyearsinequalamountson the anniversary date of the date of grant.
58 Half of the annual retainer paid to Directors is a fixed amount and half is a variable amount; it is expected that each director will use the after tax portion of the variable portion of their retainer to buy shares on the TSx.
59 Directors received cash compensation that ranged in value between $6,000 and $21,200. For calculation purposes we have included a value of $17,200 that one director received.
60 Compensation and Nominating Committee.
61 $82,170ofthisamount($325,800inthecaseoftheChair) representsthevalueofDeferredTrustUnits(DTU’s)awardedto directors in 2015; DTU’s vest on a five year vesting schedule pursuant to which one-fifth of DTU’s will vest on each anniversary of the grant date for a period of five years.
62 $59,340ofthisamount($79,120inthecaseoftheChair)represents thevalueofDeferredTrustUnits(DTU’s)awardedtodirectors in 2015; DTU’s vest on a five year vesting schedule pursuant to which one-fifth of DTU’s will vest on each anniversary of the grant date for a period of five years.
63 Directors of Enbridge Income Fund Holdings Inc. are also directors ofEnbridgeCommercialTrust(ECT).Directorsarecompensated by ECT for their service on both boards; the amounts shown here are reflective of that.
64 Each non-executive trustee in 2015 was entitled to elect to receive upto100%ofhis/herboardcompensation(equatingupto $75,000)intheformofdeferredunits,inlieuofcash,whichsuch amount was matched by CAPREIT.
65 $36,200 of this amount represents the value of Share Appreciation Rights(SAR’s)awardedtodirectorsin2015;SAR’svestonthethird anniversary of their respective dates of grant.
66 $100,000ofthisamount($200,000inthecaseoftheChair) representsthevalueofPhantomShareUnits(PSU’s)awardedto directorsin2015;PSU’svestequallyoverathreeyearperiod.
67 Audit and Finance Committee.
68 Breakdown of director fees was not provided. Directors were paid total amounts ranging between $89,742 and $120,425. For calculation purposes we have included the amount of $109,780. A new compensation program for directors has been approved for 2016 with specific retainer amounts.
69 Audit and Governance Committee.
70 In addition to this amount, directors received $14,070 as a cash bonus under the now discontinued Cash Bonus Plan.
71 Meeting fees payable were $1,000 to $3,000 per meeting dependent upon the location of the meeting and whether it was attended in person or remotely.
72 Compensation and Governance Committee.
73 $10,000 of this amount is the board meeting attendance retainer; retainer fee for meetings implemented in July 2015; prior to this date, the board meeting fee was $1,500/meeting.
74 $7,500 of this amount is the committee meeting attendance retainer; retainer fee for meetings implemented in July 2015; prior to this date, the committee meeting fee was $1,500/meeting.
75 $130,028 of this amount represents the value of DSUs and RSUs awardedtodirectorsin2015(equal50/50weightingbetweenDSUs andRSUs);RSUsvestasto1/3oneachoftheanniversarydates.
76 Lead Director is also Chair of the Governance Committee; this retainer in inclusive of both roles.
77 Directors receive a lump sum of $20,000 for meeting fees.
78 Board Meeting, Strategy and Briefing Session per day. A meeting for routine administrative matters where the nature of the discussion is brief would pay out $800.
79 Committee meeting per day.
80 $81,950 of this amount represents the value of Restricted Awards granted to directors in 2015; RSUs vest as to 1/3 on each of the grant anniversary dates for three years.
81 In addition to this amount, directors received a dollar for dollar match of up to $5,000 of their annual retainer which is directed towards the purchase of common shares.
82 Safety, Environment and Reserves Committee.
83 Human Resources, Compensation and Pension Committee.
84 Each Trustee is entitled to receive a fixed fee of $50,000 per year representing board and committee meeting attendance fees, provided that such trustee attended at least 85% of all board and applicable committee meetings during such year.
85 $100,000 of this amount represents the value of RSUs awarded to directors in 2015; RSUs vest on the third anniversary of the grant date.
86 $130,422ofthisamount($162,200inthecaseoftheChair) represents the value of performance shares awarded to directors in 2015; share awards vest on April 1 of the third year after they are granted.
87 $133,348 of this amount represents the value of restricted shares awarded to Directors in 2015; RSUs vest immediately at the time of grant.
88 Each director also receives a cash allowance of $7200 per annum forthepurposeofassistingthedirectorstoacquire telecommunications services and other related products and services.
89 $99,991ofthisamount($299,992inthecaseoftheChair) represents the value of share units awarded to directors in 2015; directors can elect to receive share units in the form of DSUs or RSUs; DSUs vest immediately while RSUs vest in the second year following the grant date.
90 $192,000 of this amount represents the value of RSUs awarded to directorsin2015;RSUsvestequallyoverthreeyears.
91 In 2015, a flat fee compensation system for the independent directors was implemented; however, for each board meeting in excess of ten, directors receive $1,500/meeting.
92 $100,000 of this amount represents the value of RSUs awarded to directorsin2015;RSUsvestequallyoverthreeyearsbeginningon the first anniversary of the date of grant.
93 $83,730ofthisamount($167,460inthecaseoftheChair) represents the value of RSUs awarded to directors in 2015; once a directorhasmettheminimumshareownershiprequirement,he or she can elect to receive cash in lieu of a portion of the RSUs to be granted, subject to receipt of a minimum annual grant of 1,000 RSUs; RSUs vest on the third anniversary of the grant date.
94 $150,000 of this amount is an annual grant to directors that can be received as a combination of options and RSUs at the discretion of the director and subject to a limit on the value of the options of $100,000.
End notes
118 KORN FERRY Canada
95 Trustees can elect up to 100% of their fees to be paid in the form of Deferred Units in lieu of cash. Smart will then match that amount such that the Trustee, will, subject to certain vesting conditions,receivedeferredunitsequalinvaluetotwotimes the amount of the fees that the Trustee elected to have placed in the deferred unit plan.
96 Technical and Sustainability Committee.
97 In addition to this amount, directors are provided with 15,000 incentiveawards(RIA’s)everythreeyearsthatvestastoone-third or 5,000 shares per year; no RIA’s were awarded in 2015.
98 Each Trustee may elect to receive between 60% and 100% of the annual retainer paid by Boardwalk to that Trustee in a calendar year for service on the board, together with committee fees, attendance fees, additional fees and retainer fees in the form of deferred units in lieu of cash, provided that Boardwalk shall match the elected amount such that the number of deferred units issued toeachparticipantshallbeequalinvaluetotwotimesthe elected amount.
99 $100,004ofthisamount($150,001inthecaseoftheChair) represents the value of RSUs awarded to directors in 2015; RSUs vest as to 1/3 on each of the first, second and third anniversaries of the date of grant.
100 Director fees are payable in cash; however, the after-tax portion of such fees must be used by the directors to purchase common sharesontheopenmarket.Thecommonsharesarerequiredto be held in escrow for an average period of four years.
101 Directors are entitled to elect to receive part or all of their fees in the form of Deferred Units. Chartwell matches all Deferred Units earned on a one-for-one basis.
102 Health, Safety and Environment Committee.
103 $75,000 of this amount represents the value of Incentive Based Units awarded to directors in 2015; these units will vest as to one- third on each of the first, second and third anniversaries of the date of the respective grants.
104 Compliance Review and Corporate Governance Committee.
105 $24,000 of this amount is a monetary amount paid to Trustees. Trustees are strongly encouraged to use the proceeds of this compensation towards the purchase of CREIT units.
106 In addition to this amount, the Chair received $137,500 to cover the administrative costs of running the Chairman’s office.
107 $40,000 of this amount represents the value of RSUs awarded to directors in 2015; RSUs vest as to one-third on each of the three anniversaries following the date of grant.
108 $73,766 of this amount represents the value of RSUs awarded to directorsin2015.Amountdifferedslightlyforsomedirectors. RSUs vest as to one-third on each of the three anniversary dates.
109 $114,660ofthisamount($165,620inthecaseoftheChair) represents the value of Restricted Share Rights awarded to directors in 2015; one half of the restricted shares will vest on the first anniversary of the grant date and the other half will vest on the second anniversary.
110 Directors are given the choice to receive their retainer as a combination of cash and stock options or stock options only.
111 Each outside director who was a member of a board committee, other than the Board Chair, received a per diem fee of US$1,500 for committee meetings he or she attended.
112 $75,000ofthisamount($125,000inthecaseoftheChair) representsthevalueofRestrictedShareAwards(RSAs)awarded to directors in 2015; All RSAs vest as to one-third per year for a period of three years from the date of grant.
113 Director fees ranged in amount and included a retainer fee plus amounts related to the varying degrees of responsibility held by each director. The amount included here has been used for calculation purposes.
114 $456,422 of this amount reflects the value of RSU’s awarded to directors in 2015; RSUs vest as to 1/3 on each of the first, second and third anniversaries of the date of grant.
115 Executive Committee.
116 Conduct Review Committee.
117 A Director who serves on the boards of both Cogeco Cable and COGECO receives a lesser annual retainer from each entity in the amount of $47,500.
118 Applies to directors who serve on more than one committee. Committee chairs are not paid an additional fee for serving on the corporate governance committee.
119 Directors can elect to defer their annual retainer and committee fees and, in lieu of the cash fees, to receive a grant of restricted shareunits(RSUs)withavalueoftwotimestheforegonefees which will settle upon termination of board service. In 2015, all directors elected to receive their fees in the form of RSUs.
120 $412,500 of this amount represents the value of RSU’s awarded to directors in 2015; these annual RSU’s vest and are deliverable prior to the next AGM, unless the director elects to defer issuance until the director’s separation.
121 $99,995 of this amount represents the value of performance based awards given to directors in 2015; the awards vest as to 1/3 upon each anniversary of the grant date over the three yearssubsequenttothegrant.
122 Trustees can elect up to 100% of their fees to be paid in the form of Deferred Trust Units in lieu of cash; the REIT shall match 50% of the elected amount; the matched amounts will vest as to 1/3 on each of the first, second and third anniversary dates of the date of grant.
123 $63,982 of this amount represents the value of restricted share units granted to directors in 2015; RSUs vest in annual installments over three years following the date of grant.
124 Capital Resources Committee.
125 Upon re-election to the board each year, a director is granted 35,000 RSUs. These RSUs vest over three years. Amounts have not been included here as they were not included on the director compensation table in the proxy circular.
126 $114,432 of this amount represents the value of restricted stock unitsawardedtodirectorsin2015;RSUscliffvestattheendofthe calendar year.
127 Compliance Committee.
128 Two directors received this retainer amount as they do not sit on the board of Gaz Metro Inc. as well as valener.
129 In 2015, directors received a grant of DSUs; amounts varied so we have used $292,748 as the grant value.
130 Trustees may elect to receive between 0 and 100% of their annual retainerintheformofRestrictedTrustUnits(RTU’s);Killam matches all RTU payments made directly by each eligible participant; 50% of RTU’s vest two years after the award date, and 50% vest three calendar years after the award date.
131 All inclusive committee retainer fee for all committee work.
End notes
1192016 Corporate Board GovernanCe and direCtor Compensation report
korn Ferry
korn Ferry Canada’s Board Services Practice
KornFerry’sGlobalBoardServicesteamfieldsacoregroupofBoardrecruitmentspecialistswhofocustheirpracticeonassessingandselectingdirectorsforcorporations.Theyaresupportedbyseniorprofessionalsacrossthefirmwhoprovidein-depthlocalknowledgeaboutcurrentand “nextgeneration”directorcandidates.
TheKornFerryBoardServicesPracticeassistsCanadiancompaniesintheidentification,qualificationandattractionofdirectorsfromCanada,theUnitedStatesandelsewherearoundtheworld.ItisKornFerry’smissiontoensureitsclientsrecruitBoardmemberswhohavetheability andtimetomakeasubstantialcontribution,andwhohaveastrongtrackrecordofachievement.
Canada – Board Services Practice Leaders
ToRonTo416-365-1841 Dov Zevy,OfficeManagingDirectorandSeniorClientPartner, [email protected]
CALGARy403-269-3277 Bob Sutton,OfficeManagingDirectorandSeniorClientPartner, [email protected]
MonTRÉAL514-397-9655 Nicolas Bilodeau,SeniorClientPartner [email protected]
vAnCoUvER604-684-1834 Michael O’Callaghan,OfficeManagingDirectorandSeniorClientPartner, [email protected]
Kevin McBurney,SeniorClientPartner CEOandBoardServices
Louise Wells,DirectorofResearchandAnalysis,CorporateBoard GovernanceandDirectorCompensationReport(Calgary403-269-3277)
Since our inception, clients have trusted Korn Ferry to help them recruit world-class leadership talent. Building on this heritage, today we are a single source for a wide range of leadership and talent consulting services.
From our nearly, 150 offices in 52 countries we assist organizations in attracting, developing, retaining and sustaining their people. Services range from executive assessment and recruitment to leadership development programs, enterprise learning, succession planning and recruitment process outsourcing.
More clients around the world trust Korn Ferry than any other firm to deliver and develop the best executives to manage their organizations, a responsibility we take seriously and work every day to meet with unsurpassed integrity and results.
120 KORN FERRY Canada
korn Ferry
noRTh AMERICA
Atlanta Los Angeles RestonBoston McLean San FranciscoCalgary Miami ScottsdaleChicago Minneapolis StamfordDallas Montreal TorontoDallas – Futurestep New York VancouverWaltham Houston PhiladelphiaWashington, DC Irvine Princeton
LATIn AMERICA
Bogota Mexico City Rio de JaneiroBuenos Aires Monterrey Santiago Caracas Quito Sao PauloLima
ASIA PACIFIC
Auckland Kuala Lumpur SingaporeBangalore Melbourne Singapore – FuturestepBeijing Mumbai Sydney Brisbane New Delhi TaipeiGuangzhou Perth SeoulTokyo Hong Kong ShanghaiWellington Jakarta Shanghai – Futurestep
EURoPE, MIddLE EAST, AFRICA
Abu Dhabi Geneva MoscowAlmaty Gothenburg NairobiAmsterdam Hamburg OsloAthens Helsinki ParisBratislava Istanbul Riyadh Brussels Johannesburg StockholmBudapest Kiev Tel AvivCopenhagen London viennaDubai Lyon – Futurestep ZurichDusseldorf Madrid Frankfurt Milan
1212016 Corporate Board GovernanCe and direCtor Compensation report
Patrick o’Callaghan and Associates
Patrick o’Callaghan and Associates Board Effectiveness Advisory Services
• Workingconstructivelywithboardstodevelopandimplementpractical, actionableandeffectiveboard,boardchair,committee,committeechair, and individual director performance evaluations.
• Advisingboardsandboardchairsoncurrentgovernanceissuesandchallenges.
• Definingandclarifyingboardrolesandresponsibilitiesthatfocusonoptimizing theboard’seffectiveness.
• Intervention/mediationforboardsdealingwithinternalconflict.
• Workingtowardsaneffectivetransitionwithboardsofmergingorganizations.
• Specializedresearchandspeakingengagements.
• Developinganddeliveringcustomseminarsandreportsoncurrentgovernanceissues.
• Providingdirectorrecruitmentandboardcompositionstrategyadvice (inpartnershipwithKornFerry).
Patrick O’Callaghan and Associates has maintained a strong commitment to board governance research. In addition to the research undertaken on governance practices and director compensation for this annual report, Patrick O’Callaghan and Associates, in partnership with Korn Ferry, has, since 2001, conducted a focused review of an emerging governance topic.
This research involves at least 100 face-to-face interviews with directors throughout Canada. Focused reporttopicshaveincluded:(over)
PatrickO’CallaghanandAssociatesspecializesinboardeffectivenessinthepublic,privateand not-for-profit sectors. Patrick O’Callaghan and Associates is a pioneer in governance consultinginCanada.Since1992,thisboutiqueconsultingpracticehasprovidedboardgovernance advice to organizations in a wide range of industries throughout Canada, including assignments with federal and provincial crown corporations.
PatrickO’Callaghan,theManagingPartnerandMoniqueSteensma,ClientPartner,havebeen the primary authors of the annual Governance and Compensation Report since 1992, including this year’s Emerging Governance Issues Report – Are risk management and strategy enough? Making succession and talent management true board priorities.
122 KORN FERRY Canada
2016 Are Risk Management and Strategy Enough? Making Succession and Talent Management True Board Priorities.
2015 IndustryKnowledgeonCanadianBoards:WellOfftheTarget
2014 Counting the Hours: How Time Consuming Is It To Be A Canadian Director?
2013 The Impact of Social Media on Boards and Directors Today
2012 Improving the Board Composition and Director Selection Process
2011 Retirement Age and Term Policies - A New Focus
2010 The Challenge of Individual Director Evaluation
2009 Board Chair Succession Planning
2008 BehavioralCompetenciesofanEffectiveDirector
2007 The Board’s Role in Executive Compensation
2006 Gender Diversity on Corporate Boards
2005 The Board’s Role in CEO Succession Planning
2004 How Boards Add value – The CEO Perspective
2003 Is there a Shortage of Qualified Canadian Directors?
2002 Board and Individual Director Evaluation
2001 The Role of the Board Chair in Canadian Companies
PatrickO’Callaghan,theManagingPartner,isafrequentspeakerandseminarleaderoncorporate governance issues. He has first-hand experience as a director of public and private Canadian corporations and several not-for-profit organizations. He has served as a member of the Directors Advisory Group of the Canadian Institute of Chartered Accountants and the Advisory Committee on Senior Level Retention and Compensation for the Treasury Board of Canada. Mr. O’Callaghan was the Founder and past Board Chair of Women On Board, whichwasacquiredin2013byCatalystInc.,theworld’sleadingnonprofitorganizationwitha mission to expand opportunities for women in business. Catalyst is dedicated to creating more inclusive workplaces where employees representing every dimension of diversity can thrive. Mr. O’Callaghan sits on the Advisory Council for Catalyst’s Corporate Board Services.
Patrick O’Callaghan and AssociatesSuite 3000 – 1021 W Hastings Streetvancouver BC v6E 0C3
Telephone:(604)685-5880Fax:(604)684-1884Web: www.poca.net E-mail: [email protected]

1232016 Corporate Board GovernanCe and direCtor Compensation report
www.ignitio
nsc.co
m®