Embed Size (px)
Citation preview
Corporate Presentation
Corporate Presentation
www.telemar.com.br/ir August, 2004
2August 2004August 2004 www.telemar.com.br/ir
Telemar Presentation - Contents
3. Review of Operating Results 12
2. Growth Strategy 3
1. Highlights – 2003/2004 1
4. Financial Overview 20
3August 2004August 2004 www.telemar.com.br/ir
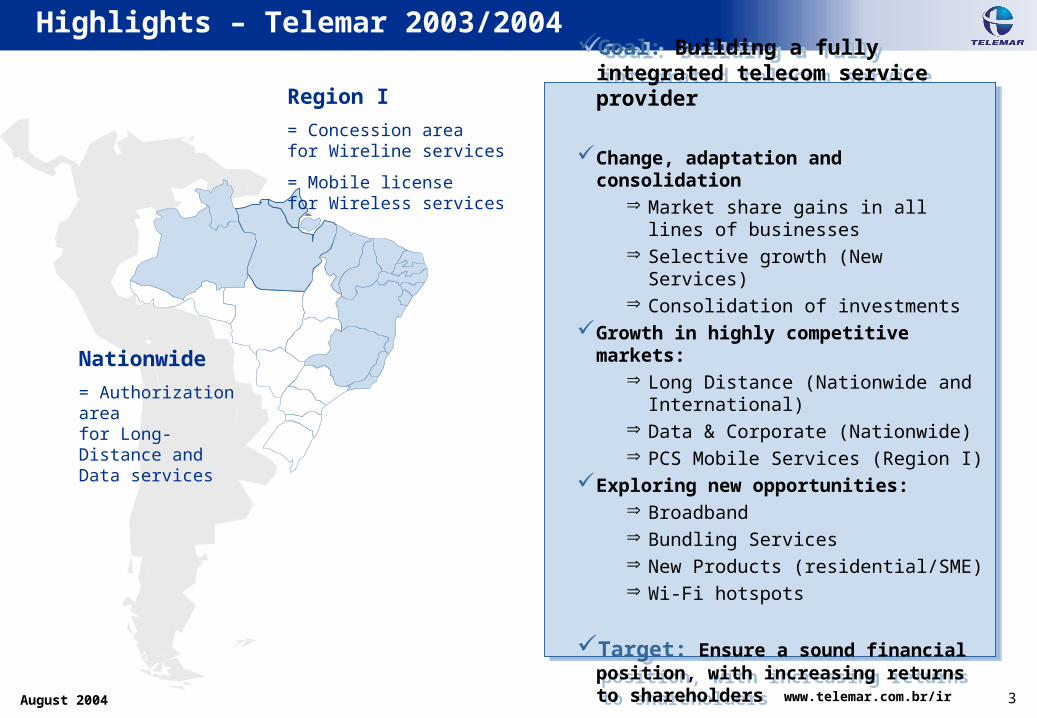
Goal: Building a fully integrated telecom service provider
Change, adaptation and consolidation Market share gains in all lines of
businesses Selective growth (New Services) Consolidation of investments
Growth in highly competitive markets: Long Distance (Nationwide and
International) Data & Corporate (Nationwide) PCS Mobile Services (Region I)
Exploring new opportunities: Broadband Bundling Services New Products (residential/SME) Wi-Fi hotspots
Target: Ensure a sound financial position, with increasing returns to shareholders
Highlights – Telemar 2003/2004
Region I
= Concession areafor Wireline services
= Mobile license for Wireless services
Nationwide
= Authorization areafor Long-Distance and Data services
4August 2004August 2004 www.telemar.com.br/ir
3. Review of Operating Results 12
2. Growth Strategy 3
1. Highlights – 2003/2004 1
4. Financial Overview 20
5August 2004August 2004 www.telemar.com.br/ir
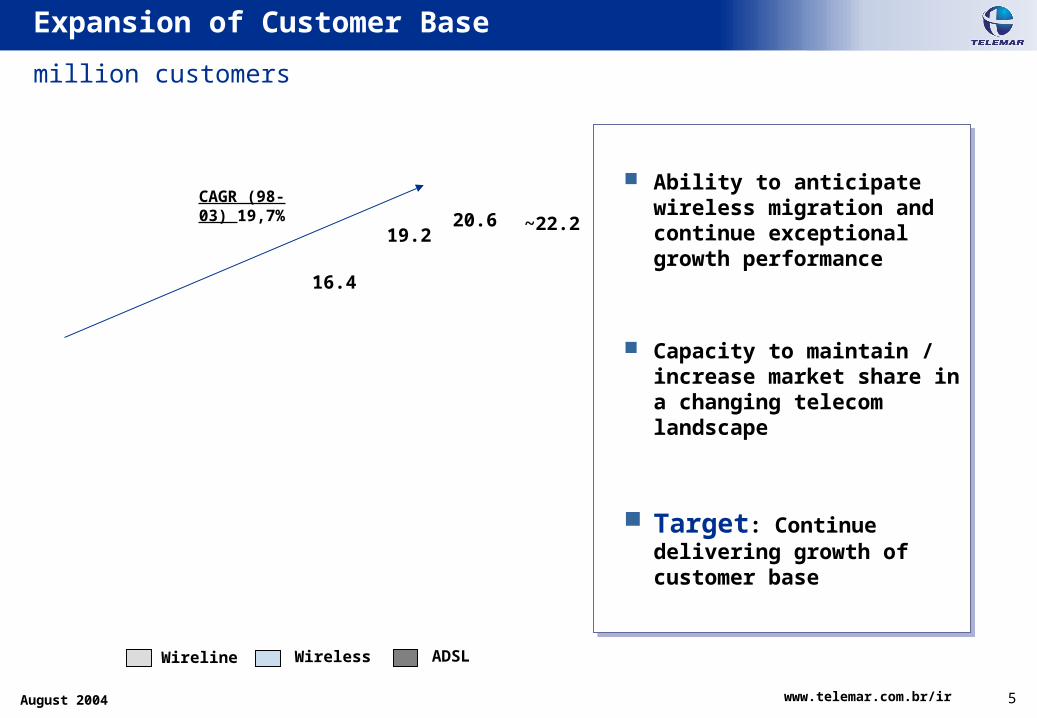
Ability to anticipate wireless migration and continue exceptional growth performance
Capacity to maintain / increase market share in a changing telecom landscape
Target: Continue delivering growth of customer base
Ability to anticipate wireless migration and continue exceptional growth performance
Capacity to maintain / increase market share in a changing telecom landscape
Target: Continue delivering growth of customer base
million customers
*Company’s acquisition
Expansion of Customer Base
CAGR (98-03) 19,7%
19.2
16.4
~22.220.6
Wireline Wireless ADSL
6August 2004August 2004 www.telemar.com.br/ir
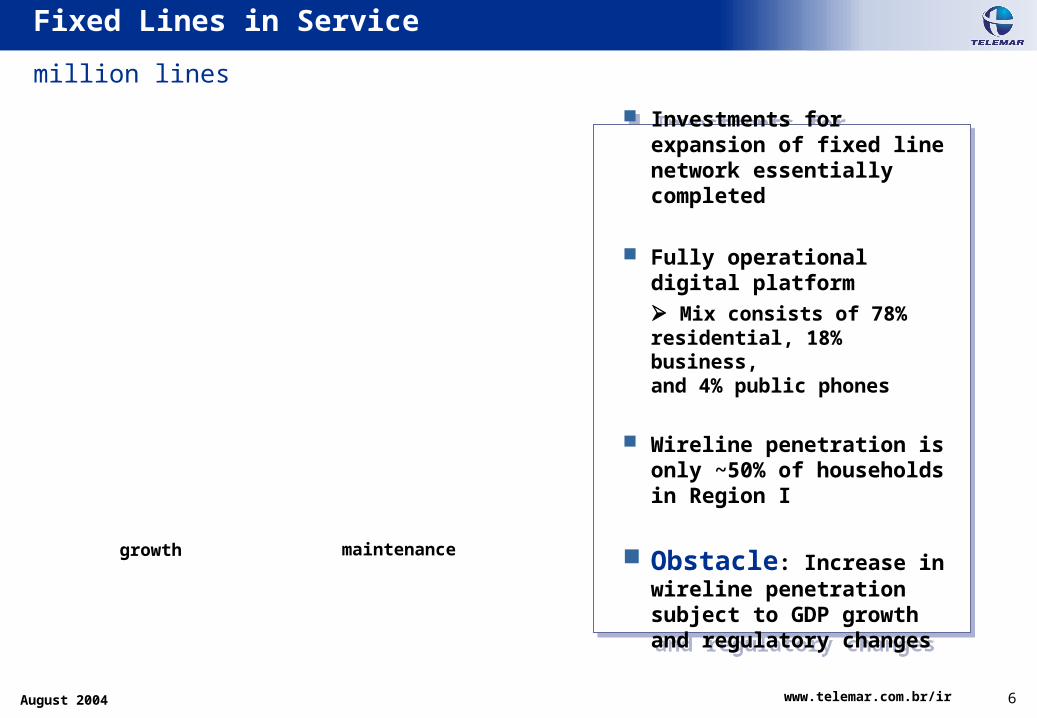
Investments for expansion of fixed line network essentially completed
Fully operational digital platform
Mix consists of 78% residential, 18% business, and 4% public phones
Wireline penetration is only ~50% of households in Region I
Obstacle: Increase in wireline penetration subject to GDP growth and regulatory changes
million lines
Fixed Lines in Service
growth maintenance
7August 2004August 2004 www.telemar.com.br/ir
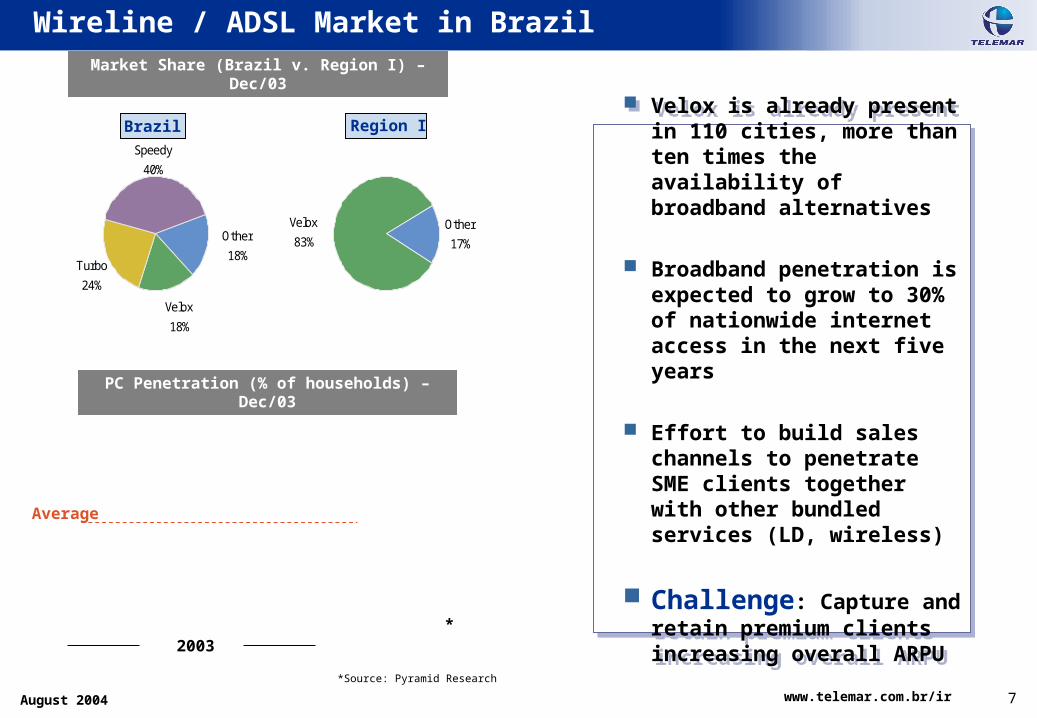
Wireline / ADSL Market in Brazil
Other
17%
Velox
83%
Velox
18%
Other
18%
Speedy
40%
Turbo
24%
Market Share (Brazil v. Region I) – Dec/03
Market Share (Brazil v. Region I) – Dec/03
PC Penetration (% of households) – Dec/03
PC Penetration (% of households) – Dec/03
*
*Source: Pyramid Research
2003
Velox is already present in 110 cities, more than ten times the availability of broadband alternatives
Broadband penetration is expected to grow to 30% of nationwide internet access in the next five years
Effort to build sales channels to penetrate SME clients together with other bundled services (LD, wireless)
Challenge: Capture and retain premium clients increasing overall ARPU
Brazil Region I
Average
8August 2004August 2004 www.telemar.com.br/ir
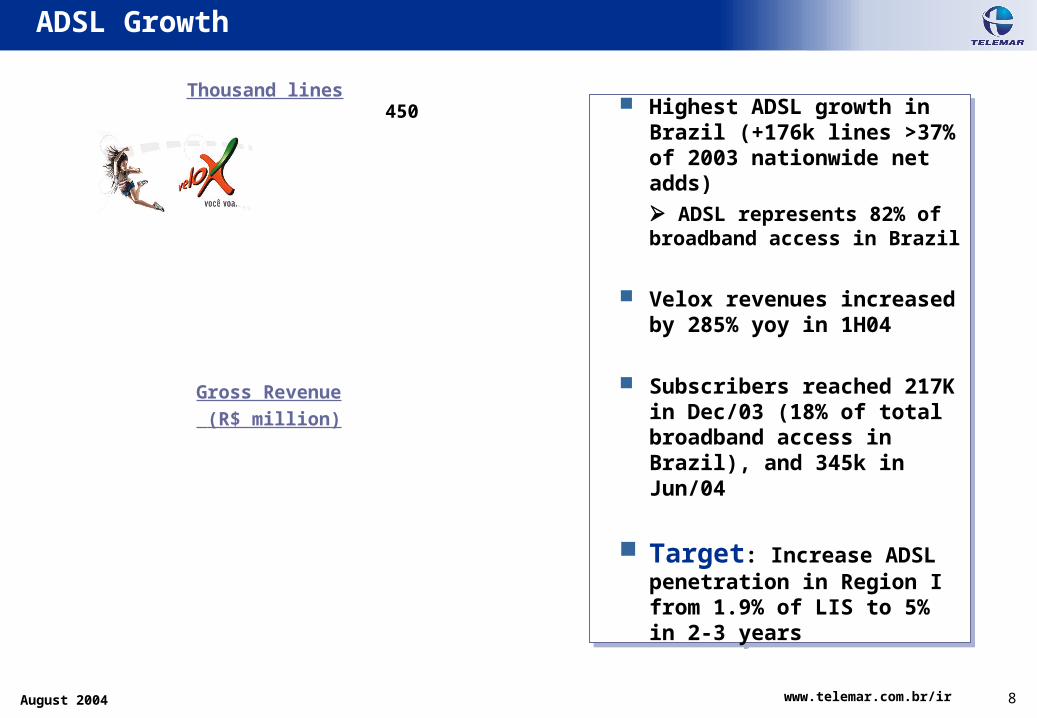
Highest ADSL growth in Brazil (+176k lines >37% of 2003 nationwide net adds)
ADSL represents 82% of broadband access in Brazil
Velox revenues increased by 285% yoy in 1H04
Subscribers reached 217K in Dec/03 (18% of total broadband access in Brazil), and 345k in Jun/04
Target: Increase ADSL penetration in Region I from 1.9% of LIS to 5% in 2-3 years
ADSL Growth
Thousand lines
Gross Revenue
(R$ million)
450
9August 2004August 2004 www.telemar.com.br/ir
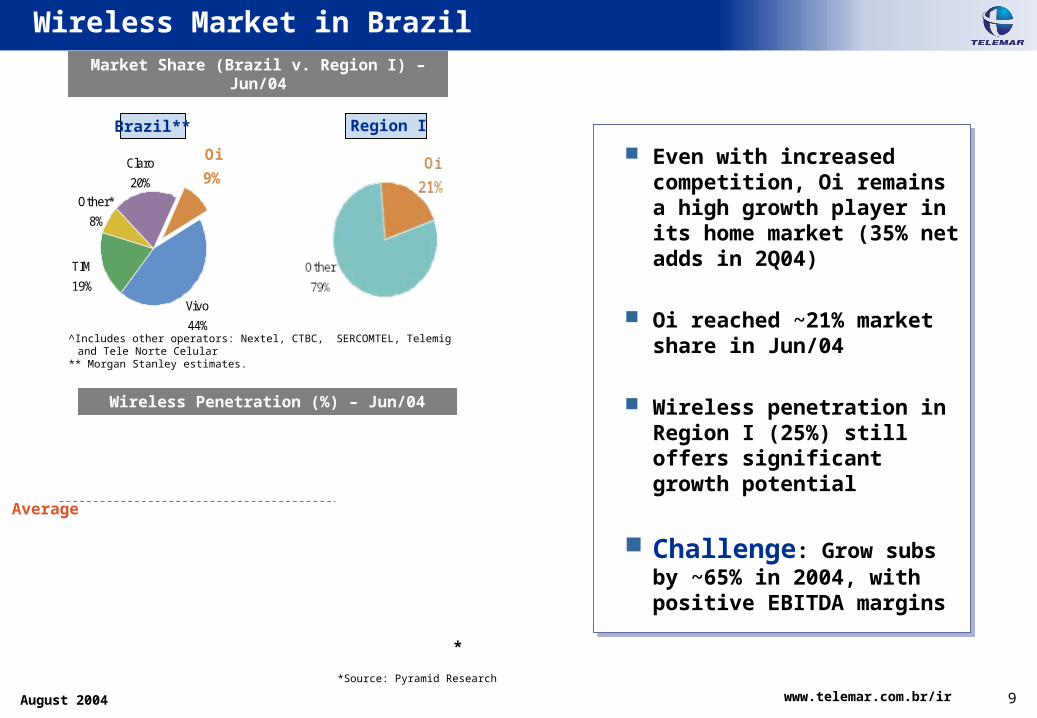
Wireless Market in Brazil
^Includes other operators: Nextel, CTBC, SERCOMTEL, Telemig and Tele Norte Celular
** Morgan Stanley estimates.
Market Share (Brazil v. Region I) – Jun/04
Market Share (Brazil v. Region I) – Jun/04
Wireless Penetration (%) – Jun/04Wireless Penetration (%) – Jun/04
*
*Source: Pyramid Research
Even with increased competition, Oi remains a high growth player in its home market (35% net adds in 2Q04)
Oi reached ~21% market share in Jun/04
Wireless penetration in Region I (25%) still offers significant growth potential
Challenge: Grow subs by ~65% in 2004, with positive EBITDA margins
Even with increased competition, Oi remains a high growth player in its home market (35% net adds in 2Q04)
Oi reached ~21% market share in Jun/04
Wireless penetration in Region I (25%) still offers significant growth potential
Challenge: Grow subs by ~65% in 2004, with positive EBITDA margins
Average
Brazil** Region I
Vivo
44%
TIM
19%
Other*
8%
Claro
20%
Oi
9%
10August 2004August 2004 www.telemar.com.br/ir
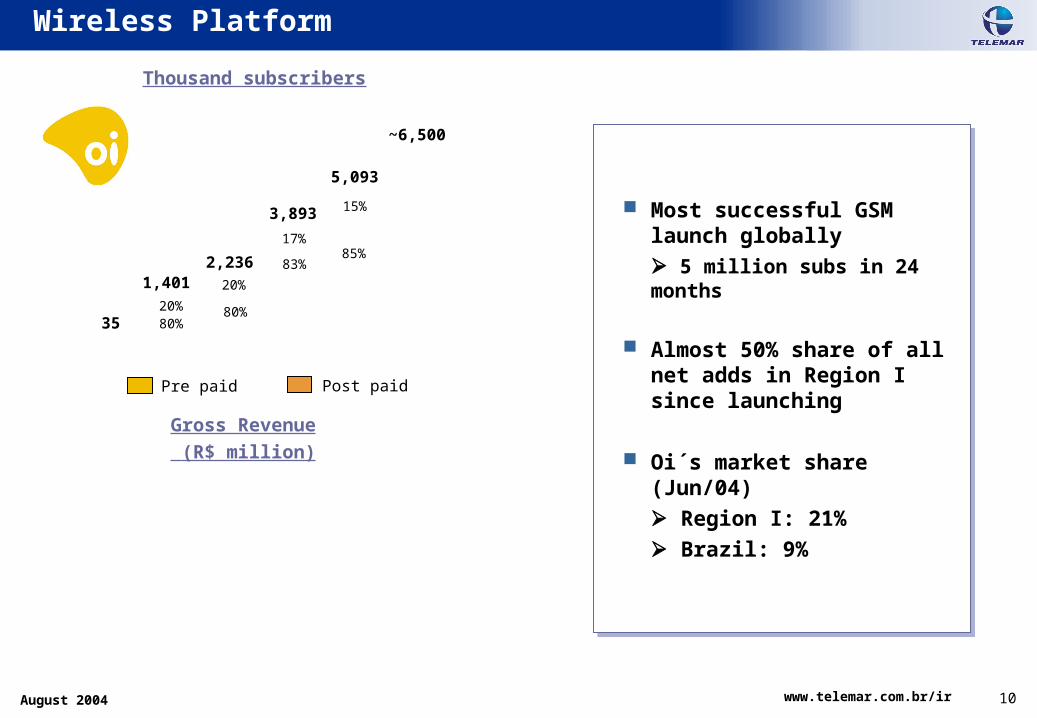
Most successful GSM launch globally
5 million subs in 24 months
Almost 50% share of all net adds in Region I since launching
Oi´s market share (Jun/04)
Region I: 21%
Brazil: 9%
Most successful GSM launch globally
5 million subs in 24 months
Almost 50% share of all net adds in Region I since launching
Oi´s market share (Jun/04)
Region I: 21%
Brazil: 9%
Wireless Platform
Pre paid Post paid
1,4012,236
3,893
80%20% 80%
20%
83%
17%
35
~6,500
Thousand subscribers
Gross Revenue
(R$ million)
5,093
85%
15%
11August 2004August 2004 www.telemar.com.br/ir
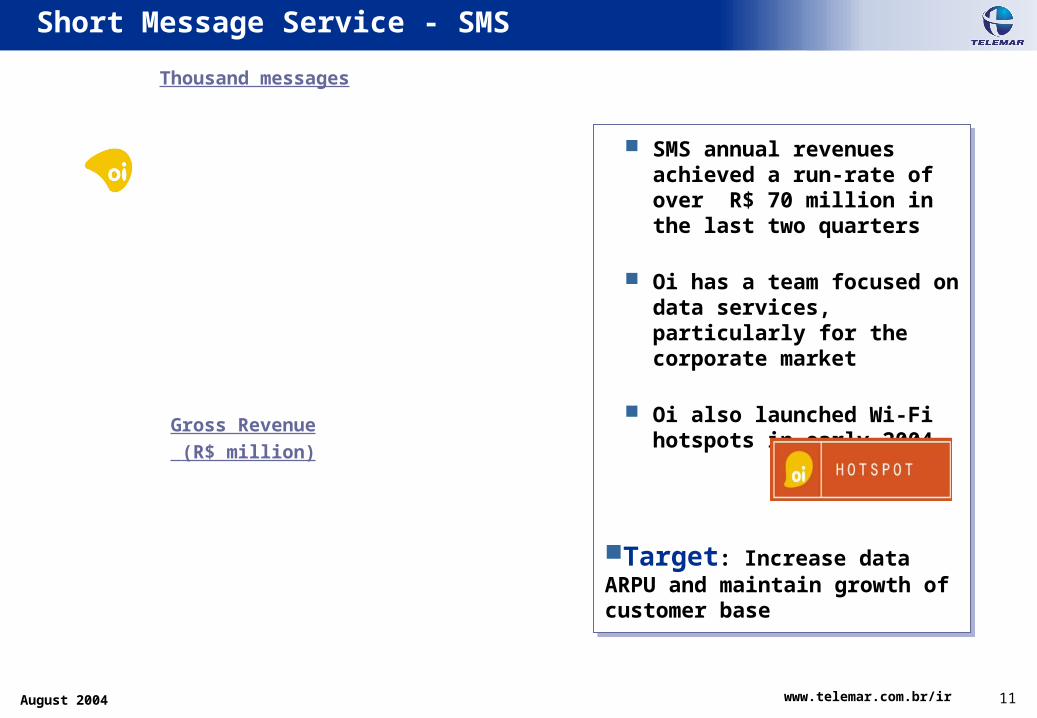
Short Message Service - SMS
Thousand messages
Gross Revenue
(R$ million)
SMS annual revenues achieved a run-rate of over R$ 70 million in the last two quarters
Oi has a team focused on data services, particularly for the corporate market
Oi also launched Wi-Fi hotspots in early 2004
Target: Increase data ARPU and maintain growth of customer base
SMS annual revenues achieved a run-rate of over R$ 70 million in the last two quarters
Oi has a team focused on data services, particularly for the corporate market
Oi also launched Wi-Fi hotspots in early 2004
Target: Increase data ARPU and maintain growth of customer base
12August 2004August 2004 www.telemar.com.br/ir
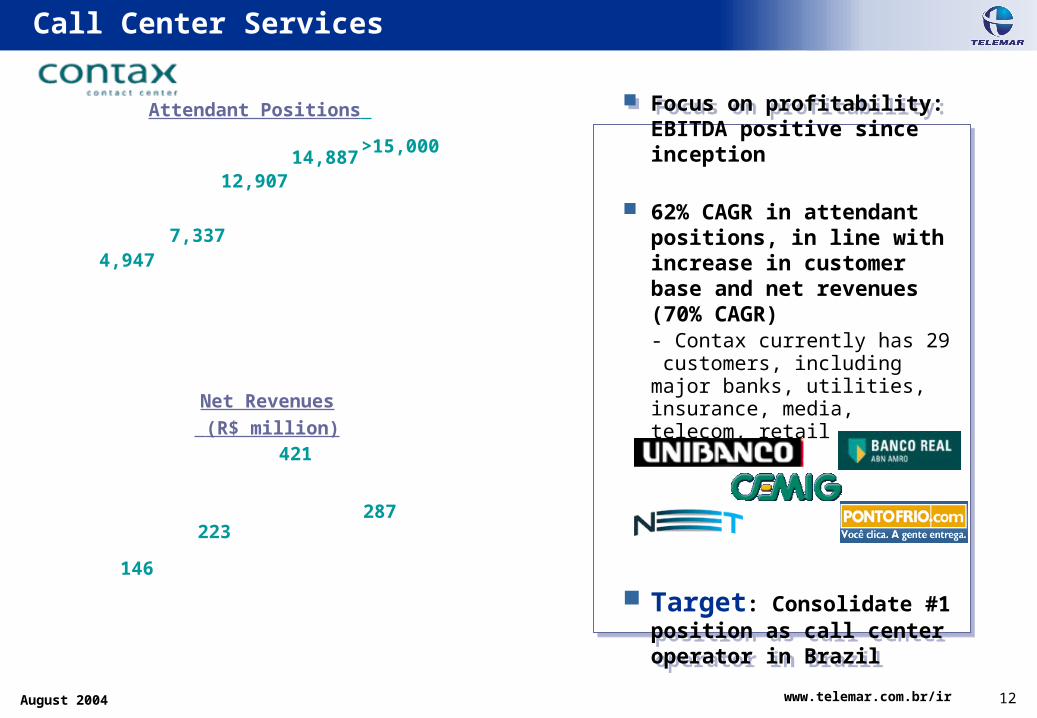
Focus on profitability: EBITDA positive since inception
62% CAGR in attendant positions, in line with increase in customer base and net revenues (70% CAGR)- Contax currently has 29 customers, including major banks, utilities, insurance, media, telecom, retail
Target: Consolidate #1 position as call center operator in Brazil
Call Center Services
Attendant Positions
7,3374,947
12,907
Net Revenues
(R$ million)
223
421
146
>15,00014,887
287
13August 2004August 2004 www.telemar.com.br/ir
3. Review of Operating Results 12
2. Growth Strategy 3
1. Highlights – 2003/2004 1
4. Financial Overview 20
14August 2004August 2004 www.telemar.com.br/ir
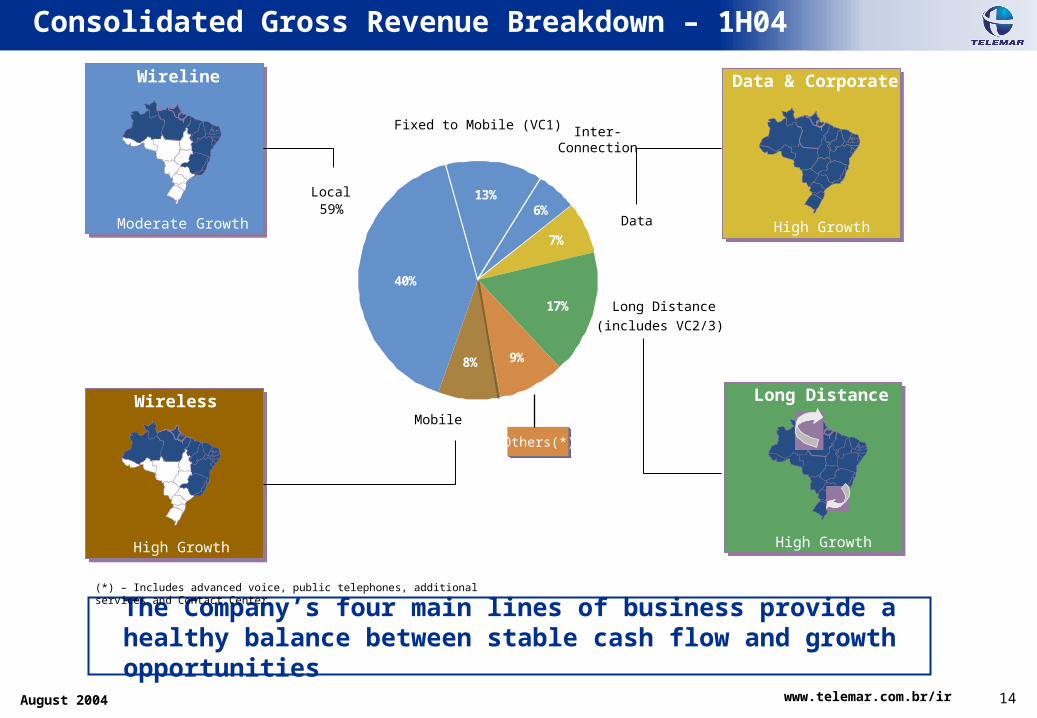
13%6%
7%
17%
9%8%
40%
Consolidated Gross Revenue Breakdown – 1H04
The Company’s four main lines of business provide a healthy balance between stable cash flow and growth opportunities
Local59%
Inter-Connection
Data
Long Distance(includes VC2/3)
Fixed to Mobile (VC1)
Wireline
Moderate Growth
Long Distance
High Growth
Wireless
High Growth
Data & Corporate
High Growth
Others(*)
(*) – Includes advanced voice, public telephones, additional services and Contact Center.
Mobile
15August 2004August 2004 www.telemar.com.br/ir
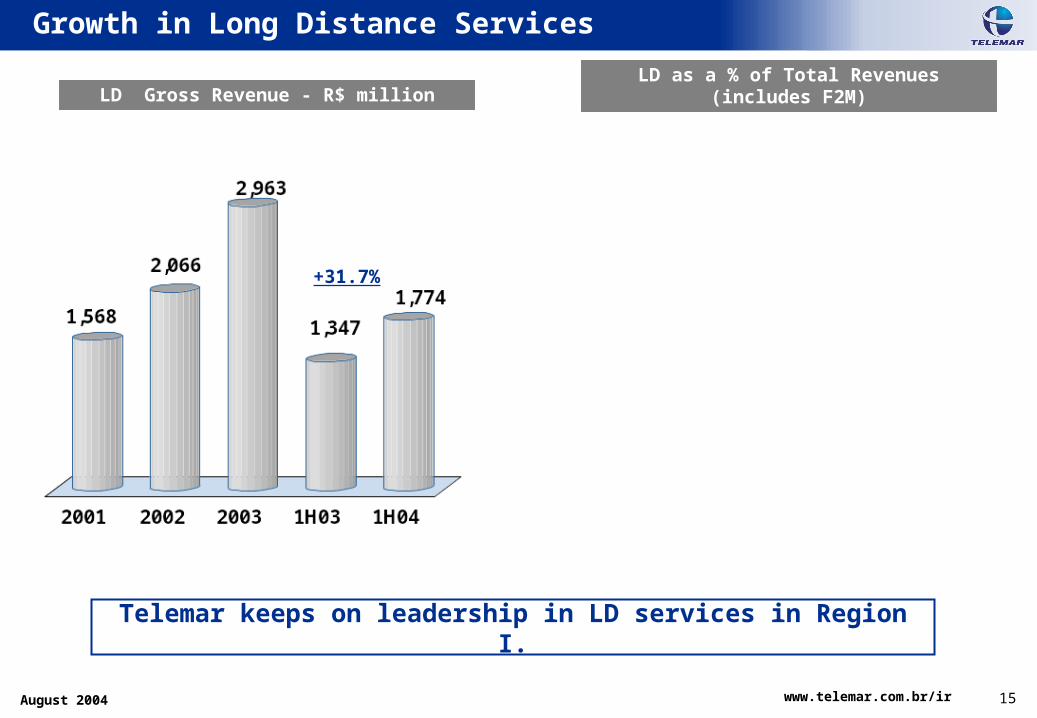
Telemar keeps on leadership in LD services in Region I.
Growth in Long Distance Services
LD Gross Revenue - R$ millionLD Gross Revenue - R$ millionLD as a % of Total Revenues
(includes F2M)
LD as a % of Total Revenues (includes F2M)
+31.7%
16August 2004August 2004 www.telemar.com.br/ir
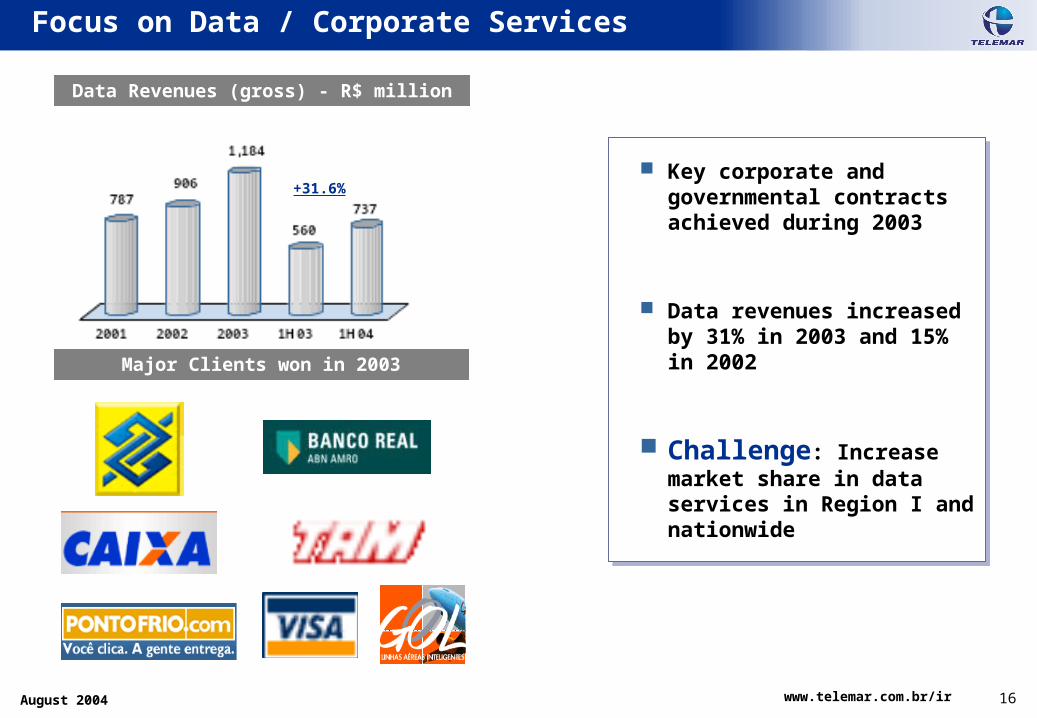
Key corporate and governmental contracts achieved during 2003
Data revenues increased by 31% in 2003 and 15% in 2002
Challenge: Increase market share in data services in Region I and nationwide
Key corporate and governmental contracts achieved during 2003
Data revenues increased by 31% in 2003 and 15% in 2002
Challenge: Increase market share in data services in Region I and nationwide
Focus on Data / Corporate Services
Major Clients won in 2003Major Clients won in 2003
Data Revenues (gross) - R$ millionData Revenues (gross) - R$ million
+31.6%
17August 2004August 2004 www.telemar.com.br/ir
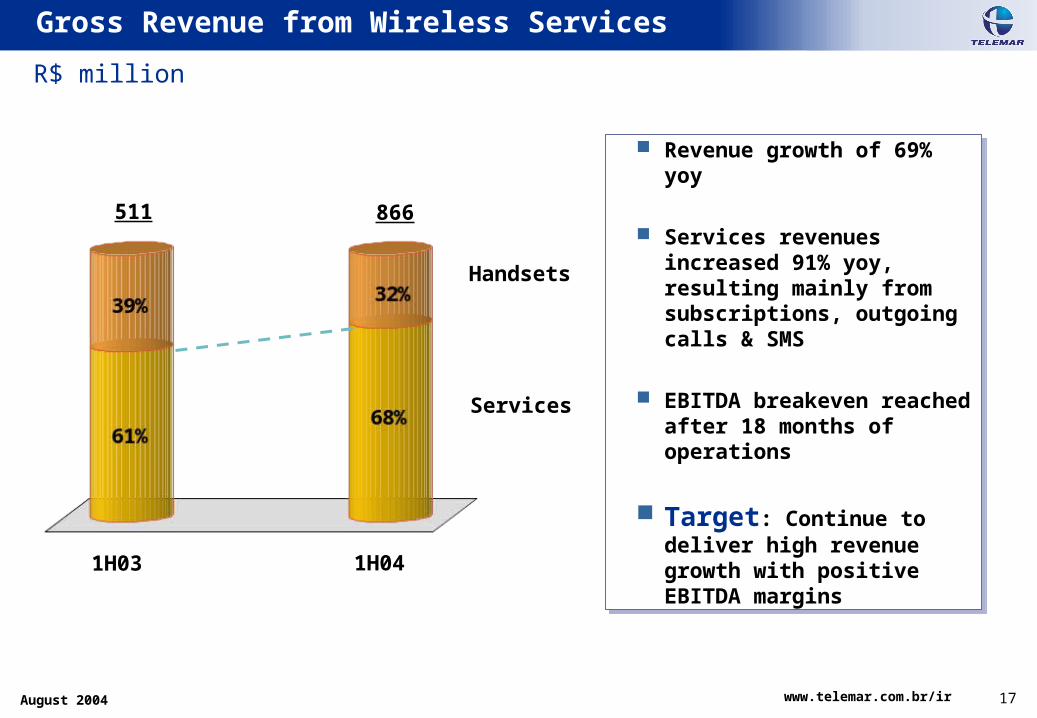
Revenue growth of 69% yoy
Services revenues increased 91% yoy, resulting mainly from subscriptions, outgoing calls & SMS
EBITDA breakeven reached after 18 months of operations
Target: Continue to deliver high revenue growth with positive EBITDA margins
Revenue growth of 69% yoy
Services revenues increased 91% yoy, resulting mainly from subscriptions, outgoing calls & SMS
EBITDA breakeven reached after 18 months of operations
Target: Continue to deliver high revenue growth with positive EBITDA margins
Gross Revenue from Wireless Services
Services
Handsets
R$ million
511 866
1H03 1H04
18August 2004August 2004 www.telemar.com.br/ir
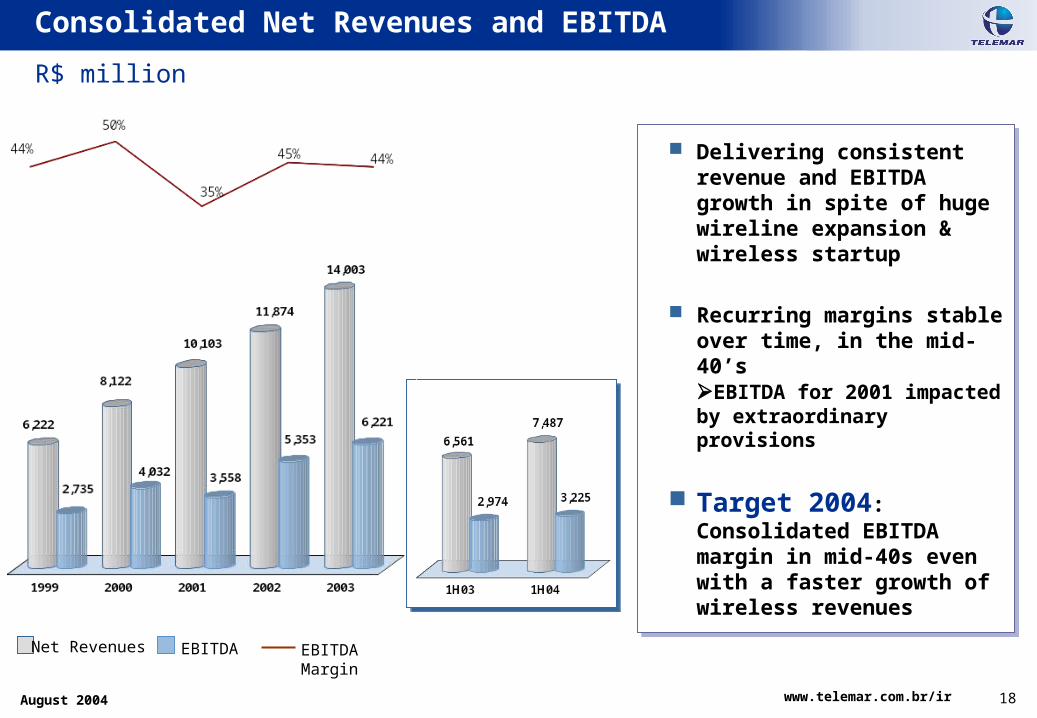
Delivering consistent revenue and EBITDA growth in spite of huge wireline expansion & wireless startup
Recurring margins stable over time, in the mid-40’s EBITDA for 2001 impacted by extraordinary provisions
Target 2004: Consolidated EBITDA margin in mid-40s even with a faster growth of wireless revenues
R$ million
Consolidated Net Revenues and EBITDA
Net Revenues EBITDA EBITDA Margin
19August 2004August 2004 www.telemar.com.br/ir
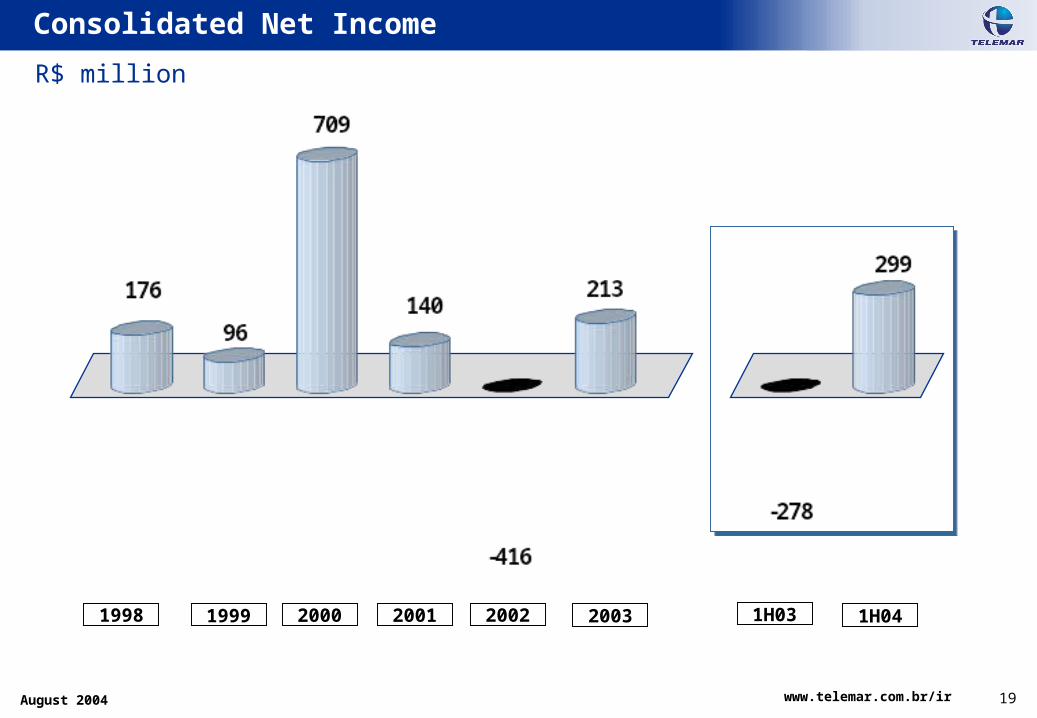
Consolidated Net Income
1999 2000 2001 2002 20031998 1H04
R$ million
1H03
20August 2004August 2004 www.telemar.com.br/ir
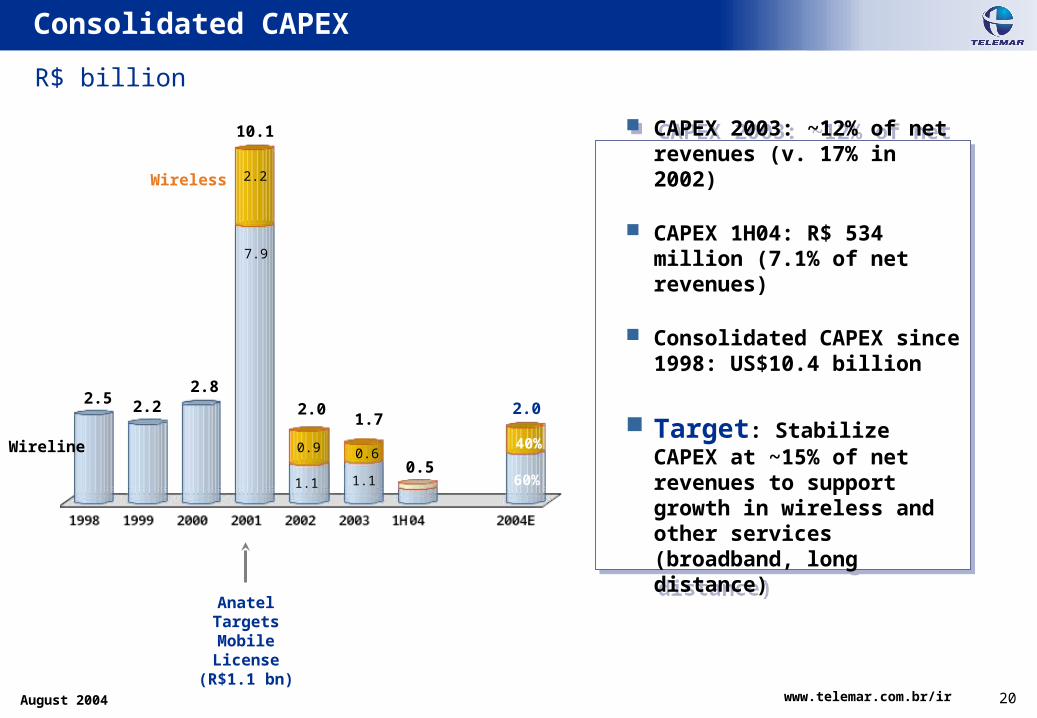
CAPEX 2003: ~12% of net revenues (v. 17% in 2002)
CAPEX 1H04: R$ 534 million (7.1% of net revenues)
Consolidated CAPEX since 1998: US$10.4 billion
Target: Stabilize CAPEX at ~15% of net revenues to support growth in wireless and other services (broadband, long distance)
CAPEX 2003: ~12% of net revenues (v. 17% in 2002)
CAPEX 1H04: R$ 534 million (7.1% of net revenues)
Consolidated CAPEX since 1998: US$10.4 billion
Target: Stabilize CAPEX at ~15% of net revenues to support growth in wireless and other services (broadband, long distance)
10.1
2.01.7
Wireline
Consolidated CAPEX
Wireless
R$ billion
Anatel TargetsMobile License
(R$1.1 bn)
2.0
1.1
0.9
1.1
2.82.22.5
0.6
60%
40%
2.2
7.9
0.5
21August 2004August 2004 www.telemar.com.br/ir
3. Review of Operating Results 12
2. Growth Strategy 3
1. Highlights – 2003/2004 1
4. Financial Overview 20
22August 2004August 2004 www.telemar.com.br/ir
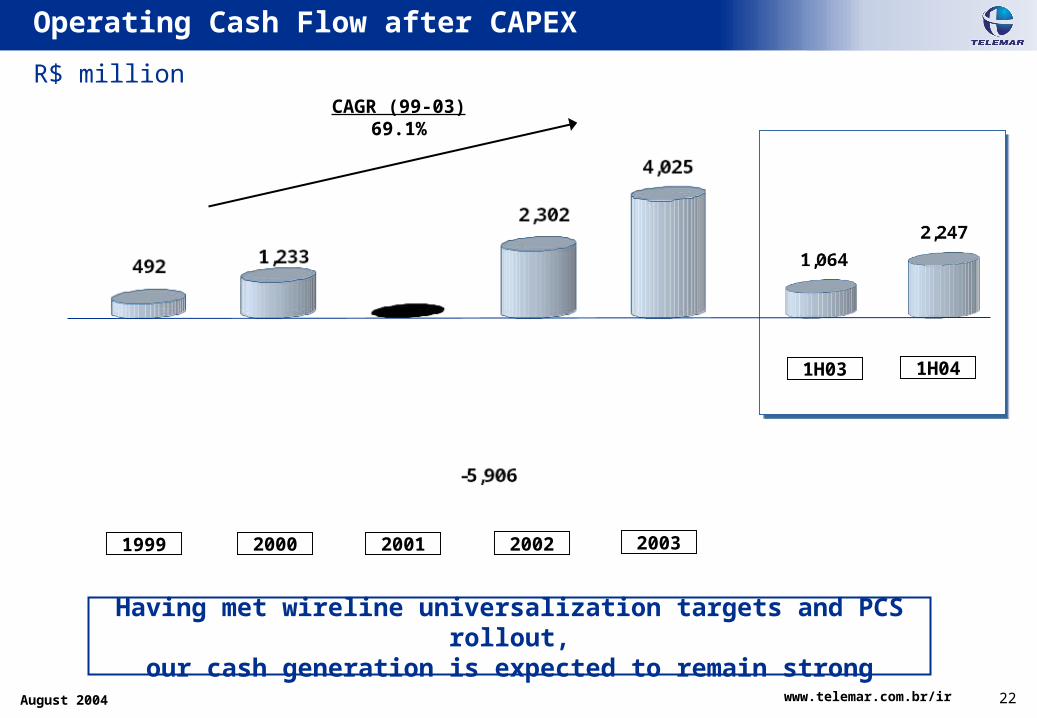
Operating Cash Flow after CAPEX
R$ million
1999 2000 2001 2002 2003
Having met wireline universalization targets and PCS rollout,our cash generation is expected to remain strong
CAGR (99-03)69.1%
1H041H03
23August 2004August 2004 www.telemar.com.br/ir
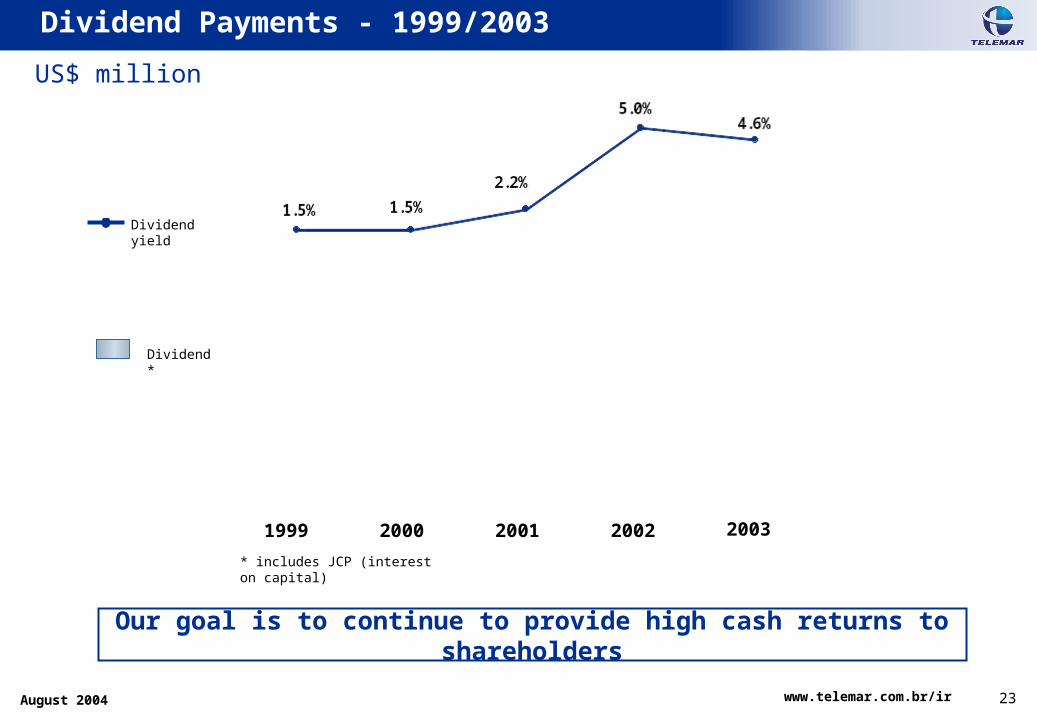
Dividend Payments - 1999/2003
1999 2000 2001 2002 2003
Dividend yield
Dividend *
US$ million
Our goal is to continue to provide high cash returns to shareholders
* includes JCP (interest on capital)
24August 2004August 2004 www.telemar.com.br/ir
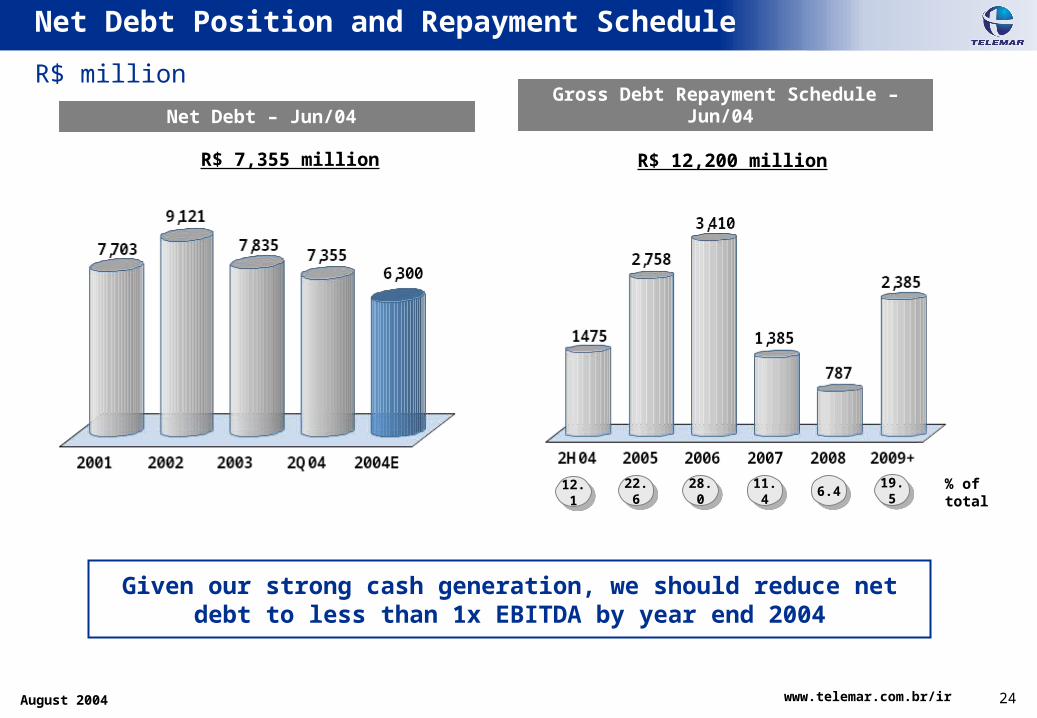
Net Debt Position and Repayment Schedule
R$ million
% of total
12.1 22.6 28.0 11.4 6.4
Net Debt – Jun/04 Net Debt – Jun/04 Gross Debt Repayment Schedule –
Jun/04
Gross Debt Repayment Schedule – Jun/04
Given our strong cash generation, we should reduce net debt to less than 1x EBITDA by year end 2004
19.5
R$ 7,355 million R$ 12,200 million
25August 2004August 2004 www.telemar.com.br/ir
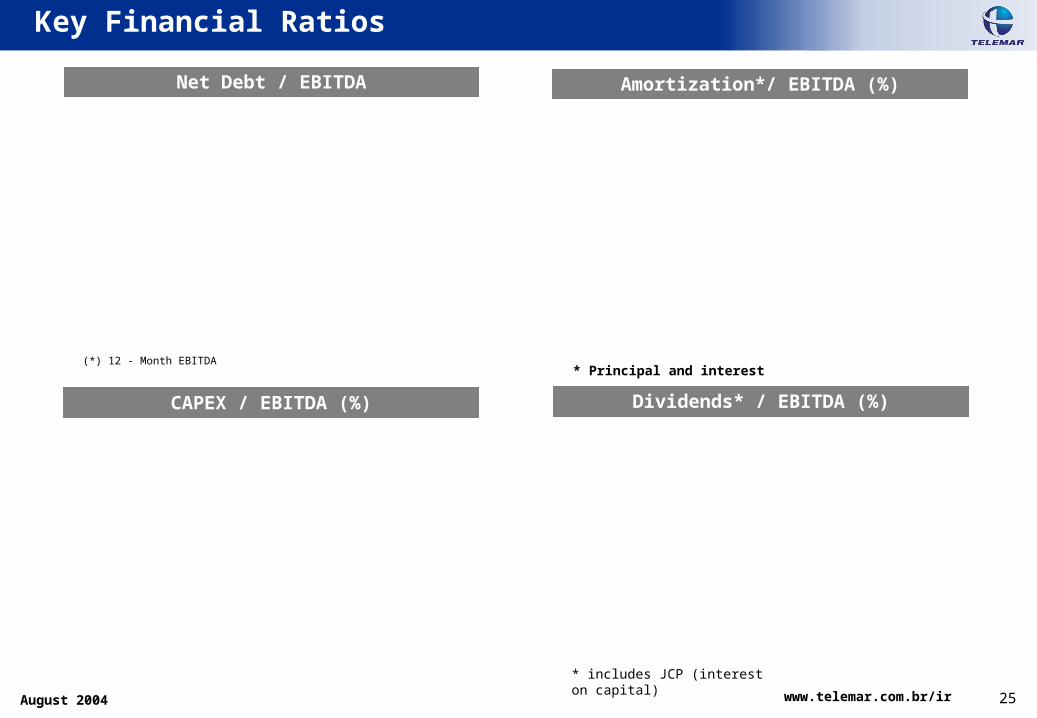
Key Financial Ratios
Net Debt / EBITDANet Debt / EBITDA Amortization*/ EBITDA (%)Amortization*/ EBITDA (%)
Dividends* / EBITDA (%)Dividends* / EBITDA (%)CAPEX / EBITDA (%)CAPEX / EBITDA (%)
* includes JCP (interest on capital)
(*) 12 - Month EBITDA* Principal and interest
26August 2004August 2004 www.telemar.com.br/ir
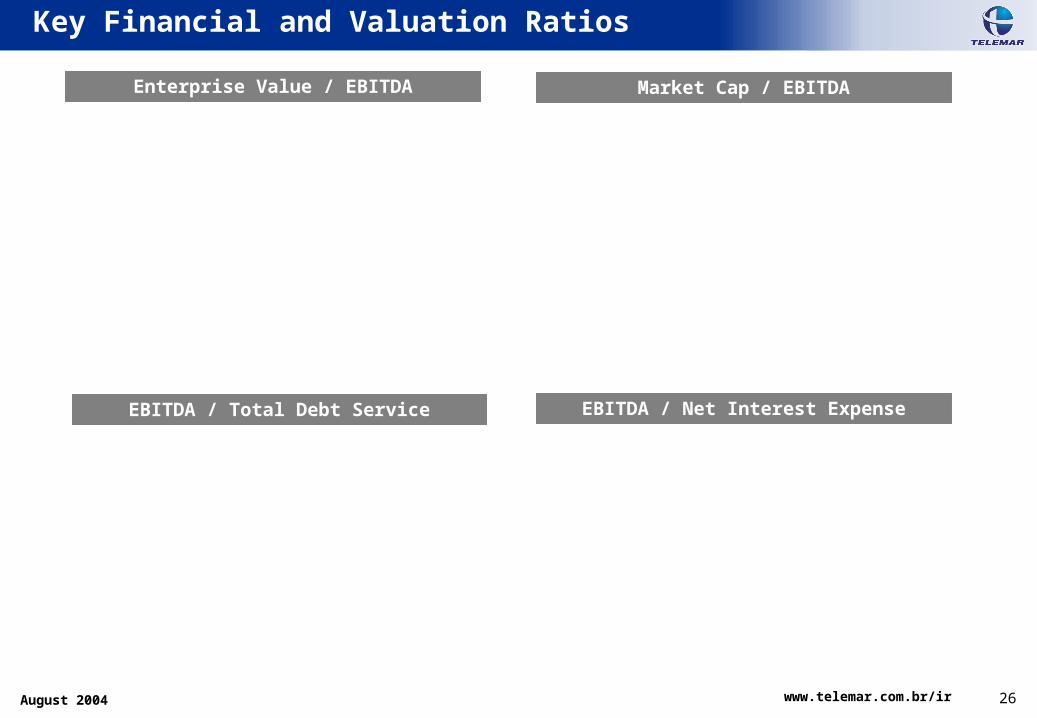
Key Financial and Valuation Ratios
Enterprise Value / EBITDAEnterprise Value / EBITDA Market Cap / EBITDAMarket Cap / EBITDA
EBITDA / Net Interest ExpenseEBITDA / Net Interest ExpenseEBITDA / Total Debt ServiceEBITDA / Total Debt Service
27August 2004August 2004 www.telemar.com.br/ir
Investor Relations
Rua Humberto de Campos, 425 / 8º andar
Leblon
Rio de Janeiro -RJ
Phone: ( 55 21) 3131-1314/1313/1315/1316
Fax: (55 21) 3131-1155
E-mail: [email protected]
Visit our website:
http://www.telemar.com.br/ir
This presentation contains forward-looking statements. Statements that are not historical facts, including statements about our beliefs and expectations, are forward-looking statements and involve inherent risks and uncertainties. These statements are based on current plans, estimates and projections, and therefore you should not place undue reliance on them. Forward-looking statements speak only as of the date they are made, and we undertake no obligation to update publicly any of them in light of new information or future events
“Safe Harbor” Statement