Embed Size (px)
Citation preview
Correlates of the Minnesota Multiphasic Personality Inventory-2 Restructured Form
(MMPI-2-RF) Scores for Asian Indian College Students
By
Saloni Taneja, M.A., M.S.
Clinical Psychology
Florida Institute of Technology
A doctoral research project submitted to Florida Institute of Technology
in partial fulfillment of the requirements for the degree of
Doctor of Psychology in Clinical Psychology
Melbourne, FL
December 2016
We the undersigned committee, hereby approve the attached doctoral research project in partial
fulfillment for the degree of Doctor of Clinical Psychology Correlates of the Minnesota Multiphasic Personality Inventory-2 Restructured Form (MMPI-2-
RF) Scores for Asian Indian College Students
By
Saloni Taneja, M.A., M.S.
Radhika Krishnamurthy, PsyD, ABAP Professor, School of Psychology Doctoral Research Project Chair
Maria Lavooy, PhD Associate Professor, School of Psychology Doctoral Research Project Committee Member
Kunal Mitra, PhD Professor, Biomedical Engineering Doctoral Research Project Committee Member
Mary Beth Kenkel, PhD Dean, College of Psychology and Liberal Arts
iii
Abstract
Correlates of the Minnesota Multiphasic Personality Inventory-2 Restructured Form (MMPI-2-RF) Scores for Asian Indian College Students
Saloni Taneja, M.A., M.S.
Major Advisor: Radhika Krishnamurthy, PsyD, ABAP
This study was designed to investigate empirical correlates of the Minnesota
Multiphasic Personality Inventory-2-Restructured Form (MMPI-2-RF) for Asian
Indian college students using the NEO Five Factor Inventory-3, College
Maladjustment Scales and Measures of Psychosocial Development. The study utilized
an Asian Indian college student sample (N=48) from a private university in Florida.
Pearson Product Moment correlations were computed to establish correlates of the
MMPI-2-RF scale scores. Overall, a large number of significant correlates with large
effect sizes were found across the three measures. Some correlates found in the study
provided an expansion for the interpretation of the MMPI-2-RF scales for Asian
Indian college students. The study also aimed to identify similarities and differences in
personality patterns of Asian Indian and Caucasian American college students (N=21)
by comparing their mean MMPI-2-RF scale scores. Multivariate and Univariate
analysis of results were not significant, but useful trends of differences were found for
some scales. Lastly, the study examined similarities and differences in personality
patterns of high and low acculturated Asian Indian college students and correlates of
the MMPI-2-RF scales separately for these subgroups. A higher number of correlates
were found between MMPI-2-RF scale scores and the three external measures for
those low on acculturation. Limitations, contributions and future research directions
are discussed.
iv
Table of Contents
Introduction…………………………………………………………….……...……..1
Review of Literature…………………………………………………….……...….....3
Personality: Definitions and Descriptions…………………………..……….....…3
Culture and Personality…………….......................................................................6
Personality Assessment……………………………...............................................9
Self-report inventories. ………………………………………………..........10
Performance-based personality assessment.....................................................11
The MMPI, MMPI-2, and MMPI-2-RF………..……………………….… …….13
The Minnesota Multiphasic Personality Inventory ……………...…….…….13
The Minnesota Multiphasic Personality Inventory-2………………….……16
The Minnesota Multiphasic Personality Inventory-2-RF………………........20
MMPI, MMPI-2, MMPI-2-RF with Cultural Groups…………………….……..25
International Adaptations of the MMPI/MMPI-2…………………….…….25
Use and adaptations in Asia…………………………………….……..…....25
Use of the MMPI, MMPI-2 and MMPI-2 RF with Ethnic Groups……….….….27
Hispanic, Mexican and Mexican American studies………………….……...28
Asian and Asian American Studies………………….....................................30
Correlates of the MMPI/MMPI-2/MMPI-2-RF with College Students..…..…....32
MMPI/MMPI-2/MMPI-2-RF with College Students from Various Cultural
Groups………………………………………………………………………......39
v
African American students………………...…………………..………….39
Mexican/Hispanic students………………………………………………..41
Asian and Asian American students……...……………..………………...42
MMPI and Asian Indians…………………………………..…………………. 43
Use of the MMPI in India……………………………………...…….……43
Use of the MMPI with Asian Indian college students in the U.S………... 44
Rationale and Hypotheses…………………………………………….……………47
Methods………………………………………………………….…………………50
Participants…………………...………………………………….……………..50
Instruments…………………………………………………………………..…52
Procedure………………………….………………………………………..….56
Data Analyses………………………………………………………………….55
Results………………………………………………………………….………..…58
Discussion………………………………………………………………………….82
References ……………………………………………………………………........89
Appendix A: Expanded Correlates for the MMPI-2-RF for Asian Indian College
Students………………………………………………………………………….....105
Appendix B: Acculturation Scale for Asian Indians…………………………….....115
Appendix C: Participant Informed Consent Form ……………………………..…..120
vi
List of Tables
Table 1 Validity and Clinical Scales of the MMPI and MMPI-2…………………..…………19
Table 2 MMPI-2-RF Scales and Measured Characteristics…………………………….…….21
Table 3 MMPI-2-RF means and standard deviations for the Asian Indian sample…………..58
Table 4 MPD Negative Scale means and standard deviations for the Asian Indian
sample…………………………………………………………………………..…….60
Table 5 NEO-FFI-3 means and standard deviations for the Asian Indian sample………...…60
Table 6 CAS means and standard deviations for the Asian Indian sample……………...……61
Table 7 MMPI-2-RF means and standard deviations for the Caucasian American sample.…62
Table 8 NEO-FFI-3 correlates of the MMPI-2-RF scale scores for Asian Indian students…..64
Table 9 CAS correlates of the MMPI-2-RF scale scores for Asian Indian students……..……66
Table 10 MPD Negative Scale correlates of the MMPI-2-RF scale scores for Asian Indian students……………………………………………………………………………..…70 Table 11 MMPI-2-RF 3 means and standard deviations for high and low acculturated Asian Indian students…………………………………………………………………….…74 Table 12 Significant NEO-FFI-3 correlates of the MMPI-2-RF scale scores for low and high acculturated Asian Indian students……………………………………………………………………..…………75
vii
Table 13 Significant CAS correlates of the MMPI-2-RF scale scores for low and high acculturated Asian Indian students…………………………………..………………76 Table 14 Significant MPD Negative Scale correlates of the MMPI-2-RF scale scores for low and high acculturated Asian Indian students…………………………………………………………………………………...……78 Table 15 Expanded correlates for the MMPI-2-RF for Asian Indian college students………………………………………………………………………………..………105
Correlates of the MMPI-2-RF for Asian Indians
1
Introduction
Asian Indian migrants began arriving in the United States as early as 1820.
Although few in number at the time, the Indian population surged since the 1990s
and 2000s and has become the third largest Asian immigrant group in the United
States (U.S. Census Bureau, 2010). According to census statistics, there was a
67.6% increase in the number of Asian Indians where the total number of Asian
Indian immigrants increased from 1,899,599 in 2000 to 3,183,063 in 2010.
Currently, the Asian Indian population constitutes 9.1% of the total Asian
population in the United States (U.S. Census Bureau, 2010). More than half of
Indian immigrants in the United States obtain lawful permanent residence through
the employment-based preference option.
Among the international college student population, close to 103,000 Asian
Indian students were enrolled in U.S. educational institutions in the 2013-14 school
year (U.S. Citizenship and Immigration Services, 2015). It is likely that with
increasing number of college and university students, some percentage of students
will receive psychotherapy and psychological testing. There are greater demands
on college counseling centers today to diagnose and treat various types of student
related problems, ranging from adjustment problems to severe psychopathology.
International students bring with them their own cultural reference points for
behavioral functioning, some of which differ substantially from American norms.
Thus, they may appear out-of-step from their American peers, at least initially.
Furthermore, the transition to a new cultural environment makes demands on
processes of adaptation and acculturation, and some international students cope
with these challenges more successfully than others.
Correlates of the MMPI-2-RF for Asian Indians
2
Personality assessment measures such as the Minnesota Multiphasic
Personality Inventory (MMPI/MMPI-2) are an important tool to aid college-
counseling centers in accomplishing their goals of aiding student adjustment. Like
its previous versions, the Minnesota Multiphasic Personality Inventory-2-
Restructured Form (MMPI-2-RF; Tellegen & Ben-Porath, 2008) is fast gaining
popularity as a personality measure for assessing and diagnosing personality
attributes and psychological disturbances in college students. However, there
appears to be very limited research on the Asian Indian population with the MMPI
and its later versions. The purpose of this study was to expand descriptors
associated with MMPI-2-RF scores specifically for the Asian Indian population,
and examine similarities and differences in MMPI-2-RF scores of Asian Indian
and Caucasian American college students in order to enhance the future use of this
test with Asian Indians in the United States.
Correlates of the MMPI-2-RF for Asian Indians
3
Review of Literature
Personality: Definitions and Descriptions
Personality can be defined as “those characteristics of the person that
account for consistent patterns of feeling, thinking, and behaving” (Pervin,
Cervone, & John, 2005, p. 6). Therefore, personality is believed to be enduring
and relatively stable across situations, contexts and interactions. Some theorists
emphasize the integrative or organizational structure of personality, which depicts
personality as a pattern across various individual behaviors resulting from the
organization (Hall & Lindzey, 1957). This conceptualization suggests that
personality gives order to individuals’ interactions with themselves and their
environments. Another way to define personality is by looking at its function in
mediating an individual’s adjustment in his or her context, and thus consists of
overt and covert efforts at adjustment carried out by the individual (Hall &
Lindzey, 1957). Martinez and Oishi (2006) identified affect, thinking, behaving,
self-concept, motivation, and values as some core components of personality.
Of the many theories of personality conceptualized by various theorists,
trait-based approaches gained significant importance historically and continue to
be popular (Mischel, 1981). Trait refers to a distinguishing characteristic of a
person that is characterized by consistency in the way an individual will display it
across situations. According to personality researchers, the most fundamental
viewpoint of trait theories is that people possess dispositions, which determines the
strength of an individual’s tendency to behave in a particular manner. Therefore, a
related assumption is that there is a direct agreement between an individual’s trait
and performance of his or her trait-related behaviors (Pervin et al., 2005).
Correlates of the MMPI-2-RF for Asian Indians
4
Spielberg (1985) described these behaviors as states and defined them as observed
expressions of personality. He gave an analogy of energy to describe the
relationship between the two and stated, “trait anxiety would be equivalent to
potential energy, and state to kinetic energy.” (Spielberg, 1970, p. 3).
Traits are identified as the most enduring aspects of personality, and a vast
amount of literature establishes stability in personality through longitudinal
research on traits. The stability of personality is evaluated in relation to
temperament, as predictive links have been established between childhood
temperament type and adult personality. For example, a longitudinal research study
found that early temperamental tendencies of 1000 individuals tested as babies
were significantly correlated with their personality characteristics as adults when
tested after 23 years, indicating foundations of personality in early years and
stability and continuity of traits over time (Caspi, Harrington, Milne, Theodore &
Moffitt, 2003).
In further attempts to determine the stability of personality, findings from
research studies other than on temperament focused on trait-score correlations
using rank-order correlation, and meta analytic data on test-retest correlations
(McCrae & Costa, 1999). The Five Factor Model (FFM) of personality (McCrae &
Costa, 1999) explains personality in terms of the five core traits of openness to
experience, conscientiousness, extraversion, agreeableness and neuroticism.
Empirical findings based on this model have shown stability in personality traits
across time and suggest that most changes in personality are limited to early
adulthood. This is supported by rank-order correlations that measure consistency
and stability in personality traits by assessing homogeny in a group of scores

Correlates of the MMPI-2-RF for Asian Indians
5
obtained on a particular trait across multiple measurements in time (Roberts &
DelVecchio, 2000). Research in this area has indicated that rank-order correlations
in adolescence range from .30 to .60, which is considered significant as
adolescence is deemed a period of intense life changes (Roberts, Caspi & Moffitt,
2001). Findings have also indicated modest changes during early adulthood, but it
is found that the probability of these changes declines beyond 30 years of age as
rank-order correlations have revealed a range of .60 to .80 over a period of
approximately 20 years (McCrae, Herbst, Costa, & Siegler, 2000).
Additional literature that supports the idea of stability of personality traits
uses meta-analytic data of test-retest correlations. Research has found that stability
in traits increases from .31 in childhood to .74 between 50 and 70 years of age
(Roberts & DelVecchio, 2000). Moderate correlations are found below the age of
50, indicating unlikelihood of dramatic changes in personality over time.
Zuckerman (1995) provided a biological explanation for stability of traits,
proposing that neural connections in the brain manifest in particular traits and a
substantial amount of redirection or change in patterns of neuronal firing will be
required to bring drastic changes in traits. Therefore, his findings are
commensurate with the notion that personality traits are increasingly stable over
time.
While rank-order correlation and meta-analytic methods argue in favor of
stability, studies on intra-individual personality trait changes challenge this
assumption and indicate significant within-person changes in traits. For example,
research by Scollon and Diener (2006) revealed that there were notable within-
person changes in extraversion and neuroticism when tested over a span of eight
Correlates of the MMPI-2-RF for Asian Indians
6
years beyond the age of 30 years. To conclude the debate, McAdams and Pals
(2006) proposed that among factors such as maturation and characteristic
adaptations that result in modest changes in traits, personality is also influenced by
cultural and social contexts. The following section provides an account of interplay
between those cultural factors and personality development and testing.
Culture and Personality
Culture is defined as shared meaning systems comprised of values and
norms that guide people of a particular group. These values and norms are said to
be maintained between generations and are transmitted through language,
practices, social institutions and shared narratives (Senior & Bhopal, 1994; Markus
& Kitayama, 1998). Over several decades of research, social scientists have
indicated that cultural influences have significant deterministic psychological
effects on the developing personalities of individuals. However, more recent
theorists propose that culture only provides a probabilistic influence on an
individual’s behavior (Stryker & Burke, 2000).
The study of culture and personality emerged in the beginning of the 20th
century (Benedict, 1934), and ever since there have been challenges in determining
the relationship between the two and achieving a balance between universalities in
personality types and cultural uniqueness in personality (Cheung, Vijver, & Leong,
2011). Historically, two major camps in research of cultural influences on
personality emerged: cross-cultural and cultural psychology (Kwan & Hermann,
2015). Cross-cultural psychologists argue that culture is an independent factor that
shapes personality and postulate that all individuals have the same psychological
make-up indicating universality of personality characteristics (Church, 2000). For
Correlates of the MMPI-2-RF for Asian Indians
7
example, research on social axioms revealed that there is a universal central
processing mechanism for all people across all cultural contexts (Bond, 2000).
Cultural psychology, on the other hand, recognized personality as a result of an
individual’s interactions with his or her culture (Church, 2000). Therefore, cultural
researchers assume that personality components are constructed socially and traits
differ across cultural contexts. For example, in a study on open-ended descriptions
of people provided by American and Hindu participants, it was found that Hindu
participants tended to provide descriptions involving collectivistic concepts that
were derived from their cultural context, whereas the American participants’
descriptions were free of such contextual connotations, indicating an autonomous
person concept (Shweder & Bourne, 1984). Therefore, three prominent goals of
studying culture and personality have been identified (Berry, Poortinga, Segall, &
Desan, 2002). The first goal, called “transport and test” (Berry et al., 2002, p.3),
aims to study Western concepts and constructs in other cultures to assess their
generalizability and validity across cultures; therefore, the methods used to study
these dimensions are also Western. The five-factor theory is an apt example of this
goal (McCrae & Terrancciano, 2005). The second goal pertains to exploring other
cultures in order to find culture-specific phenomena. Using a lexical approach, the
researchers identify local phenomena and use factor analysis to derive culturally
meaningful personality dimensions. These are then compared against Western
dimensions to identify cross-cultural similarities and differences (Ashton & Lee,
2005). The third goal of cross-cultural psychology is to combine results obtained
from pursuit of the first two goals to derive relatively universal constructs in order
to universalize concepts of personality. Consistent with the aforementioned goals,
Correlates of the MMPI-2-RF for Asian Indians
8
two prominent methods of studying the relationship between personality and
culture are the etic and emic approaches. Etic approaches are closely related to the
first goal and investigate the universal applicability of Western approaches with an
aim of establish generalizability and cross-cultural validity of concepts and
methods (Cheung et al., 2011). The FFM is an apt example of this approach
(McCrae & Terrancciano, 2005). The etic approach aims to establish equivalence,
which refers to the strength of comparability of personality constructs and
phenomena when tested across multiple cultural groups. The emic approach, which
corresponds to the second goal of study of culture and personality, uses methods to
investigate culture-specific or indigenous phenomena. Researchers who use this
approach typically begin by generating a list of adjectives to describe personality
using a lexical approach, and then employ factor analysis to identify traits or
constructs important to that culture. These constructs are then compared against
Western dimensions to investigate similarities and differences (Ashton & Lee,
2005). Using the emic approach, research has revealed personality and
psychopathology patterns that influence health seeking behaviors among Asian
Indian people living in the United States. Research suggests that Asian Indians find
it difficult to express their difficulties openly even though anxiety and depression
are significantly prevalent among this population, indicating a need for self-
concealment. (Khanna, McDowell, Perumbilly, & Titus, 2009; Masuda & Boone,
2011). This is also explained from a larger cultural perspective of Asians. Research
on culturally driven syndromes suggests that Asians are prone to exhibit
psychological difficulties through somatization tendencies (American Psychiatric
Association, 2000). It is also found that Asian cultural groups tend to emphasize
Correlates of the MMPI-2-RF for Asian Indians
9
restraining of emotions and believe in suppressing emotions of anger, which results
in symptoms of insomnia, panic, indigestion and generalized aches and pains (Min
& Lee, 1989). In the domain of relationships, it is found that Asians have a
collectivistic orientation highlighting the importance of social context on their
attitudes and behaviors (Khanna et al., 2009). Researchers have also found the
tendency towards passivity in relationships, indicating that those from an Asian
origin define themselves in the context of their relationships with those around
them (Markus & Kitayama, 1998).
Recent theorists are of the view that many personality dimensions are
universal, but manifestations of those dimensions differ across cultures. Therefore,
a combined etic-emic approach to personality assessment has been proposed. This
new approach uses integrated methods to balance the focus on culture-specific and
universal components of personality. This view is supported by the work on the
FFM, which claims that while personality traits of neuroticism, extraversion,
openness, agreeableness, and conscientiousness are universal, it is possible to
investigate differences in meanings, perceptions and demonstration of these traits
based on the specific culture studied (McCrae, 2000).
Personality Assessment
This section describes the historical foundations of personality assessment,
which led to current assessment methods and applications. Attempts to develop
structured methods of personality assessment began in the 19th century, which
subsequently resulted in two historical trends. One such trend leaned towards
‘phrenology,’ which entailed measuring peoples’ characteristics by assessing their
head size and shape. The other movement, led by Francis Galton, focused on
Correlates of the MMPI-2-RF for Asian Indians
10
devising scientific observation and methods, which influenced personality test
developments of the later half of the 19th century (Butcher, 2010). Clinical
psychology began with psychological assessment, and during the two world wars,
clinical psychology was typified and recognized primarily by psychological
assessment. In the United States, introduction and use of personality assessment
was catalyzed by the need to develop instruments to screen for psychological and
psychiatric difficulties among those drafted into the U.S Army. Two primary types
of personality assessments methods emerged: self-report inventories and
performance-based techniques (Benjamin, 2005).
Self-report inventories. These are the most common and direct methods to
investigate an individual’s problems and attributes (Butcher, Bubany, & Mason,
2013). Self report methods typically consist of self-descriptive statements that are
rated either by answering “yes” or “no”, or follow a Likert-type rating scale. The
first formal self-report measure to assess personality characteristics, developed and
published by Heymans and Wiersma (1906), assessed personal qualities using a
90-item structured rating scale. Subsequent years saw the development of self-
report measures using diverse test construction approaches. One such class of
personality questionnaires consisted of theoretically influenced, one-dimensional
personality inventories. This approach to personality assessment methods is based
on face validity of test items so as to ensure utility and relevance of the test. One
such test, constructed by Robert Woodworth, was the Personal Data Sheet, which
aimed to screen for maladjustment in draftees during World War 1 (Woodworth,
1920). Another group of tests can be classified as theoretically derived
multidimensional personality inventories that widened the scope of personality
Correlates of the MMPI-2-RF for Asian Indians
11
assessment by including more than one personality dimension in a single test.
Bernreuter (1931) and Humm and Wadsworth (1934) used this approach to
construct their measures. Another very different approach relied on empirical
approach to construct test items. The earlier tests were influenced by developers’
judgments in constructing the tests and were not empirically derived, thus raising
questions about the validity of the test scores. The empirical methods postulated
that items must be tested before being included in the test. The Minnesota
Multiphasic Personality Inventory (MMPI), developed by Hathaway and
McKinley (1943), was the first test based on strict empirical validation.
Factor analysis was another method used by test developers to construct
inventories. This method, pioneered by Cattell in the 1940s (Cattell, 1946), applied
correlational-statistical techniques to derive test items from a pool of items so as to
increase homogeneity in the dimension being measured. In using a modified
version of the factor analytic approach, Jackson (1970) proposed a sequential
system of first selecting theoretically based items, then applying factor analysis to
ensure scale homogeneity and high correlation with the total score. Another
category of self-report measures is content-based, which is a combination of
theoretical and correlational methods described earlier. Items are first grouped
based on similarity in content and statistical analysis is then conducted for item
analysis to ensure that the items are close to the construct being measured (Butcher
et al., 2013).
Performance-based personality measures. In contrast to self-report
inventories, performance-based measures, also referred to as free-response
methods, sample people’s performance on various tasks. As an example, people
Correlates of the MMPI-2-RF for Asian Indians
12
may be required to develop narratives or verbalize their perceptions to ambiguous
stimuli as in the Rorschach Inkblot Test (Weiner, 2013). Personality-based
measures, therefore, require the test taker to perform a task that is intended to
uncover or elicit insight into the dynamics of their personality.
Performance-based measures contribute to the domain of personality in
three different ways. First, they give insight into attributes or characteristics of
which the individual is not fully aware or willing to disclose. According to Weiner
(2013), although performance-based interpretations are less definitive and more
open to inference than self-report personality measures, they give information
about personality patterns that cannot be assessed directly on self-report
inventories. Second, these measures reduce impression management by the
examinee because they are not face valid. According to Weiner (2013),
performance based measures also provide more opportunity for interaction and
dialogue between the examiner and respondent, which is less available when using
self-report measures. Therefore, they also give an examiner the means to assess for
the respondents’ interpersonal styles and dynamics.
Personality assessments are used for a variety of purposes in educational,
forensic, and occupational settings, but they can be broadly classified into two
categories, namely clinical evaluation and assessment of ‘normal’ personality
characteristics. Clinical treatment settings are the most popular and traditional
areas of personality assessment applications (Weiner & Greene, 2008). Clinical
personality assessments facilitate decision-making for treatment, provide a method
for measuring the client’s progress, and clarify the nature and extent of
psychological problems experienced by the examinee. Clinical personality
Correlates of the MMPI-2-RF for Asian Indians
13
assessment is a useful tool for psychologists as it can provide information about
clients’ personality strengths, weaknesses, coping styles, needs, concerns, attitudes
toward themselves and others, and their abilities to adapt to life’s circumstances
(Weiner & Greene, 2008). The MMPI and its revised 2nd edition, the MMPI-2
(Butcher, Dalhstrom, Graham, Tellegen, & Kaemmer, 1989) is the most
extensively used measure for clinical personality assessment, and the research on it
is ever expanding. The second group of personality measures is constructed to
obtain information about ‘normal’ personality traits that can be useful to describe
characteristics ways of functioning. One such measure is the NEO Personality
Inventory, which is based on the FFM, and organizes personality in terms of five
basic dimensions: Extraversion, Agreeableness, Conscientiousness, Neuroticism,
and Openness to Experience (Costa & McCrae, 1995). The FFM is based upon
factor analytic research on the structure of personality (Costa & McCrae, 1992); it
is a measure of normal personality traits but has also been used in clinical
assessments.
The MMPI, MMPI-2, and MMPI-2-RF
Minnesota Multiphasic Personality Inventory. Hathaway and McKinley
(1943) developed the MMPI with the purpose to construct a personality inventory
that would prove efficient and reliable in assessing personality characteristics and
facilitating diagnosis (Graham, 2012).
To construct the basic MMPI scales, Hathaway and McKinley (1943)
initially collected a large number of items that consisted of personality-related
statements from psychiatric case histories and reports, textbooks and previously
published personality and social measures. The authors used an empirical keying
Correlates of the MMPI-2-RF for Asian Indians
14
approach, where responses of the patients diagnosed with various psychiatric
disorders were compared against those of “normals.” For this purpose, the first step
in the scale development consisted of forming eight diagnostic groups based on
patients diagnosed with hypochondriasis, depression, hysteria, psychopathic
deviate, paranoia, psychasthenia, schizophrenia, and mania (Graham, 2012). The
normal sample consisted of 724 relatives and visitors of medical patients in the
University of Minnesota Hospitals. Items that discriminated between the two
groups were assigned to the relevant scale, named according to the diagnostic
group. Subsequently, the Masculinity-Femininity Scale and Social Introversion
Scale (Drake, 1956) were added to form the 10 MMPI Clinical Scales (Graham,
2012).
To assess the interpretability of a profile and investigate test-taking
attitudes, the authors devised a set of Validity Scales (Graham, 2012). The Cannot
Say (?) is a count of unanswered items on the test. It was deemed that a high
number of unanswered items would threaten the interpretability of the resulting
personality profile. The Lie (L) scale was constructed to assess respondents’
tendency to present themselves in an unrealistically positive light, including denial
of faults and personal shortcomings. The Infrequency (F) scale was designed to
detect over-reporting of psychological distress and disturbance. The Correction (K)
scale consisted of items to detect defensive responding that would result in
underreporting of psychological disturbance. Scale K scores were also used to
develop corrective weights to be added to Clinical Scales most affected by
defensiveness (Graham, 2012).
The 10 Clinical Scales are: Scale 1, Hypochondriasis; Scale 2, Depression;
Correlates of the MMPI-2-RF for Asian Indians
15
Scale 3, Hysteria; Scale 4, Psychopathic Deviate; Scale 5 Masculinity-Femininity
Scale; Scale 6, Paranoia; Scale 7 Psychasthenia; Scale 8, Schizophrenia; Scale 9,
Hypomania; and Scale 0, Social Introversion. MMPI Clinical Scale interpretation
is refined through the use of subscales. Harris and Lingoes (1955) created
subscales in order to identify specific content areas within the heterogeneous
Clinical Scales (Greene, 2012). They grouped items that were similar in content or
seemed to reflect a single trait or attitude from a Clinical Scale (Friedman, Lewak,
Nichols, & Webb, 2001). A set of 28 Harris-Lingoes Subscales were created for
the Clinical Scales 2, 3, 4, 6, 8, and 9.
Additional scale developments included constructing Content Scales
(Wiggins, 1969) to investigate responses in homogeneous, non-overlapping
content areas (Greene, 2012). The items on the Content Scales were deemed face-
valid and were established with sound validity and reliability. The 13 Content
Scales were: Poor Health (HEA), Depression (DEP), Organic Symptoms (ORG),
Family Problems (FAM), Authority Conflict (AUT), Feminine Interests (FEM),
Religious Fundamentalism (REL), Manifest Hostility (HOS), Poor Morale (MOR),
Phobias (PHO), Psychoticism (PSY), Hypomania (HYP), and Social
Maladjustment (SOC) (Friedman et al., 2001).
In addition, numerous supplementary scales were developed by
independent researchers over several decades to enhance research and application
of the MMPI in the clinical domain. Rigorous factor analyses revealed two primary
factors: General Maladjustment and Repression, with the two supplementary scales
of Welsh’s Anxiety (A) and Welsh’s Repression (R), found to be the best indicators
of the two factors (Friedman et al., 2001).
Correlates of the MMPI-2-RF for Asian Indians
16
The Minnesota Multiphasic Personality Inventory-2 (MMPI-2). The
MMPI-2, developed by Butcher, Dahlstrom, Graham, Tellegen, and Kaemmer
(1989) is a revised and re-standardized version of the original MMPI (Greene,
2012). A major goal of the revision was to improve the representativeness of the
standardization sample. Therefore, the new normative sample included respondents
from ethnic minorities in a nationally representative sample. Item content of the
MMPI was revised to eliminate archaic and sexist terminology and improve
grammar. Therefore, 141 of the original 550 items on the MMPI were reworded or
revised to improve upon the quality of the item content (Greene, 2012). The final
version of MMPI-2 was published with 567 items, which comprises the same 10
core clinical scales that constituted the MMPI.
The MMPI-2 retained all the Validity Scales from the MMPI with the
addition of two new Validity Scales called Variable Response Inconsistency
(VRIN) and True Response Inconsistency (TRIN). These two scales measure the
respondent’s response consistency and response bias (acquiescence and nay
saying), respectively, in answering items on the test. Items in both the scales are
arranged in pairs, with VRIN containing 67 pairs of similar or opposite content
items, whereas TRIN contains 20 pairs of items that are opposite in content. The
MMPI-2 measures over-reporting through the Infrequency (F) Scale, and two new
scales called the Back Infrequency (FB) Scale and Infrequency-Psychopathology
(Fp) were added (Butcher et al., 1989). The Fb Scale measures the test-taker’s
responses to items in the second half of the test and is compared with the F scale to
determine consistency in responding to the test items. Fp was designed to detect if
a high F scale core reflected exaggeration of problems. A later addition consisted
Correlates of the MMPI-2-RF for Asian Indians
17
of the Fake Bad Scale (FBS), later renamed Symptom Validity Scale designed to
detect malingering in personal injury litigation scenarios (Lees-Haley, English, &
Glen, 1991).
The three scales for detecting underreporting are Correction (K), Lie (L),
and Superlative Self-Presentation (S). All the items of the L and K scales of the
original MMPI were preserved in the newer version, and the S Scale was added by
Butcher and Han (1995) to assess respondents’ proclivity towards presenting
themselves as highly virtuous. Overall, the underreporting scales investigate a
test-taker’s tendency towards impression management and self-deception (Greene,
2012).
A new set of Content Scales for the MMPI-2 were developed by Butcher,
Graham, Williams, and Ben-Porath (1990) to assess the content dimension of the
revised measure. The 15 Content Scales developed using the MMPI-2 item pool
are: Anxiety, Fears, Obsessions, Depression, Health Concerns, Bizarre Mentation,
Anger, Cynicism, Antisocial Practices, Type A, Low Self-Esteem, Social
Discomfort, Family Problems, Work Interference, and Negative Treatment
Indicators. Content Component Scales were developed for most Content Scales to
improve the interpretability of Content Scales with heterogeneous item content
(Greene, 2012). The MMPI-2 also contains a standard set of Supplementary
Scales, most of which were retained from the original MMPI (Graham, 2012).
Currently, 15 MMPI-2 Supplementary Scales that measure broad personality
characteristics are: Welsh’s Anxiety (A), Welsh’s Repression (R), Ego Strength
(Es), Dominance (Do), and Social Responsibility (Re); Generalized Emotional
Distress Scales of College Maladjustment (Mt), Post-Traumatic Stress Disorder-
Correlates of the MMPI-2-RF for Asian Indians
18
Keane (PK), and Marital Distress (MDS); Behavioral Dyscontrol Scales of
Hostility (Ho), Overcontrolled Hostility (O-H), MacAndrew- Revised (MAC-R),
Addiction Admission (AAS), and Addiction Potential (APS); and Gender Role-
Masculine (GM), and Gender Role-Feminine (GF) (Graham, 2012). The
Supplementary Scales serve to expand the MMPI-2 interpretation.
In addition, Harkness, McNulty, and Ben-Porath (1995) constructed a set of
PSY-5 Scales to assess personality attributes that could account for both normal
functioning and clinical disturbances. Closely resembling the FFM, these scales
are: Aggressiveness (AGGR), Psychoticism (PSYC), Disconstraint (DISC),
Negative Emotionality/ Neuroticism (NEGE), and Introversion/ Low Positive
Emotionality (INTR) (Graham, 2012).
A more recent development was designed to refine the interpretation of the
Clinical Scales by overcoming their psychometric limitations and increasing their
distinctiveness. Tellegen, Ben-Porath, McNulty, Arbisi, Graham, and Kaemmer
(2003) developed the Restructured Clinical Scales (RC), where each Clinical Scale
except Scales 5 and 0 has an RC Scale counterpart. RC Scales for Scales 5 and 0
were not developed because they do not measure core components of
psychopathology. The RC scales thus developed are: Demoralization (RCd),
Somatic Complaints (RC1), Low Positive Emotions (RC2), Cynicism (RC3),
Antisocial Behavior (RC4), Ideas of Persecution (RC6), Dysfunctional Negative
Emotions (RC7), Aberrant Experiences (RC8), and Hypomanic Activation (RC9).
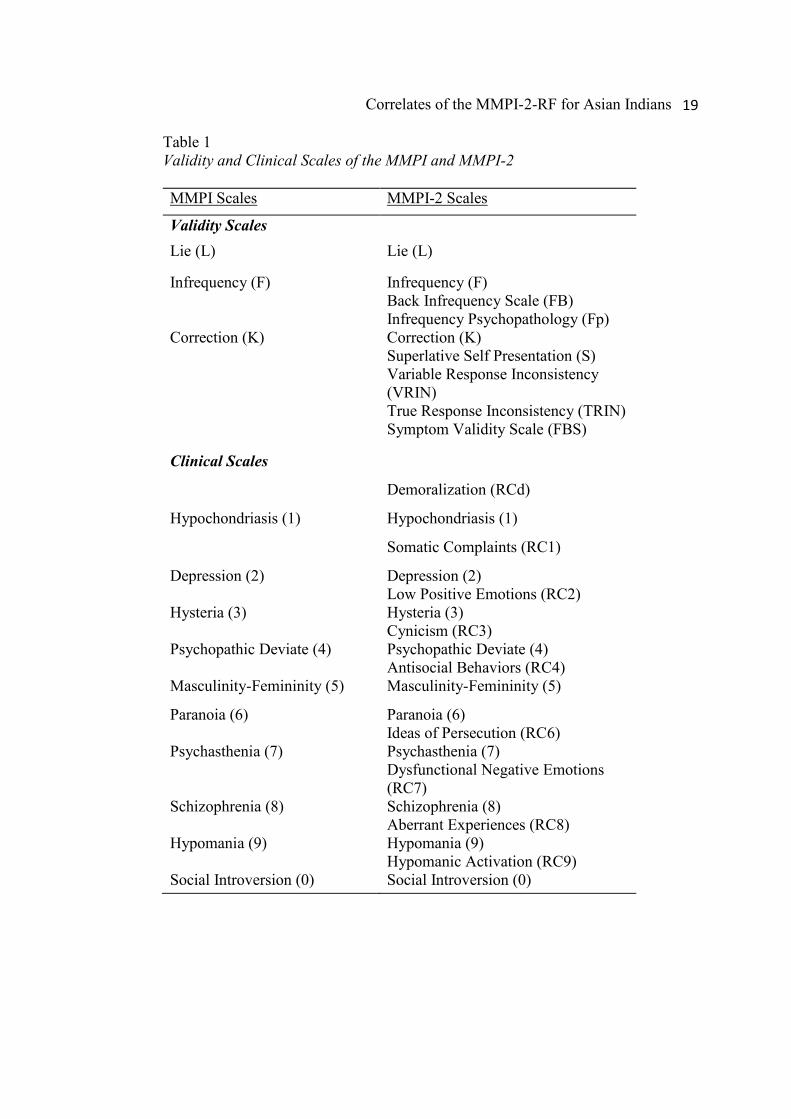
Table 1 summarizes the Validity and Clinical Scales of the MMPI and MMPI-2.
Correlates of the MMPI-2-RF for Asian Indians
19
Table 1 Validity and Clinical Scales of the MMPI and MMPI-2 MMPI Scales MMPI-2 Scales
Validity Scales Lie (L) Lie (L)
Infrequency (F) Infrequency (F) Back Infrequency Scale (FB) Infrequency Psychopathology (Fp)
Correction (K) Correction (K) Superlative Self Presentation (S) Variable Response Inconsistency (VRIN) True Response Inconsistency (TRIN)
Symptom Validity Scale (FBS)
Clinical Scales
Demoralization (RCd)
Hypochondriasis (1) Hypochondriasis (1)
Somatic Complaints (RC1)
Depression (2) Depression (2) Low Positive Emotions (RC2)
Hysteria (3) Hysteria (3) Cynicism (RC3)
Psychopathic Deviate (4) Psychopathic Deviate (4) Antisocial Behaviors (RC4)
Masculinity-Femininity (5) Masculinity-Femininity (5)
Paranoia (6) Paranoia (6) Ideas of Persecution (RC6)
Psychasthenia (7) Psychasthenia (7) Dysfunctional Negative Emotions (RC7)
Schizophrenia (8) Schizophrenia (8) Aberrant Experiences (RC8)
Hypomania (9) Hypomania (9) Hypomanic Activation (RC9)
Social Introversion (0) Social Introversion (0)

Correlates of the MMPI-2-RF for Asian Indians
20
The Minnesota Multiphasic Personality Inventory-2-RF (MMPI-2-RF).
The MMPI-2-RF, developed by Ben-Porath and Tellegen in 2008, was constructed
with two primary purposes: (a) to increase homogeneity within the clinical scales
so as to produce exhaustive and clinically relevant measures, and (b) to highlight
and identity the “distinctive substantive core” of each clinical scale by removing a
shared general distress component. To this end, the RC scales are at the core of the
measure. However, the restructuring also generated a hierarchical structure
whereby the RC and other substantive scales are nested under the Higher-Order
Scales (Tellegen & Ben-Porath, 2008). The test has 338 items which were derived
from MMPI-2 item pool. There are nine validity scales and forty-two scales that
are categorized as three Higher Order Scales, nine RC Scales, five Somatic Scales,
nine Internalizing Scales, four Externalizing Scales, five Interpersonal Scales, two
Interest Scales, and five PSY-5-r Scales. The seven revised Validity Scales are
VRIN-r, TRIN-r, F-r, Fp-r, FBS-r, L-r, K-r. A new scale called Infrequent Somatic
Responses (Fs) was added to measure over-reporting of somatic symptoms. The
Response Bias Scale (RBS; Gervais, Ben-Porath, Wygant, & Green, 2007) was
developed to bolster detection of symptom over-reporting in forensic,
neuropsychological and disability evaluations. The Somatic Scales, Internalizing
Scales, Externalizing Scales and Interpersonal Scales form the Specific Problems
Scales. These scales are non-overlapping in their items, which is also described as
a positive attribute of the MMPI-2 RF. The PSY-5-r scales are modified versions of
the MMPI-2 PSY-5 Scales.
A significant change in the MMPI-2-RF is the use of non-gendered norms,
as the authors reported minimal differences between the scores on men and women

Correlates of the MMPI-2-RF for Asian Indians
21
on the RF scales (Tellegen & Ben-Porath, 2008). The MMPI-2-RF was
standardized on a normative sample that consisted of 1,138 men (mean age= 41.7,
SD= 15.3) and 1,138 women (mean age= 40.4, SD= 15.3). The sample was derived
from the MMPI-2 normative sample, whose responses were converted into MMPI-
2-RF item responses. The Technical Manual of the MMPI-2-RF describes the
psychometric properties of the test as sound and stable, thus declaring the measure
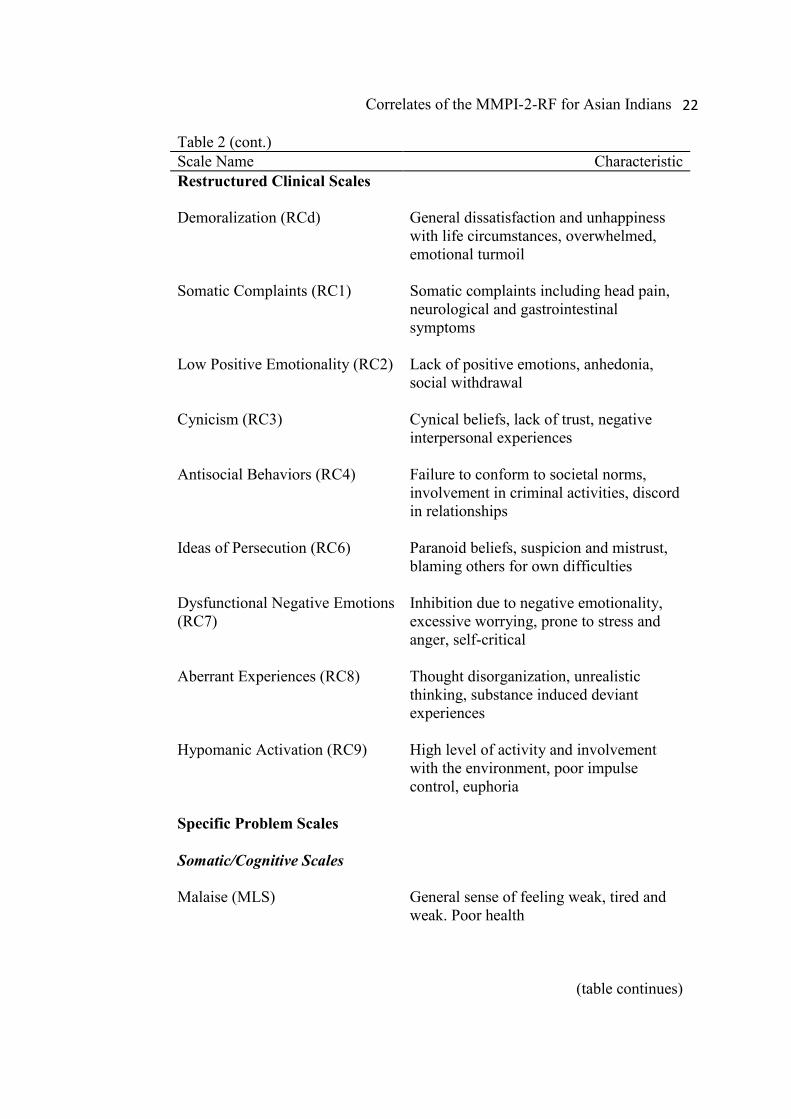
as valid and reliable. The following table summarizes the MMPI-2-RF scales and
the attributes they measure.
Table 2 MMPI-2-RF Scales and Measured Characteristics
Scale Name Characteristic Validity Scales
Cannot Say (?)
Unanswered items
Variable Response Inconsistency (VRIN-r)
Random response pattern
True Response Inconsistency (TRIN-r)
Inconsistencies related to acquiescent or nay-saying response bias
Infrequent Responses (F-r) Infrequently endorsed symptoms suggesting high disturbance
Infrequent Psychopathology Responses (Fp-r)
Over reporting of problems
Infrequent Somatic Responses (Fs)
Somatic symptoms infrequently endorsed by a medical sample
Uncommon Virtues (L-r) Unrealistic moral virtues and characteristics
Adjustment Validity (K-r) Defensiveness indicated by under-reported maladjustment
(table continues)
Correlates of the MMPI-2-RF for Asian Indians
22
Table 2 (cont.) Scale Name Characteristic Restructured Clinical Scales
Demoralization (RCd) General dissatisfaction and unhappiness with life circumstances, overwhelmed, emotional turmoil
Somatic Complaints (RC1) Somatic complaints including head pain, neurological and gastrointestinal symptoms
Low Positive Emotionality (RC2) Lack of positive emotions, anhedonia, social withdrawal
Cynicism (RC3)
Cynical beliefs, lack of trust, negative interpersonal experiences
Antisocial Behaviors (RC4) Failure to conform to societal norms, involvement in criminal activities, discord in relationships
Ideas of Persecution (RC6) Paranoid beliefs, suspicion and mistrust, blaming others for own difficulties
Dysfunctional Negative Emotions (RC7)
Inhibition due to negative emotionality, excessive worrying, prone to stress and anger, self-critical
Aberrant Experiences (RC8) Thought disorganization, unrealistic thinking, substance induced deviant experiences
Hypomanic Activation (RC9) High level of activity and involvement with the environment, poor impulse control, euphoria
Specific Problem Scales
Somatic/Cognitive Scales
Malaise (MLS)
General sense of feeling weak, tired and weak. Poor health
(table continues)
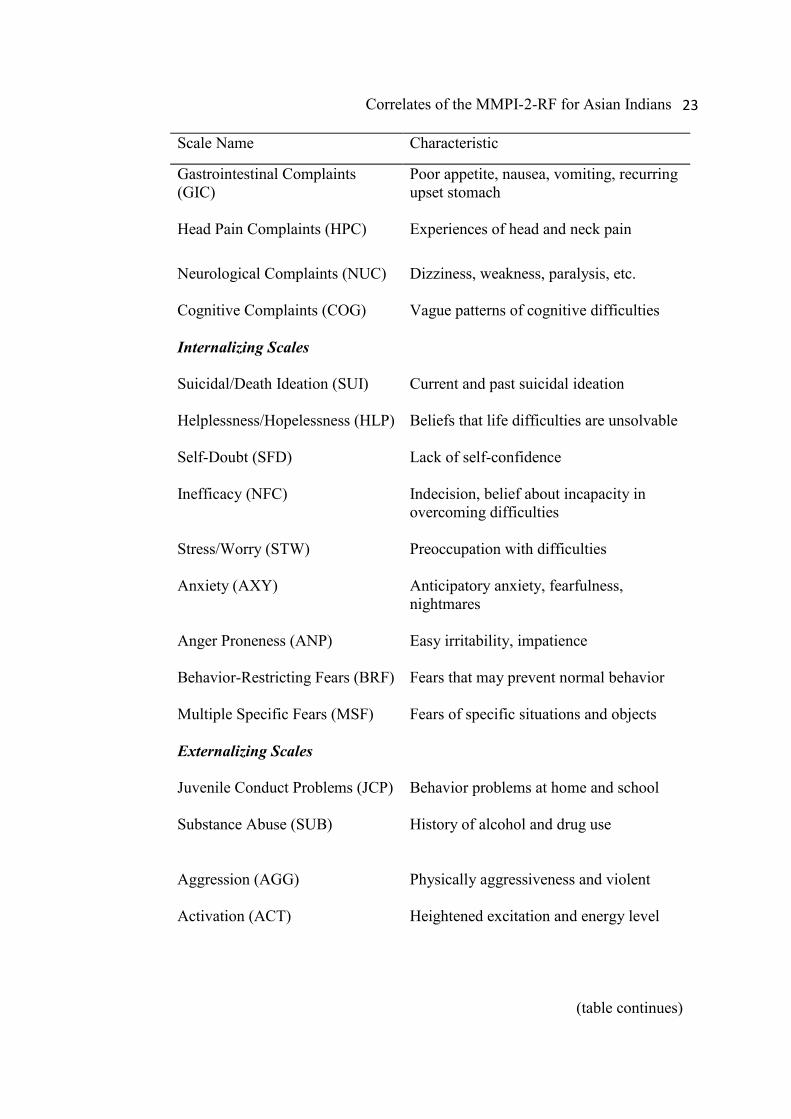
Correlates of the MMPI-2-RF for Asian Indians
23
Scale Name Characteristic
Gastrointestinal Complaints (GIC)
Poor appetite, nausea, vomiting, recurring upset stomach
Head Pain Complaints (HPC)
Experiences of head and neck pain
Neurological Complaints (NUC)
Dizziness, weakness, paralysis, etc.
Cognitive Complaints (COG)
Vague patterns of cognitive difficulties
Internalizing Scales
Suicidal/Death Ideation (SUI)
Current and past suicidal ideation
Helplessness/Hopelessness (HLP)
Beliefs that life difficulties are unsolvable
Self-Doubt (SFD)
Lack of self-confidence
Inefficacy (NFC)
Indecision, belief about incapacity in overcoming difficulties
Stress/Worry (STW)
Preoccupation with difficulties
Anxiety (AXY)
Anticipatory anxiety, fearfulness, nightmares
Anger Proneness (ANP)
Easy irritability, impatience
Behavior-Restricting Fears (BRF) Fears that may prevent normal behavior
Multiple Specific Fears (MSF) Fears of specific situations and objects
Externalizing Scales
Juvenile Conduct Problems (JCP)
Behavior problems at home and school
Substance Abuse (SUB)
History of alcohol and drug use
Aggression (AGG) Physically aggressiveness and violent
Activation (ACT) Heightened excitation and energy level
(table continues)
Correlates of the MMPI-2-RF for Asian Indians
24
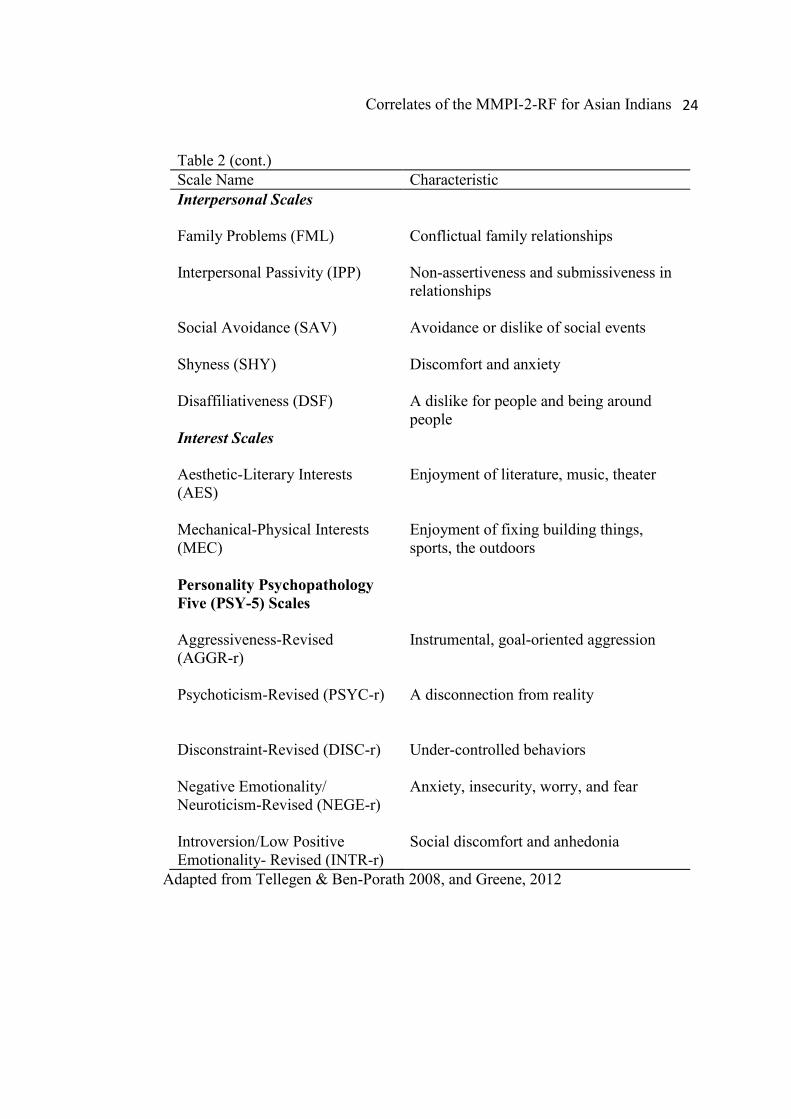
Table 2 (cont.) Scale Name Characteristic Interpersonal Scales
Family Problems (FML)
Conflictual family relationships
Interpersonal Passivity (IPP)
Non-assertiveness and submissiveness in relationships
Social Avoidance (SAV)
Avoidance or dislike of social events
Shyness (SHY) Discomfort and anxiety
Disaffiliativeness (DSF)
A dislike for people and being around people
Interest Scales
Aesthetic-Literary Interests (AES)
Enjoyment of literature, music, theater
Mechanical-Physical Interests (MEC)
Enjoyment of fixing building things, sports, the outdoors
Personality Psychopathology Five (PSY-5) Scales
Aggressiveness-Revised (AGGR-r)
Instrumental, goal-oriented aggression
Psychoticism-Revised (PSYC-r)
A disconnection from reality
Disconstraint-Revised (DISC-r) Under-controlled behaviors
Negative Emotionality/ Neuroticism-Revised (NEGE-r)
Anxiety, insecurity, worry, and fear
Introversion/Low Positive Emotionality- Revised (INTR-r)
Social discomfort and anhedonia
Adapted from Tellegen & Ben-Porath 2008, and Greene, 2012
Correlates of the MMPI-2-RF for Asian Indians
25
MMPI, MMPI-2, MMPI-2-RF with Cultural Groups
International Adaptations of the MMPI/MMPI-2. With an increase in
demand for mental health services in countries outside the United States, there has
been a growing need for use of reliable and valid personality measures (Butcher,
1996). To assess psychopathology across diverse cultural and ethnic groups, cross-
cultural test adaptations of the MMPI and MMPI-2 provide practitioners
worldwide a tool to assess personality and psychological disturbances. The MMPI
has been adapted in many languages because of its demonstrated international
applicability (Butcher, Cheung, & Lim, 2003). Researchers and test developers
have deemed it important to assure theoretical and construct equivalence of
psychological tests being translated and adapted into other languages (Butcher et
al., 2003). The MMPI/MMPI-2 have been translated into many Asian languages
including Chinese, Japanese, Korean and Thai, Spanish for South America, Central
America and Spain, and other European languages like Bulgarian, Croatian,
Danish, French, German, Hungarian, Italian, Norwegian, Polish, Romanian, and
Swedish.
Use and adaptations in Asia. Cheung (1985) translated the MMPI in
Chinese and compared the patterns of items of endorsements using participants
from Hong Kong and the U.S. (Butcher et al., 2003). The research investigated
test-retest reliability and translation equivalence using samples from Mainland
China and Hong Kong. Chinese norms were established using a sample of 1,553
men and 1,516 women representing seven major regions of China. An analysis of
patterns in profiles suggested that respondent scores tended to be elevated on
Correlates of the MMPI-2-RF for Asian Indians
26
Scales F, 2, and 8 when compared to U.S. norms. However, the profiles showed
lower scores when using Chinese norms for the same participants, therefore
resulting in using 60 as a clinical T-score cut off (Cheung, 1995). The resulting
recommendation was that both the Chinese and U.S norms can be used with the
Chinese population (Cheung, 1995). Cheung, Song and Zhang (1996) also
developed the Chinese version of the MMPI-2. The Chinese MMPI is used
extensively in clinical settings in China and Hong Kong.
After a number of MMPI translations in Japanese in the 1950s, a
collaborative effort was undertaken to form a single version (Butcher et al., 2003).
With the publication of the MMPI-2 in 1989, the Japanese test developers
published an experimental Japanese version of the MMPI-2 that contained 704
items, which included 550 original MMPI items translated into Japanese and 154
new provisional items. The researchers attended to linguistic and conceptual
equivalence in constructing the Japanese version (Butcher et al., 2003).
The Korean version of the MMPI-2 was developed by Han (1996), who
later conducted a research study to assess the usefulness of the Korean validity
scales to determine invalidity of the profiles. For this purpose, respondents
(N=162) completed the test in two settings, where first they completed the test
using original instructions and they were then divided in three groups to respond to
the items to (a) fake bad, (b) deny problems, and (c) claim significant virtue. The
original MMPI-2 was also administered to 50 Korean psychiatric patients using
standard instructions. The analysis of the results revealed that the Korean version
of the MMPI-2 was successful in detecting faking bad through scales F, Fb and the
F-K Index (Han, 2001). In another study, Han (1996) examined the utility of the
Correlates of the MMPI-2-RF for Asian Indians
27
Korean version of the MMPI-2 in clinical assessment. The MMPI-2 profiles of 167
college students were compared to 120 inpatients and cross-cultural comparisons
between the Asian subgroup samples and U.S. samples were also made. The Asian
subgroup college students showed significantly elevated mean scores on the
MMPI-2 scales when compared to the U.S. normative sample (Cheung, Song, &
Zhang, 1996).
Overall, the utilization of the MMPI-2 in Asian countries has increased;
however, there are a few limitations to its use among the Asian population. Some
existing versions of the MMPI-2 do not have separate norms and need to rely upon
the U.S. norms as a standard of comparison (Butcher, Cheung, & Lim, 2003).
Use of the MMPI, MMPI-2 and MMPI-2 RF with Ethnic Groups
The MMPI has been widely utilized with various ethnic groups. According
to Hall, Bansal and Lopez (1999), the MMPI and MMPI-2 have been used to study
ethnic and cultural differences globally. They conducted a meta-analysis of 25
research studies that aimed at assessing ethnic differences in the performances of
the Latin American, European American, and African American samples over a
31-year span. Male and female participants’ data were analyzed separately.
When African American men’s scores were compared with European
American men’s scores, the researchers found that African Americans scored
higher than European Americans on scales L, F, K, 1, 7, 8, and 9. Further, they
found that Europeans Americans scored higher on scales 2, 3, 4, 5, and 0. These 12
individual scale differences were of medium effect size (d= .60; Cohen, 1988).
Among the female samples, there were medium effect sizes for 7 of 156 individual
scale differences and there were no large effect sizes. Aggregate effect sizes
Correlates of the MMPI-2-RF for Asian Indians
28
indicated that African American women scored higher on Scales L, F, 1, 2, 4, 5, 6,
7, and 8 and lower on Scales K, 2, 3, and 9 than European American women (Hall
et al., 1999).
For Latino Americans, most of whom were Mexican Americans, there were
higher scores on the three Validity scales namely L, F and K, and lower scores on
all Clinical scales when compared with the scores obtained by European
Americans. However, the effect sizes were small (Hall et al., 1999). The study
concluded that the MMPI and MMPI-2 differences among Europeans, African
Americans and Latino Americans were minimal, and that the two tests do not
portray African Americans and Latino Americans, unfairly, as pathological.
Hispanic, Mexican and Mexican American studies. Whitworth (1988)
compared the MMPI performance of Anglo-American (N=150), and Mexican
American (N=300) people. The Anglo American sample received the English
version of the MMPI. The Mexican Americans were divided into two groups and
were either given the test in English or in Spanish. Those who were administered
the test in Spanish obtained higher score on the 10 Clinical scales than both groups
who took it in English. A multivariate analysis revealed significant main effects for
ethnicity and language on Scales L, F, Hs, D, Pd, Mf, Pa and Sc. The researchers
gave an explanation of acculturation to explain the differences between the two
Mexican American groups and concluded that language preference is a major
component of acculturation. Furthermore, the Mexican American group tested in
English only scored higher than the Anglo American group on Scale L, suggesting
the role of some non-language related factors that were, however, not as
pronounced as language. (Whitworth, 1988).

Correlates of the MMPI-2-RF for Asian Indians
29
To draw a comparison between American and Mexican norms of the
MMPI-2, Lucio, Ampudia, Duran, Leon, and Butcher (2001) administered the
Mexican –Spanish version of the MMPI-2 to Mexican (N=860) adults from
Mexico and the English version of the test to North American (N=1138)
respondents. Semantic and cultural issues were considered when using the
Mexican-Spanish version. T-tests revealed that the Mexican sample scored
significantly higher on Scales L and Hs than the North American sample, while the
North Americans scored significantly higher on Scale Mf. The researchers
attributed the differences in the scores of the three scales to differences in attitudes
towards the inventory, that is, in defensiveness in responding to the test items,
which results in non-clinical scores on all the scales. They attributed the higher
defensiveness of the Mexican sample to the role of culture in moral issues (Lucio
et al., 2001). Additionally, the investigators concluded that the difference between
the two samples on gender scales was determined by the cultural differences in
perception of masculinity and femininity.
In assessing the role of personality assessment in personnel selection,
Zapata, Kreuch, Landers, Hoyt, and Butcher (2001) investigated the comparability
of the MMPI-2 in assessing Spanish speaking and English speaking employees.
The researchers used a sample of 322 Puerto Rican power plant repairers who were
administered the test in Spanish and 327 English speaking employees from the
U.S. mainland who took the inventory in English. The results indicated that both
the groups scored similarly on the test. As opposed to the previous research results,
Puerto Rican employees scored lower on defensiveness when compared with the
U.S mainland employees. Based on the results, the researchers concluded that there
Correlates of the MMPI-2-RF for Asian Indians
30
is no general tendency for the MMPI-2 to overpathologize Hispanic clients.
Another area where the MMPI-2 has been used to study cross-cultural
differences is the area of malingering and somatization among workers’
compensation applicants. DuAlba and Scott (1993) conducted a study where they
administered the MMPI-2 to 60 Caucasian and 60 Hispanic workers who had made
workers’ compensations claims. The study focused on investigating participants’
performance on Scales D, Hs, and Hy. The results of the analysis indicated no
differences on malingering. However, 93% (n=56) of the Hispanic sample reported
significant somatization, whereas only 55% (n=33) Caucasian respondents were
classified in the somatization category. In totality, the majority (63%) of the
participants who reported somatization were Hispanics while only 37% of the total
sample reporting somatization was Caucasian. The researchers concluded that
somatization is more prevalent in the Hispanic population when compared to
Caucasians, which was attributed to cultural factors that influence reporting of
emotional distress in terms of physical complaints (DuAlba & Scott, 1993). This
was consistent with conclusions of other psychometric studies indicating that
cultural factors predispose Hispanic individuals to somatizing under stress
(Escobar, 1987; Kolody, Vega, Meinhardt, & Bensussen, 1986).
Asian and Asian American Studies. Kwan (1999) reviewed a series of
MMPI studies of Asian American individuals. Most of the studies revealed that
Chinese samples scored significantly higher on Scales 0, D, and Sc (Robers, 1992;
Stevens, Kwan, & Graybill, 1993). When gender differences were analyzed, men
scored significantly high on Scale 0, 2 and 8, and women obtained notably higher
scores on scales L, D, and 0 (Robers, 1992; Stevens et al., 1993). The researchers
Correlates of the MMPI-2-RF for Asian Indians
31
concluded that depression may be the core underlying feature of the Asian
American psychiatric patients.
Tshushima and Tshushima (2009) conducted research to compare the
MMPI-2 Validity Scales among compensation-seeking Caucasian (n=109) and
Asian American (n=48) medical patients in Hawaii. Within the Asian American
group, there were 24 Japanese, 13 Filipino, 9 Chinese, 1 Korean, and 1
Vietnamese. The five validity scales chosen for the study were F, Fb, FBS, Fp and
Ds2. Results revealed no significant group effects of race for the five validity scale
scores. In addition, the groups did not differ significantly on any of the 10 clinical
scales of the MMPI-2. The researchers concluded that the substantial
representation of the Asian American population, which is 41.5 % of the total
population of Hawaii (U.S. Census, 2000), may have insulated them from
experiencing psychological stressors, prejudice, discrimination, and social
isolation, which is experienced by other ethnic minorities (Sue, Keefe, Enomoto,
Durvasula, & Chao, 1996). Tshushima and Tshushima (2009) cautioned that the
results of the study may not be generalizable to other Asian Americans.
A study by Tsai and Pike (2000) compared 90 Asian American students to
90 Caucasian students matched on demographic variables of sex, age, institutional
setting, and psychiatric treatment history. The researchers administered the MMPI-
2 and an acculturation scale, the SL–ASIA, which consists of 21 multiple-choice
items that assess language preference, identity, attitudes, friendship choice,
generational and geographical history, and behavior. The results revealed that the
low-acculturated group had the most elevated profile, the bicultural group had the
second most elevated profile level, and the high-acculturated Asian American and
Correlates of the MMPI-2-RF for Asian Indians
32
Caucasian scores were generally similar. Specifically, significant differences were
found between low-acculturated Asian American participants and Caucasian
participants, where low-acculturated Asian Americans obtained profile elevations
on clinical Scales 1, 2, 6, 7, 8, and 0 (Tsai & Pike, 2000). High-acculturated Asian
Americans obtained moderate scores on Scales F and 8 but scored within the
normal range on all other Clinical and Validity Scales. There were also significant
differences among the three Asian American groups on Scales L, F, 1, 5 and 8. The
low-acculturated group scored the highest on all the scales compared to the two
other two groups. Overall, the low-acculturated group had nine of their 13 validity
and clinical scale means significantly higher than those of the Caucasians. The
bicultural group had six scales significantly higher than the Caucasian sample.
Lastly, the high-acculturated Asian American and Caucasian group scores had no
statistically different means. The researchers concluded that acculturation level
does have an impact on the Asian American students’ MMPI-2 profiles. They
postulated that the high scores obtained by the low-acculturated and bicultural
sample could be attributed to stress related to establishing an ethnic identity and
the assimilation process (Tsai & Pike, 2000).
Correlates of the MMPI/MMPI-2/MMPI-2-RF with College Students
Several MMPI studies have centered on establishing test score correlates
specifically for college students. One such study by Thaw (1980) aimed at
examining correlates of the Mf scale for women college students. She administered
the MMPI; Motivation Analysis Test that measures motivational dynamics;
Personal Attribute Questionnaire measuring socially desirable characteristics
stereotypically related with masculinity and femininity; Parental Attributes
Correlates of the MMPI-2-RF for Asian Indians
33
Questionnaire (ratings of parents on the same attributes measured on Personal
Attribute Questionnaire); and Parental Attitude Questionnaire measuring family
atmosphere and child-rearing behaviors. The findings of the study revealed Mf
scale correlates for women with variables that indicate communality, expressive
qualities, social introversion, insecurity and self-dissatisfaction. Women scoring
low on Mf, that is, in the feminine direction, had high scores on depression and
self-dissatisfaction, and were found to be more concerned with self-repute and self-
concept.
A study in the domain of self-esteem by McCurdy and Kelly (1997) aimed
to establish correlates of the MMPI-2 Self Esteem content scale with two self-
esteem measures, the Rosenberg Self-esteem Scale and Coopersmith Self-Esteem
Inventory-Adult Form C. Using a sample size of 115 undergraduate volunteers, the
researchers found that the Low Self-esteem scores were significantly negatively
correlated with scores from both the Rosenberg Self-esteem Scale (r= -.61) and
Coopersmith Self-Esteem Inventory (r= -.67). The negative correlations
appropriately indicated that Low Self-esteem content scale scores are inversely
correlated to self-esteem on other measures.
Among MMPI-2 correlate studies, a study by Forbey and Ben-Porath
(2008) established empirical correlates of the MMPI-2 RC scales in a non-clinical
setting using scales that assess three domains of personality- emotions (RCd, RC1,
RC2, RC7), behavior (RC4, RC9) and thought (RC3, RC6, RC8)-using a sample of
1038 undergraduate college students. For the emotion domain, they used the
Screener for Somatoform Disorders, Beck Depression Inventory, Internal State
Scale, State Trait Personality Inventory (STPI)-Anxiety, STPI-Anger, Fears
Correlates of the MMPI-2-RF for Asian Indians
34
Questionnaire, and Obsessive Compulsive Scale as external measures. To assess
behavior, they utilized the Drug Abuse Screening Test, Michigan Alcohol
Screening Test, Barratt Impulsivity Scale (BIS) General, BIS-Motor and Internal
State Scale. Measures used to assess thought were Machiavellianism-IV, Magical
Ideation Scale, and Perceptual Abberation Scale. The researchers expected to
produce more distinctive patterns of correlations with external criteria using a
college student sample, thus allowing for better appraisals of discriminant validity.
They hypothesized that a measure of somatoform disorder would correlate with
RC1; depression with RCd and RC2; anxiety with RCd and RC7; and anger, social
phobias, and obsessiveness with RC7.
As expected, RCd showed significant correlations with measures of anxiety
and depression, and low correlations with measures assessing behavioral
dyscontrol and unusual thought processes. RC1 was highly correlated with
measures assessing somatic complaints and minimally correlated with measures of
behavioral dyscontrol and unusual thought processes. RC3 correlated notably with
negativism, internalized anger, and magical ideation, and revealed low correlations
with measures of emotional dysfunction and behavioral discontrol. RC4 correlated
highly with measures of behavioral discontrol and showed low correlations with
tests measuring emotional dysfunction and unusual thinking. These findings were
consistent across genders (Forbey & Ben-Porath, 2008). Ideas of Persecution, i.e.
the RC6 scale, correlated highly with measure of magical ideation and anger.
Interestingly, it also correlated with somatic preoccupation for both genders.
Between emotional dysfunction and unusual thinking, it correlated to a lower
degree with emotional dysfunction; however, it correlated with both minimally
Correlates of the MMPI-2-RF for Asian Indians
35
(Forbey & Ben-Porath, 2008). Therefore, the results were commensurate with the
hypotheses and revealed that RC scale scores are associated highly with scales
measuring theoretically similar constructs and minimally with measures of other
constructs, thus establishing evidence for convergent and discriminant validity.
Another recent study by Sellbom, Ben-Porath, and Graham (2006) was
directed towards establishing empirical correlates of the MMPI-2 RC scales in a
college counseling setting. The researchers used a modified version of an Intake
Form, previously used in a large scale study of outpatient mental health clients;
Client Description Form (CDF), which is a modified version of a Patient
Description Form to be filled by the therapists; and the Symptom Checklist-90-
Revised (SCL-90-R). The findings of the study revealed high correlations between
RC scales and conceptually related criteria and very minimal correlations between
conceptually non-related criteria. Specifically, RC2 correlated strongly with
depression, pessimism and introversion; RC4 with anti-social, aggressive,
angry/resentful characteristics; and RC9 with narcissistic features. Satisfactory
convergent validity for RC3, RC6, and RC8 could not be found because of lack of
appropriate criterion data and absence of psychotic symptoms among the college
counseling center clients. Overall, the study gave strong evidence for RC scales’
convergent and discriminant validity and contributed to the literature on MMPI-2
RC scale use among college counseling center clients (Sellbom et al., 2006).
Given the relatively recent publication of the MMPI-2-RF, there is a
limited amount of literature on empirical correlates of the test for a college
population. Among the few studies published to date, Forbey, Lee, and Handel
(2010) used a sample of 805 undergraduate students to study the utility, convergent
Correlates of the MMPI-2-RF for Asian Indians
36
and discriminant validity of scores on the MMPI-2-RF Specific Problem and
Interest Scales. The researchers used the Anger Idioms Scale (AIS), Assertiveness
Self-Report Inventory (ASRI), Bem Sex Role Inventory (BSRI), Cognitive
Failures Questionnaire (CFQ), Social Avoidance and Distress Scale (SADS), and
Social Fears Scale (SFS) to establish external correlates for MMPI-2-RF Specific
Problem and Interest Scales. More specifically, the AIS scores correlated
significantly with ANP, RC7, PSY-5-r and NEGE-r for men. When assessing for
discriminant validity, AIS produced significantly low correlations with the MMPI-
2 RF Internalizing scales i.e. EID, RCd and RC2 (Forbey et al., 2010). The AIS
scales also correlated with other externalizing scales such as H-O, BXD, AGG and
RC9.
Furthermore, the CFQ correlated significantly with COG, RCd and RC7.
As hypothesized, SADS was most correlated with SAV. SHY and INTR-r also
produced large effect size correlations with SADS. Large effect size correlations
were also obtained for women in the study for EID, RCd, RC2, and RC7 with the
SADS. This group of correlations produced the greatest discrepancy between men
and women (Forbey et al., 2010). In general, the correlational analysis revealed
evidence in favor of convergent and discriminant validity of the MMPI-2 RF
Specific Problem scales.
A study by Sellbom, Anderson, and Bagby (2013) utilizing the MMPI-2 RF
was aimed at exploring relationship between the DSM-5 Section III personality
traits and the MMPI-2-RF scales. Two separate university sample groups, N=463
and N=357, participated in the study, and all the participants were undergraduate
college students. Zero order correlations were computed to examine the
Correlates of the MMPI-2-RF for Asian Indians
37
relationship between MMPI-2-RF scales and Personality Inventory for DSM-5
domain and facet scales and the results were organized on the bases of each DSM-
5 personality trait domain. In the domain of Negative Affectivity, the relationship
between PID-5 and the MMPI-2-RF scales that measured internalizing was
significant. There were large effect sizes for scales EID, RCd and RC7. Scales
SFD, NFC, STW, and AXY correlated significantly with PID-5 Anxiousness, and
COG and NFC were found to be significantly strong predictors of PID-5
Perseveration. Significant correlations were found between MMPI-2-RF scales
RC7, RC3, RC6 and PID-5 Suspiciousness. RCd, RC7 and NFC also had large
significant correlations with PID-5 Submissiveness, while ANP was a significant
predictor of PID-5 Hostility. In the domain of Detachment, the MMPI-2-RF scales
EID, RCd, RC2 and SP correlated significantly with PID-5 Detachment domain
and the outcomes were consistent with the hypothesis. The EID, Rcd, MLS, HLP
and SFD scales were found to be significant predictors of PID-5 Depressivity.
Scales EID, RCd, RC2, MLS and SAV also correlated significantly with PID-5
Anhedonia, while RC2, SAV and SHY correlated notably with PDI-5 Withdrawal
(Sellbom et al., 2013).
In the domain of Antagonism, the most significant predictors of PID-5
Antagonism were MMPI-2-RF scales BXD, RC9 and AGG. In the domain of
Disinhibition, there were significant correlations between PID-5 Disinhibition and
RF scales BXD, RC4, RC9, SUB, AGG, ACT and COG, with COG being the best
predictor of Disinihibition. Within the Psychoticism domain, significant
correlations were found between PID-5 Psychoticism and THD, RC8 and COG
(Sellbom et al., 2013).
Correlates of the MMPI-2-RF for Asian Indians
38
In the same study, significant correlations were also found between DSM-5
Personality Disorders (PD) and relevant MMPI-2-RF scales. The Antisocial PD
correlated highly with BXD, RC4, RC9 and AGG. Avoidant PD was found to
correlate notably with EID, RCd, RC2, RC7, SFD, NFC, STW, SAV and SHY,
commensurate with the expectation. Borderline PD was moderately-to-strongly
correlated with MMPI-2-RF scales EID, RCd, RC7, COG, SFD, NFC, STW, AXY
and ANP. Within the Narcissistic PD domain, only RC9 correlated highly, and
BXD, RC8, SUB, AGG, low IPP and low SAV correlated only moderately (Sellbom
et al., 2013). In summary, the findings in the study revealed meaningful correlation
between MMPI-2-RF scales and DSM-5 Section III personality traits and
disorders.
Avdeyeva, Tellegen, and Ben-Porath (2012) studied empirical correlates of
low scores on MMPI-2/MMPI-2-RF RC scales using the Multidimensional
Personality Questionnaire (MPQ). They used a sample of 811 university students
with a goal of examining whether high (T>65); within-normal-limits (T=39-64)
and low (T<39) scores on RC scales are significantly different from MPQ defined
personality descriptors. For this purpose, the researchers chose 11 primary MPQ
scales and 3 higher order MPQ scales (Negative Emotionality, Positive
Emotionality and Constraint). Results of Multivariate Analyses of Variance
(MANOVA) revealed significant differences between the low and within-normal-
limits score groups. The group that scored low on all RC scales also scored
significantly and moderately lower on MPQ Negative Emotionality Scale than
those who scored within normal limits. One exception was the absence of
significant correlation between low scores on RC Scales with higher scores on
Correlates of the MMPI-2-RF for Asian Indians
39
MPQ Positive Emotionality. This study contributed to the MMPI-2-RF literature
for college students by demonstrating that low scores on MMPI-2-RF scales tend
to correlate with items or descriptors that tend to be the opposite of the descriptors
that correlate with high scores on MMPI-2-RF scales, which is consistent with
what is found with other populations (Aydeyeva et al., 2012).
MMPI/MMPI-2/MMPI-2-RF with College Students from Various Cultural
Groups
African American students. A few MMPI/MMPI-2 studies have been
conducted to determine specific profile features of African American students.
These studies have typically assessed differences between African American and
Caucasian American college students. A study by Whatley, Allen and Dana (2003)
attempted to assess the differences in MMPI scores based on racial identity, as well
as investigate the potential effect of the MMPI in pathologizing racial identity
processes. Scales F, 4, 8, and 9 were chosen based on previous research by
Graham (2000) and Scale 6 was selected to assess the level of paranoia and distrust
as a function of culture (Grier & Cobbs, 1968). The study included the Racial
Identity Attitude Scale (RIAS-B; Helms & Parham, 1996), measuring racial
identity in the framework of developmental stages of preencounter, encounter,
immersion-emersion and internalization, which also serve as the four subscales of
the measure. Stepwise multiple regression results revealed that Immersion-
Emersion scale scores significantly predicted the scores on Scale 4 and 9. The
RIAS-B Internalization scale served as a significant predictor of Scale 6, albeit in
an inverse relationship. The researchers described that higher level of
Correlates of the MMPI-2-RF for Asian Indians
40
internalization among African American students was associated with a lower level
of mistrust those belonging to that culture.
In another study, Rainey (1997) investigated ethnic differences in
psychopathology using the MMPI-2 among 267 undergraduate students (N=141
African Americans and N=126 White Americans). Rainey conducted a two-way
MANOVA with race and sex as independent variables and the eight MMPI-2
clinical scales as dependent variables. The results showed a significant main effect
for race, with African American students scoring higher than White American
students on Scales 4, 6, 8 and 9, thus supporting the hypothesis that African and
White Americans differ in the nature of psychopathology reported. According to
the study, African Americans report more psychotic content than the White
Americans. Similar findings were revealed when using socio-economic status
(SES) as a covariate in the analyses. An interesting finding from the study revealed
that African and White Americans do not differ in the number of psychopathology
syndromes, but show differences in the type of psychological symptoms reported.
In addition, there was a significant main effect of sex on the MMPI-2 Scales 1, 2,
3, 7 and 9. It was found that female students reported a higher number of physical
symptoms, anxiety, and unusual thoughts than male students, who reported a
higher number of manic symptoms. There was no interaction between race and sex
for the clinical scales (Rainey 1997).
In a study by Reed, McLeod, Randall, and Walker (1993) to assess the
prevalence of depressive symptoms among African American female college
students, 71 participants completed the MMPI-2 and Beck Depression Inventory
(BDI; Beck, Ward, & Mendelson, 1961). An examination of concordance rates
Correlates of the MMPI-2-RF for Asian Indians
41
between responses to the two measures revealed that only 6 of the 14 participants
who reported experiencing high depression on the BDI also endorsed significantly
high number of symptoms measured by the Depression (D) Scale. Further, the
MMPI-2 D scale identified that 23% of the total sample was experiencing
depression, out of which 12 participants obtained clinically significant elevations
(T>65) and 5 participants received sub-clinical elevations (T=62). The researchers
concluded that the scale score elevations were reflective of styles of coping as
opposed to pathology. They supported their conclusion with the adequate academic
performance of the students who participated in the study and suggested that these
students tended to underestimate their coping and personal strengths and
overestimated the severity of their difficulties (Reed et al., 1993).
Mexican/Hispanic students. Montgomery and Orozco (1985) conducted a
study to assess the effects of acculturation using the MMPI profiles of 365
undergraduate Mexican American and Anglo American students. Results indicated
that there were statistically significant differences between the two groups on 10 of
the 13 MMPI scales. However, after researchers statistically controlled for
acculturation and age, Mexican and Anglo American students differed on only two
scales, L and Mf. Specifically, the Mf scores of the Mexican American women
were significantly higher than those of the Anglo-American female students. This
difference in scores suggested that Mexican American women have fewer
traditional sex-roles interests. Additionally, Mexican American individuals yielded
significantly higher MMPI scores on the L scale, suggesting that Mexican
American individuals are culturally more likely to deny their faults and conform in
order to make a good impression (Montgomery & Orozco, 1985).
Correlates of the MMPI-2-RF for Asian Indians
42
Canul and Cross (1994) administered an Acculturation Rating Scale for
Mexican Americans (ARSMA), a Racial Identity Attitude Scale (RIAS-B), and the
MMPI-2 to 51 Hispanic undergraduate students. Results suggested that the
Hispanic students’ performance on the MMPI-2 L and K scales were influenced by
their racial identity attitudes and acculturative level; however, the Mf scale score
was not predicted by their racial identity attitudes. Although acculturation level
predicted MMPI-2 L scale performance, it did not predict Mf or K scale scores.
Individuals who were less adapted to their host culture scored higher on the L
scale. Mexican American participants who were less acculturated yielded a higher
L score and thus demonstrated denial of personal shortcomings on the MMPI-2
when compared to more highly acculturated participants (Canul & Cross, 1994).
Asian and Asian American students. Sue and Sue (1974) compared the
MMPI scores of Asian-American and non-Asian students from a student mental
health clinic. The sample consisted of 46 Chinese and Japanese students, and 120
non-Asian students. The results revealed significantly higher scores for Asian male
students on scales L, F, Hs, Pd, Pa, Pt, and Si than non Asian male students. The
Asian female students scored significantly higher only on scale L, F, and Si. The
profiles of Asian students were similarly patterned to their control counterparts,
however, the severity was greater for Asian Americans. The findings drew
attention on how to institute mental health services for ethnic minorities within
their cultural experiences.
Stevens and Kwan (1993) compared the MMPI-2 scores of 25 Chinese and
25 Caucasian-American college students. T-test results revealed that Chinese men
produced a higher mean T-score on scale Si than Caucasian men, and Chinese
Correlates of the MMPI-2-RF for Asian Indians
43
women scored significantly higher on Scale L than Caucasian women. The
researchers also compared the scores with published norms for male and female
American college students (Butcher, Graham, Williams, & Ben-Porath, 1990). The
comparison revealed that the Chinese men produced a higher score on scale Si than
the male norm group. Chinese women obtained higher scores on scales L, K, D,
Hy, and a lower score on scale Mf than the female norm group.
MMPI and Asian Indians
Although Asian Indians form a substantial diaspora in the United States,
the research on Asian Indians in the area of personality assessment, and
specifically MMPI and MMPI-2 is sparse. The following section describes MMPI
and MMPI-2-RF studies among Asian Indians living in India and the United
States.
Use of the MMPI in India. A survey of the literature shows there is a very
limited amount of research on the MMPI and MMPI-2 in India. To study gender
differences in report of anxiety, Sharma (1978) used the MMPI with a sample of
university students in India, and specifically studied patterns in K and L scales.
While it was hypothesized that men will score higher on defensiveness, no
significant differences were found between the two genders. Similarly, no
significant gender differences were found for scores on anxiety. Sharma (1978)
concluded that anxiety is multidimensional and situational factors play an
important role in reporting anxiety. Another study using the MMPI attempted to
study the relationship of depression with anxiety, neuroticism, psychoticism and
social desirability using a sample of 120 women in India. The researchers
correlated the scores on MMPI D scale with those on the Beck Depression
Correlates of the MMPI-2-RF for Asian Indians
44
Inventory and Zung Self-Rating Scale, finding that depression scores vary by self
report measures (Upamanyu & Reen, 1990).
Manerikar and Patil (1972) used the MMPI to obtain personality profiles of
Indian executives (N=55) pursuing a diploma in Business and Industrial
Management. The personality patterns revealed that the executives were active,
ambitious, confident and rational, but also endorsed depression and anxiety
(Manerikar & Patil, 1972). To study personality patterns among people with
alcohol dependence, Trivedi and Raghavan (1991) administered the Multiphasic
Questionnaire (MPQ), a short version of MMPI, to inpatients (N=30) being treated
for alcohol dependence. Results showed highest scores on depression and lowest
on anxiety. Significant correlations were found between psychopathic deviance
and depression scales.
No studies have been published on the use of the MMPI-2 and/or MMPI-2
RF for Asian Indians living in India.
Use of the MMPI with Asian Indian college students in the United States.
Two recent doctoral dissertations have examined the MMPI-2-RF scores of Asian
Indian college student samples. The first dissertation compared MMPI-2-RF
profiles of Asian Indian university students in California and India (Sorathia,
2014). Using samples of N= 36 participants from California, and N=23 from India,
the study revealed statistically significant differences where Asian Indian
participants scored significantly higher on L-r than Caucasian American
participants. The results were commensurate with previous research which reveals
that impression management is of importance in the Asian Indian community and
possessing unfavorable personality traits reflects negatively on the individual
Correlates of the MMPI-2-RF for Asian Indians
45
(Ahmed & Lemkau, 2000). The study further revealed that Asian Indian
participants scored significantly higher on Scale RC1, consistent with existing
research which shows that psychological distress is often disguised by somatic
complaints among the Asian Indian population (Ahmed & Lemkau, 2000). This
proclivity towards somatization is also perpetuated by the stigma attached to
seeking mental health services (Masood, Okazaki, & Takeuchi, 2009).
Furthermore, the Asian Indian sample scored significantly higher on Scale RC8
indicating that Asian Indians are more likely to report experiencing unrealistic
thinking and somatic delusions (Sorathia, 2014). Research on ethnic minorities is
consistent with this study’s results, as the African American population and
Mexican participants have also obtained significantly higher scores on RC8 than
their Caucasian counterparts (Castro, Gordon, Brown, Anestis, & Joiner , 2008;
Lucio, Ampudia, Durán, León & Butcher, 2001). Sorathia’s (2014) study indicated
that a higher score on RC8 could be attributed to spiritual beliefs of the Asian
Indian participants (Sorathia, 2014).
The second doctoral research by Bhasin (2014) used a sample of N=77
Asian Indians to compare responses on the MMPI-2-RF relative to the three levels
of acculturation (low acculturation, bi-acculturation and high acculturation)
measured through the Acculturation Scale for Asian Indians developed by Parekh
(2000). The results revealed that the bi-acculturated Asian Indians obtained
significantly higher score on Scale RC6 than the highly acculturated sample group.
A significant difference was also found on scale THD between the bi-acculturated
and highly acculturated participants. Bhasin (2014) concluded that even adequately
adjusted Asian Indians tend to experience acculturative stress resulting from the
Correlates of the MMPI-2-RF for Asian Indians
46
fear of being judged or perceived negatively, and from fear of facing
discrimination and racism. He further suggested that these differences may not be
attributes of personality but are likely indicative of cultural adjustment. Bhasin
(2014) also found significant gender differences where female participants
reported higher levels of anxiety, specific phobias, passiveness, and aesthetic
interests as indicated by significantly higher scores on scales EID, RC7, AXY, BRF,
IPP, AES, and MSF than male participants, who scored significantly higher on
scales AGGR-r, BXD, RC4, JCP, MEC, and DISC-r. He attributed these
differences to roles and expectations of both genders in the Asian Indian
population.

Correlates of the MMPI-2-RF for Asian Indians
47
Rationale and Hypotheses
In recent decades, the psychological literature has given increasing
attention to the role of cultural factors in psychological functioning, and this
emphasis has begun to influence personality assessment research and practice. To
date, a relatively small number of MMPI and MMPI-2 studies using culture or
cultural identity as a variable have been conducted with African American,
Hispanic American, and American Indian samples. More recent studies have
included small numbers of Asian Americans, typically within heterogeneous Asian
samples. It is noted that there are no published MMPI or MMPI-2 studies on
Asian Indians residing in the United States. The expanding Asian Indian
population in the United States prompts a need for research with Asian Indians to
strengthen the validity of MMPI interpretations for this group. Moreover, with the
relatively recent publication of the MMPI-2-RF, there is a need to identify score
patterns and their measured constructs for Asian Indians. The two doctoral
dissertations discussed earlier undertook comparisons of MMPI-2-RF scores of
Asian Indian and Caucasian American college student samples and examined
profiles in the contexts of acculturation and gender. However, they did not provide
MMPI-2-RF scale score correlates for Asian Indian college students. The current
study is intended to fill the gap of previous research and contribute to the
developing literature on personality assessment of Asian Indian students.
The purposes of the present study were multifold. First, the study aimed to
expand MMPI-2-RF descriptors for Asian Indian college students, which was
achieved by establishing correlates of the MMPI-2-RF using other self-report
measures. This would enable elaborated and accurate interpretations of MMPI-2-
Correlates of the MMPI-2-RF for Asian Indians
48
RF scores produced by Asian Indians in subsequent assessment applications of this
measure. Keeping this generative purpose in mind, no specific directional
hypotheses were proposed for this goal of the current study. However, it was
expected that the obtained correlates would be congruent with the MMPI-2-RF
scale constructs.
The second purpose of the study was to compare mean MMPI-2-RF scores
of the Asian Indian student sample with those of a Caucasian American student
sample so as to investigate the impact of cultural background on personality test
scores. Based on the literature indicating greater somatic expressions of distress
and difficulty among Asians relative to westerners, it was anticipated that the
Asian Indians would score higher on the five MMPI-2-RF Somatic scales of MLS,
GIC, HPC, NUC, and COG than the Caucasian Americans. Higher scores on
selected Internalizing scales such as HLP, SFD, STW, and ANP, and selected
Interpersonal scales such as IPP, SHY, and DSF were also expected for Asian
Indian students relative to their Caucasian American counterparts as a function of
their being in the process of cultural adaptation and the likelihood of associated
reticence in interpersonal interactions. Conversely, lower scores on Externalizing
scales such as SUB and AGG among Asian Indian students were likely, given
cultural sanctions against substance abuse and expression of negative emotionality.
These hypotheses were moderated by the expectation that the Asian Indian student
sample for this study is likely to have an urban, high socioeconomic background
with considerable exposure to western norms; therefore, culture-based differences
may be less pronounced.

Correlates of the MMPI-2-RF for Asian Indians
49
A final goal of the study was to examine the MMPI-2-RF scores of more
acculturated and less acculturated students and compare them on an exploratory
basis to determine the potential influence of acculturation on the personality test
scores.
Correlates of the MMPI-2-RF for Asian Indians
50
Methods
Participants
Participants for this study consisted of 48 Asian Indian college students
attending a medium-sized, private university located in the southeastern United
States, supplemented with 21 Caucasian American college students from the
same university for comparative analysis.
Within the Asian Indian sample, 31participants (68%) were men and
17 (32%) were women. Ages of the students in this sample ranged from 18
years to 28 years with a mean age of 20.83 (SD=3.73).
Six percent of the Asian Indian student sample were freshmen in college,
18.7% were sophomores, 10.41% juniors, 8.3% seniors, and 52.1% were
graduate students at Florida Institute of Technology. The students in the sample
belonged to a diverse range of degree majors. The largest percentage of students
were Computer Science majors, 18.7%; 10.1% were in Aerospace Engineering,
8.3% each were studying Computer Information Systems and Mechanical
Engineering, 4.1% each reported Astronomy, Electrical Engineering, Aviation
Human Factors, Bio-Technology, and 2% each stated they were studying Civil
Engineering, Marine Biology, Ocean Engineering, Human Centered Design and
Pre-medical Studies.
The relationship status of the students in the sample consisted of 2%
married, 23% in a relationship and the remaining 75% single. With regard to the
country of origin, 2% students were from Kenya, 4.1% students from Pakistan,
and 93.9% students were from India. Two percent of the students were citizen of
the United States and 98% students were on a F1 student visa. The sample
Correlates of the MMPI-2-RF for Asian Indians
51
represented urban locals and ranged from large metropolitan cities to small
towns and cities in India. The participants represented a diverse range of spoken
Indian languages including Hindi, English, Gujarati, Manipuri, Telugu, Tamil,
Marathi, Kannada, and Urdu. The majority of this sample, 52%, reported having
family/relatives in the United States and the remaining 48% did not have
relatives in the country. The participants reported a broad range of time spent in
the United States with a mean of 23.73 months (SD= 27.82; range = 1-192
months).
Within the Caucasian American sample, 12 participants (52.3%) were
men and 9 (47.7%) were women. Ages of the students in this sample ranged
from 18 years to 27 years with a mean of 20.83 (SD=2.04). With respect to
class standing, 23.8% were freshmen in college, 38.09% were sophomores,
28.6% juniors, and 9.5% were seniors at Florida Institute of Technology. The
students in the sample belonged to a diverse range of degree majors. The largest
percentage of students were Psychology majors, 19%, 14.2% each were
Forensic Psychology and Software Engineering majors, 9.5% each were ABA
and Bio Medical Engineering majors, 4.7% each reported Marine Biology,
Sustainability, Business, Aerospace Engineering and Mathematical Sciences.
The relationship status of the students in the sample consisted of 61.9% single
and 38% in a relationship.
For this study, participants were included if they produced valid MMPI-
2-RF profiles. Based on the test’s Administration and Scoring Manual’s
guidelines for profile validity, students who produced a Cannot Say (?) raw
score < 15, VRIN-r T score <80, TRIN-r T score <80, F-r T score <120, Fp-r T
Correlates of the MMPI-2-RF for Asian Indians
52
score <100, L-r score < 80, K-r score <70 were included for this study,
(Tellegen & Ben Porath, 2008). Three Asian Indians, but no Caucasian
Americans, were excluded using this inclusion/exclusion criteria.
Instruments
MMPI-2-RF (Tellegen & Ben-Porath, 2008)
The MMPI-2-RF was the central measure of this study. The MMPI-2-RF
Technical Manual provides evidence of the sound psychometric properties of the
measure based on data from the MMPI-2 normative sample and comparative
treatment samples including an outpatient community mental health sample, a
psychiatric inpatient sample from a general community hospital, and male
inpatients at a Veteran Administration’s hospital (Tellegen & Ben Porath, 2008).
The test-retest reliability coefficients for the Validity Scales ranged from .40 for
TRIN-r to .84 for K-r. The Standard Error of Measurements (SEMs) for the
Validity Scales ranged from 8 for TRIN-r to 4 for K-r. Reliability coefficients for
the Higher Order Scales range from .71 for THD (SEM=5) to .91 for BXD (SEM =
3). The RC scale scores yielded strong reliability coefficients ranging from .64 for
RC6 to .89 for RC4, and SEMs of 6 and 3, respectively. The test-retest reliability
coefficients for the Specific Problem Scales range from .54 (SEM = 7) for NUC to
.92 for MEC (SEM = 3). The PSY-5 scales also demonstrated strong test-retest
reliability coefficients of .76 for PSYC-r to .93 for DISC-r and SEMs of 5 for
PSYC-r and 3 for DISC-r (Tellegen & Ben Porath, 2008).
With respect to internal consistency reliability, it is noted that the alpha
coefficients for the MMPI-2-RF range from .37, SEM=9 (TRIN-r for men) and .20,
SEM=8 (VRIN-r for women) to .87 (RCd for men) and .89 (RCd for women) with
Correlates of the MMPI-2-RF for Asian Indians
53
a SEM=3. The majority of the MMPI-2-RF Scales fall within the acceptable .50
to.70 range for internal consistency (Tellegen & Ben Porath, 2008).
Evidence for the external validity of the MMPI-2-RF was derived from a
wide variety of settings such as clinical (out-patient community mental health,
community hospitals, Veterans’ Affairs hospitals), medical, forensic, and non-
clinical settings. (Tellegen & Ben Porath, 2008). It was demonstrated though inter-
correlations between sets of scale scores indicating expected directions of
convergent and discriminant validity. Furthermore, improvements in convergent
and discriminant validity of the new RC scales over the earlier clinical scales of the
MMPI-2 were shown using diverse samples, settings and assessment measures.
The Technical Manual also outlines the empirical correlates of the MMPI-2-RF,
which provide a basis for meaningful interpretation. Thus, the psychometric
findings on the reliability and validity of the MMPI-2-RF demonstrate the ability
of the test to measure “protocol validity, personality and psychopathology”
(Tellegen & Ben Porath, 2008, p. 33).
NEO Five Factor Inventory-3 (McCrae & Costa, 2010)
The NEO FFI-3 is a short form of the NEO Personality Inventory-3. It is a
reliable and valid tool to measure normal, inheritable traits of personality, namely
Neuroticism, Extraversion, Openness, Agreeableness, and Conscientiousness,
derived through factor analysis (Steel & Ones, 2002). Each domain further
produces facet scores. The NEO-FFI-3 uses the NEO-PI-3 norms for scoring and
interpretation. The internal consistency of the NEO-PI-3 ranges from .89 to .93 for
domain scores and from .54 to .83 for facet scores. Test-retest reliability
coefficients were not provided for NEO FFI-3 and NEO-PI-3 in the test manuals,
Correlates of the MMPI-2-RF for Asian Indians
54
therefore estimates from the NEO-PI-R are used as substitutes. A reliability
generalization study by Caruso (2000) revealed that the Agreeableness had a
modest test-retest reliability of .58 and internal consistency reliability of .62. The
existing literature indicates that other NEO-PI-R domains display adequate
reliability. Consensual validity has been found when comparing with peer and
spouse reports. Convergent and discriminant validity of the NEO inventories has
been established through correlations with scores from other instruments including
the Myers-Briggs Type Indicator, Minnesota Multiphasic Personality Inventory,
and California Psychological Inventory (Botwin, 1995). The NEO-FFI-3 consists
of 180 items and takes approximately 15 minutes to complete (Botwin, 1995).
College Adjustment Scales (Anton & Reed, 1991)
The College Adjustment Scales (CAS) is a 108-item self-report measure to
assess “psychological distress, relationship conflict, low self-esteem, and academic
career choice difficulties” in college students (Anton & Reed, 1991, p. 1). Scored
on a 4-point Likert scale, the measure has 9 scales: (a) Anxiety, (b) Depression, (c)
Suicidal Ideation, (d) Substance Abuse, (e) Self-esteem Problems, (f) Interpersonal
Problems, (g) Family Problems, (h) Academic Problems, and (i) Career Problems.
The normative sample of the CAS consisted of 1,146 college students seeking
counseling services. The internal consistency reliability of the scales ranges from
.80 to .92, with an overall mean coefficient of .86. There is also evidence for
convergent and discriminant validity of the CAS using the multitrait-monomethod
research design (Anton & Reed, 1991). The measures used to establish CAS test
score validity were: (a) State-Trait Anxiety Inventory, (b) Beck Depression
Inventory, (c) Beck Hopelessness Scale, (d) NEO-Personality Inventory, (e)
Correlates of the MMPI-2-RF for Asian Indians
55
cumulative GPA, (f) Inventory of Interpersonal Problems, (g) Michigan
Alcoholism Screening Test, (h) Drug Abuse Screening Test, (i) Multidimensional
Self-esteem Inventory, (j) Family Adaptability and Cohesion Evaluation Scales,
(k) Career Decision Scale, and (1) the Self-expression Inventory. Additional
studies have also found the CAS to be clinically useful as was evidenced by the
measure’s ability to distinguish between clinical and non-clinical samples
(Nafziger, Couillard, Smith, & Wiswell, 1998). Finally, a review of the CAS in the
Mental Measurements Yearbook provides evidence for adequate discriminant and
predictive validity (Martin & Starr, 1996).
Measures of Psychosocial Development (Hawley, 1988)
Based on Erikson’s theory of personality development, the Measures of
Psychosocial Development (MPD) is a 112-item self-report measure that assesses
the degree to which psychosocial conflicts corresponding to eight stages have been
resolved (Hawley, 1988). It has 27 scales that yield eight positive, eight negative,
and eight resolution scales, as well as three total scale scores. The three total scores
reflect overall psychological adjustment, and the resolution of each stage is
indicated by the eight resolution scales. The 16 positive and negative scales
measure attitudes associated with each stage of psychosocial development. The
test is shown to produce internal consistency reliabilities that range from .65 to .84,
and a test-retest reliability coefficient of .80, thus indicating adequate reliability
(Hawley, 1988). For the current study, only the eight negative scales were selected
for analysis because they measure constructs that align with the concepts measured
by the MMPI-2-RF assessing difficulty and disturbance.
Acculturation Scale for Asian Indians (Parekh, 2000)
Correlates of the MMPI-2-RF for Asian Indians
56
The Acculturation Scale for Asian Indians (ASAI) is an unpublished
measure developed with an aim to assess level of acculturation among Asian
Indians beyond measurements of language, education and socio-economic status. It
is designed to assess traditions and values that are retained from the country of
origin. The ASAI was modeled after the African American Acculturation Scale
(AAAS), developed by Landrine and Klonoff (cited in Parekh, 2000). Items are
rated on a 7-point Likert scale and the scale has eight domains that measure areas
of traditional family structures, preference for things Asian-Indian, traditional
foods, interracial attitudes/cultural mistrust, traditional health beliefs and practices,
traditional religious beliefs and practices, traditional socialization, and
superstitions. High scores on the measure reflect traditionalism whereas low scores
indicate increased acculturation in the host country (Parekh, 2000). The ASAI has
an internal consistency coefficient of .98 and split-half reliability coefficient of .92.
To establish validity, the test was evaluated against the alcohol, dietary, physical
activity and taboo subscales of the Behavioral Risk Factor Surveillance System
Questionnaire, Beck Depression Inventory and the Beck Anxiety Inventory. The
ASAI scores is shown to have a negative relationship with the alcohol use scale
from the Behavioral Risk Factor Surveillance System Questionnaire (Navsaria,
2008). The complete ASAI is shown in Appendix A.
Procedure
The study began upon approval from the Institutional Review Board of
Florida Institute of Technology and the Doctoral Research Project committee.
Caucasian American participants were recruited through the university list serve
and Asian Indian participants were recruited through the Indian Student
Correlates of the MMPI-2-RF for Asian Indians
57
Association (ISA)- Sanskriti - at FIT. Following provision of informed consent,
participants completed the above mentioned measures at a designated location on
campus. The consent form is included in Appendix B. After completion of the
tests, the scored responses were entered in a Statistical Package for the Social
Sciences (SPSS) database. The informed consent and any other identifying
information for each participant were secured separately in a locked facility.
Participants were identified as an alpha-numerical code so as to protect their
privacy.
Data Analyses
Preliminary analyses consisted of computing descriptive statistics such as
means, standard deviations, and percentage data to describe the characteristics of
the sample. Additionally, acculturation levels of the Asian Indian participants were
computed. Means and standard deviations were generated for the scores on all the
measures. Central analyses aimed at establishing correlates of the MMPI-2-RF for
the Asian Indian student sample consisted of computing Pearson Product Moment
correlations between their MMPI-2-RF scores and scores from the NEO-FFI-3,
CAS, and MPD. Multivariate and Univariate Analyses of Variance (MANOVA,
ANOVAS) were conducted to explore differences in MMPI-2-RF scores between
the Asian American and Caucasian American samples. Finally, correlates and
Multivariate and Univariate Analyses of Variance (MANOVA, ANOVAS) were
conducted to compare mean MMPI-2-RF scores of high and low acculturated
Asian Indians.
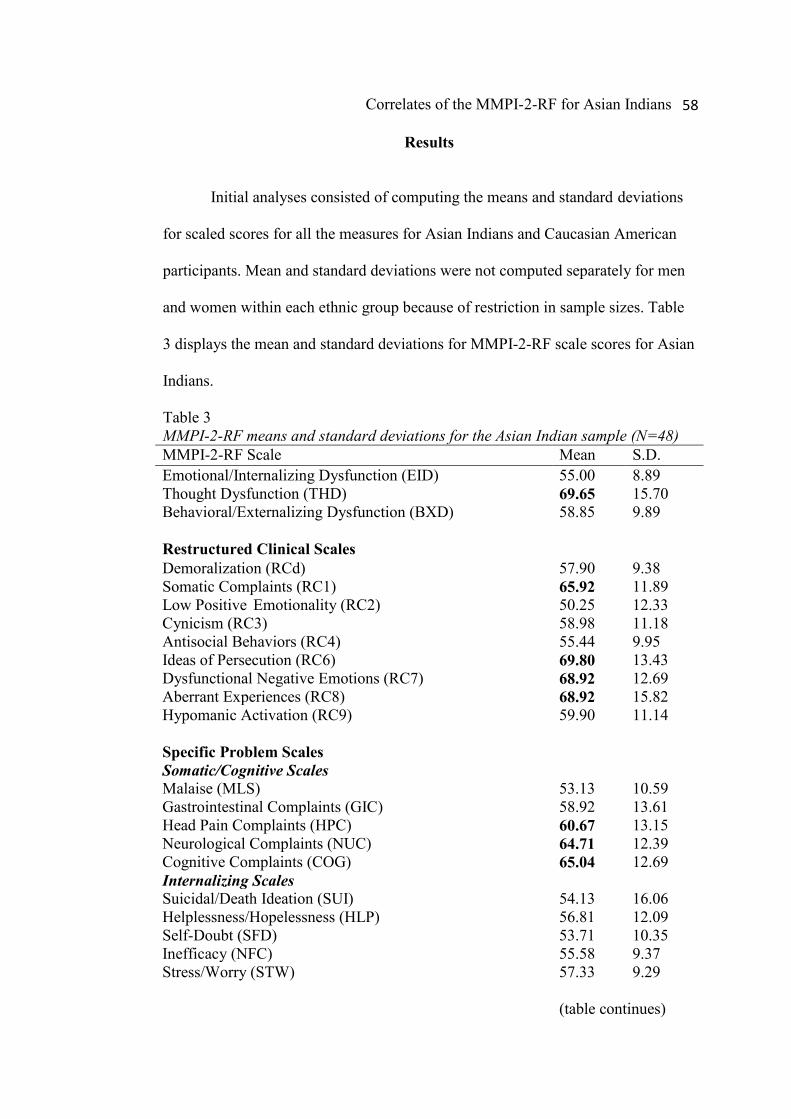
Correlates of the MMPI-2-RF for Asian Indians
58
Results
Initial analyses consisted of computing the means and standard deviations
for scaled scores for all the measures for Asian Indians and Caucasian American
participants. Mean and standard deviations were not computed separately for men
and women within each ethnic group because of restriction in sample sizes. Table
3 displays the mean and standard deviations for MMPI-2-RF scale scores for Asian
Indians.
Table 3 MMPI-2-RF means and standard deviations for the Asian Indian sample (N=48) MMPI-2-RF Scale Mean S.D. Emotional/Internalizing Dysfunction (EID) 55.00 8.89 Thought Dysfunction (THD) 69.65 15.70 Behavioral/Externalizing Dysfunction (BXD) 58.85 9.89 Restructured Clinical Scales Demoralization (RCd) 57.90 9.38 Somatic Complaints (RC1) 65.92 11.89 Low Positive Emotionality (RC2) 50.25 12.33 Cynicism (RC3) 58.98 11.18 Antisocial Behaviors (RC4) 55.44 9.95 Ideas of Persecution (RC6) 69.80 13.43 Dysfunctional Negative Emotions (RC7) 68.92 12.69 Aberrant Experiences (RC8) 68.92 15.82 Hypomanic Activation (RC9) 59.90 11.14 Specific Problem Scales Somatic/Cognitive Scales Malaise (MLS) 53.13 10.59 Gastrointestinal Complaints (GIC) 58.92 13.61 Head Pain Complaints (HPC) 60.67 13.15 Neurological Complaints (NUC) 64.71 12.39 Cognitive Complaints (COG) 65.04 12.69 Internalizing Scales Suicidal/Death Ideation (SUI) 54.13 16.06 Helplessness/Hopelessness (HLP) 56.81 12.09 Self-Doubt (SFD) 53.71 10.35 Inefficacy (NFC) 55.58 9.37 Stress/Worry (STW) 57.33 9.29
(table continues)
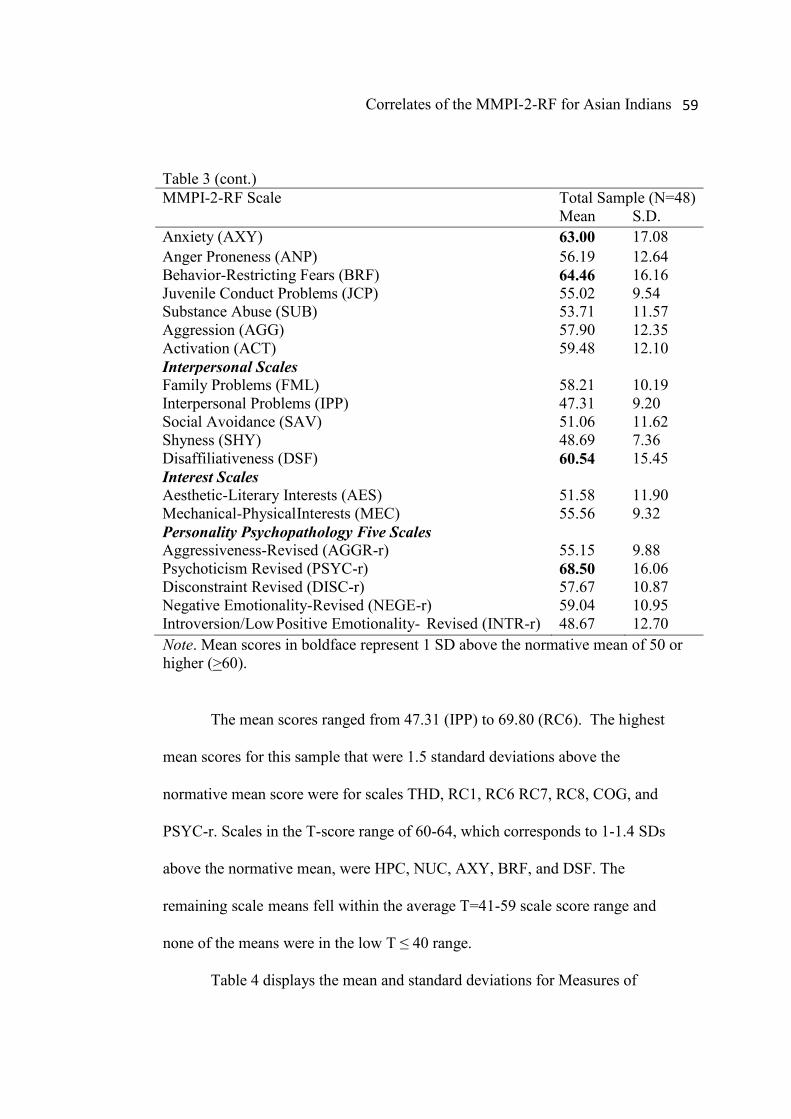
Correlates of the MMPI-2-RF for Asian Indians
59
Table 3 (cont.)
MMPI-2-RF Scale Total Sample (N=48) Mean S.D. Anxiety (AXY) 63.00 17.08 Anger Proneness (ANP) 56.19 12.64 Behavior-Restricting Fears (BRF) 64.46 16.16 Juvenile Conduct Problems (JCP) 55.02 9.54 Substance Abuse (SUB) 53.71 11.57 Aggression (AGG) 57.90 12.35 Activation (ACT) 59.48 12.10 Interpersonal Scales Family Problems (FML) 58.21 10.19 Interpersonal Problems (IPP) 47.31 9.20 Social Avoidance (SAV) 51.06 11.62 Shyness (SHY) 48.69 7.36 Disaffiliativeness (DSF) 60.54 15.45 Interest Scales Aesthetic-Literary Interests (AES) 51.58 11.90 Mechanical-Physical Interests (MEC) 55.56 9.32 Personality Psychopathology Five Scales Aggressiveness-Revised (AGGR-r) 55.15 9.88 Psychoticism Revised (PSYC-r) 68.50 16.06 Disconstraint Revised (DISC-r) 57.67 10.87 Negative Emotionality-Revised (NEGE-r) 59.04 10.95 Introversion/Low Positive Emotionality- Revised (INTR-r) 48.67 12.70 Note. Mean scores in boldface represent 1 SD above the normative mean of 50 or higher (>60).
The mean scores ranged from 47.31 (IPP) to 69.80 (RC6). The highest
mean scores for this sample that were 1.5 standard deviations above the
normative mean score were for scales THD, RC1, RC6 RC7, RC8, COG, and
PSYC-r. Scales in the T-score range of 60-64, which corresponds to 1-1.4 SDs
above the normative mean, were HPC, NUC, AXY, BRF, and DSF. The
remaining scale means fell within the average T=41-59 scale score range and
none of the means were in the low T ≤ 40 range.
Table 4 displays the mean and standard deviations for Measures of
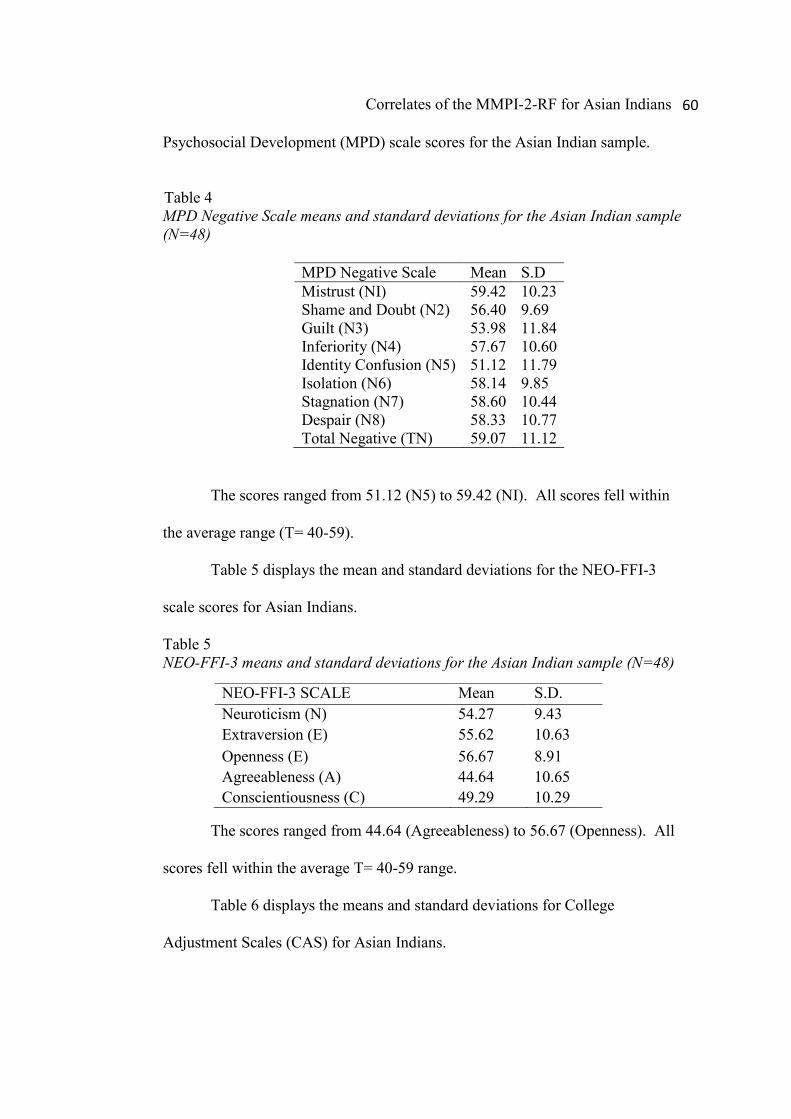
Correlates of the MMPI-2-RF for Asian Indians
60
Psychosocial Development (MPD) scale scores for the Asian Indian sample.
Table 4 MPD Negative Scale means and standard deviations for the Asian Indian sample (N=48)
MPD Negative Scale Mean S.D Mistrust (NI) 59.42 10.23 Shame and Doubt (N2) 56.40 9.69 Guilt (N3) 53.98 11.84 Inferiority (N4) 57.67 10.60 Identity Confusion (N5) 51.12 11.79 Isolation (N6) 58.14 9.85 Stagnation (N7) 58.60 10.44 Despair (N8) 58.33 10.77 Total Negative (TN) 59.07 11.12
The scores ranged from 51.12 (N5) to 59.42 (NI). All scores fell within
the average range (T= 40-59).
Table 5 displays the mean and standard deviations for the NEO-FFI-3
scale scores for Asian Indians.
Table 5 NEO-FFI-3 means and standard deviations for the Asian Indian sample (N=48)
The scores ranged from 44.64 (Agreeableness) to 56.67 (Openness). All
scores fell within the average T= 40-59 range.
Table 6 displays the means and standard deviations for College
Adjustment Scales (CAS) for Asian Indians.
NEO-FFI-3 SCALE Mean S.D. Neuroticism (N) 54.27 9.43 Extraversion (E) 55.62 10.63 Openness (E) 56.67 8.91 Agreeableness (A) 44.64 10.65 Conscientiousness (C) 49.29 10.29
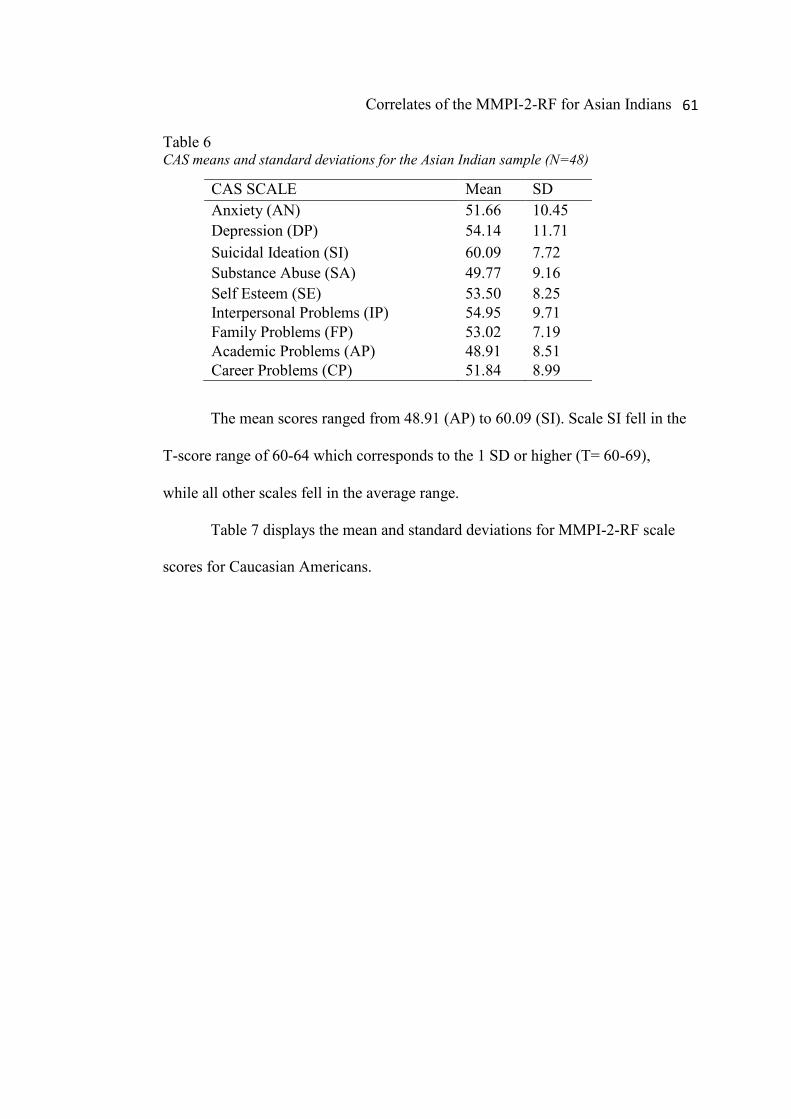
Correlates of the MMPI-2-RF for Asian Indians
61
Table 6 CAS means and standard deviations for the Asian Indian sample (N=48)
The mean scores ranged from 48.91 (AP) to 60.09 (SI). Scale SI fell in the
T-score range of 60-64 which corresponds to the 1 SD or higher (T= 60-69),
while all other scales fell in the average range.
Table 7 displays the mean and standard deviations for MMPI-2-RF scale
scores for Caucasian Americans.
CAS SCALE Mean SD Anxiety (AN) 51.66 10.45 Depression (DP) 54.14 11.71 Suicidal Ideation (SI) 60.09 7.72 Substance Abuse (SA) 49.77 9.16 Self Esteem (SE) 53.50 8.25 Interpersonal Problems (IP) 54.95 9.71 Family Problems (FP) 53.02 7.19 Academic Problems (AP) 48.91 8.51 Career Problems (CP) 51.84 8.99
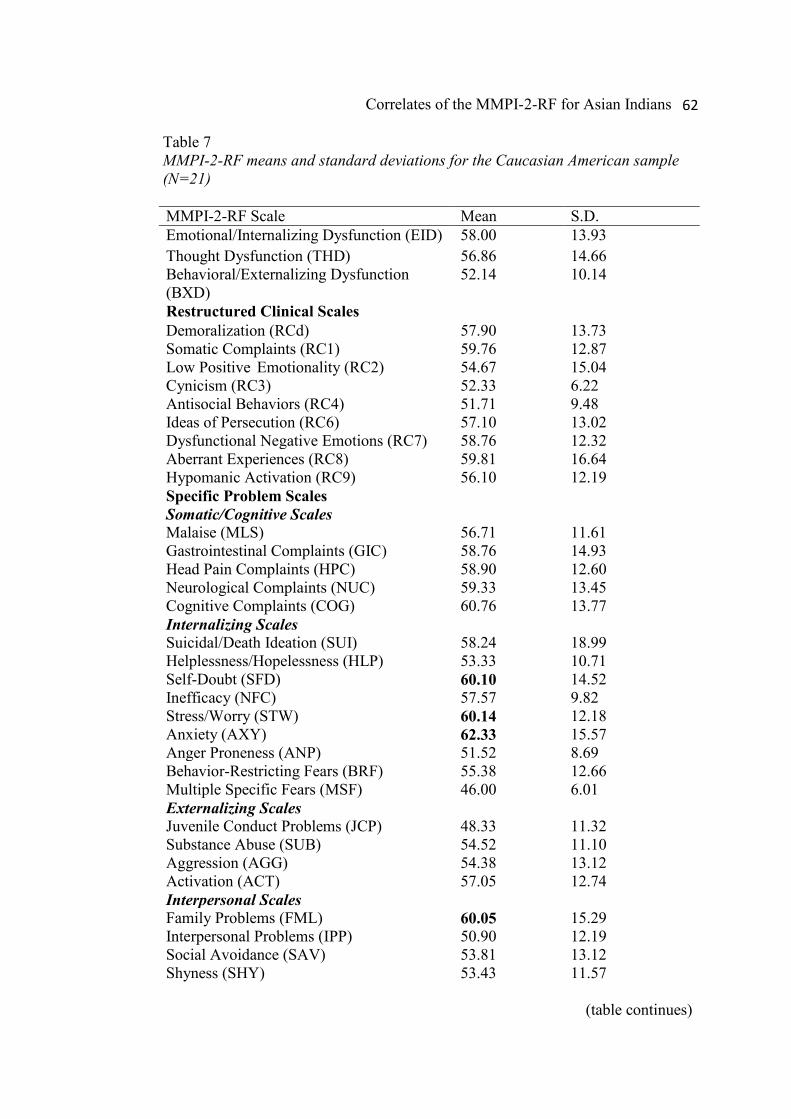
Correlates of the MMPI-2-RF for Asian Indians
62
Table 7 MMPI-2-RF means and standard deviations for the Caucasian American sample (N=21) MMPI-2-RF Scale Mean S.D. Emotional/Internalizing Dysfunction (EID) 58.00 13.93 Thought Dysfunction (THD) 56.86 14.66 Behavioral/Externalizing Dysfunction (BXD)
52.14 10.14
Restructured Clinical Scales Demoralization (RCd) 57.90 13.73 Somatic Complaints (RC1) 59.76 12.87 Low Positive Emotionality (RC2) 54.67 15.04 Cynicism (RC3) 52.33 6.22 Antisocial Behaviors (RC4) 51.71 9.48 Ideas of Persecution (RC6) 57.10 13.02 Dysfunctional Negative Emotions (RC7) 58.76 12.32 Aberrant Experiences (RC8) 59.81 16.64 Hypomanic Activation (RC9) 56.10 12.19 Specific Problem Scales Somatic/Cognitive Scales Malaise (MLS) 56.71 11.61 Gastrointestinal Complaints (GIC) 58.76 14.93 Head Pain Complaints (HPC) 58.90 12.60 Neurological Complaints (NUC) 59.33 13.45 Cognitive Complaints (COG) 60.76 13.77 Internalizing Scales Suicidal/Death Ideation (SUI) 58.24 18.99 Helplessness/Hopelessness (HLP) 53.33 10.71 Self-Doubt (SFD) 60.10 14.52 Inefficacy (NFC) 57.57 9.82 Stress/Worry (STW) 60.14 12.18 Anxiety (AXY) 62.33 15.57 Anger Proneness (ANP) 51.52 8.69 Behavior-Restricting Fears (BRF) 55.38 12.66 Multiple Specific Fears (MSF) 46.00 6.01 Externalizing Scales Juvenile Conduct Problems (JCP) 48.33 11.32 Substance Abuse (SUB) 54.52 11.10 Aggression (AGG) 54.38 13.12 Activation (ACT) 57.05 12.74 Interpersonal Scales Family Problems (FML) 60.05 15.29 Interpersonal Problems (IPP) 50.90 12.19 Social Avoidance (SAV) 53.81 13.12 Shyness (SHY) 53.43 11.57
(table continues)
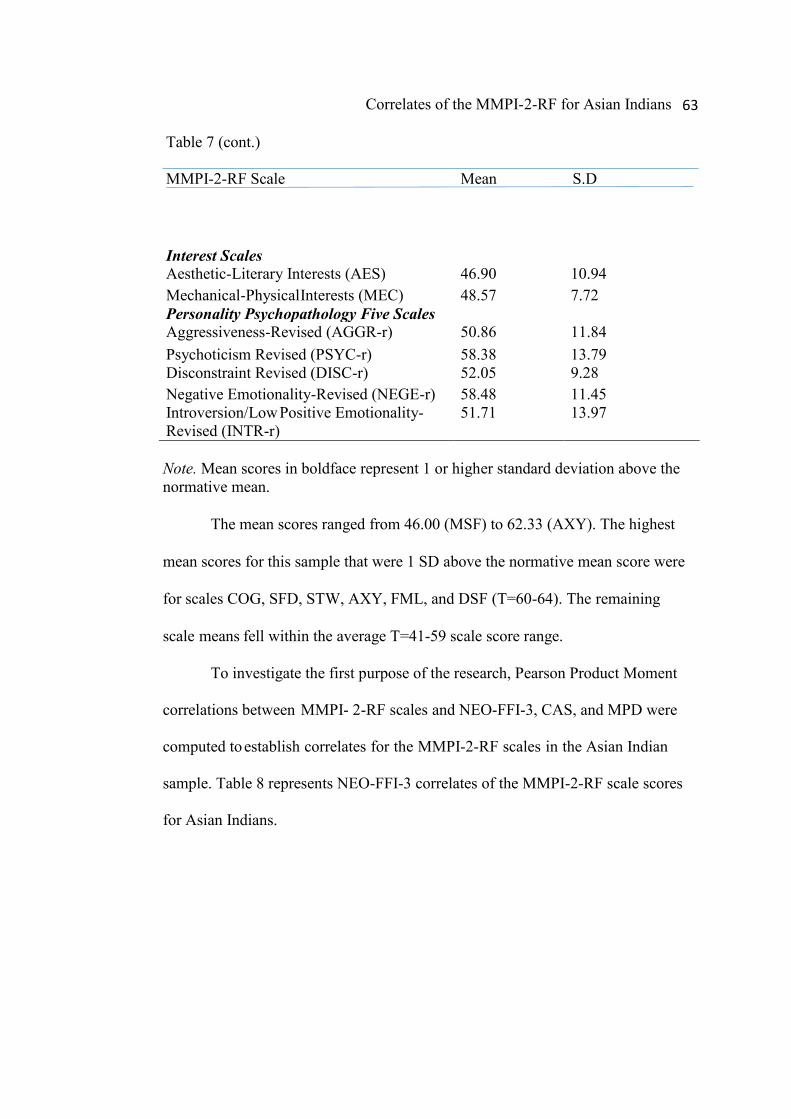
Correlates of the MMPI-2-RF for Asian Indians
63
Table 7 (cont.) MMPI-2-RF Scale
Mean S.D
Interest Scales Aesthetic-Literary Interests (AES) 46.90 10.94 Mechanical-Physical Interests (MEC) 48.57 7.72 Personality Psychopathology Five Scales Aggressiveness-Revised (AGGR-r) 50.86 11.84 Psychoticism Revised (PSYC-r) 58.38 13.79 Disconstraint Revised (DISC-r) 52.05 9.28 Negative Emotionality-Revised (NEGE-r) 58.48 11.45 Introversion/Low Positive Emotionality- Revised (INTR-r)
51.71 13.97
Note. Mean scores in boldface represent 1 or higher standard deviation above the normative mean.
The mean scores ranged from 46.00 (MSF) to 62.33 (AXY). The highest
mean scores for this sample that were 1 SD above the normative mean score were
for scales COG, SFD, STW, AXY, FML, and DSF (T=60-64). The remaining
scale means fell within the average T=41-59 scale score range.
To investigate the first purpose of the research, Pearson Product Moment
correlations between MMPI- 2-RF scales and NEO-FFI-3, CAS, and MPD were
computed to establish correlates for the MMPI-2-RF scales in the Asian Indian
sample. Table 8 represents NEO-FFI-3 correlates of the MMPI-2-RF scale scores
for Asian Indians.
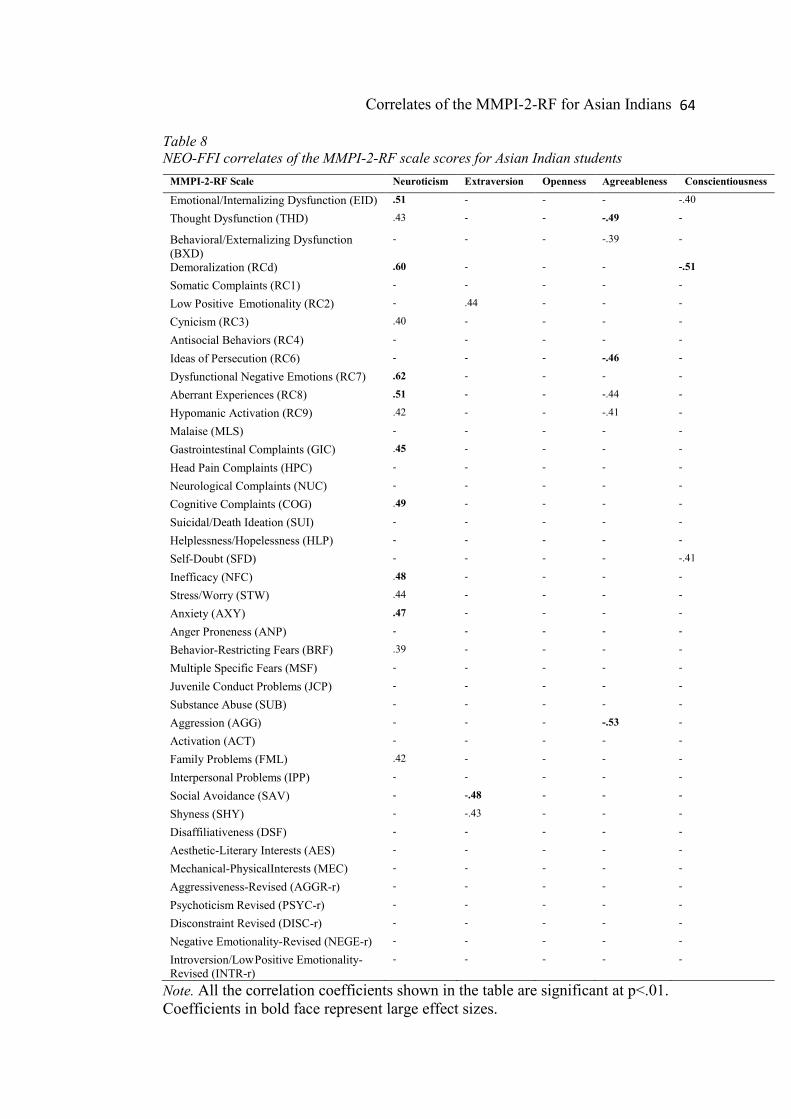
Correlates of the MMPI-2-RF for Asian Indians
64
Table 8 NEO-FFI correlates of the MMPI-2-RF scale scores for Asian Indian students
Note. All the correlation coefficients shown in the table are significant at p<.01. Coefficients in bold face represent large effect sizes.
MMPI-2-RF Scale Neuroticism Extraversion Openness Agreeableness Conscientiousness
Emotional/Internalizing Dysfunction (EID) .51 - - - -.40
Thought Dysfunction (THD) .43 - - -.49 -
Behavioral/Externalizing Dysfunction (BXD)
- - - -.39 -
Demoralization (RCd) .60 - - - -.51
Somatic Complaints (RC1) - - - - -
Low Positive Emotionality (RC2) - .44 - - -
Cynicism (RC3) .40 - - - -
Antisocial Behaviors (RC4) - - - - -
Ideas of Persecution (RC6) - - - -.46 -
Dysfunctional Negative Emotions (RC7) .62 - - - -
Aberrant Experiences (RC8) .51 - - -.44 -
Hypomanic Activation (RC9) .42 - - -.41 -
Malaise (MLS) - - - - -
Gastrointestinal Complaints (GIC) .45 - - - -
Head Pain Complaints (HPC) - - - - -
Neurological Complaints (NUC) - - - - -
Cognitive Complaints (COG) .49 - - - -
Suicidal/Death Ideation (SUI) - - - - -
Helplessness/Hopelessness (HLP) - - - - -
Self-Doubt (SFD) - - - - -.41
Inefficacy (NFC) .48 - - - -
Stress/Worry (STW) .44 - - - -
Anxiety (AXY) .47 - - - -
Anger Proneness (ANP) - - - - -
Behavior-Restricting Fears (BRF) .39 - - - -
Multiple Specific Fears (MSF) - - - - -
Juvenile Conduct Problems (JCP) - - - - -
Substance Abuse (SUB) - - - - -
Aggression (AGG) - - - -.53 -
Activation (ACT) - - - - -
Family Problems (FML) .42 - - - -
Interpersonal Problems (IPP) - - - - -
Social Avoidance (SAV) - -.48 - - -
Shyness (SHY) - -.43 - - -
Disaffiliativeness (DSF) - - - - -
Aesthetic-Literary Interests (AES) - - - - -
Mechanical-Physical Interests (MEC) - - - - -
Aggressiveness-Revised (AGGR-r) - - - - -
Psychoticism Revised (PSYC-r) - - - - -
Disconstraint Revised (DISC-r) - - - - -
Negative Emotionality-Revised (NEGE-r) - - - - -
Introversion/Low Positive Emotionality- Revised (INTR-r)
- - - - -
Correlates of the MMPI-2-RF for Asian Indians
65
Among the MMPI-2-RF scales with the highest number of correlates,
scale RCd was found to be positively correlated, with large effect sizes, with the
NEO-FFI-3 Neuroticism scale that assesses anxiety, depression, and vulnerability
to stress. It was inversely correlated with scale Conscientiousness that measures
competence, dutifulness, self-discipline and achievement striving. Scale RC7 was
consistently positively correlated with the NEO-FFI-3 Neuroticism scale.
Furthermore, scales EID, RC8, GIC, COG, AXY and NFC, also correlated
consistently with large size effects with the Neuroticism scale. Scale SAV that
assesses social avoidance was negatively correlated with scale Extraversion of the
NEO-FFI-3 which assesses warmth, gregariousness, activity and excitement
seeking. Interestingly, scales AGG and RC6 correlated inversely with scale
Agreeableness of the NEO-FFI-3 that measures trust, altruism, compliance,
modesty, and straightforwardness.
Table 9 represents CAS correlates of the MMPI-2-RF scale scores for
Asian Indians.
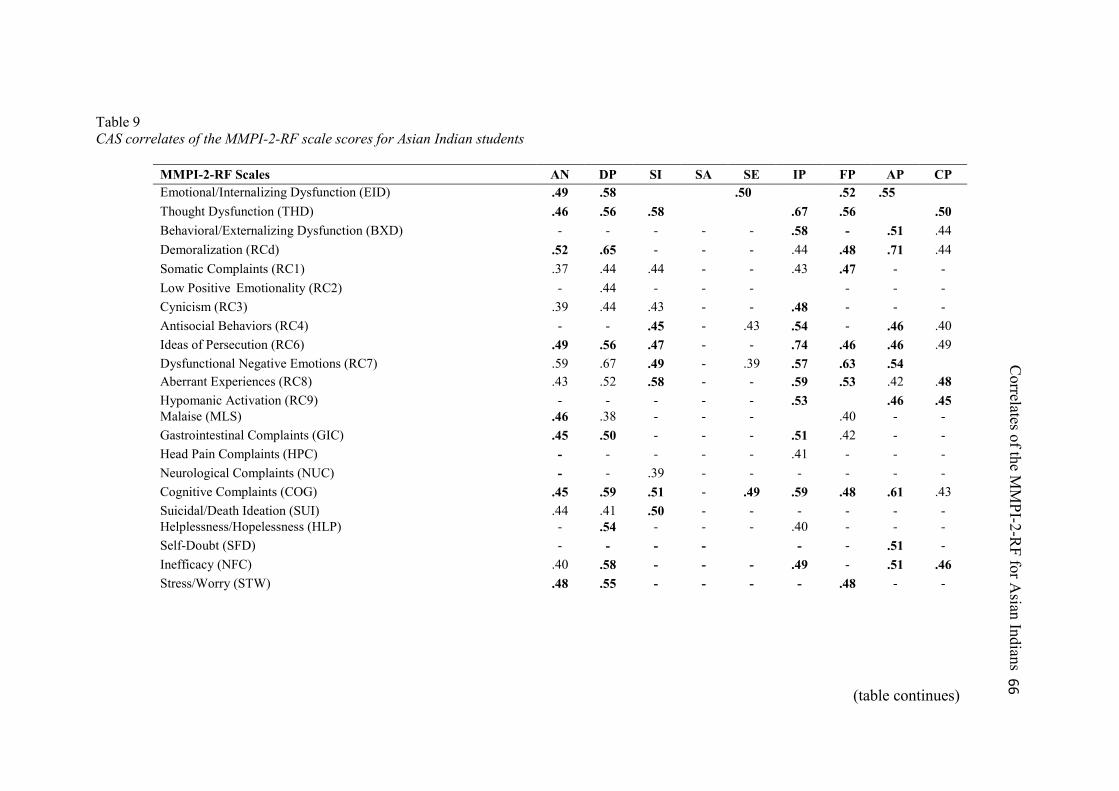
Table 9 CAS correlates of the MMPI-2-RF scale scores for Asian Indian students
MMPI-2-RF Scales AN DP SI SA SE IP FP AP CP Emotional/Internalizing Dysfunction (EID) .49 .58 .50 .52 .55 Thought Dysfunction (THD) .46 .56 .58 .67 .56 .50 Behavioral/Externalizing Dysfunction (BXD) - - - - - .58 - .51 .44 Demoralization (RCd) .52 .65 - - - .44 .48 .71 .44 Somatic Complaints (RC1) .37 .44 .44 - - .43 .47 - - Low Positive Emotionality (RC2) - .44 - - - - - - Cynicism (RC3) .39 .44 .43 - - .48 - - - Antisocial Behaviors (RC4) - - .45 - .43 .54 - .46 .40 Ideas of Persecution (RC6) .49 .56 .47 - - .74 .46 .46 .49 Dysfunctional Negative Emotions (RC7) .59 .67 .49 - .39 .57 .63 .54 Aberrant Experiences (RC8) .43 .52 .58 - - .59 .53 .42 .48 Hypomanic Activation (RC9) - - - - - .53 .46 .45 Malaise (MLS) .46 .38 - - - .40 - - Gastrointestinal Complaints (GIC) .45 .50 - - - .51 .42 - - Head Pain Complaints (HPC) - - - - - .41 - - - Neurological Complaints (NUC) - - .39 - - - - - - Cognitive Complaints (COG) .45 .59 .51 - .49 .59 .48 .61 .43 Suicidal/Death Ideation (SUI) .44 .41 .50 - - - - - - Helplessness/Hopelessness (HLP) - .54 - - - .40 - - - Self-Doubt (SFD) - - - - - - .51 - Inefficacy (NFC) .40 .58 - - - .49 - .51 .46 Stress/Worry (STW) .48 .55 - - - - .48 - -
(table continues)
Correlates of the M
MPI-2-R
F for Asian Indians 6
6
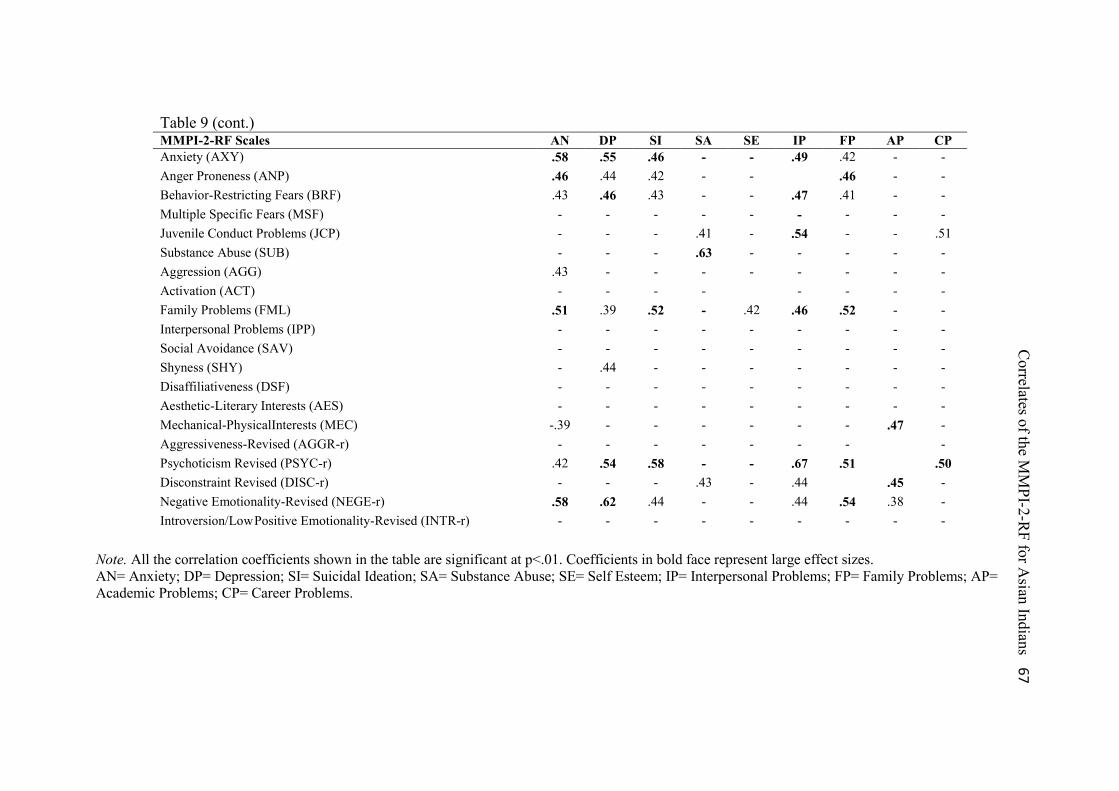
Note. All the correlation coefficients shown in the table are significant at p<.01. Coefficients in bold face represent large effect sizes. AN= Anxiety; DP= Depression; SI= Suicidal Ideation; SA= Substance Abuse; SE= Self Esteem; IP= Interpersonal Problems; FP= Family Problems; AP= Academic Problems; CP= Career Problems.
Table 9 (cont.) MMPI-2-RF Scales AN DP SI SA SE IP FP AP CP Anxiety (AXY) .58 .55 .46 - - .49 .42 - - Anger Proneness (ANP) .46 .44 .42 - - .46 - - Behavior-Restricting Fears (BRF) .43 .46 .43 - - .47 .41 - - Multiple Specific Fears (MSF) - - - - - - - - - Juvenile Conduct Problems (JCP) - - - .41 - .54 - - .51 Substance Abuse (SUB) - - - .63 - - - - - Aggression (AGG) .43 - - - - - - - - Activation (ACT) - - - - - - - - Family Problems (FML) .51 .39 .52 - .42 .46 .52 - - Interpersonal Problems (IPP) - - - - - - - - - Social Avoidance (SAV) - - - - - - - - - Shyness (SHY) - .44 - - - - - - - Disaffiliativeness (DSF) - - - - - - - - - Aesthetic-Literary Interests (AES) - - - - - - - - - Mechanical-Physical Interests (MEC) -.39 - - - - - - .47 - Aggressiveness-Revised (AGGR-r) - - - - - - - - Psychoticism Revised (PSYC-r) .42 .54 .58 - - .67 .51 .50 Disconstraint Revised (DISC-r) - - - .43 - .44 .45 - Negative Emotionality-Revised (NEGE-r) .58 .62 .44 - - .44 .54 .38 - Introversion/Low Positive Emotionality-Revised (INTR-r) - - - - - - - - -
Correlates of the M
MPI-2-R
F for Asian Indians 6
7
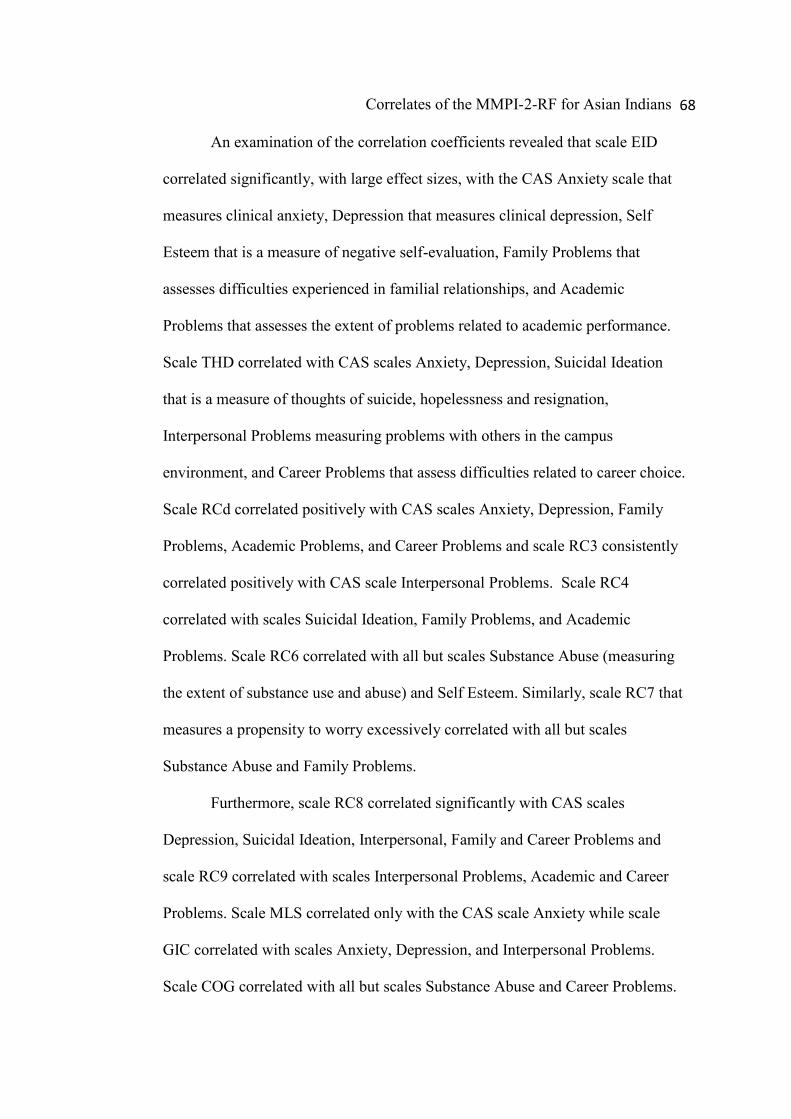
Correlates of the MMPI-2-RF for Asian Indians
68
An examination of the correlation coefficients revealed that scale EID
correlated significantly, with large effect sizes, with the CAS Anxiety scale that
measures clinical anxiety, Depression that measures clinical depression, Self
Esteem that is a measure of negative self-evaluation, Family Problems that
assesses difficulties experienced in familial relationships, and Academic
Problems that assesses the extent of problems related to academic performance.
Scale THD correlated with CAS scales Anxiety, Depression, Suicidal Ideation
that is a measure of thoughts of suicide, hopelessness and resignation,
Interpersonal Problems measuring problems with others in the campus
environment, and Career Problems that assess difficulties related to career choice.
Scale RCd correlated positively with CAS scales Anxiety, Depression, Family
Problems, Academic Problems, and Career Problems and scale RC3 consistently
correlated positively with CAS scale Interpersonal Problems. Scale RC4
correlated with scales Suicidal Ideation, Family Problems, and Academic
Problems. Scale RC6 correlated with all but scales Substance Abuse (measuring
the extent of substance use and abuse) and Self Esteem. Similarly, scale RC7 that
measures a propensity to worry excessively correlated with all but scales
Substance Abuse and Family Problems.
Furthermore, scale RC8 correlated significantly with CAS scales
Depression, Suicidal Ideation, Interpersonal, Family and Career Problems and
scale RC9 correlated with scales Interpersonal Problems, Academic and Career
Problems. Scale MLS correlated only with the CAS scale Anxiety while scale
GIC correlated with scales Anxiety, Depression, and Interpersonal Problems.
Scale COG correlated with all but scales Substance Abuse and Career Problems.
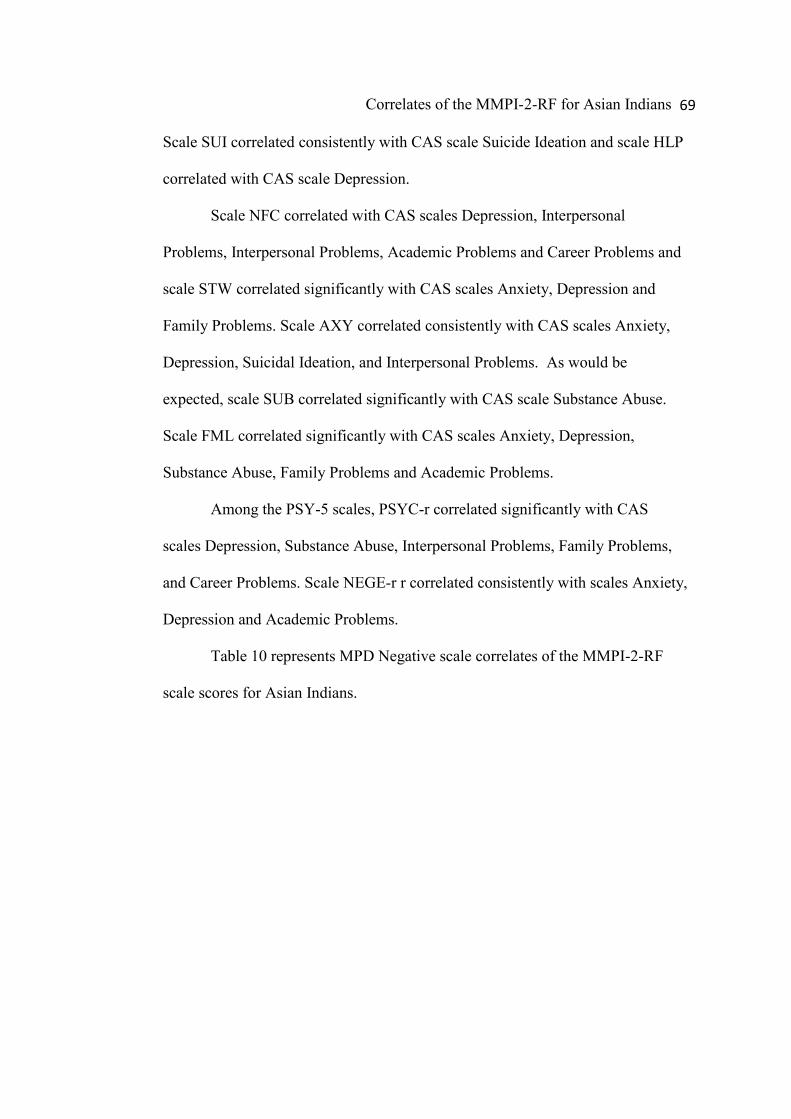
Correlates of the MMPI-2-RF for Asian Indians
69
Scale SUI correlated consistently with CAS scale Suicide Ideation and scale HLP
correlated with CAS scale Depression.
Scale NFC correlated with CAS scales Depression, Interpersonal
Problems, Interpersonal Problems, Academic Problems and Career Problems and
scale STW correlated significantly with CAS scales Anxiety, Depression and
Family Problems. Scale AXY correlated consistently with CAS scales Anxiety,
Depression, Suicidal Ideation, and Interpersonal Problems. As would be
expected, scale SUB correlated significantly with CAS scale Substance Abuse.
Scale FML correlated significantly with CAS scales Anxiety, Depression,
Substance Abuse, Family Problems and Academic Problems.
Among the PSY-5 scales, PSYC-r correlated significantly with CAS
scales Depression, Substance Abuse, Interpersonal Problems, Family Problems,
and Career Problems. Scale NEGE-r r correlated consistently with scales Anxiety,
Depression and Academic Problems.
Table 10 represents MPD Negative scale correlates of the MMPI-2-RF
scale scores for Asian Indians.
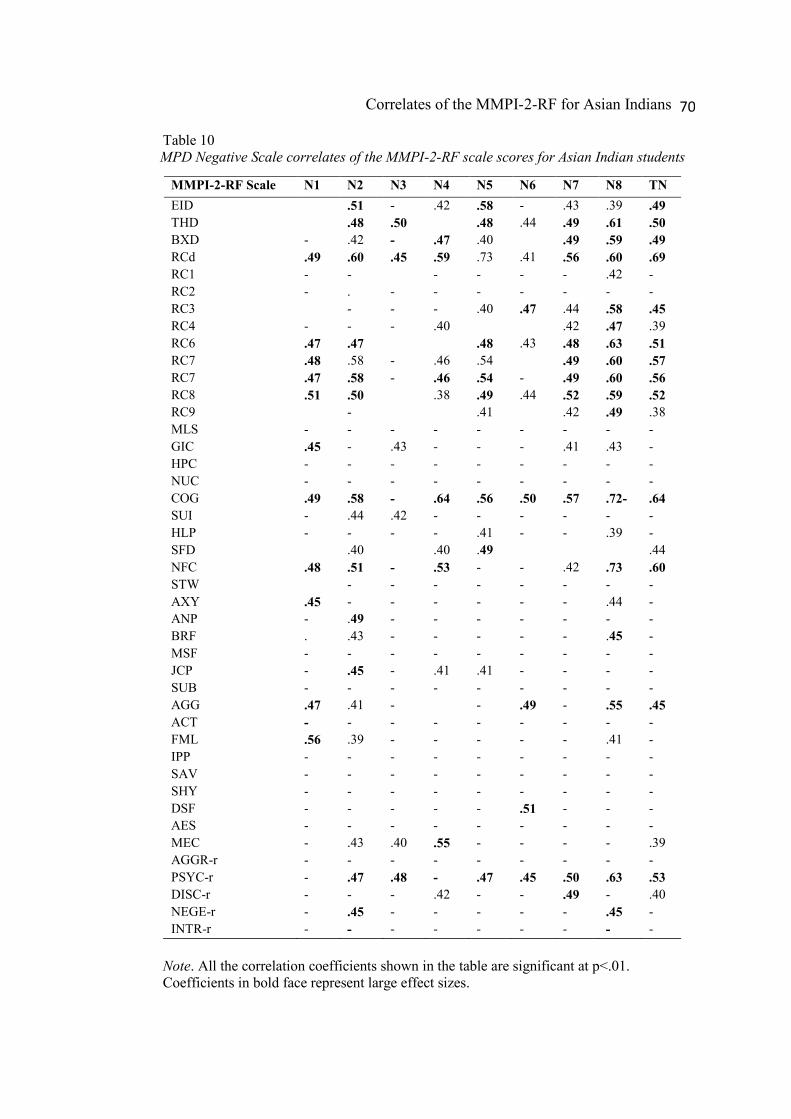
Correlates of the MMPI-2-RF for Asian Indians
70
Table 10 MPD Negative Scale correlates of the MMPI-2-RF scale scores for Asian Indian students
Note. All the correlation coefficients shown in the table are significant at p<.01. Coefficients in bold face represent large effect sizes.
MMPI-2-RF Scale N1 N2 N3 N4 N5 N6 N7 N8 TN EID .51 - .42 .58 - .43 .39 .49 THD .48 .50 .48 .44 .49 .61 .50 BXD - .42 - .47 .40 .49 .59 .49 RCd .49 .60 .45 .59 .73 .41 .56 .60 .69 RC1 - - - - - - .42 - RC2 - . - - - - - - - RC3 - - - .40 .47 .44 .58 .45 RC4 - - - .40 .42 .47 .39 RC6 .47 .47 .48 .43 .48 .63 .51 RC7 .48 .58 - .46 .54 .49 .60 .57 RC7 .47 .58 - .46 .54 - .49 .60 .56 RC8 .51 .50 .38 .49 .44 .52 .59 .52 RC9 - .41 .42 .49 .38 MLS - - - - - - - - - GIC .45 - .43 - - - .41 .43 - HPC - - - - - - - - - NUC - - - - - - - - - COG .49 .58 - .64 .56 .50 .57 .72- .64 SUI - .44 .42 - - - - - - HLP - - - - .41 - - .39 - SFD .40 .40 .49 .44 NFC .48 .51 - .53 - - .42 .73 .60 STW - - - - - - - - AXY .45 - - - - - - .44 - ANP - .49 - - - - - - - BRF . .43 - - - - - .45 - MSF - - - - - - - - - JCP - .45 - .41 .41 - - - - SUB - - - - - - - - - AGG .47 .41 - - .49 - .55 .45 ACT - - - - - - - - - FML .56 .39 - - - - - .41 - IPP - - - - - - - - - SAV - - - - - - - - - SHY - - - - - - - - - DSF - - - - - .51 - - - AES - - - - - - - - - MEC - .43 .40 .55 - - - - .39 AGGR-r - - - - - - - - - PSYC-r - .47 .48 - .47 .45 .50 .63 .53 DISC-r - - - .42 - - .49 - .40 NEGE-r - .45 - - - - - .45 - INTR-r - - - - - - - - -
Correlates of the MMPI-2-RF for Asian Indians
71
N1= Mistrust; N2=Shame and Doubt; N3= Guilt; N4= Inferiority; N5= Identity Confusion; N6= Isolation; N7- Stagnation; N8=Despair; TN= Total Negative.
A look at MMPI-2-RF scale score correlations with MPD Negative scales
indicated numerous correlations with large effect sizes. Scales RCd and RC7
correlated significantly with all but Isolation scale. Scale RC8 correlated with
Negative MPD scales Mistrust, Shame and Doubt, Inferiority, Identity Confusion,
Isolation, Stagnation, and Despair. Scale THD correlated with large effect sizes
with scales Shame and Doubt, Guilt, Inferiority, Identity Confusion, Isolation,
Stagnation, and Despair. Scale RC6 significantly correlated with scales Mistrust,
Shame and Doubt, Identity Confusion, Isolation, Stagnation, and Despair. Scale
BXD correlated significantly with 3 MPD Negative Scales namely Stagnation,
Despair and Total Positive. Scale RC9 only correlated significantly with MPD
scale Despair.
Furthermore, scale NFC correlated significantly with Mistrust, Shame and
Doubt, Inferiority, Stagnation, Despair and Total Negative. Scale PSYC-r
correlated with all but Mistrust and Inferiority. Scale MEC correlated with large
effect sizes with Shame and Doubt, Guilt, and Inferiority and JCP correlated
consistently with Shame and Doubt, Inferiority and Identity Confusion. Scale AGG
correlated with scales Mistrust, Shame and Doubt, Isolation, Despair, Total
Negative. Scale FML correlated with Mistrust, Shame and Doubt and Despair
while DSF only correlated with Isolation.
To address the second hypothesis, Multivariate Analyses of Variance
(MANOVAs) followed by univariate Analyses of Variance (ANOVAs) were
conducted to compare the mean MMPI-2-RF scores produced by Asian Indian and
Correlates of the MMPI-2-RF for Asian Indians
72
Caucasian Americans samples for the 14 of the selected MMPI-2-RF scales. The
MANOVA result was not significant (Wilks’ λ= .345, F(1, 67)=1.38, p<.01). The
small sample sizes likely contributed to the non-significance. Because the purpose
of the study was to determine differences between the two samples, univariate
analyses were examined. No significant univariate results were obtained at the
designated alpha level. However, a visual inspection of the MMPI-2-RD mean
scores for the 2 samples shown earlier in tables 3 and 7 revealed that the Asian
sample had relatively higher than normative means (1 SD or higher) on THD,
RC1, RC6, RC7, RC8, HPC, NUC, COG, AXY, BRF, SHY, and PSYC-r. The
Caucasian sample had relatively higher than normative means (1 SD but not
exceeding 1.5 SD) on COG, SFD, STW, AXY, FML and DSF.
Comparisons were also drawn for high and low acculturated Asian Indians.
Based on the median score of 519 on the ASAI for the current sample, participants
scoring lower than 519 were considered high on acculturation (n=26) and those
scoring higher than 519 were considered low on acculturation (n=22). Multivariate
Analyses of Variance (MANOVAs) followed by univariate Analyses of Variance
(ANOVAs) were conducted to compare the mean MMPI-2-RF scores produced
by Asian Indians separated by the two levels of acculturation. The MANOVA
result was not significant (Wilks’ λ= .222, F(1, 47)=.448, p<.01). It is likely that
overall significance was potentially impacted by the small sample size. Correlates
were also computed separately for high and low acculturated Asian Indians for
each external measure. Table 11 represents means and standard deviations of the
MMPI-2-RF scores for high and low acculturated Asian Indian sample. Tables 12,

Correlates of the MMPI-2-RF for Asian Indians
73
13 and 14 represent correlates of the MMPI-2-RF scale scores with external
measures based on acculturation levels.

Correlates of the MMPI-2-RF for Asian Indians
74
Table 11 MMPI-2-RF means and standard deviations for low and high acculturated Asian Indian students
MMPI-2-RF Scale Low Acculturation High Acculturation Mean SD Mean SD EID 58.73 9.40 54.65 8.67 THD 74.23 16.52 72.48 14.56 BXD 60.05 11.59 62.26 10.06 RCd 61.82 9.65 56.70 10.14 RC1 70.45 12.45 67.48 12.17 RC2 51.73 13.87 50.04 13.85 RC3 61.05 10.81 59.96 12.87 RC4 54.68 11.49 59.04 9.12 RC6 71.95 16.61 71.91 13.78 RC7 65.23 11.57 59.65 12.27 RC8 71.95 15.81 71.52 13.53 RC9 64.09 10.57 61.22 11.97 MLS 55.45 11.50 55.48 13.01 GIC 62.18 14.00 57.04 13.80 HPC 64.45 12.11 62.65 12.95 NUC 67.50 13.89 65.96 11.55 COG 67.18 14.24 66.35 12.11 SUI 51.91 14.56 58.91 19.94 HLP 63.45 11.73 54.09 11.78 SFD 55.18 11.84 51.52 9.63 NFC 58.41 9.85 55.09 10.02 STW 61.23 9.26 56.83 9.16 AXY 63.91 16.79 66.00 17.56 ANP 60.91 11.51 58.35 14.11 BRF 67.73 14.36 65.17 17.44 MSF 50.95 8.54 50.22 9.02 JCP 54.91 11.07 57.96 9.76 SUB 49.41 10.92 56.96 12.12 AGG 60.14 11.59 61.48 13.04 ACT 63.45 11.57 59.83 10.67 FML 59.09 8.54 61.43 10.67 IPP 47.27 11/07 46.87 11.17 SAV 52.00 10.92 52.30 11.84 SHY 49.82 11.59 49.52 6.68 DSF 61.27 11.57 63.04 15.06 AES 55.86 8.78 49.91 11.00 MEC 56.68 10.08 56.35 7.56 AGGR-r 56.36 9.69 57.57 10.17 PSYC-r 74.32 16.76 71.09 15.36 DISC-r 56.91 12.61 61.87 10.52 NEGE-r 63.95 10.43 59.26 10.69 INTR-r 48.86 14.12 49.91 13.84
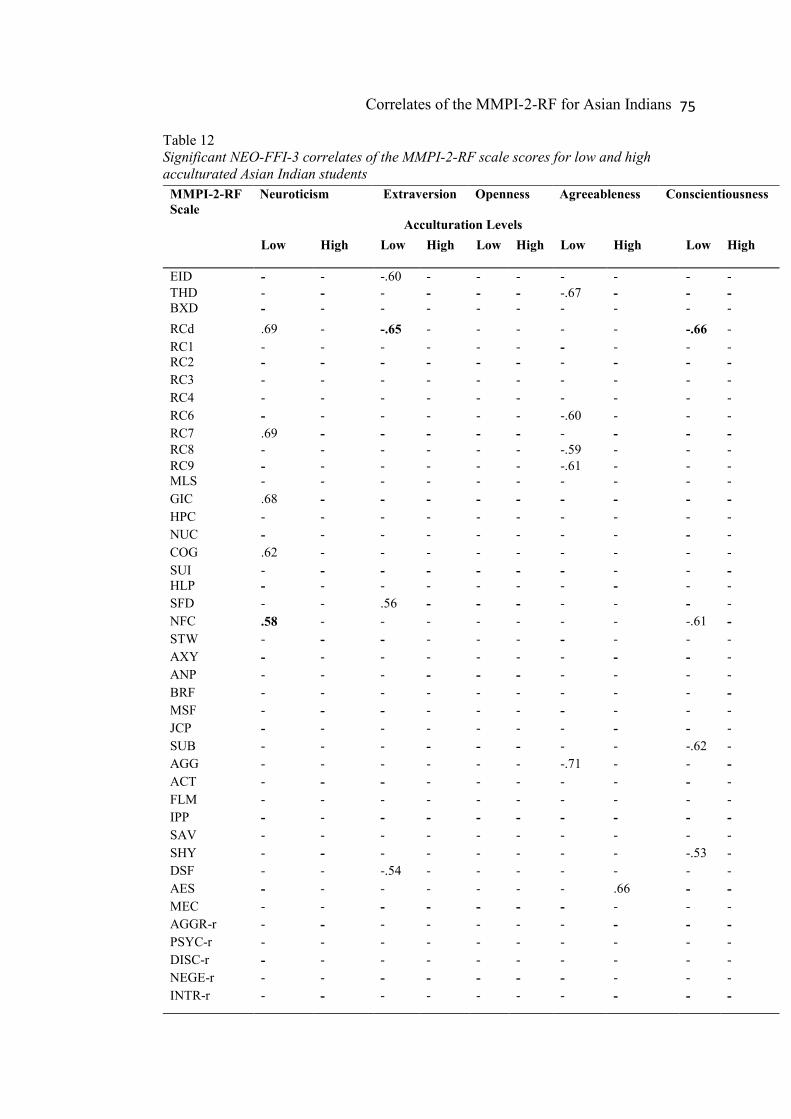
Correlates of the MMPI-2-RF for Asian Indians
75
Table 12 Significant NEO-FFI-3 correlates of the MMPI-2-RF scale scores for low and high acculturated Asian Indian students
MMPI-2-RF Scale
Neuroticism Extraversion Openness Agreeableness Conscientiousness
Acculturation Levels Low High Low High
Low High
Low High Low
High
EID - - -.60 - - - - - - - THD - - - - - - -.67 - - - BXD - - - - - - - - - - RCd .69 - -.65 - - - - - -.66 - RC1 - - - - - - - - - - RC2 - - - - - - - - - - RC3 - - - - - - - - - - RC4 - - - - - - - - - - RC6 - - - - - - -.60 - - - RC7 .69 - - - - - - - - - RC8 - - - - - - -.59 - - - RC9 - - - - - - -.61 - - - MLS - - - - - - - - - - GIC .68 - - - - - - - - - HPC - - - - - - - - - - NUC - - - - - - - - - - COG .62 - - - - - - - - - SUI - - - - - - - - - - HLP - - - - - - - - - - SFD - - .56 - - - - - - - NFC .58 - - - - - - - -.61 - STW - - - - - - - - - - AXY - - - - - - - - - - ANP - - - - - - - - - - BRF - - - - - - - - - - MSF - - - - - - - - - - JCP - - - - - - - - - - SUB - - - - - - - - -.62 - AGG - - - - - - -.71 - - - ACT - - - - - - - - - - FLM - - - - - - - - - - IPP - - - - - - - - - - SAV - - - - - - - - - - SHY - - - - - - - - -.53 - DSF - - -.54 - - - - - - - AES - - - - - - - .66 - - MEC - - - - - - - - - - AGGR-r - - - - - - - - - - PSYC-r - - - - - - - - - - DISC-r - - - - - - - - - - NEGE-r - - - - - - - - - - INTR-r - - - - - - - - - -
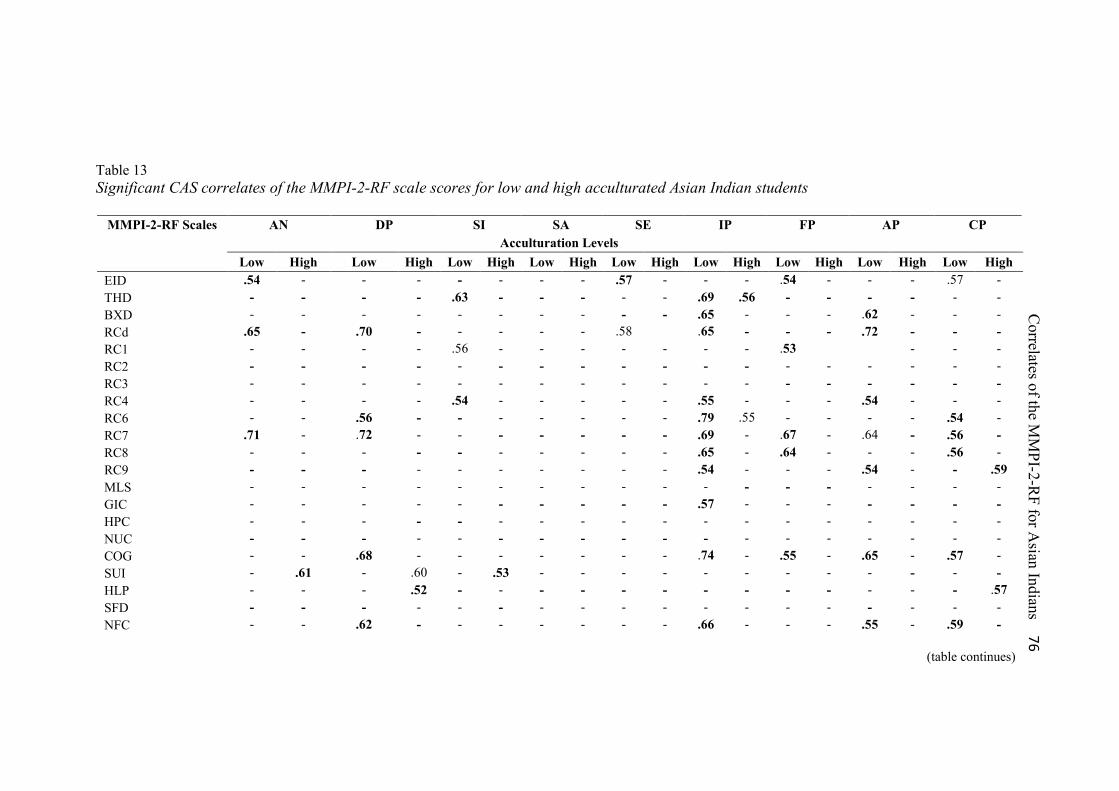
Table 13 Significant CAS correlates of the MMPI-2-RF scale scores for low and high acculturated Asian Indian students
MMPI-2-RF Scales AN DP SI SA SE IP FP AP CP Acculturation Levels
Low High Low High Low High Low High Low High Low High Low High Low High Low High EID .54 - - - - - - - .57 - - - .54 - - - .57 - THD - - - - .63 - - - - - .69 .56 - - - - - - BXD - - - - - - - - - - .65 - - - .62 - - - RCd .65 - .70 - - - - - .58 .65 - - - .72 - - - RC1 - - - - .56 - - - - - - - .53 - - - RC2 - - - - - - - - - - - - - - - - - - RC3 - - - - - - - - - - - - - - - - - - RC4 - - - - .54 - - - - - .55 - - - .54 - - - RC6 - - .56 - - - - - - - .79 .55 - - - - .54 - RC7 .71 - .72 - - - - - - - .69 - .67 - .64 - .56 - RC8 - - - - - - - - - - .65 - .64 - - - .56 - RC9 - - - - - - - - - - .54 - - - .54 - - .59 MLS - - - - - - - - - - - - - - - - - - GIC - - - - - - - - - - .57 - - - - - - - HPC - - - - - - - - - - - - - - - - - - NUC - - - - - - - - - - - - - - - - - - COG - - .68 - - - - - - - .74 - .55 - .65 - .57 - SUI - .61 - .60 - .53 - - - - - - - - - - - - HLP - - - .52 - - - - - - - - - - - - - .57 SFD - - - - - - - - - - - - - - - - - - NFC - - .62 - - - - - - - .66 - - - .55 - .59 -
(table continues)
Correlates of the M
MPI-2-R
F for Asian Indians
76
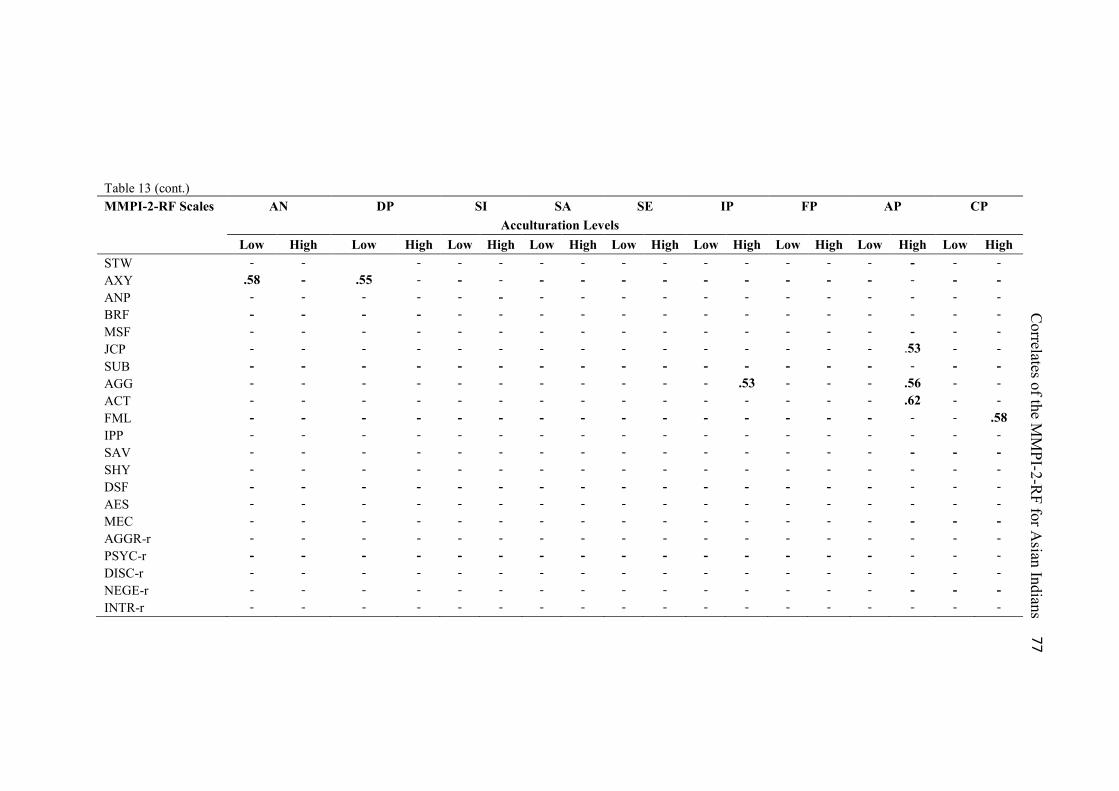
Table 13 (cont.) MMPI-2-RF Scales AN DP SI SA SE IP FP AP CP
Acculturation Levels Low High Low High Low High Low High Low High Low High Low High Low High Low High
STW - - - - - - - - - - - - - - - - - AXY .58 - .55 - - - - - - - - - - - - - - - ANP - - - - - - - - - - - - - - - - - - BRF - - - - - - - - - - - - - - - - - - MSF - - - - - - - - - - - - - - - - - - JCP - - - - - - - - - - - - - - - .53 - - SUB - - - - - - - - - - - - - - - - - - AGG - - - - - - - - - - - .53 - - - .56 - - ACT - - - - - - - - - - - - - - - .62 - - FML - - - - - - - - - - - - - - - - - .58 IPP - - - - - - - - - - - - - - - - - - SAV - - - - - - - - - - - - - - - - - - SHY - - - - - - - - - - - - - - - - - - DSF - - - - - - - - - - - - - - - - - - AES - - - - - - - - - - - - - - - - - - MEC - - - - - - - - - - - - - - - - - - AGGR-r - - - - - - - - - - - - - - - - - - PSYC-r - - - - - - - - - - - - - - - - - - DISC-r - - - - - - - - - - - - - - - - - - NEGE-r - - - - - - - - - - - - - - - - - - INTR-r - - - - - - - - - - - - - - - - - -
Correlates of the M
MPI-2-R
F for Asian Indians
77
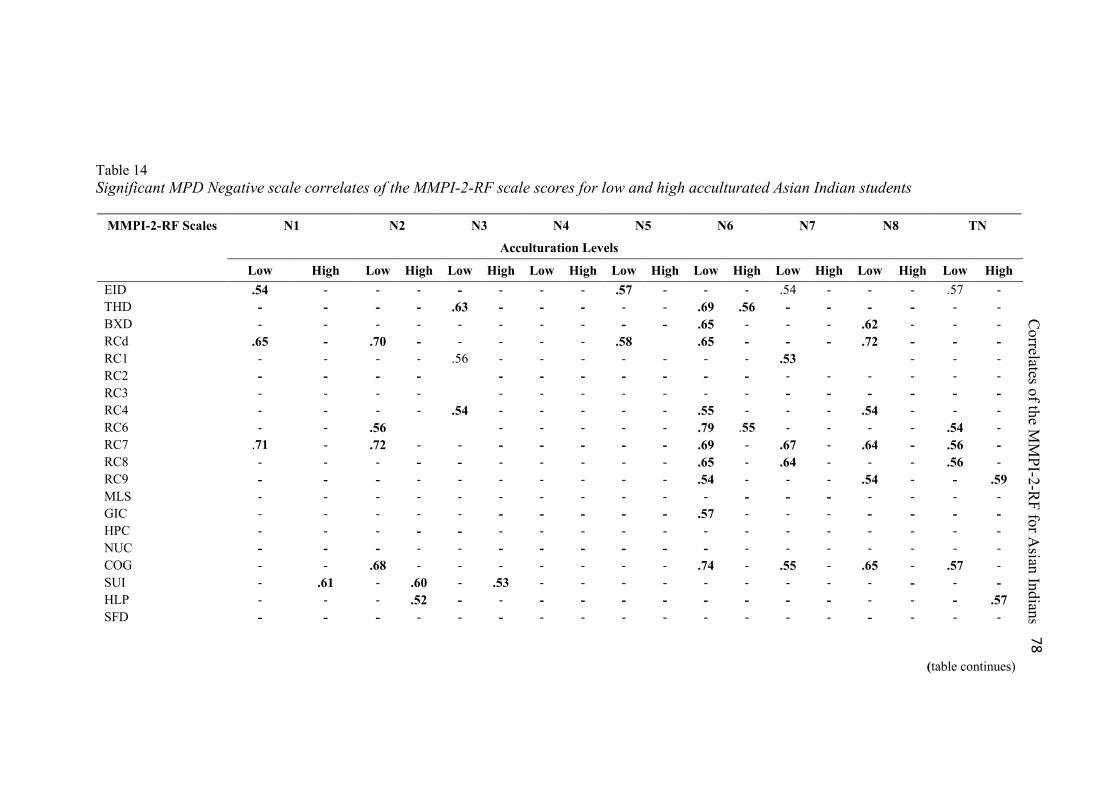
Table 14 Significant MPD Negative scale correlates of the MMPI-2-RF scale scores for low and high acculturated Asian Indian students
MMPI-2-RF Scales N1 N2 N3 N4 N5 N6 N7 N8 TN
Acculturation Levels
Low High Low High Low High Low High Low High Low High Low High Low High Low High EID .54 - - - - - - - .57 - - - .54 - - - .57 - THD - - - - .63 - - - - - .69 .56 - - - - - - BXD - - - - - - - - - - .65 - - - .62 - - - RCd .65 - .70 - - - - - .58 .65 - - - .72 - - - RC1 - - - - .56 - - - - - - - .53 - - - RC2 - - - - - - - - - - - - - - - - - RC3 - - - - - - - - - - - - - - - - - RC4 - - - - .54 - - - - - .55 - - - .54 - - - RC6 - - .56 - - - - - .79 .55 - - - - .54 - RC7 .71 - .72 - - - - - - - .69 - .67 - .64 - .56 - RC8 - - - - - - - - - - .65 - .64 - - - .56 - RC9 - - - - - - - - - - .54 - - - .54 - - .59 MLS - - - - - - - - - - - - - - - - - - GIC - - - - - - - - - - .57 - - - - - - - HPC - - - - - - - - - - - - - - - - - - NUC - - - - - - - - - - - - - - - - - - COG - - .68 - - - - - - - .74 - .55 - .65 - .57 - SUI - .61 - .60 - .53 - - - - - - - - - - - - HLP - - - .52 - - - - - - - - - - - - - .57 SFD - - - - - - - - - - - - - - - - - -
(table continues)
Correlates of the M
MPI-2-R
F for Asian Indians
78
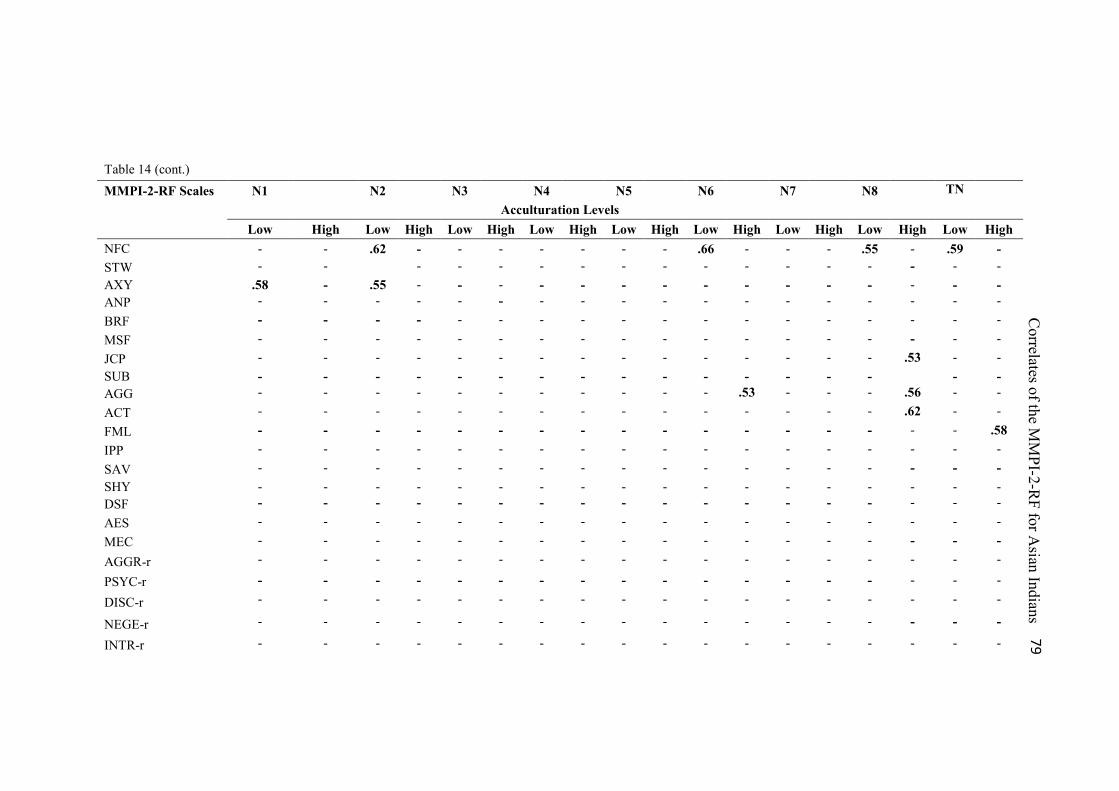
Table 14 (cont.) MMPI-2-RF Scales N1 N2 N3 N4 N5 N6 N7 N8 TN
Acculturation Levels Low High Low High Low High Low High Low High Low High Low High Low High Low High NFC - - .62 - - - - - - - .66 - - - .55 - .59 - STW - - - - - - - - - - - - - - - - - AXY .58 - .55 - - - - - - - - - - - - - - - ANP - - - - - - - - - - - - - - - - - - BRF - - - - - - - - - - - - - - - - - - MSF - - - - - - - - - - - - - - - - - - JCP - - - - - - - - - - - - - - - .53 - - SUB - - - - - - - - - - - - - - - - - AGG - - - - - - - - - - - .53 - - - .56 - - ACT - - - - - - - - - - - - - - - .62 - - FML - - - - - - - - - - - - - - - - - .58 IPP - - - - - - - - - - - - - - - - - - SAV - - - - - - - - - - - - - - - - - - SHY - - - - - - - - - - - - - - - - - - DSF - - - - - - - - - - - - - - - - - - AES - - - - - - - - - - - - - - - - - - MEC - - - - - - - - - - - - - - - - - - AGGR-r - - - - - - - - - - - - - - - - - -
PSYC-r - - - - - - - - - - - - - - - - - -
DISC-r - - - - - - - - - - - - - - - - - -
NEGE-r - - - - - - - - - - - - - - - - - -
INTR-r - - - - - - - - - - - - - - - - - -
Correlates of the M
MPI-2-R
F for Asian Indians
79
Correlates of the MMPI-2-RF for Asian Indians
80
A global inspection of the correlates for each subgroup revealed a higher
number of correlates for participants who were low on acculturation. More
specifically, RCd correlated with NEO-FFI-3 scales of Neuroticism and
Extraversion with coefficients of .69 and -.65 respectively for low acculturated
Asian Indians. No correlations were observed for this scale for those high on
acculturation. RC7, GIC, COG, and NFC correlated with large effect sizes for
scale Neuroticism with coefficients of .69, .68, .62, and .58 respectively. No such
trend was observed for the group considered high on acculturation.
An examination of correlations between MMPI-2-RF and CAS revealed
that scale EID correlated with CAS scales Anxiety, Self Esteem, and Family
Problems with coefficients of .54, .57, and .54 respectively for those low on
acculturation. No such trend manifested for the high acculturated group. Scale RCd
correlated with scales Anxiety, Depression, Self Esteem, Interpersonal Problems
and Academic Problems with coefficients of .65, .70, .58, .65, and .72 for the
group considered low acculturated. RC7 correlated with scales Anxiety,
Depression, Interpersonal Problems, Family Problems and Academic Problems
with coefficients of .71, .72, .69, .67, and .64 for the low acculturated group. Scale
COG also correlated with numerous CAS scale such as Depression, Interpersonal
Problems, Family Problems, Academic Problems and Career Problems with
coefficients of .68, .74, .55, .65 and .57. No such trend was observed for those high
on acculturation.
With regards to correlations between MMPI-2-RF and Negative scales of
MPD, among the scale with most number of correlates, RCd correlated with all the
negative scales for low acculturated Asian Indians while no such trend was
Correlates of the MMPI-2-RF for Asian Indians
81
observed for the ones high on acculturation. Scale RC7 correlated with Inferiority,
Identity Confusion, Stagnation, and Total Negative for those low on acculturation.
Scale COG correlated with large effect sizes with MPD scales Shame and Doubt,
Identity Confusion, Stagnation, Despair and Total Negative for low acculturated
Asian Indians. Scale BXD correlated with scales Shame &Doubt, Inferiority,
Despair, and Total Negative. No such trend was observed for those high on
acculturation.
Correlates of the MMPI-2-RF for Asian Indians
82
Discussion
The Asian Indian population has had a manifold increase in the United
States in the last two decades. A similar trend has been seen with the rising
numbers of the Asian Indian student population enrolled in undergraduate and
graduate courses in the United States. With an increase in these numbers, there is a
greater demand of psychological assessment, including the use of the MMPI
measures, because the number of these students seeking mental health services also
increases. International students bring with them cultural factors that may
influence their adaptation, acculturation, and coping with the challenges they face
in a new context. One difficulty that arises in using existing psychological
assessment measures is the use of American norms, which may differ considerably
from the normative Asian Indians patterns of thinking, feeling and behaving.
While culture-based research has been conducted for other ethnic groups, research
in this area is lagging behind for the Asian Indian population in the United States.
With the advent of the MMPI-2-RF, the cultural and diversity based literature is
being developed, and the current study was an attempt in the same direction.
The primary goal of this study was to develop accurate descriptions of
personality patterns of Asian Indian college students in order to improve the use of
this measure for the Asian Indian college population. For this purpose, correlates
were established using three external measures, namely, the College Adjustment
Scales, Measures of Psychosocial Development, and the NEO-Five Factor
Inventory-3. This study produced a large number of significant correlates of
MMPI-2-RF scores for Asian Indian students across the three external measures.
The number of correlations varied by scale, with multiple correlates found for
Correlates of the MMPI-2-RF for Asian Indians
83
scales EID, THD, BXD, RCd, RC6, RC8, COG, NFC, and PSYC-r. Relatively
fewer correlates were found for scales RC3, RC7, AXY, ANP, and NEGE-r.
Overall, the nature and direction of the correlates was consistent with measured
constructs. Magnitudes of these correlations fell largely within the range of .41-.74
and consisted of large effect sizes (r > .44) for most MMPI-2-RF scales. Given the
restriction in sample size and the large number of significant correlations
produced, a stringent significance level of p< .01 was chosen for interpretation to
achieve a balance between Type I and Type 2 errors.
For the broad constructs of emotions, cognitions and behaviors measured
by the Higher-Order scales, the external correlates for each of these scales found
were in the expected direction. However, in addition to the emotional distress
measured by EID, scales THD and BXD also correlated with measures of general
distress. Most RC scales with the exception of RC1 and RC2, correlated with a
large number of scales on the external measures that assess interpersonal problems,
followed by academic and family problems.
Among the PSY-5 scales, scales PSYC-r and NEGE-r correlated with
external scales that expanded the constructs of these scales to include depression,
family and interpersonal problems, and feelings of doubt, guilt, inferiority,
isolation and absence of long-term purpose. AGGR-r, and INTR-r surprisingly had
no correlations with the external measures.
For correlates to be meaningful, they must be relevant, appropriate, and
distinctive in order to be a clear extension of the measured construct. Appendix A
outlines the expanded descriptors based on the correlates generated in this study.
The first column presents the original descriptors of the MMPI-2-RF scale and the
Correlates of the MMPI-2-RF for Asian Indians
84
second column provides the expanded descriptors based on the correlations with
the external measures. There were some descriptors that provided a verification of
the core constructs measured by the MMPI-2-RF. For example, scale SUI
correlated congruently with the CAS scale Suicidal Ideation that measures the
extent of thoughts of suicide. With regard to uniqueness and extension, the
correlates for scale NFC are a good illustration as they extend the core construct
measured by NFC to capture a number of new descriptors so as to broaden the core
construct into a larger area of malfunctioning. Specifically, the new descriptors
identify that the scale measures difficulty in integrating a central identity,
misdirected energies and loss of opportunities, despair about life, worry about
career and major choices, feelings of incapability, and passivity. Furthermore,
although the correlates of scale SUB were fewer in number, they broadened the
scale’s measurements into areas reflecting emotional difficulties and decline in
functioning associated with a history of drug and alcohol use. Similarly, the
correlates of scale SAV extended the construct from social avoidance to being
quiet and nonassertive.
Overall, the significant correlates expanded the descriptors associated with
the constructs measured by the MMPI-2-RF. However, there was a considerable
overlap in the new correlate descriptors across the MMPI-2-RF scales, which can
be attributed to two potential factors. First, although the common variance of
demoralization was removed from MMPI-2-RF RC scales and placed in the RCd
scale, a broad measure of psychopathology like the MMPI-2-RF still contains
generalized distress and disorder components across its range of scales, such as
Internalizing and Externalizing scales, Interpersonal and PSY-5 scales. Second, the
Correlates of the MMPI-2-RF for Asian Indians
85
external measures used for this study also assess a broad array of maladjustment
constructs, thereby resulting in overlap of descriptors. Overall, such overlapping
associations are not entirely unexpected. However, they do not provide a very
discriminating picture in many instances.
The second purpose of the study attempted to compare the mean MMPI-2-
RF scores of Asian Americans and Caucasian Americans. It was expected that
Asian Indians would score differently than the Caucasian American sample
because of cultural and ethnic influence but the results were non-significant. As
noted earlier, the largest contributing factor for the non-significance was the small
sample size, particularly for the Caucasian American subsample. The non-
significance can also be attributed to the effects of globalization and dissolving
boundaries across cultures due to development in media and information
technology that increases access to information, opportunities, and experiences
outside one’s own cultural context. A comparison of mean scores for the two
samples for the chosen scales reveals Asian Indians scored 5 or more T-score
points higher than the Caucasian American sample for scales NUC and COG,
although not statistically significant. This is consistent with existing research on
Asians that suggests they are inclined to exhibit psychological disturbances though
somatization tendencies and that emotional disturbances are often manifested
through aches and pains (e.g., Min & Lee, 1989). Furthermore, the Asian Indian
sample scored six T-score points (ie., approximately one-half SD) higher than the
Caucasian American sample for scale SFD, indicating relative lack of self-
confidence. While these higher means can be attributed to stress that accompanies
adjustment to college, it also likely points to the stress confounded by cultural

Correlates of the MMPI-2-RF for Asian Indians
86
adjustment. Moving to a new country brings with itself novel experiences and a
lack of knowledge about normative behaviors. It is not surprising that the need to
feel accepted and to be viewed as worthy can result in low self-confidence.
As a final goal, correlates with the three external measures were also
computed separately for the two acculturation-based sub-groups of Asian Indian
students. There were higher number of correlates consistently across the three
measures for those low on acculturation, particularly for scales that measure
emotional, cognitive and behavioral difficulties, general subjective distress, fears,
anxieties, lack of trusting relationships, unusual thoughts, problems with
concentration, and gastrointestinal problems. More specifically, the three Higher-
Order scales had a higher number of correlates for those low on acculturation,
indicating that not being well acculturated can amount to higher level of distress
that has broad ranging impact on thinking, feeling and behaviors. The higher
number of correlates for scales RC6, RC7, and RC8 for the low acculturated Asian
Indian students likely reflects a tendency towards suspiciousness, mistrust and
being wary and cautious, which is realistic in a novel environment where
meaningful relationships are not yet formed. This is commensurate with the
dissertation findings by Bhasin (2014), which suggested that acculturative stress
likely manifests as fear of being judged or perceived negatively, and possibly also
due to fear of racism and discrimination. Correlations for the high acculturated
group were relatively limited, indicating high acculturation is reflective of better
adjustment and thus is a protective factor and acts as a buffer against distress and
disturbance.
Correlates of the MMPI-2-RF for Asian Indians
87
Limitations
Although this study provides some useful information to expand the
interpretation of MMPI-2-RF scales for the Asian Indian college students, it was
markedly limited by the size of the Asian Indian sample. The small sample size
reduced statistical power for the analyses, which increased the likelihood of Type I
error, and therefore, could have obscured some noteworthy and useful findings. It
also limits the generalizability of the findings to the Asian Indian student
population in the United States. Additionally, the limitations in sample size
prevented examination of gender-related differences in MMPI-2-RF correlates for
the Asian Indian student sample in this study. Furthermore, differences in the size
of the two ethnic subsamples was a barrier in fully discovering noteworthy
differences and similarities between them.
Contributions
Despite the limitations of the current study, it offers some noteworthy
contributions. There is currently no published study on any version of the MMPI
using cultural identity as a variable for Asian Indians residing in the United States.
Moreover, with the relatively recent publication of the MMPI-2-RF, there is a need
to identify diversity-sensitive score patterns for Asian Indians. The current study is
a step in the direction of filling the gap in this kind of research, which will further
strengthen interpretation on personality patterns of Asian Indian college students
using the MMPI-2-RF. In that regard, the study also uniquely expands the culture-
specific literature for the newest form of the MMPI. The findings from this study
will hopefully instigate more research of this nature for the MMPI-2-RF for the
future.
Correlates of the MMPI-2-RF for Asian Indians
88
Future Directions and Recommendations
This study provided a useful launching point for future research. The
current dissertation’s review of prior literature referenced two doctoral
dissertations using the MMPI-2-RF for the Asian Indian population. Collectively,
the three dissertations might provide impetus for the incorporation of acculturation
indices in the MMPI-2-RF, which will be of great relevance to the ever increasing
Asian Indian population in the United States. Although the tradition in personality
assessment measures has typically been to provide standard personality descriptors
regardless of ethnicity, gender and other diversity factors, increasing consideration
needs be given to diversity-based expressions of psychopathology and the ways in
which they manifest in MMPI-2-RF profiles.
Correlates of the MMPI-2-RF for Asian Indians
89
References
Ahmed, S.M., & Lemkau, J.P. (2000). Cultural issues in the primary care of South
Asians. Journal of Immigrant Health, 2(2), 89-96. doi:
10.1023/A:1009585918590
American Psychiatric Association. (2000). Diagnostic and statistical manual of
mental disorders (4th ed., text rev.). Washington, DC: American
Psychiatric Association.
Anton, W. D., & Reed, J. R. (1991). College adjustment scales: Professional
manual. Odessa, FL: Psychological Assessment Resources.
Ashton, M. C., & Lee, K. (2005). The lexical approach to the study of personality
structure: Toward the identification of cross-culturally replicable
dimensions of personality variation. Journal of Personality Disorders, 19,
303–308.
Avdeyeva, T. V., Tellegen, A., & Ben-Porath, Y. (2012). Empirical correlates of
low scores on MMPI-2/MMPI-2-RF restructured clinical scales in a sample
of university students. Assessment, 19(3), 388-393.
Benedict, R. (1934). Patterns of culture. Boston: Houghton Mifflin.
Benet-Martínez, V., & Oishi, S. (2008). Culture and personality. Handbook of
personality: Theory and research, 542-567.
Bureau, U.S. (2010). 2010 Census Data. Retrieved July 29, 2015, from
www.census.gov: http://www.census.gov/2010census/data/
Bernreuter, R. G. (1931). The Personality Inventory. Palo Alto, CA: Consulting
Psychologists Press.
Correlates of the MMPI-2-RF for Asian Indians
90
Berry, J. W., Poortinga, Y. H., Segall, M. H., & Dasen, P. R. (2002). Cross-
cultural Psychology: Research and applications (2nd ed.). New York, NY:
Cambridge University Press.
Bhandari, A., & Upmanyu, V. V. (2003). Nature of depression in Indian male
adolescents as measured by popular self-report instruments. Journal of
Personality and Clinical Studies, 19(1), 1-6. Chicago.
Bhasin, G. K. (2014). Utilizing the MMPI-2-RF with Asian Indians: The effect of
acculturation (Order No. 3668334). Available from ProQuest Dissertations
& Theses Full Text; ProQuest Dissertations & Theses Global.
(1648176337). Retrieved from
http://search.proquest.com/docview/1648176337?accountid=27313
Bond, M. H. (2000). Localizing the imperial outreach. American Behavioral
Scientist, 44, 63-72.
Botwin, M. D. (1995). Review of the revised NEO Personality Inventory. The
Twelfth Mental Measurements Yearbook, 862-863.
Butcher, J. N. (1996). International adaptations of the MMPI-2: Research and
clinical applications. University of Minnesota Press.
Butcher, J. N. (2010). Personality assessment from the nineteenth to the early
twenty-first century: Past achievements and contemporary challenges.
Annual Review of Clinical Psychology, 6, 1-20.
Correlates of the MMPI-2-RF for Asian Indians
91
Butcher, J. N., & Han, K. (1995). Development of an MMPI-2 scale to assess the
presentation of self in a superlative manner: The S Scale. In J.N. Butcher &
C.D. Spielberger (Eds.), Advances in personality measurement (Vol. 10, pp.
25-50). Hillsdale, NJ: Lawrence Erlbaum Associates.
Butcher, J. N., Bubany, S., & Mason, S. N. (2013). Assessment of personality and
psychopathology with self-report inventories. APA handbook of testing and
assessment in psychology, vol. 2: Testing and assessment in clinical and
counseling psychology. (pp. 171-192) American Psychological Association.
doi:http://dx.doi.org/10.1037/14048-011
Butcher, J. N., Cheung, F. M., & Lim, J. (2003). Use of the MMPI-2 with Asian
populations. Psychological Assessment, 15(3), 248-256.
doi:http://dx.doi.org/10.1037/1040-3590.15.3.248
Butcher, J. N., Dalhstrom, W. G., Graham, J. R., Tellegen, A., & Kaemmer, B.
(1989). Minnesota Multiphasic Personality Inventory (MMPI-2): Manual
for administration and scoring. Minneapolis: University of Minnesota
Press.
Butcher, J. N., Graham, J. R., Williams, C. L., & Ben-Porath, Y. S. (1990).
Development and use of the MMPI-2 Content Scales. University of
Minnesota Press.
Benet-Martínez, V., & Oishi, S. (2008). Culture and personality. Handbook of
personality: theory and research, 542-567.
Butcher, J. N. (1989). Minnesota multiphasic personality inventory. Corsini
Encyclopedia of Psychology. John Wiley & Sons.
Correlates of the MMPI-2-RF for Asian Indians
92
Butcher, J. N., Cheung, F. M., & Lim, J. (2003). Use of the MMPI-2 with Asian
populations. Psychological Assessment, 15(3), 248-256.
doi:http://dx.doi.org/10.1037/1040-3590.15.3.248
Canul, G. D., & Cross, H. J. (1994). The influence of acculturation and racial
identity attitudes on Mexican‐Americans' MMPI‐2 performance. Journal of
Clinical Psychology, 50(5), 736-745.
Caruso, J. C. (2000). Reliability generalization of the NEO personality scales.
Educational and Psychological Measurement, 60(2), 236-254.
Caspi, A., Harrington, H., Milne, B., Amell, J. W., Theodore, R. F., & Moffitt, T.
E. (2003). Children’s behavioral styles at age 3 are linked to their adult
personality traits at age 26. Journal of Personality, 71(4), 495-514.
Castro, Y., Gordon, K. H., Brown, J. S., Anestis, J. C., Joiner, T. E. (2008).
Examination of racial differences on the MMPI-2 clinical and restructured
clinical scales in an outpatient sample. Assessment, 15(3), 277-286. doi:
10.1177/1073191107312735
Cattell, R. B. (1946). Description and measurement of personality. Yonkerson-
Hudson, NY: World Book Company.
Cheung, F. M. (1995). Administration manual of the Minnesota Multiphasic
Personality Inventory (MMPI) Chinese edition. Hong Kong: The Chinese
University Press.
Correlates of the MMPI-2-RF for Asian Indians
93
Cheung, F. M., Song, W. Z., & Zhang, J. X. (1996). The Chinese MMPI–2:
Research and applications in Hong Kong and the People’s Republic of
China. In J. N. Butcher (Ed.), International adaptations of the MMPI–2: A
handbook of research and applications (pp. 137–161). Minneapolis:
University of Minnesota Press.
Cheung, F. M., Vijver, F.J., & Leong, F. T. L. (2011). Toward a new approach to
the study of personality in culture. American Psychologist, 66(7), 593-603.
Christie, R., & Geis, F. L. (1970). Studies in Machiavellianism. New York:
Academic.
Church, A.T. (2000). Culture and personality: Toward an integrated cultural trait
psychology. Journal of Personality, 68, 651-703.
Costa Jr., P. T., & McCrae, R. R. (1995). Domains and facets: Hierarchical
personality assessment using the Revised NEO Personality Inventory.
Journal of Personality Assessment, 64(1), 21-50.
Costa, P. T., & McCrae, R. R. (1992). Professional manual for the NEO PI-R and
NEO-FFI. Odessa, FL: Psychological Assessment Resources.
Costa, P. T., Herbst, J. H., McCrae, R. R., & Siegler, I. C. (2000). Personality at
midlife: Stability, intrinsic maturation, and response to life events.
Assessment, 7(4), 365-378.
Derogatis, L. R., Rickels, K., & Rock, A. F. (1976). The SCL-90 and the MMPI: a
step in the validation of a new self-report scale. The British Journal of
Psychiatry, 128(3), 280-289.
Drake, L. E. (1956). Interpretations of MMPI profiles in counseling male clients.
Journal of Counseling Psychology, 3, 83-88.
Correlates of the MMPI-2-RF for Asian Indians
94
DuAlba, L., & Scott, R. L. (1993). Somatization and malingering for workers'
compensation applicants: A cross‐cultural MMPI study. Journal of Clinical
Psychology, 49(6), 913-917.
Eckblad, M. L., & Chapman, L. J. (1983). Magical ideation as an indicator of
schizotypy. Journal of Consulting and Clinical Psychology, 51, 215–225.
Escobar, J. I. (1987). Somatization in the community. Archives of General
Psychiatry, 44(8), 713-718.
Forbey, J. D., & Ben-Porath, Y. (2008). Empirical correlates of the MMPI-2
Restructured Clinical (RC) scales in a nonclinical setting. Journal of
Personality Assessment, 90(2), 136-141.
doi:http://dx.doi.org/10.1080/00223890701845161
Forbey, J. D., Lee, T.T.C., & Handel, R.W. (2010). Correlates of the MMPI-2-RF
in a college setting. Psychological Assessment, 22, 737-744.
Friedman, A. F., Lewak, R., Nichols, D. S., & Webb, J. T. (2001). Psychological
assessment with the MMPI-2. Mahwah, NJ: Lawrence Erlbaum
Associates, Inc.
Gervais, R. O., Ben-Porath, Y. S., Wygant, D. B., & Green, P. (2007).
Development and validation of a Response Bias Scale (RBS) for the
MMPI-2. Assessment, 14(2), 196-208.
Graham, J. R., Ben-Porath, Y. S., & McNulty, J. L. (1999). MMPI–2 correlates for
outpatient mental health settings. Minneapolis: University of Minnesota
Press.
Graham, J.R. (2012). MMPI-2 Assessing Personality and Psychopathology. New
York: Oxford University Press.
Correlates of the MMPI-2-RF for Asian Indians
95
Greene, R. L. (2012). The MMPI-2/ MMPI-2-R: An interpretative manual. Boston,
MA: Pearson Education.
Grier, W., & Cobbs, P. (1968). Black rage. New York: Bantam Books.
Hall, C. S., & Lindzey, G. (1957). Theories of personality. John Wiley & Sons,
Inc.
Hall, G. C. N., Bansal, A., & Lopez, I. R. (1999). Ethnicity and psychopathology:
A meta-analytic review of 31 years of comparative MMPI/MMPI-2
research. Psychological Assessment, 11(2), 186.
Han, K. (1996). The Korean MMPI–2. In J. N. Butcher (Ed.), International
adaptations of the MMPI–2: A handbook of research and clinical
applications (pp. 88 –136). Minneapolis: University of Minnesota Press.
Harkness, A.R., McNulty, J.L., Ben-Porath, Y.S. (1995). The Personality
Psychopathology Five (PSY-5): Constructs and MMPI-2 scales.
Psychological Assessment, 7(1), 104.
Harris R. E., & Lingoes, J. C. (1955). Subscales for the Minnesota Multiphasic
Personality Inventory. Mimeographed materials, The Langley Porter
Clinic.
Hathaway, S. R., & McKinley, J. C. (1943). The Minnesota Multiphasic
Personality Inventory Manual. Minneapolis: University of Minnesota
Press.
Hawley, G. A. (1988). MPD, Measures of Psychosocial Development:
Professional Manual. Psychological Assessment Resources, Incorporated.

Correlates of the MMPI-2-RF for Asian Indians
96
Helms, J. E., & Parham, T. A. (1996). The Racial Identity Attitude Scale. In R. L.
Jones (Ed.), Handbook of tests and measurements for Black populations
(Vol. 2, pp. 167–174). Hampton, VA: Cobb & Henry.
Heymans, G., & Wiersma, E. (1906). Beitrage zur speziellen Psychologie auf
Grund einer Massenunterschung [Special contributions to psychology from
a large-scale investigation]. Zeitschrift fur Psychologie mit Zeitschrift fur
Angewandte Psychologie, 43, 81–127.
Humm, D. G., & Wadsworth, G. W., Jr. (1934). The Humm–Wadsworth
Temperament Scale: Preliminary report. Personnel Journal, 12, 314–323.
Jackson, D. (1970). A sequential system for personality scale development. In C.
D. Spielberger (Ed.), Current topics in clinical and community psychology,
12, 61–96. New York, NY: Academic Press.
Khanna, A., McDowell, T., Perumbilly, S., & Titus, G. (2009). Working with
Asian Indian American families: A Delphi study. Journal of Systemic
Therapies, 28, 52–71.
Kolody, B., Vega, W., Meinhardt, K., & Bensussen, G. (1986). The
correspondence of health complaints and depressive symptoms among
Anglos and Mexican-Americans. The Journal of Nervous and Mental
Disease, 174(4), 221-228.
Kwan, K. L. K. (1999). MMPI and MMPI-2 performance of the Chinese: Cross-
cultural applicability. Professional Psychology: Research and Practice,
30(3), 260.
Kwan, V.S.Y., Herrmann, S.D. (2015). The Interplay Between Culture and
Personality. Personality Processes and Individual Differences, 4, 553-574
Correlates of the MMPI-2-RF for Asian Indians
97
Lees-Haley, P. R., English, L. T., & Glenn, W. J. (1991). A fake bad scale on the
MMPI-2 for personal injury claimants. Psychological Reports, 68(1), 203-
210.
Lucio, E., Ampudia, A., Durán, C., León, Ivonne., & Butcher, J. N. (2001).
Comparison of the Mexican and American norms of the MMPI-2. Journal
of Clinical Psychology, 57(12), 1459-1468. doi: 10.1002/jclp.1109
Manerikar, V., & Patil, V. (1972). An analysis of results of tests used for selection
of candidates for Master's degree in management studies course. Indian
Journal of Applied Psychology, 9(1), 47-49.
Marks, I. M., & Mathews, A. M. (1979). Brief standard self-rating for phobic
patients. Behavior Research and Therapy, 17(3), 263-267.
Markus, H. R., & Kitayama, S. (1991). Culture and the self: Implications for
cognition, emotion, and motivation. Psychological Review, 98, 224-253.
Markus, H. R., & Kitayama, S. (1998). The cultural psychology of personality.
Journal of Cross-Cultural Psychology, 29, 63–87.
Martin W. E., & Starr, E. R. (1996). Review of the measure College Adjustment
Scales. Mental Measurements Yearbook, 13, 274-275.
Masuda, A., & Boone, M. S. (2011). Mental health stigma, self-concealment, and
help-seeking attitudes among Asian American and European American
college students with no help-seeking experience. International Journal for
the Advancement of Counselling, 33, 266– 279. doi:10.1007/s10447-011-
9129-1.
Correlates of the MMPI-2-RF for Asian Indians
98
McAdams, D. P., & Pals, J. L. (2006). A new big five: Fundamental principles for
an integrative science of personality. American Psychologist, 61(3), 204-
217.
McCrae, R. R., & Costa, P. T. (1999). A five-factor theory of personality. In L. A.
Pervin & O. P. John (Eds.), Handbook of personality: Theory and research
(2nd ed., pp. 139– 153). New York: Guilford Press.
McCrare, R. R., & Costa, P. T. (2010). NEO Inventories for the NEO Personality
Inventory-3 (NEO PI-3), NEO Five-Factor Inventory-3 (NEO-FFI-3) and
NEO Personality Inventory-revised (NEO PI-R): Professional Manual.
Psychological Assessment Resources.
McCrae, R. R., Terracciano, A. (2005). Universal features of personality traits
from the observer’s perspective: Data from 50 cultures. Journal of
Personality and Social Psychology, 88, 547–561. doi:10.1037/0022-
3514.88.3.547
McCurdy, B. A., & Kelly, D. B. (1997). Correlations of the MMPI-2 low self-
esteem scale with two self-esteem measures. Psychological Reports, 81(3),
826. Retrieved from
http://search.proquest.com/docview/619197346?accountid=27313
Min, S., & Lee, H. (1989). A clinical study of Hwa-Byung. Transcultural
Psychiatry, 26, 137–147.
Mischel, W. (1981). The role of purpose in the organization of information about
behavior: Trait-based versus goal-based categories in person cognition.
Journal of Personality and Social Psychology, 40(2), 211.
Correlates of the MMPI-2-RF for Asian Indians
99
Montgomery, G. T., & Orozco, S. (1985). Mexican Americans' performance on
the MMPI as a function of level of acculturation. Journal of Clinical
Psychology, 41(2), 203-212.
Nafziger, M. A., Couillard, G. C , Smith, T. B., & Wiswell, D. K. (1998).
Normative data on the college adjustment scales from a university
counseling center. Journal of College Student Development, 39, 283-290.
Navsaria, N. (2008). Patterns of acculturation and resiliency within the Asian
Indian diaspora (Order No. 3326361). Available from ProQuest
Dissertations & Theses Global. (304482427). Retrieved from
http://search.proquest.com/docview/304482427?accountid=27313
Odom, M.M. (2015). Annual Report. Citizen and Immigration Services.
Washington, DC: U.S. Department of Homeland Security
Parekh, B. R. (2000). Culture and health in Asian Indians (Order No. 9966640).
Available from ProQuest Dissertations & Theses Global. (304604665).
Retrieved from
http://search.proquest.com/docview/304604665?accountid=27313
Pervin, L.A., Cervone, D., & John, O.P. (2005). Personality Theory and Research.
United States of America: John Wiley & Sons, Inc.
Rainey, J. N. (1997). Coping styles, life stress, and the MMPI-2: Differences
between African-American and White American college students (Order
No. 9806240). Available from ProQuest Dissertations & Theses Global.
(304333903). Retrieved from
http://search.proquest.com/docview/304333903?accountid=27313

Correlates of the MMPI-2-RF for Asian Indians
100
Reed, M. K., McLeod, S., Randall, Y., & Walker, B. (1996). Depressive
Symptoms in African‐American Women. Journal of Multicultural
Counseling and Development, 24(1), 6-14.
Robers, H. P. H. (1992). Ethnicity and the MMPI-2: Cultural implications and
limitations for Chinese Americans (Doctoral dissertation, Rosemead
School of Psychology, 1992). Dissertation Abstracts International, 53,
2095B.
Roberts, B. W., & DelVecchio, W. F. (2000). The rank-order consistency of
personality traits from childhood to old age: a quantitative review of
longitudinal studies. Psychological Bulletin, 126(1), 3.
Roberts, B. W., Caspi, A., & Moffitt, T. E. (2001). The kids are alright: Growth
and stability in personality development from adolescence to adulthood.
Journal of Personality and Social Psychology, 81(4), 670-683.
Scollon, C. N., & Diener, E. (2006). Love, work, and changes in extraversion and
neuroticism over time. Journal of Personality and Social Psychology,
91(6), 1152.
Sellbom, M., Anderson, J. L., & Bagby, R. M. (2013). Assessing DSM-5 section
III personality traits and disorders with the MMPI-2-RF. Assessment,
20(6), 709-722. doi:http://dx.doi.org/10.1177/1073191113508808
Sellbom, M., Ben-Porath, Y., & Graham, J. R. (2006). Correlates of the MMPI-2
restructured clinical (RC) scales in a college counseling setting. Journal of
Personality Assessment, 86(1), 89-99.
doi:http://dx.doi.org/10.1207/s15327752jpa8601_10
Correlates of the MMPI-2-RF for Asian Indians
101
Senior, P. A., & Bhopal, R. (1994). Ethnicity as a variable in epidemiological
research. BMJ: British Medical Journal, 309(6950), 327.
Sharma, S. (1978). Sex differences in self-reported anxiousness for different
situations and modes of response among university students in India.
Psychologia: An International Journal of Psychology in the Orient, 21(3),
155-160.
Shweder, R. A., & Bourne, E. J. (1984). Does the concept of the person vary
cross-culturally? In R. Shweder & R. A. LeVine (Eds.), Culture theory:
Essays on mind, self and emotion (pp. 158–219). Cambridge, England:
Cambridge University Press.
Sorathia, J. (2014). The comparison of the MMPI-2 RF profiles of Asian Indian
university students in California and in India (Order No. 3619274).
Available from ProQuest Dissertations & Theses Global. (1536448177).
Retrieved from
http://search.proquest.com/docview/1536448177?accountid=27313
Spielberger, C.D. (1970), Gorsuch RL, Lushene RE. Test manual for the State
Trait Anxiety Inventory. Palo Alto, California: Consulting Psychologists
Press.
Spielberger, C.D. (1985) Assessment of state and trait anxiety: conceptual and
methodological issues. Southern Psychologist, 2, 6-16
Steel, P., & Ones, D. S. (2002). Personality and happiness: a national-level
analysis. Journal of Personality and Social Psychology, 83(3), 767.
Correlates of the MMPI-2-RF for Asian Indians
102
Stevens, M. J., Kwan, K.-L., & Graybill, D. (1993). Comparison of MMPI-2
scores of foreign Chinese and Caucasian-American students. Journal of
Clinical Psychology, 49, 23-27.
Stryker, S., & Burke, P. J. (2000). The past, present, and future of an identity
theory. Social Psychology Quarterly, 284-297.
Sue, S., & Sue, D. W. (1974). MMPI comparisons between Asian-American and
non-Asian students utilizing a student health psychiatric clinic. Journal of
Counseling Psychology, 21(5), 423-427.
doi:http://dx.doi.org/10.1037/h0037074
Sue, S., Keefe, K., Enomoto, K., Durvasula, R. S., & Chao, R. (1996). Asian
American and White college students’ performance on the MMPI-2. In J.
N. Butcher (ed.), International adaptations of the MMPI-2: Research and
clinical applications (pp. 206-218). Minneapolis: University of Minnesota
Press.
Tellegen, A., & Ben-Porath, Y. S. (2008). Minnesota Multiphasic Personality
Inventory-2 Restructured Form: Technical Manual. Minneapolis, MN:
University of Minnesota Press.
Tellegen, A., Ben-Porath, Y. S., McNulty, J. L., Arbisi, P. A., Graham, J. R., &
Kaemmer, B. (2003). MMPI–2 Restructured Clinical (RC) scales:
Development, validation, and interpretation. Minneapolis: University of
Minnesota Press.
Correlates of the MMPI-2-RF for Asian Indians
103
Thaw, S. (1980). Correlates of low MMPI mf scale scores in college females
(Order No. MK53313). Available from ProQuest Dissertations & Theses
Full Text: Social Sciences; ProQuest Dissertations & Theses Global: Social
Sciences. (303078341). Retrieved from
http://search.proquest.com/docview/303078341?accountid=27313
Trivedi, S., & Raghavan, R. (1991). Multi-phasic questionnaire profile of
alcoholics and related factors. Drug and Alcohol Dependence, 29(1), 1-4.
Tsai, D C., Pike, P. L. (2000). Effects of acculturation on the MMPI-2 scores of
Asian American students. Journal of Personality Assessment, 74(2), 216-
230. doi: 0.1207/S15327752JPA7402_4
Tsushima, W. T., & Tsushima, V. G. (2009). Comparison of MMPI-2 validity
scales among compensation-seeking Caucasian and Asian American
medical patients. Assessment, 16(2), 159-164.
doi:http://dx.doi.org/10.1177/1073191108327695
Upmanyu, V. V., & Reen, M. (1990). A study of popular self report measures of
depression. Journal of Personality and Clinical Studies, 6(2), 159-164.
Weiner, I. B. (2013). Assessment of personality and psychopathology with
performance- based measures. APA handbook of testing and assessment in
psychology, vol. 2: Testing and assessment in clinical and counseling
psychology. (pp. 153-170) American Psychological Association. doi:
http://dx.doi.org/10.1037/14048-010
Weiner, I. B., & Greene, R. L. (2008). Handbook of personality assessment.
Hoboken, NJ: Wiley.
Correlates of the MMPI-2-RF for Asian Indians
104
Whatley, P. R., Allen, J., & Dana, R. H. (2003). Racial identity and the MMPI in
African American male college students. Cultural Diversity and Ethnic
Minority Psychology, 9(4), 345-353. doi:http://dx.doi.org/10.1037/1099-
9809.9.4.345
Whitworth, R H. (1988). Anglo- and Mexican-American performance on the
MMPI administered in Spanish or English. Journal of Clinical Psychology,
44(6), 891- 897. doi: 10.1002/1097-4679(198811)44:6<891::AID-
JCLP2270440608>3.0.CO;2-Y
Wiggins, J.S. (1969). Content dimensions in the MMPI. In J.N. Butcher (Ed.),
MMPI: Research developments and clinical applications (pp. 127-180).
New York: McGraw- Hill.
Woodworth, R. S. (1920). Personal data sheet. Chicago, IL: Stoelting.
Zapata-Sola, A., Kreuch, T., Landers, R. N., Hoyt, T., & Butcher, J. N.
(2009).Personality assessment in personnel selection using the MMPI-2:
A cross-cultural comparison. International Journal of Clinical and Health
Psychology, 9(2), 287-298.
Zuckerman, M. (1995). Good and bad humors: Biochemical bases of personality
and its disorders. Psychological Science, 6(6), 325-332.
Zuckerman, M., & Cloninger, C. R. (1996). Relationships between Cloninger's,
Zuckerman's, and Eysenck's dimensions of personality. Personality and
Individual Differences, 21(2), 283-285.
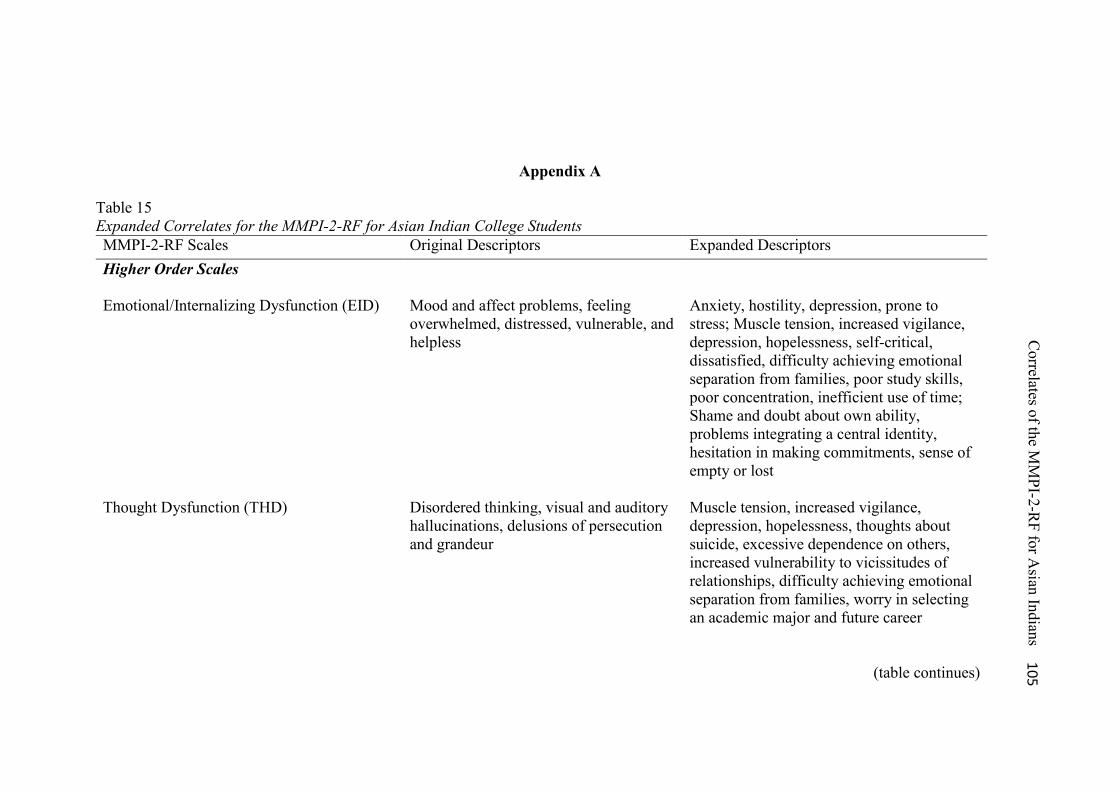
Appendix A
Table 15 Expanded Correlates for the MMPI-2-RF for Asian Indian College Students MMPI-2-RF Scales Original Descriptors Expanded Descriptors Higher Order Scales
Emotional/Internalizing Dysfunction (EID) Mood and affect problems, feeling overwhelmed, distressed, vulnerable, and helpless
Anxiety, hostility, depression, prone to stress; Muscle tension, increased vigilance, depression, hopelessness, self-critical, dissatisfied, difficulty achieving emotional separation from families, poor study skills, poor concentration, inefficient use of time; Shame and doubt about own ability, problems integrating a central identity, hesitation in making commitments, sense of empty or lost
Thought Dysfunction (THD) Disordered thinking, visual and auditory hallucinations, delusions of persecution and grandeur
Muscle tension, increased vigilance, depression, hopelessness, thoughts about suicide, excessive dependence on others, increased vulnerability to vicissitudes of relationships, difficulty achieving emotional separation from families, worry in selecting an academic major and future career
(table continues)
Correlates of the M
MPI-2-R
F for Asian Indians
10
5
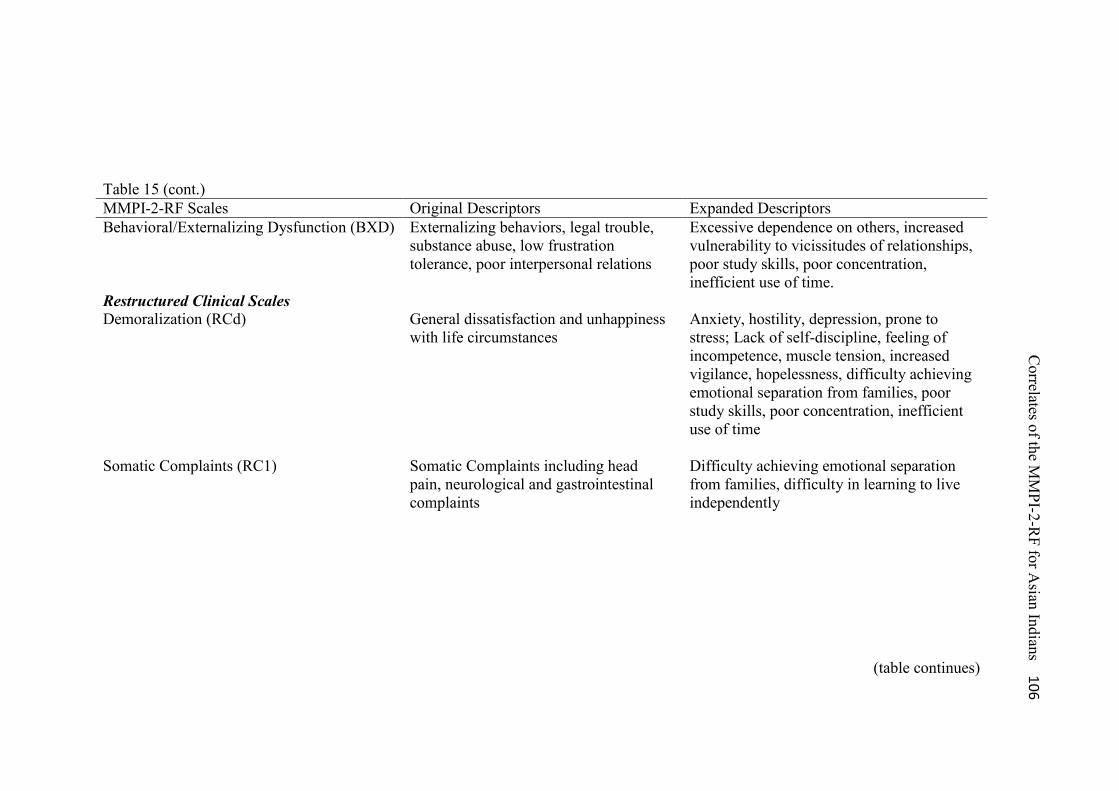
Table 15 (cont.)
MMPI-2-RF Scales Original Descriptors Expanded Descriptors Behavioral/Externalizing Dysfunction (BXD)
Externalizing behaviors, legal trouble, substance abuse, low frustration tolerance, poor interpersonal relations
Excessive dependence on others, increased vulnerability to vicissitudes of relationships, poor study skills, poor concentration, inefficient use of time.
Restructured Clinical Scales Demoralization (RCd) General dissatisfaction and unhappiness
with life circumstances Anxiety, hostility, depression, prone to stress; Lack of self-discipline, feeling of incompetence, muscle tension, increased vigilance, hopelessness, difficulty achieving emotional separation from families, poor study skills, poor concentration, inefficient use of time
Somatic Complaints (RC1) Somatic Complaints including head pain, neurological and gastrointestinal complaints
Difficulty achieving emotional separation from families, difficulty in learning to live independently
(table continues)
Correlates of the M
MPI-2-R
F for Asian Indians
10
6
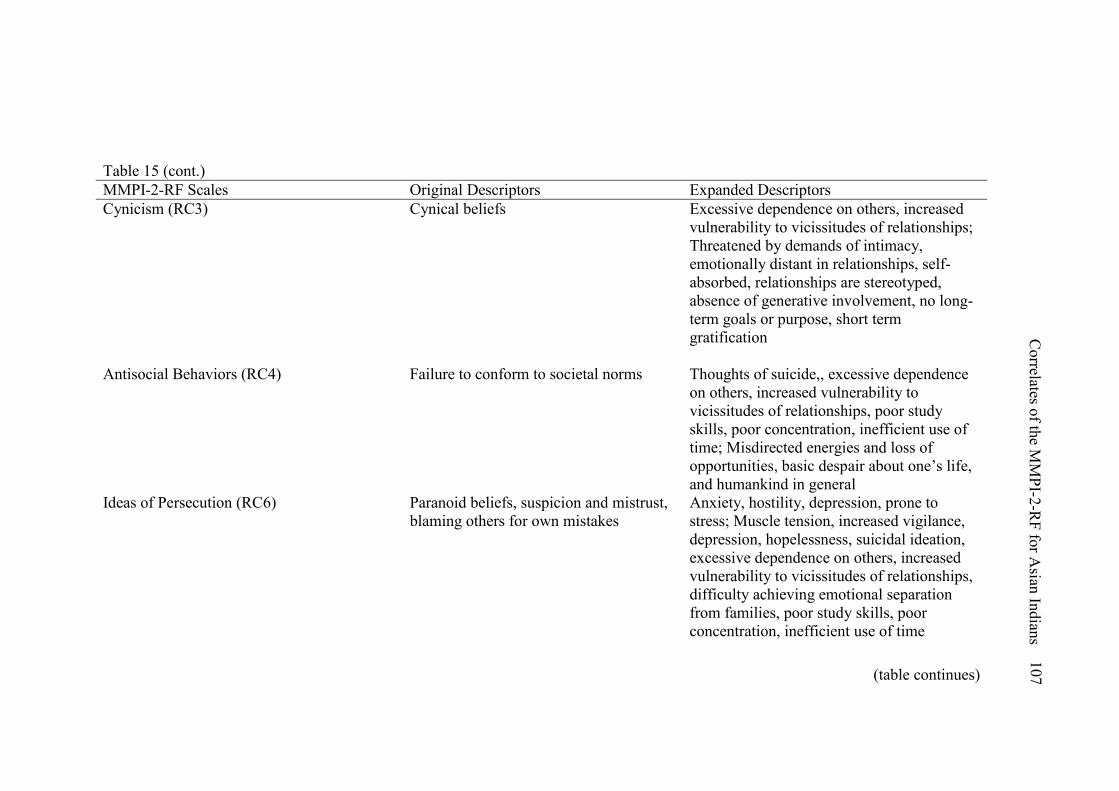
Table 15 (cont.) MMPI-2-RF Scales Original Descriptors Expanded Descriptors Cynicism (RC3)
Cynical beliefs Excessive dependence on others, increased vulnerability to vicissitudes of relationships; Threatened by demands of intimacy, emotionally distant in relationships, self-absorbed, relationships are stereotyped, absence of generative involvement, no long-term goals or purpose, short term gratification
Antisocial Behaviors (RC4)
Failure to conform to societal norms Thoughts of suicide,, excessive dependence on others, increased vulnerability to vicissitudes of relationships, poor study skills, poor concentration, inefficient use of time; Misdirected energies and loss of opportunities, basic despair about one’s life, and humankind in general
Ideas of Persecution (RC6) Paranoid beliefs, suspicion and mistrust, blaming others for own mistakes
Anxiety, hostility, depression, prone to stress; Muscle tension, increased vigilance, depression, hopelessness, suicidal ideation, excessive dependence on others, increased vulnerability to vicissitudes of relationships, difficulty achieving emotional separation from families, poor study skills, poor concentration, inefficient use of time
(table continues)
Correlates of the M
MPI-2-R
F for Asian Indians
107
107

Table 15 (cont.) MMPI-2-RF Scales Original Descriptors Expanded Descriptors Dysfunctional Negative Emotions (RC7) Inhibition, negative emotionality,
worrying, prone to stress and anger Anxiety, hostility, depression, prone to stress, Suicidal ideation, excessive dependence on others, increased vulnerability to vicissitudes of relationships, difficulty achieving emotional separation from families, poor study skills, poor concentration, inefficient use of time
Aberrant Experiences (RC8)
Thought disorganization, unrealistic thinking
Anxiety, hostility, depression, prone to stress; Suicidal ideation, excessive dependence on others, increased vulnerability to vicissitudes of relationships, difficulty achieving emotional separation from families, worry in selecting an academic major and future career.
Hypomanic Activation (RC9) High level of activity and involvement with the environment
Excessive dependence on others, increased vulnerability to vicissitudes of relationships, worry in selecting an academic major and future career, poor study skills, poor concentration, inefficient use of time; Misdirected energies and loss of opportunities, basic despair about one’s life, and human kind in general
(table continues)
Correlates of the M
MPI-2-R
F for Asian Indians
10
8
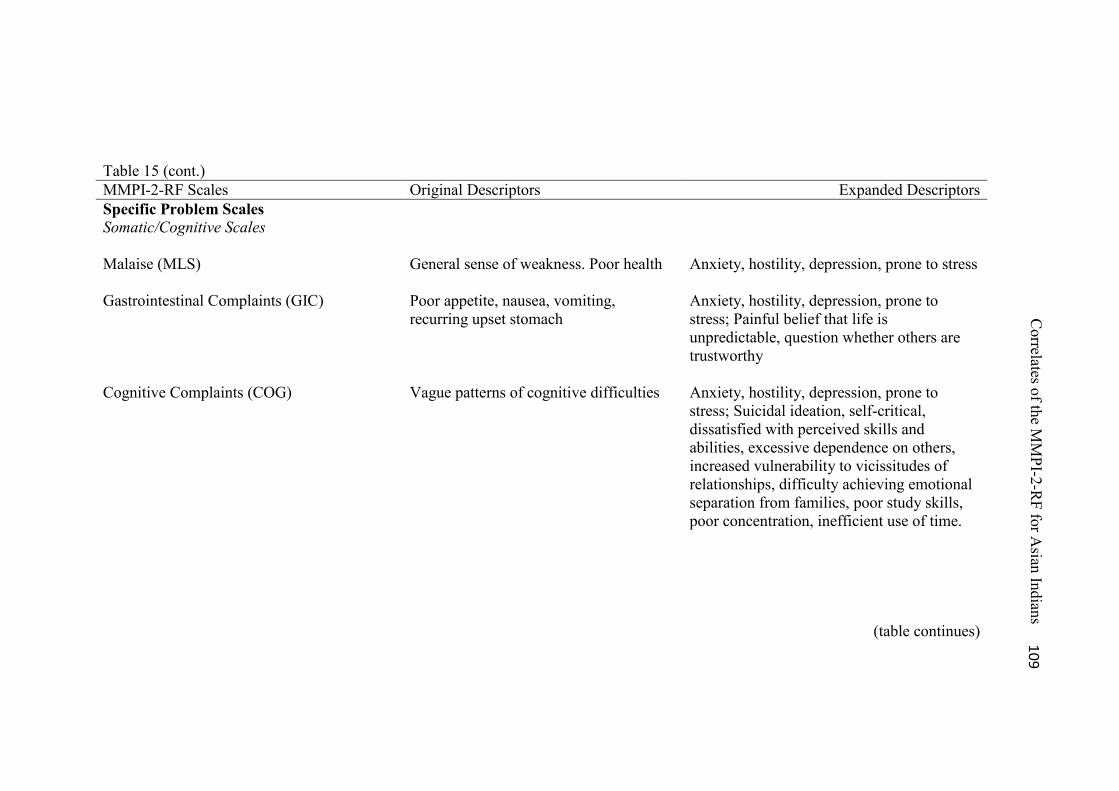
Table 15 (cont.) MMPI-2-RF Scales Original Descriptors Expanded Descriptors Specific Problem Scales Somatic/Cognitive Scales
Malaise (MLS)
General sense of weakness. Poor health Anxiety, hostility, depression, prone to stress
Gastrointestinal Complaints (GIC)
Poor appetite, nausea, vomiting, recurring upset stomach
Anxiety, hostility, depression, prone to stress; Painful belief that life is unpredictable, question whether others are trustworthy
Cognitive Complaints (COG) Vague patterns of cognitive difficulties Anxiety, hostility, depression, prone to stress; Suicidal ideation, self-critical, dissatisfied with perceived skills and abilities, excessive dependence on others, increased vulnerability to vicissitudes of relationships, difficulty achieving emotional separation from families, poor study skills, poor concentration, inefficient use of time.
(table continues)
Correlates of the M
MPI-2-R
F for Asian Indians
10
9
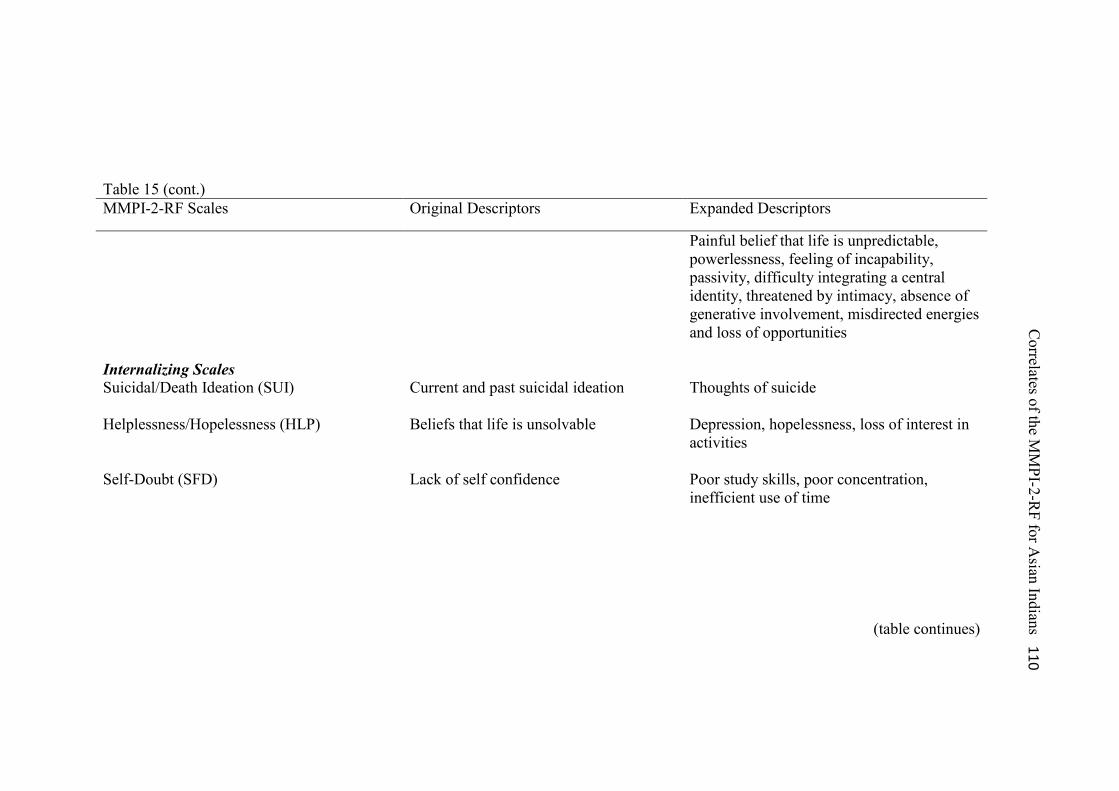
Table 15 (cont.)
MMPI-2-RF Scales Original Descriptors Expanded Descriptors
Painful belief that life is unpredictable, powerlessness, feeling of incapability, passivity, difficulty integrating a central identity, threatened by intimacy, absence of generative involvement, misdirected energies and loss of opportunities
Internalizing Scales Suicidal/Death Ideation (SUI)
Current and past suicidal ideation Thoughts of suicide
Helplessness/Hopelessness (HLP)
Beliefs that life is unsolvable Depression, hopelessness, loss of interest in activities
Self-Doubt (SFD)
Lack of self confidence Poor study skills, poor concentration, inefficient use of time
(table continues)
Correlates of the M
MPI-2-R
F for Asian Indians
11
0
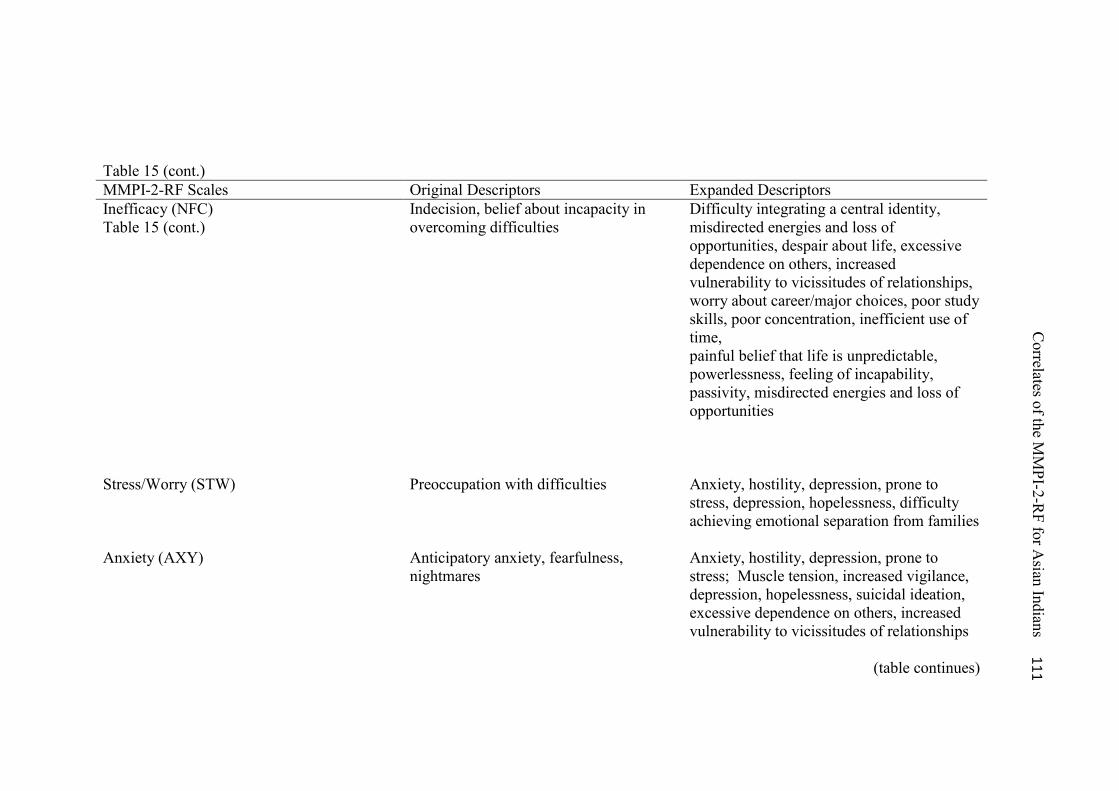
Table 15 (cont.) MMPI-2-RF Scales Original Descriptors Expanded Descriptors Inefficacy (NFC) Table 15 (cont.)
Indecision, belief about incapacity in overcoming difficulties
Difficulty integrating a central identity, misdirected energies and loss of opportunities, despair about life, excessive dependence on others, increased vulnerability to vicissitudes of relationships, worry about career/major choices, poor study skills, poor concentration, inefficient use of time, painful belief that life is unpredictable, powerlessness, feeling of incapability, passivity, misdirected energies and loss of opportunities
Stress/Worry (STW)
Preoccupation with difficulties Anxiety, hostility, depression, prone to stress, depression, hopelessness, difficulty achieving emotional separation from families
Anxiety (AXY)
Anticipatory anxiety, fearfulness, nightmares
Anxiety, hostility, depression, prone to stress; Muscle tension, increased vigilance, depression, hopelessness, suicidal ideation, excessive dependence on others, increased vulnerability to vicissitudes of relationships
(table continues)
Correlates of the M
MPI-2-R
F for Asian Indians
11
1
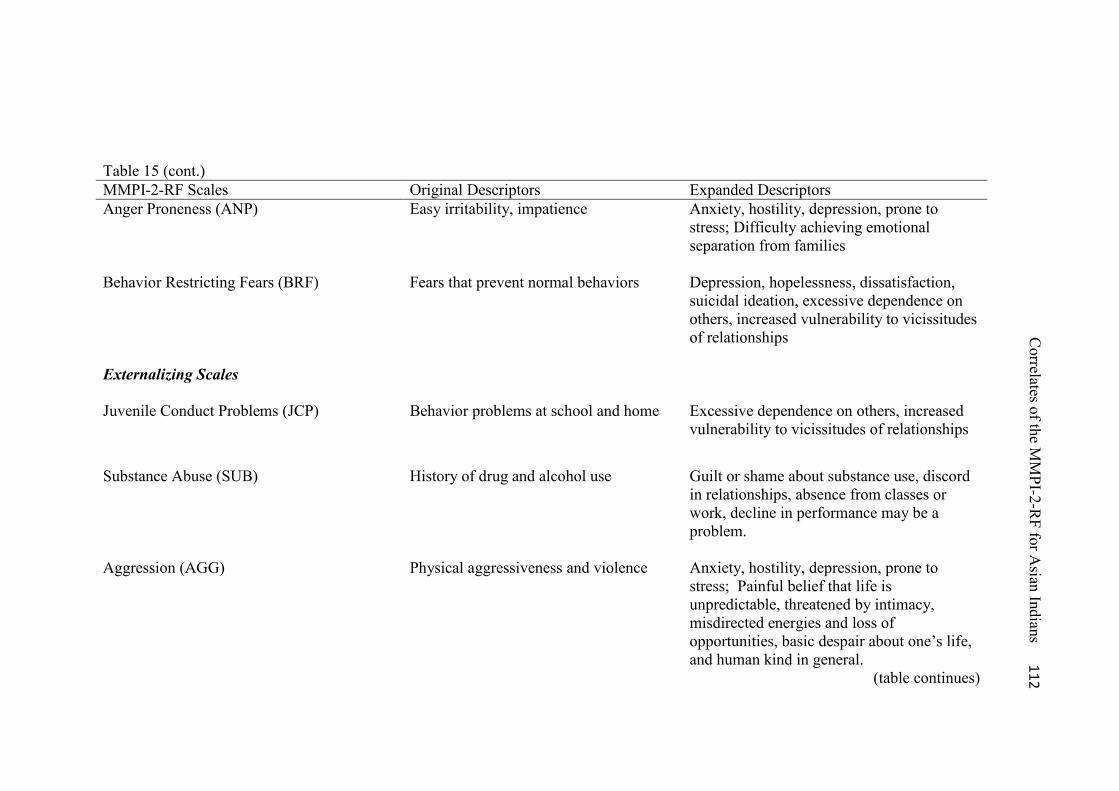
Table 15 (cont.) MMPI-2-RF Scales Original Descriptors Expanded Descriptors Anger Proneness (ANP)
Easy irritability, impatience Anxiety, hostility, depression, prone to stress; Difficulty achieving emotional separation from families
Behavior Restricting Fears (BRF) Fears that prevent normal behaviors Depression, hopelessness, dissatisfaction, suicidal ideation, excessive dependence on others, increased vulnerability to vicissitudes of relationships
Externalizing Scales
Juvenile Conduct Problems (JCP)
Behavior problems at school and home Excessive dependence on others, increased vulnerability to vicissitudes of relationships
Substance Abuse (SUB) History of drug and alcohol use Guilt or shame about substance use, discord in relationships, absence from classes or work, decline in performance may be a problem.
Aggression (AGG) Physical aggressiveness and violence Anxiety, hostility, depression, prone to stress; Painful belief that life is unpredictable, threatened by intimacy, misdirected energies and loss of opportunities, basic despair about one’s life, and human kind in general.
(table continues)
Correlates of the M
MPI-2-R
F for Asian Indians
11
2
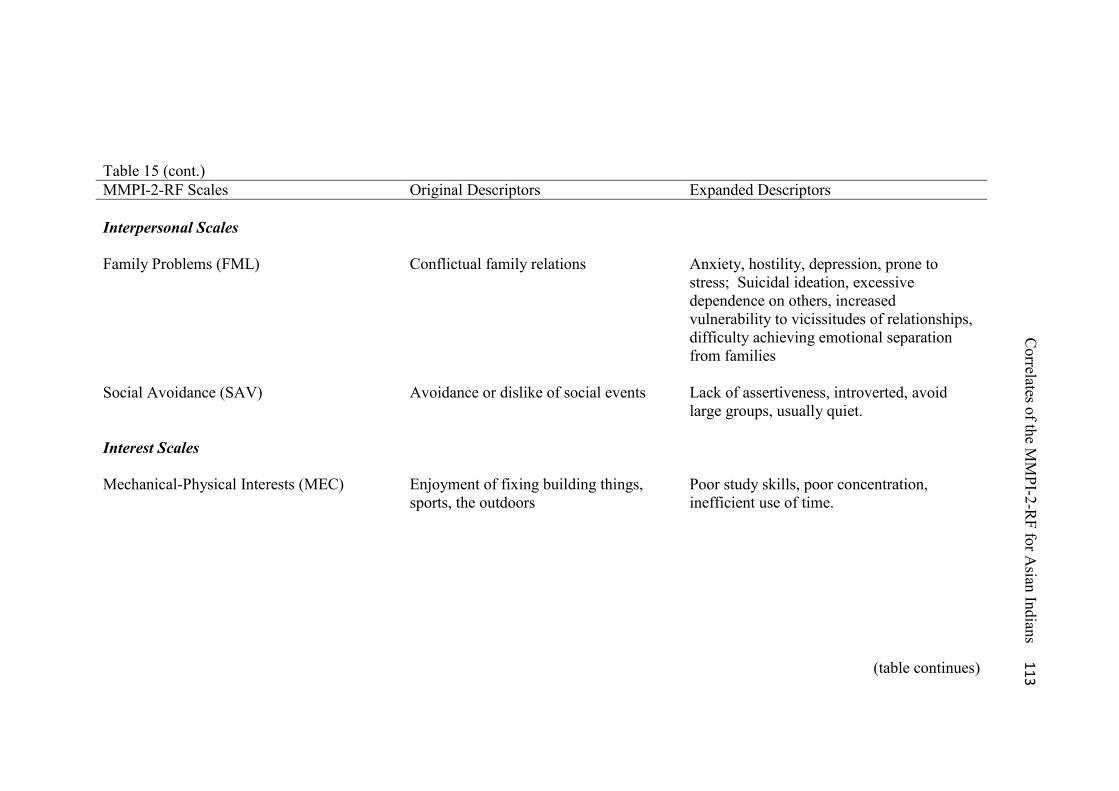
Table 15 (cont.) MMPI-2-RF Scales Original Descriptors Expanded Descriptors Interpersonal Scales
Family Problems (FML)
Conflictual family relations Anxiety, hostility, depression, prone to stress; Suicidal ideation, excessive dependence on others, increased vulnerability to vicissitudes of relationships, difficulty achieving emotional separation from families
Social Avoidance (SAV)
Avoidance or dislike of social events Lack of assertiveness, introverted, avoid large groups, usually quiet.
Interest Scales
Mechanical-Physical Interests (MEC) Enjoyment of fixing building things, sports, the outdoors
Poor study skills, poor concentration, inefficient use of time.
(table continues)
Correlates of the M
MPI-2-R
F for Asian Indians
11
3
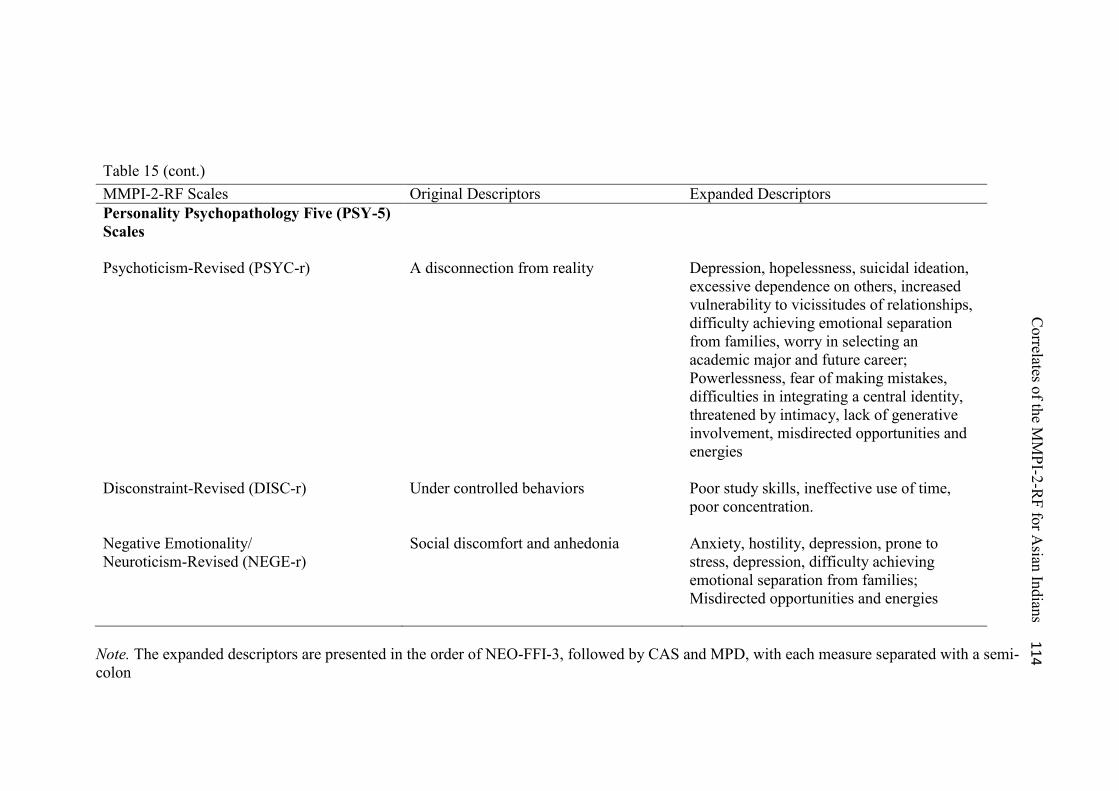
Table 15 (cont.) MMPI-2-RF Scales Original Descriptors Expanded Descriptors Personality Psychopathology Five (PSY-5) Scales
Psychoticism-Revised (PSYC-r)
A disconnection from reality Depression, hopelessness, suicidal ideation, excessive dependence on others, increased vulnerability to vicissitudes of relationships, difficulty achieving emotional separation from families, worry in selecting an academic major and future career; Powerlessness, fear of making mistakes, difficulties in integrating a central identity, threatened by intimacy, lack of generative involvement, misdirected opportunities and energies
Disconstraint-Revised (DISC-r) Under controlled behaviors Poor study skills, ineffective use of time, poor concentration.
Negative Emotionality/ Neuroticism-Revised (NEGE-r)
Social discomfort and anhedonia Anxiety, hostility, depression, prone to stress, depression, difficulty achieving emotional separation from families; Misdirected opportunities and energies
Note. The expanded descriptors are presented in the order of NEO-FFI-3, followed by CAS and MPD, with each measure separated with a semi-colon
11
4 C
orrelates of the MM
PI-2-RF for A
sian Indians
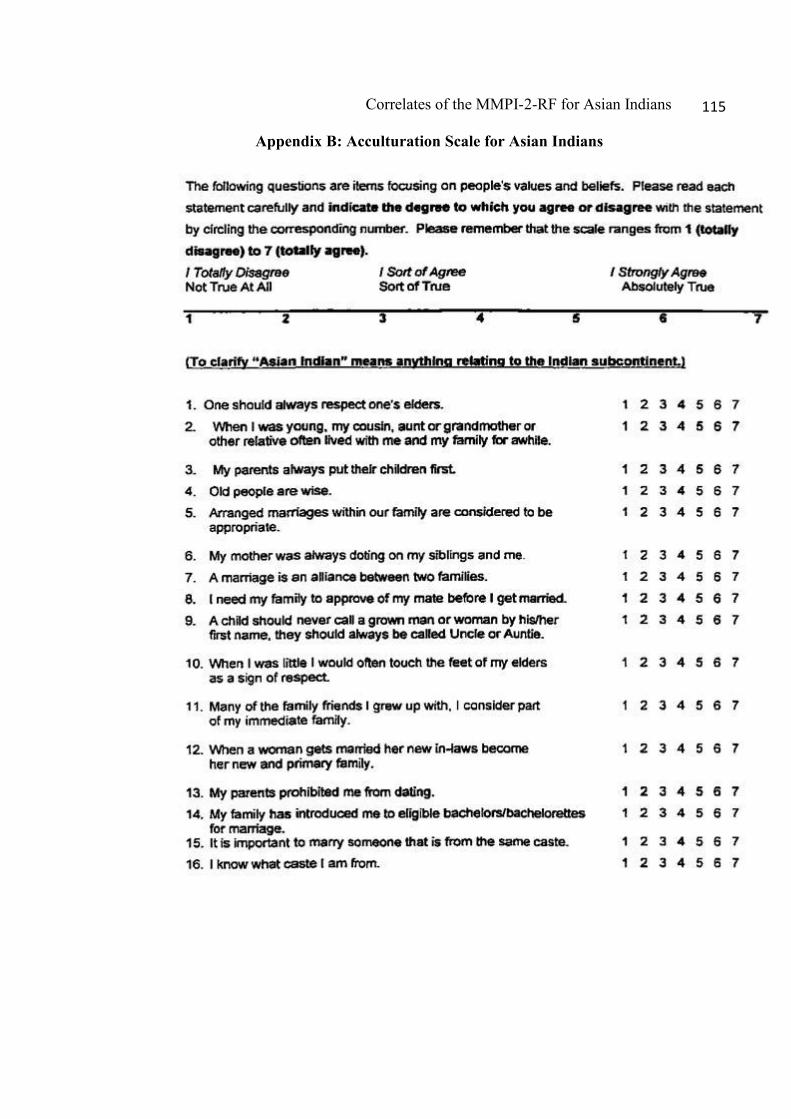
Correlates of the MMPI-2-RF for Asian Indians
115 115
Appendix B: Acculturation Scale for Asian Indians

Correlates of the MMPI-2-RF for Asian Indians
116 116
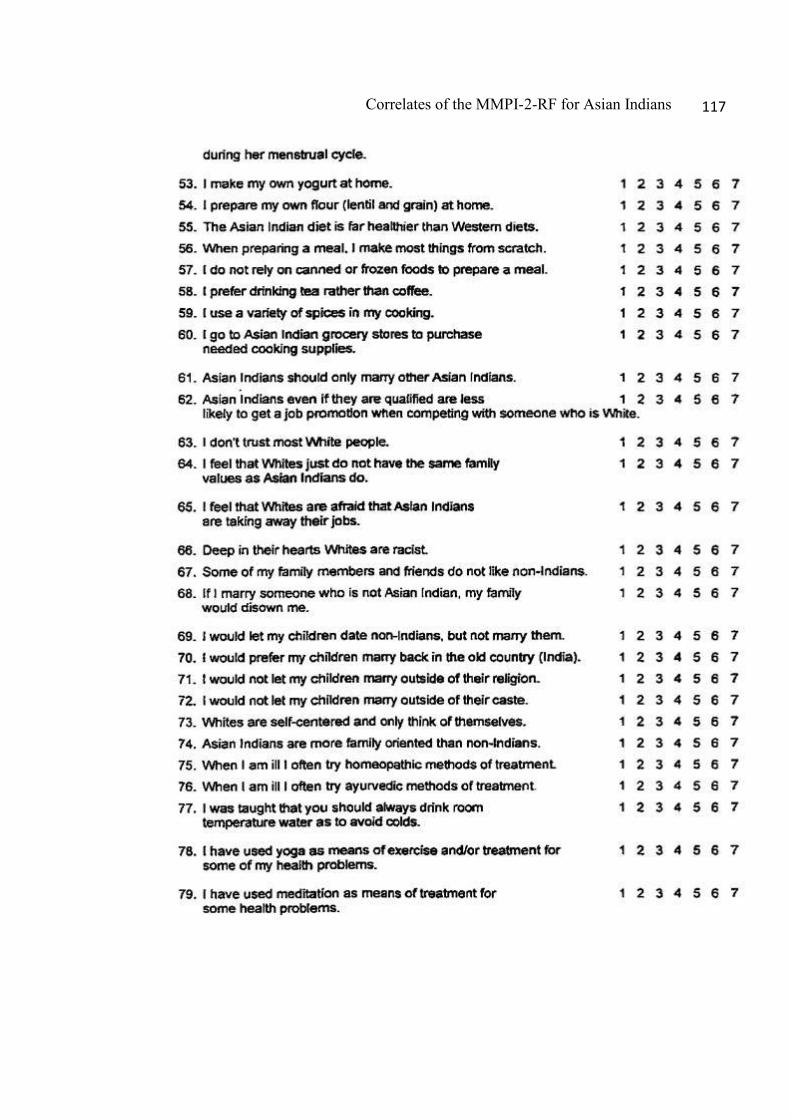
Correlates of the MMPI-2-RF for Asian Indians
117 117
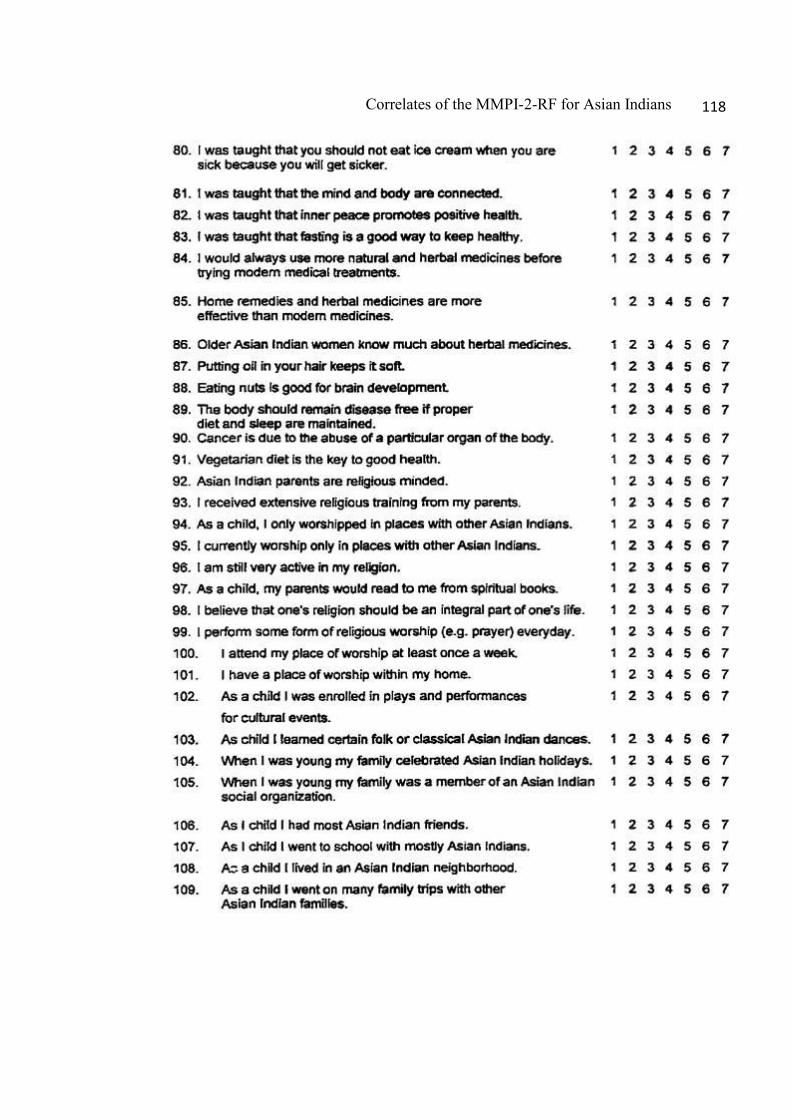
Correlates of the MMPI-2-RF for Asian Indians
118 118
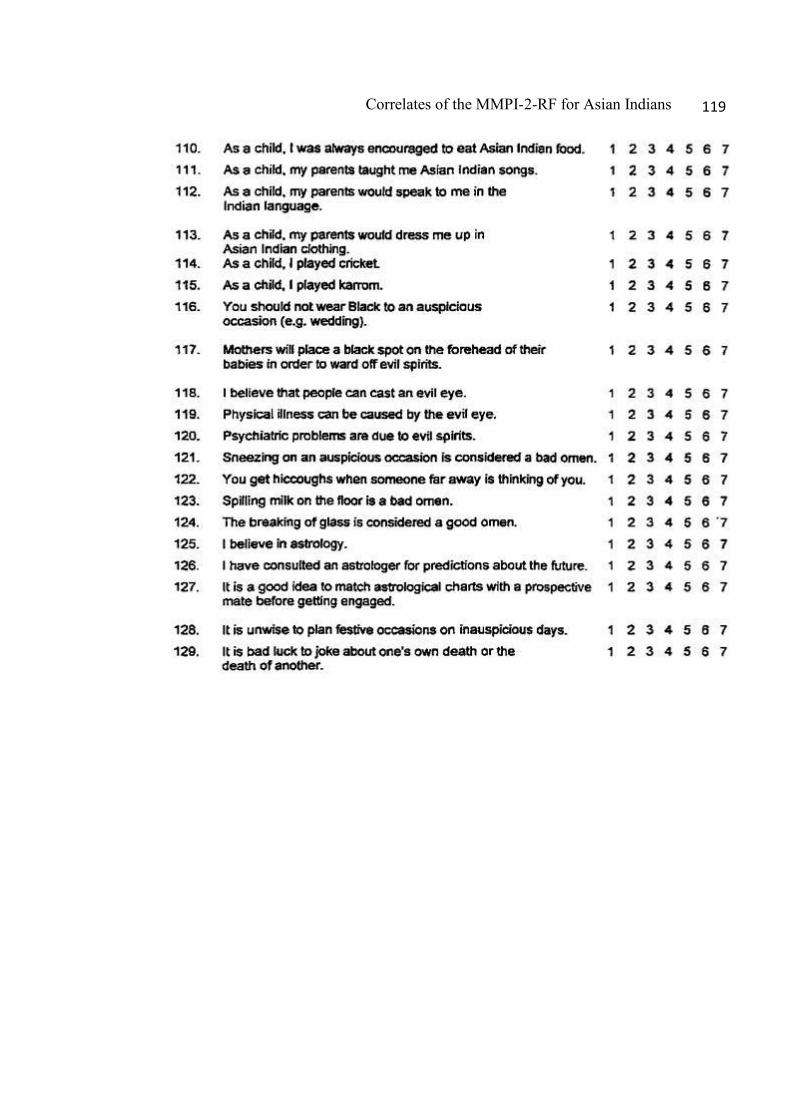
Correlates of the MMPI-2-RF for Asian Indians
119 119
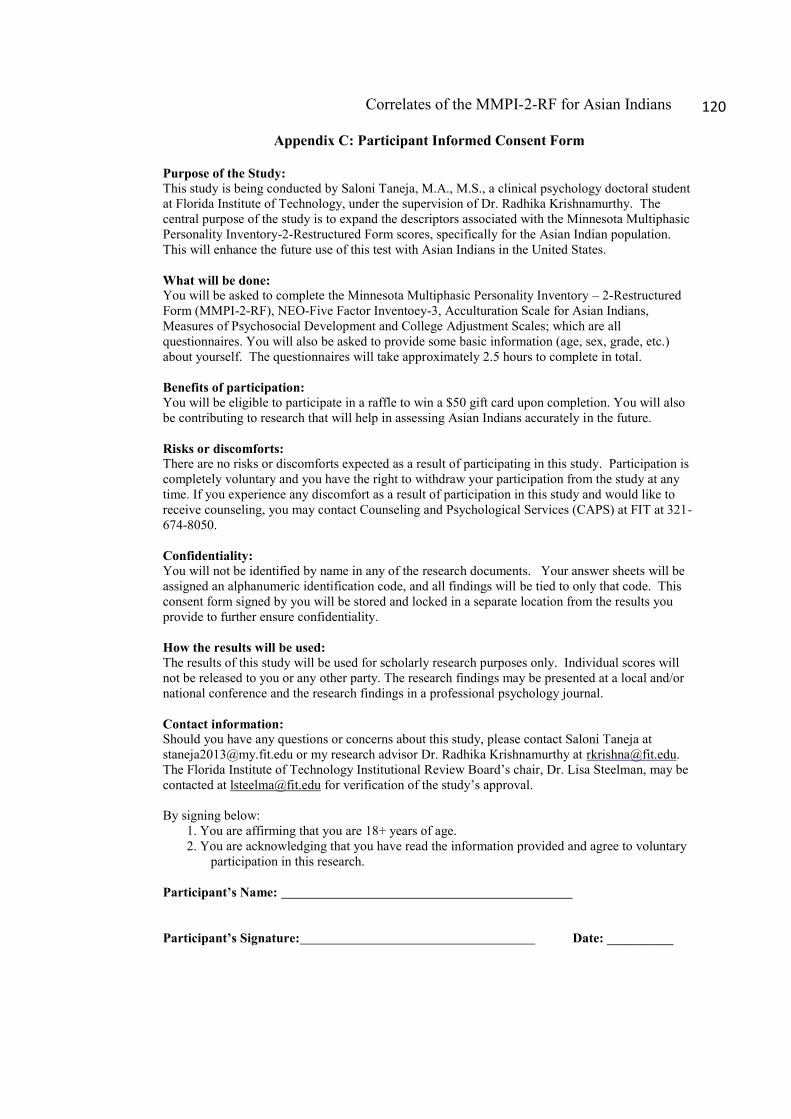
Correlates of the MMPI-2-RF for Asian Indians
120 120
Appendix C: Participant Informed Consent Form Purpose of the Study: This study is being conducted by Saloni Taneja, M.A., M.S., a clinical psychology doctoral student at Florida Institute of Technology, under the supervision of Dr. Radhika Krishnamurthy. The central purpose of the study is to expand the descriptors associated with the Minnesota Multiphasic Personality Inventory-2-Restructured Form scores, specifically for the Asian Indian population. This will enhance the future use of this test with Asian Indians in the United States. What will be done: You will be asked to complete the Minnesota Multiphasic Personality Inventory – 2-Restructured Form (MMPI-2-RF), NEO-Five Factor Inventoey-3, Acculturation Scale for Asian Indians, Measures of Psychosocial Development and College Adjustment Scales; which are all questionnaires. You will also be asked to provide some basic information (age, sex, grade, etc.) about yourself. The questionnaires will take approximately 2.5 hours to complete in total. Benefits of participation: You will be eligible to participate in a raffle to win a $50 gift card upon completion. You will also be contributing to research that will help in assessing Asian Indians accurately in the future. Risks or discomforts: There are no risks or discomforts expected as a result of participating in this study. Participation is completely voluntary and you have the right to withdraw your participation from the study at any time. If you experience any discomfort as a result of participation in this study and would like to receive counseling, you may contact Counseling and Psychological Services (CAPS) at FIT at 321-674-8050. Confidentiality: You will not be identified by name in any of the research documents. Your answer sheets will be assigned an alphanumeric identification code, and all findings will be tied to only that code. This consent form signed by you will be stored and locked in a separate location from the results you provide to further ensure confidentiality. How the results will be used: The results of this study will be used for scholarly research purposes only. Individual scores will not be released to you or any other party. The research findings may be presented at a local and/or national conference and the research findings in a professional psychology journal. Contact information: Should you have any questions or concerns about this study, please contact Saloni Taneja at [email protected] or my research advisor Dr. Radhika Krishnamurthy at [email protected]. The Florida Institute of Technology Institutional Review Board’s chair, Dr. Lisa Steelman, may be contacted at [email protected] for verification of the study’s approval. By signing below:
1. You are affirming that you are 18+ years of age. 2. You are acknowledging that you have read the information provided and agree to voluntary
participation in this research. Participant’s Name: Participant’s Signature: Date: __________