Embed Size (px)
Citation preview
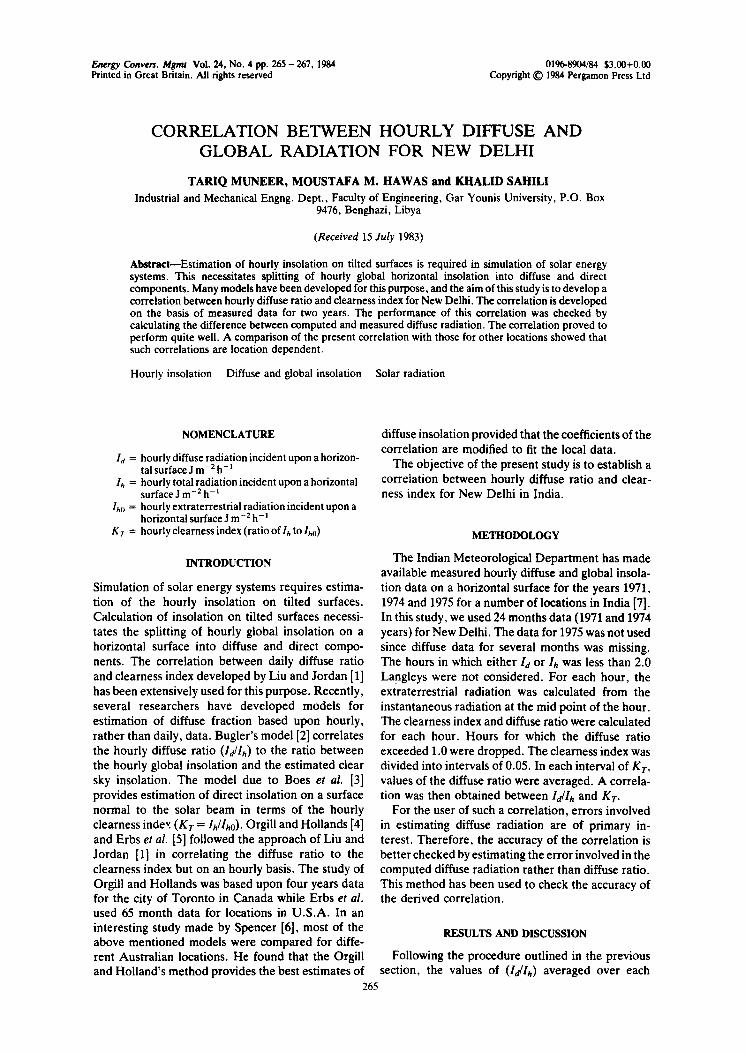
Energy Convers. Mgmt Vol. 24, No. 4 pp. 265 - 267, 1984 0196-8904/84 $3.00+0.00 Printed in Great Britain. All fights reserved Copyright ~ 1984 Pergamon Press Ltd
CORRELATION BETWEEN HOURLY DIFFUSE AND GLOBAL RADIATION FOR NEW DELHI
TARIQ MUNEER, MOUSTAFA M. HAWAS and KHALID SAHILI Industrial and Mechanical Engng. Dept., Faculty of Engineering, Gar Younis University, P.O. Box
9476, Benghazi, Libya
(Received 15 July 1983)
Abstract--Estimation of hourly insolation on tilted surfaces is required in simulation of solar energy systems. This necessitates splitting of hourly global horizontal insolation into diffuse and direct components. Many models have been developed for this purpose, and the aim of this study is to develop a correlation between hourly diffuse ratio and clearness index for New Delhi. The correlation is developed on the basis of measured data for two years. The performance of this correlation was checked by calculating the difference between computed and measured diffuse radiation. The correlation proved to perform quite well. A comparison of the present correlation with those for other locations showed that such correlations are location dependent.
Hourly insolation Diffuse and global insolation Solar radiation
NOMENCLATURE diffuse insolation provided that the coefficients of the correlation are modified to fit the local data.
ld = hourly diffuse radiation incident upon a horizon- tal surface J m -2 h- ~ The objective of the present study is to establish a
lh = hourly total radiation incident upon a horizontal correlation between hourly diffuse ratio and clear- surface J m-2h -~ ness index for New Delhi in India.
ln~j = hourly extraterrestrial radiation incident upon a horizontal surface J m -2 h- 1
KT = hourly clearness index (ratio Oflh to lho) METHODOLOGY
INTRODUCTION The Indian Meteorological Department has made available measured hourly diffuse and global insola-
Simulation of solar energy systems requires estima- tion data on a horizontal surface for the years 1971, tion of the hourly insolation on tilted surfaces. 1974 and 1975 for a number of locations in India [7]. Calculation of insolation on tilted surfaces necessi- In this study, we used 24 months data (1971 and 1974 tares the splitting of hourly global insolation on a years) for New Delhi. The data for 1975 was not used horizontal surface into diffuse and direct compo- since diffuse data for several months was missing. nents. The correlation between daily diffuse ratio The hours in which either Id or lh was less than 2.0 and clearness index developed by Liu and Jordan [1] Langleys were not considered. For each hour, the has been extensively used for this purpose. Recently, extraterrestrial radiation was calculated from the several researchers have developed models for instantaneous radiation at the mid point of the hour. estimation of diffuse fraction based upon hourly, The clearness index and diffuse ratio were calculated rather than daily, data. Bugler's model [2] correlates for each hour. Hours for which the diffuse ratio the hourly diffuse ratio (Id/lh) to the ratio between exceeded 1.0 were dropped. The clearness index was the hourly global insolation and the estimated clear divided into intervals of 0.05. In each interval of Kr , sky insolation. The model due to Boes et al. [3] values of the diffuse ratio were averaged. A correla- provides estimation of direct insolation on a surface tion was then obtained between Id/lh and Kr . normal to the solar beam in terms of the hourly For the user of such a correlation, errors involved clearness index (Kr = lh/lho). Orgill and HoUands [4] in estimating diffuse radiation are of primary in- and Erbs et al. [5] followed the approach of Liu and terest. Therefore, the accuracy of the correlation is Jordan [1] in correlating the diffuse ratio to the better checked by estimating the error involved in the clearness index but on an hourly basis. The study of computed diffuse radiation rather than diffuse ratio. Orgill and Hollands was based upon four years data This method has been used to check the accuracy of for the city of Toronto in Canada while Erbs et al. the derived correlation. used 65 month data for locations in U.S.A. In an interesting study made by Spencer [6], most of the RESULTS AND DISCUSSION above mentioned models were compared for diffe- rent Australian locations. He found that the Orgill Following the procedure outlined in the previous and Holland's method provides the best estimates of section, the values of (Id/lh) averaged over each
265
266 MUNEER et d.: NEW DELHI HOURLY DIFFUSE AND GLOBAL RADIATION
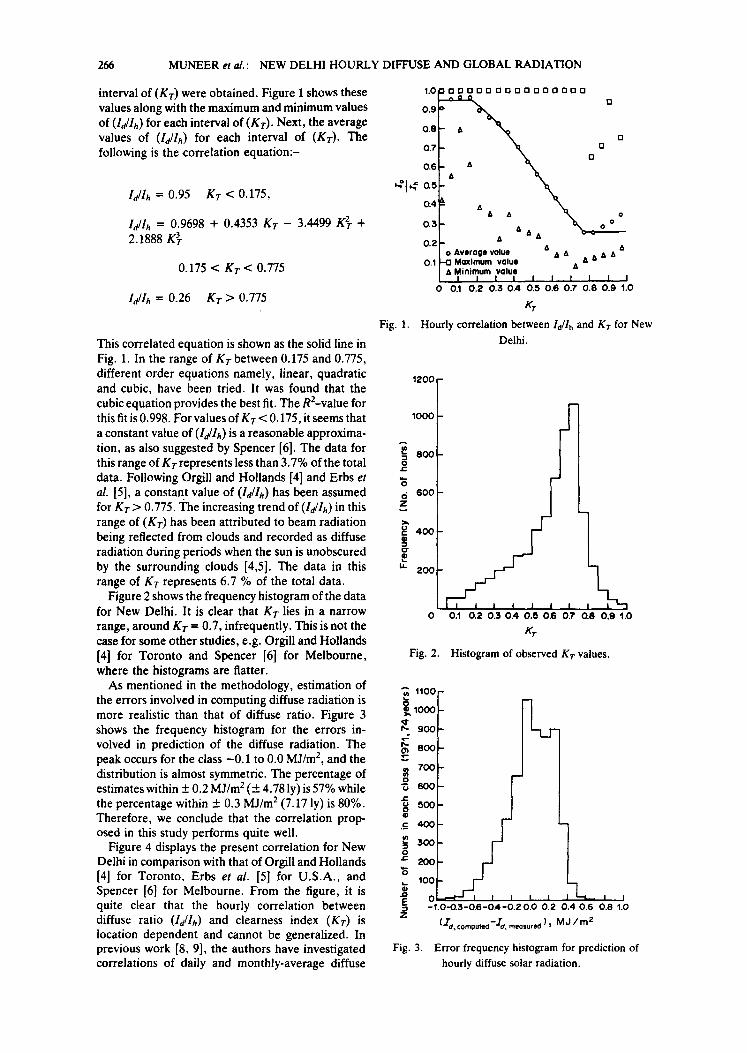
interval of (Kr) were obtained. Figure I shows these 1.o D a o tata o D r~ o ta o o Q o a Q values along with the maximum and minimum values 0.9 ~ of (ld/lh) for each interval of (Kr). Next, the average 0.8 values of (ld/lh) for each interval of (KT). The n following is the correlation equation:- 0.7 " ~ o r~
0.6 A A A
[d/lh ---- 0,95 Kr < 0.175, ~¢1'-~ aa O.4
ld/lh = 0.9698 + 0.4353 Kr - 3.4499 K2r + o.a A A "K~ o * * AAA " ~ 2.1888 K~- o.2 A
Av l roge volue 6 A A A A A A 0.175 < KT < 0.775 oa --0 MoxJmum volue A
A Min imum volue
Id/lh = 0.26 Kr > 0.775 Kr
Fig. 1. Hourly correlation between [d/lh and Kr for New
This correlated equation is shown as the solid line in Delhi. Fig. 1. In the range of KT between 0.175 and 0.775, different order equations namely, linear, quadratic 12oo, and cubic, have been tried. It was found that the cubic equation provides the best fit. The R2-value for this fit is 0.998. For values of KT < 0.175, it seems that Iooo a constant value of (la/lh) is a reasonable approxima- tion, as also suggested by Spencer [6]. The data for ~ aoo this range of Kr represents less than 3.7% of the total o e .
data. Following Orgill and Hollands [4] and Erbs et ~ al. [5], a constant value of (ld/lh) has been assumed o" 60o for KT > 0.775. t h e increasing trend of (ld/lh) in this z range of (KT-) has been attributed to beam radiation ~" 400 r - j - / being reflected from clouds and recorded as diffuse ® radiation during periods when the sun is unobscured by the surrounding clouds [4,5]. The data in this " 2oo - 1 range of Kr represents 6.7 % of the total data. L.
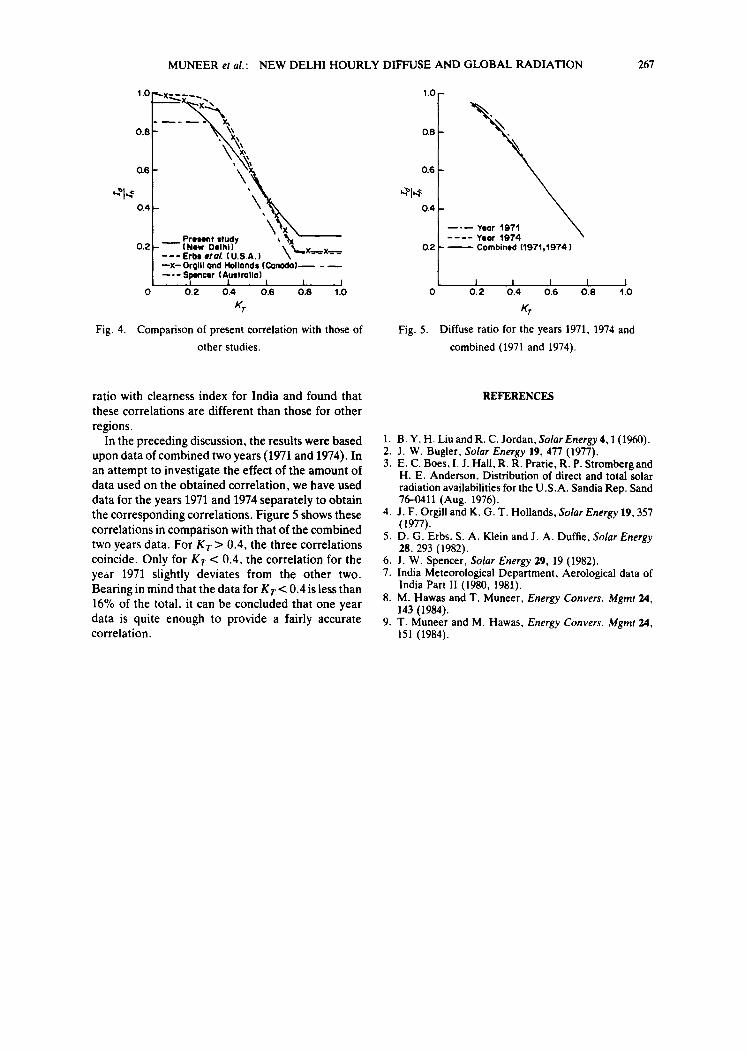
Figure 2 shows the frequency histogram o f the data " 1
for New Delhi. It is clear that K~ lies in a narrow o o.1 o.z 0.3 0.4 0.5 0.6 02 o.6 0.9 1.o range, around Kr = 0.7, infrequently. This is not the A, r case for some other studies, e.g. Orgill and Hollands [4] for Toronto and Spencer [6] for Melbourne, Fig. 2. Histogram of observed Krvalues. where the histograms are flatter.
As mentioned in the methodology, estimation of t 1 0 0
the errors involved in computing diffuse radiation is ~ ~ ] more realistic than that of diffuse ratio. Figure 3 looo shows the frequency histogram for the errors in- ~, 9oo volved in prediction of the diffuse radiation. The ~ aoo peak occurs for the class -0 .1 to 0.0 MJ/m 2, and the -~ distribution is almost symmetric. The percentage of ~ 700
° I estimates within _+ 0.2 M Jim 2 (+_ 4.78 ly) is 57% while -~ 6oo the percentage within + 0.3 MJ/m 2 (7.17 ly) is 80%. ~ sou Therefore, we conclude that the correlation prop- ® used in this study performs quite well. ~ 3oo
Figure 4 displays the present correlation for New = [ - o Delhi in comparison with that of Orgill and Hollands =: zoo
for Toronto, Erbs et al. [5] for U.S.A., and ~ J [4] Spencer [6] for Melbourne. From the figure, it is ~ loo
"" # 1 I I I I , I quite clear that the hourly correlation between E o -1.o-o.3-o.6-o.4-o.2 o o o.2 0.4 0.6 o.a 1.o diffuse ratio (ld/lh) and clearness index (KT) is z (I~. cornpu,e~-~'~, moos.rod ). M J / m 2 location dependent and cannot be generalized. In previous work [8, 9], the authors have investigated Fig. 3. Error frequency histogram for prediction of correlations of daily and monthly-average diffuse hourly diffuse solar radiation.
MUNEER et al.: NEW DELHI HOURLY DIFFUSE AND GLOBAL RADIATION 267
1.0 "~'X ..... ~ x ~ - - ~ 1.0
0 .8 ~,~,~ 0.8 "~, 0.6 " 0.6
0.4 - \ ' ; ~ 0.4
__o
P r e s e n t s t u d y , ' ~ . . . . Veer 197'4 0 .2 - ~ ( N e w D e l h i ) \ ' ~ - . x ~ r x 0.2 Combined (1971 ,1974)
- - - E r b l ere/. ( U.S.A. ) \ ----=- ~ X - Orgll l Qnd Hol londt ( C o n o d o ) ~ - - - - - Spencer (Austml lo)
I I I I I I I I I I 0 0 . 2 0 .4 0 .6 0 .8 1.0 0 0 . 2 0 .4 0 .6 0 . 8 4.0
K,. K,.
Fig. 4. Comparison of present correlation with those of Fig. 5. Diffuse ratio for the years 1971, 1974 and
other studies, combined (1971 and 1974).
ratio with clearness index for India and found that REFERENCES these correlations are different than those for other regions.
In the preceding discussion, the results were based 1. B.Y.H. LiuandR. C. Jordan, Solar Energy 4,1(1960). upon data of combined two years (1971 and 1974). In 2. J. w. Bugler, Solar Energy 19, 477 (1977). an attempt to investigate the effect of the amount of 3. E.C. Bees, I. J. Hall, R. R. Prarie, R. P. Stromberg and
H. E. Anderson, Distribution of direct and total solar data used on the obtained correlation, we have used radiation availabilities for the U.S.A. Sandia Rep. Sand data for the years 1971 and 1974 separately to obtain 76--0411 (Aug. 1976). the corresponding correlations. Figure 5 shows these 4. J. F. Orgill and K, (3. T. Hollands, Solar Energy 19, 357 correlations in comparison with that of the combined (1977).
5. D. G. Erbs. S. A. Klein and J. A. Duffle, Solar Energy two years data. For KT > 0.4, the three correlations 28, 293 (1982). coincide. Only for KT < 0.4, the correlation for the 6. J. W. Spencer, Solar Energy 29, 19 (1982). year 1971 slightly deviates from the other two. 7. India Meteorological Department, Aerological data of Bearing in mind that the data for Kr < 0.4 is less than India Part II (1980, 1981).
8. M. Hawas and T. Muneer, Energy Convers. Mgmt 24, 16% of the total, it can be concluded that one year 143 (1984). data is quite enough to provide a fairly accurate 9. T. Muneer and M. Hawas, Energy Convers. Mgmt 24, correlation. 151 (1984).