Embed Size (px)
Citation preview
Corruption Perceptions vs. Corruption Reality
Benjamin A. Olken�
MIT and NBER
March 11, 2009
Abstract
This paper examines the accuracy of corruption perceptions by comparing Indonesian vil-lagers�reported perceptions about corruption in a road-building project in their village with amore objective measure of �missing expenditures�in the project. I �nd that villagers�reportedperceptions do contain real information, and that villagers are sophisticated enough to distin-guish between corruption in a particular road project and general corruption in the village.The magnitude of the reported information, however, is small, in part because o¢ cials hidecorruption where it is hardest for villagers to detect. I also �nd that there are biases in reportedperceptions. The �ndings illustrate the limitations of relying solely on corruption perceptions,whether in designing anti-corruption policies or in conducting empirical research on corruption.
�I wish to thank Abhijit Banerjee, Esther Du�o, Amy Finkelstein, Ray Fisman, Seema Jayachandran, Larry Katz,Aart Kraay, Michael Kremer, Thomas Piketty, Susan Rose-Ackerman, Monica Singhal, and an anonymous refereefor helpful comments. Special thanks are due to Victor Bottini, Richard Gnagey, Susan Wong, and especially ScottGuggenheim for their support and assistance throughout the project. The �eld work and engineering survey wouldhave been impossible without the dedication of Faray Muhammad and Suroso Yoso Oetomo, as well as the entire P4�eld sta¤. This project was supported by a grant from the DfID-World Bank Strategic Poverty Partnership TrustFund. All views expressed are those of the author, and do not necessarily re�ect the opinions of DfID or the WorldBank. Email: [email protected]
1 Introduction
Corruption is thought to be a signi�cant problem in much of the developing world. Corruption not
only imposes a tax on public services and private sector activity; it also creates potentially severe
e¢ ciency consequences as well (Krueger 1974, Shleifer and Vishny 1993, Bertrand et al. 2006). Yet
despite the importance of the problem, eliminating corruption has proved di¢ cult in all but a few
developing countries.
One potential reason why corruption is so persistent is that citizens may not have accurate
information about corruption. After all, since corruption is illegal, regularly and directly observing
corrupt activity is almost always impossible. If citizens have accurate information about corrup-
tion, then the democratic process and grass-roots monitoring can potentially provide incentives for
politicians to limit corruption. If, on the other hand, citizens have little in the way of accurate
information about corrupt activity � or even if citizens know about average levels of corruption
but do not know who is corrupt and who is honest �then the political process may not provide
su¢ cient incentives to restrain corruption.
The accuracy of corruption perceptions is also important because of their ubiquitous use by
international institutions and academics to measure corrupt activity. For example, corruption
perceptions form the basis of the much-cited cross-country Transparency International Corruption
Index (Lambsdor¤ 2003) and World Bank Governance Indicators (Kaufmann et al. 2005), and are
used extensively within countries as well to assess governance at the sub-national level. Perceptions
have also been widely used in academic research on the determinants of corruption.1 Measuring
perceptions about corruption rather than corruption itself skirts the inherent di¢ culties involved
in measuring corruption directly, but raises the question of how those being surveyed form their
perceptions in the �rst place, and how accurate those reported perceptions actually are.
This paper examines the empirical relationship between reported corruption perceptions and a
more objective measure of corruption, in the context of a road-building program in rural Indonesia.
To construct an objective measure of corruption, I assembled a team of engineers and surveyors
1Prominent papers in this literature include Mauro (1995), Knack and Keefer (1995), LaPorta et al. (1999), andTreisman (2000). This literature is surveyed in detail in Rose-Ackerman (2004).
1
who, after the roads built by the project were completed, dug core samples in each road to estimate
the quantity of materials used, surveyed local suppliers to estimate prices, and interviewed villagers
to determine the wages paid on the project. From these data, I construct an independent estimate
of the amount each road actually cost to build, and then compare this estimate to what the village
reported it spent on the project on a line-item by line-item basis. The di¤erence between what
the village claimed the road cost to build and what the engineers estimated it actually cost to
build forms my objective measure of corruption, which I label �missing expenditures.� To obtain
data on villagers�reported perceptions of corruption, in the same set of villages I also conducted
a household survey, in which villagers were asked about the likelihood of corruption in the road
project.
Using these data, I �nd that villagers�reported perceptions of the likelihood of corruption in
the road project do contain information about the level of missing expenditures in the project.
Moreover, villagers are sophisticated enough in their reported perceptions to distinguish between
general levels of corruption in the village and corruption in the particular road project I examine.
However, reported perceptions of corruption contain only a limited amount of information: increas-
ing the missing expenditures measure by 10 percent is associated with just a 0.8 percent increase
in the probability a villager believes that there is any corruption in the project.
One reason villagers�information about corruption may be limited is that o¢ cials have multiple
methods of hiding corruption, and choose to hide corruption in the places where it is hardest for
villagers to detect. In particular, my analysis suggests that villagers are able to detect marked-
up prices, but appear unable to detect in�ated quantities of materials used in the road project.
Consistent with this, the vast majority of corruption in the project occurs by in�ating quantities,
with almost no markup of prices on average. The inability of villagers to detect in�ated quantities,
combined with the fact that o¢ cials can substitute between hiding corruption as in�ated prices or
in�ated quantities, suggests that o¢ cials may be strategic in how they hide corruption, and that
e¤ective monitoring requires specialist auditors who can detect multiple types of corruption.
The fact that the overall correlation between reported corruption perceptions and missing ex-
penditures is positive, however, is not su¢ cient to show that the two variables can be used inter-
2
changeably as measures of corruption. In particular, reported perceptions may be systematically
biased, either because individuals beliefs are biased, or because conditional on their true beliefs
the way individuals report corruption is biased. I �rst show that, even controlling for village �xed
e¤ects (and therefore controlling completely �exibly for the actual level of corruption in the road)
and benchmarking for how respondents answer the corruption question in other contexts, indi-
vidual characteristics such as education and gender systematically predict respondents�reported
perceptions of corruption in the road project. I show that these biases are not a¤ected by how
the respondents are told the information will be used, which suggests they may be biases in the
respondents underlying beliefs rather than simply biases in how respondents choose to report their
perceptions on the survey.
Just because individual perceptions are biased does not necessarily mean that, in aggregate,
corruption perceptions will give misleading results when investigating the determinants of corrup-
tion. To test for aggregate biases that would a¤ect inference about the determinants of corruption,
I examine the relationship between the two di¤erent measures of corruption and a host of village
characteristics. Consistent with other studies, I �nd, for example, that increased ethnic heterogene-
ity is associated with higher levels of reported corruption perceptions (e.g., Mauro 1995, LaPorta
1999), and that increased levels of participation in social activities are associated with lower levels of
reported corruption perceptions (e.g., Putnam 1993). But when I examine the relationship between
these variables and the missing expenditures variable, I �nd di¤erent results �ethnic heterogeneity
is associated with lower levels of missing expenditures, and participation in social activities is not
correlated with missing expenditures levels at all.
One hypothesis that could reconcile these di¤erences is that there is may be a feedback mecha-
nism, where biased beliefs about corruption lead to more monitoring behavior, which in turn lowers
actual corruption. For example, I show that within a given village, respondents who are prone to
believe there is more corruption generally (as measured by their corruption perceptions about the
President of Indonesia) are more likely to engage in monitoring the village road project. Similarly,
villagers in more ethnically heterogeneous villages are less likely to report trusting their fellow vil-
lagers, and more likely to attend project monitoring meetings, than those in homogeneous villages,
3
which may explain why there is greater perceived corruption in heterogeneous villages but lower
missing expenditures.
More generally, the results suggest that when examining the correlates of corruption, examining
perceptions of corruption may lead to misleading conclusions. Instead, more objective methods of
measuring corruption, such as the approach used here (or the related approaches used by Di Tella
and Schargrodsky 2003, Reinikka and Svensson 2004, Fisman and Wei 2004, Yang 2004, Hsieh and
Moretti 2006, and Olken 2006a), may produce more reliable results.
This paper is related to several literatures in economics that seek to characterize the relationship
between reported beliefs and reality more generally. Bertrand and Mullainathan (2001) discuss the
psychological underpinnings of biases in answers to subjective survey questions, and there is a large
literature examining the accuracy and potential biases in individuals�forecasts of their own future
retirement decisions, mortality, and income.2 In the public sphere, several authors have also found
that reported perceptions are positively correlated with more objective measures of performance,
in the very di¤erent contexts of international perceptions of bribery (Mocan 2004), prices paid
by Bolivian hospitals for medical supplies (Gray-Molina et al. 2001), and principals evaluating
teachers (Jacob and Lefgren 2005). In the setting closest to that examined here, however, Beaman
et al. (2008) document that women leaders in Indian villages deliver better public services than
male leaders, yet score worse on measures of citizen satisfaction. Their results, consistent with the
results presented here, suggest that there may be political market failures caused by inaccuracies
in public perceptions about the performance of government o¢ cials.
The remainder of this paper is organized as follows. Section 2 discusses the empirical setting
and the data used in the paper. Section 3 examines the degree to which individual villagers have
information about actual corruption levels. Section 4 examines the degree to which villagers�
reported perceptions about corruption are biased. Section 5 concludes.
2For example, Bernheim (1989) discusses systematic variability in individual accuracy in forcasting retirementdates, Hurd and McGarry (1995) document that individuals with certain observable characteristics are systematicallymore likely to over or under-predict their own mortality, Dominitz and Manski (1997) document that individuals canforecast their expected income, and Bassett and Lumsdaine (1999, 2001) discuss how even controlling for observablecharacteristics, some individuals are likely to be over-optimistic accross a wide variety of beliefs whereas others aresystematically over-pessimistic.
4
2 Setting and Data
2.1 Empirical Setting
The data in this paper come from 477 villages in two of Indonesia�s most populous provinces, East
Java and Central Java, as shown in Figure 1. The villages in this study were selected because they
were about to begin building small-scale road projects under the auspices of the Kecamatan (Sub-
district) Development Project, or KDP. KDP is a national government program, funded through
a loan from the World Bank, which �nances projects in approximately 15,000 villages throughout
Indonesia each year. The data in this paper were collected between September 2003 and August
2004.
The roads I examine are built of a mixture of rock, sand, and gravel, range in length from
0.5 �3 km, and may either run within the village or run from the village to the �elds. A typical
road project costs on the order of Rp. 80 million (US$8,800 at the then-current exchange rate).
Under KDP, a village committee receives the funds from the central government, and then procures
materials and hires labor directly, rather than using a contractor as an intermediary. The allocation
to the village is lump-sum, so that the village is the residual claimant. In particular, surplus funds
can be used, with the approval of a village meeting, for additional development projects, rather
than having to be returned to the KDP program. These funds are often supplemented by voluntary
contributions from village residents, primarily in the form of unpaid labor. A series of three village-
level meetings are conducted to monitor the use of funds by the village committee implementing
the project.
Corruption in the village projects can occur in several ways. First, village implementation
teams, potentially working with the village head, may collude with suppliers to in�ate either the
prices or the quantities listed on the o¢ cial receipts. Second, members of the implementation team
may manipulate wage payments by in�ating the wage rate or the number of workers paid by the
project.
The villages in this study were part of a randomized experiment on reducing corruption, described
in more detail in Olken (2007). Three experimental treatments were conducted in randomly selected
5
subsets of villages: an increase in the probability of an external government audit of the project,
an increase in the number of invitations distributed to the village meetings regularly held to over-
see use of project funds, and the distribution of anonymous comment forms. All of the empirical
speci�cations reported below include dummy variables for each of these experimental treatments to
ensure that the e¤ects reported here are not being driven by these experiments, though the results
below are essentially similar if the experimental dummies are not included. (I discuss the e¤ects of
the experiments on reported corruption perceptions in Section 4.3).
The data used here come from three surveys designed by the author: a household survey,
containing data on household beliefs about corruption in the project; a �eld survey, used to measure
missing expenditures in the road project; and a key-informant survey with the village head and
the head of each hamlet, used to measure village characteristics. In the subsequent subsections,
I describe the two aspects of the data that are the focus of this study �the household survey on
corruption perceptions and the �eld survey to measure missing expenditures in the road project.
Additional details about the data collected can be found in the Appendix.
2.2 Corruption Perceptions
Data on reported corruption perceptions were obtained from a survey of a strati�ed random sample
of adults in the village. The survey was conducted between February 2004 - April 2004, when
construction of the road projects was between 80% - 100% complete. The sample includes 3,691
respondents.
The key corruption question I examine is the following: �Generally speaking, what is your
opinion of the likelihood of diversions of money / KKN (corruption, collusion, and nepotism)
involving [...],�where [...] is 1) the President of Indonesia (at the time, Megawati Sukarnoputri),
2) the sta¤ of the subdistrict o¢ ce (the administrative level above the village), 3) the village head,
4) the village parliament, and 5) the road project. KKN is the Indonesian acronym for corruption,
collusion, and nepotism �the catch-all phrase for corruption in Indonesian. Respondents were given
5 possible choices in response �none, low, medium, high, and very high. The �rst four questions
(from the President to the village parliament) were asked, in that order, in the middle of the 1.5
6
hour survey; the question about the road project was asked towards the end of the survey.
The tabulations of the responses to these corruption questions are given in Table 1. Several
things are worth noting about the responses. First, the more �local�the subject being asked about,
the less corruption respondents report � i.e., respondents report the highest corruption levels for
the President, followed by the subdistrict sta¤, followed by the village o¢ cials, followed lastly by
the road project.
Second, 8.9% of respondents do not answer the question about corruption in the road project,
claiming either they do not know or they do not want to answer. In interviews it appeared that
many people who refused to answer did so because they felt uncomfortable saying that there was
corruption. Although respondents were assured that responses would remain anonymous, this
reluctance to state opinions about corruption is common to many surveys of corruption (Azfar
and Murrell 2005). It is particularly understandable in this context, given that free speech was
restricted in Indonesia until the end of the Soeharto government in 1998, and that even now village
heads still wield considerable local authority.
I therefore examine two versions of the corruption beliefs variable that deal with these non-
responses in di¤erent ways. The �rst version is simply the �ve ordered categorical responses shown
in Table 1, where �refused to answer�is treated as missing. I use ordered probit models to inves-
tigate the determinants of this categorical response variable. The disadvantage of this approach is
that it disregards the potentially useful information contained in �refused to answer,�namely that
those who refuse to answer often believe there is corruption but are unwilling to say so. I therefore
create a second version of the beliefs variable called �any likelihood of corruption�that groups all
positive likelihood of corruption answers together with non-responses. This variable is equal to 1 if
the respondent reports any positive probability of corruption (low, medium, high, or very high) or
refused to answer the corruption question, and 0 otherwise.3 I use probit models to investigate the
determinants of this variable. As will be discussed in more detail below, the two variables produce
broadly similar results.
3Alternatively, if I use a dummy variable for any positive perceptions of corruption, but drop missings rather thancount them as a positive perception, the results are slightly weaker than the results presented. This is consistent withthe idea that a non-response is associated with a positive perceived corruption probability.
7
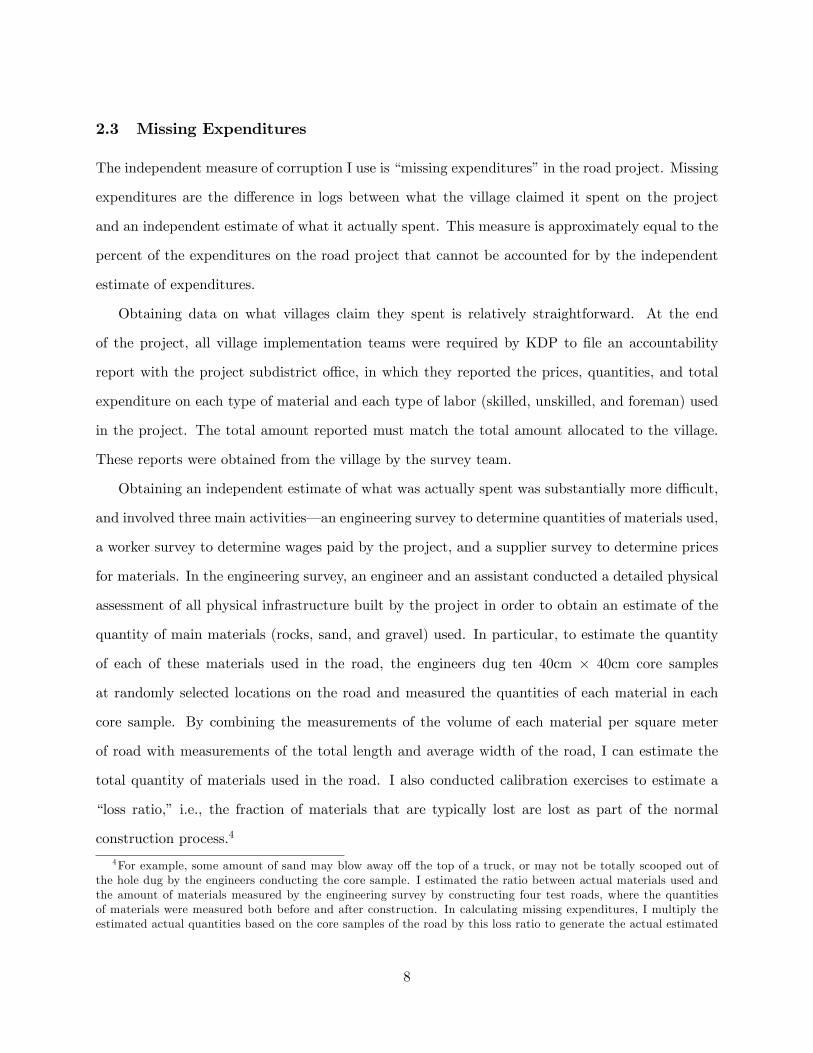
2.3 Missing Expenditures
The independent measure of corruption I use is �missing expenditures�in the road project. Missing
expenditures are the di¤erence in logs between what the village claimed it spent on the project
and an independent estimate of what it actually spent. This measure is approximately equal to the
percent of the expenditures on the road project that cannot be accounted for by the independent
estimate of expenditures.
Obtaining data on what villages claim they spent is relatively straightforward. At the end
of the project, all village implementation teams were required by KDP to �le an accountability
report with the project subdistrict o¢ ce, in which they reported the prices, quantities, and total
expenditure on each type of material and each type of labor (skilled, unskilled, and foreman) used
in the project. The total amount reported must match the total amount allocated to the village.
These reports were obtained from the village by the survey team.
Obtaining an independent estimate of what was actually spent was substantially more di¢ cult,
and involved three main activities� an engineering survey to determine quantities of materials used,
a worker survey to determine wages paid by the project, and a supplier survey to determine prices
for materials. In the engineering survey, an engineer and an assistant conducted a detailed physical
assessment of all physical infrastructure built by the project in order to obtain an estimate of the
quantity of main materials (rocks, sand, and gravel) used. In particular, to estimate the quantity
of each of these materials used in the road, the engineers dug ten 40cm � 40cm core samples
at randomly selected locations on the road and measured the quantities of each material in each
core sample. By combining the measurements of the volume of each material per square meter
of road with measurements of the total length and average width of the road, I can estimate the
total quantity of materials used in the road. I also conducted calibration exercises to estimate a
�loss ratio,� i.e., the fraction of materials that are typically lost are lost as part of the normal
construction process.4
4For example, some amount of sand may blow away o¤ the top of a truck, or may not be totally scooped out ofthe hole dug by the engineers conducting the core sample. I estimated the ratio between actual materials used andthe amount of materials measured by the engineering survey by constructing four test roads, where the quantitiesof materials were measured both before and after construction. In calculating missing expenditures, I multiply theestimated actual quantities based on the core samples of the road by this loss ratio to generate the actual estimated
8
To measure the quantity of labor, workers were asked which of the many activities involved in
building the road were done with paid labor, voluntary labor, or some combination, what the daily
wage and number of hours worked was, and to describe any piece rate arrangements that may have
been part of the building of the project. To estimate the quantity of person-days actually paid out
by the project, I combine information from the worker survey about the percentage of each task
done with paid labor, information from the engineering survey about the quantity of each task,
and assumptions of worker capacity derived both from the experience of �eld engineers and the
experience from building the calibration roads.
To measure prices, a price survey was conducted in each subdistrict. Since there can be sub-
stantial di¤erences in transportation costs within a subdistrict, surveyors obtained prices for each
material that included transportation costs to each survey village. The price survey included sev-
eral types of suppliers� supply contractors, construction supply stores, truck drivers (who typically
transport the materials used in the project), and workers at quarries� as well recent buyers of
material (primarily workers at construction sites). For each type of material used by the project,
between three and �ve independent prices were obtained; I use the median price from the survey for
the analysis. To minimize the potential for reporting bias, in all cases price surveys were conducted
in villages in the subdistrict other than the village for which the data would be used. Respondents
were also not informed that the survey was related to an analysis of the road project.5
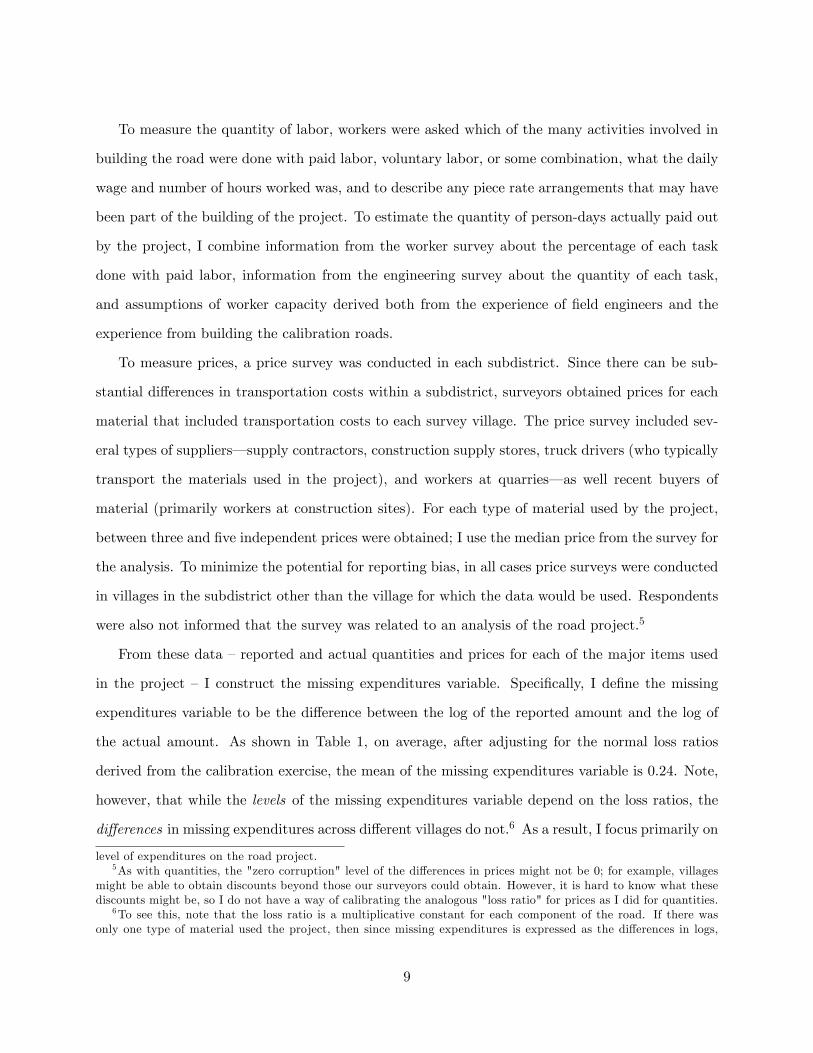
From these data �reported and actual quantities and prices for each of the major items used
in the project � I construct the missing expenditures variable. Speci�cally, I de�ne the missing
expenditures variable to be the di¤erence between the log of the reported amount and the log of
the actual amount. As shown in Table 1, on average, after adjusting for the normal loss ratios
derived from the calibration exercise, the mean of the missing expenditures variable is 0:24. Note,
however, that while the levels of the missing expenditures variable depend on the loss ratios, the
di¤erences in missing expenditures across di¤erent villages do not.6 As a result, I focus primarily on
level of expenditures on the road project.5As with quantities, the "zero corruption" level of the di¤erences in prices might not be 0; for example, villages
might be able to obtain discounts beyond those our surveyors could obtain. However, it is hard to know what thesediscounts might be, so I do not have a way of calibrating the analogous "loss ratio" for prices as I did for quantities.
6To see this, note that the loss ratio is a multiplicative constant for each component of the road. If there wasonly one type of material used the project, then since missing expenditures is expressed as the di¤erences in logs,
9
the di¤erences in missing expenditures across villages rather than on the absolute level of missing
expenditures. I also examine several alternative versions of the missing expenditures measures,
which separate out missing price and quantities, focus on missing materials expenditures only (i.e.,
exclude labor), and use various subsets of respondents from the price survey. The mean levels of
missing expenditures for each district in the study are shown in Figure 1, and the PDF of the
missing expenditures, in�ated prices and missing quantities variables are shown in Figure 2.
3 Comparing perceptions with missing expenditures
3.1 The information content of villagers�reported perceptions
I begin by estimating whether villagers�reported corruption perceptions contain any information
about missing expenditures. I consider both versions of the corruption perceptions variable de-
scribed above �the categorical response variable and a dummy variable for any positive probability
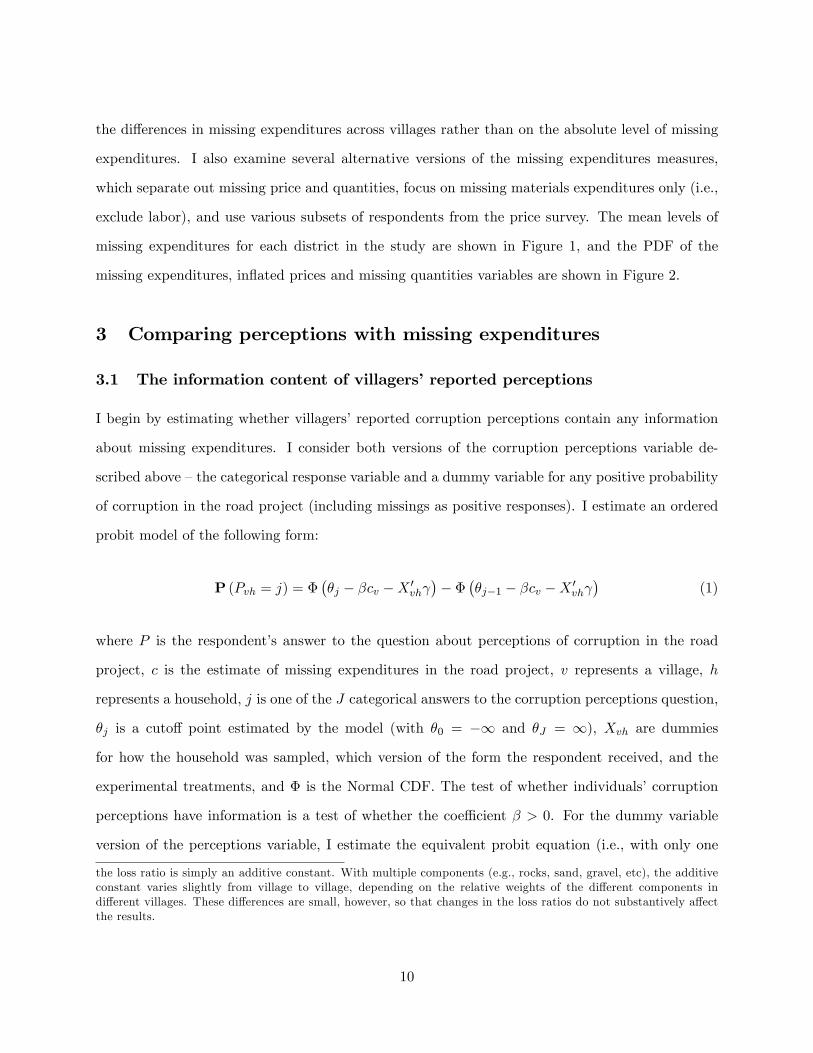
of corruption in the road project (including missings as positive responses). I estimate an ordered
probit model of the following form:
P (Pvh = j) = ���j � �cv �X 0
vh �� �
��j�1 � �cv �X 0
vh �
(1)
where P is the respondent�s answer to the question about perceptions of corruption in the road
project, c is the estimate of missing expenditures in the road project, v represents a village, h
represents a household, j is one of the J categorical answers to the corruption perceptions question,
�j is a cuto¤ point estimated by the model (with �0 = �1 and �J = 1), Xvh are dummies
for how the household was sampled, which version of the form the respondent received, and the
experimental treatments, and � is the Normal CDF. The test of whether individuals�corruption
perceptions have information is a test of whether the coe¢ cient � > 0. For the dummy variable
version of the perceptions variable, I estimate the equivalent probit equation (i.e., with only one
the loss ratio is simply an additive constant. With multiple components (e.g., rocks, sand, gravel, etc), the additiveconstant varies slightly from village to village, depending on the relative weights of the di¤erent components indi¤erent villages. These di¤erences are small, however, so that changes in the loss ratios do not substantively a¤ectthe results.
10
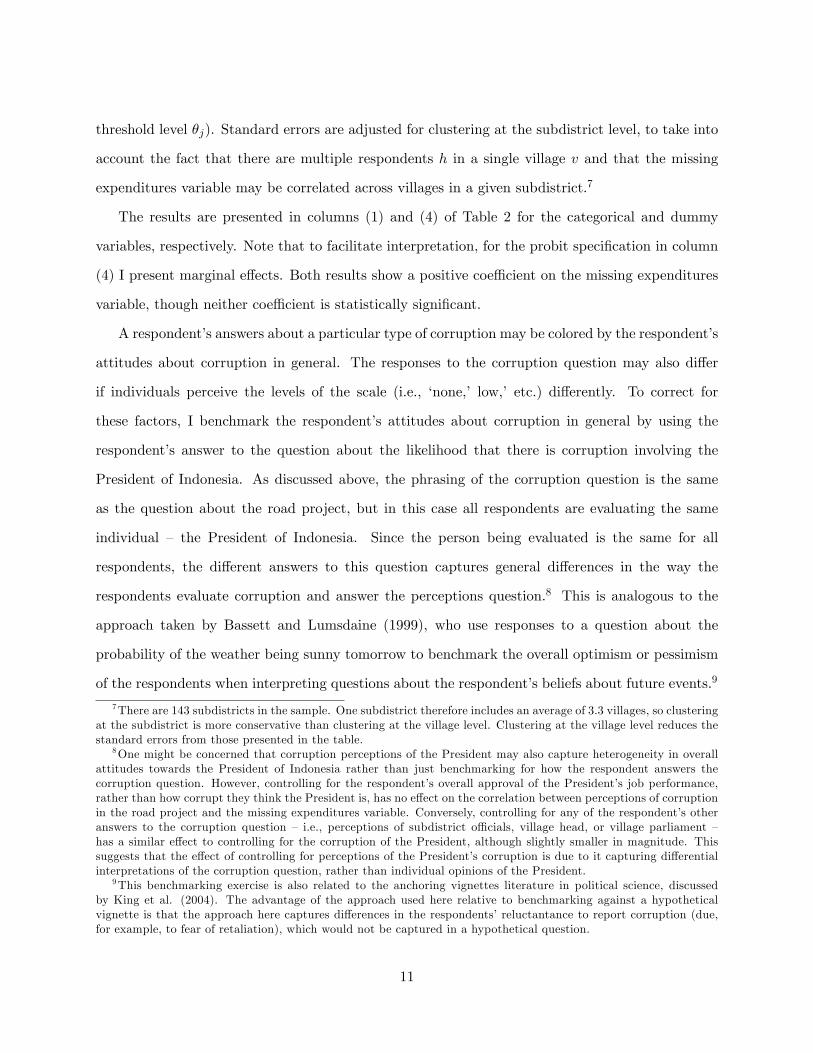
threshold level �j). Standard errors are adjusted for clustering at the subdistrict level, to take into
account the fact that there are multiple respondents h in a single village v and that the missing
expenditures variable may be correlated across villages in a given subdistrict.7
The results are presented in columns (1) and (4) of Table 2 for the categorical and dummy
variables, respectively. Note that to facilitate interpretation, for the probit speci�cation in column
(4) I present marginal e¤ects. Both results show a positive coe¢ cient on the missing expenditures
variable, though neither coe¢ cient is statistically signi�cant.
A respondent�s answers about a particular type of corruption may be colored by the respondent�s
attitudes about corruption in general. The responses to the corruption question may also di¤er
if individuals perceive the levels of the scale (i.e., �none,� low,� etc.) di¤erently. To correct for
these factors, I benchmark the respondent�s attitudes about corruption in general by using the
respondent�s answer to the question about the likelihood that there is corruption involving the
President of Indonesia. As discussed above, the phrasing of the corruption question is the same
as the question about the road project, but in this case all respondents are evaluating the same
individual � the President of Indonesia. Since the person being evaluated is the same for all
respondents, the di¤erent answers to this question captures general di¤erences in the way the
respondents evaluate corruption and answer the perceptions question.8 This is analogous to the
approach taken by Bassett and Lumsdaine (1999), who use responses to a question about the
probability of the weather being sunny tomorrow to benchmark the overall optimism or pessimism
of the respondents when interpreting questions about the respondent�s beliefs about future events.9
7There are 143 subdistricts in the sample. One subdistrict therefore includes an average of 3.3 villages, so clusteringat the subdistrict is more conservative than clustering at the village level. Clustering at the village level reduces thestandard errors from those presented in the table.
8One might be concerned that corruption perceptions of the President may also capture heterogeneity in overallattitudes towards the President of Indonesia rather than just benchmarking for how the respondent answers thecorruption question. However, controlling for the respondent�s overall approval of the President�s job performance,rather than how corrupt they think the President is, has no e¤ect on the correlation between perceptions of corruptionin the road project and the missing expenditures variable. Conversely, controlling for any of the respondent�s otheranswers to the corruption question � i.e., perceptions of subdistrict o¢ cials, village head, or village parliament �has a similar e¤ect to controlling for the corruption of the President, although slightly smaller in magnitude. Thissuggests that the e¤ect of controlling for perceptions of the President�s corruption is due to it capturing di¤erentialinterpretations of the corruption question, rather than individual opinions of the President.
9This benchmarking exercise is also related to the anchoring vignettes literature in political science, discussedby King et al. (2004). The advantage of the approach used here relative to benchmarking against a hypotheticalvignette is that the approach here captures di¤erences in the respondents�reluctantance to report corruption (due,for example, to fear of retaliation), which would not be captured in a hypothetical question.
11
The results, controlling for dummies corresponding to the di¤erent possible answers to the
question about how corrupt the President is, are presented in columns (2) and (5). The responses
to the corruption question on the road project and the corruption question about the President are
positively correlated (the dummy versions of these variables have correlation coe¢ cient 0.16, p <
0.001). Controlling for perceptions of how corrupt the President is substantially strengthens the
results, increasing both the magnitudes and the statistical signi�cance in both speci�cations.10
However, even controlling for the individual�s response about how corrupt the President is, it is
possible that the correlation between missing expenditures in the road project and perceptions of
corruption in the road project re�ects only villagers�perceptions of the average levels of corruption
in their village, rather than speci�c information about the road project per se.
To examine whether villagers have speci�c information about the road project per se, I estimate
an alternative version of equation (1) that also controls as �exibly as possible for villagers�reported
perceptions about the general level of corruption in the village, denoted by q:
P (Pvh = j) = ���j � �cv �X 0
vh � q0��� �
��j�1 � �cv �X 0
vh � q0��
(2)
To capture as �exibly as possible the respondents�general corruption perceptions q, I include in q
the respondents�answers to the corruption questions about subdistrict o¢ cials, the village head,
and the village parliament (none of whom have any o¢ cial role in the road project), as well as
a variety of respondent-level control variables � age, gender, per-capita expenditure (predicted
from assets), participation in social activities, and family relationships to government and project
o¢ cials. (The role of these respondent-level variables in predicting perceptions will be discussed
in more detail in Section 4.1 below.) As can be seen in columns (3) and (6) of Table 2, adding
these many additional control variables reduces the standard errors but does not change the point
estimates. This is despite the fact that, to take just one example, the correlation of respondents�
10A natural question is why controlling for beliefs about the President changes the point estimates on the correlation,rather than just reduces the standard errors. However, if all people in a certain area believe there is more corruption,they may monitor more, reducing actual corruption levels. In fact, as discussed in Section 4.2 below, the data isconsistent with this mechanism �individuals who report any corruption in involving the President are more likely toattend one of the project accountability meeting. Such a mechanism would attenuate the raw correlation betweenbeliefs and actual corruption unless one also controls for the overall average beliefs about corruption.
12
perceptions of corruption involving the village head and corruption involving the road project is 0.4.
Thus, despite the relatively high correlation of these perceptions of di¤erent types of corruption, the
results suggest that villagers are actually able to distinguish between general levels of corruption
in the village and corruption in the road project in particular.
To interpret the magnitudes of the estimated coe¢ cients, consider the probit speci�cation. The
point estimate in column (6) suggests that a 10 percent increase in missing expenditures above the
mean level � i.e. an increase of 0.024 from the mean level of 0.24 �would be associated with an
increase in the probability the respondent reports any corruption in the project of 0.0030, or an
increase of about 0.8 percent over the mean level of 0.36. Put another way, the �elasticity� of a
respondent reporting any likelihood of corruption with respect to the missing expenditures variable
is about 0.08. Calculating the marginal e¤ects from the ordered probit speci�cations gives results
of similar magnitudes. While there is information about actual corruption levels in perceptions,
the magnitude of this information is weak.
An important question is whether this weak correlation is merely the result of measurement
error in the missing expenditures measure, or actually re�ects the fact that households have little
information. Recall that to construct the missing expenditures measure, I used data from 10
core samples of each road, and between 3-5 price quotations for each type of materials used. To
investigate the role of measurement error, for each road I randomly split these 10 core samples
and 3-5 price quotations into two groups of 5 core samples and 1-3 price quotations each, and use
these subsamples of measurements to construct two di¤erent estimates of missing expenditures for
each village. I then repeat the regressions in columns (4) - (6) of Table 2 instrumenting for the
measure of missing expenditure constructed using the �rst set of measurements with the measure
of missing expenditure constructed using the second set of measurements. For comparison, OLS
results (analogous to columns 4-6 of Table 2) are shown in Panel A of Table 3; the results using
instrumental variables to correct for measurement error are shown in Panel B of Table 3. The
estimates in Panel B are only slightly larger than in Panel A (e.g., the coe¢ cient in column (3)
increases from 0.109 in the OLS to 0.128 in the IV correcting for measurement error). Thus, at
least to the extent I can detect it here, measurement error alone does not seem to explain the low
13
correlation between perceptions and missing expenditures.
3.2 Di¤erential accuracy: prices vs. quantities
There are multiple methods village o¢ cials can use to hide corruption, and some of these methods
may be easier for villagers to detect than others. In particular, village o¢ cials who steal a given
amount have two options for how to account for this missing money in the accounts �they can either
in�ate the price paid for the materials procured, or they can in�ate the quantities of the materials
procured (or both). To examine how perceptions of corruption are formed, I re-estimate equation
(1) with the missing expenditures variable separated into variables representing its constituent parts
��in�ated prices�and �missing quantities.�Speci�cally, I de�ne �in�ated prices�as the di¤erence
in logs between the prices reported by the village and the prices measured by the independent survey
team, weighted by the quantities reported by the village; similarly, I de�ne �missing quantities�as
the di¤erence in logs between the quantities reported by the village and the quantities measured by
the independent survey team, weighted by the prices reported. In�ated prices therefore captures
markups in prices, while missing quantities captures markups in quantities.
The results are presented in Table 4. All speci�cations con�rm that villagers�perceptions of cor-
ruption in the project are strongly positively correlated with price markups, and only very weakly
(and statistically insigni�cantly) correlated with markups in quantities. The estimated magni-
tudes for in�ated prices are approximately double the magnitudes for missing expenditures overall.
Market prices for commodities are commonly known to villagers, but quantities of commodities
delivered are very di¢ cult to estimate without careful measurement, even for trained engineers;
therefore, it is not surprising that villagers are better at detecting marked-up prices than in�ated
quantities.
Given this result, it is interesting to compare the overall average levels of the in�ated prices and
missing quantities variables. After all, if villagers can detect marked-up prices but cannot detect
marked-up quantities, village o¢ cials would in general choose to hide their corruption by in�ating
quantities rather than marking up prices. As discussed above, one needs to interpret the levels of
the missing expenditures variables with caution, because the levels of these variables depend on
14
assumptions about the loss ratios and on the ability of surveyors to obtain exactly the same prices
as the villages procuring the material for the project. Nevertheless, the levels of the in�ated prices
and quantities variables are precisely what one would expect given the perceptions results: all of
the missing expenditures are hidden by in�ating quantities, not by in�ating prices. Speci�cally, as
shown in Table 1, the mean level of the missing quantities variable is 0.24, while the mean level
of the in�ated prices variable is -0.014, very close to zero.11 Thus, on average the vast majority
of the missing expenditures appears to be occurring exactly where villagers cannot detect it. This
raises the possibility that the relatively low correlation between reported perceptions and missing
expenditures may in part re�ect the strategic behavior of savvy corrupt o¢ cials who deliberately
choose the types of corruption that are hardest to detect.12 It also suggests that there may be
limits in the degree to which villagers can e¤ectively monitor corruption, at least in the absence of
external help detecting it.
3.3 Robustness to alternative missing expenditures measures
The missing expenditures measure variable contains four types of data: data from the accounting
book for the roads project, data from the engineer�s assessment of the road project, a price survey,
and a labor survey. Although the accounting data and the engineering data are objective measures,
and not subject to reporting biases, it is possible that respondents might systematically misreport
their answers to the price or the labor survey. If the same omitted variable �say, ethnic hetero-
geneity � led to misreporting of corruption perceptions and misreporting on the price and labor
components, it is possible that the omitted variable could be generating the correlations uncovered
in the previous sections.
To examine this possibility, in Table 5, I therefore repeat the analysis above using di¤erent
missing expenditures measures that progressively seek to eliminate as much potential for reporting
11 In�ated prices could be less than 0 if, for example, villages purchasing materials received bulk discounts onpurchase prices that were not o¤ered to the independent survey team.12A natural question is how to reconcile the facts that 1) there appears to be no price-markups on average and 2)
villagers are able to detect price-markups. The answer is that the fact that the average price-markup being 0 masksthe fact that some villages had higher-than-market prices, and others had lower-than-market prices. Villagers appearto detect these di¤erences, and they are correlated with corruption perceptions. Perhaps the village o¢ cials in thosevillages where prices were marked-up did not realize that prices would be easier to detect than quantities.
15
bias from the missing expenditures variable as possible.13 First, to exclude potential biases from
the labor survey, I examine missing materials expenditures �i.e. missing expenditures on the three
main materials (rock, sand, and gravel) that go into the road project. This variable uses no data
from the labor survey. Panel A of Table 5 replicates the regressions in Table 2 examining missing
materials expenditures, and Panel B replicates the regressions in Table 4 using missing materials
prices and missing materials quantities. As is evident from Table 5, these results, which exclude all
information from the labor survey entirely, are very similar to the main regression results, suggesting
that reporting biases in the labor survey are not driving the results.
To examine potential biases in the price survey, I exploit the fact that the price survey in-
terviewed three di¤erent types of respondents � sellers of materials who had supplied materials
to any KDP program (KDP is the village infrastructure scheme studied in this paper), sellers of
materials who did not supply materials to any KDP program, and a small numbers of independent
buyers of materials (i.e., private individuals engaged in construction projects in the area). If there
were systematic reporting biases, one would expect them to be most severe for those respondents
who actually supplied to the KDP program. Moreover, one would expect very di¤erent types of
misreporting for sellers and buyers.14
Panel C of Table 5 presents results using price data only from non-KDP sellers of materials,
and Panel D of Table 5 presents results using price data only from independent buyers of materials.
The results in Panel C are virtually identical to the results in Panel B, showing that there is
no di¤erence from excluding prices from those who sell to the project. The results in Panel D,
where I use information from buyers only, are somewhat smaller and weaker statistically that the
main results, but remain positive in all cases and cannot be statistically distinguished from the
main results. The slightly smaller point estimates are likely explained by the fact that I have very
few buyer observations per village (there are an average of only 0.87 buyers surveyed in the price
survey per village (i.e., not all villages had a buyer surveyed), as compared to 6.24 price surveys
13Section 4.2 below discusses other tests for reporting biases in the corruption perceptions surveys.14 It is also important to recall that, as discussed above, all data on the price surveys came from interviews in
surrounding villages, not from the village in question. Those being surveyed were also not informed that the surveyhad anything to do with the road-building project. These two sample design considerations were to minimize thepossibility of reporting biases in the price survey.
16
for all types of observations), increasing measurement error in prices and creating attenuation bias.
All told, the results suggest that systematic misreporting on the labor and price components of
the missing expenditures survey is not substantially driving the correlations between corruption
perceptions and missing expenditures established in the previous section.
4 Biases and feedback
4.1 Are corruption perceptions systematically biased?
This section examines whether certain types of individuals are systematically biased in their re-
ported perceptions about corruption. To do so, I re-estimate a version of equation (2) that includes
village �xed e¤ects in addition to respondent-level variables. Since the actual level of corruption in
the road project does not vary within the village �after all, there is only one road project in each
village � if there are no individual biases, then once village �xed e¤ects are included and once I
benchmark for how respondents perceive the di¤erent possible answers to the corruption question,
none of the individual characteristics in the regression should systematically predict corruption
perceptions. If they do, then we know that those types of individuals described by the variable
in question are systematically biased either towards reporting or not reporting corruption in the
project.15
Given the incidental parameters problem, rather than estimate an ordered probit or probit
model with a large number of dummy variables for each village, I instead estimate an OLS models
with village �xed e¤ects using the linearized version of the corruption perceptions variable (where
the categorical responses are put on a scale from 0 to 1), and a conditional logit model with the
dummy version of the corruption perceptions variable.16 The coe¢ cients in the conditional logit
15 In interpreting these results, it is important to note that while I can estimate whether bias exists, I do not knowwhich individuals are �biased�and which are �unbiased�. The reason is that the dependent variable, perceptions ofcorruption, does not have a numeric scale that we know should be comparable to the missing expenditures variable.Thus, unlike the literature evaluating subjective probabilities (e.g., Dominitz and Manski 1997, Hurd and McGarry2002), I cannot say which individuals are right and which are wrong or whether the perceived level of corruption is�right on average�; rather, I can only say that conditional on the actual level of corruption, those with high educationare more likely to report higher levels of corruption than those with low levels of education.16Speci�cally, for the linearized version, I assign a value of 0 to a response of �none�, 1 to a response of �low�, 2 to
a response of �medium�, etc. Note that for the dummy version of the variable, I �nd that linear probability modelswith �xed e¤ects, rather than conditional logit models, produces qualitatively similar results.
17
models can be interpreted as log odds-ratios.
The results are presented in Table 6. For each dependent variable, I present two sets of results �
one with no additional controls, and one controlling for perceptions about the President, to control
for the fact that some respondents may have interpreted the multiple response categories di¤erently
from others.
Individual-level biases in reported perceptions appear quite signi�cant. Conditional on village
�xed e¤ects, better educated respondents and male respondents tend to report more corruption;
those who participate in the types of social activity where the project was likely to be discussed,
those who live near the project, and (naturally) those who are related to the head of the project all
tend to report less corruption.17 Taken together, these individual level biases are highly signi�cant
�the p-value from a joint test of these characteristics is less than 0.01 in all speci�cations.
Not only are these biases statistically signi�cant, they are large in magnitude as well. For exam-
ple, the results show that each year of education makes an individual between 5 and 7 percentage
points more likely to report corruption in the project. This implies that, holding actual corruption
levels constant, the �elasticity� of the probability of reporting any likelihood of corruption with
respect to the respondent�s education is between 0.17 and 0.22 � considerably larger than the
impact of the actual missing expenditures variable discussed above.
The main conclusion from these results is that these individual biases are very substantial,
especially when compared to the magnitude of the correlation between missing expenditures and
reported corruption perceptions found above. This suggests that the signal-to-noise ratio in re-
ported perceptions is quite low, which may also help explain the low overall correlation between
perceptions and missing expenditures.
4.2 Biased beliefs vs. biased reporting
An important question is whether the biases in corruption perceptions documented above represent
systematic di¤erences in individuals�true beliefs about the level of corruption, or are instead biases17An interesting question is whether these individual characteristics lead to respondents being more or less accurate
at detecting corruption, not just biased. To examine this, I also interacted each of these individual characteristicswith the missing expenditures variable. Across a wide range of speci�cations, I found no evidence of such interactions(results not reported).
18
in how individuals report their true beliefs. If there are biases in true beliefs, those biases might
a¤ect the degree to which individuals monitor corruption and punish corrupt o¢ cials, whereas if
they are biases in reporting, they might not.18
Since true beliefs cannot be observed directly, it is impossible to conclusively disentangle biased
beliefs from biased reporting. However, there are several ways we can begin to make progress on
this issue. First, 630 respondents in villages receiving the �comment form�experimental treatment
(Olken 2007) were randomly allocated to receive one of two versions of the survey form: Form
A, in which respondents were reminded that their responses to the corruption questions would
be con�dential, and Form B, in which respondents were told that while their responses to the
corruption questions would be con�dential, they would be summarized and a summary would be
read at a village �accountability meeting�.19 The purpose of this randomization was to investigate
whether respondents would change the reported amounts of corruption if they knew it the results
would feed back into the village monitoring process.20
The e¤ects of the Form B treatment are investigated in Table 7. First, Columns (1) and (3)
of Table 7 repeat the same regressions in Table 6 on the subsample of individuals where the Form
B randomization was conducted, using both the linearized and dummy version of the reported
corruption perceptions variable, respectively.21 As in Table 6, the linearized versions are analyzed
using OLS �xed e¤ects models, and the dummy versions are analyzed using conditional logit models.
The coe¢ cient on receiving the Form B results show no signi�cant di¤erences in the average level
of reported corruption between the two versions of the form.
Next, columns (2) and (4) of Table 7 report results where I interact all of the respondent
characteristics in Table 6 with the Form B dummy. To the extent that the individual level biases
documented in Table 6 are reporting biases, rather than belief biases, we expect them to be more
18A model developing this point explicitly can be found in the working paper version of this paper (Olken 2006b).19These accountability meetings occur in all villages as part of the normal KDP process; the only di¤erence due to
the randomization is whether survey respondents were told that their responses to the corruption question would beincluded in the aggregated, anonymous comments discussed at the accountability meeting.20Note that all regressions in the paper include a Form B dummy variable, to ensure that this randomization is
not a¤ecting the main results.21The one variable from Table 6 that is not included is the "attend develompent meeting" variable, because those
households who were sampled because they attended the development meetings were not included in the FormA/Form B experiment. The number of observations in these regressions is less than 630 due to missing values ofseveral covariates.
19
pronounced with the Form B version of the form �i.e., reporting biases should be more pronounced
for those people who are told that their responses will actually be used to inform the political
decisions surrounding monitoring the project. The p-value from a joint test of all interactions is
included at the bottom of the table.
The results from this test provide little evidence for systematic reporting biases. Only two
interactions with the Form B variable (with respondent age and a female dummy) are statistically
signi�cant, and even these variables are only signi�cant on the linearized variable, not the categorical
variable. In fact, the point estimate on the Form B � female variable is actually of the opposite
sign in column (4) when the dummy corruption variable is used. The p-value from the joint test
of all Form B interactions is 0.11 in column (2) (linearized corruption variable) and 0.63 in column
(4) (dummy corruption variable). Though this test is by no means de�nitive, it suggests that many
of the biases found here may represent biases in beliefs rather than biases in reporting.
A second way of examining whether the biases in corruption perceptions shown in Table 6 are
actually biases in beliefs is to examine whether they translate into di¤erent levels of monitoring
activity, i.e., are those individuals who report that there is more corruption more likely to participate
in monitoring local o¢ cials? To separate out biases in beliefs from actual information about
corruption, I consider the following question: conditional on village �xed e¤ects (so holding actual
levels of corruption constant), are those individuals who report that the President of Indonesia
is more likely to be corrupt more likely to attend monitoring meetings for the road project? By
looking at corruption perceptions about the President of Indonesia, rather than the road project,
I isolate the relationship between monitoring and general attitudes about corruption, and exclude
idiosyncratic information the respondent might have had about the road project per se that might
cause him or her to attend a monitoring meeting.
To investigate this, Table 8 presents the results from a conditional logit regression, where the
dependent variable is a dummy for attending either any village meeting about the road project
(columns 1 and 2) or attending an �accountability meeting� for the road project (column 3 and
4), where village o¢ cials are required to account for how they spent the project funds. The key
independent variable is corruption perceptions of the President, either the linear measure (columns
20
1 and 3) or the dummy variable version. All household controls from Table 6 are included in the
regression, and the village is the conditioning variable. The coe¢ cients can be interpreted as log
odds ratios.
The results show that those individuals who report that the President of Indonesia is likely to be
corrupt are substantially more likely to attend monitoring meetings about the road project. Taking
the point estimates in column (4), for example, individuals who report any corruption involving
the President of Indonesia are 58% (0.458 log points) more likely to attend project monitoring
meetings than individuals who do not report any corruption involving the President. These results
provide suggestive evidence not only that some of the biases in reported corruption may represent
real beliefs, not just reporting biases, but also that these biases in beliefs may translate into real
monitoring behavior.
4.3 Are aggregate biases substantial?
The previous section showed that certain types of individuals are systematically biased in their
perceptions of corruption, and presented some suggestive evidence that these biases are correlated
with actual decisions about how much to monitor potentially corrupt o¢ cials. For these biases to
feed back to a¤ect monitoring and, ultimately, corruption levels, these individual biases would have
to be both large and correlated with village characteristics.
This section examines empirically whether aggregate biases are substantial enough to e¤ect
qualitative conclusions about the correlates of corruption. In doing this, it is important to note
that I do not necessarily claim a causal interpretation of the relationship between these variables
and corruption; rather, the main question of interest is the consistency of the partial correlations
between these variables and corruption across the various ways of measuring corruption.
To examine aggregate biases, I estimate the following two regressions via OLS:
ecv = �1 + Z0v�2 + "v (3)
ePvh = �1 + Z0v�2 ++X
0vh�3 + �
0v (4)
21
and examine the the similarity or di¤erence between the coe¢ cients �2 and �2, which capture the
impact of village characteristics Z on missing expenditures and perceived corruption, respectively.
To obtain the most comparable possible coe¢ cients across these very di¤erent measures, I normalize
all of the corruption measures to have mean 0 and standard deviation 1, so that all coe¢ cients
can be interpreted in terms of standard deviation changes in the corruption measure. I denote the
normalized versions of missing expenditures by ecv and the normalized version of perceptions byePvh.22 That being said, I will focus primarily on those results for which the estimated coe¢ cients�2 and �2 are of di¤erent sign, not just of di¤erent magnitude, so as not to rely too heavily on this
normalization.23
The results are presented in Table 9. Column (1) presents the results when missing expenditures
is the dependent variable, columns (2) and (3) present the result when the scaled linear version of
perceptions is the dependent variable, and columns (4) and (5) present the results when the scaled
dummy version of perceptions is the dependent variable. Columns (2) and (4) do not include the
controls for corruption perceptions of the President, the village head, etc. or the respondent-level
characteristics included in Table 6; columns (3) and (5) do.
The results suggest that for identifying the e¤ects of basic demographic characteristics, such
as population and education, the results from perceptions (columns 2-5) appear to give similar
22For the categorical-response perceptions variable, I impose a linear scale on the variable, and then normalize thislinearized variable to have mean 0 and standard deviation 1. Although this imposes a linearized form on categoricalresponse variable, as discussed in footnote 16 above, in other speci�cations OLS regressions using this linearizedvaraible produce qualitatively similar results to the ordered probit speci�cations, which suggests that the linearassumptions are not substantially a¤ecting the resuts. I have also considered ordered probit and probit versionsof equation (4), and they produce qualitatively similar results to those in Table 9 below. Similarly, for the binarydependent variable, I normalize the variable to have mean 0 and standard deviation 1.23An alternative, equivalent approach which does not rely on these normalizations is as follows. Suppose the true
model of the world is:
cv = �1 + Z0v�2 + "v (5)
Bvh = e�1 + Z0ve�2 ++X 0vhe�3 + e�4cv + e�0v (6)
The coe¢ cient of interest is �2, the e¤ect of village characteristics Z on real corruption levels. In most circumstances,c is unobserved. If we assume that e�2 = 0 (i.e., Zv a¤ects Bvh only through its e¤ect on cv), then the estimatedcoe¢ cient �2 in equation (4) in the text will be equal to �2, the coe¢ cient of interest. In the setting here, we alsoobserve c, so we can estimate (6) directly and test whether e�2 = 0 - i.e., we can test directly whether Z has nodirect e¤ect on perceptions other than through its e¤ect on the percent missing. This is equivalent to testing whether�2 = �2 in equations (3) and (4) in the text. Estimating (6) and testing whether e�2 = 0 yields similar results to thosepresented in Table 9 and discussed below. In particular, the coe¢ cients e�2 in equation (6) are statistically signi�cantlydi¤erent from 0 for the mean village education level, ordinances from village parliament, social participation, andvillage ethnic fragmentation.
22
results to the more objective missing expenditures measure (column 1). But when considering
characteristics related to trust �such as ethnic heterogeneity and social participation �examining
the impact on corruption perceptions rather than actual corruption may lead to biased conclusions.
Of particular note are the estimates on ethnic heterogeneity. The cross-country corruption
literature has found that heterogeneity is positively associated with corruption perceptions (e.g.,
Mauro 1995, LaPorta et al 1999). Following the standard approach in the literature, I construct
as a measure of ethnic and religious heterogeneity the probability that two randomly drawn indi-
viduals are from di¤erent ethnic or religious groups, respectively.24 Consistent with the literature,
I �nd that ethnic heterogeneity is associated with greater perceived levels of corruption. Specif-
ically, moving from a village with no ethnic heterogeneity to a village with the maximum ethnic
heterogeneity in the sample (0.51) is associated with an increase of between 0.65 and 1 standard
deviations in the perceived corruption measure, equivalent to an increase of about 50 percentage
points in the probability of reporting positive corruption in the project.25 However, when I exam-
ine the relationship between ethnic heterogeneity and the missing expenditures measure, I get the
opposite result �moving from a village with no ethnic heterogeneity to a village with the maximum
ethnic heterogeneity in the sample is associated with a decrease in the percent missing variable of
about 0.73 standard deviations. The coe¢ cients on religious fragmentation show a similar pattern
�a large negative coe¢ cient when missing expenditures is the dependent variable, and coe¢ cients
much closer to zero (and in some cases positive) when perceptions are the dependent variable �
though the results on religious heterogeneity are not statistically signi�cant.
One possible explanation for these di¤erences is, much as respondents who believe the President
of Indonesia is more likely to be corrupt are more likely to go to monitoring meetings (see Section 4.2
above), ethnic heterogeneity lowers the level of trust in the village �resulting in higher perceived
levels of corruption, more monitoring, and lower actual corruption. In fact, there is suggestive
24Overall, the sample is relatively homogeneous �the probability that two individuals in the same village are fromdi¤erent ethnic groups is greater than 0.05 in only 9 percent of villages, and the probability that two individualsin the same village are from di¤erent religious groups is greater than 0.05 in only 10 percent of villages. In resultsnot reported in the table, I have veri�ed that the results are qualitatively similar if I remove outliers in the ethnicheterogeneity variable.25Moreover, controlling for the overall heterogeneity in the village, those respondents whose ethnic group di¤ered
from that of the village head were 12 percentage points more likely to report positive probability of corruption in theproject (results not shown).
23
evidence consistent with this explanation. The household survey asked respondents a version of the
World Values Survey trust question, in which respondents were asked about the degree to which
they trust other residents of the village.26 On average, 52% of residents in villages with ethnic
heterogeneity less than 0.05 reported trusting their fellow villagers, whereas only 36% of residents
in villages with ethnic heterogeneity greater than 0.05 reported trusting their fellow co-residents.
To examine this relationship more systematically, columns (6) and (7) of Table 9 regress trust-
ing other villagers on the same set of village characteristics used before. The results (which are
expressed as standard deviations to be comparable to other rows in the tables) show the negative
relationship between ethnic heterogeneity and trust is statistically signi�cant (column 6), though it
attenuates very slightly when we also include individual respondent covariates (column 7). More-
over, in high ethnic heterogeneity villages (de�ned similarly using the 0.05 threshold), the number
of people who attend accountability meetings was 22% higher than in villages with low ethnic het-
erogeneity27 These �ndings provide suggestive evidence that lower levels of trust correlated with
ethnic heterogeneity lead to more negative corruption perceptions, which in turn lead to higher
levels of monitoring, lowering actual corruption levels.28
A similar e¤ect to ethnic heterogeneity � though in the opposite direction � can be seen by
looking at the social participation variables. I de�ne the intensity of social participation as the
average number of times an adult in the village participated in a social group of any kind in
the past 3 months. This measure is obtained from a census of social groups obtained from the
head of each hamlet. As can be seen in Table 9, increased participation in social groups in the
village is associated with a decrease in perceived corruption levels. This is consistent with the
results reported by Putnam (1993). But when we look at the actual corruption level, we �nd, if
26Speci�cally, they were asked: �In general, do you think that other residents of the village can be trusted, or youhave to be careful in dealing with them?�The variable is coded 1 if the respondents say they can trust other residentsof the village, and 0 if they say they have to be careful in dealing with them.27This di¤ernce is statistically signi�cant at the 1% level. The point estimates are virtually identical if the village-
level characteristics included in Table 9 are included as well (except, obviously, ethnic heterogeneity). Using a linearethnic heterogeneity measure, rather than the discrete cuto¤ for ethnic heterogeneity greater than 0.05, gives verysimilar results.28This feedback mechanism may also explain the di¤erence between the result in this paper that ethnic hetero-
geneity leads to less corruption and results elsewhere. For example, the rice program studied in Olken (2006a) hadno participatory monitoring mechanism, so the feedback mechanism postulated here between ethnic heterogeniety,increased monitoring, and less corruption would not have occurred in the case of the rice program.
24
anything, that increased social participation is associated with higher measured corruption levels,
though the point estimate is statistically insigni�cant. Similar, though weaker, di¤erences between
the perceptions variable and missing expenditures appear when we consider a measure of whether
there is a political opposition in the village that could potentially monitor the project �the degree
of activeness of the village parliament, or BPD.29
4.4 Using perceptions to detect experimental impacts
Given the di¢ culties in measuring corruption directly, an important question is the degree to which
perceptions data can substitute for more direct measures of corruption in cases where the latter
is di¢ cult or infeasible to collect. To examine this, Table 9 also examines how the experimental
results reported in Olken (2007) would have di¤ered had the perceptions-based measure been used
to evaluate corruption instead of the missing expenditures measure. As described above, there were
three experimental interventions in these villages �an audit treatment, in which villages were told
in advance that they would be audited by the central government audit agency with probability
1, an invitations treatment, where hundreds of written invitations were passed out to villagers to
attend accountability meetings, and an anonymous comment form treatment, where villagers were
able to give comments about the project without fear of retaliation.
As can be seen in column (1) of Table 9, the audit intervention was associated with a sta-
tistically signi�cant reduction in missing expenditures of about 0.3 standard deviations, whereas
the invitations and invitations plus comment forms treatments were associated with a very small,
and statistically insigni�cant, reduction in the missing expenditures variable. By contrast, when
examining the perceptions variable, the audit treatment has a much smaller (and in most speci�-
cations not statistically signi�cant) e¤ect, and the invitations and invitations plus comment form
treatments are associated with increases in the perceptions of corruption, in some cases statisti-
cally signi�cantly so. The conclusions from the study would therefore have been quite di¤erent had
29To measure how active the BPD was, I examine the number of ordinances the BPD had issued in the previousyear. Though the BPD coe¢ cients are not separately signi�cant in either the missing expenditures or perceptionsregressions, the di¤erence between them appears to be statistically signi�cant using the method discussed in footnote23. I also consider another measure of transparency in the project �whether a written report of project expenseswas provided at a village accountability meeting �though the results are not conclusive in either direction.
25
perceptions been the main measure of corruption, rather than missing expenditures.
In this particular case, we can speculate as to some of the speci�c reasons why perceptions
and actual corruption would respond di¤erently to the experimental treatments. For example, as
reported in Olken (2007), the audits primarily resulted in a reduction in missing quantities, whereas
the results in Table 4 show that villagers are much better at detecting in�ated prices. Villagers�
perceptions of corruption do not detect precisely the type of corruption where the experiments
had the greatest impact. Also, one can also easily imagine that anonymous comment forms would
increase people�s perceptions of corruption by providing information about corruption, while in
fact having the opposite e¤ect on actual corruption levels. More generally, the di¤erence in the
results between the two types of measures highlights the importance of obtaining unbiased, direct
measures of corruption.
5 Conclusion
This paper has examined the relationship between perceptions of corruption and a more objective
measure of corruption, in the context of a road building program in rural Indonesia. The paper
shows empirically that villagers� perceptions of corruption do appear to be positively (though
weakly) correlated with the more objective missing expenditures measure. Moreover, villagers
appear to be able to distinguish between the overall probability of corruption in the village and
corruption speci�c to the road project.
Despite this, the magnitude of the correlation between reported corruption perceptions and
missing expenditures is small. In part, this may be because, on average, almost all of the corruption
in the project was hidden by in�ating quantities, which are hard for villagers to detect, rather than
marking up prices, which are easier for villagers to detect. This suggests an important feedback
mechanism between transparency � which increases the ability of citizens to detect corruption
� and corruption levels. It also suggests that, at least in this case, villagers do not currently
possess enough capability to detect corruption to e¤ectively monitor local o¢ cials, at least without
additional external help.
26
I then examine the extent of biases in corruption perceptions. The results show that there are
signi�cant individual-level biases in how respondents answer the corruption question. Moreover,
there is evidence that for some village level characteristics, particularly those associated with levels
of trust, such as ethnic heterogeneity and social participation, using perceptions to measure corrup-
tion can produce very di¤erent answers from the results obtained using a more objective measure of
corruption. I present suggestive evidence in favor of the idea that biases in individual�s views about
corruption can lead to increased monitoring behavior, which may in turn reduce corruption. These
results suggest that perceptions data should be used for empirical research on the determinants of
corruption with considerable caution, and that there is little alternative to continuing to collect
more objective measures of corruption, di¢ cult though that may be.
References
Alesina, Alberto, Reza Baqir, and William Easterly, �Public Goods and Ethnic Divisions,�Quar-terly Journal of Economics 114 (4), pp. 1243-1284, 1999.
Azfar, Omar and Peter Murrell, �Identifying reticent respondents: Assessing the quality of surveydata on corruption and values,�mimeo, University of Maryland, 2005.
Bassett, William F. and Robin L. Lumsdaine, �Outlook, Outcomes, and Optimism,� mimeo,Brown University, 1999.
Bassett, William F. and Robin L. Lumsdaine, �Probability Limits: Are Subjective AssessmentsAdequately Accurate?�Journal of Human Resources 36 (2), pp. 327-363, Spring 2001.
Bernheim, B. Douglas, �The Timing of Retirement: a Comparison of Expectations and Realiza-tions,�in David Wise (ed.), The Economics of Aging, Chicago: University of Chicago Press,pp. 259-283, 1989.
Bertrand, Marianne and Sendhil Mullainathan, �Do People Mean What They Say? Implicationsfor Subjective Survey Data,�American Economic Review 91 (2), pp. 67-72, May 2001.
Bertrand, Marianne, Simeon Djankov, Rema Hanna, and Sendhil Mullainathan, �Does CorruptionProduce Unsafe Drivers?�NBER Working Paper #12274, 2006.
Deaton, Angus, �Data and Econometric Tools for Development Analysis,� in Jere Behrman andT.N. Srinivasan (eds.), Handbook of Development Economics Volume 3, New York: NorthHolland, pp. 1785 - 1882, 1995.
Di Tella, Rafael and Ernesto Schargrodsky, �The Role of Wages and Auditing During a Crackdownon Corruption in the City of Buenos Aires,�Journal of Law and Economics 46, April 2003.
27
Dominitz, Je¤rey and Charles Manski, �Using expectations data to study subjective income ex-pectations,�Journal of the American Statistical Association 92 (439), pp. 855-862, 1997.
Beaman, Lori, Raghabendra Chattopadhyay, Esther Du�o Rohini Pande, and Petia Topalova,�Powerful Women: Does Exposure Reduce Bias?" Unappreciated Service: Performance, Per-ceptions, and Women Leaders in India,�mimeo, MIT, July 2008.
Fisman, Raymond and Shang-Jin Wei, �Tax Rates and Tax Evasion: Evidence from �MissingImports�in China,�Journal of Political Economy 112 (2), pp. 471-500, 2004.
Glaeser, Edward L. and Raven E. Saks, �Corruption in America,�Journal of Public Economics90 (6-7), pp. 1053-1072, August 2006.
Gray-Molina, George, Ernesto Pérez de Rada, and Ernesto Yeñez, �Does Voice Matter? Partici-pation and Controlling Corruption in Bolivian Hospitals,�in Rafael Di Tella and WIlliam D.Savedo¤ (eds.), Diagnosis Coruption, Washington: IADB Press, 2001.
Hsieh, Chang-Tai and Enrico Moretti, �Did Iraq Cheat the United Nations? Underpricing, Bribes,and the Oil for Food Program,�Quarterly Journal of Economics 121 (4), pp. 1211-1248,Decmber 2006.
Hurd, Michael D. and Kathleen McGarry, �Evaluation of the Subjective Probabilities of Survivalin the Health and Retirement Study,�Journal of Human Resources 30, pp. S268-S292, 1995.
Hurd, Michael D. and Kathleen McGarry, �The Predictive Validity of Subjective Probabilities ofSurvival,�Economic Journal 112, pp. 966-985, October 2002.
Jacob, Brian and Lars Lefgren, �Principals as Agents: Subjective Performance Assessment inEducation,�NBER Working Paper #11463, 2005.
Kaufmann, Daniel, Aart Kraay, and Massimo Mastruzzi, �Governance Matters IV: GovernanceIndicators for 1996-2004,�mimeo, World Bank, May 2005.
King, Gary, Christopher J.L. Murray, Joshua A. Salomon, and Ajay Tandon. �Enhancing theValidity and Cross-cultural Comparability of Survey Research,�American Political ScienceReview 98 (1), pp. 191 - 207, February 2004.
Knack, Stephen and Philip Keefer, �Institutions and Economic Performance: Cross-Country TestsUsing Alternative Institutional Measures,�Economics & Politics 7 (3), pp. 207-227, 1995.
Krueger, Anne O., �The Political Economy of the Rent-Seeking Society,�American EconomicReview 64 (3), pp. 291-303, June 1974.
LaPorta, Raphael, Florencio Lopez-de-Silanes, Andrei Shleifer, and Robert Vishny, �The Qualityof Government,�Journal of Law, Economics, and Organizations 15 (1), pp. 222 - 279, 1999.
Lambsdor¤, Johann G., �Background Paper to the 2003 Corruption Perceptions Index,�mimeo:Transparency International, September 2003.
Mauro, Paulo, �Corruption and Growth,�Quarterly Journal of Economics 110 (3), pp. 681-712,August 1995.
28
Miguel, Edward, and Mary Kay Gugerty, �Ethnic Diversity, Social Sanctions, and Public Goodsin Kenya,�Journal of Public Economics 89 (11-12), pp 2325-2268, 2005.
Mocan, Naci, �What Determines Corruption? International Evidence from Micro Data,�NBERWorking Paper #10460, May 2004.
Olken, Benjamin A., �Corruption and the Cost of Redistribution,�Journal of Public Economics90 (4-5), pp. 853-870, May 2006(a).
Olken, Benjamin A., �Corruption Perceptions vs. Corruption Reality.� NBER Working Paper#12428, July 2006(b).
Olken, Benjamin A., �Monitoring Corruption: Evidence from a Field Experiment in Indonesia,�Journal of Political Economy 115 (2), pp. 200-249, April 2007.
Putnam, Robert D., with Robert Leonardi and Ra¤aella Y. Nanetti, Making Democracy Work:Civic Traditions in Modern Italy, Princeton: Princeton University Press, 1993.
Reinikka, Ritva and Jakob Svensson, �Local Capture: Evidence from a Central GovernmentTransfer Program in Uganda,�Quarterly Journal of Economics 119 (2), pp. 679-706, May2004.
Rose-Ackerman, Susan, �The Challenge of Poor Governance and Corruption,� mimeo, Copen-hagen Consensus and Yale University, 2004.
Shleifer, Andrei and Robert W. Vishny, �Corruption,�Quarterly Journal of Economics 108 (3),pp. 599-617, August 1993.
Treisman, Daniel, �The causes of corruption: a cross-national study,�Journal of Public Economics76, pp. 399-457, 2000.
Yang, Dean, �Can Enforcement Back�re? Crime Displacement in the Context of a CommonCustoms Reform,�University of Michigan, mimeo, 2004.
Appendix: Data Details
The original data was collected in 608 total villages. The sample in this paper, however, is limitedto the 477 villages where the missing expenditures variable, described above, could be constructed.The missing expenditures variable could not be calculated in some villages for one of four reasons:(1) surveyor error in locating the road, (2) the project consisted largely of a partial rehabilitationof an existing road, (3) agglomerated expenditures reports (i.e., the village expenditure reportcombined expenditures in the road project with other projects that could not be independentlymeasured, such as a school), or (4) villages that had asphalted the road that refused to let theengineers break the asphalt to conduct the engineering survey.
The household survey was designed as a strati�ed random sample, containing between six andthirteen respondents per village, selected as follows. Two respondents were selected from the
29
hamlets in which the road was located by �rst randomly selecting a hamlet, and then randomlyselecting a neighborhood (RT) in that hamlet. A complete list of households in the RT was obtainedfrom the neighborhood head, and two households were drawn randomly from that list. Individualrespondents were drawn from a list of all adults age 18 or over in the selected households. Twoadditional respondents were selected from the hamlets in which the road was not being built usingthe same procedure. As men in the village tend to participate much more in road constructionactivities, the randomization was designed such that, of the four respondents selected in this manner,three were men and one was a women. In villages receiving the Comment Form treatment, anadditional four respondents were drawn using the same procedure, two from hamlets with theproject and two from hamlets that did not contain the project. Two respondents were drawnrandomly from the attendance list of Village Meeting II, which was held before the randomizationwas announced, and is therefore exogenous with respect to the experiments. Finally, in someComment Form villages an additional 3 respondents were added, randomly selected from the twoneighborhoods above (the reasons for this will be discussed below). Each respondent receivedcompensation of Rp. 10,000 ($1.20), equal to slightly more than half of the typical daily agriculturalwage in the study area.
Given this sample selection, a natural question is whether the sample should be re-weightedto re�ect the fact that di¤erent respondents had di¤erent probabilities of being sampled. As isapparent from the description of the sampling, women were systematically undersampled, andthose who attended a pre-randomization village meeting were systematically oversampled. In allspeci�cations, I control for how the respondent was sampled (i.e., whether the respondent wasfrom a hamlet with or without the road project, whether the respondent was selected from theattendance list at Village Meeting II, and whether the household was one of the 3 additionalhouseholds added in the Comment Form villages). The question is whether, given these controlfor level di¤erences among these samples, one needs to reweight to account for treatment e¤ectheterogeneity in the relationship between missing expenditures and perceptions. As discussed byDeaton (1995), weighting the sample makes the point estimates invariant to survey design, butreduces the e¤ective power and, in the presence of treatment heterogeneity, does necessarily obtainconsistent estimates for the true average population e¤ect. Accordingly, the results presentedbelow in the text are unweighted. Using sample weights in the regressions that account for thedi¤erential probability of sampling and which weight each village equally (i.e., so that commentform villages are not over-weighted in the regression) does not substantively change the results,but not surprisingly it does reduce the statistical signi�cance of the missing expenditures variablein columns (2) and (3) of Table 2.
As discussed above, beyond simply measuring perceptions, an additional goal of the survey wasto measure how stated perceptions about corruption change when respondents know that theiranswers will be used for monitoring. To examine this, after all corruption questions except forquestions involving corruption in the road project had been asked, a randomly selected subset ofrespondents in the Comment Form villages were told that their responses to the questions aboutcorruption in the project would be used, anonymously, as part of the overall report on the commentforms presented at the accountability meeting (the Form B treatment discussed above). Due toa training error, approximately 60% of enumerators appear to have given Form B surveys to allhouseholds in Comment Form villages. In the Form B experiment discussed above, I restrict atten-tion to those villages where the experiment was carried out properly. Moreover, in approximatelyhalf of all Comment Form villages, three additional households were surveyed, drawn randomly
30
from the same neighborhoods as before, two of whom received Form A and one of whom receivedForm B. In all speci�cations I include a dummy variable for which version of the form each house-hold received in all speci�cations, as well as dummies for whether the household was sampled aspart of this additional three households per village, in addition to dummies for which experimentaltreatment the village was assigned (i.e. comment forms, invitations, or audits). Although I includethese dummies in all speci�cations in this paper, doing so does not substantially a¤ect the results.
In addition to the corruption question, the household survey included a wide variety of othercovariates, such as a household roster, education levels, participation in social activities and in theroad project, assets, and family relationships to various village o¢ cials. To estimate householdexpenditure of respondents, I used the 1999 SSD (Hundred Villages Survey), an Indonesian statis-tics bureau dataset, containing 3,193 rural Javanese households. The SSD asked both a detailedexpenditure questionnaire and the same set of asset questions used in my household survey. In theSSD, I used OLS to estimate the relationship between log household expenditure and the follow-ing variables, all of which I observe in my survey: log household size, whether the household washeaded by a woman, the percentage of household members consisting of children ages 0-3, 4-6, 7-9,10-12, and 13-16, dummies for whether the household has a stove, refrigerator, radio, television,satellite dish, motorbike, car, and electricity, dummies for �oor type, wall type, and ceiling type,the total amount of land held by the household, whether the household consumes meat at least oncea week, whether each household member has at least two sets of clothes, whether the householduses modern medicine when a child is sick. I then used the estimated coe¢ cients from the SSD topredict household expenditure in my survey. Combined, these 34 variables have an R-squared of0.58 predicting log household expenditure in the SSD, which suggests that predicted expenditureis a reasonable approximation for actual expenditure, at least for the purposes used here.
31
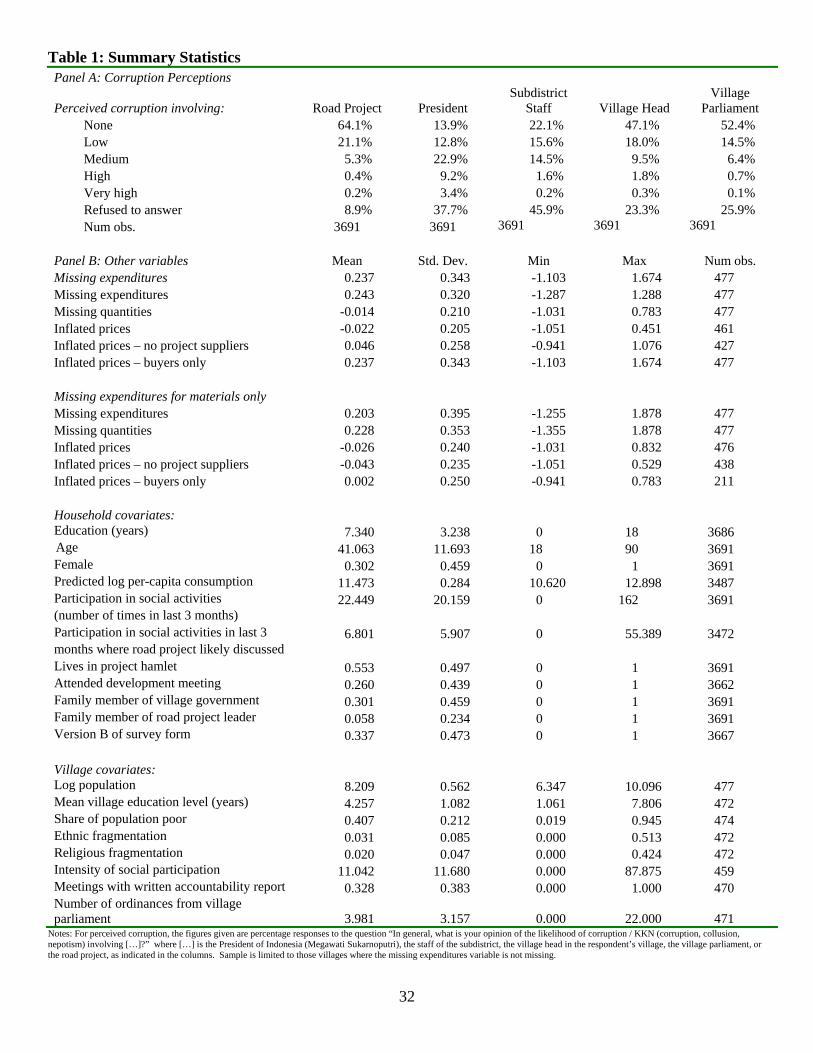
32
Table 1: Summary Statistics Panel A: Corruption Perceptions
Perceived corruption involving: Road Project President Subdistrict
Staff Village Head Village
Parliament None 64.1% 13.9% 22.1% 47.1% 52.4% Low 21.1% 12.8% 15.6% 18.0% 14.5% Medium 5.3% 22.9% 14.5% 9.5% 6.4% High 0.4% 9.2% 1.6% 1.8% 0.7% Very high 0.2% 3.4% 0.2% 0.3% 0.1% Refused to answer 8.9% 37.7% 45.9% 23.3% 25.9% Num obs. 3691 3691 3691 3691 3691
Panel B: Other variables Mean Std. Dev. Min Max Num obs. Missing expenditures 0.237 0.343 -1.103 1.674 477 Missing expenditures 0.243 0.320 -1.287 1.288 477 Missing quantities -0.014 0.210 -1.031 0.783 477 Inflated prices -0.022 0.205 -1.051 0.451 461 Inflated prices – no project suppliers 0.046 0.258 -0.941 1.076 427 Inflated prices – buyers only 0.237 0.343 -1.103 1.674 477 Missing expenditures for materials only Missing expenditures 0.203 0.395 -1.255 1.878 477 Missing quantities 0.228 0.353 -1.355 1.878 477 Inflated prices -0.026 0.240 -1.031 0.832 476 Inflated prices – no project suppliers -0.043 0.235 -1.051 0.529 438 Inflated prices – buyers only 0.002 0.250 -0.941 0.783 211 Household covariates: Education (years) 7.340 3.238 0 18 3686 Age 41.063 11.693 18 90 3691 Female 0.302 0.459 0 1 3691 Predicted log per-capita consumption 11.473 0.284 10.620 12.898 3487 Participation in social activities 22.449 20.159 0 162 3691 (number of times in last 3 months) Participation in social activities in last 3 6.801 5.907 0 55.389 3472 months where road project likely discussed Lives in project hamlet 0.553 0.497 0 1 3691 Attended development meeting 0.260 0.439 0 1 3662 Family member of village government 0.301 0.459 0 1 3691 Family member of road project leader 0.058 0.234 0 1 3691 Version B of survey form 0.337 0.473 0 1 3667
Village covariates: Log population 8.209 0.562 6.347 10.096 477 Mean village education level (years) 4.257 1.082 1.061 7.806 472 Share of population poor 0.407 0.212 0.019 0.945 474 Ethnic fragmentation 0.031 0.085 0.000 0.513 472 Religious fragmentation 0.020 0.047 0.000 0.424 472 Intensity of social participation 11.042 11.680 0.000 87.875 459 Meetings with written accountability report 0.328 0.383 0.000 1.000 470 Number of ordinances from village parliament 3.981 3.157 0.000 22.000 471
Notes: For perceived corruption, the figures given are percentage responses to the question “In general, what is your opinion of the likelihood of corruption / KKN (corruption, collusion, nepotism) involving […]?” where […] is the President of Indonesia (Megawati Sukarnoputri), the staff of the subdistrict, the village head in the respondent’s village, the village parliament, or the road project, as indicated in the columns. Sample is limited to those villages where the missing expenditures variable is not missing.
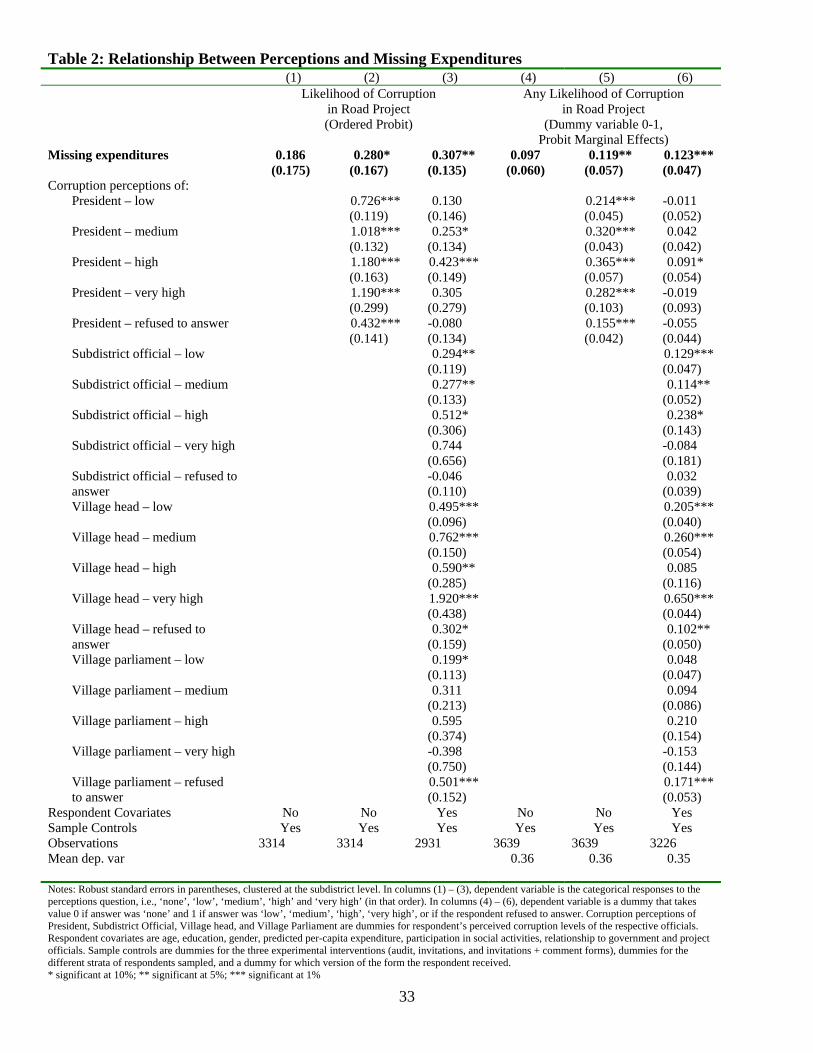
33
Table 2: Relationship Between Perceptions and Missing Expenditures (1) (2) (3) (4) (5) (6) Likelihood of Corruption
in Road Project (Ordered Probit)
Any Likelihood of Corruption in Road Project
(Dummy variable 0-1, Probit Marginal Effects)
Missing expenditures 0.186 0.280* 0.307** 0.097 0.119** 0.123*** (0.175) (0.167) (0.135) (0.060) (0.057) (0.047)
Corruption perceptions of: President – low 0.726*** 0.130 0.214*** -0.011 (0.119) (0.146) (0.045) (0.052) President – medium 1.018*** 0.253* 0.320*** 0.042 (0.132) (0.134) (0.043) (0.042) President – high 1.180*** 0.423*** 0.365*** 0.091* (0.163) (0.149) (0.057) (0.054) President – very high 1.190*** 0.305 0.282*** -0.019 (0.299) (0.279) (0.103) (0.093) President – refused to answer 0.432*** -0.080 0.155*** -0.055 (0.141) (0.134) (0.042) (0.044) Subdistrict official – low 0.294** 0.129*** (0.119) (0.047) Subdistrict official – medium 0.277** 0.114** (0.133) (0.052) Subdistrict official – high 0.512* 0.238* (0.306) (0.143) Subdistrict official – very high 0.744 -0.084 (0.656) (0.181) Subdistrict official – refused to -0.046 0.032 answer (0.110) (0.039) Village head – low 0.495*** 0.205*** (0.096) (0.040) Village head – medium 0.762*** 0.260*** (0.150) (0.054) Village head – high 0.590** 0.085 (0.285) (0.116) Village head – very high 1.920*** 0.650*** (0.438) (0.044) Village head – refused to 0.302* 0.102** answer (0.159) (0.050) Village parliament – low 0.199* 0.048 (0.113) (0.047) Village parliament – medium 0.311 0.094 (0.213) (0.086) Village parliament – high 0.595 0.210 (0.374) (0.154) Village parliament – very high -0.398 -0.153 (0.750) (0.144) Village parliament – refused 0.501*** 0.171*** to answer (0.152) (0.053)
Respondent Covariates No No Yes No No Yes Sample Controls Yes Yes Yes Yes Yes Yes Observations 3314 3314 2931 3639 3639 3226 Mean dep. var 0.36 0.36 0.35
Notes: Robust standard errors in parentheses, clustered at the subdistrict level. In columns (1) – (3), dependent variable is the categorical responses to the perceptions question, i.e., ‘none’, ‘low’, ‘medium’, ‘high’ and ‘very high’ (in that order). In columns (4) – (6), dependent variable is a dummy that takes value 0 if answer was ‘none’ and 1 if answer was ‘low’, ‘medium’, ‘high’, ‘very high’, or if the respondent refused to answer. Corruption perceptions of President, Subdistrict Official, Village head, and Village Parliament are dummies for respondent’s perceived corruption levels of the respective officials. Respondent covariates are age, education, gender, predicted per-capita expenditure, participation in social activities, relationship to government and project officials. Sample controls are dummies for the three experimental interventions (audit, invitations, and invitations + comment forms), dummies for the different strata of respondents sampled, and a dummy for which version of the form the respondent received. * significant at 10%; ** significant at 5%; *** significant at 1%
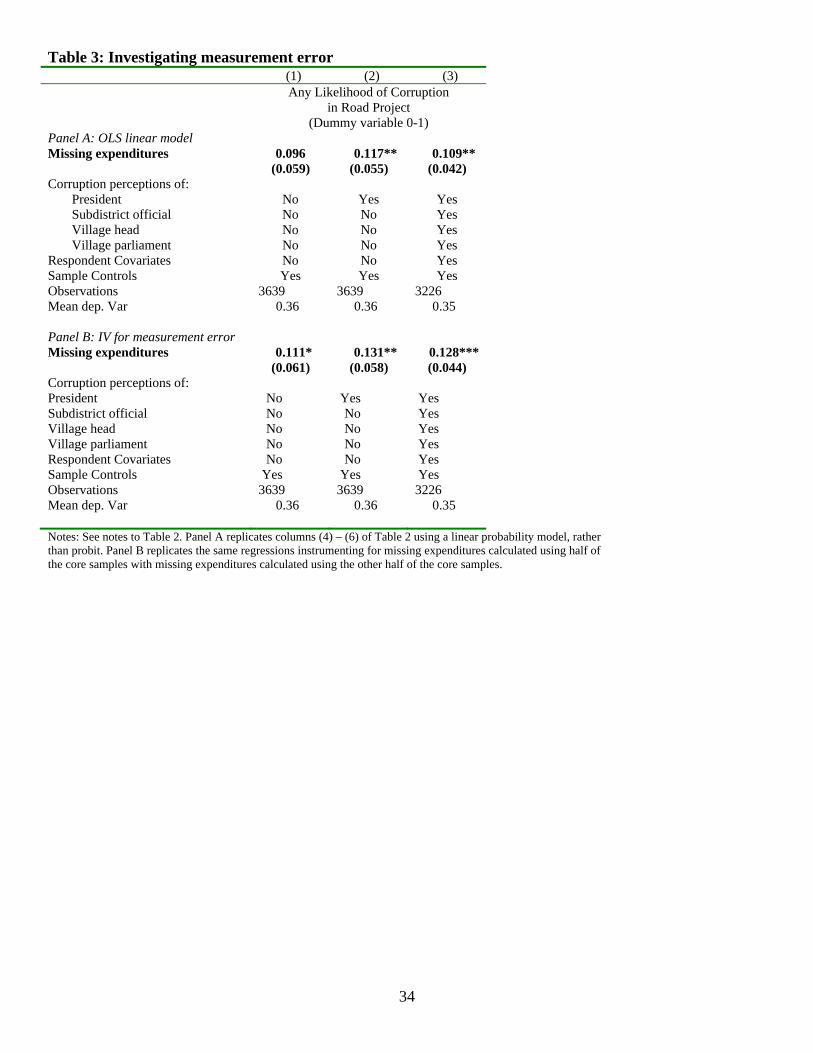
34
Table 3: Investigating measurement error (1) (2) (3) Any Likelihood of Corruption
in Road Project (Dummy variable 0-1)
Panel A: OLS linear model Missing expenditures 0.096 0.117** 0.109**
(0.059) (0.055) (0.042) Corruption perceptions of:
President No Yes Yes Subdistrict official No No Yes Village head No No Yes Village parliament No No Yes
Respondent Covariates No No Yes Sample Controls Yes Yes Yes Observations 3639 3639 3226 Mean dep. Var 0.36 0.36 0.35
Panel B: IV for measurement error Missing expenditures 0.111* 0.131** 0.128*** (0.061) (0.058) (0.044) Corruption perceptions of: President No Yes Yes Subdistrict official No No Yes Village head No No Yes Village parliament No No Yes Respondent Covariates No No Yes Sample Controls Yes Yes Yes Observations 3639 3639 3226 Mean dep. Var 0.36 0.36 0.35
Notes: See notes to Table 2. Panel A replicates columns (4) – (6) of Table 2 using a linear probability model, rather than probit. Panel B replicates the same regressions instrumenting for missing expenditures calculated using half of the core samples with missing expenditures calculated using the other half of the core samples.
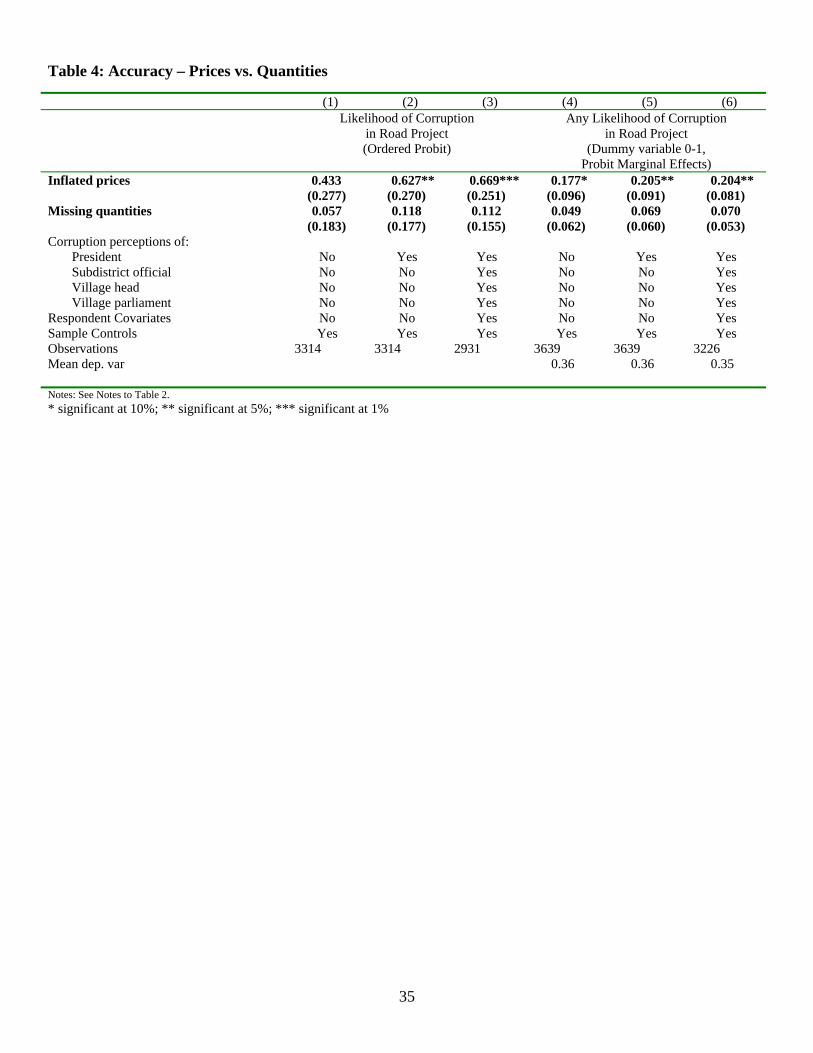
35
Table 4: Accuracy – Prices vs. Quantities
(1) (2) (3) (4) (5) (6) Likelihood of Corruption
in Road Project (Ordered Probit)
Any Likelihood of Corruption in Road Project
(Dummy variable 0-1, Probit Marginal Effects)
Inflated prices 0.433 0.627** 0.669*** 0.177* 0.205** 0.204** (0.277) (0.270) (0.251) (0.096) (0.091) (0.081)
Missing quantities 0.057 0.118 0.112 0.049 0.069 0.070 (0.183) (0.177) (0.155) (0.062) (0.060) (0.053)
Corruption perceptions of: President No Yes Yes No Yes Yes Subdistrict official No No Yes No No Yes Village head No No Yes No No Yes Village parliament No No Yes No No Yes
Respondent Covariates No No Yes No No Yes Sample Controls Yes Yes Yes Yes Yes Yes Observations 3314 3314 2931 3639 3639 3226 Mean dep. var 0.36 0.36 0.35
Notes: See Notes to Table 2. * significant at 10%; ** significant at 5%; *** significant at 1%
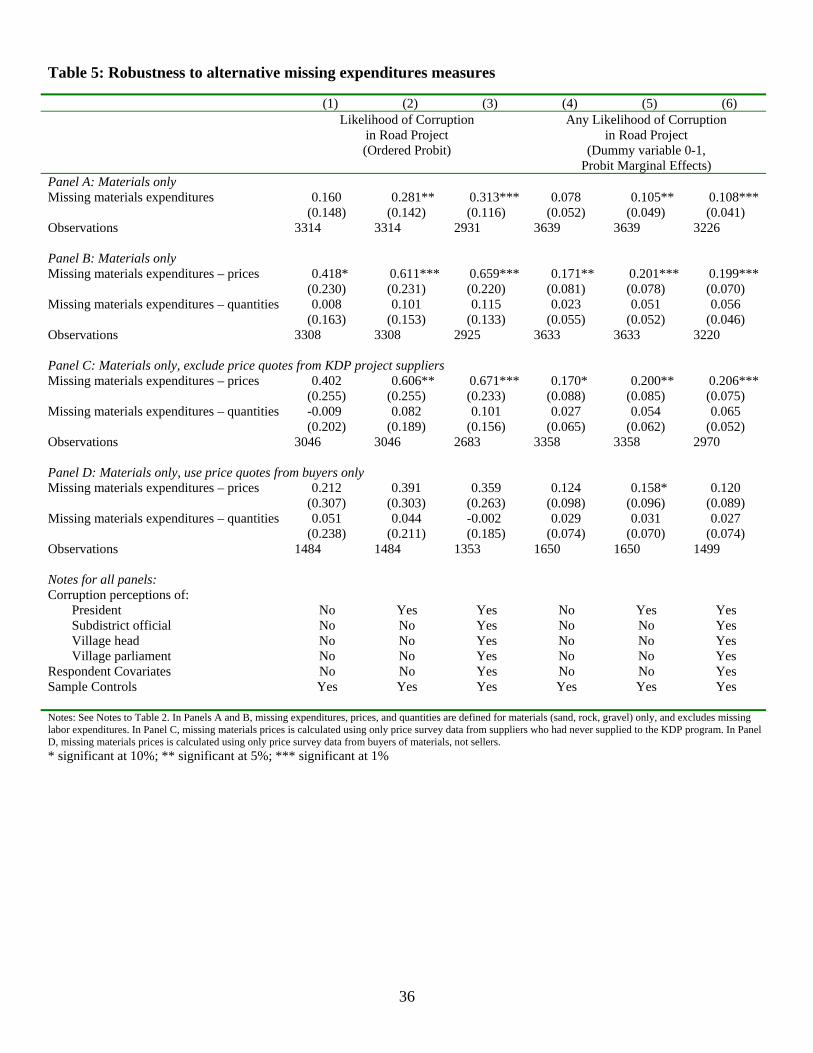
36
Table 5: Robustness to alternative missing expenditures measures
(1) (2) (3) (4) (5) (6) Likelihood of Corruption
in Road Project (Ordered Probit)
Any Likelihood of Corruption in Road Project
(Dummy variable 0-1, Probit Marginal Effects)
Panel A: Materials only Missing materials expenditures 0.160 0.281** 0.313*** 0.078 0.105** 0.108***
(0.148) (0.142) (0.116) (0.052) (0.049) (0.041) Observations 3314 3314 2931 3639 3639 3226 Panel B: Materials only Missing materials expenditures – prices 0.418* 0.611*** 0.659*** 0.171** 0.201*** 0.199*** (0.230) (0.231) (0.220) (0.081) (0.078) (0.070) Missing materials expenditures – quantities 0.008 0.101 0.115 0.023 0.051 0.056 (0.163) (0.153) (0.133) (0.055) (0.052) (0.046) Observations 3308 3308 2925 3633 3633 3220 Panel C: Materials only, exclude price quotes from KDP project suppliers Missing materials expenditures – prices 0.402 0.606** 0.671*** 0.170* 0.200** 0.206*** (0.255) (0.255) (0.233) (0.088) (0.085) (0.075) Missing materials expenditures – quantities -0.009 0.082 0.101 0.027 0.054 0.065 (0.202) (0.189) (0.156) (0.065) (0.062) (0.052) Observations 3046 3046 2683 3358 3358 2970 Panel D: Materials only, use price quotes from buyers only Missing materials expenditures – prices 0.212 0.391 0.359 0.124 0.158* 0.120 (0.307) (0.303) (0.263) (0.098) (0.096) (0.089) Missing materials expenditures – quantities 0.051 0.044 -0.002 0.029 0.031 0.027 (0.238) (0.211) (0.185) (0.074) (0.070) (0.074) Observations 1484 1484 1353 1650 1650 1499 Notes for all panels: Corruption perceptions of:
President No Yes Yes No Yes Yes Subdistrict official No No Yes No No Yes Village head No No Yes No No Yes Village parliament No No Yes No No Yes
Respondent Covariates No No Yes No No Yes Sample Controls Yes Yes Yes Yes Yes Yes
Notes: See Notes to Table 2. In Panels A and B, missing expenditures, prices, and quantities are defined for materials (sand, rock, gravel) only, and excludes missing labor expenditures. In Panel C, missing materials prices is calculated using only price survey data from suppliers who had never supplied to the KDP program. In Panel D, missing materials prices is calculated using only price survey data from buyers of materials, not sellers. * significant at 10%; ** significant at 5%; *** significant at 1%
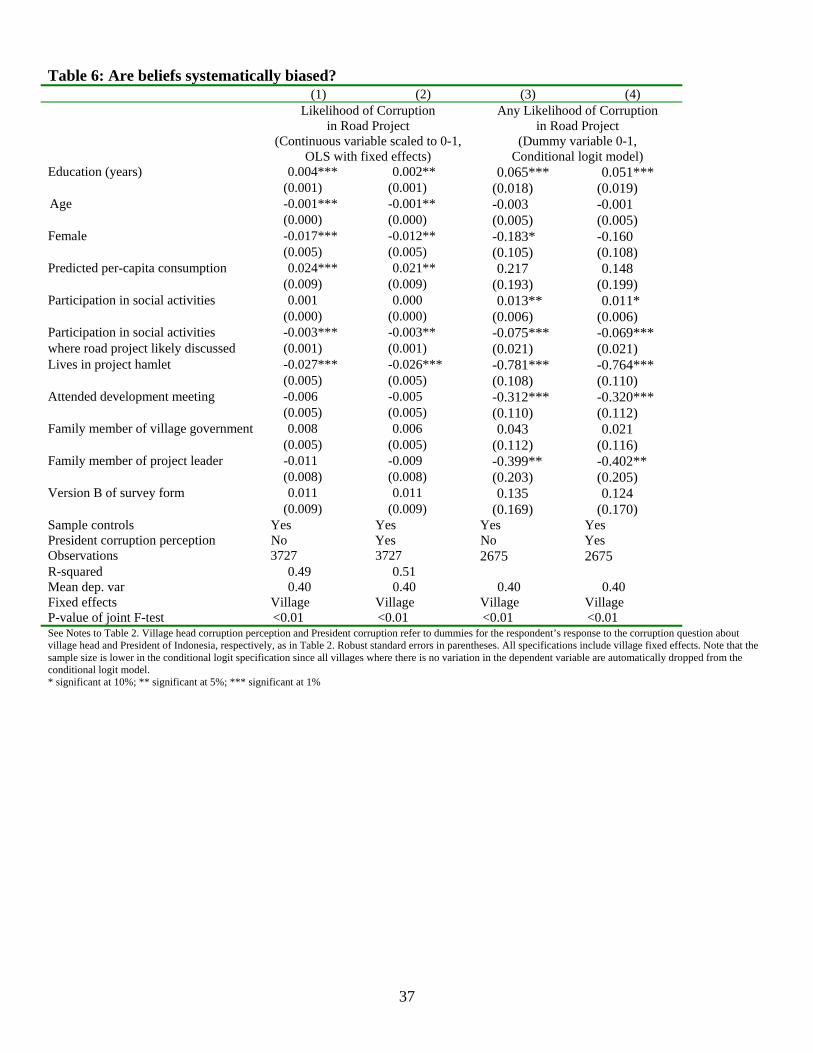
37
Table 6: Are beliefs systematically biased?
(1) (2) (3) (4) Likelihood of Corruption
in Road Project (Continuous variable scaled to 0-1,
OLS with fixed effects)
Any Likelihood of Corruption in Road Project
(Dummy variable 0-1, Conditional logit model)
Education (years) 0.004*** 0.002** 0.065*** 0.051*** (0.001) (0.001) (0.018) (0.019)
Age -0.001*** -0.001** -0.003 -0.001 (0.000) (0.000) (0.005) (0.005)
Female -0.017*** -0.012** -0.183* -0.160 (0.005) (0.005) (0.105) (0.108)
Predicted per-capita consumption 0.024*** 0.021** 0.217 0.148 (0.009) (0.009) (0.193) (0.199)
Participation in social activities 0.001 0.000 0.013** 0.011* (0.000) (0.000) (0.006) (0.006)
Participation in social activities -0.003*** -0.003** -0.075*** -0.069*** where road project likely discussed (0.001) (0.001) (0.021) (0.021) Lives in project hamlet -0.027*** -0.026*** -0.781*** -0.764***
(0.005) (0.005) (0.108) (0.110) Attended development meeting -0.006 -0.005 -0.312*** -0.320***
(0.005) (0.005) (0.110) (0.112) Family member of village government 0.008 0.006 0.043 0.021
(0.005) (0.005) (0.112) (0.116) Family member of project leader -0.011 -0.009 -0.399** -0.402**
(0.008) (0.008) (0.203) (0.205) Version B of survey form 0.011 0.011 0.135 0.124
(0.009) (0.009) (0.169) (0.170) Sample controls Yes Yes Yes Yes President corruption perception No Yes No Yes Observations 3727 3727 2675 2675 R-squared 0.49 0.51 Mean dep. var 0.40 0.40 0.40 0.40 Fixed effects Village Village Village Village P-value of joint F-test <0.01 <0.01 <0.01 <0.01 See Notes to Table 2. Village head corruption perception and President corruption refer to dummies for the respondent’s response to the corruption question about village head and President of Indonesia, respectively, as in Table 2. Robust standard errors in parentheses. All specifications include village fixed effects. Note that the sample size is lower in the conditional logit specification since all villages where there is no variation in the dependent variable are automatically dropped from the conditional logit model. * significant at 10%; ** significant at 5%; *** significant at 1%
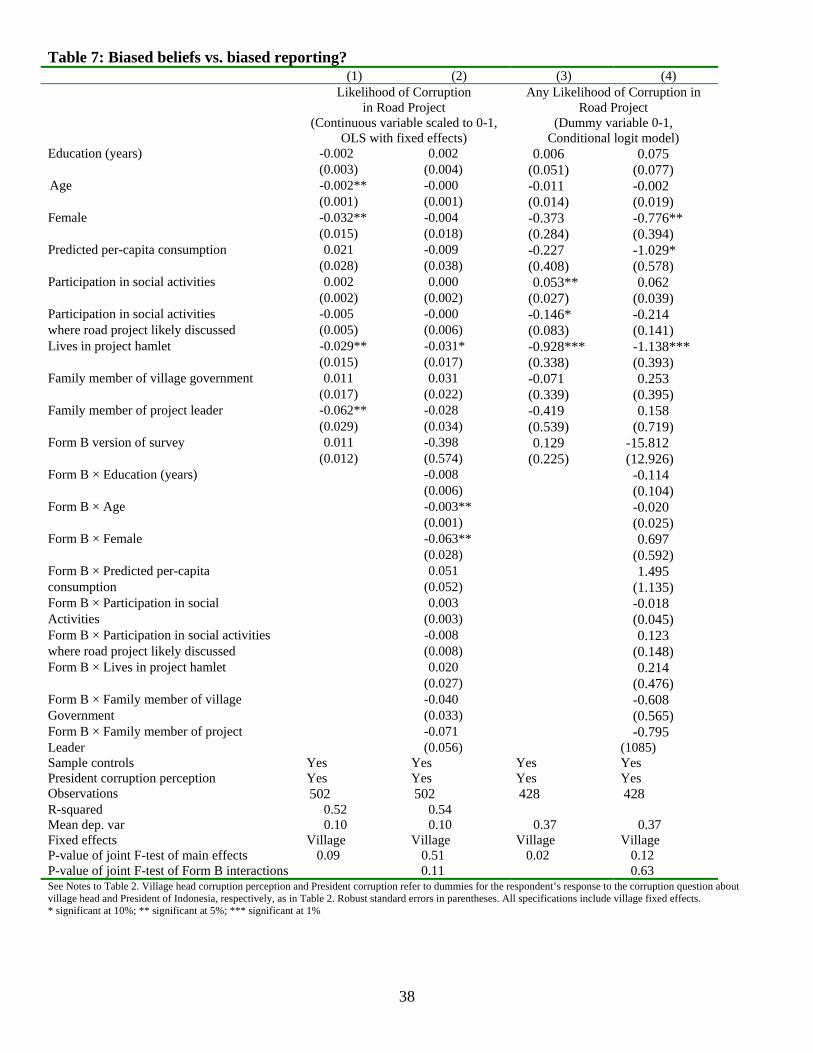
38
Table 7: Biased beliefs vs. biased reporting? (1) (2) (3) (4) Likelihood of Corruption
in Road Project (Continuous variable scaled to 0-1,
OLS with fixed effects)
Any Likelihood of Corruption in Road Project
(Dummy variable 0-1, Conditional logit model)
Education (years) -0.002 0.002 0.006 0.075 (0.003) (0.004) (0.051) (0.077)
Age -0.002** -0.000 -0.011 -0.002 (0.001) (0.001) (0.014) (0.019)
Female -0.032** -0.004 -0.373 -0.776** (0.015) (0.018) (0.284) (0.394)
Predicted per-capita consumption 0.021 -0.009 -0.227 -1.029* (0.028) (0.038) (0.408) (0.578)
Participation in social activities 0.002 0.000 0.053** 0.062 (0.002) (0.002) (0.027) (0.039)
Participation in social activities -0.005 -0.000 -0.146* -0.214 where road project likely discussed (0.005) (0.006) (0.083) (0.141) Lives in project hamlet -0.029** -0.031* -0.928*** -1.138***
(0.015) (0.017) (0.338) (0.393) Family member of village government 0.011 0.031 -0.071 0.253
(0.017) (0.022) (0.339) (0.395) Family member of project leader -0.062** -0.028 -0.419 0.158
(0.029) (0.034) (0.539) (0.719) Form B version of survey 0.011 -0.398 0.129 -15.812
(0.012) (0.574) (0.225) (12.926) Form B × Education (years) -0.008 -0.114
(0.006) (0.104) Form B × Age -0.003** -0.020
(0.001) (0.025) Form B × Female -0.063** 0.697
(0.028) (0.592) Form B × Predicted per-capita 0.051 1.495 consumption (0.052) (1.135) Form B × Participation in social 0.003 -0.018 Activities (0.003) (0.045) Form B × Participation in social activities -0.008 0.123 where road project likely discussed (0.008) (0.148) Form B × Lives in project hamlet 0.020 0.214
(0.027) (0.476) Form B × Family member of village -0.040 -0.608 Government (0.033) (0.565) Form B × Family member of project -0.071 -0.795 Leader (0.056) (1085) Sample controls Yes Yes Yes Yes President corruption perception Yes Yes Yes Yes Observations 502 502 428 428 R-squared 0.52 0.54 Mean dep. var 0.10 0.10 0.37 0.37 Fixed effects Village Village Village Village P-value of joint F-test of main effects 0.09 0.51 0.02 0.12 P-value of joint F-test of Form B interactions 0.11 0.63 See Notes to Table 2. Village head corruption perception and President corruption refer to dummies for the respondent’s response to the corruption question about village head and President of Indonesia, respectively, as in Table 2. Robust standard errors in parentheses. All specifications include village fixed effects. * significant at 10%; ** significant at 5%; *** significant at 1%
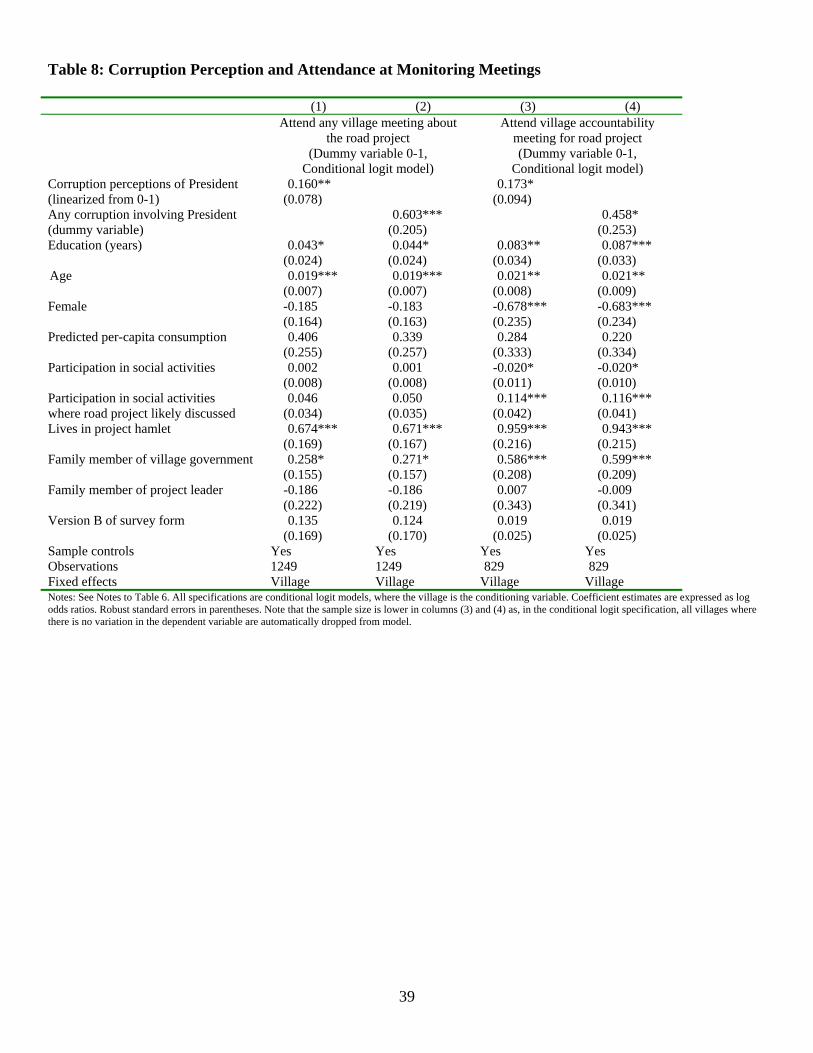
39
Table 8: Corruption Perception and Attendance at Monitoring Meetings
(1) (2) (3) (4) Attend any village meeting about
the road project (Dummy variable 0-1,
Conditional logit model)
Attend village accountability meeting for road project (Dummy variable 0-1,
Conditional logit model) Corruption perceptions of President 0.160** 0.173* (linearized from 0-1) (0.078) (0.094) Any corruption involving President 0.603*** 0.458* (dummy variable) (0.205) (0.253) Education (years) 0.043* 0.044* 0.083** 0.087***
(0.024) (0.024) (0.034) (0.033) Age 0.019*** 0.019*** 0.021** 0.021**
(0.007) (0.007) (0.008) (0.009) Female -0.185 -0.183 -0.678*** -0.683***
(0.164) (0.163) (0.235) (0.234) Predicted per-capita consumption 0.406 0.339 0.284 0.220
(0.255) (0.257) (0.333) (0.334) Participation in social activities 0.002 0.001 -0.020* -0.020*
(0.008) (0.008) (0.011) (0.010) Participation in social activities 0.046 0.050 0.114*** 0.116*** where road project likely discussed (0.034) (0.035) (0.042) (0.041) Lives in project hamlet 0.674*** 0.671*** 0.959*** 0.943***
(0.169) (0.167) (0.216) (0.215) Family member of village government 0.258* 0.271* 0.586*** 0.599***
(0.155) (0.157) (0.208) (0.209) Family member of project leader -0.186 -0.186 0.007 -0.009
(0.222) (0.219) (0.343) (0.341) Version B of survey form 0.135 0.124 0.019 0.019
(0.169) (0.170) (0.025) (0.025) Sample controls Yes Yes Yes Yes Observations 1249 1249 829 829 Fixed effects Village Village Village Village Notes: See Notes to Table 6. All specifications are conditional logit models, where the village is the conditioning variable. Coefficient estimates are expressed as log odds ratios. Robust standard errors in parentheses. Note that the sample size is lower in columns (3) and (4) as, in the conditional logit specification, all villages where there is no variation in the dependent variable are automatically dropped from model.
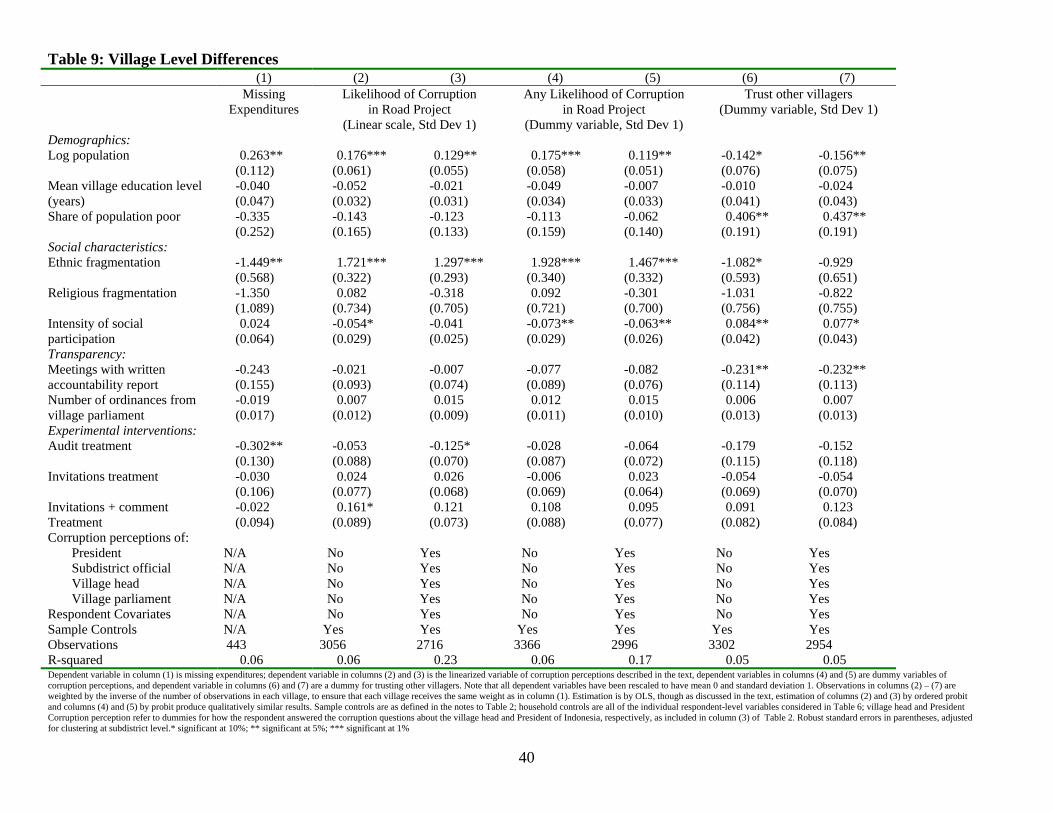
40
Table 9: Village Level Differences (1) (2) (3) (4) (5) (6) (7) Missing
Expenditures Likelihood of Corruption
in Road Project (Linear scale, Std Dev 1)
Any Likelihood of Corruption in Road Project
(Dummy variable, Std Dev 1)
Trust other villagers (Dummy variable, Std Dev 1)
Demographics: Log population 0.263** 0.176*** 0.129** 0.175*** 0.119** -0.142* -0.156**
(0.112) (0.061) (0.055) (0.058) (0.051) (0.076) (0.075) Mean village education level -0.040 -0.052 -0.021 -0.049 -0.007 -0.010 -0.024 (years) (0.047) (0.032) (0.031) (0.034) (0.033) (0.041) (0.043) Share of population poor -0.335 -0.143 -0.123 -0.113 -0.062 0.406** 0.437**
(0.252) (0.165) (0.133) (0.159) (0.140) (0.191) (0.191) Social characteristics: Ethnic fragmentation -1.449** 1.721*** 1.297*** 1.928*** 1.467*** -1.082* -0.929
(0.568) (0.322) (0.293) (0.340) (0.332) (0.593) (0.651) Religious fragmentation -1.350 0.082 -0.318 0.092 -0.301 -1.031 -0.822
(1.089) (0.734) (0.705) (0.721) (0.700) (0.756) (0.755) Intensity of social 0.024 -0.054* -0.041 -0.073** -0.063** 0.084** 0.077* participation (0.064) (0.029) (0.025) (0.029) (0.026) (0.042) (0.043) Transparency: Meetings with written -0.243 -0.021 -0.007 -0.077 -0.082 -0.231** -0.232** accountability report (0.155) (0.093) (0.074) (0.089) (0.076) (0.114) (0.113) Number of ordinances from -0.019 0.007 0.015 0.012 0.015 0.006 0.007 village parliament (0.017) (0.012) (0.009) (0.011) (0.010) (0.013) (0.013) Experimental interventions: Audit treatment -0.302** -0.053 -0.125* -0.028 -0.064 -0.179 -0.152
(0.130) (0.088) (0.070) (0.087) (0.072) (0.115) (0.118) Invitations treatment -0.030 0.024 0.026 -0.006 0.023 -0.054 -0.054
(0.106) (0.077) (0.068) (0.069) (0.064) (0.069) (0.070) Invitations + comment -0.022 0.161* 0.121 0.108 0.095 0.091 0.123 Treatment (0.094) (0.089) (0.073) (0.088) (0.077) (0.082) (0.084) Corruption perceptions of:
President N/A No Yes No Yes No Yes Subdistrict official N/A No Yes No Yes No Yes Village head N/A No Yes No Yes No Yes Village parliament N/A No Yes No Yes No Yes
Respondent Covariates N/A No Yes No Yes No Yes Sample Controls N/A Yes Yes Yes Yes Yes Yes Observations 443 3056 2716 3366 2996 3302 2954 R-squared 0.06 0.06 0.23 0.06 0.17 0.05 0.05 Dependent variable in column (1) is missing expenditures; dependent variable in columns (2) and (3) is the linearized variable of corruption perceptions described in the text, dependent variables in columns (4) and (5) are dummy variables of corruption perceptions, and dependent variable in columns (6) and (7) are a dummy for trusting other villagers. Note that all dependent variables have been rescaled to have mean 0 and standard deviation 1. Observations in columns (2) – (7) are weighted by the inverse of the number of observations in each village, to ensure that each village receives the same weight as in column (1). Estimation is by OLS, though as discussed in the text, estimation of columns (2) and (3) by ordered probit and columns (4) and (5) by probit produce qualitatively similar results. Sample controls are as defined in the notes to Table 2; household controls are all of the individual respondent-level variables considered in Table 6; village head and President Corruption perception refer to dummies for how the respondent answered the corruption questions about the village head and President of Indonesia, respectively, as included in column (3) of Table 2. Robust standard errors in parentheses, adjusted for clustering at subdistrict level.* significant at 10%; ** significant at 5%; *** significant at 1%
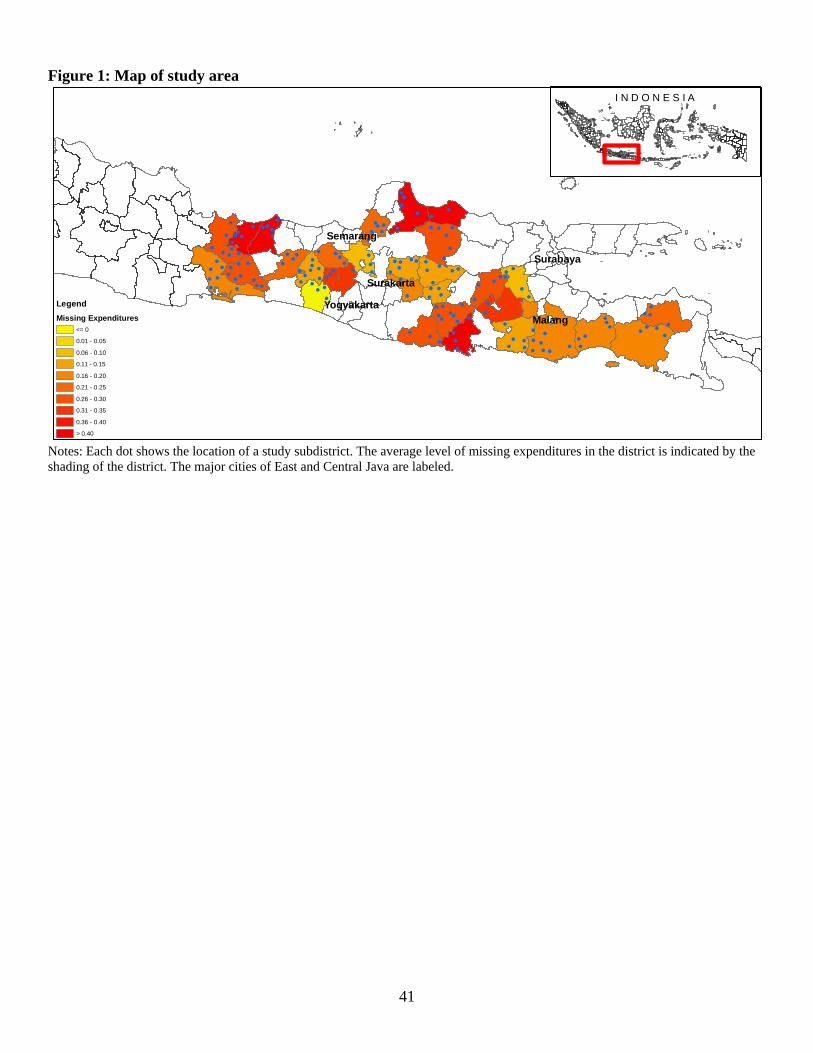
Figure 1: Map of study area
!
! !!
!
!
!
!
!
!
! !!
!!
!
!
!
!
!!
!!! !
!
!
!
!!
!!
! ! !
!!
!
!
!
!
!
!!
!
!!
! !
!!
! !!
!
!
!!
! !
!!
!! !
!
!!!!
!
!
!!
!
!
!
!!
!
!
!!!
!
!!
!
!
!
!
!
!!
! !!
!
!
!
!!
!!!
!
!!
!!
!!
!!
!! !!
!
!
!!!
!
!
! !
!
!
!
!
!!
! !! !
!!
! ! !
!
!!!
!
!
!
!
!!
Semarang
Surabaya
Malang
Surakarta
Yogyakarta
I N D O N E S I A
LegendMissing Expenditures
<= 0
0.01 - 0.05
0.06 - 0.10
0.11 - 0.15
0.16 - 0.20
0.21 - 0.25
0.26 - 0.30
0.31 - 0.35
0.36 - 0.40
> 0.40 Notes: Each dot shows the location of a study subdistrict. The average level of missing expenditures in the district is indicated by the shading of the district. The major cities of East and Central Java are labeled.
41
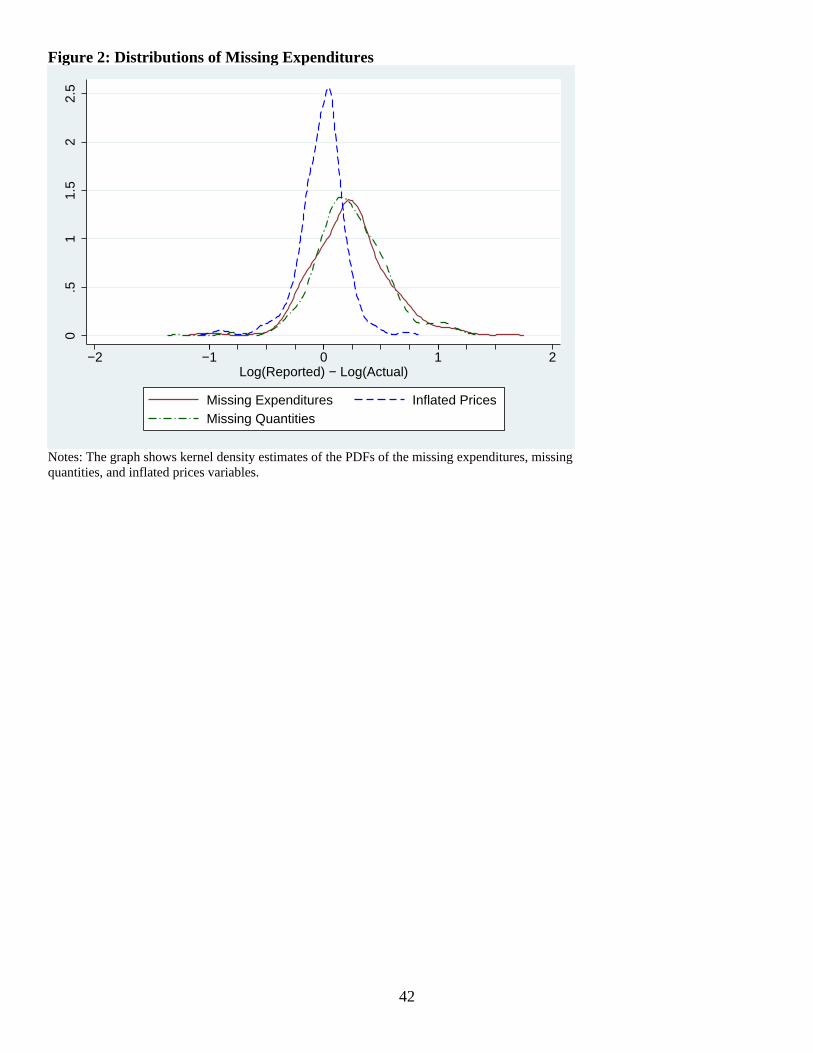
Figure 2: Distributions of Missing Expenditures 0
.51
1.5
22.
5
−2 −1 0 1 2Log(Reported) − Log(Actual)
Missing Expenditures Inflated PricesMissing Quantities
Notes: The graph shows kernel density estimates of the PDFs of the missing expenditures, missing quantities, and inflated prices variables.
42