Embed Size (px)
DESCRIPTION
Cost Criteria
Citation preview
DRAFT Technical Memorandum #7
2010 SCP Tech Memo - 7 Cost - Final.Docx Page 1 of 18 January 12, 2012
2010 SASD SEWER SYSTEM CAPACITY PLAN UPDATE
Technical Memorandum #7
Technical Memorandum Cost Criteria for 2010 System Capacity Plan PREPARED BY: My Huynh DATE: September 13, 2011
REVIEWED BY: Sonny Lunde
INTRODUCTION
This Technical Memorandum presents the methodology used to develop estimated costs for project shed areas proposed in the Sacramento Area Sewer District System Capacity Plan 2010. The estimated costs may then be incorporated into SASD’s rate and fee study.
1. DEVELOPMENT OF ESTIMATED COST
Estimates of the capital costs associated with the proposed project areas are order of magnitude estimates. An order of magnitude estimate is one that is made without detailed engineering data, and uses techniques such as cost curves and scaling factors from similar projects. The overall expected level of accuracy of the cost estimates is approximately 30%. All costs presented in this memorandum have been adjusted to an Engineering News Record construction cost index of 9527, which represents the average of the January 2011 ENR cost indexes for the San Francisco area (10116) and the “20-Cities” ENR average (8938).
The estimated costs were developed using a baseline pipe construction cost with added cost and markups for related items. An example cost estimate sheet for a hypothetical project is presented in Figure 1.
Figure 1 – Cost Estimate Sheet Example
Baseline Pipe Construction Costs
+ Additional Costs for Geotechnical Factors + Additional Costs Traffic Control + +
Additional Costs for Productivity Factors Surface Restoration Costs
+ Costs for Special Structures and Pump Stations = Subtotal + 5% Mobilization/Demobilization
= Estimated Construction Cost Subtotal + 30% Contingencies for Unknown Conditions = ESTIMATED CONSTRUCTION COST + Right-of-Way/Easement Acquisition + 25% Engineering, Administration, and Legal Cost
= TOTAL PROJECT COST
DRAFT Technical Memorandum #7
2010 SCP Tech Memo - 7 Cost - Final.Docx Page 2 of 18 January 12, 2012
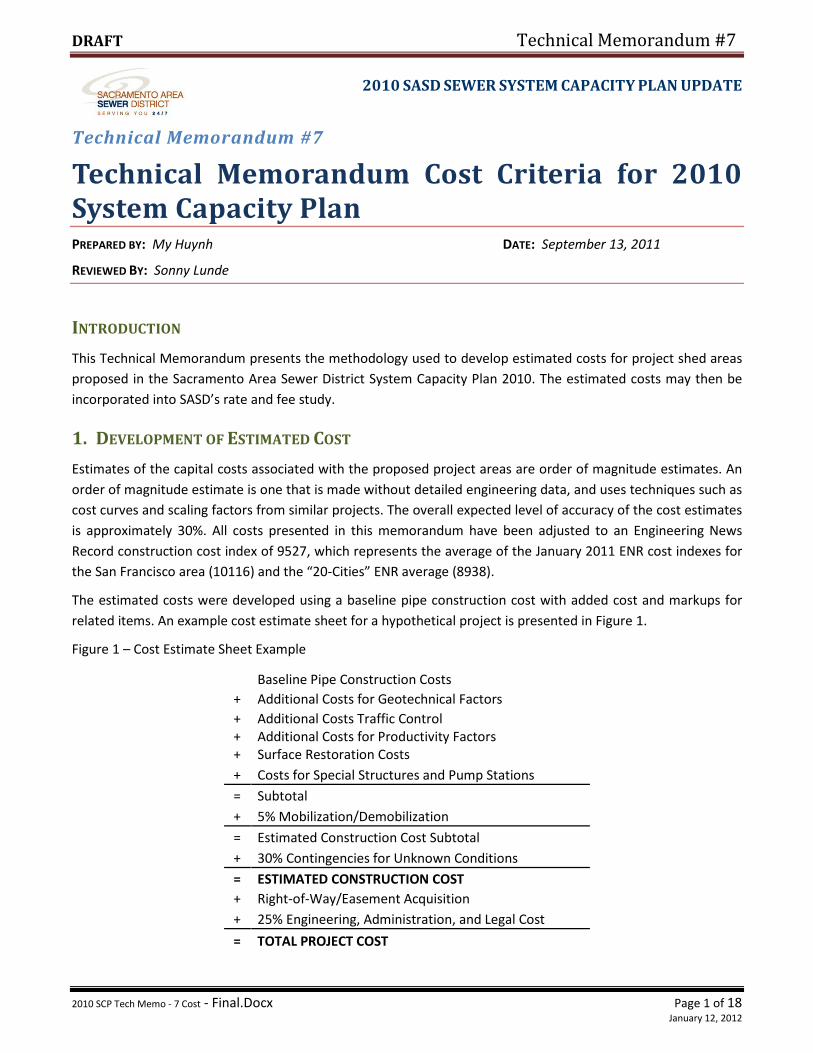
2. SUMMARY OF ESTIMATED UNIT COST
For easy reference, a summary of estimated unit cost is included in Table 1.
Table 1 – Summary of Estimated Unit Cost
Item Description Unit Cost
Range Section
Reference
Baseline Construction
Open Cut Gravity Sewer 8 to 42-inch diameter, 8 to 28 feet deep $160 to $680/lf
3.1.1
Open Cut DIP Force Main 4 to 18-inch diameter, 4 to 16 feet deep $140 to $430/lf
3.1.2
Trenchless Pipe Construction Bore and Jack, Microtunnel, Pipe Ramming. With and without casing
$305 to $1,700/lf
3.1.3
Geotechnical Factors
Additional Dewater Deep well system $45 to $60/lf 3.2.1
Additional Sheeting and Shoring
Trench boxes, solid shoring, and sheet piles $30 to $710/lf 3.2.2
Cobble Areas
Developed Areas 100% of
baseline cost 3.2.3
Undeveloped Areas 20% of
baseline cost
Hard Rock Areas Northeastern part of service area 100% of
baseline cost 3.2.3
Traffic Control
Additional Traffic Control For pipe alignments along major roads with four or more lanes of traffic.
$45/lf 3.3
Productivity Factors
Congested Traffic/Utility Corridor
For pipe alignments along major roads with four or more lanes of traffic.
15% of baseline cost
3.4.1
Remove and Replace Delay Factor
For pipe alignments to be upsized in place. 25% of
baseline cost 3.4.2
DRAFT Technical Memorandum #7
2010 SCP Tech Memo - 7 Cost - Final.Docx Page 3 of 18 January 12, 2012
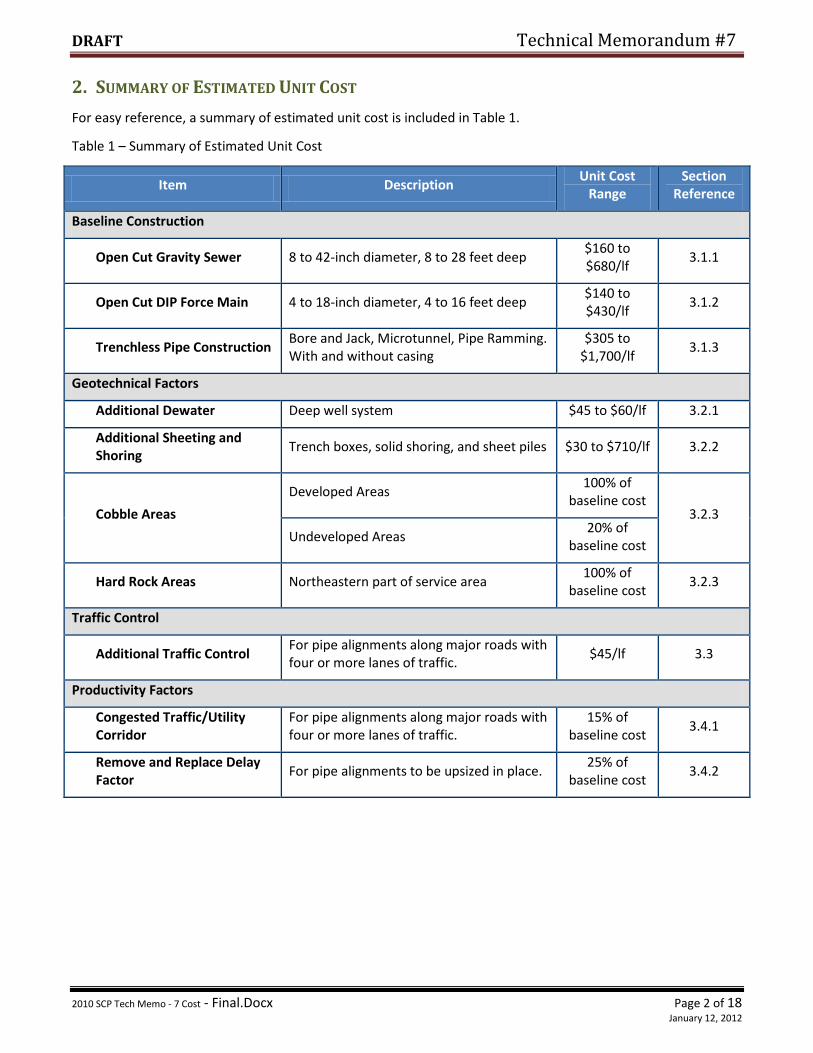
Table 1 – Summary of Estimated Unit Cost - Continued
Item Description Unit Cost
Range Section
Reference
Surface Restoration
Pavement Restoration Final Paving and patch paving 15 feet width
$100/lf 3.5.1
Landscape Restoration Replanting in medians and landscaped area 40 feet width
$3.00/sf 3.5.2
Revegetation Hydroseeding in open areas 80 feet width
$0.25/sf 3.5.2
Creek Restoration Replanting and minor bank erosion control 40 feet width
$12/sf 3.5.2
Sewer Structures
Junction Structures Junction, transition, and turning structure $25,000 to
$850,000 per structure
3.6.1
Pump Stations 10 MGD or less firm capacity Based on low, medium, and high total dynamic heads.
$0.5 to $6.1M 3.6.2
Mobilization/Demobilization % of subtotal 5% 3.7
Contingencies % of Estimated Construction Cost Subtotal 30% 3.8
Easement Acquisition
Acquisition Cost Title reports, appraisals, real estate staff time
$7,000 per parcel
3.9
Easements in Newly Constructed Development
Granted to SASD as condition of development
No Cost to SASD
3.9
Temporary Construction Easements
80 feet width $0.80/sf 3.9
Permanent Easement 20 feet width $4.00/sf 3.9
Engineering, Administration, and Legal Costs
% of Estimated Construction Cost 25% 3.10
DRAFT Technical Memorandum #7
2010 SCP Tech Memo - 7 Cost - Final.Docx Page 4 of 18 January 12, 2012
3. BASIS OF ESTIMATED COST
Construction costs include costs for installation of gravity pipelines, force mains, and pump stations. The basis for these costs is described below.
3.1 Baseline Pipeline Construction
Baseline pipeline construction costs were developed for open cut gravity sewer trunks, force mains, and trenchless pipe construction. These costs are based on a combination of construction bids for projects in Sacramento and other urban areas in California, catalog unit price costing, and adjustments to unit costs identified in previous SASD Master Plans (2000 and 2006).
Both the baseline gravity pipe and force main construction costs include the following:
Vertical trench walls to reduce utility conflicts Trench box or hydraulic shores Select, imported backfill in the pipe zone and native back fill above the pipe zone to the pavement
structural base. It is assumed that the spoil may be hauled to a local disposal site. Backfill would be compacted to 90 percent to within 2 feet of the ground surface.
Temporary pavement to be placed over excavated areas in traveled roads at the end of each day. Sump pump in the trench used for minor dewatering. Minor traffic control including two way flagging, construction area traffic signs, and channelizers.
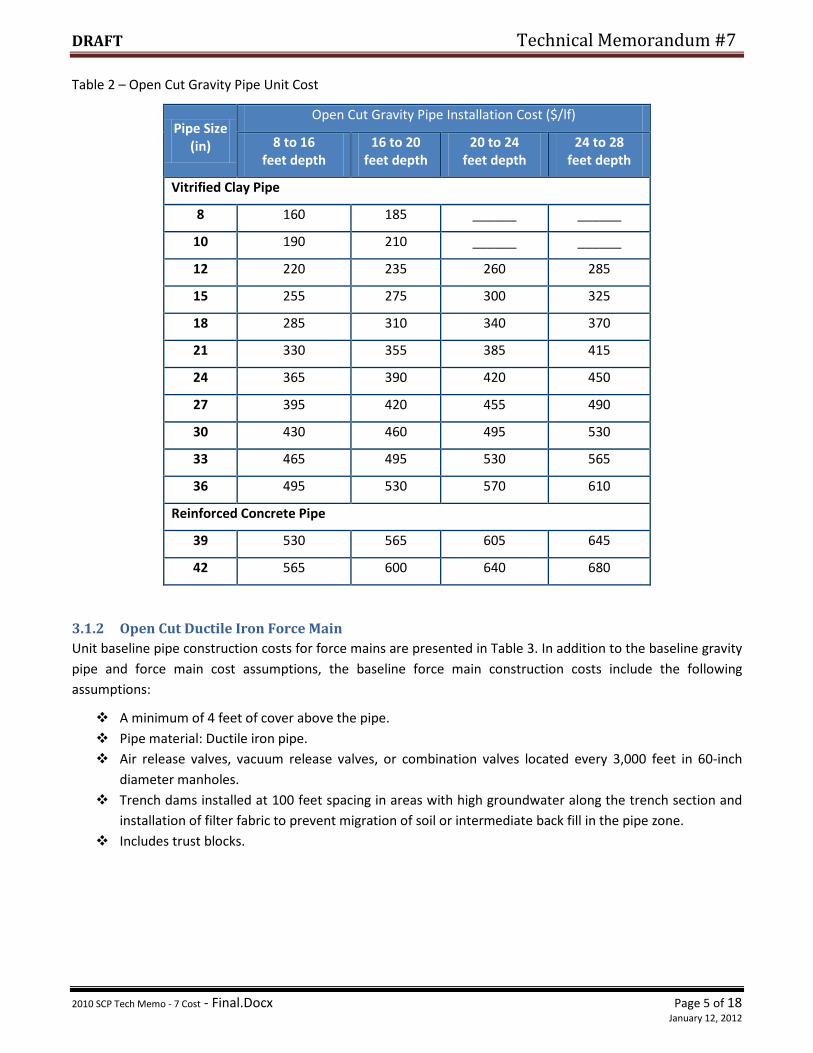
3.1.1 Open Cut Gravity Sewers Baseline unit pipe construction costs were developed for gravity collector and trunk sewers ranging from 8 to 42 inches in diameter for four depth-to-invert ranges: 8 to 16 feet, 16 to 20 feet, 20 to 24 feet, and 24 to 28 feet. These unit costs are presented in Table 2. It was assumed that gravity trunk sewers installed by open-cut construction would not be constructed deeper than 28 feet deep.
In addition to the baseline gravity pipe and force main cost assumptions, the baseline gravity vcp pipe construction costs include the following assumptions:
Pipe material: VCP for 8 to 36-inch sewers; and PVC-lined (or calcareous aggregate) RCP for 39-inch and larger sewers.
Manholes will be located every 400 feet in collector pipes (working pipe capacity of less than 1 mgd, typically pipes 8-inch to 10-inch) and every 500 feet in trunk sewers (working pipe capacity of 1 mgd or greater, typically pipes 10-inch or greater).
Trench dams if needed to prevent migration of groundwater along the trench section and/or filter fabric to prevent migration of soil or intermediate back fill into the pipe zone.
Collector sewer not to exceed 19 feet in depth.
DRAFT Technical Memorandum #7
2010 SCP Tech Memo - 7 Cost - Final.Docx Page 5 of 18 January 12, 2012
Table 2 – Open Cut Gravity Pipe Unit Cost
Pipe Size (in)
Open Cut Gravity Pipe Installation Cost ($/lf)
8 to 16 feet depth
16 to 20 feet depth
20 to 24 feet depth
24 to 28 feet depth
Vitrified Clay Pipe
8 160 185 ______ ______
10 190 210 ______ ______
12 220 235 260 285
15 255 275 300 325
18 285 310 340 370
21 330 355 385 415
24 365 390 420 450
27 395 420 455 490
30 430 460 495 530
33 465 495 530 565
36 495 530 570 610
Reinforced Concrete Pipe
39 530 565 605 645
42 565 600 640 680
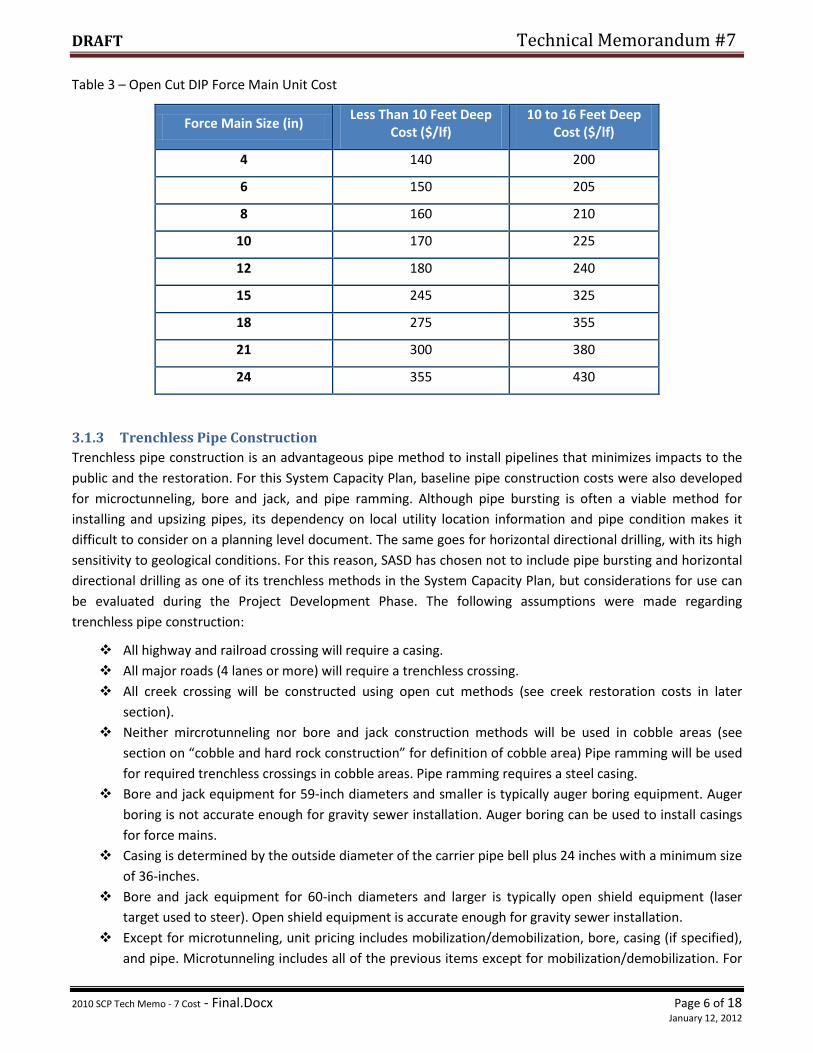
3.1.2 Open Cut Ductile Iron Force Main Unit baseline pipe construction costs for force mains are presented in Table 3. In addition to the baseline gravity pipe and force main cost assumptions, the baseline force main construction costs include the following assumptions:
A minimum of 4 feet of cover above the pipe. Pipe material: Ductile iron pipe. Air release valves, vacuum release valves, or combination valves located every 3,000 feet in 60-inch
diameter manholes. Trench dams installed at 100 feet spacing in areas with high groundwater along the trench section and
installation of filter fabric to prevent migration of soil or intermediate back fill in the pipe zone. Includes trust blocks.
DRAFT Technical Memorandum #7
2010 SCP Tech Memo - 7 Cost - Final.Docx Page 6 of 18 January 12, 2012
Table 3 – Open Cut DIP Force Main Unit Cost
Force Main Size (in) Less Than 10 Feet Deep
Cost ($/lf) 10 to 16 Feet Deep
Cost ($/lf)
4 140 200
6 150 205
8 160 210
10 170 225
12 180 240
15 245 325
18 275 355
21 300 380
24 355 430
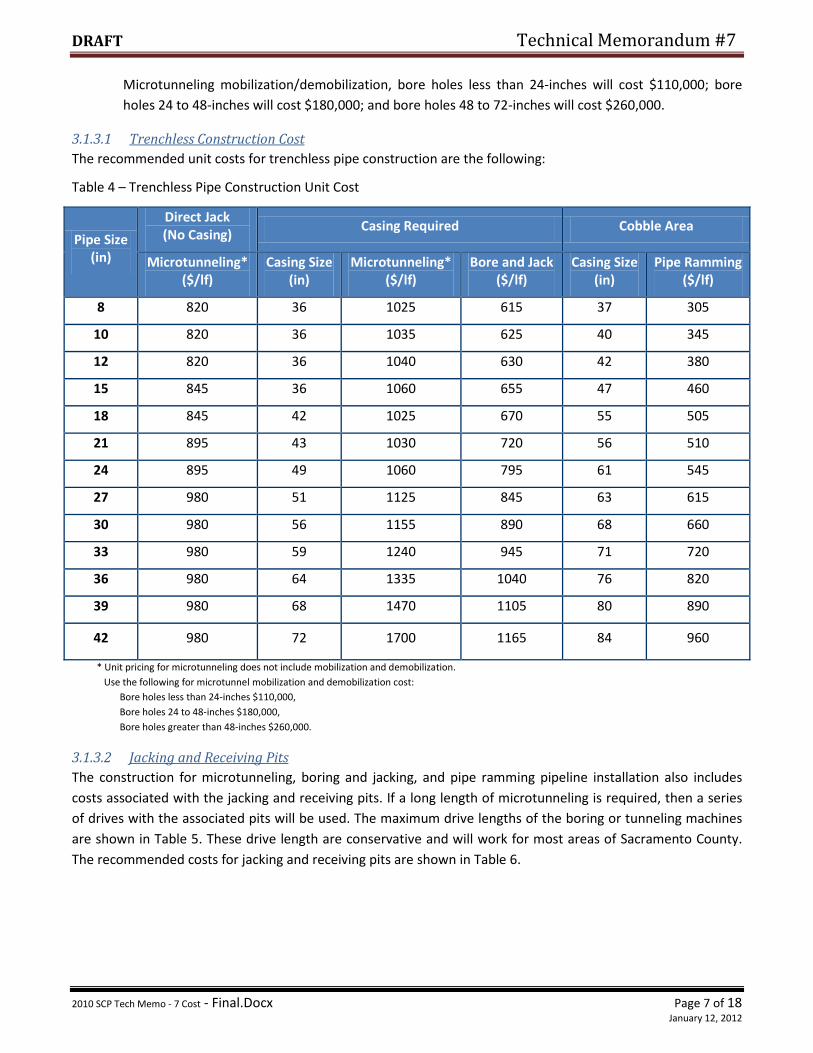
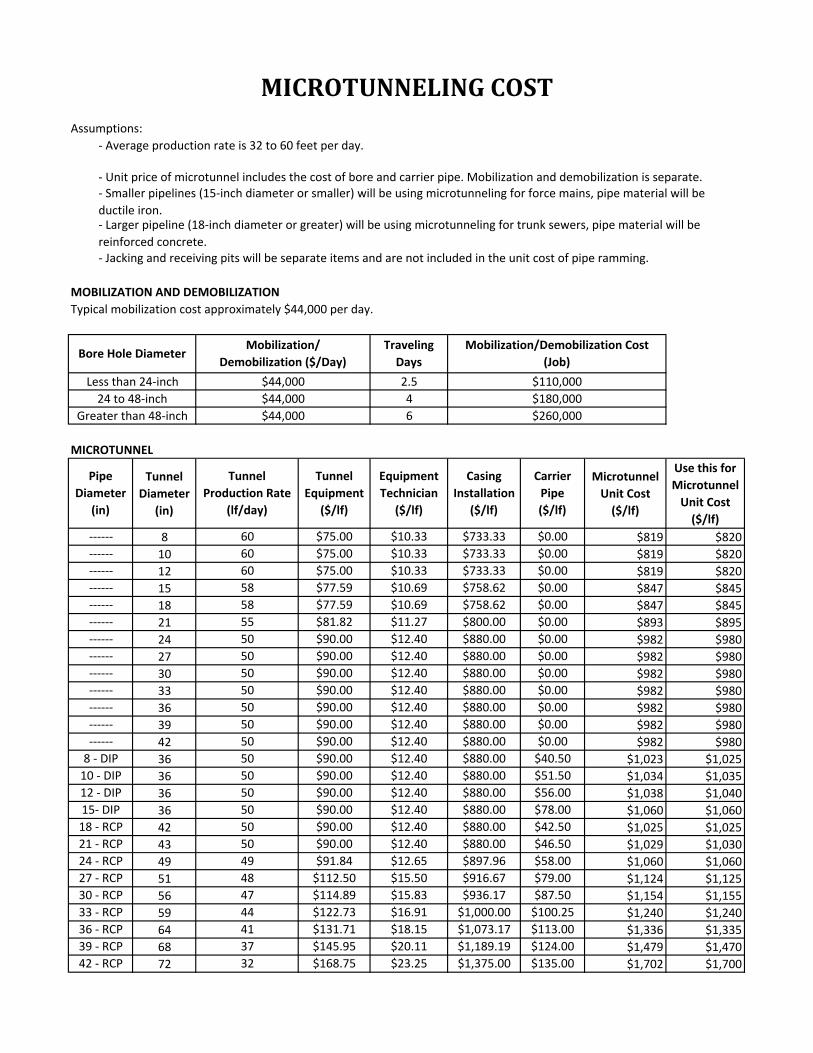
3.1.3 Trenchless Pipe Construction Trenchless pipe construction is an advantageous pipe method to install pipelines that minimizes impacts to the public and the restoration. For this System Capacity Plan, baseline pipe construction costs were also developed for microctunneling, bore and jack, and pipe ramming. Although pipe bursting is often a viable method for installing and upsizing pipes, its dependency on local utility location information and pipe condition makes it difficult to consider on a planning level document. The same goes for horizontal directional drilling, with its high sensitivity to geological conditions. For this reason, SASD has chosen not to include pipe bursting and horizontal directional drilling as one of its trenchless methods in the System Capacity Plan, but considerations for use can be evaluated during the Project Development Phase. The following assumptions were made regarding trenchless pipe construction:
All highway and railroad crossing will require a casing. All major roads (4 lanes or more) will require a trenchless crossing. All creek crossing will be constructed using open cut methods (see creek restoration costs in later
section). Neither mircrotunneling nor bore and jack construction methods will be used in cobble areas (see
section on “cobble and hard rock construction” for definition of cobble area) Pipe ramming will be used for required trenchless crossings in cobble areas. Pipe ramming requires a steel casing.
Bore and jack equipment for 59-inch diameters and smaller is typically auger boring equipment. Auger boring is not accurate enough for gravity sewer installation. Auger boring can be used to install casings for force mains.
Casing is determined by the outside diameter of the carrier pipe bell plus 24 inches with a minimum size of 36-inches.
Bore and jack equipment for 60-inch diameters and larger is typically open shield equipment (laser target used to steer). Open shield equipment is accurate enough for gravity sewer installation.
Except for microtunneling, unit pricing includes mobilization/demobilization, bore, casing (if specified), and pipe. Microtunneling includes all of the previous items except for mobilization/demobilization. For
DRAFT Technical Memorandum #7
2010 SCP Tech Memo - 7 Cost - Final.Docx Page 7 of 18 January 12, 2012
Microtunneling mobilization/demobilization, bore holes less than 24-inches will cost $110,000; bore holes 24 to 48-inches will cost $180,000; and bore holes 48 to 72-inches will cost $260,000.
3.1.3.1 Trenchless Construction Cost The recommended unit costs for trenchless pipe construction are the following:
Table 4 – Trenchless Pipe Construction Unit Cost
Pipe Size (in)
Direct Jack (No Casing)
Casing Required Cobble Area
Microtunneling* ($/lf)
Casing Size (in)
Microtunneling* ($/lf)
Bore and Jack ($/lf)
Casing Size (in)
Pipe Ramming ($/lf)
8 820 36 1025 615 37 305
10 820 36 1035 625 40 345
12 820 36 1040 630 42 380
15 845 36 1060 655 47 460
18 845 42 1025 670 55 505
21 895 43 1030 720 56 510
24 895 49 1060 795 61 545
27 980 51 1125 845 63 615
30 980 56 1155 890 68 660
33 980 59 1240 945 71 720
36 980 64 1335 1040 76 820
39 980 68 1470 1105 80 890
42 980 72 1700 1165 84 960
* Unit pricing for microtunneling does not include mobilization and demobilization. Use the following for microtunnel mobilization and demobilization cost: Bore holes less than 24-inches $110,000, Bore holes 24 to 48-inches $180,000, Bore holes greater than 48-inches $260,000.
3.1.3.2 Jacking and Receiving Pits The construction for microtunneling, boring and jacking, and pipe ramming pipeline installation also includes costs associated with the jacking and receiving pits. If a long length of microtunneling is required, then a series of drives with the associated pits will be used. The maximum drive lengths of the boring or tunneling machines are shown in Table 5. These drive length are conservative and will work for most areas of Sacramento County. The recommended costs for jacking and receiving pits are shown in Table 6.
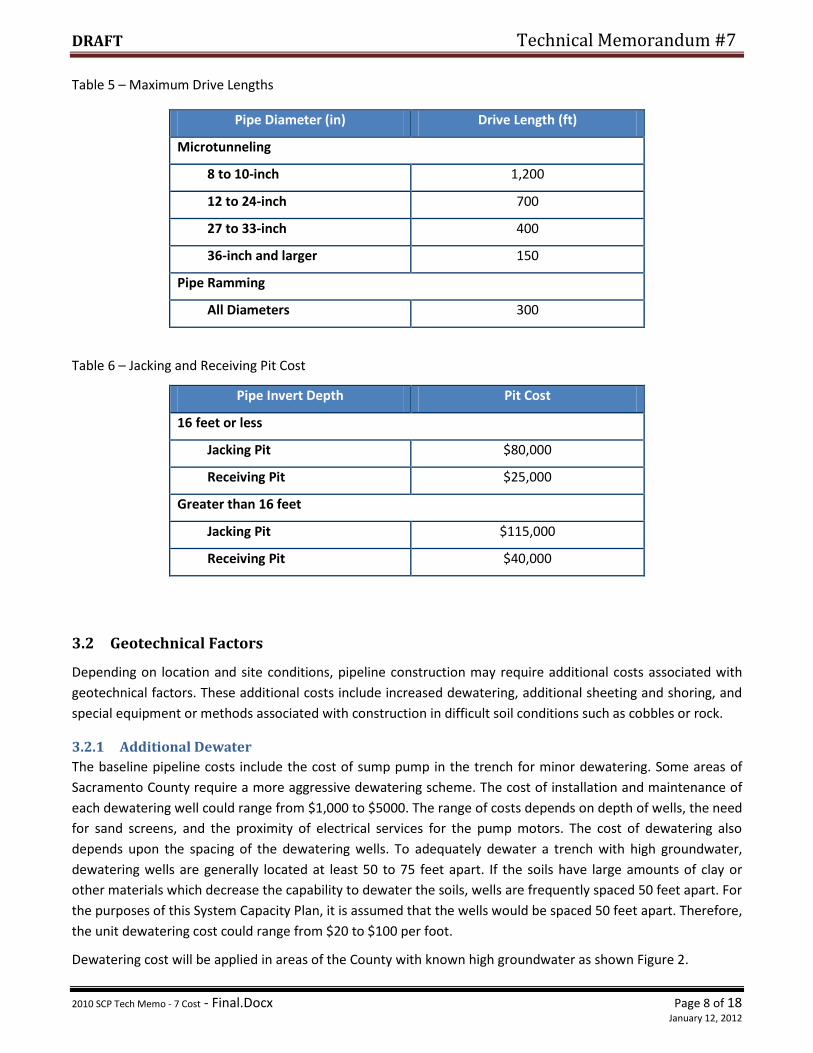
DRAFT Technical Memorandum #7
2010 SCP Tech Memo - 7 Cost - Final.Docx Page 8 of 18 January 12, 2012
Table 5 – Maximum Drive Lengths
Pipe Diameter (in) Drive Length (ft)
Microtunneling
8 to 10-inch 1,200
12 to 24-inch 700
27 to 33-inch 400
36-inch and larger 150
Pipe Ramming
All Diameters 300
Table 6 – Jacking and Receiving Pit Cost
Pipe Invert Depth Pit Cost
16 feet or less
Jacking Pit $80,000
Receiving Pit $25,000
Greater than 16 feet
Jacking Pit $115,000
Receiving Pit $40,000
3.2 Geotechnical Factors
Depending on location and site conditions, pipeline construction may require additional costs associated with geotechnical factors. These additional costs include increased dewatering, additional sheeting and shoring, and special equipment or methods associated with construction in difficult soil conditions such as cobbles or rock.
3.2.1 Additional Dewater The baseline pipeline costs include the cost of sump pump in the trench for minor dewatering. Some areas of Sacramento County require a more aggressive dewatering scheme. The cost of installation and maintenance of each dewatering well could range from $1,000 to $5000. The range of costs depends on depth of wells, the need for sand screens, and the proximity of electrical services for the pump motors. The cost of dewatering also depends upon the spacing of the dewatering wells. To adequately dewater a trench with high groundwater, dewatering wells are generally located at least 50 to 75 feet apart. If the soils have large amounts of clay or other materials which decrease the capability to dewater the soils, wells are frequently spaced 50 feet apart. For the purposes of this System Capacity Plan, it is assumed that the wells would be spaced 50 feet apart. Therefore, the unit dewatering cost could range from $20 to $100 per foot.
Dewatering cost will be applied in areas of the County with known high groundwater as shown Figure 2.

DRAFT Technical Memorandum #7
2010 SCP Tech Memo - 7 Cost - Final.Docx Page 9 of 18 January 12, 2012
Figure 2 – High Groundwater Areas
For the purpose of this System Capacity Plan, dewatering cost from Table 7 will be applied in areas of the County with known high groundwater as shown in Figure 2.
Table 7 – Additional Dewatering Unit Cost
Groundwater Infiltration Additional Dewatering Cost
200 GPD/Acre $45/LF of pipe
500 GPD/Acre $60/LF of pipe
All Other Areas $0 – Minor dewatering included in
the cost of the pipe installation.
3.2.2 Additional Sheeting and Shoring Sheeting and shoring methods could range from hydraulic shores to interlocking full-sheets. The specific type of shoring used will depend upon trench depths, soil conditions, and groundwater levels. For the purposes of determining sheeting and shoring requirements for this System Capacity Plan, three different ground conditions will be used: no groundwater, undeveloped areas with high groundwater, and developed areas with high
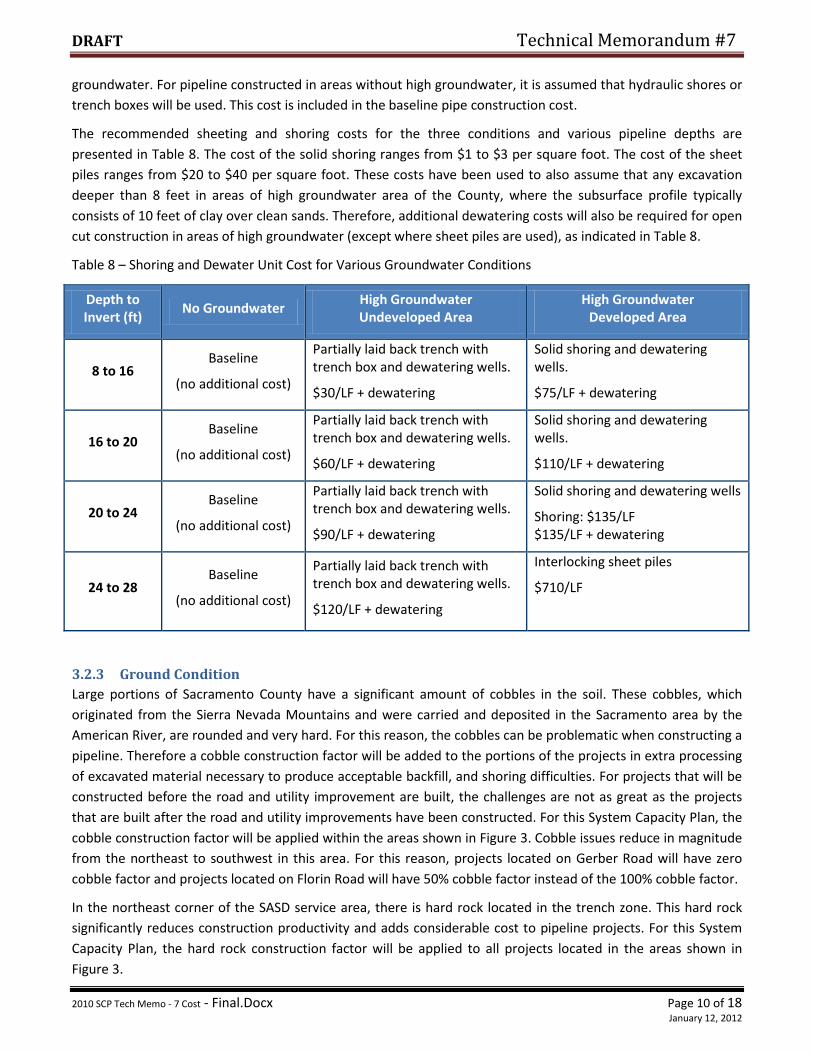
DRAFT Technical Memorandum #7
2010 SCP Tech Memo - 7 Cost - Final.Docx Page 10 of 18 January 12, 2012
groundwater. For pipeline constructed in areas without high groundwater, it is assumed that hydraulic shores or trench boxes will be used. This cost is included in the baseline pipe construction cost.
The recommended sheeting and shoring costs for the three conditions and various pipeline depths are presented in Table 8. The cost of the solid shoring ranges from $1 to $3 per square foot. The cost of the sheet piles ranges from $20 to $40 per square foot. These costs have been used to also assume that any excavation deeper than 8 feet in areas of high groundwater area of the County, where the subsurface profile typically consists of 10 feet of clay over clean sands. Therefore, additional dewatering costs will also be required for open cut construction in areas of high groundwater (except where sheet piles are used), as indicated in Table 8.
Table 8 – Shoring and Dewater Unit Cost for Various Groundwater Conditions
Depth to Invert (ft)
No Groundwater High Groundwater Undeveloped Area
High Groundwater Developed Area
8 to 16 Baseline
(no additional cost)
Partially laid back trench with trench box and dewatering wells.
$30/LF + dewatering
Solid shoring and dewatering wells.
$75/LF + dewatering
16 to 20 Baseline
(no additional cost)
Partially laid back trench with trench box and dewatering wells.
$60/LF + dewatering
Solid shoring and dewatering wells.
$110/LF + dewatering
20 to 24 Baseline
(no additional cost)
Partially laid back trench with trench box and dewatering wells.
$90/LF + dewatering
Solid shoring and dewatering wells
Shoring: $135/LF $135/LF + dewatering
24 to 28 Baseline
(no additional cost)
Partially laid back trench with trench box and dewatering wells.
$120/LF + dewatering
Interlocking sheet piles
$710/LF
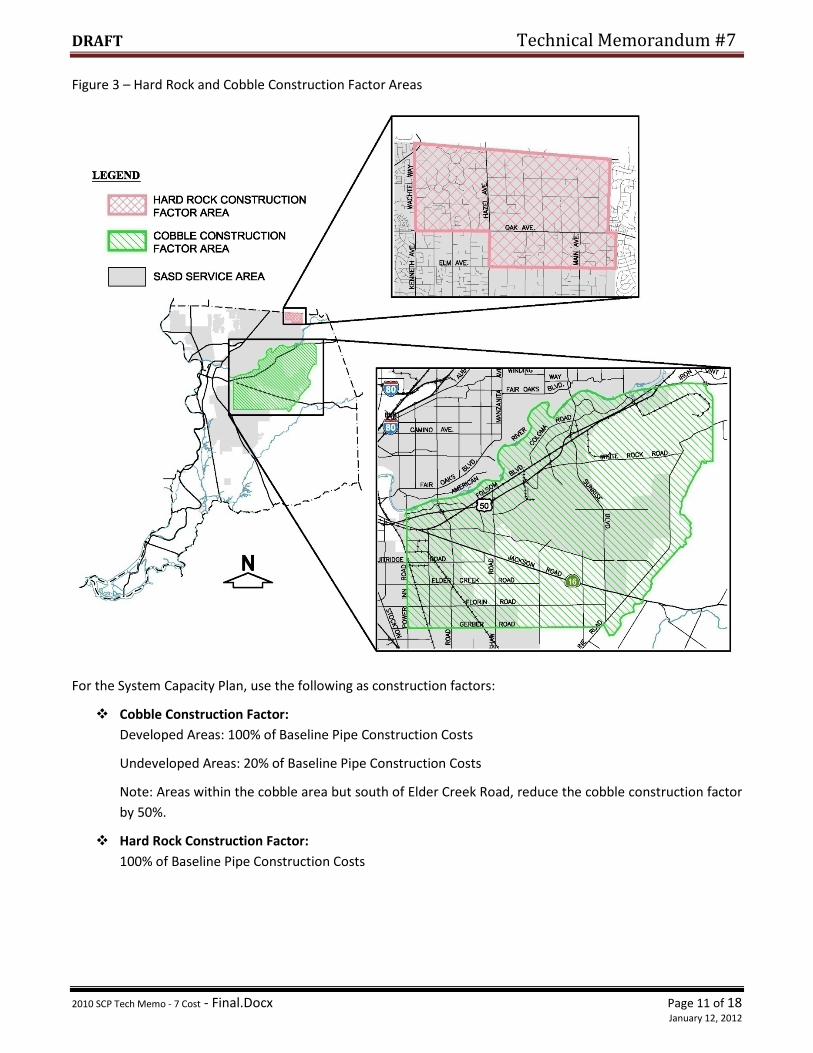
3.2.3 Ground Condition Large portions of Sacramento County have a significant amount of cobbles in the soil. These cobbles, which originated from the Sierra Nevada Mountains and were carried and deposited in the Sacramento area by the American River, are rounded and very hard. For this reason, the cobbles can be problematic when constructing a pipeline. Therefore a cobble construction factor will be added to the portions of the projects in extra processing of excavated material necessary to produce acceptable backfill, and shoring difficulties. For projects that will be constructed before the road and utility improvement are built, the challenges are not as great as the projects that are built after the road and utility improvements have been constructed. For this System Capacity Plan, the cobble construction factor will be applied within the areas shown in Figure 3. Cobble issues reduce in magnitude from the northeast to southwest in this area. For this reason, projects located on Gerber Road will have zero cobble factor and projects located on Florin Road will have 50% cobble factor instead of the 100% cobble factor.
In the northeast corner of the SASD service area, there is hard rock located in the trench zone. This hard rock significantly reduces construction productivity and adds considerable cost to pipeline projects. For this System Capacity Plan, the hard rock construction factor will be applied to all projects located in the areas shown in Figure 3.
DRAFT Technical Memorandum #7
2010 SCP Tech Memo - 7 Cost - Final.Docx Page 11 of 18 January 12, 2012
Figure 3 – Hard Rock and Cobble Construction Factor Areas
For the System Capacity Plan, use the following as construction factors:
Cobble Construction Factor: Developed Areas: 100% of Baseline Pipe Construction Costs
Undeveloped Areas: 20% of Baseline Pipe Construction Costs
Note: Areas within the cobble area but south of Elder Creek Road, reduce the cobble construction factor by 50%.
Hard Rock Construction Factor: 100% of Baseline Pipe Construction Costs
DRAFT Technical Memorandum #7
2010 SCP Tech Memo - 7 Cost - Final.Docx Page 12 of 18 January 12, 2012
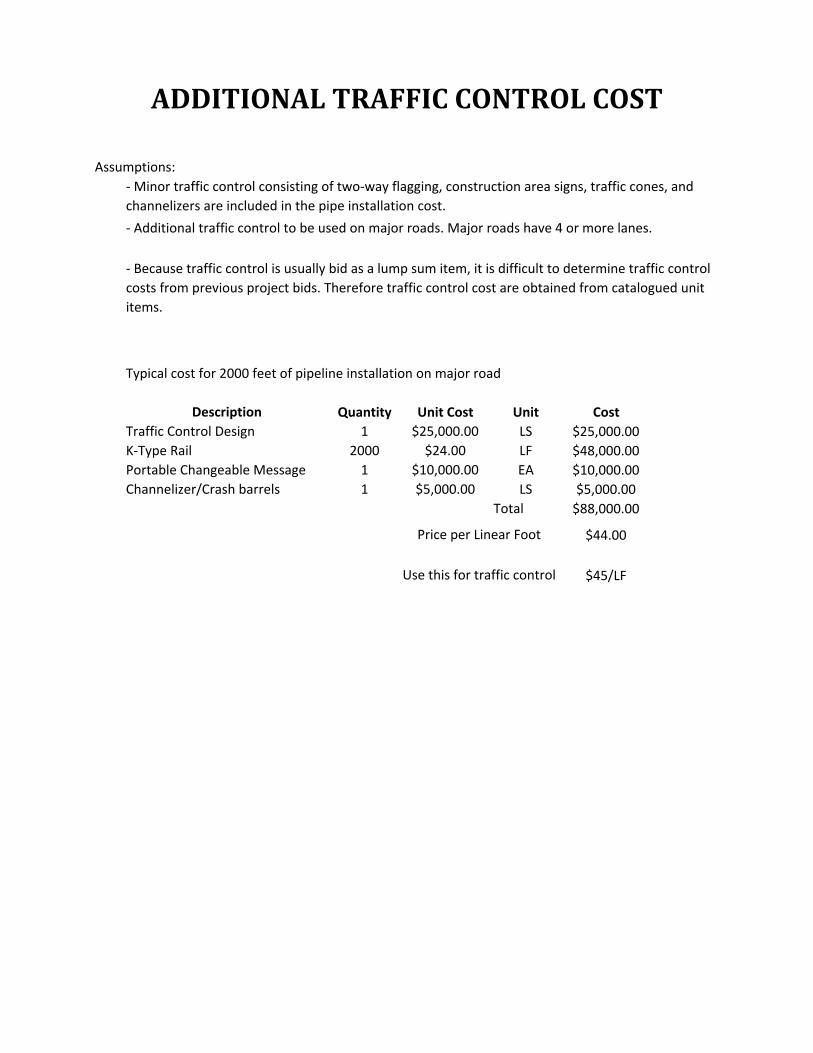
3.3 Traffic Control
Minor traffic control consisting of two-way flagging, construction area signs, traffic cones, and channelizers are included in the pipe installation cost. For roads identified as having 4 or more lanes, additional traffic control will be needed. Additional traffic control includes the cost of traffic design and use of flagging, construction area traffic signs, temporary crash cushions, barricades, channelizes, flashing beacons, K-rails, and changeable message boards. Traffic control on major roads could range $3000 to $6000 per day. If it is assumed that construction will proceed at a rate of 100 feet/day, the equivalent cost would be $30 to $60 per foot. For this System Capacity Plan, the following unit cost will be used:
Increased Traffic Control: $45 per linear foot of alignment located in major roads (4 or more lanes).
3.4 Productivity Factors
3.4.1 Traffic/Utility Corridor Delay Factor Constructing a pipeline in a busy road or a road with numerous utilities is slower (and therefore more costly) than constructing a pipeline in a quiet residential or rural street. Often times, there are restricted work areas and hours to maintain safe traffic flow, driveway access coordination, and utility conflicts. Therefore a congested traffic/utility corridor delay factor reflecting the loss of productivity will be added to alignments on roads with 4 or more lanes.
Congested Traffic/Utility Corridor Delay Factor: 15% of baseline pipe construction costs in major roads (4 or more lanes).
3.4.2 Remove and Replace Delay Factor Constructing a new pipeline in an alignment that requires the removal of the existing gravity sewer is more costly than constructing a pipeline in a new alignment. The additional cost is caused by the necessary bypass pumping and the extra processing of the excavated material to remove the broken pipe from the backfill material. However, contractors are very creative and could typically avoid completely removing the pipe or remove it at a lower cost than traditional means. For those reasons, the remove and replace delay factor will be the following:
Remove and Replace Delay Factor: 25% of baseline pipe construction costs.
DRAFT Technical Memorandum #7
2010 SCP Tech Memo - 7 Cost - Final.Docx Page 13 of 18 January 12, 2012
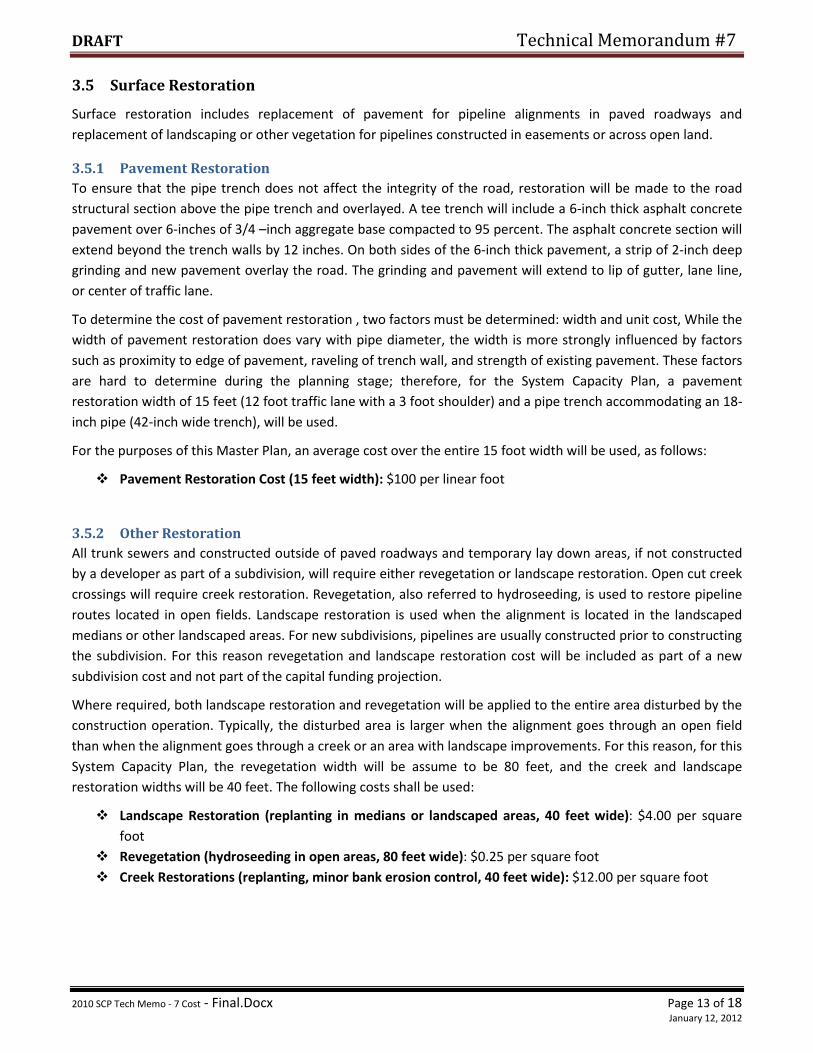
3.5 Surface Restoration
Surface restoration includes replacement of pavement for pipeline alignments in paved roadways and replacement of landscaping or other vegetation for pipelines constructed in easements or across open land.
3.5.1 Pavement Restoration To ensure that the pipe trench does not affect the integrity of the road, restoration will be made to the road structural section above the pipe trench and overlayed. A tee trench will include a 6-inch thick asphalt concrete pavement over 6-inches of 3/4 –inch aggregate base compacted to 95 percent. The asphalt concrete section will extend beyond the trench walls by 12 inches. On both sides of the 6-inch thick pavement, a strip of 2-inch deep grinding and new pavement overlay the road. The grinding and pavement will extend to lip of gutter, lane line, or center of traffic lane.
To determine the cost of pavement restoration , two factors must be determined: width and unit cost, While the width of pavement restoration does vary with pipe diameter, the width is more strongly influenced by factors such as proximity to edge of pavement, raveling of trench wall, and strength of existing pavement. These factors are hard to determine during the planning stage; therefore, for the System Capacity Plan, a pavement restoration width of 15 feet (12 foot traffic lane with a 3 foot shoulder) and a pipe trench accommodating an 18-inch pipe (42-inch wide trench), will be used.
For the purposes of this Master Plan, an average cost over the entire 15 foot width will be used, as follows:
Pavement Restoration Cost (15 feet width): $100 per linear foot
3.5.2 Other Restoration All trunk sewers and constructed outside of paved roadways and temporary lay down areas, if not constructed by a developer as part of a subdivision, will require either revegetation or landscape restoration. Open cut creek crossings will require creek restoration. Revegetation, also referred to hydroseeding, is used to restore pipeline routes located in open fields. Landscape restoration is used when the alignment is located in the landscaped medians or other landscaped areas. For new subdivisions, pipelines are usually constructed prior to constructing the subdivision. For this reason revegetation and landscape restoration cost will be included as part of a new subdivision cost and not part of the capital funding projection.
Where required, both landscape restoration and revegetation will be applied to the entire area disturbed by the construction operation. Typically, the disturbed area is larger when the alignment goes through an open field than when the alignment goes through a creek or an area with landscape improvements. For this reason, for this System Capacity Plan, the revegetation width will be assume to be 80 feet, and the creek and landscape restoration widths will be 40 feet. The following costs shall be used:
Landscape Restoration (replanting in medians or landscaped areas, 40 feet wide): $4.00 per square foot
Revegetation (hydroseeding in open areas, 80 feet wide): $0.25 per square foot Creek Restorations (replanting, minor bank erosion control, 40 feet wide): $12.00 per square foot
DRAFT Technical Memorandum #7
2010 SCP Tech Memo - 7 Cost - Final.Docx Page 14 of 18 January 12, 2012
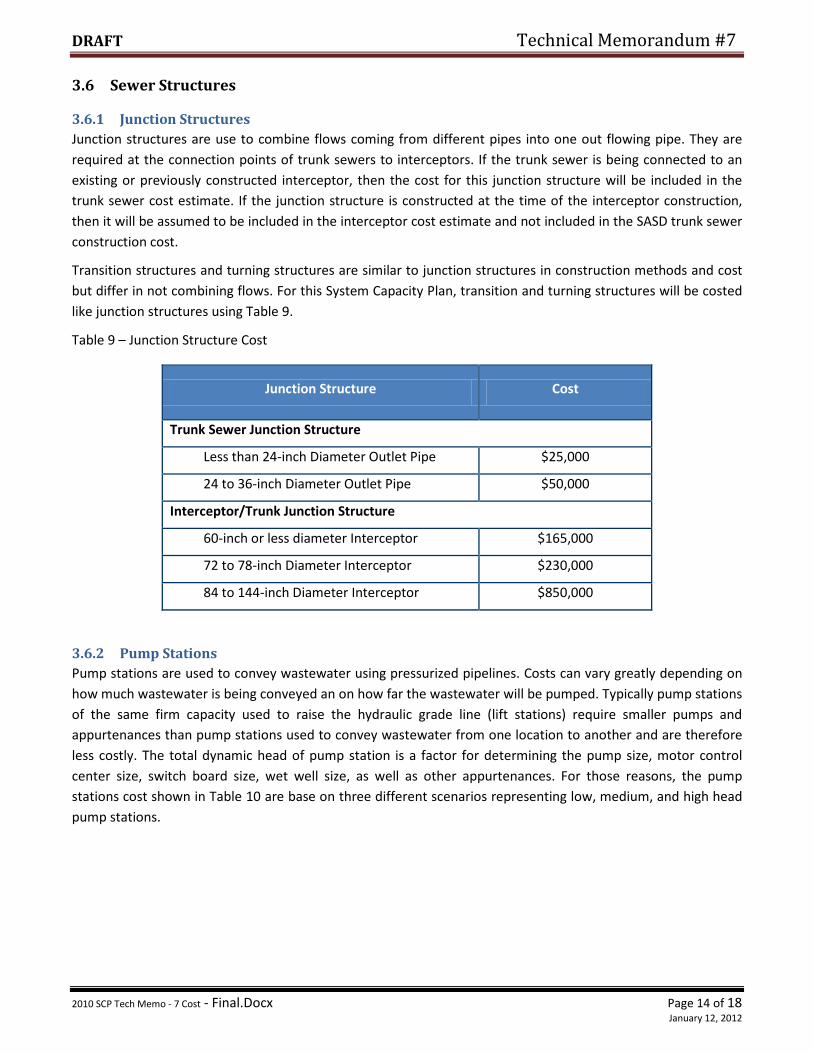
3.6 Sewer Structures
3.6.1 Junction Structures Junction structures are use to combine flows coming from different pipes into one out flowing pipe. They are required at the connection points of trunk sewers to interceptors. If the trunk sewer is being connected to an existing or previously constructed interceptor, then the cost for this junction structure will be included in the trunk sewer cost estimate. If the junction structure is constructed at the time of the interceptor construction, then it will be assumed to be included in the interceptor cost estimate and not included in the SASD trunk sewer construction cost.
Transition structures and turning structures are similar to junction structures in construction methods and cost but differ in not combining flows. For this System Capacity Plan, transition and turning structures will be costed like junction structures using Table 9.
Table 9 – Junction Structure Cost
Junction Structure Cost
Trunk Sewer Junction Structure
Less than 24-inch Diameter Outlet Pipe $25,000
24 to 36-inch Diameter Outlet Pipe $50,000
Interceptor/Trunk Junction Structure
60-inch or less diameter Interceptor $165,000
72 to 78-inch Diameter Interceptor $230,000
84 to 144-inch Diameter Interceptor $850,000
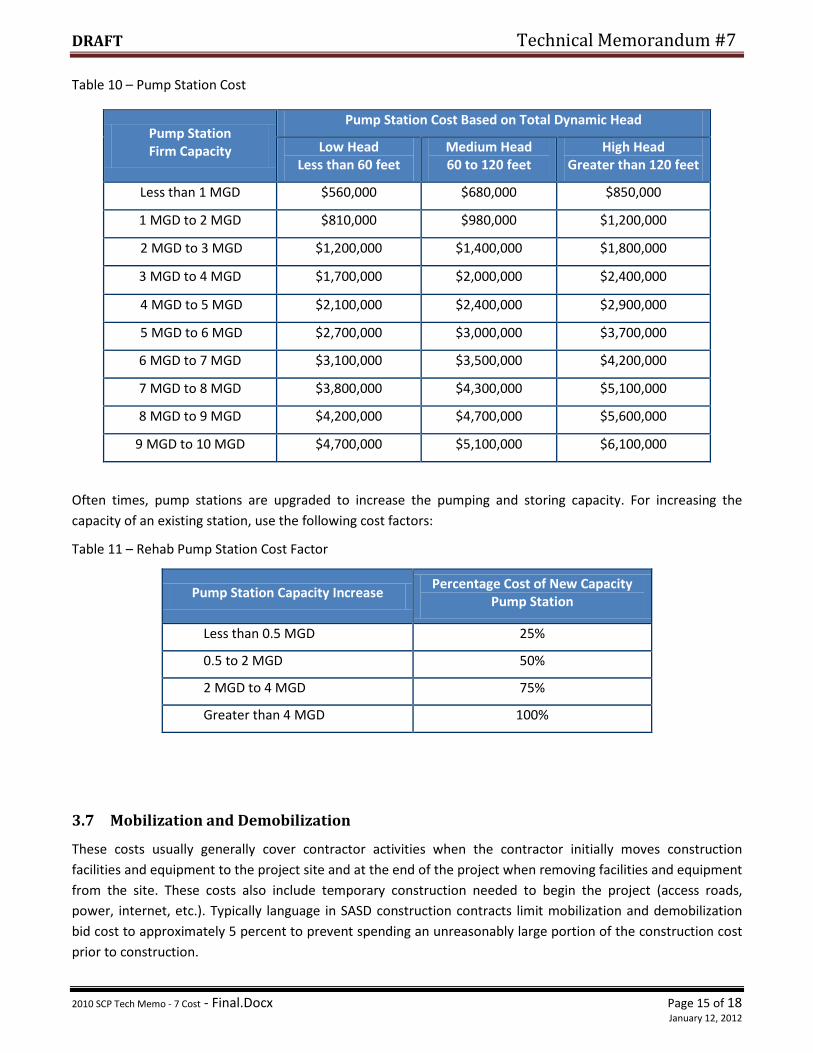
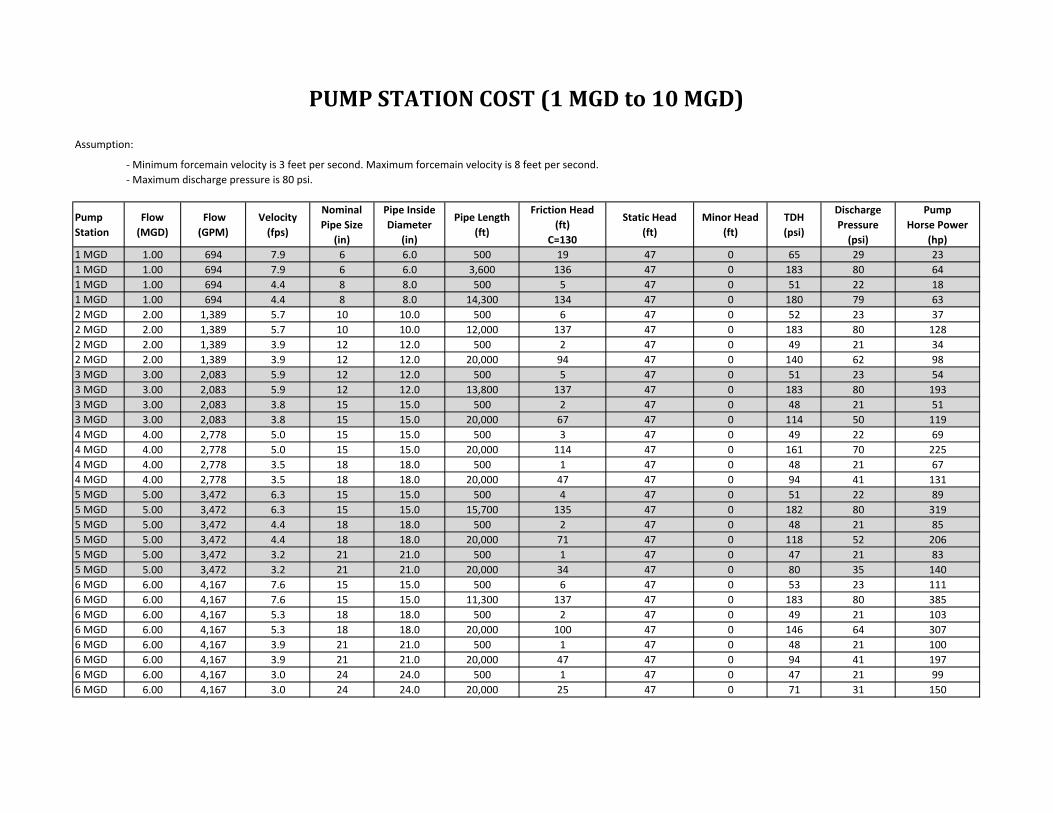
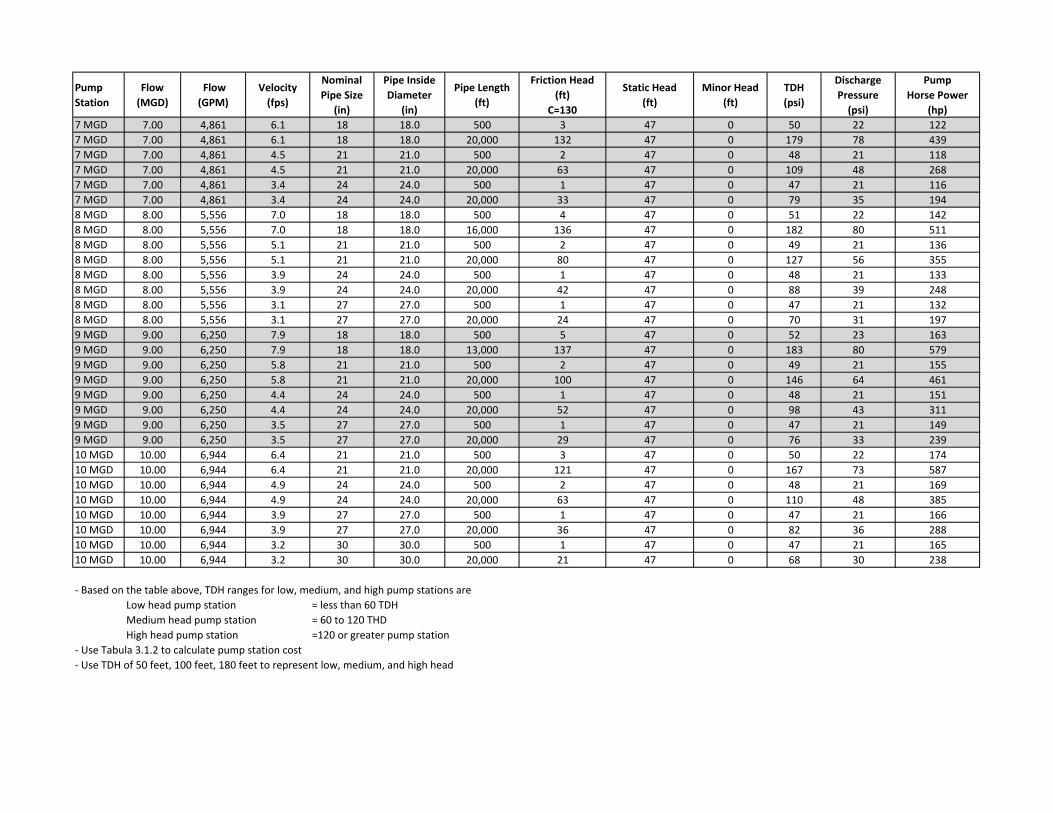
3.6.2 Pump Stations Pump stations are used to convey wastewater using pressurized pipelines. Costs can vary greatly depending on how much wastewater is being conveyed an on how far the wastewater will be pumped. Typically pump stations of the same firm capacity used to raise the hydraulic grade line (lift stations) require smaller pumps and appurtenances than pump stations used to convey wastewater from one location to another and are therefore less costly. The total dynamic head of pump station is a factor for determining the pump size, motor control center size, switch board size, wet well size, as well as other appurtenances. For those reasons, the pump stations cost shown in Table 10 are base on three different scenarios representing low, medium, and high head pump stations.
DRAFT Technical Memorandum #7
2010 SCP Tech Memo - 7 Cost - Final.Docx Page 15 of 18 January 12, 2012
Table 10 – Pump Station Cost
Pump Station Firm Capacity
Pump Station Cost Based on Total Dynamic Head
Low Head Less than 60 feet
Medium Head 60 to 120 feet
High Head Greater than 120 feet
Less than 1 MGD $560,000 $680,000 $850,000
1 MGD to 2 MGD $810,000 $980,000 $1,200,000
2 MGD to 3 MGD $1,200,000 $1,400,000 $1,800,000
3 MGD to 4 MGD $1,700,000 $2,000,000 $2,400,000
4 MGD to 5 MGD $2,100,000 $2,400,000 $2,900,000
5 MGD to 6 MGD $2,700,000 $3,000,000 $3,700,000
6 MGD to 7 MGD $3,100,000 $3,500,000 $4,200,000
7 MGD to 8 MGD $3,800,000 $4,300,000 $5,100,000
8 MGD to 9 MGD $4,200,000 $4,700,000 $5,600,000
9 MGD to 10 MGD $4,700,000 $5,100,000 $6,100,000
Often times, pump stations are upgraded to increase the pumping and storing capacity. For increasing the capacity of an existing station, use the following cost factors:
Table 11 – Rehab Pump Station Cost Factor
Pump Station Capacity Increase Percentage Cost of New Capacity
Pump Station
Less than 0.5 MGD 25%
0.5 to 2 MGD 50%
2 MGD to 4 MGD 75%
Greater than 4 MGD 100%
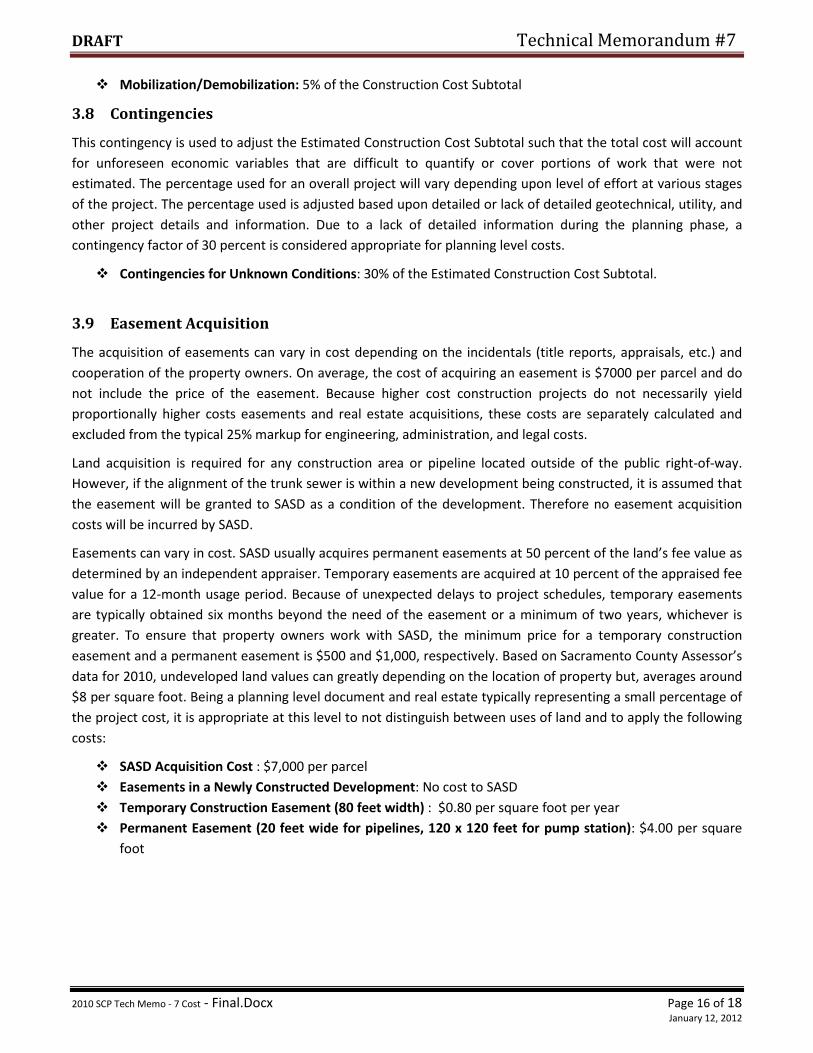
3.7 Mobilization and Demobilization
These costs usually generally cover contractor activities when the contractor initially moves construction facilities and equipment to the project site and at the end of the project when removing facilities and equipment from the site. These costs also include temporary construction needed to begin the project (access roads, power, internet, etc.). Typically language in SASD construction contracts limit mobilization and demobilization bid cost to approximately 5 percent to prevent spending an unreasonably large portion of the construction cost prior to construction.
DRAFT Technical Memorandum #7
2010 SCP Tech Memo - 7 Cost - Final.Docx Page 16 of 18 January 12, 2012
Mobilization/Demobilization: 5% of the Construction Cost Subtotal
3.8 Contingencies
This contingency is used to adjust the Estimated Construction Cost Subtotal such that the total cost will account for unforeseen economic variables that are difficult to quantify or cover portions of work that were not estimated. The percentage used for an overall project will vary depending upon level of effort at various stages of the project. The percentage used is adjusted based upon detailed or lack of detailed geotechnical, utility, and other project details and information. Due to a lack of detailed information during the planning phase, a contingency factor of 30 percent is considered appropriate for planning level costs.
Contingencies for Unknown Conditions: 30% of the Estimated Construction Cost Subtotal.
3.9 Easement Acquisition
The acquisition of easements can vary in cost depending on the incidentals (title reports, appraisals, etc.) and cooperation of the property owners. On average, the cost of acquiring an easement is $7000 per parcel and do not include the price of the easement. Because higher cost construction projects do not necessarily yield proportionally higher costs easements and real estate acquisitions, these costs are separately calculated and excluded from the typical 25% markup for engineering, administration, and legal costs.
Land acquisition is required for any construction area or pipeline located outside of the public right-of-way. However, if the alignment of the trunk sewer is within a new development being constructed, it is assumed that the easement will be granted to SASD as a condition of the development. Therefore no easement acquisition costs will be incurred by SASD.
Easements can vary in cost. SASD usually acquires permanent easements at 50 percent of the land’s fee value as determined by an independent appraiser. Temporary easements are acquired at 10 percent of the appraised fee value for a 12-month usage period. Because of unexpected delays to project schedules, temporary easements are typically obtained six months beyond the need of the easement or a minimum of two years, whichever is greater. To ensure that property owners work with SASD, the minimum price for a temporary construction easement and a permanent easement is $500 and $1,000, respectively. Based on Sacramento County Assessor’s data for 2010, undeveloped land values can greatly depending on the location of property but, averages around $8 per square foot. Being a planning level document and real estate typically representing a small percentage of the project cost, it is appropriate at this level to not distinguish between uses of land and to apply the following costs:
SASD Acquisition Cost : $7,000 per parcel Easements in a Newly Constructed Development: No cost to SASD Temporary Construction Easement (80 feet width) : $0.80 per square foot per year Permanent Easement (20 feet wide for pipelines, 120 x 120 feet for pump station): $4.00 per square
foot
DRAFT Technical Memorandum #7
2010 SCP Tech Memo - 7 Cost - Final.Docx Page 17 of 18 January 12, 2012
3.10 Engineering, Administration, and Legal Costs
Typically, a markup is applied to the Estimated Construction Cost to account for the various costs in bringing a planning level concept through design, construction, and closeout. The engineering, administration, and legal cost item will account for all reasonably anticipated cost items for both the design and a construction phase, assumed:
Engineering, Administration, and Legal Costs: 25% of the Total Estimated Construction Cost
This cost item includes and excludes the following:
Include:
Project Development Plan 1 & 2 SASD Design/Project Management Flow Monitoring and Capacity Analysis Consultant Design Environmental Clearance (Mitigated Negative Declaration) Permitting Typical Public Outreach Construction Inspection Construction Survey Construction Costs Administration Costs Legal Costs
Does not include:
Program Cost associated with implementing District’s Capital Improvement and Trunk Expansion Programs
Easements nor Real Estate Acquisitions
DRAFT Technical Memorandum #7
2010 SCP Tech Memo - 7 Cost - Final.Docx Page 18 of 18 January 12, 2012
4. REFERENCES
Tabula Version 3.1.2 King County, Washington, November 10, 2010
CSD-1 Master Plan 2000, Technical Memorandum No. 8B, August 1, 2000
CSD-1 Master Plan 2006, Master Plan TM No. 8B - Cost Research Results, February 23, 2006
SASD Standards and Specifications, June 22, 2011, Version 1.0
County of Sacramento Construction Standard Specification, January 2008
SASD New Construction Bid Summary 2000 to 2010
2010 RSMeans Heavy Construction Cost Data, 24th Annual Edition
Ebidboard.com for public agency construction bids from 2008 to 2010
Engineering News-Record, Construction Cost Index
SASD Sewer Ordinance, April 8, 2011.
Sacramento County Assessor’s Office Commercial and Land Sales for 2010
Interceptor Sequencing Study
COST APPENDIX
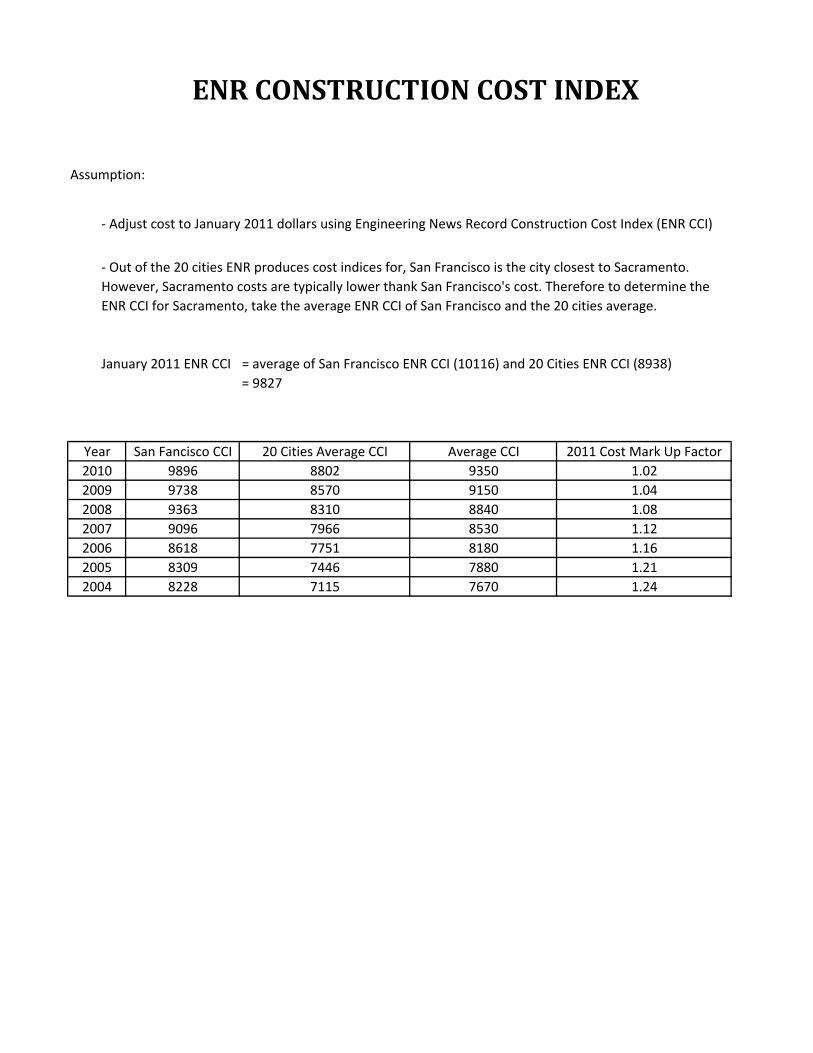
Assumption:
January 2011 ENR CCI = average of San Francisco ENR CCI (10116) and 20 Cities ENR CCI (8938)
= 9827
San Fancisco CCI 20 Cities Average CCI Average CCI 2011 Cost Mark Up Factor
9896 8802 9350 1.02
9738 8570 9150 1.04
9363 8310 8840 1.08
9096 7966 8530 1.12
8618 7751 8180 1.16
8309 7446 7880 1.21
8228 7115 7670 1.24
ENR CONSTRUCTION COST INDEX
2005
2004
‐ Adjust cost to January 2011 dollars using Engineering News Record Construction Cost Index (ENR CCI)
‐ Out of the 20 cities ENR produces cost indices for, San Francisco is the city closest to Sacramento.
However, Sacramento costs are typically lower thank San Francisco's cost. Therefore to determine the
ENR CCI for Sacramento, take the average ENR CCI of San Francisco and the 20 cities average.
Year
2010
2009
2008
2007
2006
50% 150%
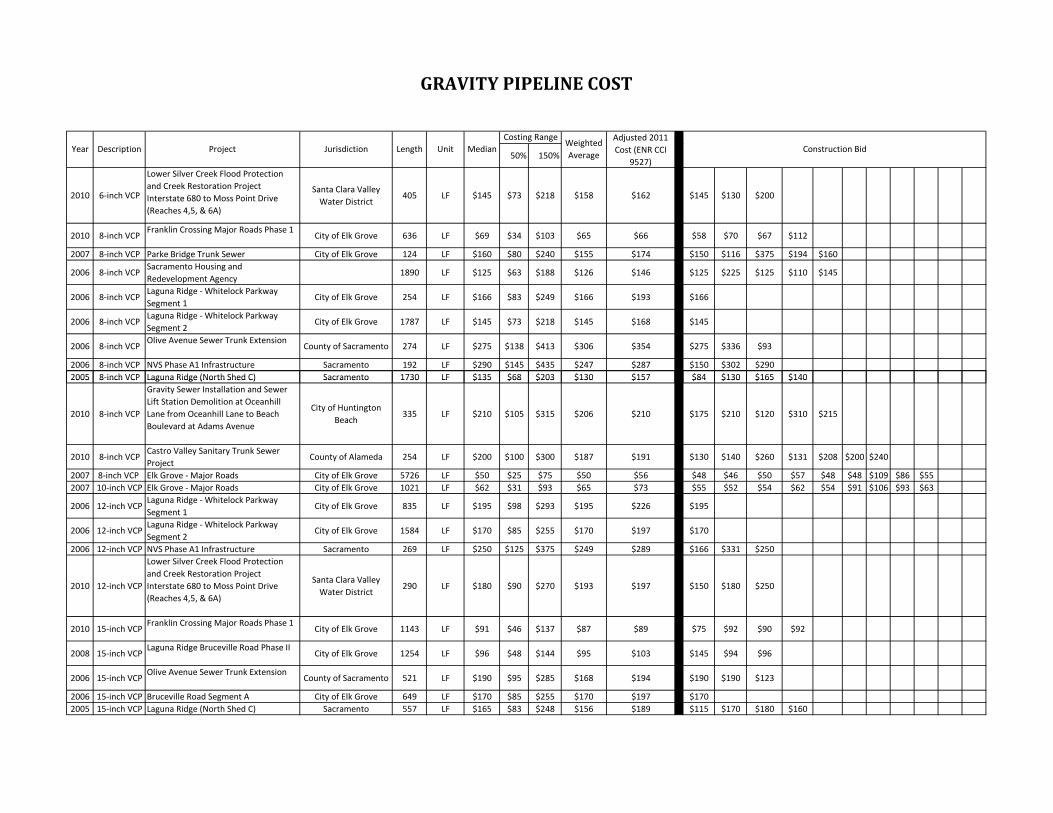
2010 6‐inch VCP
Lower Silver Creek Flood Protection
and Creek Restoration Project
Interstate 680 to Moss Point Drive
(Reaches 4,5, & 6A)
Santa Clara Valley
Water District405 LF $145 $73 $218 $158 $162 $145 $130 $200
2010 8‐inch VCPFranklin Crossing Major Roads Phase 1
City of Elk Grove 636 LF $69 $34 $103 $65 $66 $58 $70 $67 $112
2007 8‐inch VCP Parke Bridge Trunk Sewer City of Elk Grove 124 LF $160 $80 $240 $155 $174 $150 $116 $375 $194 $160
2006 8‐inch VCPSacramento Housing and
Redevelopment Agency1890 LF $125 $63 $188 $126 $146 $125 $225 $125 $110 $145
2006 8‐inch VCPLaguna Ridge ‐ Whitelock Parkway
Segment 1City of Elk Grove 254 LF $166 $83 $249 $166 $193 $166
2006 8‐inch VCPLaguna Ridge ‐ Whitelock Parkway
Segment 2City of Elk Grove 1787 LF $145 $73 $218 $145 $168 $145
2006 8‐inch VCPOlive Avenue Sewer Trunk Extension
County of Sacramento 274 LF $275 $138 $413 $306 $354 $275 $336 $93
2006 8‐inch VCP NVS Phase A1 Infrastructure Sacramento 192 LF $290 $145 $435 $247 $287 $150 $302 $290
2005 8‐inch VCP Laguna Ridge (North Shed C) Sacramento 1730 LF $135 $68 $203 $130 $157 $84 $130 $165 $140
Weighted
AverageConstruction Bid
GRAVITY PIPELINE COST
Adjusted 2011
Cost (ENR CCI
9527)
Year Description Project Jurisdiction Length Unit Median
Costing Range
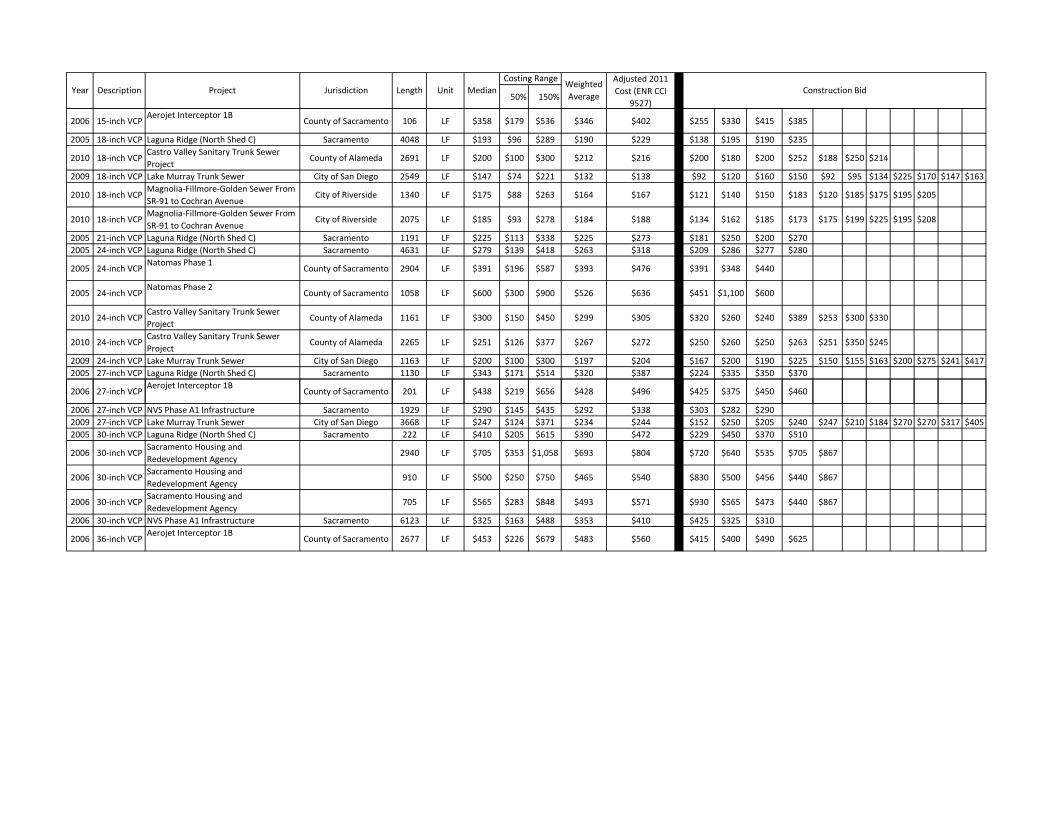
2005 8 inch VCP Laguna Ridge (North Shed C) Sacramento 1730 LF $135 $68 $203 $130 $157 $84 $130 $165 $140
2010 8‐inch VCP
Gravity Sewer Installation and Sewer
Lift Station Demolition at Oceanhill
Lane from Oceanhill Lane to Beach
Boulevard at Adams Avenue
City of Huntington
Beach335 LF $210 $105 $315 $206 $210 $175 $210 $120 $310 $215
2010 8‐inch VCPCastro Valley Sanitary Trunk Sewer
ProjectCounty of Alameda 254 LF $200 $100 $300 $187 $191 $130 $140 $260 $131 $208 $200 $240
2007 8‐inch VCP Elk Grove ‐ Major Roads City of Elk Grove 5726 LF $50 $25 $75 $50 $56 $48 $46 $50 $57 $48 $48 $109 $86 $55
2007 10‐inch VCP Elk Grove ‐ Major Roads City of Elk Grove 1021 LF $62 $31 $93 $65 $73 $55 $52 $54 $62 $54 $91 $106 $93 $63
2006 12‐inch VCPLaguna Ridge ‐ Whitelock Parkway
Segment 1City of Elk Grove 835 LF $195 $98 $293 $195 $226 $195
2006 12‐inch VCPLaguna Ridge ‐ Whitelock Parkway
Segment 2City of Elk Grove 1584 LF $170 $85 $255 $170 $197 $170
2006 12‐inch VCP NVS Phase A1 Infrastructure Sacramento 269 LF $250 $125 $375 $249 $289 $166 $331 $250
2010 12‐inch VCP
Lower Silver Creek Flood Protection
and Creek Restoration Project
Interstate 680 to Moss Point Drive
(Reaches 4,5, & 6A)
Santa Clara Valley
Water District290 LF $180 $90 $270 $193 $197 $150 $180 $250
2010 15‐inch VCPFranklin Crossing Major Roads Phase 1
City of Elk Grove 1143 LF $91 $46 $137 $87 $89 $75 $92 $90 $92
2008 15‐inch VCPLaguna Ridge Bruceville Road Phase II
City of Elk Grove 1254 LF $96 $48 $144 $95 $103 $145 $94 $96
2006 15‐inch VCPOlive Avenue Sewer Trunk Extension
County of Sacramento 521 LF $190 $95 $285 $168 $194 $190 $190 $123
2006 15‐inch VCP Bruceville Road Segment A City of Elk Grove 649 LF $170 $85 $255 $170 $197 $170
2005 15‐inch VCP Laguna Ridge (North Shed C) Sacramento 557 LF $165 $83 $248 $156 $189 $115 $170 $180 $160
50% 150%
Weighted
AverageConstruction Bid
Adjusted 2011
Cost (ENR CCI
9527)
Year Description Project Jurisdiction Length Unit Median
Costing Range
2006 15‐inch VCPAerojet Interceptor 1B
County of Sacramento 106 LF $358 $179 $536 $346 $402 $255 $330 $415 $385
2005 18‐inch VCP Laguna Ridge (North Shed C) Sacramento 4048 LF $193 $96 $289 $190 $229 $138 $195 $190 $235
2010 18‐inch VCPCastro Valley Sanitary Trunk Sewer
ProjectCounty of Alameda 2691 LF $200 $100 $300 $212 $216 $200 $180 $200 $252 $188 $250 $214
2009 18‐inch VCP Lake Murray Trunk Sewer City of San Diego 2549 LF $147 $74 $221 $132 $138 $92 $120 $160 $150 $92 $95 $134 $225 $170 $147 $163
2010 18‐inch VCPMagnolia‐Fillmore‐Golden Sewer From
SR‐91 to Cochran AvenueCity of Riverside 1340 LF $175 $88 $263 $164 $167 $121 $140 $150 $183 $120 $185 $175 $195 $205
2010 18‐inch VCPMagnolia‐Fillmore‐Golden Sewer From
SR‐91 to Cochran AvenueCity of Riverside 2075 LF $185 $93 $278 $184 $188 $134 $162 $185 $173 $175 $199 $225 $195 $208
2005 21‐inch VCP Laguna Ridge (North Shed C) Sacramento 1191 LF $225 $113 $338 $225 $273 $181 $250 $200 $270
2005 24‐inch VCP Laguna Ridge (North Shed C) Sacramento 4631 LF $279 $139 $418 $263 $318 $209 $286 $277 $280
2005 24‐inch VCPNatomas Phase 1
County of Sacramento 2904 LF $391 $196 $587 $393 $476 $391 $348 $440
2005 24‐inch VCPNatomas Phase 2
County of Sacramento 1058 LF $600 $300 $900 $526 $636 $451 $1,100 $600
2010 24‐inch VCPCastro Valley Sanitary Trunk Sewer
ProjectCounty of Alameda 1161 LF $300 $150 $450 $299 $305 $320 $260 $240 $389 $253 $300 $330
2010 24‐inch VCPCastro Valley Sanitary Trunk Sewer
ProjectCounty of Alameda 2265 LF $251 $126 $377 $267 $272 $250 $260 $250 $263 $251 $350 $245
2009 24‐inch VCP Lake Murray Trunk Sewer City of San Diego 1163 LF $200 $100 $300 $197 $204 $167 $200 $190 $225 $150 $155 $163 $200 $275 $241 $417
2005 27‐inch VCP Laguna Ridge (North Shed C) Sacramento 1130 LF $343 $171 $514 $320 $387 $224 $335 $350 $370
2006 27‐inch VCPAerojet Interceptor 1B
County of Sacramento 201 LF $438 $219 $656 $428 $496 $425 $375 $450 $460
2006 27‐inch VCP NVS Phase A1 Infrastructure Sacramento 1929 LF $290 $145 $435 $292 $338 $303 $282 $290
2009 27‐inch VCP Lake Murray Trunk Sewer City of San Diego 3668 LF $247 $124 $371 $234 $244 $152 $250 $205 $240 $247 $210 $184 $270 $270 $317 $405
2005 30‐inch VCP Laguna Ridge (North Shed C) Sacramento 222 LF $410 $205 $615 $390 $472 $229 $450 $370 $510
2006 30‐inch VCPSacramento Housing and
Redevelopment Agency2940 LF $705 $353 $1,058 $693 $804 $720 $640 $535 $705 $867
2006 30‐inch VCPSacramento Housing and
Redevelopment Agency910 LF $500 $250 $750 $465 $540 $830 $500 $456 $440 $867
2006 30‐inch VCPSacramento Housing and
Redevelopment Agency705 LF $565 $283 $848 $493 $571 $930 $565 $473 $440 $867
2006 30‐inch VCP NVS Phase A1 Infrastructure Sacramento 6123 LF $325 $163 $488 $353 $410 $425 $325 $310
2006 36‐inch VCPAerojet Interceptor 1B
County of Sacramento 2677 LF $453 $226 $679 $483 $560 $415 $400 $490 $625
VCP GRAVITY PIPELINE COSTPipe Size Cost Depth 8' to 16' 16' to 20' 20' to 24' 24' to 28'
6 111.77 8 to 16 $131
8 140.67 8 to 16 $160
10 169.57 8 to 16 $189
12 198.47 8 to 16 $213
15 241.82 8 to 16 $257
18 285.17 16 to 20 $312
21 328.52 16 to 20 $356
24 371.87 16 to 20 $404
27 415.22 16 to 20 $447
30 458.57 20 to 24 $491
33 501.92 20 to 24 $534
36 545.27 20 to 24 $577
MANHOLE COST PER LINEAR FOOT USE THIS FOR GRAVITY PIPELINE COSTAverage Cost Spacing 400 Spacing 500 Pipe Size 8' to 16' 16' to 20' 20' to 24' 24' to 28'
7500 19 15 VCP ‐ 6 135 160 ‐‐‐‐‐‐ ‐‐‐‐‐‐
13500 N/A 27 VCP ‐ 8 160 185 ‐‐‐‐‐‐ ‐‐‐‐‐‐
8000 N/A 16 VCP ‐ 10 190 210 ‐‐‐‐‐‐ ‐‐‐‐‐‐
16000 N/A 32 VCP ‐ 12 220 235 260 285
19000 N/A 38 VCP ‐ 15 255 275 300 325
Manholes
48‐inch Manhole < 16 feet deep Pipe 8‐21
48‐inch Manhole > 16 feet deep Pipe 12‐21
60‐inch Manhole < 16 feet deep Pipe 24<
60‐inch Manhole > 16 feet deep Pipe 24<
72‐inch Manhole > 16 feet deep
y = 14.45x + 25.07R² = 0.538
$0
$200
$400
$600
$800
$1,000
0 5 10 15 20 25 30 35 40
Pipe
Cost
Pipe Diameter (in)
Pipe Cost vs Pipe Diameter
Series1
Linear (Series1)
VCP ‐ 18 285 310 340 370
VCP ‐ 21 330 355 385 415
VCP ‐ 24 365 390 420 450
VCP ‐ 27 395 420 455 490
VCP ‐ 30 430 460 495 530
VCP ‐ 33 465 495 530 565
VCP ‐ 36 495 530 570 610
RCP ‐ 39 530 565 605 645
RCP‐ 42 565 600 640 680
CHECK ‐ MASTER PLAN 2006 ADJUSTED VALUES (ENR CCI 8064)
Adjusted Value VarianceAdjusted
ValueVariance
Adjusted
ValueVariance
Adjusted
ValueVariance
6 ‐‐‐‐‐‐ N/A ‐‐‐‐‐‐ N/A ‐‐‐‐‐‐ N/A ‐‐‐‐‐‐ N/A
8 $177 ‐$17 ‐‐‐‐‐‐ N/A ‐‐‐‐‐‐ N/A ‐‐‐‐‐‐ N/A
10 $201 ‐$11 ‐‐‐‐‐‐ N/A ‐‐‐‐‐‐ N/A ‐‐‐‐‐‐ N/A
12 $224 ‐$4 $236 ‐$1 $260 $0 $284 $1
15 $260 ‐$5 $284 ‐$9 $295 $5 $319 $6
18 $295 ‐$10 $319 ‐$9 $343 ‐$3 $366 $4
21 $331 ‐$1 $354 $1 $378 $7 $402 $13
24 $366 ‐$1 $390 $0 $413 $7 $449 $1
27 $402 ‐$7 $425 ‐$5 $461 ‐$6 $496 ‐$6
30 $437 ‐$7 $461 ‐$1 $496 ‐$1 $532 ‐$2
33 $473 ‐$8 $508 ‐$13 $543 ‐$13 $579 ‐$14
36 $508 ‐$13 $543 ‐$13 $579 ‐$9 $626 ‐$16
39 $532 ‐$2 $579 ‐$14 $614 ‐$9 $662 ‐$17
Check Okay 42 $567 ‐$2 $614 ‐$14 $662 ‐$22 $709 ‐$29
24' to 28'
Pipe Size
8' to 16' 16' to 20' 20' to 24'
y = 14.45x + 25.07R² = 0.538
$0
$200
$400
$600
$800
$1,000
0 5 10 15 20 25 30 35 40
Pipe
Cost
Pipe Diameter (in)
Pipe Cost vs Pipe Diameter
Series1
Linear (Series1)

Assumption:
‐ Force mains to be in depth range of 4 to 16 feet. Force mains located deeper than 16 feet, use unit cost for gravity pipe.
‐ Force main to be ductile iron pipe.
‐ Air release valves and manhole vault to be installed every 3000 feet (included in unit price for force main).
Total CostCost Per Linear Foot
Use
CY $/CY CY $/CY CY $/CY LF $/LF LF $/LF CY $/CY CY $/CY CY $/CY LS $/LS $ $/LF $/LF
500 $4.00 1222 $28.70 444 $15.00 1000 $4.00 1000 $36.41 110 $45.00 170 $28.70 942 $45.00 367 $12.00 $140,783 $141 $140
500 $4.00 1889 $28.70 1111 $15.00 1000 $4.00 1000 $36.41 110 $45.00 170 $28.70 1609 $45.00 567 $8.00 $200,050 $200 $200
500 $4.00 1222 $28.70 444 $15.00 1000 $4.00 1000 $42.24 110 $45.00 170 $28.70 942 $45.00 367 $12.00 $146,613 $147 $150
500 $4.00 1889 $28.70 1111 $15.00 1000 $4.00 1000 $42.24 110 $45.00 170 $28.70 1609 $45.00 567 $8.00 $205,880 $206 $205
500 $4.00 1222 $28.70 444 $15.00 1000 $4.00 1000 $46.20 110 $45.00 170 $28.70 942 $45.00 367 $12.00 $150,573 $151 $160
500 $4.00 1889 $28.70 1111 $15.00 1000 $4.00 1000 $46.20 110 $45.00 170 $28.70 1609 $45.00 567 $8.00 $209,840 $210 $210
500 $4.00 1222 $28.70 444 $15.00 1000 $4.00 1000 $62.70 110 $45.00 170 $28.70 942 $45.00 367 $12.00 $167,073 $167 $170
500 $4.00 1889 $28.70 1111 $15.00 1000 $4.00 1000 $62.70 110 $45.00 170 $28.70 1609 $45.00 567 $8.00 $226,340 $226 $225
500 $4.00 1222 $28.70 444 $15.00 1000 $4.00 1000 $78.10 110 $45.00 170 $28.70 942 $45.00 367 $12.00 $182,473 $182 $180
667 $4.00 1889 $28.70 1111 $15.00 1000 $4.00 1000 $78.10 110 $45.00 170 $28.70 1609 $45.00 567 $8.00 $242,407 $242 $240
667 $4.00 1630 $28.70 593 $15.00 1000 $4.00 1000 $107.80 150 $45.00 220 $28.70 1260 $45.00 489 $12.00 $245,740 $246 $245
667 $4.00 2519 $28.70 1481 $15.00 1000 $4.00 1000 $107.80 150 $45.00 220 $28.70 2149 $45.00 756 $8.00 $324,762 $325 $325
667 $4.00 1630 $28.70 593 $15.00 1000 $4.00 1000 $138.38 150 $45.00 220 $28.70 1260 $45.00 489 $12.00 $276,315 $276 $275
667 $4.00 2519 $28.70 1481 $15.00 1000 $4.00 1000 $138.38 150 $45.00 220 $28.70 2149 $45.00 756 $8.00 $355,337 $355 $355
667 $4.00 1630 $28.70 593 $15.00 1000 $4.00 1000 $163.13 150 $45.00 220 $28.70 1260 $45.00 489 $12.00 $301,065 $301 $300
667 $4.00 2519 $28.70 1481 $15.00 1000 $4.00 1000 $163.13 150 $45.00 220 $28.70 2149 $45.00 756 $8.00 $380,087 $380 $380
667 $4.00 1630 $28.70 593 $15.00 1000 $4.00 1000 $214.88 150 $45.00 220 $28.70 1260 $45.00 489 $12.00 $352,815 $353 $355
667 $4.00 2519 $28.70 1481 $15.00 1000 $4.00 1000 $214.88 150 $45.00 220 $28.70 2149 $45.00 756 $8.00 $431,837 $432 $430
Use these cost for force mains
60‐inch Manhole < 16 feet deep
Cost
$8,000
Pavement Removal/Temporary
Replacement
Trench Excavation
DewateringARV Installation and Manhole
Pipe and Installation
Pipe BeddingIntermediate Backfill &
Compaction
140 200
Backfill & Compaction
Hauling of Excess Native
Material
Less than 10 Feet Deep
Cost ($/lf)
10 to 16 Feet Deep
Cost ($/lf)
8" DIP 10 to 16 feet deep
10" DIP less than 10 feet deep
4" DIP less than 10 feet deep
4" DIP 10 to 16 feet deep
6" DIP less than 10 feet deep
6" DIP 10 to 16 feet deep
8" DIP less than 10 feet deep
15" DIP less than 10 feet deep
15" DIP 10 to 16 feet deep
18" DIP less than 10 feet deep
225
240
18
150
160
170
180
245
275
21
24
Cost per LF Based on Spacing of 3,000 feet
Air Release Valve ‐ ARI Nylon D‐206
8
10
12
380
430
325
355
300
355
205
210
$2,500
$4
FORCE MAIN COST
Force main
15
Force Main Diameter (in)4
18" DIP 10 to 16 feet deep
21" DIP less than 10 feet deep
21" DIP 10 to 16 feet deep
24" DIP less than 10 feet deep
24" DIP 10 to 16 feet deep
Description
10" DIP 10 to 16 feet deep
12" DIP less than 10 feet deep
12" DIP 10 to 16 feet deep

Assumptions:
‐ Bore and jack unit cost does not include jacking and receiving pit cost.
Steel Casing Pipe Diameter
(in)
Bore and Jack Cost ($/lf)
Pipe and Installation
Cost ($/lf)
Total Bore and Jack Cost ($/lf)
Use this for Bore and Jack Unit Cost
($/lf)
36 575 $40.50 $616 $615
36 575 $51.50 $627 $625
36 575 $56.00 $631 $630
36 575 $78.00 $653 $655
42 625 $42.50 $668 $670
43 675 $46.50 $722 $720
49 735 $58.00 $793 $795
51 765 $79.00 $844 $845
56 800 $87.50 $888 $890
59 845 $100.25 $945 $945
64 925 $113.00 $1,038 $1,040
68 980 $124.00 $1,104 $1,105
72 1030 $135.00 $1,165 $1,165
39
42
BORE AND JACK COST
‐ Bore and jack unit cost include mobilization and demobilization cost and carrier pipe and
installation cost.
21
24
27
30
33
36
Carrier Pipe Diameter
(in)
8
10
12
15
18
Assumptions:
MOBILIZATION AND DEMOBILIZATIONTypical mobilization cost approximately $44,000 per day.
MICROTUNNEL
Tunnel Diameter
(in)
Microtunnel Unit Cost($/lf)
Use this for Microtunnel Unit Cost($/lf)
8 $819 $820
10 $819 $820
12 $819 $820
15 $847 $845
18 $847 $845
21 $893 $895
24 $982 $980
27 $982 $980
30 $982 $980
33 $982 $980
36 $982 $980
39 $982 $980
42 $982 $980
36 $1,023 $1,025
36 $1,034 $1,035
36 $1,038 $1,040
36 $1,060 $1,060
42 $1,025 $1,025
43 $1,029 $1,030
49 $1,060 $1,060
51 $1,124 $1,125
56 $1,154 $1,155
59 $1,240 $1,240
64 $1,336 $1,335
68 $1,479 $1,470
72 $1,702 $1,700
MICROTUNNELING COST
2.5
4
6
$110,000
$180,000
$260,000
‐ Average production rate is 32 to 60 feet per day.
‐ Unit price of microtunnel includes the cost of bore and carrier pipe. Mobilization and demobilization is separate.‐ Smaller pipelines (15‐inch diameter or smaller) will be using microtunneling for force mains, pipe material will be
ductile iron.‐ Larger pipeline (18‐inch diameter or greater) will be using microtunneling for trunk sewers, pipe material will be
reinforced concrete.‐ Jacking and receiving pits will be separate items and are not included in the unit cost of pipe ramming.
Mobilization/Demobilization ($/Day)
Mobilization/Demobilization Cost(Job)
Traveling Days
$44,000
$44,000
Bore Hole Diameter
Less than 24‐inch
24 to 48‐inch
$44,000
$0.00
$0.00
$0.00
$113.00
$124.00
$135.00
$42.50
$46.50
$58.00
$79.00
$87.50
$100.25
Carrier Pipe($/lf)
$0.00
$0.00
$0.00
$0.00
$0.00
$916.67
$936.17
$1,000.00
$880.00
$880.00
$880.00
$880.00
$880.00
$880.00
$0.00
$0.00
$40.50
$51.50
$56.00
$78.00
$0.00
$0.00
$0.00
$12.40
$12.40
$1,073.17
$1,189.19
$1,375.00
$880.00
$880.00
$880.00
$880.00
$880.00
$897.96
$15.50
$15.83
$16.91
$18.15
$12.40
$12.40
$12.40
$12.40
$12.40
$12.40
$145.95
$168.75
$10.33
$10.33
$10.33
$10.69
$10.69
$11.27
$90.00
$90.00
$90.00
$91.84
$112.50
$114.89
$90.00
$90.00
$90.00
$90.00
$20.11
$23.25
$90.00
$90.00
$12.40
$12.65
Equipment Technician
($/lf)
Casing Installation
($/lf)
$75.00
$77.59
$77.59
$81.82
41
50
50
50
$12.40
$12.40
$12.40
$12.40
$122.73
$131.71
$733.33
$733.33
$733.33
$758.62
$758.62
$800.00
$880.00
$880.00
37
32
Tunnel Equipment
($/lf)
$75.00
$75.00
$90.00
$90.00
$90.00
$90.00
50
50
49
48
47
44
50
50
50
50
50
50
55
50
50
33 ‐ RCP
36 ‐ RCP
39 ‐ RCP
42 ‐ RCP
Tunnel Production Rate
(lf/day)
60
60
60
58
58
15‐ DIP
18 ‐ RCP
21 ‐ RCP
24 ‐ RCP
27 ‐ RCP
30 ‐ RCP
‐‐‐‐‐‐
‐‐‐‐‐‐
‐‐‐‐‐‐
8 ‐ DIP
10 ‐ DIP
12 ‐ DIP
‐‐‐‐‐‐
‐‐‐‐‐‐
‐‐‐‐‐‐
‐‐‐‐‐‐
‐‐‐‐‐‐
‐‐‐‐‐‐
Greater than 48‐inch
Pipe Diameter
(in)
‐‐‐‐‐‐
‐‐‐‐‐‐
‐‐‐‐‐‐
‐‐‐‐‐‐
Assumptions:
Pipe Ramming Cost 2000 (ENR
CCI 6474)($/lf)
Adjusted Pipe Ramming Cost (ENR CCI 9527)
($/lf)
Pipe Size
Pipe and Installation
Cost($/lf)
Pipe Type
Total Pipe Ramming
Cost($/lf)
Use this for Pipe
Ramming Cost ($/lf)
$180 $265 8‐inch $40.50 DIP $305 $305
$200 $294 10‐inch $51.50 DIP $346 $345
$220 $324 12‐inch $56.00 DIP $380 $380
$260 $383 15‐inch $78.00 DIP $461 $460
$315 $464 18‐inch $42.50 RCP $506 $505
$315 $464 21‐inch $46.50 RCP $510 $510
$330 $486 24‐inch $58.00 RCP $544 $545
$365 $537 27‐inch $79.00 RCP $616 $615
$390 $574 30‐inch $87.50 RCP $661 $660
$420 $618 33‐inch $100.25 RCP $718 $720
$480 $706 36‐inch $113.00 RCP $819 $820
$520 $765 39‐inch $124.00 RCP $889 $890
$560 $824 42‐inch $135.00 RCP $959 $960
71‐inch
76‐inch
80‐inch
84‐inch
‐ Pipe ramming is most useful in short drives and shallow applications.
‐ Mobilization and demobilization cost will be included in the unit price of pipe ramming.
‐ Pipe installation cost will also be include in the price of pipe ramming.
‐ Smaller pipelines (15‐inch diameter or smaller) will be using pipe ramming for force mains, pipe material will
be ductile iron.
‐ Larger pipelines (18‐inch diameter or greater) will be using pipe ramming for trunk sewers, pipe material
will be reinforced concrete.
‐ Jacking and receiving pits will be separate items and are not included in the unit cost for pipe ramming
47‐inch
55‐inch
56‐inch
61‐inch
63‐inch
68‐inch
42‐inch
‐ Casing to accommodate carrier pipe bell plus 12 inches.
‐ Due to the lack of available cost information on pipe ramming, unit price cost for pipe ramming will be
obtained from ENR CCI adjustments from Master Plan 2000.
PIPE RAMMING COST
Casing Size
37‐inch
40‐inch
Assumption:
‐ Adjust unit pricing from SASD Master Plan 2000 based on ENR CCI.
No
Groundwater
High
Groundwater
Undeveloped
Area (LF)
High
Groundwater
Developed
Area (LF)
No
Groundwater
High
Groundwater
Undeveloped
Area (LF)
High
Groundwater
Developed
Area (LF)
No
Groundwater
High
Groundwater
Undeveloped
Area (LF)
High
Groundwater
Developed
Area (LF)
Baseline 20 50 Baseline $29 $74 Baseline $30 $75
Baseline 40 75 Baseline $59 $110 Baseline $60 $110
Baseline 60 90 Baseline $88 $132 Baseline $90 $135
Baseline 80 480 Baseline $118 $706 Baseline $120 $710
Check Sheet Piles at 24 to 28 feet
Pipe depth at 26 feet, excavation depth at 27 feet
Sheet Piles 25' deep excavation range =$26.50 sf
drive, extract, and salvage
Sheet Piles = $715.50 compared to $710/lf
okay
20 to 24
24 to 28
‐ There is limited information on project cost for sheeting and shoring. Projects are typically bid on a lump sum basis and therefore making it
difficult to determine actual sheeting and shoring cost.
ADDITIONAL SHEETING AND SHORING COST
Master Plan 2000 (ENR CCI 6474) Unit Cost Adjustment (ENR CCI 9827) Use these Unit Cost for System Capacity Plan
Depth (ft)
8 to 16
16 to 20
Assumptions:
Typical cost for 2000 feet of pipeline installation on major road
Quantity Unit Cost Unit CostTraffic Control Design 1 $25,000.00 LS $25,000.00
2000 $24.00 LF $48,000.00
Portable Changeable Message 1 $10,000.00 EA $10,000.00
Channelizer/Crash barrels 1 $5,000.00 LS $5,000.00
Total $88,000.00
$44.00
$45/LF
K‐Type Rail
Description
Price per Linear Foot
Use this for traffic control
‐ Minor traffic control consisting of two‐way flagging, construction area signs, traffic cones, and
channelizers are included in the pipe installation cost.
‐ Additional traffic control to be used on major roads. Major roads have 4 or more lanes.
‐ Because traffic control is usually bid as a lump sum item, it is difficult to determine traffic control
costs from previous project bids. Therefore traffic control cost are obtained from catalogued unit
items.
ADDITIONAL TRAFFIC CONTROL COST

50% 150%
2010 HydroseedingLower Silver Creek Flood Protection
and Creek Restoration Project
Santa Clara
Valley Water
District
84330 SF $0.25 $0.13 $0.38 $0.27 $0.27 $0.28 $0.10 $0.25
2010 HydroseedingLower Silver Creek Flood Protection
and Creek Restoration Project
Santa Clara
Valley Water
District
38500 SF $0.15 $0.08 $0.23 $0.13 $0.13 $0.15 $0.10 $0.25
2010 HydroseedingLower Silver Creek Flood Protection
and Creek Restoration Project
Santa Clara
Valley Water
District
7900 SF $0.13 $0.07 $0.20 $0.12 $0.12 $0.13 $0.10 $0.25
2010 HydroseedingLower Silver Creek Flood Protection
and Creek Restoration Project
Santa Clara
Valley Water
District
26200 SF $0.12 $0.06 $0.18 $0.11 $0.11 $0.10 $0.12 $0.25
2009 Hydroseeding Metro Air Park Gravity ConnectorCounty of
Sacramento2 AC $2,500.00 $1,250.00 $3,750.00 $2,266.67 $0.05 $2,500.00 $1,800.00 $6,000.00 $2,500.00
2009 Hydroseeding Metro Air Park Force MainCounty of
Sacramento12 AC $1,700.00 $850.00 $2,550.00 $1,764.05 $0.04 $1,700.00 $1,600.00 $2,000.00 $1,250.00 $1,900.00 $1,250.00 $1,635.00 $1,600.00 $2,900.00 $2,100.00 $1,700.00 $2,525.87 $1,907.75
Average $0.12
Use $0.25 per SF
Adjusted to 2011 Cost (ENR 9527)
($/SF)Construction Bid
REVEGETATION COST
Bid Year
Description Project Jurisdiction Quantity Unit Median
Cost Range
Weighted Average
Assumption:
‐ Minimum forcemain velocity is 3 feet per second. Maximum forcemain velocity is 8 feet per second.
‐ Maximum discharge pressure is 80 psi.
Pump Station
Flow (MGD)
Flow (GPM)
Velocity(fps)
Nominal Pipe Size
(in)
Pipe Inside Diameter
(in)
Pipe Length(ft)
Friction Head(ft)
C=130
Static Head(ft)
Minor Head(ft)
TDH(psi)
Discharge Pressure(psi)
Pump Horse Power
(hp)1 MGD 1.00 694 7.9 6 6.0 500 19 47 0 65 29 23
1 MGD 1.00 694 7.9 6 6.0 3,600 136 47 0 183 80 64
1 MGD 1.00 694 4.4 8 8.0 500 5 47 0 51 22 18
1 MGD 1.00 694 4.4 8 8.0 14,300 134 47 0 180 79 63
2 MGD 2.00 1,389 5.7 10 10.0 500 6 47 0 52 23 37
2 MGD 2.00 1,389 5.7 10 10.0 12,000 137 47 0 183 80 128
2 MGD 2.00 1,389 3.9 12 12.0 500 2 47 0 49 21 34
2 MGD 2.00 1,389 3.9 12 12.0 20,000 94 47 0 140 62 98
3 MGD 3.00 2,083 5.9 12 12.0 500 5 47 0 51 23 54
3 MGD 3.00 2,083 5.9 12 12.0 13,800 137 47 0 183 80 193
3 MGD 3.00 2,083 3.8 15 15.0 500 2 47 0 48 21 51
3 MGD 3.00 2,083 3.8 15 15.0 20,000 67 47 0 114 50 119
4 MGD 4.00 2,778 5.0 15 15.0 500 3 47 0 49 22 69
4 MGD 4.00 2,778 5.0 15 15.0 20,000 114 47 0 161 70 225
4 MGD 4.00 2,778 3.5 18 18.0 500 1 47 0 48 21 67
4 MGD 4.00 2,778 3.5 18 18.0 20,000 47 47 0 94 41 131
5 MGD 5.00 3,472 6.3 15 15.0 500 4 47 0 51 22 89
5 MGD 5.00 3,472 6.3 15 15.0 15,700 135 47 0 182 80 319
5 MGD 5.00 3,472 4.4 18 18.0 500 2 47 0 48 21 85
5 MGD 5.00 3,472 4.4 18 18.0 20,000 71 47 0 118 52 206
5 MGD 5.00 3,472 3.2 21 21.0 500 1 47 0 47 21 83
5 MGD 5.00 3,472 3.2 21 21.0 20,000 34 47 0 80 35 140
6 MGD 6.00 4,167 7.6 15 15.0 500 6 47 0 53 23 111
6 MGD 6.00 4,167 7.6 15 15.0 11,300 137 47 0 183 80 385
6 MGD 6.00 4,167 5.3 18 18.0 500 2 47 0 49 21 103
6 MGD 6.00 4,167 5.3 18 18.0 20,000 100 47 0 146 64 307
6 MGD 6.00 4,167 3.9 21 21.0 500 1 47 0 48 21 100
6 MGD 6.00 4,167 3.9 21 21.0 20,000 47 47 0 94 41 197
6 MGD 6.00 4,167 3.0 24 24.0 500 1 47 0 47 21 99
6 MGD 6.00 4,167 3.0 24 24.0 20,000 25 47 0 71 31 150
PUMP STATION COST (1 MGD to 10 MGD)
Pump Station
Flow (MGD)
Flow (GPM)
Velocity(fps)
Nominal Pipe Size
(in)
Pipe Inside Diameter
(in)
Pipe Length(ft)
Friction Head(ft)
C=130
Static Head(ft)
Minor Head(ft)
TDH(psi)
Discharge Pressure(psi)
Pump Horse Power
(hp)7 MGD 7.00 4,861 6.1 18 18.0 500 3 47 0 50 22 122
7 MGD 7.00 4,861 6.1 18 18.0 20,000 132 47 0 179 78 439
7 MGD 7.00 4,861 4.5 21 21.0 500 2 47 0 48 21 118
7 MGD 7.00 4,861 4.5 21 21.0 20,000 63 47 0 109 48 268
7 MGD 7.00 4,861 3.4 24 24.0 500 1 47 0 47 21 116
7 MGD 7.00 4,861 3.4 24 24.0 20,000 33 47 0 79 35 194
8 MGD 8.00 5,556 7.0 18 18.0 500 4 47 0 51 22 142
8 MGD 8.00 5,556 7.0 18 18.0 16,000 136 47 0 182 80 511
8 MGD 8.00 5,556 5.1 21 21.0 500 2 47 0 49 21 136
8 MGD 8.00 5,556 5.1 21 21.0 20,000 80 47 0 127 56 355
8 MGD 8.00 5,556 3.9 24 24.0 500 1 47 0 48 21 133
8 MGD 8.00 5,556 3.9 24 24.0 20,000 42 47 0 88 39 248
8 MGD 8.00 5,556 3.1 27 27.0 500 1 47 0 47 21 132
8 MGD 8.00 5,556 3.1 27 27.0 20,000 24 47 0 70 31 197
9 MGD 9.00 6,250 7.9 18 18.0 500 5 47 0 52 23 163
9 MGD 9.00 6,250 7.9 18 18.0 13,000 137 47 0 183 80 579
9 MGD 9.00 6,250 5.8 21 21.0 500 2 47 0 49 21 155
9 MGD 9.00 6,250 5.8 21 21.0 20,000 100 47 0 146 64 461
9 MGD 9.00 6,250 4.4 24 24.0 500 1 47 0 48 21 151
9 MGD 9.00 6,250 4.4 24 24.0 20,000 52 47 0 98 43 311
9 MGD 9.00 6,250 3.5 27 27.0 500 1 47 0 47 21 149
9 MGD 9.00 6,250 3.5 27 27.0 20,000 29 47 0 76 33 239
10 MGD 10.00 6,944 6.4 21 21.0 500 3 47 0 50 22 174
10 MGD 10.00 6,944 6.4 21 21.0 20,000 121 47 0 167 73 587
10 MGD 10.00 6,944 4.9 24 24.0 500 2 47 0 48 21 169
10 MGD 10.00 6,944 4.9 24 24.0 20,000 63 47 0 110 48 385
10 MGD 10.00 6,944 3.9 27 27.0 500 1 47 0 47 21 166
10 MGD 10.00 6,944 3.9 27 27.0 20,000 36 47 0 82 36 288
10 MGD 10.00 6,944 3.2 30 30.0 500 1 47 0 47 21 165
10 MGD 10.00 6,944 3.2 30 30.0 20,000 21 47 0 68 30 238
‐ Based on the table above, TDH ranges for low, medium, and high pump stations are
Low head pump station = less than 60 TDH
Medium head pump station = 60 to 120 THD
High head pump station =120 or greater pump station
‐ Use Tabula 3.1.2 to calculate pump station cost
‐ Use TDH of 50 feet, 100 feet, 180 feet to represent low, medium, and high head
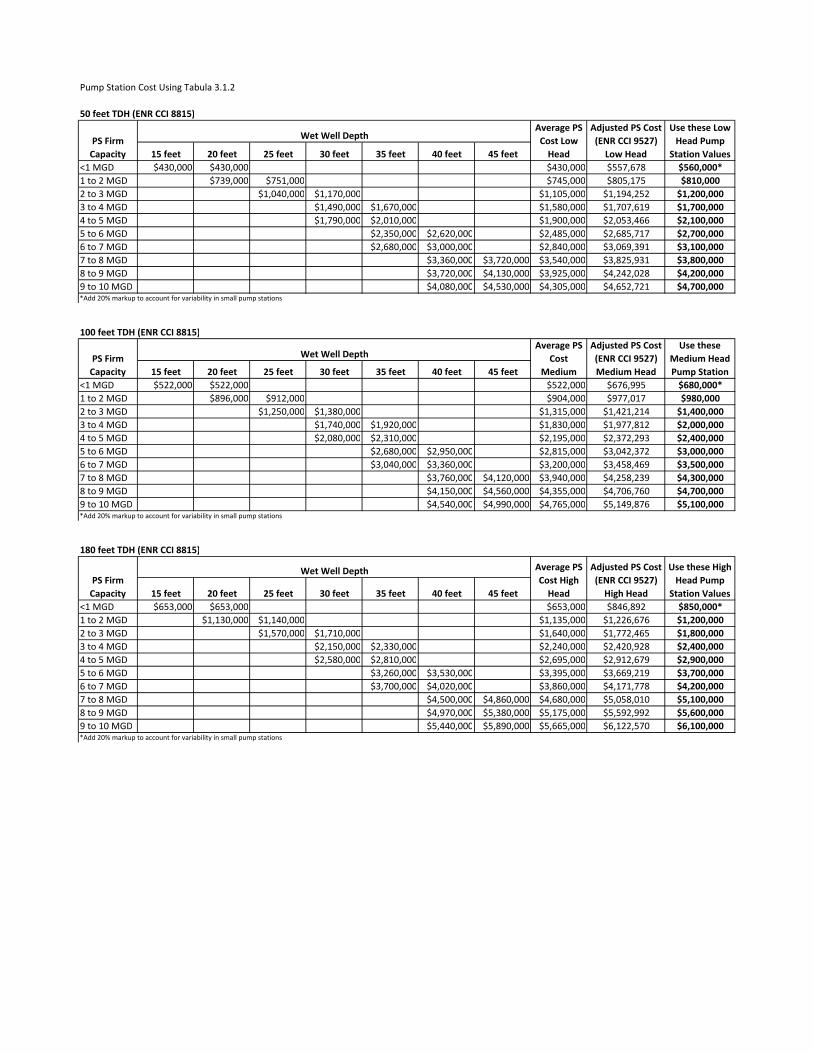
Pump Station Cost Using Tabula 3.1.2
50 feet TDH (ENR CCI 8815)
15 feet 20 feet 25 feet 30 feet 35 feet 40 feet 45 feet<1 MGD $430,000 $430,000 $430,000
1 to 2 MGD $739,000 $751,000 $745,000
2 to 3 MGD $1,040,000 $1,170,000 $1,105,000
3 to 4 MGD $1,490,000 $1,670,000 $1,580,000
4 to 5 MGD $1,790,000 $2,010,000 $1,900,000
5 to 6 MGD $2,350,000 $2,620,000 $2,485,000
6 to 7 MGD $2,680,000 $3,000,000 $2,840,000
7 to 8 MGD $3,360,000 $3,720,000 $3,540,000
8 to 9 MGD $3,720,000 $4,130,000 $3,925,000
9 to 10 MGD $4,080,000 $4,530,000 $4,305,000*Add 20% markup to account for variability in small pump stations
100 feet TDH (ENR CCI 8815)
15 feet 20 feet 25 feet 30 feet 35 feet 40 feet 45 feet<1 MGD $522,000 $522,000 $522,000
1 to 2 MGD $896,000 $912,000 $904,000
2 to 3 MGD $1,250,000 $1,380,000 $1,315,000
3 to 4 MGD $1,740,000 $1,920,000 $1,830,000
4 to 5 MGD $2,080,000 $2,310,000 $2,195,000
5 to 6 MGD $2,680,000 $2,950,000 $2,815,000
6 to 7 MGD $3,040,000 $3,360,000 $3,200,000
7 to 8 MGD $3,760,000 $4,120,000 $3,940,000
8 to 9 MGD $4,150,000 $4,560,000 $4,355,000
9 to 10 MGD $4,540,000 $4,990,000 $4,765,000*Add 20% markup to account for variability in small pump stations
180 feet TDH (ENR CCI 8815)
15 feet 20 feet 25 feet 30 feet 35 feet 40 feet 45 feet<1 MGD $653,000 $653,000 $653,000
1 to 2 MGD $1,130,000 $1,140,000 $1,135,000
2 to 3 MGD $1,570,000 $1,710,000 $1,640,000
3 to 4 MGD $2,150,000 $2,330,000 $2,240,000
4 to 5 MGD $2,580,000 $2,810,000 $2,695,000
5 to 6 MGD $3,260,000 $3,530,000 $3,395,000
6 to 7 MGD $3,700,000 $4,020,000 $3,860,000
7 to 8 MGD $4,500,000 $4,860,000 $4,680,000
8 to 9 MGD $4,970,000 $5,380,000 $5,175,000
9 to 10 MGD $5,440,000 $5,890,000 $5,665,000*Add 20% markup to account for variability in small pump stations
$5,600,000$6,100,000
$5,592,992
$6,122,570
$5,058,010 $5,100,000
$850,000*$1,200,000$1,800,000$2,400,000
$4,171,778
$1,226,676
$2,900,000$3,700,000$4,200,000
$1,772,465
$846,892
$2,420,928
$2,912,679
$3,669,219
$4,706,760
$5,149,876
$3,000,000$3,500,000$4,300,000$4,700,000$5,100,000
$4,700,000
Adjusted PS Cost (ENR CCI 9527) Medium Head
Use these Medium Head Pump Station
Adjusted PS Cost (ENR CCI 9527) High Head
Use these High Head Pump
Station Values
$676,995
$977,017
$1,421,214
$1,977,812
$2,372,293
$3,042,372
$680,000*$980,000$1,400,000$2,000,000$2,400,000
$2,100,000$2,700,000$3,100,000$3,800,000$4,200,000
Use these Low Head Pump
Station Values$560,000*$810,000$1,200,000$1,700,000
Average PS Cost
Medium
Average PS Cost Low Head
Average PS Cost High Head
Adjusted PS Cost (ENR CCI 9527) Low Head$557,678
$805,175
$1,194,252
$1,707,619
$2,053,466
$2,685,717
$3,069,391
$3,825,931
$4,242,028
$4,652,721
$3,458,469
$4,258,239
PS Firm Capacity
Wet Well Depth
PS Firm Capacity
Wet Well Depth
PS Firm Capacity
Wet Well Depth
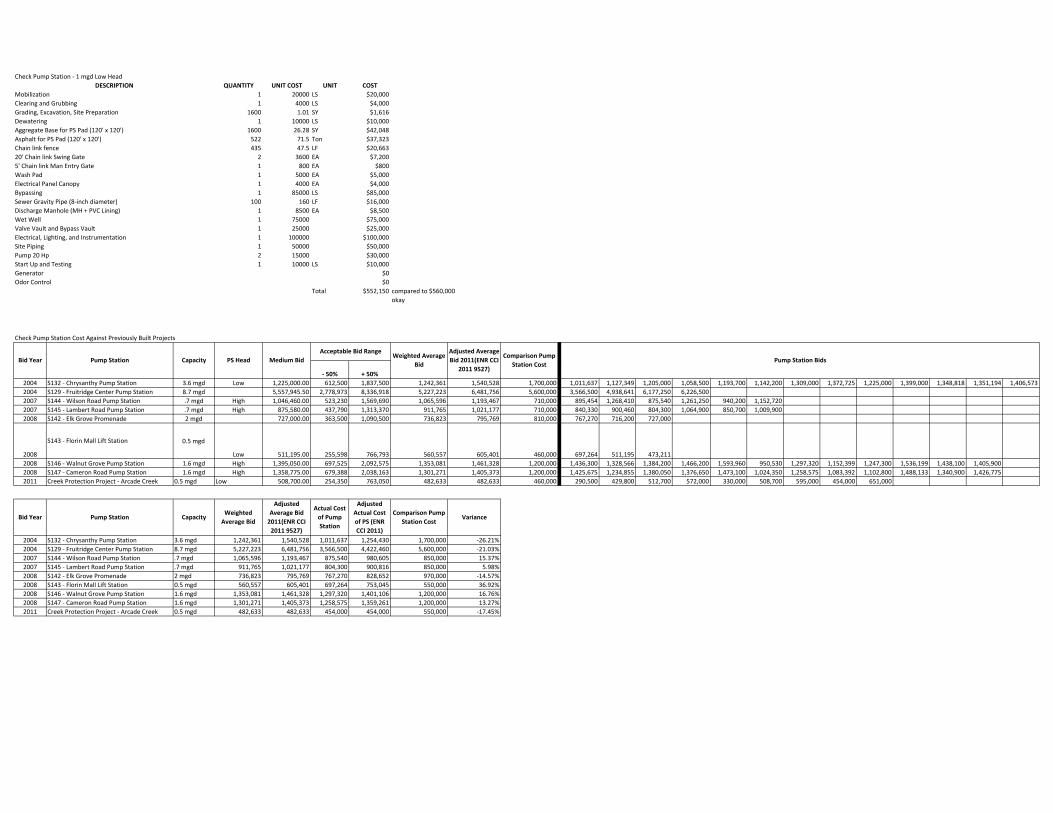
QUANTITY UNIT COST UNIT COST1 20000 LS $20,000
1 4000 LS $4,000
1600 1.01 SY $1,616
1 10000 LS $10,000
1600 26.28 SY $42,048
522 71.5 Ton $37,323
435 47.5 LF $20,663
2 3600 EA $7,200
1 800 EA $800
1 5000 EA $5,000
1 4000 EA $4,000
1 85000 LS $85,000
100 160 LF $16,000
1 8500 EA $8,500
1 75000 $75,000
1 25000 $25,000
1 100000 $100,000
1 50000 $50,000
2 15000 $30,000
1 10000 LS $10,000
$0
$0
Total $552,150 compared to $560,000
okay
Check Pump Station Cost Against Previously Built Projects
‐ 50% + 50%2004 3.6 mgd Low 1,225,000.00 612,500 1,837,500 1,242,361 1,540,528 1,700,000 1,011,637 1,127,349 1,205,000 1,058,500 1,193,700 1,142,200 1,309,000 1,372,725 1,225,000 1,399,000 1,348,818 1,351,194 1,406,573
2004 8.7 mgd 5,557,945.50 2,778,973 8,336,918 5,227,223 6,481,756 5,600,000 3,566,500 4,938,641 6,177,250 6,226,500
2007 .7 mgd High 1,046,460.00 523,230 1,569,690 1,065,596 1,193,467 710,000 895,454 1,268,410 875,540 1,261,250 940,200 1,152,720
2007 .7 mgd High 875,580.00 437,790 1,313,370 911,765 1,021,177 710,000 840,330 900,460 804,300 1,064,900 850,700 1,009,900
2008 2 mgd 727,000.00 363,500 1,090,500 736,823 795,769 810,000 767,270 716,200 727,000
2008
0.5 mgd
Low 511,195.00 255,598 766,793 560,557 605,401 460,000 697,264 511,195 473,211
2008 1.6 mgd High 1,395,050.00 697,525 2,092,575 1,353,081 1,461,328 1,200,000 1,436,300 1,328,566 1,384,200 1,466,200 1,593,960 950,530 1,297,320 1,152,399 1,247,300 1,536,199 1,438,100 1,405,900
2008 1.6 mgd High 1,358,775.00 679,388 2,038,163 1,301,271 1,405,373 1,200,000 1,425,675 1,234,855 1,380,050 1,376,650 1,473,100 1,024,350 1,258,575 1,083,392 1,102,800 1,488,133 1,340,900 1,426,775
2011 0.5 mgd Low 508,700.00 254,350 763,050 482,633 482,633 460,000 290,500 429,800 512,700 572,000 330,000 508,700 595,000 454,000 651,000
2004 3.6 mgd 1,242,361 1,540,528 1,011,637 1,254,430 1,700,000 ‐26.21%
2004 8.7 mgd 5,227,223 6,481,756 3,566,500 4,422,460 5,600,000 ‐21.03%
2007 .7 mgd 1,065,596 1,193,467 875,540 980,605 850,000 15.37%
2007 .7 mgd 911,765 1,021,177 804,300 900,816 850,000 5.98%
2008 2 mgd 736,823 795,769 767,270 828,652 970,000 ‐14.57%
2008 0.5 mgd 560,557 605,401 697,264 753,045 550,000 36.92%
2008 1.6 mgd 1,353,081 1,461,328 1,297,320 1,401,106 1,200,000 16.76%
2008 1.6 mgd 1,301,271 1,405,373 1,258,575 1,359,261 1,200,000 13.27%
2011 0.5 mgd 482,633 482,633 454,000 454,000 550,000 ‐17.45%
Pump Station Bids
Bid Year Pump Station Capacity
Creek Protection Project ‐ Arcade Creek
Weighted Average Bid
Adjusted Average Bid 2011(ENR CCI 2011 9527)
Actual Cost of Pump Station
Adjusted Actual Cost of PS (ENR CCI 2011)
S144 ‐ Wilson Road Pump Station
S145 ‐ Lambert Road Pump Station
S142 ‐ Elk Grove Promenade
S143 ‐ Florin Mall Lift Station
S146 ‐ Walnut Grove Pump Station
S147 ‐ Cameron Road Pump Station
Weighted Average Bid
Adjusted Average Bid 2011(ENR CCI
2011 9527)
Comparison Pump Station Cost
S132 ‐ Chrysanthy Pump Station
S129 ‐ Fruitridge Center Pump Station
Comparison Pump Station Cost
Variance
S146 ‐ Walnut Grove Pump Station
S147 ‐ Cameron Road Pump Station
Creek Protection Project ‐ Arcade Creek
Acceptable Bid Range
S132 ‐ Chrysanthy Pump Station
S129 ‐ Fruitridge Center Pump Station
S144 ‐ Wilson Road Pump Station
S145 ‐ Lambert Road Pump Station
S142 ‐ Elk Grove Promenade
S143 ‐ Florin Mall Lift Station
Bid Year Pump Station Capacity PS Head Medium Bid
Check Pump Station ‐ 1 mgd Low Head
Dewatering
Electrical Panel Canopy
Bypassing
Valve Vault and Bypass Vault
Wet Well
Discharge Manhole (MH + PVC Lining)
Sewer Gravity Pipe (8‐inch diameter)
DESCRIPTION
Clearing and Grubbing
Mobilization
Grading, Excavation, Site Preparation
Aggregate Base for PS Pad (120' x 120')
Asphalt for PS Pad (120' x 120')
Site Piping
Pump 20 Hp
Start Up and Testing
Generator
Odor Control
Electrical, Lighting, and Instrumentation
Chain link fence
20' Chain link Swing Gate
5' Chain link Man Entry Gate
Wash Pad
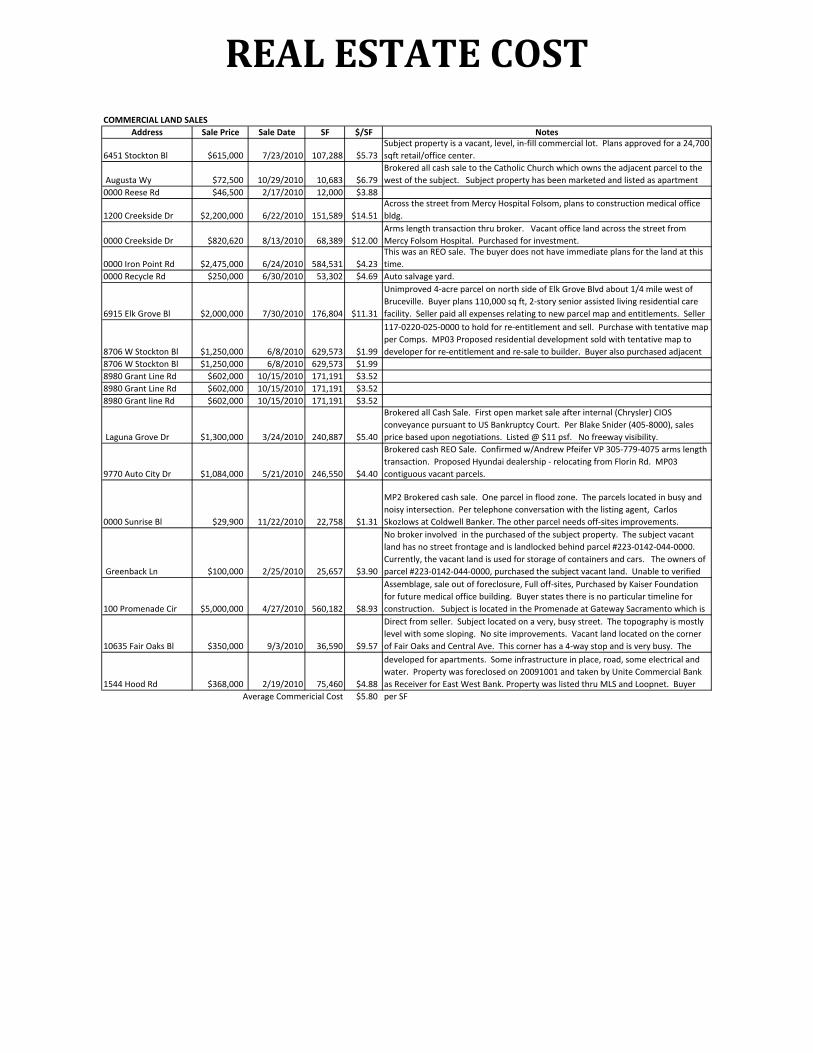
COMMERCIAL LAND SALESAddress Sale Price Sale Date SF $/SF
6451 Stockton Bl $615,000 7/23/2010 107,288 $5.73
Augusta Wy $72,500 10/29/2010 10,683 $6.79
0000 Reese Rd $46,500 2/17/2010 12,000 $3.88
1200 Creekside Dr $2,200,000 6/22/2010 151,589 $14.51
0000 Creekside Dr $820,620 8/13/2010 68,389 $12.00
0000 Iron Point Rd $2,475,000 6/24/2010 584,531 $4.23
0000 Recycle Rd $250,000 6/30/2010 53,302 $4.69
6915 Elk Grove Bl $2,000,000 7/30/2010 176,804 $11.31
8706 W Stockton Bl $1,250,000 6/8/2010 629,573 $1.99
8706 W Stockton Bl $1,250,000 6/8/2010 629,573 $1.99
8980 Grant Line Rd $602,000 10/15/2010 171,191 $3.52
8980 Grant Line Rd $602,000 10/15/2010 171,191 $3.52
8980 Grant line Rd $602,000 10/15/2010 171,191 $3.52
Laguna Grove Dr $1,300,000 3/24/2010 240,887 $5.40
9770 Auto City Dr $1,084,000 5/21/2010 246,550 $4.40
0000 Sunrise Bl $29,900 11/22/2010 22,758 $1.31
Greenback Ln $100,000 2/25/2010 25,657 $3.90
100 Promenade Cir $5,000,000 4/27/2010 560,182 $8.93
10635 Fair Oaks Bl $350,000 9/3/2010 36,590 $9.57
1544 Hood Rd $368,000 2/19/2010 75,460 $4.88
$5.80 per SFAverage Commericial Cost
NotesSubject property is a vacant, level, in‐fill commercial lot. Plans approved for a 24,700
sqft retail/office center.
Brokered all cash sale to the Catholic Church which owns the adjacent parcel to the
west of the subject. Subject property has been marketed and listed as apartment
Across the street from Mercy Hospital Folsom, plans to construction medical office
bldg.
Arms length transaction thru broker. Vacant office land across the street from
Mercy Folsom Hospital. Purchased for investment.This was an REO sale. The buyer does not have immediate plans for the land at this
time.
Auto salvage yard.
Unimproved 4‐acre parcel on north side of Elk Grove Blvd about 1/4 mile west of
Bruceville. Buyer plans 110,000 sq ft, 2‐story senior assisted living residential care
facility. Seller paid all expenses relating to new parcel map and entitlements. Seller
117‐0220‐025‐0000 to hold for re‐entitlement and sell. Purchase with tentative map
per Comps. MP03 Proposed residential development sold with tentative map to
developer for re‐entitlement and re‐sale to builder. Buyer also purchased adjacent
Assemblage, sale out of foreclosure, Full off‐sites, Purchased by Kaiser Foundation
for future medical office building. Buyer states there is no particular timeline for
construction. Subject is located in the Promenade at Gateway Sacramento which is
Direct from seller. Subject located on a very, busy street. The topography is mostly
level with some sloping. No site improvements. Vacant land located on the corner
of Fair Oaks and Central Ave. This corner has a 4‐way stop and is very busy. The
developed for apartments. Some infrastructure in place, road, some electrical and
water. Property was foreclosed on 20091001 and taken by Unite Commercial Bank
as Receiver for East West Bank. Property was listed thru MLS and Loopnet. Buyer
Brokered all Cash Sale. First open market sale after internal (Chrysler) CIOS
conveyance pursuant to US Bankruptcy Court. Per Blake Snider (405‐8000), sales
price based upon negotiations. Listed @ $11 psf. No freeway visibility.
Brokered cash REO Sale. Confirmed w/Andrew Pfeifer VP 305‐779‐4075 arms length
transaction. Proposed Hyundai dealership ‐ relocating from Florin Rd. MP03
contiguous vacant parcels.
MP2 Brokered cash sale. One parcel in flood zone. The parcels located in busy and
noisy intersection. Per telephone conversation with the listing agent, Carlos
Skozlows at Coldwell Banker. The other parcel needs off‐sites improvements.
No broker involved in the purchased of the subject property. The subject vacant
land has no street frontage and is landlocked behind parcel #223‐0142‐044‐0000.
Currently, the vacant land is used for storage of containers and cars. The owners of
parcel #223‐0142‐044‐0000, purchased the subject vacant land. Unable to verified
REAL ESTATE COST
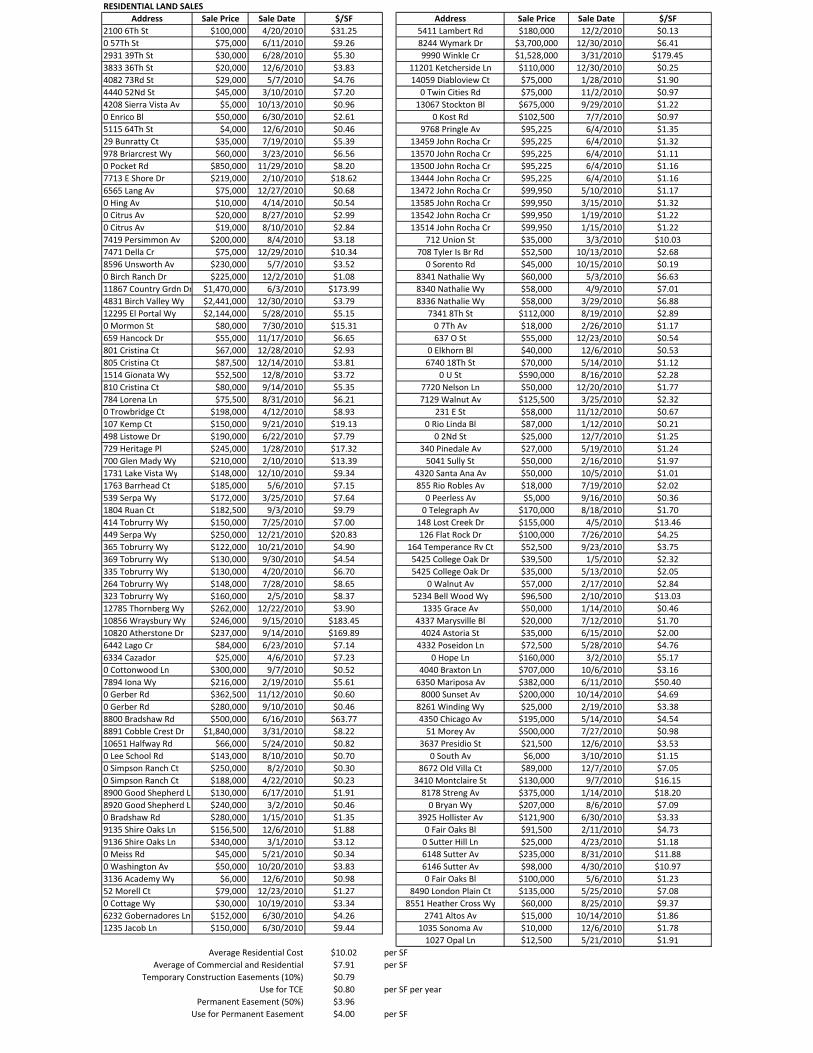
RESIDENTIAL LAND SALESAddress Sale Price Sale Date Sale Date
2100 6Th St $100,000 4/20/2010 12/2/2010
0 57Th St $75,000 6/11/2010 12/30/2010
2931 39Th St $30,000 6/28/2010 3/31/2010
3833 36Th St $20,000 12/6/2010 12/30/2010
4082 73Rd St $29,000 5/7/2010 1/28/2010
4440 52Nd St $45,000 3/10/2010 11/2/2010
4208 Sierra Vista Av $5,000 10/13/2010 9/29/2010
0 Enrico Bl $50,000 6/30/2010 7/7/2010
5115 64Th St $4,000 12/6/2010 6/4/2010
29 Bunratty Ct $35,000 7/19/2010 6/4/2010
978 Briarcrest Wy $60,000 3/23/2010 6/4/2010
0 Pocket Rd $850,000 11/29/2010 6/4/2010
7713 E Shore Dr $219,000 2/10/2010 6/4/2010
6565 Lang Av $75,000 12/27/2010 5/10/2010
0 Hing Av $10,000 4/14/2010 3/15/2010
0 Citrus Av $20,000 8/27/2010 1/19/2010
0 Citrus Av $19,000 8/10/2010 1/15/2010
7419 Persimmon Av $200,000 8/4/2010 3/3/2010
7471 Della Cr $75,000 12/29/2010 10/13/2010
8596 Unsworth Av $230,000 5/7/2010 10/15/2010
0 Birch Ranch Dr $225,000 12/2/2010 5/3/2010
11867 Country Grdn Dr $1,470,000 6/3/2010 4/9/2010
4831 Birch Valley Wy $2,441,000 12/30/2010 3/29/2010
12295 El Portal Wy $2,144,000 5/28/2010 8/19/2010
0 Mormon St $80,000 7/30/2010 2/26/2010
659 Hancock Dr $55,000 11/17/2010 12/23/2010
801 Cristina Ct $67,000 12/28/2010 12/6/2010
805 Cristina Ct $87,500 12/14/2010 5/14/2010
1514 Gionata Wy $52,500 12/8/2010 8/16/2010
810 Cristina Ct $80,000 9/14/2010 12/20/2010
784 Lorena Ln $75,500 8/31/2010 3/25/2010
0 Trowbridge Ct $198,000 4/12/2010 11/12/2010
107 Kemp Ct $150,000 9/21/2010 1/12/2010
498 Listowe Dr $190,000 6/22/2010 12/7/2010
729 Heritage Pl $245,000 1/28/2010 5/19/2010
700 Glen Mady Wy $210,000 2/10/2010 2/16/2010
1731 Lake Vista Wy $148,000 12/10/2010 10/5/2010
1763 Barrhead Ct $185,000 5/6/2010 7/19/2010
539 Serpa Wy $172,000 3/25/2010 9/16/2010
1804 Ruan Ct $182,500 9/3/2010 8/18/2010
414 Tobrurry Wy $150,000 7/25/2010 4/5/2010
449 Serpa Wy $250,000 12/21/2010 7/26/2010
365 Tobrurry Wy $122,000 10/21/2010 9/23/2010
369 Tobrurry Wy $130,000 9/30/2010 1/5/2010
335 Tobrurry Wy $130,000 4/20/2010 5/13/2010
264 Tobrurry Wy $148,000 7/28/2010 2/17/2010
323 Tobrurry Wy $160,000 2/5/2010 2/10/2010
12785 Thornberg Wy $262,000 12/22/2010 1/14/2010
10856 Wraysbury Wy $246,000 9/15/2010 7/12/2010
10820 Atherstone Dr $237,000 9/14/2010 6/15/2010
6442 Lago Cr $84,000 6/23/2010 5/28/2010
6334 Cazador $25,000 4/6/2010 3/2/2010
0 Cottonwood Ln $300,000 9/7/2010 10/6/2010
7894 Iona Wy $216,000 2/19/2010 6/11/2010
0 Gerber Rd $362,500 11/12/2010 10/14/2010
0 Gerber Rd $280,000 9/10/2010 2/19/2010
8800 Bradshaw Rd $500,000 6/16/2010 5/14/2010
8891 Cobble Crest Dr $1,840,000 3/31/2010 7/27/2010
10651 Halfway Rd $66,000 5/24/2010 12/6/2010
0 Lee School Rd $143,000 8/10/2010 3/10/2010
0 Simpson Ranch Ct $250,000 8/2/2010 12/7/2010
0 Simpson Ranch Ct $188,000 4/22/2010 9/7/2010
8900 Good Shepherd Ln $130,000 6/17/2010 1/14/2010
8920 Good Shepherd Ln $240,000 3/2/2010 8/6/2010
0 Bradshaw Rd $280,000 1/15/2010 6/30/2010
9135 Shire Oaks Ln $156,500 12/6/2010 2/11/2010
9136 Shire Oaks Ln $340,000 3/1/2010 4/23/2010
0 Meiss Rd $45,000 5/21/2010 8/31/2010
0 Washington Av $50,000 10/20/2010 4/30/2010
3136 Academy Wy $6,000 12/6/2010 5/6/2010
52 Morell Ct $79,000 12/23/2010 5/25/2010
0 Cottage Wy $30,000 10/19/2010 8/25/2010
6232 Gobernadores Ln $152,000 6/30/2010 10/14/2010
1235 Jacob Ln $150,000 6/30/2010 12/6/2010
5/21/2010
per SF
per SF
per SF per year
per SF
$4.76
$7.20
$0.96
$2.61
$0.46
$5.39
$/SF$31.25
$9.26
$5.30
$3.83
$2.84
$3.18
$10.34
$3.52
$1.08
$173.99
$6.56
$8.20
$18.62
$0.68
$0.54
$2.99
$3.72
$5.35
$6.21
$8.93
$19.13
$7.79
$3.79
$5.15
$15.31
$6.65
$2.93
$3.81
$4.54
$6.70
$8.65
$17.32
$13.39
$9.34
$7.15
$7.64
$9.79
$1.88
$3.12
$0.34
$3.83
$0.82
$0.70
$0.30
$0.23
$1.91
$0.46
$102,500
$95,225
$95,225
$95,225
$110,000
$75,000
$75,000
$675,000
$1.35
$0.52
$5.61
$0.60
$0.46
$63.77
$8.22
$8.37
$3.90
$183.45
$169.89
$7.14
$7.23
$7.00
$20.83
$4.90
$25,000
$27,000
$50,000
$125,500
$45,000
$60,000
$58,000
$58,000
$35,000
$52,500
$9.44
$10.02
Average of Commercial and Residential $7.91
$0.98
$1.27
$3.34
$4.26
$100,000
$135,000
$60,000
$15,000
$235,000
$98,000
$91,500
$25,000
$25,000
$195,000
Permanent Easement (50%) $3.96
Use for Permanent Easement $4.00
Temporary Construction Easements (10%)
Use for TCE
$0.79
$0.80
$500,000
$21,500
$382,000
$200,000
$39,500
$35,000
$57,000
$96,500
$100,000
$52,500
$180,000
$3,700,000
$1,528,000
$/SFAddress Sale Price
11201 Ketcherside Ln
14059 Diabloview Ct
$6,000
$89,000
$130,000
$375,000
$50,000
$20,000
$35,000
$72,500
$160,000
$707,000
$50,000
$50,000
$18,000
$5,000
$170,000
$155,000
$112,000
$18,000
$55,000
0 Twin Cities Rd
13067 Stockton Bl
0 Kost Rd
9768 Pringle Av
13459 John Rocha Cr
13570 John Rocha Cr
$10,000
$12,500
5411 Lambert Rd
8244 Wymark Dr
9990 Winkle Cr
$207,000
$121,900
$40,000
$70,000
$590,000
$95,225
$95,225
$99,950
$99,950
$99,950
$99,950
$58,000
$87,000
712 Union St
708 Tyler Is Br Rd
0 Sorento Rd
8341 Nathalie Wy
8340 Nathalie Wy
8336 Nathalie Wy
13500 John Rocha Cr
13444 John Rocha Cr
13472 John Rocha Cr
13585 John Rocha Cr
13542 John Rocha Cr
13514 John Rocha Cr
7720 Nelson Ln
7129 Walnut Av
231 E St
0 Rio Linda Bl
0 2Nd St
340 Pinedale Av
7341 8Th St
0 7Th Av
637 O St
0 Elkhorn Bl
6740 18Th St
0 U St
126 Flat Rock Dr
164 Temperance Rv Ct
5425 College Oak Dr
5425 College Oak Dr
0 Walnut Av
5234 Bell Wood Wy
5041 Sully St
4320 Santa Ana Av
855 Rio Robles Av
0 Peerless Av
0 Telegraph Av
148 Lost Creek Dr
8261 Winding Wy
4350 Chicago Av
51 Morey Av
3637 Presidio St
1335 Grace Av
4337 Marysville Bl
4024 Astoria St
4332 Poseidon Ln
0 Hope Ln
4040 Braxton Ln
8551 Heather Cross Wy
2741 Altos Av
1035 Sonoma Av
1027 Opal Ln
$0.13
$6.41
$179.45
$0.25
$1.90
$0.97
0 Fair Oaks Bl
0 Sutter Hill Ln
6148 Sutter Av
6146 Sutter Av
0 Fair Oaks Bl
8490 London Plain Ct
0 South Av
8672 Old Villa Ct
3410 Montclaire St
8178 Streng Av
0 Bryan Wy
3925 Hollister Av
6350 Mariposa Av
8000 Sunset Av
$1.16
$1.17
$1.32
$1.22
$1.22
$10.03
$1.22
$0.97
$1.35
$1.32
$1.11
$1.16
$1.17
$0.54
$0.53
$1.12
$2.28
$1.77
$2.68
$0.19
$6.63
$7.01
$6.88
$2.89
$1.01
$2.02
$0.36
$1.70
$13.46
$4.25
$2.32
$0.67
$0.21
$1.25
$1.24
$1.97
$2.00
$4.76
$5.17
$3.16
$50.40
$3.75
$2.32
$2.05
$2.84
$13.03
$0.46
$1.86
$1.78
$1.91
Average Residential Cost
$1.18
$11.88
$10.97
$1.23
$7.08
$9.37
$7.05
$16.15
$18.20
$7.09
$3.33
$4.73
$4.69
$3.38
$4.54
$0.98
$3.53
$1.15
$1.70