Embed Size (px)
Citation preview
County of SutterState of California
ComprehensiveAnnualFinancialReport
Fiscal Year Ended June 30, 2020
Nathan M. Black, CPAAuditor-Controller

A picture of wild pea plants on the bank of a canal in Sutter County. There are 22 canals in Sutter County used to support the many crops and orchards of the county.
The front cover features a view of the Sutter Buttes on a mostly clear day. This mountain range is known as “The Smallest Mountain Range in the World.” Sutter County is located in the heart of the Sacramento Valley, with 88 percent of its 600-square miles being prime farm and grazing land.
The photographs were taken and shared by Blake M. Westmoreland, a citizen of Sutter County.
County of SutterState of California
Comprehensive AnnualFinancial Report
For the Fiscal Year Ended June 30, 2020
Nathan M. Black, CPAAuditor-Controller
County of Sutter | Comprehensive Annual Financial Report Fiscal Year Ended June 30, 2020
i
Table of ContentsIntroductory SectionLetter of Transmittal ....................................................................................................................................................................................1
Financial SectionIndependent Auditor’s Report .................................................................................................................................................................7Management’s Discussion and Analysis (Unaudited) .......................................................................................... 10
Basic Financial Statements: Government-wide Financial Statements:
Statement of Net Position ............................................................................................................................... 26Statement of Activities .....................................................................................................................................28
Fund Financial Statements: Governmental Funds: Balance Sheet ..................................................................................................................................................30 Reconciliation of the Governmental Funds Balance Sheet to the Government-wide Statement of Net Position – Governmental Activities.................................................32 Statement of Revenues, Expenditures, and Changes in Fund Balances ......................................................34 Reconciliation of the Statement of Revenues, Expenditures, and
Changes in Fund Balances of Governmental Funds to the Government-wide Statement of Activities – Governmental Activities ..........................................................................36
Proprietary Funds: Statement of Net Position...............................................................................................................................37 Statement of Revenues, Expenses, and Changes in Net Position ................................................................38 Statement of Cash Flows ................................................................................................................................39
Fiduciary Funds: Statement of Fiduciary Net Position..............................................................................................................41 Statement of Changes in Fiduciary Net Position ..........................................................................................42
Notes to Basic Financial Statements....................................................................................................................46
Required Supplementary Information: Schedule of Changes in Net Pension Liability and Related Ratios – Misc. Plan ................................................99 Schedule of Pension Plan Contributions – Miscellaneous Plan .........................................................................99 Schedule of the Net Pension Liability and Related Ratios – Safety Plan ........................................................101 Schedule of Pension Plan Contributions – Safety Plan.....................................................................................101 Schedule of Changes in Total OPEB Liability and Related Ratios....................................................................103 Governmental Funds – General and Major Special Revenue: Schedule of Revenues, Expenditures, and Changes in Fund Balances – Budget and Actual: General Fund ....................................................................................................................................................108 Bi-County Behavioral Health...........................................................................................................................109 Welfare..............................................................................................................................................................110 Public Safety/Trial Courts ...............................................................................................................................111 Mental Health Services Act ..............................................................................................................................112
County of Sutter | Comprehensive Annual Financial Report Fiscal Year Ended June 30, 2020
ii
Public Safety Realignment ...............................................................................................................................113 Note to Required Supplementary Information.................................................................................................107
Other Supplementary Information: Combining and Individual Fund Statements and Schedules: Non-major Governmental Funds Narrative Summary .................................................................................................................................. 114
Combining Balance Sheet ......................................................................................................................... 116 Combining Statement of Revenues, Expenses and Changes in Net Position ........................................ 121 Schedule of Revenues, Expenditures, and Changes in Fund Balances – Budget and Actual ................ 126
Internal Service Funds Combining Balance Sheet ......................................................................................................................... 140 Combining Statement of Revenues, Expenses and Changes in Net Position ........................................ 142 Combining Statement of Cash Flows ....................................................................................................... 144
Statistical Section Narrative Summary ..............................................................................................................................................150 Financial Trends: Net Position by Category .................................................................................................................................151 Changes in Net Position ...................................................................................................................................152 Fund Balances, Governmental Funds .............................................................................................................153 Changes in Fund Balances, Governmental Funds ..........................................................................................154 Revenue Capacity: Assessed Value of Taxable Property and Actual Value of Property .............................................................155 Property Tax Rates – Direct and Overlapping Governments ........................................................................156 Principal Property Taxpayers .........................................................................................................................157 Property Tax Levies and Collections ..............................................................................................................158
Debt Capacity: Ratios or Outstanding Debt by Type...............................................................................................................159 Computation of Legal Debt Margin .................................................................................................................160 Direct and Overlapping Bonded Debt.............................................................................................................161
Economic and Demographic Information: Demographics and Economic Statistics..........................................................................................................162 Principal Employers.........................................................................................................................................163
Operating Information: County Employees by Function/Program .....................................................................................................164 Operating Indicators by Function/Program .................................................................................................165 Capital Assets and Infrastructure Statistics by Function/Program.............................................................166
Glossary: Glossary ................................................................................................................................................................170


Introductory Section
Introductory Section

1Letter of Transmittal
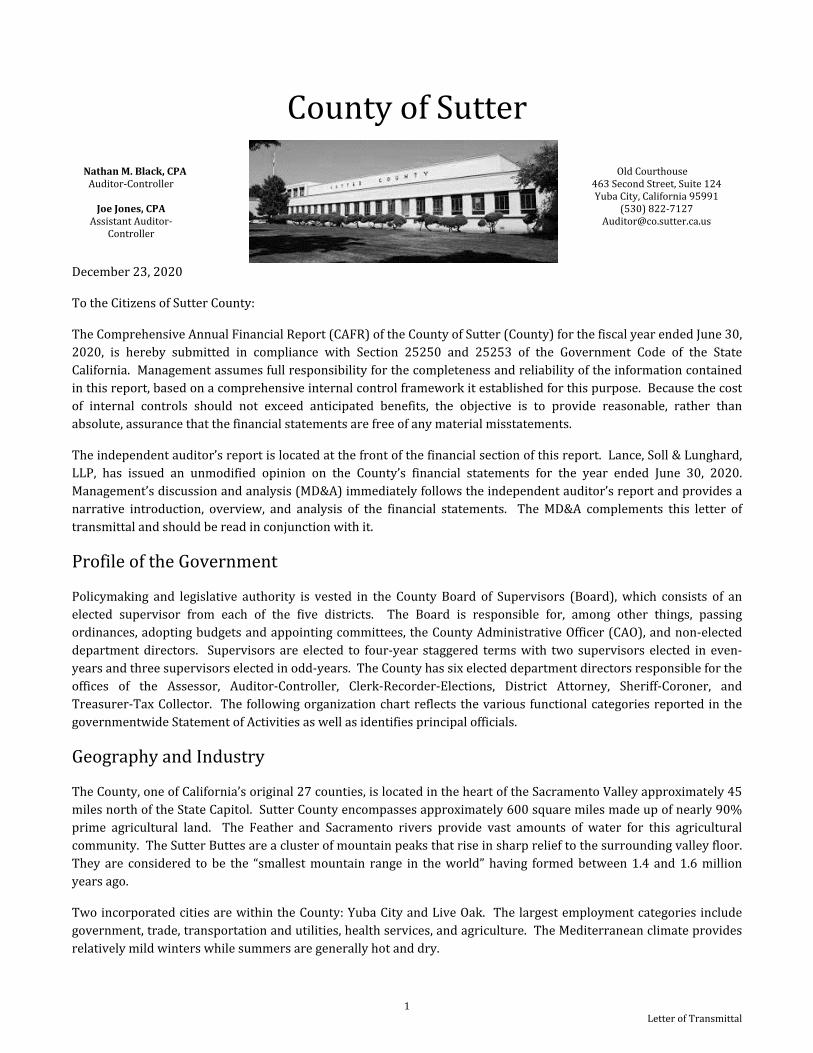
County of Sutter Nathan M. Black, CPA
Auditor-Controller
Joe Jones, CPAAssistant Auditor-
Controller
Old Courthouse
463 Second Street, Suite 124Yuba City, California 95991
(530) [email protected]
December 23, 2020
To the Citizens of Sutter County:
The Comprehensive Annual Financial Report (CAFR) of the County of Sutter (County) for the fiscal year ended June 30, 2020, is hereby submitted in compliance with Section 25250 and 25253 of the Government Code of the State California. Management assumes full responsibility for the completeness and reliability of the information contained in this report, based on a comprehensive internal control framework it established for this purpose. Because the cost of internal controls should not exceed anticipated benefits, the objective is to provide reasonable, rather than absolute, assurance that the financial statements are free of any material misstatements.
The independent auditor’s report is located at the front of the financial section of this report. Lance, Soll & Lunghard, LLP, has issued an unmodified opinion on the County’s financial statements for the year ended June 30, 2020. Management’s discussion and analysis (MD&A) immediately follows the independent auditor’s report and provides a narrative introduction, overview, and analysis of the financial statements. The MD&A complements this letter of transmittal and should be read in conjunction with it.
Profile of the Government
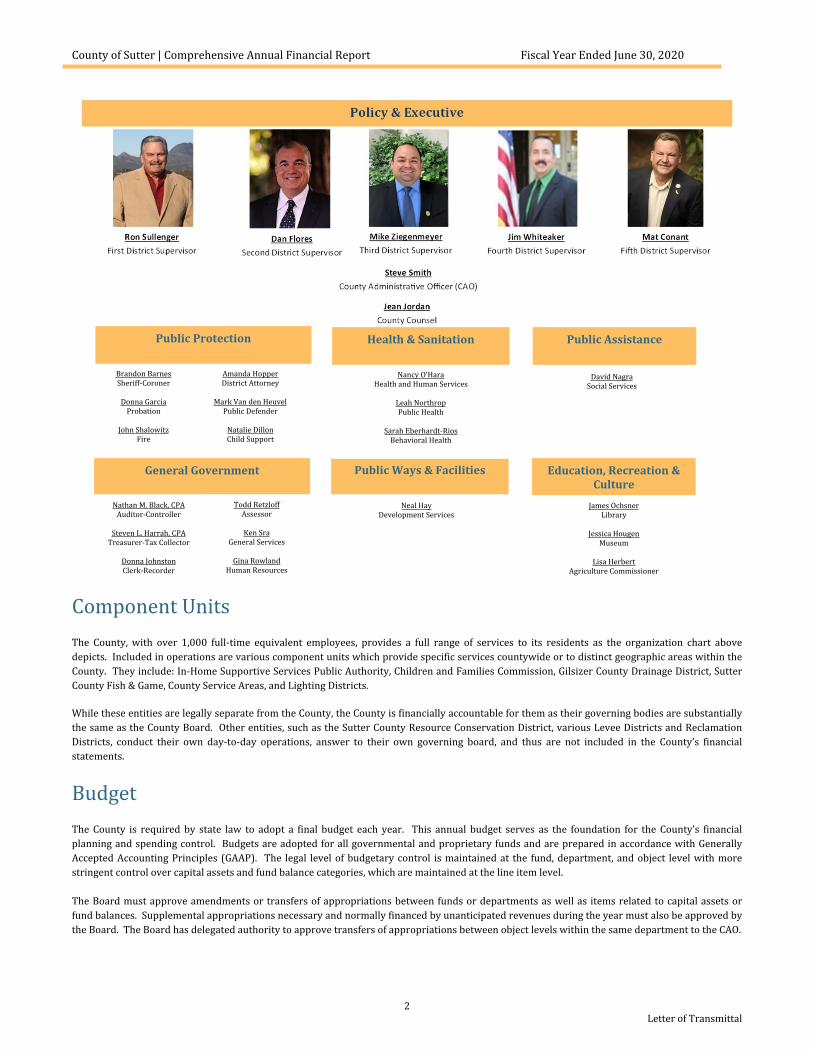
Policymaking and legislative authority is vested in the County Board of Supervisors (Board), which consists of an elected supervisor from each of the five districts. The Board is responsible for, among other things, passing ordinances, adopting budgets and appointing committees, the County Administrative Officer (CAO), and non-elected department directors. Supervisors are elected to four-year staggered terms with two supervisors elected in even-years and three supervisors elected in odd-years. The County has six elected department directors responsible for the offices of the Assessor, Auditor-Controller, Clerk-Recorder-Elections, District Attorney, Sheriff-Coroner, and Treasurer-Tax Collector. The following organization chart reflects the various functional categories reported in the governmentwide Statement of Activities as well as identifies principal officials.
Geography and Industry
The County, one of California’s original 27 counties, is located in the heart of the Sacramento Valley approximately 45 miles north of the State Capitol. Sutter County encompasses approximately 600 square miles made up of nearly 90% prime agricultural land. The Feather and Sacramento rivers provide vast amounts of water for this agricultural community. The Sutter Buttes are a cluster of mountain peaks that rise in sharp relief to the surrounding valley floor. They are considered to be the “smallest mountain range in the world” having formed between 1.4 and 1.6 million years ago.
Two incorporated cities are within the County: Yuba City and Live Oak. The largest employment categories include government, trade, transportation and utilities, health services, and agriculture. The Mediterranean climate provides relatively mild winters while summers are generally hot and dry.
County of Sutter | Comprehensive Annual Financial Report Fiscal Year Ended June 30, 2020
2Letter of Transmittal
Component UnitsThe County, with over 1,000 full-time equivalent employees, provides a full range of services to its residents as the organization chart above depicts. Included in operations are various component units which provide specific services countywide or to distinct geographic areas within the County. They include: In-Home Supportive Services Public Authority, Children and Families Commission, Gilsizer County Drainage District, Sutter County Fish & Game, County Service Areas, and Lighting Districts.
While these entities are legally separate from the County, the County is financially accountable for them as their governing bodies are substantially the same as the County Board. Other entities, such as the Sutter County Resource Conservation District, various Levee Districts and Reclamation Districts, conduct their own day-to-day operations, answer to their own governing board, and thus are not included in the County’s financial statements.
BudgetThe County is required by state law to adopt a final budget each year. This annual budget serves as the foundation for the County’s financial planning and spending control. Budgets are adopted for all governmental and proprietary funds and are prepared in accordance with Generally Accepted Accounting Principles (GAAP). The legal level of budgetary control is maintained at the fund, department, and object level with more stringent control over capital assets and fund balance categories, which are maintained at the line item level.
The Board must approve amendments or transfers of appropriations between funds or departments as well as items related to capital assets or fund balances. Supplemental appropriations necessary and normally financed by unanticipated revenues during the year must also be approved by the Board. The Board has delegated authority to approve transfers of appropriations between object levels within the same department to the CAO.
Education, Recreation & Culture
James OchsnerLibrary
Jessica HougenMuseum
Lisa HerbertAgriculture Commissioner
General Government
Nathan M. Black, CPAAuditor-Controller
Steven L. Harrah, CPATreasurer-Tax Collector
Donna JohnstonClerk-Recorder
Todd RetzloffAssessor
Ken SraGeneral Services
Gina RowlandHuman Resources
Public Ways & Facilities
Neal HayDevelopment Services
Public Protection
Brandon BarnesSheriff-Coroner
Donna GarciaProbation
John ShalowitzFire
Amanda HopperDistrict Attorney
Mark Van den HeuvelPublic Defender
Natalie DillonChild Support
Health & Sanitation
Nancy O’HaraHealth and Human Services
Leah NorthropPublic Health
Sarah Eberhardt-RiosBehavioral Health
Public Assistance
David NagraSocial Services
County of Sutter | Comprehensive Annual Financial Report Fiscal Year Ended June 30, 2020
3Letter of Transmittal
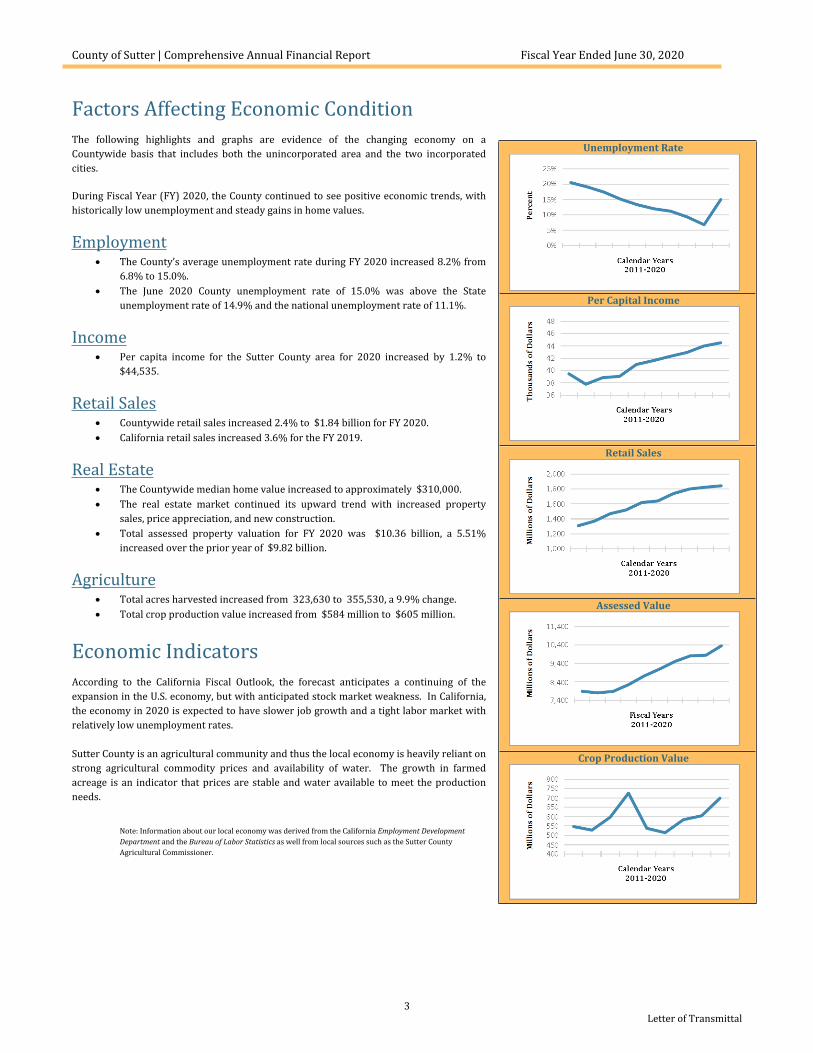
Factors Affecting Economic ConditionThe following highlights and graphs are evidence of the changing economy on a Countywide basis that includes both the unincorporated area and the two incorporated cities.
During Fiscal Year (FY) 2020, the County continued to see positive economic trends, with historically low unemployment and steady gains in home values.
Employment The County’s average unemployment rate during FY 2020 increased 8.2% from
6.8% to 15.0%. The June 2020 County unemployment rate of 15.0% was above the State
unemployment rate of 14.9% and the national unemployment rate of 11.1%.
Income Per capita income for the Sutter County area for 2020 increased by 1.2% to
$44,535.
Retail Sales Countywide retail sales increased 2.4% to $1.84 billion for FY 2020. California retail sales increased 3.6% for the FY 2019.
Real Estate The Countywide median home value increased to approximately $310,000. The real estate market continued its upward trend with increased property
sales, price appreciation, and new construction. Total assessed property valuation for FY 2020 was $10.36 billion, a 5.51%
increased over the prior year of $9.82 billion.
Agriculture Total acres harvested increased from 323,630 to 355,530, a 9.9% change. Total crop production value increased from $584 million to $605 million.
Economic IndicatorsAccording to the California Fiscal Outlook, the forecast anticipates a continuing of the expansion in the U.S. economy, but with anticipated stock market weakness. In California, the economy in 2020 is expected to have slower job growth and a tight labor market with relatively low unemployment rates.
Sutter County is an agricultural community and thus the local economy is heavily reliant on strong agricultural commodity prices and availability of water. The growth in farmed acreage is an indicator that prices are stable and water available to meet the production needs.
Note: Information about our local economy was derived from the California Employment Development Department and the Bureau of Labor Statistics as well from local sources such as the Sutter County Agricultural Commissioner.
Unemployment Rate
Per Capital Income
Retail Sales
Assessed Value
Crop Production Value
County of Sutter | Comprehensive Annual Financial Report Fiscal Year Ended June 30, 2020
4Letter of Transmittal
Major InitiativesLong-term Financial Planning – Development of a Ten-Year Financial Strategic Plan
Although staff is submitting a “balanced” Recommended Budget for FY 2020-21, the General Fund continues to experience “structural” challenges. Ideally, recurring revenues should be sufficient to cover recurring expenditures. This is not the case for the General Fund. Instead, the General Fund relies on expenditure “savings” from the prior year to serve as a de-facto revenue (or “source of funds”) to balance the budget for the subsequent year. This is not a “Best Management Practice.”
The County must continually navigate the complex system of federal and state funding and be ever vigilant for funding reductions that will have an impact on local services, in particular those provided to the County’s most vulnerable citizens. The country has sustained 10 years of economic expansion, and it is feasible that the nation could face a recession within the next few years. Historically, the State has transferred greater financial responsibility onto counties as well as diverting funds from local government in order to close budget gaps. Under Governor Brown, the state was able to build a significant “rainy day fund,” which would help to sustain services in an economic downturn. With the advent of COVID-19 and the associated revenue loss across the state the state’s reserves have all but disappeared. Thus, the County must look for ways to become financially nimble to address a loss of federal, state and local revenues.
As part of the Board’s Top Priority #4, staff continues work to forecast revenues and expenditures over an extended period in order to promote the flexibility to strategically manage resources. A financial strategic plan is being completed and will come to the Board of Supervisors for review and adoption in the fall of 2020. -
County Facilities Master Plan
The County owns and/or leases over 30 facilities in different locations throughout the county. Over many years, the County has become a major property owner yet does not have sufficient staff and financial resources to maintain the buildings. This has translated into many facilities suffering from years, and in some cases decades, of deferred maintenance. Several County facilities are severely run-down and the cost to restore and/or repair them is more than abandoning these buildings and purchasing existing buildings elsewhere, along with purchasing raw land and building new facilities.
Recognizing the severity of this situation, in May 2017, the Board of Supervisors approved hiring an outside consultant (Kosmont and Associates) to conduct a review of all County facilities. A report was submitted to the County in October 2017. To build upon the results of the Kosmont report, in December 2018, the Board authorized a new agreement with an architectural firm (Nichols, Melburg & Rossetto, AIA & Associates) to develop the County’s Facilities Master Plan. The architects’ scope of work includes space surveys and departmental interviews to discuss the space needs of each County department. Completion of their report is anticipated in Fall 2019, and it will serve as the basis of an AB 1600 Study, so the County can update its Development Impact Fees. The increased fees will allow the County to begin collecting revenue to fund necessary future expansion needs.
In concept, the County’s plan includes locating all the general administrative and support functions into a main “Government Campus” surrounding the main offices housed at 1130 and 1160 Civic Center Boulevard in Yuba City. In Spring 2019, the County purchased an office building at 1190 Civic Center Boulevard, furthering the Campus plan. This building will house the Assessor’s Office within the budget year, freeing space for the Auditor-Controller and Treasurer-Tax Collector to move into 1160 Civic Center Boulevard in FY 2020-21.
A “Public Safety Campus” is recommended around the new State Courthouse located at 1175 Civic Center Boulevard and would include the Sheriff’s Office, expanded Jail, District Attorney’s Office, Probation, etc. A Health & Human Services Campus was recommended at 850 Gray Avenue in Yuba City. Other cluster campuses were recommended for the remaining County uses. Staff is working on a more formal Countywide Facilities Master Plan to be submitted to the Board of Supervisors at a later date.
In FY 2017-18, the County secured a long-term lease for 850 Gray Avenue to house approximately 250 Health and Human Service employees, or about 25% of the County’s workforce. Design of the improvements necessary to house staff and provide services to clients has begun, and County staff is working with an outside financial consultant to obtain financing for construction. The $19 million Jail Expansion Project was completed during FY 2019-20.
Homelessness
The rise in the local homeless population (especially within the Feather River river-bottoms and throughout Downtown Yuba City) continues to present challenges for the local community and economy. As revealed in a recent Yuba City citywide survey, homelessness was, by far, ranked as the community’s most serious concern. In response, the County continues to work closely with other local governments and service providers, including the following two bi-county working groups: 1) Bi-County Homeless Consortium; and, 2) Bi-County Homeless Services Program.
County of Sutter | Comprehensive Annual Financial Report Fiscal Year Ended June 30, 2020
5Letter of Transmittal
In November 2017, the Board of Supervisors adopted a formal Sutter County Long-Term Homeless Management Plan. As a part of implementing this plan, the County has moved forward with building a shelter complex at its Behavioral Health campus located at 1965 Live Oak Boulevard. Construction on the site was completed in September 2019. This plan was developed in partnership with other regional governments as well as community-based organizations to improve services and shelter operations. As always, the goal remains to address homeless individuals’ barriers to stable living and get them into permanent housing.
Sutter Pointe Specific Plan Implementation
In Spring 2019, developers submitted a proposed first project phase comprising 873± acres located in the eastern portion of the plan area north of Riego Road and south of Sankey Road. This first phase proposes to establish 3,402 single-family and 399 multifamily homes, along with 46.1 acres of employment centers, 25 acres of commercial centers, 61.3 acres of parkland, 54.9 acres of open space along with a K-8 school. The County is reviewing this project for consistency with the adopted Specific Plan and working with developers to establish the necessary public infrastructure and services needed to serve this mixed-use community and to ensure compliance with developer agreements, Sutter County’s Federal Incidental Take Permit, and other environmental requirements.
Staff anticipates bringing this project forward for consideration in the second half of 2020 and it is believed that construction of new homes and businesses in this area could commence by the end of 2023 or early in 2024. As directed by the Board of Supervisors, this development is designed to be self-sustaining and to not have any net new costs to taxpayers outside of the plan area. At build-out of the entire 7,500-acre specific plan, Sutter Pointe provides for a maximum of 17,500 housing units, thousands of new jobs, and approximately 50,000 residents.
Relevant Financial PoliciesAnnual Financial ForecastingFollowing mid-year budget reviews, that aid in current year decisions and forecasting year-end results from operations.
Mid-Year Budget Review The County performs mid-year budget reviews that aid in current year decisions and forecasting year-end results from operations.
Contingency PlanningThe County does not maintain a formal contingency policy, however, approximately 1% of the General Fund is budgeted annually as a contingency against unforeseen adverse developments in county operations.
Nonrecurring RevenueThe County performs mid-year budget reviews that aid in current year decisions and forecasting year-end results from operations.
Debt AffordabilityThe County is in the process of establishing a Debt Advisory Committee (DAC) to be made up of the County Administrator, Auditor-Controller, and Treasurer/Tax Collector. The purpose of the Committee will be to provide advice to the Board on debt issuance and management. The DAC review all potential debt issuances and provide a report to the Board of Supervisors.
Capital and Maintenance FundingThe County has an informal pay-as-you-go policy for funding capital. However, the County has recently begun procurement of a facilities master plan that will aid in capital funding and address the aging and disparate facilities.
Financial Reporting AwardsThis report is the County’s third CAFR. We plan to seek consideration for financial reporting awards in the future.

2151 River Plaza Dr., Suite 150 Sacramento , CA 95833 Phone: 916.503.9691 Lance, Soll & Lunghard, LLP
INDEPENDENT AUDITORS’ REPORT
To the Board of Supervisors and Grandy Jury County of Sutter, California Report on the Financial Statements We have audited the accompanying financial statements of the governmental activities, the business-type activities, each major fund, and the aggregate remaining fund information of County of Sutter, California, (the County) as of and for the year ended June 30, 2020, and the related notes to the financial statements, which collectively comprise the County’s basic financial statements as listed in the table of contents. Management’s Responsibility for the Financial Statements Management is responsible for the preparation and fair presentation of these financial statements in accordance with accounting principles generally accepted in the United States of America; this includes the design, implementation, and maintenance of internal control relevant to the preparation and fair presentation of financial statements that are free from material misstatement, whether due to fraud or error.
Auditor’s Responsibility Our responsibility is to express opinions on these financial statements based on our audit. We conducted our audit in accordance with auditing standards generally accepted in the United States of America and the standards applicable to financial audits contained in Government Auditing Standards, issued by the Comptroller General of the United States. Those standards require that we plan and perform the audit to obtain reasonable assurance about whether the financial statements are free from material misstatement. An audit involves performing procedures to obtain audit evidence about the amounts and disclosures in the financial statements. The procedures selected depend on the auditor’s judgment, including the assessment of the risks of material misstatement of the financial statements, whether due to fraud or error. In making those risk assessments, the auditor considers internal control relevant to the entity’s preparation and fair presentation of the financial statements in order to design audit procedures that are appropriate in the circumstances, but not for the purpose of expressing an opinion on the effectiveness of the entity’s internal control. Accordingly, we express no such opinion. An audit also includes evaluating the appropriateness of accounting policies used and the reasonableness of significant accounting estimates made by management, as well as evaluating the overall presentation of the financial statements. We believe that the audit evidence we have obtained is sufficient and appropriate to provide a basis for our audit opinions.
To the Board of Supervisors and Grandy Jury County of Sutter, California
Opinions In our opinion, the financial statements referred to above present fairly, in all material respects, the respective financial position of the governmental activities, the business-type activities, each major fund, and the aggregate remaining fund information of the County of Sutter, California, as of June 30, 2020, and the respective changes in financial position and, where applicable, cash flows thereof for the year then ended in accordance with accounting principles generally accepted in the United States of America. Other Matters Required Supplementary Information Accounting principles generally accepted in the United States of America require that the management’s discussion and analysis, the budgetary comparison schedules for the General Fund, the Bi-County Behavioral Health Fund, the Welfare Fund, the Public Safety/Trial Courts Fund, the Mental Health Services Act Fund and Public Safety Realignment Fund, the schedule of changes in net pension liability and related ratios – miscellaneous plan, the schedule of pension plan contributions – miscellaneous plan, the schedule of changes in net pension liability and related ratios – safety plan, the schedule of pension plan contributions – safety plan, and the schedule of changes in total OPEB liability and related ratios be presented to supplement the basic financial statements. Such information, although not a part of the basic financial statements, is required by the Governmental Accounting Standards Board, who considers it to be an essential part of financial reporting for placing the basic financial statements in an appropriate operational, economic, or historical context. We have applied certain limited procedures to the required supplementary information in accordance with auditing standards generally accepted in the United States of America, which consisted of inquiries of management about the methods of preparing the information and comparing the information for consistency with management’s responses to our inquiries, the basic financial statements, and other knowledge we obtained during our audit of the basic financial statements. We do not express an opinion or provide any assurance on the information because the limited procedures do not provide us with sufficient evidence to express an opinion or provide any assurance. Other Information Our audit was conducted for the purpose of forming opinions on the financial statements that collectively comprise the County’s basic financial statements. The introductory section, combining and individual nonmajor fund financial statements and schedules, statistical section and glossary section are presented for purposes of additional analysis and are not a required part of the basic financial statements. The combining and individual nonmajor fund financial statements and schedules are the responsibility of management and were derived from and relate directly to the underlying accounting and other records used to prepare the basic financial statements. Such information has been subjected to the auditing procedures applied in the audit of the basic financial statements and certain additional procedures, including comparing and reconciling such information directly to the underlying accounting and other records used to prepare the basic financial statements or to the basic financial statements themselves, and other additional procedures in accordance with auditing standards generally accepted in the United States of America. In our opinion, the combining and individual nonmajor fund financial statements and schedules are fairly stated, in all material respects in relation to the basic financial statements as a whole. The introductory, statistical and glossary sections have not been subjected to the auditing procedures applied in the audit of the basic financial statements and, accordingly, we do not express an opinion or provide any assurance on them.
To the Board of Supervisors and Grandy Jury County of Sutter, California
Other Reporting Required by Government Auditing Standards In accordance with Government Auditing Standards, we have also issued our report dated December 23, 2020 on our consideration of the County’s internal control over financial reporting and on our tests of its compliance with certain provisions of laws, regulations, contracts, and grant agreements and other matters. The purpose of that report is solely to describe the scope of our testing of internal control over financial reporting and compliance and the results of that testing, and not to provide an opinion on the effectiveness of the County’s internal control over financial reporting or on compliance. That report is an integral part of an audit performed in accordance with Government Auditing Standards in considering the County’s internal control over financial reporting and compliance.
Sacramento, California Decemeber 23, 2020
County of Sutter | Comprehensive Annual Financial Report Fiscal Year Ended June 30, 2020
Unaudited and in thousands 10 Management’s Discussion & Analysis
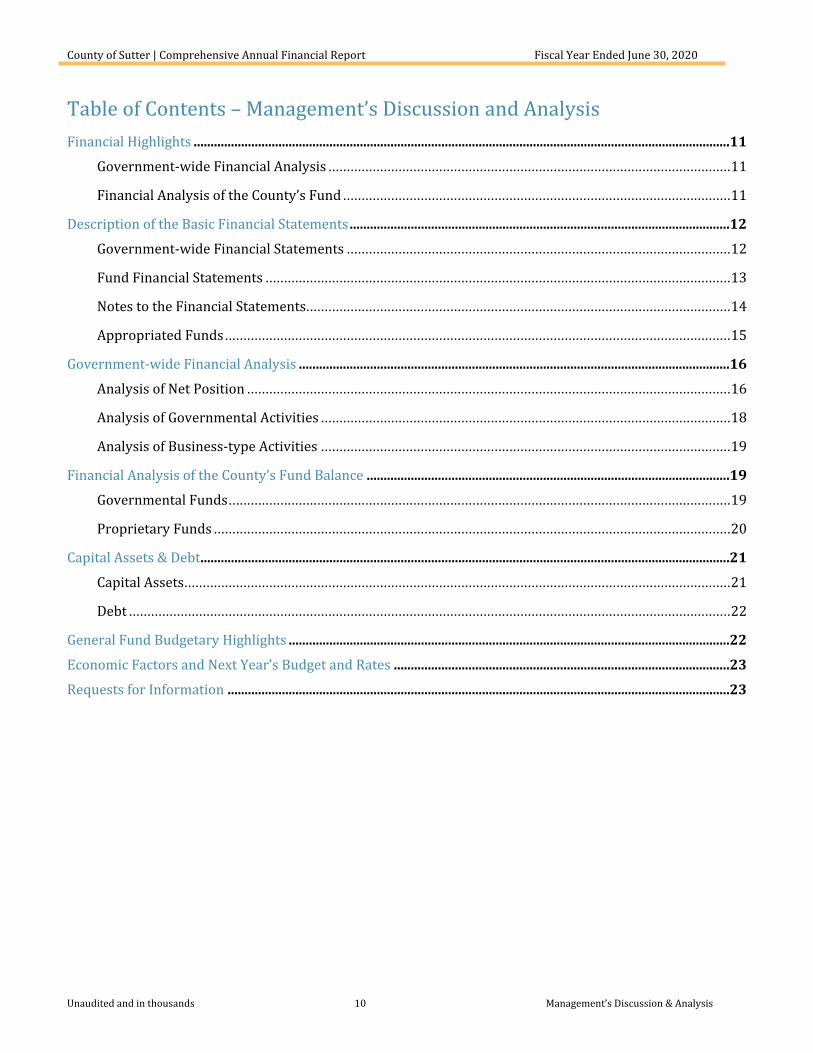
Table of Contents – Management’s Discussion and AnalysisFinancial Highlights ..............................................................................................................................................................11
Government-wide Financial Analysis .............................................................................................................11
Financial Analysis of the County’s Fund .........................................................................................................11
Description of the Basic Financial Statements ................................................................................................................12
Government-wide Financial Statements ........................................................................................................12
Fund Financial Statements ..............................................................................................................................13
Notes to the Financial Statements...................................................................................................................14
Appropriated Funds .........................................................................................................................................15
Government-wide Financial Analysis ...............................................................................................................................16
Analysis of Net Position ...................................................................................................................................16
Analysis of Governmental Activities ...............................................................................................................18
Analysis of Business-type Activities ...............................................................................................................19
Financial Analysis of the County’s Fund Balance ...........................................................................................................19
Governmental Funds........................................................................................................................................19
Proprietary Funds ............................................................................................................................................20
Capital Assets & Debt............................................................................................................................................................21
Capital Assets....................................................................................................................................................21
Debt ...................................................................................................................................................................22
General Fund Budgetary Highlights ..................................................................................................................................22
Economic Factors and Next Year’s Budget and Rates ...................................................................................................23
Requests for Information ....................................................................................................................................................23
County of Sutter | Comprehensive Annual Financial Report Fiscal Year Ended June 30, 2020
Unaudited and in thousands 11 Management’s Discussion & Analysis
Financial HighlightsThe information in this section is not covered by the Independent Auditors’ Report but is presented as required supplementary information for the benefit of the readers of the CAFR.
As management of the County, we offer readers of the County’s financial statements this narrative overview and analysis of the financial activities of the County for the year ended June 30, 2020. We encourage readers to consider the information presented here in conjunction with additional information that we have furnished in the County’s Basic Financial Statements, which immediately follow this section. All dollar amounts are expressed in thousands.
Government-wide Financial Analysis
The assets and deferred outflows of resources of the County exceeded its liabilities and deferred inflows of resources at the close of the most recent fiscal year by $57,010 (See Summary of Net Position and analysis on page 26):
$95,041 represents the County’s investment in capital assets, less (1) accumulated depreciation, (2) related outstanding debt used to acquire those assets, and (3) related deferred inflows of resources,
$87,466 is available for the County’s ongoing obligations related to programs with external restrictions, and; $(125,497) in unrestricted net position is primarily the result of the County’s unfunded pension and Other
Postemployment Benefits (OPEB) liabilities.
The County’s total net position decreased by $2,448 over the prior year:
The $4,874 increase in net position from the net investment in capital assets represents capital acquisitions and deletions, less current year depreciation, and the addition and/or retirement of related long-term debt and deferred inflows of resources,
The $275 decrease in restricted net position represents the change in resources that are subject to external restrictions on their use, and;
The $7,047 decrease in unrestricted net position is the change available to fund County programs to citizens and debt obligations to creditors.
Financial Analysis of the County’s Funds
The County’s governmental funds’ combined ending fund balance of $102,858, was an increase of $2,515 from the prior year ending fund balance of $100,343. Amounts available for spending include Restricted, Committed, Assigned and Unassigned Fund Balances; these totaled $100,283 or 97% of ending fund balance. Of this amount:
$77,773 is restricted by law or externally imposed requirements, $14,409 is committed for specific purposes, $34 is assigned fund balance, and; $8,067 is unassigned fund balance.
Spendable fund balance for the General Fund decreased $644 to $17,780, which equates to 64% of total General Fund expenditures for the year.
County of Sutter | Comprehensive Annual Financial Report Fiscal Year Ended June 30, 2020
Unaudited and in thousands 12 Management’s Discussion & Analysis
Description of the Basic Financial StatementsManagement’s Discussion and Analysis introduces the County’s Basic Financial Statements. The County’s Basic Financial Statements include three components:
Government-wide Financial Statements Fund Financial Statements Notes to the Financial Statements
Government-wide Financial Statements
The Government-wide Financial Statements provide readers with a broad overview of the County’s finances, in a manner similar to a private sector business.
The Statement of Net Position presents information on all of the County’s Assets and Deferred Outflows of Resources and Liabilities and Deferred Inflows of Resources with the difference reported as Net Position.
Net Position = (Assets + Deferred Outflows of Resources) – (Liabilities + Deferred Inflows of Resources)
Over time, increases or decreases in Net Position are a useful indicator of an improving or deteriorating County financial condition.
The Statement of Activities presents the most recent fiscal year changes in the County’s net position. All changes in net position are reported as soon as the underlying event giving rise to the change occurs, regardless of the timing of related cash flows (Accrual Basis of Accounting). The statement reports items resulting from cash flows in future fiscal periods (e.g., uncollected taxes, and earned but unused vacation leave) as revenues and expenses.
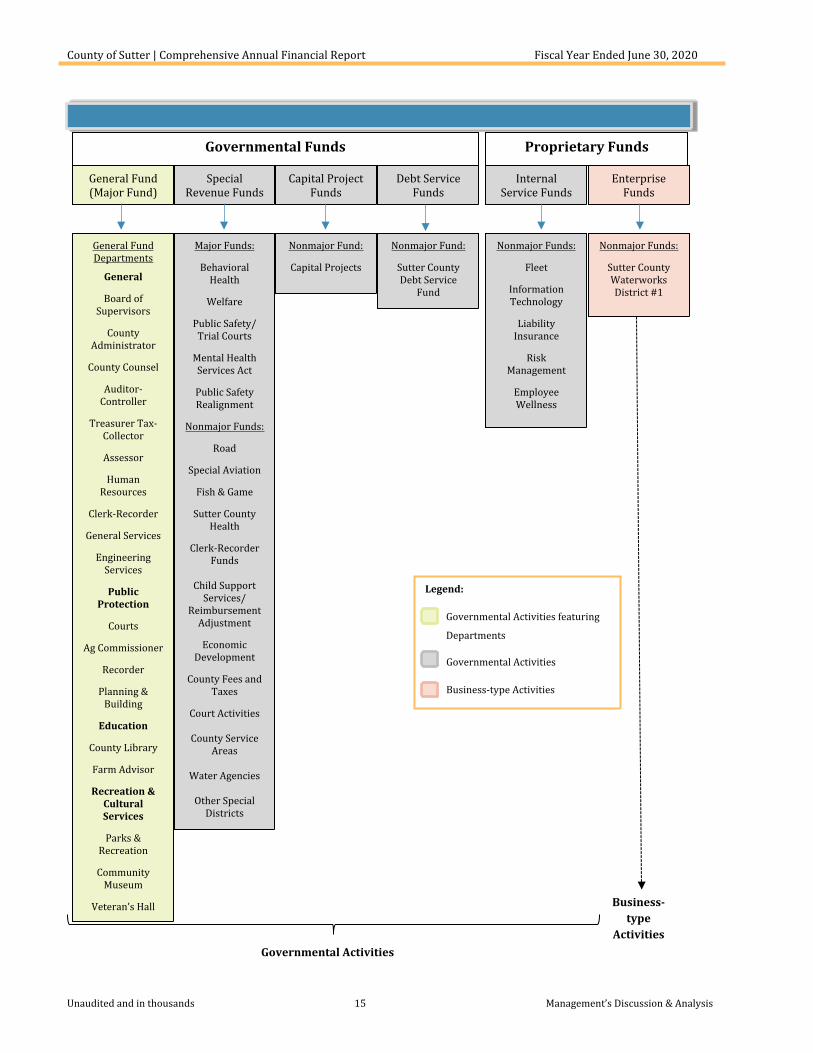
The Government-wide Financial Statements distinguish functions of the County principally supported by taxes and intergovernmental revenues (governmental activities) from other functions intended to recover all or a significant portion of their costs through user fees and charges (business-type activities). The governmental activities grouped by function of the County include General Government, Public Protection, Public Ways and Facilities, Health and Sanitation, Public Assistance, Education, and Recreation and Culture. The business-type activities of the County include Waterworks District #1.
Component Units are included in the financial statements and are legally separate entities for which the County is financially accountable. If a component unit’s total debt is expected to be repaid entirely by the County, if the component unit provides services entirely to the County, or if the component unit has substantially the same governing board as the County and there is a financial benefit or burden relationship or County management has operational responsibility for a component unit, then the component will be classified as a blended component unit. If a component unit does not meet any of the preceding requirements it will be presented as a discrete component unit. The following is a list of the County’s blended component units:
1. In-Home Supportive Services Public Authority2. Gilsizer County Drainage District3. Sutter County Fish & Game Commission4. County Service Areas5. Lighting Districts6. Children and Families’ Commission
County of Sutter | Comprehensive Annual Financial Report Fiscal Year Ended June 30, 2020
Unaudited and in thousands 13 Management’s Discussion & Analysis
Fund Financial Statements
A fund is a grouping of related accounts used to maintain control over resources segregated for specific activities or objectives. The County, like other state and local governments, uses fund accounting to ensure and demonstrate compliance with finance-related legal requirements.
The County’s funds are divided into three types:
Governmental funds Proprietary funds Fiduciary funds
Governmental Funds
Governmental funds account for essentially the same functions reported as governmental activities in the Government-wide Financial Statements. However, unlike the Government-wide Financial Statements, governmental fund financial statements focus on near-term inflows and outflows of spendable resources, as well as on balances of spendable resources available at the end of the fiscal year (Modified Accrual Basis of Accounting). Such information may be useful in evaluating the County’s near-term financing requirements. To understand the long-term impact of the County’s near-term financing decisions, it is useful to compare the information presented for governmental funds with similar information presented for governmental activities in the Governmental Funds Statement of Revenues, Expenditures, and Changes in Fund Balance provide a reconciliation to facilitate this comparison between governmental funds and governmental activities.
The County maintains approximately 130 individual governmental funds combined into 20 funds for financial reporting purposes. The County segregates from the General Fund a number of significant functions in 5 major funds. Information is presented separately in the Governmental Funds Balance Sheet and in the Governmental Funds Statement of Revenues, Expenditures, and Changes in Fund Balances for the General, Bi-County Behavioral Health, Welfare, Public Safety/Trial Courts, Mental Health Services Act, and Public Safety Realignment, all considered major funds. Data for the other 14 governmental funds are provided in the form of combining statements elsewhere in this report.
The County adopts an annual appropriated budget for all of its operating funds. The budget and actual comparison schedules provided for the General Fund and major special revenue funds demonstrate performance against this budget.
Pages 30 - 36 of this report display the Governmental Funds Financial Statements.
Proprietary Funds
The County maintains two types of proprietary funds: enterprise funds and internal service funds. The County has one enterprise fund which does not qualify as a major fund.
Enterprise Funds report the same functions presented as business-type activities in the Government-wide Financial Statements. The County uses an enterprise fund to account for Waterworks District #1.
Internal Service Funds are an accounting device used to accumulate and allocate costs internally among the County’s various functions. The County’s internal service funds account for information technology services, fleet maintenance, employee wellness, and self-insurance programs. Since these services predominately benefit governmental rather than business-type functions, they are consolidated within governmental activities in the Government-wide Financial Statements.
County of Sutter | Comprehensive Annual Financial Report Fiscal Year Ended June 30, 2020
Unaudited and in thousands 14 Management’s Discussion & Analysis
Proprietary funds provide the same type of information as the Government-wide Financial Statements, but in more detail. The proprietary funds financial statements provide separate information for the enterprise fund and the internal service funds. Data for the five internal service funds are combined into a single, aggregated presentation in the proprietary funds financial statements.
Page 37 - 39 of this report display the Proprietary Funds Financial Statements.
Fiduciary Funds
Fiduciary funds account for resources held for the benefit of parties outside the County. Fiduciary funds are not reported in the Government-wide Financial Statements because the resources of those funds are not available to support the County’s own programs. Fiduciary fund accounting is similar to proprietary fund accounting. Fiduciary funds report the external portions of the Treasurer’s investment pool, a private-purpose trust fund, and agency funds.
Pages 41 - 42 of this report display the Fiduciary Funds Financial Statements.
Notes to the Financial Statements
The Notes to the Financial Statements provide additional information that is essential to a full understanding of the data provided in the Government-wide and Fund Financial Statements. Information in the Notes to the Financial Statements is described as follows:
Note 1 provides a general description of the County’s Significant Accounting Policies. Notes 2 to 13 provide detailed information on cash and investments, loans receivable, capital assets, lease
commitments, long-term liabilities, deferred outflows of resources, interfund transactions, risk management, deferred inflows of resources, and fund balance classifications.
Notes 14 and 15 provide detailed information on pension plans and other post employments benefits. Note 16 provides detailed information on the County’s compensated absences liability. Note 17 provides other information such as construction commitments and contingent liabilities. Note 18 provides other information on significant events affecting the County subsequent to the fiscal year end
date of June 30, 2020. Note 19 provides information on fund balance restatements.
Notes to the Financial Statements start on Page 46 of this report.
County of Sutter | Comprehensive Annual Financial Report Fiscal Year Ended June 30, 2020
Unaudited and in thousands 15 Management’s Discussion & Analysis
Governmental Funds Proprietary Funds
Business-type
ActivitiesGovernmental Activities
General Fund(Major Fund)
Capital Project Funds
Special Revenue Funds
Debt Service Funds
Internal Service Funds
Enterprise Funds
General FundDepartments
General
Board of Supervisors
County Administrator
County Counsel
Auditor-Controller
Treasurer Tax-Collector
Assessor
Human Resources
Clerk-Recorder
General Services
Engineering Services
Public Protection
Courts
Ag Commissioner
Recorder
Planning & Building
Education
County Library
Farm Advisor
Recreation & Cultural Services
Parks & Recreation
Community Museum
Veteran’s Hall
Major Funds:
Behavioral Health
Welfare
Public Safety/ Trial Courts
Mental Health Services Act
Public Safety Realignment
Nonmajor Funds:
Road
Special Aviation
Fish & Game
Sutter County Health
Clerk-Recorder Funds
Child Support Services/
Reimbursement Adjustment
Economic Development
County Fees and Taxes
Court Activities
County Service Areas
Water Agencies
Other Special Districts
Nonmajor Fund:
Capital Projects
Nonmajor Fund:
Sutter County Debt Service
Fund
Nonmajor Funds:
Fleet
Information Technology
Liability Insurance
Risk Management
Employee Wellness
Nonmajor Funds:
Sutter County Waterworks District #1
Legend:
Governmental Activities featuring
Departments
Governmental Activities
Business-type Activities
County of Sutter | Comprehensive Annual Financial Report Fiscal Year Ended June 30, 2020
Unaudited and in thousands 16 Management’s Discussion & Analysis
Government-wide Financial AnalysisCondensed Statement of Net Position (in thousands)
Total
Governmental Activities Business-Type Activities Total Dollar Change % Change
2020 2019 2020 2019 2020 2019 2019 to 20202019 to
2020
Current and other assets $ 131,846 $ 128,876 $ 413 $ 409 $ 132,259 $ 129,285 $ 2,974 2%
Capital assets 99,996 96,008 2,482 1,701 102,478 97,709 4,769 5%
Total Assets 231,843 224,884 2,894 2,110 234,737 226,994 7,743 3%
Deferred outflows of resources
Deferred OPEB 686 727 - - 686 727 (41) (6%)
Deferred pension 28,640 27,156 - 4 28,640 27,160 1,480 5%
Total deferred outflows of resources 29,326 27,883 - 4 29,326 27,887 1,439 5%
Current and other liabilities 15,676 23,051 27 91 15,703 23,142 (7,439) (32%)
Long term liabilities 182,128 164,804 152 187 182,281 164,991 17,290 10%
Total Liabilities 197,805 187,855 179 278 197,984 188,133 9,851 5%
Deferred inflows of resources
Deferred OPEB 4,230 507 - - 4,230 507 3,723 734%
Deferred pension 4,839 6,782 - 1 4,839 6,783 (1,944) (29%)
Total deferred inflows of resources 9,069 7,289 - 1 9,069 7,290 1,779 24%
Net investment in capital assets 92,732 88,678 2,310 1,489 95,041 90,167 4,874 5%
Restricted 87,466 87,741 - - 87,466 87,741 (275) (0%)
Unrestricted (125,903) (118,796) 405 346 (125,497) (118,450) (7,047) 6%
Total Net Position $ 54,295 $ 57,623 $ 2,715 $ 1,835 $ 57,010 $ 59,458 $ (2,448) (4%)
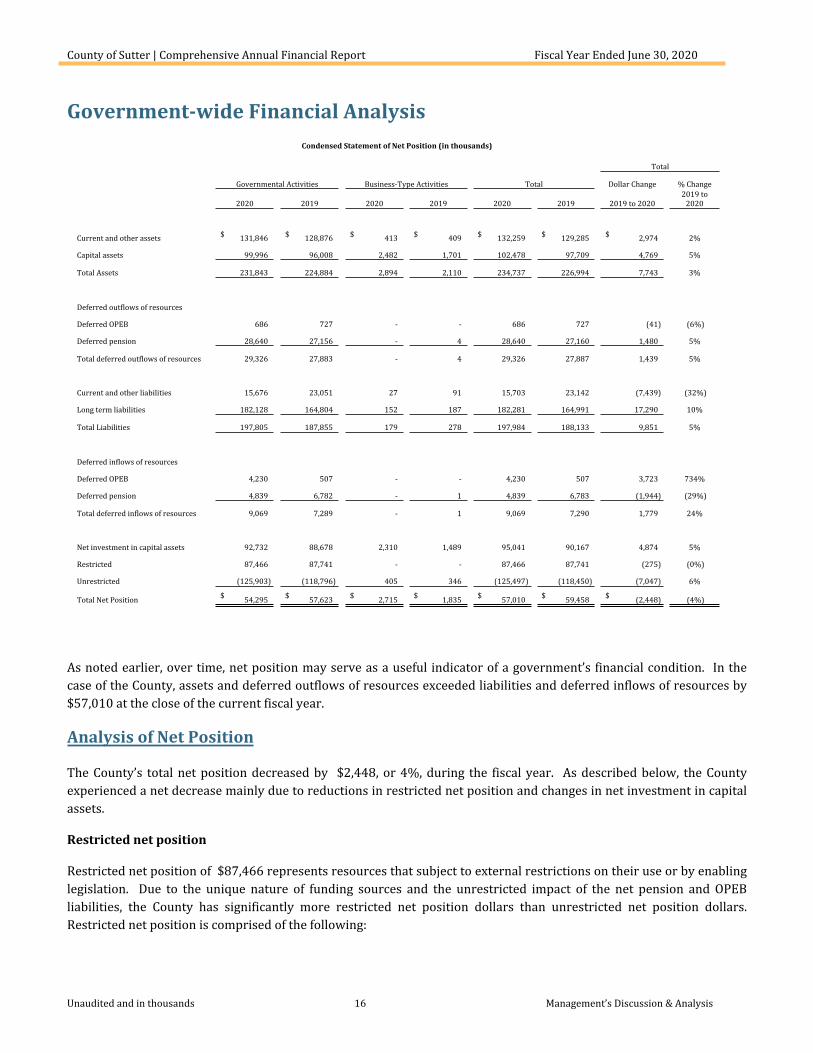
As noted earlier, over time, net position may serve as a useful indicator of a government’s financial condition. In the case of the County, assets and deferred outflows of resources exceeded liabilities and deferred inflows of resources by $57,010 at the close of the current fiscal year.
Analysis of Net Position
The County’s total net position decreased by $2,448, or 4%, during the fiscal year. As described below, the County experienced a net decrease mainly due to reductions in restricted net position and changes in net investment in capital assets.
Restricted net position
Restricted net position of $87,466 represents resources that subject to external restrictions on their use or by enabling legislation. Due to the unique nature of funding sources and the unrestricted impact of the net pension and OPEB liabilities, the County has significantly more restricted net position dollars than unrestricted net position dollars. Restricted net position is comprised of the following:
County of Sutter | Comprehensive Annual Financial Report Fiscal Year Ended June 30, 2020
Unaudited and in thousands 17 Management’s Discussion & Analysis
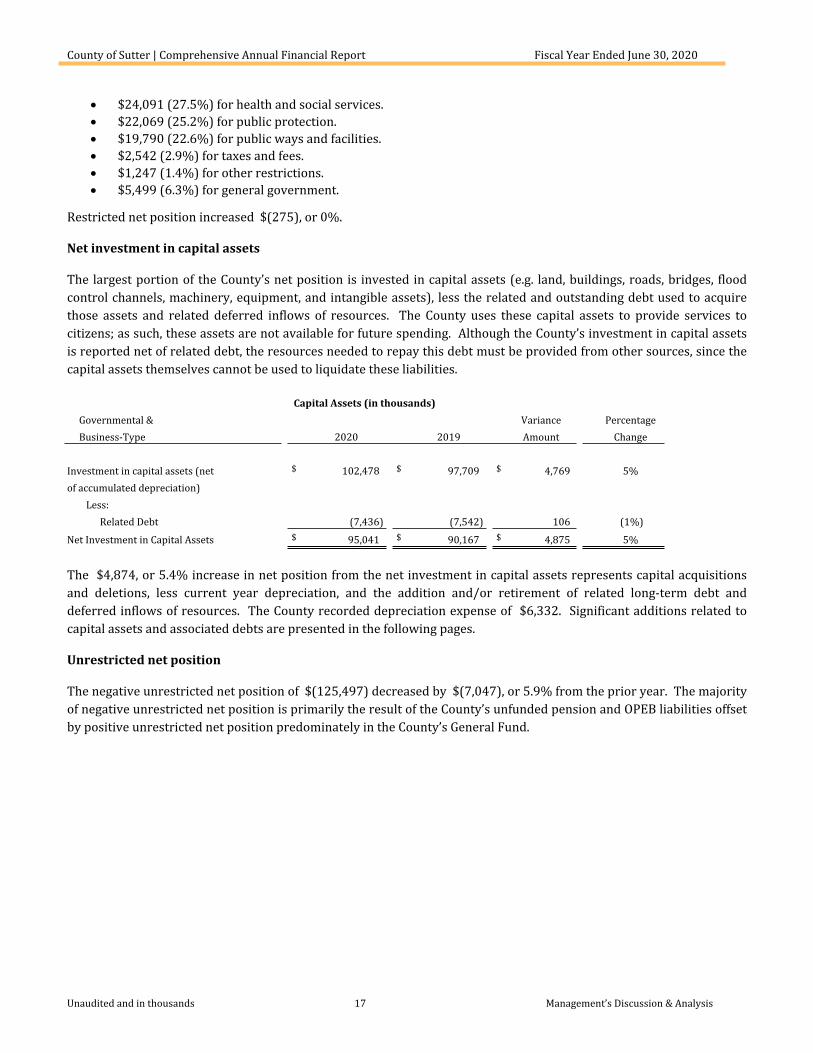
$24,091 (27.5%) for health and social services. $22,069 (25.2%) for public protection. $19,790 (22.6%) for public ways and facilities. $2,542 (2.9%) for taxes and fees. $1,247 (1.4%) for other restrictions. $5,499 (6.3%) for general government.
Restricted net position increased $(275), or 0%.
Net investment in capital assets
The largest portion of the County’s net position is invested in capital assets (e.g. land, buildings, roads, bridges, flood control channels, machinery, equipment, and intangible assets), less the related and outstanding debt used to acquire those assets and related deferred inflows of resources. The County uses these capital assets to provide services to citizens; as such, these assets are not available for future spending. Although the County’s investment in capital assets is reported net of related debt, the resources needed to repay this debt must be provided from other sources, since the capital assets themselves cannot be used to liquidate these liabilities.
Capital Assets (in thousands)Governmental & Variance PercentageBusiness-Type 2020 2019 Amount Change
Investment in capital assets (net $ 102,478 $ 97,709 $ 4,769 5%of accumulated depreciation)
Less: Related Debt (7,436) (7,542) 106 (1%)
Net Investment in Capital Assets $ 95,041 $ 90,167 $ 4,875 5%
The $4,874, or 5.4% increase in net position from the net investment in capital assets represents capital acquisitions and deletions, less current year depreciation, and the addition and/or retirement of related long-term debt and deferred inflows of resources. The County recorded depreciation expense of $6,332. Significant additions related to capital assets and associated debts are presented in the following pages.
Unrestricted net position
The negative unrestricted net position of $(125,497) decreased by $(7,047), or 5.9% from the prior year. The majority of negative unrestricted net position is primarily the result of the County’s unfunded pension and OPEB liabilities offset by positive unrestricted net position predominately in the County’s General Fund.
County of Sutter | Comprehensive Annual Financial Report Fiscal Year Ended June 30, 2020
Unaudited and in thousands 18 Management’s Discussion & Analysis
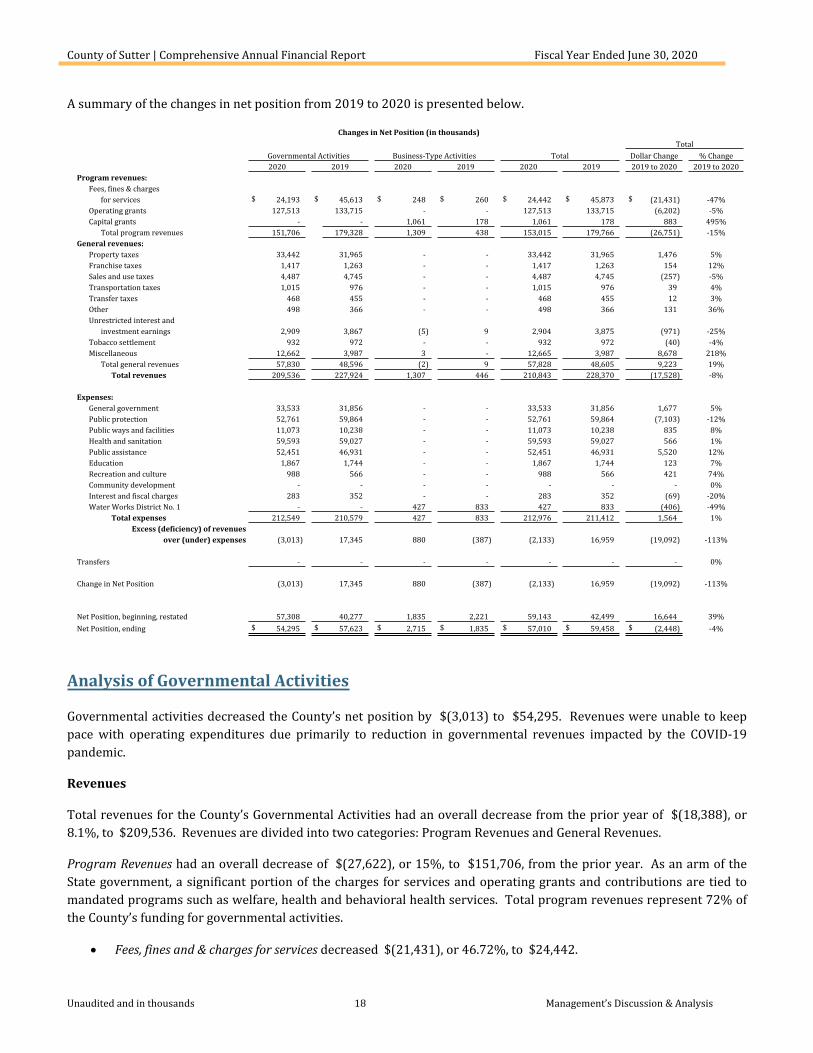
A summary of the changes in net position from 2019 to 2020 is presented below.
Changes in Net Position (in thousands)Total
Governmental Activities Business-Type Activities Total Dollar Change % Change2020 2019 2020 2019 2020 2019 2019 to 2020 2019 to 2020
Program revenues:Fees, fines & charges
for services $ 24,193 $ 45,613 $ 248 $ 260 $ 24,442 $ 45,873 $ (21,431) -47%Operating grants 127,513 133,715 - - 127,513 133,715 (6,202) -5%Capital grants - - 1,061 178 1,061 178 883 495%
Total program revenues 151,706 179,328 1,309 438 153,015 179,766 (26,751) -15%General revenues:
Property taxes 33,442 31,965 - - 33,442 31,965 1,476 5%Franchise taxes 1,417 1,263 - - 1,417 1,263 154 12%Sales and use taxes 4,487 4,745 - - 4,487 4,745 (257) -5%Transportation taxes 1,015 976 - - 1,015 976 39 4%Transfer taxes 468 455 - - 468 455 12 3%Other 498 366 - - 498 366 131 36%Unrestricted interest and
investment earnings 2,909 3,867 (5) 9 2,904 3,875 (971) -25%Tobacco settlement 932 972 - - 932 972 (40) -4%Miscellaneous 12,662 3,987 3 - 12,665 3,987 8,678 218%
Total general revenues 57,830 48,596 (2) 9 57,828 48,605 9,223 19% Total revenues 209,536 227,924 1,307 446 210,843 228,370 (17,528) -8%
Expenses:General government 33,533 31,856 - - 33,533 31,856 1,677 5%Public protection 52,761 59,864 - - 52,761 59,864 (7,103) -12%Public ways and facilities 11,073 10,238 - - 11,073 10,238 835 8%Health and sanitation 59,593 59,027 - - 59,593 59,027 566 1%Public assistance 52,451 46,931 - - 52,451 46,931 5,520 12%Education 1,867 1,744 - - 1,867 1,744 123 7%Recreation and culture 988 566 - - 988 566 421 74%Community development - - - - - - - 0%Interest and fiscal charges 283 352 - - 283 352 (69) -20%Water Works District No. 1 - - 427 833 427 833 (406) -49%
Total expenses 212,549 210,579 427 833 212,976 211,412 1,564 1%Excess (deficiency) of revenues
over (under) expenses (3,013) 17,345 880 (387) (2,133) 16,959 (19,092) -113%
Transfers - - - - - - - 0%
Change in Net Position (3,013) 17,345 880 (387) (2,133) 16,959 (19,092) -113%
Net Position, beginning, restated 57,308 40,277 1,835 2,221 59,143 42,499 16,644 39%Net Position, ending $ 54,295 $ 57,623 $ 2,715 $ 1,835 $ 57,010 $ 59,458 $ (2,448) -4%
Analysis of Governmental Activities
Governmental activities decreased the County’s net position by $(3,013) to $54,295. Revenues were unable to keep pace with operating expenditures due primarily to reduction in governmental revenues impacted by the COVID-19 pandemic.
Revenues
Total revenues for the County’s Governmental Activities had an overall decrease from the prior year of $(18,388), or 8.1%, to $209,536. Revenues are divided into two categories: Program Revenues and General Revenues.
Program Revenues had an overall decrease of $(27,622), or 15%, to $151,706, from the prior year. As an arm of the State government, a significant portion of the charges for services and operating grants and contributions are tied to mandated programs such as welfare, health and behavioral health services. Total program revenues represent 72% of the County’s funding for governmental activities.
Fees, fines and & charges for services decreased $(21,431), or 46.72%, to $24,442.
County of Sutter | Comprehensive Annual Financial Report Fiscal Year Ended June 30, 2020
Unaudited and in thousands 19 Management’s Discussion & Analysis
Operating grants (intergovernmental revenues) decreased $(6,202), or 4.64%, to $127,513. Capital grants (intergovernmental revenues) increased $883, or 495%.
General Revenues had an overall increase of $9,233, or 4%, to $57,830, from the prior year. These revenues included general taxes which provided the Board of Supervisors with the most discretionary spending ability. Since the formation of California County government in the 1850’s, basic public safety services such as sheriff, fire, probation, and district attorney consume most of these resources. The increase in general revenues is due primarily to:
Sales and use tax shrank $(257), or 5.42%, to $4,487. Property taxes increase 1,476, or 4.62%, to 33,442. Franchise tax increase $154, or 12%, to $1,417.
Expenses had an overall increase for all activities of $1,564, or 0.74%, to $212,976 from the prior year.
Analysis of Business-type Activities
The net position of business-type activities increased by $880, or 48%, to $2,715. For many years this enterprise activity has generated annual deficits, however, in the current year due to a large state grant the fund increase its net position. For example, capital grants of $1,061, was 81% of total revenue. Although grant funding is regularly applied for and awarded due to the low per-capita income of the area residents, there is no guarantee that these funds will be received each year.
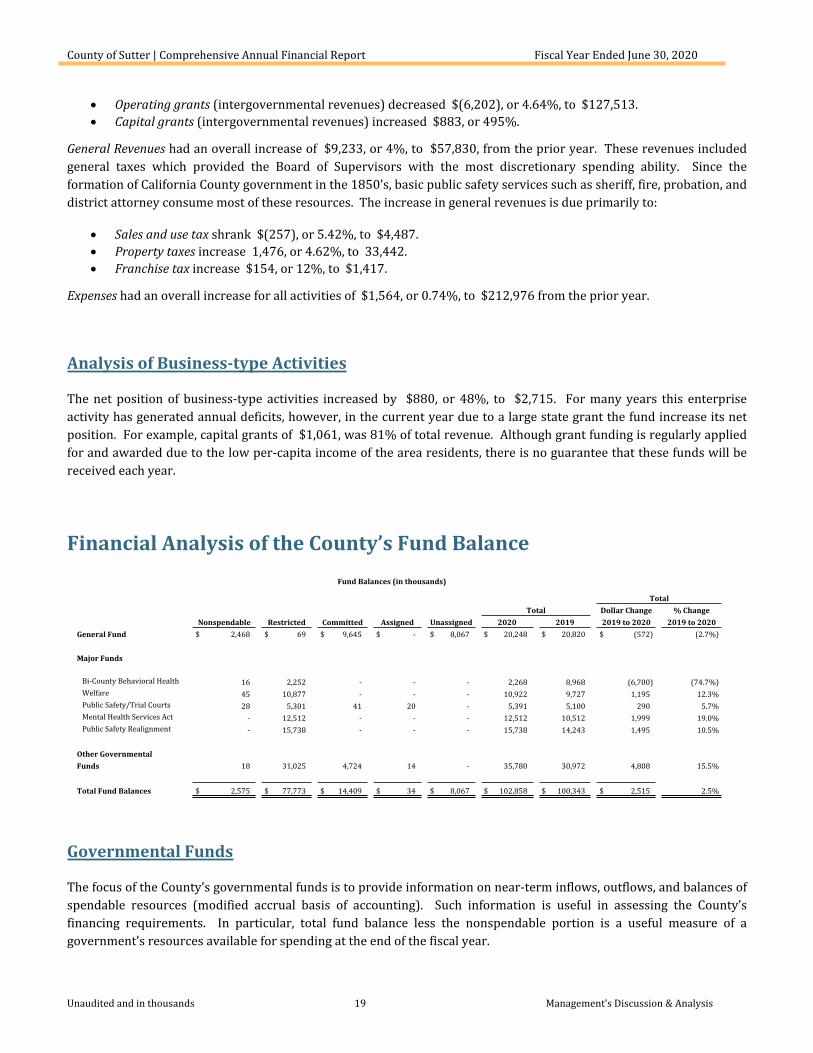
Financial Analysis of the County’s Fund BalanceFund Balances (in thousands)
TotalTotal Dollar Change % Change
Nonspendable Restricted Committed Assigned Unassigned 2020 2019 2019 to 2020 2019 to 2020General Fund $ 2,468 $ 69 $ 9,645 $ - $ 8,067 $ 20,248 $ 20,820 $ (572) (2.7%)
Major Funds
Bi-County Behavioral Health 16 2,252 - - - 2,268 8,968 (6,700) (74.7%) Welfare 45 10,877 - - - 10,922 9,727 1,195 12.3% Public Safety/Trial Courts 28 5,301 41 20 - 5,391 5,100 290 5.7% Mental Health Services Act - 12,512 - - - 12,512 10,512 1,999 19.0% Public Safety Realignment - 15,738 - - - 15,738 14,243 1,495 10.5%
Other GovernmentalFunds 18 31,025 4,724 14 - 35,780 30,972 4,808 15.5%
Total Fund Balances $ 2,575 $ 77,773 $ 14,409 $ 34 $ 8,067 $ 102,858 $ 100,343 $ 2,515 2.5%
Governmental Funds
The focus of the County’s governmental funds is to provide information on near-term inflows, outflows, and balances of spendable resources (modified accrual basis of accounting). Such information is useful in assessing the County’s financing requirements. In particular, total fund balance less the nonspendable portion is a useful measure of a government’s resources available for spending at the end of the fiscal year.
County of Sutter | Comprehensive Annual Financial Report Fiscal Year Ended June 30, 2020
Unaudited and in thousands 20 Management’s Discussion & Analysis
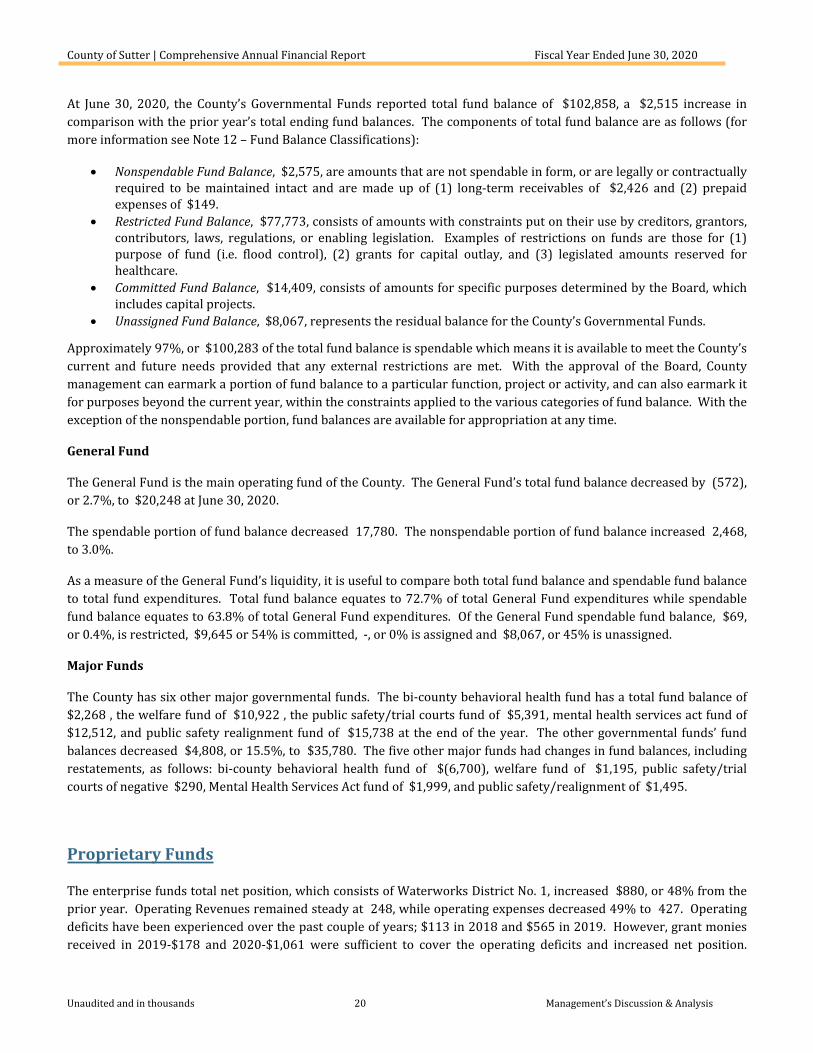
At June 30, 2020, the County’s Governmental Funds reported total fund balance of $102,858, a $2,515 increase in comparison with the prior year’s total ending fund balances. The components of total fund balance are as follows (for more information see Note 12 – Fund Balance Classifications):
Nonspendable Fund Balance, $2,575, are amounts that are not spendable in form, or are legally or contractually required to be maintained intact and are made up of (1) long-term receivables of $2,426 and (2) prepaid expenses of $149.
Restricted Fund Balance, $77,773, consists of amounts with constraints put on their use by creditors, grantors, contributors, laws, regulations, or enabling legislation. Examples of restrictions on funds are those for (1) purpose of fund (i.e. flood control), (2) grants for capital outlay, and (3) legislated amounts reserved for healthcare.
Committed Fund Balance, $14,409, consists of amounts for specific purposes determined by the Board, which includes capital projects.
Unassigned Fund Balance, $8,067, represents the residual balance for the County’s Governmental Funds.
Approximately 97%, or $100,283 of the total fund balance is spendable which means it is available to meet the County’s current and future needs provided that any external restrictions are met. With the approval of the Board, County management can earmark a portion of fund balance to a particular function, project or activity, and can also earmark it for purposes beyond the current year, within the constraints applied to the various categories of fund balance. With the exception of the nonspendable portion, fund balances are available for appropriation at any time.
General Fund
The General Fund is the main operating fund of the County. The General Fund’s total fund balance decreased by (572), or 2.7%, to $20,248 at June 30, 2020.
The spendable portion of fund balance decreased 17,780. The nonspendable portion of fund balance increased 2,468, to 3.0%.
As a measure of the General Fund’s liquidity, it is useful to compare both total fund balance and spendable fund balance to total fund expenditures. Total fund balance equates to 72.7% of total General Fund expenditures while spendable fund balance equates to 63.8% of total General Fund expenditures. Of the General Fund spendable fund balance, $69, or 0.4%, is restricted, $9,645 or 54% is committed, -, or 0% is assigned and $8,067, or 45% is unassigned.
Major Funds
The County has six other major governmental funds. The bi-county behavioral health fund has a total fund balance of $2,268 , the welfare fund of $10,922 , the public safety/trial courts fund of $5,391, mental health services act fund of $12,512, and public safety realignment fund of $15,738 at the end of the year. The other governmental funds’ fund balances decreased $4,808, or 15.5%, to $35,780. The five other major funds had changes in fund balances, including restatements, as follows: bi-county behavioral health fund of $(6,700), welfare fund of $1,195, public safety/trial courts of negative $290, Mental Health Services Act fund of $1,999, and public safety/realignment of $1,495.
Proprietary Funds
The enterprise funds total net position, which consists of Waterworks District No. 1, increased $880, or 48% from the prior year. Operating Revenues remained steady at 248, while operating expenses decreased 49% to 427. Operating deficits have been experienced over the past couple of years; $113 in 2018 and $565 in 2019. However, grant monies received in 2019-$178 and 2020-$1,061 were sufficient to cover the operating deficits and increased net position.
County of Sutter | Comprehensive Annual Financial Report Fiscal Year Ended June 30, 2020
Unaudited and in thousands 21 Management’s Discussion & Analysis
Accordingly, operating revenues may have to be raised, in the future to meet the operating expenses of the utility district.
Total internal service funds’ net position increased by $972, or 44%, and ended with a deficit balance of $(1,256).
Capital Assets & Debt
Capital Assets
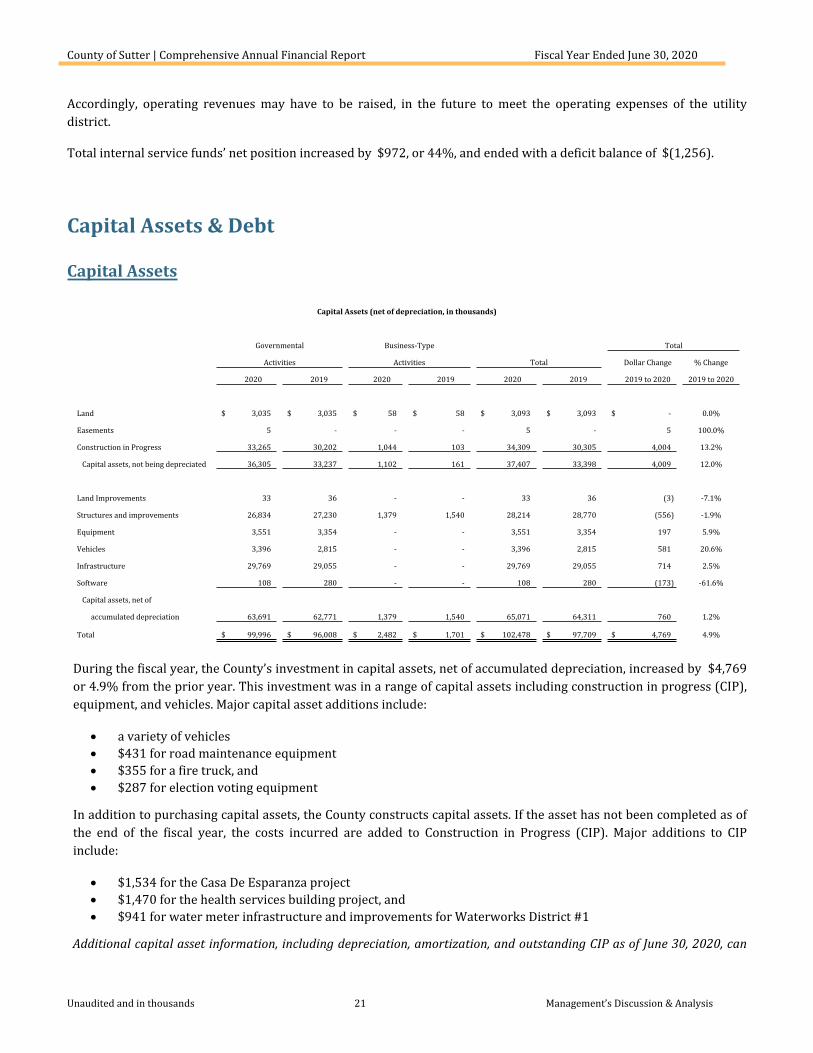
Capital Assets (net of depreciation, in thousands)
Governmental Business-Type Total
Activities Activities Total Dollar Change % Change
2020 2019 2020 2019 2020 2019 2019 to 2020 2019 to 2020
Land $ 3,035 $ 3,035 $ 58 $ 58 $ 3,093 $ 3,093 $ - 0.0%
Easements 5 - - - 5 - 5 100.0%
Construction in Progress 33,265 30,202 1,044 103 34,309 30,305 4,004 13.2%
Capital assets, not being depreciated 36,305 33,237 1,102 161 37,407 33,398 4,009 12.0%
Land Improvements 33 36 - - 33 36 (3) -7.1%
Structures and improvements 26,834 27,230 1,379 1,540 28,214 28,770 (556) -1.9%
Equipment 3,551 3,354 - - 3,551 3,354 197 5.9%
Vehicles 3,396 2,815 - - 3,396 2,815 581 20.6%
Infrastructure 29,769 29,055 - - 29,769 29,055 714 2.5%
Software 108 280 - - 108 280 (173) -61.6%
Capital assets, net of
accumulated depreciation 63,691 62,771 1,379 1,540 65,071 64,311 760 1.2%
Total $ 99,996 $ 96,008 $ 2,482 $ 1,701 $ 102,478 $ 97,709 $ 4,769 4.9%
During the fiscal year, the County’s investment in capital assets, net of accumulated depreciation, increased by $4,769 or 4.9% from the prior year. This investment was in a range of capital assets including construction in progress (CIP), equipment, and vehicles. Major capital asset additions include:
a variety of vehicles $431 for road maintenance equipment $355 for a fire truck, and $287 for election voting equipment
In addition to purchasing capital assets, the County constructs capital assets. If the asset has not been completed as of the end of the fiscal year, the costs incurred are added to Construction in Progress (CIP). Major additions to CIP include:
$1,534 for the Casa De Esparanza project $1,470 for the health services building project, and $941 for water meter infrastructure and improvements for Waterworks District #1
Additional capital asset information, including depreciation, amortization, and outstanding CIP as of June 30, 2020, can
County of Sutter | Comprehensive Annual Financial Report Fiscal Year Ended June 30, 2020
Unaudited and in thousands 22 Management’s Discussion & Analysis
be found in Note 5 of the Notes to the Financial Statements.
Debt
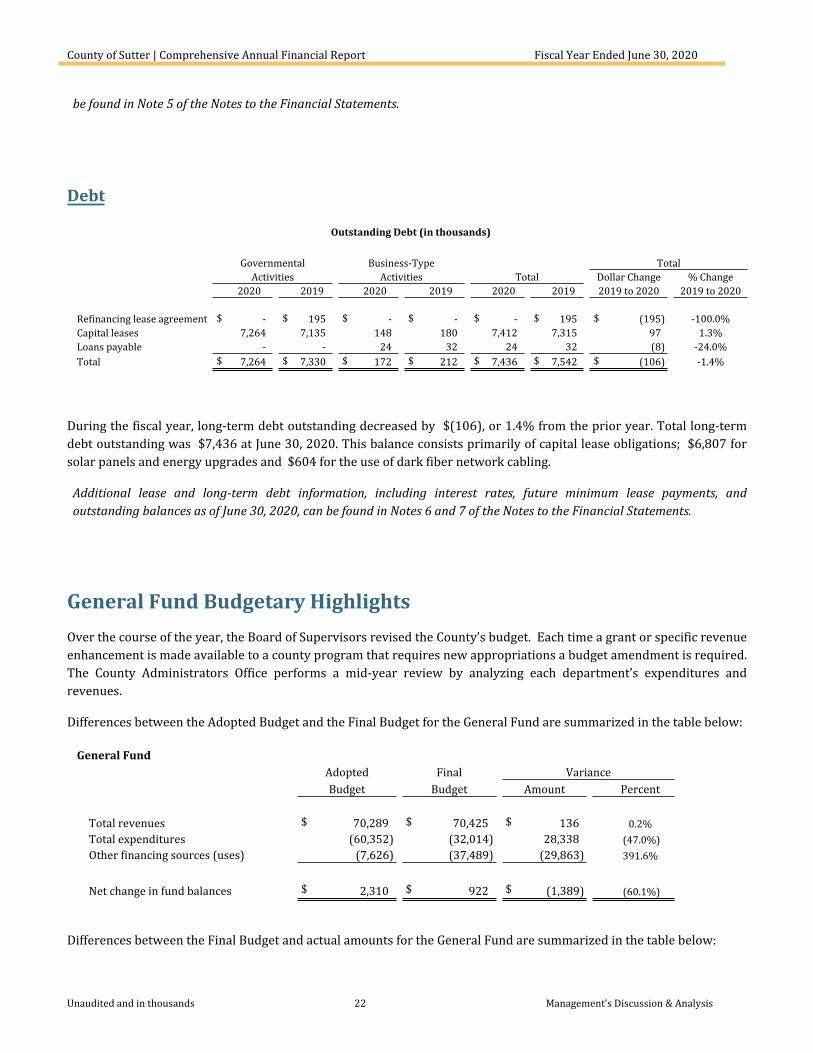
Outstanding Debt (in thousands)
Governmental Business-Type TotalActivities Activities Total Dollar Change % Change
2020 2019 2020 2019 2020 2019 2019 to 2020 2019 to 2020
Refinancing lease agreement $ - $ 195 $ - $ - $ - $ 195 $ (195) -100.0%Capital leases 7,264 7,135 148 180 7,412 7,315 97 1.3%Loans payable - - 24 32 24 32 (8) -24.0%Total $ 7,264 $ 7,330 $ 172 $ 212 $ 7,436 $ 7,542 $ (106) -1.4%
During the fiscal year, long-term debt outstanding decreased by $(106), or 1.4% from the prior year. Total long-term debt outstanding was $7,436 at June 30, 2020. This balance consists primarily of capital lease obligations; $6,807 for solar panels and energy upgrades and $604 for the use of dark fiber network cabling.
Additional lease and long-term debt information, including interest rates, future minimum lease payments, and outstanding balances as of June 30, 2020, can be found in Notes 6 and 7 of the Notes to the Financial Statements.
General Fund Budgetary HighlightsOver the course of the year, the Board of Supervisors revised the County’s budget. Each time a grant or specific revenue enhancement is made available to a county program that requires new appropriations a budget amendment is required. The County Administrators Office performs a mid-year review by analyzing each department’s expenditures and revenues.
Differences between the Adopted Budget and the Final Budget for the General Fund are summarized in the table below:
General FundAdopted Final VarianceBudget Budget Amount Percent
Total revenues $ 70,289 $ 70,425 $ 136 0.2%Total expenditures (60,352) (32,014) 28,338 (47.0%)Other financing sources (uses) (7,626) (37,489) (29,863) 391.6%
Net change in fund balances $ 2,310 $ 922 $ (1,389) (60.1%)
Differences between the Final Budget and actual amounts for the General Fund are summarized in the table below:
County of Sutter | Comprehensive Annual Financial Report Fiscal Year Ended June 30, 2020
Unaudited and in thousands 23 Management’s Discussion & Analysis
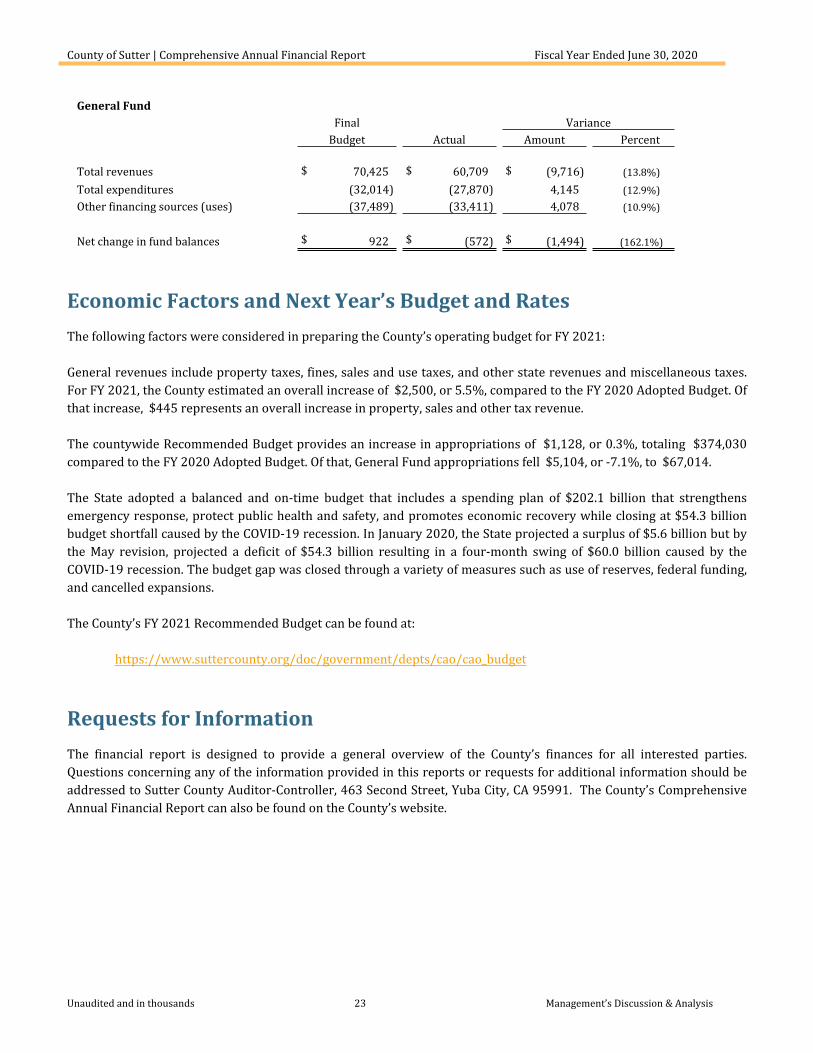
General FundFinal Variance
Budget Actual Amount Percent
Total revenues $ 70,425 $ 60,709 $ (9,716) $ (13.8%)Total expenditures (32,014) (27,870) 4,145 (12.9%)Other financing sources (uses) (37,489) (33,411) 4,078 (10.9%)
Net change in fund balances $ 922 $ (572) $ (1,494) (162.1%)
Economic Factors and Next Year’s Budget and RatesThe following factors were considered in preparing the County’s operating budget for FY 2021:
General revenues include property taxes, fines, sales and use taxes, and other state revenues and miscellaneous taxes. For FY 2021, the County estimated an overall increase of $2,500, or 5.5%, compared to the FY 2020 Adopted Budget. Of that increase, $445 represents an overall increase in property, sales and other tax revenue.
The countywide Recommended Budget provides an increase in appropriations of $1,128, or 0.3%, totaling $374,030 compared to the FY 2020 Adopted Budget. Of that, General Fund appropriations fell $5,104, or -7.1%, to $67,014.
The State adopted a balanced and on-time budget that includes a spending plan of $202.1 billion that strengthens emergency response, protect public health and safety, and promotes economic recovery while closing at $54.3 billion budget shortfall caused by the COVID-19 recession. In January 2020, the State projected a surplus of $5.6 billion but by the May revision, projected a deficit of $54.3 billion resulting in a four-month swing of $60.0 billion caused by the COVID-19 recession. The budget gap was closed through a variety of measures such as use of reserves, federal funding, and cancelled expansions.
The County’s FY 2021 Recommended Budget can be found at:
https://www.suttercounty.org/doc/government/depts/cao/cao_budget
Requests for InformationThe financial report is designed to provide a general overview of the County’s finances for all interested parties. Questions concerning any of the information provided in this reports or requests for additional information should be addressed to Sutter County Auditor-Controller, 463 Second Street, Yuba City, CA 95991. The County’s Comprehensive Annual Financial Report can also be found on the County’s website.

Basic FinancialStatements

26The notes to the financial statements are an integral part of this statement.
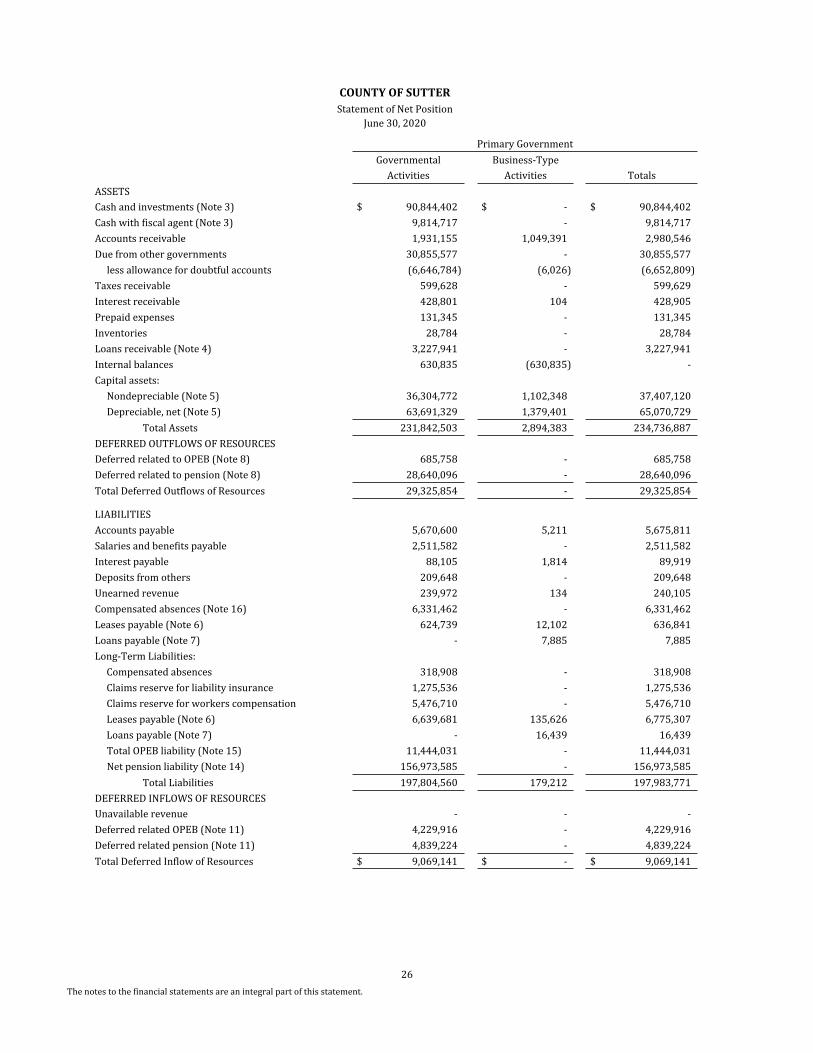
COUNTY OF SUTTERStatement of Net Position
June 30, 2020
Primary GovernmentGovernmental Business-Type
Activities Activities TotalsASSETSCash and investments (Note 3) $ 90,844,402 $ - $ 90,844,402Cash with fiscal agent (Note 3) 9,814,717 - 9,814,717Accounts receivable 1,931,155 1,049,391 2,980,546Due from other governments 30,855,577 - 30,855,577
less allowance for doubtful accounts (6,646,784) (6,026) (6,652,809)Taxes receivable 599,628 - 599,629Interest receivable 428,801 104 428,905Prepaid expenses 131,345 - 131,345Inventories 28,784 - 28,784Loans receivable (Note 4) 3,227,941 - 3,227,941Internal balances 630,835 (630,835) -Capital assets:
Nondepreciable (Note 5) 36,304,772 1,102,348 37,407,120Depreciable, net (Note 5) 63,691,329 1,379,401 65,070,729
Total Assets 231,842,503 2,894,383 234,736,887DEFERRED OUTFLOWS OF RESOURCESDeferred related to OPEB (Note 8) 685,758 - 685,758Deferred related to pension (Note 8) 28,640,096 - 28,640,096Total Deferred Outflows of Resources 29,325,854 - 29,325,854
LIABILITIES Accounts payable 5,670,600 5,211 5,675,811Salaries and benefits payable 2,511,582 - 2,511,582Interest payable 88,105 1,814 89,919Deposits from others 209,648 - 209,648Unearned revenue 239,972 134 240,105Compensated absences (Note 16) 6,331,462 - 6,331,462Leases payable (Note 6) 624,739 12,102 636,841Loans payable (Note 7) - 7,885 7,885Long-Term Liabilities: Compensated absences 318,908 - 318,908 Claims reserve for liability insurance 1,275,536 - 1,275,536 Claims reserve for workers compensation 5,476,710 - 5,476,710 Leases payable (Note 6) 6,639,681 135,626 6,775,307 Loans payable (Note 7) - 16,439 16,439
Total OPEB liability (Note 15) 11,444,031 - 11,444,031Net pension liability (Note 14) 156,973,585 - 156,973,585
Total Liabilities 197,804,560 179,212 197,983,771DEFERRED INFLOWS OF RESOURCESUnavailable revenue - - -Deferred related OPEB (Note 11) 4,229,916 - 4,229,916Deferred related pension (Note 11) 4,839,224 - 4,839,224Total Deferred Inflow of Resources $ 9,069,141 $ - $ 9,069,141
27The notes to the financial statements are an integral part of this statement.
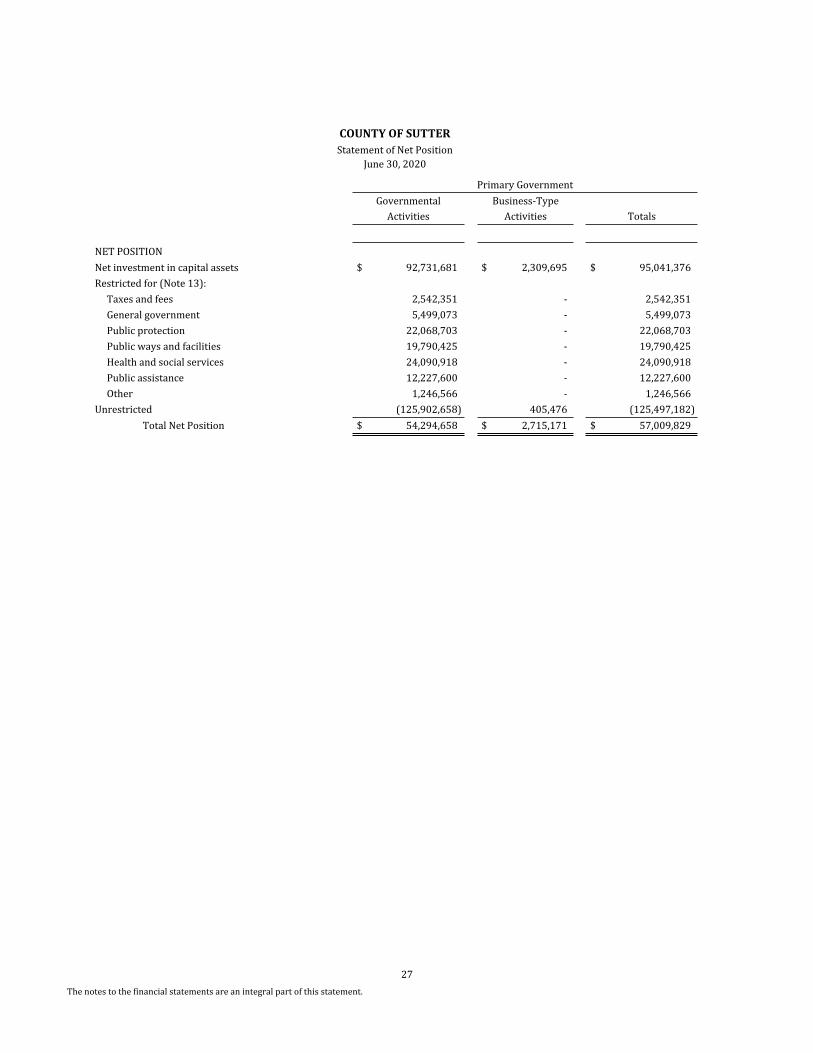
COUNTY OF SUTTERStatement of Net Position
June 30, 2020
Primary GovernmentGovernmental Business-Type
Activities Activities Totals
NET POSITIONNet investment in capital assets $ 92,731,681 $ 2,309,695 $ 95,041,376Restricted for (Note 13):
Taxes and fees 2,542,351 - 2,542,351General government 5,499,073 - 5,499,073Public protection 22,068,703 - 22,068,703Public ways and facilities 19,790,425 - 19,790,425Health and social services 24,090,918 - 24,090,918Public assistance 12,227,600 - 12,227,600Other 1,246,566 - 1,246,566
Unrestricted (125,902,658) 405,476 (125,497,182)Total Net Position $ 54,294,658 $ 2,715,171 $ 57,009,829
28The notes to the financial statements are an integral part of this statement.
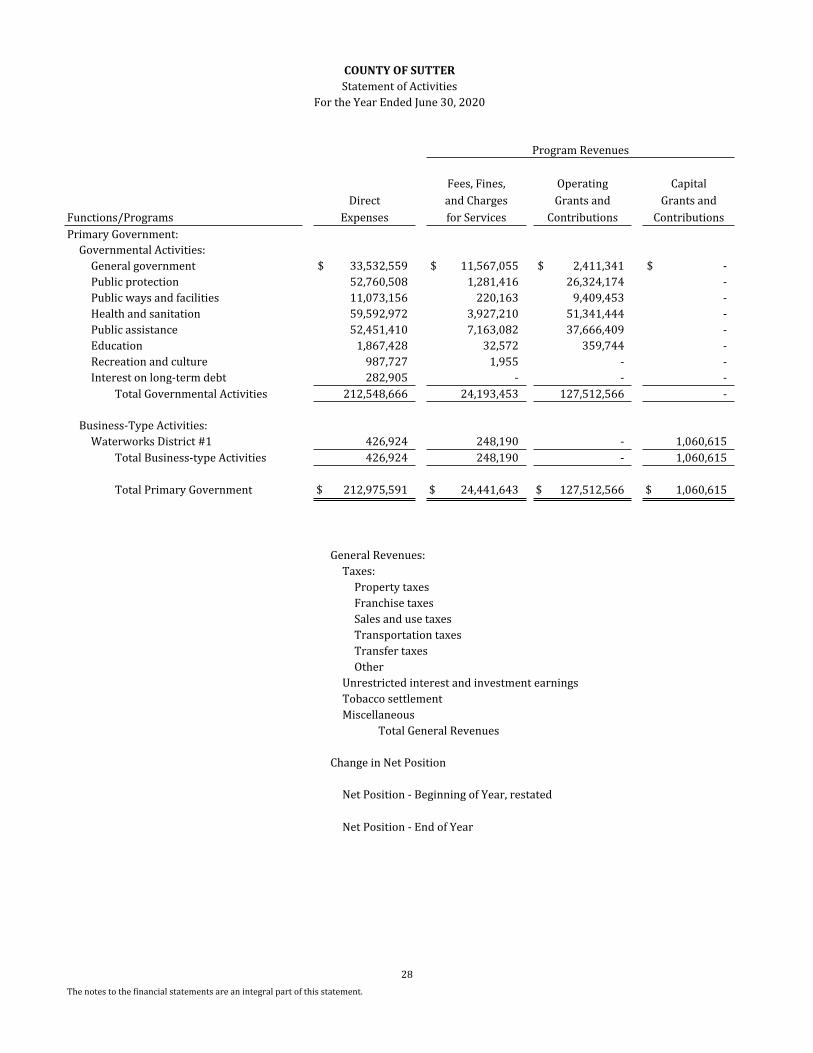
COUNTY OF SUTTERStatement of Activities
For the Year Ended June 30, 2020
Program Revenues
Fees, Fines, Operating CapitalDirect and Charges Grants and Grants and
Functions/Programs Expenses for Services Contributions ContributionsPrimary Government:
Governmental Activities:General government $ 33,532,559 $ 11,567,055 $ 2,411,341 $ -Public protection 52,760,508 1,281,416 26,324,174 -Public ways and facilities 11,073,156 220,163 9,409,453 -Health and sanitation 59,592,972 3,927,210 51,341,444 -Public assistance 52,451,410 7,163,082 37,666,409 -Education 1,867,428 32,572 359,744 -Recreation and culture 987,727 1,955 - -Interest on long-term debt 282,905 - - -
Total Governmental Activities 212,548,666 24,193,453 127,512,566 -
Business-Type Activities:Waterworks District #1 426,924 248,190 - 1,060,615
Total Business-type Activities 426,924 248,190 - 1,060,615
Total Primary Government $ 212,975,591 $ 24,441,643 $ 127,512,566 $ 1,060,615
General Revenues:Taxes:
Property taxesFranchise taxesSales and use taxesTransportation taxesTransfer taxesOther
Unrestricted interest and investment earningsTobacco settlementMiscellaneous
Total General Revenues
Change in Net Position
Net Position - Beginning of Year, restated
Net Position - End of Year
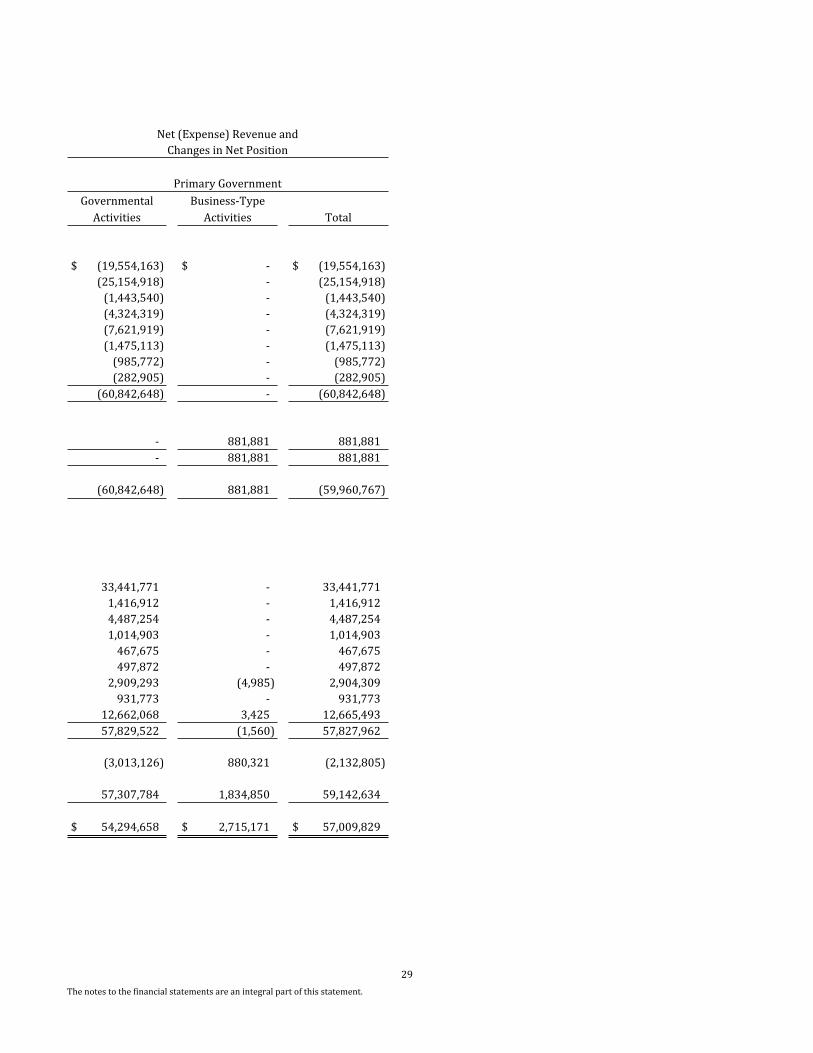
29The notes to the financial statements are an integral part of this statement.
Net (Expense) Revenue andChanges in Net Position
Primary GovernmentGovernmental Business-Type
Activities Activities Total
$ (19,554,163) $ - $ (19,554,163)(25,154,918) - (25,154,918)
(1,443,540) - (1,443,540)(4,324,319) - (4,324,319)(7,621,919) - (7,621,919)(1,475,113) - (1,475,113)
(985,772) - (985,772)(282,905) - (282,905)
(60,842,648) - (60,842,648)
- 881,881 881,881- 881,881 881,881
(60,842,648) 881,881 (59,960,767)
33,441,771 - 33,441,7711,416,912 - 1,416,9124,487,254 - 4,487,2541,014,903 - 1,014,903
467,675 - 467,675497,872 - 497,872
2,909,293 (4,985) 2,904,309931,773 - 931,773
12,662,068 3,425 12,665,49357,829,522 (1,560) 57,827,962
(3,013,126) 880,321 (2,132,805)
57,307,784 1,834,850 59,142,634
$ 54,294,658 $ 2,715,171 $ 57,009,829
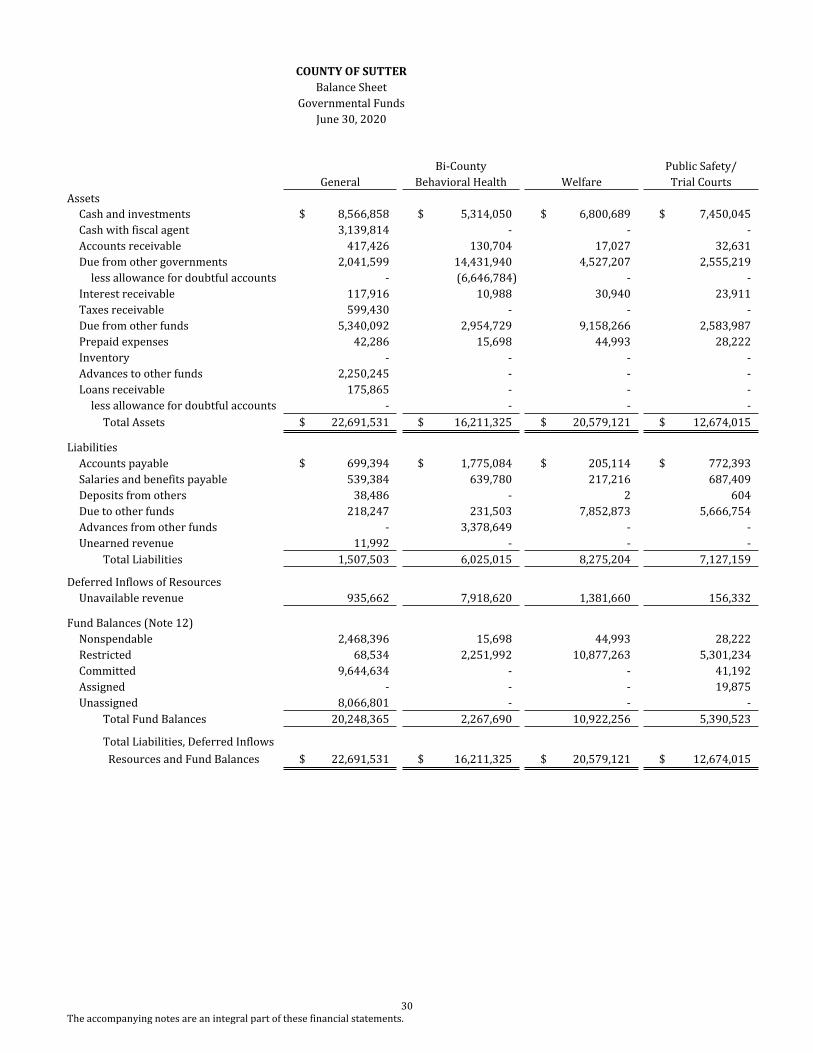
30The accompanying notes are an integral part of these financial statements.
COUNTY OF SUTTERBalance Sheet
Governmental Funds June 30, 2020
Bi-County Public Safety/General Behavioral Health Welfare Trial Courts
AssetsCash and investments $ 8,566,858 $ 5,314,050 $ 6,800,689 $ 7,450,045Cash with fiscal agent 3,139,814 - - -Accounts receivable 417,426 130,704 17,027 32,631Due from other governments 2,041,599 14,431,940 4,527,207 2,555,219
less allowance for doubtful accounts - (6,646,784) - -Interest receivable 117,916 10,988 30,940 23,911Taxes receivable 599,430 - - -Due from other funds 5,340,092 2,954,729 9,158,266 2,583,987Prepaid expenses 42,286 15,698 44,993 28,222Inventory - - - -Advances to other funds 2,250,245 - - -Loans receivable 175,865 - - -
less allowance for doubtful accounts - - - -Total Assets $ 22,691,531 $ 16,211,325 $ 20,579,121 $ 12,674,015
LiabilitiesAccounts payable $ 699,394 $ 1,775,084 $ 205,114 $ 772,393Salaries and benefits payable 539,384 639,780 217,216 687,409Deposits from others 38,486 - 2 604Due to other funds 218,247 231,503 7,852,873 5,666,754Advances from other funds - 3,378,649 - -Unearned revenue 11,992 - - -
Total Liabilities 1,507,503 6,025,015 8,275,204 7,127,159
Deferred Inflows of ResourcesUnavailable revenue 935,662 7,918,620 1,381,660 156,332
Fund Balances (Note 12)Nonspendable 2,468,396 15,698 44,993 28,222Restricted 68,534 2,251,992 10,877,263 5,301,234Committed 9,644,634 - - 41,192Assigned - - - 19,875Unassigned 8,066,801 - - -
Total Fund Balances 20,248,365 2,267,690 10,922,256 5,390,523
Total Liabilities, Deferred Inflows of Resources and Fund Balances $ 22,691,531 $ 16,211,325 $ 20,579,121 $ 12,674,015
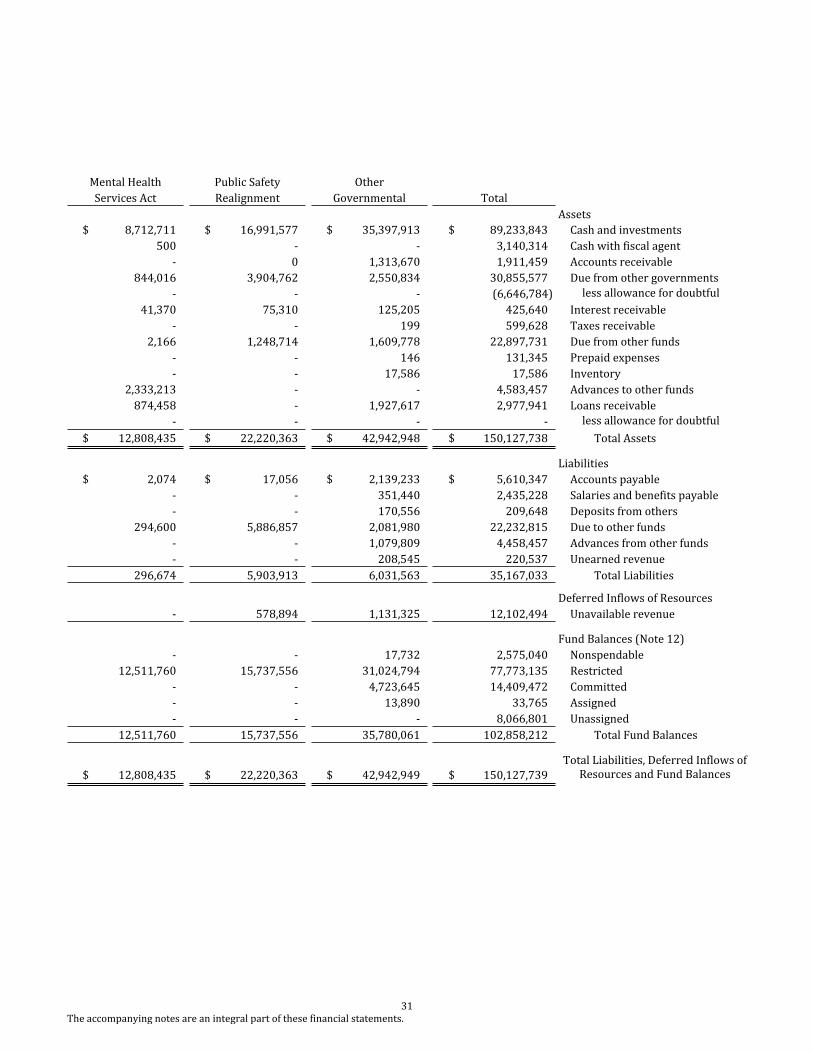
31The accompanying notes are an integral part of these financial statements.
Mental Health Public Safety Other Services Act Realignment Governmental Total
Assets$ 8,712,711 $ 16,991,577 $ 35,397,913 $ 89,233,843 Cash and investments
500 - - 3,140,314 Cash with fiscal agent- 0 1,313,670 1,911,459 Accounts receivable
844,016 3,904,762 2,550,834 30,855,577 Due from other governments- - - (6,646,784) less allowance for doubtful
accounts41,370 75,310 125,205 425,640 Interest receivable- - 199 599,628 Taxes receivable
2,166 1,248,714 1,609,778 22,897,731 Due from other funds- - 146 131,345 Prepaid expenses- - 17,586 17,586 Inventory
2,333,213 - - 4,583,457 Advances to other funds874,458 - 1,927,617 2,977,941 Loans receivable
- - - - less allowance for doubtful accounts$ 12,808,435 $ 22,220,363 $ 42,942,948 $ 150,127,738 Total Assets
Liabilities$ 2,074 $ 17,056 $ 2,139,233 $ 5,610,347 Accounts payable
- - 351,440 2,435,228 Salaries and benefits payable- - 170,556 209,648 Deposits from others
294,600 5,886,857 2,081,980 22,232,815 Due to other funds- - 1,079,809 4,458,457 Advances from other funds- - 208,545 220,537 Unearned revenue
296,674 5,903,913 6,031,563 35,167,033 Total Liabilities
Deferred Inflows of Resources- 578,894 1,131,325 12,102,494 Unavailable revenue
Fund Balances (Note 12)- - 17,732 2,575,040 Nonspendable
12,511,760 15,737,556 31,024,794 77,773,135 Restricted- - 4,723,645 14,409,472 Committed- - 13,890 33,765 Assigned- - - 8,066,801 Unassigned
12,511,760 15,737,556 35,780,061 102,858,212 Total Fund Balances
$ 12,808,435 $ 22,220,363 $ 42,942,949 $ 150,127,739Total Liabilities, Deferred Inflows of
Resources and Fund Balances
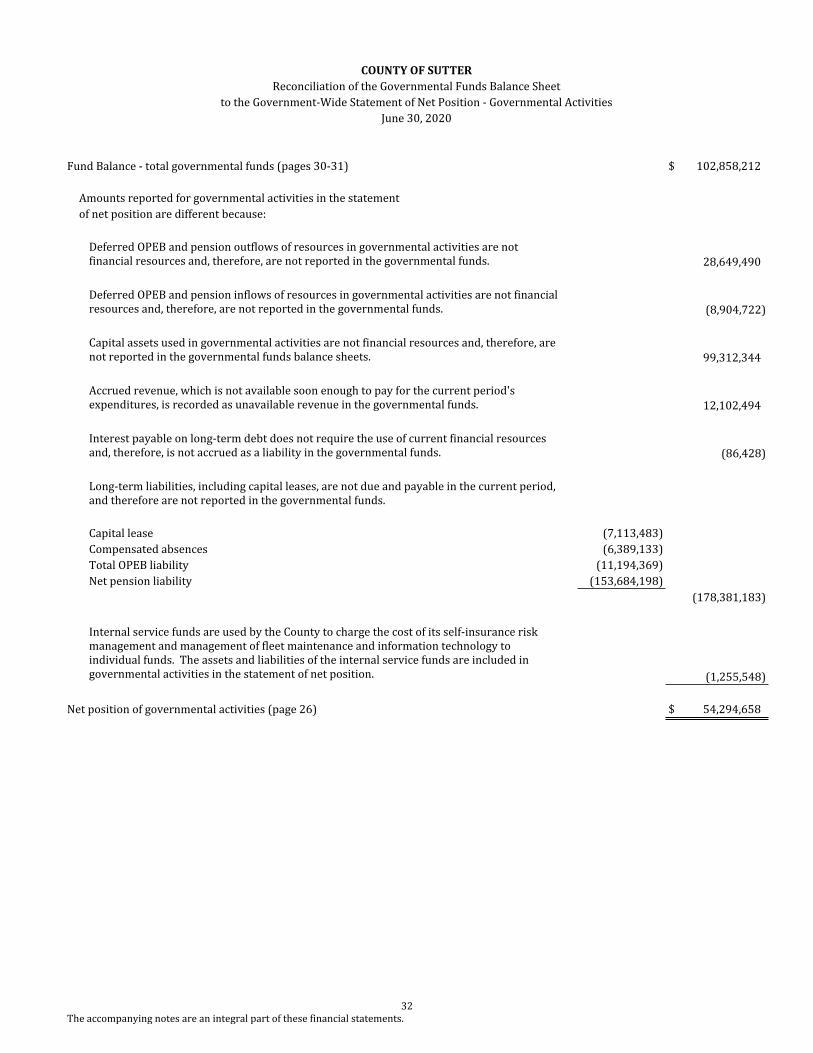
32The accompanying notes are an integral part of these financial statements.
COUNTY OF SUTTERReconciliation of the Governmental Funds Balance Sheet
to the Government-Wide Statement of Net Position - Governmental ActivitiesJune 30, 2020
Fund Balance - total governmental funds (pages 30-31) $ 102,858,212
Amounts reported for governmental activities in the statementof net position are different because:
Deferred OPEB and pension outflows of resources in governmental activities are not financial resources and, therefore, are not reported in the governmental funds. 28,649,490
Deferred OPEB and pension inflows of resources in governmental activities are not financial resources and, therefore, are not reported in the governmental funds. (8,904,722)
Capital assets used in governmental activities are not financial resources and, therefore, are not reported in the governmental funds balance sheets. 99,312,344
Accrued revenue, which is not available soon enough to pay for the current period's expenditures, is recorded as unavailable revenue in the governmental funds. 12,102,494
Interest payable on long-term debt does not require the use of current financial resources and, therefore, is not accrued as a liability in the governmental funds. (86,428)
Long-term liabilities, including capital leases, are not due and payable in the current period, and therefore are not reported in the governmental funds.
Capital lease (7,113,483)Compensated absences (6,389,133)Total OPEB liability (11,194,369)Net pension liability (153,684,198)
(178,381,183)
Internal service funds are used by the County to charge the cost of its self-insurance risk management and management of fleet maintenance and information technology to individual funds. The assets and liabilities of the internal service funds are included in governmental activities in the statement of net position. (1,255,548)
Net position of governmental activities (page 26) $ 54,294,658

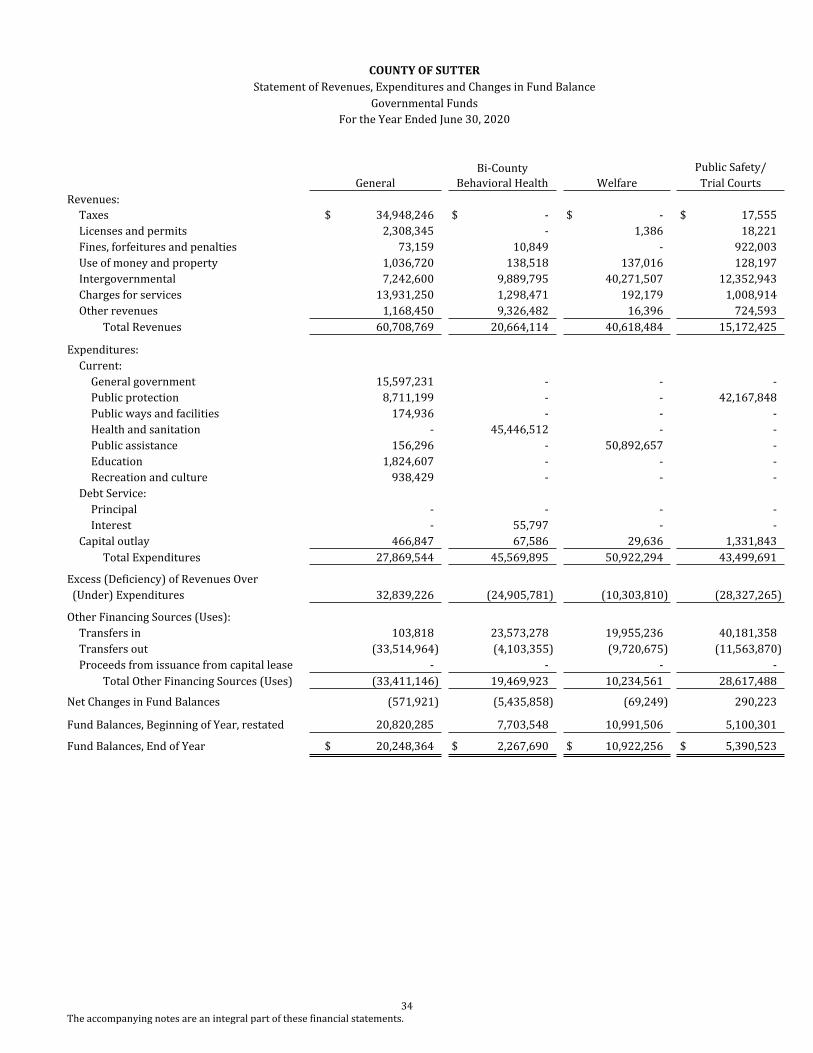
34The accompanying notes are an integral part of these financial statements.
COUNTY OF SUTTERStatement of Revenues, Expenditures and Changes in Fund Balance
Governmental Funds For the Year Ended June 30, 2020
Bi-County Public Safety/General Behavioral Health Welfare Trial Courts
Revenues:Taxes $ 34,948,246 $ - $ - $ 17,555Licenses and permits 2,308,345 - 1,386 18,221Fines, forfeitures and penalties 73,159 10,849 - 922,003Use of money and property 1,036,720 138,518 137,016 128,197Intergovernmental 7,242,600 9,889,795 40,271,507 12,352,943Charges for services 13,931,250 1,298,471 192,179 1,008,914Other revenues 1,168,450 9,326,482 16,396 724,593
Total Revenues 60,708,769 20,664,114 40,618,484 15,172,425
Expenditures:Current:
General government 15,597,231 - - -Public protection 8,711,199 - - 42,167,848Public ways and facilities 174,936 - - -Health and sanitation - 45,446,512 - -Public assistance 156,296 - 50,892,657 -Education 1,824,607 - - -Recreation and culture 938,429 - - -
Debt Service:Principal - - - -Interest - 55,797 - -
Capital outlay 466,847 67,586 29,636 1,331,843Total Expenditures 27,869,544 45,569,895 50,922,294 43,499,691
Excess (Deficiency) of Revenues Over (Under) Expenditures 32,839,226 (24,905,781) (10,303,810) (28,327,265)
Other Financing Sources (Uses):Transfers in 103,818 23,573,278 19,955,236 40,181,358Transfers out (33,514,964) (4,103,355) (9,720,675) (11,563,870)Proceeds from issuance from capital lease - - - -
Total Other Financing Sources (Uses) (33,411,146) 19,469,923 10,234,561 28,617,488
Net Changes in Fund Balances (571,921) (5,435,858) (69,249) 290,223
Fund Balances, Beginning of Year, restated 20,820,285 7,703,548 10,991,506 5,100,301
Fund Balances, End of Year $ 20,248,364 $ 2,267,690 $ 10,922,256 $ 5,390,523
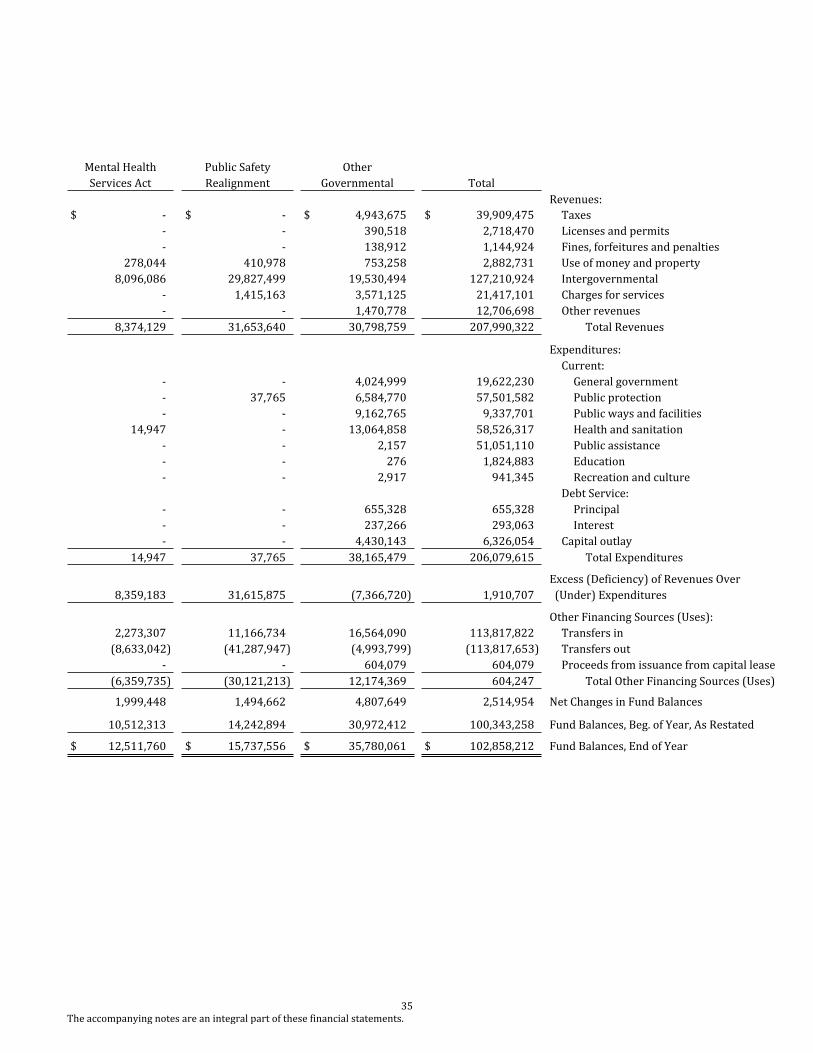
35The accompanying notes are an integral part of these financial statements.
Mental Health Public Safety Other Services Act Realignment Governmental Total
Revenues:$ - $ - $ 4,943,675 $ 39,909,475 Taxes
- - 390,518 2,718,470 Licenses and permits- - 138,912 1,144,924 Fines, forfeitures and penalties
278,044 410,978 753,258 2,882,731 Use of money and property8,096,086 29,827,499 19,530,494 127,210,924 Intergovernmental
- 1,415,163 3,571,125 21,417,101 Charges for services- - 1,470,778 12,706,698 Other revenues
8,374,129 31,653,640 30,798,759 207,990,322 Total Revenues
Expenditures:Current:
- - 4,024,999 19,622,230 General government- 37,765 6,584,770 57,501,582 Public protection- - 9,162,765 9,337,701 Public ways and facilities
14,947 - 13,064,858 58,526,317 Health and sanitation- - 2,157 51,051,110 Public assistance- - 276 1,824,883 Education- - 2,917 941,345 Recreation and culture
Debt Service:- - 655,328 655,328 Principal - - 237,266 293,063 Interest- - 4,430,143 6,326,054 Capital outlay
14,947 37,765 38,165,479 206,079,615 Total Expenditures
Excess (Deficiency) of Revenues Over8,359,183 31,615,875 (7,366,720) 1,910,707 (Under) Expenditures
Other Financing Sources (Uses):2,273,307 11,166,734 16,564,090 113,817,822 Transfers in
(8,633,042) (41,287,947) (4,993,799) (113,817,653) Transfers out- - 604,079 604,079 Proceeds from issuance from capital lease
(6,359,735) (30,121,213) 12,174,369 604,247 Total Other Financing Sources (Uses)
1,999,448 1,494,662 4,807,649 2,514,954 Net Changes in Fund Balances
10,512,313 14,242,894 30,972,412 100,343,258 Fund Balances, Beg. of Year, As Restated
$ 12,511,760 $ 15,737,556 $ 35,780,061 $ 102,858,212 Fund Balances, End of Year
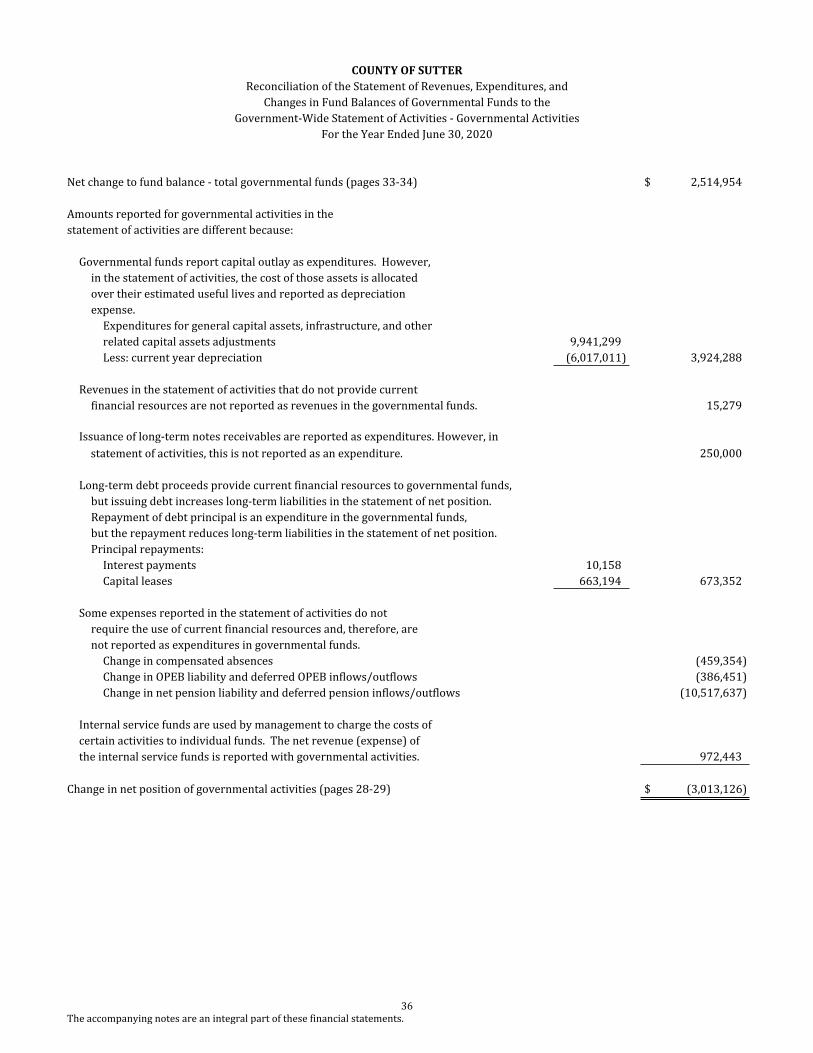
36The accompanying notes are an integral part of these financial statements.
COUNTY OF SUTTERReconciliation of the Statement of Revenues, Expenditures, and
Changes in Fund Balances of Governmental Funds to theGovernment-Wide Statement of Activities - Governmental Activities
For the Year Ended June 30, 2020
Net change to fund balance - total governmental funds (pages 33-34) $ 2,514,954
Amounts reported for governmental activities in thestatement of activities are different because:
Governmental funds report capital outlay as expenditures. However,in the statement of activities, the cost of those assets is allocated over their estimated useful lives and reported as depreciationexpense.
Expenditures for general capital assets, infrastructure, and otherrelated capital assets adjustments 9,941,299Less: current year depreciation (6,017,011) 3,924,288
Revenues in the statement of activities that do not provide currentfinancial resources are not reported as revenues in the governmental funds. 15,279
Issuance of long-term notes receivables are reported as expenditures. However, in the statement of activities, this is not reported as an expenditure. 250,000
Long-term debt proceeds provide current financial resources to governmental funds,but issuing debt increases long-term liabilities in the statement of net position.Repayment of debt principal is an expenditure in the governmental funds,but the repayment reduces long-term liabilities in the statement of net position.Principal repayments:
Interest payments 10,158Capital leases 663,194 673,352
Some expenses reported in the statement of activities do notrequire the use of current financial resources and, therefore, arenot reported as expenditures in governmental funds.
Change in compensated absences (459,354)Change in OPEB liability and deferred OPEB inflows/outflows (386,451)Change in net pension liability and deferred pension inflows/outflows (10,517,637)
Internal service funds are used by management to charge the costs ofcertain activities to individual funds. The net revenue (expense) ofthe internal service funds is reported with governmental activities. 972,443
Change in net position of governmental activities (pages 28-29) $ (3,013,126)
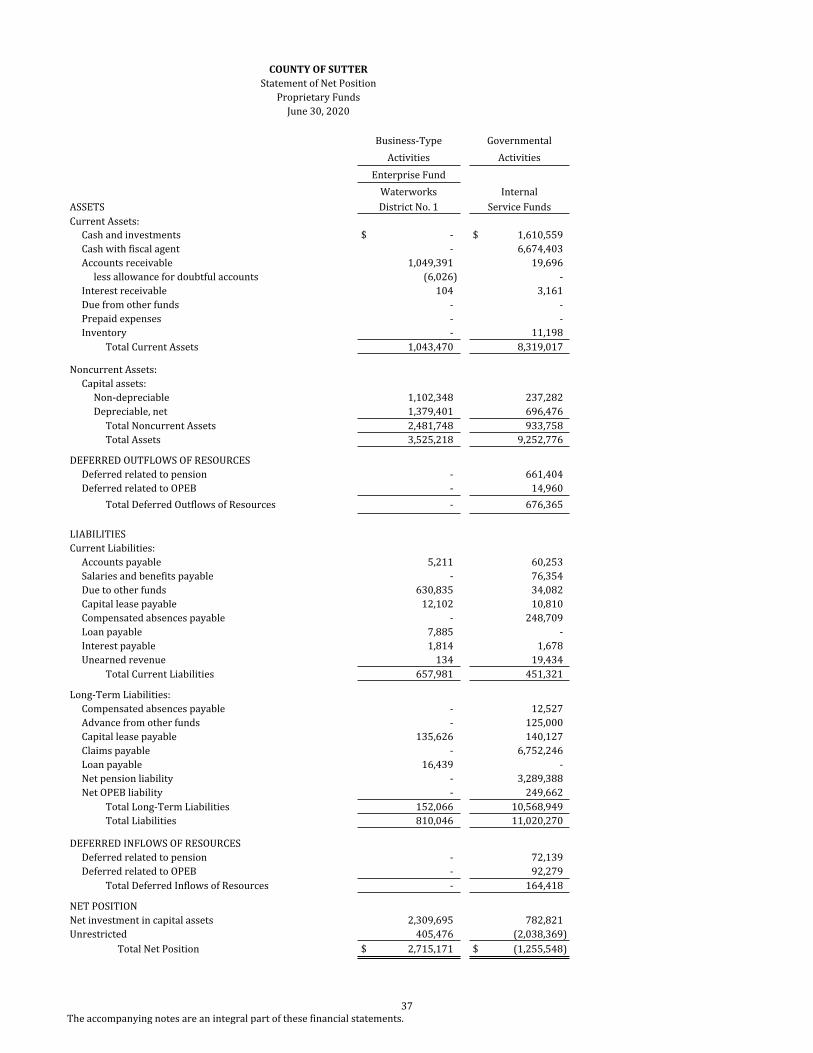
37The accompanying notes are an integral part of these financial statements.
COUNTY OF SUTTERStatement of Net Position
Proprietary FundsJune 30, 2020
Business-Type GovernmentalActivities Activities
Enterprise FundWaterworks Internal
ASSETS District No. 1 Service FundsCurrent Assets:
Cash and investments $ - $ 1,610,559Cash with fiscal agent - 6,674,403Accounts receivable 1,049,391 19,696
less allowance for doubtful accounts (6,026) -Interest receivable 104 3,161Due from other funds - -Prepaid expenses - -Inventory - 11,198
Total Current Assets 1,043,470 8,319,017
Noncurrent Assets:Capital assets:
Non-depreciable 1,102,348 237,282Depreciable, net 1,379,401 696,476
Total Noncurrent Assets 2,481,748 933,758Total Assets 3,525,218 9,252,776
DEFERRED OUTFLOWS OF RESOURCESDeferred related to pension - 661,404Deferred related to OPEB - 14,960
Total Deferred Outflows of Resources - 676,365
LIABILITIES Current Liabilities:
Accounts payable 5,211 60,253Salaries and benefits payable - 76,354Due to other funds 630,835 34,082Capital lease payable 12,102 10,810Compensated absences payable - 248,709Loan payable 7,885 -Interest payable 1,814 1,678Unearned revenue 134 19,434
Total Current Liabilities 657,981 451,321
Long-Term Liabilities:Compensated absences payable - 12,527Advance from other funds - 125,000Capital lease payable 135,626 140,127Claims payable - 6,752,246Loan payable 16,439 -Net pension liability - 3,289,388Net OPEB liability - 249,662
Total Long-Term Liabilities 152,066 10,568,949Total Liabilities 810,046 11,020,270
DEFERRED INFLOWS OF RESOURCESDeferred related to pension - 72,139Deferred related to OPEB - 92,279
Total Deferred Inflows of Resources - 164,418
NET POSITIONNet investment in capital assets 2,309,695 782,821Unrestricted 405,476 (2,038,369)
Total Net Position $ 2,715,171 $ (1,255,548)
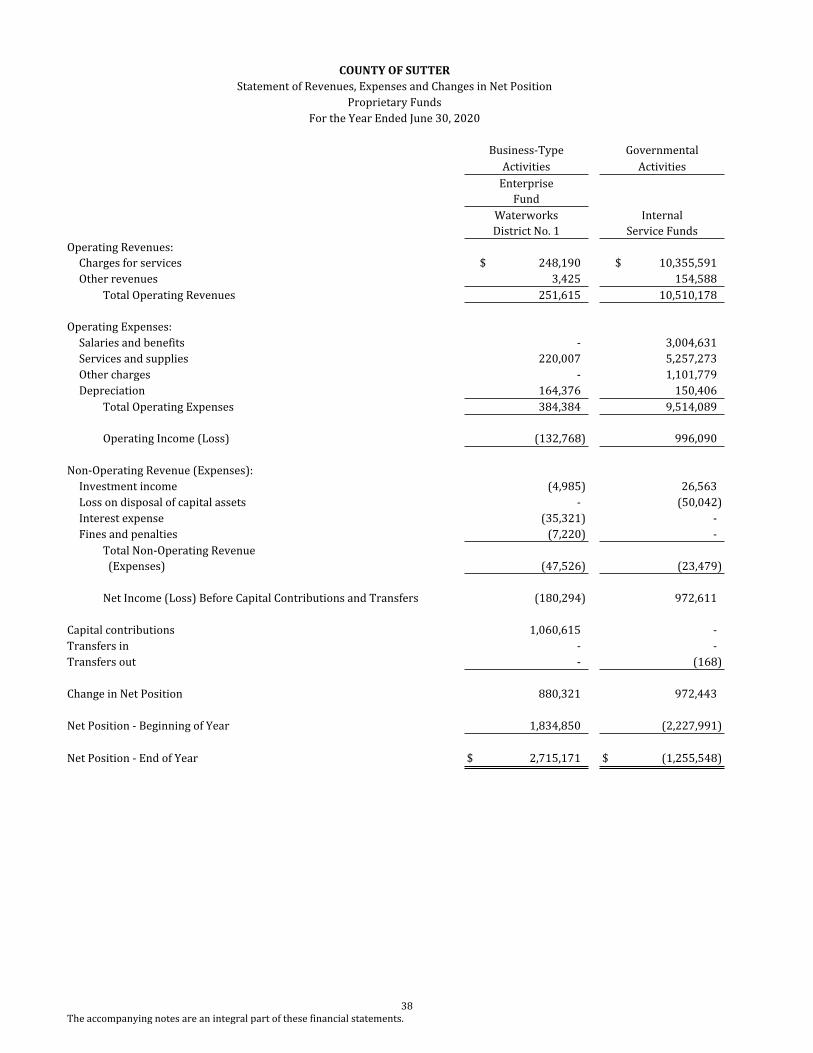
38The accompanying notes are an integral part of these financial statements.
COUNTY OF SUTTERStatement of Revenues, Expenses and Changes in Net Position
Proprietary FundsFor the Year Ended June 30, 2020
Business-Type GovernmentalActivities Activities
EnterpriseFund
Waterworks InternalDistrict No. 1 Service Funds
Operating Revenues:Charges for services $ 248,190 $ 10,355,591Other revenues 3,425 154,588
Total Operating Revenues 251,615 10,510,178
Operating Expenses:Salaries and benefits - 3,004,631Services and supplies 220,007 5,257,273Other charges - 1,101,779Depreciation 164,376 150,406
Total Operating Expenses 384,384 9,514,089
Operating Income (Loss) (132,768) 996,090
Non-Operating Revenue (Expenses):Investment income (4,985) 26,563Loss on disposal of capital assets - (50,042)Interest expense (35,321) -Fines and penalties (7,220) -
Total Non-Operating Revenue (Expenses) (47,526) (23,479)
Net Income (Loss) Before Capital Contributions and Transfers (180,294) 972,611
Capital contributions 1,060,615 -Transfers in - -Transfers out - (168)
Change in Net Position 880,321 972,443
Net Position - Beginning of Year 1,834,850 (2,227,991)
Net Position - End of Year $ 2,715,171 $ (1,255,548)
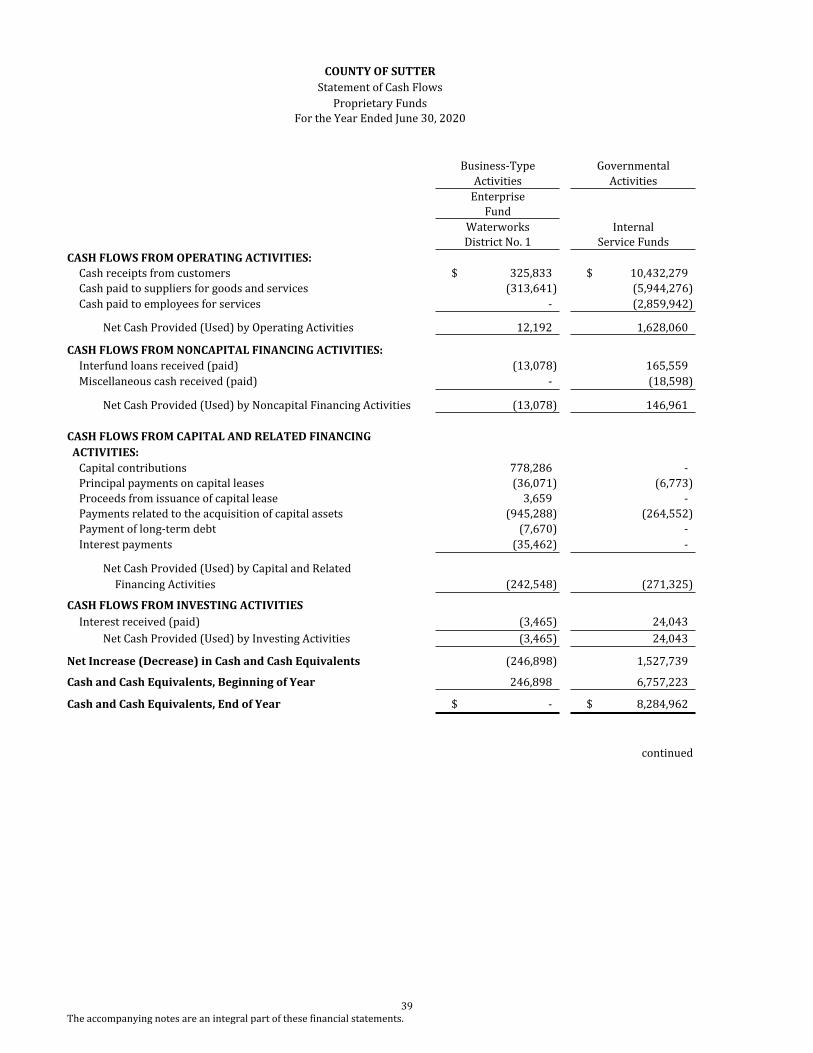
39The accompanying notes are an integral part of these financial statements.
COUNTY OF SUTTERStatement of Cash Flows
Proprietary FundsFor the Year Ended June 30, 2020
Business-Type GovernmentalActivities Activities
EnterpriseFund
Waterworks InternalDistrict No. 1 Service Funds
CASH FLOWS FROM OPERATING ACTIVITIES:Cash receipts from customers $ 325,833 $ 10,432,279Cash paid to suppliers for goods and services (313,641) (5,944,276)Cash paid to employees for services - (2,859,942)
Net Cash Provided (Used) by Operating Activities 12,192 1,628,060
CASH FLOWS FROM NONCAPITAL FINANCING ACTIVITIES:Interfund loans received (paid) (13,078) 165,559Miscellaneous cash received (paid) - (18,598)
Net Cash Provided (Used) by Noncapital Financing Activities (13,078) 146,961
CASH FLOWS FROM CAPITAL AND RELATED FINANCING ACTIVITIES:
Capital contributions 778,286 -Principal payments on capital leases (36,071) (6,773)Proceeds from issuance of capital lease 3,659 -Payments related to the acquisition of capital assets (945,288) (264,552)Payment of long-term debt (7,670) -Interest payments (35,462) -
Net Cash Provided (Used) by Capital and RelatedFinancing Activities (242,548) (271,325)
CASH FLOWS FROM INVESTING ACTIVITIESInterest received (paid) (3,465) 24,043
Net Cash Provided (Used) by Investing Activities (3,465) 24,043
Net Increase (Decrease) in Cash and Cash Equivalents (246,898) 1,527,739
Cash and Cash Equivalents, Beginning of Year 246,898 6,757,223
Cash and Cash Equivalents, End of Year $ - $ 8,284,962
continued
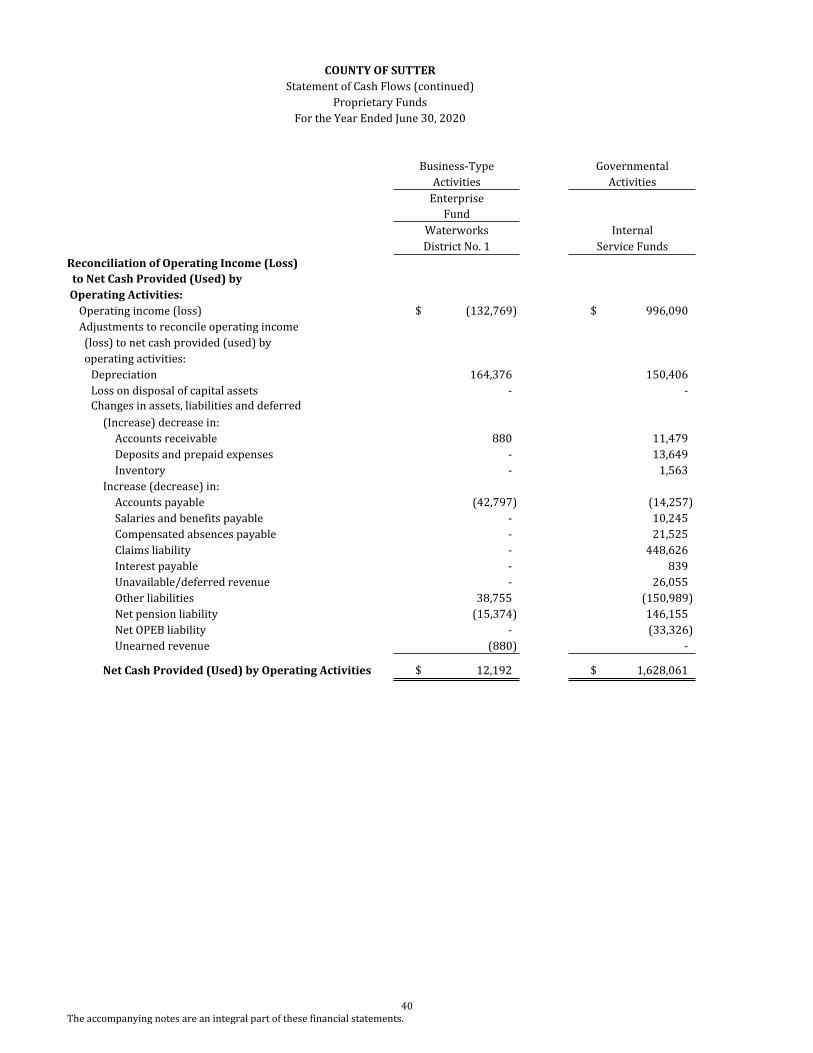
40The accompanying notes are an integral part of these financial statements.
COUNTY OF SUTTERStatement of Cash Flows (continued)
Proprietary FundsFor the Year Ended June 30, 2020
Business-Type GovernmentalActivities Activities
EnterpriseFund
Waterworks InternalDistrict No. 1 Service Funds
Reconciliation of Operating Income (Loss) to Net Cash Provided (Used) by Operating Activities:
Operating income (loss) $ (132,769) $ 996,090Adjustments to reconcile operating income (loss) to net cash provided (used) by operating activities:
Depreciation 164,376 150,406Loss on disposal of capital assets - -Changes in assets, liabilities and deferred inflows/outflows:(Increase) decrease in:
Accounts receivable 880 11,479Deposits and prepaid expenses - 13,649Inventory - 1,563
Increase (decrease) in:Accounts payable (42,797) (14,257)Salaries and benefits payable - 10,245Compensated absences payable - 21,525Claims liability - 448,626Interest payable - 839Unavailable/deferred revenue - 26,055Other liabilities 38,755 (150,989)Net pension liability (15,374) 146,155Net OPEB liability - (33,326)Unearned revenue (880) -
Net Cash Provided (Used) by Operating Activities $ 12,192 $ 1,628,061
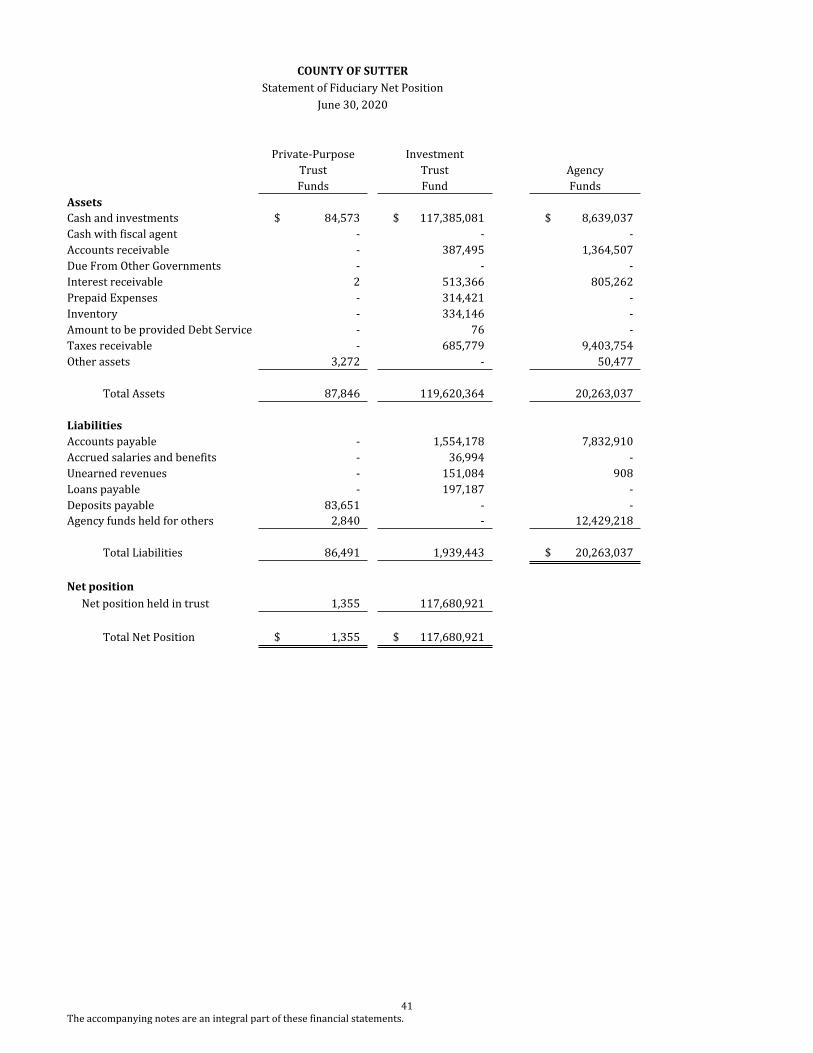
41The accompanying notes are an integral part of these financial statements.
COUNTY OF SUTTERStatement of Fiduciary Net Position
June 30, 2020
Private-Purpose InvestmentTrust Trust AgencyFunds Fund Funds
AssetsCash and investments $ 84,573 $ 117,385,081 $ 8,639,037Cash with fiscal agent - - -Accounts receivable - 387,495 1,364,507Due From Other Governments - - -Interest receivable 2 513,366 805,262Prepaid Expenses - 314,421 -Inventory - 334,146 -Amount to be provided Debt Service - 76 -Taxes receivable - 685,779 9,403,754Other assets 3,272 - 50,477
Total Assets 87,846 119,620,364 20,263,037
LiabilitiesAccounts payable - 1,554,178 7,832,910Accrued salaries and benefits - 36,994 -Unearned revenues - 151,084 908Loans payable - 197,187 -Deposits payable 83,651 - -Agency funds held for others 2,840 - 12,429,218
Total Liabilities 86,491 1,939,443 $ 20,263,037
Net position Net position held in trust 1,355 117,680,921
Total Net Position $ 1,355 $ 117,680,921
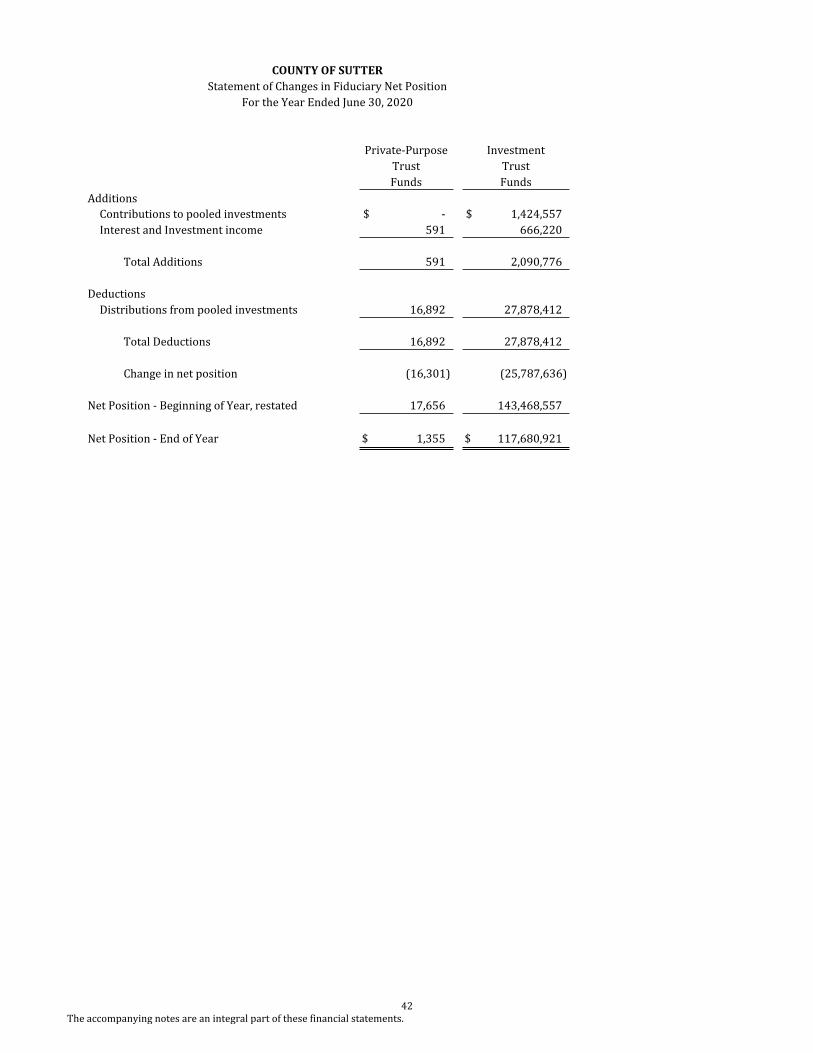
42The accompanying notes are an integral part of these financial statements.
COUNTY OF SUTTERStatement of Changes in Fiduciary Net Position
For the Year Ended June 30, 2020
Private-Purpose InvestmentTrust TrustFunds Funds
AdditionsContributions to pooled investments $ - $ 1,424,557Interest and Investment income 591 666,220
Total Additions 591 2,090,776
DeductionsDistributions from pooled investments 16,892 27,878,412
Total Deductions 16,892 27,878,412
Change in net position (16,301) (25,787,636)
Net Position - Beginning of Year, restated 17,656 143,468,557
Net Position - End of Year $ 1,355 $ 117,680,921


Notes to the Financial Statements

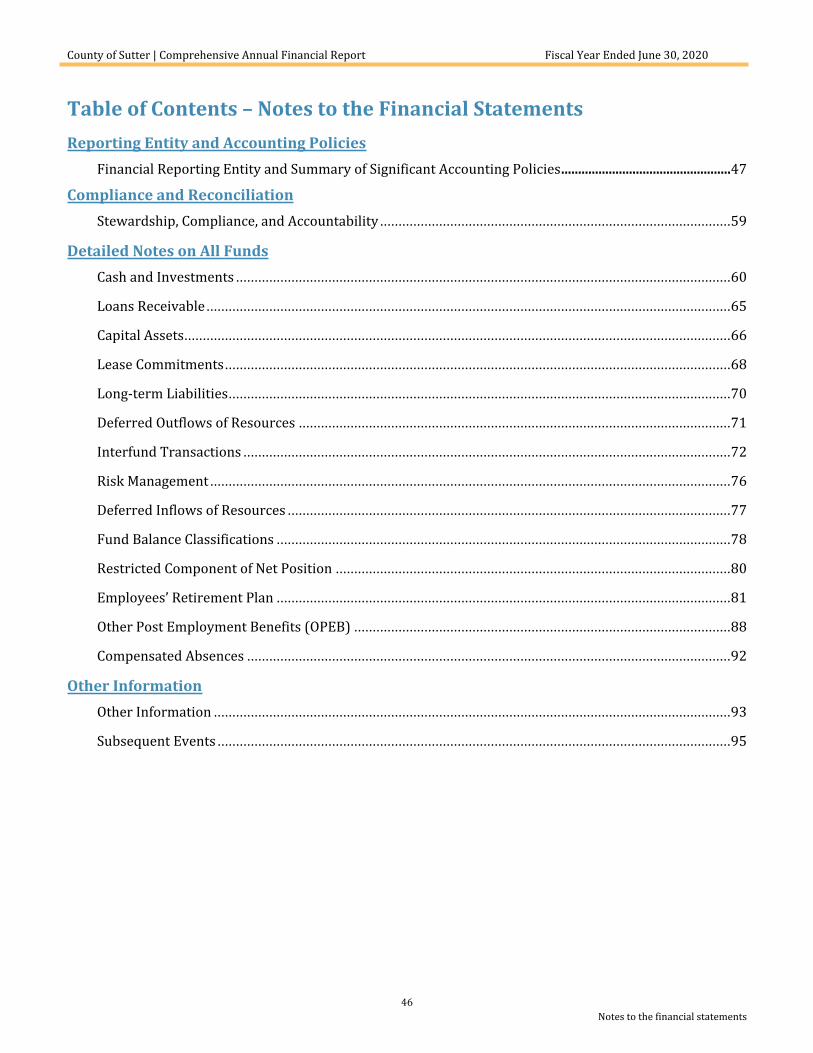
County of Sutter | Comprehensive Annual Financial Report Fiscal Year Ended June 30, 2020
46Notes to the financial statements
Table of Contents – Notes to the Financial StatementsReporting Entity and Accounting Policies
Financial Reporting Entity and Summary of Significant Accounting Policies..................................................47
Compliance and ReconciliationStewardship, Compliance, and Accountability ...............................................................................................59
Detailed Notes on All FundsCash and Investments ......................................................................................................................................60
Loans Receivable ..............................................................................................................................................65
Capital Assets....................................................................................................................................................66
Lease Commitments.........................................................................................................................................68
Long-term Liabilities........................................................................................................................................70
Deferred Outflows of Resources .....................................................................................................................71
Interfund Transactions ....................................................................................................................................72
Risk Management .............................................................................................................................................76
Deferred Inflows of Resources ........................................................................................................................77
Fund Balance Classifications ...........................................................................................................................78
Restricted Component of Net Position ...........................................................................................................80
Employees’ Retirement Plan ...........................................................................................................................81
Other Post Employment Benefits (OPEB) ......................................................................................................88
Compensated Absences ...................................................................................................................................92
Other InformationOther Information ............................................................................................................................................93
Subsequent Events ...........................................................................................................................................95
County of Sutter | Comprehensive Annual Financial Report Fiscal Year Ended June 30, 2020
47Notes to the financial statements
1. FINANCIAL REPORTING ENTITY AND SUMMARY OF SIGNIFICANT ACCOUNTING POLICES
Reporting Entity
The County operates under an Administrator-Board of Supervisors form of government and provides various services on a countywide basis including public safety, highway and streets, sanitation, health and social services, culture-recreation, public improvements, planning and zoning, and general administrative services.
The County defines its reporting entity in accordance with accounting principles generally accepted in the United States of America (GAAP), which provides guidance for determining which governmental activities, organizations and functions should be included in the reporting entity. The accompanying financial statements present information on the activities of the reporting entity, including all fund types of the County (the primary government) and its component units.
Reporting for component units on the County’s financial statements can be blended or discretely presented. Blended component units; although legally separate entities, are in substance part of the County’s operations and, therefore, data from these units is combined with data of the primary government. Discretely presented component units, on the other hand, would be reported in a separate column in the government-wide financial statements to emphasize it is legally separate from the government.
For financial reporting purposes, the County’s basic financial statements include all financial activities of the following special districts as blended component units because their Board of Directors is composed of the same members as the County’s board. These component units have not issued separate financial statements.
Discretely Presented Component Units
There are no component units of the county which meet the criteria for discrete presentation.
Blended Component Units
The blended component units’ governing bodies are substantially the same as the governing body of the primary government. Component units that are blended into the reporting activity types of the County’s report are presented below:
Special Assessment Districts – The assessment districts are separate legal entities formed to provide various services within the County.
Lighting Districts – The lighting districts are separate legal entities formed to provide lighting services within the County.
Landscape Districts – The landscape districts are separate legal entities formed to provide landscape services within the County.
The accompanying financial statements include an Investment Trust Fund that holds assets of numerous self-governed school and special districts for which the County Treasurer-Tax Collector acts as custodian. The financial
County of Sutter | Comprehensive Annual Financial Report Fiscal Year Ended June 30, 2020
48Notes to the financial statements
reporting for these governmental entities, which are independent of the County, is limited to the total amount of cash and investments, and other assets, and the related fiduciary responsibility of the County for disbursement of these assets. The County Auditor-Controller makes disbursements upon the request of the special district officers. Activities of the school and special districts are administered by separate boards and are independent of the County Board of Supervisors. The County Board of Supervisors has no effective authority to govern, manage, approve budgets, assume financial accountability, establish revenue limits, or to appropriate surplus funds available in these entities. Sutter County Schools do not issue independent audited financial statements but report directly to the California Department of Education. The individual Sutter County Special Districts do have independent audited financial statements. Individuals interested in obtaining a copy of a district’s report should contact the district directly.
The accompanying financial statements also include six different private purpose trust funds. These funds are mostly comprised of monies held on behalf of citizens by order of the courts until such time the courts release the monies. The County Board of Supervisors has no effective authority to govern, manage, assume financial accountability, or to appropriate surplus funds available in these entities.
New Accounting Pronouncements
The following Governmental Accounting Standards Board (GASB) Statements have been implemented in the current financial statements:
Statement No. 88Certain Disclosures Related to Debt, Including Direct Borrowings and Direct Placements
This statement defines debt for purposes of disclosure in notes to financial statements as a liability that arises from a contractual obligation to pay cash or other assets that may be used in lieu of cash in one or more payments to settle an amount that is fixed at the date the contractual obligation is established. This statement requires that additional essential information related to debt be disclosed in notes to financial statements, including unused lines of credit; assets pledged as collateral for the debt; and terms specified in debt agreements related to significant events of default with finance-related consequences, significant termination events with finance-related consequences, and significant subjective acceleration clauses. This statement defines direct borrowings and direct placements as having terms negotiated directly with the investor or lender and are not offered for public sale. For notes to financial statements related to debt, this statement also requires that existing and additional information be provided for direct borrowings and direct placements of debt separately from other debt.
Statement No. 95Postponement of the Effective Dates of Certain Authoritative Guidance
This Statement extends the effective dates of certain accounting and financial reporting provisions in Statements and Implementation Guides that were first effective for reporting periods beginning after June 15, 2018. The requirements of this Statement apply to the financial statements of all state and local governments.
County of Sutter | Comprehensive Annual Financial Report Fiscal Year Ended June 30, 2020
49Notes to the financial statements
Financial Statements
In accordance with GASB Statement No. 34, “Basic Financial Statements and Management’s Discussion and Analysis for State and Local Governments,” the financial statements consist of the following:
Government-wide financial statements, Fund financial statements, and Notes to the financial statements.
Government-wide Financial Statements
The government-wide financial statements consist of the Statement of Net Position and the Statement of Activities and report information on all of the nonfiduciary activities of the primary government and its component units. Generally, the effect of interfund intra-function activity has been eliminated from the government-wide financial statements. All internal balances in the Statement of Net Position that have been eliminated, except for those representing balances between the governmental activities and the business-type activities, are presented as internal balances and eliminated in the total government column.
The Statement of Activities presents functional revenue and expenses of governmental activities and business-type activities. Governmental activities, which normally are supported by taxes and intergovernmental revenues, are reported separately from business-type activities, which rely to a significant extent on fees and charges for support. In the Statement of Activities, internal service funds’ revenue and expenses related to interfund services have been eliminated. Revenue and expenses related to services provided to external customers have not been eliminated and are presented within governmental activities.
The government-wide financial statements distinguish functions of the County that are principally supported by taxes and intergovernmental revenues (governmental activities) from other functions that are intended to recover all or a significant portion of their costs through user fees and charges (business-type activities). The governmental activities of the County include general government, public protection, public ways and facilities, health and sanitation, public assistance, education, and recreation and culture. The business-type activities of the County include water and sewer services of the Robbins community.
The Statement of Activities presents a comparison between direct expenses and program revenues for each different identifiable activity of the County’s business-type activities and for each function of the County’s governmental activities. Direct expenses are those that are specifically associated with a program or function and; therefore, are clearly identifiable to a particular function. Program revenues include 1) charges paid by the recipients of goods and services offered by the program and 2) grants and contributions that are restricted to meeting the operational or capital requirements of a particular program. Revenues that are not classified as program revenues, including all taxes, are presented instead as general revenues.
Fund Financial Statements
Fund financial statements of the reporting entity are organized into funds, each of which is considered to be separate accounting entities. Each fund is accounted for by providing a separate set of self-balancing accounts that constitute its assets, liabilities, fund equity, revenues, and expenditures/expenses. Funds are organized into three major categories: governmental, proprietary, and fiduciary. An emphasis is placed on major funds within the governmental and proprietary categories. A fund is considered major if it is the primary operating fund of the county of meets the following criteria:
County of Sutter | Comprehensive Annual Financial Report Fiscal Year Ended June 30, 2020
50Notes to the financial statements
Total assets, liabilities, revenues or expenditures/expenses of that individual governmental fund or enterprise fund are at least 10% of the corresponding total for all funds of that category or type; and
Total assets, liabilities, revenues or expenditures/expenses of the individual governmental fund or enterprise fund are at least 5% of the corresponding total for all governmental and enterprise funds combined.
Basis of Accounting and Measurement Focus
The government-wide and proprietary fund financial statements are reported using the economic resources measurement focus and the accrual basis of accounting. Revenues are recorded when earned and expenses are recorded at the time liabilities are incurred, regardless of when the related cash flows take place. Nonexchange transactions, in which the County gives (or receives) value without directly receiving (or giving) equal value in exchange, include property and sales tax, grants, entitlements, and donations. On an accrual basis, revenue from property taxes is recognized in the fiscal year for which the taxes are levied. Revenues from sales tax are recognized when the underlying transactions take place. Revenues from grants, entitlements, and donations are recognized in the fiscal year in which all eligibility requirements have been satisfied.
Governmental funds are reported using the current financial resources measurement focus and the modified accrual basis of accounting. Under this method, revenues are recognized when measurable and available. Property and sales taxes, interest, certain state and federal grants, and charges for services are accrued when their receipt occurs within sixty days after the end of the accounting period so as to be both measurable and available. Expenditures are generally recorded when a liability is incurred, as under accrual accounting. However, debt service expenditures as well as expenditures related to claims and judgments are recorded only when payment is due. General capital acquisitions are reported as expenditures in governmental funds. Proceeds of general long-term debt and capital leases are reported as other financing sources.
For the governmental funds financial statements, the County considers all revenues susceptible to accrual and recognizes revenue if the accrual criteria are met. Specifically, sales taxes, franchise taxes, licenses, interest, special assessments, charges for services and other miscellaneous revenue are all considered to be susceptible to accrual, and have been recognized as revenue in the current fiscal period. Entitlements and shared revenues are recorded at the time of receipt or earlier if the susceptible to accrual criteria are met. All expenditure-driven grants are recorded at the time of receipt or earlier. If qualifying expenditures have been incurred and all other requirements are met, except for the timing requirement, a deferred inflow of resources is reported until time requirements have passed.
The accounts of the County are organized on the basis of funds. A fund is an independent fiscal and accounting entity with a self-balancing set of accounts. Fund accounting segregates funds according to their intended purpose and is used to aid management in demonstrating compliance with finance-related legal and contractual provisions.
In accordance with GAAP the County reports on each major governmental fund. By definition, the general fund is always considered a major fund. Governmental funds other than the general fund must be reported as major funds if they meet both the ten percent and five percent criterion, defined respectively, 1) An individual governmental fund reports at least ten percent of any of the following: a) total governmental fund assets, b) total governmental fund liabilities, c) total governmental fund revenues, or d) total governmental fund expenditures; 2) an individual governmental fund reports at least five percent of the aggregated total for both governmental funds and enterprise funds of any one of the items for which it met the ten percent criterion. In addition, a fund may be reported as
County of Sutter | Comprehensive Annual Financial Report Fiscal Year Ended June 30, 2020
51Notes to the financial statements
major if it is believed to be of particular importance to financial statement users.
The County reports the following major governmental funds:
The General Fund is used to account for all revenues and expenditures necessary to carry out basic governmental activities of the County that are not accounted for through other funds. For the County, the General Fund includes such activities as general government, public protection, public assistance, education, public ways and facilities, and culture and recreation services.
The Bi-County Behavioral Health Fund is a special revenue fund used to account for revenues and expenditures for mental health activities.
The Welfare Fund is a special revenue fund used to account for revenues and expenditures for social welfare programs.
The Public Safety/Trial Courts Fund is a special revenue fund used to account for revenues and expenditures for public safety programs.
The Mental Health Services Act Fund is a special revenue fund used to account for revenues and expenditures for Proposition 63, the Mental Health Services Act.
The Public Safety Realignment Fund is a special revenue fund used to account for the realignment of revenues and expenditures for public safety programs.
Proprietary funds distinguish operating revenues and expenses from non-operating items. Operating revenues and expenses generally result from providing services and producing and delivering goods in connection with a proprietary fund’s principal ongoing operations. The principal operating revenues of the enterprise and internal service funds are charges to customers for sales and services.
Operating expenses for enterprise and internal service funds include the cost of sales and services, administrative expenses, and depreciation on capital assets. All revenues and expenses not meeting this definition are reported as non-operating revenues and expenses.
The County reports the following proprietary funds:
An Enterprise Fund accounts for Water Works District No. 1 activities related to the provision of water services.
Internal Service Funds account for the County’s fleet maintenance, information technology, employee wellness, and self-insurance programs which provide services to other departments on a cost reimbursement basis.
Fiduciary funds include private purpose trust, investment trust and agency funds. All investment trust funds employ the same economic resources measurement focus and accrual basis of accounting as do proprietary funds. Agency funds, however, are unlike all other types of funds, reporting only assets and liabilities. So agency funds cannot be said to have a measurement focus. They do, however, use the accrual basis of accounting to recognize receivables and payables.
County of Sutter | Comprehensive Annual Financial Report Fiscal Year Ended June 30, 2020
52Notes to the financial statements
The County reports the following fiduciary funds:
The Private-Purpose Trust Funds account for trust arrangements under which principal and income benefit individuals, private organizations, or other governments such as escheat property.
The Investment Trust Funds account for the assets of legally separate entities that deposit cash with the County Treasurer. The entities include school and community college districts, other special districts governed by local boards, regional boards and authorities, and pass-through funds for tax collections for cities. These funds represent the assets, primarily cash and investments, and the related liability of the County to disburse these monies on demand.
The Agency Funds account for assets held by the County in a custodial capacity on behalf of various local governments and individuals.
Cash and Cash Equivalents
For purposes of the accompanying Statement of Cash Flows, the enterprise and internal service funds consider their equity in the County Treasurer’s Investment pool along with all highly liquid investments having a maturity of three months or less at the time of purchase to be cash equivalents.
The Treasurer’s Investment pool is not registered as an investment company with the Securities and Exchange Commission (SEC) nor is it an SEC Rule 2a7-like pool. California Code statutes and the County Treasury Oversight Committee set forth the various investment policies that the County Treasurer must follow.
Investments
The County sponsors an investment pool that is managed by the County Treasurer. The Treasurer invests on behalf of most funds of the County and external participants in accordance with the California State Government Code and the County’s investment policy. State statutes authorize the County to invest its cash surplus in obligations of the U.S. Treasury, agencies and instrumentalities, corporate bonds, medium term notes, bankers’ acceptance, certificates of deposit, commercial paper, repurchase agreements, and the State of California Local Agency Investment Fund.
Investment transactions are recorded on the trade date at cost. The fair value represents the amount the County could reasonably expect to receive for an investment in a current sale between a willing buyer and seller. Short term investments are reported at cost, which approximates fair value. Securities traded on a national or international exchange are valued at the last reported sales price at current exchange rates. Cash deposits are reported at carrying amount which reasonably estimates fair value. Managed funds not listed on an established market are reported at the estimated fair value as determined by the respective fund managers based on quoted sales prices of the underlying securities.
Participant’s equity in the investment pool is determined by the dollar amount of participant deposits, adjusted for withdrawals and distributed investment income. Investment income is determined on an amortized cost basis. Amortized premiums and accreted discounts, accrued interest, and realized gains and losses, net of expenses, are apportioned to pool participants every quarter. This method differs from the fair value method used to value investments in these financial statements, as unrealized gains or losses are not apportioned to pool participants.
County of Sutter | Comprehensive Annual Financial Report Fiscal Year Ended June 30, 2020
53Notes to the financial statements
During the fiscal year ended June 30, 2020, the County Treasurer has not entered into any legally binding guarantees to support the value of participant equity in the investment pool.
Income from pooled investments is allocated to the individual funds or external participants based on the fund or participant’s average daily cash balance at quarter end in relation to the total pool investments. Interest income earned in agency funds where there are no interest earnings requirements are assigned to the General Fund per County Policy. Income from non-pooled investments is recorded based on the specific investments held by the fund. The interest income is recorded in the fund that earned the interest.
Receivables
In the government-wide statements, receivables consist of all revenues earned at year-end and not yet received. Allowances for uncollectible accounts receivable are based upon historical trends and the periodic aging of accounts receivable. Major receivable balances for the governmental activities include taxes, grants, and interest. Business-type activities report user fees and interest earnings as their major receivables.
In the fund financial statements, material receivables in governmental funds include revenue accounts such as taxes, grants, interest, and other similar intergovernmental revenues since they are usually both measurable and available. Non-exchange transactions collectible but not available are deferred in the fund financial statements in accordance with modified accrual basis of accounting, but not deferred in the government-wide financial statements in accordance with the full accrual basis of accounting. Interest and investment earnings are included in the current fiscal year if they are collected within 60 days of fiscal year end.
Proprietary fund major receivables consist of all revenues earned at year-end and not yet received. User fee receivable and interest earnings compose the majority of proprietary fund receivables. Allowance for uncollectible accounts receivable are based upon historical trends and the periodic aging of accounts receivable.
Interfund Transactions
Interfund transactions are reflected as either loans, services provided or used, reimbursements or transfers.
Loans reported as receivables and payables are referred to as either “due to/from other funds” (i.e. the current portion of interfund loans) or “advances to/from other funds” (i.e., the noncurrent portion of interfund loans) as appropriate and are subject to elimination upon consolidation. Advances between funds, as reported in the fund financial statements, are offset by a fund balance reserve account in applicable governmental funds to indicate that they are not available for appropriation and are not available financial resources.
Services provided or used, deemed to be at market or near market rates, are treated as revenues and expenditures or expenses. These services provide information on the net cost of each government function and, therefore, are not eliminated in the process of preparing the government-wide Statement of Activities.
Reimbursements occur when the funds responsible for particular expenditures or expenses repay the funds that initially paid for them. Such reimbursements are treated as an adjustment to expenditures or expenses; that is, a corresponding increase in expenditures or expenses in the reimbursing fund and a corresponding decrease in expenditures or expenses in the reimbursed fund.
County of Sutter | Comprehensive Annual Financial Report Fiscal Year Ended June 30, 2020
54Notes to the financial statements
All other interfund transactions are treated as transfers. Transfers between funds are netted as part of the reconciliation to the government-wide presentation.
Inventory and Prepaid Expenses
Inventories are stated at cost (first-in, first-out basis) for governmental funds and proprietary funds. Inventory recorded by governmental funds includes expendable supplies held for consumption. Governmental fund inventories are recorded as expenditures at the time the inventory is consumed. Reported inventories of governmental funds are equally offset by a fund balance reservation to indicate that portion of fund balance not available for future appropriation. Certain payments to vendors reflect costs applicable to future accounting periods and are therefore considered prepaid expenses.
Loans Receivable
Loans receivable are comprised of mortgage subsidies and long-term loans to other agencies.
Capital Assets
Capital assets include property, plant, equipment, and infrastructure assets (roads, bridges, sidewalks, water, sewer, and similar items). Capital assets are defined by the County as equipment with a cost of $5,000 or more, structures and improvements with a cost of $150,000 or more, and all land regardless of cost. Equipment reported in the financial statements is at actual historical cost. Structures and improvements and land are reported at actual cost when available or estimated historical cost. Estimated historical cost was arrived at by a variety of methods including the use of factors and comparative sales. Infrastructure assets, including bridges and roads, are reported at estimated historical cost.
Estimated historical cost for bridges was arrived at by developing a listing of all bridges constructed after 1980 and multiplying total square footage by the average cost per square foot and the price level factor for the Price Trends for Federal-Aid Highway Construction. Estimated historical cost for roads was arrived at by multiplying the number of land-miles constructed since 1980 for asphalt with curb and gutter by the average cost per lane-mile and the price level factor from the Price Trends for Federal-Aid Highway Construction. The county has determined the cost of gravel and dirt roads to be minimal and has elected not to capitalize these road types. Contributed capital assets are recorded at estimated fair market value at the date of donation.
Capital assets that are used in governmental fund operations are reported in the government-wide financial statements. Property, plant, equipment and infrastructure are accounted for as capital assets. In the fund financial statements, capital assets used in governmental fund operations are accounted for as capital outlay expenditures of the governmental fund upon acquisition.
Capital assets used in the proprietary fund operations are reported on their respective propriety statement of net position. Capital assets used in proprietary fund operations are accounted for the same as in the government-wide statements.
Depreciation of all exhaustible capital assets is recorded as an allocated expense in the Statement of Activities, with accumulated depreciation reflected in the Statement of Net Position. Depreciation is provided over the assets’ estimated useful lives using the straight-line method of depreciation. The range of estimated useful lives by type of asset is as follows:
County of Sutter | Comprehensive Annual Financial Report Fiscal Year Ended June 30, 2020
55Notes to the financial statements
Depreciable Asset Estimated LivesEquipment 5-25 yearsSoftware 3-10 yearsStructures and improvements 5-50 yearsInfrastructure 30-50 years
Maintenance and repairs are charged to operations when incurred. Betterments and major improvements which significantly increase values, change capacities or extend useful lives are capitalized. Upon sale or retirement of capital assets, the cost and related accumulated depreciation are removed from the respective accounts and any resulting gain or loss is included in the results of operations.
Unearned Revenue
Under both the accrual and modified accrual basis of accounting, revenues are recognized only when earned. Thus, the government-wide statement of net position, governmental funds, and enterprise funds defer revenue recognition for resources that have been received at year-end, but not yet earned. Assets recognized before the earning process is complete are offset by a corresponding liability as unearned revenues.
Deferred Outflows/Inflows of Resources
In addition to assets, the statement of financial position will sometimes report a separate section for deferred outflows of resources. This separate financial statement element, deferred outflows of resources, represents a consumption of net position that applies to a future period and so will not be recognized as an outflow of resources (expenses/expenditure) until then. The County has deferred outflows of resources related to pensions and other post-employment benefits.
In addition to liabilities, the statement of financial position will sometimes report a separate section for deferred inflows of resources. This separate financial statement element represents an acquisition of net position that applies to a future period and so will not be recognized as an inflow of resources (revenue) until that time. The County has deferred inflows of resources related to unavailable revenues report under the modified accrual basis of accounting in the governmental funds balance sheet and related to pensions and OPEB in its government-wide statements.
The governmental funds report unavailable revenues for receivables that have not been received within the modified accrual period. These amounts are deferred and recognized as an inflow of resources in the period that the amounts become available.
Compensated Absences
The County’s policy regarding compensated absences is to permit employees to accumulate earned but unused vacation and sick leave. The liability for these compensated absences is recorded as a debt in the government-wide statements. The current portion of this debt is estimated based on historical trends. In the governmental fund financial statements, the expenditures and liabilities related to those obligations are recognized only when they mature. In the proprietary funds the accrued compensated absences is recorded as an expense and related liability in the year earned. The County includes its share of social security and medicare taxes payable on behalf of the employees in the accrual for compensated absences.
County of Sutter | Comprehensive Annual Financial Report Fiscal Year Ended June 30, 2020
56Notes to the financial statements
Long-Term Debt
The accounting treatment of long-term debt depends on whether the assets are used in governmental fund operations or proprietary fund operations and whether they are reported in the government-wide or fund financial statements.
All long-term debt to be repaid from governmental and business-type resources are reported as liabilities in the government-wide statements. The long-term debt consists primarily of loans payable and capital leases payable.
Long-term debt for governmental funds is not reported as a liability in the fund financial statements. The debt proceeds are reported as other financing sources and payment of principal and interest reported as expenditures. The accounting for proprietary funds is the same in the fund statements as it is in the government-wide statements.
Fund Balances/Net Position
The government-wide and business-type fund financial statements utilize a net position presentation. Net position is categorized as follows:
Net Investment in Capital Assets – Consists of capital assets including restricted capital assets, net of accumulated depreciation and reduced by the outstanding balances of any bonds, mortgages, notes or other borrowings that are attributable to the acquisition, construction or improvement of those assets
Restricted net position – Consists of net position with constraints placed on the use either by (1) external groups such as creditors, grantors, contributors or laws or regulations or other governments; (2) law through constitutional provisions or enabling legislation.
Unrestricted net position – All other net position that do not meet the definition of “restricted” or “investment in capital assets.”
When both restricted and unrestricted net position are available, restricted resources are depleted first before the restricted resources are used.
Under GASB Statement No. 54, governmental fund balance is reported in classifications that comprise a hierarchy based primarily on the extent to which the County is bound to honor constraints on the specific purpose for which amounts in the funds can be spent. Fund balance is reported in five components – nonspendable, restricted, committed, assigned and unassigned.
Nonspendable – This component includes amounts that cannot be spent because they are either (a) not in spendable form or (b) legally or contractually required to be maintained intact.
Restricted – This component includes amounts that can be spent only for the specific purposes stipulated by external resource providers, constitutionally or through enabling legislation. Restrictions may effectively be changed or lifted only with the consent of the resource providers.
Committed – This component includes amount that can only be used for the specific purposes determined by a formal action of the County’s Board of Supervisors taking the same formal action that imposed the
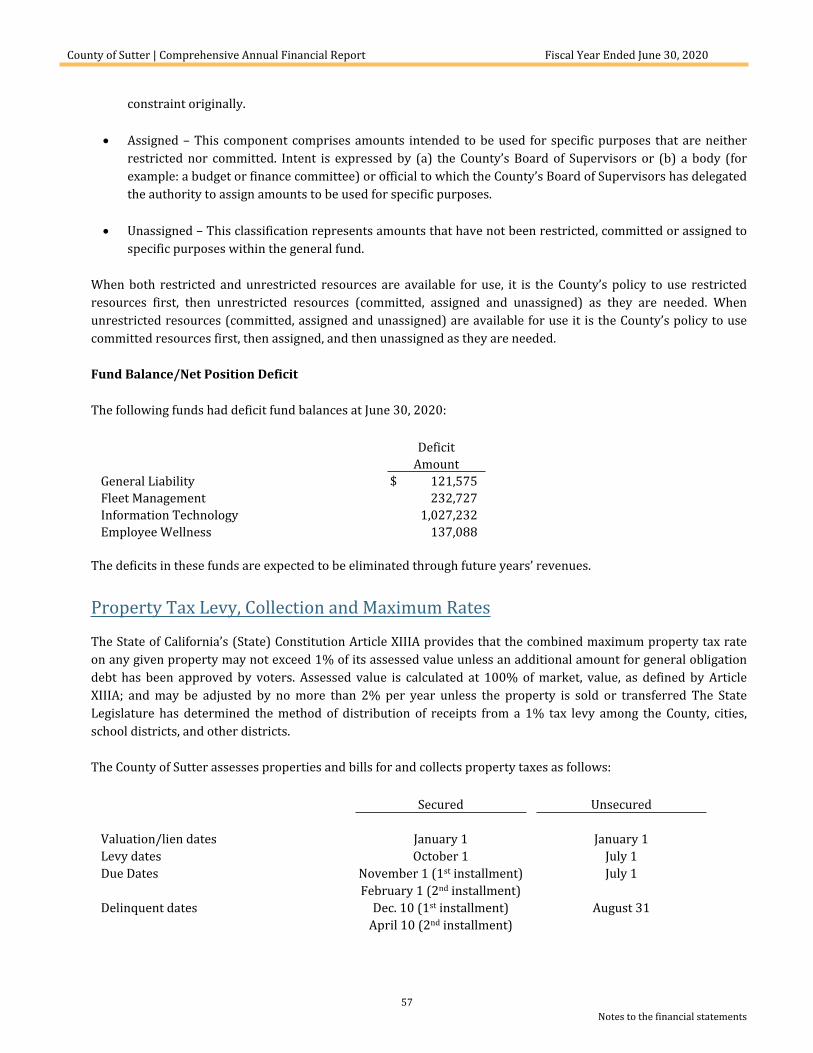
County of Sutter | Comprehensive Annual Financial Report Fiscal Year Ended June 30, 2020
57Notes to the financial statements
constraint originally.
Assigned – This component comprises amounts intended to be used for specific purposes that are neither restricted nor committed. Intent is expressed by (a) the County’s Board of Supervisors or (b) a body (for example: a budget or finance committee) or official to which the County’s Board of Supervisors has delegated the authority to assign amounts to be used for specific purposes.
Unassigned – This classification represents amounts that have not been restricted, committed or assigned to specific purposes within the general fund.
When both restricted and unrestricted resources are available for use, it is the County’s policy to use restricted resources first, then unrestricted resources (committed, assigned and unassigned) as they are needed. When unrestricted resources (committed, assigned and unassigned) are available for use it is the County’s policy to use committed resources first, then assigned, and then unassigned as they are needed.
Fund Balance/Net Position Deficit
The following funds had deficit fund balances at June 30, 2020:
DeficitAmount
General Liability $ 121,575Fleet Management 232,727Information Technology 1,027,232Employee Wellness 137,088
The deficits in these funds are expected to be eliminated through future years’ revenues.
Property Tax Levy, Collection and Maximum Rates
The State of California’s (State) Constitution Article XIIIA provides that the combined maximum property tax rate on any given property may not exceed 1% of its assessed value unless an additional amount for general obligation debt has been approved by voters. Assessed value is calculated at 100% of market, value, as defined by Article XIIIA; and may be adjusted by no more than 2% per year unless the property is sold or transferred The State Legislature has determined the method of distribution of receipts from a 1% tax levy among the County, cities, school districts, and other districts.
The County of Sutter assesses properties and bills for and collects property taxes as follows:
Secured Unsecured
Valuation/lien dates January 1 January 1Levy dates October 1 July 1Due Dates November 1 (1st installment) July 1
February 1 (2nd installment)Delinquent dates Dec. 10 (1st installment) August 31
April 10 (2nd installment)
County of Sutter | Comprehensive Annual Financial Report Fiscal Year Ended June 30, 2020
58Notes to the financial statements
The term “unsecured” refers to taxes on personal property other than land and buildings. These taxes are secured by liens on the personal property being taxed. Property tax revenues are recognized in the fiscal year for which they are levied, provided they are due and collected within sixty days after fiscal year-end.
The County apportions secured property tax revenue in accordance with the alternate methods of distribution, the “Teeter Plan,” as prescribed in Section 4717 of the California Revenue and Taxation code. Under this method of apportionment, penalties and interest collected on delinquent secured taxes are required to be held in trust in the Tax Loss Reserve Fund (TLRF). The primary purpose of TLRF is to cover losses that may occur as a result of special sales of tax-defaulted property.
The County has elected to follow the procedures authorized by Revenue and Taxation Code 4703.2 which requires that the tax losses reserve fund shall be maintained at not less than 25 percent of the local delinquent secured taxes and assessments for participating entities in the County as calculated at the end of the fiscal year. The net balance in the TLRF was $661,781 at June 30, 2020. The County’s management believes that any ownership rights to the TLRF the County may have are effective only upon a Board approved transfer or to the extent of losses related to the sale of tax defaulted property. Amounts in the TLRF are considered to be held in a custodial capacity for the participants in the County’s Teeter Plan and accounted for in an agency fund.
Grant Revenues
Certain grant revenues are recognized when specific related expenditures have been incurred. In other grant programs, monies are virtually unrestricted as to purpose of expenditures and are only revocable for failure to comply with prescribed compliance requirements. These revenues are recognized at the time of receipt, or earlier if susceptible to accrual criteria is met. Cash received prior to incurrence of the related expenditure is recorded as unearned revenue.
Expenditures/Expenses
In the government-wide financial statements, expenses are classified by function for both governmental and business-type activities.
In the fund financial statements, governmental fund report expenditures of financial resources. Proprietary funds report expenses relating to use of economic resources. Expenditure/expenses are classified as follows:
Government Funds – By CharacterCurrent (further classified by function)Debt ServiceCapital Outlay
Proprietary Fund – By Operating and Nonoperating
Use of Estimates
The preparation of basic financial statements in conformity with accounting principles generally accepted in the United States of America requires management to make estimates and assumptions that affect certain reported amounts and disclosures. Accordingly, actual results could differ from those estimates.
County of Sutter | Comprehensive Annual Financial Report Fiscal Year Ended June 30, 2020
59Notes to the financial statements
2. STEWARDSHIP, COMPLIANCE, AND ACCOUNTABILITY
Gann Spending Limitation
Under Article XIIIB of the California Constitution (the Gann spending Limitation), the County is restricted as to the amount of annual appropriations from proceeds of taxes, and if proceeds of taxes exceed allowed appropriations, the excess must either be refunded to the State Controller or returned to the taxpayers through revised tax rates, revised fee schedules or other refund arrangements. The allowed appropriations for the Gann Limit for the fiscal year ended June 30, 2020 were $242,284,939. The appropriations subject to this limit were $40,962,891, which is $201,322,048 below the appropriations limit. Accordingly, the appropriations subject to this legal restriction were only 16.9% of the maximum allowed by law.
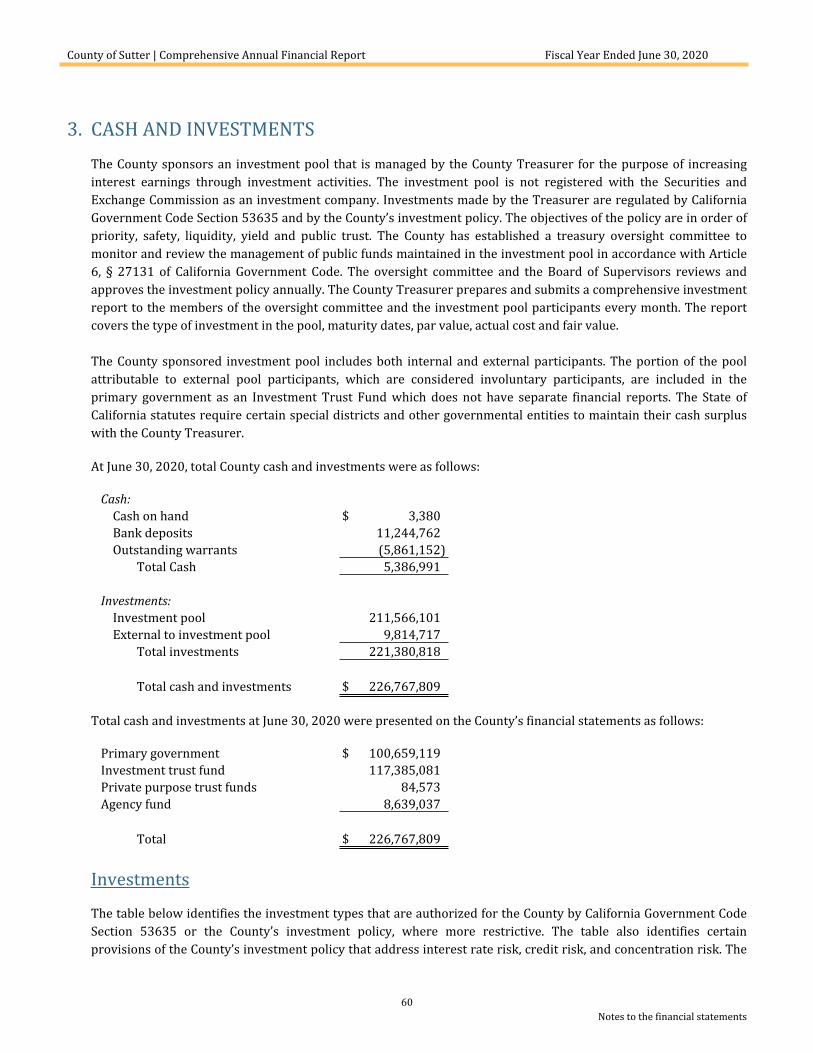
County of Sutter | Comprehensive Annual Financial Report Fiscal Year Ended June 30, 2020
60Notes to the financial statements
3. CASH AND INVESTMENTSThe County sponsors an investment pool that is managed by the County Treasurer for the purpose of increasing interest earnings through investment activities. The investment pool is not registered with the Securities and Exchange Commission as an investment company. Investments made by the Treasurer are regulated by California Government Code Section 53635 and by the County’s investment policy. The objectives of the policy are in order of priority, safety, liquidity, yield and public trust. The County has established a treasury oversight committee to monitor and review the management of public funds maintained in the investment pool in accordance with Article 6, § 27131 of California Government Code. The oversight committee and the Board of Supervisors reviews and approves the investment policy annually. The County Treasurer prepares and submits a comprehensive investment report to the members of the oversight committee and the investment pool participants every month. The report covers the type of investment in the pool, maturity dates, par value, actual cost and fair value.
The County sponsored investment pool includes both internal and external participants. The portion of the pool attributable to external pool participants, which are considered involuntary participants, are included in the primary government as an Investment Trust Fund which does not have separate financial reports. The State of California statutes require certain special districts and other governmental entities to maintain their cash surplus with the County Treasurer.
At June 30, 2020, total County cash and investments were as follows:
Cash:Cash on hand $ 3,380Bank deposits 11,244,762Outstanding warrants (5,861,152)
Total Cash 5,386,991
Investments:Investment pool 211,566,101External to investment pool 9,814,717
Total investments 221,380,818
Total cash and investments $ 226,767,809
Total cash and investments at June 30, 2020 were presented on the County’s financial statements as follows:
Primary government $ 100,659,119Investment trust fund 117,385,081Private purpose trust funds 84,573Agency fund 8,639,037
Total $ 226,767,809
Investments
The table below identifies the investment types that are authorized for the County by California Government Code Section 53635 or the County’s investment policy, where more restrictive. The table also identifies certain provisions of the County’s investment policy that address interest rate risk, credit risk, and concentration risk. The
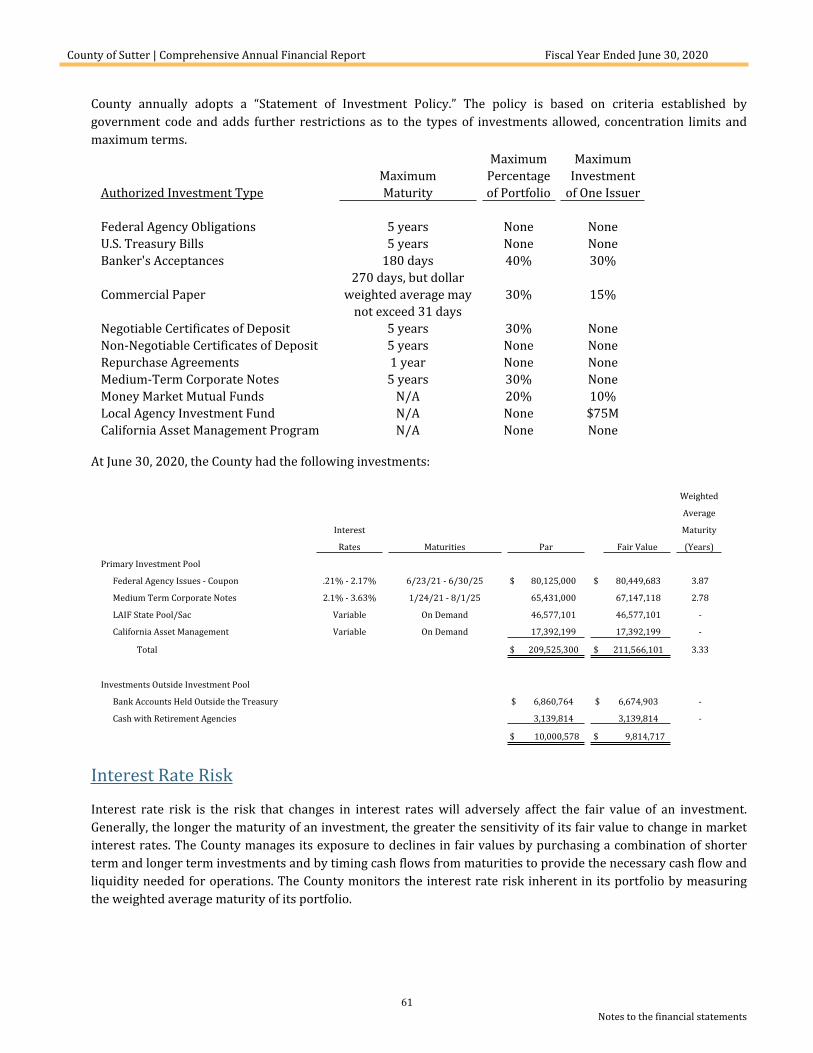
County of Sutter | Comprehensive Annual Financial Report Fiscal Year Ended June 30, 2020
61Notes to the financial statements
County annually adopts a “Statement of Investment Policy.” The policy is based on criteria established by government code and adds further restrictions as to the types of investments allowed, concentration limits and maximum terms.
Maximum MaximumMaximum Percentage Investment
Authorized Investment Type Maturity of Portfolio of One Issuer
Federal Agency Obligations 5 years None NoneU.S. Treasury Bills 5 years None NoneBanker's Acceptances 180 days 40% 30%
270 days, but dollarCommercial Paper weighted average may 30% 15%
not exceed 31 daysNegotiable Certificates of Deposit 5 years 30% NoneNon-Negotiable Certificates of Deposit 5 years None NoneRepurchase Agreements 1 year None NoneMedium-Term Corporate Notes 5 years 30% NoneMoney Market Mutual Funds N/A 20% 10%Local Agency Investment Fund N/A None $75MCalifornia Asset Management Program N/A None None
At June 30, 2020, the County had the following investments:
Weighted
Average
Interest Maturity
Rates Maturities Par Fair Value (Years)
Primary Investment Pool
Federal Agency Issues - Coupon .21% - 2.17% 6/23/21 - 6/30/25 $ 80,125,000 $ 80,449,683 3.87
Medium Term Corporate Notes 2.1% - 3.63% 1/24/21 - 8/1/25 65,431,000 67,147,118 2.78
LAIF State Pool/Sac Variable On Demand 46,577,101 46,577,101 -
California Asset Management Variable On Demand 17,392,199 17,392,199 -
Total $ 209,525,300 $ 211,566,101 3.33
Investments Outside Investment Pool
Bank Accounts Held Outside the Treasury $ 6,860,764 $ 6,674,903 -
Cash with Retirement Agencies 3,139,814 3,139,814 -
$ 10,000,578 $ 9,814,717
Interest Rate Risk
Interest rate risk is the risk that changes in interest rates will adversely affect the fair value of an investment. Generally, the longer the maturity of an investment, the greater the sensitivity of its fair value to change in market interest rates. The County manages its exposure to declines in fair values by purchasing a combination of shorter term and longer term investments and by timing cash flows from maturities to provide the necessary cash flow and liquidity needed for operations. The County monitors the interest rate risk inherent in its portfolio by measuring the weighted average maturity of its portfolio.
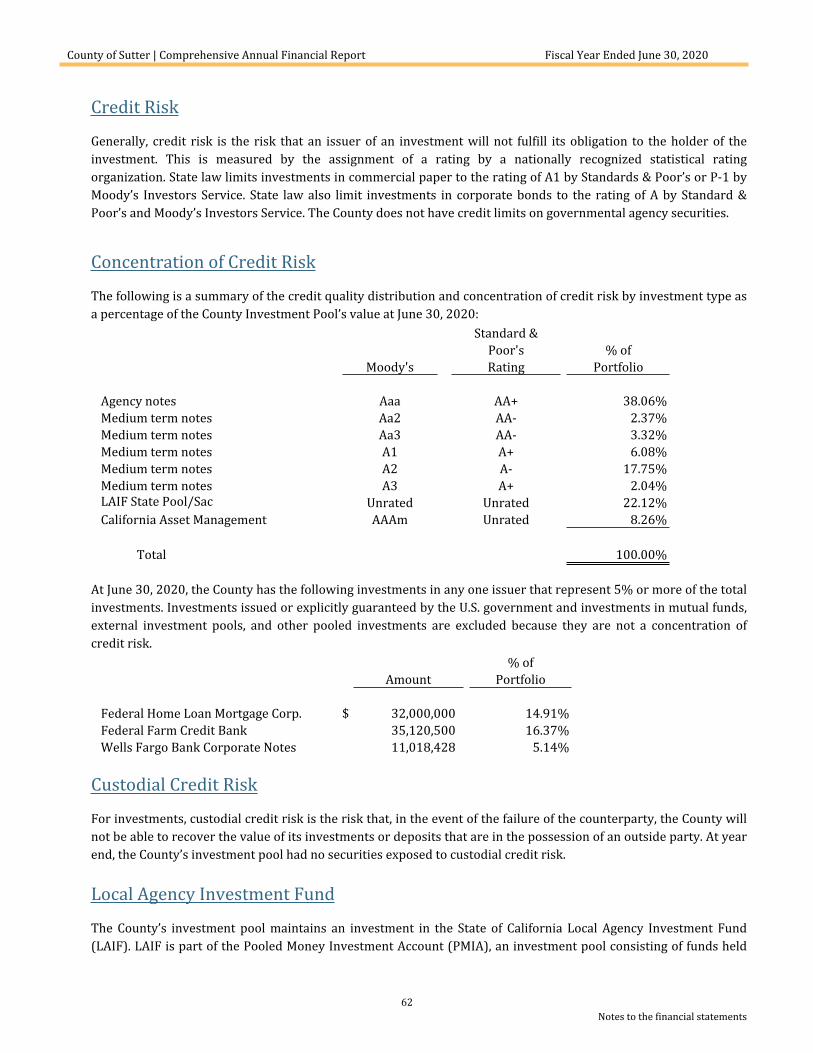
County of Sutter | Comprehensive Annual Financial Report Fiscal Year Ended June 30, 2020
62Notes to the financial statements
Credit Risk
Generally, credit risk is the risk that an issuer of an investment will not fulfill its obligation to the holder of the investment. This is measured by the assignment of a rating by a nationally recognized statistical rating organization. State law limits investments in commercial paper to the rating of A1 by Standards & Poor’s or P-1 by Moody’s Investors Service. State law also limit investments in corporate bonds to the rating of A by Standard & Poor’s and Moody’s Investors Service. The County does not have credit limits on governmental agency securities.
Concentration of Credit Risk
The following is a summary of the credit quality distribution and concentration of credit risk by investment type as a percentage of the County Investment Pool’s value at June 30, 2020:
Standard & Poor's % of
Moody's Rating Portfolio
Agency notes Aaa AA+ 38.06%Medium term notes Aa2 AA- 2.37%Medium term notes Aa3 AA- 3.32%Medium term notes A1 A+ 6.08%Medium term notes A2 A- 17.75%Medium term notes A3 A+ 2.04%LAIF State Pool/Sac Unrated Unrated 22.12%California Asset Management AAAm Unrated 8.26%
Total 100.00%
At June 30, 2020, the County has the following investments in any one issuer that represent 5% or more of the total investments. Investments issued or explicitly guaranteed by the U.S. government and investments in mutual funds, external investment pools, and other pooled investments are excluded because they are not a concentration of credit risk.
% ofAmount Portfolio
Federal Home Loan Mortgage Corp. $ 32,000,000 14.91%Federal Farm Credit Bank 35,120,500 16.37%Wells Fargo Bank Corporate Notes 11,018,428 5.14%
Custodial Credit Risk
For investments, custodial credit risk is the risk that, in the event of the failure of the counterparty, the County will not be able to recover the value of its investments or deposits that are in the possession of an outside party. At year end, the County’s investment pool had no securities exposed to custodial credit risk.
Local Agency Investment Fund
The County’s investment pool maintains an investment in the State of California Local Agency Investment Fund (LAIF). LAIF is part of the Pooled Money Investment Account (PMIA), an investment pool consisting of funds held
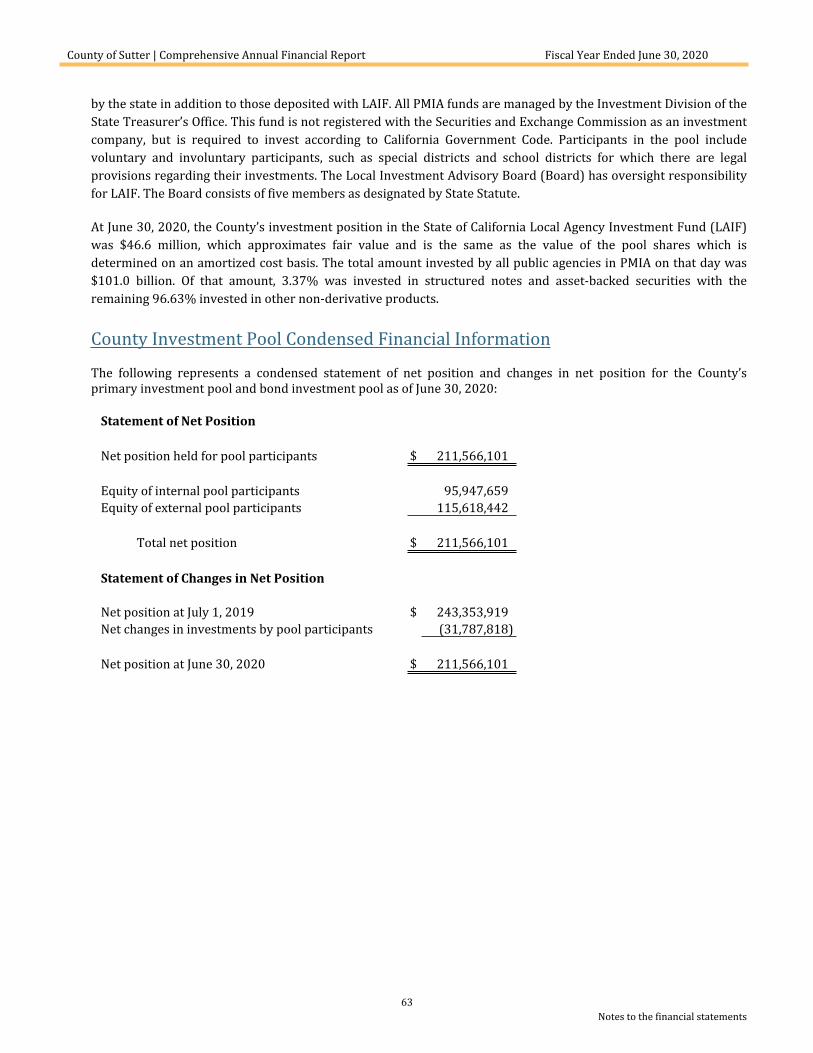
County of Sutter | Comprehensive Annual Financial Report Fiscal Year Ended June 30, 2020
63Notes to the financial statements
by the state in addition to those deposited with LAIF. All PMIA funds are managed by the Investment Division of the State Treasurer’s Office. This fund is not registered with the Securities and Exchange Commission as an investment company, but is required to invest according to California Government Code. Participants in the pool include voluntary and involuntary participants, such as special districts and school districts for which there are legal provisions regarding their investments. The Local Investment Advisory Board (Board) has oversight responsibility for LAIF. The Board consists of five members as designated by State Statute.
At June 30, 2020, the County’s investment position in the State of California Local Agency Investment Fund (LAIF) was $46.6 million, which approximates fair value and is the same as the value of the pool shares which is determined on an amortized cost basis. The total amount invested by all public agencies in PMIA on that day was $101.0 billion. Of that amount, 3.37% was invested in structured notes and asset-backed securities with the remaining 96.63% invested in other non-derivative products.
County Investment Pool Condensed Financial Information
The following represents a condensed statement of net position and changes in net position for the County’s primary investment pool and bond investment pool as of June 30, 2020:
Statement of Net Position
Net position held for pool participants $ 211,566,101
Equity of internal pool participants 95,947,659Equity of external pool participants 115,618,442
Total net position $ 211,566,101
Statement of Changes in Net Position
Net position at July 1, 2019 $ 243,353,919Net changes in investments by pool participants (31,787,818)
Net position at June 30, 2020 $ 211,566,101
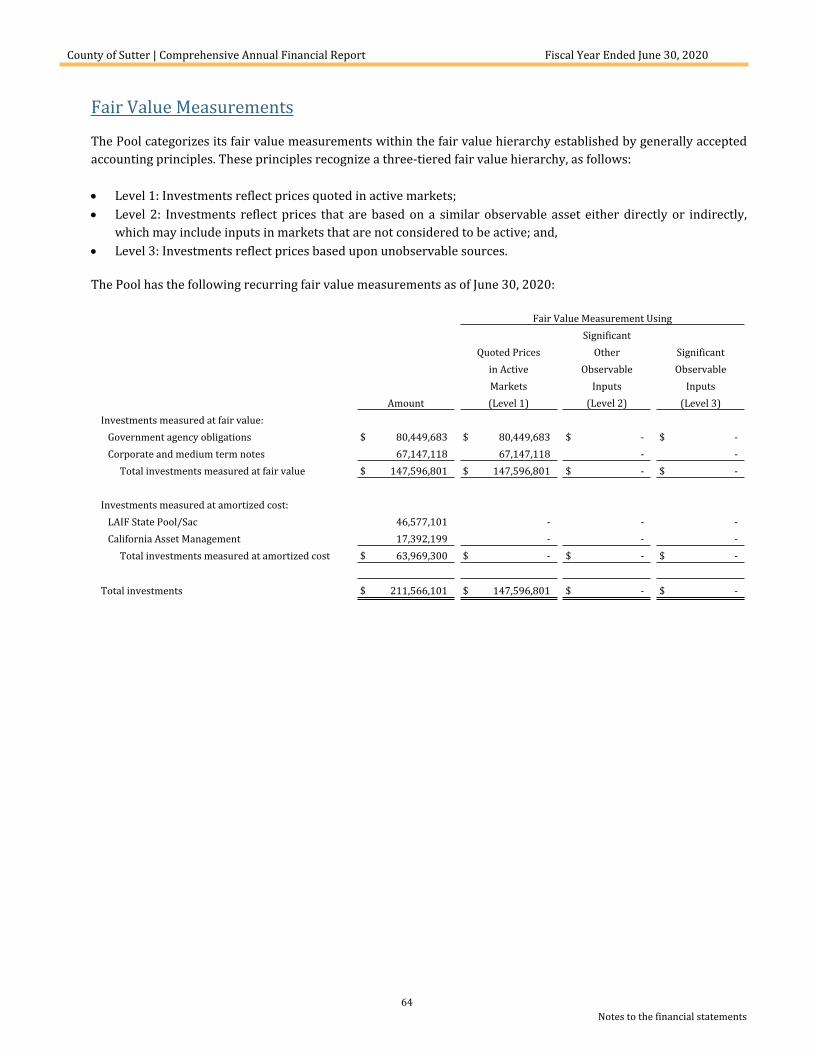
County of Sutter | Comprehensive Annual Financial Report Fiscal Year Ended June 30, 2020
64Notes to the financial statements
Fair Value Measurements
The Pool categorizes its fair value measurements within the fair value hierarchy established by generally accepted accounting principles. These principles recognize a three-tiered fair value hierarchy, as follows:
Level 1: Investments reflect prices quoted in active markets; Level 2: Investments reflect prices that are based on a similar observable asset either directly or indirectly,
which may include inputs in markets that are not considered to be active; and, Level 3: Investments reflect prices based upon unobservable sources.
The Pool has the following recurring fair value measurements as of June 30, 2020:
Fair Value Measurement UsingSignificant
Quoted Prices Other Significantin Active Observable ObservableMarkets Inputs Inputs
Amount (Level 1) (Level 2) (Level 3)Investments measured at fair value: Government agency obligations $ 80,449,683 $ 80,449,683 $ - $ - Corporate and medium term notes 67,147,118 67,147,118 - -
Total investments measured at fair value $ 147,596,801 $ 147,596,801 $ - $ -
Investments measured at amortized cost: LAIF State Pool/Sac 46,577,101 - - - California Asset Management 17,392,199 - - -
Total investments measured at amortized cost $ 63,969,300 $ - $ - $ -
Total investments $ 211,566,101 $ 147,596,801 $ - $ -
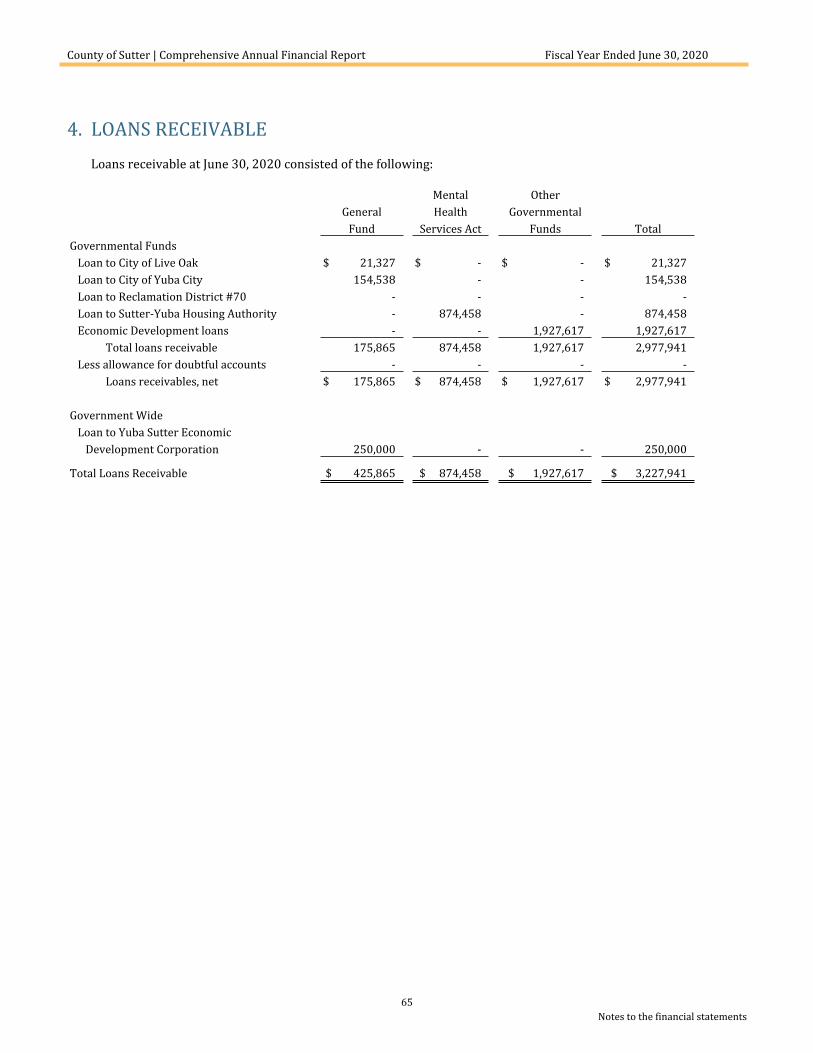
County of Sutter | Comprehensive Annual Financial Report Fiscal Year Ended June 30, 2020
65Notes to the financial statements
4. LOANS RECEIVABLELoans receivable at June 30, 2020 consisted of the following:
Mental OtherGeneral Health Governmental
Fund Services Act Funds TotalGovernmental Funds Loan to City of Live Oak $ 21,327 $ - $ - $ 21,327 Loan to City of Yuba City 154,538 - - 154,538 Loan to Reclamation District #70 - - - - Loan to Sutter-Yuba Housing Authority - 874,458 - 874,458 Economic Development loans - - 1,927,617 1,927,617
Total loans receivable 175,865 874,458 1,927,617 2,977,941 Less allowance for doubtful accounts - - - -
Loans receivables, net $ 175,865 $ 874,458 $ 1,927,617 $ 2,977,941
Government Wide Loan to Yuba Sutter Economic Development Corporation 250,000 - - 250,000
Total Loans Receivable $ 425,865 $ 874,458 $ 1,927,617 $ 3,227,941
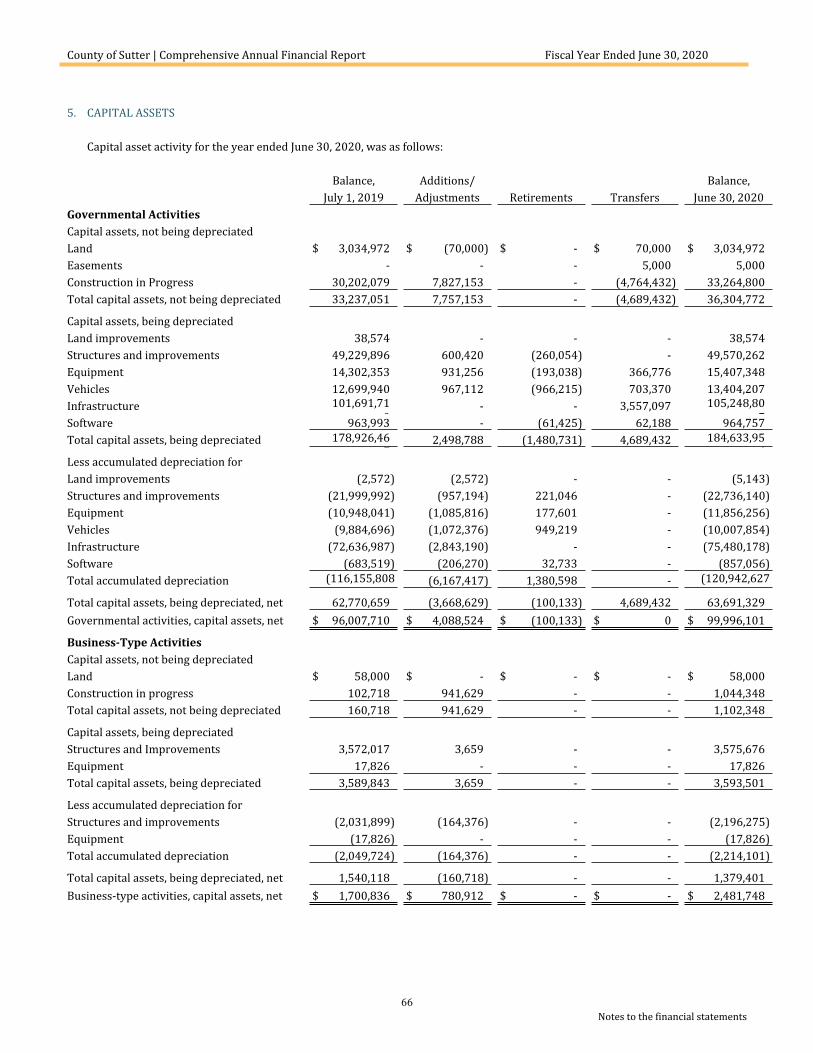
County of Sutter | Comprehensive Annual Financial Report Fiscal Year Ended June 30, 2020
66Notes to the financial statements
5. CAPITAL ASSETS
Capital asset activity for the year ended June 30, 2020, was as follows:
Balance, Additions/ Balance,July 1, 2019 Adjustments Retirements Transfers June 30, 2020
Governmental ActivitiesCapital assets, not being depreciatedLand $ 3,034,972 $ (70,000) $ - $ 70,000 $ 3,034,972Easements - - - 5,000 5,000Construction in Progress 30,202,079 7,827,153 - (4,764,432) 33,264,800Total capital assets, not being depreciated 33,237,051 7,757,153 - (4,689,432) 36,304,772
Capital assets, being depreciatedLand improvements 38,574 - - - 38,574Structures and improvements 49,229,896 600,420 (260,054) - 49,570,262Equipment 14,302,353 931,256 (193,038) 366,776 15,407,348Vehicles 12,699,940 967,112 (966,215) 703,370 13,404,207Infrastructure 101,691,71
0- - 3,557,097 105,248,80
7Software 963,993 - (61,425) 62,188 964,757Total capital assets, being depreciated 178,926,46
72,498,788 (1,480,731) 4,689,432 184,633,95
6Less accumulated depreciation forLand improvements (2,572) (2,572) - - (5,143)Structures and improvements (21,999,992) (957,194) 221,046 - (22,736,140)Equipment (10,948,041) (1,085,816) 177,601 - (11,856,256)Vehicles (9,884,696) (1,072,376) 949,219 - (10,007,854)Infrastructure (72,636,987) (2,843,190) - - (75,480,178)Software (683,519) (206,270) 32,733 - (857,056)Total accumulated depreciation (116,155,808
)(6,167,417) 1,380,598 - (120,942,627
)Total capital assets, being depreciated, net 62,770,659 (3,668,629) (100,133) 4,689,432 63,691,329Governmental activities, capital assets, net $ 96,007,710 $ 4,088,524 $ (100,133) $ 0 $ 99,996,101
Business-Type ActivitiesCapital assets, not being depreciatedLand $ 58,000 $ - $ - $ - $ 58,000Construction in progress 102,718 941,629 - - 1,044,348Total capital assets, not being depreciated 160,718 941,629 - - 1,102,348
Capital assets, being depreciatedStructures and Improvements 3,572,017 3,659 - - 3,575,676Equipment 17,826 - - - 17,826Total capital assets, being depreciated 3,589,843 3,659 - - 3,593,501
Less accumulated depreciation forStructures and improvements (2,031,899) (164,376) - - (2,196,275)Equipment (17,826) - - - (17,826)Total accumulated depreciation (2,049,724) (164,376) - - (2,214,101)
Total capital assets, being depreciated, net 1,540,118 (160,718) - - 1,379,401Business-type activities, capital assets, net $ 1,700,836 $ 780,912 $ - $ - $ 2,481,748
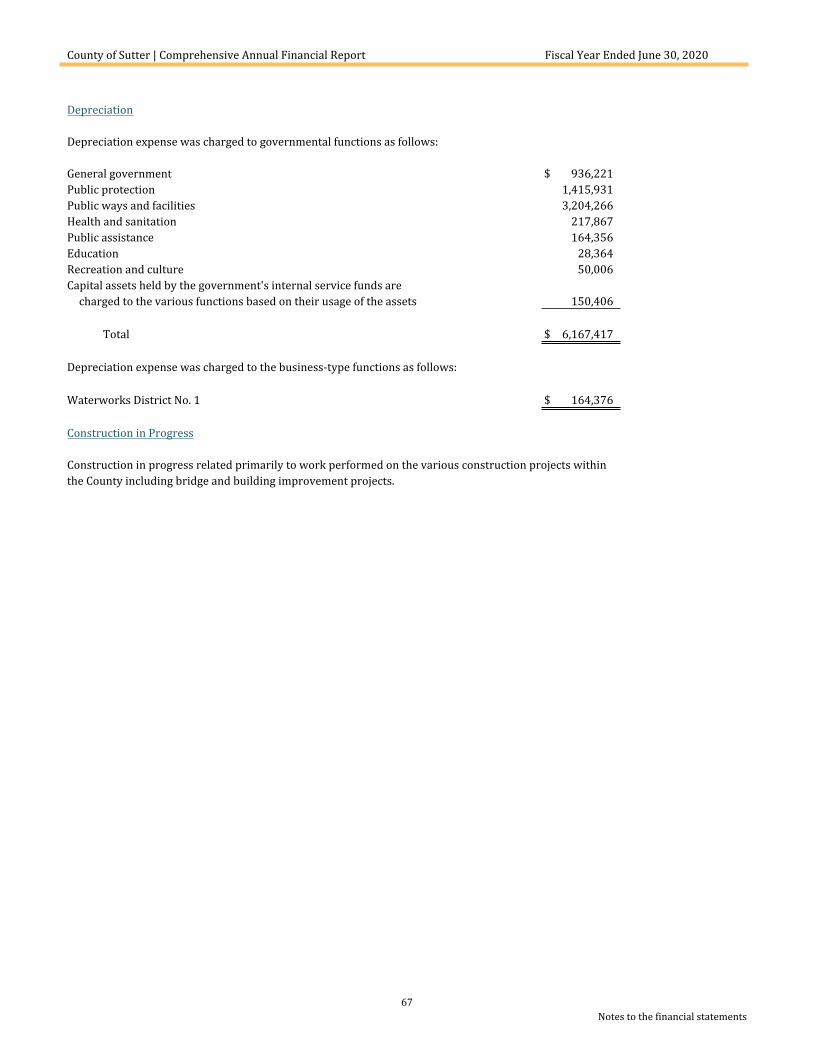
County of Sutter | Comprehensive Annual Financial Report Fiscal Year Ended June 30, 2020
67Notes to the financial statements
Depreciation
Depreciation expense was charged to governmental functions as follows:
General government $ 936,221Public protection 1,415,931Public ways and facilities 3,204,266Health and sanitation 217,867Public assistance 164,356Education 28,364Recreation and culture 50,006Capital assets held by the government's internal service funds are
charged to the various functions based on their usage of the assets 150,406
Total $ 6,167,417
Depreciation expense was charged to the business-type functions as follows:
Waterworks District No. 1 $ 164,376
Construction in Progress
Construction in progress related primarily to work performed on the various construction projects withinthe County including bridge and building improvement projects.
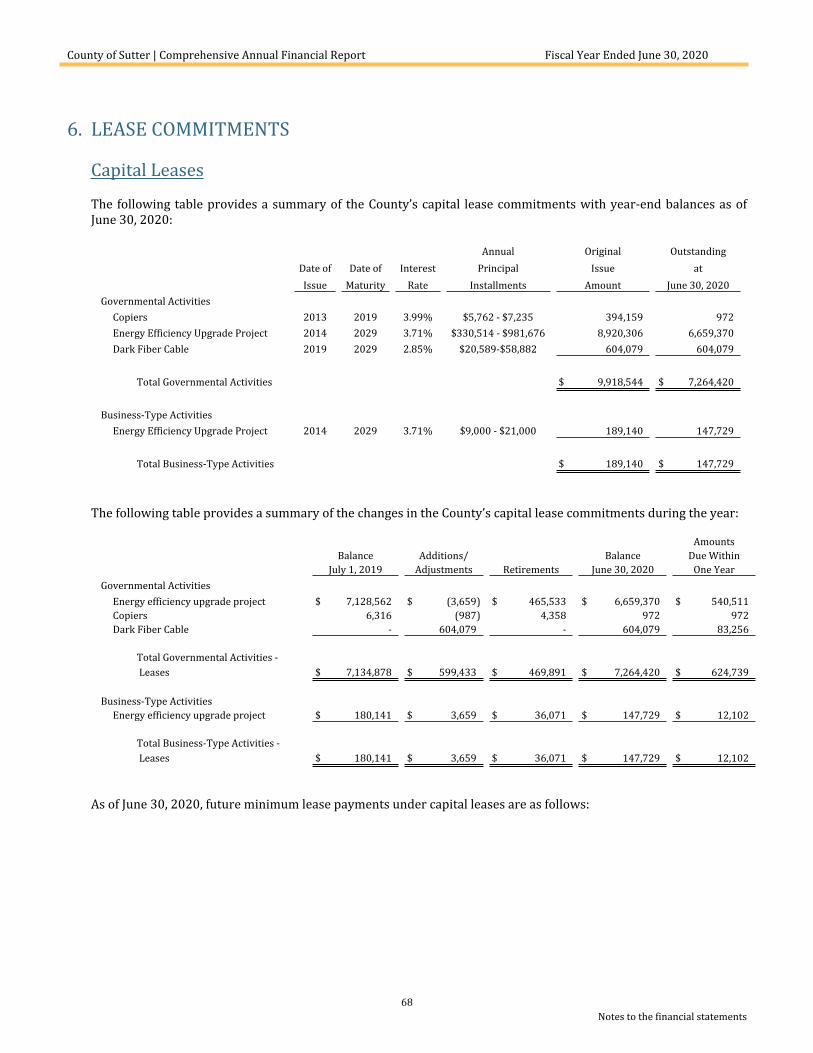
County of Sutter | Comprehensive Annual Financial Report Fiscal Year Ended June 30, 2020
68Notes to the financial statements
6. LEASE COMMITMENTS
Capital Leases
The following table provides a summary of the County’s capital lease commitments with year-end balances as of June 30, 2020:
Annual Original OutstandingDate of Date of Interest Principal Issue atIssue Maturity Rate Installments Amount June 30, 2020
Governmental ActivitiesCopiers 2013 2019 3.99% $5,762 - $7,235 394,159 972Energy Efficiency Upgrade Project 2014 2029 3.71% $330,514 - $981,676 8,920,306 6,659,370Dark Fiber Cable 2019 2029 2.85% $20,589-$58,882 604,079 604,079
Total Governmental Activities $ 9,918,544 $ 7,264,420
Business-Type ActivitiesEnergy Efficiency Upgrade Project 2014 2029 3.71% $9,000 - $21,000 189,140 147,729
Total Business-Type Activities $ 189,140 $ 147,729
The following table provides a summary of the changes in the County’s capital lease commitments during the year:
AmountsBalance Additions/ Balance Due Within
July 1, 2019 Adjustments Retirements June 30, 2020 One YearGovernmental Activities
Energy efficiency upgrade project $ 7,128,562 $ (3,659) $ 465,533 $ 6,659,370 $ 540,511Copiers 6,316 (987) 4,358 972 972Dark Fiber Cable - 604,079 - 604,079 83,256
Total Governmental Activities - Leases $ 7,134,878 $ 599,433 $ 469,891 $ 7,264,420 $ 624,739
Business-Type ActivitiesEnergy efficiency upgrade project $ 180,141 $ 3,659 $ 36,071 $ 147,729 $ 12,102
Total Business-Type Activities - Leases $ 180,141 $ 3,659 $ 36,071 $ 147,729 $ 12,102
As of June 30, 2020, future minimum lease payments under capital leases are as follows:
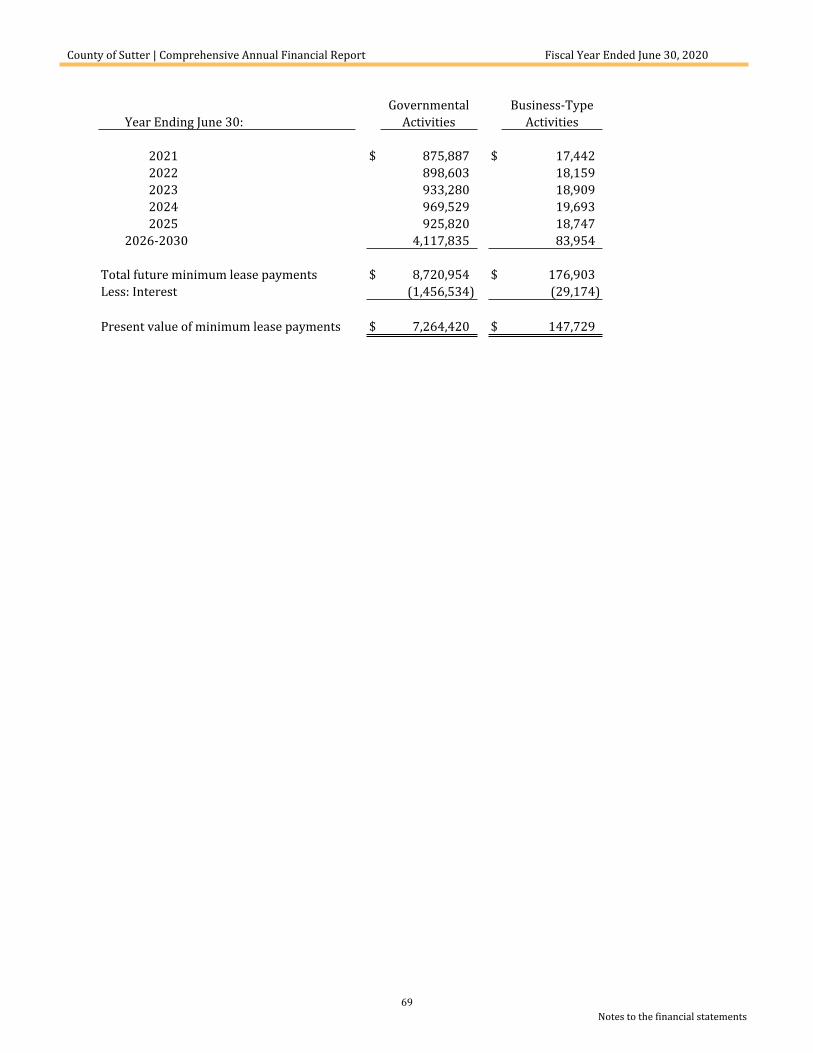
County of Sutter | Comprehensive Annual Financial Report Fiscal Year Ended June 30, 2020
69Notes to the financial statements
Governmental Business-TypeYear Ending June 30: Activities Activities
2021 $ 875,887 $ 17,4422022 898,603 18,1592023 933,280 18,9092024 969,529 19,6932025 925,820 18,747
2026-2030 4,117,835 83,954
Total future minimum lease payments $ 8,720,954 $ 176,903Less: Interest (1,456,534) (29,174)
Present value of minimum lease payments $ 7,264,420 $ 147,729
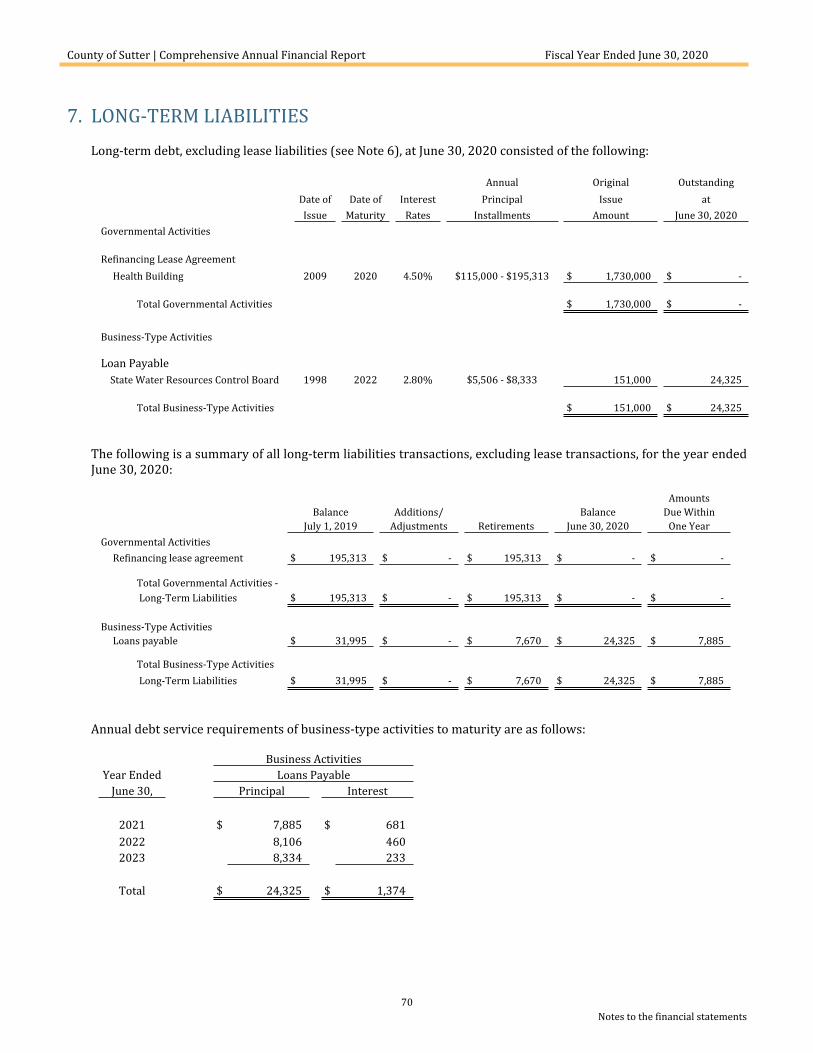
County of Sutter | Comprehensive Annual Financial Report Fiscal Year Ended June 30, 2020
70Notes to the financial statements
7. LONG-TERM LIABILITIESLong-term debt, excluding lease liabilities (see Note 6), at June 30, 2020 consisted of the following:
Annual Original OutstandingDate of Date of Interest Principal Issue atIssue Maturity Rates Installments Amount June 30, 2020
Governmental Activities
Refinancing Lease AgreementHealth Building 2009 2020 4.50% $115,000 - $195,313 $ 1,730,000 $ -
Total Governmental Activities $ 1,730,000 $ -
Business-Type Activities
Loan Payable State Water Resources Control Board 1998 2022 2.80% $5,506 - $8,333 151,000 24,325
Total Business-Type Activities $ 151,000 $ 24,325
The following is a summary of all long-term liabilities transactions, excluding lease transactions, for the year ended June 30, 2020:
AmountsBalance Additions/ Balance Due Within
July 1, 2019 Adjustments Retirements June 30, 2020 One YearGovernmental Activities
Refinancing lease agreement $ 195,313 $ - $ 195,313 $ - $ -
Total Governmental Activities - Long-Term Liabilities $ 195,313 $ - $ 195,313 $ - $ -
Business-Type ActivitiesLoans payable $ 31,995 $ - $ 7,670 $ 24,325 $ 7,885
Total Business-Type Activities - Long-Term Liabilities $ 31,995 $ - $ 7,670 $ 24,325 $ 7,885
Annual debt service requirements of business-type activities to maturity are as follows:
Business ActivitiesYear Ended Loans Payable
June 30, Principal Interest
2021 $ 7,885 $ 6812022 8,106 4602023 8,334 233
Total $ 24,325 $ 1,374
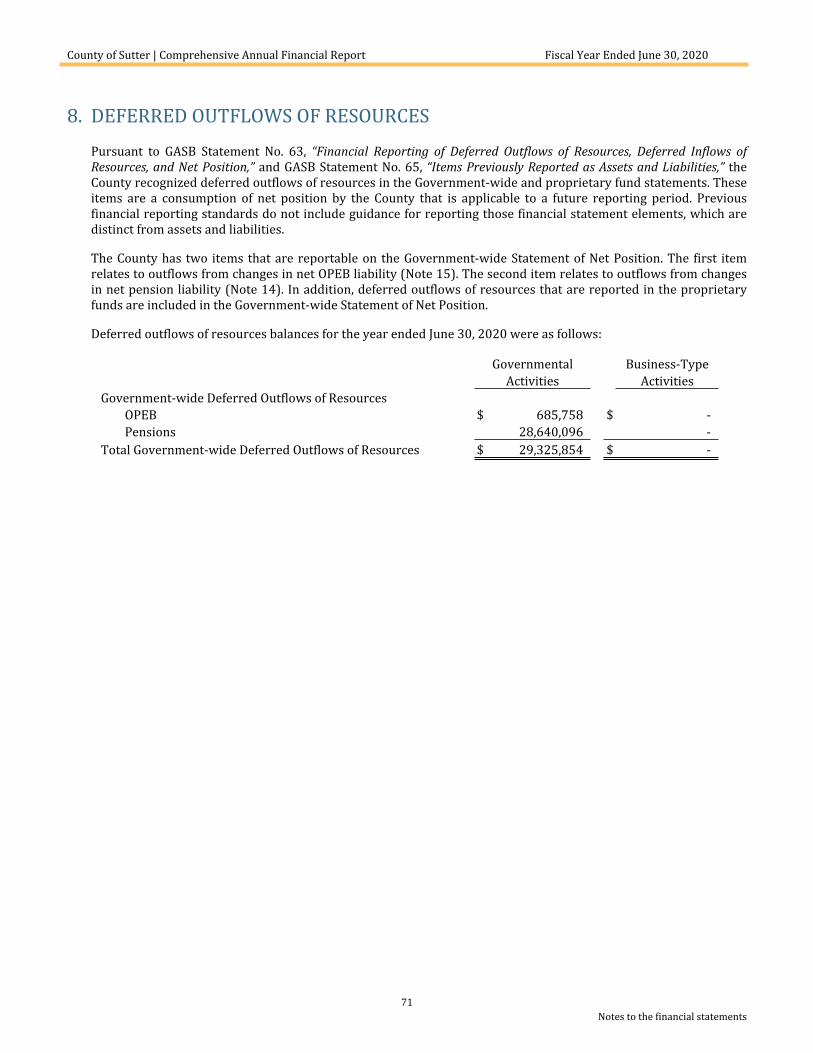
County of Sutter | Comprehensive Annual Financial Report Fiscal Year Ended June 30, 2020
71Notes to the financial statements
8. DEFERRED OUTFLOWS OF RESOURCES
Pursuant to GASB Statement No. 63, “Financial Reporting of Deferred Outflows of Resources, Deferred Inflows of Resources, and Net Position,” and GASB Statement No. 65, “Items Previously Reported as Assets and Liabilities,” the County recognized deferred outflows of resources in the Government-wide and proprietary fund statements. These items are a consumption of net position by the County that is applicable to a future reporting period. Previous financial reporting standards do not include guidance for reporting those financial statement elements, which are distinct from assets and liabilities.
The County has two items that are reportable on the Government-wide Statement of Net Position. The first item relates to outflows from changes in net OPEB liability (Note 15). The second item relates to outflows from changes in net pension liability (Note 14). In addition, deferred outflows of resources that are reported in the proprietary funds are included in the Government-wide Statement of Net Position.
Deferred outflows of resources balances for the year ended June 30, 2020 were as follows:
Governmental Business-TypeActivities Activities
Government-wide Deferred Outflows of ResourcesOPEB $ 685,758 $ -Pensions 28,640,096 -
Total Government-wide Deferred Outflows of Resources $ 29,325,854 $ -
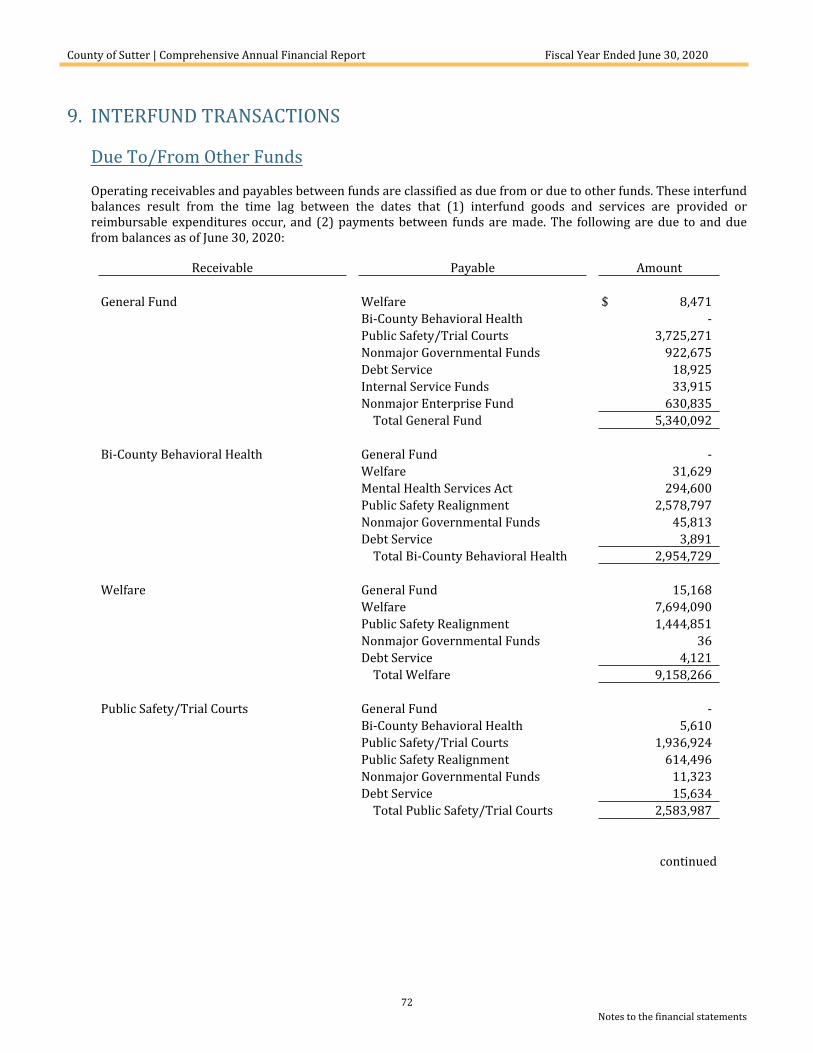
County of Sutter | Comprehensive Annual Financial Report Fiscal Year Ended June 30, 2020
72Notes to the financial statements
9. INTERFUND TRANSACTIONS
Due To/From Other Funds
Operating receivables and payables between funds are classified as due from or due to other funds. These interfund balances result from the time lag between the dates that (1) interfund goods and services are provided or reimbursable expenditures occur, and (2) payments between funds are made. The following are due to and due from balances as of June 30, 2020:
Receivable Payable Amount
General Fund Welfare $ 8,471Bi-County Behavioral Health -Public Safety/Trial Courts 3,725,271Nonmajor Governmental Funds 922,675Debt Service 18,925Internal Service Funds 33,915Nonmajor Enterprise Fund 630,835
Total General Fund 5,340,092
Bi-County Behavioral Health General Fund -Welfare 31,629Mental Health Services Act 294,600Public Safety Realignment 2,578,797Nonmajor Governmental Funds 45,813Debt Service 3,891
Total Bi-County Behavioral Health 2,954,729
Welfare General Fund 15,168Welfare 7,694,090Public Safety Realignment 1,444,851Nonmajor Governmental Funds 36Debt Service 4,121
Total Welfare 9,158,266
Public Safety/Trial Courts General Fund -Bi-County Behavioral Health 5,610Public Safety/Trial Courts 1,936,924Public Safety Realignment 614,496Nonmajor Governmental Funds 11,323Debt Service 15,634
Total Public Safety/Trial Courts 2,583,987
continued
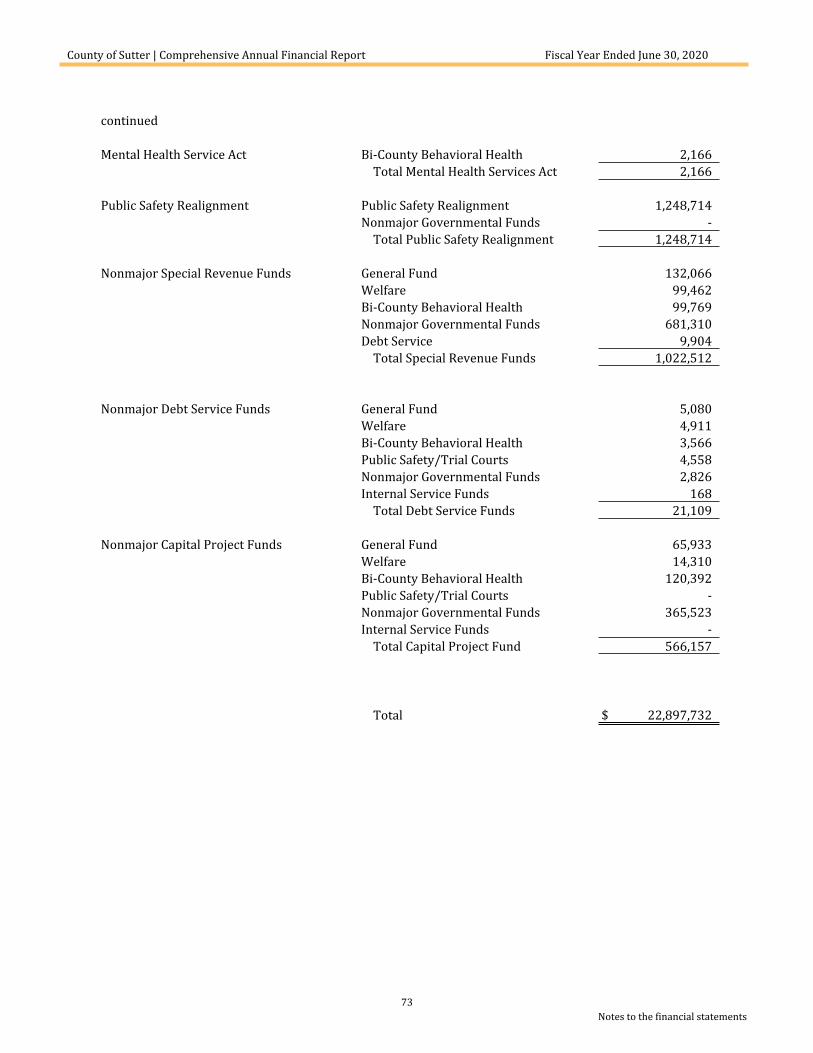
County of Sutter | Comprehensive Annual Financial Report Fiscal Year Ended June 30, 2020
73Notes to the financial statements
continued
Mental Health Service Act Bi-County Behavioral Health 2,166Total Mental Health Services Act 2,166
Public Safety Realignment Public Safety Realignment 1,248,714Nonmajor Governmental Funds -
Total Public Safety Realignment 1,248,714
Nonmajor Special Revenue Funds General Fund 132,066Welfare 99,462Bi-County Behavioral Health 99,769Nonmajor Governmental Funds 681,310Debt Service 9,904
Total Special Revenue Funds 1,022,512
Nonmajor Debt Service Funds General Fund 5,080Welfare 4,911Bi-County Behavioral Health 3,566Public Safety/Trial Courts 4,558Nonmajor Governmental Funds 2,826Internal Service Funds 168
Total Debt Service Funds 21,109
Nonmajor Capital Project Funds General Fund 65,933Welfare 14,310Bi-County Behavioral Health 120,392Public Safety/Trial Courts -Nonmajor Governmental Funds 365,523Internal Service Funds -
Total Capital Project Fund 566,157
Total $ 22,897,732
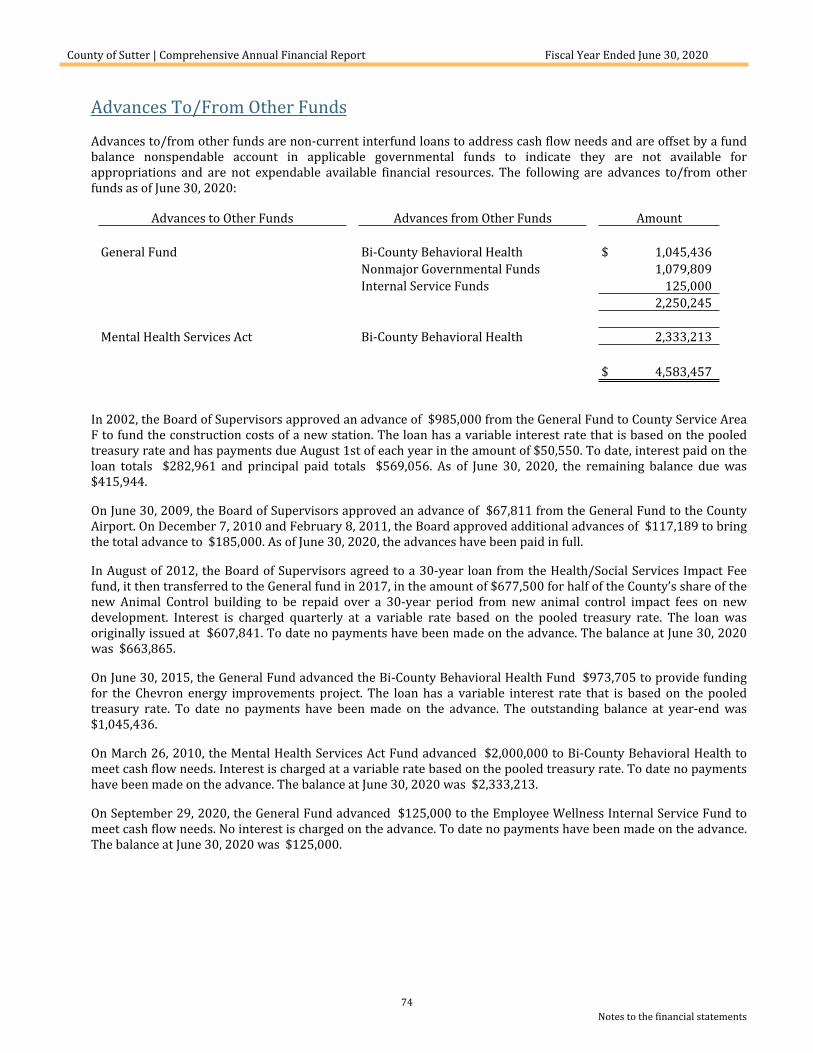
County of Sutter | Comprehensive Annual Financial Report Fiscal Year Ended June 30, 2020
74Notes to the financial statements
Advances To/From Other Funds
Advances to/from other funds are non-current interfund loans to address cash flow needs and are offset by a fund balance nonspendable account in applicable governmental funds to indicate they are not available for appropriations and are not expendable available financial resources. The following are advances to/from other funds as of June 30, 2020:
Advances to Other Funds Advances from Other Funds Amount
General Fund Bi-County Behavioral Health $ 1,045,436Nonmajor Governmental Funds 1,079,809Internal Service Funds 125,000
2,250,245
Mental Health Services Act Bi-County Behavioral Health 2,333,213
$ 4,583,457
In 2002, the Board of Supervisors approved an advance of $985,000 from the General Fund to County Service Area F to fund the construction costs of a new station. The loan has a variable interest rate that is based on the pooled treasury rate and has payments due August 1st of each year in the amount of $50,550. To date, interest paid on the loan totals $282,961 and principal paid totals $569,056. As of June 30, 2020, the remaining balance due was $415,944.
On June 30, 2009, the Board of Supervisors approved an advance of $67,811 from the General Fund to the County Airport. On December 7, 2010 and February 8, 2011, the Board approved additional advances of $117,189 to bring the total advance to $185,000. As of June 30, 2020, the advances have been paid in full.
In August of 2012, the Board of Supervisors agreed to a 30-year loan from the Health/Social Services Impact Fee fund, it then transferred to the General fund in 2017, in the amount of $677,500 for half of the County’s share of the new Animal Control building to be repaid over a 30-year period from new animal control impact fees on new development. Interest is charged quarterly at a variable rate based on the pooled treasury rate. The loan was originally issued at $607,841. To date no payments have been made on the advance. The balance at June 30, 2020 was $663,865.
On June 30, 2015, the General Fund advanced the Bi-County Behavioral Health Fund $973,705 to provide funding for the Chevron energy improvements project. The loan has a variable interest rate that is based on the pooled treasury rate. To date no payments have been made on the advance. The outstanding balance at year-end was $1,045,436.
On March 26, 2010, the Mental Health Services Act Fund advanced $2,000,000 to Bi-County Behavioral Health to meet cash flow needs. Interest is charged at a variable rate based on the pooled treasury rate. To date no payments have been made on the advance. The balance at June 30, 2020 was $2,333,213.
On September 29, 2020, the General Fund advanced $125,000 to the Employee Wellness Internal Service Fund to meet cash flow needs. No interest is charged on the advance. To date no payments have been made on the advance. The balance at June 30, 2020 was $125,000.
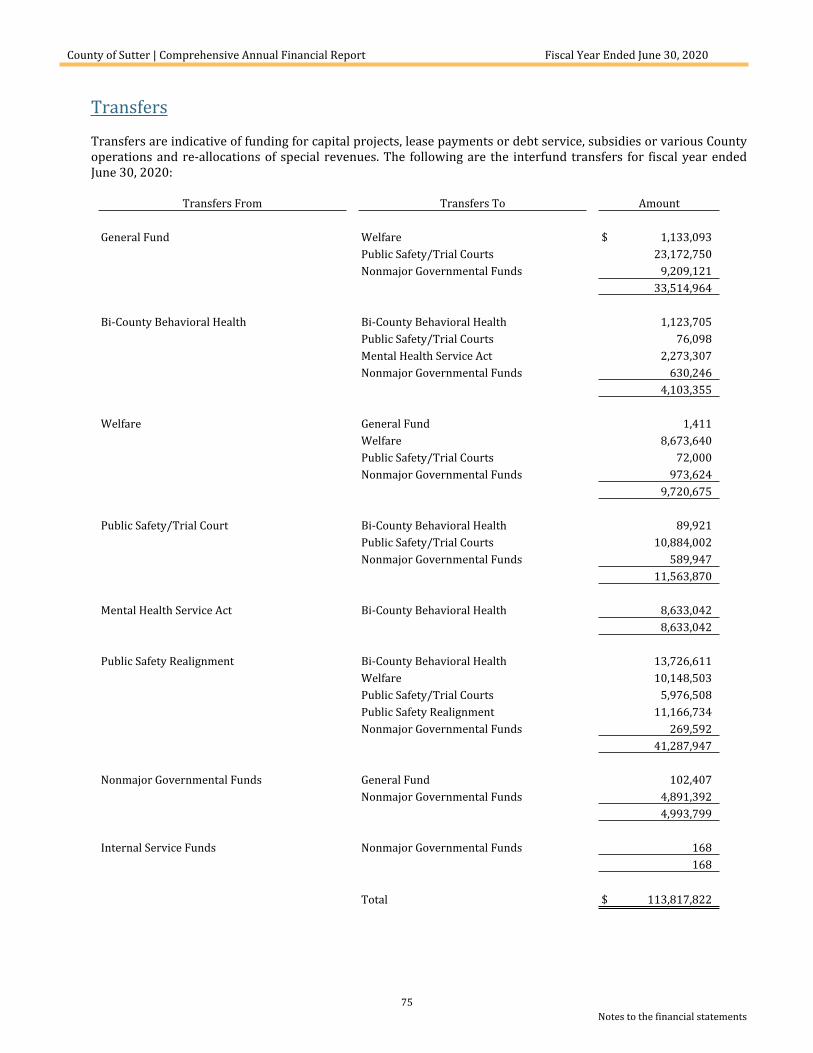
County of Sutter | Comprehensive Annual Financial Report Fiscal Year Ended June 30, 2020
75Notes to the financial statements
Transfers
Transfers are indicative of funding for capital projects, lease payments or debt service, subsidies or various County operations and re-allocations of special revenues. The following are the interfund transfers for fiscal year ended June 30, 2020:
Transfers From Transfers To Amount
General Fund Welfare $ 1,133,093Public Safety/Trial Courts 23,172,750Nonmajor Governmental Funds 9,209,121
33,514,964
Bi-County Behavioral Health Bi-County Behavioral Health 1,123,705Public Safety/Trial Courts 76,098Mental Health Service Act 2,273,307Nonmajor Governmental Funds 630,246
4,103,355
Welfare General Fund 1,411Welfare 8,673,640Public Safety/Trial Courts 72,000Nonmajor Governmental Funds 973,624
9,720,675
Public Safety/Trial Court Bi-County Behavioral Health 89,921Public Safety/Trial Courts 10,884,002Nonmajor Governmental Funds 589,947
11,563,870
Mental Health Service Act Bi-County Behavioral Health 8,633,0428,633,042
Public Safety Realignment Bi-County Behavioral Health 13,726,611Welfare 10,148,503Public Safety/Trial Courts 5,976,508Public Safety Realignment 11,166,734Nonmajor Governmental Funds 269,592
41,287,947
Nonmajor Governmental Funds General Fund 102,407Nonmajor Governmental Funds 4,891,392
4,993,799
Internal Service Funds Nonmajor Governmental Funds 168168
Total $ 113,817,822
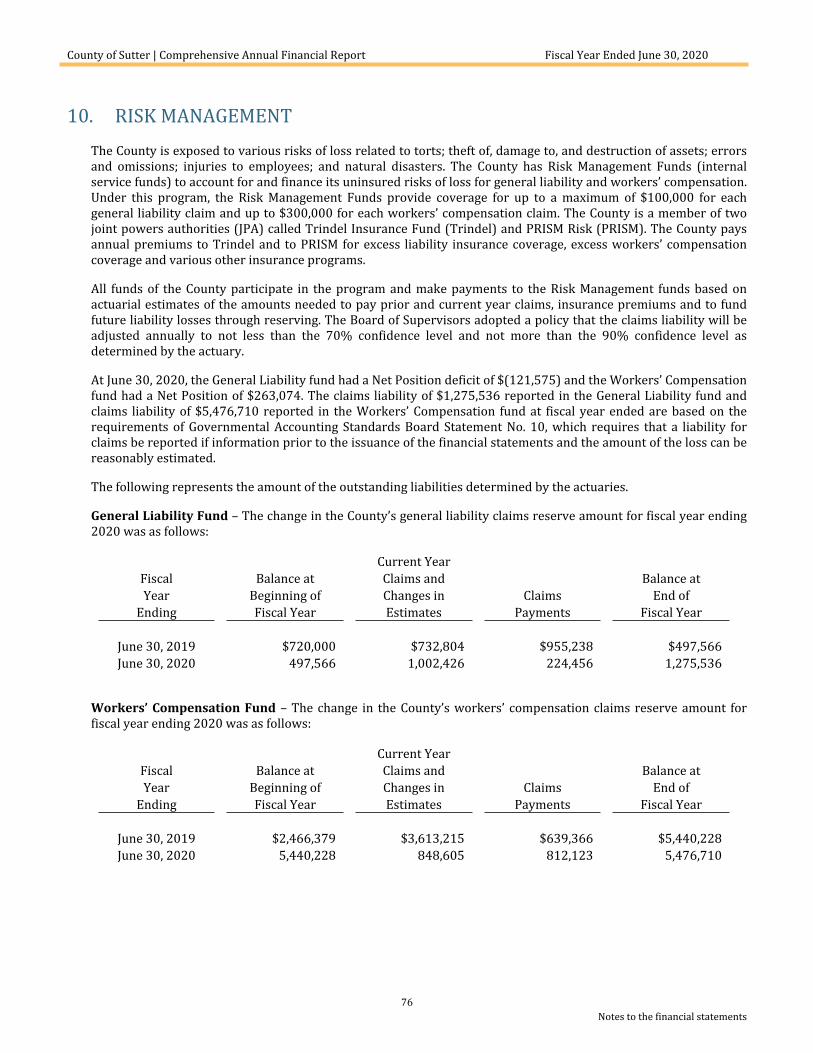
County of Sutter | Comprehensive Annual Financial Report Fiscal Year Ended June 30, 2020
76Notes to the financial statements
10. RISK MANAGEMENTThe County is exposed to various risks of loss related to torts; theft of, damage to, and destruction of assets; errors and omissions; injuries to employees; and natural disasters. The County has Risk Management Funds (internal service funds) to account for and finance its uninsured risks of loss for general liability and workers’ compensation. Under this program, the Risk Management Funds provide coverage for up to a maximum of $100,000 for each general liability claim and up to $300,000 for each workers’ compensation claim. The County is a member of two joint powers authorities (JPA) called Trindel Insurance Fund (Trindel) and PRISM Risk (PRISM). The County pays annual premiums to Trindel and to PRISM for excess liability insurance coverage, excess workers’ compensation coverage and various other insurance programs.
All funds of the County participate in the program and make payments to the Risk Management funds based on actuarial estimates of the amounts needed to pay prior and current year claims, insurance premiums and to fund future liability losses through reserving. The Board of Supervisors adopted a policy that the claims liability will be adjusted annually to not less than the 70% confidence level and not more than the 90% confidence level as determined by the actuary.
At June 30, 2020, the General Liability fund had a Net Position deficit of $(121,575) and the Workers’ Compensation fund had a Net Position of $263,074. The claims liability of $1,275,536 reported in the General Liability fund and claims liability of $5,476,710 reported in the Workers’ Compensation fund at fiscal year ended are based on the requirements of Governmental Accounting Standards Board Statement No. 10, which requires that a liability for claims be reported if information prior to the issuance of the financial statements and the amount of the loss can be reasonably estimated.
The following represents the amount of the outstanding liabilities determined by the actuaries.
General Liability Fund – The change in the County’s general liability claims reserve amount for fiscal year ending 2020 was as follows:
Current YearFiscal Balance at Claims and Balance atYear Beginning of Changes in Claims End of
Ending Fiscal Year Estimates Payments Fiscal Year
June 30, 2019 $720,000 $732,804 $955,238 $497,566June 30, 2020 497,566 1,002,426 224,456 1,275,536
Workers’ Compensation Fund – The change in the County’s workers’ compensation claims reserve amount for fiscal year ending 2020 was as follows:
Current YearFiscal Balance at Claims and Balance atYear Beginning of Changes in Claims End of
Ending Fiscal Year Estimates Payments Fiscal Year
June 30, 2019 $2,466,379 $3,613,215 $639,366 $5,440,228June 30, 2020 5,440,228 848,605 812,123 5,476,710
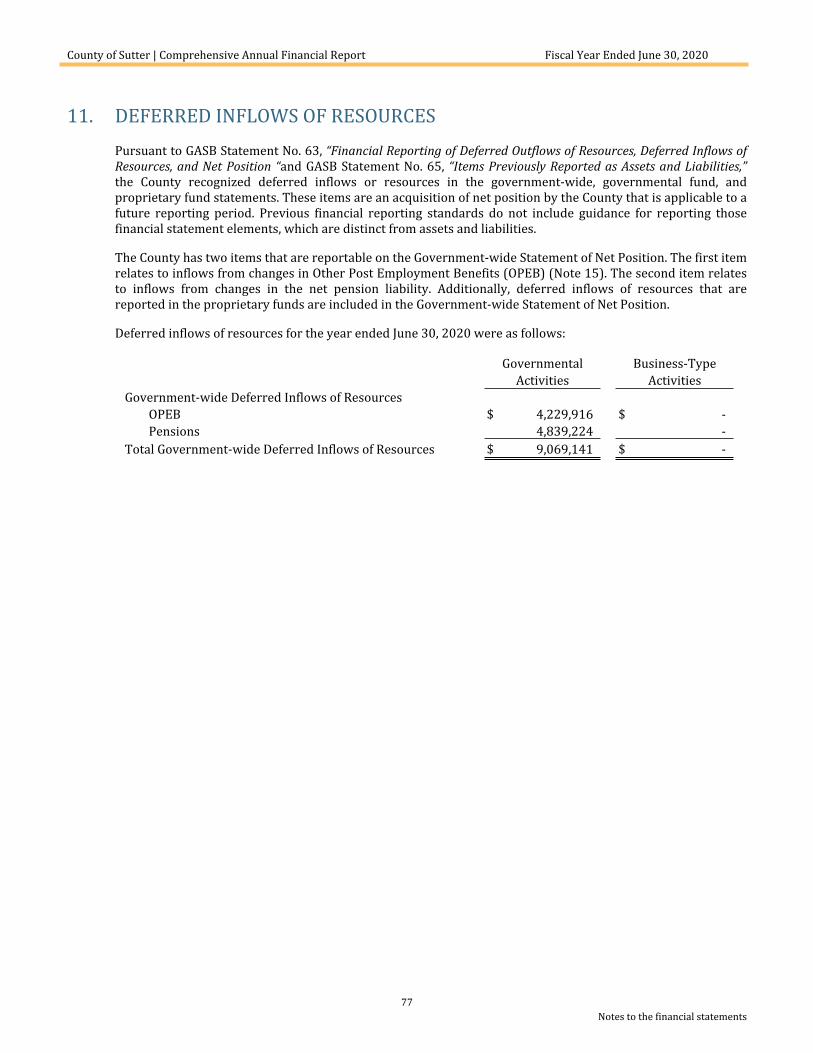
County of Sutter | Comprehensive Annual Financial Report Fiscal Year Ended June 30, 2020
77Notes to the financial statements
11. DEFERRED INFLOWS OF RESOURCESPursuant to GASB Statement No. 63, “Financial Reporting of Deferred Outflows of Resources, Deferred Inflows of Resources, and Net Position “and GASB Statement No. 65, “Items Previously Reported as Assets and Liabilities,” the County recognized deferred inflows or resources in the government-wide, governmental fund, and proprietary fund statements. These items are an acquisition of net position by the County that is applicable to a future reporting period. Previous financial reporting standards do not include guidance for reporting those financial statement elements, which are distinct from assets and liabilities.
The County has two items that are reportable on the Government-wide Statement of Net Position. The first item relates to inflows from changes in Other Post Employment Benefits (OPEB) (Note 15). The second item relates to inflows from changes in the net pension liability. Additionally, deferred inflows of resources that are reported in the proprietary funds are included in the Government-wide Statement of Net Position.
Deferred inflows of resources for the year ended June 30, 2020 were as follows:
Governmental Business-TypeActivities Activities
Government-wide Deferred Inflows of ResourcesOPEB $ 4,229,916 $ -Pensions 4,839,224 -
Total Government-wide Deferred Inflows of Resources $ 9,069,141 $ -
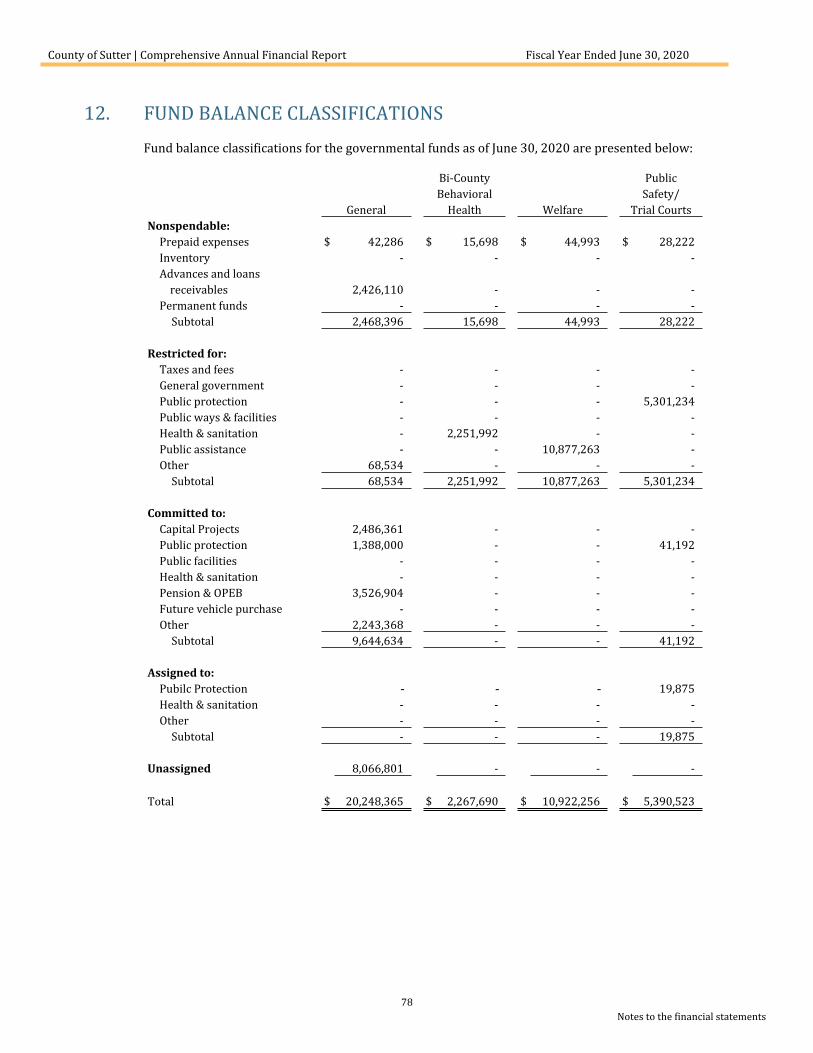
County of Sutter | Comprehensive Annual Financial Report Fiscal Year Ended June 30, 2020
78Notes to the financial statements
12. FUND BALANCE CLASSIFICATIONSFund balance classifications for the governmental funds as of June 30, 2020 are presented below:
Bi-County PublicBehavioral Safety/
General Health Welfare Trial CourtsNonspendable:
Prepaid expenses $ 42,286 $ 15,698 $ 44,993 $ 28,222Inventory - - - -Advances and loans receivables 2,426,110 - - -Permanent funds - - - -
Subtotal 2,468,396 15,698 44,993 28,222
Restricted for:Taxes and fees - - - -General government - - - -Public protection - - - 5,301,234Public ways & facilities - - - -Health & sanitation - 2,251,992 - -Public assistance - - 10,877,263 -Other 68,534 - - -
Subtotal 68,534 2,251,992 10,877,263 5,301,234
Committed to:Capital Projects 2,486,361 - - -Public protection 1,388,000 - - 41,192Public facilities - - - -Health & sanitation - - - -Pension & OPEB 3,526,904 - - -Future vehicle purchase - - - -Other 2,243,368 - - -
Subtotal 9,644,634 - - 41,192
Assigned to:Pubilc Protection - - - 19,875Health & sanitation - - - -Other - - - -
Subtotal - - - 19,875
Unassigned 8,066,801 - - -
Total $ 20,248,365 $ 2,267,690 $ 10,922,256 $ 5,390,523
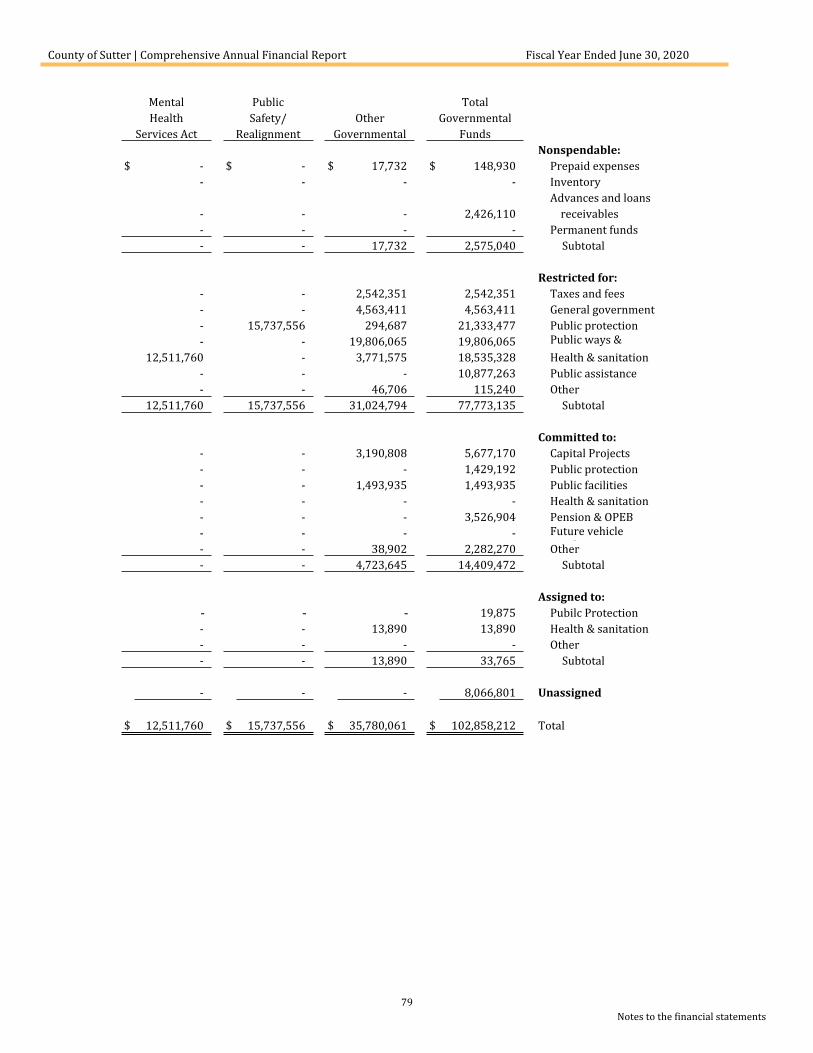
County of Sutter | Comprehensive Annual Financial Report Fiscal Year Ended June 30, 2020
79Notes to the financial statements
Mental Public TotalHealth Safety/ Other Governmental
Services Act Realignment Governmental FundsNonspendable:
$ - $ - $ 17,732 $ 148,930 Prepaid expenses- - - - Inventory
Advances and loans- - - 2,426,110 receivables- - - - Permanent funds- - 17,732 2,575,040 Subtotal
Restricted for:- - 2,542,351 2,542,351 Taxes and fees- - 4,563,411 4,563,411 General government- 15,737,556 294,687 21,333,477 Public protection- - 19,806,065 19,806,065 Public ways &
facilities12,511,760 - 3,771,575 18,535,328 Health & sanitation- - - 10,877,263 Public assistance- - 46,706 115,240 Other
12,511,760 15,737,556 31,024,794 77,773,135 Subtotal
Committed to:- - 3,190,808 5,677,170 Capital Projects- - - 1,429,192 Public protection- - 1,493,935 1,493,935 Public facilities- - - - Health & sanitation- - - 3,526,904 Pension & OPEB- - - - Future vehicle
purchase- - 38,902 2,282,270 Other- - 4,723,645 14,409,472 Subtotal
Assigned to:- - - 19,875 Pubilc Protection- - 13,890 13,890 Health & sanitation- - - - Other- - 13,890 33,765 Subtotal
- - - 8,066,801 Unassigned
$ 12,511,760 $ 15,737,556 $ 35,780,061 $ 102,858,212 Total
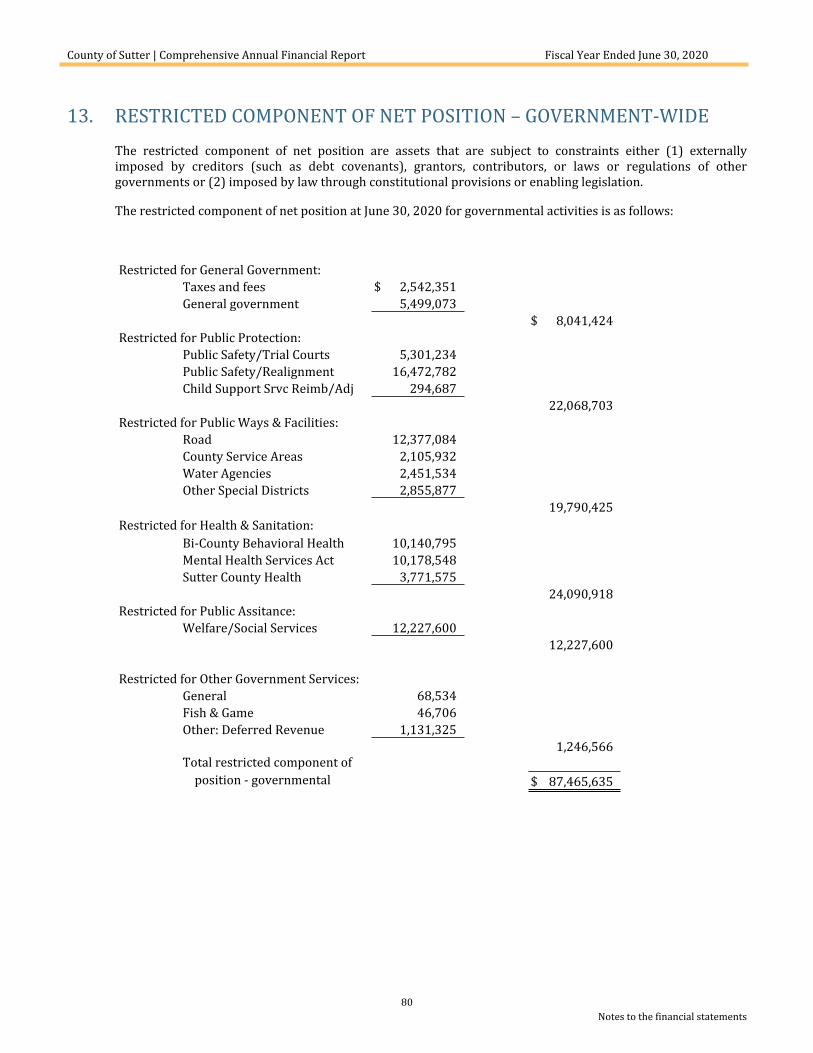
County of Sutter | Comprehensive Annual Financial Report Fiscal Year Ended June 30, 2020
80Notes to the financial statements
13. RESTRICTED COMPONENT OF NET POSITION – GOVERNMENT-WIDE
The restricted component of net position are assets that are subject to constraints either (1) externally imposed by creditors (such as debt covenants), grantors, contributors, or laws or regulations of other governments or (2) imposed by law through constitutional provisions or enabling legislation.
The restricted component of net position at June 30, 2020 for governmental activities is as follows:
Restricted for General Government:Taxes and fees $ 2,542,351General government 5,499,073
$ 8,041,424Restricted for Public Protection:
Public Safety/Trial Courts 5,301,234Public Safety/Realignment 16,472,782Child Support Srvc Reimb/Adj 294,687
22,068,703Restricted for Public Ways & Facilities:
Road 12,377,084County Service Areas 2,105,932Water Agencies 2,451,534Other Special Districts 2,855,877
19,790,425Restricted for Health & Sanitation:
Bi-County Behavioral Health 10,140,795Mental Health Services Act 10,178,548Sutter County Health 3,771,575
24,090,918Restricted for Public Assitance:
Welfare/Social Services 12,227,60012,227,600
Restricted for Other Government Services:General 68,534Fish & Game 46,706Other: Deferred Revenue 1,131,325
1,246,566Total restricted component of netposition - governmental
activities$ 87,465,635
County of Sutter | Comprehensive Annual Financial Report Fiscal Year Ended June 30, 2020
81Notes to the financial statements
14. EMPLOYEES’ RETIREMENT PLAN
A. General Information about the Pensions Plans
Plan Description
All qualified permanent and probationary employees are eligible to participate in the County’s Safety or Miscellaneous Plans. The County’s Safety Plan and the Miscellaneous Plan are both agent multiple-employer defined benefit pension plans. The County’s Safety and Miscellaneous Plans are part of the California Public Employees Retirement System (PERS), a public employee retirement system which acts as a common investment and administrative agent for participating public entities within the State of California. Benefit provisions and other requirements are established by State statute and County resolution. The County’s defined benefit pension plans provide retirement and disability benefits, annual cost-of-living adjustments and death benefits to plan members and their beneficiaries. The County selects optional benefit provisions by contract with CalPERS and adopts those benefits through County ordinance. CalPERS issues a separate comprehensive annual financial report; however, separate reports for the County’s Safety and Miscellaneous Plans are not available. Copies of CalPERS annual financial reports which include required supplementary information (RSI) for each plan may be obtained from CalPERS Executive Offices, Lincoln Plaza North, 400 Q Street, Sacramento, CA 95811.
Benefits Provided
All pension plans provide benefits, upon retirement, disability or death of members. Retirement benefits are based on years of service, final average compensation, and retirement age. Employees terminating before accruing five years of retirement service credit forfeit the right to receive retirement benefits unless they establish reciprocity with another public agency within a prescribed time period. Non-vested employees who terminate service are entitled to withdraw their accumulated contributions plus accrued interest. Employees who terminate service after earning five years of retirement service credit may leave their contributions on deposit and elect to take a deferred retirement. Differences between expected and actual experience for vested and non-vested benefits may result in an increase or decrease to pension expense and net pension liability.
Service related disability benefits are provided to safety members and are based on final compensation. Non-service related disability benefits are provided to both safety and miscellaneous members. The benefit is based on final compensation, multiplied by service, which is determined as follows:
service is CalPERS credited service, for members with less than 10 years of service or greater than 18.518 years of service; or
service is CalPERS credited service plus the additional number of years that the member would have worked until age 60, for members with at least 10 years but not more than 18.518 years of service.
Death benefits are based upon a variety of factors including whether the participant was retired or not.Annual cost-of-living adjustments (COLAs) after retirement are provided in all plans. COLAs are granted to retired members each May based upon the Bureau of Labor Statistics Average Consumer Price Index for All Urban Consumers for the previous calendar year and is subject to a maximum of 2% per annum.
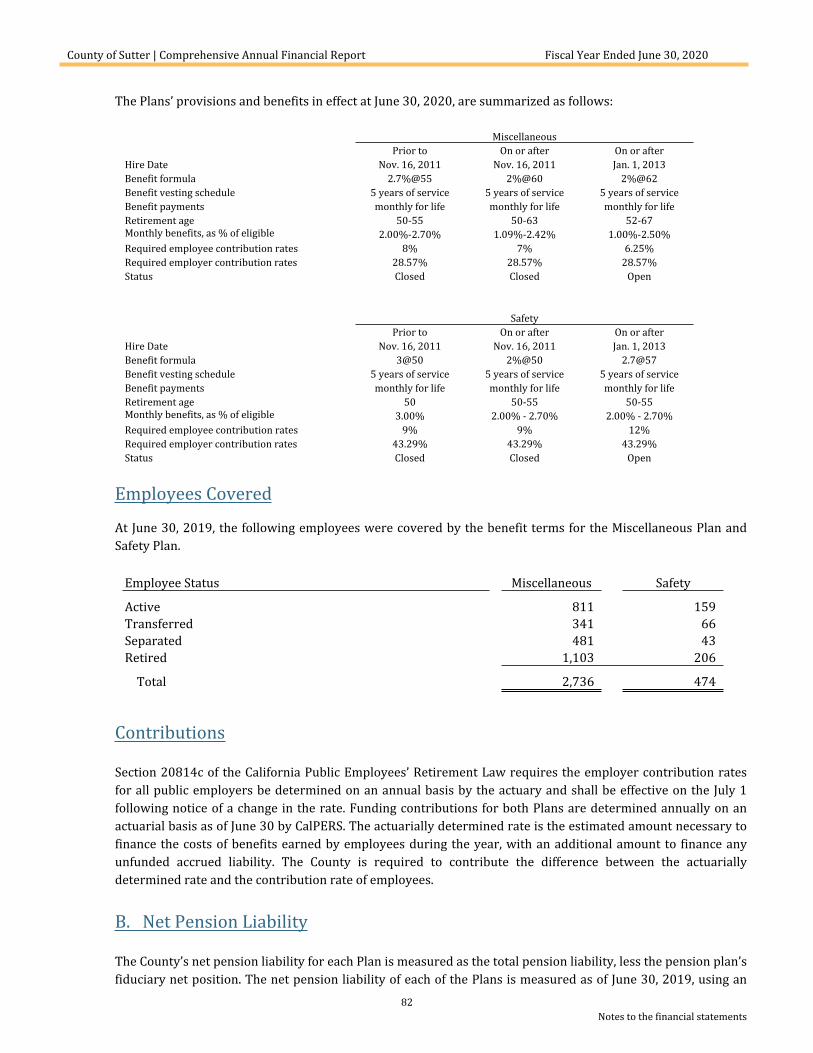
County of Sutter | Comprehensive Annual Financial Report Fiscal Year Ended June 30, 2020
82Notes to the financial statements
The Plans’ provisions and benefits in effect at June 30, 2020, are summarized as follows:
MiscellaneousPrior to On or after On or after
Hire Date Nov. 16, 2011 Nov. 16, 2011 Jan. 1, 2013Benefit formula 2.7%@55 2%@60 2%@62Benefit vesting schedule 5 years of service 5 years of service 5 years of serviceBenefit payments monthly for life monthly for life monthly for lifeRetirement age 50-55 50-63 52-67Monthly benefits, as % of eligible compensation
2.00%-2.70% 1.09%-2.42% 1.00%-2.50%Required employee contribution rates 8% 7% 6.25%Required employer contribution rates 28.57% 28.57% 28.57%Status Closed Closed Open
SafetyPrior to On or after On or after
Hire Date Nov. 16, 2011 Nov. 16, 2011 Jan. 1, 2013Benefit formula 3@50 2%@50 2.7@57Benefit vesting schedule 5 years of service 5 years of service 5 years of serviceBenefit payments monthly for life monthly for life monthly for lifeRetirement age 50 50-55 50-55Monthly benefits, as % of eligible compensation
3.00% 2.00% - 2.70% 2.00% - 2.70%Required employee contribution rates 9% 9% 12%Required employer contribution rates 43.29% 43.29% 43.29%Status Closed Closed Open
Employees Covered
At June 30, 2019, the following employees were covered by the benefit terms for the Miscellaneous Plan and Safety Plan.
Employee Status Miscellaneous Safety
Active 811 159Transferred 341 66Separated 481 43Retired 1,103 206
Total 2,736 474
Contributions
Section 20814c of the California Public Employees’ Retirement Law requires the employer contribution rates for all public employers be determined on an annual basis by the actuary and shall be effective on the July 1 following notice of a change in the rate. Funding contributions for both Plans are determined annually on an actuarial basis as of June 30 by CalPERS. The actuarially determined rate is the estimated amount necessary to finance the costs of benefits earned by employees during the year, with an additional amount to finance any unfunded accrued liability. The County is required to contribute the difference between the actuarially determined rate and the contribution rate of employees.
B. Net Pension Liability
The County’s net pension liability for each Plan is measured as the total pension liability, less the pension plan’s fiduciary net position. The net pension liability of each of the Plans is measured as of June 30, 2019, using an
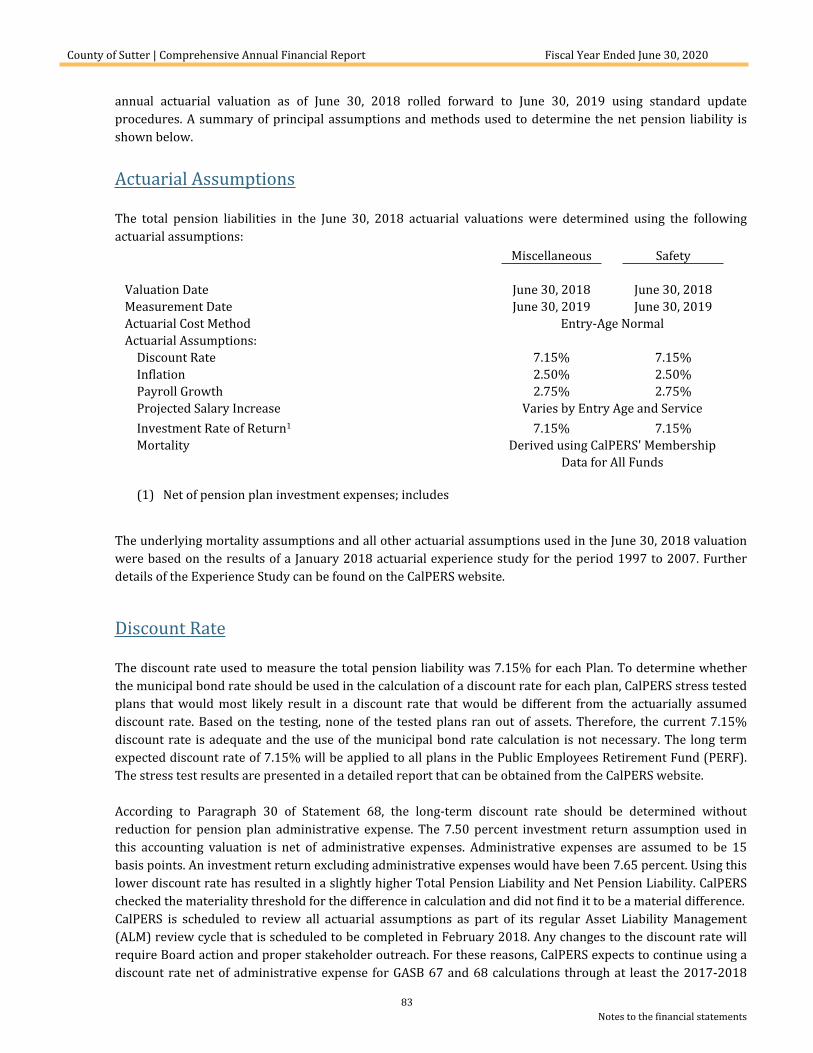
County of Sutter | Comprehensive Annual Financial Report Fiscal Year Ended June 30, 2020
83Notes to the financial statements
annual actuarial valuation as of June 30, 2018 rolled forward to June 30, 2019 using standard update procedures. A summary of principal assumptions and methods used to determine the net pension liability is shown below.
Actuarial Assumptions
The total pension liabilities in the June 30, 2018 actuarial valuations were determined using the following actuarial assumptions:
Miscellaneous Safety
Valuation Date June 30, 2018 June 30, 2018Measurement Date June 30, 2019 June 30, 2019Actuarial Cost Method Entry-Age NormalActuarial Assumptions:
Discount Rate 7.15% 7.15%Inflation 2.50% 2.50%Payroll Growth 2.75% 2.75%Projected Salary Increase Varies by Entry Age and ServiceInvestment Rate of Return1 7.15% 7.15%Mortality Derived using CalPERS' Membership
Data for All Funds
(1) Net of pension plan investment expenses; includes inflation.
The underlying mortality assumptions and all other actuarial assumptions used in the June 30, 2018 valuation were based on the results of a January 2018 actuarial experience study for the period 1997 to 2007. Further details of the Experience Study can be found on the CalPERS website.
Discount Rate
The discount rate used to measure the total pension liability was 7.15% for each Plan. To determine whether the municipal bond rate should be used in the calculation of a discount rate for each plan, CalPERS stress tested plans that would most likely result in a discount rate that would be different from the actuarially assumed discount rate. Based on the testing, none of the tested plans ran out of assets. Therefore, the current 7.15% discount rate is adequate and the use of the municipal bond rate calculation is not necessary. The long term expected discount rate of 7.15% will be applied to all plans in the Public Employees Retirement Fund (PERF). The stress test results are presented in a detailed report that can be obtained from the CalPERS website.
According to Paragraph 30 of Statement 68, the long-term discount rate should be determined without reduction for pension plan administrative expense. The 7.50 percent investment return assumption used in this accounting valuation is net of administrative expenses. Administrative expenses are assumed to be 15 basis points. An investment return excluding administrative expenses would have been 7.65 percent. Using this lower discount rate has resulted in a slightly higher Total Pension Liability and Net Pension Liability. CalPERS checked the materiality threshold for the difference in calculation and did not find it to be a material difference. CalPERS is scheduled to review all actuarial assumptions as part of its regular Asset Liability Management (ALM) review cycle that is scheduled to be completed in February 2018. Any changes to the discount rate will require Board action and proper stakeholder outreach. For these reasons, CalPERS expects to continue using a discount rate net of administrative expense for GASB 67 and 68 calculations through at least the 2017-2018
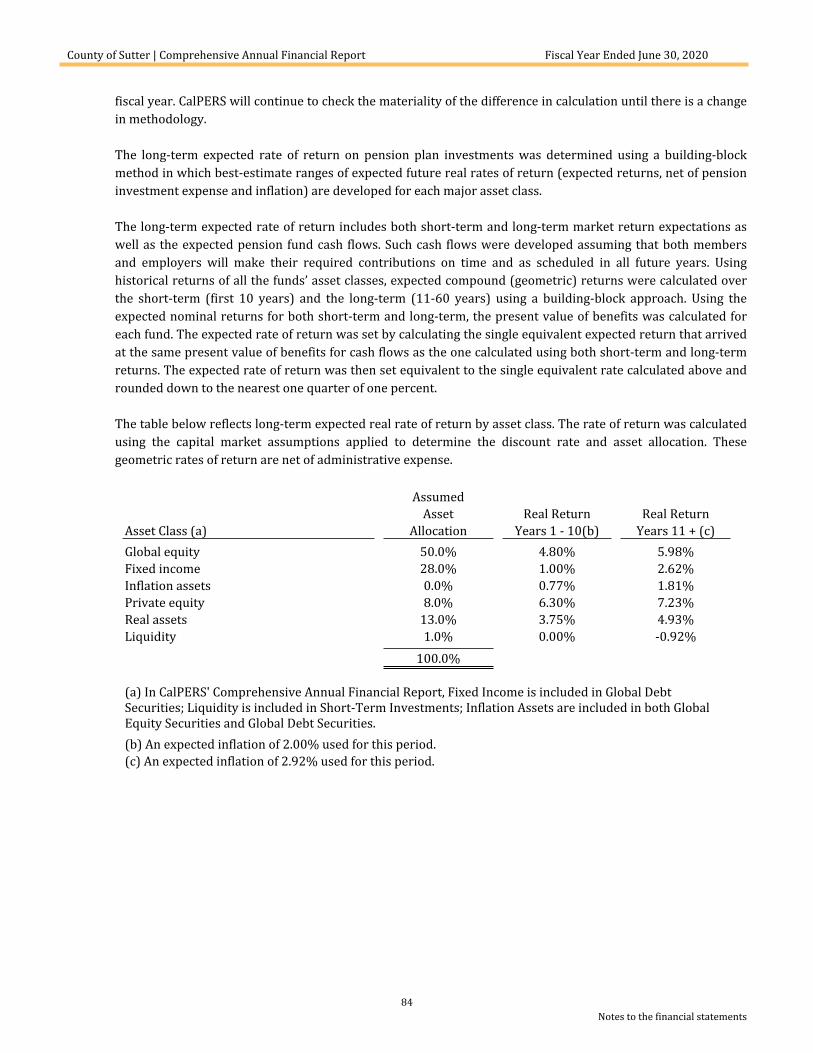
County of Sutter | Comprehensive Annual Financial Report Fiscal Year Ended June 30, 2020
84Notes to the financial statements
fiscal year. CalPERS will continue to check the materiality of the difference in calculation until there is a change in methodology.
The long-term expected rate of return on pension plan investments was determined using a building-block method in which best-estimate ranges of expected future real rates of return (expected returns, net of pension investment expense and inflation) are developed for each major asset class.
The long-term expected rate of return includes both short-term and long-term market return expectations as well as the expected pension fund cash flows. Such cash flows were developed assuming that both members and employers will make their required contributions on time and as scheduled in all future years. Using historical returns of all the funds’ asset classes, expected compound (geometric) returns were calculated over the short-term (first 10 years) and the long-term (11-60 years) using a building-block approach. Using the expected nominal returns for both short-term and long-term, the present value of benefits was calculated for each fund. The expected rate of return was set by calculating the single equivalent expected return that arrived at the same present value of benefits for cash flows as the one calculated using both short-term and long-term returns. The expected rate of return was then set equivalent to the single equivalent rate calculated above and rounded down to the nearest one quarter of one percent.
The table below reflects long-term expected real rate of return by asset class. The rate of return was calculated using the capital market assumptions applied to determine the discount rate and asset allocation. These geometric rates of return are net of administrative expense.
AssumedAsset Real Return Real Return
Asset Class (a) Allocation Years 1 - 10(b) Years 11 + (c)Global equity 50.0% 4.80% 5.98%Fixed income 28.0% 1.00% 2.62%Inflation assets 0.0% 0.77% 1.81%Private equity 8.0% 6.30% 7.23%Real assets 13.0% 3.75% 4.93%Liquidity 1.0% 0.00% -0.92%
100.0%
(a) In CalPERS' Comprehensive Annual Financial Report, Fixed Income is included in Global Debt Securities; Liquidity is included in Short-Term Investments; Inflation Assets are included in both Global Equity Securities and Global Debt Securities.(b) An expected inflation of 2.00% used for this period.(c) An expected inflation of 2.92% used for this period.
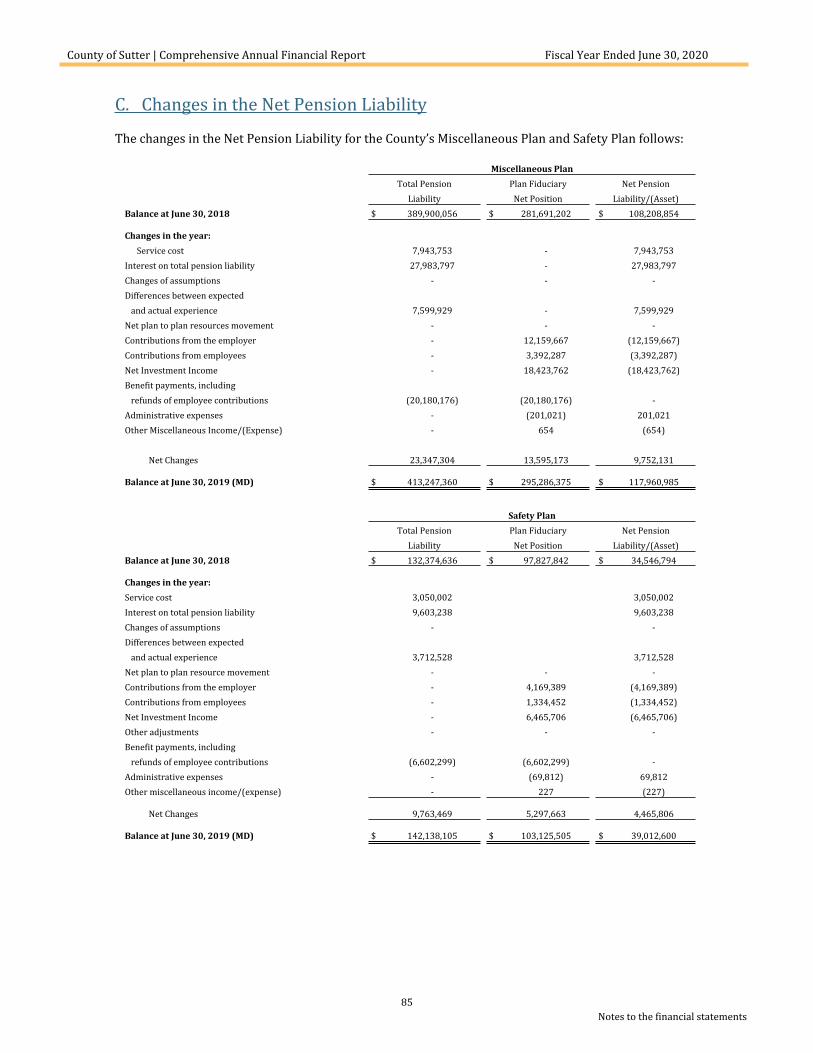
County of Sutter | Comprehensive Annual Financial Report Fiscal Year Ended June 30, 2020
85Notes to the financial statements
C. Changes in the Net Pension Liability
The changes in the Net Pension Liability for the County’s Miscellaneous Plan and Safety Plan follows:
Miscellaneous PlanTotal Pension Plan Fiduciary Net Pension
Liability Net Position Liability/(Asset)Balance at June 30, 2018 $ 389,900,056 $ 281,691,202 $ 108,208,854
Changes in the year:Service cost 7,943,753 - 7,943,753
Interest on total pension liability 27,983,797 - 27,983,797 Changes of assumptions - - - Differences between expected and actual experience 7,599,929 - 7,599,929 Net plan to plan resources movement - - - Contributions from the employer - 12,159,667 (12,159,667)Contributions from employees - 3,392,287 (3,392,287)Net Investment Income - 18,423,762 (18,423,762)Benefit payments, including refunds of employee contributions (20,180,176) (20,180,176) - Administrative expenses - (201,021) 201,021 Other Miscellaneous Income/(Expense) - 654 (654)
Net Changes 23,347,304 13,595,173 9,752,131
Balance at June 30, 2019 (MD) $ 413,247,360 $ 295,286,375 $ 117,960,985
Safety PlanTotal Pension Plan Fiduciary Net Pension
Liability Net Position Liability/(Asset)Balance at June 30, 2018 $ 132,374,636 $ 97,827,842 $ 34,546,794
Changes in the year:Service cost 3,050,002 3,050,002 Interest on total pension liability 9,603,238 9,603,238 Changes of assumptions - - Differences between expected and actual experience 3,712,528 3,712,528 Net plan to plan resource movement - - - Contributions from the employer - 4,169,389 (4,169,389)Contributions from employees - 1,334,452 (1,334,452)Net Investment Income - 6,465,706 (6,465,706)Other adjustments - - - Benefit payments, including refunds of employee contributions (6,602,299) (6,602,299) - Administrative expenses - (69,812) 69,812 Other miscellaneous income/(expense) - 227 (227)
Net Changes 9,763,469 5,297,663 4,465,806
Balance at June 30, 2019 (MD) $ 142,138,105 $ 103,125,505 $ 39,012,600
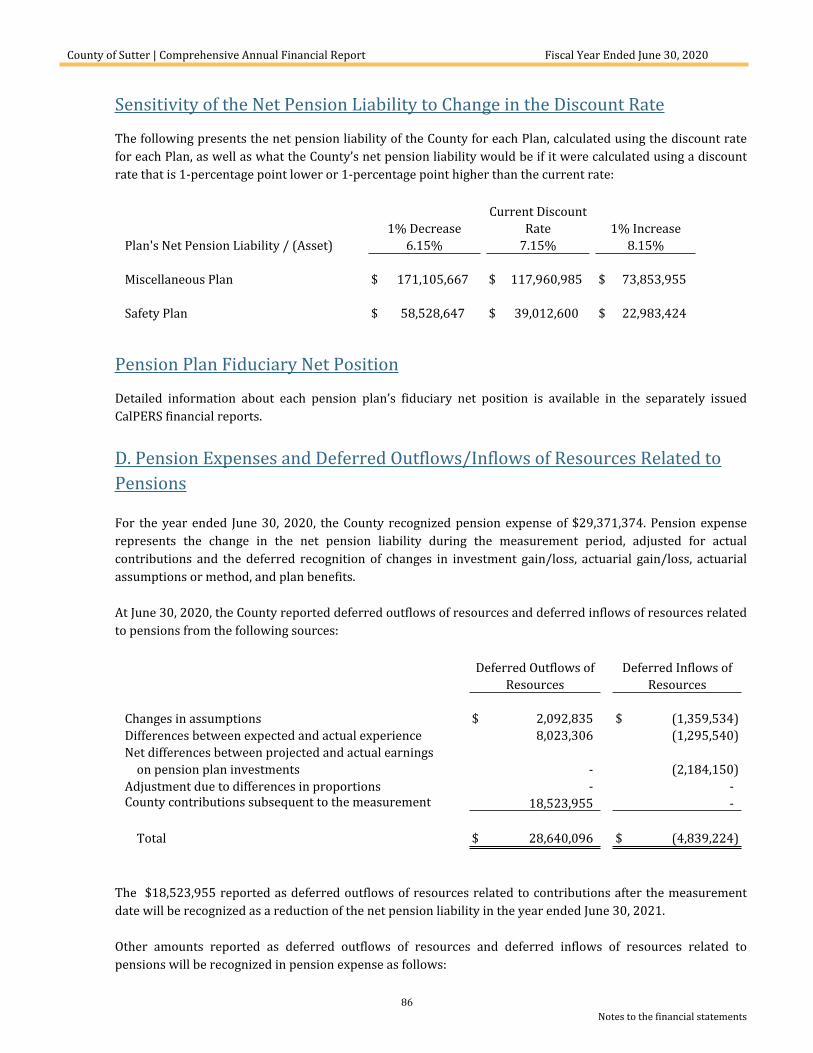
County of Sutter | Comprehensive Annual Financial Report Fiscal Year Ended June 30, 2020
86Notes to the financial statements
Sensitivity of the Net Pension Liability to Change in the Discount Rate
The following presents the net pension liability of the County for each Plan, calculated using the discount rate for each Plan, as well as what the County’s net pension liability would be if it were calculated using a discount rate that is 1-percentage point lower or 1-percentage point higher than the current rate:
Current Discount1% Decrease Rate 1% Increase
Plan's Net Pension Liability / (Asset) 6.15% 7.15% 8.15%
Miscellaneous Plan $ 171,105,667 $ 117,960,985 $ 73,853,955
Safety Plan $ 58,528,647 $ 39,012,600 $ 22,983,424
Pension Plan Fiduciary Net Position
Detailed information about each pension plan’s fiduciary net position is available in the separately issued CalPERS financial reports.
D. Pension Expenses and Deferred Outflows/Inflows of Resources Related to Pensions
For the year ended June 30, 2020, the County recognized pension expense of $29,371,374. Pension expense represents the change in the net pension liability during the measurement period, adjusted for actual contributions and the deferred recognition of changes in investment gain/loss, actuarial gain/loss, actuarial assumptions or method, and plan benefits.
At June 30, 2020, the County reported deferred outflows of resources and deferred inflows of resources related to pensions from the following sources:
Deferred Outflows of Deferred Inflows ofResources Resources
Changes in assumptions $ 2,092,835 $ (1,359,534)Differences between expected and actual experience 8,023,306 (1,295,540)Net differences between projected and actual earnings
on pension plan investments - (2,184,150)Adjustment due to differences in proportions - -County contributions subsequent to the measurement date
18,523,955 -
Total $ 28,640,096 $ (4,839,224)
The $18,523,955 reported as deferred outflows of resources related to contributions after the measurement date will be recognized as a reduction of the net pension liability in the year ended June 30, 2021.
Other amounts reported as deferred outflows of resources and deferred inflows of resources related to pensions will be recognized in pension expense as follows:
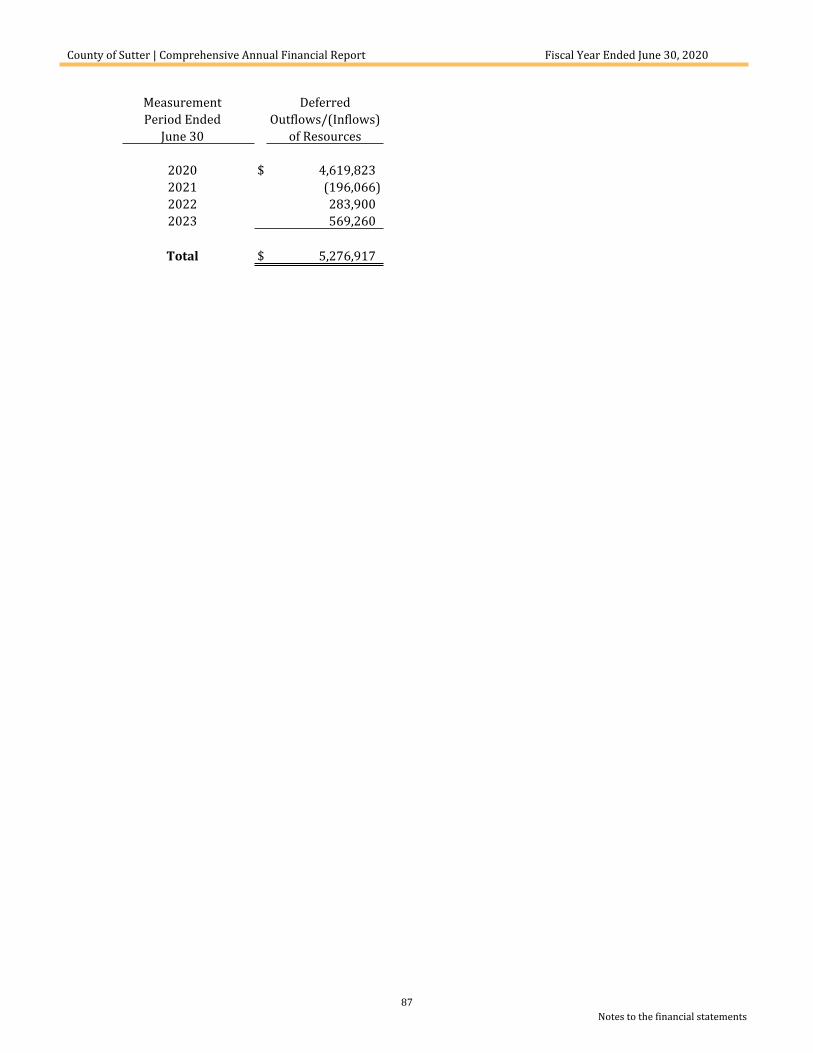
County of Sutter | Comprehensive Annual Financial Report Fiscal Year Ended June 30, 2020
87Notes to the financial statements
Measurement DeferredPeriod Ended Outflows/(Inflows)
June 30 of Resources
2020 $ 4,619,8232021 (196,066)2022 283,9002023 569,260
Total $ 5,276,917
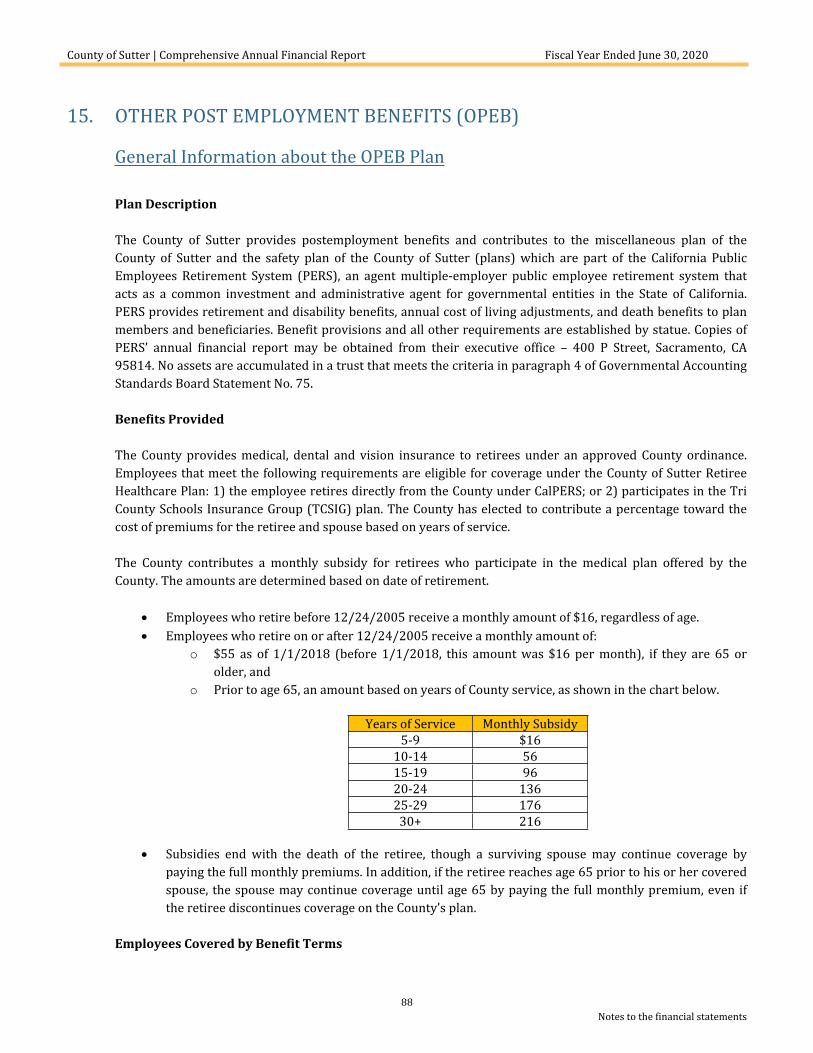
County of Sutter | Comprehensive Annual Financial Report Fiscal Year Ended June 30, 2020
88Notes to the financial statements
15. OTHER POST EMPLOYMENT BENEFITS (OPEB)
General Information about the OPEB Plan
Plan Description
The County of Sutter provides postemployment benefits and contributes to the miscellaneous plan of the County of Sutter and the safety plan of the County of Sutter (plans) which are part of the California Public Employees Retirement System (PERS), an agent multiple-employer public employee retirement system that acts as a common investment and administrative agent for governmental entities in the State of California. PERS provides retirement and disability benefits, annual cost of living adjustments, and death benefits to plan members and beneficiaries. Benefit provisions and all other requirements are established by statue. Copies of PERS’ annual financial report may be obtained from their executive office – 400 P Street, Sacramento, CA 95814. No assets are accumulated in a trust that meets the criteria in paragraph 4 of Governmental Accounting Standards Board Statement No. 75.
Benefits Provided
The County provides medical, dental and vision insurance to retirees under an approved County ordinance. Employees that meet the following requirements are eligible for coverage under the County of Sutter Retiree Healthcare Plan: 1) the employee retires directly from the County under CalPERS; or 2) participates in the Tri County Schools Insurance Group (TCSIG) plan. The County has elected to contribute a percentage toward the cost of premiums for the retiree and spouse based on years of service.
The County contributes a monthly subsidy for retirees who participate in the medical plan offered by the County. The amounts are determined based on date of retirement.
Employees who retire before 12/24/2005 receive a monthly amount of $16, regardless of age. Employees who retire on or after 12/24/2005 receive a monthly amount of:
o $55 as of 1/1/2018 (before 1/1/2018, this amount was $16 per month), if they are 65 or older, and
o Prior to age 65, an amount based on years of County service, as shown in the chart below.
Years of Service Monthly Subsidy5-9 $16
10-14 5615-19 9620-24 13625-29 176
30+ 216
Subsidies end with the death of the retiree, though a surviving spouse may continue coverage by paying the full monthly premiums. In addition, if the retiree reaches age 65 prior to his or her covered spouse, the spouse may continue coverage until age 65 by paying the full monthly premium, even if the retiree discontinues coverage on the County’s plan.
Employees Covered by Benefit Terms
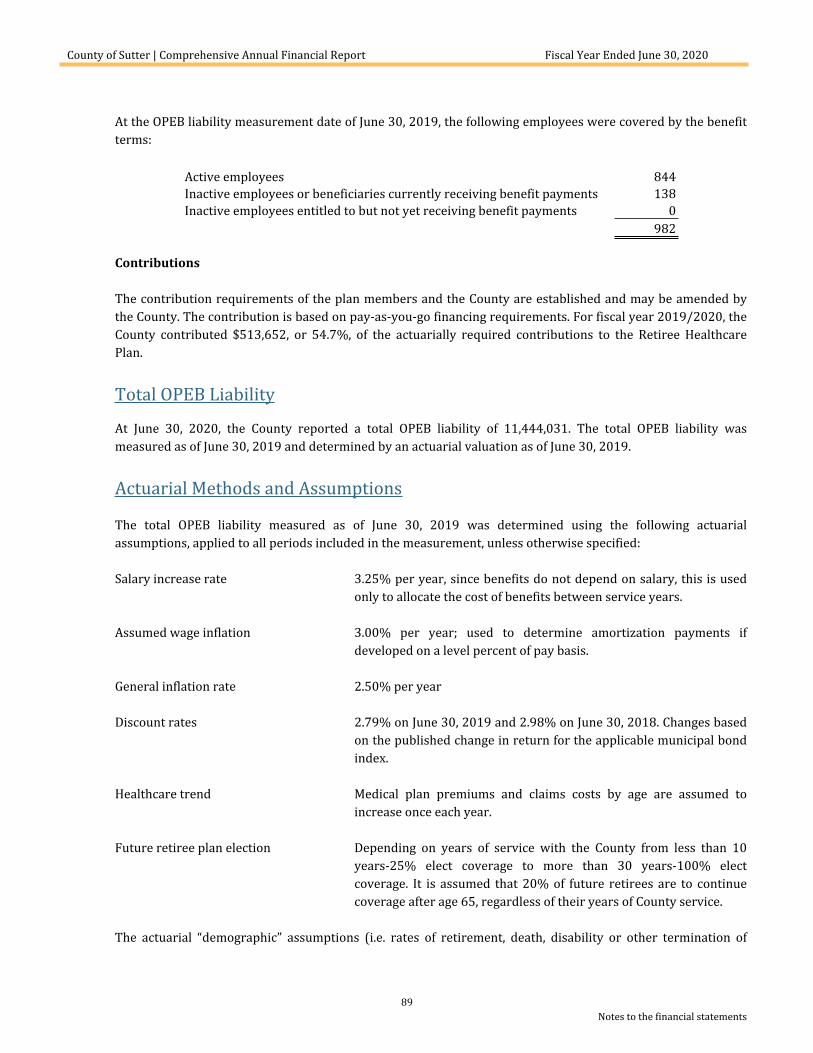
County of Sutter | Comprehensive Annual Financial Report Fiscal Year Ended June 30, 2020
89Notes to the financial statements
At the OPEB liability measurement date of June 30, 2019, the following employees were covered by the benefit terms:
Active employees 844Inactive employees or beneficiaries currently receiving benefit payments 138Inactive employees entitled to but not yet receiving benefit payments 0
982
Contributions
The contribution requirements of the plan members and the County are established and may be amended by the County. The contribution is based on pay-as-you-go financing requirements. For fiscal year 2019/2020, the County contributed $513,652, or 54.7%, of the actuarially required contributions to the Retiree Healthcare Plan.
Total OPEB Liability
At June 30, 2020, the County reported a total OPEB liability of 11,444,031. The total OPEB liability was measured as of June 30, 2019 and determined by an actuarial valuation as of June 30, 2019.
Actuarial Methods and Assumptions
The total OPEB liability measured as of June 30, 2019 was determined using the following actuarial assumptions, applied to all periods included in the measurement, unless otherwise specified:
Salary increase rate 3.25% per year, since benefits do not depend on salary, this is used only to allocate the cost of benefits between service years.
Assumed wage inflation 3.00% per year; used to determine amortization payments if developed on a level percent of pay basis.
General inflation rate 2.50% per year
Discount rates 2.79% on June 30, 2019 and 2.98% on June 30, 2018. Changes based on the published change in return for the applicable municipal bond index.
Healthcare trend Medical plan premiums and claims costs by age are assumed to increase once each year.
Future retiree plan election Depending on years of service with the County from less than 10 years-25% elect coverage to more than 30 years-100% elect coverage. It is assumed that 20% of future retirees are to continue coverage after age 65, regardless of their years of County service.
The actuarial “demographic” assumptions (i.e. rates of retirement, death, disability or other termination of
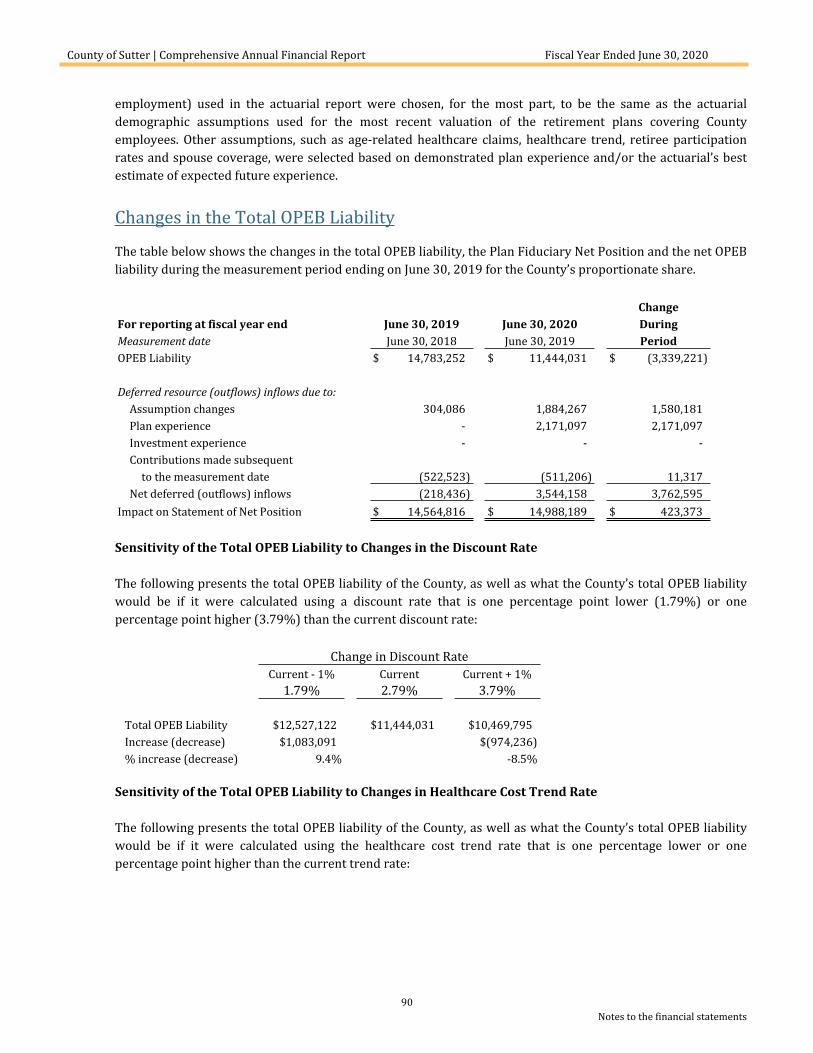
County of Sutter | Comprehensive Annual Financial Report Fiscal Year Ended June 30, 2020
90Notes to the financial statements
employment) used in the actuarial report were chosen, for the most part, to be the same as the actuarial demographic assumptions used for the most recent valuation of the retirement plans covering County employees. Other assumptions, such as age-related healthcare claims, healthcare trend, retiree participation rates and spouse coverage, were selected based on demonstrated plan experience and/or the actuarial’s best estimate of expected future experience.
Changes in the Total OPEB Liability
The table below shows the changes in the total OPEB liability, the Plan Fiduciary Net Position and the net OPEB liability during the measurement period ending on June 30, 2019 for the County’s proportionate share.
ChangeFor reporting at fiscal year end June 30, 2019 June 30, 2020 During Measurement date June 30, 2018 June 30, 2019 PeriodOPEB Liability $ 14,783,252 $ 11,444,031 $ (3,339,221)
Deferred resource (outflows) inflows due to:Assumption changes 304,086 1,884,267 1,580,181Plan experience - 2,171,097 2,171,097Investment experience - - -Contributions made subsequent
to the measurement date (522,523) (511,206) 11,317Net deferred (outflows) inflows (218,436) 3,544,158 3,762,595
Impact on Statement of Net Position $ 14,564,816 $ 14,988,189 $ 423,373
Sensitivity of the Total OPEB Liability to Changes in the Discount Rate
The following presents the total OPEB liability of the County, as well as what the County’s total OPEB liability would be if it were calculated using a discount rate that is one percentage point lower (1.79%) or one percentage point higher (3.79%) than the current discount rate:
Change in Discount RateCurrent - 1% Current Current + 1%
1.79% 2.79% 3.79%
Total OPEB Liability $12,527,122 $11,444,031 $10,469,795Increase (decrease) $1,083,091 $(974,236)% increase (decrease) 9.4% -8.5%
Sensitivity of the Total OPEB Liability to Changes in Healthcare Cost Trend Rate
The following presents the total OPEB liability of the County, as well as what the County’s total OPEB liability would be if it were calculated using the healthcare cost trend rate that is one percentage lower or one percentage point higher than the current trend rate:
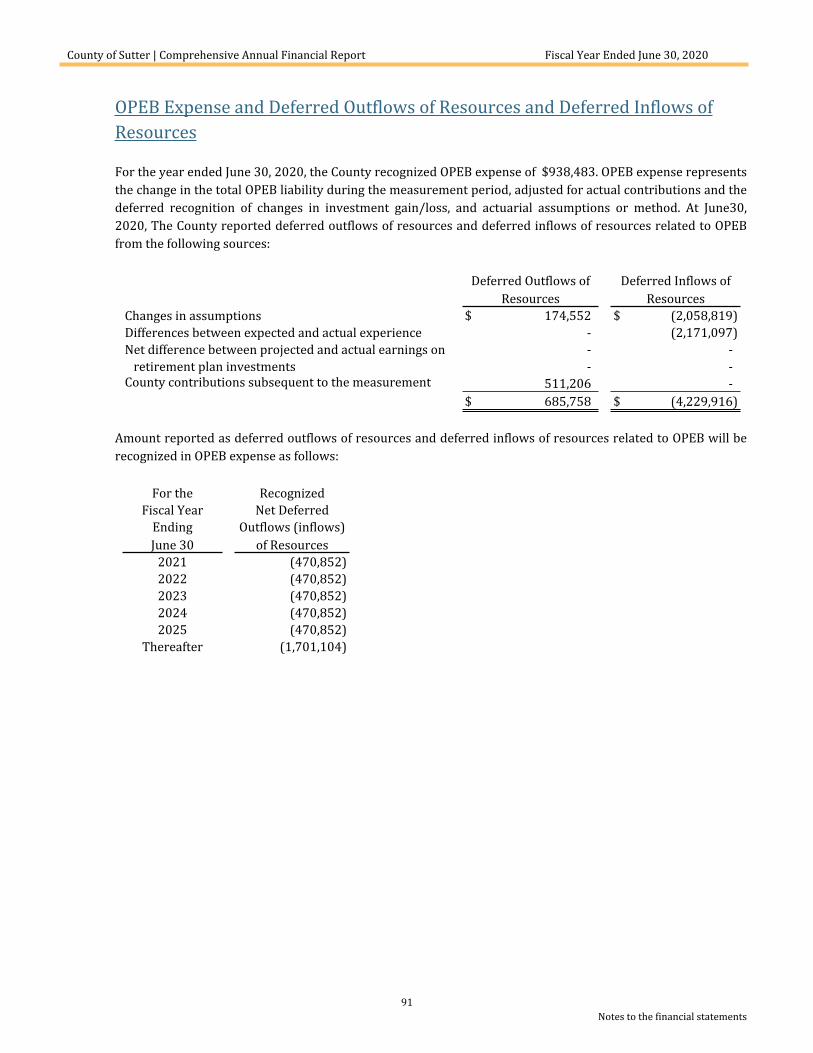
County of Sutter | Comprehensive Annual Financial Report Fiscal Year Ended June 30, 2020
91Notes to the financial statements
OPEB Expense and Deferred Outflows of Resources and Deferred Inflows of Resources
For the year ended June 30, 2020, the County recognized OPEB expense of $938,483. OPEB expense represents the change in the total OPEB liability during the measurement period, adjusted for actual contributions and the deferred recognition of changes in investment gain/loss, and actuarial assumptions or method. At June30, 2020, The County reported deferred outflows of resources and deferred inflows of resources related to OPEB from the following sources:
Deferred Outflows of Deferred Inflows of Resources Resources
Changes in assumptions $ 174,552 $ (2,058,819)Differences between expected and actual experience - (2,171,097)Net difference between projected and actual earnings on - - retirement plan investments - -County contributions subsequent to the measurement date
511,206 -$ 685,758 $ (4,229,916)
Amount reported as deferred outflows of resources and deferred inflows of resources related to OPEB will be recognized in OPEB expense as follows:
For the RecognizedFiscal Year Net Deferred
Ending Outflows (inflows)June 30 of Resources
2021 (470,852)2022 (470,852)2023 (470,852)2024 (470,852)2025 (470,852)
Thereafter (1,701,104)
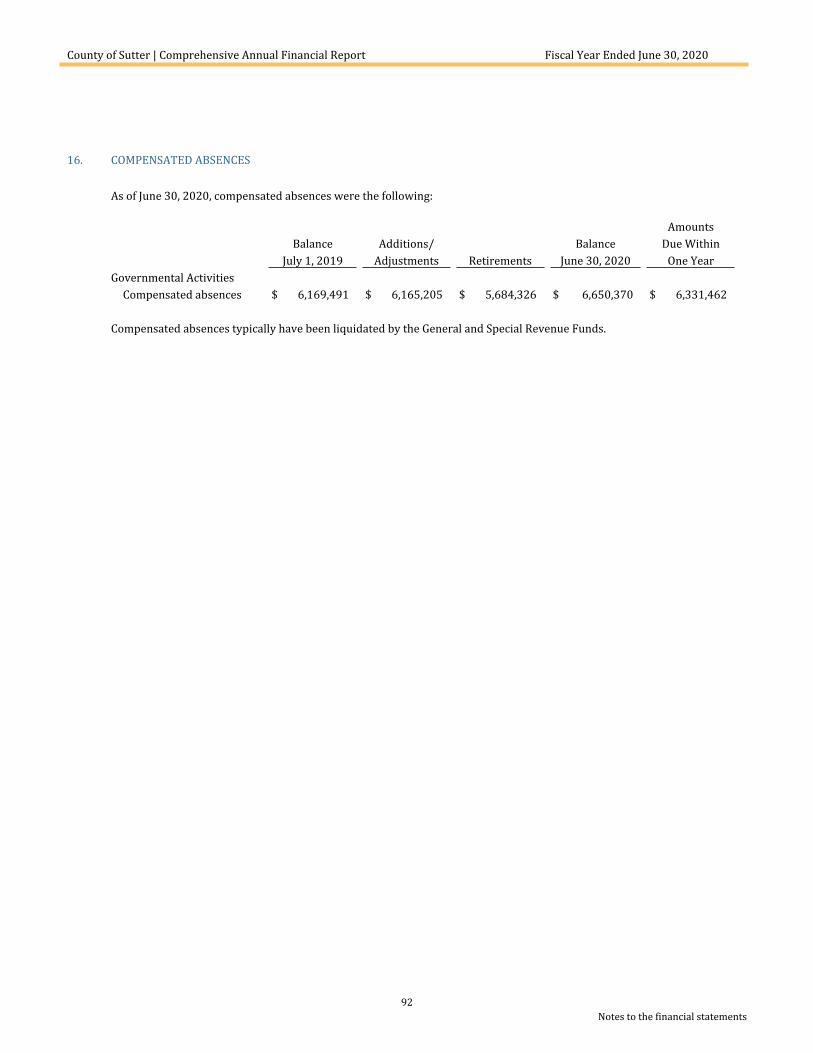
County of Sutter | Comprehensive Annual Financial Report Fiscal Year Ended June 30, 2020
92Notes to the financial statements
16. COMPENSATED ABSENCES
As of June 30, 2020, compensated absences were the following:
AmountsBalance Additions/ Balance Due Within
July 1, 2019 Adjustments Retirements June 30, 2020 One YearGovernmental Activities
Compensated absences $ 6,169,491 $ 6,165,205 $ 5,684,326 $ 6,650,370 $ 6,331,462
Compensated absences typically have been liquidated by the General and Special Revenue Funds.
County of Sutter | Comprehensive Annual Financial Report Fiscal Year Ended June 30, 2020
93Notes to the financial statements
17. OTHER INFORMATION
A. Construction Commitments
At June 30, 2020, the County does not have commitments for construction contracts.
B. Contingent Liabilities
Grants
Amounts received or receivable from grant agencies are subject to audit and adjustment by grantor agencies. Any disallowed claims, including amounts already collected, may constitute a liability of the applicable funds. The amount of expenditures which may be disallowed by the grantor cannot be determined at this time; although the County expects any such amounts to be immaterial.
Other Claims
The County is subject to various lawsuits, inverse condemnation cases, personnel actions, disputes over tax assessments, and other actions incidental to the ordinary course of County operations. In the opinion of the County Counsel, the total potential claims against the County not covered by insurance resulting from litigation would not materially affect the financial statements of the County at June 30, 2020.
C. Joint Agencies
The CSAC Excess Insurance Authority is a joint powers authority organized to develop and fund excess insurance programs for member counties. The Authority operates public entity risk pools for workers’ compensation, comprehensive liability, property, medical malpractice, and pool purchases excess insurance and services for members. The Authority is under the control and direction of a board of directors consisting of representatives of the fifty-member counties.
Completed audited financial statements for CSAC Excess Insurance Authority can be obtained from the Authority’s office at 75 Iron Point Circle, Suite 200, Folsom, California 95630.
D. Restatement of Fund Balance
During fiscal year 2019-20, it was determined that wraparound service activities should be included as part of the Welfare major fund as opposed to the Bi-County Behavioral Health major fund for financial statement reporting. Wraparound is a family-centered, strengths-based, needs-driven planning process for creating individualized services and supports for children, youth, and their families that facilitate access to normalized and inclusive community options, activities, and opportunities. The table below presents the restatement adjustment and corresponding adjusted beginning fund balance.
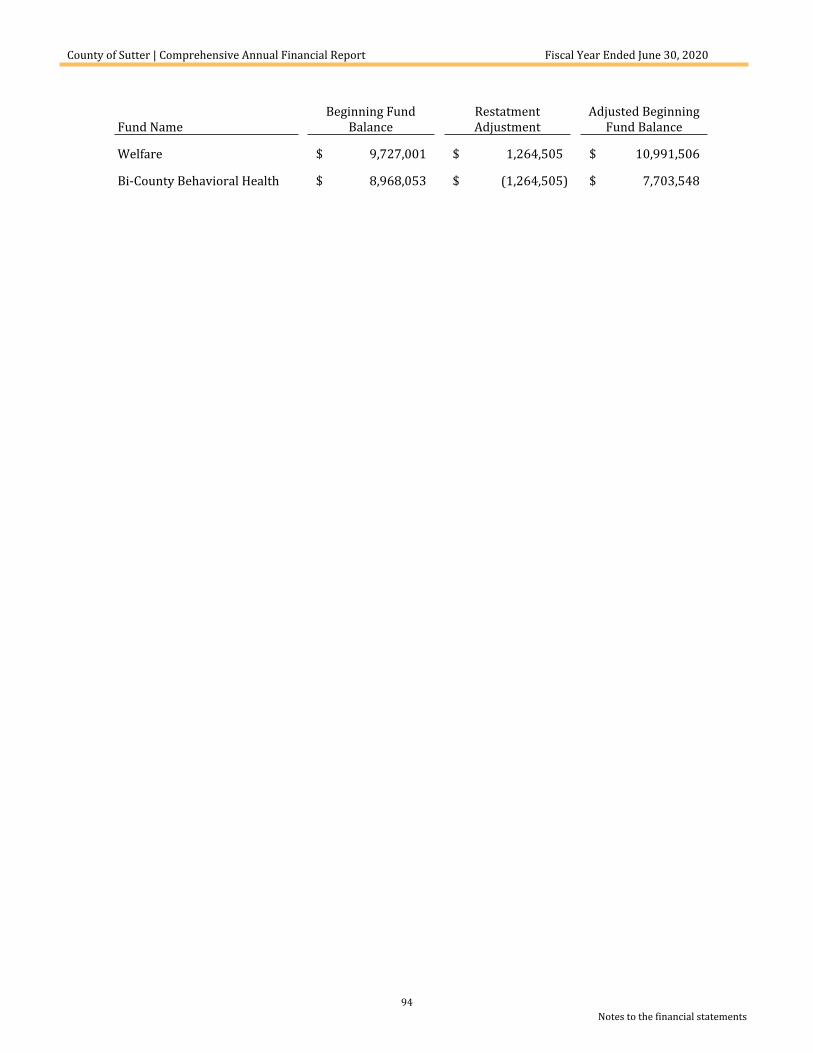
County of Sutter | Comprehensive Annual Financial Report Fiscal Year Ended June 30, 2020
94Notes to the financial statements
Fund NameBeginning Fund
BalanceRestatment Adjustment
Adjusted Beginning Fund Balance
Welfare $ 9,727,001 $ 1,264,505 $ 10,991,506
Bi-County Behavioral Health $ 8,968,053 $ (1,264,505) $ 7,703,548
County of Sutter | Comprehensive Annual Financial Report Fiscal Year Ended June 30, 2020
95Notes to the financial statements
18. SUBSEQUENT EVENTS
A. COVID-19 PANDEMIC
On March 27, 2020, the Coronavirus Aid, Relief, and Economic Security Act (CARES Act) was passed. This act made funding available to local governments for costs associated with the activities in response to COVID-19. From July to October 2002, the County received CARES Act funding that totaled $10,272,390.
Potential impacts to our future tax revenues include disruptions or restrictions on our current employees’ ability to work. Any of the foregoing could negatively impact our revenues and we currently can’t anticipate all of the ways in which this health pandemic, COVID-19, could adversely impact our government agency.
On October 13, 2020, the Board of Supervisors unanimously approved awarding of grants to existing borrowers of Economic Resiliency Loans. The grant awards were used to forgive $210,000 of the $250,000 of loans previously approved by the board on April 7, 2020. These grant awards were funded through the CARES Act.


Required SupplementaryInformation

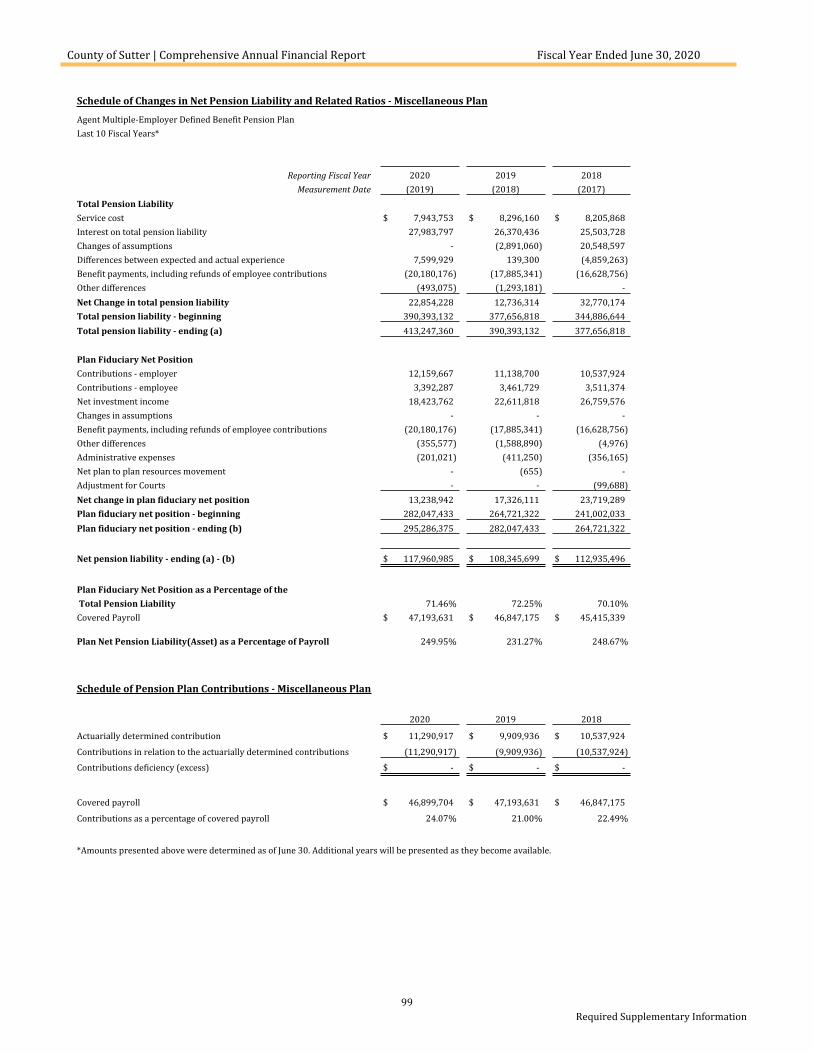
County of Sutter | Comprehensive Annual Financial Report Fiscal Year Ended June 30, 2020
99Required Supplementary Information
Schedule of Changes in Net Pension Liability and Related Ratios - Miscellaneous Plan
Agent Multiple-Employer Defined Benefit Pension PlanLast 10 Fiscal Years*
Reporting Fiscal Year 2020 2019 2018Measurement Date (2019) (2018) (2017)
Total Pension LiabilityService cost $ 7,943,753 $ 8,296,160 $ 8,205,868Interest on total pension liability 27,983,797 26,370,436 25,503,728Changes of assumptions - (2,891,060) 20,548,597Differences between expected and actual experience 7,599,929 139,300 (4,859,263)Benefit payments, including refunds of employee contributions (20,180,176) (17,885,341) (16,628,756)Other differences (493,075) (1,293,181) -Net Change in total pension liability 22,854,228 12,736,314 32,770,174Total pension liability - beginning 390,393,132 377,656,818 344,886,644Total pension liability - ending (a) 413,247,360 390,393,132 377,656,818
Plan Fiduciary Net PositionContributions - employer 12,159,667 11,138,700 10,537,924Contributions - employee 3,392,287 3,461,729 3,511,374Net investment income 18,423,762 22,611,818 26,759,576Changes in assumptions - - -Benefit payments, including refunds of employee contributions (20,180,176) (17,885,341) (16,628,756)Other differences (355,577) (1,588,890) (4,976)Administrative expenses (201,021) (411,250) (356,165)Net plan to plan resources movement - (655) -Adjustment for Courts - - (99,688)Net change in plan fiduciary net position 13,238,942 17,326,111 23,719,289Plan fiduciary net position - beginning 282,047,433 264,721,322 241,002,033Plan fiduciary net position - ending (b) 295,286,375 282,047,433 264,721,322
Net pension liability - ending (a) - (b) $ 117,960,985 $ 108,345,699 $ 112,935,496
Plan Fiduciary Net Position as a Percentage of the Total Pension Liability 71.46% 72.25% 70.10%Covered Payroll $ 47,193,631 $ 46,847,175 $ 45,415,339
Plan Net Pension Liability(Asset) as a Percentage of Payroll 249.95% 231.27% 248.67%
Schedule of Pension Plan Contributions - Miscellaneous Plan
2020 2019 2018
Actuarially determined contribution $ 11,290,917 $ 9,909,936 $ 10,537,924
Contributions in relation to the actuarially determined contributions (11,290,917) (9,909,936) (10,537,924)
Contributions deficiency (excess) $ - $ - $ -
Covered payroll $ 46,899,704 $ 47,193,631 $ 46,847,175
Contributions as a percentage of covered payroll 24.07% 21.00% 22.49%
*Amounts presented above were determined as of June 30. Additional years will be presented as they become available.
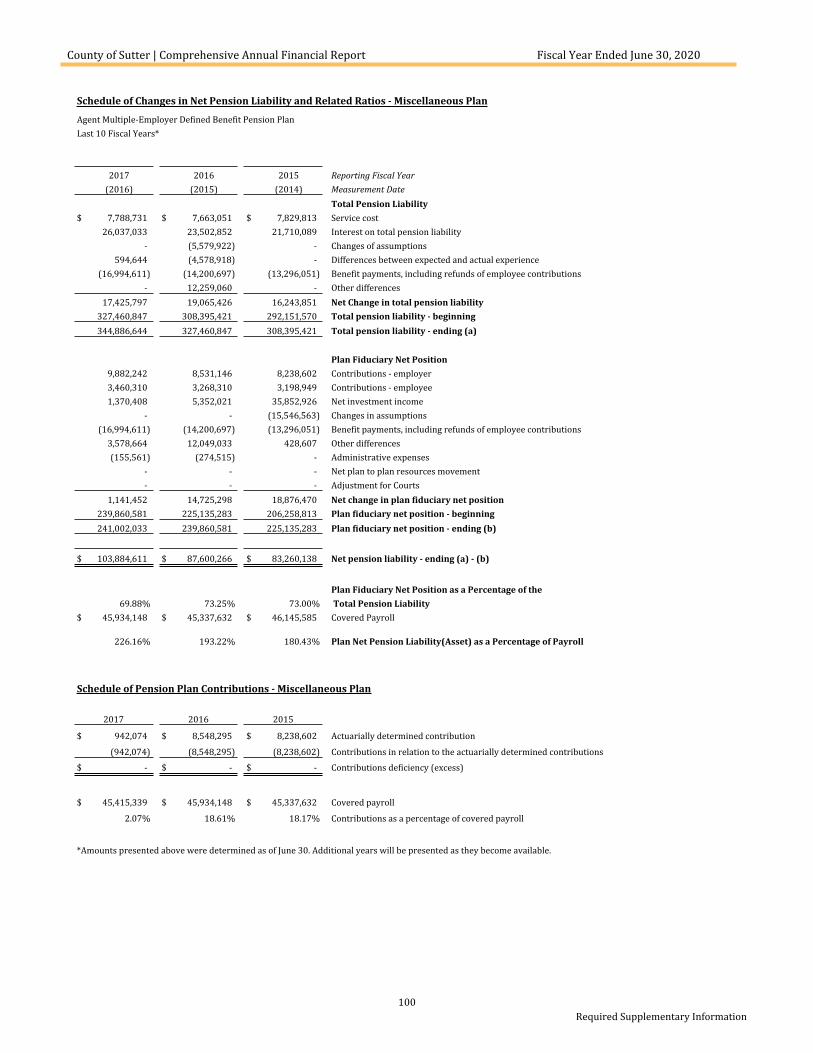
County of Sutter | Comprehensive Annual Financial Report Fiscal Year Ended June 30, 2020
100Required Supplementary Information
Schedule of Changes in Net Pension Liability and Related Ratios - Miscellaneous Plan
Agent Multiple-Employer Defined Benefit Pension PlanLast 10 Fiscal Years*
2017 2016 2015 Reporting Fiscal Year(2016) (2015) (2014) Measurement Date
Total Pension Liability$ 7,788,731 $ 7,663,051 $ 7,829,813 Service cost
26,037,033 23,502,852 21,710,089 Interest on total pension liability- (5,579,922) - Changes of assumptions
594,644 (4,578,918) - Differences between expected and actual experience(16,994,611) (14,200,697) (13,296,051) Benefit payments, including refunds of employee contributions
- 12,259,060 - Other differences17,425,797 19,065,426 16,243,851 Net Change in total pension liability
327,460,847 308,395,421 292,151,570 Total pension liability - beginning344,886,644 327,460,847 308,395,421 Total pension liability - ending (a)
Plan Fiduciary Net Position9,882,242 8,531,146 8,238,602 Contributions - employer3,460,310 3,268,310 3,198,949 Contributions - employee1,370,408 5,352,021 35,852,926 Net investment income
- - (15,546,563) Changes in assumptions(16,994,611) (14,200,697) (13,296,051) Benefit payments, including refunds of employee contributions
3,578,664 12,049,033 428,607 Other differences(155,561) (274,515) - Administrative expenses
- - - Net plan to plan resources movement- - - Adjustment for Courts
1,141,452 14,725,298 18,876,470 Net change in plan fiduciary net position239,860,581 225,135,283 206,258,813 Plan fiduciary net position - beginning241,002,033 239,860,581 225,135,283 Plan fiduciary net position - ending (b)
$ 103,884,611 $ 87,600,266 $ 83,260,138 Net pension liability - ending (a) - (b)
Plan Fiduciary Net Position as a Percentage of the69.88% 73.25% 73.00% Total Pension Liability
$ 45,934,148 $ 45,337,632 $ 46,145,585 Covered Payroll
226.16% 193.22% 180.43% Plan Net Pension Liability(Asset) as a Percentage of Payroll
Schedule of Pension Plan Contributions - Miscellaneous Plan
2017 2016 2015
$ 942,074 $ 8,548,295 $ 8,238,602 Actuarially determined contribution
(942,074) (8,548,295) (8,238,602) Contributions in relation to the actuarially determined contributions
$ - $ - $ - Contributions deficiency (excess)
$ 45,415,339 $ 45,934,148 $ 45,337,632 Covered payroll
2.07% 18.61% 18.17% Contributions as a percentage of covered payroll
*Amounts presented above were determined as of June 30. Additional years will be presented as they become available.
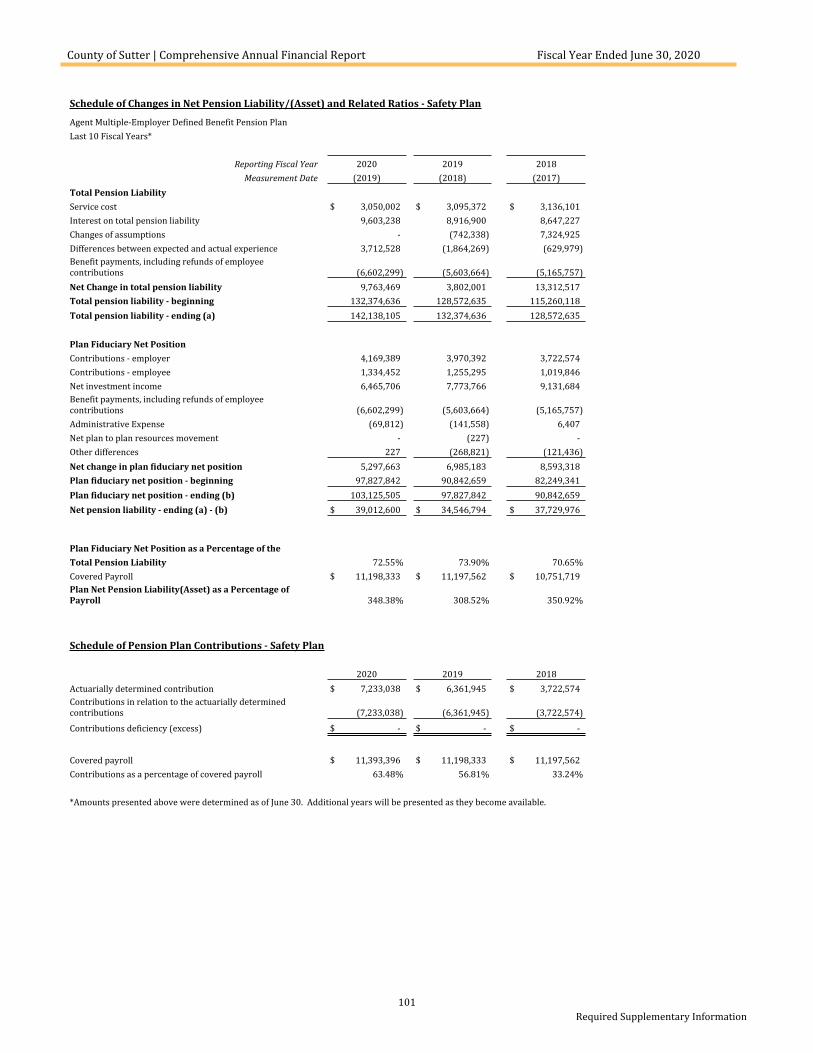
County of Sutter | Comprehensive Annual Financial Report Fiscal Year Ended June 30, 2020
101Required Supplementary Information
Schedule of Changes in Net Pension Liability/(Asset) and Related Ratios - Safety Plan
Agent Multiple-Employer Defined Benefit Pension PlanLast 10 Fiscal Years*
Reporting Fiscal Year 2020 2019 2018Measurement Date (2019) (2018) (2017)
Total Pension LiabilityService cost $ 3,050,002 $ 3,095,372 $ 3,136,101Interest on total pension liability 9,603,238 8,916,900 8,647,227Changes of assumptions - (742,338) 7,324,925Differences between expected and actual experience 3,712,528 (1,864,269) (629,979)Benefit payments, including refunds of employee contributions (6,602,299) (5,603,664) (5,165,757)Net Change in total pension liability 9,763,469 3,802,001 13,312,517Total pension liability - beginning 132,374,636 128,572,635 115,260,118Total pension liability - ending (a) 142,138,105 132,374,636 128,572,635
Plan Fiduciary Net PositionContributions - employer 4,169,389 3,970,392 3,722,574Contributions - employee 1,334,452 1,255,295 1,019,846Net investment income 6,465,706 7,773,766 9,131,684Benefit payments, including refunds of employee contributions (6,602,299) (5,603,664) (5,165,757)Administrative Expense (69,812) (141,558) 6,407Net plan to plan resources movement - (227) -Other differences 227 (268,821) (121,436)Net change in plan fiduciary net position 5,297,663 6,985,183 8,593,318Plan fiduciary net position - beginning 97,827,842 90,842,659 82,249,341Plan fiduciary net position - ending (b) 103,125,505 97,827,842 90,842,659Net pension liability - ending (a) - (b) $ 39,012,600 $ 34,546,794 $ 37,729,976
Plan Fiduciary Net Position as a Percentage of the Total Pension Liability 72.55% 73.90% 70.65%Covered Payroll $ 11,198,333 $ 11,197,562 $ 10,751,719Plan Net Pension Liability(Asset) as a Percentage of Payroll 348.38% 308.52% 350.92%
Schedule of Pension Plan Contributions - Safety Plan
2020 2019 2018 Actuarially determined contribution $ 7,233,038 $ 6,361,945 $ 3,722,574Contributions in relation to the actuarially determined contributions (7,233,038) (6,361,945) (3,722,574)
Contributions deficiency (excess) $ - $ - $ -
Covered payroll $ 11,393,396 $ 11,198,333 $ 11,197,562Contributions as a percentage of covered payroll 63.48% 56.81% 33.24%
*Amounts presented above were determined as of June 30. Additional years will be presented as they become available.
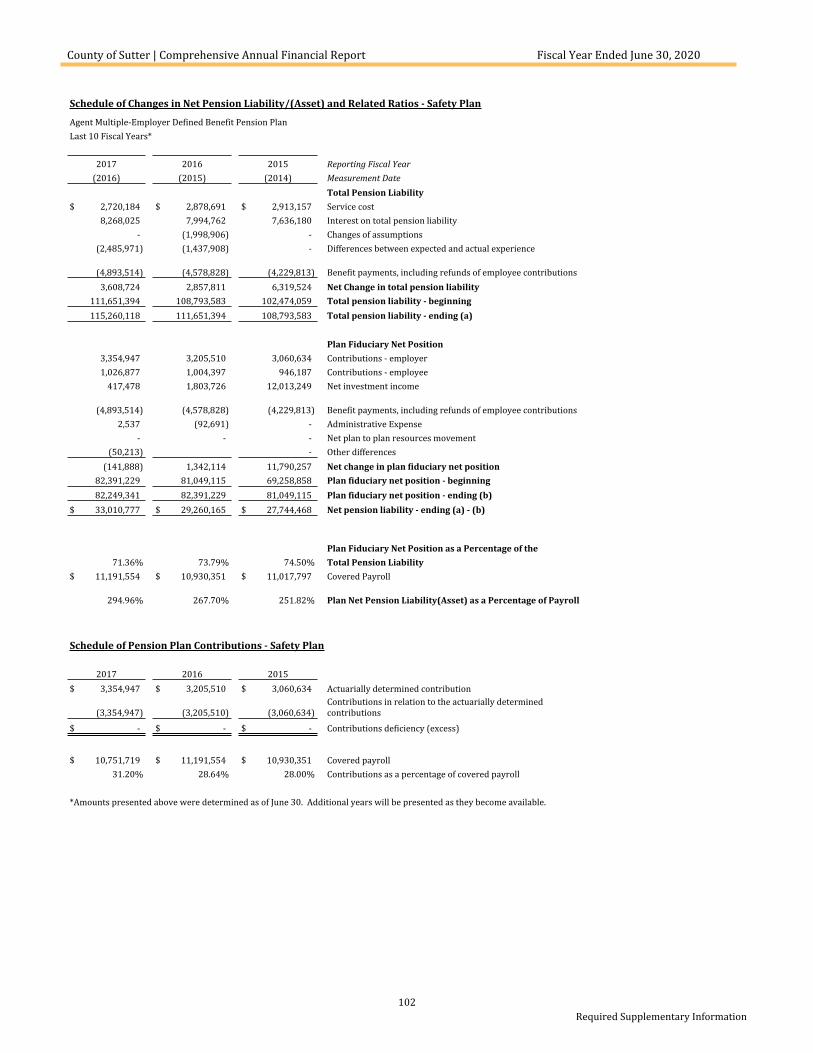
County of Sutter | Comprehensive Annual Financial Report Fiscal Year Ended June 30, 2020
102Required Supplementary Information
Schedule of Changes in Net Pension Liability/(Asset) and Related Ratios - Safety Plan
Agent Multiple-Employer Defined Benefit Pension PlanLast 10 Fiscal Years*
2017 2016 2015 Reporting Fiscal Year(2016) (2015) (2014) Measurement Date
Total Pension Liability$ 2,720,184 $ 2,878,691 $ 2,913,157 Service cost
8,268,025 7,994,762 7,636,180 Interest on total pension liability- (1,998,906) - Changes of assumptions
(2,485,971) (1,437,908) - Differences between expected and actual experience
(4,893,514) (4,578,828) (4,229,813) Benefit payments, including refunds of employee contributions3,608,724 2,857,811 6,319,524 Net Change in total pension liability
111,651,394 108,793,583 102,474,059 Total pension liability - beginning115,260,118 111,651,394 108,793,583 Total pension liability - ending (a)
Plan Fiduciary Net Position3,354,947 3,205,510 3,060,634 Contributions - employer1,026,877 1,004,397 946,187 Contributions - employee
417,478 1,803,726 12,013,249 Net investment income
(4,893,514) (4,578,828) (4,229,813) Benefit payments, including refunds of employee contributions2,537 (92,691) - Administrative Expense
- - - Net plan to plan resources movement(50,213) - Other differences
(141,888) 1,342,114 11,790,257 Net change in plan fiduciary net position82,391,229 81,049,115 69,258,858 Plan fiduciary net position - beginning82,249,341 82,391,229 81,049,115 Plan fiduciary net position - ending (b)
$ 33,010,777 $ 29,260,165 $ 27,744,468 Net pension liability - ending (a) - (b)
Plan Fiduciary Net Position as a Percentage of the 71.36% 73.79% 74.50% Total Pension Liability
$ 11,191,554 $ 10,930,351 $ 11,017,797 Covered Payroll
294.96% 267.70% 251.82% Plan Net Pension Liability(Asset) as a Percentage of Payroll
Schedule of Pension Plan Contributions - Safety Plan
2017 2016 2015 $ 3,354,947 $ 3,205,510 $ 3,060,634 Actuarially determined contribution
(3,354,947) (3,205,510) (3,060,634)Contributions in relation to the actuarially determined contributions
$ - $ - $ - Contributions deficiency (excess)
$ 10,751,719 $ 11,191,554 $ 10,930,351 Covered payroll31.20% 28.64% 28.00% Contributions as a percentage of covered payroll
*Amounts presented above were determined as of June 30. Additional years will be presented as they become available.
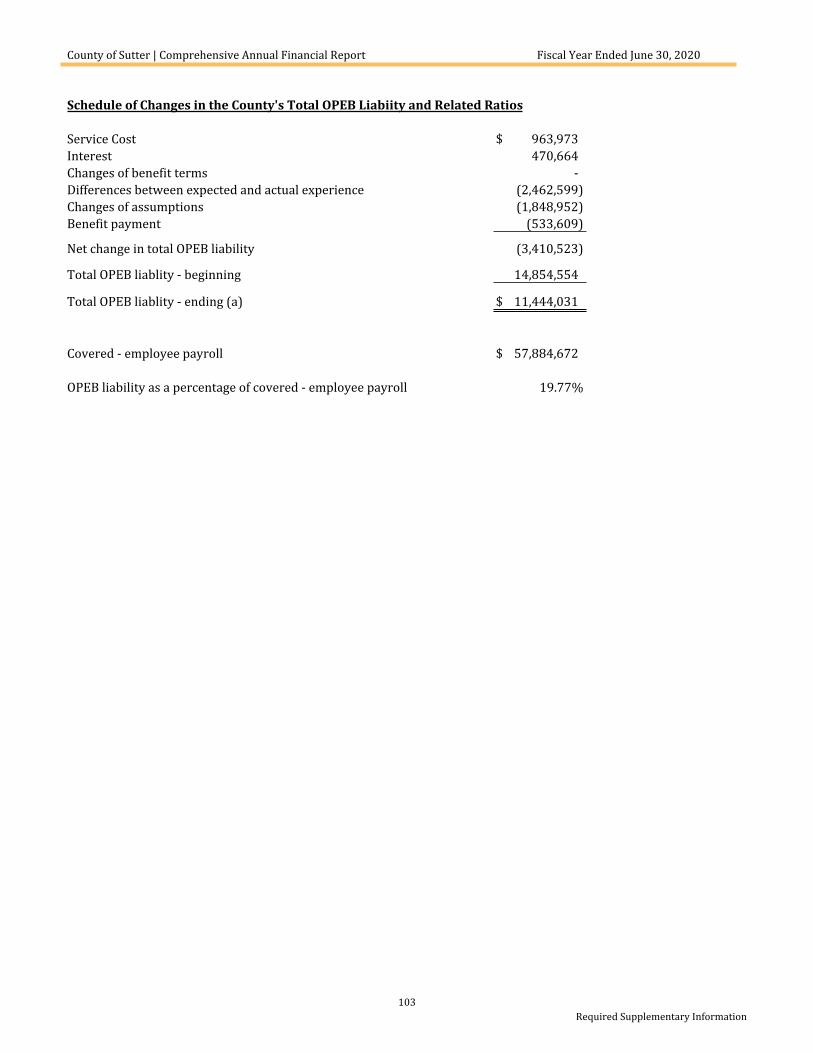
County of Sutter | Comprehensive Annual Financial Report Fiscal Year Ended June 30, 2020
103Required Supplementary Information
Schedule of Changes in the County's Total OPEB Liabiity and Related Ratios
Service Cost $ 963,973Interest 470,664Changes of benefit terms -Differences between expected and actual experience (2,462,599)Changes of assumptions (1,848,952)Benefit payment (533,609)
Net change in total OPEB liability (3,410,523)
Total OPEB liablity - beginning 14,854,554
Total OPEB liablity - ending (a) $ 11,444,031
Covered - employee payroll $ 57,884,672
OPEB liability as a percentage of covered - employee payroll 19.77%

Governmental Funds – General and
Major Special Revenue

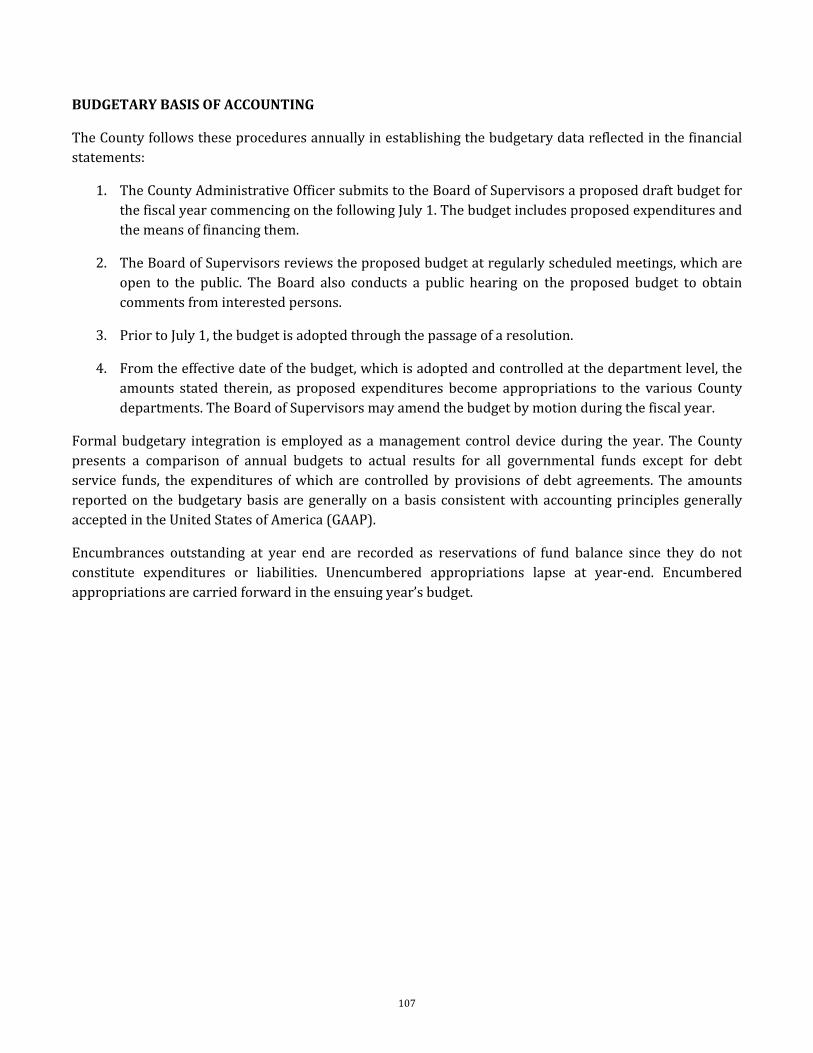
107
BUDGETARY BASIS OF ACCOUNTING
The County follows these procedures annually in establishing the budgetary data reflected in the financial statements:
1. The County Administrative Officer submits to the Board of Supervisors a proposed draft budget for the fiscal year commencing on the following July 1. The budget includes proposed expenditures and the means of financing them.
2. The Board of Supervisors reviews the proposed budget at regularly scheduled meetings, which are open to the public. The Board also conducts a public hearing on the proposed budget to obtain comments from interested persons.
3. Prior to July 1, the budget is adopted through the passage of a resolution.
4. From the effective date of the budget, which is adopted and controlled at the department level, the amounts stated therein, as proposed expenditures become appropriations to the various County departments. The Board of Supervisors may amend the budget by motion during the fiscal year.
Formal budgetary integration is employed as a management control device during the year. The County presents a comparison of annual budgets to actual results for all governmental funds except for debt service funds, the expenditures of which are controlled by provisions of debt agreements. The amounts reported on the budgetary basis are generally on a basis consistent with accounting principles generally accepted in the United States of America (GAAP).
Encumbrances outstanding at year end are recorded as reservations of fund balance since they do not constitute expenditures or liabilities. Unencumbered appropriations lapse at year-end. Encumbered appropriations are carried forward in the ensuing year’s budget.
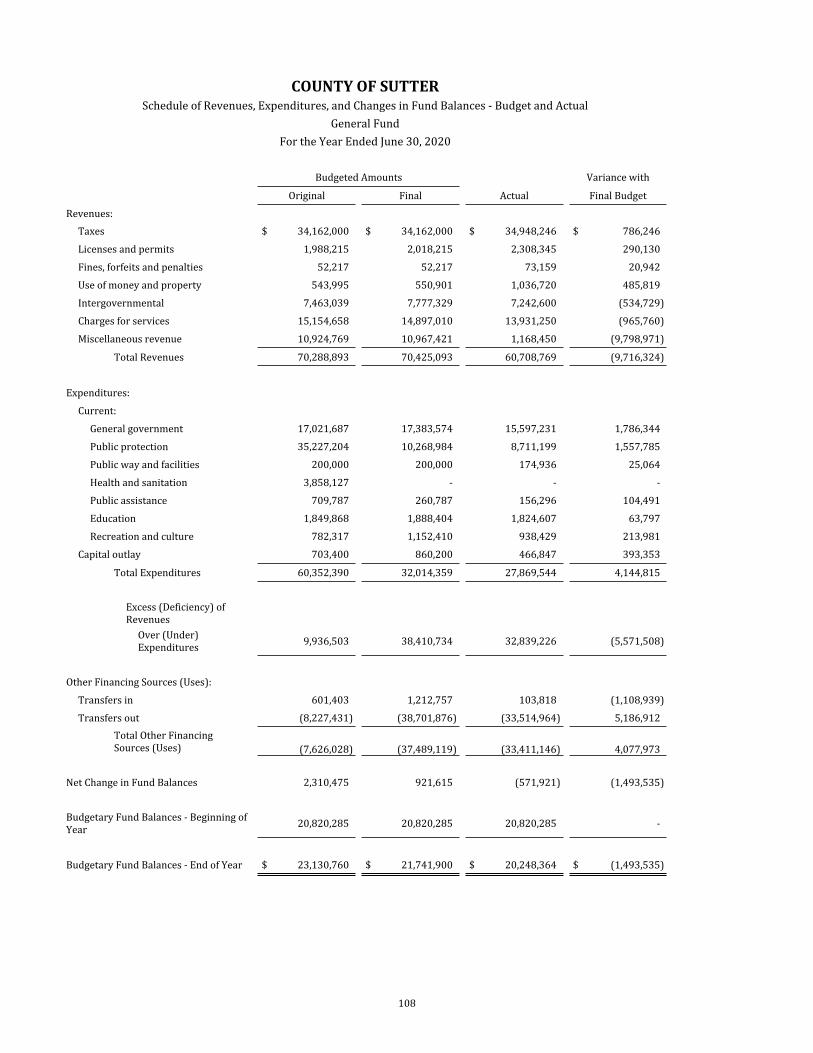
108
COUNTY OF SUTTERSchedule of Revenues, Expenditures, and Changes in Fund Balances - Budget and Actual
General FundFor the Year Ended June 30, 2020
Budgeted Amounts Variance with
Original Final Actual Final Budget
Revenues:Taxes $ 34,162,000 $ 34,162,000 $ 34,948,246 $ 786,246
Licenses and permits 1,988,215 2,018,215 2,308,345 290,130
Fines, forfeits and penalties 52,217 52,217 73,159 20,942
Use of money and property 543,995 550,901 1,036,720 485,819
Intergovernmental 7,463,039 7,777,329 7,242,600 (534,729)
Charges for services 15,154,658 14,897,010 13,931,250 (965,760)
Miscellaneous revenue 10,924,769 10,967,421 1,168,450 (9,798,971)
Total Revenues 70,288,893 70,425,093 60,708,769 (9,716,324)
Expenditures:
Current:
General government 17,021,687 17,383,574 15,597,231 1,786,344
Public protection 35,227,204 10,268,984 8,711,199 1,557,785
Public way and facilities 200,000 200,000 174,936 25,064
Health and sanitation 3,858,127 - - -
Public assistance 709,787 260,787 156,296 104,491
Education 1,849,868 1,888,404 1,824,607 63,797
Recreation and culture 782,317 1,152,410 938,429 213,981
Capital outlay 703,400 860,200 466,847 393,353
Total Expenditures 60,352,390 32,014,359 27,869,544 4,144,815
Excess (Deficiency) of Revenues
Over (Under) Expenditures 9,936,503 38,410,734 32,839,226 (5,571,508)
Other Financing Sources (Uses):
Transfers in 601,403 1,212,757 103,818 (1,108,939)
Transfers out (8,227,431) (38,701,876) (33,514,964) 5,186,912Total Other Financing Sources (Uses) (7,626,028) (37,489,119) (33,411,146) 4,077,973
Net Change in Fund Balances 2,310,475 921,615 (571,921) (1,493,535)
Budgetary Fund Balances - Beginning of Year 20,820,285 20,820,285 20,820,285 -
Budgetary Fund Balances - End of Year $ 23,130,760 $ 21,741,900 $ 20,248,364 $ (1,493,535)
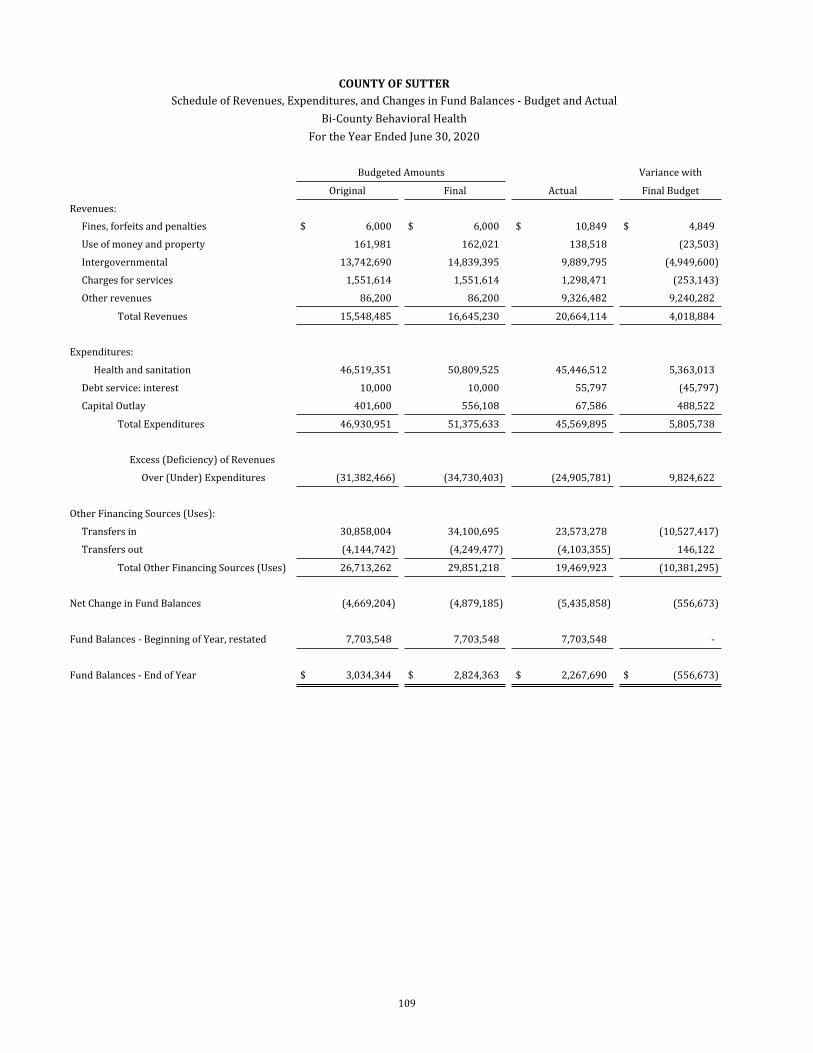
109
COUNTY OF SUTTERSchedule of Revenues, Expenditures, and Changes in Fund Balances - Budget and Actual
Bi-County Behavioral HealthFor the Year Ended June 30, 2020
Budgeted Amounts Variance with
Original Final Actual Final Budget
Revenues:Fines, forfeits and penalties $ 6,000 $ 6,000 $ 10,849 $ 4,849
Use of money and property 161,981 162,021 138,518 (23,503)
Intergovernmental 13,742,690 14,839,395 9,889,795 (4,949,600)
Charges for services 1,551,614 1,551,614 1,298,471 (253,143)
Other revenues 86,200 86,200 9,326,482 9,240,282
Total Revenues 15,548,485 16,645,230 20,664,114 4,018,884
Expenditures:
Health and sanitation 46,519,351 50,809,525 45,446,512 5,363,013
Debt service: interest 10,000 10,000 55,797 (45,797)
Capital Outlay 401,600 556,108 67,586 488,522
Total Expenditures 46,930,951 51,375,633 45,569,895 5,805,738
Excess (Deficiency) of Revenues
Over (Under) Expenditures (31,382,466) (34,730,403) (24,905,781) 9,824,622
Other Financing Sources (Uses):
Transfers in 30,858,004 34,100,695 23,573,278 (10,527,417)
Transfers out (4,144,742) (4,249,477) (4,103,355) 146,122
Total Other Financing Sources (Uses) 26,713,262 29,851,218 19,469,923 (10,381,295)
Net Change in Fund Balances (4,669,204) (4,879,185) (5,435,858) (556,673)
Fund Balances - Beginning of Year, restated 7,703,548 7,703,548 7,703,548 -
Fund Balances - End of Year $ 3,034,344 $ 2,824,363 $ 2,267,690 $ (556,673)
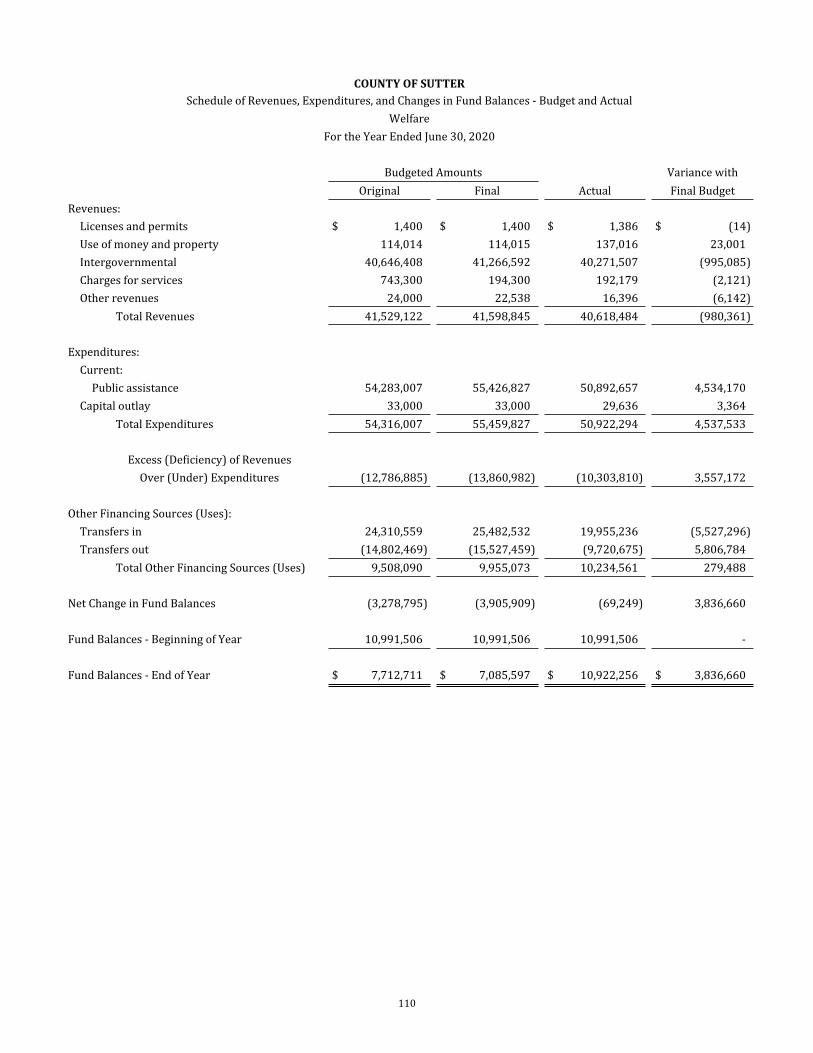
110
COUNTY OF SUTTERSchedule of Revenues, Expenditures, and Changes in Fund Balances - Budget and Actual
WelfareFor the Year Ended June 30, 2020
Budgeted Amounts Variance withOriginal Final Actual Final Budget
Revenues:Licenses and permits $ 1,400 $ 1,400 $ 1,386 $ (14)Use of money and property 114,014 114,015 137,016 23,001Intergovernmental 40,646,408 41,266,592 40,271,507 (995,085)Charges for services 743,300 194,300 192,179 (2,121)Other revenues 24,000 22,538 16,396 (6,142)
Total Revenues 41,529,122 41,598,845 40,618,484 (980,361)
Expenditures:Current:
Public assistance 54,283,007 55,426,827 50,892,657 4,534,170Capital outlay 33,000 33,000 29,636 3,364
Total Expenditures 54,316,007 55,459,827 50,922,294 4,537,533
Excess (Deficiency) of RevenuesOver (Under) Expenditures (12,786,885) (13,860,982) (10,303,810) 3,557,172
Other Financing Sources (Uses):Transfers in 24,310,559 25,482,532 19,955,236 (5,527,296)Transfers out (14,802,469) (15,527,459) (9,720,675) 5,806,784
Total Other Financing Sources (Uses) 9,508,090 9,955,073 10,234,561 279,488
Net Change in Fund Balances (3,278,795) (3,905,909) (69,249) 3,836,660
Fund Balances - Beginning of Year 10,991,506 10,991,506 10,991,506 -
Fund Balances - End of Year $ 7,712,711 $ 7,085,597 $ 10,922,256 $ 3,836,660
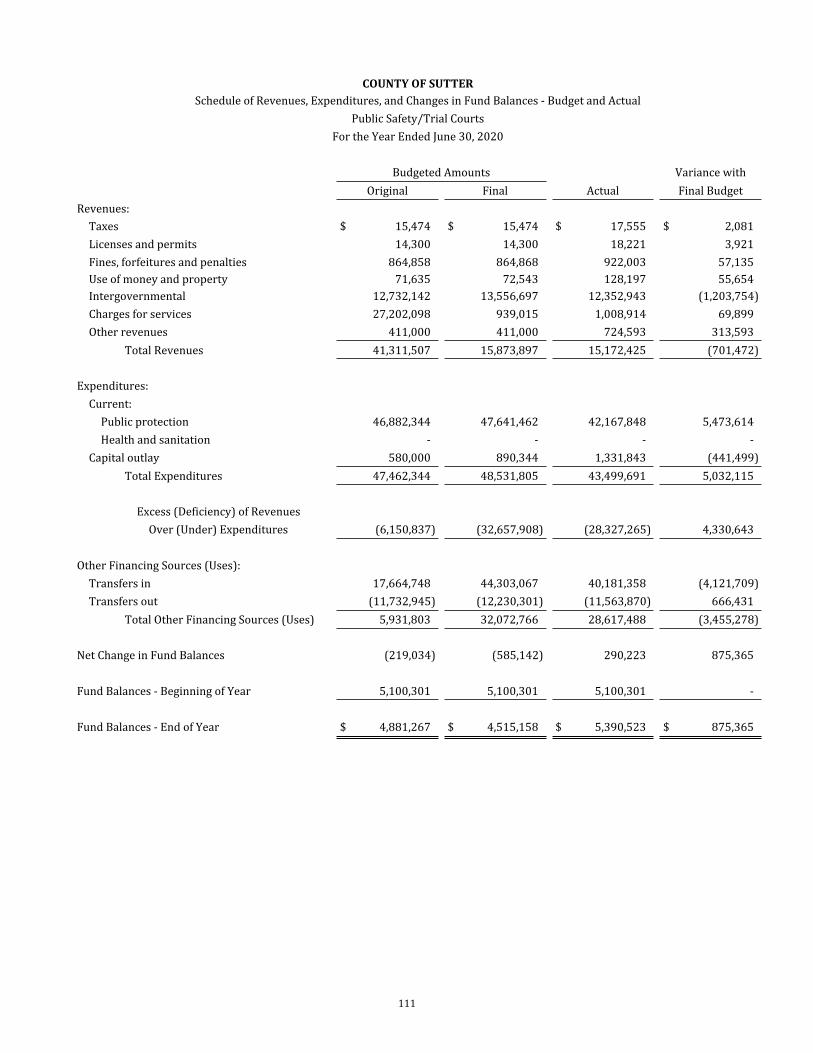
111
COUNTY OF SUTTERSchedule of Revenues, Expenditures, and Changes in Fund Balances - Budget and Actual
Public Safety/Trial CourtsFor the Year Ended June 30, 2020
Budgeted Amounts Variance withOriginal Final Actual Final Budget
Revenues:Taxes $ 15,474 $ 15,474 $ 17,555 $ 2,081Licenses and permits 14,300 14,300 18,221 3,921Fines, forfeitures and penalties 864,858 864,868 922,003 57,135Use of money and property 71,635 72,543 128,197 55,654Intergovernmental 12,732,142 13,556,697 12,352,943 (1,203,754)Charges for services 27,202,098 939,015 1,008,914 69,899Other revenues 411,000 411,000 724,593 313,593
Total Revenues 41,311,507 15,873,897 15,172,425 (701,472)
Expenditures:Current:
Public protection 46,882,344 47,641,462 42,167,848 5,473,614Health and sanitation - - - -
Capital outlay 580,000 890,344 1,331,843 (441,499)Total Expenditures 47,462,344 48,531,805 43,499,691 5,032,115
Excess (Deficiency) of RevenuesOver (Under) Expenditures (6,150,837) (32,657,908) (28,327,265) 4,330,643
Other Financing Sources (Uses):Transfers in 17,664,748 44,303,067 40,181,358 (4,121,709)Transfers out (11,732,945) (12,230,301) (11,563,870) 666,431
Total Other Financing Sources (Uses) 5,931,803 32,072,766 28,617,488 (3,455,278)
Net Change in Fund Balances (219,034) (585,142) 290,223 875,365
Fund Balances - Beginning of Year 5,100,301 5,100,301 5,100,301 -
Fund Balances - End of Year $ 4,881,267 $ 4,515,158 $ 5,390,523 $ 875,365
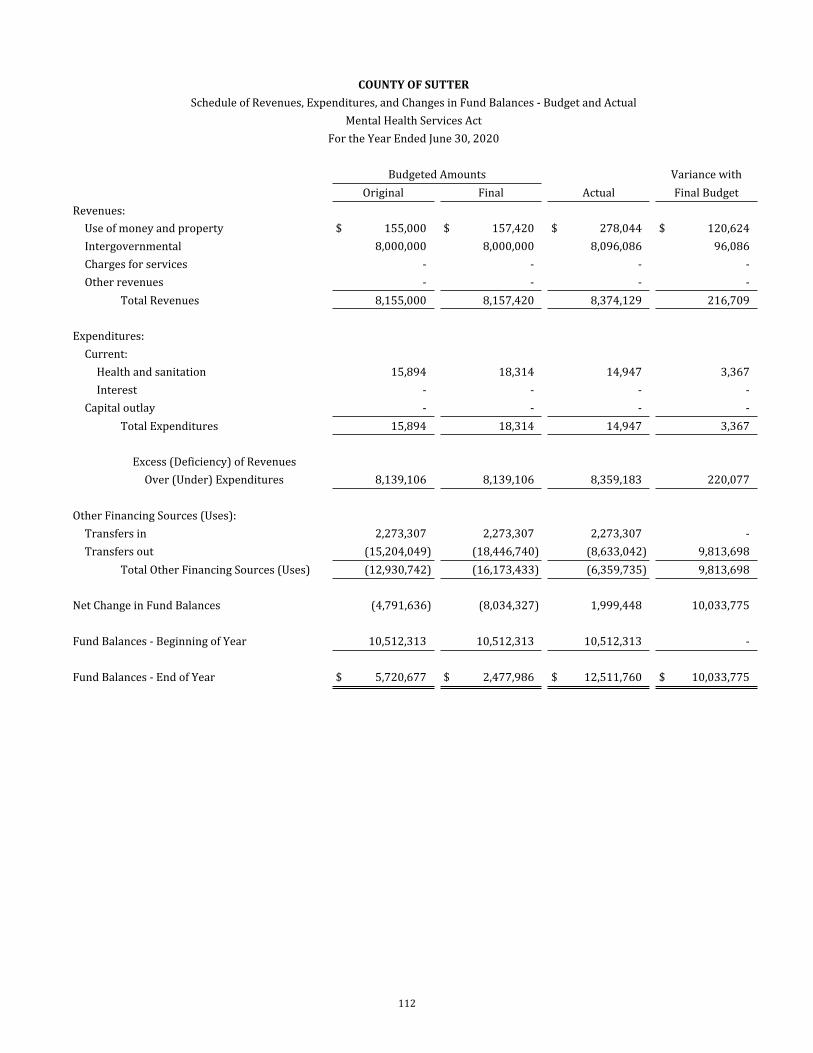
112
COUNTY OF SUTTERSchedule of Revenues, Expenditures, and Changes in Fund Balances - Budget and Actual
Mental Health Services ActFor the Year Ended June 30, 2020
Budgeted Amounts Variance withOriginal Final Actual Final Budget
Revenues:Use of money and property $ 155,000 $ 157,420 $ 278,044 $ 120,624Intergovernmental 8,000,000 8,000,000 8,096,086 96,086Charges for services - - - -Other revenues - - - -
Total Revenues 8,155,000 8,157,420 8,374,129 216,709
Expenditures:Current:
Health and sanitation 15,894 18,314 14,947 3,367Interest - - - -
Capital outlay - - - -Total Expenditures 15,894 18,314 14,947 3,367
Excess (Deficiency) of RevenuesOver (Under) Expenditures 8,139,106 8,139,106 8,359,183 220,077
Other Financing Sources (Uses):Transfers in 2,273,307 2,273,307 2,273,307 -Transfers out (15,204,049) (18,446,740) (8,633,042) 9,813,698
Total Other Financing Sources (Uses) (12,930,742) (16,173,433) (6,359,735) 9,813,698
Net Change in Fund Balances (4,791,636) (8,034,327) 1,999,448 10,033,775
Fund Balances - Beginning of Year 10,512,313 10,512,313 10,512,313 -
Fund Balances - End of Year $ 5,720,677 $ 2,477,986 $ 12,511,760 $ 10,033,775
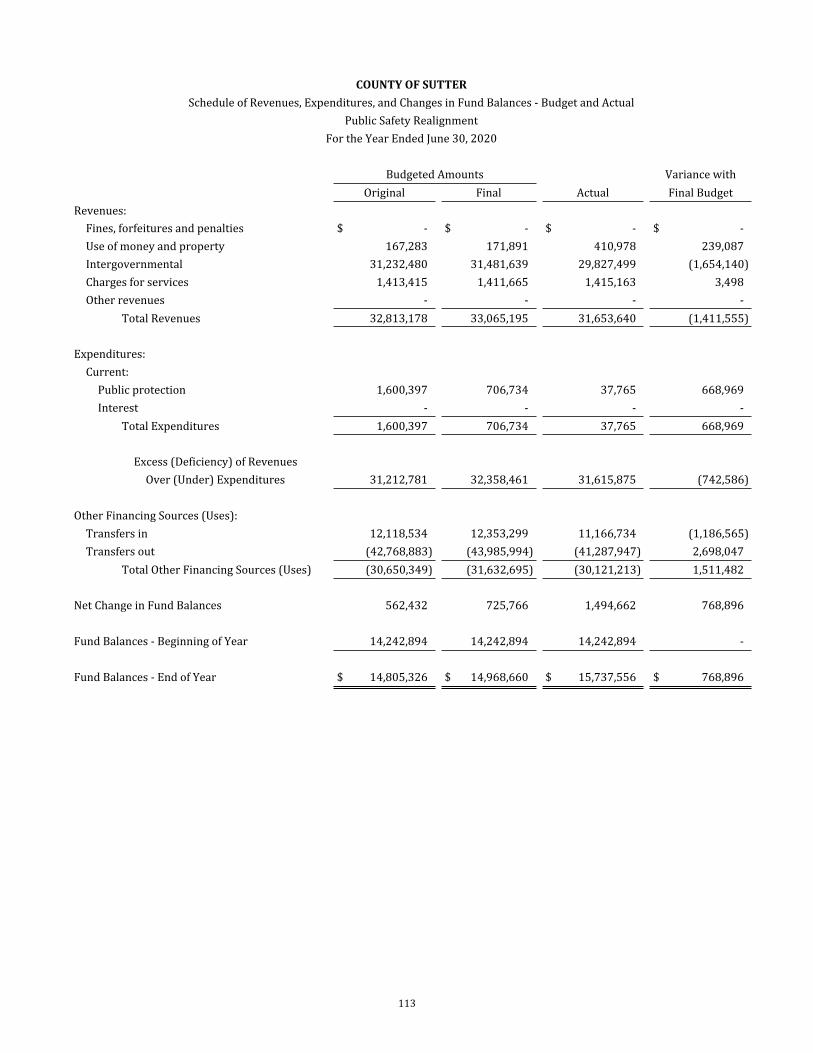
113
COUNTY OF SUTTERSchedule of Revenues, Expenditures, and Changes in Fund Balances - Budget and Actual
Public Safety RealignmentFor the Year Ended June 30, 2020
Budgeted Amounts Variance withOriginal Final Actual Final Budget
Revenues:Fines, forfeitures and penalties $ - $ - $ - $ -Use of money and property 167,283 171,891 410,978 239,087Intergovernmental 31,232,480 31,481,639 29,827,499 (1,654,140)Charges for services 1,413,415 1,411,665 1,415,163 3,498Other revenues - - - -
Total Revenues 32,813,178 33,065,195 31,653,640 (1,411,555)
Expenditures:Current:
Public protection 1,600,397 706,734 37,765 668,969Interest - - - -
Total Expenditures 1,600,397 706,734 37,765 668,969
Excess (Deficiency) of RevenuesOver (Under) Expenditures 31,212,781 32,358,461 31,615,875 (742,586)
Other Financing Sources (Uses):Transfers in 12,118,534 12,353,299 11,166,734 (1,186,565)Transfers out (42,768,883) (43,985,994) (41,287,947) 2,698,047
Total Other Financing Sources (Uses) (30,650,349) (31,632,695) (30,121,213) 1,511,482
Net Change in Fund Balances 562,432 725,766 1,494,662 768,896
Fund Balances - Beginning of Year 14,242,894 14,242,894 14,242,894 -
Fund Balances - End of Year $ 14,805,326 $ 14,968,660 $ 15,737,556 $ 768,896
County of Sutter | Comprehensive Annual Financial Report Fiscal Year Ended June 30, 2020
114Nonmajor Governmental Funds
Nonmajor governmental funds are funds that do not meet the definition of a major fund, as described in the glossary. The following funds are presented as nonmajor funds in the CAFR:
Special Revenue FundsSpecial Revenue Funds are established to finance particular governmental activities and are financed by specific taxes or other revenues. Such funds are authorized by statutory provisions to pay for certain activities of a continuing nature. Included in the Special Revenue classification are the following funds:
RoadAccounts for financing the construction and maintenance of Sutter County’s unincorporated area road systems through planning; environmental analysis; traffic engineering and design; operations; traffic signals, street lights, signs and markings, right-of-way acquisitions; safety related improvements; and radar/speed control.
Special AviationThis fund is used to account for federal airport and other revenues and expenditures for the provision of capital improvements and equipment maintenance at the Sutter County Airport.
Fish & GameThis fund is used to account for fines and forfeitures received under Section 13003 of the Fish and Game Code and their expenditure for the propagation and conservation of fish and wildlife.
Sutter County HealthAccounts for the range of services provided that are designed to protect and enhance the well-being of the community and needs related to mental health and substance abuse problems. Revenue sources are primarily sales tax revenue and state grants.
Clerk Recorder FundsAccounts for the various activities of the clerk-recorder such as the County Recorder Upgrade Fee imposed for instruments recorded by the County to support, maintain and improve the County’s recording system; provides for repository of official and vital records for the County and files or records a variety of documents, maintains a record of those documents for posterity, and makes certified copies available to the public; and records the revenue for the various candidates running for elections within the County.
Child Support ServicesAccounts for the child support services activities within the County.
Economic DevelopmentEconomic development activities support infrastructure development, economic and workforce development projects, housing development and rehabilitation, and public.
County Fees and TaxesThe fund is used to collect development impact fees and certain property taxes.
County of Sutter | Comprehensive Annual Financial Report Fiscal Year Ended June 30, 2020
115Nonmajor Governmental Funds
Court ActivitiesAccounts for court activities such as for the Automated County Warrants Fund, established pursuant to Vehicle Code Section 40508.5, which is used to account for fees imposed if a defendant fails to appear or to comply with any valid court order pursuant to this code. The funds are used for the development and operation of an automated county warrant system. Also included is the Office of Revenue Collections fund which is used to account for the 10% rebate on restitution fine and order monies remitted to the Victim Compensation and Government Claims Board (VCGCB) pursuant to Government Code Section 13966.01. The objective of the rebate is to enhance collection efforts and is intended to create an incentive for the County to aggressively pursue the collection of restitution monies to be utilized to assist other victims of crime.
County Service AreasThe County Service Areas Fund is used to account for the street lighting, public protection, health and sanitation, recreation and culture, public ways, and water utilities services provided by county service area districts in the unincorporated areas of the County.
Water AgenciesThe Water Agencies Fund prepares investigations and reports on the County’s water requirements, project development, and efficient use of water. The agency provides technical assistance to other County departments, water districts, and the public concerning water availability and water well locations and design.
Other Special DistrictsThe funds here are community assessment districts which provide canal and lighting maintenance to some communities within the county.
Debt ServiceThe General Debt Service Fund is used to account for the accumulation of resources for, and the payment of, general long-term debt.
Capital ProjectsThe Capital Projects Fund is used to account for financial resources to be used for the acquisition of land or acquisition or construction of major facilities other than those financed by the proprietary fund types.
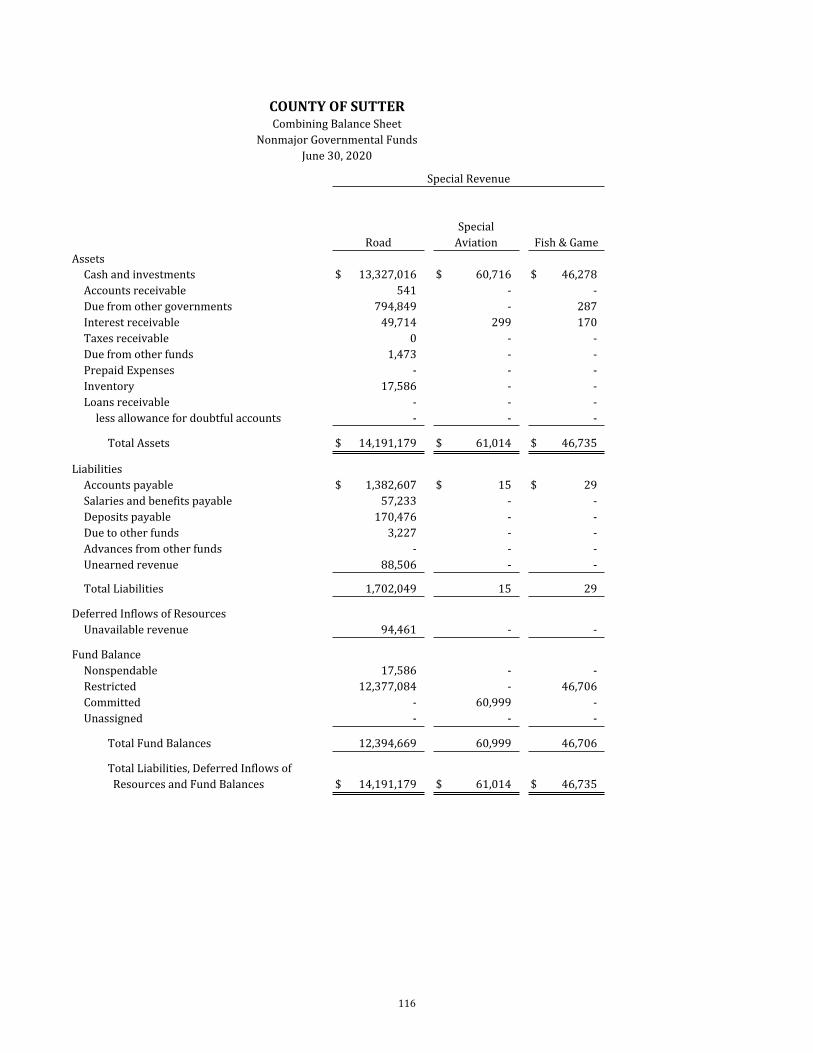
116
COUNTY OF SUTTERCombining Balance Sheet
Nonmajor Governmental FundsJune 30, 2020
Special Revenue
SpecialRoad Aviation Fish & Game
AssetsCash and investments $ 13,327,016 $ 60,716 $ 46,278Accounts receivable 541 - -Due from other governments 794,849 - 287Interest receivable 49,714 299 170Taxes receivable 0 - -Due from other funds 1,473 - -Prepaid Expenses - - -Inventory 17,586 - -Loans receivable - - -
less allowance for doubtful accounts - - -
Total Assets $ 14,191,179 $ 61,014 $ 46,735
LiabilitiesAccounts payable $ 1,382,607 $ 15 $ 29Salaries and benefits payable 57,233 - -Deposits payable 170,476 - -Due to other funds 3,227 - -Advances from other funds - - -Unearned revenue 88,506 - -
Total Liabilities 1,702,049 15 29
Deferred Inflows of ResourcesUnavailable revenue 94,461 - -
Fund BalanceNonspendable 17,586 - -Restricted 12,377,084 - 46,706Committed - 60,999 -Unassigned - - -
Total Fund Balances 12,394,669 60,999 46,706
Total Liabilities, Deferred Inflows of Resources and Fund Balances $ 14,191,179 $ 61,014 $ 46,735
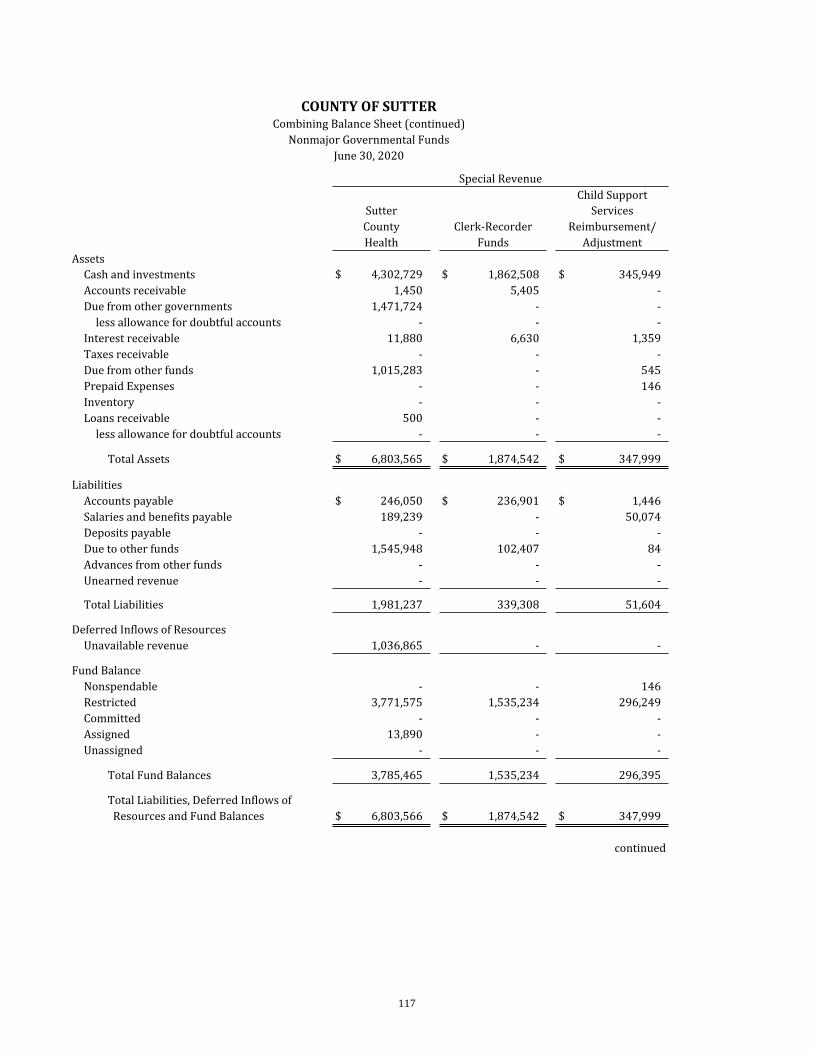
117
COUNTY OF SUTTERCombining Balance Sheet (continued)
Nonmajor Governmental FundsJune 30, 2020
Special RevenueChild Support
Sutter ServicesCounty Clerk-Recorder Reimbursement/Health Funds Adjustment
AssetsCash and investments $ 4,302,729 $ 1,862,508 $ 345,949Accounts receivable 1,450 5,405 -Due from other governments 1,471,724 - -
less allowance for doubtful accounts - - -Interest receivable 11,880 6,630 1,359Taxes receivable - - -Due from other funds 1,015,283 - 545Prepaid Expenses - - 146Inventory - - -Loans receivable 500 - -
less allowance for doubtful accounts - - -
Total Assets $ 6,803,565 $ 1,874,542 $ 347,999
LiabilitiesAccounts payable $ 246,050 $ 236,901 $ 1,446Salaries and benefits payable 189,239 - 50,074Deposits payable - - -Due to other funds 1,545,948 102,407 84Advances from other funds - - -Unearned revenue - - -
Total Liabilities 1,981,237 339,308 51,604
Deferred Inflows of ResourcesUnavailable revenue 1,036,865 - -
Fund BalanceNonspendable - - 146Restricted 3,771,575 1,535,234 296,249Committed - - -Assigned 13,890 - -Unassigned - - -
Total Fund Balances 3,785,465 1,535,234 296,395
Total Liabilities, Deferred Inflows of Resources and Fund Balances $ 6,803,566 $ 1,874,542 $ 347,999
continued
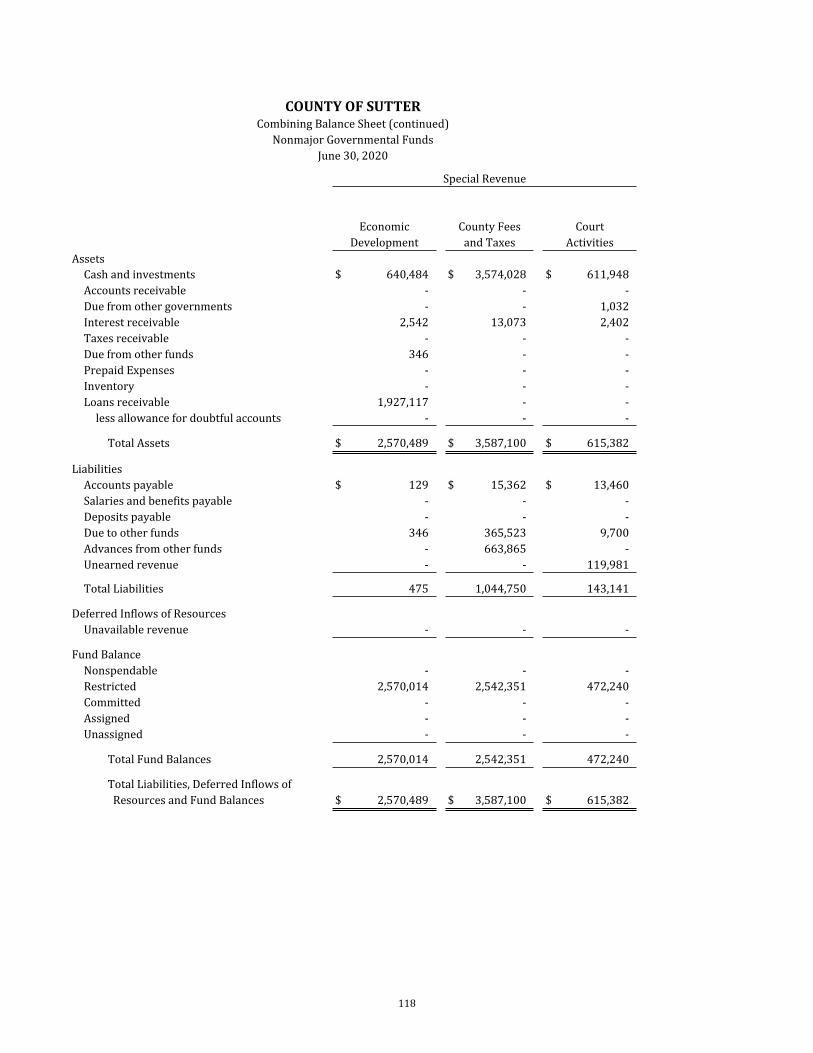
118
COUNTY OF SUTTERCombining Balance Sheet (continued)
Nonmajor Governmental FundsJune 30, 2020
Special Revenue
Economic County Fees CourtDevelopment and Taxes Activities
AssetsCash and investments $ 640,484 $ 3,574,028 $ 611,948Accounts receivable - - -Due from other governments - - 1,032Interest receivable 2,542 13,073 2,402Taxes receivable - - -Due from other funds 346 - -Prepaid Expenses - - -Inventory - - -Loans receivable 1,927,117 - -
less allowance for doubtful accounts - - -
Total Assets $ 2,570,489 $ 3,587,100 $ 615,382
LiabilitiesAccounts payable $ 129 $ 15,362 $ 13,460Salaries and benefits payable - - -Deposits payable - - -Due to other funds 346 365,523 9,700Advances from other funds - 663,865 -Unearned revenue - - 119,981
Total Liabilities 475 1,044,750 143,141
Deferred Inflows of ResourcesUnavailable revenue - - -
Fund BalanceNonspendable - - -Restricted 2,570,014 2,542,351 472,240Committed - - -Assigned - - -Unassigned - - -
Total Fund Balances 2,570,014 2,542,351 472,240
Total Liabilities, Deferred Inflows of Resources and Fund Balances $ 2,570,489 $ 3,587,100 $ 615,382
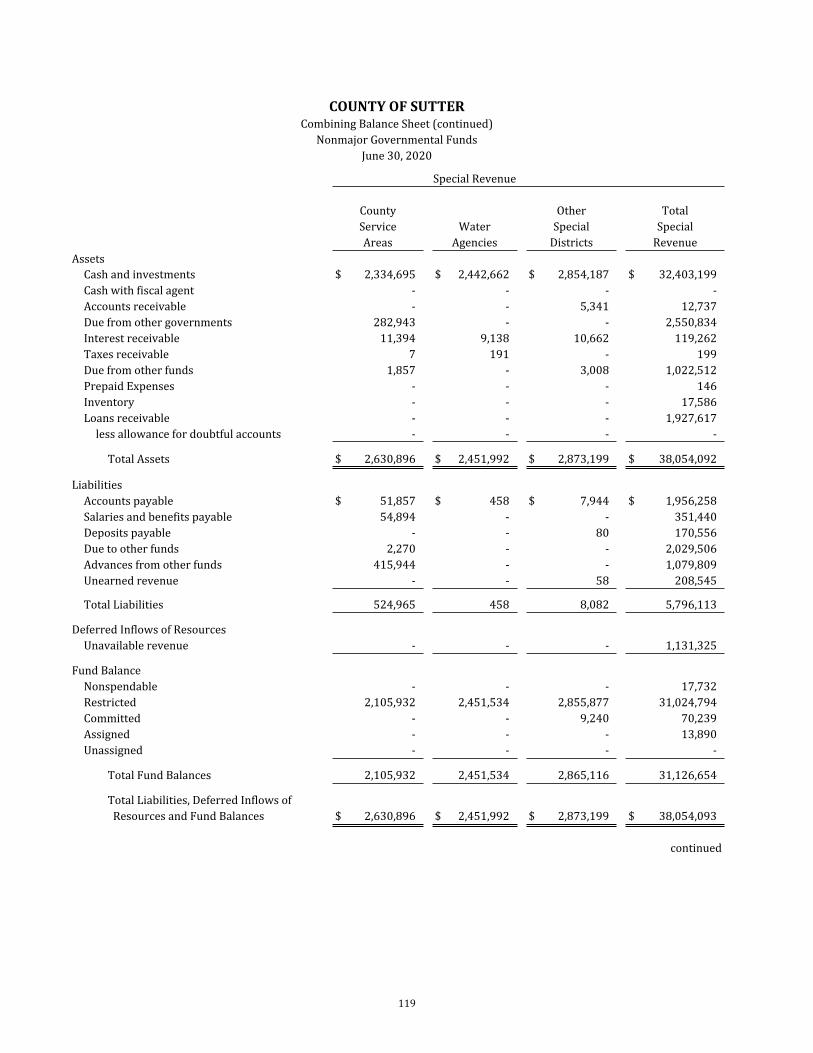
119
COUNTY OF SUTTERCombining Balance Sheet (continued)
Nonmajor Governmental FundsJune 30, 2020
Special Revenue
County Other TotalService Water Special SpecialAreas Agencies Districts Revenue
AssetsCash and investments $ 2,334,695 $ 2,442,662 $ 2,854,187 $ 32,403,199Cash with fiscal agent - - - -Accounts receivable - - 5,341 12,737Due from other governments 282,943 - - 2,550,834Interest receivable 11,394 9,138 10,662 119,262Taxes receivable 7 191 - 199Due from other funds 1,857 - 3,008 1,022,512Prepaid Expenses - - - 146Inventory - - - 17,586Loans receivable - - - 1,927,617
less allowance for doubtful accounts - - - -
Total Assets $ 2,630,896 $ 2,451,992 $ 2,873,199 $ 38,054,092
LiabilitiesAccounts payable $ 51,857 $ 458 $ 7,944 $ 1,956,258Salaries and benefits payable 54,894 - - 351,440Deposits payable - - 80 170,556Due to other funds 2,270 - - 2,029,506Advances from other funds 415,944 - - 1,079,809Unearned revenue - - 58 208,545
Total Liabilities 524,965 458 8,082 5,796,113
Deferred Inflows of ResourcesUnavailable revenue - - - 1,131,325
Fund BalanceNonspendable - - - 17,732Restricted 2,105,932 2,451,534 2,855,877 31,024,794Committed - - 9,240 70,239Assigned - - - 13,890Unassigned - - - -
Total Fund Balances 2,105,932 2,451,534 2,865,116 31,126,654
Total Liabilities, Deferred Inflows of Resources and Fund Balances $ 2,630,896 $ 2,451,992 $ 2,873,199 $ 38,054,093
continued
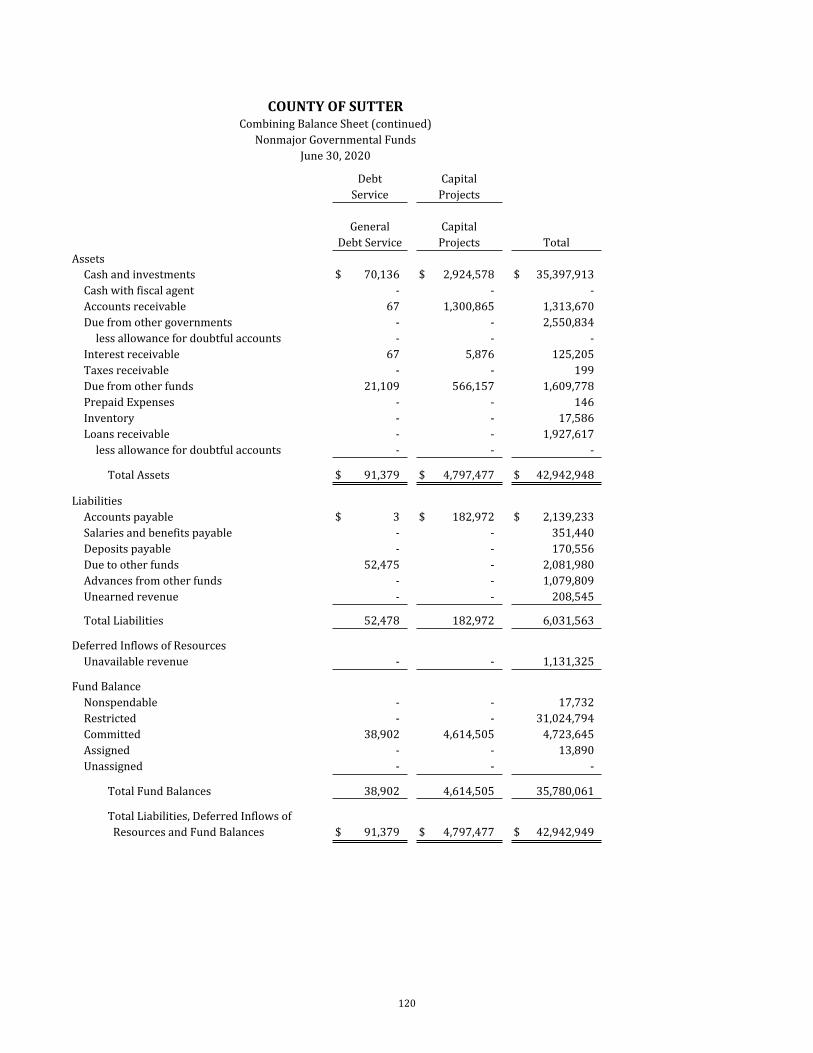
120
COUNTY OF SUTTERCombining Balance Sheet (continued)
Nonmajor Governmental FundsJune 30, 2020
Debt Capital Service Projects
General Capital Debt Service Projects Total
AssetsCash and investments $ 70,136 $ 2,924,578 $ 35,397,913Cash with fiscal agent - - -Accounts receivable 67 1,300,865 1,313,670Due from other governments - - 2,550,834
less allowance for doubtful accounts - - -Interest receivable 67 5,876 125,205Taxes receivable - - 199Due from other funds 21,109 566,157 1,609,778Prepaid Expenses - - 146Inventory - - 17,586Loans receivable - - 1,927,617
less allowance for doubtful accounts - - -
Total Assets $ 91,379 $ 4,797,477 $ 42,942,948
LiabilitiesAccounts payable $ 3 $ 182,972 $ 2,139,233Salaries and benefits payable - - 351,440Deposits payable - - 170,556Due to other funds 52,475 - 2,081,980Advances from other funds - - 1,079,809Unearned revenue - - 208,545
Total Liabilities 52,478 182,972 6,031,563
Deferred Inflows of ResourcesUnavailable revenue - - 1,131,325
Fund BalanceNonspendable - - 17,732Restricted - - 31,024,794Committed 38,902 4,614,505 4,723,645Assigned - - 13,890Unassigned - - -
Total Fund Balances 38,902 4,614,505 35,780,061
Total Liabilities, Deferred Inflows of Resources and Fund Balances $ 91,379 $ 4,797,477 $ 42,942,949
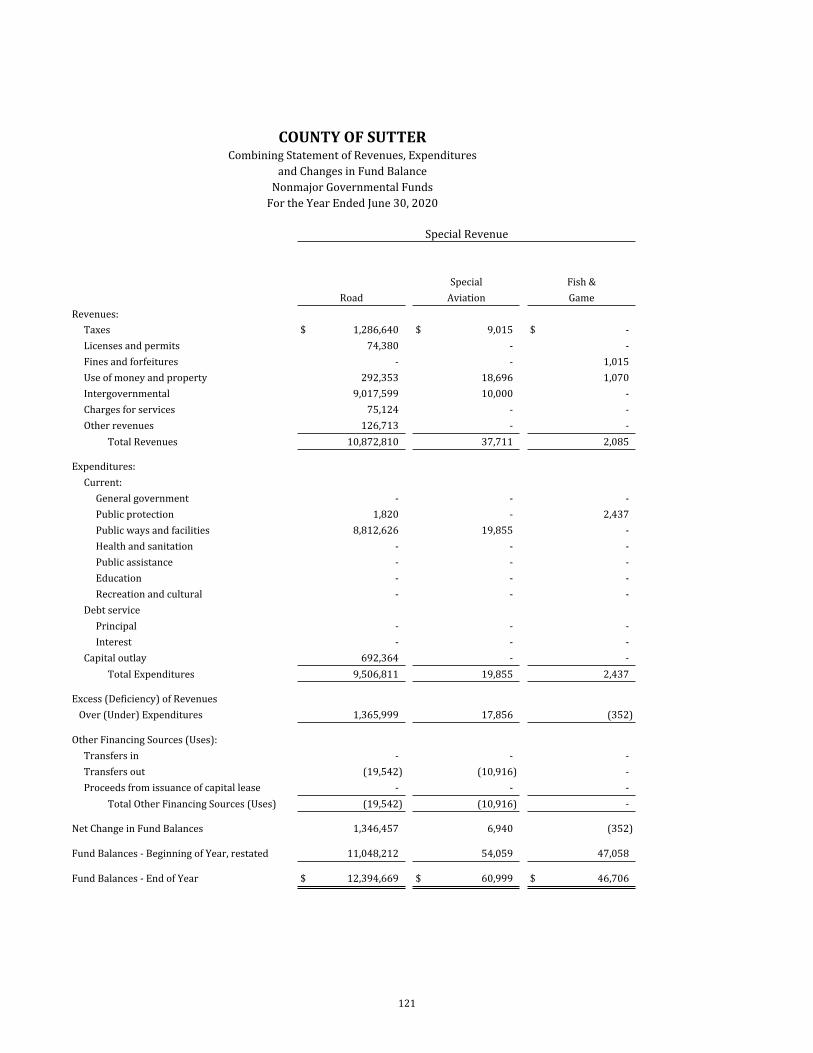
121
COUNTY OF SUTTERCombining Statement of Revenues, Expenditures
and Changes in Fund BalanceNonmajor Governmental Funds
For the Year Ended June 30, 2020
Special Revenue
Special Fish &Road Aviation Game
Revenues:Taxes $ 1,286,640 $ 9,015 $ -Licenses and permits 74,380 - -Fines and forfeitures - - 1,015Use of money and property 292,353 18,696 1,070Intergovernmental 9,017,599 10,000 -Charges for services 75,124 - -Other revenues 126,713 - -
Total Revenues 10,872,810 37,711 2,085
Expenditures:Current:
General government - - -Public protection 1,820 - 2,437Public ways and facilities 8,812,626 19,855 -Health and sanitation - - -Public assistance - - -Education - - -Recreation and cultural - - -
Debt servicePrincipal - - -Interest - - -
Capital outlay 692,364 - -Total Expenditures 9,506,811 19,855 2,437
Excess (Deficiency) of Revenues Over (Under) Expenditures 1,365,999 17,856 (352)
Other Financing Sources (Uses):Transfers in - - -Transfers out (19,542) (10,916) -Proceeds from issuance of capital lease - - -
Total Other Financing Sources (Uses) (19,542) (10,916) -
Net Change in Fund Balances 1,346,457 6,940 (352)
Fund Balances - Beginning of Year, restated 11,048,212 54,059 47,058
Fund Balances - End of Year $ 12,394,669 $ 60,999 $ 46,706
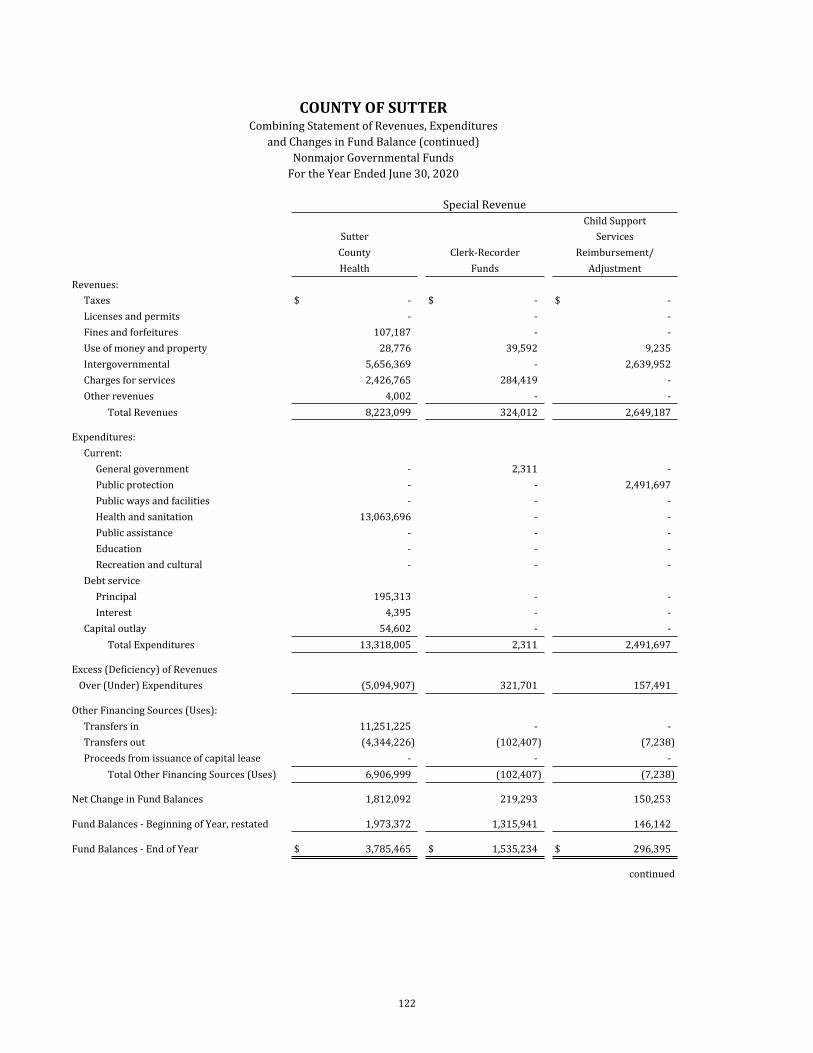
122
COUNTY OF SUTTERCombining Statement of Revenues, Expenditures
and Changes in Fund Balance (continued)Nonmajor Governmental Funds
For the Year Ended June 30, 2020
Special RevenueChild Support
Sutter ServicesCounty Clerk-Recorder Reimbursement/Health Funds Adjustment
Revenues:Taxes $ - $ - $ -Licenses and permits - - -Fines and forfeitures 107,187 - -Use of money and property 28,776 39,592 9,235Intergovernmental 5,656,369 - 2,639,952Charges for services 2,426,765 284,419 -Other revenues 4,002 - -
Total Revenues 8,223,099 324,012 2,649,187
Expenditures:Current:
General government - 2,311 -Public protection - - 2,491,697Public ways and facilities - - -Health and sanitation 13,063,696 - -Public assistance - - -Education - - -Recreation and cultural - - -
Debt servicePrincipal 195,313 - -Interest 4,395 - -
Capital outlay 54,602 - -Total Expenditures 13,318,005 2,311 2,491,697
Excess (Deficiency) of Revenues Over (Under) Expenditures (5,094,907) 321,701 157,491
Other Financing Sources (Uses):Transfers in 11,251,225 - -Transfers out (4,344,226) (102,407) (7,238)Proceeds from issuance of capital lease - - -
Total Other Financing Sources (Uses) 6,906,999 (102,407) (7,238)
Net Change in Fund Balances 1,812,092 219,293 150,253
Fund Balances - Beginning of Year, restated 1,973,372 1,315,941 146,142
Fund Balances - End of Year $ 3,785,465 $ 1,535,234 $ 296,395
continued
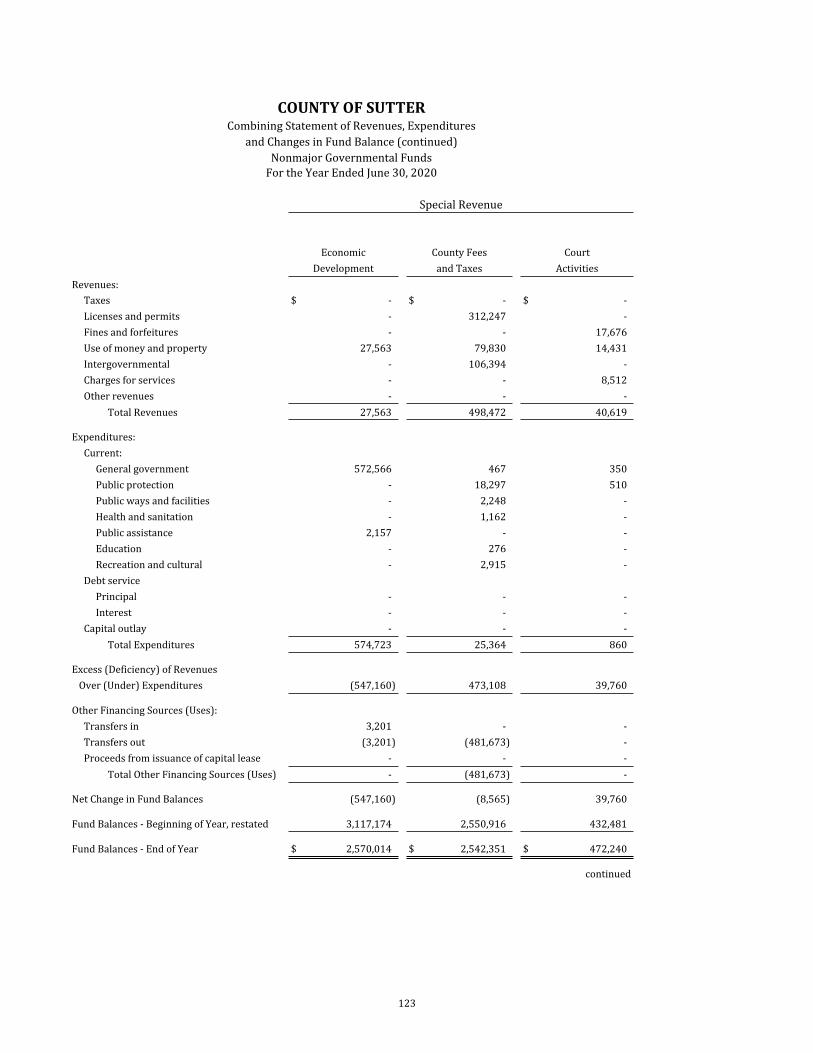
123
COUNTY OF SUTTERCombining Statement of Revenues, Expenditures
and Changes in Fund Balance (continued)Nonmajor Governmental Funds
For the Year Ended June 30, 2020
Special Revenue
Economic County Fees CourtDevelopment and Taxes Activities
Revenues:Taxes $ - $ - $ -Licenses and permits - 312,247 -Fines and forfeitures - - 17,676Use of money and property 27,563 79,830 14,431Intergovernmental - 106,394 -Charges for services - - 8,512Other revenues - - -
Total Revenues 27,563 498,472 40,619
Expenditures:Current:
General government 572,566 467 350Public protection - 18,297 510Public ways and facilities - 2,248 -Health and sanitation - 1,162 -Public assistance 2,157 - -Education - 276 -Recreation and cultural - 2,915 -
Debt servicePrincipal - - -Interest - - -
Capital outlay - - -Total Expenditures 574,723 25,364 860
Excess (Deficiency) of Revenues Over (Under) Expenditures (547,160) 473,108 39,760
Other Financing Sources (Uses):Transfers in 3,201 - -Transfers out (3,201) (481,673) -Proceeds from issuance of capital lease - - -
Total Other Financing Sources (Uses) - (481,673) -
Net Change in Fund Balances (547,160) (8,565) 39,760
Fund Balances - Beginning of Year, restated 3,117,174 2,550,916 432,481
Fund Balances - End of Year $ 2,570,014 $ 2,542,351 $ 472,240
continued
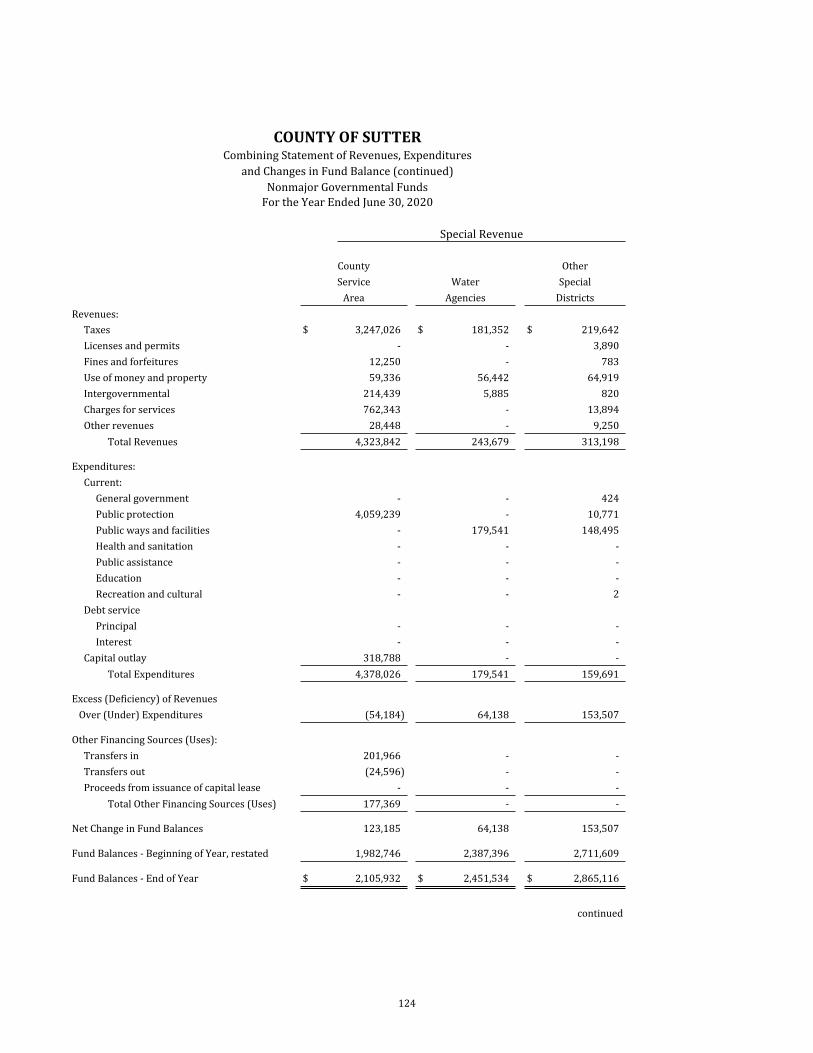
124
COUNTY OF SUTTERCombining Statement of Revenues, Expenditures
and Changes in Fund Balance (continued)Nonmajor Governmental Funds
For the Year Ended June 30, 2020
Special Revenue
County OtherService Water Special
Area Agencies DistrictsRevenues:
Taxes $ 3,247,026 $ 181,352 $ 219,642Licenses and permits - - 3,890Fines and forfeitures 12,250 - 783Use of money and property 59,336 56,442 64,919Intergovernmental 214,439 5,885 820Charges for services 762,343 - 13,894Other revenues 28,448 - 9,250
Total Revenues 4,323,842 243,679 313,198
Expenditures:Current:
General government - - 424Public protection 4,059,239 - 10,771Public ways and facilities - 179,541 148,495Health and sanitation - - -Public assistance - - -Education - - -Recreation and cultural - - 2
Debt servicePrincipal - - -Interest - - -
Capital outlay 318,788 - -Total Expenditures 4,378,026 179,541 159,691
Excess (Deficiency) of Revenues Over (Under) Expenditures (54,184) 64,138 153,507
Other Financing Sources (Uses):Transfers in 201,966 - -Transfers out (24,596) - -Proceeds from issuance of capital lease - - -
Total Other Financing Sources (Uses) 177,369 - -
Net Change in Fund Balances 123,185 64,138 153,507
Fund Balances - Beginning of Year, restated 1,982,746 2,387,396 2,711,609
Fund Balances - End of Year $ 2,105,932 $ 2,451,534 $ 2,865,116
continued
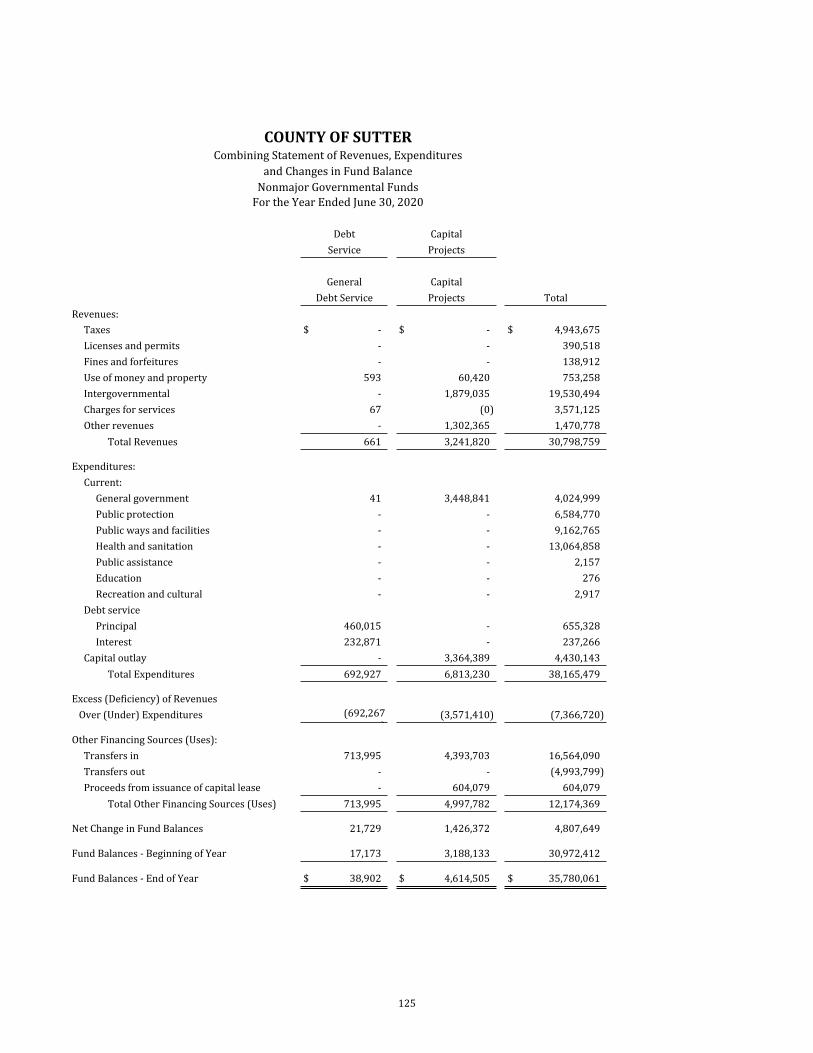
125
COUNTY OF SUTTERCombining Statement of Revenues, Expenditures
and Changes in Fund BalanceNonmajor Governmental Funds
For the Year Ended June 30, 2020
Debt Capital Service Projects
General Capital Debt Service Projects Total
Revenues:Taxes $ - $ - $ 4,943,675Licenses and permits - - 390,518Fines and forfeitures - - 138,912Use of money and property 593 60,420 753,258Intergovernmental - 1,879,035 19,530,494Charges for services 67 (0) 3,571,125Other revenues - 1,302,365 1,470,778
Total Revenues 661 3,241,820 30,798,759
Expenditures:Current:
General government 41 3,448,841 4,024,999Public protection - - 6,584,770Public ways and facilities - - 9,162,765Health and sanitation - - 13,064,858Public assistance - - 2,157Education - - 276Recreation and cultural - - 2,917
Debt servicePrincipal 460,015 - 655,328Interest 232,871 - 237,266
Capital outlay - 3,364,389 4,430,143Total Expenditures 692,927 6,813,230 38,165,479
Excess (Deficiency) of Revenues Over (Under) Expenditures (692,267
)(3,571,410) (7,366,720)
Other Financing Sources (Uses):Transfers in 713,995 4,393,703 16,564,090Transfers out - - (4,993,799)Proceeds from issuance of capital lease - 604,079 604,079
Total Other Financing Sources (Uses) 713,995 4,997,782 12,174,369
Net Change in Fund Balances 21,729 1,426,372 4,807,649
Fund Balances - Beginning of Year 17,173 3,188,133 30,972,412
Fund Balances - End of Year $ 38,902 $ 4,614,505 $ 35,780,061
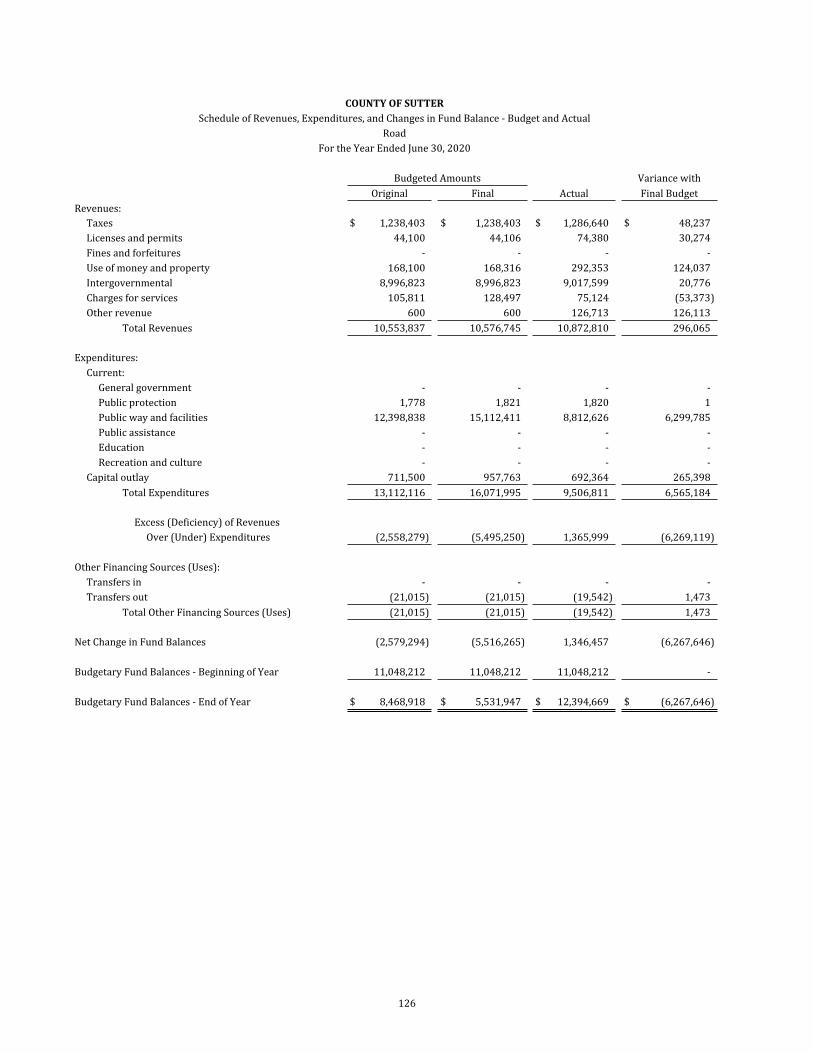
126
COUNTY OF SUTTERSchedule of Revenues, Expenditures, and Changes in Fund Balance - Budget and Actual
RoadFor the Year Ended June 30, 2020
Budgeted Amounts Variance withOriginal Final Actual Final Budget
Revenues:Taxes $ 1,238,403 $ 1,238,403 $ 1,286,640 $ 48,237Licenses and permits 44,100 44,106 74,380 30,274Fines and forfeitures - - - -Use of money and property 168,100 168,316 292,353 124,037Intergovernmental 8,996,823 8,996,823 9,017,599 20,776Charges for services 105,811 128,497 75,124 (53,373)Other revenue 600 600 126,713 126,113
Total Revenues 10,553,837 10,576,745 10,872,810 296,065
Expenditures:Current:
General government - - - -Public protection 1,778 1,821 1,820 1Public way and facilities 12,398,838 15,112,411 8,812,626 6,299,785Public assistance - - - -Education - - - -Recreation and culture - - - -
Capital outlay 711,500 957,763 692,364 265,398Total Expenditures 13,112,116 16,071,995 9,506,811 6,565,184
Excess (Deficiency) of RevenuesOver (Under) Expenditures (2,558,279) (5,495,250) 1,365,999 (6,269,119)
Other Financing Sources (Uses):Transfers in - - - -Transfers out (21,015) (21,015) (19,542) 1,473
Total Other Financing Sources (Uses) (21,015) (21,015) (19,542) 1,473
Net Change in Fund Balances (2,579,294) (5,516,265) 1,346,457 (6,267,646)
Budgetary Fund Balances - Beginning of Year 11,048,212 11,048,212 11,048,212 -
Budgetary Fund Balances - End of Year $ 8,468,918 $ 5,531,947 $ 12,394,669 $ (6,267,646)
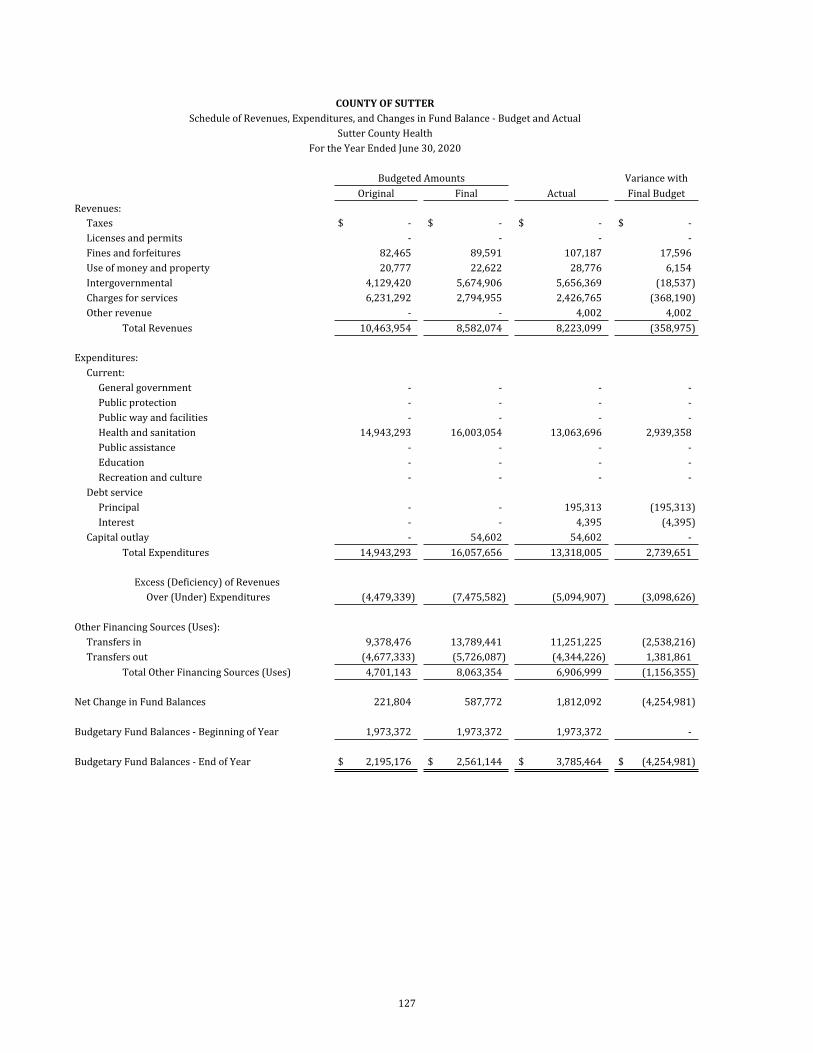
127
COUNTY OF SUTTERSchedule of Revenues, Expenditures, and Changes in Fund Balance - Budget and Actual
Sutter County HealthFor the Year Ended June 30, 2020
Budgeted Amounts Variance withOriginal Final Actual Final Budget
Revenues:Taxes $ - $ - $ - $ -Licenses and permits - - - -Fines and forfeitures 82,465 89,591 107,187 17,596Use of money and property 20,777 22,622 28,776 6,154Intergovernmental 4,129,420 5,674,906 5,656,369 (18,537)Charges for services 6,231,292 2,794,955 2,426,765 (368,190)Other revenue - - 4,002 4,002
Total Revenues 10,463,954 8,582,074 8,223,099 (358,975)
Expenditures:Current:
General government - - - -Public protection - - - -Public way and facilities - - - -Health and sanitation 14,943,293 16,003,054 13,063,696 2,939,358Public assistance - - - -Education - - - -Recreation and culture - - - -
Debt servicePrincipal - - 195,313 (195,313)Interest - - 4,395 (4,395)
Capital outlay - 54,602 54,602 -Total Expenditures 14,943,293 16,057,656 13,318,005 2,739,651
Excess (Deficiency) of RevenuesOver (Under) Expenditures (4,479,339) (7,475,582) (5,094,907) (3,098,626)
Other Financing Sources (Uses):Transfers in 9,378,476 13,789,441 11,251,225 (2,538,216)Transfers out (4,677,333) (5,726,087) (4,344,226) 1,381,861
Total Other Financing Sources (Uses) 4,701,143 8,063,354 6,906,999 (1,156,355)
Net Change in Fund Balances 221,804 587,772 1,812,092 (4,254,981)
Budgetary Fund Balances - Beginning of Year 1,973,372 1,973,372 1,973,372 -
Budgetary Fund Balances - End of Year $ 2,195,176 $ 2,561,144 $ 3,785,464 $ (4,254,981)
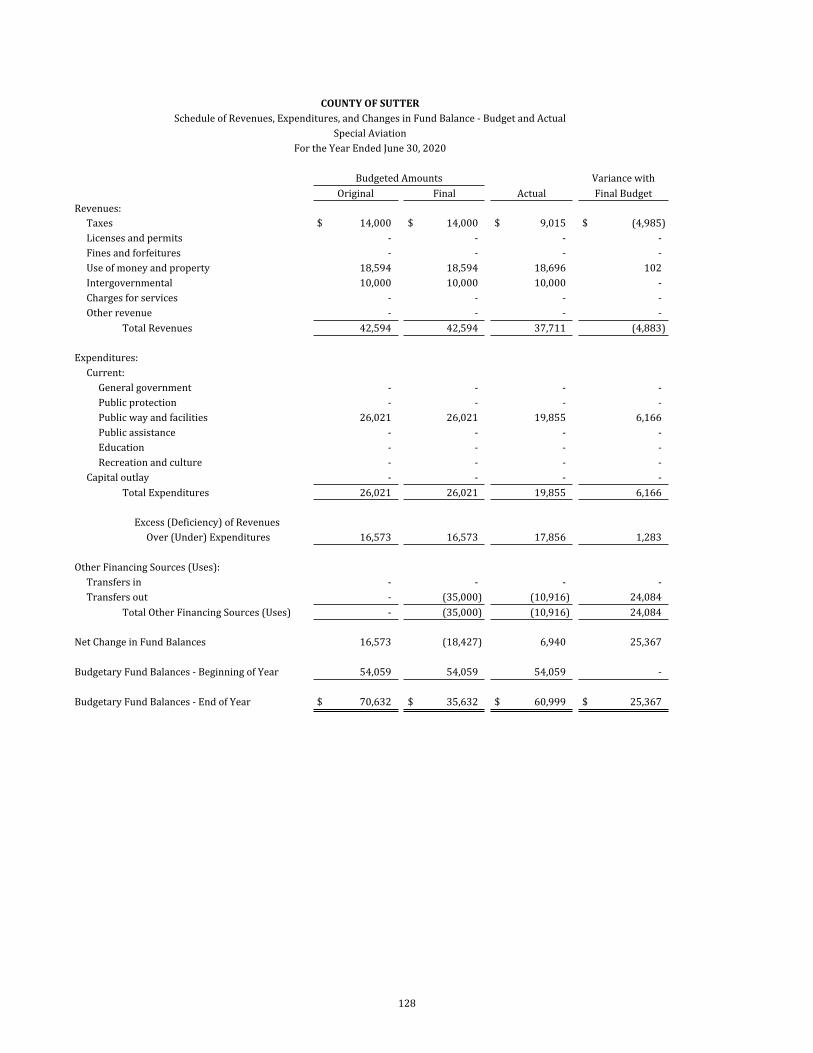
128
COUNTY OF SUTTERSchedule of Revenues, Expenditures, and Changes in Fund Balance - Budget and Actual
Special AviationFor the Year Ended June 30, 2020
Budgeted Amounts Variance withOriginal Final Actual Final Budget
Revenues:Taxes $ 14,000 $ 14,000 $ 9,015 $ (4,985)Licenses and permits - - - -Fines and forfeitures - - - -Use of money and property 18,594 18,594 18,696 102Intergovernmental 10,000 10,000 10,000 -Charges for services - - - -Other revenue - - - -
Total Revenues 42,594 42,594 37,711 (4,883)
Expenditures:Current:
General government - - - -Public protection - - - -Public way and facilities 26,021 26,021 19,855 6,166Public assistance - - - -Education - - - -Recreation and culture - - - -
Capital outlay - - - -Total Expenditures 26,021 26,021 19,855 6,166
Excess (Deficiency) of RevenuesOver (Under) Expenditures 16,573 16,573 17,856 1,283
Other Financing Sources (Uses):Transfers in - - - -Transfers out - (35,000) (10,916) 24,084
Total Other Financing Sources (Uses) - (35,000) (10,916) 24,084
Net Change in Fund Balances 16,573 (18,427) 6,940 25,367
Budgetary Fund Balances - Beginning of Year 54,059 54,059 54,059 -
Budgetary Fund Balances - End of Year $ 70,632 $ 35,632 $ 60,999 $ 25,367
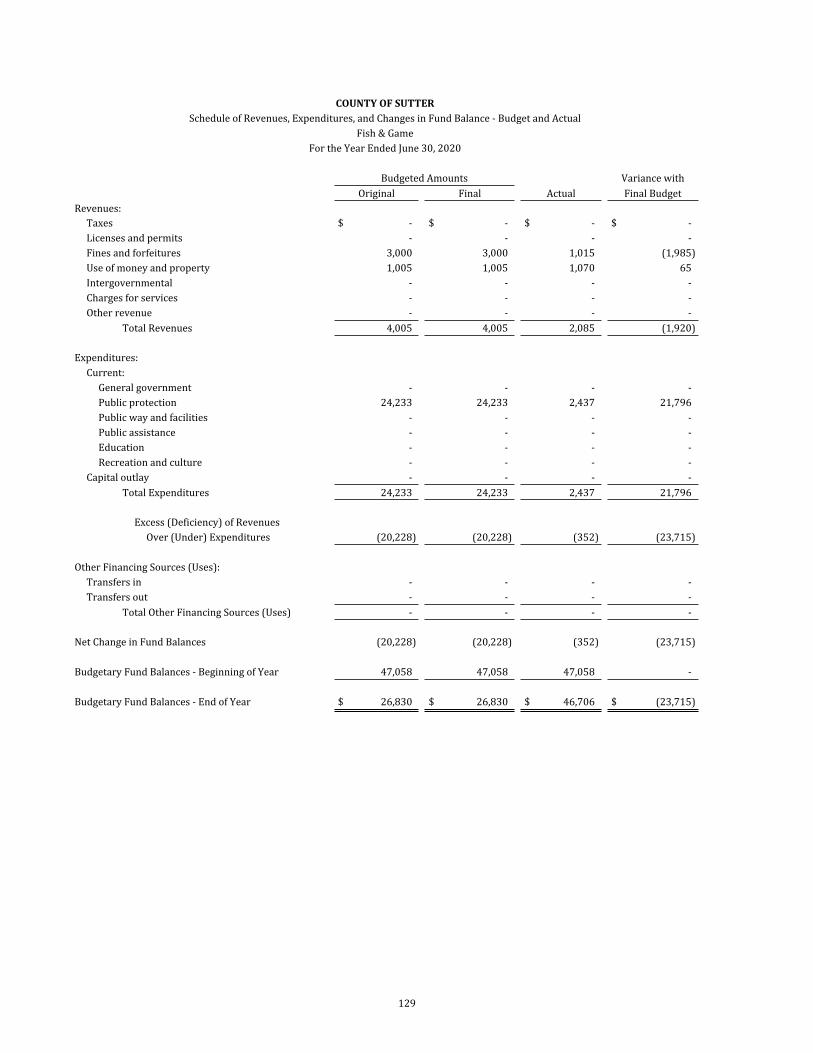
129
COUNTY OF SUTTERSchedule of Revenues, Expenditures, and Changes in Fund Balance - Budget and Actual
Fish & GameFor the Year Ended June 30, 2020
Budgeted Amounts Variance withOriginal Final Actual Final Budget
Revenues:Taxes $ - $ - $ - $ -Licenses and permits - - - -Fines and forfeitures 3,000 3,000 1,015 (1,985)Use of money and property 1,005 1,005 1,070 65Intergovernmental - - - -Charges for services - - - -Other revenue - - - -
Total Revenues 4,005 4,005 2,085 (1,920)
Expenditures:Current:
General government - - - -Public protection 24,233 24,233 2,437 21,796Public way and facilities - - - -Public assistance - - - -Education - - - -Recreation and culture - - - -
Capital outlay - - - -Total Expenditures 24,233 24,233 2,437 21,796
Excess (Deficiency) of RevenuesOver (Under) Expenditures (20,228) (20,228) (352) (23,715)
Other Financing Sources (Uses):Transfers in - - - -Transfers out - - - -
Total Other Financing Sources (Uses) - - - -
Net Change in Fund Balances (20,228) (20,228) (352) (23,715)
Budgetary Fund Balances - Beginning of Year 47,058 47,058 47,058 -
Budgetary Fund Balances - End of Year $ 26,830 $ 26,830 $ 46,706 $ (23,715)
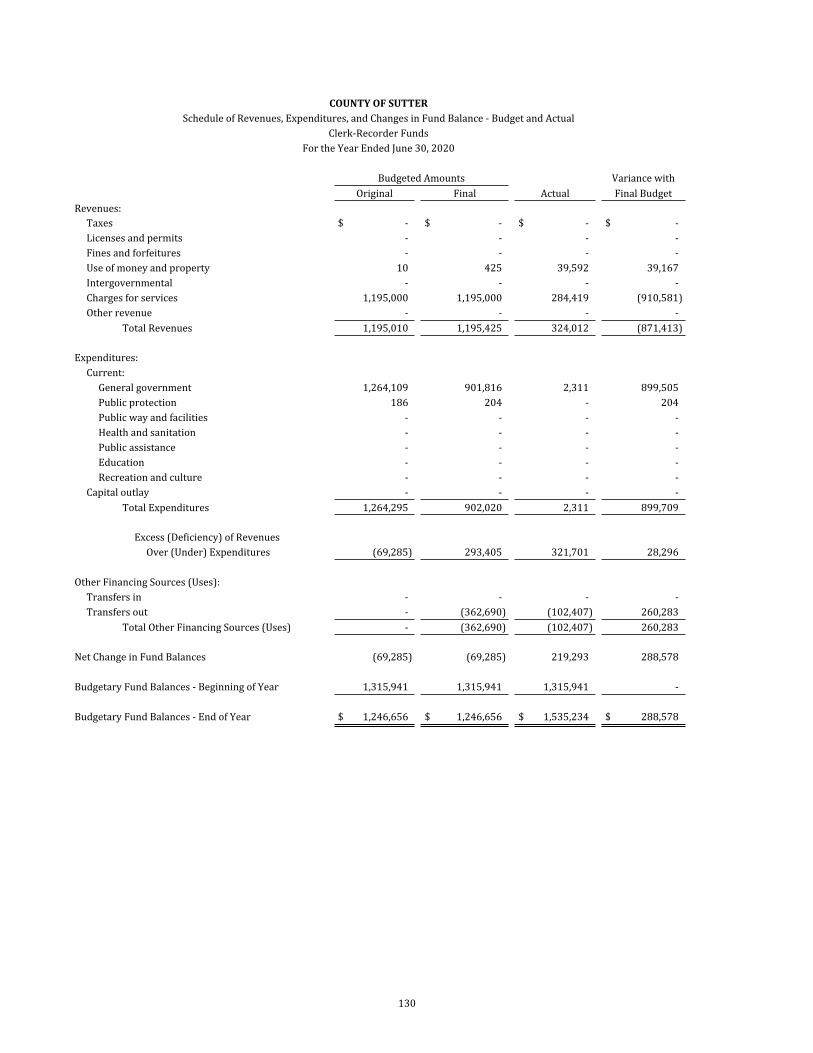
130
COUNTY OF SUTTERSchedule of Revenues, Expenditures, and Changes in Fund Balance - Budget and Actual
Clerk-Recorder FundsFor the Year Ended June 30, 2020
Budgeted Amounts Variance withOriginal Final Actual Final Budget
Revenues:Taxes $ - $ - $ - $ -Licenses and permits - - - -Fines and forfeitures - - - -Use of money and property 10 425 39,592 39,167Intergovernmental - - - -Charges for services 1,195,000 1,195,000 284,419 (910,581)Other revenue - - - -
Total Revenues 1,195,010 1,195,425 324,012 (871,413)
Expenditures:Current:
General government 1,264,109 901,816 2,311 899,505Public protection 186 204 - 204Public way and facilities - - - -Health and sanitation - - - -Public assistance - - - -Education - - - -Recreation and culture - - - -
Capital outlay - - - -Total Expenditures 1,264,295 902,020 2,311 899,709
Excess (Deficiency) of RevenuesOver (Under) Expenditures (69,285) 293,405 321,701 28,296
Other Financing Sources (Uses):Transfers in - - - -Transfers out - (362,690) (102,407) 260,283
Total Other Financing Sources (Uses) - (362,690) (102,407) 260,283
Net Change in Fund Balances (69,285) (69,285) 219,293 288,578
Budgetary Fund Balances - Beginning of Year 1,315,941 1,315,941 1,315,941 -
Budgetary Fund Balances - End of Year $ 1,246,656 $ 1,246,656 $ 1,535,234 $ 288,578
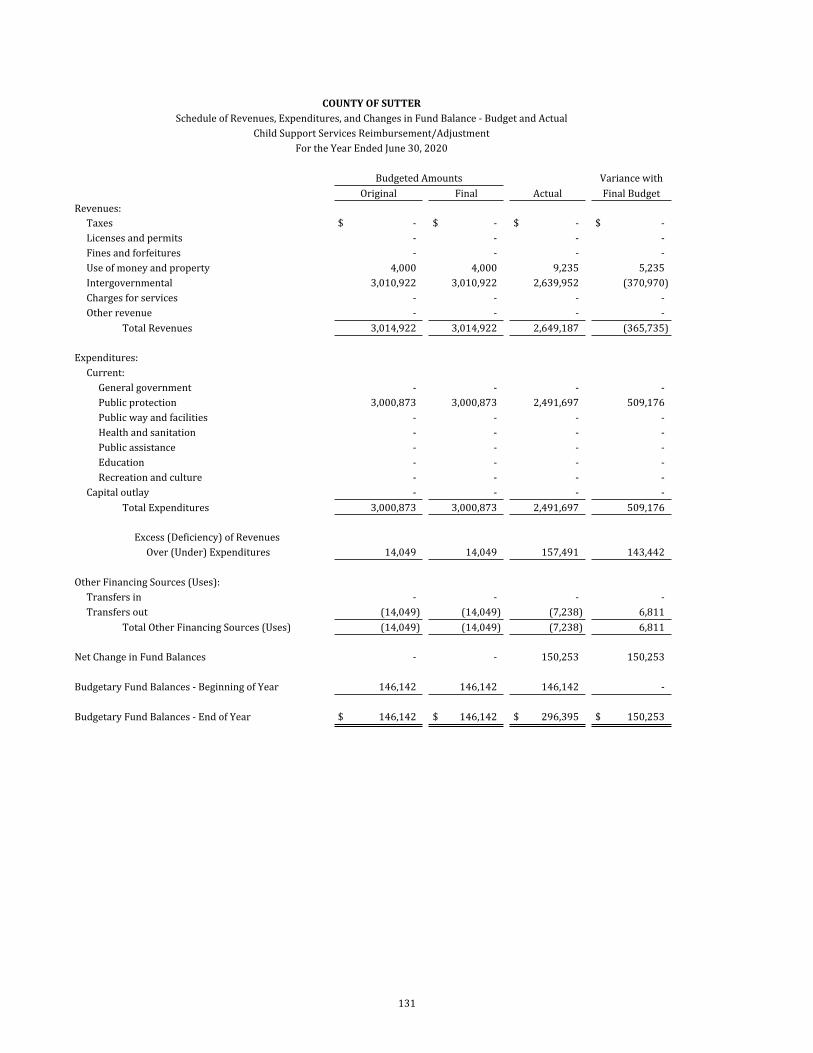
131
COUNTY OF SUTTERSchedule of Revenues, Expenditures, and Changes in Fund Balance - Budget and Actual
Child Support Services Reimbursement/AdjustmentFor the Year Ended June 30, 2020
Budgeted Amounts Variance withOriginal Final Actual Final Budget
Revenues:Taxes $ - $ - $ - $ -Licenses and permits - - - -Fines and forfeitures - - - -Use of money and property 4,000 4,000 9,235 5,235Intergovernmental 3,010,922 3,010,922 2,639,952 (370,970)Charges for services - - - -Other revenue - - - -
Total Revenues 3,014,922 3,014,922 2,649,187 (365,735)
Expenditures:Current:
General government - - - -Public protection 3,000,873 3,000,873 2,491,697 509,176Public way and facilities - - - -Health and sanitation - - - -Public assistance - - - -Education - - - -Recreation and culture - - - -
Capital outlay - - - -Total Expenditures 3,000,873 3,000,873 2,491,697 509,176
Excess (Deficiency) of RevenuesOver (Under) Expenditures 14,049 14,049 157,491 143,442
Other Financing Sources (Uses):Transfers in - - - -Transfers out (14,049) (14,049) (7,238) 6,811
Total Other Financing Sources (Uses) (14,049) (14,049) (7,238) 6,811
Net Change in Fund Balances - - 150,253 150,253
Budgetary Fund Balances - Beginning of Year 146,142 146,142 146,142 -
Budgetary Fund Balances - End of Year $ 146,142 $ 146,142 $ 296,395 $ 150,253

132
COUNTY OF SUTTERSchedule of Revenues, Expenditures, and Changes in Fund Balance - Budget and Actual
Economic DevelopmentFor the Year Ended June 30, 2020
Budgeted Amounts Variance withOriginal Final Actual Final Budget
Revenues:Taxes $ - $ - $ - $ -Licenses and permits - - - -Fines and forfeitures - - - -Use of money and property 10,414 18,568 27,563 8,995Intergovernmental - - - -Charges for services - - - -Other revenue - - - -
Total Revenues 10,414 18,568 27,563 8,995
Expenditures:Current:
General government 1,386 573,386 572,566 820Public protection - - - -Public way and facilities - - - -Health and sanitation - - - -Public assistance 7,847 208,021 2,157 205,864Education - - - -Recreation and culture - - - -
Capital outlay - - - -Total Expenditures 9,233 781,407 574,723 206,684
Excess (Deficiency) of RevenuesOver (Under) Expenditures 1,181 (762,839) (547,160) (197,688)
Other Financing Sources (Uses):Transfers in - - 3,201 3,201Transfers out - (3,202) (3,201) 1
Total Other Financing Sources (Uses) - (3,202) - 3,202
Net Change in Fund Balances 1,181 (766,041) (547,160) (194,486)
Budgetary Fund Balances - Beginning of Year 3,117,174 3,117,174 3,117,174 -
Budgetary Fund Balances - End of Year $ 3,118,355 $ 2,351,133 $ 2,570,014 $ (194,486)

133
COUNTY OF SUTTERSchedule of Revenues, Expenditures, and Changes in Fund Balance - Budget and Actual
County Fees and TaxesFor the Year Ended June 30, 2020
Budgeted Amounts Variance withOriginal Final Actual Final Budget
Revenues:Taxes $ - $ - $ - $ -Licenses and permits 266,500 270,500 312,247 41,747Fines and forfeitures - - - -Use of money and property 78,818 84,383 79,830 (4,553)Intergovernmental 120,000 120,000 106,394 (13,606)Charges for services - - - -Other revenue - - - -
Total Revenues 465,318 474,883 498,472 23,589
Expenditures:Current:
General government 1,147 1,147 467 680Public protection 1,337 18,805 18,297 508Public way and facilities 379 2,356 2,248 109Health and sanitation 143 1,162 1,162 -Public assistance - - - -Education 242 276 276 -Recreation and culture 1,138 3,483 2,915 568
Capital outlay - - - -Total Expenditures 4,386 27,230 25,365 1,865
Excess (Deficiency) of RevenuesOver (Under) Expenditures 460,932 447,653 473,107 25,454
Other Financing Sources (Uses):Transfers in - - - -Transfers out (116,150) (1,108,150) (481,673) 626,477
Total Other Financing Sources (Uses) (116,150) (1,108,150) (481,673) 626,477
Net Change in Fund Balances 344,782 (660,497) (8,565) 651,931
Budgetary Fund Balances - Beginning of Year 2,550,916 2,550,916 2,550,916 -
Budgetary Fund Balances - End of Year $ 2,895,698 $ 1,890,419 $ 2,542,350 $ 651,931

134
COUNTY OF SUTTERSchedule of Revenues, Expenditures, and Changes in Fund Balance - Budget and Actual
Court ActivitiesFor the Year Ended June 30, 2020
Budgeted Amounts Variance withOriginal Final Actual Final Budget
Revenues:Taxes $ - $ - $ - $ -Licenses and permits - - - -Fines and forfeitures 14,000 14,000 17,676 3,676Use of money and property 25 127 14,431 14,304Intergovernmental - - - -Charges for services 13,000 13,000 8,512 (4,488)Other revenue - - - -
Total Revenues 27,025 27,127 40,619 13,492
Expenditures:Current:
General government 2,967 351 350 1Public protection 456 510 510 -Public way and facilities - - - -Health and sanitation - - - -Public assistance - - - -Education - - - -Recreation and culture - - - -
Debt service: interest - - - -Total Expenditures 3,423 861 860 1
Excess (Deficiency) of RevenuesOver (Under) Expenditures 23,602 26,266 39,760 13,494
Other Financing Sources (Uses):Transfers in - - - -Transfers out - (2,664) - 2,664
Total Other Financing Sources (Uses) - (2,664) - 2,664
Net Change in Fund Balances 23,602 23,602 39,760 16,158
Budgetary Fund Balances - Beginning of Year 432,481 432,481 432,481 -
Budgetary Fund Balances - End of Year $ 456,083 $ 456,083 $ 472,240 $ 16,158
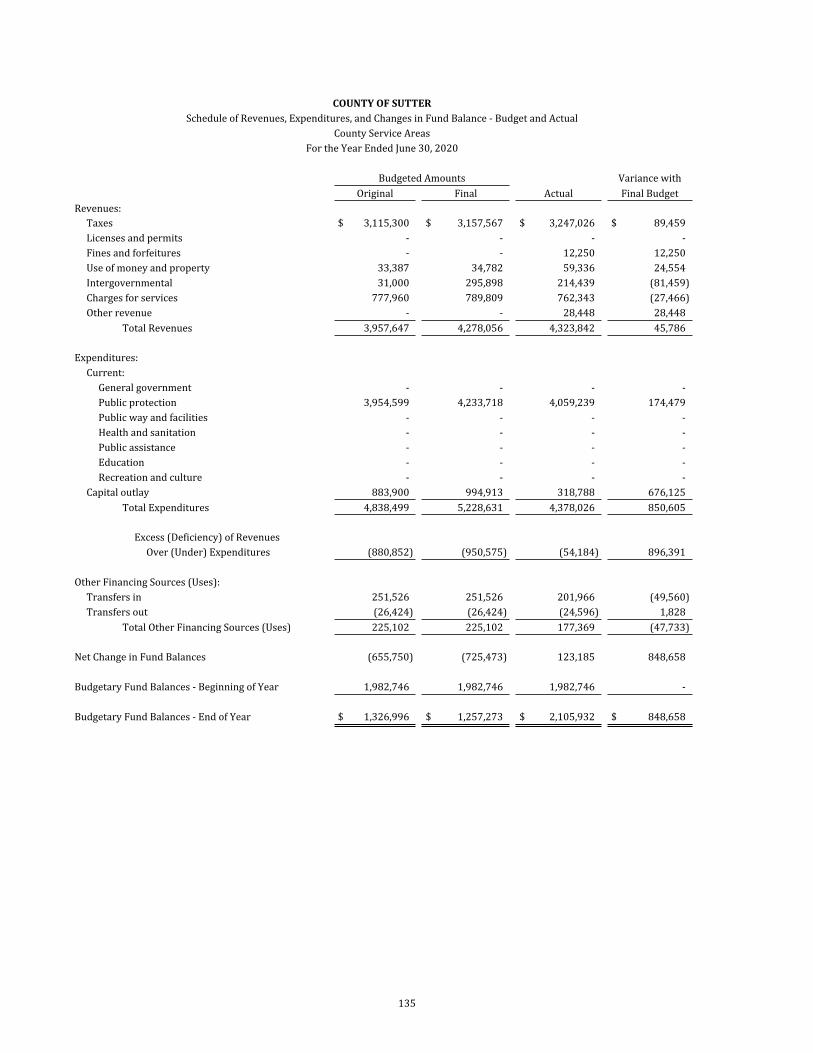
135
COUNTY OF SUTTERSchedule of Revenues, Expenditures, and Changes in Fund Balance - Budget and Actual
County Service AreasFor the Year Ended June 30, 2020
Budgeted Amounts Variance withOriginal Final Actual Final Budget
Revenues:Taxes $ 3,115,300 $ 3,157,567 $ 3,247,026 $ 89,459Licenses and permits - - - -Fines and forfeitures - - 12,250 12,250Use of money and property 33,387 34,782 59,336 24,554Intergovernmental 31,000 295,898 214,439 (81,459)Charges for services 777,960 789,809 762,343 (27,466)Other revenue - - 28,448 28,448
Total Revenues 3,957,647 4,278,056 4,323,842 45,786
Expenditures:Current:
General government - - - -Public protection 3,954,599 4,233,718 4,059,239 174,479Public way and facilities - - - -Health and sanitation - - - -Public assistance - - - -Education - - - -Recreation and culture - - - -
Capital outlay 883,900 994,913 318,788 676,125Total Expenditures 4,838,499 5,228,631 4,378,026 850,605
Excess (Deficiency) of RevenuesOver (Under) Expenditures (880,852) (950,575) (54,184) 896,391
Other Financing Sources (Uses):Transfers in 251,526 251,526 201,966 (49,560)Transfers out (26,424) (26,424) (24,596) 1,828
Total Other Financing Sources (Uses) 225,102 225,102 177,369 (47,733)
Net Change in Fund Balances (655,750) (725,473) 123,185 848,658
Budgetary Fund Balances - Beginning of Year 1,982,746 1,982,746 1,982,746 -
Budgetary Fund Balances - End of Year $ 1,326,996 $ 1,257,273 $ 2,105,932 $ 848,658
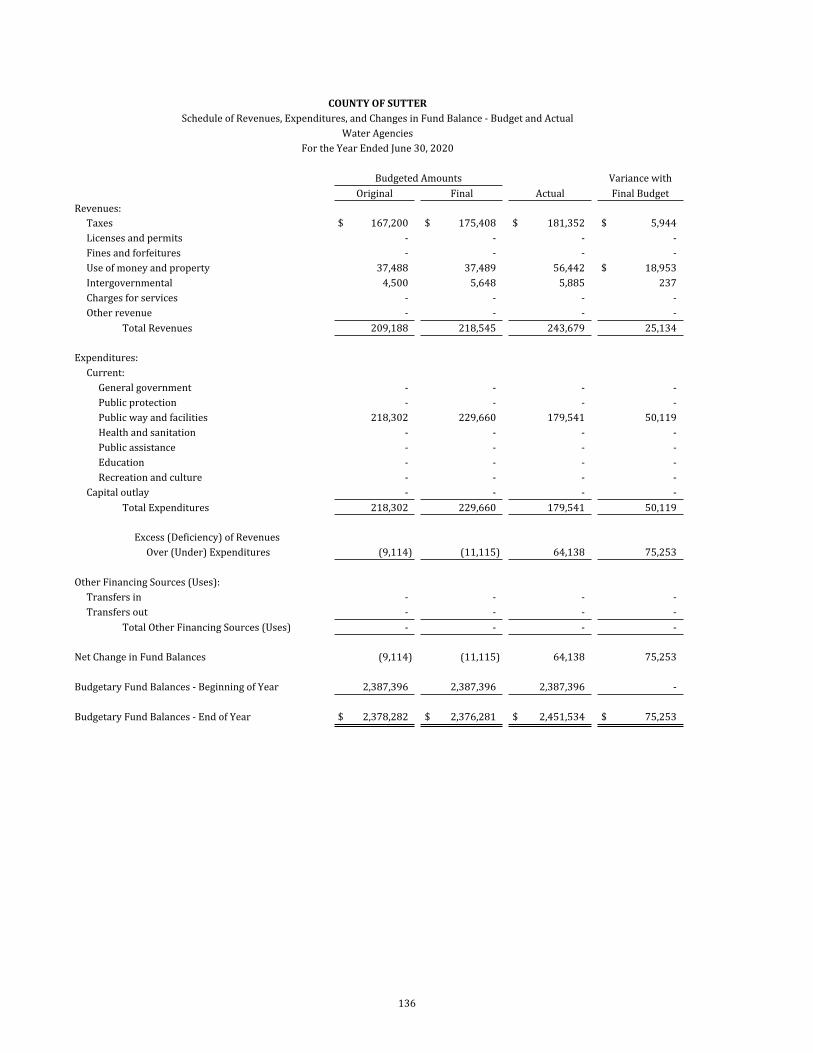
136
COUNTY OF SUTTERSchedule of Revenues, Expenditures, and Changes in Fund Balance - Budget and Actual
Water AgenciesFor the Year Ended June 30, 2020
Budgeted Amounts Variance withOriginal Final Actual Final Budget
Revenues:Taxes $ 167,200 $ 175,408 $ 181,352 $ 5,944Licenses and permits - - - -Fines and forfeitures - - - -Use of money and property 37,488 37,489 56,442 $ 18,953Intergovernmental 4,500 5,648 5,885 237Charges for services - - - -Other revenue - - - -
Total Revenues 209,188 218,545 243,679 25,134
Expenditures:Current:
General government - - - -Public protection - - - -Public way and facilities 218,302 229,660 179,541 50,119Health and sanitation - - - -Public assistance - - - -Education - - - -Recreation and culture - - - -
Capital outlay - - - -Total Expenditures 218,302 229,660 179,541 50,119
Excess (Deficiency) of RevenuesOver (Under) Expenditures (9,114) (11,115) 64,138 75,253
Other Financing Sources (Uses):Transfers in - - - -Transfers out - - - -
Total Other Financing Sources (Uses) - - - -
Net Change in Fund Balances (9,114) (11,115) 64,138 75,253
Budgetary Fund Balances - Beginning of Year 2,387,396 2,387,396 2,387,396 -
Budgetary Fund Balances - End of Year $ 2,378,282 $ 2,376,281 $ 2,451,534 $ 75,253
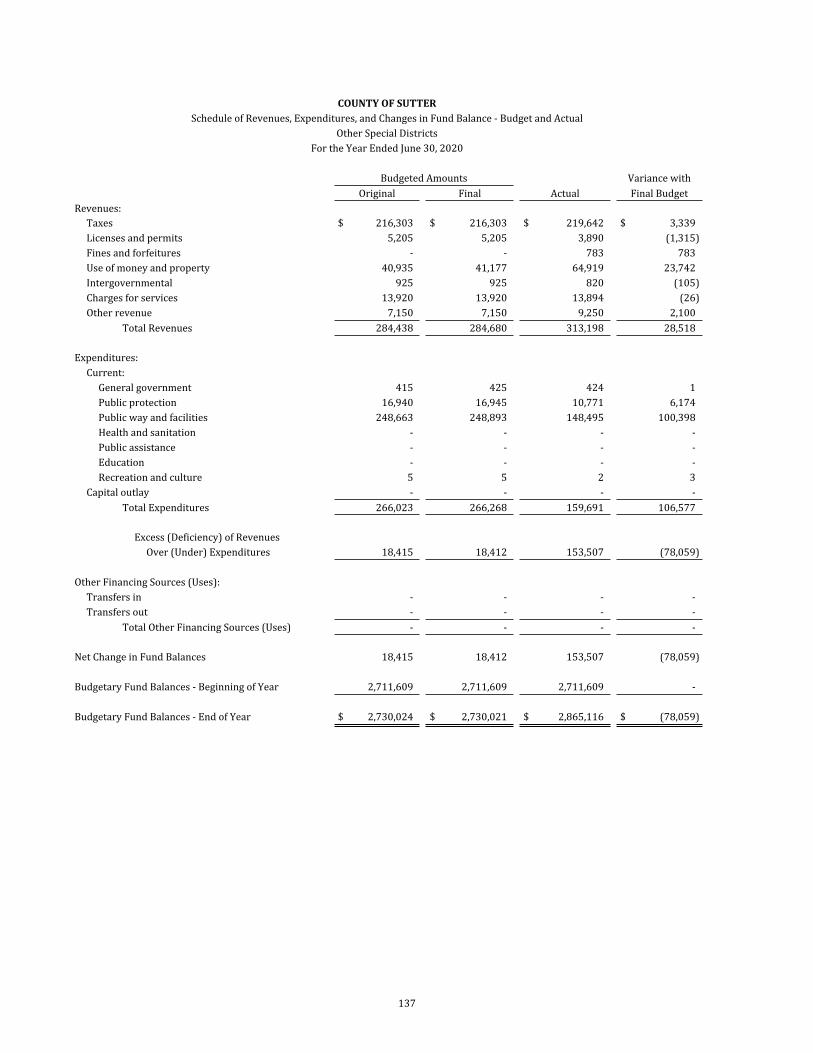
137
COUNTY OF SUTTERSchedule of Revenues, Expenditures, and Changes in Fund Balance - Budget and Actual
Other Special DistrictsFor the Year Ended June 30, 2020
Budgeted Amounts Variance withOriginal Final Actual Final Budget
Revenues:Taxes $ 216,303 $ 216,303 $ 219,642 $ 3,339Licenses and permits 5,205 5,205 3,890 (1,315)Fines and forfeitures - - 783 783Use of money and property 40,935 41,177 64,919 23,742Intergovernmental 925 925 820 (105)Charges for services 13,920 13,920 13,894 (26)Other revenue 7,150 7,150 9,250 2,100
Total Revenues 284,438 284,680 313,198 28,518
Expenditures:Current:
General government 415 425 424 1Public protection 16,940 16,945 10,771 6,174Public way and facilities 248,663 248,893 148,495 100,398Health and sanitation - - - -Public assistance - - - -Education - - - -Recreation and culture 5 5 2 3
Capital outlay - - - -Total Expenditures 266,023 266,268 159,691 106,577
Excess (Deficiency) of RevenuesOver (Under) Expenditures 18,415 18,412 153,507 (78,059)
Other Financing Sources (Uses):Transfers in - - - -Transfers out - - - -
Total Other Financing Sources (Uses) - - - -
Net Change in Fund Balances 18,415 18,412 153,507 (78,059)
Budgetary Fund Balances - Beginning of Year 2,711,609 2,711,609 2,711,609 -
Budgetary Fund Balances - End of Year $ 2,730,024 $ 2,730,021 $ 2,865,116 $ (78,059)
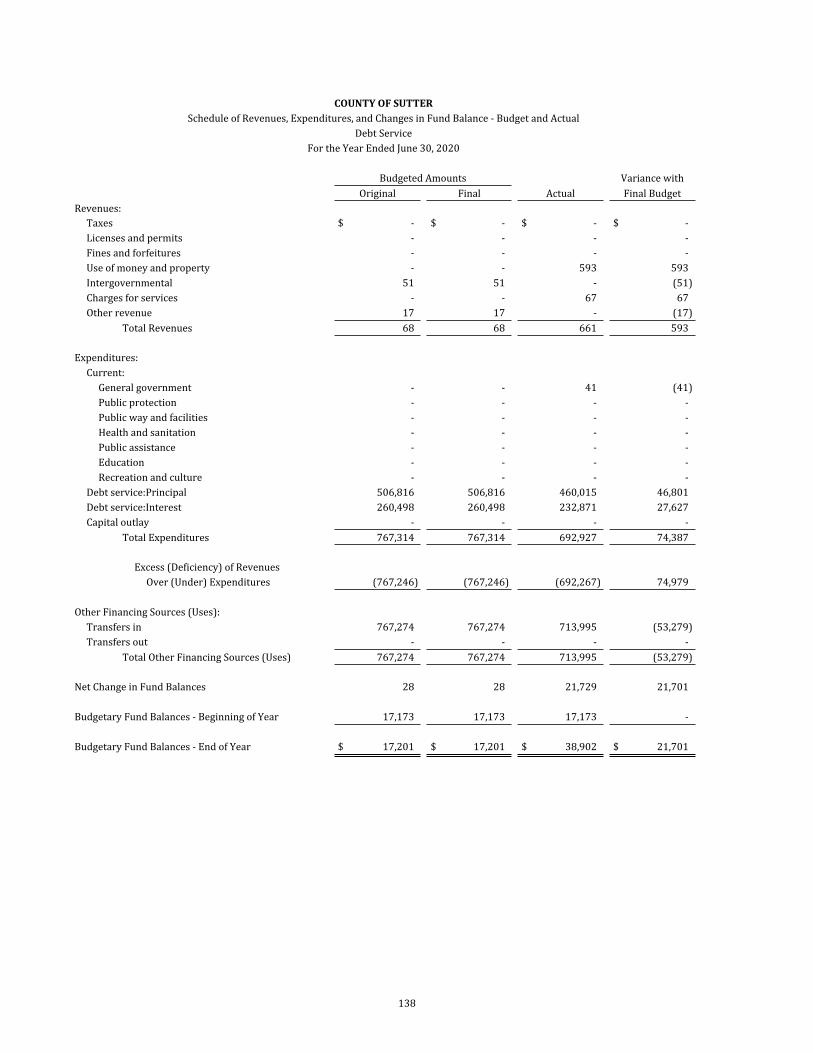
138
COUNTY OF SUTTERSchedule of Revenues, Expenditures, and Changes in Fund Balance - Budget and Actual
Debt ServiceFor the Year Ended June 30, 2020
Budgeted Amounts Variance withOriginal Final Actual Final Budget
Revenues:Taxes $ - $ - $ - $ -Licenses and permits - - - -Fines and forfeitures - - - -Use of money and property - - 593 593Intergovernmental 51 51 - (51)Charges for services - - 67 67Other revenue 17 17 - (17)
Total Revenues 68 68 661 593
Expenditures:Current:
General government - - 41 (41)Public protection - - - -Public way and facilities - - - -Health and sanitation - - - -Public assistance - - - -Education - - - -Recreation and culture - - - -
Debt service:Principal 506,816 506,816 460,015 46,801Debt service:Interest 260,498 260,498 232,871 27,627Capital outlay - - - -
Total Expenditures 767,314 767,314 692,927 74,387
Excess (Deficiency) of RevenuesOver (Under) Expenditures (767,246) (767,246) (692,267) 74,979
Other Financing Sources (Uses):Transfers in 767,274 767,274 713,995 (53,279)Transfers out - - - -
Total Other Financing Sources (Uses) 767,274 767,274 713,995 (53,279)
Net Change in Fund Balances 28 28 21,729 21,701
Budgetary Fund Balances - Beginning of Year 17,173 17,173 17,173 -
Budgetary Fund Balances - End of Year $ 17,201 $ 17,201 $ 38,902 $ 21,701
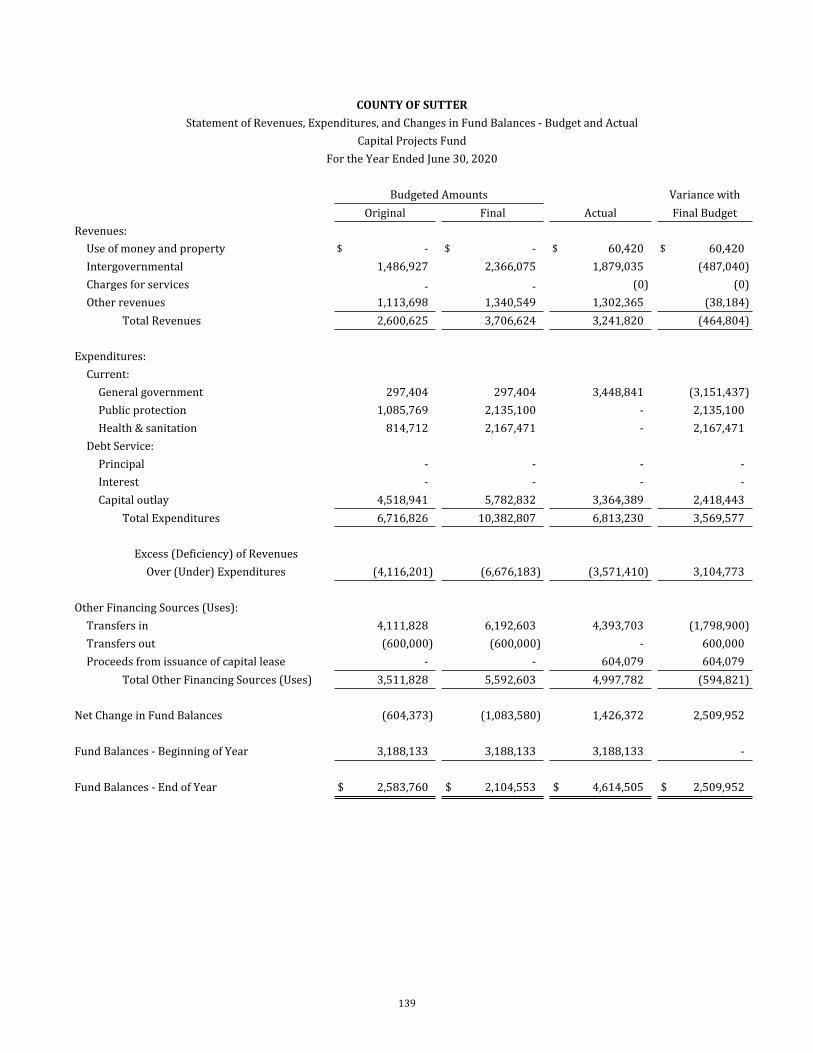
139
COUNTY OF SUTTERStatement of Revenues, Expenditures, and Changes in Fund Balances - Budget and Actual
Capital Projects FundFor the Year Ended June 30, 2020
Budgeted Amounts Variance withOriginal Final Actual Final Budget
Revenues:Use of money and property $ - $ - $ 60,420 $ 60,420Intergovernmental 1,486,927 2,366,075 1,879,035 (487,040)Charges for services - - (0) (0)Other revenues 1,113,698 1,340,549 1,302,365 (38,184)
Total Revenues 2,600,625 3,706,624 3,241,820 (464,804)
Expenditures:Current:
General government 297,404 297,404 3,448,841 (3,151,437)Public protection 1,085,769 2,135,100 - 2,135,100Health & sanitation 814,712 2,167,471 - 2,167,471
Debt Service:Principal - - - -Interest - - - -Capital outlay 4,518,941 5,782,832 3,364,389 2,418,443
Total Expenditures 6,716,826 10,382,807 6,813,230 3,569,577
Excess (Deficiency) of RevenuesOver (Under) Expenditures (4,116,201) (6,676,183) (3,571,410) 3,104,773
Other Financing Sources (Uses):Transfers in 4,111,828 6,192,603 4,393,703 (1,798,900)Transfers out (600,000) (600,000) - 600,000Proceeds from issuance of capital lease - - 604,079 604,079
Total Other Financing Sources (Uses) 3,511,828 5,592,603 4,997,782 (594,821)
Net Change in Fund Balances (604,373) (1,083,580) 1,426,372 2,509,952
Fund Balances - Beginning of Year 3,188,133 3,188,133 3,188,133 -
Fund Balances - End of Year $ 2,583,760 $ 2,104,553 $ 4,614,505 $ 2,509,952
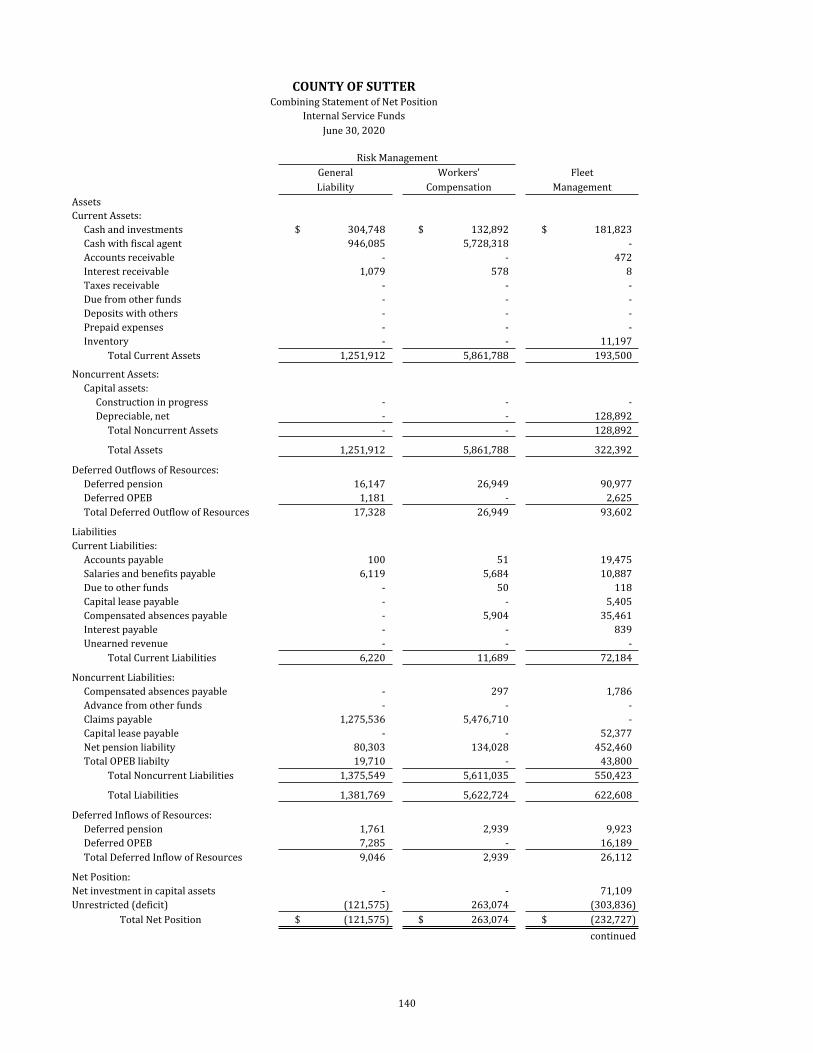
140
COUNTY OF SUTTERCombining Statement of Net Position
Internal Service FundsJune 30, 2020
Risk ManagementGeneral Workers' Fleet Liability Compensation Management
AssetsCurrent Assets:
Cash and investments $ 304,748 $ 132,892 $ 181,823Cash with fiscal agent 946,085 5,728,318 -Accounts receivable - - 472Interest receivable 1,079 578 8Taxes receivable - - -Due from other funds - - -Deposits with others - - -Prepaid expenses - - -Inventory - - 11,197
Total Current Assets 1,251,912 5,861,788 193,500
Noncurrent Assets:Capital assets:
Construction in progress - - -Depreciable, net - - 128,892
Total Noncurrent Assets - - 128,892
Total Assets 1,251,912 5,861,788 322,392
Deferred Outflows of Resources:Deferred pension 16,147 26,949 90,977Deferred OPEB 1,181 - 2,625Total Deferred Outflow of Resources 17,328 26,949 93,602
LiabilitiesCurrent Liabilities:
Accounts payable 100 51 19,475Salaries and benefits payable 6,119 5,684 10,887Due to other funds - 50 118Capital lease payable - - 5,405Compensated absences payable - 5,904 35,461Interest payable - - 839Unearned revenue - - -
Total Current Liabilities 6,220 11,689 72,184
Noncurrent Liabilities:Compensated absences payable - 297 1,786Advance from other funds - - -Claims payable 1,275,536 5,476,710 -Capital lease payable - - 52,377Net pension liability 80,303 134,028 452,460Total OPEB liabilty 19,710 - 43,800
Total Noncurrent Liabilities 1,375,549 5,611,035 550,423
Total Liabilities 1,381,769 5,622,724 622,608
Deferred Inflows of Resources:Deferred pension 1,761 2,939 9,923Deferred OPEB 7,285 - 16,189Total Deferred Inflow of Resources 9,046 2,939 26,112
Net Position:Net investment in capital assets - - 71,109Unrestricted (deficit) (121,575) 263,074 (303,836)
Total Net Position $ (121,575) $ 263,074 $ (232,727)continued
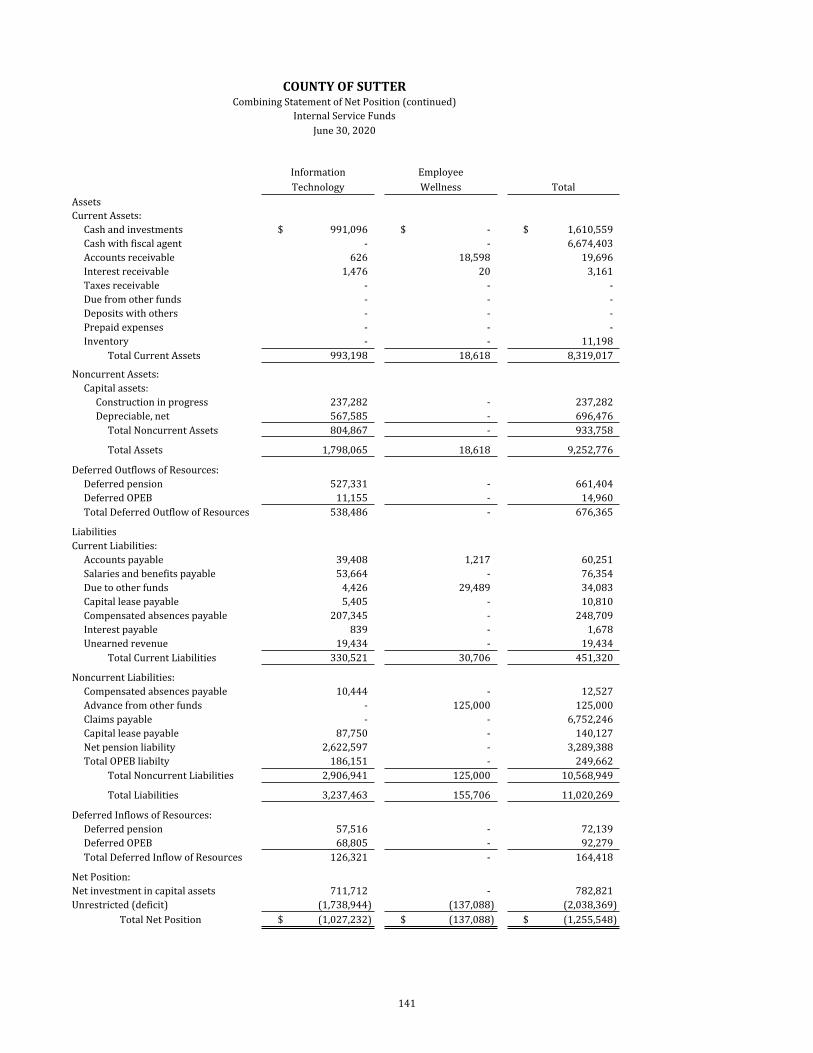
141
COUNTY OF SUTTERCombining Statement of Net Position (continued)
Internal Service FundsJune 30, 2020
Information EmployeeTechnology Wellness Total
AssetsCurrent Assets:
Cash and investments $ 991,096 $ - $ 1,610,559Cash with fiscal agent - - 6,674,403Accounts receivable 626 18,598 19,696Interest receivable 1,476 20 3,161Taxes receivable - - -Due from other funds - - -Deposits with others - - -Prepaid expenses - - -Inventory - - 11,198
Total Current Assets 993,198 18,618 8,319,017
Noncurrent Assets:Capital assets:
Construction in progress 237,282 - 237,282Depreciable, net 567,585 - 696,476
Total Noncurrent Assets 804,867 - 933,758
Total Assets 1,798,065 18,618 9,252,776
Deferred Outflows of Resources:Deferred pension 527,331 - 661,404Deferred OPEB 11,155 - 14,960Total Deferred Outflow of Resources 538,486 - 676,365
LiabilitiesCurrent Liabilities:
Accounts payable 39,408 1,217 60,251Salaries and benefits payable 53,664 - 76,354Due to other funds 4,426 29,489 34,083Capital lease payable 5,405 - 10,810Compensated absences payable 207,345 - 248,709Interest payable 839 - 1,678Unearned revenue 19,434 - 19,434
Total Current Liabilities 330,521 30,706 451,320
Noncurrent Liabilities:Compensated absences payable 10,444 - 12,527Advance from other funds - 125,000 125,000Claims payable - - 6,752,246Capital lease payable 87,750 - 140,127Net pension liability 2,622,597 - 3,289,388Total OPEB liabilty 186,151 - 249,662
Total Noncurrent Liabilities 2,906,941 125,000 10,568,949
Total Liabilities 3,237,463 155,706 11,020,269
Deferred Inflows of Resources:Deferred pension 57,516 - 72,139Deferred OPEB 68,805 - 92,279Total Deferred Inflow of Resources 126,321 - 164,418
Net Position:Net investment in capital assets 711,712 - 782,821Unrestricted (deficit) (1,738,944) (137,088) (2,038,369)
Total Net Position $ (1,027,232) $ (137,088) $ (1,255,548)
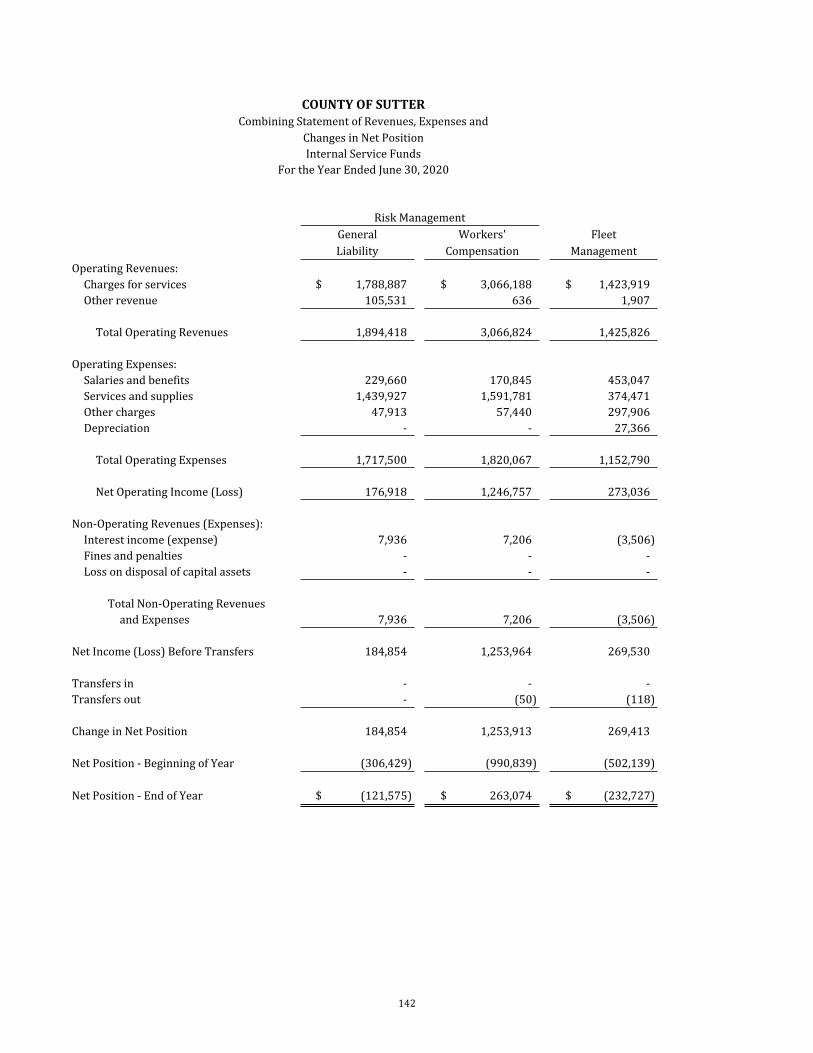
142
COUNTY OF SUTTERCombining Statement of Revenues, Expenses and
Changes in Net PositionInternal Service Funds
For the Year Ended June 30, 2020
Risk ManagementGeneral Workers' Fleet Liability Compensation Management
Operating Revenues:Charges for services $ 1,788,887 $ 3,066,188 $ 1,423,919Other revenue 105,531 636 1,907
Total Operating Revenues 1,894,418 3,066,824 1,425,826
Operating Expenses:Salaries and benefits 229,660 170,845 453,047Services and supplies 1,439,927 1,591,781 374,471Other charges 47,913 57,440 297,906Depreciation - - 27,366
Total Operating Expenses 1,717,500 1,820,067 1,152,790
Net Operating Income (Loss) 176,918 1,246,757 273,036
Non-Operating Revenues (Expenses):Interest income (expense) 7,936 7,206 (3,506)Fines and penalties - - -Loss on disposal of capital assets - - -
Total Non-Operating Revenuesand Expenses 7,936 7,206 (3,506)
Net Income (Loss) Before Transfers 184,854 1,253,964 269,530
Transfers in - - -Transfers out - (50) (118)
Change in Net Position 184,854 1,253,913 269,413
Net Position - Beginning of Year (306,429) (990,839) (502,139)
Net Position - End of Year $ (121,575) $ 263,074 $ (232,727)
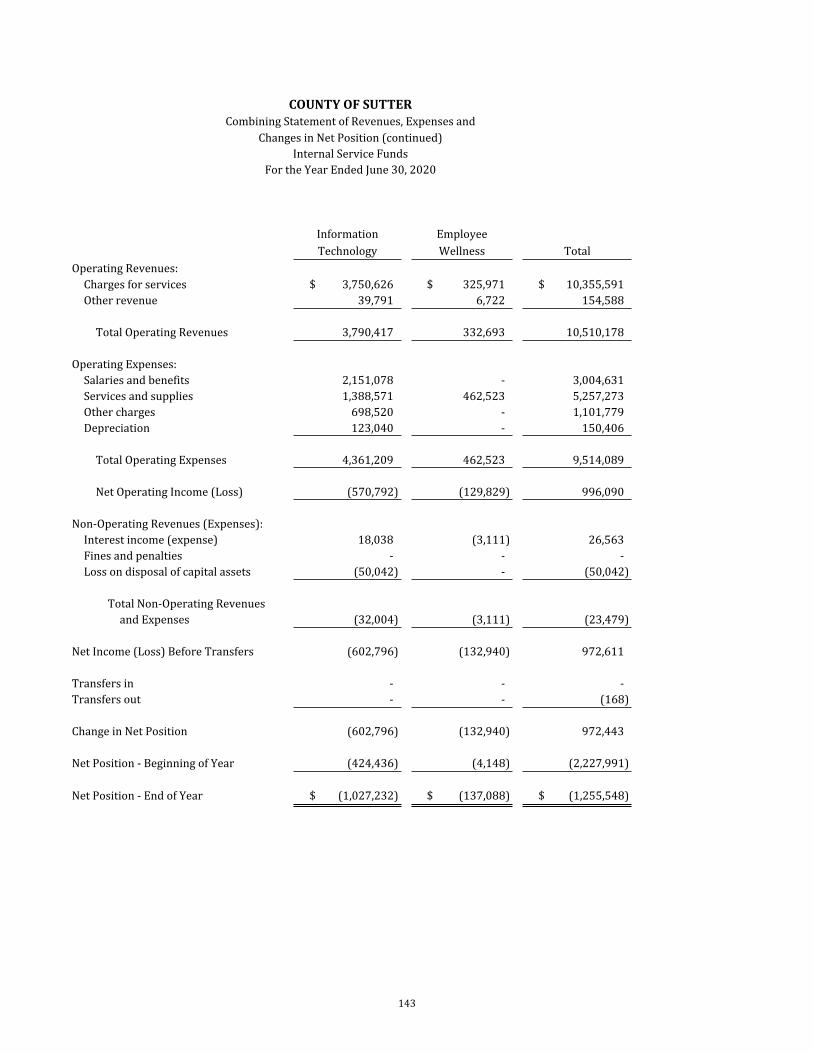
143
COUNTY OF SUTTERCombining Statement of Revenues, Expenses and
Changes in Net Position (continued)Internal Service Funds
For the Year Ended June 30, 2020
Information EmployeeTechnology Wellness Total
Operating Revenues:Charges for services $ 3,750,626 $ 325,971 $ 10,355,591Other revenue 39,791 6,722 154,588
Total Operating Revenues 3,790,417 332,693 10,510,178
Operating Expenses:Salaries and benefits 2,151,078 - 3,004,631Services and supplies 1,388,571 462,523 5,257,273Other charges 698,520 - 1,101,779Depreciation 123,040 - 150,406
Total Operating Expenses 4,361,209 462,523 9,514,089
Net Operating Income (Loss) (570,792) (129,829) 996,090
Non-Operating Revenues (Expenses):Interest income (expense) 18,038 (3,111) 26,563Fines and penalties - - -Loss on disposal of capital assets (50,042) - (50,042)
Total Non-Operating Revenuesand Expenses (32,004) (3,111) (23,479)
Net Income (Loss) Before Transfers (602,796) (132,940) 972,611
Transfers in - - -Transfers out - - (168)
Change in Net Position (602,796) (132,940) 972,443
Net Position - Beginning of Year (424,436) (4,148) (2,227,991)
Net Position - End of Year $ (1,027,232) $ (137,088) $ (1,255,548)
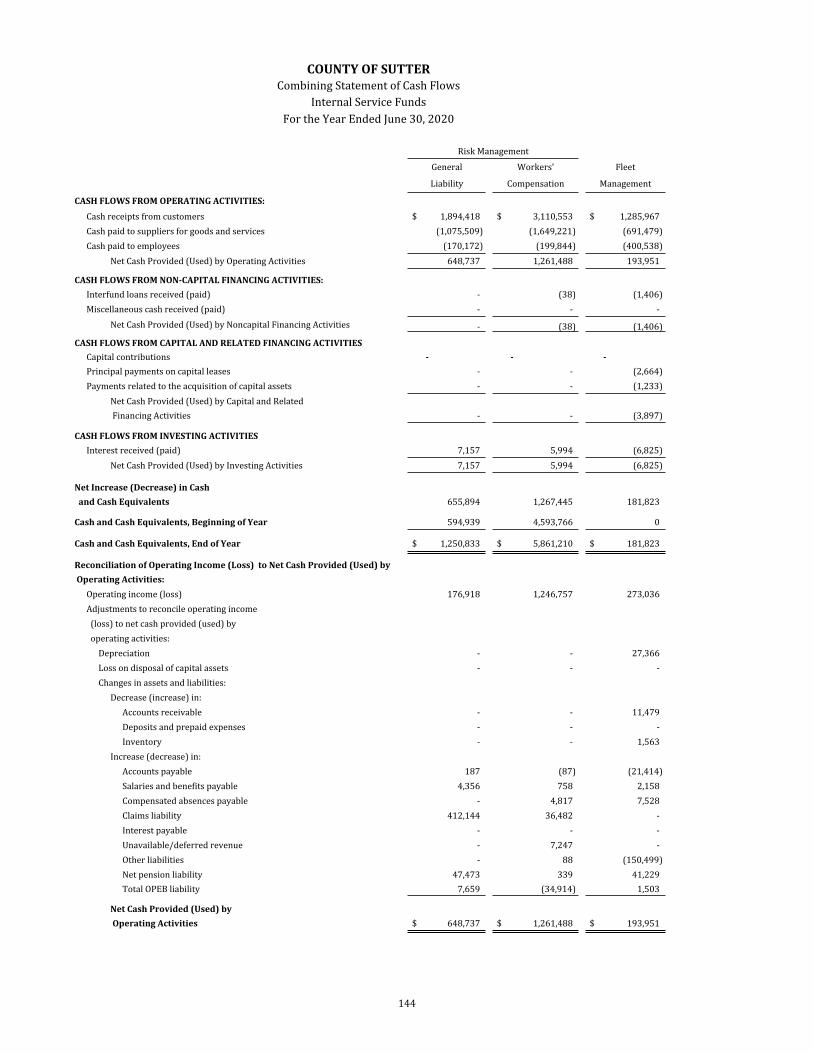
144
COUNTY OF SUTTERCombining Statement of Cash Flows
Internal Service FundsFor the Year Ended June 30, 2020
Risk Management
General Workers' Fleet
Liability Compensation Management
CASH FLOWS FROM OPERATING ACTIVITIES:
Cash receipts from customers $ 1,894,418 $ 3,110,553 $ 1,285,967Cash paid to suppliers for goods and services (1,075,509) (1,649,221) (691,479)Cash paid to employees (170,172) (199,844) (400,538)
Net Cash Provided (Used) by Operating Activities 648,737 1,261,488 193,951
CASH FLOWS FROM NON-CAPITAL FINANCING ACTIVITIES:Interfund loans received (paid) - (38) (1,406)Miscellaneous cash received (paid) - - -
Net Cash Provided (Used) by Noncapital Financing Activities - (38) (1,406)
CASH FLOWS FROM CAPITAL AND RELATED FINANCING ACTIVITIESCapital contributions - - - Principal payments on capital leases - - (2,664)Payments related to the acquisition of capital assets - - (1,233)
Net Cash Provided (Used) by Capital and Related Financing Activities - - (3,897)
CASH FLOWS FROM INVESTING ACTIVITIESInterest received (paid) 7,157 5,994 (6,825)
Net Cash Provided (Used) by Investing Activities 7,157 5,994 (6,825)
Net Increase (Decrease) in Cash and Cash Equivalents 655,894 1,267,445 181,823
Cash and Cash Equivalents, Beginning of Year 594,939 4,593,766 0
Cash and Cash Equivalents, End of Year $ 1,250,833 $ 5,861,210 $ 181,823
Reconciliation of Operating Income (Loss) to Net Cash Provided (Used) by Operating Activities:
Operating income (loss) 176,918 1,246,757 273,036Adjustments to reconcile operating income (loss) to net cash provided (used) by operating activities:
Depreciation - - 27,366Loss on disposal of capital assets - - -Changes in assets and liabilities:
Decrease (increase) in:Accounts receivable - - 11,479Deposits and prepaid expenses - - -Inventory - - 1,563
Increase (decrease) in:Accounts payable 187 (87) (21,414)Salaries and benefits payable 4,356 758 2,158Compensated absences payable - 4,817 7,528Claims liability 412,144 36,482 -Interest payable - - -Unavailable/deferred revenue - 7,247 -Other liabilities - 88 (150,499)Net pension liability 47,473 339 41,229Total OPEB liability 7,659 (34,914) 1,503
Net Cash Provided (Used) by Operating Activities $ 648,737 $ 1,261,488 $ 193,951
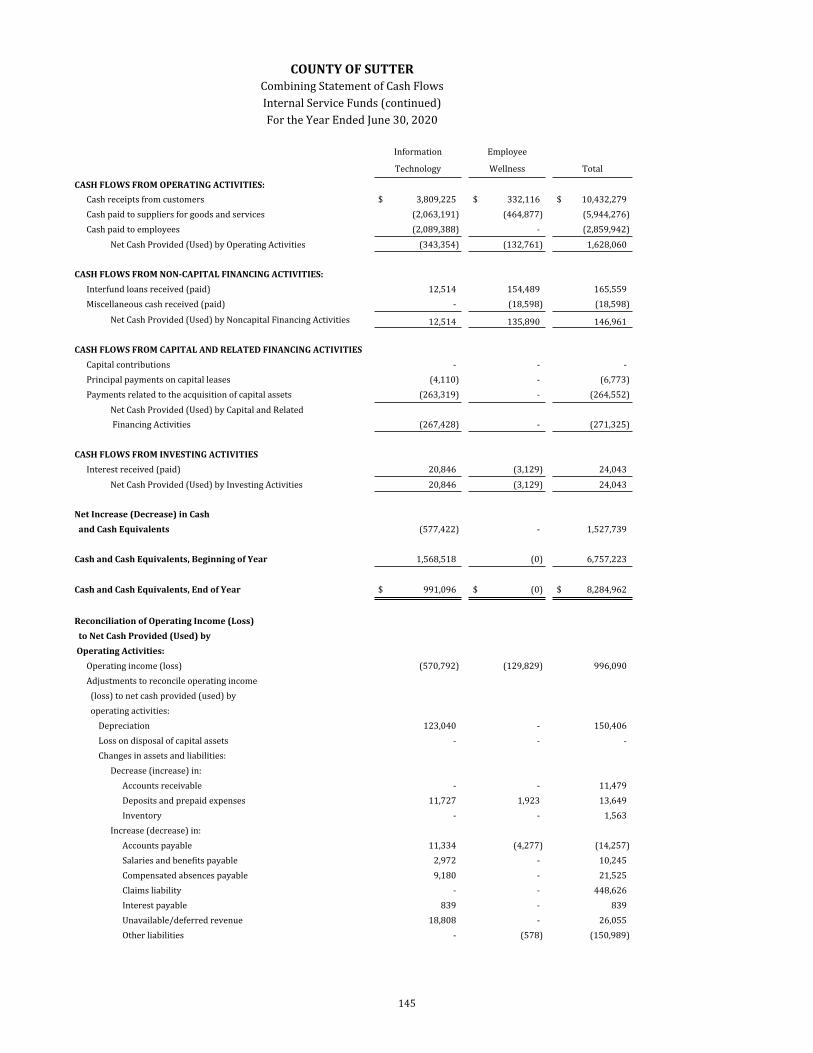
145
COUNTY OF SUTTERCombining Statement of Cash FlowsInternal Service Funds (continued)For the Year Ended June 30, 2020
Information Employee
Technology Wellness Total
CASH FLOWS FROM OPERATING ACTIVITIES:Cash receipts from customers $ 3,809,225 $ 332,116 $ 10,432,279Cash paid to suppliers for goods and services (2,063,191) (464,877) (5,944,276)Cash paid to employees (2,089,388) - (2,859,942)
Net Cash Provided (Used) by Operating Activities (343,354) (132,761) 1,628,060
CASH FLOWS FROM NON-CAPITAL FINANCING ACTIVITIES:Interfund loans received (paid) 12,514 154,489 165,559Miscellaneous cash received (paid) - (18,598) (18,598)
Net Cash Provided (Used) by Noncapital Financing Activities 12,514 135,890 146,961
CASH FLOWS FROM CAPITAL AND RELATED FINANCING ACTIVITIESCapital contributions - - -Principal payments on capital leases (4,110) - (6,773)Payments related to the acquisition of capital assets (263,319) - (264,552)
Net Cash Provided (Used) by Capital and Related Financing Activities (267,428) - (271,325)
CASH FLOWS FROM INVESTING ACTIVITIESInterest received (paid) 20,846 (3,129) 24,043
Net Cash Provided (Used) by Investing Activities 20,846 (3,129) 24,043
Net Increase (Decrease) in Cash and Cash Equivalents (577,422) - 1,527,739
Cash and Cash Equivalents, Beginning of Year 1,568,518 (0) 6,757,223
Cash and Cash Equivalents, End of Year $ 991,096 $ (0) $ 8,284,962
Reconciliation of Operating Income (Loss) to Net Cash Provided (Used) by Operating Activities:
Operating income (loss) (570,792) (129,829) 996,090Adjustments to reconcile operating income (loss) to net cash provided (used) by operating activities:
Depreciation 123,040 - 150,406Loss on disposal of capital assets - - -Changes in assets and liabilities:
Decrease (increase) in:Accounts receivable - - 11,479Deposits and prepaid expenses 11,727 1,923 13,649Inventory - - 1,563
Increase (decrease) in:Accounts payable 11,334 (4,277) (14,257)Salaries and benefits payable 2,972 - 10,245Compensated absences payable 9,180 - 21,525Claims liability - - 448,626Interest payable 839 - 839Unavailable/deferred revenue 18,808 - 26,055Other liabilities - (578) (150,989)

146
Net pension liability 57,114 - 146,155Total OPEB liability (7,576) - (33,326)
Net Cash Provided (Used) by Operating Activities $ (343,354) $ (132,761) $ 1,628,061

147
Statistical Section
Statistical Section

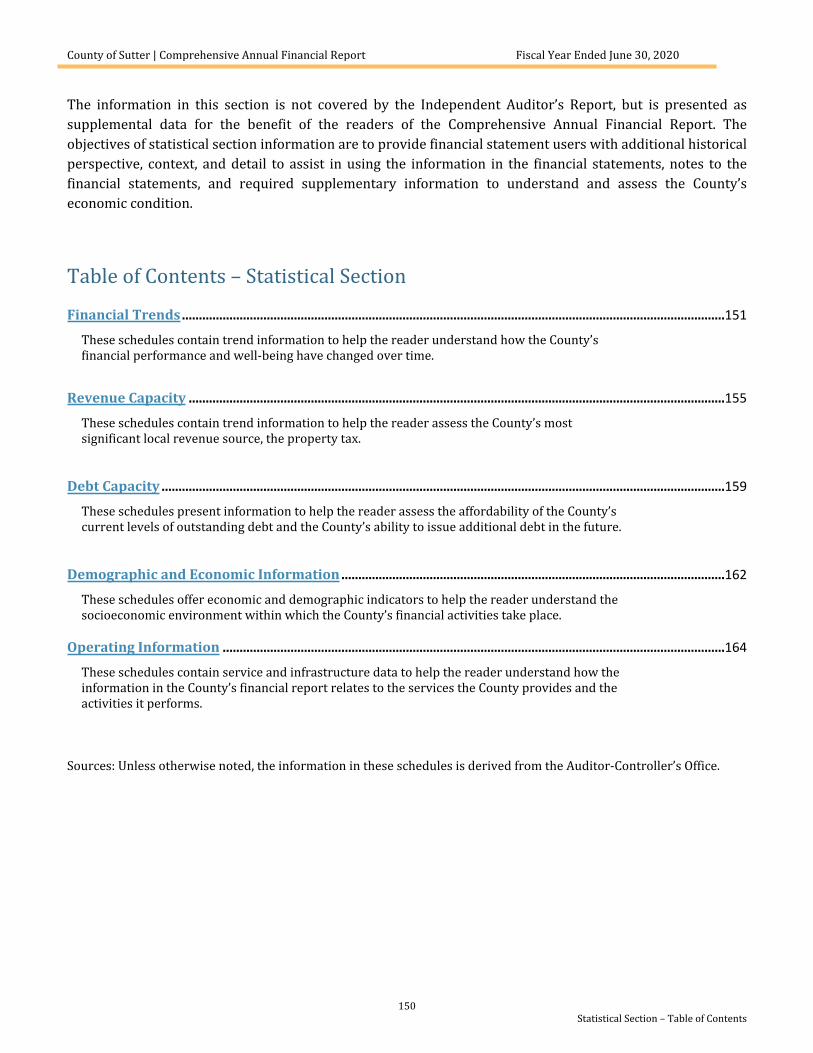
County of Sutter | Comprehensive Annual Financial Report Fiscal Year Ended June 30, 2020
150Statistical Section – Table of Contents
The information in this section is not covered by the Independent Auditor’s Report, but is presented as supplemental data for the benefit of the readers of the Comprehensive Annual Financial Report. The objectives of statistical section information are to provide financial statement users with additional historical perspective, context, and detail to assist in using the information in the financial statements, notes to the financial statements, and required supplementary information to understand and assess the County’s economic condition.
Table of Contents – Statistical Section
Financial Trends................................................................................................................................................................151
These schedules contain trend information to help the reader understand how the County’sfinancial performance and well-being have changed over time.
Revenue Capacity ..............................................................................................................................................................155
These schedules contain trend information to help the reader assess the County’s most significant local revenue source, the property tax.
Debt Capacity ......................................................................................................................................................................159
These schedules present information to help the reader assess the affordability of the County’scurrent levels of outstanding debt and the County’s ability to issue additional debt in the future.
Demographic and Economic Information .................................................................................................................162
These schedules offer economic and demographic indicators to help the reader understand the socioeconomic environment within which the County’s financial activities take place.
Operating Information ....................................................................................................................................................164
These schedules contain service and infrastructure data to help the reader understand how the information in the County’s financial report relates to the services the County provides and theactivities it performs.
Sources: Unless otherwise noted, the information in these schedules is derived from the Auditor-Controller’s Office.
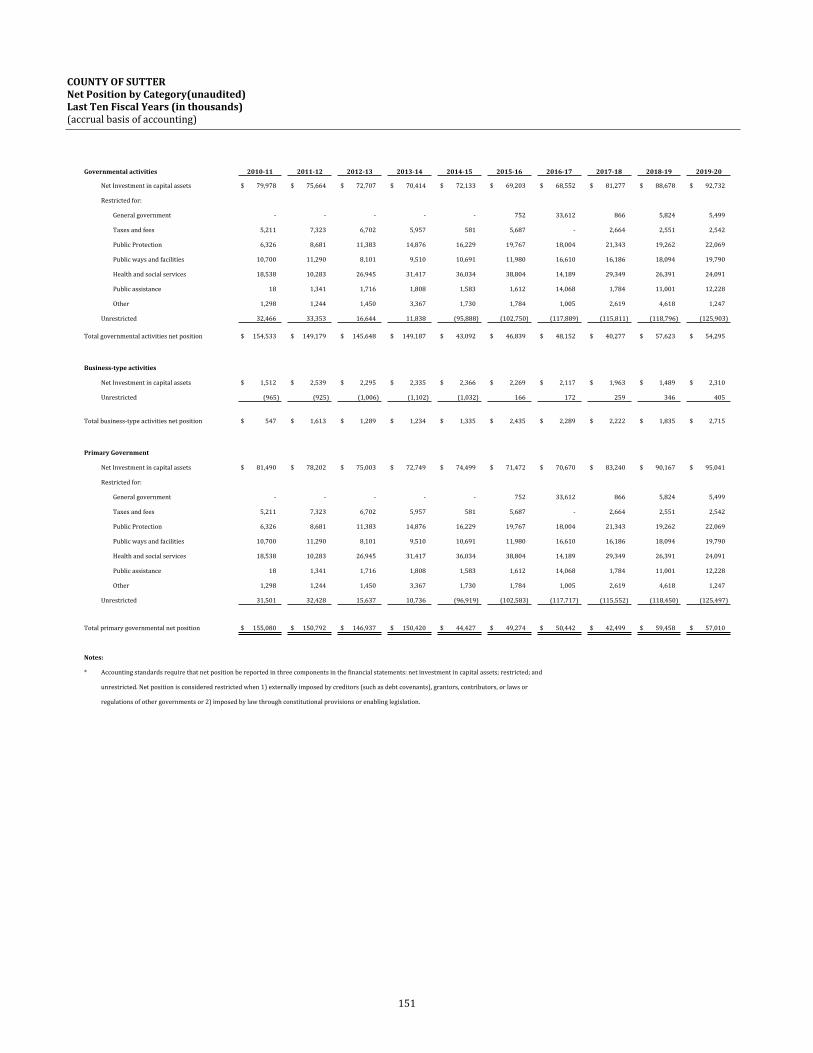
151
COUNTY OF SUTTERNet Position by Category(unaudited)Last Ten Fiscal Years (in thousands)(accrual basis of accounting)
Governmental activities 2010-11 2011-12 2012-13 2013-14 2014-15 2015-16 2016-17 2017-18 2018-19 2019-20
Net Investment in capital assets $ 79,978 $ 75,664 $ 72,707 $ 70,414 $ 72,133 $ 69,203 $ 68,552 $ 81,277 $ 88,678 $ 92,732
Restricted for:
General government - - - - - 752 33,612 866 5,824 5,499
Taxes and fees 5,211 7,323 6,702 5,957 581 5,687 - 2,664 2,551 2,542
Public Protection 6,326 8,681 11,383 14,876 16,229 19,767 18,004 21,343 19,262 22,069
Public ways and facilities 10,700 11,290 8,101 9,510 10,691 11,980 16,610 16,186 18,094 19,790
Health and social services 18,538 10,283 26,945 31,417 36,034 38,804 14,189 29,349 26,391 24,091
Public assistance 18 1,341 1,716 1,808 1,583 1,612 14,068 1,784 11,001 12,228
Other 1,298 1,244 1,450 3,367 1,730 1,784 1,005 2,619 4,618 1,247
Unrestricted 32,466 33,353 16,644 11,838 (95,888) (102,750) (117,889) (115,811) (118,796) (125,903)
Total governmental activities net position $ 154,533 $ 149,179 $ 145,648 $ 149,187 $ 43,092 $ 46,839 $ 48,152 $ 40,277 $ 57,623 $ 54,295
Business-type activities
Net Investment in capital assets $ 1,512 $ 2,539 $ 2,295 $ 2,335 $ 2,366 $ 2,269 $ 2,117 $ 1,963 $ 1,489 $ 2,310
Unrestricted (965) (925) (1,006) (1,102) (1,032) 166 172 259 346 405
Total business-type activities net position $ 547 $ 1,613 $ 1,289 $ 1,234 $ 1,335 $ 2,435 $ 2,289 $ 2,222 $ 1,835 $ 2,715
Primary Government
Net Investment in capital assets $ 81,490 $ 78,202 $ 75,003 $ 72,749 $ 74,499 $ 71,472 $ 70,670 $ 83,240 $ 90,167 $ 95,041
Restricted for:
General government - - - - - 752 33,612 866 5,824 5,499
Taxes and fees 5,211 7,323 6,702 5,957 581 5,687 - 2,664 2,551 2,542
Public Protection 6,326 8,681 11,383 14,876 16,229 19,767 18,004 21,343 19,262 22,069
Public ways and facilities 10,700 11,290 8,101 9,510 10,691 11,980 16,610 16,186 18,094 19,790
Health and social services 18,538 10,283 26,945 31,417 36,034 38,804 14,189 29,349 26,391 24,091
Public assistance 18 1,341 1,716 1,808 1,583 1,612 14,068 1,784 11,001 12,228
Other 1,298 1,244 1,450 3,367 1,730 1,784 1,005 2,619 4,618 1,247
Unrestricted 31,501 32,428 15,637 10,736 (96,919) (102,583) (117,717) (115,552) (118,450) (125,497)
Total primary governmental net position $ 155,080 $ 150,792 $ 146,937 $ 150,420 $ 44,427 $ 49,274 $ 50,442 $ 42,499 $ 59,458 $ 57,010
Notes:
* Accounting standards require that net position be reported in three components in the financial statements: net investment in capital assets; restricted; and
unrestricted. Net position is considered restricted when 1) externally imposed by creditors (such as debt covenants), grantors, contributors, or laws or
regulations of other governments or 2) imposed by law through constitutional provisions or enabling legislation.
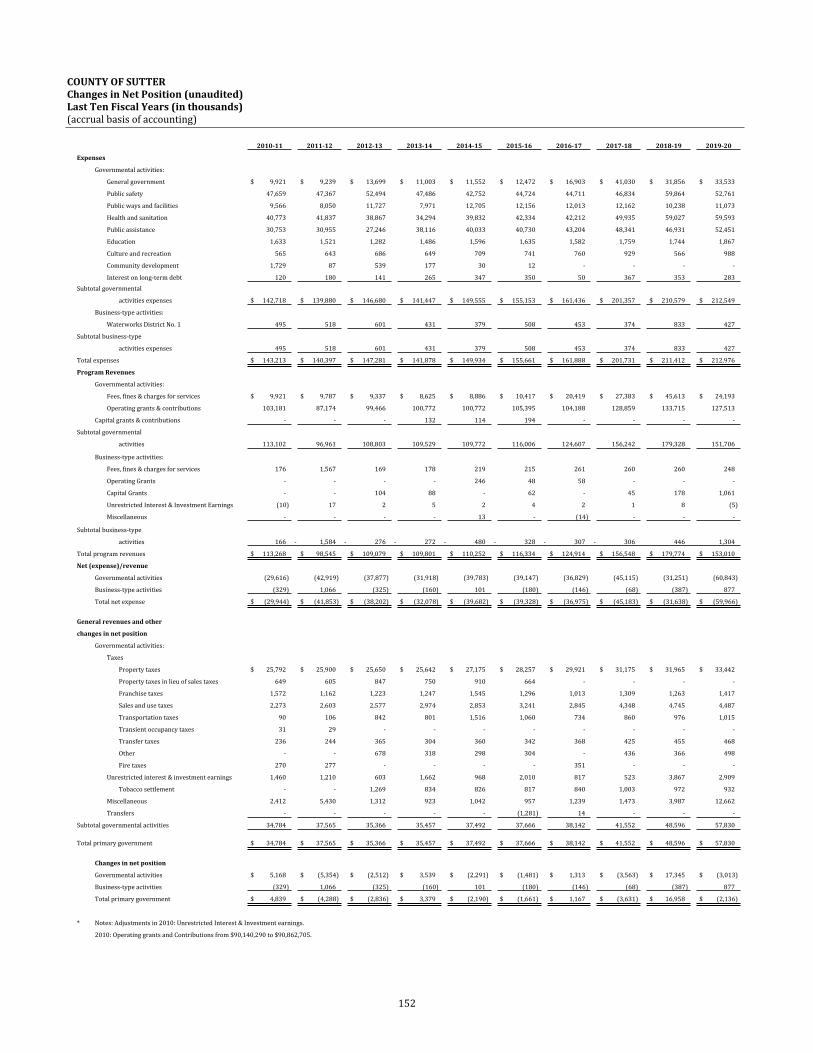
152
COUNTY OF SUTTERChanges in Net Position (unaudited)Last Ten Fiscal Years (in thousands)(accrual basis of accounting)
2010-11 2011-12 2012-13 2013-14 2014-15 2015-16 2016-17 2017-18 2018-19 2019-20
Expenses
Governmental activities:
General government $ 9,921 $ 9,239 $ 13,699 $ 11,003 $ 11,552 $ 12,472 $ 16,903 $ 41,030 $ 31,856 $ 33,533
Public safety 47,659 47,367 52,494 47,486 42,752 44,724 44,711 46,834 59,864 52,761
Public ways and facilities 9,566 8,050 11,727 7,971 12,705 12,156 12,013 12,162 10,238 11,073
Health and sanitation 40,773 41,837 38,867 34,294 39,832 42,334 42,212 49,935 59,027 59,593
Public assistance 30,753 30,955 27,246 38,116 40,033 40,730 43,204 48,341 46,931 52,451
Education 1,633 1,521 1,282 1,486 1,596 1,635 1,582 1,759 1,744 1,867
Culture and recreation 565 643 686 649 709 741 760 929 566 988
Community development 1,729 87 539 177 30 12 - - - -
Interest on long-term debt 120 180 141 265 347 350 50 367 353 283Subtotal governmental
activities expenses $ 142,718 $ 139,880 $ 146,680 $ 141,447 $ 149,555 $ 155,153 $ 161,436 $ 201,357 $ 210,579 $ 212,549
Business-type activities:
Waterworks District No. 1 495 518 601 431 379 508 453 374 833 427
Subtotal business-type
activities expenses 495 518 601 431 379 508 453 374 833 427
Total expenses $ 143,213 $ 140,397 $ 147,281 $ 141,878 $ 149,934 $ 155,661 $ 161,888 $ 201,731 $ 211,412 $ 212,976
Program Revenues
Governmental activities:
Fees, fines & charges for services $ 9,921 $ 9,787 $ 9,337 $ 8,625 $ 8,886 $ 10,417 $ 20,419 $ 27,383 $ 45,613 $ 24,193
Operating grants & contributions 103,181 87,174 99,466 100,772 100,772 105,395 104,188 128,859 133,715 127,513
Capital grants & contributions - - - 132 114 194 - - - -
Subtotal governmental
activities 113,102 96,961 108,803 109,529 109,772 116,006 124,607 156,242 179,328 151,706
Business-type activities:
Fees, fines & charges for services 176 1,567 169 178 219 215 261 260 260 248
Operating Grants - - - - 246 48 58 - - -
Capital Grants - - 104 88 - 62 - 45 178 1,061
Unrestricted Interest & Investment Earnings (10) 17 2 5 2 4 2 1 8 (5)
Miscellaneous - - - - 13 - (14) - - -
Subtotal business-type
activities 166 - 1,584 - 276 - 272 - 480 - 328 - 307 - 306 446 1,304
Total program revenues $ 113,268 $ 98,545 $ 109,079 $ 109,801 $ 110,252 $ 116,334 $ 124,914 $ 156,548 $ 179,774 $ 153,010
Net (expense)/revenue
Governmental activities (29,616) (42,919) (37,877) (31,918) (39,783) (39,147) (36,829) (45,115) (31,251) (60,843)
Business-type activities (329) 1,066 (325) (160) 101 (180) (146) (68) (387) 877
Total net expense $ (29,944) $ (41,853) $ (38,202) $ (32,078) $ (39,682) $ (39,328) $ (36,975) $ (45,183) $ (31,638) $ (59,966)
General revenues and other
changes in net position
Governmental activities:
Taxes
Property taxes $ 25,792 $ 25,900 $ 25,650 $ 25,642 $ 27,175 $ 28,257 $ 29,921 $ 31,175 $ 31,965 $ 33,442
Property taxes in lieu of sales taxes 649 605 847 750 910 664 - - - -
Franchise taxes 1,572 1,162 1,223 1,247 1,545 1,296 1,013 1,309 1,263 1,417
Sales and use taxes 2,273 2,603 2,577 2,974 2,853 3,241 2,845 4,348 4,745 4,487
Transportation taxes 90 106 842 801 1,516 1,060 734 860 976 1,015
Transient occupancy taxes 31 29 - - - - - - - -
Transfer taxes 236 244 365 304 360 342 368 425 455 468
Other - - 678 318 298 304 - 436 366 498
Fire taxes 270 277 - - - - 351 - - -
Unrestricted interest & investment earnings 1,460 1,210 603 1,662 968 2,010 817 523 3,867 2,909
Tobacco settlement - - 1,269 834 826 817 840 1,003 972 932
Miscellaneous 2,412 5,430 1,312 923 1,042 957 1,239 1,473 3,987 12,662
Transfers - - - - - (1,281) 14 - - -
Subtotal governmental activities 34,784 37,565 35,366 35,457 37,492 37,666 38,142 41,552 48,596 57,830
Total primary government $ 34,784 $ 37,565 $ 35,366 $ 35,457 $ 37,492 $ 37,666 $ 38,142 $ 41,552 $ 48,596 $ 57,830
Changes in net position
Governmental activities $ 5,168 $ (5,354) $ (2,512) $ 3,539 $ (2,291) $ (1,481) $ 1,313 $ (3,563) $ 17,345 $ (3,013)
Business-type activities (329) 1,066 (325) (160) 101 (180) (146) (68) (387) 877
Total primary government $ 4,839 $ (4,288) $ (2,836) $ 3,379 $ (2,190) $ (1,661) $ 1,167 $ (3,631) $ 16,958 $ (2,136)
* Notes: Adjustments in 2010: Unrestricted Interest & Investment earnings.
2010: Operating grants and Contributions from $90,140,290 to $90,862,705.
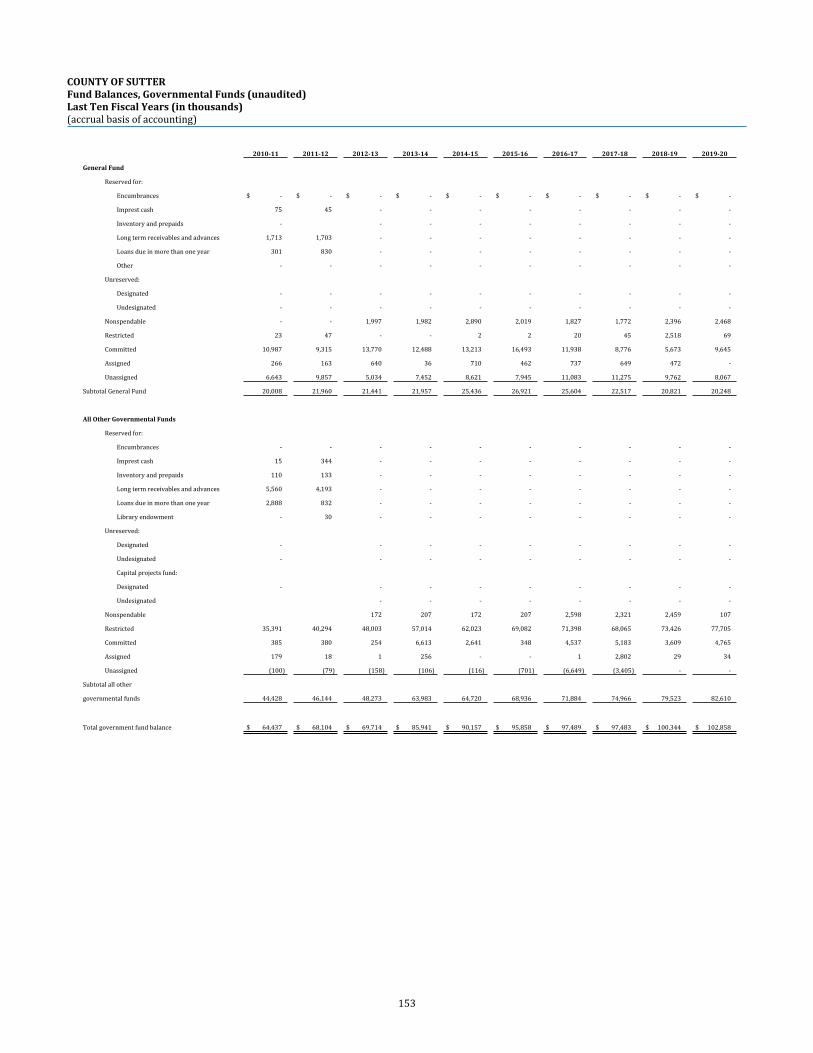
153
COUNTY OF SUTTERFund Balances, Governmental Funds (unaudited)Last Ten Fiscal Years (in thousands)(accrual basis of accounting)
2010-11 2011-12 2012-13 2013-14 2014-15 2015-16 2016-17 2017-18 2018-19 2019-20
General Fund
Reserved for:
Encumbrances $ - $ - $ - $ - $ - $ - $ - $ - $ - $ -
Imprest cash 75 45 - - - - - - - -
Inventory and prepaids - - - - - - - - -
Long term receivables and advances 1,713 1,703 - - - - - - - -
Loans due in more than one year 301 830 - - - - - - - -
Other - - - - - - - - - -
Unreserved:
Designated - - - - - - - - - -
Undesignated - - - - - - - - - -
Nonspendable - - 1,997 1,982 2,890 2,019 1,827 1,772 2,396 2,468
Restricted 23 47 - - 2 2 20 45 2,518 69
Committed 10,987 9,315 13,770 12,488 13,213 16,493 11,938 8,776 5,673 9,645
Assigned 266 163 640 36 710 462 737 649 472 -
Unassigned 6,643 9,857 5,034 7,452 8,621 7,945 11,083 11,275 9,762 8,067
Subtotal General Fund 20,008 21,960 21,441 21,957 25,436 26,921 25,604 22,517 20,821 20,248
All Other Governmental Funds
Reserved for:
Encumbrances - - - - - - - - - -
Imprest cash 15 344 - - - - - - - -
Inventory and prepaids 110 133 - - - - - - - -
Long term receivables and advances 5,560 4,193 - - - - - - - -
Loans due in more than one year 2,888 832 - - - - - - - -
Library endowment - 30 - - - - - - - -
Unreserved:
Designated - - - - - - - - -
Undesignated - - - - - - - - -
Capital projects fund:
Designated - - - - - - - - -
Undesignated - - - - - - - -
Nonspendable 172 207 172 207 2,598 2,321 2,459 107
Restricted 35,391 40,294 48,003 57,014 62,023 69,082 71,398 68,065 73,426 77,705
Committed 385 380 254 6,613 2,641 348 4,537 5,183 3,609 4,765
Assigned 179 18 1 256 - - 1 2,802 29 34
Unassigned (100) (79) (158) (106) (116) (701) (6,649) (3,405) - -
Subtotal all other
governmental funds 44,428 46,144 48,273 63,983 64,720 68,936 71,884 74,966 79,523 82,610
Total government fund balance $ 64,437 $ 68,104 $ 69,714 $ 85,941 $ 90,157 $ 95,858 $ 97,489 $ 97,483 $ 100,344 $ 102,858
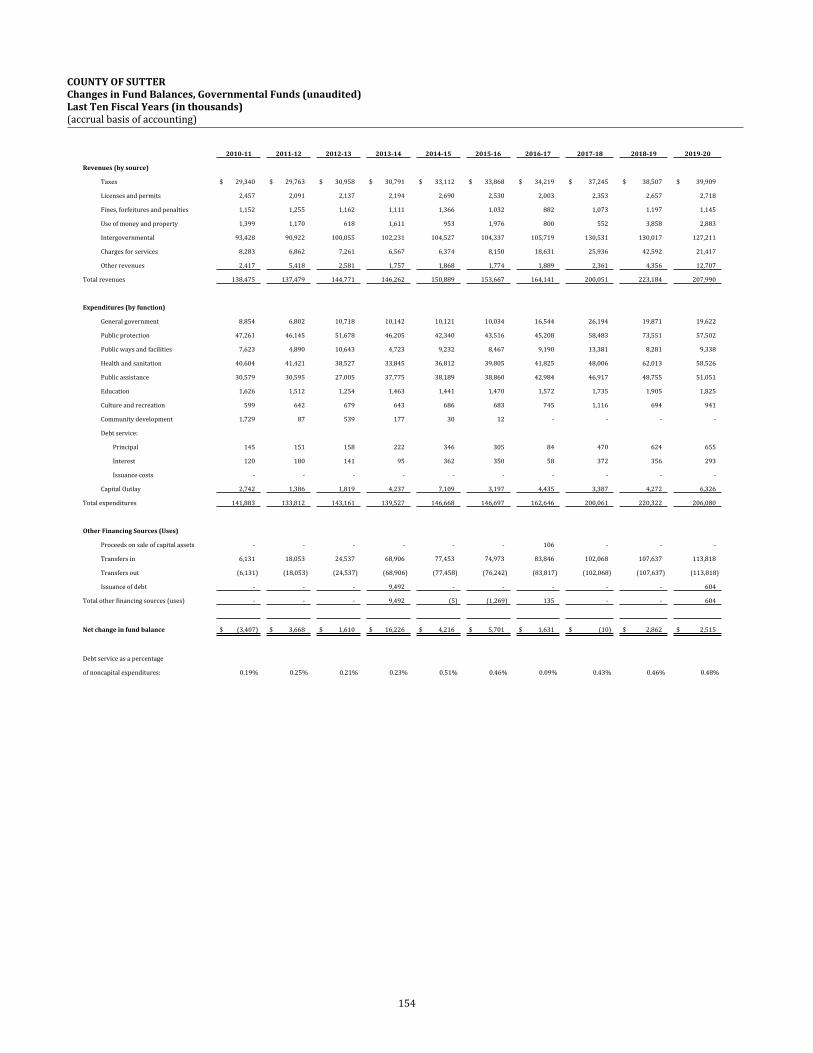
154
COUNTY OF SUTTERChanges in Fund Balances, Governmental Funds (unaudited)Last Ten Fiscal Years (in thousands)(accrual basis of accounting)
2010-11 2011-12 2012-13 2013-14 2014-15 2015-16 2016-17 2017-18 2018-19 2019-20
Revenues (by source)
Taxes $ 29,340 $ 29,763 $ 30,958 $ 30,791 $ 33,112 $ 33,868 $ 34,219 $ 37,245 $ 38,507 $ 39,909
Licenses and permits 2,457 2,091 2,137 2,194 2,690 2,530 2,003 2,353 2,657 2,718
Fines, forfeitures and penalties 1,152 1,255 1,162 1,111 1,366 1,032 882 1,073 1,197 1,145
Use of money and property 1,399 1,170 618 1,611 953 1,976 800 552 3,858 2,883
Intergovernmental 93,428 90,922 100,055 102,231 104,527 104,337 105,719 130,531 130,017 127,211
Charges for services 8,283 6,862 7,261 6,567 6,374 8,150 18,631 25,936 42,592 21,417
Other revenues 2,417 5,418 2,581 1,757 1,868 1,774 1,889 2,361 4,356 12,707
Total revenues 138,475 137,479 144,771 146,262 150,889 153,667 164,141 200,051 223,184 207,990
Expenditures (by function)
General government 8,854 6,802 10,718 10,142 10,121 10,034 16,544 26,194 19,871 19,622
Public protection 47,261 46,145 51,678 46,205 42,340 43,516 45,208 58,483 73,551 57,502
Public ways and facilities 7,623 4,890 10,643 4,723 9,232 8,467 9,190 13,381 8,281 9,338
Health and sanitation 40,604 41,421 38,527 33,845 36,812 39,805 41,825 48,006 62,013 58,526
Public assistance 30,579 30,595 27,005 37,775 38,189 38,860 42,984 46,917 48,755 51,051
Education 1,626 1,512 1,254 1,463 1,441 1,470 1,572 1,735 1,905 1,825
Culture and recreation 599 642 679 643 686 683 745 1,116 694 941
Community development 1,729 87 539 177 30 12 - - - -
Debt service:
Principal 145 151 158 222 346 305 84 470 624 655
Interest 120 180 141 95 362 350 58 372 356 293
Issuance costs - - - - - - - - - -
Capital Outlay 2,742 1,386 1,819 4,237 7,109 3,197 4,435 3,387 4,272 6,326
Total expenditures 141,883 133,812 143,161 139,527 146,668 146,697 162,646 200,061 220,322 206,080
Other Financing Sources (Uses)
Proceeds on sale of capital assets - - - - - - 106 - - -
Transfers in 6,131 18,053 24,537 68,906 77,453 74,973 83,846 102,068 107,637 113,818
Transfers out (6,131) (18,053) (24,537) (68,906) (77,458) (76,242) (83,817) (102,068) (107,637) (113,818)
Issuance of debt - - - 9,492 - - - - - 604
Total other financing sources (uses) - - - 9,492 (5) (1,269) 135 - - 604
Net change in fund balance $ (3,407) $ 3,668 $ 1,610 $ 16,226 $ 4,216 $ 5,701 $ 1,631 $ (10) $ 2,862 $ 2,515
Debt service as a percentage
of noncapital expenditures: 0.19% 0.25% 0.21% 0.23% 0.51% 0.46% 0.09% 0.43% 0.46% 0.48%
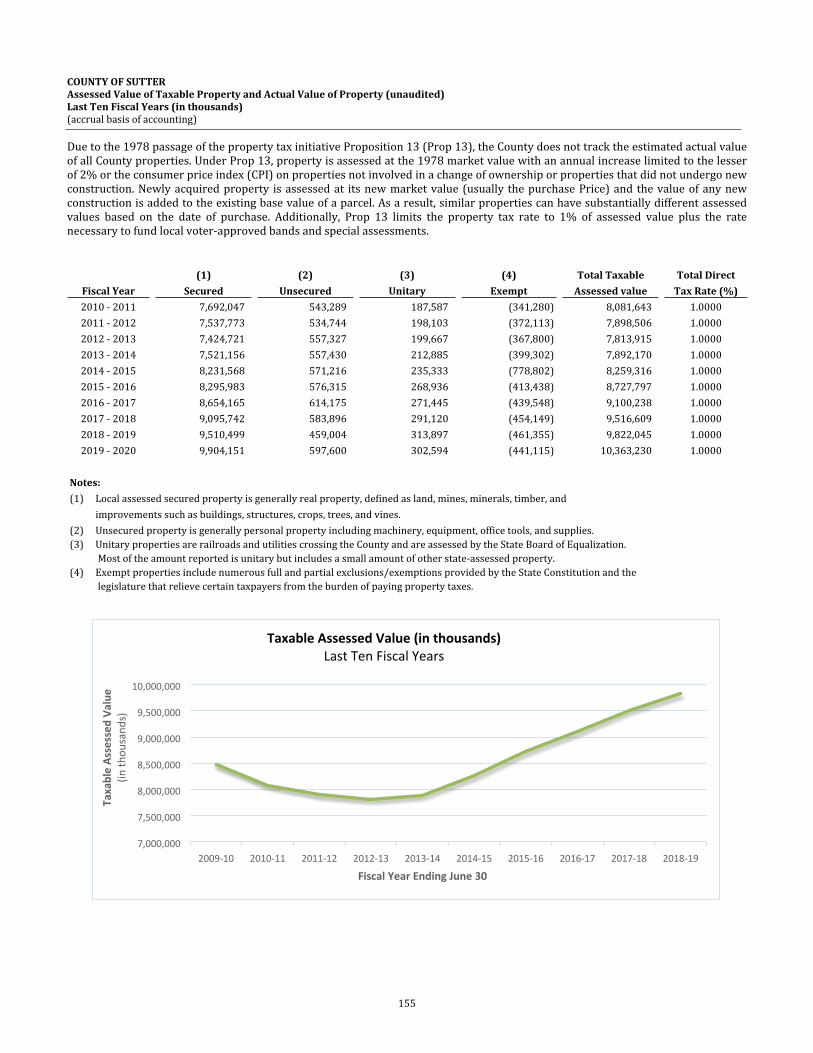
155
COUNTY OF SUTTERAssessed Value of Taxable Property and Actual Value of Property (unaudited)Last Ten Fiscal Years (in thousands)(accrual basis of accounting)
Due to the 1978 passage of the property tax initiative Proposition 13 (Prop 13), the County does not track the estimated actual value of all County properties. Under Prop 13, property is assessed at the 1978 market value with an annual increase limited to the lesser of 2% or the consumer price index (CPI) on properties not involved in a change of ownership or properties that did not undergo new construction. Newly acquired property is assessed at its new market value (usually the purchase Price) and the value of any new construction is added to the existing base value of a parcel. As a result, similar properties can have substantially different assessed values based on the date of purchase. Additionally, Prop 13 limits the property tax rate to 1% of assessed value plus the rate necessary to fund local voter-approved bands and special assessments.
(1) (2) (3) (4) Total Taxable Total DirectFiscal Year Secured Unsecured Unitary Exempt Assessed value Tax Rate (%)2010 - 2011 7,692,047 543,289 187,587 (341,280) 8,081,643 1.00002011 - 2012 7,537,773 534,744 198,103 (372,113) 7,898,506 1.00002012 - 2013 7,424,721 557,327 199,667 (367,800) 7,813,915 1.00002013 - 2014 7,521,156 557,430 212,885 (399,302) 7,892,170 1.00002014 - 2015 8,231,568 571,216 235,333 (778,802) 8,259,316 1.00002015 - 2016 8,295,983 576,315 268,936 (413,438) 8,727,797 1.00002016 - 2017 8,654,165 614,175 271,445 (439,548) 9,100,238 1.00002017 - 2018 9,095,742 583,896 291,120 (454,149) 9,516,609 1.00002018 - 2019 9,510,499 459,004 313,897 (461,355) 9,822,045 1.00002019 - 2020 9,904,151 597,600 302,594 (441,115) 10,363,230 1.0000
Notes:(1) Local assessed secured property is generally real property, defined as land, mines, minerals, timber, and improvements such as buildings, structures, crops, trees, and vines.(2) Unsecured property is generally personal property including machinery, equipment, office tools, and supplies. (3) Unitary properties are railroads and utilities crossing the County and are assessed by the State Board of Equalization. Most of the amount reported is unitary but includes a small amount of other state-assessed property. (4) Exempt properties include numerous full and partial exclusions/exemptions provided by the State Constitution and the legislature that relieve certain taxpayers from the burden of paying property taxes.
2009-10 2010-11 2011-12 2012-13 2013-14 2014-15 2015-16 2016-17 2017-18 2018-197,000,000
7,500,000
8,000,000
8,500,000
9,000,000
9,500,000
10,000,000
Taxable Assessed Value (in thousands) Last Ten Fiscal Years
Fiscal Year Ending June 30
Taxa
ble
Asse
ssed
Val
ue(in
thou
sand
s)
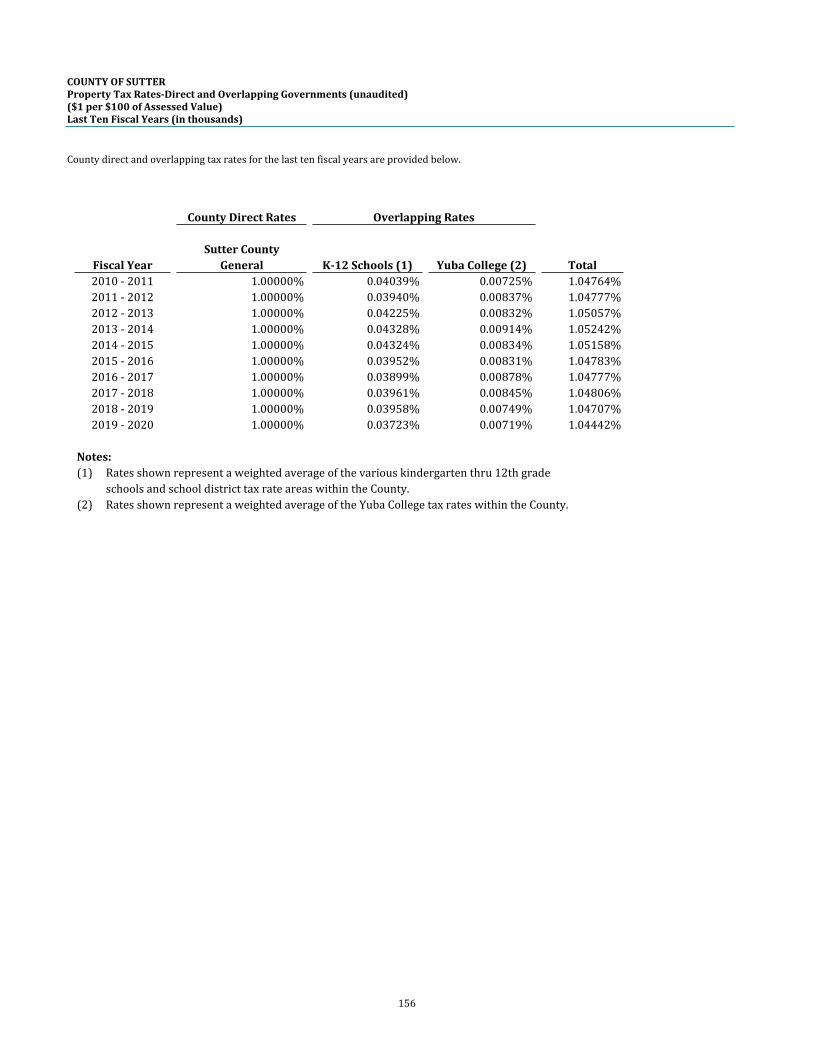
156
COUNTY OF SUTTERProperty Tax Rates-Direct and Overlapping Governments (unaudited)($1 per $100 of Assessed Value)Last Ten Fiscal Years (in thousands)
County direct and overlapping tax rates for the last ten fiscal years are provided below.
County Direct Rates Overlapping Rates
Sutter CountyFiscal Year General K-12 Schools (1) Yuba College (2) Total2010 - 2011 1.00000% 0.04039% 0.00725% 1.04764%2011 - 2012 1.00000% 0.03940% 0.00837% 1.04777%2012 - 2013 1.00000% 0.04225% 0.00832% 1.05057%2013 - 2014 1.00000% 0.04328% 0.00914% 1.05242%2014 - 2015 1.00000% 0.04324% 0.00834% 1.05158%2015 - 2016 1.00000% 0.03952% 0.00831% 1.04783%2016 - 2017 1.00000% 0.03899% 0.00878% 1.04777%2017 - 2018 1.00000% 0.03961% 0.00845% 1.04806%2018 - 2019 1.00000% 0.03958% 0.00749% 1.04707%2019 - 2020 1.00000% 0.03723% 0.00719% 1.04442%
Notes:(1) Rates shown represent a weighted average of the various kindergarten thru 12th grade schools and school district tax rate areas within the County.(2) Rates shown represent a weighted average of the Yuba College tax rates within the County.
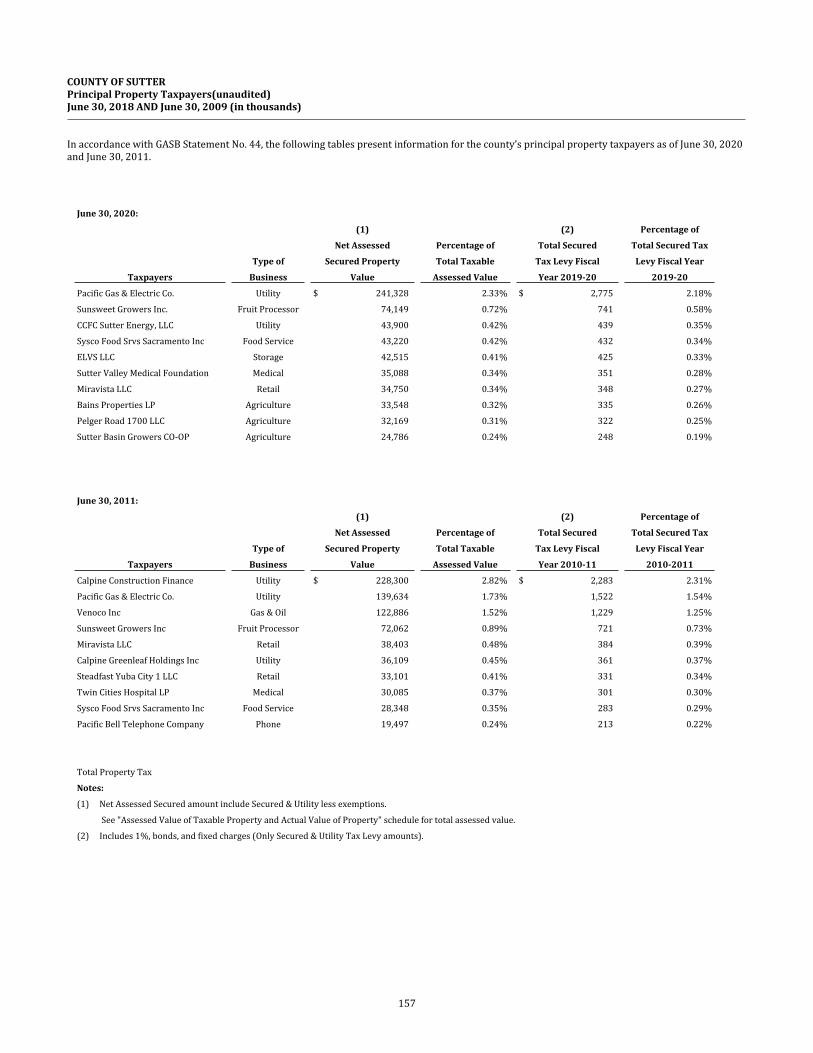
157
COUNTY OF SUTTERPrincipal Property Taxpayers(unaudited)June 30, 2018 AND June 30, 2009 (in thousands)
In accordance with GASB Statement No. 44, the following tables present information for the county’s principal property taxpayers as of June 30, 2020 and June 30, 2011.
June 30, 2020:
(1) (2) Percentage of
Net Assessed Percentage of Total Secured Total Secured Tax
Type of Secured Property Total Taxable Tax Levy Fiscal Levy Fiscal Year
Taxpayers Business Value Assessed Value Year 2019-20 2019-20
Pacific Gas & Electric Co. Utility $ 241,328 2.33% $ 2,775 2.18%
Sunsweet Growers Inc. Fruit Processor 74,149 0.72% 741 0.58%
CCFC Sutter Energy, LLC Utility 43,900 0.42% 439 0.35%
Sysco Food Srvs Sacramento Inc Food Service 43,220 0.42% 432 0.34%
ELVS LLC Storage 42,515 0.41% 425 0.33%
Sutter Valley Medical Foundation Medical 35,088 0.34% 351 0.28%
Miravista LLC Retail 34,750 0.34% 348 0.27%
Bains Properties LP Agriculture 33,548 0.32% 335 0.26%
Pelger Road 1700 LLC Agriculture 32,169 0.31% 322 0.25%
Sutter Basin Growers CO-OP Agriculture 24,786 0.24% 248 0.19%
June 30, 2011:
(1) (2) Percentage of
Net Assessed Percentage of Total Secured Total Secured Tax
Type of Secured Property Total Taxable Tax Levy Fiscal Levy Fiscal Year
Taxpayers Business Value Assessed Value Year 2010-11 2010-2011
Calpine Construction Finance Utility $ 228,300 2.82% $ 2,283 2.31%
Pacific Gas & Electric Co. Utility 139,634 1.73% 1,522 1.54%
Venoco Inc Gas & Oil 122,886 1.52% 1,229 1.25%
Sunsweet Growers Inc Fruit Processor 72,062 0.89% 721 0.73%
Miravista LLC Retail 38,403 0.48% 384 0.39%
Calpine Greenleaf Holdings Inc Utility 36,109 0.45% 361 0.37%
Steadfast Yuba City 1 LLC Retail 33,101 0.41% 331 0.34%
Twin Cities Hospital LP Medical 30,085 0.37% 301 0.30%
Sysco Food Srvs Sacramento Inc Food Service 28,348 0.35% 283 0.29%
Pacific Bell Telephone Company Phone 19,497 0.24% 213 0.22%
Total Property Tax
Notes:
(1) Net Assessed Secured amount include Secured & Utility less exemptions.
See "Assessed Value of Taxable Property and Actual Value of Property" schedule for total assessed value.
(2) Includes 1%, bonds, and fixed charges (Only Secured & Utility Tax Levy amounts).
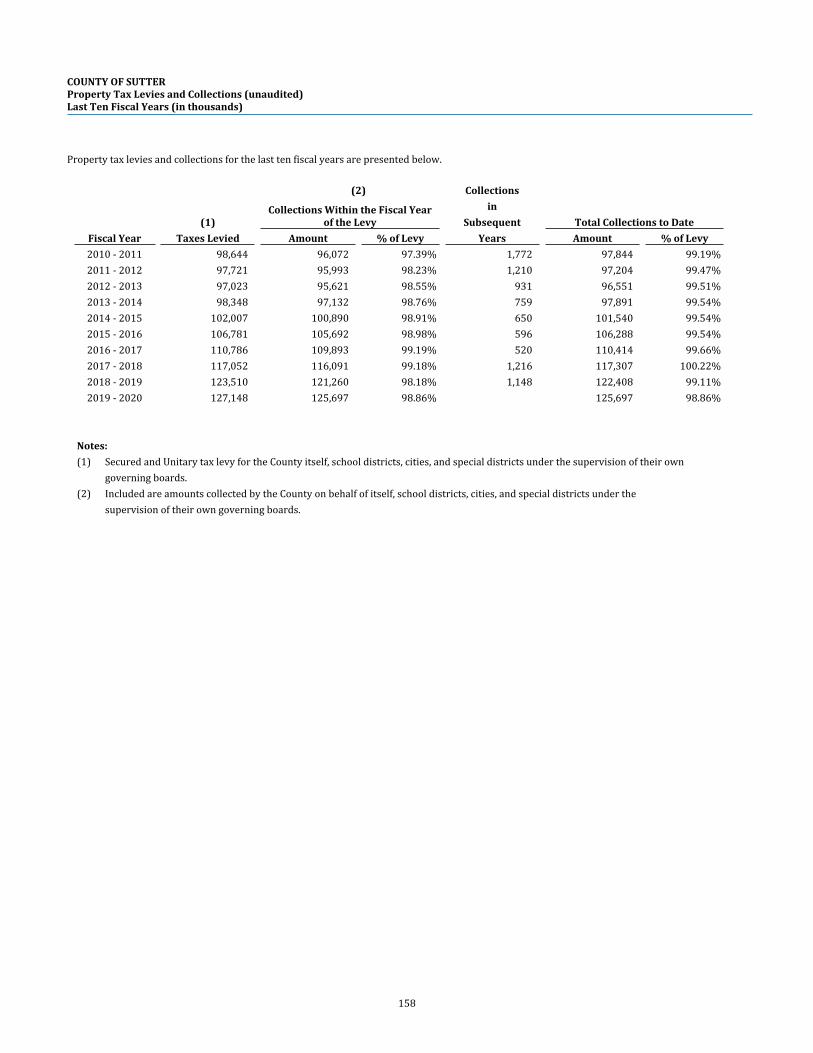
158
COUNTY OF SUTTERProperty Tax Levies and Collections (unaudited)Last Ten Fiscal Years (in thousands)
Property tax levies and collections for the last ten fiscal years are presented below.
(2) Collectionsin
(1)Collections Within the Fiscal Year
of the Levy Subsequent Total Collections to DateFiscal Year Taxes Levied Amount % of Levy Years Amount % of Levy2010 - 2011 98,644 96,072 97.39% 1,772 97,844 99.19%2011 - 2012 97,721 95,993 98.23% 1,210 97,204 99.47%2012 - 2013 97,023 95,621 98.55% 931 96,551 99.51%2013 - 2014 98,348 97,132 98.76% 759 97,891 99.54%2014 - 2015 102,007 100,890 98.91% 650 101,540 99.54%2015 - 2016 106,781 105,692 98.98% 596 106,288 99.54%2016 - 2017 110,786 109,893 99.19% 520 110,414 99.66%2017 - 2018 117,052 116,091 99.18% 1,216 117,307 100.22%2018 - 2019 123,510 121,260 98.18% 1,148 122,408 99.11%2019 - 2020 127,148 125,697 98.86% 125,697 98.86%
Notes:(1) Secured and Unitary tax levy for the County itself, school districts, cities, and special districts under the supervision of their own governing boards.(2) Included are amounts collected by the County on behalf of itself, school districts, cities, and special districts under the supervision of their own governing boards.
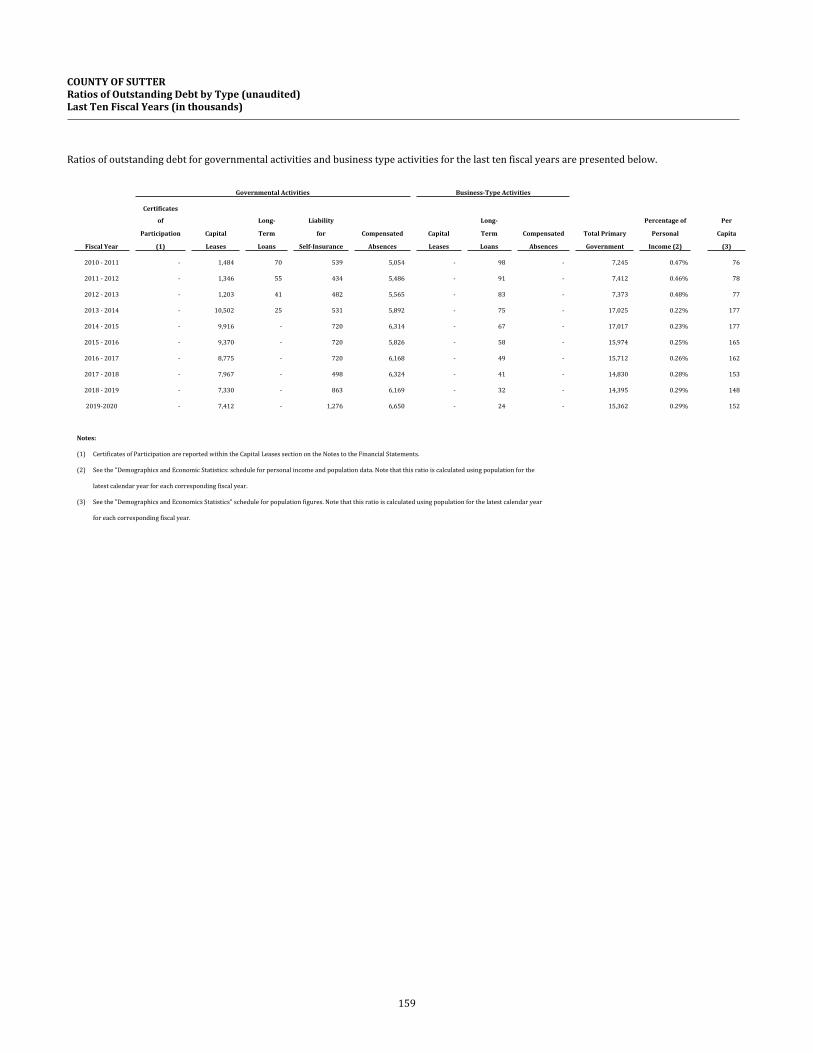
159
COUNTY OF SUTTERRatios of Outstanding Debt by Type (unaudited)Last Ten Fiscal Years (in thousands)
Ratios of outstanding debt for governmental activities and business type activities for the last ten fiscal years are presented below.
Governmental Activities Business-Type Activities
Certificates
of Long- Liability Long- Percentage of Per
Participation Capital Term for Compensated Capital Term Compensated Total Primary Personal Capita
Fiscal Year (1) Leases Loans Self-Insurance Absences Leases Loans Absences Government Income (2) (3)
2010 - 2011 - 1,484 70 539 5,054 - 98 - 7,245 0.47% 76
2011 - 2012 - 1,346 55 434 5,486 - 91 - 7,412 0.46% 78
2012 - 2013 - 1,203 41 482 5,565 - 83 - 7,373 0.48% 77
2013 - 2014 - 10,502 25 531 5,892 - 75 - 17,025 0.22% 177
2014 - 2015 - 9,916 - 720 6,314 - 67 - 17,017 0.23% 177
2015 - 2016 - 9,370 - 720 5,826 - 58 - 15,974 0.25% 165
2016 - 2017 - 8,775 - 720 6,168 - 49 - 15,712 0.26% 162
2017 - 2018 - 7,967 - 498 6,324 - 41 - 14,830 0.28% 153
2018 - 2019 - 7,330 - 863 6,169 - 32 - 14,395 0.29% 148
2019-2020 - 7,412 - 1,276 6,650 - 24 - 15,362 0.29% 152
Notes:
(1) Certificates of Participation are reported within the Capital Leases section on the Notes to the Financial Statements.
(2) See the "Demographics and Economic Statistics: schedule for personal income and population data. Note that this ratio is calculated using population for the
latest calendar year for each corresponding fiscal year.
(3) See the "Demographics and Economics Statistics" schedule for population figures. Note that this ratio is calculated using population for the latest calendar year
for each corresponding fiscal year.
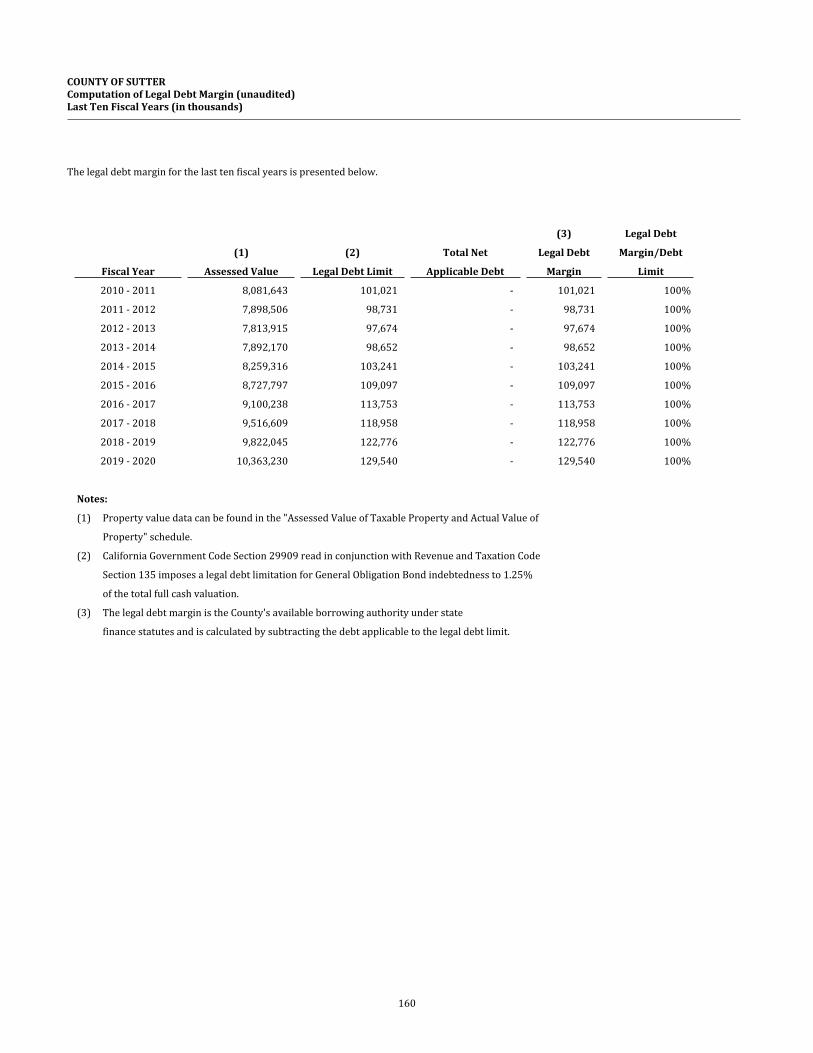
160
COUNTY OF SUTTERComputation of Legal Debt Margin (unaudited)Last Ten Fiscal Years (in thousands)
The legal debt margin for the last ten fiscal years is presented below.
(3) Legal Debt
(1) (2) Total Net Legal Debt Margin/Debt
Fiscal Year Assessed Value Legal Debt Limit Applicable Debt Margin Limit
2010 - 2011 8,081,643 101,021 - 101,021 100%
2011 - 2012 7,898,506 98,731 - 98,731 100%
2012 - 2013 7,813,915 97,674 - 97,674 100%
2013 - 2014 7,892,170 98,652 - 98,652 100%
2014 - 2015 8,259,316 103,241 - 103,241 100%
2015 - 2016 8,727,797 109,097 - 109,097 100%
2016 - 2017 9,100,238 113,753 - 113,753 100%
2017 - 2018 9,516,609 118,958 - 118,958 100%
2018 - 2019 9,822,045 122,776 - 122,776 100%
2019 - 2020 10,363,230 129,540 - 129,540 100%
Notes:
(1) Property value data can be found in the "Assessed Value of Taxable Property and Actual Value of
Property" schedule.
(2) California Government Code Section 29909 read in conjunction with Revenue and Taxation Code
Section 135 imposes a legal debt limitation for General Obligation Bond indebtedness to 1.25%
of the total full cash valuation.
(3) The legal debt margin is the County's available borrowing authority under state
finance statutes and is calculated by subtracting the debt applicable to the legal debt limit.
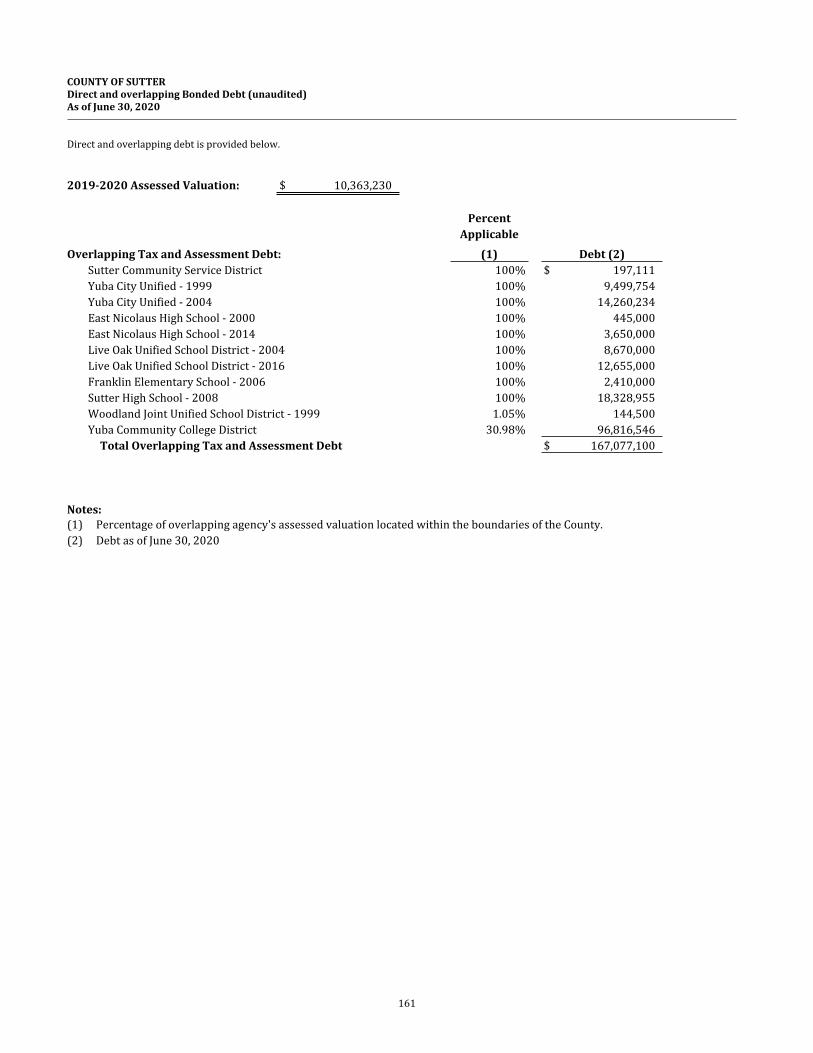
161
COUNTY OF SUTTERDirect and overlapping Bonded Debt (unaudited)As of June 30, 2020
Direct and overlapping debt is provided below.
2019-2020 Assessed Valuation: $ 10,363,230
PercentApplicable
Overlapping Tax and Assessment Debt: (1) Debt (2)Sutter Community Service District 100% $ 197,111Yuba City Unified - 1999 100% 9,499,754Yuba City Unified - 2004 100% 14,260,234East Nicolaus High School - 2000 100% 445,000East Nicolaus High School - 2014 100% 3,650,000Live Oak Unified School District - 2004 100% 8,670,000Live Oak Unified School District - 2016 100% 12,655,000Franklin Elementary School - 2006 100% 2,410,000Sutter High School - 2008 100% 18,328,955Woodland Joint Unified School District - 1999 1.05% 144,500Yuba Community College District 30.98% 96,816,546
Total Overlapping Tax and Assessment Debt $ 167,077,100
Notes:(1) Percentage of overlapping agency's assessed valuation located within the boundaries of the County.(2) Debt as of June 30, 2020
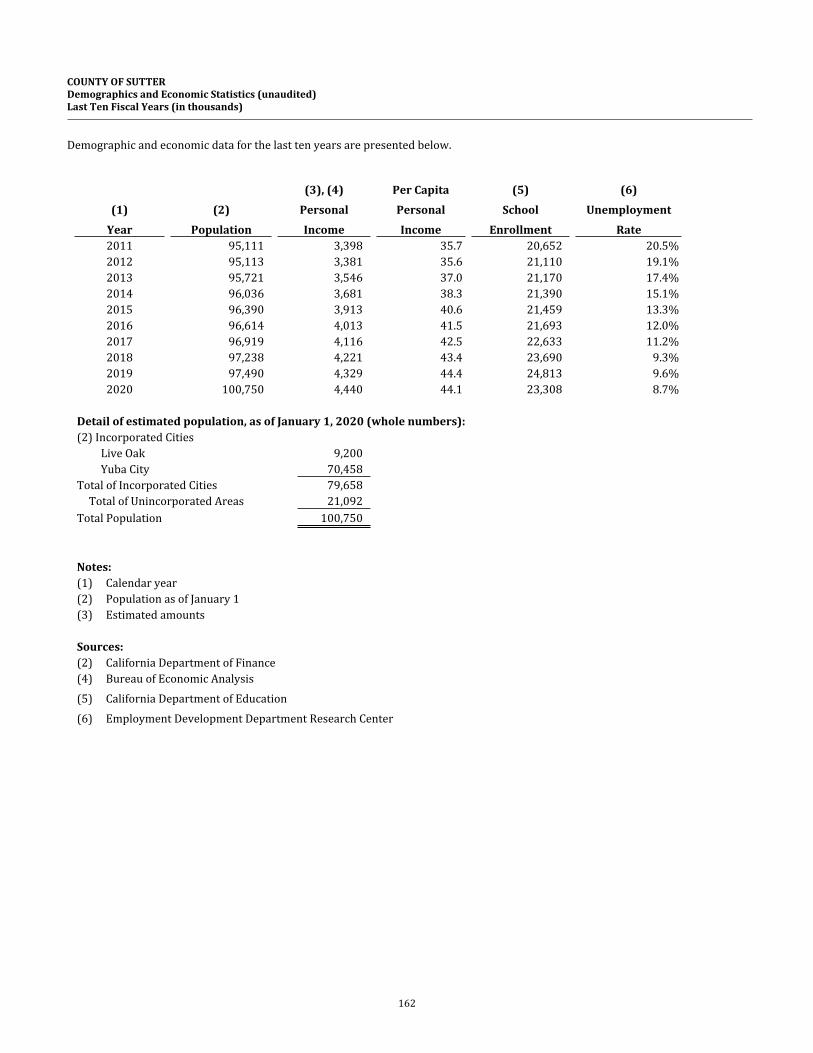
162
COUNTY OF SUTTERDemographics and Economic Statistics (unaudited)Last Ten Fiscal Years (in thousands)
Demographic and economic data for the last ten years are presented below.
(3), (4) Per Capita (5) (6)(1) (2) Personal Personal School Unemployment
Year Population Income Income Enrollment Rate2011 95,111 3,398 35.7 20,652 20.5%2012 95,113 3,381 35.6 21,110 19.1%2013 95,721 3,546 37.0 21,170 17.4%2014 96,036 3,681 38.3 21,390 15.1%2015 96,390 3,913 40.6 21,459 13.3%2016 96,614 4,013 41.5 21,693 12.0%2017 96,919 4,116 42.5 22,633 11.2%2018 97,238 4,221 43.4 23,690 9.3%2019 97,490 4,329 44.4 24,813 9.6%2020 100,750 4,440 44.1 23,308 8.7%
Detail of estimated population, as of January 1, 2020 (whole numbers):(2) Incorporated Cities
Live Oak 9,200Yuba City 70,458
Total of Incorporated Cities 79,658Total of Unincorporated Areas 21,092
Total Population 100,750
Notes:(1) Calendar year(2) Population as of January 1(3) Estimated amounts
Sources:(2) California Department of Finance(4) Bureau of Economic Analysis(5) California Department of Education(6) Employment Development Department Research Center
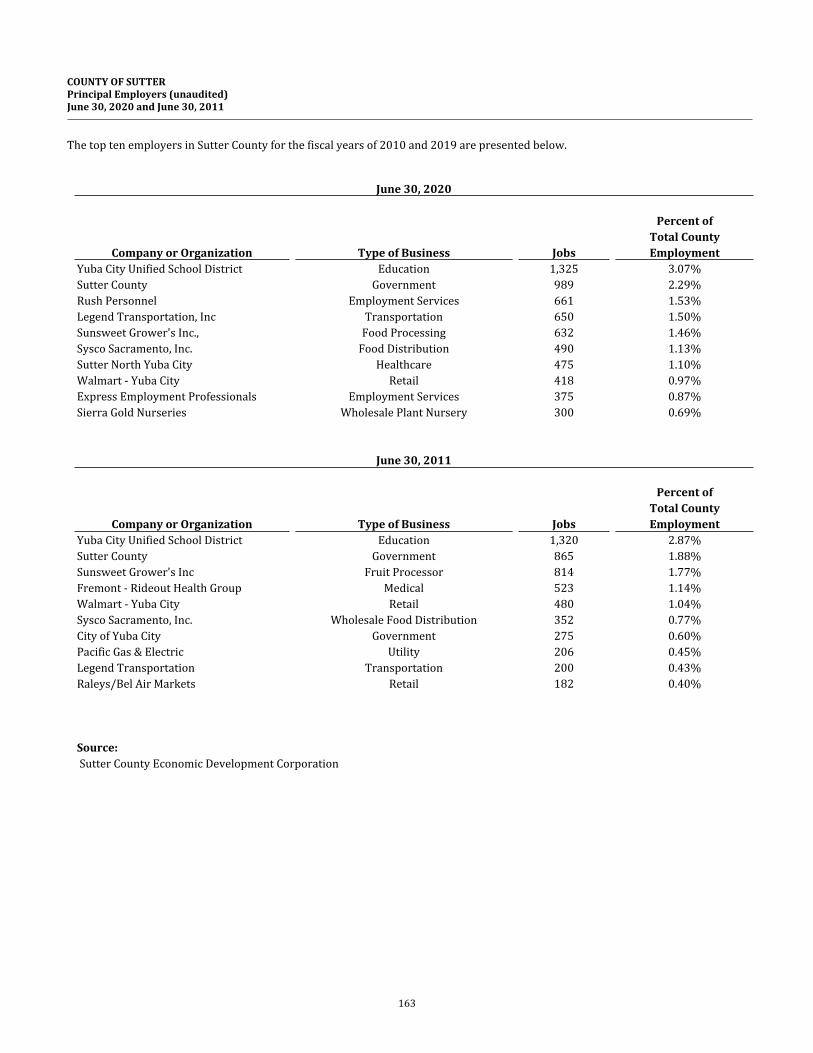
163
COUNTY OF SUTTERPrincipal Employers (unaudited)June 30, 2020 and June 30, 2011
The top ten employers in Sutter County for the fiscal years of 2010 and 2019 are presented below.
June 30, 2020
Percent ofTotal County
Company or Organization Type of Business Jobs EmploymentYuba City Unified School District Education 1,325 3.07%Sutter County Government 989 2.29%Rush Personnel Employment Services 661 1.53%Legend Transportation, Inc Transportation 650 1.50%Sunsweet Grower's Inc., Food Processing 632 1.46%Sysco Sacramento, Inc. Food Distribution 490 1.13%Sutter North Yuba City Healthcare 475 1.10%Walmart - Yuba City Retail 418 0.97%Express Employment Professionals Employment Services 375 0.87%Sierra Gold Nurseries Wholesale Plant Nursery 300 0.69%
June 30, 2011
Percent ofTotal County
Company or Organization Type of Business Jobs EmploymentYuba City Unified School District Education 1,320 2.87%Sutter County Government 865 1.88%Sunsweet Grower's Inc Fruit Processor 814 1.77%Fremont - Rideout Health Group Medical 523 1.14%Walmart - Yuba City Retail 480 1.04%Sysco Sacramento, Inc. Wholesale Food Distribution 352 0.77%City of Yuba City Government 275 0.60%Pacific Gas & Electric Utility 206 0.45%Legend Transportation Transportation 200 0.43%Raleys/Bel Air Markets Retail 182 0.40%
Source: Sutter County Economic Development Corporation
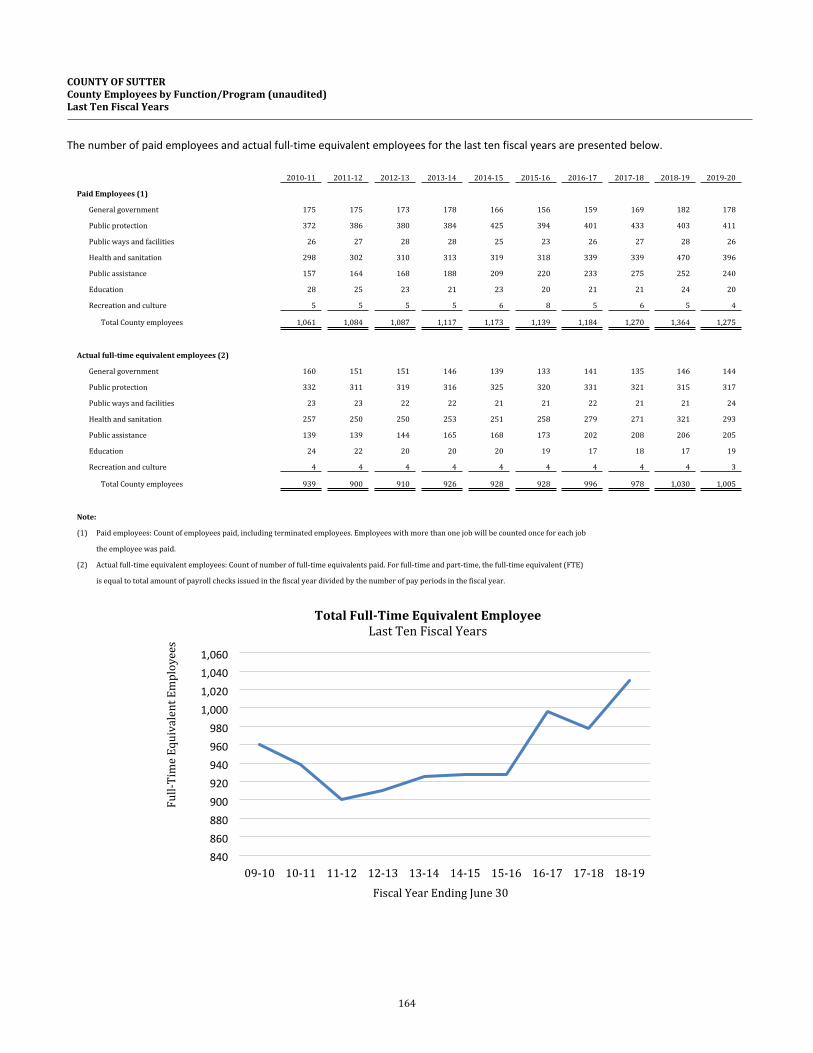
164
COUNTY OF SUTTERCounty Employees by Function/Program (unaudited)Last Ten Fiscal Years
The number of paid employees and actual full-time equivalent employees for the last ten fiscal years are presented below.
2010-11 2011-12 2012-13 2013-14 2014-15 2015-16 2016-17 2017-18 2018-19 2019-20
Paid Employees (1)
General government 175 175 173 178 166 156 159 169 182 178
Public protection 372 386 380 384 425 394 401 433 403 411
Public ways and facilities 26 27 28 28 25 23 26 27 28 26
Health and sanitation 298 302 310 313 319 318 339 339 470 396
Public assistance 157 164 168 188 209 220 233 275 252 240
Education 28 25 23 21 23 20 21 21 24 20
Recreation and culture 5 5 5 5 6 8 5 6 5 4
Total County employees 1,061 1,084 1,087 1,117 1,173 1,139 1,184 1,270 1,364 1,275
Actual full-time equivalent employees (2)
General government 160 151 151 146 139 133 141 135 146 144
Public protection 332 311 319 316 325 320 331 321 315 317
Public ways and facilities 23 23 22 22 21 21 22 21 21 24
Health and sanitation 257 250 250 253 251 258 279 271 321 293
Public assistance 139 139 144 165 168 173 202 208 206 205
Education 24 22 20 20 20 19 17 18 17 19
Recreation and culture 4 4 4 4 4 4 4 4 4 3
Total County employees 939 900 910 926 928 928 996 978 1,030 1,005
Note:
(1) Paid employees: Count of employees paid, including terminated employees. Employees with more than one job will be counted once for each job
the employee was paid.
(2) Actual full-time equivalent employees: Count of number of full-time equivalents paid. For full-time and part-time, the full-time equivalent (FTE)
is equal to total amount of payroll checks issued in the fiscal year divided by the number of pay periods in the fiscal year.
09-10 10-11 11-12 12-13 13-14 14-15 15-16 16-17 17-18 18-19840860880900920940960980
1,0001,0201,0401,060
Total Full-Time Equivalent EmployeeLast Ten Fiscal Years
Fiscal Year Ending June 30
Full-
Tim
e Eq
uiva
lent
Em
ploy
ees
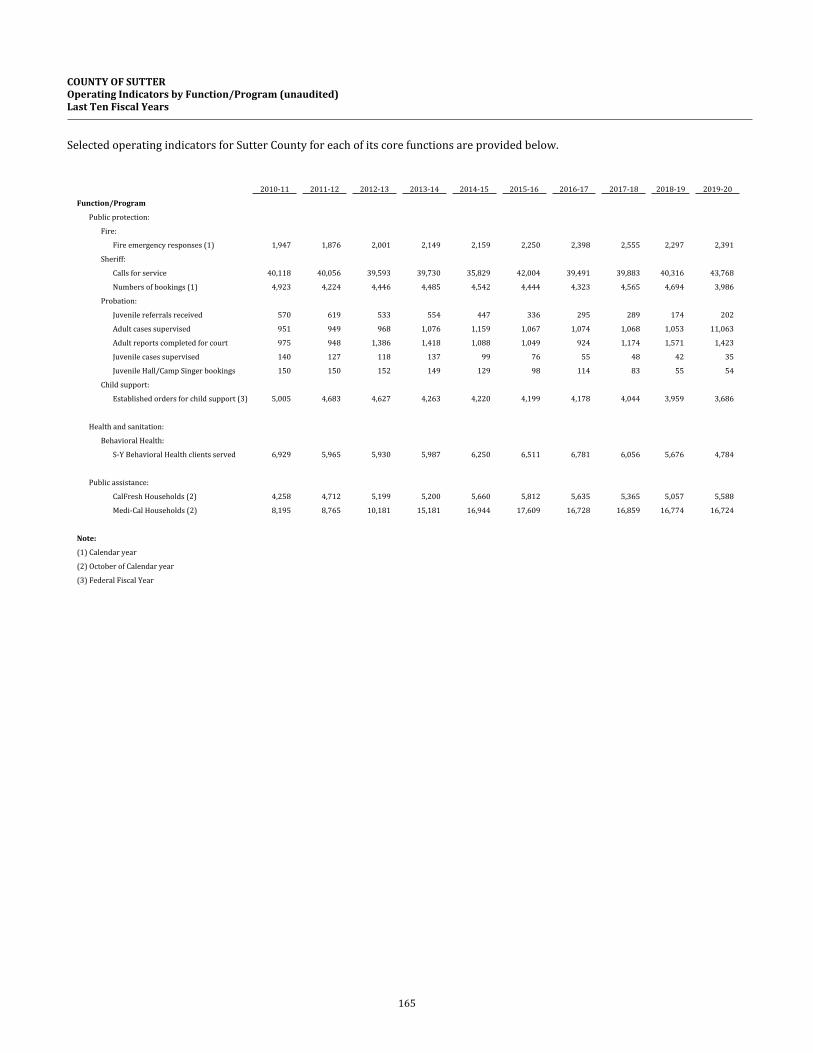
165
COUNTY OF SUTTEROperating Indicators by Function/Program (unaudited)Last Ten Fiscal Years
Selected operating indicators for Sutter County for each of its core functions are provided below.
2010-11 2011-12 2012-13 2013-14 2014-15 2015-16 2016-17 2017-18 2018-19 2019-20
Function/Program
Public protection:
Fire:
Fire emergency responses (1) 1,947 1,876 2,001 2,149 2,159 2,250 2,398 2,555 2,297 2,391
Sheriff:
Calls for service 40,118 40,056 39,593 39,730 35,829 42,004 39,491 39,883 40,316 43,768
Numbers of bookings (1) 4,923 4,224 4,446 4,485 4,542 4,444 4,323 4,565 4,694 3,986
Probation:
Juvenile referrals received 570 619 533 554 447 336 295 289 174 202
Adult cases supervised 951 949 968 1,076 1,159 1,067 1,074 1,068 1,053 11,063
Adult reports completed for court 975 948 1,386 1,418 1,088 1,049 924 1,174 1,571 1,423
Juvenile cases supervised 140 127 118 137 99 76 55 48 42 35
Juvenile Hall/Camp Singer bookings 150 150 152 149 129 98 114 83 55 54
Child support:
Established orders for child support (3) 5,005 4,683 4,627 4,263 4,220 4,199 4,178 4,044 3,959 3,686
Health and sanitation:
Behavioral Health:
S-Y Behavioral Health clients served 6,929 5,965 5,930 5,987 6,250 6,511 6,781 6,056 5,676 4,784
Public assistance:
CalFresh Households (2) 4,258 4,712 5,199 5,200 5,660 5,812 5,635 5,365 5,057 5,588
Medi-Cal Households (2) 8,195 8,765 10,181 15,181 16,944 17,609 16,728 16,859 16,774 16,724
Note:
(1) Calendar year
(2) October of Calendar year
(3) Federal Fiscal Year
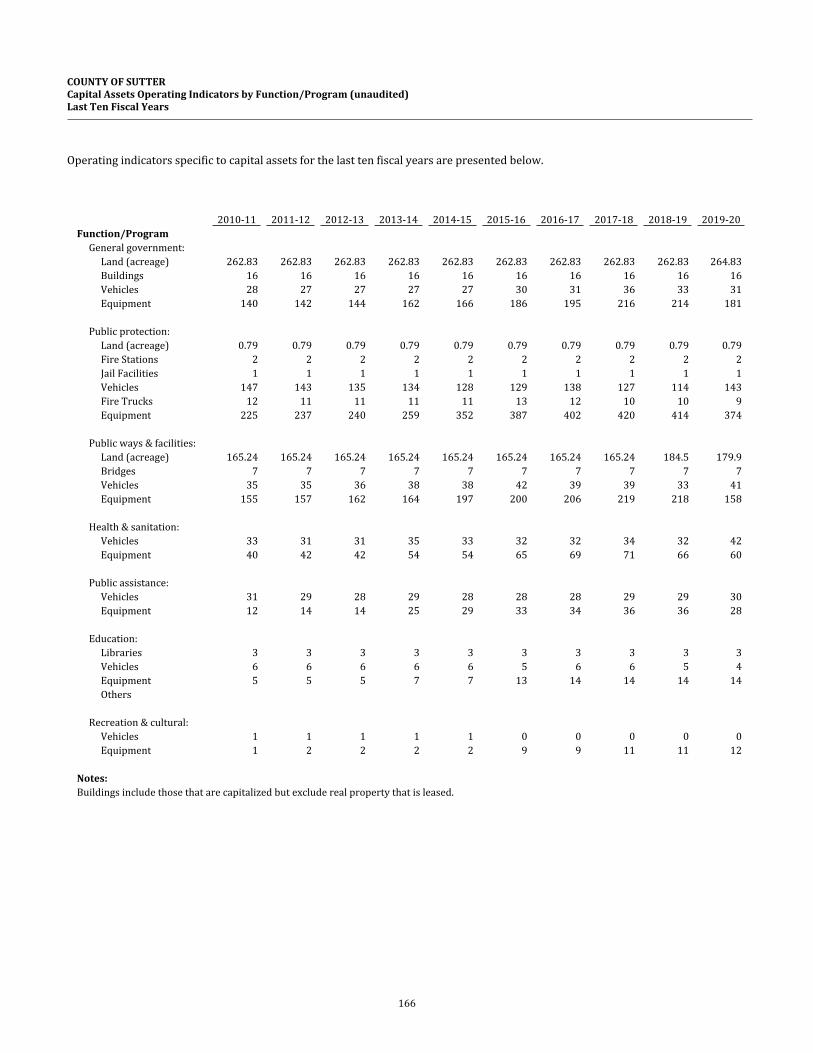
166
COUNTY OF SUTTERCapital Assets Operating Indicators by Function/Program (unaudited)Last Ten Fiscal Years
Operating indicators specific to capital assets for the last ten fiscal years are presented below.
2010-11 2011-12 2012-13 2013-14 2014-15 2015-16 2016-17 2017-18 2018-19 2019-20Function/Program
General government:Land (acreage) 262.83 262.83 262.83 262.83 262.83 262.83 262.83 262.83 262.83 264.83Buildings 16 16 16 16 16 16 16 16 16 16Vehicles 28 27 27 27 27 30 31 36 33 31Equipment 140 142 144 162 166 186 195 216 214 181
Public protection:Land (acreage) 0.79 0.79 0.79 0.79 0.79 0.79 0.79 0.79 0.79 0.79Fire Stations 2 2 2 2 2 2 2 2 2 2Jail Facilities 1 1 1 1 1 1 1 1 1 1Vehicles 147 143 135 134 128 129 138 127 114 143Fire Trucks 12 11 11 11 11 13 12 10 10 9Equipment 225 237 240 259 352 387 402 420 414 374
Public ways & facilities:Land (acreage) 165.24 165.24 165.24 165.24 165.24 165.24 165.24 165.24 184.5 179.9Bridges 7 7 7 7 7 7 7 7 7 7Vehicles 35 35 36 38 38 42 39 39 33 41Equipment 155 157 162 164 197 200 206 219 218 158
Health & sanitation:Vehicles 33 31 31 35 33 32 32 34 32 42Equipment 40 42 42 54 54 65 69 71 66 60
Public assistance:Vehicles 31 29 28 29 28 28 28 29 29 30Equipment 12 14 14 25 29 33 34 36 36 28
Education:Libraries 3 3 3 3 3 3 3 3 3 3Vehicles 6 6 6 6 6 5 6 6 5 4Equipment 5 5 5 7 7 13 14 14 14 14Others
Recreation & cultural:Vehicles 1 1 1 1 1 0 0 0 0 0Equipment 1 2 2 2 2 9 9 11 11 12
Notes:Buildings include those that are capitalized but exclude real property that is leased.

167

Glossary
Glossary

County of Sutter | Comprehensive Annual Financial Report Fiscal Year Ended June 30, 2020
170Glossary
Accounts payable – A short-term liability account reflecting amounts owed to private persons or organizations for goods and services received by a government.
Accounts receivable – An asset account reflecting amounts due from private persons or organizations for goods and services furnished by a government (but not including amounts due from other funds or other governments).
Accrual basis of accounting – The recording of the financial effects of a government of transactions and other events and circumstances that have cash consequences for the government in the periods in which those transactions, events, and circumstances occur, rather than only in the periods in which cash is received or paid by the government.
Accumulated depreciation – A contra-asset account used to report the accumulation of periodic credits to reflect the expiration of the estimated service life of capital assets.
Active employees – Individuals employed at the end of the reporting or measurement period, as applicable.
Actuarial valuation – The determination, as of a point in time (the actuarial valuation date), of the service cost, total pension liability, and related actuarial present value of projected benefit payments for pensions performed in conformity with Actuarial Standards of Practice unless otherwise specified by the GASB.
Actuarial valuation date – The date as of which an actuarial valuation is performed.
Actuarially determined contribution – A target or recommended contribution to a defined benefit pension plan for the reporting period, determined in conformity with Actuarial Standards of Practice based on the most recent measurement available when the contribution for the reporting period was adopted.
Advance from other funds – A liability account used to record noncurrent portions of a long-term loan from one fund to another fund within the same reporting entity. See Due to other funds and Interfund receivable/payable.
Advance to other funds – An asset account used to record noncurrent portions of a long-term loan from one fund to another fund within the same reporting entity. See Due from other funds and Interfund receivable/payable.
Agency fund – A fund normally used to account for assets held by a government as an agent for individuals, private organizations, or other governments and/or other funds.
Agent multiple-employer plan – Group of single-employer plans with pooled administrative and investment functions but separate actuarial valuations and contribution rates.
Amortization – The portion of the cost of a limited-life or intangible asset charged as an expense during a particular period. The reduction of debt by regular payments of principal and interest sufficient to retire the debt by maturity.
Annual OPEB cost – An accrual-basis measure of the periodic cost of an employer’s participation in a defined benefit OPEB plan.
Annual Required Contributions (ARC) – Term used in connection with other postemployment benefit plans to describe the amount an employer must contribute in a given year.
Appropriation – A legal authorization granted by a legislative body to make expenditures and to incur obligations for specific purposes. An appropriation usually is limited in amount and time it may be expended.
Assessed valuation – A valuation set upon real estate or other property by a government as a basis for levying taxes.
Assigned fund balance – Amounts that are constrained by the County’s intent to be used for specific purposes. The intent can be established at either the highest level of decision-making authority, or by a body or an official designated for that purpose. This is also the classification for residual funds in the County’s special revenue funds.
Auditor’s report – In the context of a financial audit, a statement by the auditor describing the scope of the audit and the auditing standards applied in the examination, and setting forth the auditor’s opinion on the fairness of presentation of the financial information in conformity with GAAP or some other comprehensive basis of accounting.
Balance sheet – The financial statement disclosing the assets, liabilities, and equity of an entity at a specified date in conformity with GAAP.
Basic Financial Statements (BFS) – The minimum combination of financial statements and note disclosures required for fair presentation in conformity with GAAP. Basic financial statements have three components: governmentwide financial statements, fund financial statements, and notes to the financial statements.
Basis of accounting – A term used to refer to when revenues, expenditures, expenses, and transfers, and the related assets and liabilities, are recognized in the accounts and reported in the financial statements. Specifically, it relates to the timing of the measurements made, regardless of the nature of the measurement, on either the cash or the accrual method.
Beneficial interest – The right to a portion of the benefits from donated resources pursuant to a split-interest agreement in which the donor enters into a trust or other legally enforceable agreement with characteristics that are equivalent to a split-interest agreement and transfers the resources to an intermediary.
Budget – A plan of financial operation embodying an estimate of proposed expenditures for a given period and the proposed means of financing them. Used without any modifier, the term usually indicates a financial plan for a single fiscal year. The term “budget” is used in two senses in practice. Sometimes it designates the financial plan presented to the appropriating governing body for adoption, and sometimes, the plan finally approved by that body.
Budgetary control – The control or management of a government or enterprise in accordance with an approved budget to keep expenditures within the limitations of available appropriations and available revenues.
Business-type activities – One of two classes of activities reported in the governmentwide financial statements. Business-type activities are financed in whole or in part by fees charged to external parties for goods and services. The activities are usually reported in enterprise funds.
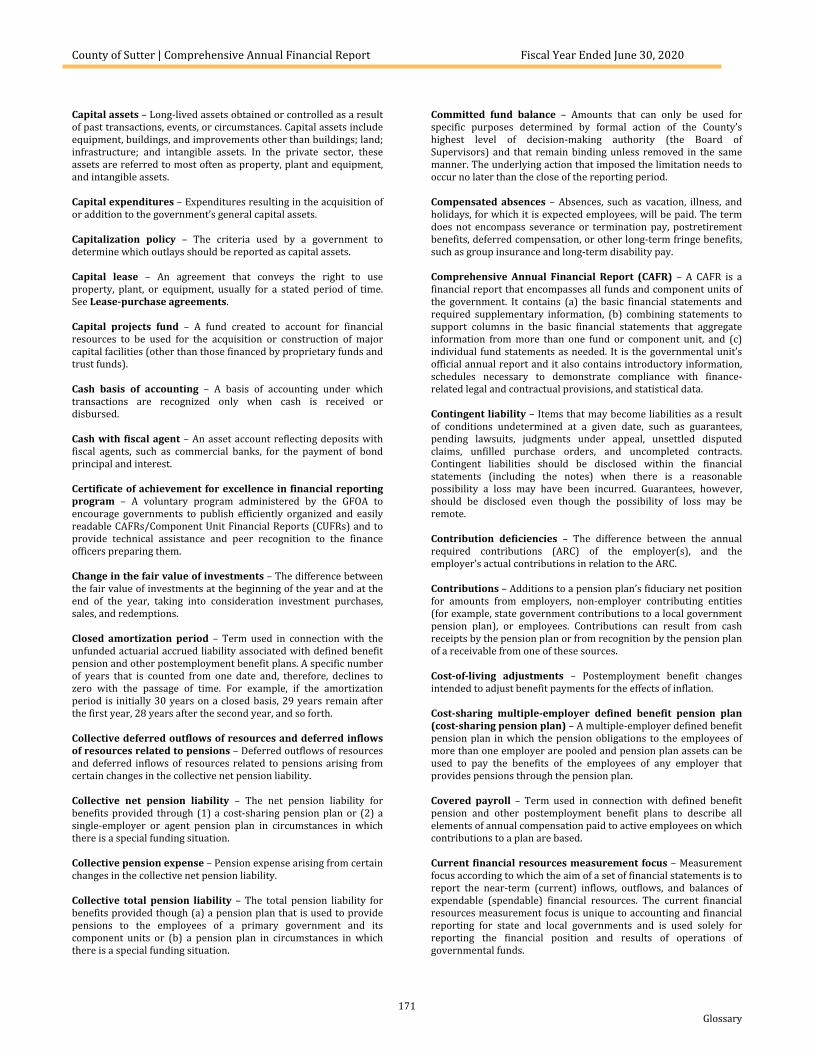
County of Sutter | Comprehensive Annual Financial Report Fiscal Year Ended June 30, 2020
171Glossary
Capital assets – Long-lived assets obtained or controlled as a result of past transactions, events, or circumstances. Capital assets include equipment, buildings, and improvements other than buildings; land; infrastructure; and intangible assets. In the private sector, these assets are referred to most often as property, plant and equipment, and intangible assets.
Capital expenditures – Expenditures resulting in the acquisition of or addition to the government’s general capital assets.
Capitalization policy – The criteria used by a government to determine which outlays should be reported as capital assets.
Capital lease – An agreement that conveys the right to use property, plant, or equipment, usually for a stated period of time. See Lease-purchase agreements.
Capital projects fund – A fund created to account for financial resources to be used for the acquisition or construction of major capital facilities (other than those financed by proprietary funds and trust funds).
Cash basis of accounting – A basis of accounting under which transactions are recognized only when cash is received or disbursed.
Cash with fiscal agent – An asset account reflecting deposits with fiscal agents, such as commercial banks, for the payment of bond principal and interest.
Certificate of achievement for excellence in financial reporting program – A voluntary program administered by the GFOA to encourage governments to publish efficiently organized and easily readable CAFRs/Component Unit Financial Reports (CUFRs) and to provide technical assistance and peer recognition to the finance officers preparing them.
Change in the fair value of investments – The difference between the fair value of investments at the beginning of the year and at the end of the year, taking into consideration investment purchases, sales, and redemptions.
Closed amortization period – Term used in connection with the unfunded actuarial accrued liability associated with defined benefit pension and other postemployment benefit plans. A specific number of years that is counted from one date and, therefore, declines to zero with the passage of time. For example, if the amortization period is initially 30 years on a closed basis, 29 years remain after the first year, 28 years after the second year, and so forth.
Collective deferred outflows of resources and deferred inflows of resources related to pensions – Deferred outflows of resources and deferred inflows of resources related to pensions arising from certain changes in the collective net pension liability.
Collective net pension liability – The net pension liability for benefits provided through (1) a cost-sharing pension plan or (2) a single-employer or agent pension plan in circumstances in which there is a special funding situation.
Collective pension expense – Pension expense arising from certain changes in the collective net pension liability.
Collective total pension liability – The total pension liability for benefits provided though (a) a pension plan that is used to provide pensions to the employees of a primary government and its component units or (b) a pension plan in circumstances in which there is a special funding situation.
Committed fund balance – Amounts that can only be used for specific purposes determined by formal action of the County’s highest level of decision-making authority (the Board of Supervisors) and that remain binding unless removed in the same manner. The underlying action that imposed the limitation needs to occur no later than the close of the reporting period.
Compensated absences – Absences, such as vacation, illness, and holidays, for which it is expected employees, will be paid. The term does not encompass severance or termination pay, postretirement benefits, deferred compensation, or other long-term fringe benefits, such as group insurance and long-term disability pay.
Comprehensive Annual Financial Report (CAFR) – A CAFR is a financial report that encompasses all funds and component units of the government. It contains (a) the basic financial statements and required supplementary information, (b) combining statements to support columns in the basic financial statements that aggregate information from more than one fund or component unit, and (c) individual fund statements as needed. It is the governmental unit’s official annual report and it also contains introductory information, schedules necessary to demonstrate compliance with finance-related legal and contractual provisions, and statistical data.
Contingent liability – Items that may become liabilities as a result of conditions undetermined at a given date, such as guarantees, pending lawsuits, judgments under appeal, unsettled disputed claims, unfilled purchase orders, and uncompleted contracts. Contingent liabilities should be disclosed within the financial statements (including the notes) when there is a reasonable possibility a loss may have been incurred. Guarantees, however, should be disclosed even though the possibility of loss may be remote.
Contribution deficiencies – The difference between the annual required contributions (ARC) of the employer(s), and the employer’s actual contributions in relation to the ARC.
Contributions – Additions to a pension plan’s fiduciary net position for amounts from employers, non-employer contributing entities (for example, state government contributions to a local government pension plan), or employees. Contributions can result from cash receipts by the pension plan or from recognition by the pension plan of a receivable from one of these sources.
Cost-of-living adjustments – Postemployment benefit changes intended to adjust benefit payments for the effects of inflation.
Cost-sharing multiple-employer defined benefit pension plan (cost-sharing pension plan) – A multiple-employer defined benefit pension plan in which the pension obligations to the employees of more than one employer are pooled and pension plan assets can be used to pay the benefits of the employees of any employer that provides pensions through the pension plan.
Covered payroll – Term used in connection with defined benefit pension and other postemployment benefit plans to describe all elements of annual compensation paid to active employees on which contributions to a plan are based.
Current financial resources measurement focus – Measurement focus according to which the aim of a set of financial statements is to report the near-term (current) inflows, outflows, and balances of expendable (spendable) financial resources. The current financial resources measurement focus is unique to accounting and financial reporting for state and local governments and is used solely for reporting the financial position and results of operations of governmental funds.
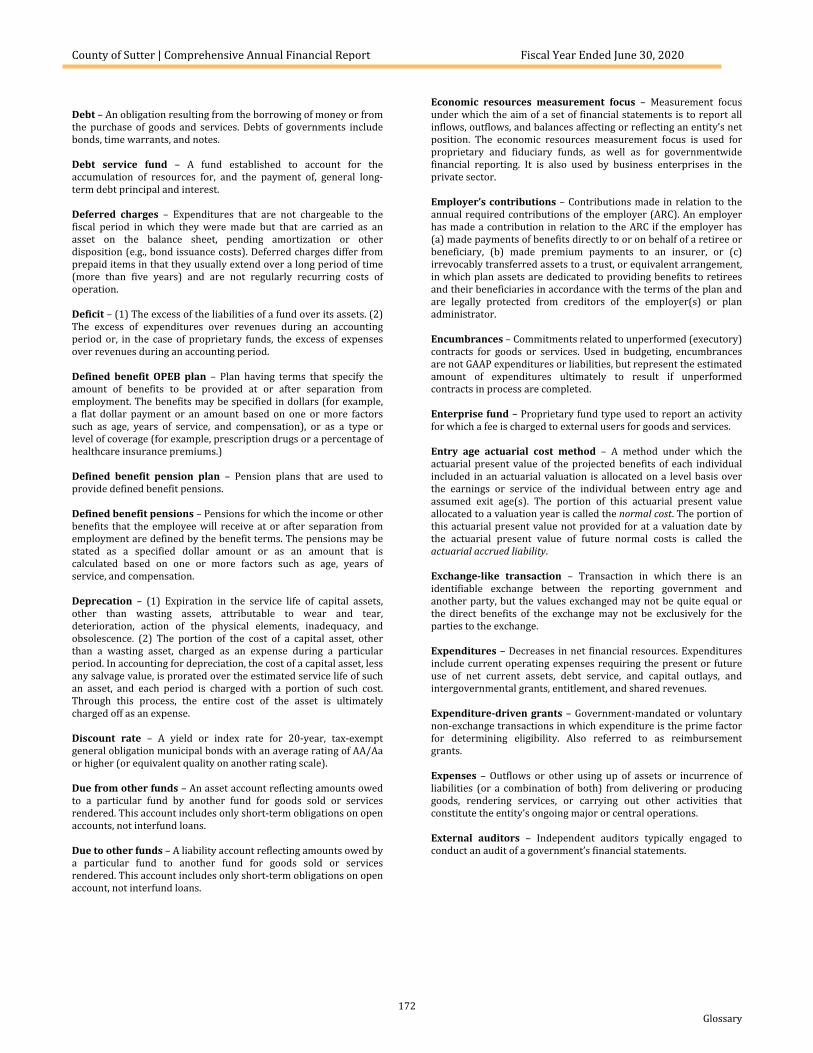
County of Sutter | Comprehensive Annual Financial Report Fiscal Year Ended June 30, 2020
172Glossary
Debt – An obligation resulting from the borrowing of money or from the purchase of goods and services. Debts of governments include bonds, time warrants, and notes.
Debt service fund – A fund established to account for the accumulation of resources for, and the payment of, general long-term debt principal and interest.
Deferred charges – Expenditures that are not chargeable to the fiscal period in which they were made but that are carried as an asset on the balance sheet, pending amortization or other disposition (e.g., bond issuance costs). Deferred charges differ from prepaid items in that they usually extend over a long period of time (more than five years) and are not regularly recurring costs of operation.
Deficit – (1) The excess of the liabilities of a fund over its assets. (2) The excess of expenditures over revenues during an accounting period or, in the case of proprietary funds, the excess of expenses over revenues during an accounting period.
Defined benefit OPEB plan – Plan having terms that specify the amount of benefits to be provided at or after separation from employment. The benefits may be specified in dollars (for example, a flat dollar payment or an amount based on one or more factors such as age, years of service, and compensation), or as a type or level of coverage (for example, prescription drugs or a percentage of healthcare insurance premiums.)
Defined benefit pension plan – Pension plans that are used to provide defined benefit pensions.
Defined benefit pensions – Pensions for which the income or other benefits that the employee will receive at or after separation from employment are defined by the benefit terms. The pensions may be stated as a specified dollar amount or as an amount that is calculated based on one or more factors such as age, years of service, and compensation.
Deprecation – (1) Expiration in the service life of capital assets, other than wasting assets, attributable to wear and tear, deterioration, action of the physical elements, inadequacy, and obsolescence. (2) The portion of the cost of a capital asset, other than a wasting asset, charged as an expense during a particular period. In accounting for depreciation, the cost of a capital asset, less any salvage value, is prorated over the estimated service life of such an asset, and each period is charged with a portion of such cost. Through this process, the entire cost of the asset is ultimately charged off as an expense.
Discount rate – A yield or index rate for 20-year, tax-exempt general obligation municipal bonds with an average rating of AA/Aa or higher (or equivalent quality on another rating scale).
Due from other funds – An asset account reflecting amounts owed to a particular fund by another fund for goods sold or services rendered. This account includes only short-term obligations on open accounts, not interfund loans.
Due to other funds – A liability account reflecting amounts owed by a particular fund to another fund for goods sold or services rendered. This account includes only short-term obligations on open account, not interfund loans.
Economic resources measurement focus – Measurement focus under which the aim of a set of financial statements is to report all inflows, outflows, and balances affecting or reflecting an entity’s net position. The economic resources measurement focus is used for proprietary and fiduciary funds, as well as for governmentwide financial reporting. It is also used by business enterprises in the private sector.
Employer’s contributions – Contributions made in relation to the annual required contributions of the employer (ARC). An employer has made a contribution in relation to the ARC if the employer has (a) made payments of benefits directly to or on behalf of a retiree or beneficiary, (b) made premium payments to an insurer, or (c) irrevocably transferred assets to a trust, or equivalent arrangement, in which plan assets are dedicated to providing benefits to retirees and their beneficiaries in accordance with the terms of the plan and are legally protected from creditors of the employer(s) or plan administrator.
Encumbrances – Commitments related to unperformed (executory) contracts for goods or services. Used in budgeting, encumbrances are not GAAP expenditures or liabilities, but represent the estimated amount of expenditures ultimately to result if unperformed contracts in process are completed.
Enterprise fund – Proprietary fund type used to report an activity for which a fee is charged to external users for goods and services.
Entry age actuarial cost method – A method under which the actuarial present value of the projected benefits of each individual included in an actuarial valuation is allocated on a level basis over the earnings or service of the individual between entry age and assumed exit age(s). The portion of this actuarial present value allocated to a valuation year is called the normal cost. The portion of this actuarial present value not provided for at a valuation date by the actuarial present value of future normal costs is called the actuarial accrued liability.
Exchange-like transaction – Transaction in which there is an identifiable exchange between the reporting government and another party, but the values exchanged may not be quite equal or the direct benefits of the exchange may not be exclusively for the parties to the exchange.
Expenditures – Decreases in net financial resources. Expenditures include current operating expenses requiring the present or future use of net current assets, debt service, and capital outlays, and intergovernmental grants, entitlement, and shared revenues.
Expenditure-driven grants – Government-mandated or voluntary non-exchange transactions in which expenditure is the prime factor for determining eligibility. Also referred to as reimbursement grants.
Expenses – Outflows or other using up of assets or incurrence of liabilities (or a combination of both) from delivering or producing goods, rendering services, or carrying out other activities that constitute the entity’s ongoing major or central operations.
External auditors – Independent auditors typically engaged to conduct an audit of a government’s financial statements.
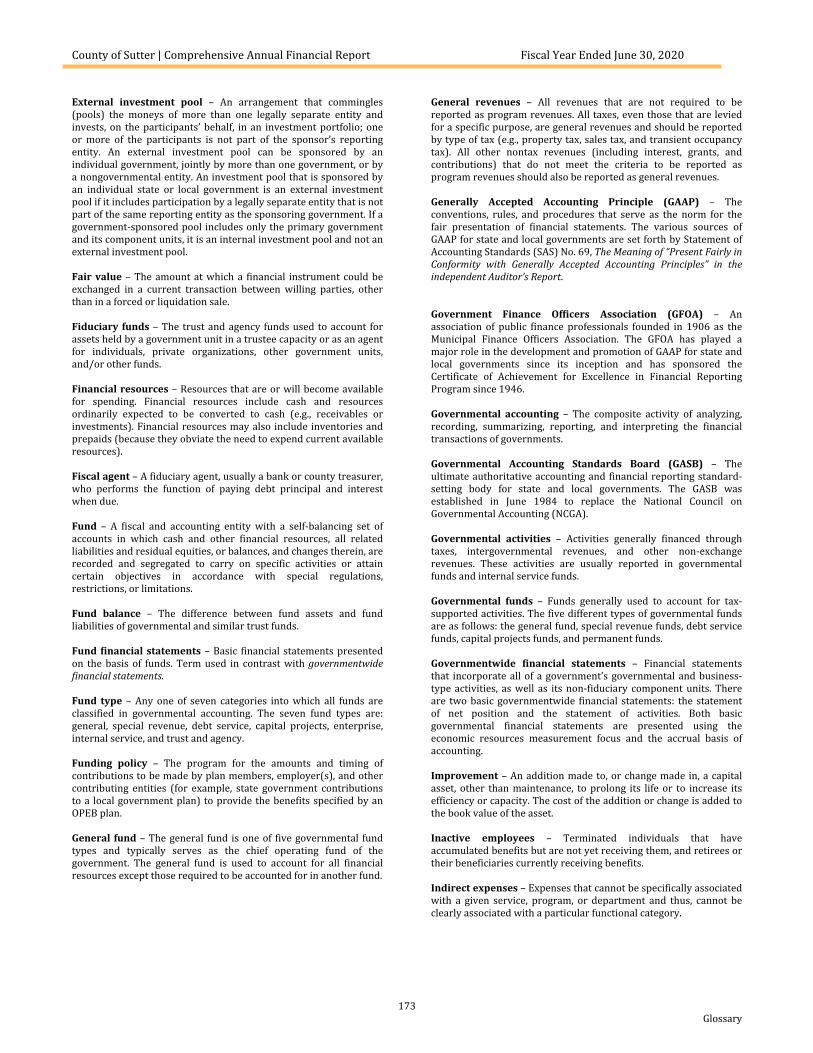
County of Sutter | Comprehensive Annual Financial Report Fiscal Year Ended June 30, 2020
173Glossary
External investment pool – An arrangement that commingles (pools) the moneys of more than one legally separate entity and invests, on the participants’ behalf, in an investment portfolio; one or more of the participants is not part of the sponsor’s reporting entity. An external investment pool can be sponsored by an individual government, jointly by more than one government, or by a nongovernmental entity. An investment pool that is sponsored by an individual state or local government is an external investment pool if it includes participation by a legally separate entity that is not part of the same reporting entity as the sponsoring government. If a government-sponsored pool includes only the primary government and its component units, it is an internal investment pool and not an external investment pool.
Fair value – The amount at which a financial instrument could be exchanged in a current transaction between willing parties, other than in a forced or liquidation sale.
Fiduciary funds – The trust and agency funds used to account for assets held by a government unit in a trustee capacity or as an agent for individuals, private organizations, other government units, and/or other funds.
Financial resources – Resources that are or will become available for spending. Financial resources include cash and resources ordinarily expected to be converted to cash (e.g., receivables or investments). Financial resources may also include inventories and prepaids (because they obviate the need to expend current available resources).
Fiscal agent – A fiduciary agent, usually a bank or county treasurer, who performs the function of paying debt principal and interest when due.
Fund – A fiscal and accounting entity with a self-balancing set of accounts in which cash and other financial resources, all related liabilities and residual equities, or balances, and changes therein, are recorded and segregated to carry on specific activities or attain certain objectives in accordance with special regulations, restrictions, or limitations.
Fund balance – The difference between fund assets and fund liabilities of governmental and similar trust funds.
Fund financial statements – Basic financial statements presented on the basis of funds. Term used in contrast with governmentwide financial statements.
Fund type – Any one of seven categories into which all funds are classified in governmental accounting. The seven fund types are: general, special revenue, debt service, capital projects, enterprise, internal service, and trust and agency.
Funding policy – The program for the amounts and timing of contributions to be made by plan members, employer(s), and other contributing entities (for example, state government contributions to a local government plan) to provide the benefits specified by an OPEB plan.
General fund – The general fund is one of five governmental fund types and typically serves as the chief operating fund of the government. The general fund is used to account for all financial resources except those required to be accounted for in another fund.
General revenues – All revenues that are not required to be reported as program revenues. All taxes, even those that are levied for a specific purpose, are general revenues and should be reported by type of tax (e.g., property tax, sales tax, and transient occupancy tax). All other nontax revenues (including interest, grants, and contributions) that do not meet the criteria to be reported as program revenues should also be reported as general revenues.
Generally Accepted Accounting Principle (GAAP) – The conventions, rules, and procedures that serve as the norm for the fair presentation of financial statements. The various sources of GAAP for state and local governments are set forth by Statement of Accounting Standards (SAS) No. 69, The Meaning of “Present Fairly in Conformity with Generally Accepted Accounting Principles” in the independent Auditor’s Report.
Government Finance Officers Association (GFOA) – An association of public finance professionals founded in 1906 as the Municipal Finance Officers Association. The GFOA has played a major role in the development and promotion of GAAP for state and local governments since its inception and has sponsored the Certificate of Achievement for Excellence in Financial Reporting Program since 1946.
Governmental accounting – The composite activity of analyzing, recording, summarizing, reporting, and interpreting the financial transactions of governments.
Governmental Accounting Standards Board (GASB) – The ultimate authoritative accounting and financial reporting standard-setting body for state and local governments. The GASB was established in June 1984 to replace the National Council on Governmental Accounting (NCGA).
Governmental activities – Activities generally financed through taxes, intergovernmental revenues, and other non-exchange revenues. These activities are usually reported in governmental funds and internal service funds.
Governmental funds – Funds generally used to account for tax-supported activities. The five different types of governmental funds are as follows: the general fund, special revenue funds, debt service funds, capital projects funds, and permanent funds.
Governmentwide financial statements – Financial statements that incorporate all of a government’s governmental and business-type activities, as well as its non-fiduciary component units. There are two basic governmentwide financial statements: the statement of net position and the statement of activities. Both basic governmental financial statements are presented using the economic resources measurement focus and the accrual basis of accounting.
Improvement – An addition made to, or change made in, a capital asset, other than maintenance, to prolong its life or to increase its efficiency or capacity. The cost of the addition or change is added to the book value of the asset.
Inactive employees – Terminated individuals that have accumulated benefits but are not yet receiving them, and retirees or their beneficiaries currently receiving benefits.
Indirect expenses – Expenses that cannot be specifically associated with a given service, program, or department and thus, cannot be clearly associated with a particular functional category.
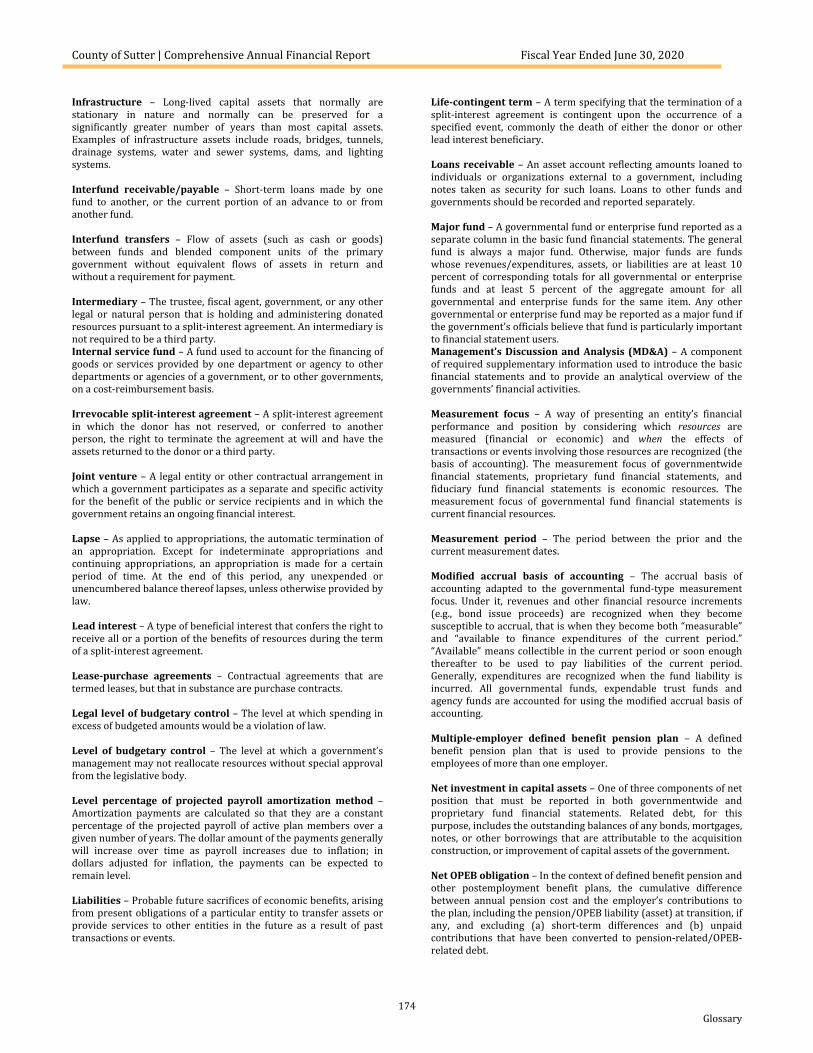
County of Sutter | Comprehensive Annual Financial Report Fiscal Year Ended June 30, 2020
174Glossary
Infrastructure – Long-lived capital assets that normally are stationary in nature and normally can be preserved for a significantly greater number of years than most capital assets. Examples of infrastructure assets include roads, bridges, tunnels, drainage systems, water and sewer systems, dams, and lighting systems.
Interfund receivable/payable – Short-term loans made by one fund to another, or the current portion of an advance to or from another fund.
Interfund transfers – Flow of assets (such as cash or goods) between funds and blended component units of the primary government without equivalent flows of assets in return and without a requirement for payment.
Intermediary – The trustee, fiscal agent, government, or any other legal or natural person that is holding and administering donated resources pursuant to a split-interest agreement. An intermediary is not required to be a third party.Internal service fund – A fund used to account for the financing of goods or services provided by one department or agency to other departments or agencies of a government, or to other governments, on a cost-reimbursement basis.
Irrevocable split-interest agreement – A split-interest agreement in which the donor has not reserved, or conferred to another person, the right to terminate the agreement at will and have the assets returned to the donor or a third party.
Joint venture – A legal entity or other contractual arrangement in which a government participates as a separate and specific activity for the benefit of the public or service recipients and in which the government retains an ongoing financial interest.
Lapse – As applied to appropriations, the automatic termination of an appropriation. Except for indeterminate appropriations and continuing appropriations, an appropriation is made for a certain period of time. At the end of this period, any unexpended or unencumbered balance thereof lapses, unless otherwise provided by law.
Lead interest – A type of beneficial interest that confers the right to receive all or a portion of the benefits of resources during the term of a split-interest agreement.
Lease-purchase agreements – Contractual agreements that are termed leases, but that in substance are purchase contracts.
Legal level of budgetary control – The level at which spending in excess of budgeted amounts would be a violation of law.
Level of budgetary control – The level at which a government’s management may not reallocate resources without special approval from the legislative body.
Level percentage of projected payroll amortization method – Amortization payments are calculated so that they are a constant percentage of the projected payroll of active plan members over a given number of years. The dollar amount of the payments generally will increase over time as payroll increases due to inflation; in dollars adjusted for inflation, the payments can be expected to remain level.
Liabilities – Probable future sacrifices of economic benefits, arising from present obligations of a particular entity to transfer assets or provide services to other entities in the future as a result of past transactions or events.
Life-contingent term – A term specifying that the termination of a split-interest agreement is contingent upon the occurrence of a specified event, commonly the death of either the donor or other lead interest beneficiary.
Loans receivable – An asset account reflecting amounts loaned to individuals or organizations external to a government, including notes taken as security for such loans. Loans to other funds and governments should be recorded and reported separately.
Major fund – A governmental fund or enterprise fund reported as a separate column in the basic fund financial statements. The general fund is always a major fund. Otherwise, major funds are funds whose revenues/expenditures, assets, or liabilities are at least 10 percent of corresponding totals for all governmental or enterprise funds and at least 5 percent of the aggregate amount for all governmental and enterprise funds for the same item. Any other governmental or enterprise fund may be reported as a major fund if the government’s officials believe that fund is particularly important to financial statement users. Management’s Discussion and Analysis (MD&A) – A component of required supplementary information used to introduce the basic financial statements and to provide an analytical overview of the governments’ financial activities.
Measurement focus – A way of presenting an entity’s financial performance and position by considering which resources are measured (financial or economic) and when the effects of transactions or events involving those resources are recognized (the basis of accounting). The measurement focus of governmentwide financial statements, proprietary fund financial statements, and fiduciary fund financial statements is economic resources. The measurement focus of governmental fund financial statements is current financial resources.
Measurement period – The period between the prior and the current measurement dates.
Modified accrual basis of accounting – The accrual basis of accounting adapted to the governmental fund-type measurement focus. Under it, revenues and other financial resource increments (e.g., bond issue proceeds) are recognized when they become susceptible to accrual, that is when they become both “measurable” and “available to finance expenditures of the current period.” “Available” means collectible in the current period or soon enough thereafter to be used to pay liabilities of the current period. Generally, expenditures are recognized when the fund liability is incurred. All governmental funds, expendable trust funds and agency funds are accounted for using the modified accrual basis of accounting.
Multiple-employer defined benefit pension plan – A defined benefit pension plan that is used to provide pensions to the employees of more than one employer.
Net investment in capital assets – One of three components of net position that must be reported in both governmentwide and proprietary fund financial statements. Related debt, for this purpose, includes the outstanding balances of any bonds, mortgages, notes, or other borrowings that are attributable to the acquisition construction, or improvement of capital assets of the government.
Net OPEB obligation – In the context of defined benefit pension and other postemployment benefit plans, the cumulative difference between annual pension cost and the employer’s contributions to the plan, including the pension/OPEB liability (asset) at transition, if any, and excluding (a) short-term differences and (b) unpaid contributions that have been converted to pension-related/OPEB-related debt.
County of Sutter | Comprehensive Annual Financial Report Fiscal Year Ended June 30, 2020
175Glossary
Net pension liability – The liability of employers and nonemployer contributing entities to employees for benefits provided through a defined benefit pension plan.
Nonspendable fund balance – Amounts that cannot be spent because they are either (a) not spendable in form or (b) legally or contractually required to be maintained intact.
Other financing sources – An increase in current financial resources that is reported separately from revenues to avoid distorting revenue trends. The use of the other financing sources category is limited to items so classified by GAAP.
Other financing uses – A decrease in current financial resources that is reported separately from expenditures to avoid distorting expenditure trends. The use of other financing uses category is limited to items so classified by GAAP.Other Postemployment Benefits (OPEB) – Benefits other than retirement income (such as death benefits, life insurance, disability, and long-term care) that are paid in the period after employment and that are provided separately from a pension plan, as well as postemployment healthcare benefits paid in the period after employment (if any), regardless of the manner in which they are provided Other postemployment benefits do not include termination benefits or termination payments for sick leave.
Overlapping debt – The proportionate share that property within a government must bear of the debts of all local governments located wholly or in part within the geographic boundaries of the reporting government. Except for special assessment debt, the amount of debt of each unit applicable to the reporting unit is arrived at by (1) determining what percentage of the total assessed value of the overlapping jurisdiction lies within the limits of the reporting unit, and (2) applying this percentage to the total debt of the overlapping jurisdiction. Special assessment debt is allocated on the basis of the ratio of assessment receivable in each jurisdiction, which will be used wholly or in part to pay off the debt, to total assessments receivable, which will be used wholly or in part for this purpose.
Pay-as-you-go – a method of financing a pension plan under which the contributions to the plan are generally made at about the same time and in about the same amount as benefit payments and expenses becoming due.
Payroll growth rate – an actuarial assumption with respect to future increases in total covered payroll attributable to inflation; used in applying the level percentage of projected payroll amortization method.
Pension benefits – Retirement income and all other benefits, including disability benefits, death benefits, life insurance, and other ancillary benefits, except health care benefits, that are provided through a defined benefit pension plan to plan members and beneficiaries after termination of employment or after retirement. Postemployment healthcare benefits are considered other postemployment benefits, whether they are provided through a defined benefit pension plan or another type of plan.
Pension plans – Arrangements through which pensions are determined, assets dedicated for pensions are accumulated and managed, and benefits are paid as they come due.
Pensions – Retirement income and, if provided through a pension plan, postemployment benefits other than retirement income (such as death benefits, life insurance, and disability benefits). Pensions do not include postemployment healthcare benefits and termination benefits.
Period-certain term – A term specifying that the termination of a split-interest agreement occurs after a specified period. (For example, a number of years.)
Plan members – Individuals that are covered under the terms of a pension plan. Plan members generally include (a) employees in active service (active plan members) and (b) terminated employees who have accumulated benefits but are not yet receiving them and retirees or their beneficiaries currently receiving benefits (inactive plan members).
Postemployment – The period after employment.
Postemployment benefit changes – Adjustments to the pension of an inactive employee.
Postemployment healthcare benefits – Medical, dental, vision, and other health-related benefits paid subsequent to the termination of employment.
Projected benefit payments – All benefits estimated to be payable through the pension plan to current active and inactive employees as a result of their past service and their expected future service.
Program revenues – Term used in connection with the governmentwide statement of activities. Revenues that derive directly from the program itself or from parties outside the reporting government’s taxpayers or citizenry, as a whole; they reduce the net cost of the function to be financed from the government’s general revenues.
Projected benefit payments – All benefit estimated to be payable through the pension plan to current active and inactive employees as a result of their past service and their expected future service.
Proprietary funds – Funds that focus on the determination of operating income, changes in net position (or cost recovery), financial position, and cash flows. There are two different types of proprietary funds: enterprise funds and internal service funds.
Real rate of return – The rate of return on an investment after adjustment to eliminate inflation.
Rebatable arbitrage – A term used in connection with the reinvestment of the proceeds of tax-exempt debt. A requirement to remit to the federal government interest revenue in excess of interest costs when the proceeds from the sale of tax-exempt securities are reinvested in a taxable money market instrument with a materially higher yield.
Remainder interest – A type of beneficial interest that confers the right to receive all or a portion of the resources remaining at the end of a split-interest agreement’s term.
Reporting entity – The oversight unit and all of its component units, if any, that are combined in the CAFR/BFS.
Required supplementary information – Consists of statements, schedules, statistical data, or other information that according to the GASB is necessary to supplement, although not required to be a part of, the basic financial statements.
Restricted assets – Assets whose use is subject to constraints that are either (a) externally imposed by creditors (such as through debt covenants), grantors, contributors, or laws or regulations of other governments or (b) imposed by law through constitutional provisions or enabling legislation.
County of Sutter | Comprehensive Annual Financial Report Fiscal Year Ended June 30, 2020
176Glossary
Restricted fund balance – Amounts with constraints placed on their use that are either (a) externally imposed by creditors, grantors, contributors, or laws or regulations of other governments or (b) imposed by law through constitutional provisions or enabling legislation.
Restricted net position – A component of net position calculated by reducing the carrying value of restricted assets by the amount of any related debt outstanding.
Retained earnings – An equity account reflecting the accumulated earnings of an enterprise or internal service fund.
Revenue bonds – Bonds whose principal and interest are payable exclusively from earnings of an enterprise fund. In addition to a pledge of revenues, such bonds sometimes contain a mortgage on the enterprise fund’s property.
Risk management – All the ways and means used to avoid accidental loss or to reduce its consequences if it does occur.
Self-insurance – A term often used to describe the retention by an entity of a risk of loss arising out of the ownership of property or from some other cause, instead of transferring that risk to an independent third party through the purchase of an insurance policy. It is sometimes accompanied by the setting aside of assets to fund any related losses. Because no insurance is involved, the term self-insurance is a misnomer.
Service costs – The portions of the actuarial present value of projected benefit payments that are attributed to valuation years.
Service life – The average remaining years of service of all members of the retirement plan (both current employees and retirees).
Single audit – An audit performed in accordance with Title 2 U.S. Code of Federal Regulations. The Single Audit allows or requires governments (depending on the amount of federal assistance received) to have one audit performed to meet the needs of all federal agencies.
Special district – An independent unit of local government organized to perform a single government function or a restricted number of related functions. Special districts usually have the power to incur debt and levy taxes; however, certain types of special districts are entirely dependent on enterprise earnings and cannot impose taxes. Examples of special districts are water districts, drainage districts, flood control districts, hospital districts, fire protection districts, cemetery districts, transit authorities, port authorities, and electric power authorities.
Special revenue fund – A fund used to account for the proceeds of specific revenue sources (other than expendable trusts or major capital projects) that are legally restricted to expenditure for specified purposes.
Split-interest agreement – An agreement in which the donor enters into a trust or other legally enforceable agreement (with characteristics that are equivalent to a split-interest agreement) under which the donor transfers resources to an intermediary to administer for the benefit of at least two beneficiaries, one of which could be a government.
Substantive plan – Terms of an OPEB plan as understood by the employer(s) and plan members.
Tax and Revenue Anticipation Notes TRAN) – Notes issued in anticipation of the collection of taxes and revenues, usually retriable only from tax collections, and frequently only from the proceeds of the tax and revenue levy whose collection they anticipate.
Termination benefits – Inducements offered by employers to active employees to hasten the termination of services, or payments made in consequence of the early termination of services. Termination benefits include early-retirement incentives, severance benefits, and other termination-related benefits.
Total pension liability – The portion of the actuarial present value of projected benefit payments that is attributed to past periods of employee service.
Trust funds – Funds used to account for assets held by a government in a trustee capacity for individuals, private organizations, other governments, and/or other funds.
Unassigned fund balance – The residual classification for the County’s General Fund that includes amounts not contained in the other classifications. In other funds, the unassigned classification is used only if expenditures incurred for specific purposes exceed the amounts restricted, committed, or assigned to those purposes.
Unconditional benefit – A right belonging to the government that cannot be taken away without the government’s consent, such as an unconditional beneficial interest.
Unearned revenues – Resource inflows that do not yet meet the criteria for revenue recognition. In governmental funds, earned amounts also are reported as unearned revenue until they are available to liquidate liabilities of the current period.
Unmodified opinion – An opinion rendered without reservation by the independent auditor that financial statements are fairly presented.
Unrestricted net position – That portion of net position that is neither restricted nor invested in capital assets (net of related debt).
Variance power – The unilateral power to redirect the benefit of the transferred resources to another beneficiary, overriding the donor’s instructions. This transfer would occur without the approval of the donor, specified beneficiaries, or any other interested party.