Embed Size (px)
Citation preview
CPO Focus on Earth Science InvestigationsFirst Edition
Copyright 2007 Delta Education LLC, a member of the School Specialty FamilyISBN-10: 1-58892-248-0
ISBN-13: 978-1-58892-248-92 3 4 5 6 7 8 9 - QWE - 11 10 09 08 07
All rights reserved. No part of this work may be reproduced or transmitted in any form or byany means, electronic or mechanical, including photocopying and recording, or by anyinformation storage or retrieval system, without permission in writing. For permission and otherrights under this copyright, please contact:
CPO Science80 Northwest Boulevard
Nashua, NH 03063(866)588-6951
http://www. cposcience.com Printed and Bound in the United States of America
CPO STAFF AND PRINCIPAL WRITERS
Mary Beth Abel Hughes - Principal WriterB.S., Marine Biology, College of Charleston; M.S., Biological Sciences,University of Rhode IslandMary Beth has taught a range of science and math at aninnovative high school and at the college level. Herexpertise is in scientific research, inquiry-based teachingmethods, and curriculum development. Mary Beth hasbeen a principal writer with CPO Science since 2000.Melissa N. G. Vela - WriterB.A., Earth and Environmental Science, Lehigh University; M.S.,Agricultural and Biological Engineering, Cornell University; M.Ed.,Curriculum/Instruction, Boston CollegeMelissa has taught six years of 9th grade earth and spacescience at Lexington High School (Lexington, MA). Shetaught 6th grade physical science and 8th grade algebra atWeston Middle School (Weston, MA).
Richard Battaglia - WriterB.S., Atmospheric, Oceanic, and Space Science, University ofMichigan; M.Ed. University of Massachusetts, BostonRichard has taught eighth grade earth science for fiveyears.Jill Elenbaas - WriterB.A., Biology and Environmental Science, Bowdoin College, MaineJill is currently teaching eighth grade earth science inWayland. MA and has teaching experience as a seventhgrade life science teacher in Dedham, MA. Erik Benton - Principal Investigation Editor B.F.A., University of MassachusettsTaught for eight years in public and private schools,focusing on inquiry and experiential learning.
CONTRIBUTING WRITERS
James SammonsB.S., Chemistry and Biology, University of Rhode IslandFormerly a research biologist in the National MarineFisheries Service, Jim taught middle school science forthirty years. He has been recognized by the SoilConservation Service, the Department of Energy'sResidence in Science and Technology program, theNational Association of Science Teachers, WGBH's Novascience program, and the National Association ofGeoscience Teachers. He is a member of the GeologicalSociety of America and the American Geophysical Union. Sean CarabatsosB.A., Boston College; M.Ed., University of Massachusetts, Boston
Sean has done extensive graduate coursework in science.He has taught middle school physical science for sevenyears in Wayland, Massachusetts.
Kelly A. StoryB.S., Chemistry, Gordon College; M.S., Chemistry, University ofMassachusetts, LowellTaught chemistry and maintains a position as labinstructor at Gordon College, Wenham, Mass.Laine IvesB.A., Gordon College; graduate coursework at Cornell University'sShoals Marine Laboratory and Wheelock CollegeLaine taught high English overseas and environmentaleducation at a middle school in New England.
SENIOR EDITOR
Lynda Pennell - Executive Vice President B.A., English, M.Ed., Administration, Reading Disabilities,Northeastern University; CAGS Media, University ofMassachusetts, BostonNationally known in high school restructuring and forintegrating academic and career education. Served asthe director of an urban school for 5 years and has 17years teaching/administrative experience. in the BostonPublic Schools. Lynda has led the development forCPO Science for the last six years.
EDITORIAL CONSULTANTS
Christine GoldenB.A., Psychology, Gordon College; M.B.A., Rivier CollegeChris has been the project manager for ImperialCommunications since 1999 and in the publishingbusiness for 22 years. She is now managing editor andowner of Big Dog Publishing services. Christine's workcenters around the editing of K-12 textbook material.
REVIEWERS
Nancy JoplinEnglish-language arts department chair Ray Wiltsey Middle School, CA
Jodye Selco Ph.D.Professor, Center for Education and Equity in Math, Science and Technology California State Polytechnic University, Pomona
Brian E. GoodrowPhysical science teacher Apple Valley Middle School, CA
Philip L. HunterScience department chair Johnson Middle School, CA
Bianca N. McRaeScience teacher, Department chair Menifee Valley Middle School, CA
Tia L. ShieldsSeventh grade life science/health and English teacher Language learning teacher Nicolas Junior High School, CA
Kelly McAllisterScience teacherGage Middle School, CA
Brad JoplinEighth grade science teacher Ray Wiltsey Middle School, CA
Tony HeinzmanTeacherApple Valley Middle School, CA
Sylvia GutmanScience teacher, Department head David A Brown Middle School Lake Elsinore Unified School District, CA
ILLUSTRATION/DESIGN
Jesse Van Valkenburgh - Design and IllustrationB.A., Illustration, Rochester Institute of TechnologyJesse has worked in prepress and design responsible forcreative design and prepress film production. Jesse alsoworked at PC Connection as a graphic designer for catalogand direct mailing design, logo design, as well as someillustration work. Polly Crisman -Design and IllustrationB.F.A., University of New HampshireGraphic artist with expertise in advertising and marketingdesign, freelance illustrating, and caricature art. Bruce Holloway - Cover Design and IllustrationPratt Institute, N.Y.; Boston Museum School of Fine ArtsExpertise in product design, advertising, and three-dimensional exhibit design. Commissioned for the NewHampshire Duck Stamp for 1999 and 2003.
EQUIPMENT DESIGN
Thomas Narro - Senior Vice President B.S., Mechanical engineering, Rensselaer Polytechnic InstituteAccomplished design and manufacturing engineer;experienced consultant in corporate reengineering andindustrial-environmental acoustics.
Danielle DzurikB.S., Industrial Design, Auburn University Danielle focuses her efforts in product developmentdeveloping new products and improving upon olderdesigns.
Thomas C. Hsu, Ph.DPh.D. in Applied Plasma Physics from the Massachusetts Institute ofTechnologyHe is a nationally recognized innovator in science andmath education and the founder of CPO Science. Wellknown as a consultant, workshop leader, and developer ofcurriculum and equipment for inquiry-based learning inscience and math.
MATERIAL SUPPORT
Kathryn Gavin - Purchasing and QualityControl ManagerKathryn is responsible for all functions related topurchasing raw materials and quality control of finishedgoods. She works closely with product development anddesign.
Michael Grady - Technical Service Coordinator A.A., Arranging and Performing, Berklee College of Music; MedicalTechnician Diploma, Middlesex Community CollegeMichael has 10 years experience in the related customerservice fields. Michael has a varied personal backgroundand holds an Associates Degree in Arranging andPerforming from the Berklee College of Music and aMedical Technician Diploma from Middlesex CommunityCollege. He works with product development and designto ensure customer quality.
Lisa LaChance - Senior Materials Specialist A.S., Accounting Lisa evaluates material samples to ensure materials meetproject requirements. She develops and manages therelease of materials specifications.
TECHNICAL SUPPORT
Tracy MorrowB.A., English, Texas A&M University; M.A., English, Sam HoustonState University, TXTaught middle school in Klein, Texas, a suburban regionoutside Houston, for nine years; at Tomball College inTomball, Texas, for five years; and worked as a technicalwriter in the oil and gas, airlines, and real estate industries.Tracy offers consulting services and technical training; herexpertise is in the editing program Framemaker.
Table of Contents
1A Observations . . . . . . . . . . . . . . . . . . . . . . . . . . . . . . . . . . . . . . . . . . . . . . . . . . . . . . . . 1
1B Question and Hypothesis. . . . . . . . . . . . . . . . . . . . . . . . . . . . . . . . . . . . . . . . . . . . . . . 5
2A Variables and Collecting Data . . . . . . . . . . . . . . . . . . . . . . . . . . . . . . . . . . . . . . . . . . 11
2B Designing an Experiment. . . . . . . . . . . . . . . . . . . . . . . . . . . . . . . . . . . . . . . . . . . . . . 15
3A Time and Tree Rings . . . . . . . . . . . . . . . . . . . . . . . . . . . . . . . . . . . . . . . . . . . . . . . . . 18
3B Topographic Mapping . . . . . . . . . . . . . . . . . . . . . . . . . . . . . . . . . . . . . . . . . . . . . . . . 23
4A Conduction in the Atmosphere . . . . . . . . . . . . . . . . . . . . . . . . . . . . . . . . . . . . . . . . . 26
4B Convection in Earth’s Atmosphere . . . . . . . . . . . . . . . . . . . . . . . . . . . . . . . . . . . . . . 29
5A Density. . . . . . . . . . . . . . . . . . . . . . . . . . . . . . . . . . . . . . . . . . . . . . . . . . . . . . . . . . . . 32
5B Buoyancy . . . . . . . . . . . . . . . . . . . . . . . . . . . . . . . . . . . . . . . . . . . . . . . . . . . . . . . . . . 35
6A Earth’s Seasons. . . . . . . . . . . . . . . . . . . . . . . . . . . . . . . . . . . . . . . . . . . . . . . . . . . . . 37
6B Heating Land and Water . . . . . . . . . . . . . . . . . . . . . . . . . . . . . . . . . . . . . . . . . . . . . . 42
7A All Cracked Up. . . . . . . . . . . . . . . . . . . . . . . . . . . . . . . . . . . . . . . . . . . . . . . . . . . . . . 44
7B Plate Tectonics . . . . . . . . . . . . . . . . . . . . . . . . . . . . . . . . . . . . . . . . . . . . . . . . . . . . . 46
8A Introduction to Metamorphic Rocks . . . . . . . . . . . . . . . . . . . . . . . . . . . . . . . . . . . . . . 51
8B Formation of Metamorphic Rocks . . . . . . . . . . . . . . . . . . . . . . . . . . . . . . . . . . . . . . . 54
9A Earthquakes. . . . . . . . . . . . . . . . . . . . . . . . . . . . . . . . . . . . . . . . . . . . . . . . . . . . . . . . 56
9B Earthquake Waves and Epicenter . . . . . . . . . . . . . . . . . . . . . . . . . . . . . . . . . . . . . . . 62
10A Volcanoes . . . . . . . . . . . . . . . . . . . . . . . . . . . . . . . . . . . . . . . . . . . . . . . . . . . . . . . . . 65
10B Igneous Rocks . . . . . . . . . . . . . . . . . . . . . . . . . . . . . . . . . . . . . . . . . . . . . . . . . . . . . . 68
11A Water Systems . . . . . . . . . . . . . . . . . . . . . . . . . . . . . . . . . . . . . . . . . . . . . . . . . . . . . 72
11B Sedimentary Rocks . . . . . . . . . . . . . . . . . . . . . . . . . . . . . . . . . . . . . . . . . . . . . . . . . . 77
12A Waves . . . . . . . . . . . . . . . . . . . . . . . . . . . . . . . . . . . . . . . . . . . . . . . . . . . . . . . . . . . . 80
12B Wave Speed . . . . . . . . . . . . . . . . . . . . . . . . . . . . . . . . . . . . . . . . . . . . . . . . . . . . . . . 82
13A Floods and Wetlands . . . . . . . . . . . . . . . . . . . . . . . . . . . . . . . . . . . . . . . . . . . . . . . . . 84
13B Wildfires . . . . . . . . . . . . . . . . . . . . . . . . . . . . . . . . . . . . . . . . . . . . . . . . . . . . . . . . . . . 87
14A Non-Renewable Resources. . . . . . . . . . . . . . . . . . . . . . . . . . . . . . . . . . . . . . . . . . . . 90
14B Renewable Resources. . . . . . . . . . . . . . . . . . . . . . . . . . . . . . . . . . . . . . . . . . . . . . . . 93
15A Food Webs, A Delicate Balance! . . . . . . . . . . . . . . . . . . . . . . . . . . . . . . . . . . . . . . . .96
15B Water Quality and Ecosystems . . . . . . . . . . . . . . . . . . . . . . . . . . . . . . . . . . . . . . . . .98
16A Environments Around School . . . . . . . . . . . . . . . . . . . . . . . . . . . . . . . . . . . . . . . . . .100
16B Weather and Climate . . . . . . . . . . . . . . . . . . . . . . . . . . . . . . . . . . . . . . . . . . . . . . . .104
Lab Skills and Equipment SetupsSafety Skills . . . . . . . . . . . . . . . . . . . . . . . . . . . . . . . . . . . . . . . . . . . . . . . . . . . . . . . . . . . 108
Writing a Lab Report . . . . . . . . . . . . . . . . . . . . . . . . . . . . . . . . . . . . . . . . . . . . . . . . . . . . 114
Measuring Length . . . . . . . . . . . . . . . . . . . . . . . . . . . . . . . . . . . . . . . . . . . . . . . . . . . . . . 117
Measuring Temperature . . . . . . . . . . . . . . . . . . . . . . . . . . . . . . . . . . . . . . . . . . . . . . . . . . 121
Calculating Volume . . . . . . . . . . . . . . . . . . . . . . . . . . . . . . . . . . . . . . . . . . . . . . . . . . . . . 123
Measuring Volume . . . . . . . . . . . . . . . . . . . . . . . . . . . . . . . . . . . . . . . . . . . . . . . . . . . . . . 127
Measuring Mass with a Triple Beam Balance . . . . . . . . . . . . . . . . . . . . . . . . . . . . . . . . . 128
Recording Observations in the Lab . . . . . . . . . . . . . . . . . . . . . . . . . . . . . . . . . . . . . . . . . 131
Physics Stand . . . . . . . . . . . . . . . . . . . . . . . . . . . . . . . . . . . . . . . . . . . . . . . . . . . . . . . . . 135
Car and Ramp . . . . . . . . . . . . . . . . . . . . . . . . . . . . . . . . . . . . . . . . . . . . . . . . . . . . . . . . . 137
Stream Table . . . . . . . . . . . . . . . . . . . . . . . . . . . . . . . . . . . . . . . . . . . . . . . . . . . . . . . . . . 139
Projects and AppendicesResponding to Natural Disasters . . . . . . . . . . . . . . . . . . . . . . . . . . 140
Keeping a Weather Log . . . . . . . . . . . . . . . . . . . . . . . . . . . . . . . . . . 142
Water Quality Testing. . . . . . . . . . . . . . . . . . . . . . . . . . . . . . . . . . . 144
Earth’s Interior . . . . . . . . . . . . . . . . . . . . . . . . . . . . . . . . . . . . . . . . 146
Metric Ruler . . . . . . . . . . . . . . . . . . . . . . . . . . . . . . . . . . . . . . . . . . . 147
Investigation 1A Observations
1A ObservationsDoes a car rolling down a hill speed up?
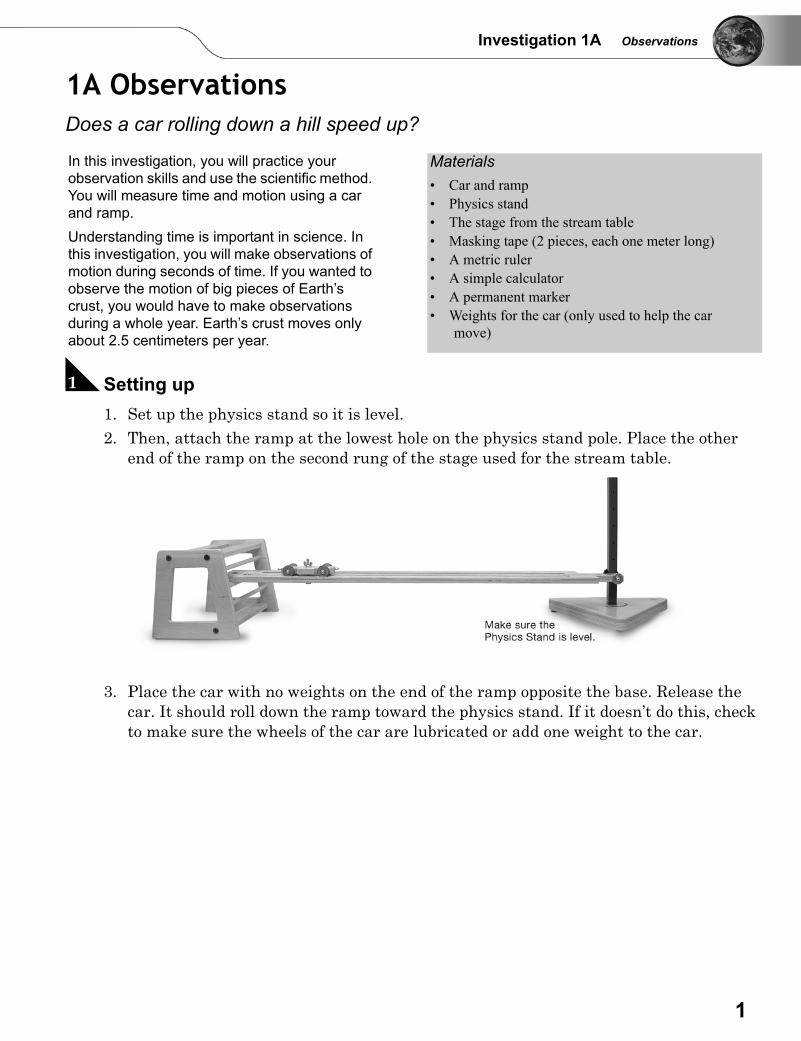
A Setting up1. Set up the physics stand so it is level.2. Then, attach the ramp at the lowest hole on the physics stand pole. Place the other
end of the ramp on the second rung of the stage used for the stream table.
3. Place the car with no weights on the end of the ramp opposite the base. Release the car. It should roll down the ramp toward the physics stand. If it doesn’t do this, check to make sure the wheels of the car are lubricated or add one weight to the car.
In this investigation, you will practice your observation skills and use the scientific method. You will measure time and motion using a car and ramp.Understanding time is important in science. In this investigation, you will make observations of motion during seconds of time. If you wanted to observe the motion of big pieces of Earth’s crust, you would have to make observations during a whole year. Earth’s crust moves only about 2.5 centimeters per year.
Materials• Car and ramp• Physics stand• The stage from the stream table• Masking tape (2 pieces, each one meter long)• A metric ruler• A simple calculator• A permanent marker• Weights for the car (only used to help the car
move)
1
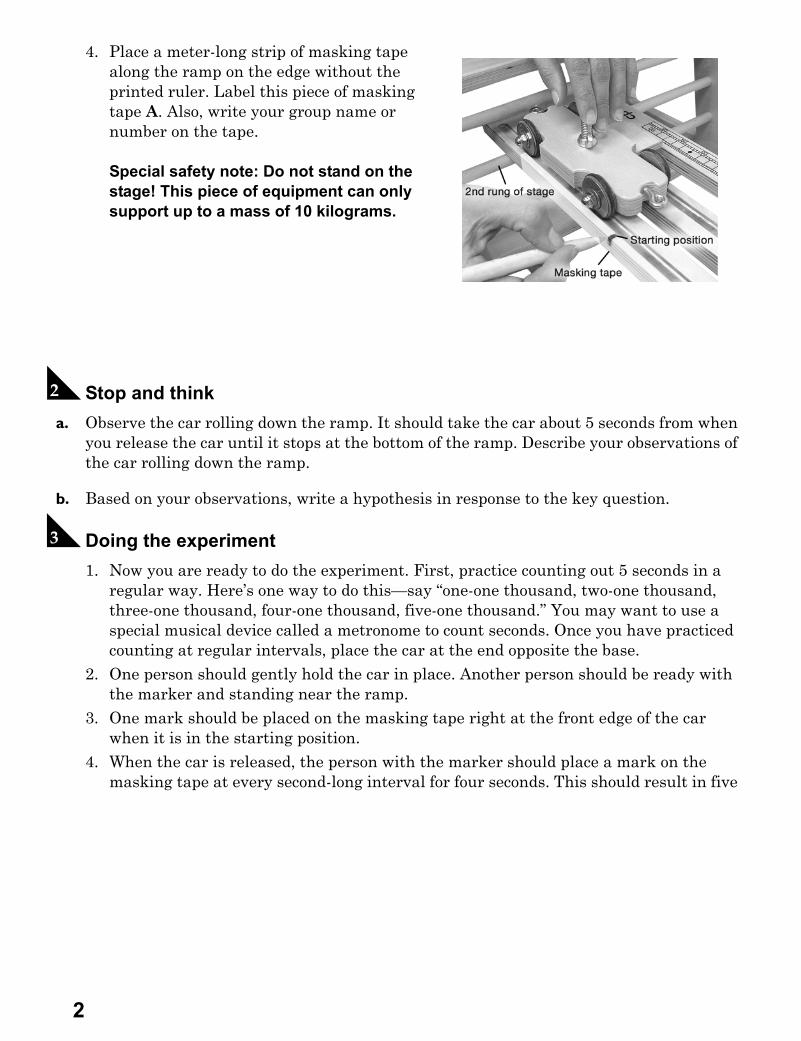
4. Place a meter-long strip of masking tape along the ramp on the edge without the printed ruler. Label this piece of masking tape A. Also, write your group name or number on the tape.
Special safety note: Do not stand on the stage! This piece of equipment can only support up to a mass of 10 kilograms.
B Stop and think a. Observe the car rolling down the ramp. It should take the car about 5 seconds from when
you release the car until it stops at the bottom of the ramp. Describe your observations of the car rolling down the ramp.
b. Based on your observations, write a hypothesis in response to the key question.
C Doing the experiment1. Now you are ready to do the experiment. First, practice counting out 5 seconds in a
regular way. Here’s one way to do this—say “one-one thousand, two-one thousand, three-one thousand, four-one thousand, five-one thousand.” You may want to use a special musical device called a metronome to count seconds. Once you have practiced counting at regular intervals, place the car at the end opposite the base.
2. One person should gently hold the car in place. Another person should be ready with the marker and standing near the ramp.
3. One mark should be placed on the masking tape right at the front edge of the car when it is in the starting position.
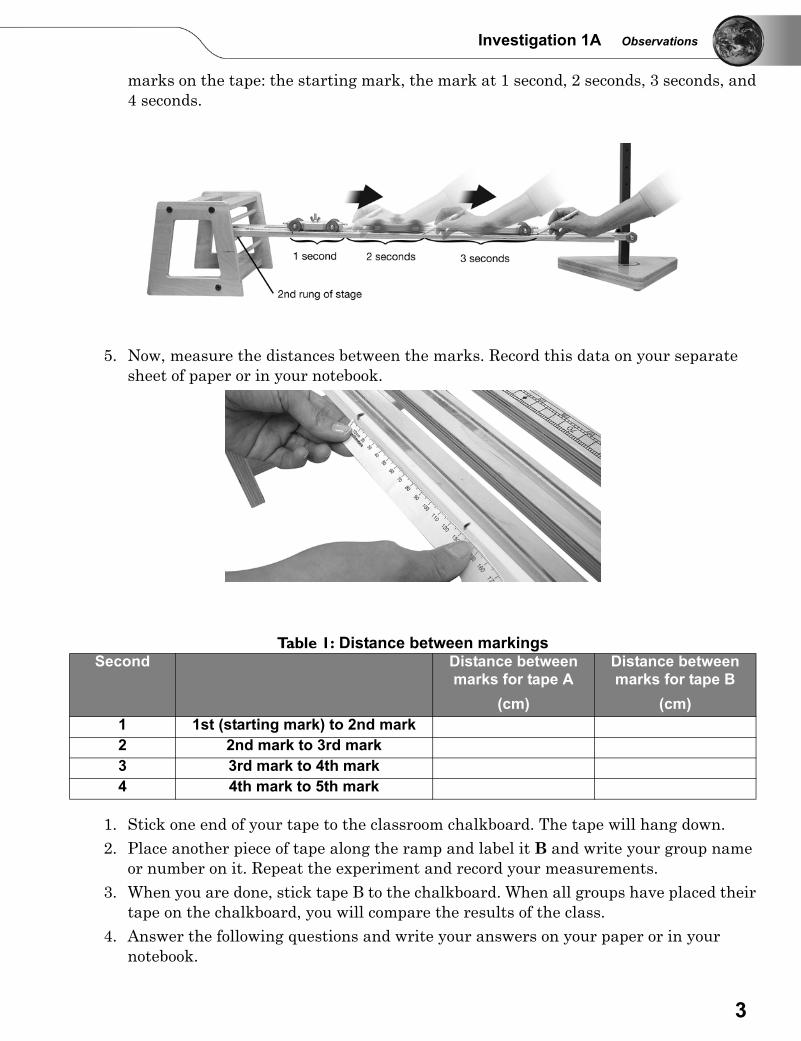
4. When the car is released, the person with the marker should place a mark on the masking tape at every second-long interval for four seconds. This should result in five
2
Investigation 1A Observations
marks on the tape: the starting mark, the mark at 1 second, 2 seconds, 3 seconds, and 4 seconds.
5. Now, measure the distances between the marks. Record this data on your separate sheet of paper or in your notebook.
1. Stick one end of your tape to the classroom chalkboard. The tape will hang down.2. Place another piece of tape along the ramp and label it B and write your group name
or number on it. Repeat the experiment and record your measurements.3. When you are done, stick tape B to the chalkboard. When all groups have placed their
tape on the chalkboard, you will compare the results of the class.4. Answer the following questions and write your answers on your paper or in your
notebook.
Table 1: Distance between markingsSecond Distance between
marks for tape A(cm)
Distance between marks for tape B
(cm)1 1st (starting mark) to 2nd mark2 2nd mark to 3rd mark3 3rd mark to 4th mark4 4th mark to 5th mark
3
D Analyzing your resultsBased on looking at the tapes that are stuck to the chalk board:
a. What happens to the distance between the marks from the start to the end of the ramp? Explain what you observe.
b. Look at the group tape pieces on the chalkboard. Are they all similar or different?
c. Was your hypothesis correct? How do you know?
d. Do the results of the other lab groups support your hypothesis?
e. Make a list of observations you made during the investigation about the motion of the car on the ramp.
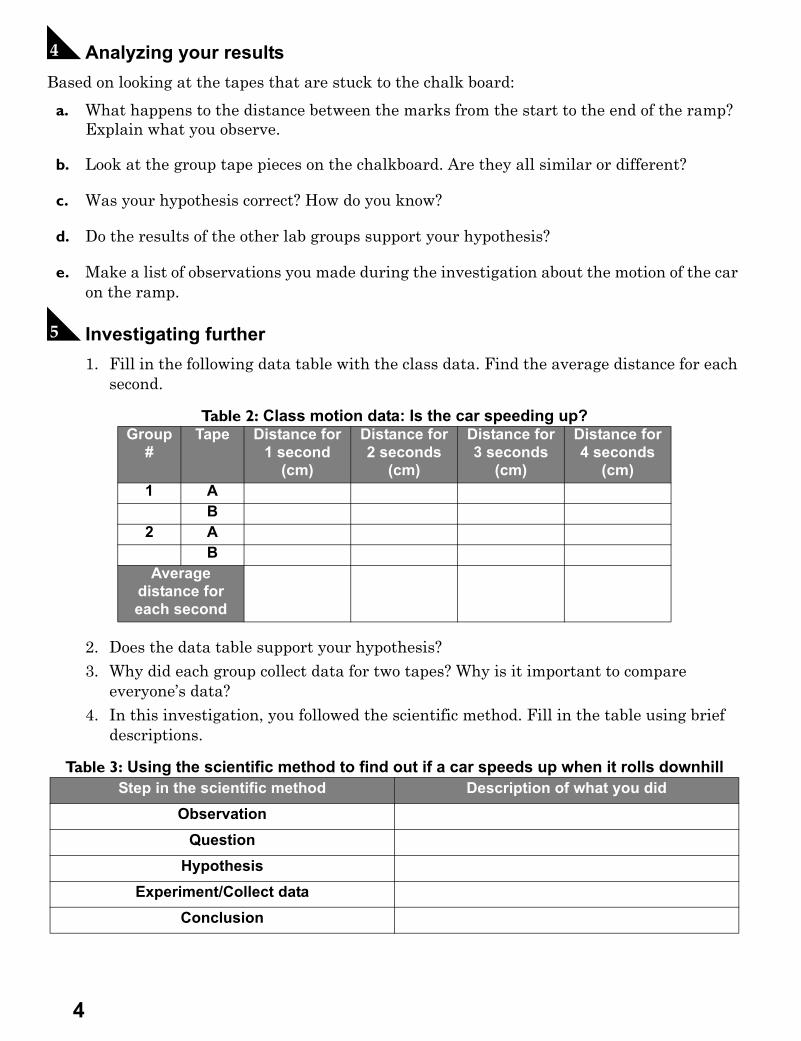
E Investigating further1. Fill in the following data table with the class data. Find the average distance for each
second.
2. Does the data table support your hypothesis?3. Why did each group collect data for two tapes? Why is it important to compare
everyone’s data?4. In this investigation, you followed the scientific method. Fill in the table using brief
descriptions.
Table 2: Class motion data: Is the car speeding up?Group
#Tape Distance for
1 second (cm)
Distance for 2 seconds
(cm)
Distance for 3 seconds
(cm)
Distance for 4 seconds
(cm)1 A
B2 A
BAverage
distance for each second
Table 3: Using the scientific method to find out if a car speeds up when it rolls downhillStep in the scientific method Description of what you did
ObservationQuestion
HypothesisExperiment/Collect data
Conclusion
4
Investigation 1B Question and Hypothesis
1B Question and HypothesisHow much does the car speed up as it rolls down a ramp?
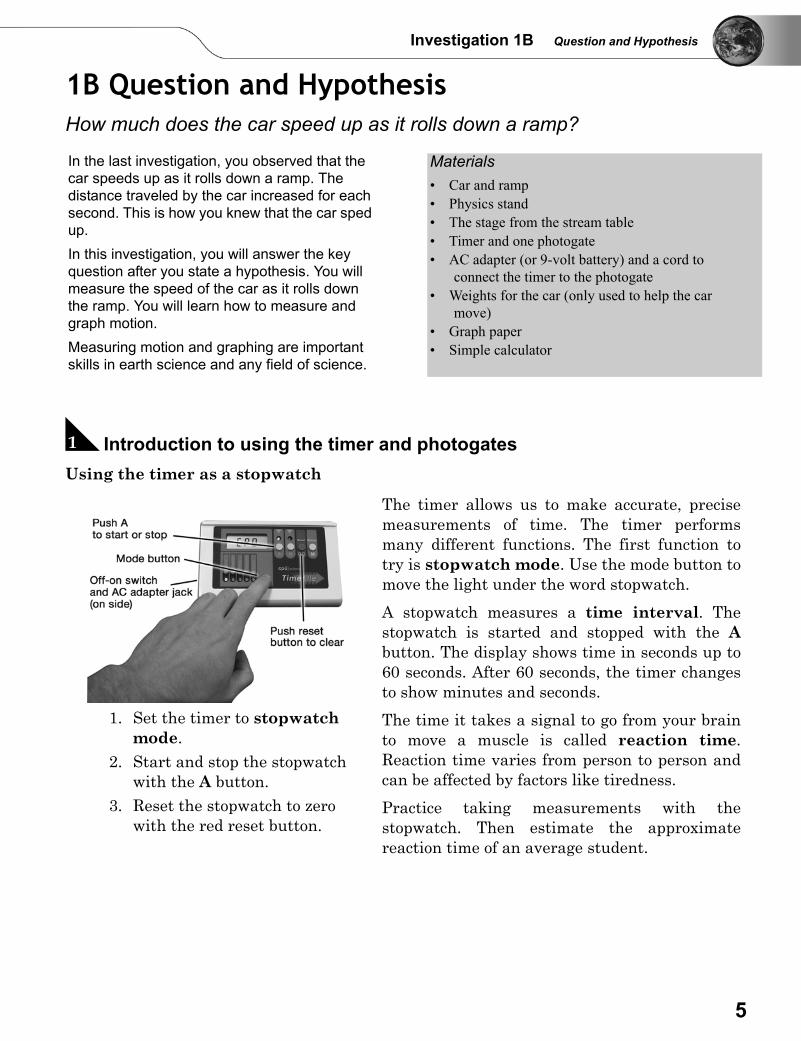
A Introduction to using the timer and photogatesUsing the timer as a stopwatch
In the last investigation, you observed that the car speeds up as it rolls down a ramp. The distance traveled by the car increased for each second. This is how you knew that the car sped up.In this investigation, you will answer the key question after you state a hypothesis. You will measure the speed of the car as it rolls down the ramp. You will learn how to measure and graph motion.Measuring motion and graphing are important skills in earth science and any field of science.
Materials• Car and ramp• Physics stand• The stage from the stream table• Timer and one photogate• AC adapter (or 9-volt battery) and a cord to
connect the timer to the photogate• Weights for the car (only used to help the car
move)• Graph paper• Simple calculator
1. Set the timer to stopwatch mode.
2. Start and stop the stopwatch with the A button.
3. Reset the stopwatch to zero with the red reset button.
The timer allows us to make accurate, precisemeasurements of time. The timer performsmany different functions. The first function totry is stopwatch mode. Use the mode button tomove the light under the word stopwatch.
A stopwatch measures a time interval. Thestopwatch is started and stopped with the Abutton. The display shows time in seconds up to60 seconds. After 60 seconds, the timer changesto show minutes and seconds.
The time it takes a signal to go from your brainto move a muscle is called reaction time.Reaction time varies from person to person andcan be affected by factors like tiredness.
Practice taking measurements with thestopwatch. Then estimate the approximatereaction time of an average student.
5
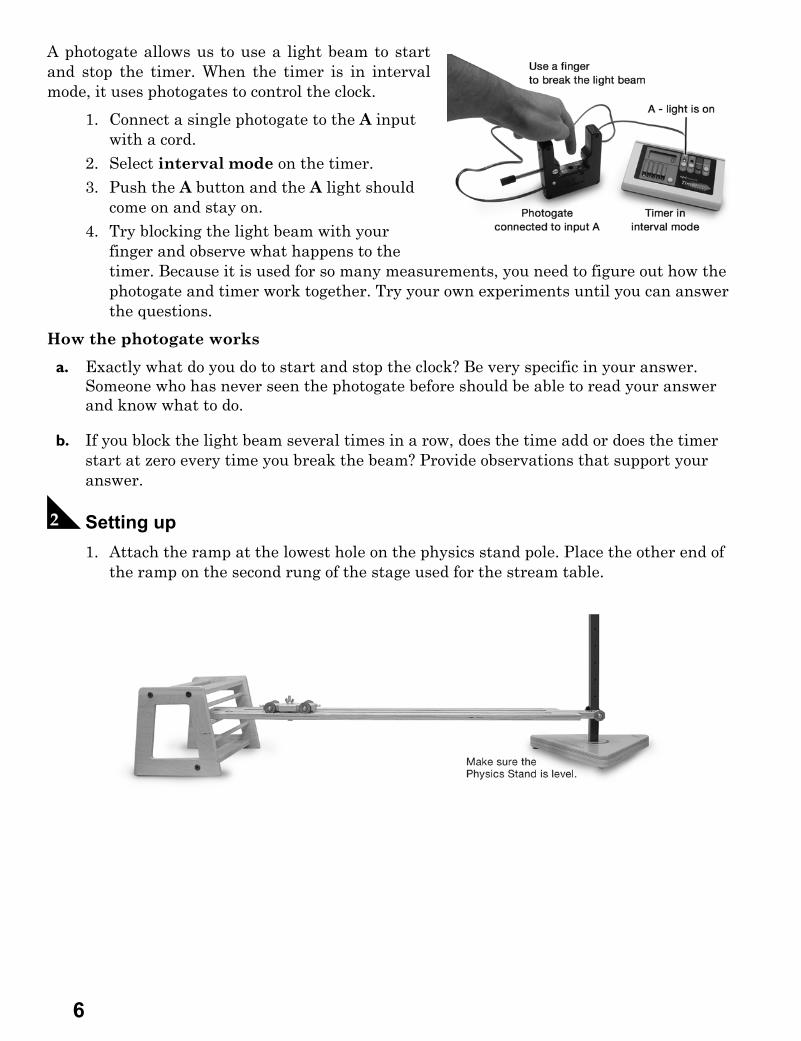
A photogate allows us to use a light beam to startand stop the timer. When the timer is in intervalmode, it uses photogates to control the clock.
1. Connect a single photogate to the A input with a cord.
2. Select interval mode on the timer.3. Push the A button and the A light should
come on and stay on.4. Try blocking the light beam with your
finger and observe what happens to the timer. Because it is used for so many measurements, you need to figure out how the photogate and timer work together. Try your own experiments until you can answer the questions.
How the photogate works
a. Exactly what do you do to start and stop the clock? Be very specific in your answer. Someone who has never seen the photogate before should be able to read your answer and know what to do.
b. If you block the light beam several times in a row, does the time add or does the timer start at zero every time you break the beam? Provide observations that support your answer.
B Setting up1. Attach the ramp at the lowest hole on the physics stand pole. Place the other end of
the ramp on the second rung of the stage used for the stream table.
6
Investigation 1B Question and Hypothesis
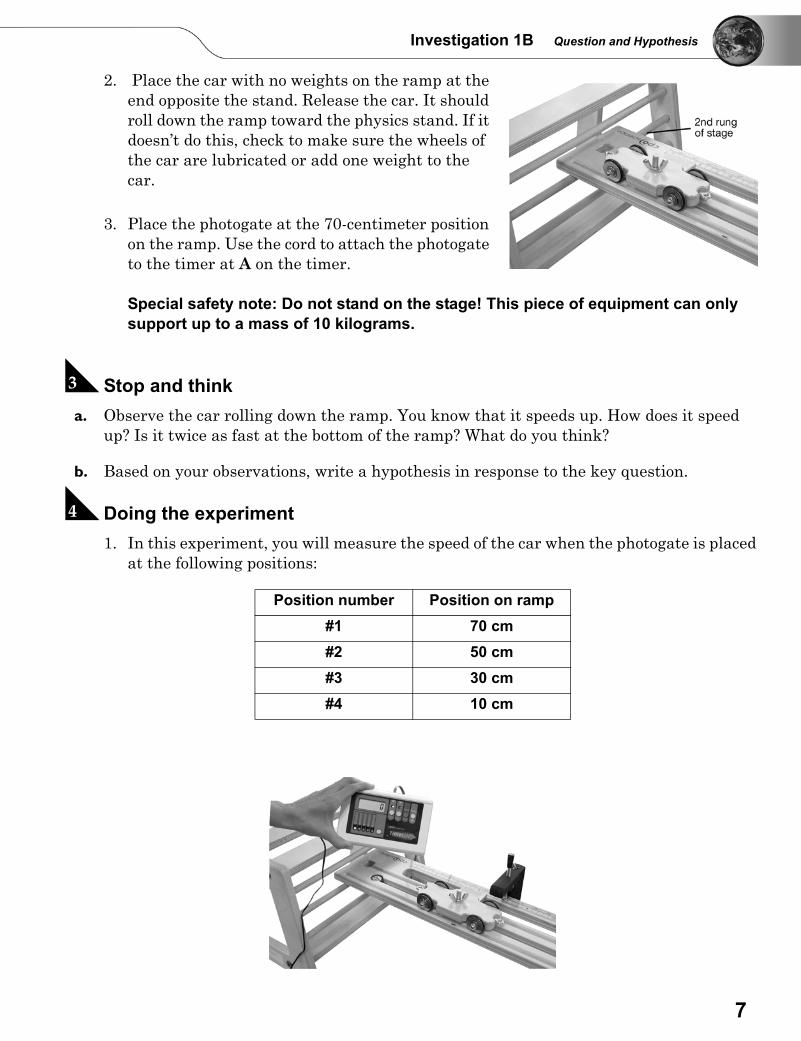
2. Place the car with no weights on the ramp at the end opposite the stand. Release the car. It should roll down the ramp toward the physics stand. If it doesn’t do this, check to make sure the wheels of the car are lubricated or add one weight to the car.
3. Place the photogate at the 70-centimeter position on the ramp. Use the cord to attach the photogate to the timer at A on the timer.
Special safety note: Do not stand on the stage! This piece of equipment can only support up to a mass of 10 kilograms.
C Stop and think a. Observe the car rolling down the ramp. You know that it speeds up. How does it speed
up? Is it twice as fast at the bottom of the ramp? What do you think?
b. Based on your observations, write a hypothesis in response to the key question.
D Doing the experiment1. In this experiment, you will measure the speed of the car when the photogate is placed
at the following positions:
Position number Position on ramp#1 70 cm#2 50 cm#3 30 cm#4 10 cm
7
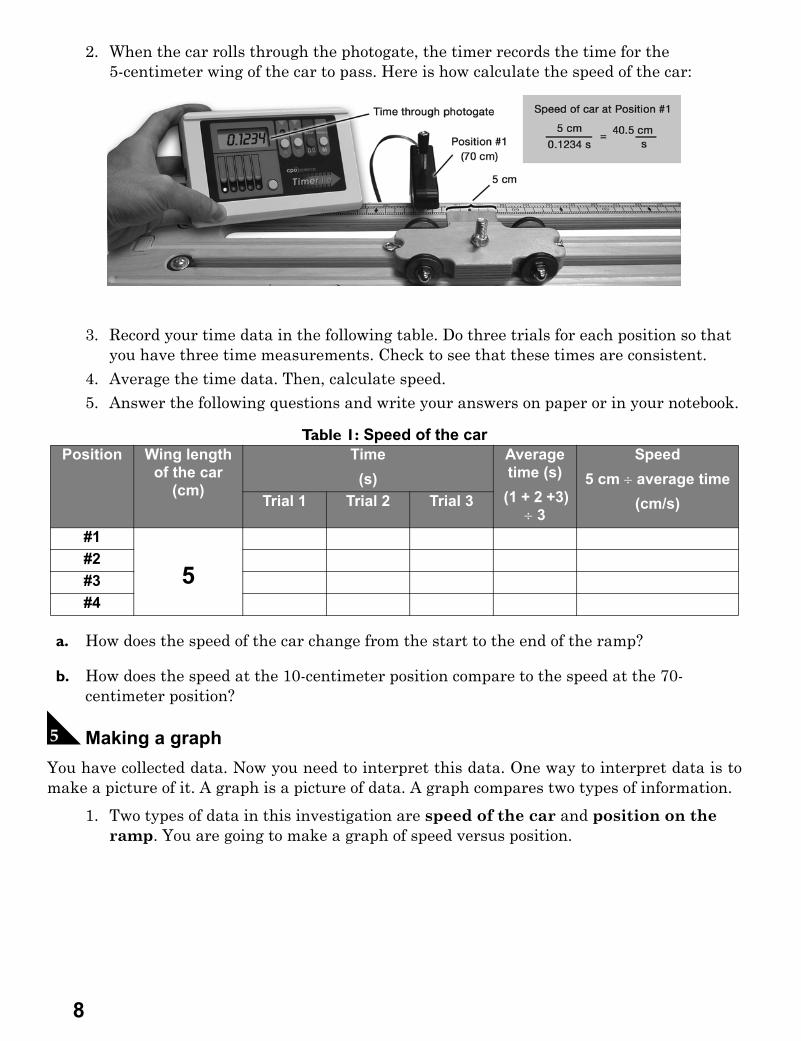
2. When the car rolls through the photogate, the timer records the time for the5-centimeter wing of the car to pass. Here is how calculate the speed of the car:
3. Record your time data in the following table. Do three trials for each position so that you have three time measurements. Check to see that these times are consistent.
4. Average the time data. Then, calculate speed.5. Answer the following questions and write your answers on paper or in your notebook.
a. How does the speed of the car change from the start to the end of the ramp?
b. How does the speed at the 10-centimeter position compare to the speed at the 70-centimeter position?
E Making a graphYou have collected data. Now you need to interpret this data. One way to interpret data is tomake a picture of it. A graph is a picture of data. A graph compares two types of information.
1. Two types of data in this investigation are speed of the car and position on the ramp. You are going to make a graph of speed versus position.
Table 1: Speed of the carPosition Wing length
of the car (cm)
Time(s)
Average time (s)
(1 + 2 +3) ÷ 3
Speed5 cm ÷ average time
(cm/s)Trial 1 Trial 2 Trial 3
#1
5#2#3#4
8
Investigation 1B Question and Hypothesis
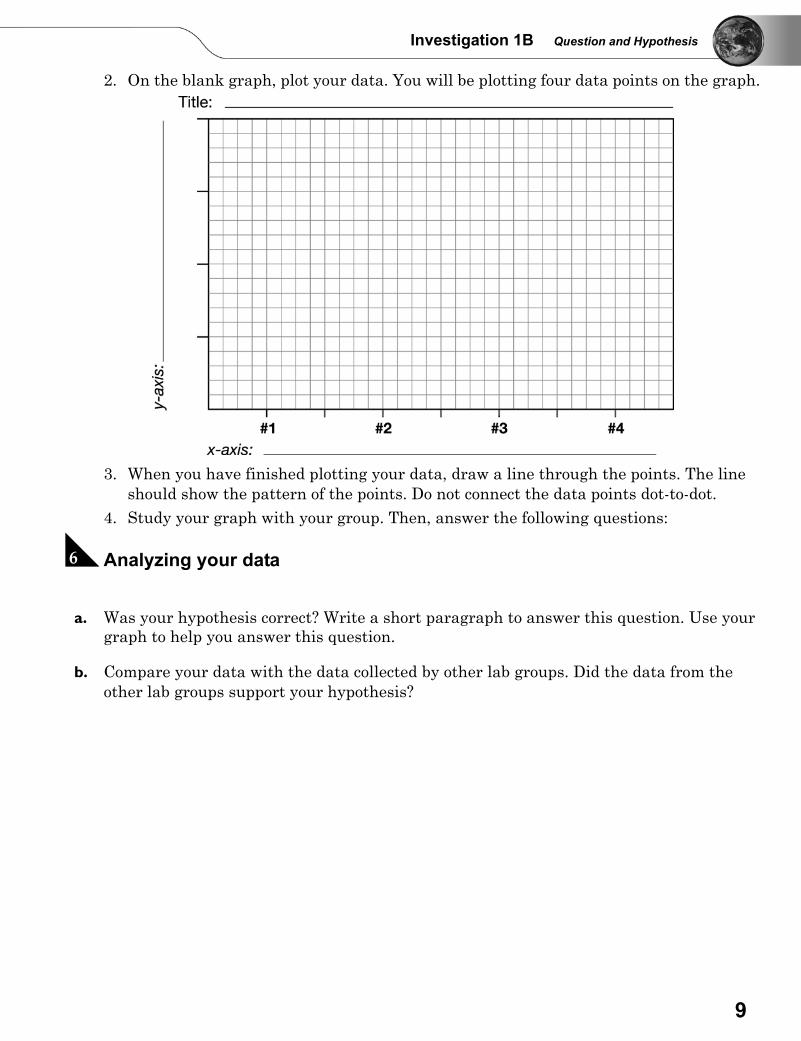
2. On the blank graph, plot your data. You will be plotting four data points on the graph.
3. When you have finished plotting your data, draw a line through the points. The line should show the pattern of the points. Do not connect the data points dot-to-dot.
4. Study your graph with your group. Then, answer the following questions:
F Analyzing your data
a. Was your hypothesis correct? Write a short paragraph to answer this question. Use your graph to help you answer this question.
b. Compare your data with the data collected by other lab groups. Did the data from the other lab groups support your hypothesis?
9
G Exploring on your ownYou have just gotten started in doing scientific experiments. Below are some tasks to practiceyour new skills! You may need your teacher to help you get started on these tasks.
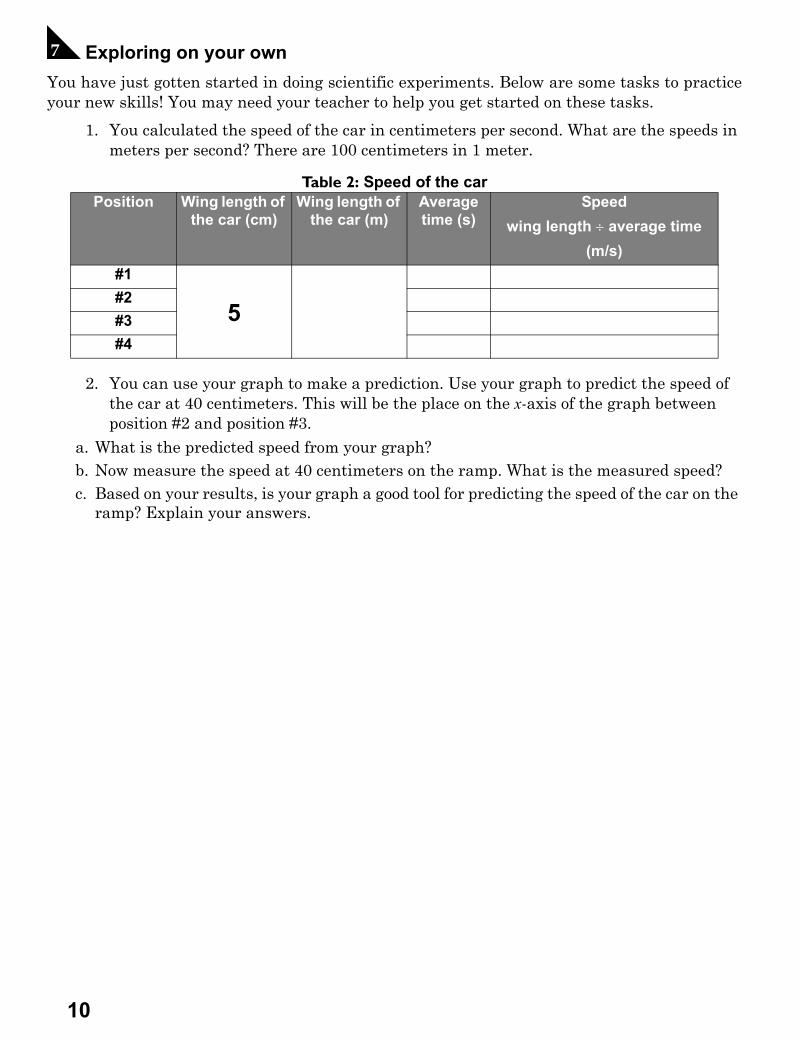
1. You calculated the speed of the car in centimeters per second. What are the speeds in meters per second? There are 100 centimeters in 1 meter.
2. You can use your graph to make a prediction. Use your graph to predict the speed of the car at 40 centimeters. This will be the place on the x-axis of the graph between position #2 and position #3.
a. What is the predicted speed from your graph? b. Now measure the speed at 40 centimeters on the ramp. What is the measured speed? c. Based on your results, is your graph a good tool for predicting the speed of the car on the
ramp? Explain your answers.
Table 2: Speed of the carPosition Wing length of
the car (cm)Wing length of
the car (m)Average time (s)
Speedwing length ÷ average time
(m/s)#1
5#2#3#4
10
Investigation 2A Variables and Collecting Data
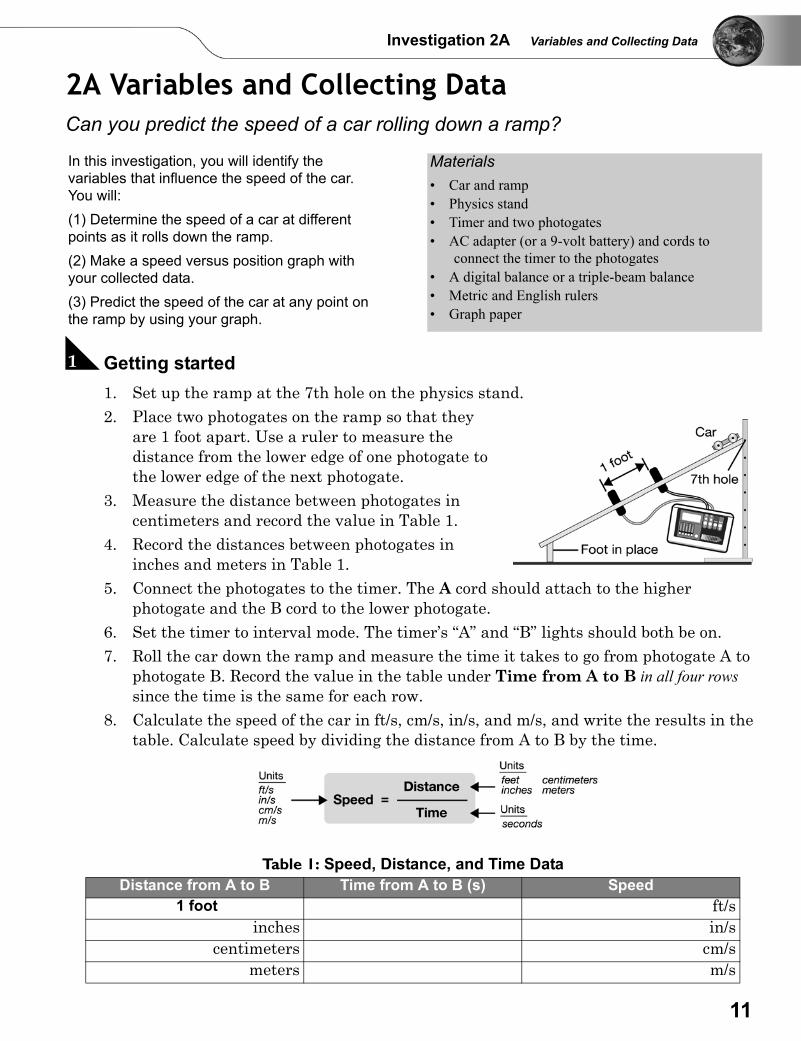
2A Variables and Collecting DataCan you predict the speed of a car rolling down a ramp?
A Getting started1. Set up the ramp at the 7th hole on the physics stand.2. Place two photogates on the ramp so that they
are 1 foot apart. Use a ruler to measure the distance from the lower edge of one photogate to the lower edge of the next photogate.
3. Measure the distance between photogates in centimeters and record the value in Table 1.
4. Record the distances between photogates in inches and meters in Table 1.
5. Connect the photogates to the timer. The A cord should attach to the higher photogate and the B cord to the lower photogate.
6. Set the timer to interval mode. The timer’s “A” and “B” lights should both be on.7. Roll the car down the ramp and measure the time it takes to go from photogate A to
photogate B. Record the value in the table under Time from A to B in all four rows since the time is the same for each row.
8. Calculate the speed of the car in ft/s, cm/s, in/s, and m/s, and write the results in the table. Calculate speed by dividing the distance from A to B by the time.
.
In this investigation, you will identify the variables that influence the speed of the car. You will: (1) Determine the speed of a car at different points as it rolls down the ramp.(2) Make a speed versus position graph with your collected data.(3) Predict the speed of the car at any point on the ramp by using your graph.
Materials• Car and ramp• Physics stand• Timer and two photogates• AC adapter (or a 9-volt battery) and cords to
connect the timer to the photogates• A digital balance or a triple-beam balance• Metric and English rulers• Graph paper
Table 1: Speed, Distance, and Time DataDistance from A to B Time from A to B (s) Speed
1 foot ft/sinches in/s
centimeters cm/smeters m/s
11
Answer the following questions about the data in Table 1.
a. Which is the fastest speed or are the values all the same speed? Explain your answer.
b. Challenge: Could a speed of 254 and a speed of 100 be the same? (Hint: One inch equals 2.54 centimeters). Explain your answer. State why units are important.
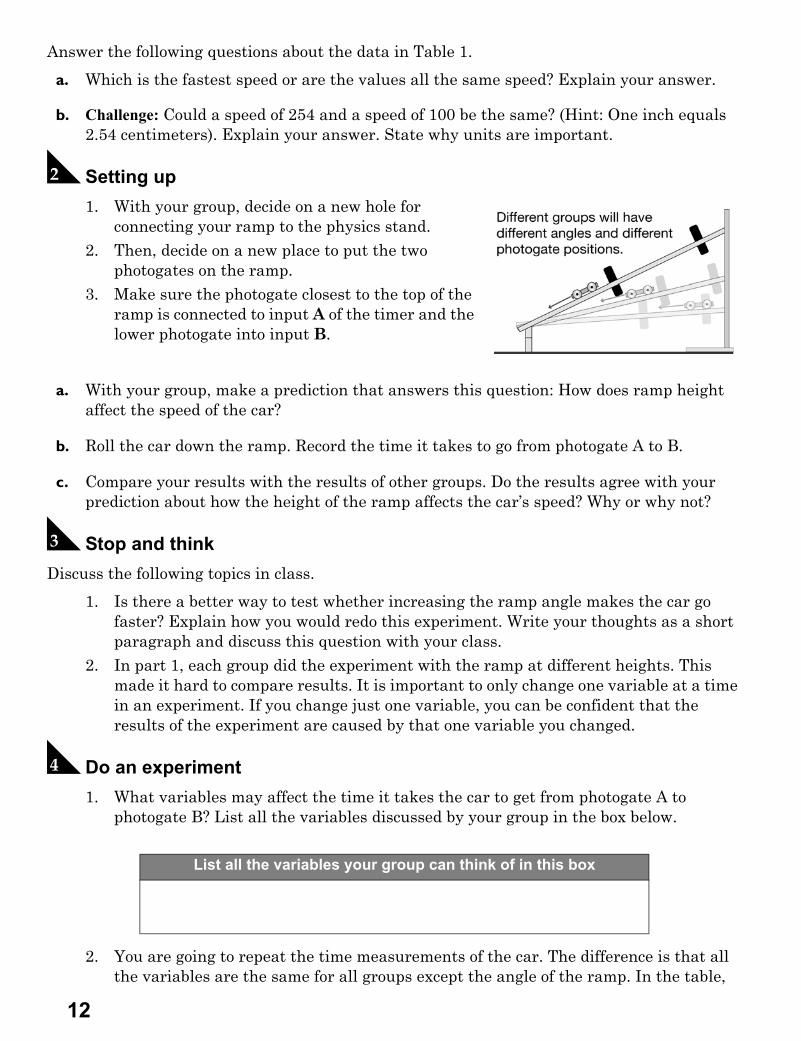
B Setting up1. With your group, decide on a new hole for
connecting your ramp to the physics stand. 2. Then, decide on a new place to put the two
photogates on the ramp.3. Make sure the photogate closest to the top of the
ramp is connected to input A of the timer and the lower photogate into input B.
a. With your group, make a prediction that answers this question: How does ramp height affect the speed of the car?
b. Roll the car down the ramp. Record the time it takes to go from photogate A to B.
c. Compare your results with the results of other groups. Do the results agree with your prediction about how the height of the ramp affects the car’s speed? Why or why not?
C Stop and thinkDiscuss the following topics in class.
1. Is there a better way to test whether increasing the ramp angle makes the car go faster? Explain how you would redo this experiment. Write your thoughts as a short paragraph and discuss this question with your class.
2. In part 1, each group did the experiment with the ramp at different heights. This made it hard to compare results. It is important to only change one variable at a time in an experiment. If you change just one variable, you can be confident that the results of the experiment are caused by that one variable you changed.
D Do an experiment1. What variables may affect the time it takes the car to get from photogate A to
photogate B? List all the variables discussed by your group in the box below..
2. You are going to repeat the time measurements of the car. The difference is that all the variables are the same for all groups except the angle of the ramp. In the table,
List all the variables your group can think of in this box
12
Investigation 2A Variables and Collecting Data
record the names of the variables you wrote in the box above. Write the values for these variables. You will have to decide as a group or class on what the values will be. In the last column answer the question: Is the variable the same or different for each group?
Table 2: Variables and values for a controlled experiment
3. Develop a technique for rolling the car down the ramp. Do not push the car. You want to complete at least three trials that are within 0.0005 seconds of one another.
4. Using your new technique and setup, record the time it takes the car to travel from photogate A to photogate B.
Once you have your new results, compare them with the results of the other groups.
a. Did your times agree with your hypothesis/prediction in 1a?
b. In one or two sentences describe why this experiment was different from what you did in part 1. Be sure to explain what you did differently in this experiment and why.
E Do another experimentTo understand how the speed of the car changes as it moves, you need to measure the speedwith one photogate. The ramp and car are designed so the light beam is broken by the5-centimeter wing of the car. The speed of the car is 5 centimeters (distance traveled) dividedby the time it takes to pass through the light beam (time taken).
1. Select between five and ten locations along the ramp to measure the speed of the car. The places should be at regular intervals such as every 10.0 centimeters.
2. At each location record the position of the photogate and the time through the light beam. The distance traveled is the same for every position since it is the wing length.
3. Calculate the speed of the car using the wing length (5 cm) and the time measurement. Record this value in Table 3.
.
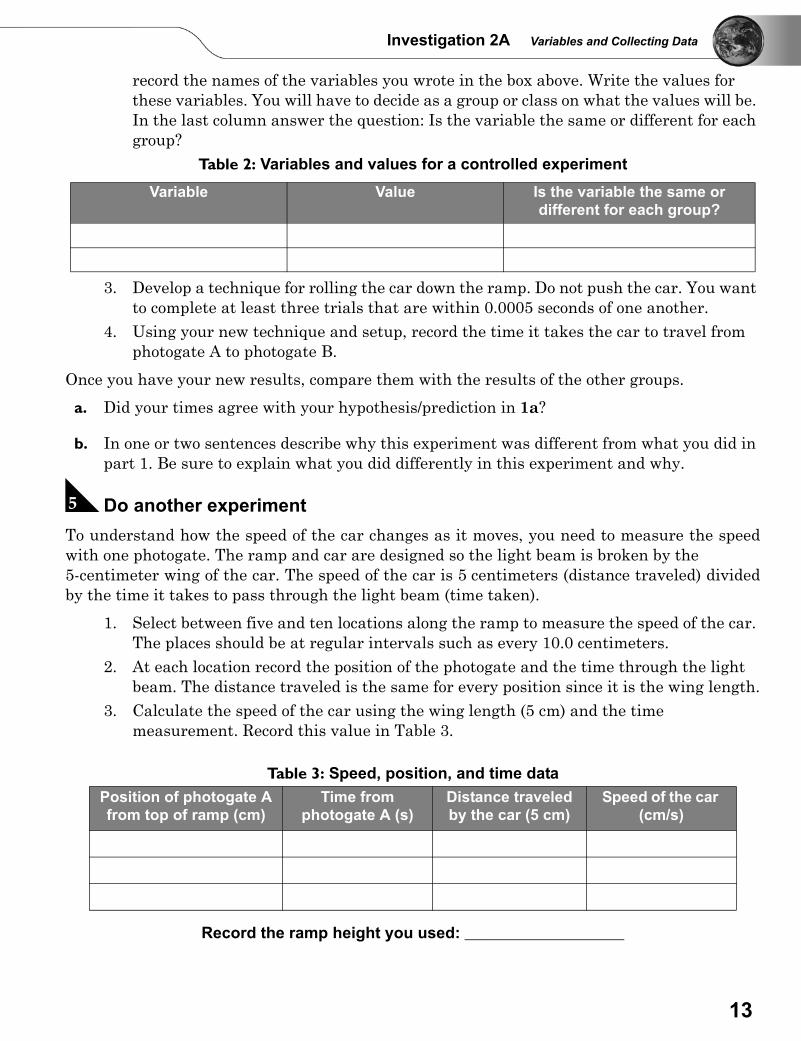
Record the ramp height you used: ____________________
Variable Value Is the variable the same or different for each group?
Table 3: Speed, position, and time dataPosition of photogate A from top of ramp (cm)
Time from photogate A (s)
Distance traveled by the car (5 cm)
Speed of the car (cm/s)
13
F Graphing and analyzing the results a. Does the speed of the car change as it moves down the ramp? If so, how does it change?
b. Graph the speed of the car versus its position. Place speed of the car on the y-axis and position of photogate A on the x-axis. Add labels to each axis and title the graph.
c. What does the graph show about the speed of the car?
G Investigating further1. Choose a spot on the ramp where you did not measure the speed of the car.2. Use your graph to find the predicted speed of the car at that position. Record your
predicted speed.3. Use the speed formula to calculate the time it should take the car to pass through the
light beam at the predicted speed. For example, if the car were going 100 centimeters per second, it would take 0.05 seconds to pass through the beam (5 cm ÷ 100 cm/s = 0.050 s).
4. Place the photogate at the spot on the ramp you chose in step 1 and record the time it takes for the car to pass through the photogate.
a. How does the predicted time compare with the actual measured time?
b. Challenge question: Calculating percent error:Find the difference between the predicted time and the actual measured time.
Take this difference and divide it by the predicted speed and then multiply by 100.
Use the percent error to calculate percent correct.
Predicted time Actual time– Difference=
Difference Predicted time÷( ) 100× Percent error=
100 Percent error– Percent correct=
14
Investigation 2B Designing an Experiment
2B Designing an ExperimentHow is height related to energy?
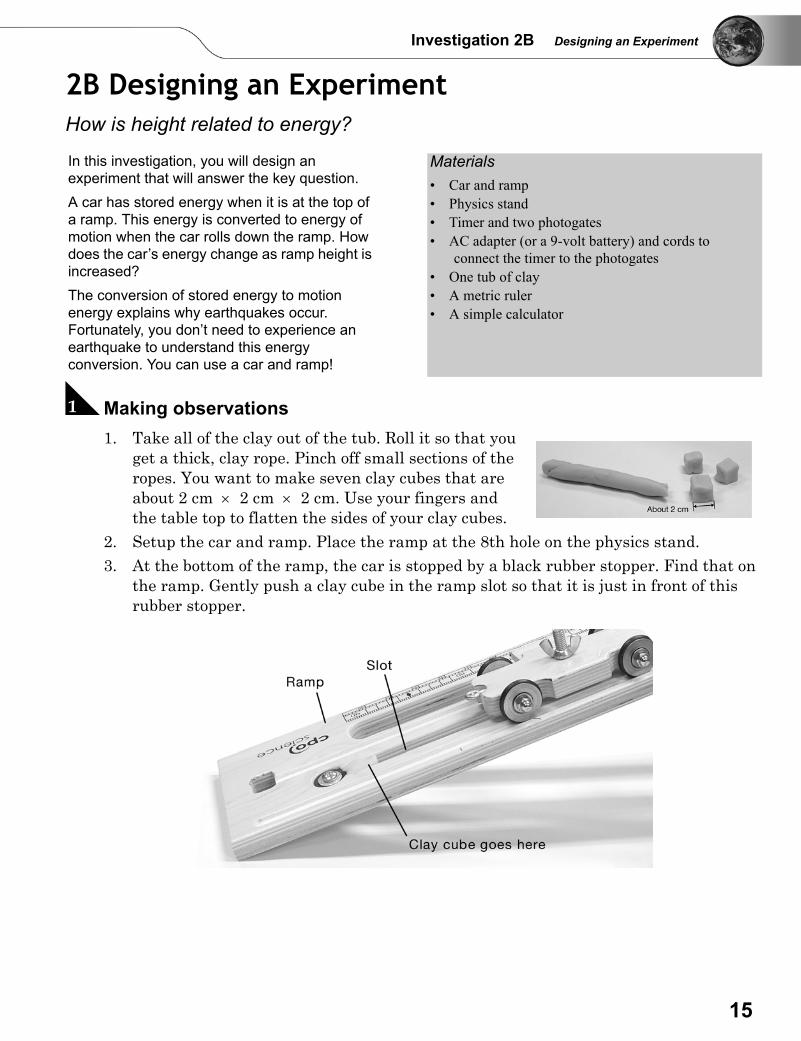
A Making observations1. Take all of the clay out of the tub. Roll it so that you
get a thick, clay rope. Pinch off small sections of the ropes. You want to make seven clay cubes that are about 2 cm × 2 cm × 2 cm. Use your fingers and the table top to flatten the sides of your clay cubes.
2. Setup the car and ramp. Place the ramp at the 8th hole on the physics stand. 3. At the bottom of the ramp, the car is stopped by a black rubber stopper. Find that on
the ramp. Gently push a clay cube in the ramp slot so that it is just in front of this rubber stopper.
In this investigation, you will design an experiment that will answer the key question. A car has stored energy when it is at the top of a ramp. This energy is converted to energy of motion when the car rolls down the ramp. How does the car’s energy change as ramp height is increased? The conversion of stored energy to motion energy explains why earthquakes occur. Fortunately, you don’t need to experience an earthquake to understand this energy conversion. You can use a car and ramp!
Materials• Car and ramp• Physics stand• Timer and two photogates• AC adapter (or a 9-volt battery) and cords to
connect the timer to the photogates• One tub of clay • A metric ruler• A simple calculator
15
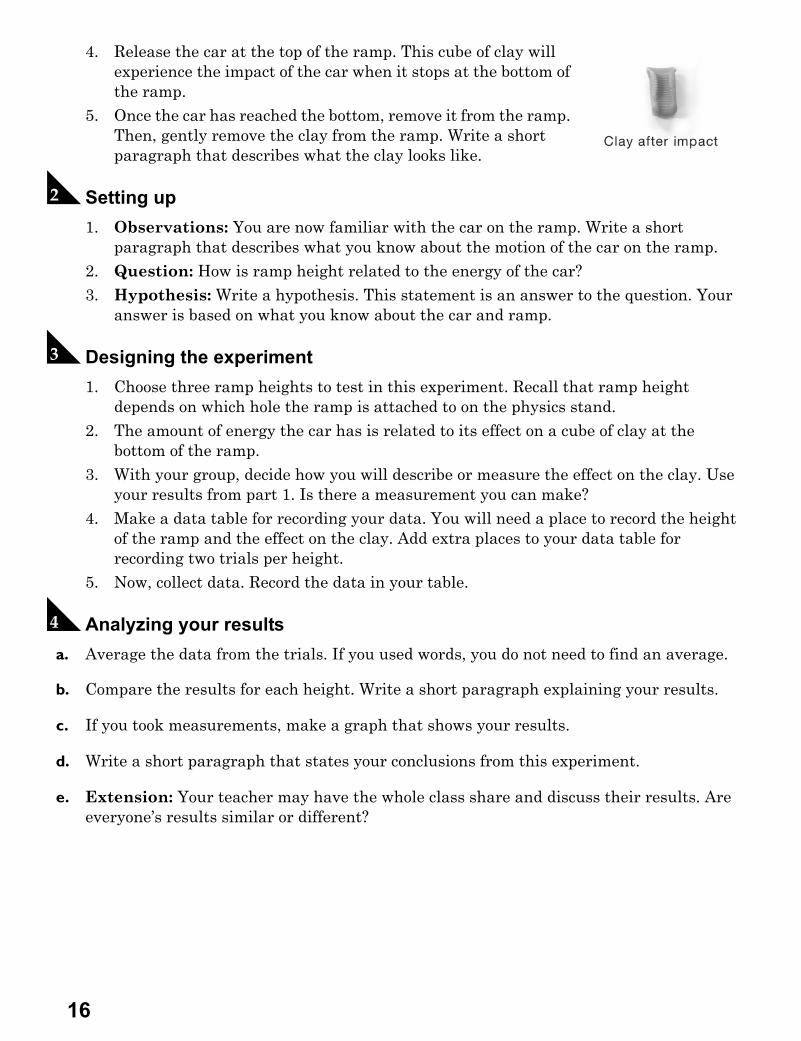
4. Release the car at the top of the ramp. This cube of clay will experience the impact of the car when it stops at the bottom of the ramp.
5. Once the car has reached the bottom, remove it from the ramp. Then, gently remove the clay from the ramp. Write a short paragraph that describes what the clay looks like.
B Setting up1. Observations: You are now familiar with the car on the ramp. Write a short
paragraph that describes what you know about the motion of the car on the ramp.2. Question: How is ramp height related to the energy of the car?3. Hypothesis: Write a hypothesis. This statement is an answer to the question. Your
answer is based on what you know about the car and ramp.
C Designing the experiment1. Choose three ramp heights to test in this experiment. Recall that ramp height
depends on which hole the ramp is attached to on the physics stand.2. The amount of energy the car has is related to its effect on a cube of clay at the
bottom of the ramp.3. With your group, decide how you will describe or measure the effect on the clay. Use
your results from part 1. Is there a measurement you can make?4. Make a data table for recording your data. You will need a place to record the height
of the ramp and the effect on the clay. Add extra places to your data table for recording two trials per height.
5. Now, collect data. Record the data in your table.
D Analyzing your results a. Average the data from the trials. If you used words, you do not need to find an average.
b. Compare the results for each height. Write a short paragraph explaining your results.
c. If you took measurements, make a graph that shows your results.
d. Write a short paragraph that states your conclusions from this experiment.
e. Extension: Your teacher may have the whole class share and discuss their results. Are everyone’s results similar or different?
16
Investigation 2B Designing an Experiment
E Exploring on your own a. Write your experiment as a lab report.
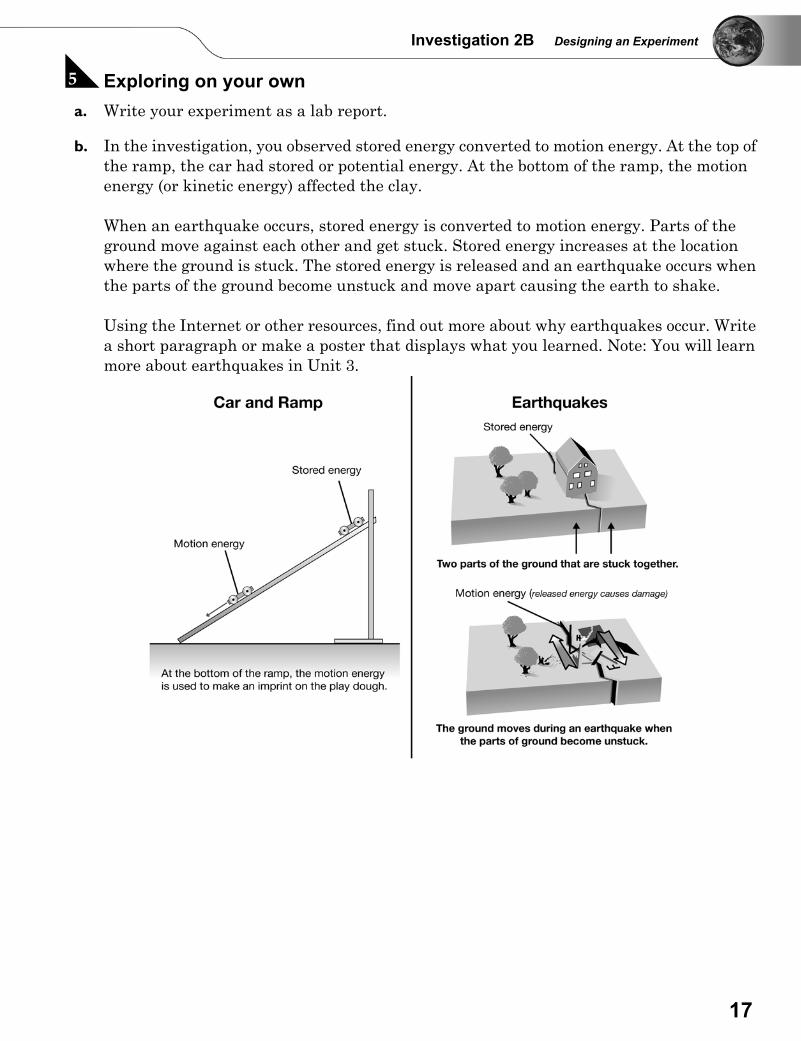
b. In the investigation, you observed stored energy converted to motion energy. At the top of the ramp, the car had stored or potential energy. At the bottom of the ramp, the motion energy (or kinetic energy) affected the clay.
When an earthquake occurs, stored energy is converted to motion energy. Parts of the ground move against each other and get stuck. Stored energy increases at the location where the ground is stuck. The stored energy is released and an earthquake occurs when the parts of the ground become unstuck and move apart causing the earth to shake.
Using the Internet or other resources, find out more about why earthquakes occur. Write a short paragraph or make a poster that displays what you learned. Note: You will learn more about earthquakes in Unit 3.
17
3A Time and Tree RingsDo tree rings tell a story?
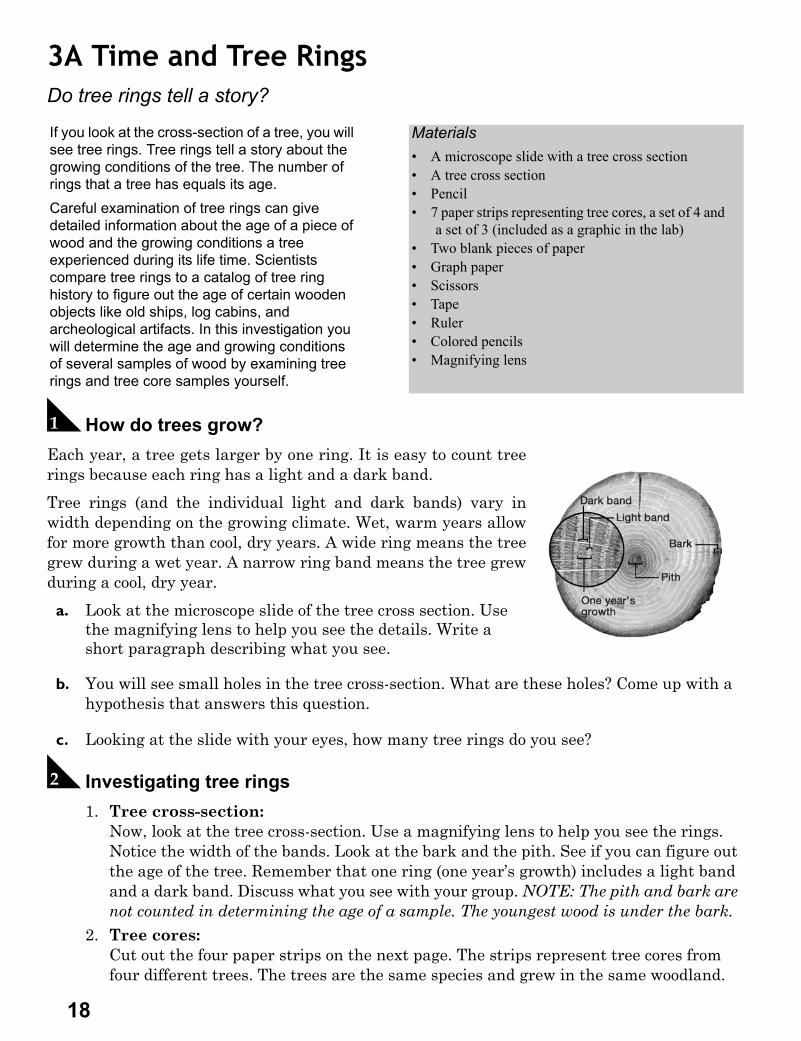
A How do trees grow?Each year, a tree gets larger by one ring. It is easy to count treerings because each ring has a light and a dark band.
Tree rings (and the individual light and dark bands) vary inwidth depending on the growing climate. Wet, warm years allowfor more growth than cool, dry years. A wide ring means the treegrew during a wet year. A narrow ring band means the tree grewduring a cool, dry year.
a. Look at the microscope slide of the tree cross section. Use the magnifying lens to help you see the details. Write a short paragraph describing what you see.
b. You will see small holes in the tree cross-section. What are these holes? Come up with a hypothesis that answers this question.
c. Looking at the slide with your eyes, how many tree rings do you see?
B Investigating tree rings 1. Tree cross-section:
Now, look at the tree cross-section. Use a magnifying lens to help you see the rings. Notice the width of the bands. Look at the bark and the pith. See if you can figure out the age of the tree. Remember that one ring (one year’s growth) includes a light band and a dark band. Discuss what you see with your group. NOTE: The pith and bark are not counted in determining the age of a sample. The youngest wood is under the bark.
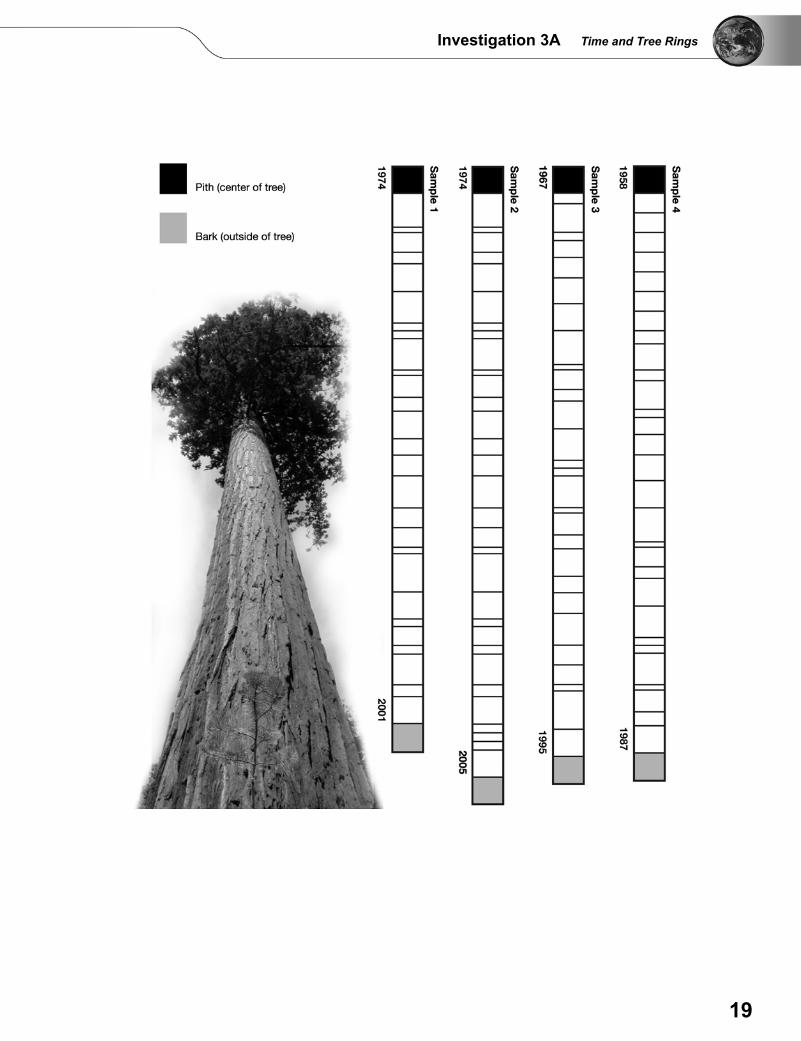
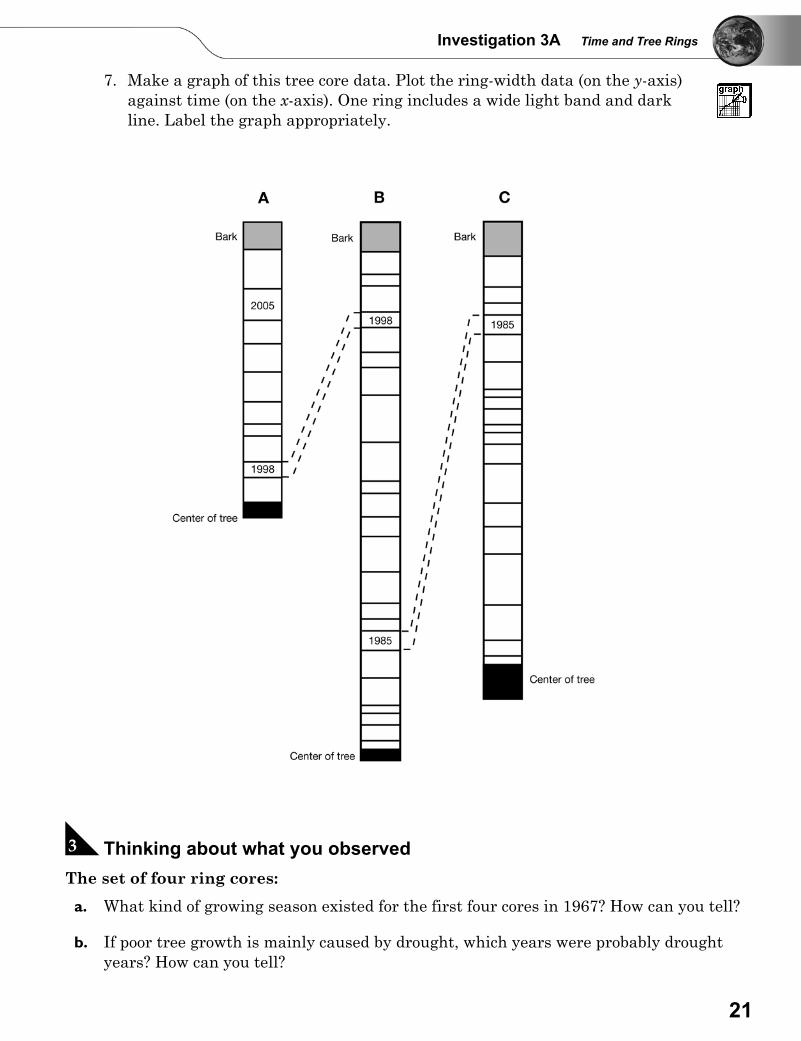
2. Tree cores:Cut out the four paper strips on the next page. The strips represent tree cores from four different trees. The trees are the same species and grew in the same woodland.
If you look at the cross-section of a tree, you will see tree rings. Tree rings tell a story about the growing conditions of the tree. The number of rings that a tree has equals its age.Careful examination of tree rings can give detailed information about the age of a piece of wood and the growing conditions a tree experienced during its life time. Scientists compare tree rings to a catalog of tree ring history to figure out the age of certain wooden objects like old ships, log cabins, and archeological artifacts. In this investigation you will determine the age and growing conditions of several samples of wood by examining tree rings and tree core samples yourself.
Materials• A microscope slide with a tree cross section• A tree cross section• Pencil• 7 paper strips representing tree cores, a set of 4 and
a set of 3 (included as a graphic in the lab)• Two blank pieces of paper• Graph paper• Scissors• Tape• Ruler• Colored pencils• Magnifying lens
18
Investigation 3A Time and Tree Rings
19
3. Determine the age of each tree by counting the rings (one ring includes a wide light band and dark line). Record your answers in Table 1.
4. Look for patterns in the rings. Line up all the samples by matching the patterns before taping them onto a blank piece of paper. Color the overlapping sections so you don’t lose track. Figure out the age of each tree and record this information, and the years that the trees began growing and were cut in Table 1.Note: These matching patterns indicate the trees grew in the same woodland and help prove what the climate was like in the past for an area.
5. More tree cores:Now look at the three new tree cores (see next page). Write down the age of each core. Then, cut out the paper strips and line them up.
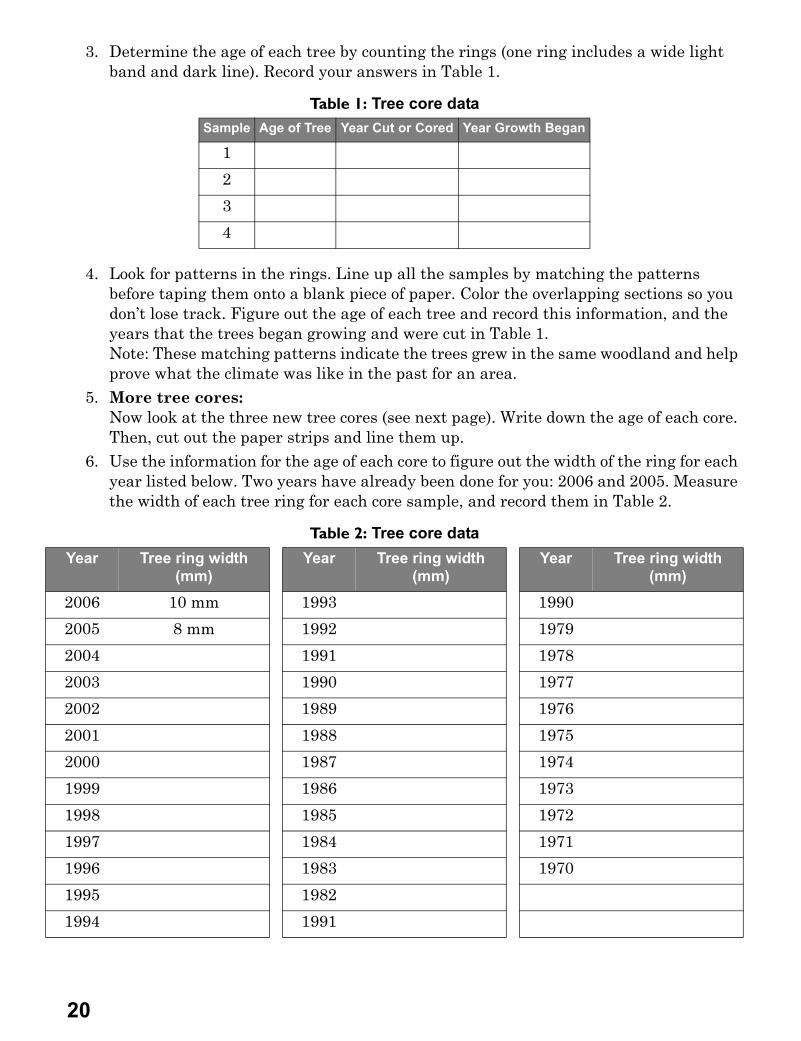
6. Use the information for the age of each core to figure out the width of the ring for each year listed below. Two years have already been done for you: 2006 and 2005. Measure the width of each tree ring for each core sample, and record them in Table 2.
Table 1: Tree core dataSample Age of Tree Year Cut or Cored Year Growth Began
1
2
3
4
Table 2: Tree core dataYear Tree ring width
(mm)Year Tree ring width
(mm)Year Tree ring width
(mm)
2006 10 mm 1993 1990
2005 8 mm 1992 1979
2004 1991 1978
2003 1990 1977
2002 1989 1976
2001 1988 1975
2000 1987 1974
1999 1986 1973
1998 1985 1972
1997 1984 1971
1996 1983 1970
1995 1982
1994 1991
20
Investigation 3A Time and Tree Rings
7. Make a graph of this tree core data. Plot the ring-width data (on the y-axis) against time (on the x-axis). One ring includes a wide light band and dark line. Label the graph appropriately.
C Thinking about what you observed The set of four ring cores:
a. What kind of growing season existed for the first four cores in 1967? How can you tell?
b. If poor tree growth is mainly caused by drought, which years were probably drought years? How can you tell?
21
c. Did this woodland have more years of drought or plentiful rainfall?
d. Why might a climatologist be interested in tree ring data from this woodland?
The set of three ring cores:
a. What does your graph show about the three cores (A, B, and C) and the climate?
D Exploring on your own a. Global warming (caused by an increase of carbon dioxide in the atmosphere) is a current
environmental topic that concerns scientists. The result of global warming is an increase in Earth’s average temperature. Due to global warming, what differences would you expect to see between tree rings of today and tree rings in the future (100 years from now)?
b. What factors can influence the growth of trees? List all the factors you can think of.
c. Trees are like the history books of a forest. But, what other objects in nature can we observe and measure to tell us something about certain environments? You may want to go to an outdoor location to brainstorm answers to this question.
d. What is a dendrochronologist and what does one do?
22
Investigation 3B Topographic Mapping
3B Topographic MappingHow do you make a topographic map from a 3-dimensional surface?
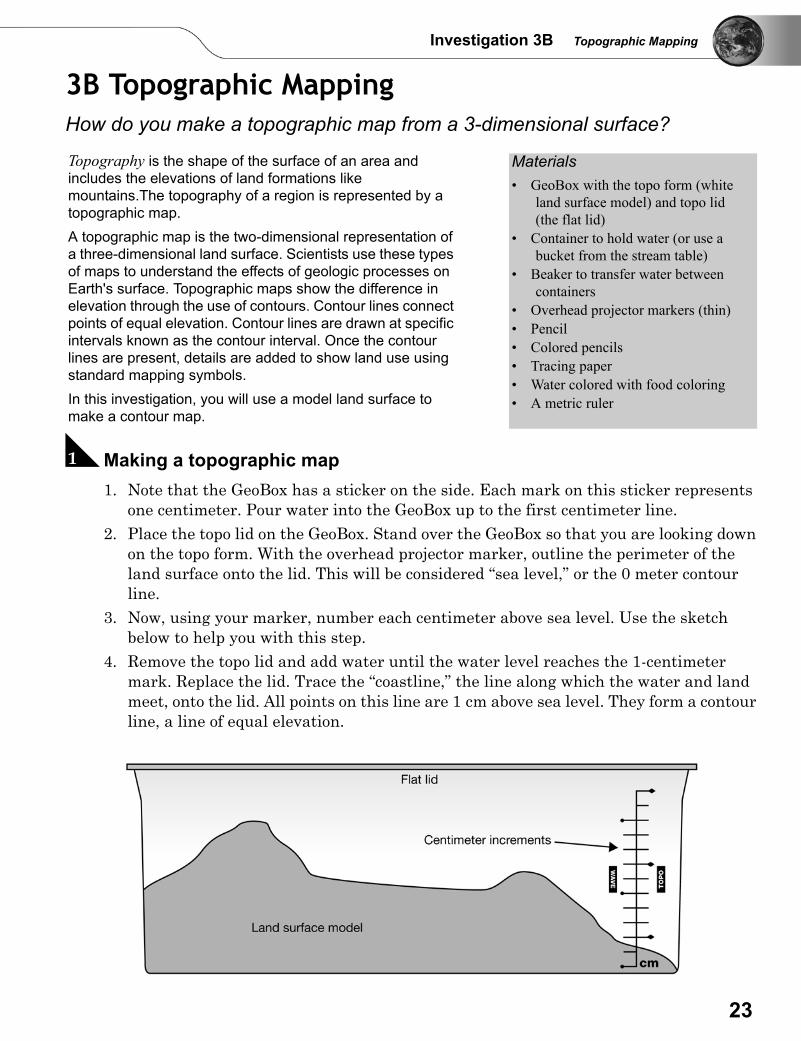
A Making a topographic map1. Note that the GeoBox has a sticker on the side. Each mark on this sticker represents
one centimeter. Pour water into the GeoBox up to the first centimeter line.2. Place the topo lid on the GeoBox. Stand over the GeoBox so that you are looking down
on the topo form. With the overhead projector marker, outline the perimeter of the land surface onto the lid. This will be considered “sea level,” or the 0 meter contour line.
3. Now, using your marker, number each centimeter above sea level. Use the sketch below to help you with this step.
4. Remove the topo lid and add water until the water level reaches the 1-centimeter mark. Replace the lid. Trace the “coastline,” the line along which the water and land meet, onto the lid. All points on this line are 1 cm above sea level. They form a contour line, a line of equal elevation.
Topography is the shape of the surface of an area and includes the elevations of land formations like mountains.The topography of a region is represented by a topographic map.A topographic map is the two-dimensional representation of a three-dimensional land surface. Scientists use these types of maps to understand the effects of geologic processes on Earth's surface. Topographic maps show the difference in elevation through the use of contours. Contour lines connect points of equal elevation. Contour lines are drawn at specific intervals known as the contour interval. Once the contour lines are present, details are added to show land use using standard mapping symbols.In this investigation, you will use a model land surface to make a contour map.
Materials• GeoBox with the topo form (white
land surface model) and topo lid (the flat lid)
• Container to hold water (or use a bucket from the stream table)
• Beaker to transfer water between containers
• Overhead projector markers (thin)• Pencil• Colored pencils• Tracing paper• Water colored with food coloring• A metric ruler
23
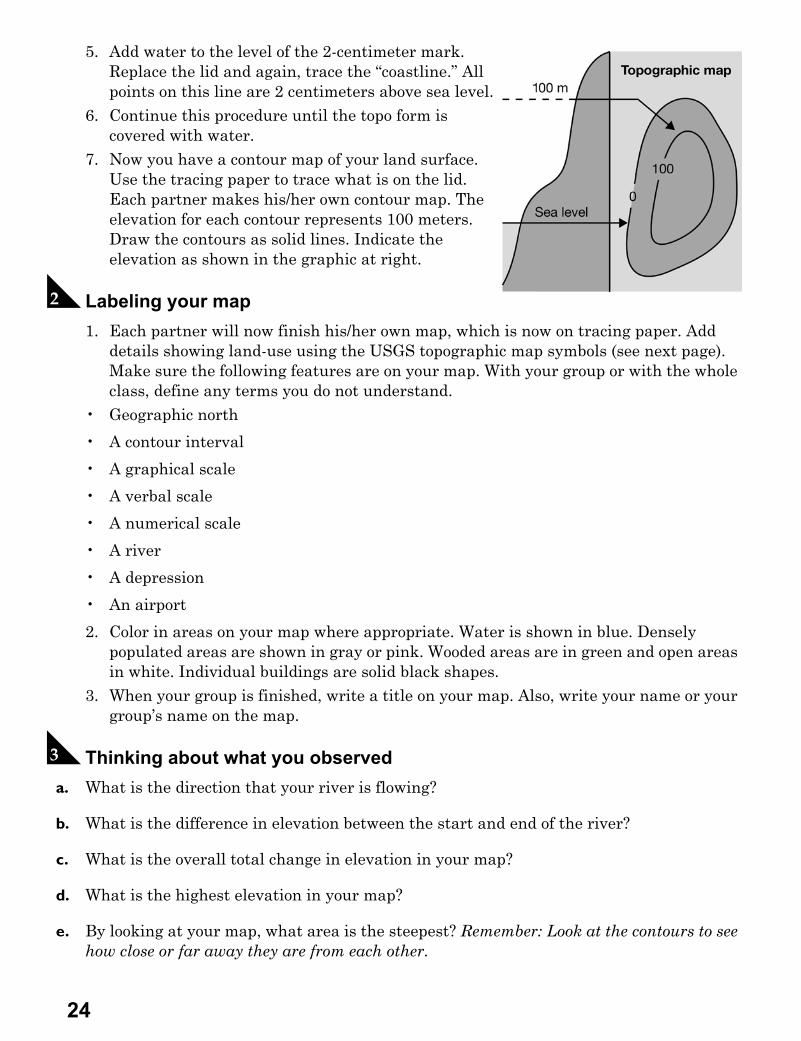
5. Add water to the level of the 2-centimeter mark. Replace the lid and again, trace the “coastline.” All points on this line are 2 centimeters above sea level.
6. Continue this procedure until the topo form is covered with water.
7. Now you have a contour map of your land surface. Use the tracing paper to trace what is on the lid. Each partner makes his/her own contour map. The elevation for each contour represents 100 meters. Draw the contours as solid lines. Indicate the elevation as shown in the graphic at right.
B Labeling your map1. Each partner will now finish his/her own map, which is now on tracing paper. Add
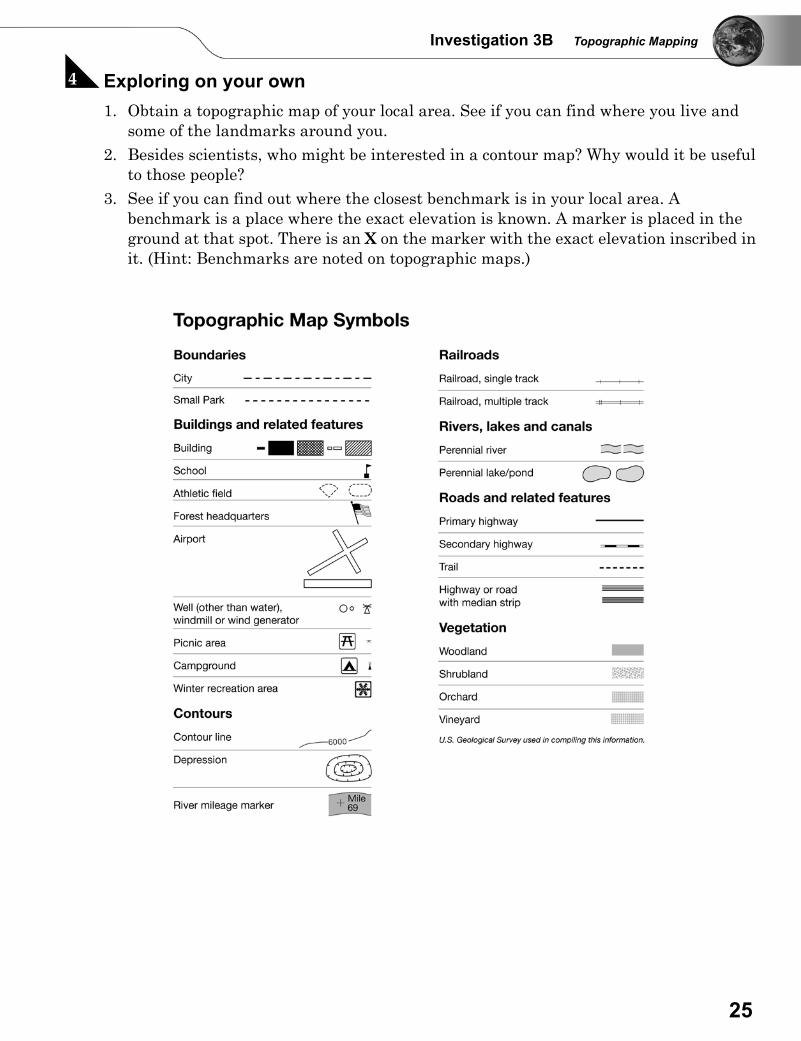
details showing land-use using the USGS topographic map symbols (see next page). Make sure the following features are on your map. With your group or with the whole class, define any terms you do not understand.
• Geographic north
• A contour interval
• A graphical scale
• A verbal scale
• A numerical scale
• A river
• A depression
• An airport
2. Color in areas on your map where appropriate. Water is shown in blue. Densely populated areas are shown in gray or pink. Wooded areas are in green and open areas in white. Individual buildings are solid black shapes.
3. When your group is finished, write a title on your map. Also, write your name or your group’s name on the map.
C Thinking about what you observed a. What is the direction that your river is flowing?
b. What is the difference in elevation between the start and end of the river?
c. What is the overall total change in elevation in your map?
d. What is the highest elevation in your map?
e. By looking at your map, what area is the steepest? Remember: Look at the contours to see how close or far away they are from each other.
24
Investigation 3B Topographic Mapping
D Exploring on your own1. Obtain a topographic map of your local area. See if you can find where you live and
some of the landmarks around you.2. Besides scientists, who might be interested in a contour map? Why would it be useful
to those people? 3. See if you can find out where the closest benchmark is in your local area. A
benchmark is a place where the exact elevation is known. A marker is placed in the ground at that spot. There is an X on the marker with the exact elevation inscribed in it. (Hint: Benchmarks are noted on topographic maps.)
25
4A Conduction in the AtmosphereHow does conduction transfer heat from Earth’s surface to its atmosphere?
A Setting upSafety tip: Use caution when working with an open flame. Long hair should be tied back.Loose or bulky outer layers of clothing should be removed. Wear goggles and flame-proofoven mitts or heat gloves while handling the lit candle and wax.
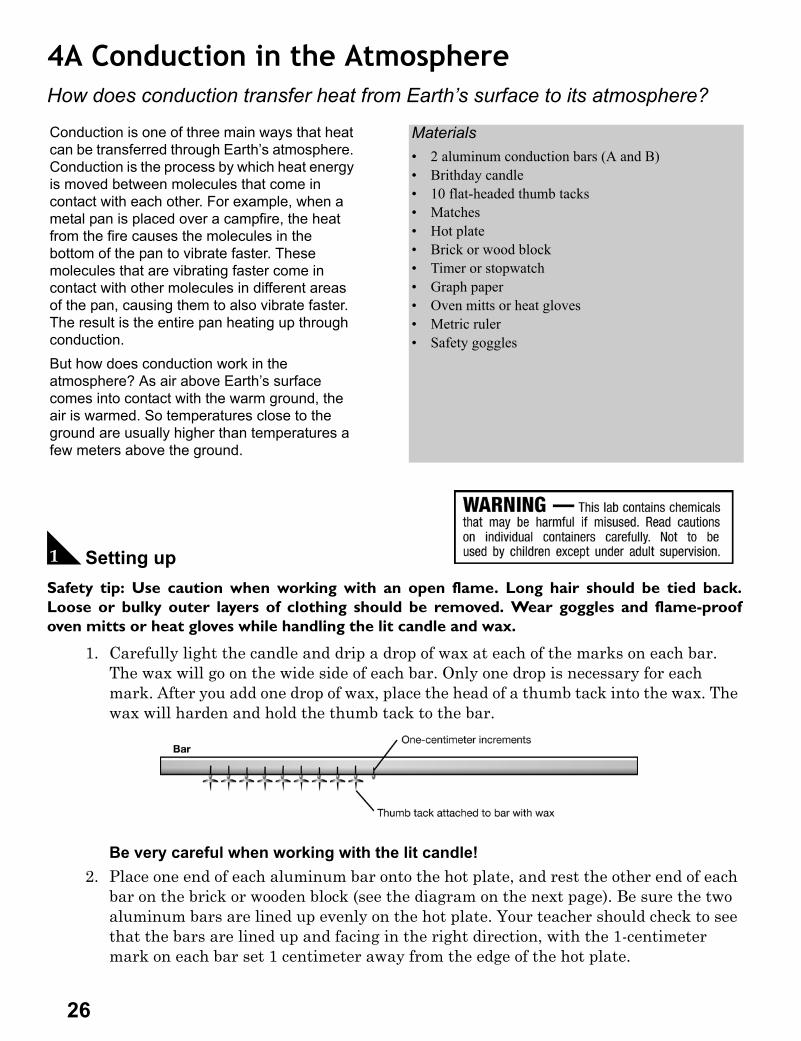
1. Carefully light the candle and drip a drop of wax at each of the marks on each bar. The wax will go on the wide side of each bar. Only one drop is necessary for each mark. After you add one drop of wax, place the head of a thumb tack into the wax. The wax will harden and hold the thumb tack to the bar.
Be very careful when working with the lit candle!2. Place one end of each aluminum bar onto the hot plate, and rest the other end of each
bar on the brick or wooden block (see the diagram on the next page). Be sure the two aluminum bars are lined up evenly on the hot plate. Your teacher should check to see that the bars are lined up and facing in the right direction, with the 1-centimeter mark on each bar set 1 centimeter away from the edge of the hot plate.
Conduction is one of three main ways that heat can be transferred through Earth’s atmosphere. Conduction is the process by which heat energy is moved between molecules that come in contact with each other. For example, when a metal pan is placed over a campfire, the heat from the fire causes the molecules in the bottom of the pan to vibrate faster. These molecules that are vibrating faster come in contact with other molecules in different areas of the pan, causing them to also vibrate faster. The result is the entire pan heating up through conduction. But how does conduction work in the atmosphere? As air above Earth’s surface comes into contact with the warm ground, the air is warmed. So temperatures close to the ground are usually higher than temperatures a few meters above the ground.
Materials• 2 aluminum conduction bars (A and B)• Brithday candle• 10 flat-headed thumb tacks• Matches• Hot plate• Brick or wood block • Timer or stopwatch• Graph paper • Oven mitts or heat gloves• Metric ruler • Safety goggles
26
Investigation 4A Conduction in the Atmosphere
B Doing the experimentSafety tip: wear goggles and oven mitts or heat gloves throughout the experiment.
1. Using the timer, measure how long it takes for the heat to travel down each of the bars. Record the elapsed time when each drop of wax melts and a tack falls. Start the stopwatch when you turn on the hot plate and stop it when the last drop melts.
2. Turn on the hot plate and start the stopwatch mode of the timer. Record the time in seconds in Table 1.NOTE: Do not touch the metal bars under any circumstances once you turn on the hot plate. The bars become extremely hot during this experiment.
3. Turn the hot plate OFF when the last drop melts.
C Stop and think
a. In your own words, describe how and in which direction heat energy is moving through this experiment. Draw a diagram to help support your explanation.
b. Think about the definition of conduction. How is conduction responsible for transferring heat energy through your experiment setup?
c. What is the purpose of the wax and thumb tacks in this investigation?
d. When an object heats up, its molecules vibrate faster. When these faster vibrating molecules come into contact with slower vibrating molecules, they cause them to vibrate faster as well. Describe how the speed of the molecules changed from one end of the bar to the other as the experiment was conducted.
D Graphing1. Graph the data, using the distance from the hot plate as the x-axis variable
and the melting time as the y-axis variable. 2. Make a legend to indicate the curves for Bar A and Bar B. Don’t forget to label
your axes, to use units, and to title your graph.
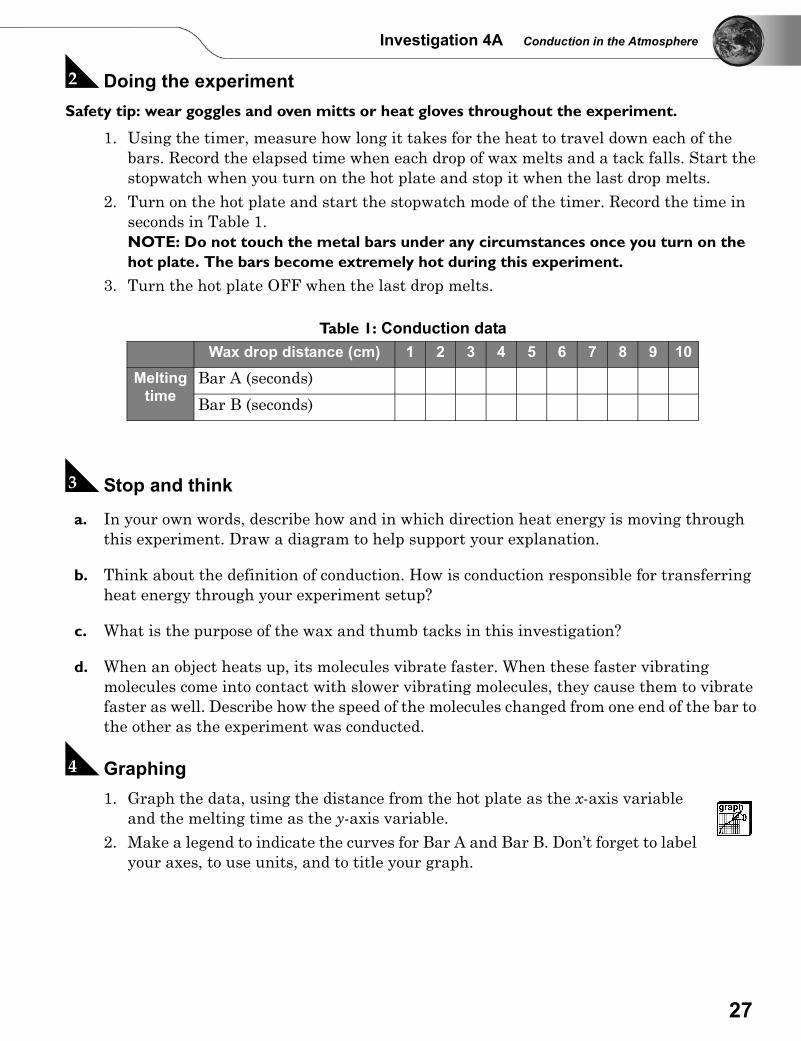
Table 1: Conduction dataWax drop distance (cm) 1 2 3 4 5 6 7 8 9 10
Melting time
Bar A (seconds)
Bar B (seconds)
27
E Thinking about what you observed a. Which aluminum bar received more heat from the hot plate, or did they receive the same
amount of heat?
b. Where did the wax melt first—nearest the hot plate, or closer to the brick or wooden block. How can you explain this?
c. Examine your graph. In which aluminum bar did the wax melt faster?
d. Which bar, A or B, is a better conductor of heat energy? Why? How do your results support your answer?
e. How would your results change if you added a third aluminum bar to the experiment that was wider and thicker than both bar A and bar B?
f. Where would you expect air temperatures on Earth to be warmer—near the surface, or at a high altitude? Explain your answer using what you learned about conduction in this experiment. Think about what part of the experiment modeled the Earth’s surface and what part modeled the air near the Earth’s surface.
F Exploring on your ownFind out what types of Earth’s surfaces are the best conductors of heat energy into theatmosphere: sand, soil, water, ice, or rock. Design an experiment to test the conductivity ofeach of these types of surfaces typically found on Earth.
28
Investigation 4B Convection in Earth’s Atmosphere
4B Convection in Earth’s AtmosphereHow is convection responsible for the movement of air through the atmosphere?
A Setting up and making observationsSafety tip: Use caution when working with an open flame. Long hair should be tied back.Loose or bulky outer layers of clothing should be removed.
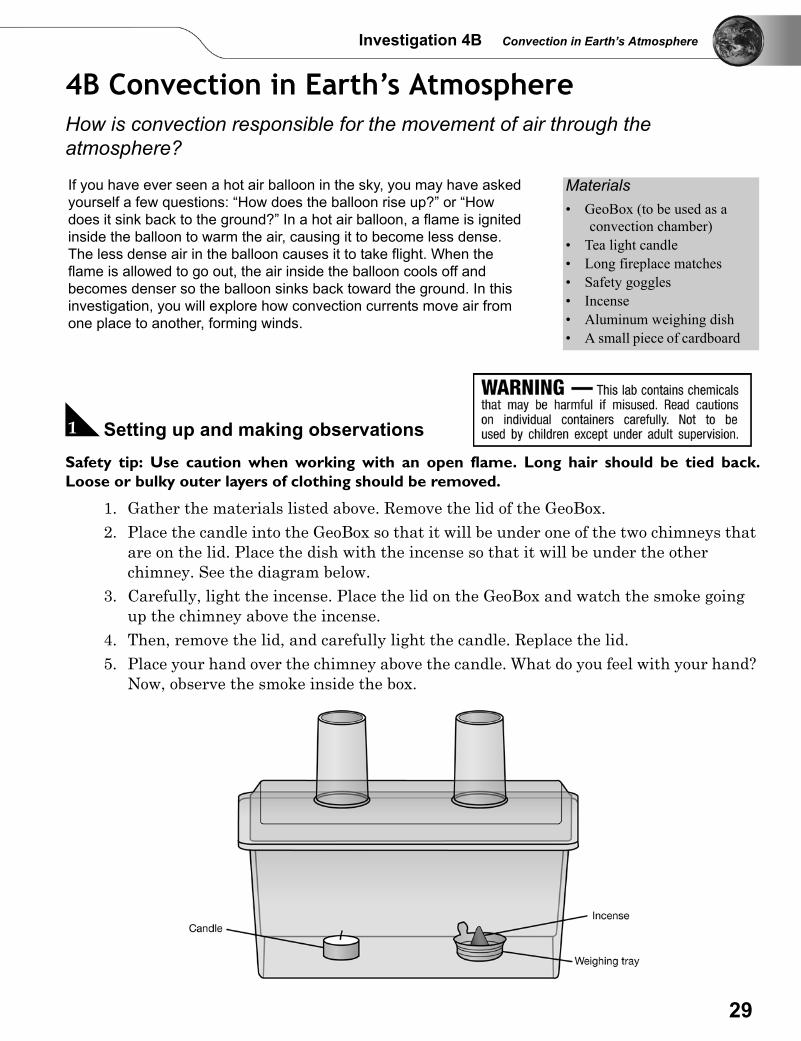
1. Gather the materials listed above. Remove the lid of the GeoBox.2. Place the candle into the GeoBox so that it will be under one of the two chimneys that
are on the lid. Place the dish with the incense so that it will be under the other chimney. See the diagram below.
3. Carefully, light the incense. Place the lid on the GeoBox and watch the smoke going up the chimney above the incense.
4. Then, remove the lid, and carefully light the candle. Replace the lid.5. Place your hand over the chimney above the candle. What do you feel with your hand?
Now, observe the smoke inside the box.
If you have ever seen a hot air balloon in the sky, you may have asked yourself a few questions: “How does the balloon rise up?” or “How does it sink back to the ground?” In a hot air balloon, a flame is ignited inside the balloon to warm the air, causing it to become less dense. The less dense air in the balloon causes it to take flight. When the flame is allowed to go out, the air inside the balloon cools off and becomes denser so the balloon sinks back toward the ground. In this investigation, you will explore how convection currents move air from one place to another, forming winds.
Materials• GeoBox (to be used as a
convection chamber)• Tea light candle• Long fireplace matches• Safety goggles• Incense• Aluminum weighing dish • A small piece of cardboard
29
6. Observe what is happening inside the box and chimneys for several minutes. In the space below, sketch your observations.
B Stop and think a. Define convection. Where is the air is rising and sinking in the box/convection chamber?
b. Describe the movement of the smoke inside the box. Be sure to describe the movement of smoke in the two chimneys as well.
c. What is the purpose of the smoke from the burning incense?
d. Based on your sketch in part 1 and your answers to these questions (a - c), make a diagram that illustrates how convection is taking place in the GeoBox. Draw and label where air is rising, sinking, becoming less dense, becoming more dense.
C Further exploration1. Place your fingers inside the two chimneys. Take note of what you feel. Is the air
rising or sinking in each of the chimneys? 2. Cover the chimney above the candle with the piece of cardboard. Observe what
happens to the movement of the air inside the GeoBox.3. Now, cover the chimney above the burning incense with the piece of cardboard.
Observe what happens to the movement of the air inside the GeoBox.
D Thinking about what you observed a. Describe the motion of the air in the box above the candle. Be sure to describe the change
in density of the air and whether or not air is rising or sinking.
30
Investigation 4B Convection in Earth’s Atmosphere
b. Describe the motion of the air in the box above the incense. Be sure to describe the change in density of the air and whether air is rising or sinking.
c. Why is the air rising in the chimney above the candle? Why is the air sinking in the chimney above the incense?
d. Describe how the air is moving between the candle and the incense. How can you explain this movement in terms of convection?
e. Think about what you observed inside the GeoBox. Explain how convection currents in the atmosphere form and how they are responsible for causing winds to blow.
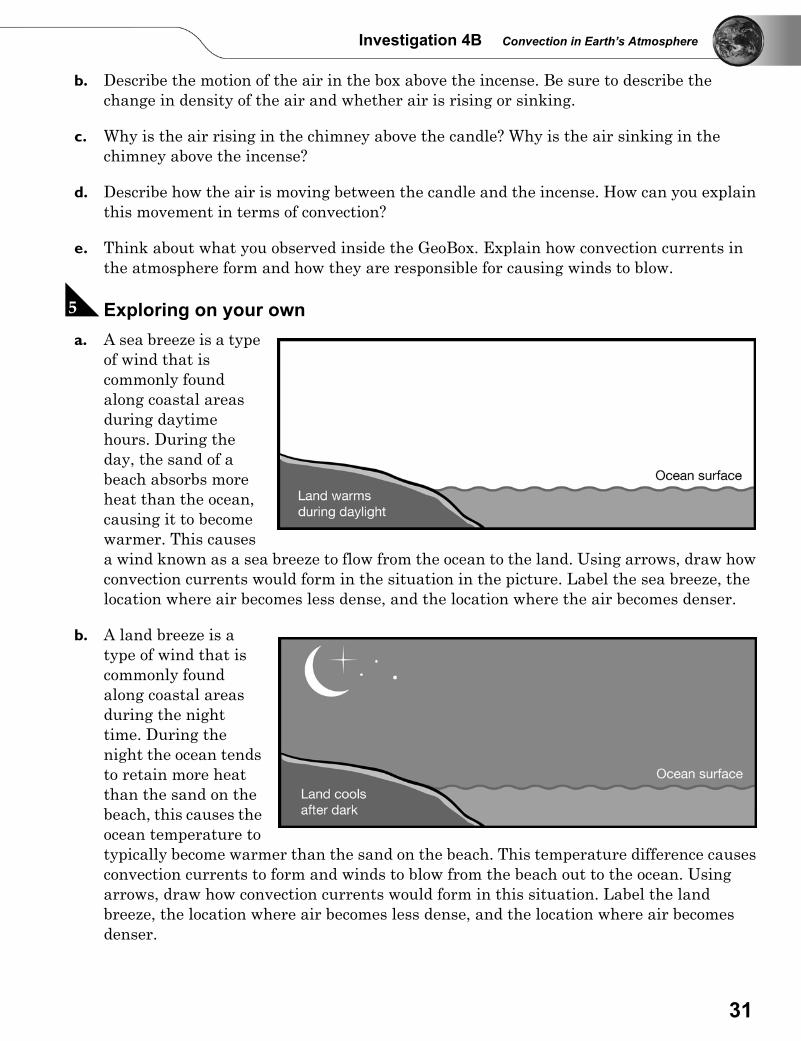
E Exploring on your own a. A sea breeze is a type
of wind that is commonly found along coastal areas during daytime hours. During the day, the sand of a beach absorbs more heat than the ocean, causing it to become warmer. This causes a wind known as a sea breeze to flow from the ocean to the land. Using arrows, draw how convection currents would form in the situation in the picture. Label the sea breeze, the location where air becomes less dense, and the location where the air becomes denser.
b. A land breeze is a type of wind that is commonly found along coastal areas during the night time. During the night the ocean tends to retain more heat than the sand on the beach, this causes the ocean temperature to typically become warmer than the sand on the beach. This temperature difference causes convection currents to form and winds to blow from the beach out to the ocean. Using arrows, draw how convection currents would form in this situation. Label the land breeze, the location where air becomes less dense, and the location where air becomes denser.
31
5A DensityWhy do some objects float in water, while others sink?
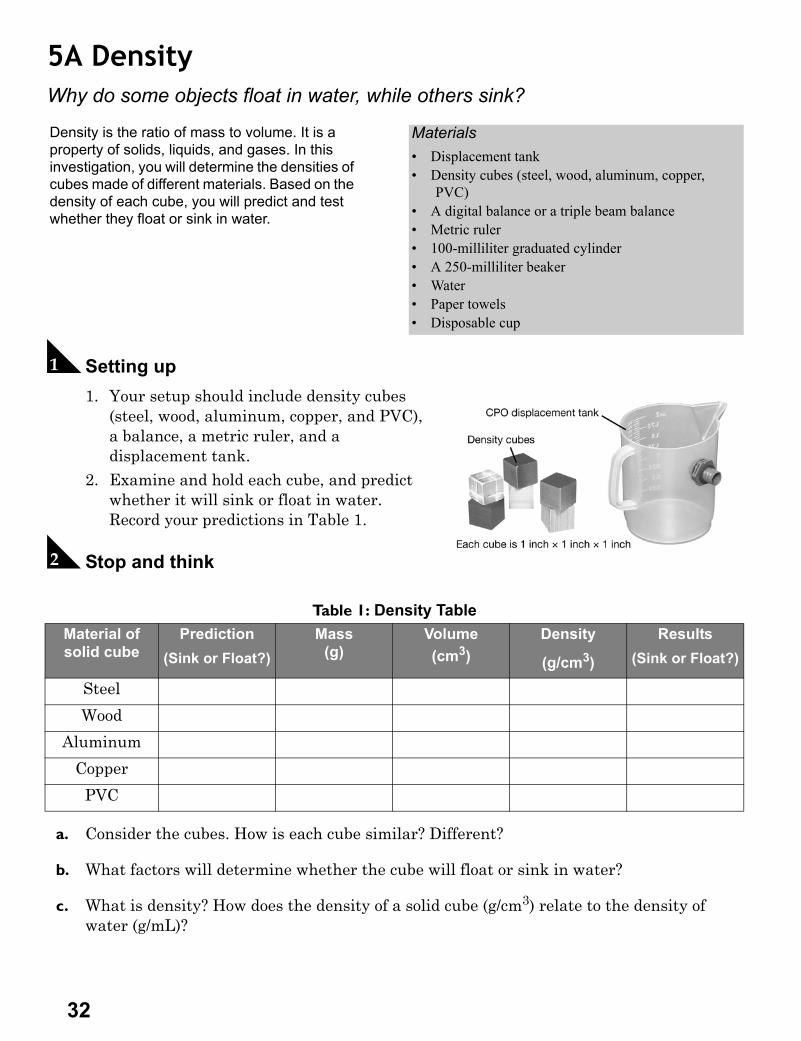
A Setting up 1. Your setup should include density cubes
(steel, wood, aluminum, copper, and PVC), a balance, a metric ruler, and a displacement tank.
2. Examine and hold each cube, and predict whether it will sink or float in water. Record your predictions in Table 1.
B Stop and think
a. Consider the cubes. How is each cube similar? Different?
b. What factors will determine whether the cube will float or sink in water?
c. What is density? How does the density of a solid cube (g/cm3) relate to the density of water (g/mL)?
Density is the ratio of mass to volume. It is a property of solids, liquids, and gases. In this investigation, you will determine the densities of cubes made of different materials. Based on the density of each cube, you will predict and test whether they float or sink in water.
Materials• Displacement tank• Density cubes (steel, wood, aluminum, copper,
PVC)• A digital balance or a triple beam balance• Metric ruler• 100-milliliter graduated cylinder• A 250-milliliter beaker• Water• Paper towels• Disposable cup
Table 1: Density TableMaterial of solid cube
Prediction(Sink or Float?)
Mass (g)
Volume(cm3)
Density
(g/cm3)
Results(Sink or Float?)
Steel
Wood
Aluminum
Copper
PVC
32
Investigation 5A Density
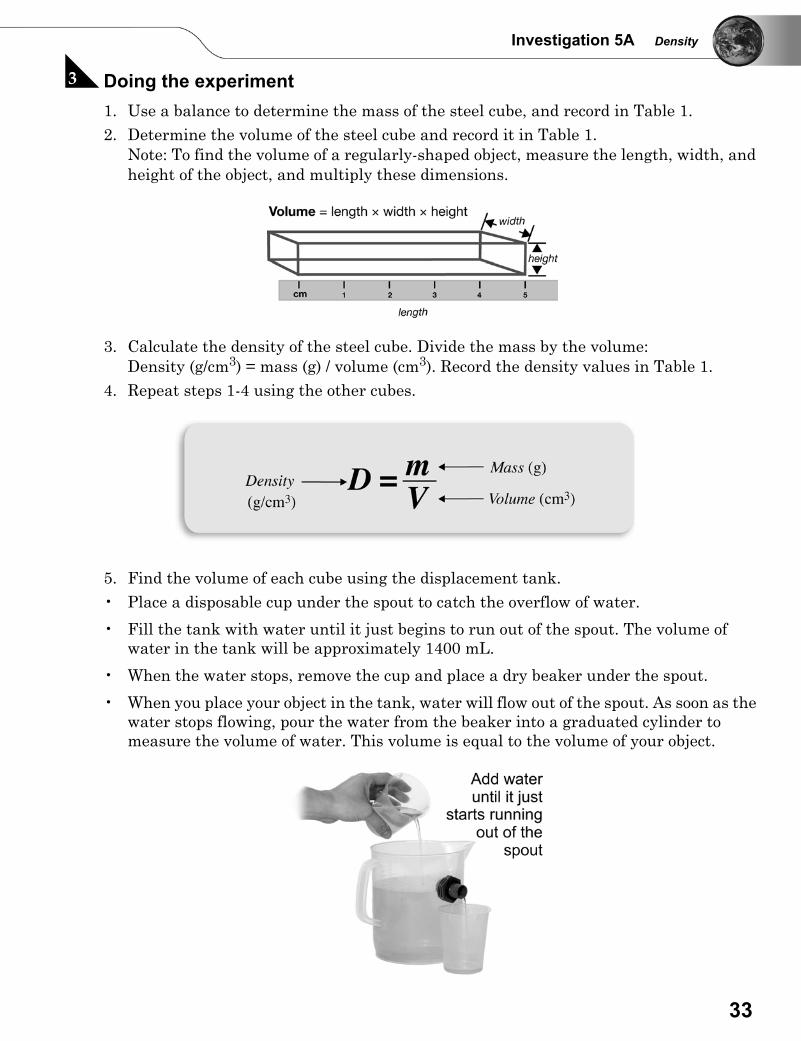
C Doing the experiment 1. Use a balance to determine the mass of the steel cube, and record in Table 1.2. Determine the volume of the steel cube and record it in Table 1.
Note: To find the volume of a regularly-shaped object, measure the length, width, and height of the object, and multiply these dimensions.
3. Calculate the density of the steel cube. Divide the mass by the volume: Density (g/cm3) = mass (g) / volume (cm3). Record the density values in Table 1.
4. Repeat steps 1-4 using the other cubes.
5. Find the volume of each cube using the displacement tank. • Place a disposable cup under the spout to catch the overflow of water.
• Fill the tank with water until it just begins to run out of the spout. The volume of water in the tank will be approximately 1400 mL.
• When the water stops, remove the cup and place a dry beaker under the spout.
• When you place your object in the tank, water will flow out of the spout. As soon as the water stops flowing, pour the water from the beaker into a graduated cylinder to measure the volume of water. This volume is equal to the volume of your object.
33
D Thinking about what you observed a. Describe how to find the density of a regularly-shaped object like a solid cube.
b. Explain why these cubes have similar volumes but different masses.
c. Explain why these cubes have different densities.
d. Do you notice any correlation (pattern) between the density of an object and its ability to sink or float?
e. As a geologist, how would you determine the densities of different rocks found in a field?
f. Did you observe a difference in the depth in which an object floated or the rate in which the object sunk in the water? Explain your answer.
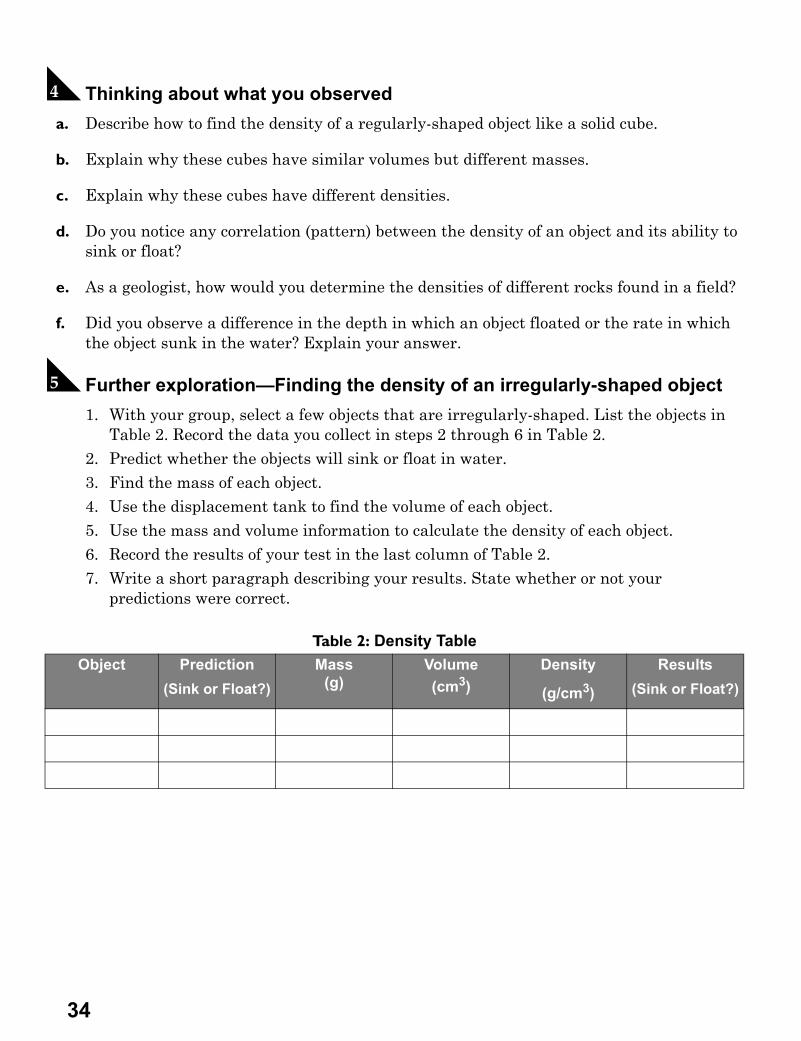
E Further exploration—Finding the density of an irregularly-shaped object1. With your group, select a few objects that are irregularly-shaped. List the objects in
Table 2. Record the data you collect in steps 2 through 6 in Table 2.2. Predict whether the objects will sink or float in water.3. Find the mass of each object.4. Use the displacement tank to find the volume of each object.5. Use the mass and volume information to calculate the density of each object. 6. Record the results of your test in the last column of Table 2.7. Write a short paragraph describing your results. State whether or not your
predictions were correct.
Table 2: Density TableObject Prediction
(Sink or Float?)Mass
(g)Volume(cm3)
Density
(g/cm3)
Results(Sink or Float?)
34
Investigation 5B Buoyancy
5B BuoyancySteel is denser than water so why do steel boats float?
A The density of clayFind the density of your stick of clay before you change its shape.
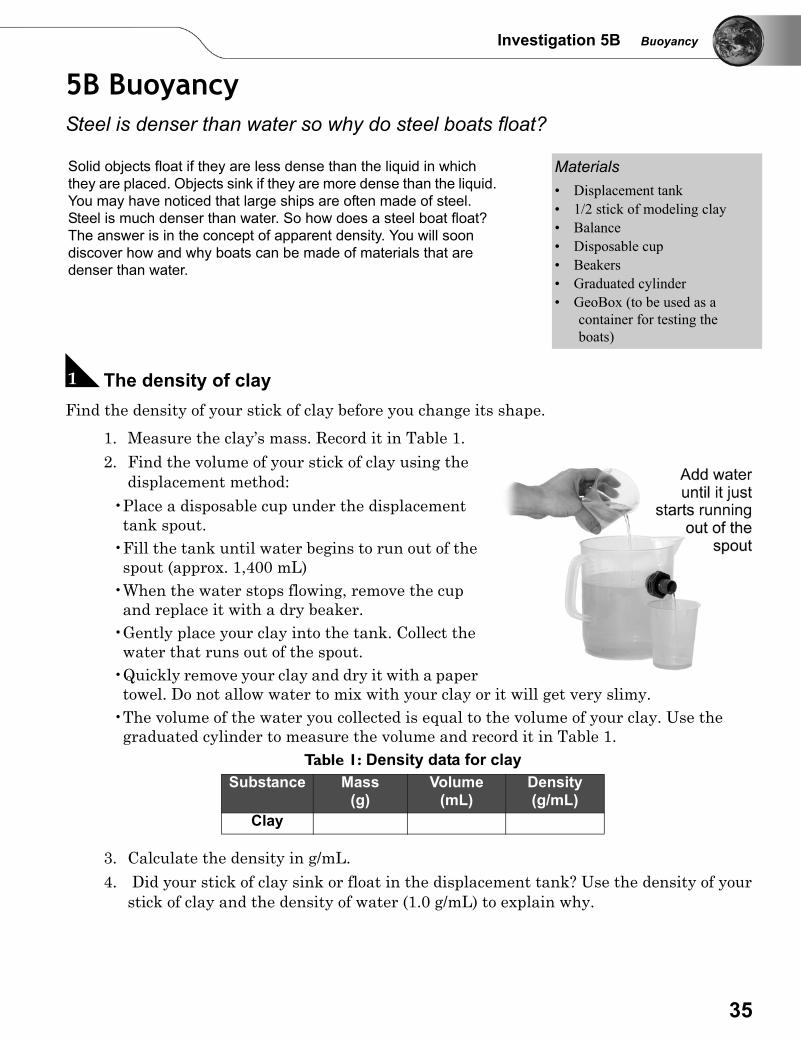
1. Measure the clay’s mass. Record it in Table 1.2. Find the volume of your stick of clay using the
displacement method:•Place a disposable cup under the displacement
tank spout.•Fill the tank until water begins to run out of the
spout (approx. 1,400 mL)•When the water stops flowing, remove the cup
and replace it with a dry beaker.•Gently place your clay into the tank. Collect the
water that runs out of the spout.•Quickly remove your clay and dry it with a paper
towel. Do not allow water to mix with your clay or it will get very slimy.•The volume of the water you collected is equal to the volume of your clay. Use the
graduated cylinder to measure the volume and record it in Table 1.Table 1: Density data for clay
3. Calculate the density in g/mL.4. Did your stick of clay sink or float in the displacement tank? Use the density of your
stick of clay and the density of water (1.0 g/mL) to explain why.
Solid objects float if they are less dense than the liquid in which they are placed. Objects sink if they are more dense than the liquid. You may have noticed that large ships are often made of steel. Steel is much denser than water. So how does a steel boat float? The answer is in the concept of apparent density. You will soon discover how and why boats can be made of materials that are denser than water.
Materials• Displacement tank• 1/2 stick of modeling clay• Balance• Disposable cup• Beakers• Graduated cylinder• GeoBox (to be used as a
container for testing the boats)
Substance Mass (g)
Volume (mL)
Density(g/mL)
Clay
35
B Making the clay floatYou know that steel can be formed into a shape that floats. Can you do the same thing withclay? For this activity, you must use ALL of your clay. Mold it into a shape that you think willfloat.
1. Fill the container with water until it is about 12 centimeters deep.2. When you are ready to test a shape that you have made, gently place it in the water in
the container. If the clay sinks, take it out of the water and dry it off right away.3. When your clay is dry, change the shape of your “boat” and try again.4. When you have successfully made a boat that floats, take it out of the water. Dry it
with a paper towel.5. Measure the mass of your boat and record it in Table 2.
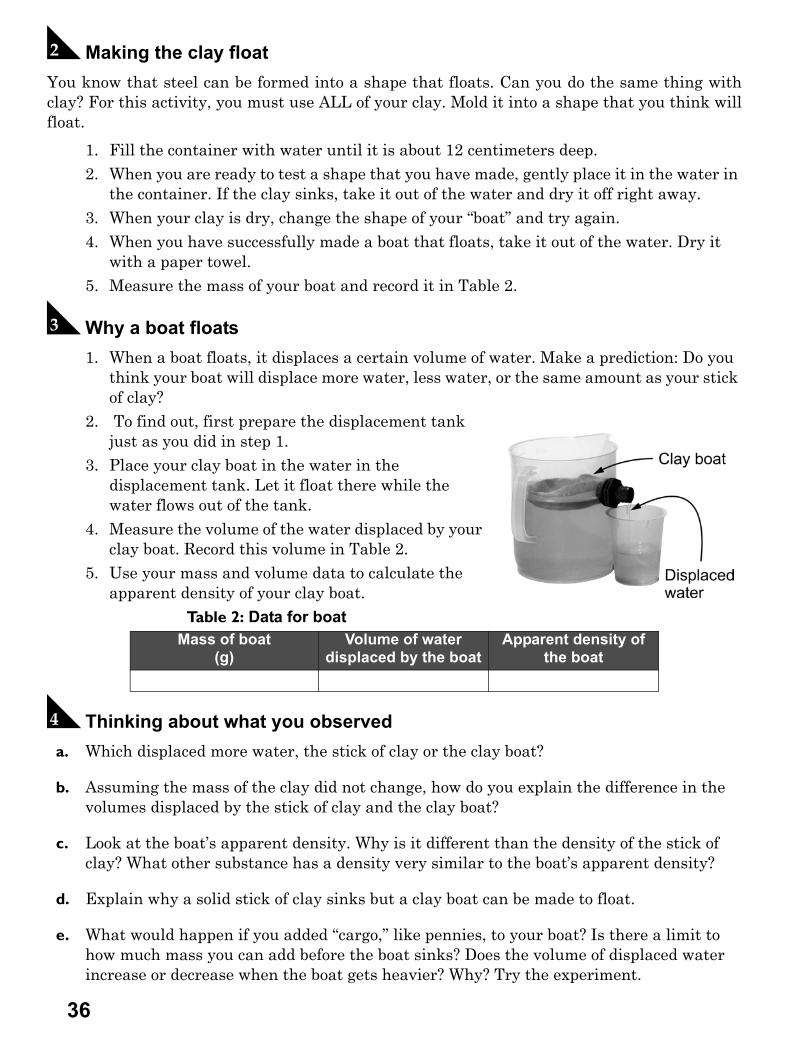
C Why a boat floats1. When a boat floats, it displaces a certain volume of water. Make a prediction: Do you
think your boat will displace more water, less water, or the same amount as your stick of clay?
2. To find out, first prepare the displacement tank just as you did in step 1.
3. Place your clay boat in the water in the displacement tank. Let it float there while the water flows out of the tank.
4. Measure the volume of the water displaced by your clay boat. Record this volume in Table 2.
5. Use your mass and volume data to calculate the apparent density of your clay boat.
Table 2: Data for boat
D Thinking about what you observed a. Which displaced more water, the stick of clay or the clay boat?
b. Assuming the mass of the clay did not change, how do you explain the difference in the volumes displaced by the stick of clay and the clay boat?
c. Look at the boat’s apparent density. Why is it different than the density of the stick of clay? What other substance has a density very similar to the boat’s apparent density?
d. Explain why a solid stick of clay sinks but a clay boat can be made to float.
e. What would happen if you added “cargo,” like pennies, to your boat? Is there a limit to how much mass you can add before the boat sinks? Does the volume of displaced water increase or decrease when the boat gets heavier? Why? Try the experiment.
Mass of boat(g)
Volume of water displaced by the boat
Apparent density of the boat
36
Investigation 6A Earth’s Seasons
6A Earth’s SeasonsWhat causes the seasons?
A Setting up1. A light source representing the Sun will be placed in the center of your classroom. It is
important that the light source emit light equally in all directions like the Sun does.2. The globe will be used to represent Earth. Put the Velcro® dots on Earth so that the
solar cell will adhere to the dots. Put the tabs at the equator, Tropic of Cancer (23.5 degrees north), and Tropic of Capricorn (23.5 degrees south).
3. With your class, choose a wall in your classroom that will represent the position of the North Star (Polaris) in the night sky. Tape a sign to this wall that says “North Star.”
Safety tip: If your light source is a light bulb, do not touch it. Light bulbs can get very hot!
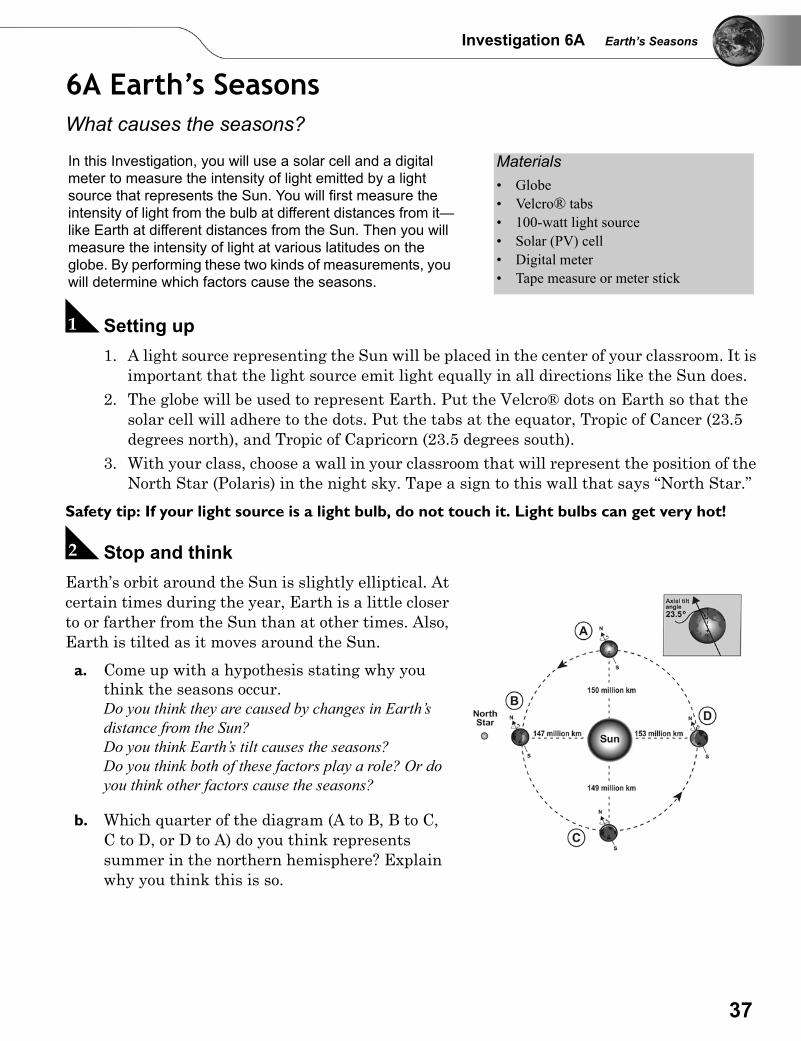
B Stop and think Earth’s orbit around the Sun is slightly elliptical. Atcertain times during the year, Earth is a little closerto or farther from the Sun than at other times. Also,Earth is tilted as it moves around the Sun.
a. Come up with a hypothesis stating why you think the seasons occur.Do you think they are caused by changes in Earth’s distance from the Sun?Do you think Earth’s tilt causes the seasons?Do you think both of these factors play a role? Or do you think other factors cause the seasons?
b. Which quarter of the diagram (A to B, B to C, C to D, or D to A) do you think represents summer in the northern hemisphere? Explain why you think this is so.
In this Investigation, you will use a solar cell and a digital meter to measure the intensity of light emitted by a light source that represents the Sun. You will first measure the intensity of light from the bulb at different distances from it—like Earth at different distances from the Sun. Then you will measure the intensity of light at various latitudes on the globe. By performing these two kinds of measurements, you will determine which factors cause the seasons.
Materials• Globe• Velcro® tabs• 100-watt light source• Solar (PV) cell• Digital meter• Tape measure or meter stick
37
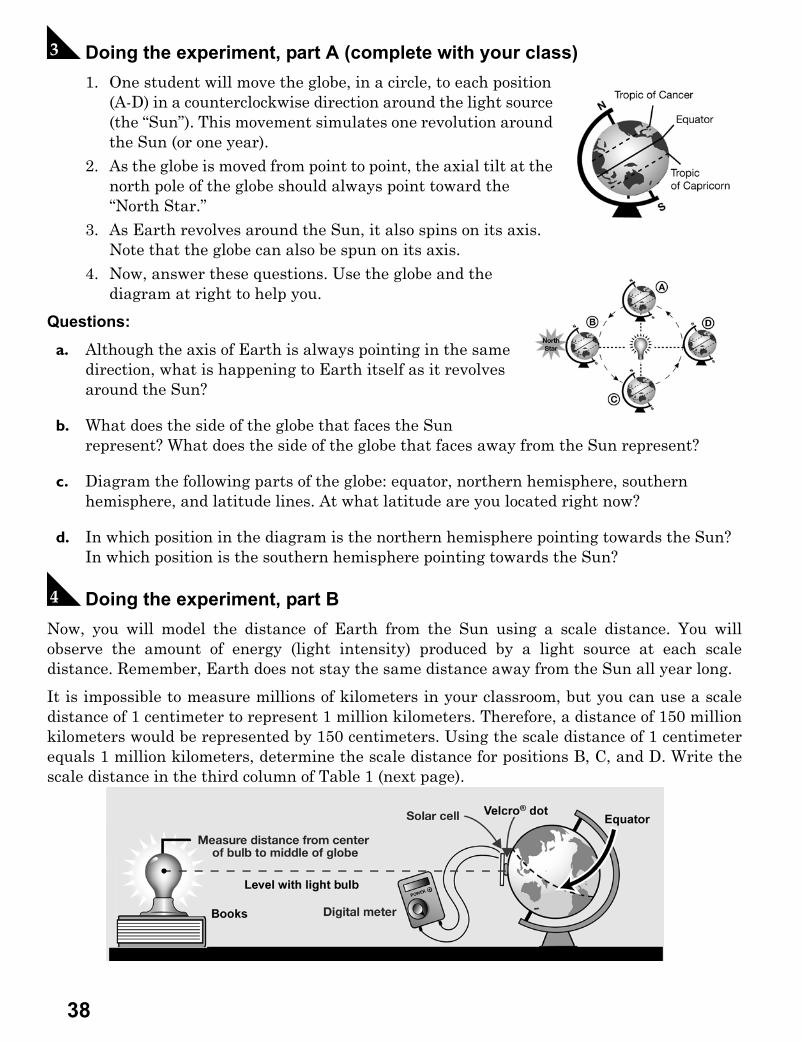
C Doing the experiment, part A (complete with your class)1. One student will move the globe, in a circle, to each position
(A-D) in a counterclockwise direction around the light source (the “Sun”). This movement simulates one revolution around the Sun (or one year).
2. As the globe is moved from point to point, the axial tilt at the north pole of the globe should always point toward the “North Star.”
3. As Earth revolves around the Sun, it also spins on its axis. Note that the globe can also be spun on its axis.
4. Now, answer these questions. Use the globe and the diagram at right to help you.
Questions:
a. Although the axis of Earth is always pointing in the same direction, what is happening to Earth itself as it revolves around the Sun?
b. What does the side of the globe that faces the Sun represent? What does the side of the globe that faces away from the Sun represent?
c. Diagram the following parts of the globe: equator, northern hemisphere, southern hemisphere, and latitude lines. At what latitude are you located right now?
d. In which position in the diagram is the northern hemisphere pointing towards the Sun? In which position is the southern hemisphere pointing towards the Sun?
D Doing the experiment, part BNow, you will model the distance of Earth from the Sun using a scale distance. You willobserve the amount of energy (light intensity) produced by a light source at each scaledistance. Remember, Earth does not stay the same distance away from the Sun all year long.
It is impossible to measure millions of kilometers in your classroom, but you can use a scaledistance of 1 centimeter to represent 1 million kilometers. Therefore, a distance of 150 millionkilometers would be represented by 150 centimeters. Using the scale distance of 1 centimeterequals 1 million kilometers, determine the scale distance for positions B, C, and D. Write thescale distance in the third column of Table 1 (next page).
38
Investigation 6A Earth’s Seasons
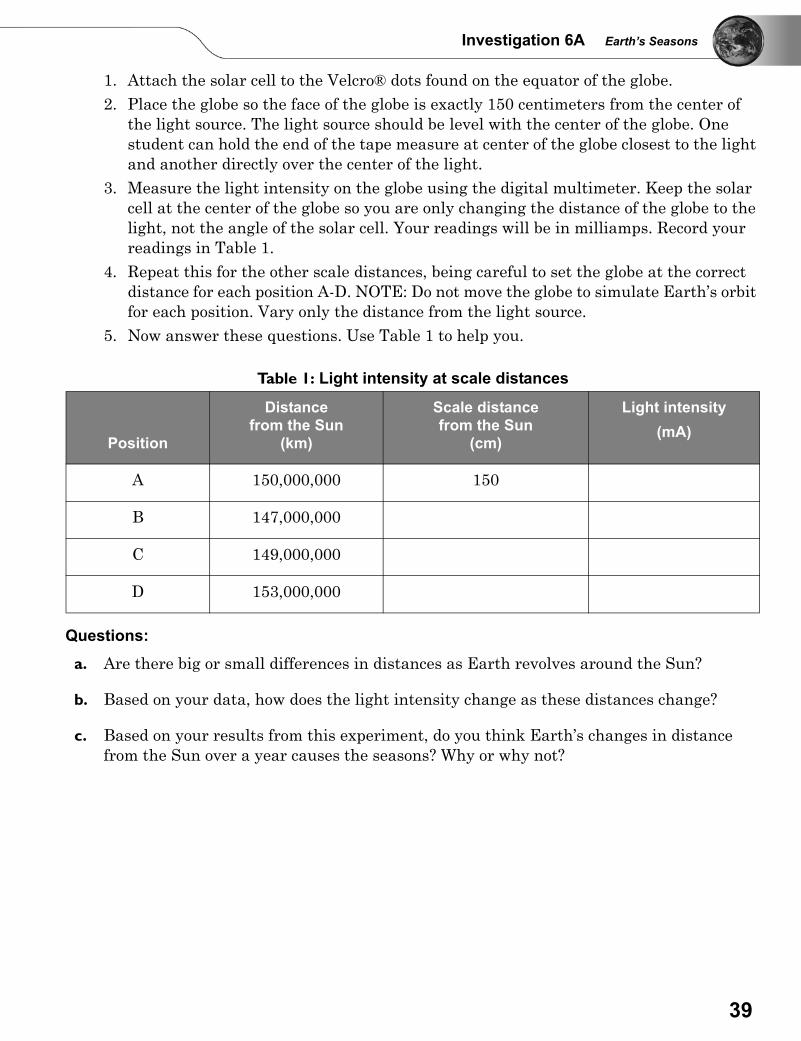
1. Attach the solar cell to the Velcro® dots found on the equator of the globe.2. Place the globe so the face of the globe is exactly 150 centimeters from the center of
the light source. The light source should be level with the center of the globe. One student can hold the end of the tape measure at center of the globe closest to the light and another directly over the center of the light.
3. Measure the light intensity on the globe using the digital multimeter. Keep the solar cell at the center of the globe so you are only changing the distance of the globe to the light, not the angle of the solar cell. Your readings will be in milliamps. Record your readings in Table 1.
4. Repeat this for the other scale distances, being careful to set the globe at the correct distance for each position A-D. NOTE: Do not move the globe to simulate Earth’s orbit for each position. Vary only the distance from the light source.
5. Now answer these questions. Use Table 1 to help you.
Questions:
a. Are there big or small differences in distances as Earth revolves around the Sun?
b. Based on your data, how does the light intensity change as these distances change?
c. Based on your results from this experiment, do you think Earth’s changes in distance from the Sun over a year causes the seasons? Why or why not?
Table 1: Light intensity at scale distances
Position
Distance from the Sun
(km)
Scale distance from the Sun
(cm)
Light intensity(mA)
A 150,000,000 150
B 147,000,000
C 149,000,000
D 153,000,000
39
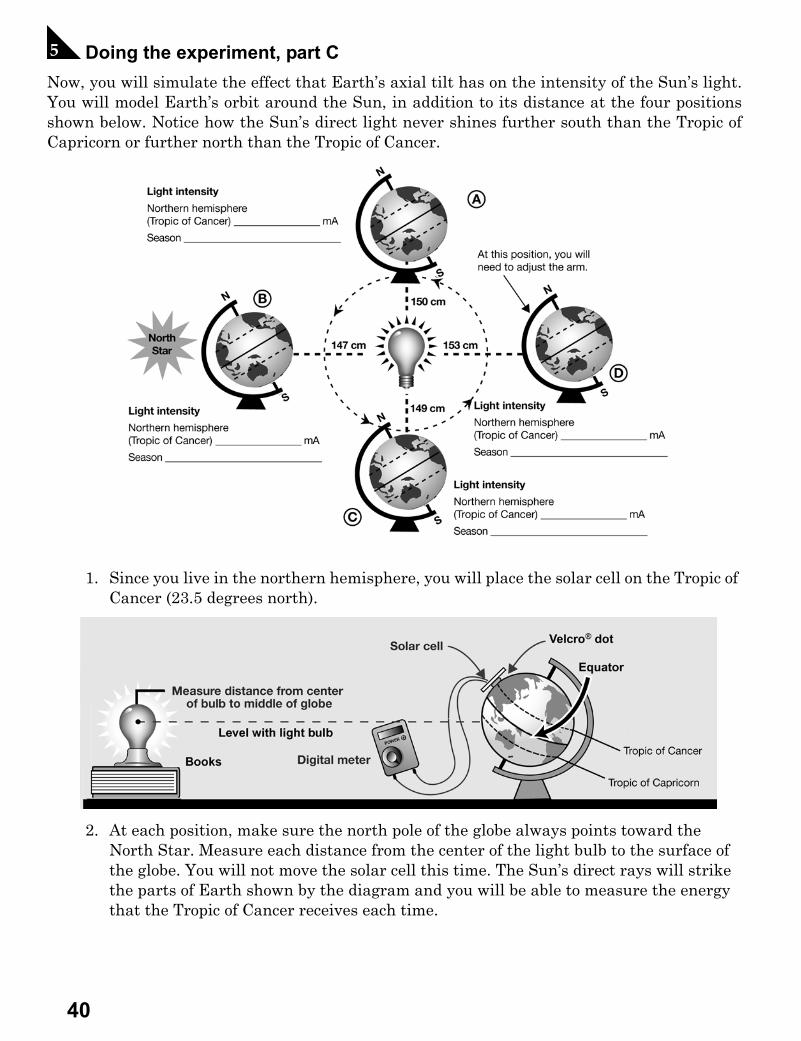
E Doing the experiment, part CNow, you will simulate the effect that Earth’s axial tilt has on the intensity of the Sun’s light.You will model Earth’s orbit around the Sun, in addition to its distance at the four positionsshown below. Notice how the Sun’s direct light never shines further south than the Tropic ofCapricorn or further north than the Tropic of Cancer.
1. Since you live in the northern hemisphere, you will place the solar cell on the Tropic of Cancer (23.5 degrees north).
2. At each position, make sure the north pole of the globe always points toward the North Star. Measure each distance from the center of the light bulb to the surface of the globe. You will not move the solar cell this time. The Sun’s direct rays will strike the parts of Earth shown by the diagram and you will be able to measure the energy that the Tropic of Cancer receives each time.
40
Investigation 6A Earth’s Seasons
• For Position A, the bulb should be level with the equator and the solar cell will be on the Tropic of Cancer. At this time of year, the Sun’s direct rays don’t hit the Tropic of Cancer—they hit the equator. The north pole should be pointed at the North Star. The distance should be 150 cm from the center of the bulb to the globe surface.
• For Position B, the bulb should be level with the Tropic of Capricorn, since during this time of year, the Sun’s direct rays hit here. Still leave the solar cell where it is.
• For Position C, the bulb should be level again with the equator. This is where the direct rays of the Sun shine at this time of year.
• See if you can figure out Position D on your own. If not, ask a partner or your teacher for help.
1. Write the light intensity values at each position on the graphic. At position D, you will need to move the arm of the globe slightly to the left or right in order to line up the bulb and solar cell.
2. Answer the questions below and then complete the questions for part 6.
Questions:
a. What role does axial tilt play in the intensity of light on Earth?
b. At which position (A, B, C, or D) does the Tropic of Cancer receive the most light? What season do you think that represents?
F Thinking about what you observed a. Of the two factors—distance from the light source and axial tilt – which plays the most
significant role in causing the seasons? Was your hypothesis supported by your results?
b. Based on your results, which position (A-D) represents the first day of summer in the northern hemisphere? Which position represents the first day of winter in the northern hemisphere?
c. Which quarter of earth’s orbit represents summer in the northern hemisphere (from A to B, B to C, C to D, or D to A)? Explain your answer based on your results from the investigation.
d. Now go back to the diagram and write in all the northern hemisphere seasons at the appropriate positions. In the space below, write what would be happening at the same time in the southern hemisphere.
41
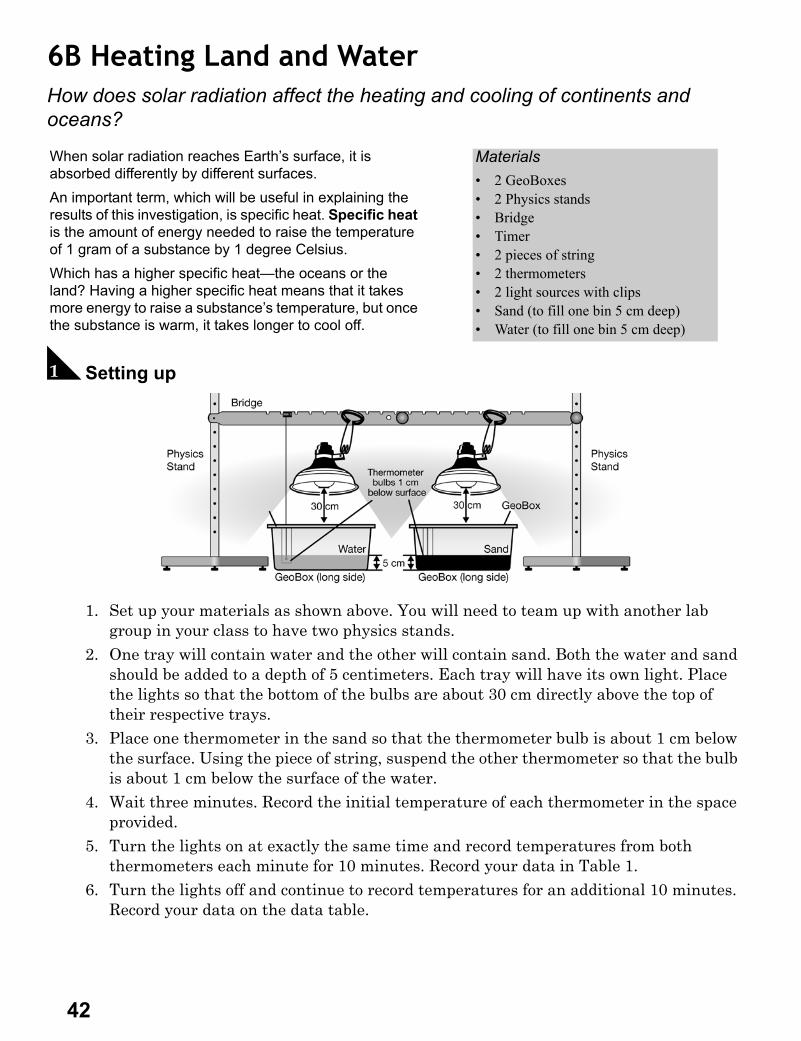
6B Heating Land and WaterHow does solar radiation affect the heating and cooling of continents and oceans?
A Setting up
1. Set up your materials as shown above. You will need to team up with another lab group in your class to have two physics stands.
2. One tray will contain water and the other will contain sand. Both the water and sand should be added to a depth of 5 centimeters. Each tray will have its own light. Place the lights so that the bottom of the bulbs are about 30 cm directly above the top of their respective trays.
3. Place one thermometer in the sand so that the thermometer bulb is about 1 cm below the surface. Using the piece of string, suspend the other thermometer so that the bulb is about 1 cm below the surface of the water.
4. Wait three minutes. Record the initial temperature of each thermometer in the space provided.
5. Turn the lights on at exactly the same time and record temperatures from both thermometers each minute for 10 minutes. Record your data in Table 1.
6. Turn the lights off and continue to record temperatures for an additional 10 minutes. Record your data on the data table.
When solar radiation reaches Earth’s surface, it is absorbed differently by different surfaces.An important term, which will be useful in explaining the results of this investigation, is specific heat. Specific heat is the amount of energy needed to raise the temperature of 1 gram of a substance by 1 degree Celsius.Which has a higher specific heat—the oceans or the land? Having a higher specific heat means that it takes more energy to raise a substance’s temperature, but once the substance is warm, it takes longer to cool off.
Materials• 2 GeoBoxes• 2 Physics stands• Bridge• Timer• 2 pieces of string• 2 thermometers• 2 light sources with clips • Sand (to fill one bin 5 cm deep)• Water (to fill one bin 5 cm deep)
42
Investigation 6B Heating Land and Water
B Stop and think
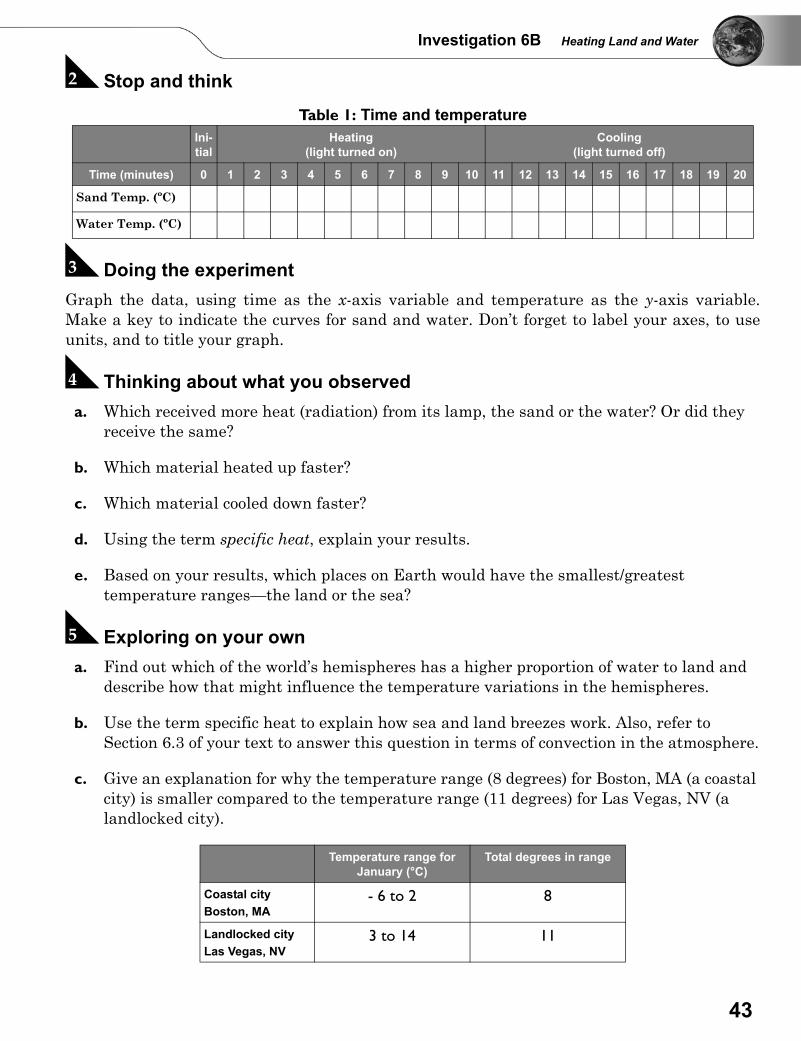
C Doing the experiment Graph the data, using time as the x-axis variable and temperature as the y-axis variable.Make a key to indicate the curves for sand and water. Don’t forget to label your axes, to useunits, and to title your graph.
D Thinking about what you observed a. Which received more heat (radiation) from its lamp, the sand or the water? Or did they
receive the same?
b. Which material heated up faster?
c. Which material cooled down faster?
d. Using the term specific heat, explain your results.
e. Based on your results, which places on Earth would have the smallest/greatest temperature ranges—the land or the sea?
E Exploring on your own a. Find out which of the world’s hemispheres has a higher proportion of water to land and
describe how that might influence the temperature variations in the hemispheres.
b. Use the term specific heat to explain how sea and land breezes work. Also, refer to Section 6.3 of your text to answer this question in terms of convection in the atmosphere.
c. Give an explanation for why the temperature range (8 degrees) for Boston, MA (a coastal city) is smaller compared to the temperature range (11 degrees) for Las Vegas, NV (a landlocked city).
Table 1: Time and temperatureIni-tial
Heating(light turned on)
Cooling(light turned off)
Time (minutes) 0 1 2 3 4 5 6 7 8 9 10 11 12 13 14 15 16 17 18 19 20
Sand Temp. (ºC)
Water Temp. (ºC)
Temperature range for January (°C)
Total degrees in range
Coastal cityBoston, MA
- 6 to 2 8
Landlocked cityLas Vegas, NV
3 to 14 11
43
7A All Cracked UpWhat is a good way to model Earth?
A Procedure1. You will be shown three different objects that can serve as models for Earth. Make a
sketch of each model.2. Write the name of each object in the first column of Table 1. Then, based on your
understanding of Earth, determine each model's strengths and weaknesses. Write your evaluations in Table 1.
3. Of the three models, which do you feel is the most accurate for modeling the layers of Earth? Which model do you feel is the least accurate? Explain your reasoning behind both answers.
4. Your teacher will now conduct a short demonstration using a hard-boiled egg as a model for the interior of Earth. Record and sketch your observations of the egg model in the space below. Be sure to make observations and sketches of both the interior and exterior of the egg.
Modeling is an extremely important practice when studying science. Many of the objects that a scientist would study, such as a planet or a molecule, are much too big or too small to work with by hand. Models can help a scientist solve this problem. Some examples of scale models a scientist might build include shrinking a planet down to the size of a basketball or blowing up a molecule to the size of a tennis ball. These models make objects easier for scientist to conduct their research. Think about a geologist studying plate tectonics and continental drift—two concepts you will learn more about in Chapter 8. The geologist would likely build small scale models of each of Earth's tectonic plates in order to easier understand how the movements of the plates affect one another.Different kinds of scale models serve different purposes. In this activity, you will examine several geologic models of Earth to learn more about some of Earth's important features.
Materials• Three objects that can
serve as models of Earth.
Examples: a ping-pong ball, a baseball, a golf ball, an orange, a basketball, etc.
Table 1: Evaluating your modelsModel Strengths Weaknesses
44
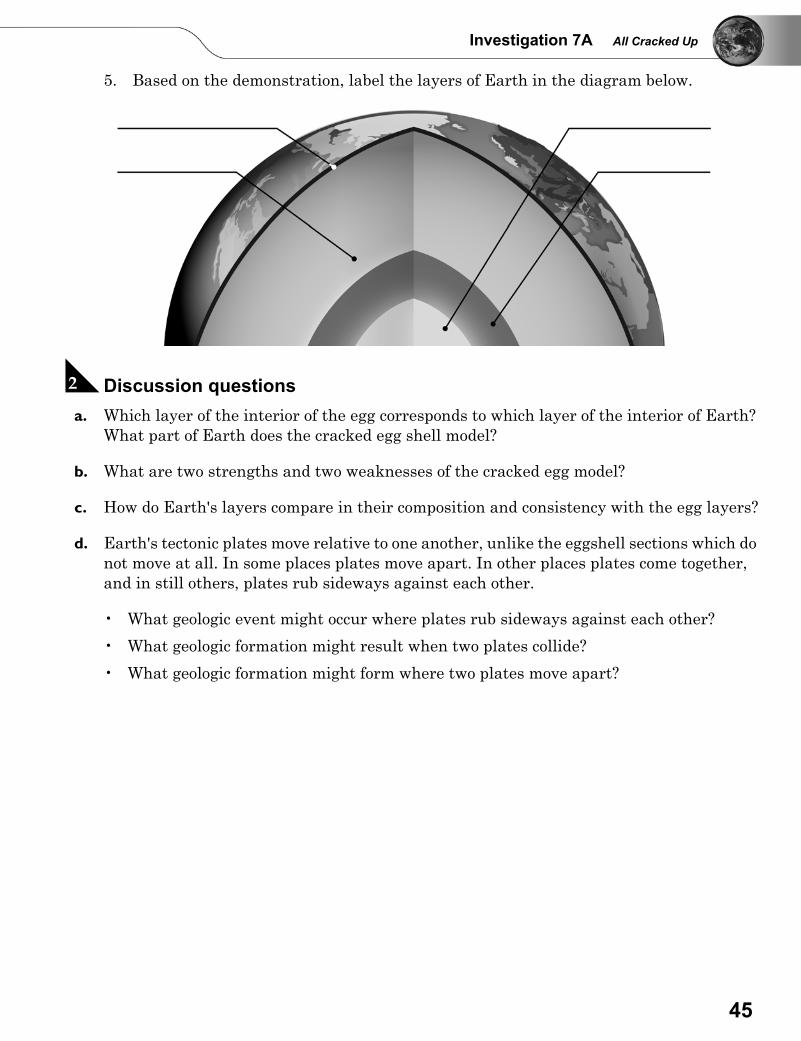
Investigation 7A All Cracked Up
5. Based on the demonstration, label the layers of Earth in the diagram below.
B Discussion questions a. Which layer of the interior of the egg corresponds to which layer of the interior of Earth?
What part of Earth does the cracked egg shell model?
b. What are two strengths and two weaknesses of the cracked egg model?
c. How do Earth's layers compare in their composition and consistency with the egg layers?
d. Earth's tectonic plates move relative to one another, unlike the eggshell sections which do not move at all. In some places plates move apart. In other places plates come together, and in still others, plates rub sideways against each other.
• What geologic event might occur where plates rub sideways against each other?
• What geologic formation might result when two plates collide?
• What geologic formation might form where two plates move apart?
45
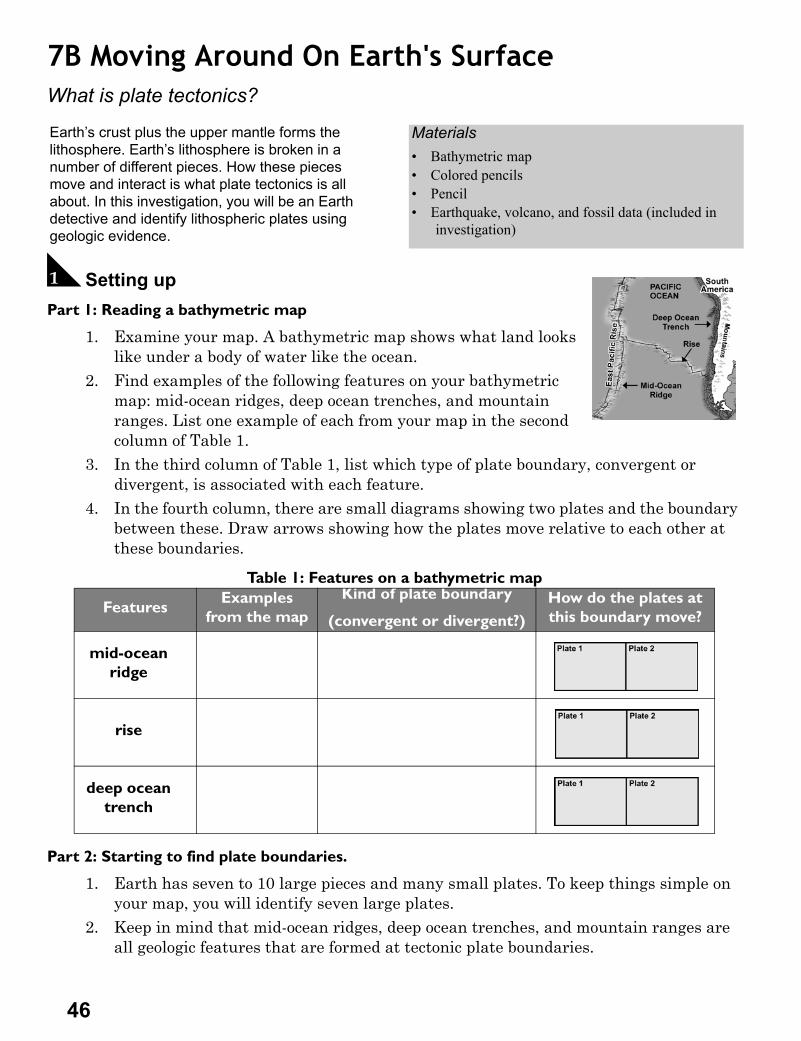
7B Moving Around On Earth's SurfaceWhat is plate tectonics?
A Setting upPart 1: Reading a bathymetric map
1. Examine your map. A bathymetric map shows what land looks like under a body of water like the ocean.
2. Find examples of the following features on your bathymetric map: mid-ocean ridges, deep ocean trenches, and mountain ranges. List one example of each from your map in the second column of Table 1.
3. In the third column of Table 1, list which type of plate boundary, convergent or divergent, is associated with each feature.
4. In the fourth column, there are small diagrams showing two plates and the boundary between these. Draw arrows showing how the plates move relative to each other at these boundaries.
Part 2: Starting to find plate boundaries.
1. Earth has seven to 10 large pieces and many small plates. To keep things simple on your map, you will identify seven large plates.
2. Keep in mind that mid-ocean ridges, deep ocean trenches, and mountain ranges are all geologic features that are formed at tectonic plate boundaries.
Earth’s crust plus the upper mantle forms the lithosphere. Earth’s lithosphere is broken in a number of different pieces. How these pieces move and interact is what plate tectonics is all about. In this investigation, you will be an Earth detective and identify lithospheric plates using geologic evidence.
Materials• Bathymetric map• Colored pencils• Pencil• Earthquake, volcano, and fossil data (included in
investigation)
Table 1: Features on a bathymetric map
Features Examples from the map
Kind of plate boundary
(convergent or divergent?)How do the plates at this boundary move?
mid-ocean ridge
rise
deep ocean trench
46
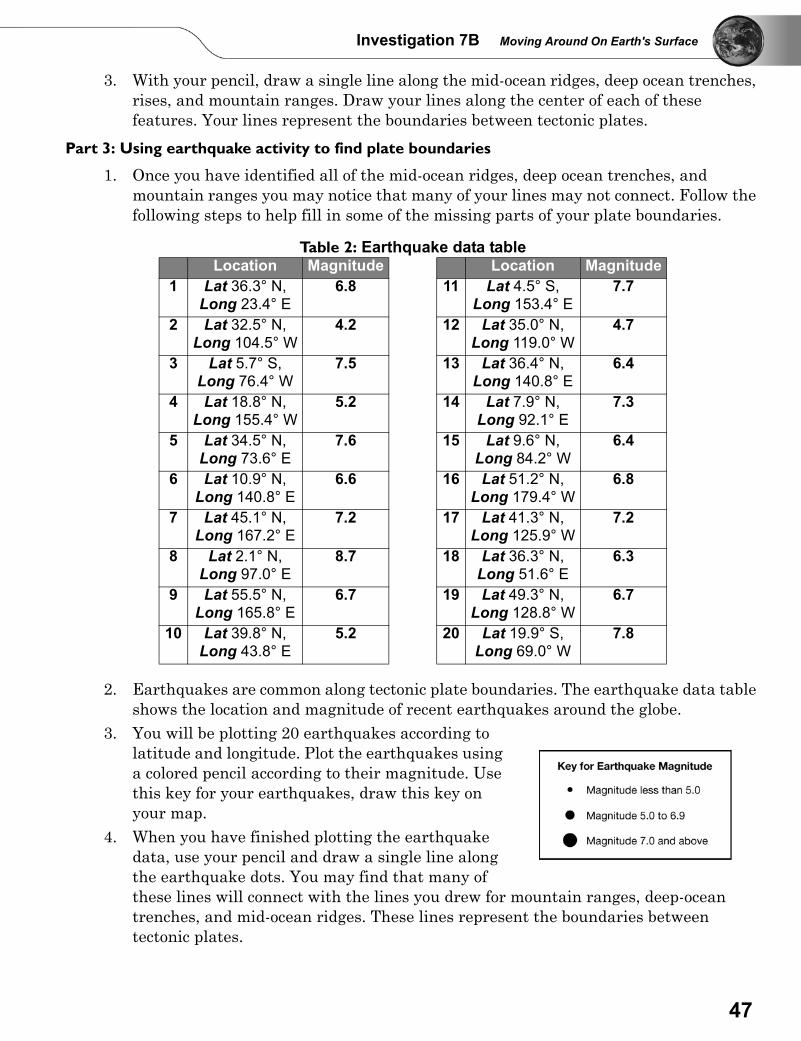
Investigation 7B Moving Around On Earth's Surface
3. With your pencil, draw a single line along the mid-ocean ridges, deep ocean trenches, rises, and mountain ranges. Draw your lines along the center of each of these features. Your lines represent the boundaries between tectonic plates.
Part 3: Using earthquake activity to find plate boundaries
1. Once you have identified all of the mid-ocean ridges, deep ocean trenches, and mountain ranges you may notice that many of your lines may not connect. Follow the following steps to help fill in some of the missing parts of your plate boundaries.
2. Earthquakes are common along tectonic plate boundaries. The earthquake data table shows the location and magnitude of recent earthquakes around the globe.
3. You will be plotting 20 earthquakes according to latitude and longitude. Plot the earthquakes using a colored pencil according to their magnitude. Use this key for your earthquakes, draw this key on your map.
4. When you have finished plotting the earthquake data, use your pencil and draw a single line along the earthquake dots. You may find that many of these lines will connect with the lines you drew for mountain ranges, deep-ocean trenches, and mid-ocean ridges. These lines represent the boundaries between tectonic plates.
Table 2: Earthquake data tableLocation Magnitude Location Magnitude
1 Lat 36.3° N, Long 23.4° E
6.8 11 Lat 4.5° S, Long 153.4° E
7.7
2 Lat 32.5° N, Long 104.5° W
4.2 12 Lat 35.0° N, Long 119.0° W
4.7
3 Lat 5.7° S, Long 76.4° W
7.5 13 Lat 36.4° N, Long 140.8° E
6.4
4 Lat 18.8° N, Long 155.4° W
5.2 14 Lat 7.9° N, Long 92.1° E
7.3
5 Lat 34.5° N, Long 73.6° E
7.6 15 Lat 9.6° N, Long 84.2° W
6.4
6 Lat 10.9° N, Long 140.8° E
6.6 16 Lat 51.2° N, Long 179.4° W
6.8
7 Lat 45.1° N, Long 167.2° E
7.2 17 Lat 41.3° N, Long 125.9° W
7.2
8 Lat 2.1° N, Long 97.0° E
8.7 18 Lat 36.3° N, Long 51.6° E
6.3
9 Lat 55.5° N, Long 165.8° E
6.7 19 Lat 49.3° N, Long 128.8° W
6.7
10 Lat 39.8° N, Long 43.8° E
5.2 20 Lat 19.9° S, Long 69.0° W
7.8
47
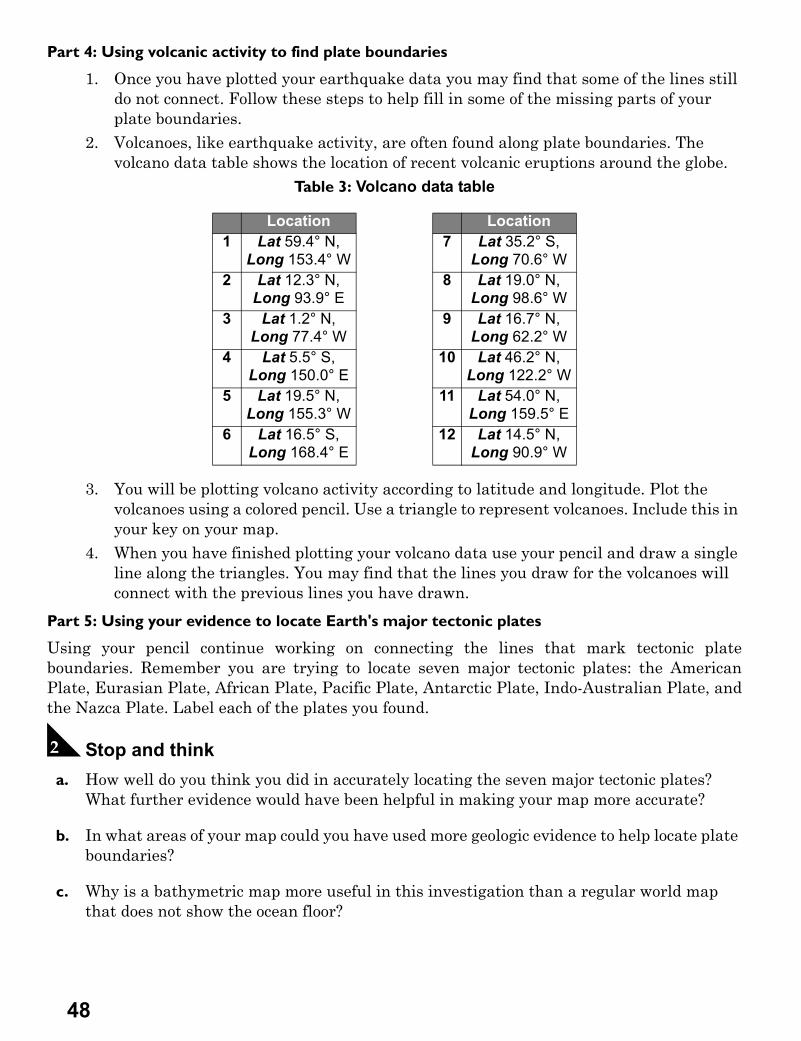
Part 4: Using volcanic activity to find plate boundaries
1. Once you have plotted your earthquake data you may find that some of the lines still do not connect. Follow these steps to help fill in some of the missing parts of your plate boundaries.
2. Volcanoes, like earthquake activity, are often found along plate boundaries. The volcano data table shows the location of recent volcanic eruptions around the globe.
Table 3: Volcano data table
3. You will be plotting volcano activity according to latitude and longitude. Plot the volcanoes using a colored pencil. Use a triangle to represent volcanoes. Include this in your key on your map.
4. When you have finished plotting your volcano data use your pencil and draw a single line along the triangles. You may find that the lines you draw for the volcanoes will connect with the previous lines you have drawn.
Part 5: Using your evidence to locate Earth's major tectonic plates
Using your pencil continue working on connecting the lines that mark tectonic plateboundaries. Remember you are trying to locate seven major tectonic plates: the AmericanPlate, Eurasian Plate, African Plate, Pacific Plate, Antarctic Plate, Indo-Australian Plate, andthe Nazca Plate. Label each of the plates you found.
B Stop and think a. How well do you think you did in accurately locating the seven major tectonic plates?
What further evidence would have been helpful in making your map more accurate?
b. In what areas of your map could you have used more geologic evidence to help locate plate boundaries?
c. Why is a bathymetric map more useful in this investigation than a regular world map that does not show the ocean floor?
Location Location1 Lat 59.4° N,
Long 153.4° W7 Lat 35.2° S,
Long 70.6° W2 Lat 12.3° N,
Long 93.9° E8 Lat 19.0° N,
Long 98.6° W3 Lat 1.2° N,
Long 77.4° W9 Lat 16.7° N,
Long 62.2° W4 Lat 5.5° S,
Long 150.0° E10 Lat 46.2° N,
Long 122.2° W5 Lat 19.5° N,
Long 155.3° W11 Lat 54.0° N,
Long 159.5° E6 Lat 16.5° S,
Long 168.4° E12 Lat 14.5° N,
Long 90.9° W
48
Investigation 7B Moving Around On Earth's Surface
C Doing the experiment1. Now that you have come up with a hypothesis of where the seven major tectonic
plates are located your teacher will help you distinguish the actual location of the seven plates.
2. When you have the actual locations of the seven major tectonic plates used your colored pencils to shade in each of the plates a different color. Be sure you have written the name of each of the seven plates on your map as well.
D Thinking about what you observed a. Find the Himalayan Mountains on your map. These mountains are continuing to grow
taller. What does this tell you about the type of plate boundary between the Eurasian plate and the Indo-Australian plate?
b. The boundary around the Pacific plate is commonly referred to as the “Ring of Fire.” Examine the geologic events along this boundary, why do you think this boundary has been given this name?
c. Find the Mid-Atlantic Ridge on your map. The Atlantic Ocean was once much smaller millions of years ago and has been growing in size to present day. What does this tell you about the type of plate boundary that exists at the Mid-Atlantic Ridge?
d. The boundary between the African Plate and the Eurasian Plate in the Mediterranean Sea is a convergent boundary. Africa is slowly pushing northward towards Europe. What will eventually become of the Mediterranean Sea in the future? Why?
e. The boundaries between the Eurasian Plate and the Indo-Australian Plate as well as the Nazca Plate and the South American plate are convergent boundaries. What is a major difference in the geologic features and events at these two plate boundaries?
49
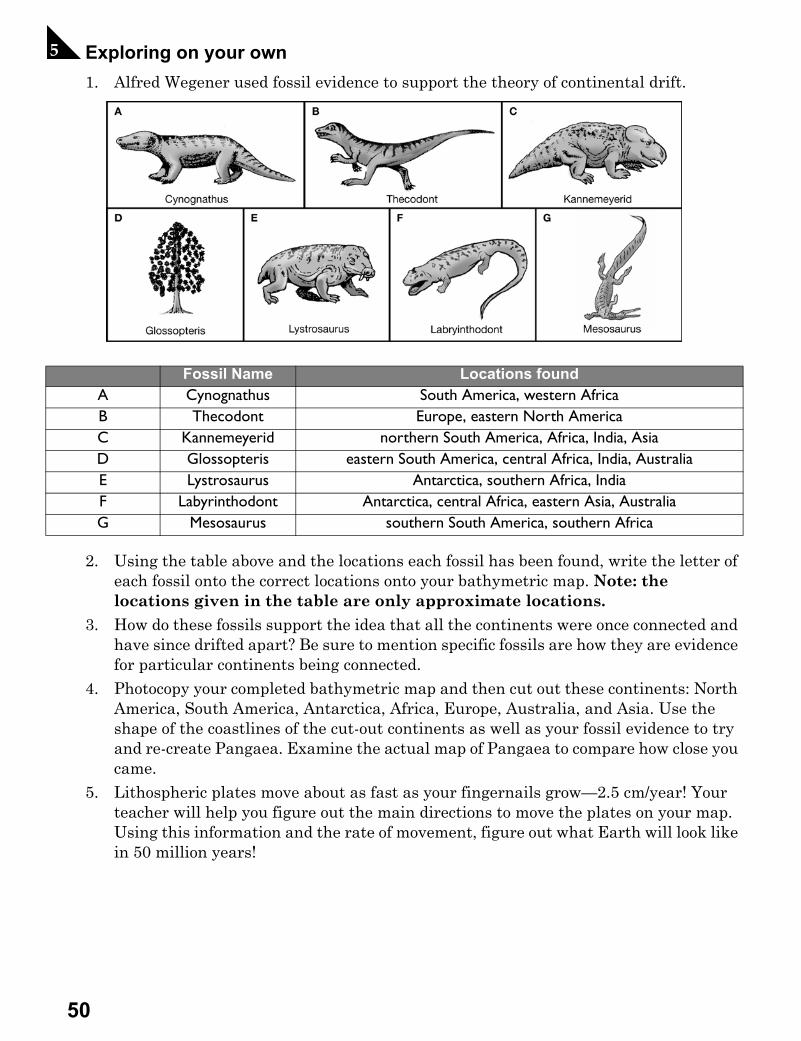
E Exploring on your own 1. Alfred Wegener used fossil evidence to support the theory of continental drift.
2. Using the table above and the locations each fossil has been found, write the letter of each fossil onto the correct locations onto your bathymetric map. Note: the locations given in the table are only approximate locations.
3. How do these fossils support the idea that all the continents were once connected and have since drifted apart? Be sure to mention specific fossils are how they are evidence for particular continents being connected.
4. Photocopy your completed bathymetric map and then cut out these continents: North America, South America, Antarctica, Africa, Europe, Australia, and Asia. Use the shape of the coastlines of the cut-out continents as well as your fossil evidence to try and re-create Pangaea. Examine the actual map of Pangaea to compare how close you came.
5. Lithospheric plates move about as fast as your fingernails grow—2.5 cm/year! Your teacher will help you figure out the main directions to move the plates on your map. Using this information and the rate of movement, figure out what Earth will look like in 50 million years!
Fossil Name Locations foundA Cynognathus South America, western AfricaB Thecodont Europe, eastern North AmericaC Kannemeyerid northern South America, Africa, India, AsiaD Glossopteris eastern South America, central Africa, India, AustraliaE Lystrosaurus Antarctica, southern Africa, IndiaF Labyrinthodont Antarctica, central Africa, eastern Asia, AustraliaG Mesosaurus southern South America, southern Africa
50
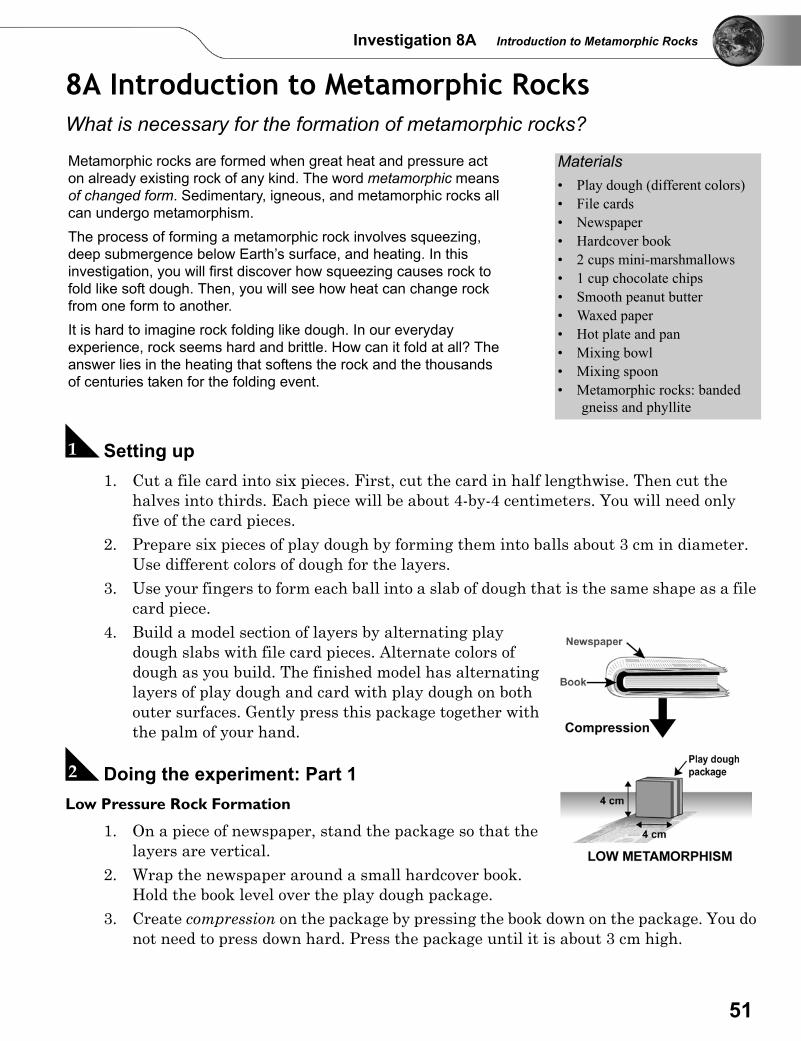
Investigation 8A Introduction to Metamorphic Rocks
8A Introduction to Metamorphic RocksWhat is necessary for the formation of metamorphic rocks?
A Setting up1. Cut a file card into six pieces. First, cut the card in half lengthwise. Then cut the
halves into thirds. Each piece will be about 4-by-4 centimeters. You will need only five of the card pieces.
2. Prepare six pieces of play dough by forming them into balls about 3 cm in diameter. Use different colors of dough for the layers.
3. Use your fingers to form each ball into a slab of dough that is the same shape as a file card piece.
4. Build a model section of layers by alternating play dough slabs with file card pieces. Alternate colors of dough as you build. The finished model has alternating layers of play dough and card with play dough on both outer surfaces. Gently press this package together with the palm of your hand.
B Doing the experiment: Part 1Low Pressure Rock Formation
1. On a piece of newspaper, stand the package so that the layers are vertical.
2. Wrap the newspaper around a small hardcover book. Hold the book level over the play dough package.
3. Create compression on the package by pressing the book down on the package. You do not need to press down hard. Press the package until it is about 3 cm high.
Metamorphic rocks are formed when great heat and pressure act on already existing rock of any kind. The word metamorphic means of changed form. Sedimentary, igneous, and metamorphic rocks all can undergo metamorphism.The process of forming a metamorphic rock involves squeezing, deep submergence below Earth’s surface, and heating. In this investigation, you will first discover how squeezing causes rock to fold like soft dough. Then, you will see how heat can change rock from one form to another. It is hard to imagine rock folding like dough. In our everyday experience, rock seems hard and brittle. How can it fold at all? The answer lies in the heating that softens the rock and the thousands of centuries taken for the folding event.
Materials• Play dough (different colors)• File cards• Newspaper• Hardcover book• 2 cups mini-marshmallows• 1 cup chocolate chips• Smooth peanut butter• Waxed paper• Hot plate and pan• Mixing bowl• Mixing spoon• Metamorphic rocks: banded
gneiss and phyllite
51
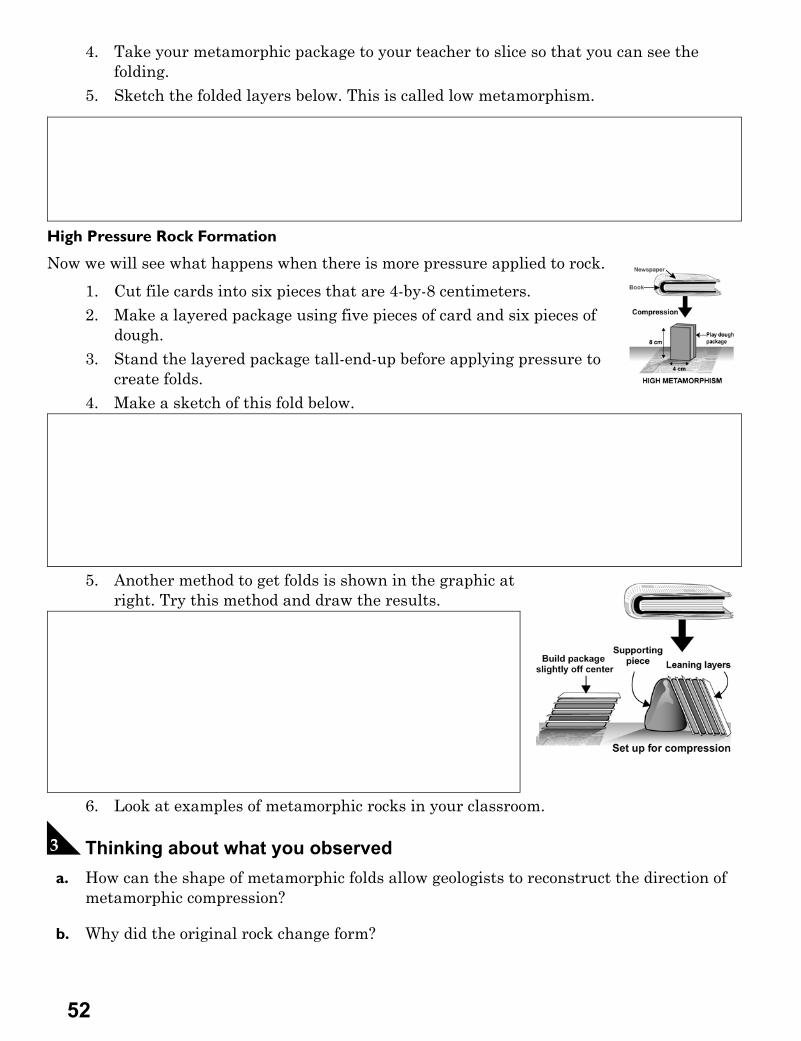
4. Take your metamorphic package to your teacher to slice so that you can see the folding.
5. Sketch the folded layers below. This is called low metamorphism..
High Pressure Rock Formation
Now we will see what happens when there is more pressure applied to rock.
1. Cut file cards into six pieces that are 4-by-8 centimeters. 2. Make a layered package using five pieces of card and six pieces of
dough. 3. Stand the layered package tall-end-up before applying pressure to
create folds. 4. Make a sketch of this fold below.
5. Another method to get folds is shown in the graphic at right. Try this method and draw the results.
6. Look at examples of metamorphic rocks in your classroom.
C Thinking about what you observed a. How can the shape of metamorphic folds allow geologists to reconstruct the direction of
metamorphic compression?
b. Why did the original rock change form?
52
Investigation 8A Introduction to Metamorphic Rocks
D Doing the experiment: Part 21. Wash your hands with soap and water. Cover your lab table with waxed paper to
provide a clean work surface. Remember that you should never eat or drink anything in a science laboratory without your teacher’s permission.
2. Mix the mini-marshmallows and chocolate chips in a bowl. Add just enough peanut butter so that the mixture is moist and clumps together.
3. Each student in the lab group should take a handful of the mixture and make a rock.4. Place the “rocks” on the waxed paper. 5. Place the rocks in the pan a few at a time and heat them over low heat. 6. When the marshmallows melt, remove the new rocks from the pan with a spoon and
placed them on the wax paper.7. With your teacher’s permission, you may taste the new rocks when they have cooled.
E Thinking about what you observed a. With what type of “rock” did you start?
b. What do each of the ingredients represent?
c. What type of “rock” resulted from your work in Part 4?
d. Why did the original rock change form?
F Exploring on your own 1. What are some uses of metamorphic rocks? Name the rock and then list its uses.2. Gather these materials: small jar, 6 squares of bubble gum (different colors), oven,
smaller jar with bolts (anything which can be used as a weight), a plastic knife, and a pot holder.Note: Be careful! The jar will be hot. Do not leave the gum in the oven longer than one-half hour. You do not want the gum to melt or burn. Burning bubble gum smells bad.• Fill the larger jar 1/2 full of bubble gum (unwrapped)• Place it in the oven (which has not been heated yet)• Put the weight inside the small jar on top of the gum• Set the oven to 350°F.• Let about 1/2 hour pass. The gum should be soft but not melted or burned. Use the
plastic knife to push the weight down gently on the gum.3. What happened to the gum?4. What type of rock does the gum represent? If the bubble gum melted, what type of
“rock” would be formed?.
53
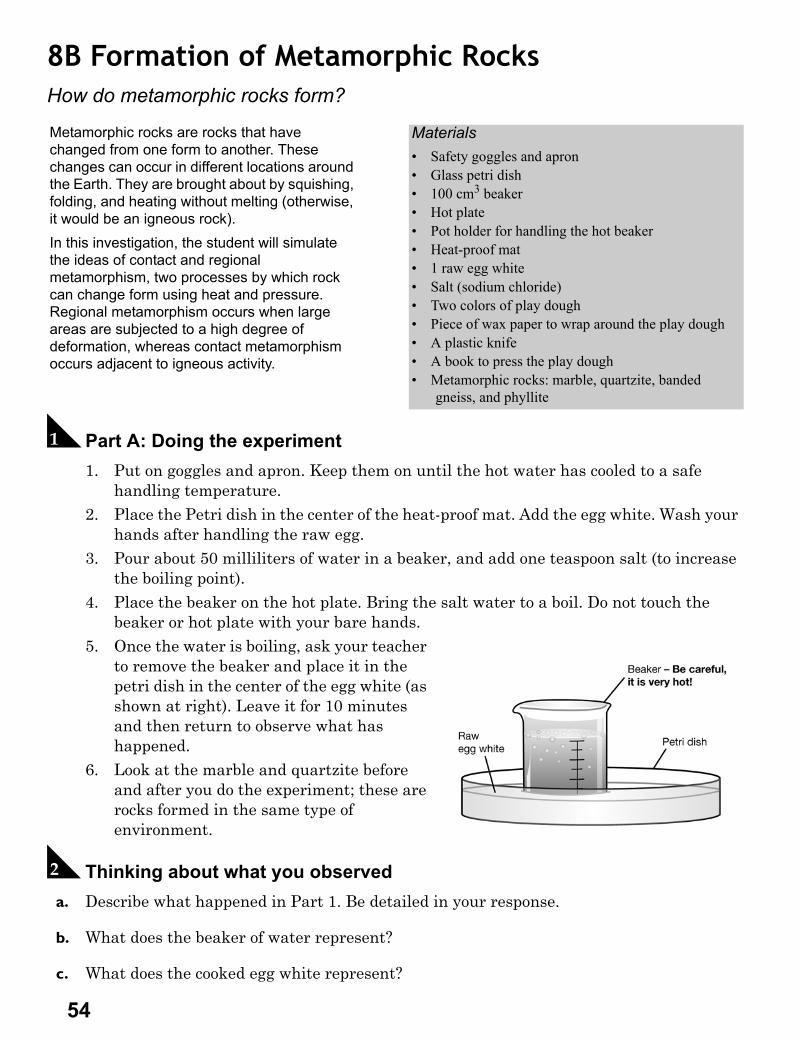
8B Formation of Metamorphic RocksHow do metamorphic rocks form?
A Part A: Doing the experiment 1. Put on goggles and apron. Keep them on until the hot water has cooled to a safe
handling temperature.2. Place the Petri dish in the center of the heat-proof mat. Add the egg white. Wash your
hands after handling the raw egg.3. Pour about 50 milliliters of water in a beaker, and add one teaspoon salt (to increase
the boiling point).4. Place the beaker on the hot plate. Bring the salt water to a boil. Do not touch the
beaker or hot plate with your bare hands.5. Once the water is boiling, ask your teacher
to remove the beaker and place it in the petri dish in the center of the egg white (as shown at right). Leave it for 10 minutes and then return to observe what has happened.
6. Look at the marble and quartzite before and after you do the experiment; these are rocks formed in the same type of environment.
B Thinking about what you observed a. Describe what happened in Part 1. Be detailed in your response.
b. What does the beaker of water represent?
c. What does the cooked egg white represent?
Metamorphic rocks are rocks that have changed from one form to another. These changes can occur in different locations around the Earth. They are brought about by squishing, folding, and heating without melting (otherwise, it would be an igneous rock). In this investigation, the student will simulate the ideas of contact and regional metamorphism, two processes by which rock can change form using heat and pressure. Regional metamorphism occurs when large areas are subjected to a high degree of deformation, whereas contact metamorphism occurs adjacent to igneous activity.
Materials• Safety goggles and apron• Glass petri dish• 100 cm3 beaker• Hot plate• Pot holder for handling the hot beaker• Heat-proof mat• 1 raw egg white• Salt (sodium chloride)• Two colors of play dough• Piece of wax paper to wrap around the play dough• A plastic knife• A book to press the play dough• Metamorphic rocks: marble, quartzite, banded
gneiss, and phyllite
54
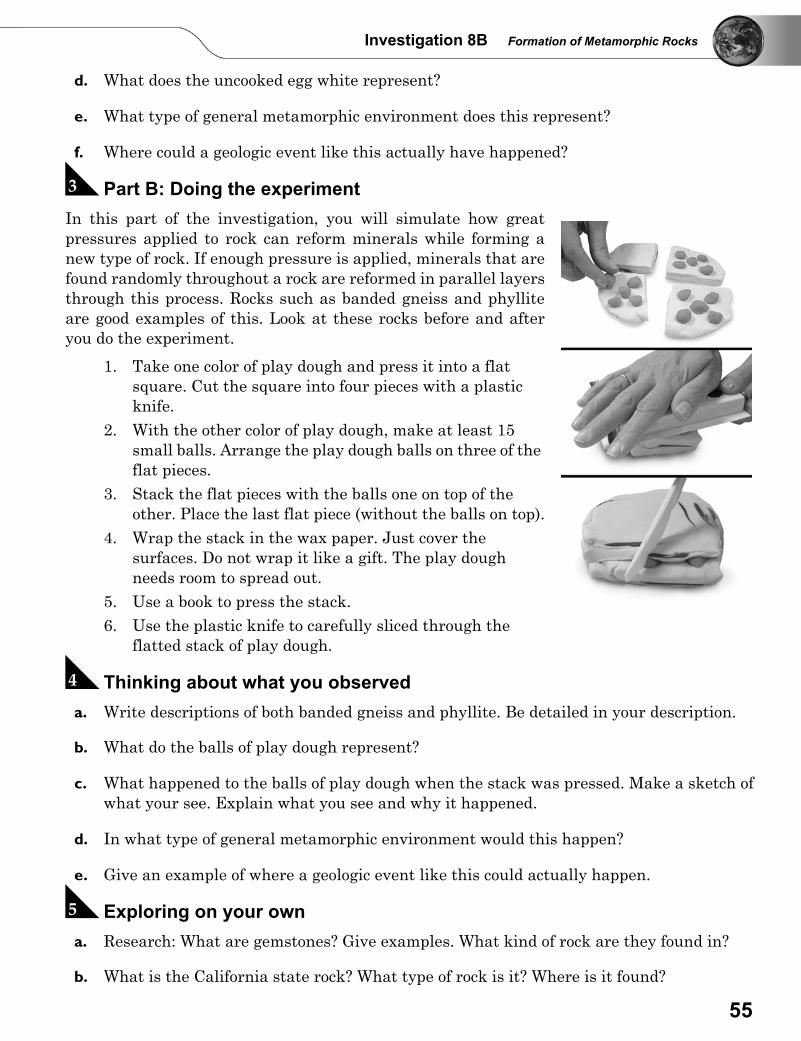
Investigation 8B Formation of Metamorphic Rocks
d. What does the uncooked egg white represent?
e. What type of general metamorphic environment does this represent?
f. Where could a geologic event like this actually have happened?
C Part B: Doing the experimentIn this part of the investigation, you will simulate how greatpressures applied to rock can reform minerals while forming anew type of rock. If enough pressure is applied, minerals that arefound randomly throughout a rock are reformed in parallel layersthrough this process. Rocks such as banded gneiss and phylliteare good examples of this. Look at these rocks before and afteryou do the experiment.
1. Take one color of play dough and press it into a flat square. Cut the square into four pieces with a plastic knife.
2. With the other color of play dough, make at least 15 small balls. Arrange the play dough balls on three of the flat pieces.
3. Stack the flat pieces with the balls one on top of the other. Place the last flat piece (without the balls on top).
4. Wrap the stack in the wax paper. Just cover the surfaces. Do not wrap it like a gift. The play dough needs room to spread out.
5. Use a book to press the stack. 6. Use the plastic knife to carefully sliced through the
flatted stack of play dough.
D Thinking about what you observed a. Write descriptions of both banded gneiss and phyllite. Be detailed in your description.
b. What do the balls of play dough represent?
c. What happened to the balls of play dough when the stack was pressed. Make a sketch of what your see. Explain what you see and why it happened.
d. In what type of general metamorphic environment would this happen?
e. Give an example of where a geologic event like this could actually happen.
E Exploring on your own a. Research: What are gemstones? Give examples. What kind of rock are they found in?
b. What is the California state rock? What type of rock is it? Where is it found?
55
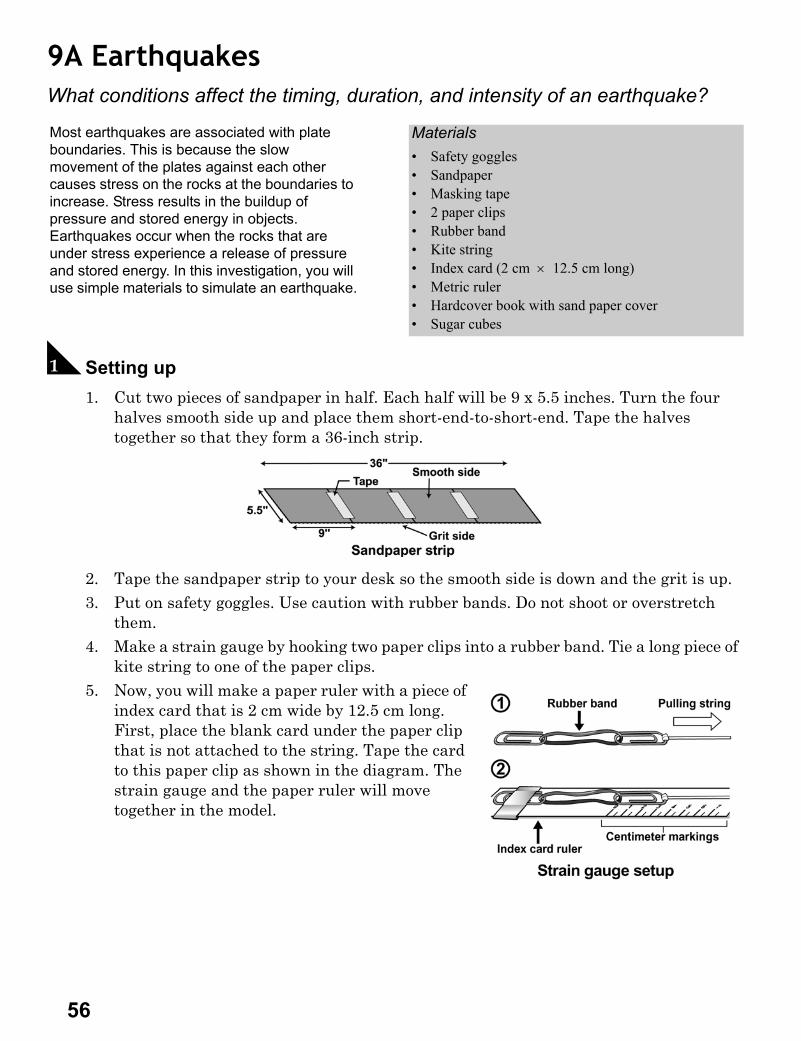
9A EarthquakesWhat conditions affect the timing, duration, and intensity of an earthquake?
A Setting up1. Cut two pieces of sandpaper in half. Each half will be 9 x 5.5 inches. Turn the four
halves smooth side up and place them short-end-to-short-end. Tape the halves together so that they form a 36-inch strip.
2. Tape the sandpaper strip to your desk so the smooth side is down and the grit is up.3. Put on safety goggles. Use caution with rubber bands. Do not shoot or overstretch
them.4. Make a strain gauge by hooking two paper clips into a rubber band. Tie a long piece of
kite string to one of the paper clips.5. Now, you will make a paper ruler with a piece of
index card that is 2 cm wide by 12.5 cm long. First, place the blank card under the paper clip that is not attached to the string. Tape the card to this paper clip as shown in the diagram. The strain gauge and the paper ruler will move together in the model.
Most earthquakes are associated with plate boundaries. This is because the slow movement of the plates against each other causes stress on the rocks at the boundaries to increase. Stress results in the buildup of pressure and stored energy in objects. Earthquakes occur when the rocks that are under stress experience a release of pressure and stored energy. In this investigation, you will use simple materials to simulate an earthquake.
Materials• Safety goggles• Sandpaper• Masking tape• 2 paper clips• Rubber band• Kite string• Index card (2 cm × 12.5 cm long)• Metric ruler• Hardcover book with sand paper cover• Sugar cubes
56
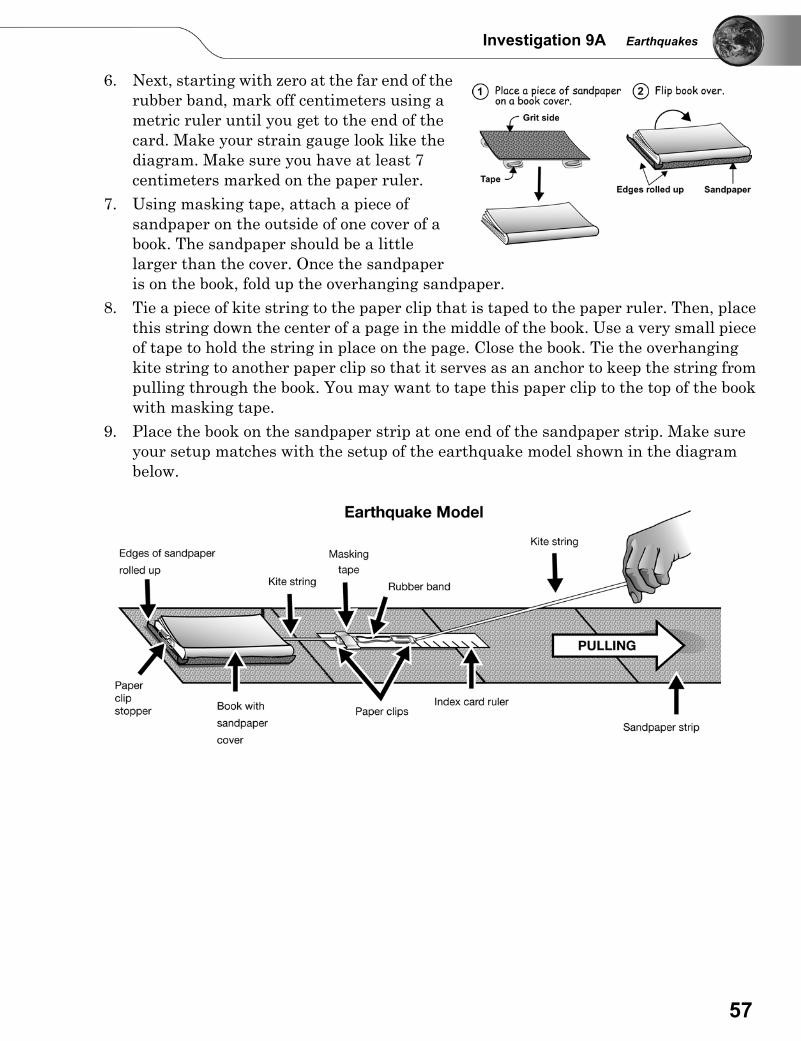
Investigation 9A Earthquakes
6. Next, starting with zero at the far end of the rubber band, mark off centimeters using a metric ruler until you get to the end of the card. Make your strain gauge look like the diagram. Make sure you have at least 7 centimeters marked on the paper ruler.
7. Using masking tape, attach a piece of sandpaper on the outside of one cover of a book. The sandpaper should be a little larger than the cover. Once the sandpaper is on the book, fold up the overhanging sandpaper.
8. Tie a piece of kite string to the paper clip that is taped to the paper ruler. Then, place this string down the center of a page in the middle of the book. Use a very small piece of tape to hold the string in place on the page. Close the book. Tie the overhanging kite string to another paper clip so that it serves as an anchor to keep the string from pulling through the book. You may want to tape this paper clip to the top of the book with masking tape.
9. Place the book on the sandpaper strip at one end of the sandpaper strip. Make sure your setup matches with the setup of the earthquake model shown in the diagram below.
57
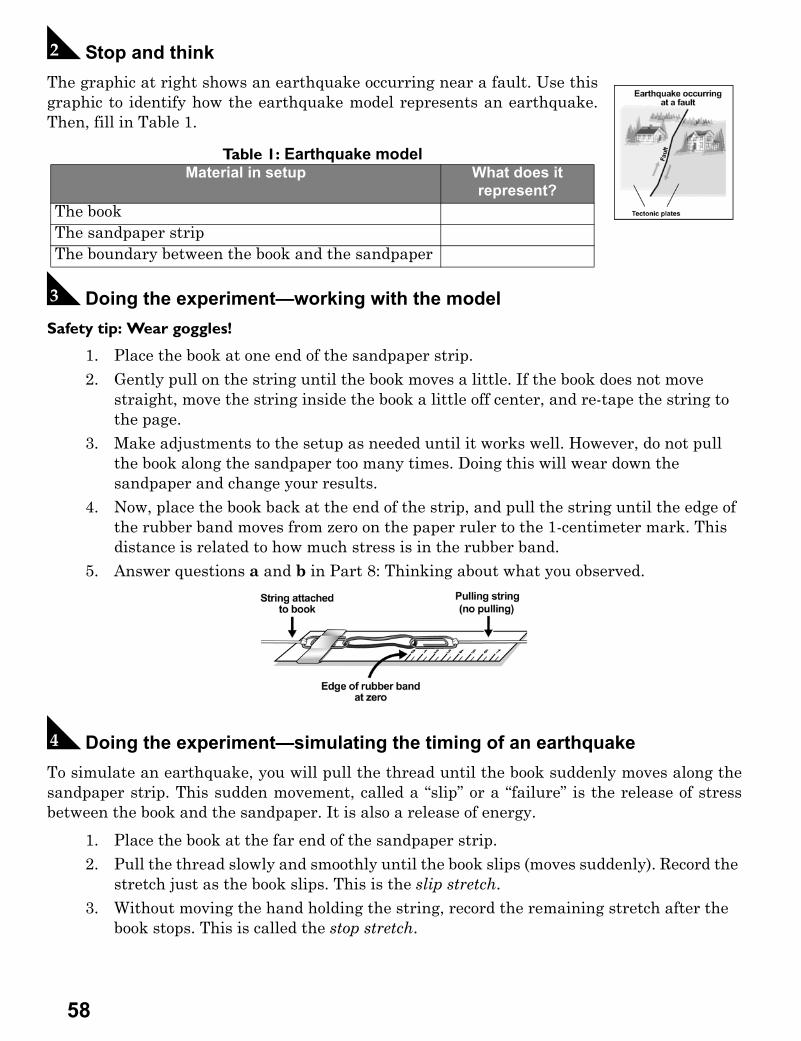
B Stop and thinkThe graphic at right shows an earthquake occurring near a fault. Use thisgraphic to identify how the earthquake model represents an earthquake.Then, fill in Table 1.
C Doing the experiment—working with the model Safety tip: Wear goggles!
1. Place the book at one end of the sandpaper strip.2. Gently pull on the string until the book moves a little. If the book does not move
straight, move the string inside the book a little off center, and re-tape the string to the page.
3. Make adjustments to the setup as needed until it works well. However, do not pull the book along the sandpaper too many times. Doing this will wear down the sandpaper and change your results.
4. Now, place the book back at the end of the strip, and pull the string until the edge of the rubber band moves from zero on the paper ruler to the 1-centimeter mark. This distance is related to how much stress is in the rubber band.
5. Answer questions a and b in Part 8: Thinking about what you observed.
D Doing the experiment—simulating the timing of an earthquakeTo simulate an earthquake, you will pull the thread until the book suddenly moves along thesandpaper strip. This sudden movement, called a “slip” or a “failure” is the release of stressbetween the book and the sandpaper. It is also a release of energy.
1. Place the book at the far end of the sandpaper strip.2. Pull the thread slowly and smoothly until the book slips (moves suddenly). Record the
stretch just as the book slips. This is the slip stretch.3. Without moving the hand holding the string, record the remaining stretch after the
book stops. This is called the stop stretch.
Table 1: Earthquake modelMaterial in setup What does it
represent?The bookThe sandpaper stripThe boundary between the book and the sandpaper
58
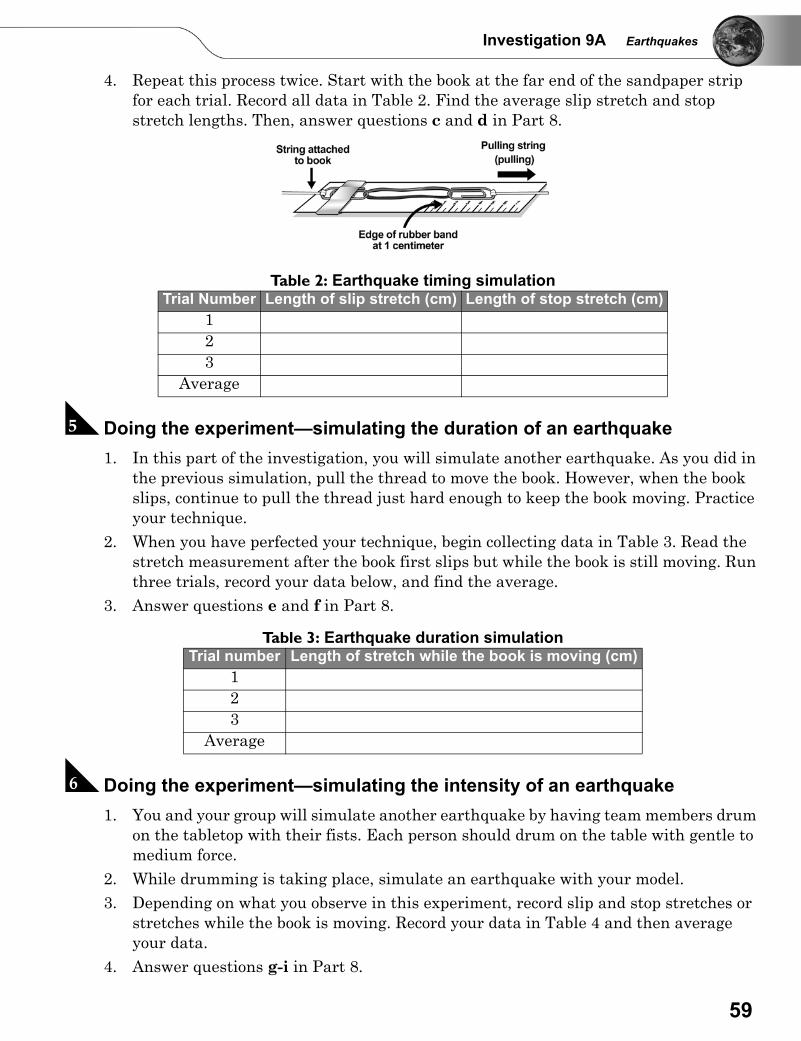
Investigation 9A Earthquakes
4. Repeat this process twice. Start with the book at the far end of the sandpaper strip for each trial. Record all data in Table 2. Find the average slip stretch and stop stretch lengths. Then, answer questions c and d in Part 8.
E Doing the experiment—simulating the duration of an earthquake1. In this part of the investigation, you will simulate another earthquake. As you did in
the previous simulation, pull the thread to move the book. However, when the book slips, continue to pull the thread just hard enough to keep the book moving. Practice your technique.
2. When you have perfected your technique, begin collecting data in Table 3. Read the stretch measurement after the book first slips but while the book is still moving. Run three trials, record your data below, and find the average.
3. Answer questions e and f in Part 8.
F Doing the experiment—simulating the intensity of an earthquake1. You and your group will simulate another earthquake by having team members drum
on the tabletop with their fists. Each person should drum on the table with gentle to medium force.
2. While drumming is taking place, simulate an earthquake with your model.3. Depending on what you observe in this experiment, record slip and stop stretches or
stretches while the book is moving. Record your data in Table 4 and then average your data.
4. Answer questions g-i in Part 8.
Table 2: Earthquake timing simulationTrial Number Length of slip stretch (cm) Length of stop stretch (cm)
123
Average
Table 3: Earthquake duration simulationTrial number Length of stretch while the book is moving (cm)
123
Average
59
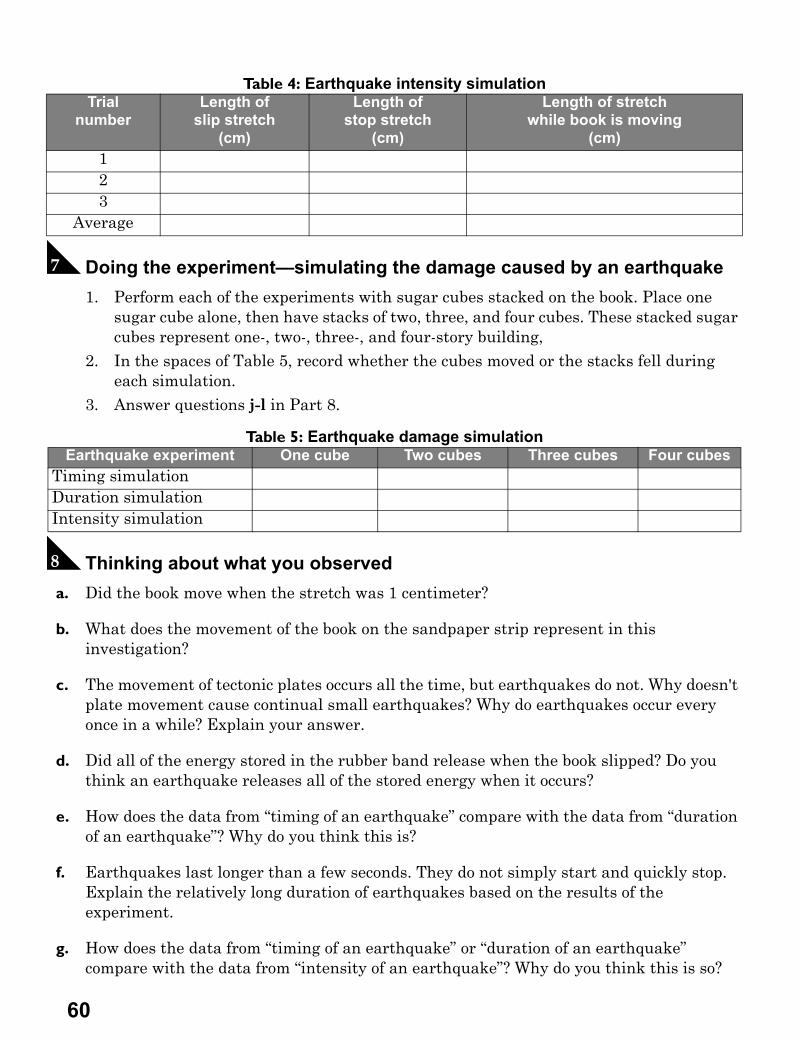
G Doing the experiment—simulating the damage caused by an earthquake1. Perform each of the experiments with sugar cubes stacked on the book. Place one
sugar cube alone, then have stacks of two, three, and four cubes. These stacked sugar cubes represent one-, two-, three-, and four-story building,
2. In the spaces of Table 5, record whether the cubes moved or the stacks fell during each simulation.
3. Answer questions j-l in Part 8.
H Thinking about what you observed a. Did the book move when the stretch was 1 centimeter?
b. What does the movement of the book on the sandpaper strip represent in this investigation?
c. The movement of tectonic plates occurs all the time, but earthquakes do not. Why doesn't plate movement cause continual small earthquakes? Why do earthquakes occur every once in a while? Explain your answer.
d. Did all of the energy stored in the rubber band release when the book slipped? Do you think an earthquake releases all of the stored energy when it occurs?
e. How does the data from “timing of an earthquake” compare with the data from “duration of an earthquake”? Why do you think this is?
f. Earthquakes last longer than a few seconds. They do not simply start and quickly stop. Explain the relatively long duration of earthquakes based on the results of the experiment.
g. How does the data from “timing of an earthquake” or “duration of an earthquake” compare with the data from “intensity of an earthquake”? Why do you think this is so?
Table 4: Earthquake intensity simulationTrial
numberLength of
slip stretch(cm)
Length of stop stretch
(cm)
Length of stretch while book is moving
(cm)123
Average
Table 5: Earthquake damage simulationEarthquake experiment One cube Two cubes Three cubes Four cubes
Timing simulationDuration simulationIntensity simulation
60
Investigation 9A Earthquakes
h. How did the drumming affect the intensity of the “earthquake” in the model?
i. Do you think one earthquake can cause another earthquake? Explain your answer.
j. Which sugar-cube building experienced the most damage? Why do you think this happened?
k. Which experiment resulted in the most damage? Why do you think this happened?
l. Given the results, suggest one safety tip that would reduce damage to buildings during an earthquake.
I Exploring on your own a. Find out what areas in the United States have the highest seismic risk.
b. In terms of plate tectonics, what is happening at the San Andreas Fault?
c. How fast is the plate movement at the San Andreas Fault?
61
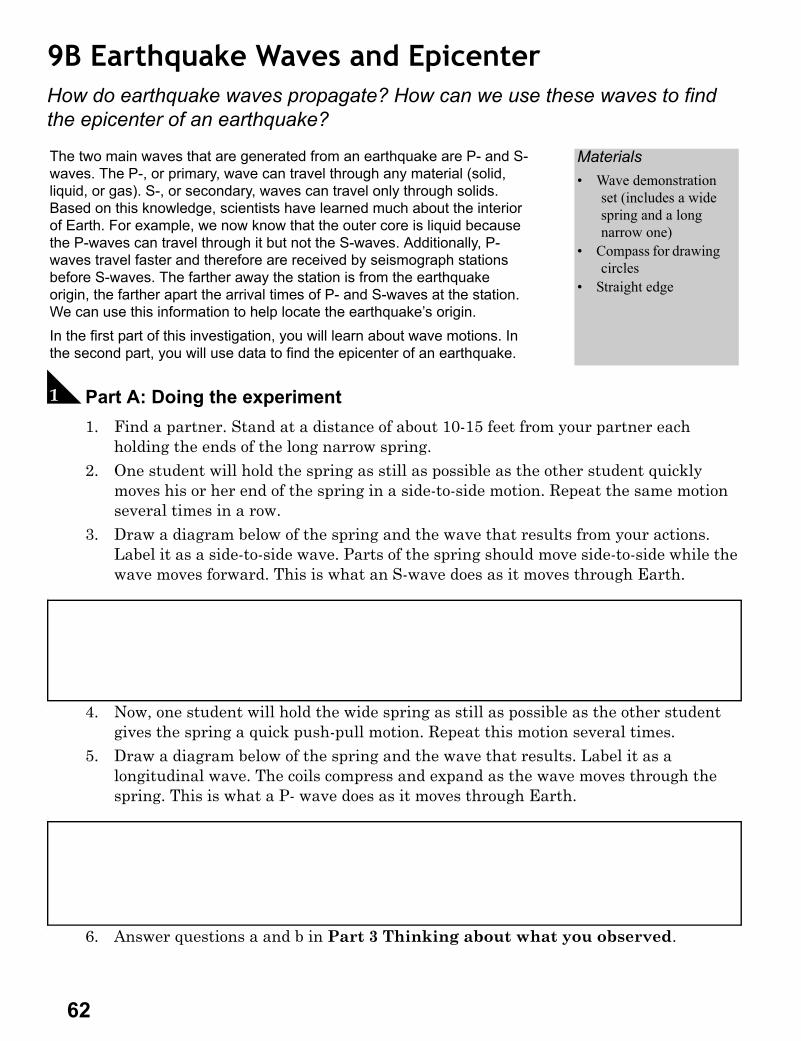
9B Earthquake Waves and EpicenterHow do earthquake waves propagate? How can we use these waves to find the epicenter of an earthquake?
A Part A: Doing the experiment 1. Find a partner. Stand at a distance of about 10-15 feet from your partner each
holding the ends of the long narrow spring.2. One student will hold the spring as still as possible as the other student quickly
moves his or her end of the spring in a side-to-side motion. Repeat the same motion several times in a row.
3. Draw a diagram below of the spring and the wave that results from your actions. Label it as a side-to-side wave. Parts of the spring should move side-to-side while the wave moves forward. This is what an S-wave does as it moves through Earth.
.
.‘
.
4. Now, one student will hold the wide spring as still as possible as the other student gives the spring a quick push-pull motion. Repeat this motion several times.
5. Draw a diagram below of the spring and the wave that results. Label it as a longitudinal wave. The coils compress and expand as the wave moves through the spring. This is what a P- wave does as it moves through Earth.
.
.‘
.
6. Answer questions a and b in Part 3 Thinking about what you observed.
The two main waves that are generated from an earthquake are P- and S-waves. The P-, or primary, wave can travel through any material (solid, liquid, or gas). S-, or secondary, waves can travel only through solids. Based on this knowledge, scientists have learned much about the interior of Earth. For example, we now know that the outer core is liquid because the P-waves can travel through it but not the S-waves. Additionally, P-waves travel faster and therefore are received by seismograph stations before S-waves. The farther away the station is from the earthquake origin, the farther apart the arrival times of P- and S-waves at the station. We can use this information to help locate the earthquake’s origin.In the first part of this investigation, you will learn about wave motions. In the second part, you will use data to find the epicenter of an earthquake.
Materials• Wave demonstration
set (includes a wide spring and a long narrow one)
• Compass for drawing circles
• Straight edge
62
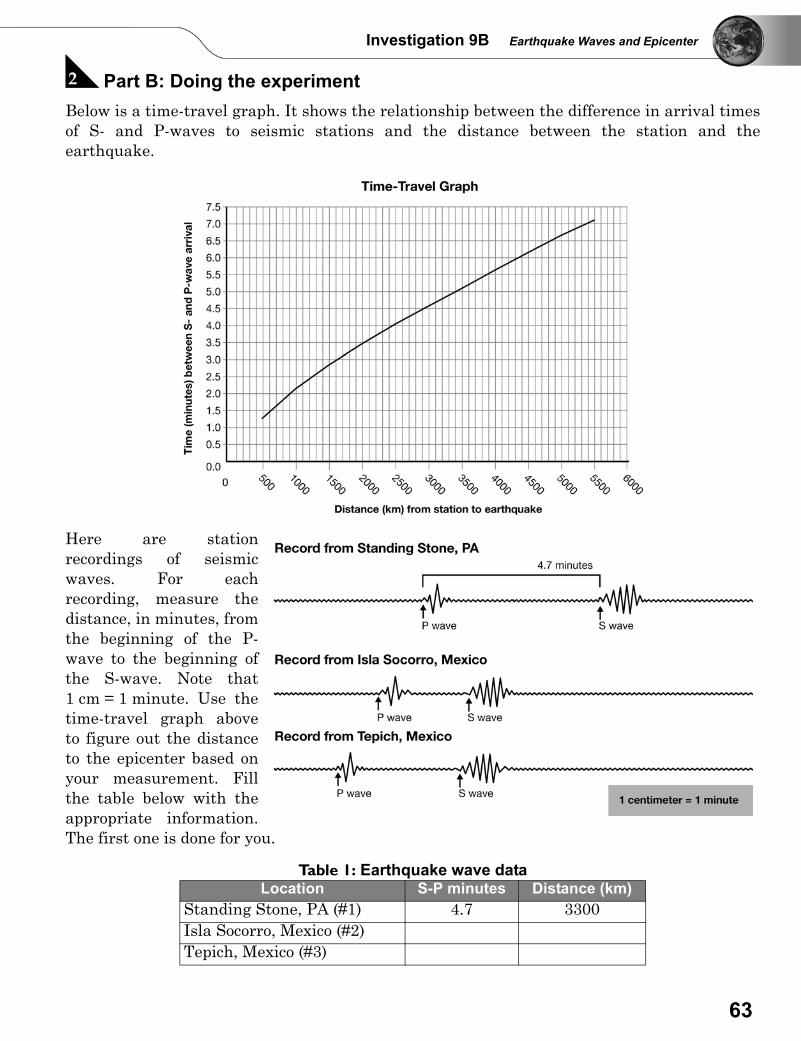
Investigation 9B Earthquake Waves and Epicenter
B Part B: Doing the experimentBelow is a time-travel graph. It shows the relationship between the difference in arrival timesof S- and P-waves to seismic stations and the distance between the station and theearthquake.
Here are stationrecordings of seismicwaves. For eachrecording, measure thedistance, in minutes, fromthe beginning of the P-wave to the beginning ofthe S-wave. Note that1 cm = 1 minute. Use thetime-travel graph aboveto figure out the distanceto the epicenter based onyour measurement. Fillthe table below with theappropriate information.The first one is done for you.
Table 1: Earthquake wave dataLocation S-P minutes Distance (km)
Standing Stone, PA (#1) 4.7 3300Isla Socorro, Mexico (#2)Tepich, Mexico (#3)
63
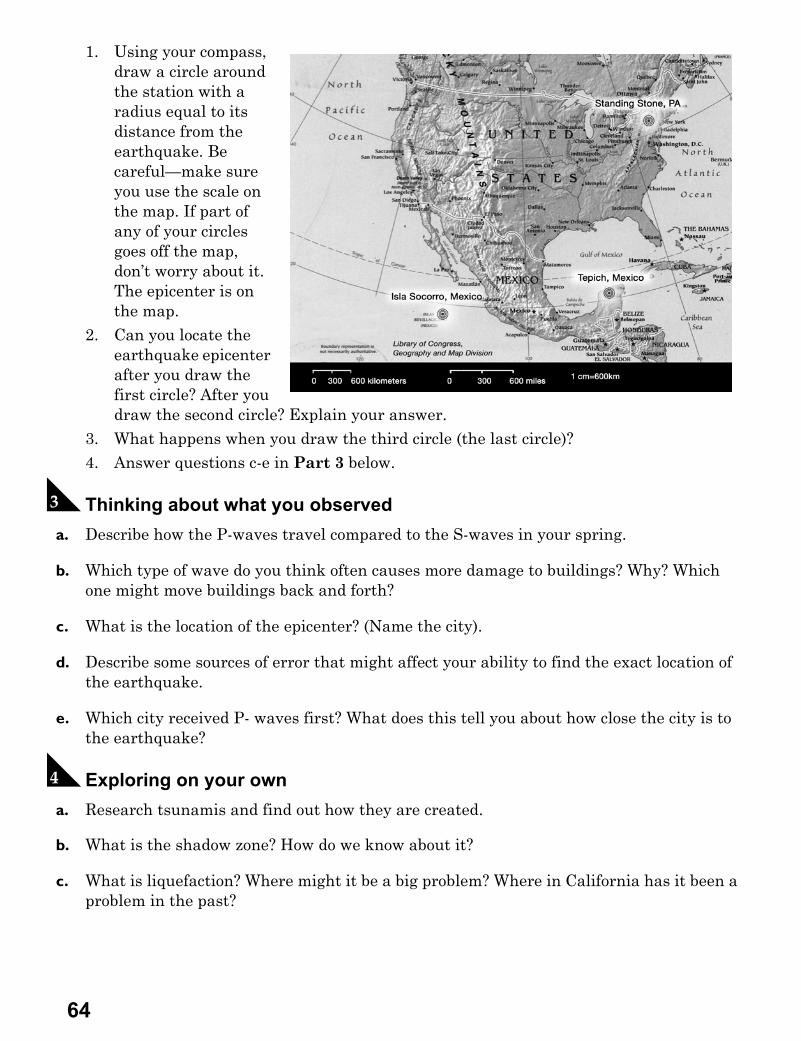
1. Using your compass, draw a circle around the station with a radius equal to its distance from the earthquake. Be careful—make sure you use the scale on the map. If part of any of your circles goes off the map, don’t worry about it. The epicenter is on the map.
2. Can you locate the earthquake epicenter after you draw the first circle? After you draw the second circle? Explain your answer.
3. What happens when you draw the third circle (the last circle)? 4. Answer questions c-e in Part 3 below.
C Thinking about what you observed a. Describe how the P-waves travel compared to the S-waves in your spring.
b. Which type of wave do you think often causes more damage to buildings? Why? Which one might move buildings back and forth?
c. What is the location of the epicenter? (Name the city).
d. Describe some sources of error that might affect your ability to find the exact location of the earthquake.
e. Which city received P- waves first? What does this tell you about how close the city is to the earthquake?
D Exploring on your own a. Research tsunamis and find out how they are created.
b. What is the shadow zone? How do we know about it?
c. What is liquefaction? Where might it be a big problem? Where in California has it been a problem in the past?
64
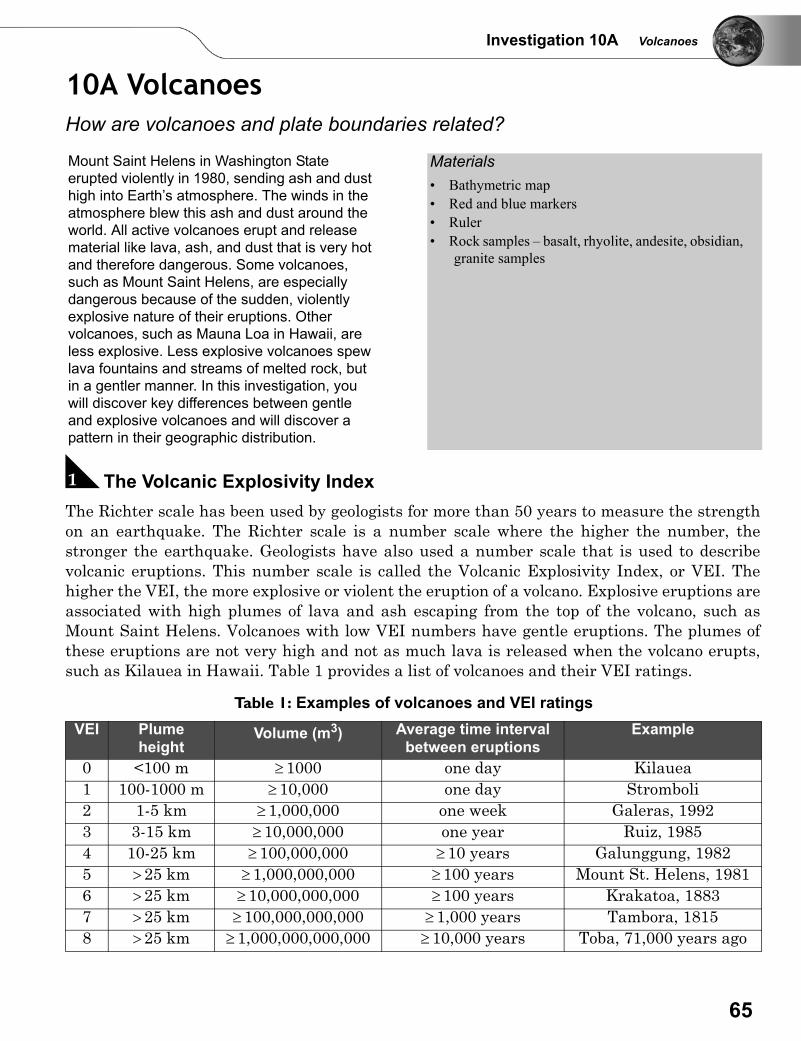
Investigation 10A Volcanoes
10A VolcanoesHow are volcanoes and plate boundaries related?
A The Volcanic Explosivity IndexThe Richter scale has been used by geologists for more than 50 years to measure the strengthon an earthquake. The Richter scale is a number scale where the higher the number, thestronger the earthquake. Geologists have also used a number scale that is used to describevolcanic eruptions. This number scale is called the Volcanic Explosivity Index, or VEI. Thehigher the VEI, the more explosive or violent the eruption of a volcano. Explosive eruptions areassociated with high plumes of lava and ash escaping from the top of the volcano, such asMount Saint Helens. Volcanoes with low VEI numbers have gentle eruptions. The plumes ofthese eruptions are not very high and not as much lava is released when the volcano erupts,such as Kilauea in Hawaii. Table 1 provides a list of volcanoes and their VEI ratings.
Mount Saint Helens in Washington State erupted violently in 1980, sending ash and dust high into Earth’s atmosphere. The winds in the atmosphere blew this ash and dust around the world. All active volcanoes erupt and release material like lava, ash, and dust that is very hot and therefore dangerous. Some volcanoes, such as Mount Saint Helens, are especially dangerous because of the sudden, violently explosive nature of their eruptions. Other volcanoes, such as Mauna Loa in Hawaii, are less explosive. Less explosive volcanoes spew lava fountains and streams of melted rock, but in a gentler manner. In this investigation, you will discover key differences between gentle and explosive volcanoes and will discover a pattern in their geographic distribution.
Materials• Bathymetric map• Red and blue markers• Ruler• Rock samples – basalt, rhyolite, andesite, obsidian,
granite samples
Table 1: Examples of volcanoes and VEI ratingsVEI Plume
heightVolume (m3) Average time interval
between eruptionsExample
0 <100 m ≥ 1000 one day Kilauea1 100-1000 m ≥ 10,000 one day Stromboli2 1-5 km ≥ 1,000,000 one week Galeras, 19923 3-15 km ≥ 10,000,000 one year Ruiz, 19854 10-25 km ≥ 100,000,000 ≥ 10 years Galunggung, 19825 > 25 km ≥ 1,000,000,000 ≥100 years Mount St. Helens, 19816 > 25 km ≥ 10,000,000,000 ≥100 years Krakatoa, 18837 > 25 km ≥ 100,000,000,000 ≥ 1,000 years Tambora, 18158 > 25 km ≥ 1,000,000,000,000 ≥ 10,000 years Toba, 71,000 years ago
65
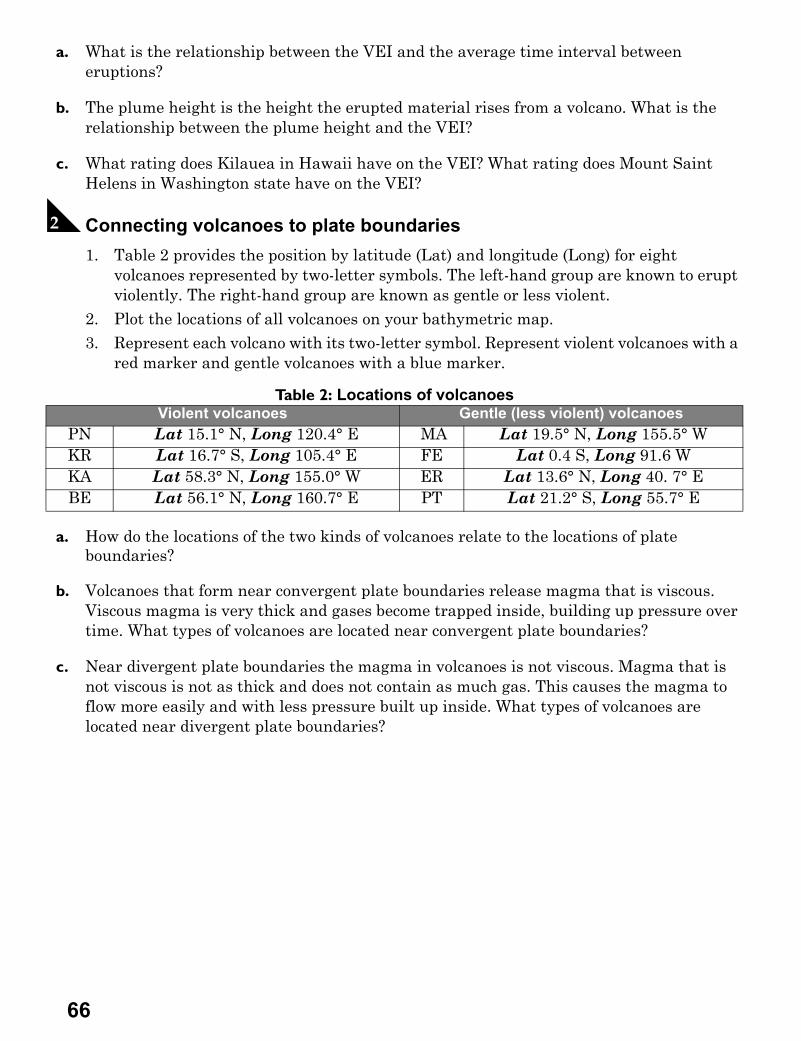
a. What is the relationship between the VEI and the average time interval between eruptions?
b. The plume height is the height the erupted material rises from a volcano. What is the relationship between the plume height and the VEI?
c. What rating does Kilauea in Hawaii have on the VEI? What rating does Mount Saint Helens in Washington state have on the VEI?
B Connecting volcanoes to plate boundaries1. Table 2 provides the position by latitude (Lat) and longitude (Long) for eight
volcanoes represented by two-letter symbols. The left-hand group are known to erupt violently. The right-hand group are known as gentle or less violent.
2. Plot the locations of all volcanoes on your bathymetric map.3. Represent each volcano with its two-letter symbol. Represent violent volcanoes with a
red marker and gentle volcanoes with a blue marker.
a. How do the locations of the two kinds of volcanoes relate to the locations of plate boundaries?
b. Volcanoes that form near convergent plate boundaries release magma that is viscous. Viscous magma is very thick and gases become trapped inside, building up pressure over time. What types of volcanoes are located near convergent plate boundaries?
c. Near divergent plate boundaries the magma in volcanoes is not viscous. Magma that is not viscous is not as thick and does not contain as much gas. This causes the magma to flow more easily and with less pressure built up inside. What types of volcanoes are located near divergent plate boundaries?
Table 2: Locations of volcanoesViolent volcanoes Gentle (less violent) volcanoes
PN Lat 15.1° N, Long 120.4° E MA Lat 19.5° N, Long 155.5° WKR Lat 16.7° S, Long 105.4° E FE Lat 0.4 S, Long 91.6 WKA Lat 58.3° N, Long 155.0° W ER Lat 13.6° N, Long 40. 7° EBE Lat 56.1° N, Long 160.7° E PT Lat 21.2° S, Long 55.7° E
66
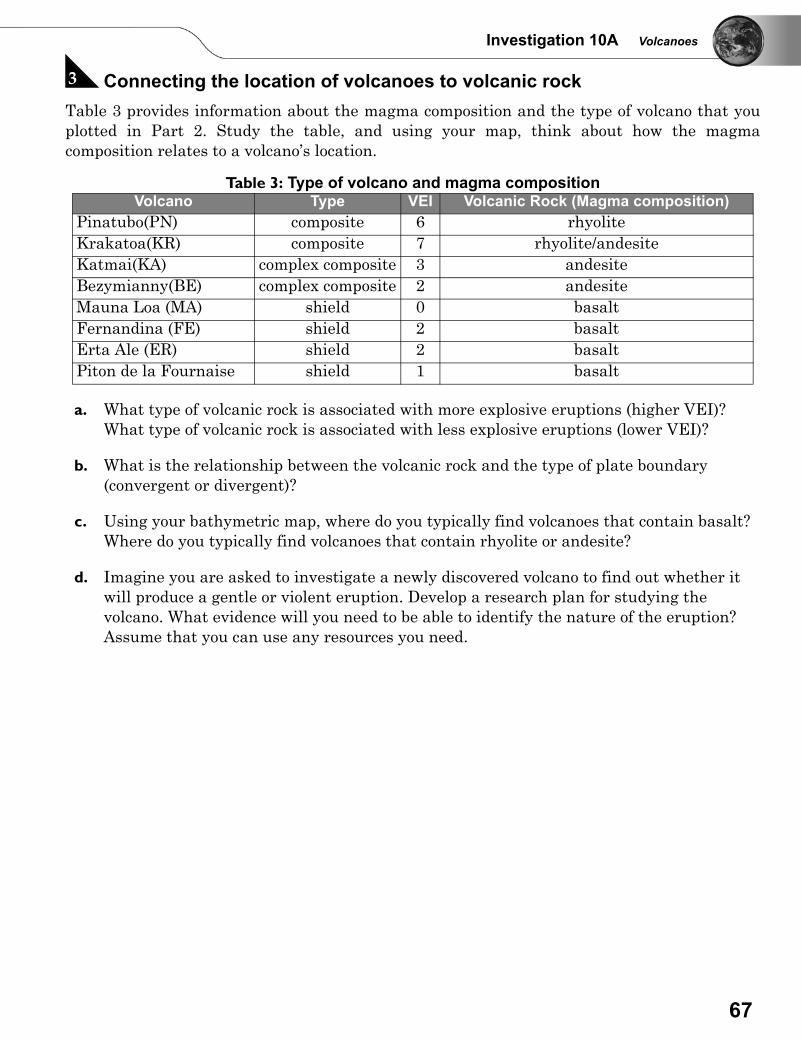
Investigation 10A Volcanoes
C Connecting the location of volcanoes to volcanic rockTable 3 provides information about the magma composition and the type of volcano that youplotted in Part 2. Study the table, and using your map, think about how the magmacomposition relates to a volcano’s location.
a. What type of volcanic rock is associated with more explosive eruptions (higher VEI)? What type of volcanic rock is associated with less explosive eruptions (lower VEI)?
b. What is the relationship between the volcanic rock and the type of plate boundary (convergent or divergent)?
c. Using your bathymetric map, where do you typically find volcanoes that contain basalt? Where do you typically find volcanoes that contain rhyolite or andesite?
d. Imagine you are asked to investigate a newly discovered volcano to find out whether it will produce a gentle or violent eruption. Develop a research plan for studying the volcano. What evidence will you need to be able to identify the nature of the eruption? Assume that you can use any resources you need.
Table 3: Type of volcano and magma compositionVolcano Type VEI Volcanic Rock (Magma composition)
Pinatubo(PN) composite 6 rhyoliteKrakatoa(KR) composite 7 rhyolite/andesiteKatmai(KA) complex composite 3 andesiteBezymianny(BE) complex composite 2 andesiteMauna Loa (MA) shield 0 basaltFernandina (FE) shield 2 basaltErta Ale (ER) shield 2 basaltPiton de la Fournaise shield 1 basalt
67
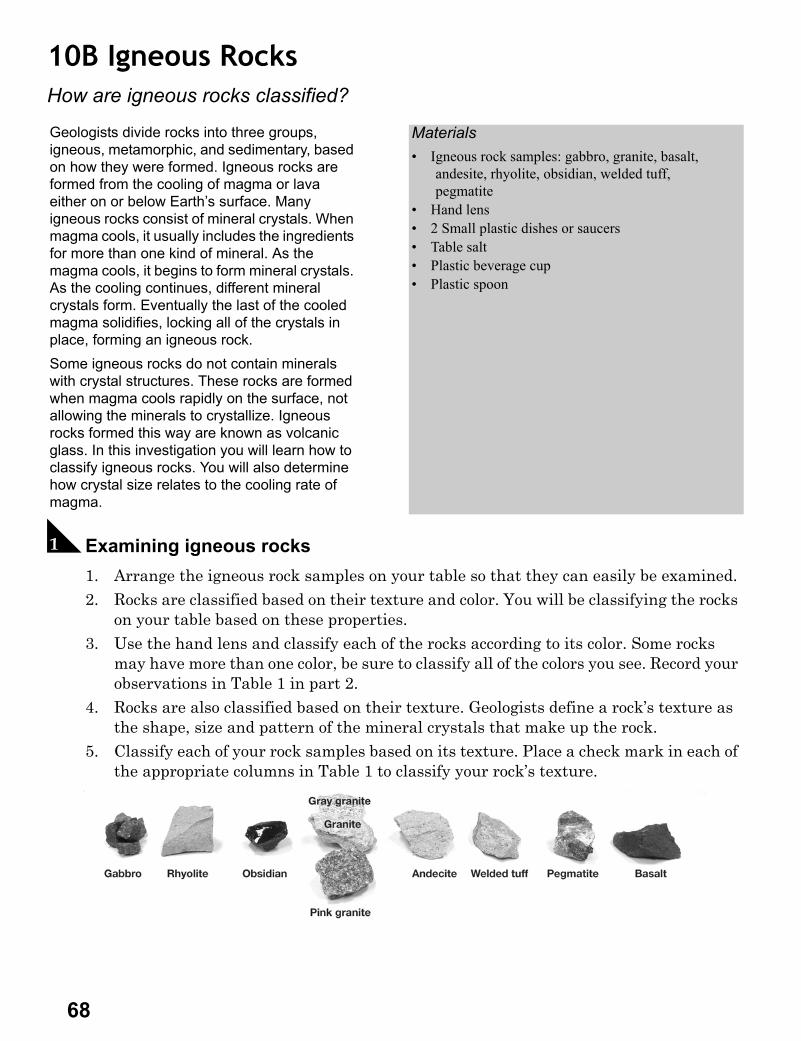
10B Igneous RocksHow are igneous rocks classified?
A Examining igneous rocks1. Arrange the igneous rock samples on your table so that they can easily be examined. 2. Rocks are classified based on their texture and color. You will be classifying the rocks
on your table based on these properties. 3. Use the hand lens and classify each of the rocks according to its color. Some rocks
may have more than one color, be sure to classify all of the colors you see. Record your observations in Table 1 in part 2.
4. Rocks are also classified based on their texture. Geologists define a rock’s texture as the shape, size and pattern of the mineral crystals that make up the rock.
5. Classify each of your rock samples based on its texture. Place a check mark in each of the appropriate columns in Table 1 to classify your rock’s texture.
Geologists divide rocks into three groups, igneous, metamorphic, and sedimentary, based on how they were formed. Igneous rocks are formed from the cooling of magma or lava either on or below Earth’s surface. Many igneous rocks consist of mineral crystals. When magma cools, it usually includes the ingredients for more than one kind of mineral. As the magma cools, it begins to form mineral crystals. As the cooling continues, different mineral crystals form. Eventually the last of the cooled magma solidifies, locking all of the crystals in place, forming an igneous rock. Some igneous rocks do not contain minerals with crystal structures. These rocks are formed when magma cools rapidly on the surface, not allowing the minerals to crystallize. Igneous rocks formed this way are known as volcanic glass. In this investigation you will learn how to classify igneous rocks. You will also determine how crystal size relates to the cooling rate of magma.
Materials• Igneous rock samples: gabbro, granite, basalt,
andesite, rhyolite, obsidian, welded tuff, pegmatite
• Hand lens• 2 Small plastic dishes or saucers• Table salt• Plastic beverage cup• Plastic spoon
68
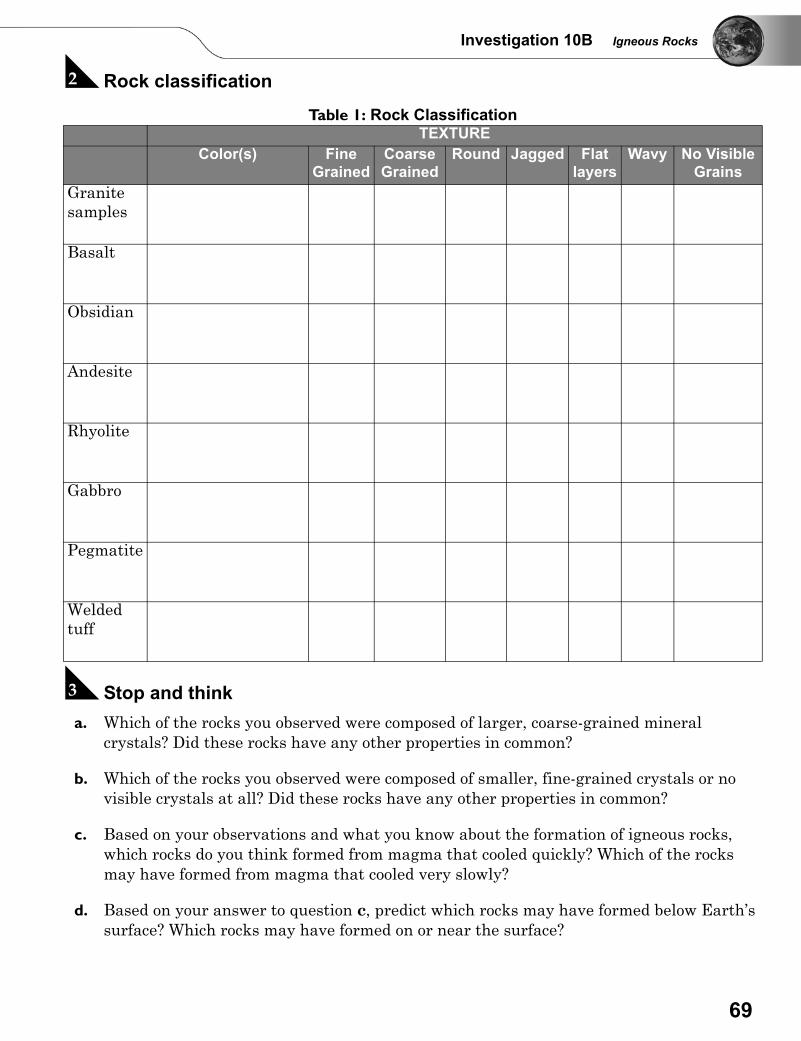
Investigation 10B Igneous Rocks
B Rock classification
C Stop and think a. Which of the rocks you observed were composed of larger, coarse-grained mineral
crystals? Did these rocks have any other properties in common?
b. Which of the rocks you observed were composed of smaller, fine-grained crystals or no visible crystals at all? Did these rocks have any other properties in common?
c. Based on your observations and what you know about the formation of igneous rocks, which rocks do you think formed from magma that cooled quickly? Which of the rocks may have formed from magma that cooled very slowly?
d. Based on your answer to question c, predict which rocks may have formed below Earth’s surface? Which rocks may have formed on or near the surface?
Table 1: Rock ClassificationTEXTURE
Color(s) FineGrained
Coarse Grained
Round Jagged Flatlayers
Wavy No VisibleGrains
Granite samples
Basalt
Obsidian
Andesite
Rhyolite
Gabbro
Pegmatite
Welded tuff
69
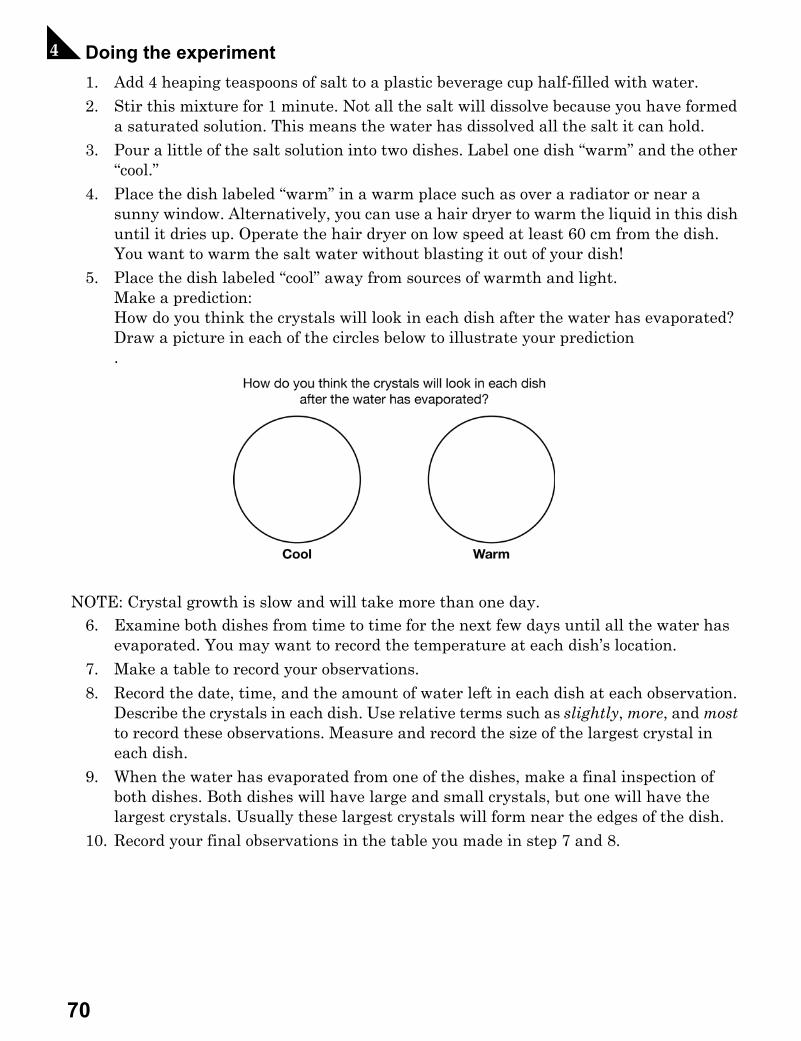
D Doing the experiment 1. Add 4 heaping teaspoons of salt to a plastic beverage cup half-filled with water.2. Stir this mixture for 1 minute. Not all the salt will dissolve because you have formed
a saturated solution. This means the water has dissolved all the salt it can hold.3. Pour a little of the salt solution into two dishes. Label one dish “warm” and the other
“cool.”4. Place the dish labeled “warm” in a warm place such as over a radiator or near a
sunny window. Alternatively, you can use a hair dryer to warm the liquid in this dish until it dries up. Operate the hair dryer on low speed at least 60 cm from the dish. You want to warm the salt water without blasting it out of your dish!
5. Place the dish labeled “cool” away from sources of warmth and light.Make a prediction: How do you think the crystals will look in each dish after the water has evaporated? Draw a picture in each of the circles below to illustrate your prediction.
NOTE: Crystal growth is slow and will take more than one day.6. Examine both dishes from time to time for the next few days until all the water has
evaporated. You may want to record the temperature at each dish’s location.7. Make a table to record your observations.8. Record the date, time, and the amount of water left in each dish at each observation.
Describe the crystals in each dish. Use relative terms such as slightly, more, and most to record these observations. Measure and record the size of the largest crystal in each dish.
9. When the water has evaporated from one of the dishes, make a final inspection of both dishes. Both dishes will have large and small crystals, but one will have the largest crystals. Usually these largest crystals will form near the edges of the dish.
10. Record your final observations in the table you made in step 7 and 8.
70
Investigation 10B Igneous Rocks
E Thinking about what you observedPart 1
a. Which dish had more time to grow crystals? Which dish contained bigger crystals?
b. Write a conclusion sentence about the time available for crystals to form and the size of the crystals that form.
Part 2
The size of rock crystals depends on the amount of interaction among the materials in themagma that forms the rock. More time allows more interaction. As a result, slow-growingcrystals tend to be bigger than fast-growing crystals. Anything that might slow the cooling ofmagma will provide that time.
a. List two natural events or conditions on Earth (other than the methods you used in this investigation) that might slow the cooling of magma.
b. List two natural events or conditions on Earth that might speed up the cooling of magma.
F Exploring on your own a. Go back to the rock samples you classified earlier in this investigation. Compare the
appearance of each sample and look at the observations you made about each rocks texture in Table 1. Based on your work in this part of the investigation, which rocks formed slowly and which rocks formed quickly? Explain your answer to this investigation based on what you learned about crystal growth.
b. Igneous rocks that form on Earth’s surface are extrusive and those that form underground are called intrusive. Based on your observations of the igneous rocks, which of the rocks are likely to be extrusive? Which are likely to be intrusive? Explain your answer.
71
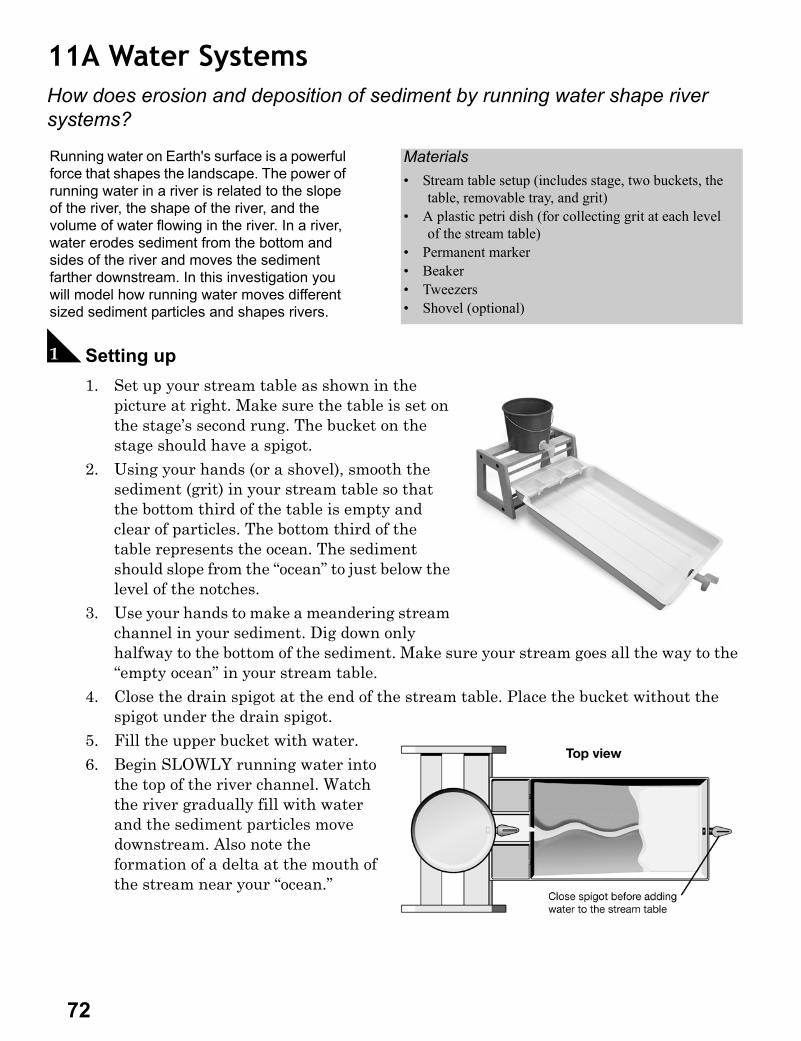
11A Water SystemsHow does erosion and deposition of sediment by running water shape river systems?
A Setting up1. Set up your stream table as shown in the
picture at right. Make sure the table is set on the stage’s second rung. The bucket on the stage should have a spigot.
2. Using your hands (or a shovel), smooth the sediment (grit) in your stream table so that the bottom third of the table is empty and clear of particles. The bottom third of the table represents the ocean. The sediment should slope from the “ocean” to just below the level of the notches.
3. Use your hands to make a meandering stream channel in your sediment. Dig down only halfway to the bottom of the sediment. Make sure your stream goes all the way to the “empty ocean” in your stream table.
4. Close the drain spigot at the end of the stream table. Place the bucket without the spigot under the drain spigot.
5. Fill the upper bucket with water.6. Begin SLOWLY running water into
the top of the river channel. Watch the river gradually fill with water and the sediment particles move downstream. Also note the formation of a delta at the mouth of the stream near your “ocean.”
Running water on Earth's surface is a powerful force that shapes the landscape. The power of running water in a river is related to the slope of the river, the shape of the river, and the volume of water flowing in the river. In a river, water erodes sediment from the bottom and sides of the river and moves the sediment farther downstream. In this investigation you will model how running water moves different sized sediment particles and shapes rivers.
Materials• Stream table setup (includes stage, two buckets, the
table, removable tray, and grit)• A plastic petri dish (for collecting grit at each level
of the stream table)• Permanent marker• Beaker • Tweezers • Shovel (optional)
72
Investigation 11A Water Systems
7. Stop the flow of water when your delta has grown into about half of your ocean, or when the water level in the ocean rises too close to the top of the stream table wall.
8. Make sure the lower bucket is lined up with the drainage hole. Open the drain spigot and allow the water to drain from the table into the lower bucket. Observe the general sizes of the particles remaining near the source of the river, the middle, and at the delta.
9. Use a permanent marker to divide a petri dish into 6 equal sections, labeling them from 1 through 6.
10. Using your tweezers, take small samples of the sediment from the following locations and place them in the numbered sections of your petri dish. The last page of this investigation to find out what a river delta looks like!• Section 1: The river source• Section 2: The end of the stream before the delta• Section 3: The middle of the delta• Section 4: The end of the delta• Section 5: The middle of the ocean bottom• Section 6: The far end of the ocean bottom
73
B Stop and think Diagram 1: River system
a. Make a drawing of your river channel, delta and ocean. Label the following river features: meanders, river source, floodplain, delta, ocean.
.
.
b. Number your diagram showing the location of each of your six sections. For example, label your river source “1.” Draw to scale the relative size of the sediment particles found at each location.
c. How does the size of the particles change as you go from the river source to the far end of the ocean? Why do you think the sediment is sorted this way?
d. Where was the speed of the water fastest? Where was it the slowest? How can you explain this?
C Doing the experiment 1. Repeat steps 1 through 10 in the procedure. But this time, change the slope of the
stream table so that it is steeper than your first trial. 2. Repeat steps 1 through 10 in the procedure. This time, change the slope of the stream
table so that it is not as steep as the first trial.
D Thinking about what you observed a. How does increasing the slope of a river affect the rate of erosion by running water?
b. How does decreasing the slope of a river affect the rate of erosion by running water?
c. How do you think the width of the river channel affects the erosion of sediment in a river?
d. Based on your knowledge of sedimentary rocks, where would you likely find samples of conglomerate, sandstone, and shale in a river system?
74
Investigation 11A Water Systems
E Exploring on your own 1. Use your stream table to model the formation of the following river features. The
images on the next page will help you with your work.2. Your teacher will check off each feature as your team correctly models its formation.
Your teacher can ask anyone in your lab group to model and/or describe how the feature forms. Therefore, all members need to be prepared to answer. Your team will earn the most points toward your lab grade if you can demonstrate the knowledge on the first try.
.
Try 1 Try 2 Try 3
v-shaped valley upstream
meanders
delta
floodplain
alluvial fan
oxbow lake
waterfall
75
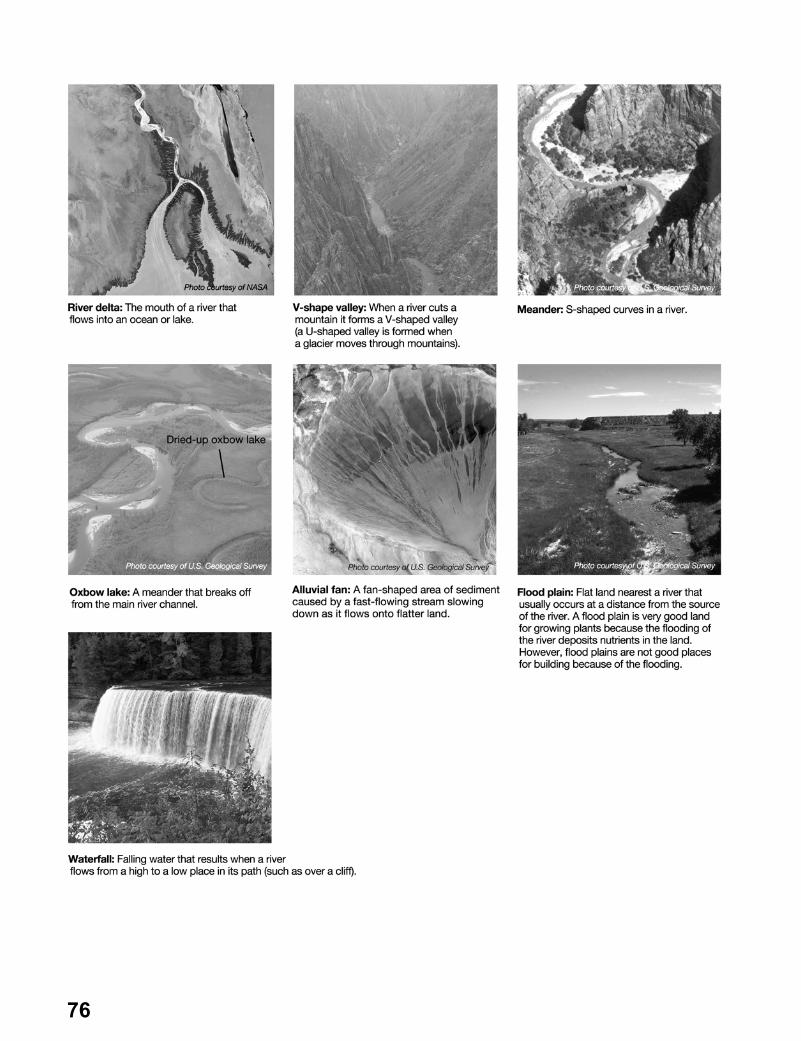
76
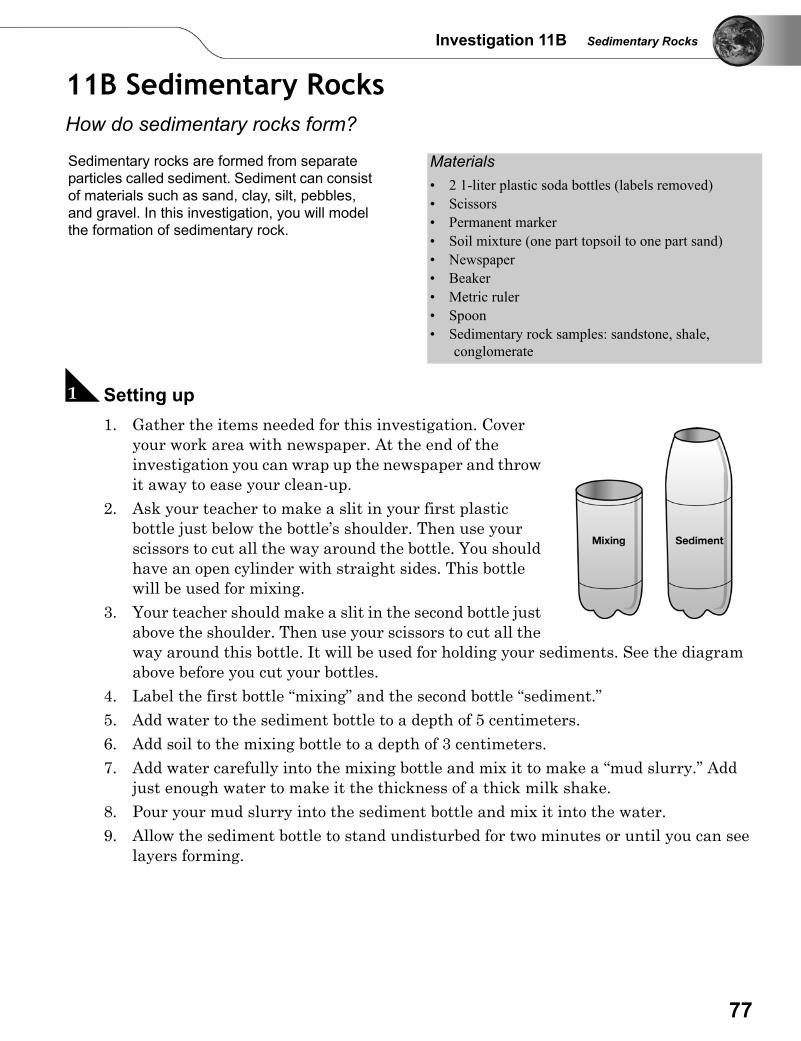
Investigation 11B Sedimentary Rocks
11B Sedimentary RocksHow do sedimentary rocks form?
A Setting up1. Gather the items needed for this investigation. Cover
your work area with newspaper. At the end of the investigation you can wrap up the newspaper and throw it away to ease your clean-up.
2. Ask your teacher to make a slit in your first plastic bottle just below the bottle’s shoulder. Then use your scissors to cut all the way around the bottle. You should have an open cylinder with straight sides. This bottle will be used for mixing.
3. Your teacher should make a slit in the second bottle just above the shoulder. Then use your scissors to cut all the way around this bottle. It will be used for holding your sediments. See the diagram above before you cut your bottles.
4. Label the first bottle “mixing” and the second bottle “sediment.” 5. Add water to the sediment bottle to a depth of 5 centimeters. 6. Add soil to the mixing bottle to a depth of 3 centimeters. 7. Add water carefully into the mixing bottle and mix it to make a “mud slurry.” Add
just enough water to make it the thickness of a thick milk shake.8. Pour your mud slurry into the sediment bottle and mix it into the water. 9. Allow the sediment bottle to stand undisturbed for two minutes or until you can see
layers forming.
Sedimentary rocks are formed from separate particles called sediment. Sediment can consist of materials such as sand, clay, silt, pebbles, and gravel. In this investigation, you will model the formation of sedimentary rock.
Materials• 2 1-liter plastic soda bottles (labels removed)• Scissors• Permanent marker• Soil mixture (one part topsoil to one part sand)• Newspaper• Beaker• Metric ruler • Spoon• Sedimentary rock samples: sandstone, shale,
conglomerate
77
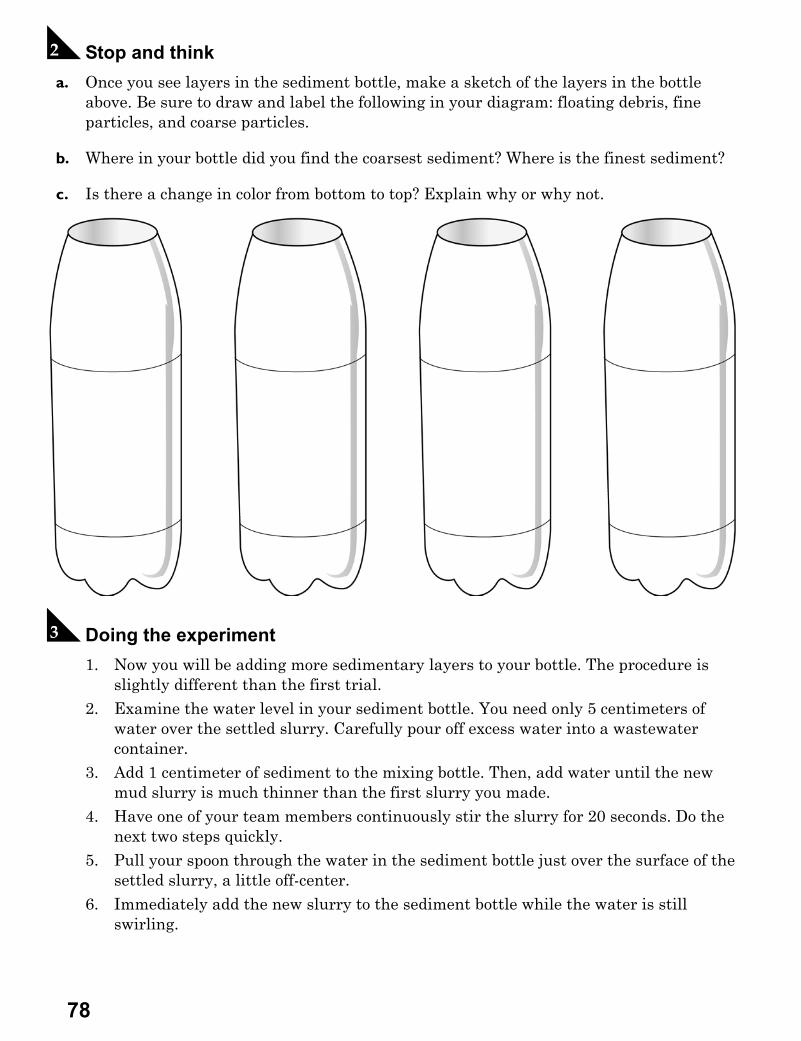
B Stop and think a. Once you see layers in the sediment bottle, make a sketch of the layers in the bottle
above. Be sure to draw and label the following in your diagram: floating debris, fine particles, and coarse particles.
b. Where in your bottle did you find the coarsest sediment? Where is the finest sediment?
c. Is there a change in color from bottom to top? Explain why or why not.
C Doing the experiment 1. Now you will be adding more sedimentary layers to your bottle. The procedure is
slightly different than the first trial.2. Examine the water level in your sediment bottle. You need only 5 centimeters of
water over the settled slurry. Carefully pour off excess water into a wastewater container.
3. Add 1 centimeter of sediment to the mixing bottle. Then, add water until the new mud slurry is much thinner than the first slurry you made.
4. Have one of your team members continuously stir the slurry for 20 seconds. Do the next two steps quickly.
5. Pull your spoon through the water in the sediment bottle just over the surface of the settled slurry, a little off-center.
6. Immediately add the new slurry to the sediment bottle while the water is still swirling.
78
Investigation 11B Sedimentary Rocks
7. After two minutes, sketch the layers you see. Use an empty sediment bottle diagram. Pay special attention to thickness, sediment size, and the angle in which the layers formed (i.e. slanted, straight across, etc.).
8. Repeat steps 2 through 7 until you have added three slurries to the original for a total of four slurries added to the sediment bottle. Stop the process if your sediment bottle gets too full.
D Thinking about what you observed a. Wipe off the sides of your bottle. Carefully examine the sediment in your bottle. Is each
slurry you made represented by a distinct layer? If so how many layers do you see?
b. Are the sedimentary layers in your bottle the same thickness?
c. Which size sediments settled into the bottle faster: larger or small particles? Explain your answer.
d. What will happen to your sedimentary layers when the water evaporates?
e. Label the sedimentary layers in your sketch from oldest to youngest. How do you think geologists can tell the age of sedimentary rock layers in areas such as the Grand Canyon?
E Exploring on your own a. Examine the sedimentary rock samples. Classify these sedimentary rocks according to
color, texture, and particle size. What types of particles do you think make up each of the rock samples?
b. Based on the results of this investigation, where would you expect to find each of these sedimentary rock samples in a river system? Upstream near the source of the river or farther downstream near the mouth of the river?
c. Go for a “rock walk” around your school or around your home. See if you can find samples of sandstone, shale, or conglomerate in these areas. Collect any other rocks that may seem interesting to you as well. Take these rocks back to your classroom and classify them according to their color, texture, and mineral size.
79
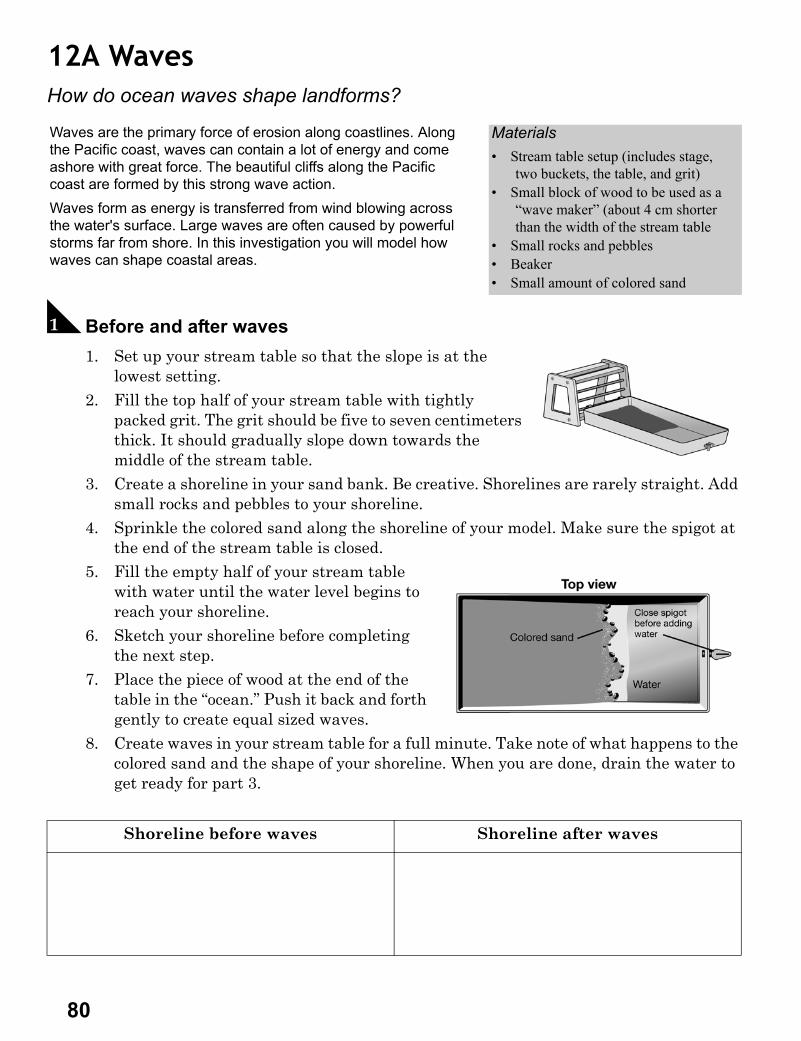
12A WavesHow do ocean waves shape landforms?
A Before and after waves1. Set up your stream table so that the slope is at the
lowest setting.
2. Fill the top half of your stream table with tightly packed grit. The grit should be five to seven centimeters thick. It should gradually slope down towards the middle of the stream table.
3. Create a shoreline in your sand bank. Be creative. Shorelines are rarely straight. Add small rocks and pebbles to your shoreline.
4. Sprinkle the colored sand along the shoreline of your model. Make sure the spigot at the end of the stream table is closed.
5. Fill the empty half of your stream table with water until the water level begins to reach your shoreline.
6. Sketch your shoreline before completing the next step.
7. Place the piece of wood at the end of the table in the “ocean.” Push it back and forth gently to create equal sized waves.
8. Create waves in your stream table for a full minute. Take note of what happens to the colored sand and the shape of your shoreline. When you are done, drain the water to get ready for part 3.
.
Waves are the primary force of erosion along coastlines. Along the Pacific coast, waves can contain a lot of energy and come ashore with great force. The beautiful cliffs along the Pacific coast are formed by this strong wave action. Waves form as energy is transferred from wind blowing across the water's surface. Large waves are often caused by powerful storms far from shore. In this investigation you will model how waves can shape coastal areas.
Materials• Stream table setup (includes stage,
two buckets, the table, and grit)• Small block of wood to be used as a
“wave maker” (about 4 cm shorter than the width of the stream table
• Small rocks and pebbles• Beaker• Small amount of colored sand
Shoreline before waves Shoreline after waves
80
Investigation 12A Waves
B Stop and think.
a. What happened to the colored sand as you created waves in your model?
b. Describe the changes that the waves made to your shoreline.
c. Describe the rate of erosion along areas of shoreline that “stuck out” into the ocean. How was erosion different here than areas (such as a bay) that were farther inland?
C A new shoreline1. Now form a new shoreline. Again, be creative! You can shape bays, inlets, peninsulas,
and areas of different thicknesses of sand.
2. Sprinkle colored sand along your shoreline as you did in the first trial. Add water as you did in Part 1, step 5.
3. Use the wood block to make larger waves than the first trial. Note what happens to the shape of your coastline and the colored sand. Create waves for one full minute.
4. Repeat steps 1 through 3. This time create waves from different angles and observe how this affects the erosion of your shoreline.
D Thinking about what you observed a. How did the rate of erosion change as you created more powerful waves? Why?
b. Which areas of your coastline eroded the fastest? Why do you think this is so?
c. Which areas of your coastline eroded the slowest? Explain your answer.
d. How did changing the angle of the waves affect the erosion of your shoreline?
e. As waves move ashore, they pick up sediment such as sand and pebbles. How do you think the sand and pebbles affect the erosion of coastal areas?
f. In this investigation you created different sized waves using a piece of wood. How are different-sized waves formed in nature?
E Exploring on your own a. Look up the definitions and find pictures of the following coastal features: sea caves,
wave-cut cliffs, sea arch, and sea stacks. Once you have researched each of these features, try to model their formation in your stream table setup.
b. Use the Internet to research the nearest coastal area to your school. Find pictures. Summarize the shape of this coastline and predict how the coastline will change as waves erode the region.
c. Look at a map or a satellite picture of the eastern coast of the United States and the Gulf Coast. Focus your attention on the barrier islands along these coasts. How permanent do you think these islands are? Is it a wise decision to build on these islands? Why or why not?
81
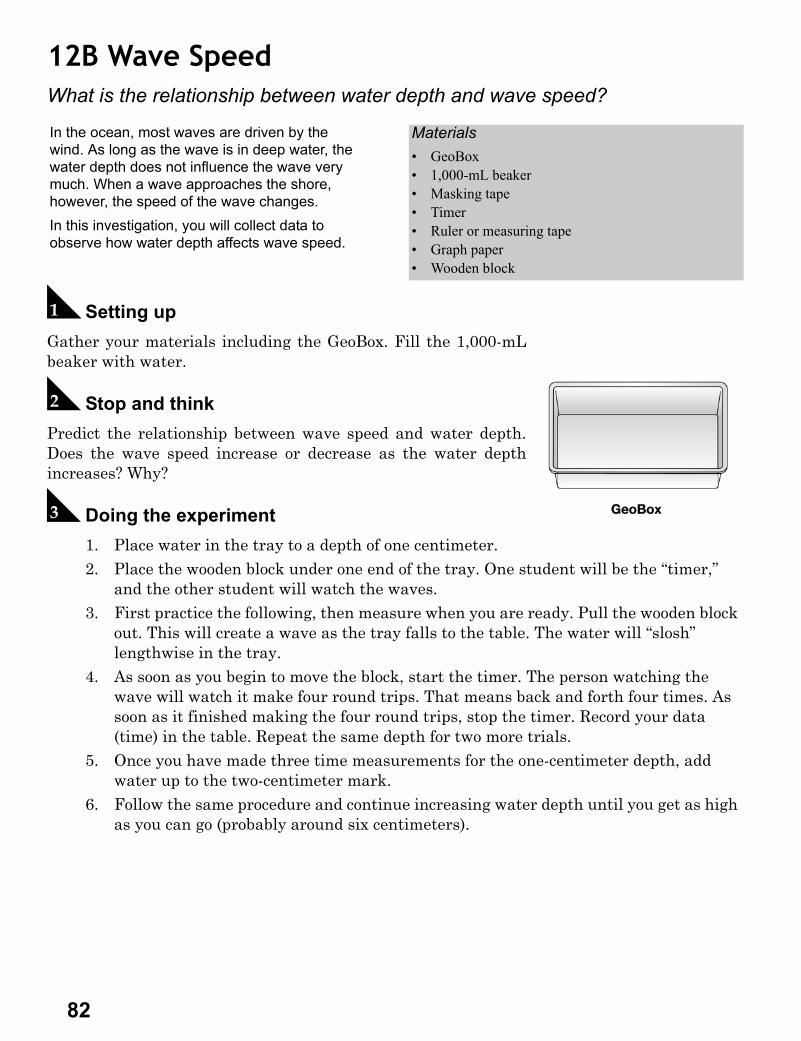
12B Wave SpeedWhat is the relationship between water depth and wave speed?
A Setting upGather your materials including the GeoBox. Fill the 1,000-mLbeaker with water.
B Stop and think Predict the relationship between wave speed and water depth.Does the wave speed increase or decrease as the water depthincreases? Why?
C Doing the experiment 1. Place water in the tray to a depth of one centimeter.2. Place the wooden block under one end of the tray. One student will be the “timer,”
and the other student will watch the waves.3. First practice the following, then measure when you are ready. Pull the wooden block
out. This will create a wave as the tray falls to the table. The water will “slosh” lengthwise in the tray.
4. As soon as you begin to move the block, start the timer. The person watching the wave will watch it make four round trips. That means back and forth four times. As soon as it finished making the four round trips, stop the timer. Record your data (time) in the table. Repeat the same depth for two more trials.
5. Once you have made three time measurements for the one-centimeter depth, add water up to the two-centimeter mark.
6. Follow the same procedure and continue increasing water depth until you get as high as you can go (probably around six centimeters).
In the ocean, most waves are driven by the wind. As long as the wave is in deep water, the water depth does not influence the wave very much. When a wave approaches the shore, however, the speed of the wave changes. In this investigation, you will collect data to observe how water depth affects wave speed.
Materials• GeoBox• 1,000-mL beaker• Masking tape• Timer• Ruler or measuring tape• Graph paper• Wooden block
82
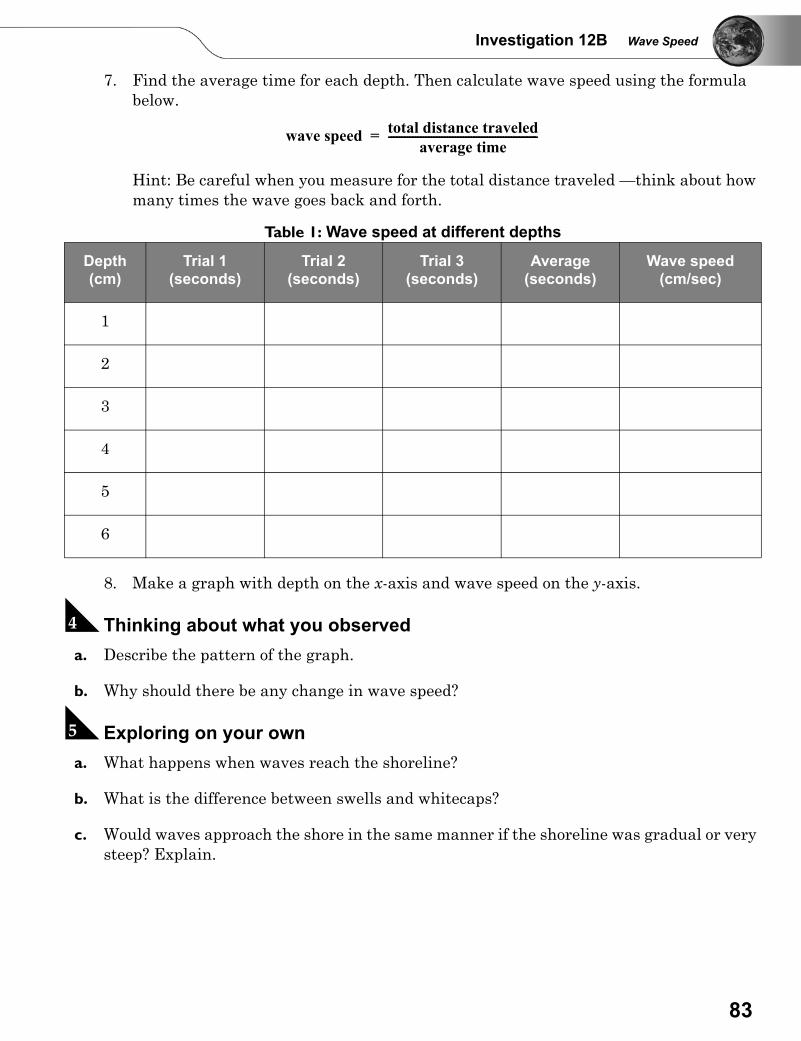
Investigation 12B Wave Speed
7. Find the average time for each depth. Then calculate wave speed using the formula below.
Hint: Be careful when you measure for the total distance traveled —think about how many times the wave goes back and forth.
8. Make a graph with depth on the x-axis and wave speed on the y-axis.
D Thinking about what you observed a. Describe the pattern of the graph.
b. Why should there be any change in wave speed?
E Exploring on your own a. What happens when waves reach the shoreline?
b. What is the difference between swells and whitecaps?
c. Would waves approach the shore in the same manner if the shoreline was gradual or very steep? Explain.
Table 1: Wave speed at different depths
Depth (cm)
Trial 1(seconds)
Trial 2 (seconds)
Trial 3 (seconds)
Average (seconds)
Wave speed (cm/sec)
1
2
3
4
5
6
wave speed total distance traveledaverage time
--------------------------------------------------------=
83
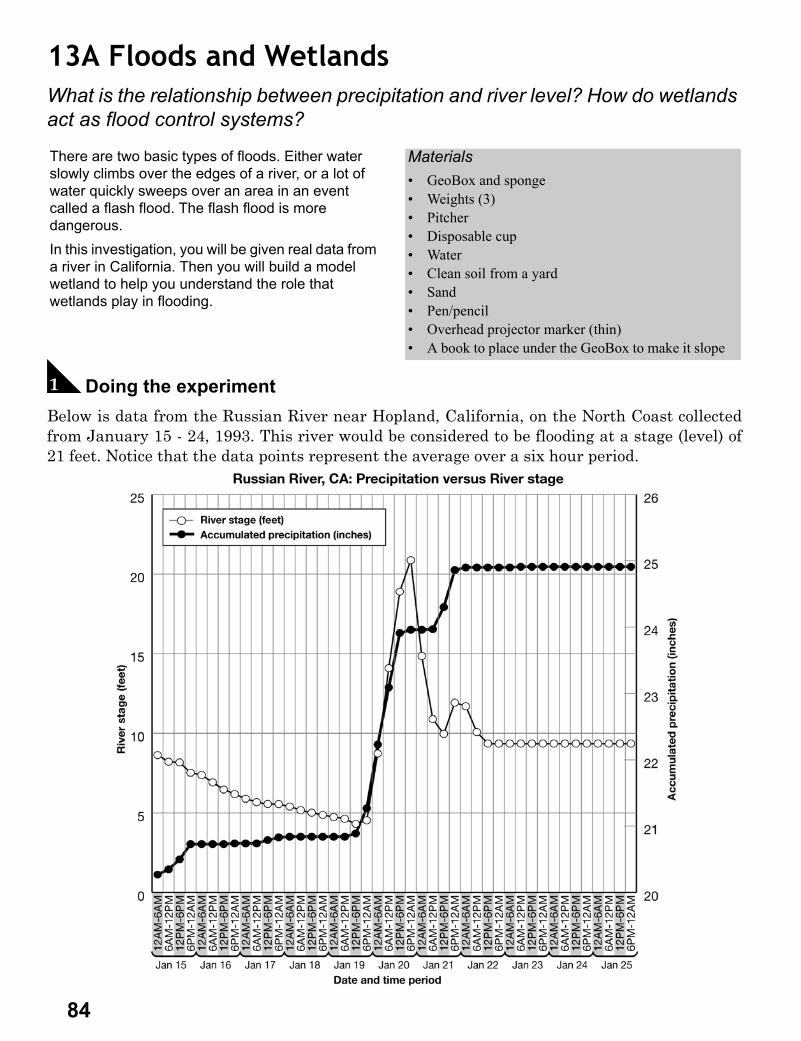
13A Floods and WetlandsWhat is the relationship between precipitation and river level? How do wetlands act as flood control systems?
A Doing the experimentBelow is data from the Russian River near Hopland, California, on the North Coast collectedfrom January 15 - 24, 1993. This river would be considered to be flooding at a stage (level) of21 feet. Notice that the data points represent the average over a six hour period.
There are two basic types of floods. Either water slowly climbs over the edges of a river, or a lot of water quickly sweeps over an area in an event called a flash flood. The flash flood is more dangerous.In this investigation, you will be given real data from a river in California. Then you will build a model wetland to help you understand the role that wetlands play in flooding.
Materials• GeoBox and sponge• Weights (3)• Pitcher• Disposable cup• Water• Clean soil from a yard• Sand• Pen/pencil• Overhead projector marker (thin)• A book to place under the GeoBox to make it slope
84
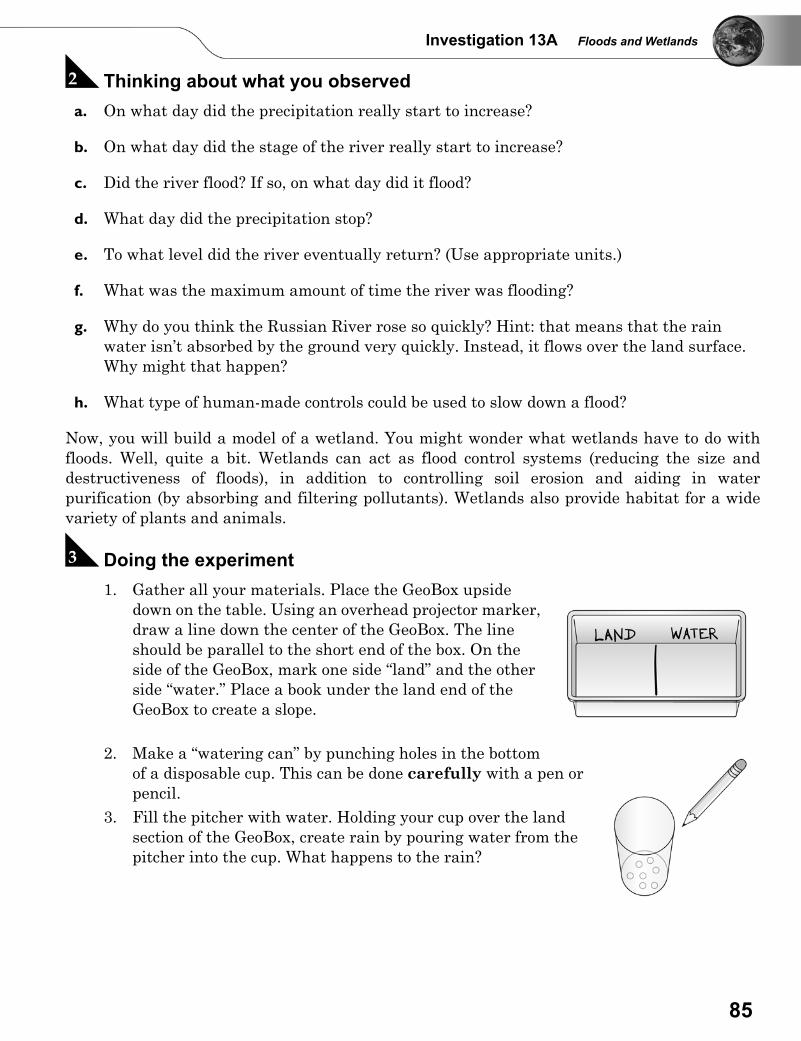
Investigation 13A Floods and Wetlands
B Thinking about what you observed a. On what day did the precipitation really start to increase?
b. On what day did the stage of the river really start to increase?
c. Did the river flood? If so, on what day did it flood?
d. What day did the precipitation stop?
e. To what level did the river eventually return? (Use appropriate units.)
f. What was the maximum amount of time the river was flooding?
g. Why do you think the Russian River rose so quickly? Hint: that means that the rain water isn’t absorbed by the ground very quickly. Instead, it flows over the land surface. Why might that happen?
h. What type of human-made controls could be used to slow down a flood?
Now, you will build a model of a wetland. You might wonder what wetlands have to do withfloods. Well, quite a bit. Wetlands can act as flood control systems (reducing the size anddestructiveness of floods), in addition to controlling soil erosion and aiding in waterpurification (by absorbing and filtering pollutants). Wetlands also provide habitat for a widevariety of plants and animals.
C Doing the experiment 1. Gather all your materials. Place the GeoBox upside
down on the table. Using an overhead projector marker, draw a line down the center of the GeoBox. The line should be parallel to the short end of the box. On the side of the GeoBox, mark one side “land” and the other side “water.” Place a book under the land end of the GeoBox to create a slope.
2. Make a “watering can” by punching holes in the bottom of a disposable cup. This can be done carefully with a pen or pencil.
3. Fill the pitcher with water. Holding your cup over the land section of the GeoBox, create rain by pouring water from the pitcher into the cup. What happens to the rain?
85
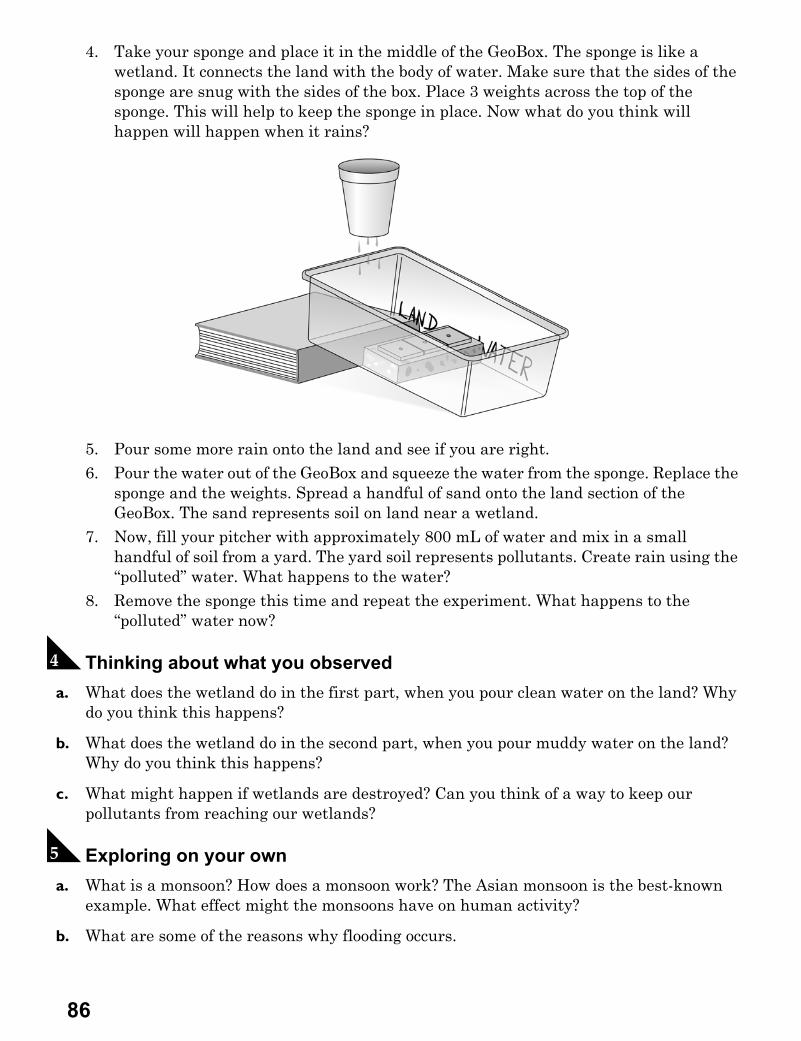
4. Take your sponge and place it in the middle of the GeoBox. The sponge is like a wetland. It connects the land with the body of water. Make sure that the sides of the sponge are snug with the sides of the box. Place 3 weights across the top of the sponge. This will help to keep the sponge in place. Now what do you think will happen will happen when it rains?
5. Pour some more rain onto the land and see if you are right. 6. Pour the water out of the GeoBox and squeeze the water from the sponge. Replace the
sponge and the weights. Spread a handful of sand onto the land section of the GeoBox. The sand represents soil on land near a wetland.
7. Now, fill your pitcher with approximately 800 mL of water and mix in a small handful of soil from a yard. The yard soil represents pollutants. Create rain using the “polluted” water. What happens to the water?
8. Remove the sponge this time and repeat the experiment. What happens to the “polluted” water now?
D Thinking about what you observed a. What does the wetland do in the first part, when you pour clean water on the land? Why
do you think this happens?
b. What does the wetland do in the second part, when you pour muddy water on the land? Why do you think this happens?
c. What might happen if wetlands are destroyed? Can you think of a way to keep our pollutants from reaching our wetlands?
E Exploring on your own a. What is a monsoon? How does a monsoon work? The Asian monsoon is the best-known
example. What effect might the monsoons have on human activity?
b. What are some of the reasons why flooding occurs.
86
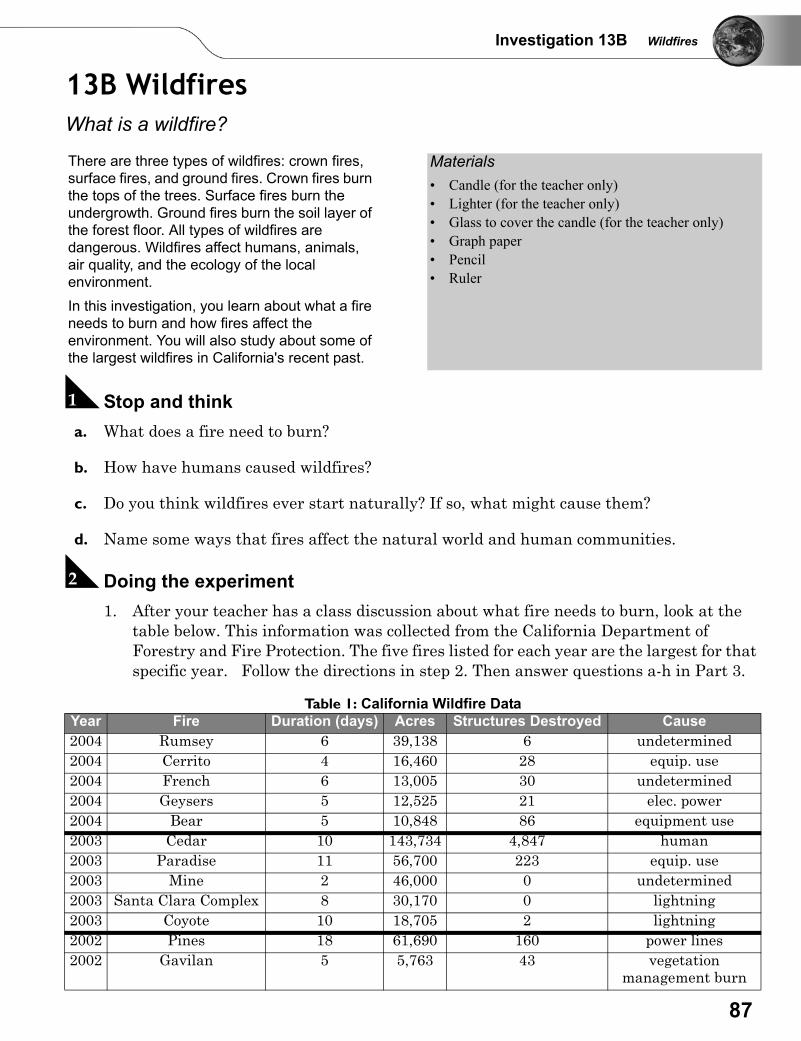
Investigation 13B Wildfires
13B Wildfires What is a wildfire?
A Stop and think a. What does a fire need to burn?
b. How have humans caused wildfires?
c. Do you think wildfires ever start naturally? If so, what might cause them?
d. Name some ways that fires affect the natural world and human communities.
B Doing the experiment1. After your teacher has a class discussion about what fire needs to burn, look at the
table below. This information was collected from the California Department of Forestry and Fire Protection. The five fires listed for each year are the largest for that specific year. Follow the directions in step 2. Then answer questions a-h in Part 3.
.
There are three types of wildfires: crown fires, surface fires, and ground fires. Crown fires burn the tops of the trees. Surface fires burn the undergrowth. Ground fires burn the soil layer of the forest floor. All types of wildfires are dangerous. Wildfires affect humans, animals, air quality, and the ecology of the local environment.In this investigation, you learn about what a fire needs to burn and how fires affect the environment. You will also study about some of the largest wildfires in California's recent past.
Materials• Candle (for the teacher only)• Lighter (for the teacher only)• Glass to cover the candle (for the teacher only)• Graph paper• Pencil• Ruler
Table 1: California Wildfire DataYear Fire Duration (days) Acres Structures Destroyed Cause2004 Rumsey 6 39,138 6 undetermined2004 Cerrito 4 16,460 28 equip. use2004 French 6 13,005 30 undetermined2004 Geysers 5 12,525 21 elec. power2004 Bear 5 10,848 86 equipment use2003 Cedar 10 143,734 4,847 human2003 Paradise 11 56,700 223 equip. use2003 Mine 2 46,000 0 undetermined2003 Santa Clara Complex 8 30,170 0 lightning2003 Coyote 10 18,705 2 lightning2002 Pines 18 61,690 160 power lines2002 Gavilan 5 5,763 43 vegetation
management burn
87
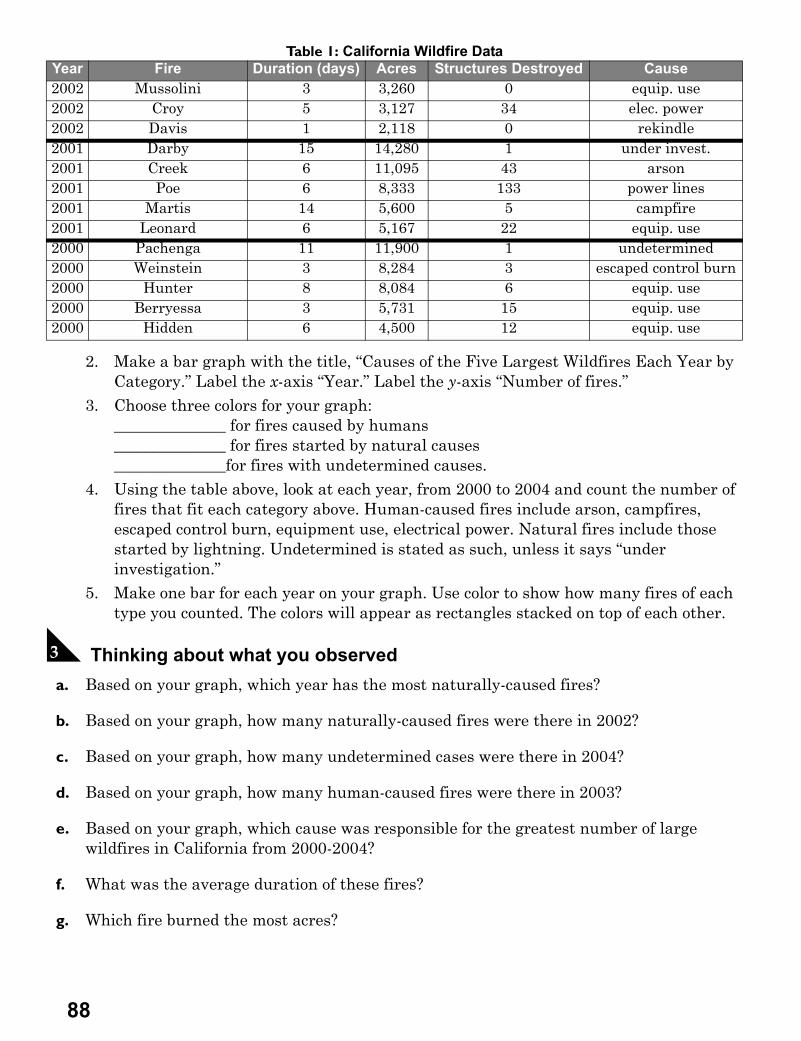
2. Make a bar graph with the title, “Causes of the Five Largest Wildfires Each Year by Category.” Label the x-axis “Year.” Label the y-axis “Number of fires.”
3. Choose three colors for your graph:______________ for fires caused by humans______________ for fires started by natural causes______________for fires with undetermined causes.
4. Using the table above, look at each year, from 2000 to 2004 and count the number of fires that fit each category above. Human-caused fires include arson, campfires, escaped control burn, equipment use, electrical power. Natural fires include those started by lightning. Undetermined is stated as such, unless it says “under investigation.”
5. Make one bar for each year on your graph. Use color to show how many fires of each type you counted. The colors will appear as rectangles stacked on top of each other.
C Thinking about what you observed a. Based on your graph, which year has the most naturally-caused fires?
b. Based on your graph, how many naturally-caused fires were there in 2002?
c. Based on your graph, how many undetermined cases were there in 2004?
d. Based on your graph, how many human-caused fires were there in 2003?
e. Based on your graph, which cause was responsible for the greatest number of large wildfires in California from 2000-2004?
f. What was the average duration of these fires?
g. Which fire burned the most acres?
2002 Mussolini 3 3,260 0 equip. use2002 Croy 5 3,127 34 elec. power2002 Davis 1 2,118 0 rekindle2001 Darby 15 14,280 1 under invest.2001 Creek 6 11,095 43 arson2001 Poe 6 8,333 133 power lines2001 Martis 14 5,600 5 campfire2001 Leonard 6 5,167 22 equip. use2000 Pachenga 11 11,900 1 undetermined2000 Weinstein 3 8,284 3 escaped control burn2000 Hunter 8 8,084 6 equip. use2000 Berryessa 3 5,731 15 equip. use2000 Hidden 6 4,500 12 equip. use
Table 1: California Wildfire DataYear Fire Duration (days) Acres Structures Destroyed Cause
88
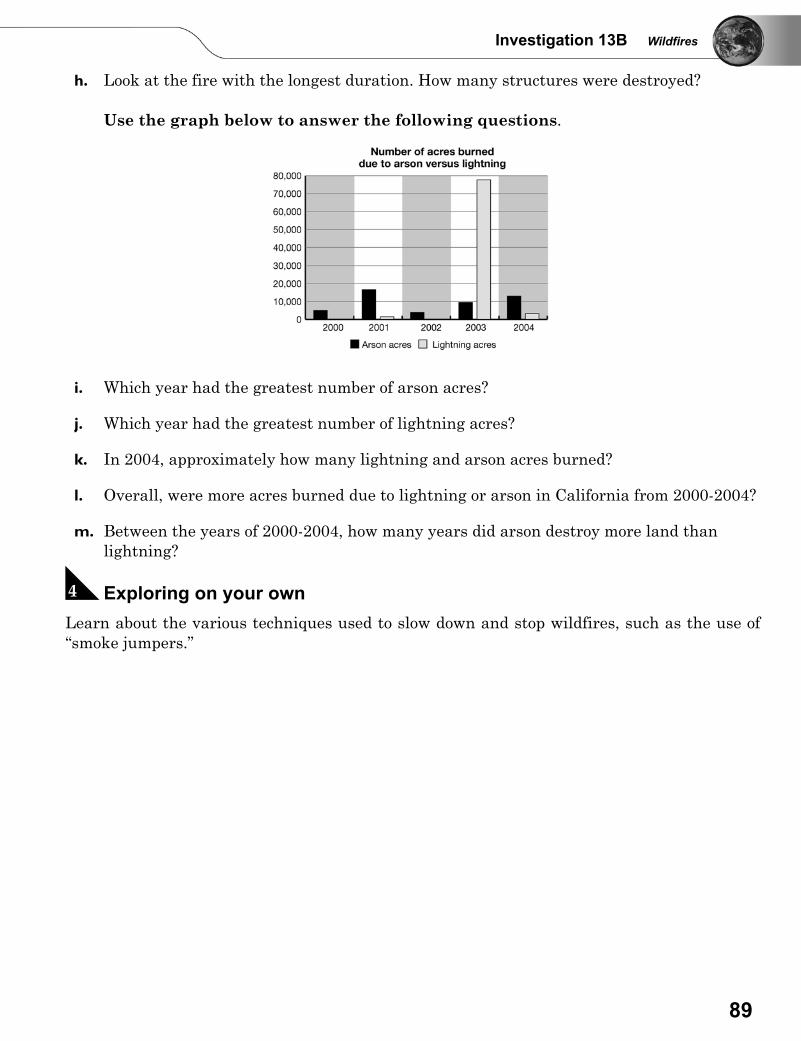
Investigation 13B Wildfires
h. Look at the fire with the longest duration. How many structures were destroyed?
Use the graph below to answer the following questions.
i. Which year had the greatest number of arson acres?
j. Which year had the greatest number of lightning acres?
k. In 2004, approximately how many lightning and arson acres burned?
l. Overall, were more acres burned due to lightning or arson in California from 2000-2004?
m. Between the years of 2000-2004, how many years did arson destroy more land than lightning?
D Exploring on your own Learn about the various techniques used to slow down and stop wildfires, such as the use of“smoke jumpers.”
89
14A Non-Renewable Resources How fast are we using non-renewable resources?
A Stop and think a. What is the difference between renewable and non-renewable resources?
b. What are some examples of each of these resources?
c. What type of resource do you expect will be depleted first?
B Activity AIn this activity, you will learn how non-renewable resources get depleted over time, especiallyas rate of use increases.
1. Fill your container with 100 beans (90 of one color type, 10 of another color/type). The 90 beans represent the fact that the United States currently uses non-renewable fossil fuels for 90% of our energy needs. The other 10% of our energy needs are met with renewable resources.
2. One student in each pair will put on the blindfold. This student will choose beans from the container.
3. For the first trial, the situation is as follows: The population is NOT growing and the demand for resources stays exactly the same from one year to the next. The blindfolded student will randomly pick 10 beans out of the jar. Any “renewable beans” can be put back in the jar. After replacing these beans, count how many beans remain in the jar. Record this information in the “Year 1” column of Table 1. How many years do you think it will take to deplete the non-renewable beans?
4. Repeat the process for year two. Continue until only renewable beans are left. Record all your data in Table 1. You may or may not use all of the columns available. You might even have to add more columns. Calculate the percentage left after each drawing. How many years did it take to run out of non-renewable resources?
As the world population and demand for energy increases, having a variety of energy sources becomes more and more important. We consume energy quickly, so we need sources of energy that are long-lasting, efficient, and as clean as possible.In this investigation, you will model the depletion of resources over time at a constant rate of use. Then you will model the depletion of resources when the rate of use increases.Next, you will make a physical model of an oil seep. This will help you understand how we find oil in the ocean.
Materials• 1 open container per two students• 2 types of dried beans or nuts—100 beans per pair
(90% one color/type, 10% another color/type)• Blindfold• Large clear cup or glass• Small mixing bowl• 2 mL cooking oil• 10 mL sand• 30 mL soil• 1 stick of modeling clay• Water
90
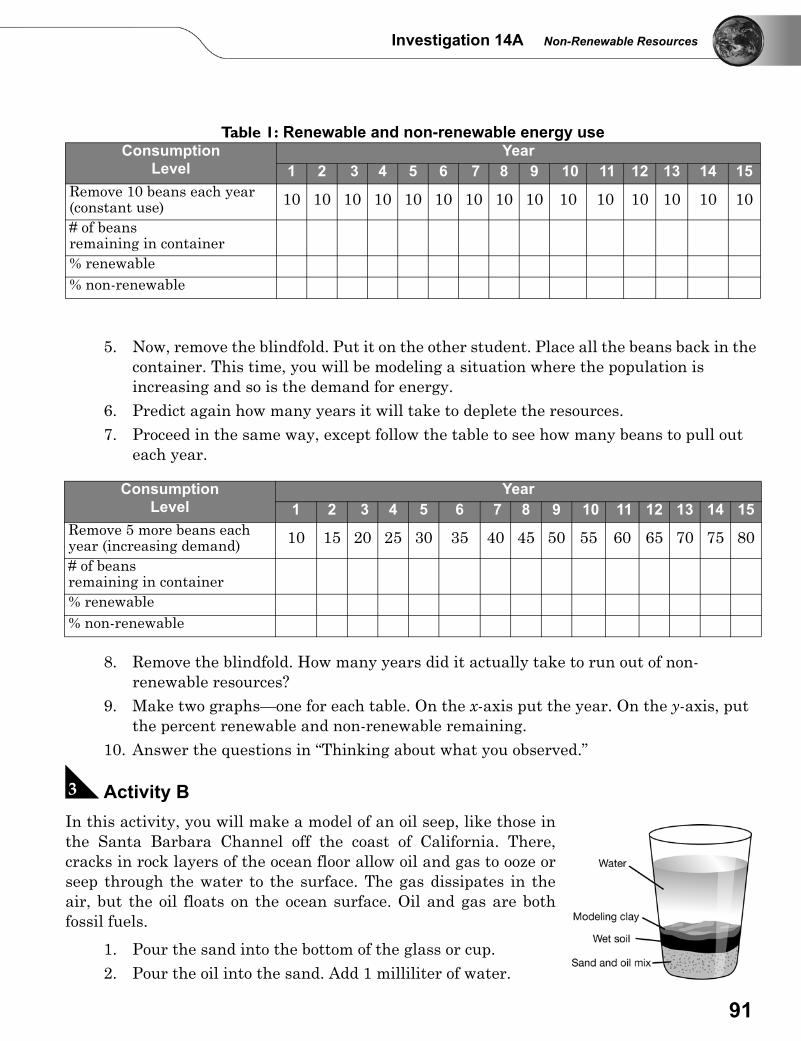
Investigation 14A Non-Renewable Resources
5. Now, remove the blindfold. Put it on the other student. Place all the beans back in the container. This time, you will be modeling a situation where the population is increasing and so is the demand for energy.
6. Predict again how many years it will take to deplete the resources. 7. Proceed in the same way, except follow the table to see how many beans to pull out
each year.
8. Remove the blindfold. How many years did it actually take to run out of non-renewable resources?
9. Make two graphs—one for each table. On the x-axis put the year. On the y-axis, put the percent renewable and non-renewable remaining.
10. Answer the questions in “Thinking about what you observed.”
C Activity BIn this activity, you will make a model of an oil seep, like those inthe Santa Barbara Channel off the coast of California. There,cracks in rock layers of the ocean floor allow oil and gas to ooze orseep through the water to the surface. The gas dissipates in theair, but the oil floats on the ocean surface. Oil and gas are bothfossil fuels.
1. Pour the sand into the bottom of the glass or cup.
2. Pour the oil into the sand. Add 1 milliliter of water.
Table 1: Renewable and non-renewable energy useConsumption
LevelYear
1 2 3 4 5 6 7 8 9 10 11 12 13 14 15Remove 10 beans each year (constant use) 10 10 10 10 10 10 10 10 10 10 10 10 10 10 10
# of beans remaining in container% renewable% non-renewable
ConsumptionLevel
Year1 2 3 4 5 6 7 8 9 10 11 12 13 14 15
Remove 5 more beans each year (increasing demand) 10 15 20 25 30 35 40 45 50 55 60 65 70 75 80
# of beans remaining in container% renewable% non-renewable
91
3. Mix the soil and water so that the mixture is very wet. Pack it tightly into the glass on top of the sand/oil mixture.
4. Take the clay and flatten it into a circle that can fit into the glass. Stick it into the glass, making a thin seal over the mud mixture.
5. Fill the rest of the glass with water.6. Time how long it takes the oil to seep through the layers to the top of the water.
D Thinking about what you observed a. Which graph in Activity A is more realistic? Why?
b. Which type of resource lasts for a longer time?
c. Compare your predictions for the number of years it would take to deplete the resources to the actual number of years that you measured. How close were you? How did you come to your prediction?
d. What did you learn about the rate of depletion of the two types of resources?
e. How long did it take for the oil to seep to the top of the water? Do you think it would take longer if there was more water on top of the clay? Why?
f. In the future, what should the United States try to do for energy consumption? Why?
E Exploring on your own 1. Try the oil seep experiment with a taller glass so that you can add more water. Also
try it with salt water. Did it take more or less time for the oil to seep to the surface? 2. Research some ways that oil and natural gas are removed from the ocean floor.3. How is coal created?
92
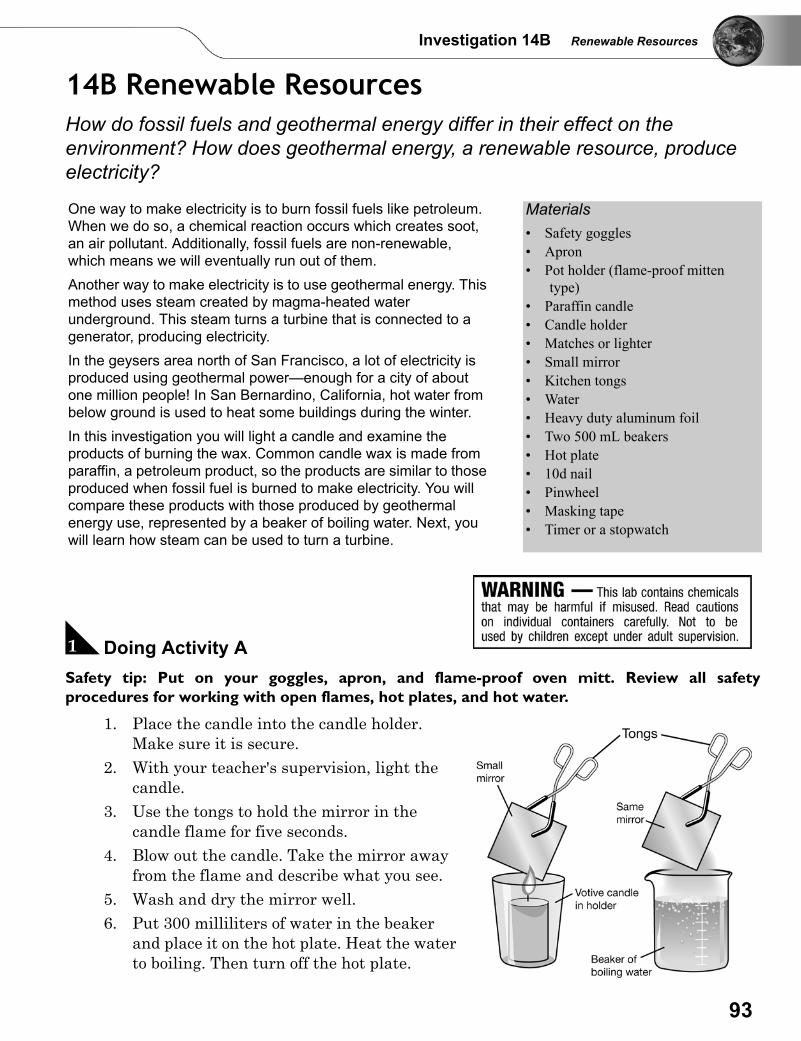
Investigation 14B Renewable Resources
14B Renewable ResourcesHow do fossil fuels and geothermal energy differ in their effect on the environment? How does geothermal energy, a renewable resource, produce electricity?
A Doing Activity A Safety tip: Put on your goggles, apron, and flame-proof oven mitt. Review all safetyprocedures for working with open flames, hot plates, and hot water.
1. Place the candle into the candle holder. Make sure it is secure.
2. With your teacher's supervision, light the candle.
3. Use the tongs to hold the mirror in the candle flame for five seconds.
4. Blow out the candle. Take the mirror away from the flame and describe what you see.
5. Wash and dry the mirror well.6. Put 300 milliliters of water in the beaker
and place it on the hot plate. Heat the water to boiling. Then turn off the hot plate.
One way to make electricity is to burn fossil fuels like petroleum. When we do so, a chemical reaction occurs which creates soot, an air pollutant. Additionally, fossil fuels are non-renewable, which means we will eventually run out of them.Another way to make electricity is to use geothermal energy. This method uses steam created by magma-heated water underground. This steam turns a turbine that is connected to a generator, producing electricity.In the geysers area north of San Francisco, a lot of electricity is produced using geothermal power—enough for a city of about one million people! In San Bernardino, California, hot water from below ground is used to heat some buildings during the winter.In this investigation you will light a candle and examine the products of burning the wax. Common candle wax is made from paraffin, a petroleum product, so the products are similar to those produced when fossil fuel is burned to make electricity. You will compare these products with those produced by geothermal energy use, represented by a beaker of boiling water. Next, you will learn how steam can be used to turn a turbine.
Materials• Safety goggles• Apron• Pot holder (flame-proof mitten
type)• Paraffin candle• Candle holder• Matches or lighter• Small mirror• Kitchen tongs• Water• Heavy duty aluminum foil• Two 500 mL beakers• Hot plate• 10d nail• Pinwheel• Masking tape• Timer or a stopwatch
93
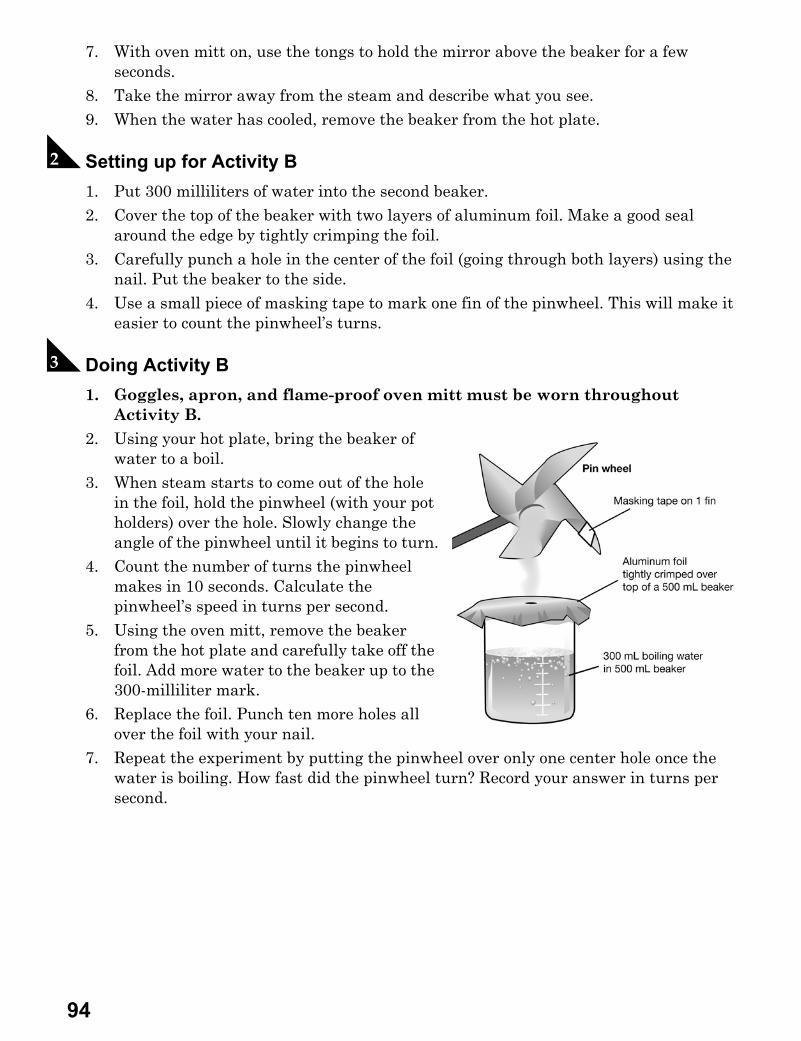
7. With oven mitt on, use the tongs to hold the mirror above the beaker for a few seconds.
8. Take the mirror away from the steam and describe what you see.9. When the water has cooled, remove the beaker from the hot plate.
B Setting up for Activity B1. Put 300 milliliters of water into the second beaker.2. Cover the top of the beaker with two layers of aluminum foil. Make a good seal
around the edge by tightly crimping the foil.3. Carefully punch a hole in the center of the foil (going through both layers) using the
nail. Put the beaker to the side.4. Use a small piece of masking tape to mark one fin of the pinwheel. This will make it
easier to count the pinwheel’s turns.
C Doing Activity B1. Goggles, apron, and flame-proof oven mitt must be worn throughout
Activity B.
2. Using your hot plate, bring the beaker of water to a boil.
3. When steam starts to come out of the hole in the foil, hold the pinwheel (with your pot holders) over the hole. Slowly change the angle of the pinwheel until it begins to turn.
4. Count the number of turns the pinwheel makes in 10 seconds. Calculate the pinwheel’s speed in turns per second.
5. Using the oven mitt, remove the beaker from the hot plate and carefully take off the foil. Add more water to the beaker up to the 300-milliliter mark.
6. Replace the foil. Punch ten more holes all over the foil with your nail.
7. Repeat the experiment by putting the pinwheel over only one center hole once the water is boiling. How fast did the pinwheel turn? Record your answer in turns per second.
94

Investigation 14B Renewable Resources
D Thinking about what you observed a. Explain how the burning candle and steam in Activity A represent types of energy
sources and air pollution.
b. In the geysers area of California, there has been a decrease in the amount of geothermal energy being created. It is thought that perhaps there are too many holes through which steam is escaping. Would your findings support that hypothesis? Why or why not?
E Exploring on your own What other places in California use geothermal energy to produce electricity? See if you canfind four locations outside the geysers area.
95
15A Food Webs, A Delicate Balance!How fragile are the ecosystems that we live in?
A Food web construction1. Arrange the classroom furniture so that there is enough space for the entire class to
form one large circle. The space inside the circle should be clear of obstacles.2. Your teacher will read a description of a particular ecosystem. You and your
classmates will create a food web to trace the energy flow through this ecosystem. 3. Your teacher will hand you a Food Web Activity card that contains information about
one type of organism in the ecosystem. Take a minute to read the card. You need to be familiar with the following information:• Species name• The species’ predators (if there are any)• How the species obtains energy (plants it eats, prey it eats, producer)
4. Create your food web, following the description below: • Your teacher will give the ball of string to one person.• The person with the string reads the name of his or her species, how the species
obtains food or energy, and what eats this species (if anything).• Next, this person holds one end of the string and then tosses the ball to one of
his/her prey (or energy source).• The string should form a line between the two species. Still holding that line, the
prey tosses the ball back to the predator. Now there is a “loop” connecting the two species.
• If there are additional prey species, the predator should repeat this sequence with each one.
• When the predator is finished, he or she should hand the ball of string to the teacher. The teacher will pass the ball on to the next student who will continue the process. Keep going until all members of the food web have been accounted for. Keep the string tight between students so that relationships are not lost!
You have learned a lot about ecosystems and the species living in them. The species in an ecosystem depend on each other in many ways. We can model these relationships using a food web that outlines the transfer of energy from species to species. Every living thing in an ecosystem is part of the food web and has a role in keeping it balanced. Food webs change due to factors like weather changes, disease, the introduction of new species, and human activity. If one thing is affected by an outside factor, what will happen to the rest of the ecosystem? During the Food Web Game, you will find out!
Materials• Food Web Activity cards• One ball of string
96
Investigation 15A Food Webs, A Delicate Balance!
B The balance gets thrown off!1. A disease attacks the one of the species in your food web. The entire population of this
species is destroyed. You will draw straws to determine which species is affected.2. All members of the affected species must drop the string and take one step back from
the web.3. As a class, discuss what happened to the string when this species disappeared. How
does this model what happens to energy flow in the food web?4. Roll up the ball of string.5. Return your desk with your species card. 6. Answer the questions below.
C Thinking about what you observedThese questions should be completed individually at the conclusion of the investigation.
a. What species did you represent in the investigation?
b. Were you a producer or a consumer? If you were a consumer, what kind were you? Explain your reasoning.
c. A deadly disease kills off the species that you represented in the food web. Identify three other organisms in the food web that would be affected by this loss. What would happen to each of them?
d. What would happen to the food web if all of the plant species were sprayed by chemicals and killed? Explain your reasoning.
e. Why is it crucial that both predators and prey live in an ecosystem? Explain your reasoning.
97
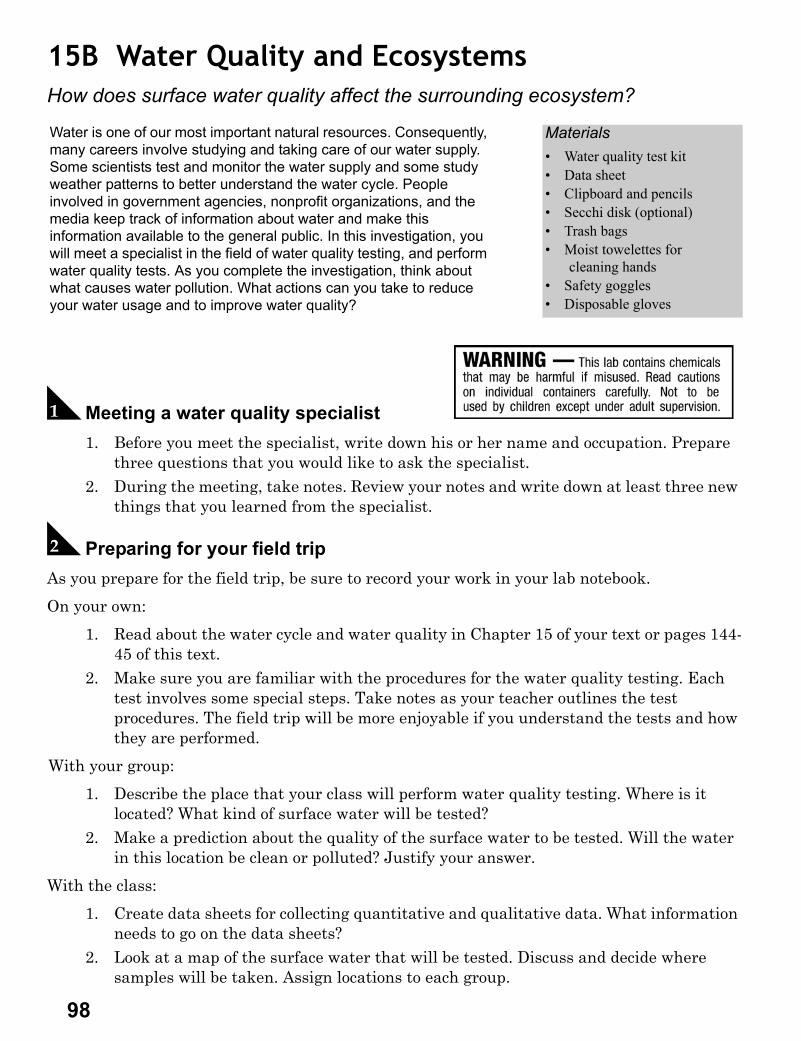
15B Water Quality and EcosystemsHow does surface water quality affect the surrounding ecosystem?
A Meeting a water quality specialist1. Before you meet the specialist, write down his or her name and occupation. Prepare
three questions that you would like to ask the specialist. 2. During the meeting, take notes. Review your notes and write down at least three new
things that you learned from the specialist.
B Preparing for your field trip As you prepare for the field trip, be sure to record your work in your lab notebook.
On your own:
1. Read about the water cycle and water quality in Chapter 15 of your text or pages 144-45 of this text.
2. Make sure you are familiar with the procedures for the water quality testing. Each test involves some special steps. Take notes as your teacher outlines the test procedures. The field trip will be more enjoyable if you understand the tests and how they are performed.
With your group:
1. Describe the place that your class will perform water quality testing. Where is it located? What kind of surface water will be tested?
2. Make a prediction about the quality of the surface water to be tested. Will the water in this location be clean or polluted? Justify your answer.
With the class:
1. Create data sheets for collecting quantitative and qualitative data. What information needs to go on the data sheets?
2. Look at a map of the surface water that will be tested. Discuss and decide where samples will be taken. Assign locations to each group.
Water is one of our most important natural resources. Consequently, many careers involve studying and taking care of our water supply. Some scientists test and monitor the water supply and some study weather patterns to better understand the water cycle. People involved in government agencies, nonprofit organizations, and the media keep track of information about water and make this information available to the general public. In this investigation, you will meet a specialist in the field of water quality testing, and perform water quality tests. As you complete the investigation, think about what causes water pollution. What actions can you take to reduce your water usage and to improve water quality?
Materials• Water quality test kit• Data sheet• Clipboard and pencils• Secchi disk (optional)• Trash bags• Moist towelettes for
cleaning hands• Safety goggles• Disposable gloves
98
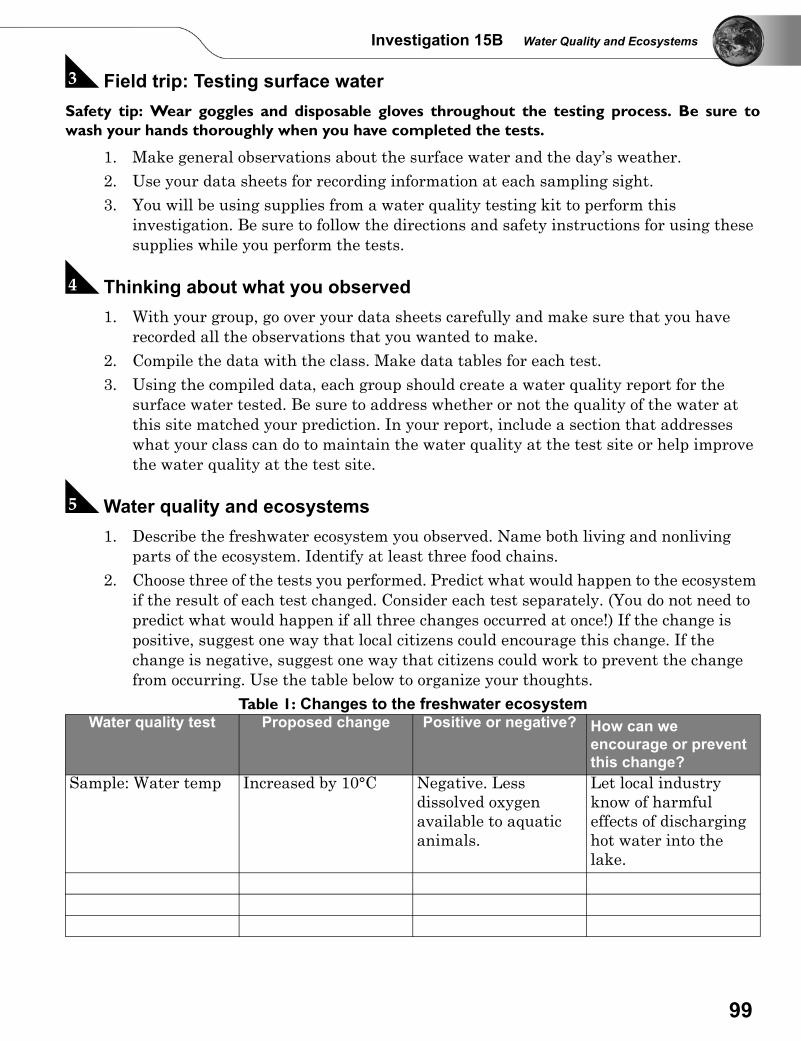
Investigation 15B Water Quality and Ecosystems
C Field trip: Testing surface waterSafety tip: Wear goggles and disposable gloves throughout the testing process. Be sure towash your hands thoroughly when you have completed the tests.
1. Make general observations about the surface water and the day’s weather.2. Use your data sheets for recording information at each sampling sight.3. You will be using supplies from a water quality testing kit to perform this
investigation. Be sure to follow the directions and safety instructions for using these supplies while you perform the tests.
D Thinking about what you observed1. With your group, go over your data sheets carefully and make sure that you have
recorded all the observations that you wanted to make.2. Compile the data with the class. Make data tables for each test.3. Using the compiled data, each group should create a water quality report for the
surface water tested. Be sure to address whether or not the quality of the water at this site matched your prediction. In your report, include a section that addresses what your class can do to maintain the water quality at the test site or help improve the water quality at the test site.
E Water quality and ecosystems1. Describe the freshwater ecosystem you observed. Name both living and nonliving
parts of the ecosystem. Identify at least three food chains.2. Choose three of the tests you performed. Predict what would happen to the ecosystem
if the result of each test changed. Consider each test separately. (You do not need to predict what would happen if all three changes occurred at once!) If the change is positive, suggest one way that local citizens could encourage this change. If the change is negative, suggest one way that citizens could work to prevent the change from occurring. Use the table below to organize your thoughts.
Table 1: Changes to the freshwater ecosystemWater quality test Proposed change Positive or negative? How can we
encourage or prevent this change?
Sample: Water temp Increased by 10°C Negative. Less dissolved oxygen available to aquatic animals.
Let local industry know of harmful effects of discharging hot water into the lake.
99
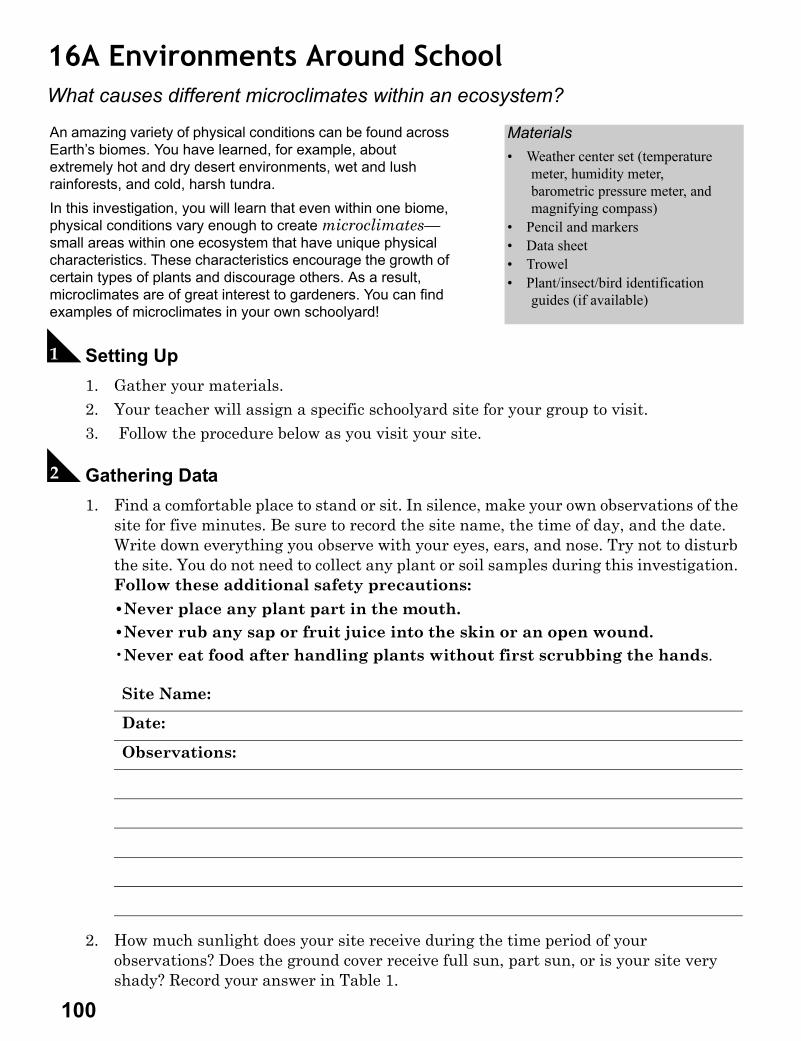
16A Environments Around SchoolWhat causes different microclimates within an ecosystem?
A Setting Up1. Gather your materials.2. Your teacher will assign a specific schoolyard site for your group to visit.3. Follow the procedure below as you visit your site.
B Gathering Data1. Find a comfortable place to stand or sit. In silence, make your own observations of the
site for five minutes. Be sure to record the site name, the time of day, and the date. Write down everything you observe with your eyes, ears, and nose. Try not to disturb the site. You do not need to collect any plant or soil samples during this investigation. Follow these additional safety precautions:
•Never place any plant part in the mouth.•Never rub any sap or fruit juice into the skin or an open wound.•Never eat food after handling plants without first scrubbing the hands.
2. How much sunlight does your site receive during the time period of your observations? Does the ground cover receive full sun, part sun, or is your site very shady? Record your answer in Table 1.
An amazing variety of physical conditions can be found across Earth’s biomes. You have learned, for example, about extremely hot and dry desert environments, wet and lush rainforests, and cold, harsh tundra. In this investigation, you will learn that even within one biome, physical conditions vary enough to create microclimates—small areas within one ecosystem that have unique physical characteristics. These characteristics encourage the growth of certain types of plants and discourage others. As a result, microclimates are of great interest to gardeners. You can find examples of microclimates in your own schoolyard!
Materials• Weather center set (temperature
meter, humidity meter, barometric pressure meter, and magnifying compass)
• Pencil and markers• Data sheet• Trowel• Plant/insect/bird identification
guides (if available)
Site Name:
Date:
Observations:
100
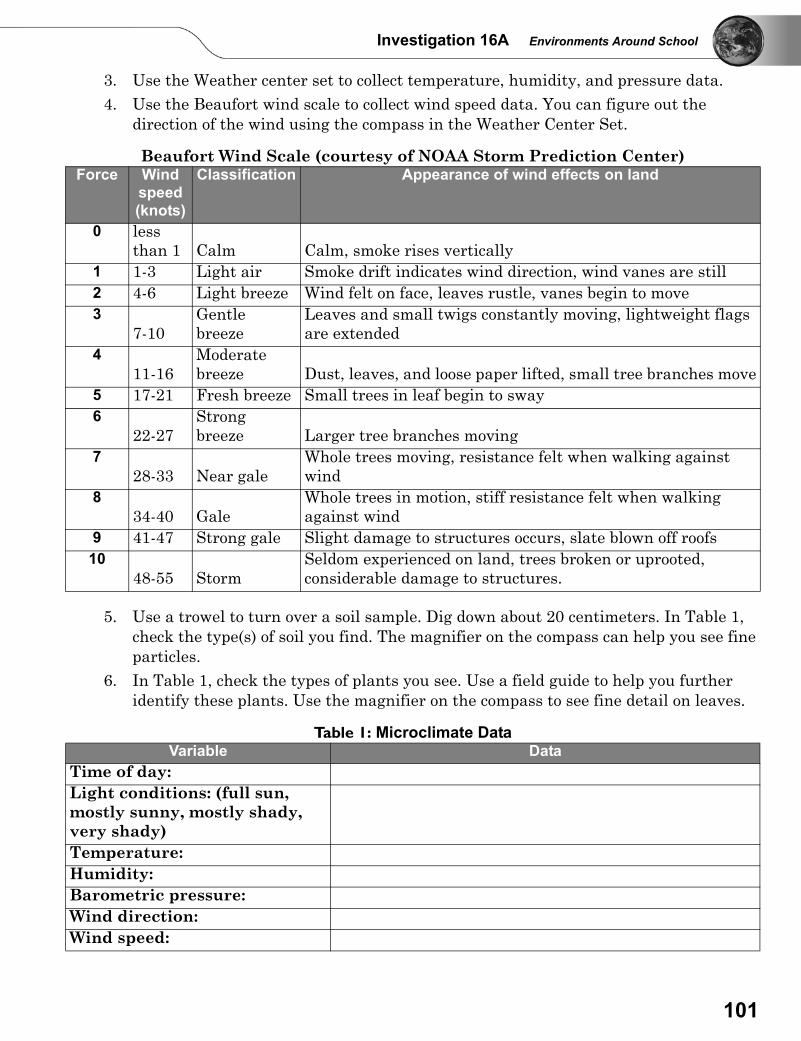
Investigation 16A Environments Around School
3. Use the Weather center set to collect temperature, humidity, and pressure data.4. Use the Beaufort wind scale to collect wind speed data. You can figure out the
direction of the wind using the compass in the Weather Center Set.
5. Use a trowel to turn over a soil sample. Dig down about 20 centimeters. In Table 1, check the type(s) of soil you find. The magnifier on the compass can help you see fine particles.
6. In Table 1, check the types of plants you see. Use a field guide to help you further identify these plants. Use the magnifier on the compass to see fine detail on leaves.
Beaufort Wind Scale (courtesy of NOAA Storm Prediction Center)Force Wind
speed (knots)
Classification Appearance of wind effects on land
0 less than 1 Calm Calm, smoke rises vertically
1 1-3 Light air Smoke drift indicates wind direction, wind vanes are still2 4-6 Light breeze Wind felt on face, leaves rustle, vanes begin to move3
7-10Gentle breeze
Leaves and small twigs constantly moving, lightweight flags are extended
411-16
Moderate breeze Dust, leaves, and loose paper lifted, small tree branches move
5 17-21 Fresh breeze Small trees in leaf begin to sway6
22-27Strong breeze Larger tree branches moving
728-33 Near gale
Whole trees moving, resistance felt when walking against wind
834-40 Gale
Whole trees in motion, stiff resistance felt when walking against wind
9 41-47 Strong gale Slight damage to structures occurs, slate blown off roofs10
48-55 StormSeldom experienced on land, trees broken or uprooted, considerable damage to structures.
Table 1: Microclimate DataVariable Data
Time of day:Light conditions: (full sun, mostly sunny, mostly shady, very shady)Temperature:Humidity:Barometric pressure:Wind direction:Wind speed:
101
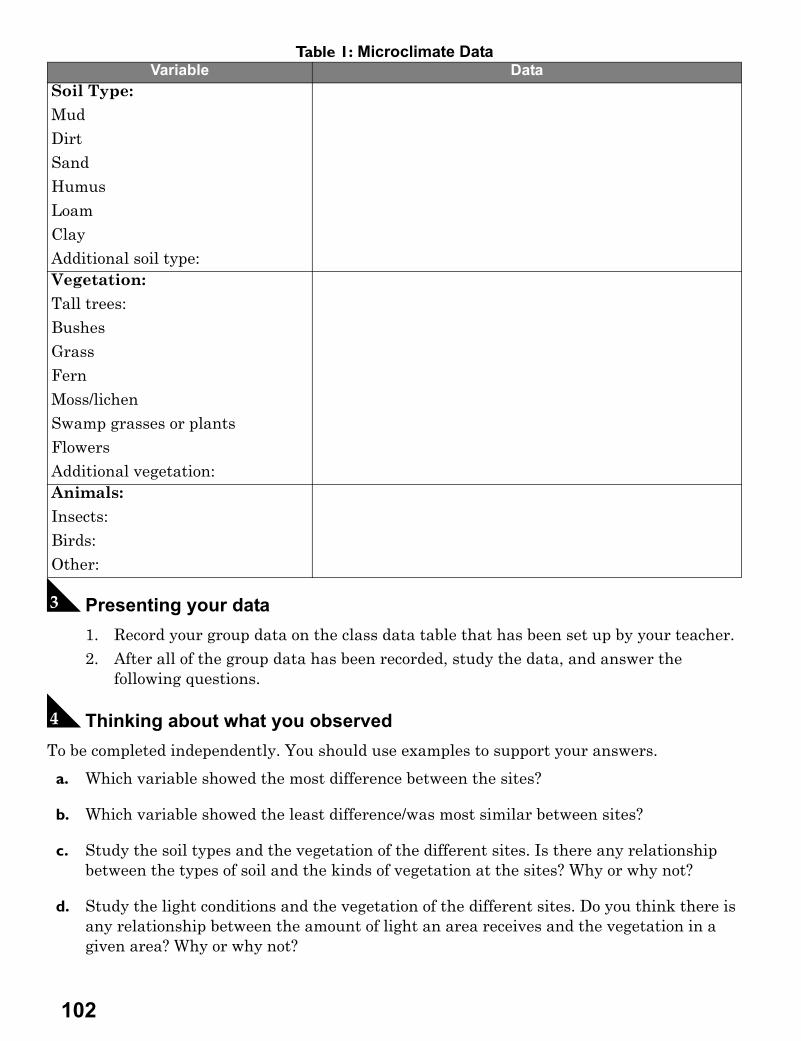
C Presenting your data1. Record your group data on the class data table that has been set up by your teacher. 2. After all of the group data has been recorded, study the data, and answer the
following questions.
D Thinking about what you observedTo be completed independently. You should use examples to support your answers.
a. Which variable showed the most difference between the sites?
b. Which variable showed the least difference/was most similar between sites?
c. Study the soil types and the vegetation of the different sites. Is there any relationship between the types of soil and the kinds of vegetation at the sites? Why or why not?
d. Study the light conditions and the vegetation of the different sites. Do you think there is any relationship between the amount of light an area receives and the vegetation in a given area? Why or why not?
Soil Type:
MudDirtSandHumusLoamClayAdditional soil type:Vegetation:
Tall trees:BushesGrassFernMoss/lichenSwamp grasses or plantsFlowersAdditional vegetation:Animals:
Insects:Birds:Other:
Table 1: Microclimate DataVariable Data
102
Investigation 16A Environments Around School
e. Study the temperature and the light conditions of the different sites. Do you think there is any relationship between the amount of light a given area receives and the temperature? Why or why not?
f. Study the humidity and the light conditions for the different sites. Do you think there is any relationship between the humidity and the light conditions of a given area? Why or why not?
E Exploring on your own a. Interview the person responsible for your school grounds. Ask them about the
microclimates they have observed, and how they make decisions about what to plant on the school grounds.
b. Invite a landscape architect to speak to your class about how microclimates play a role in landscape design.
103
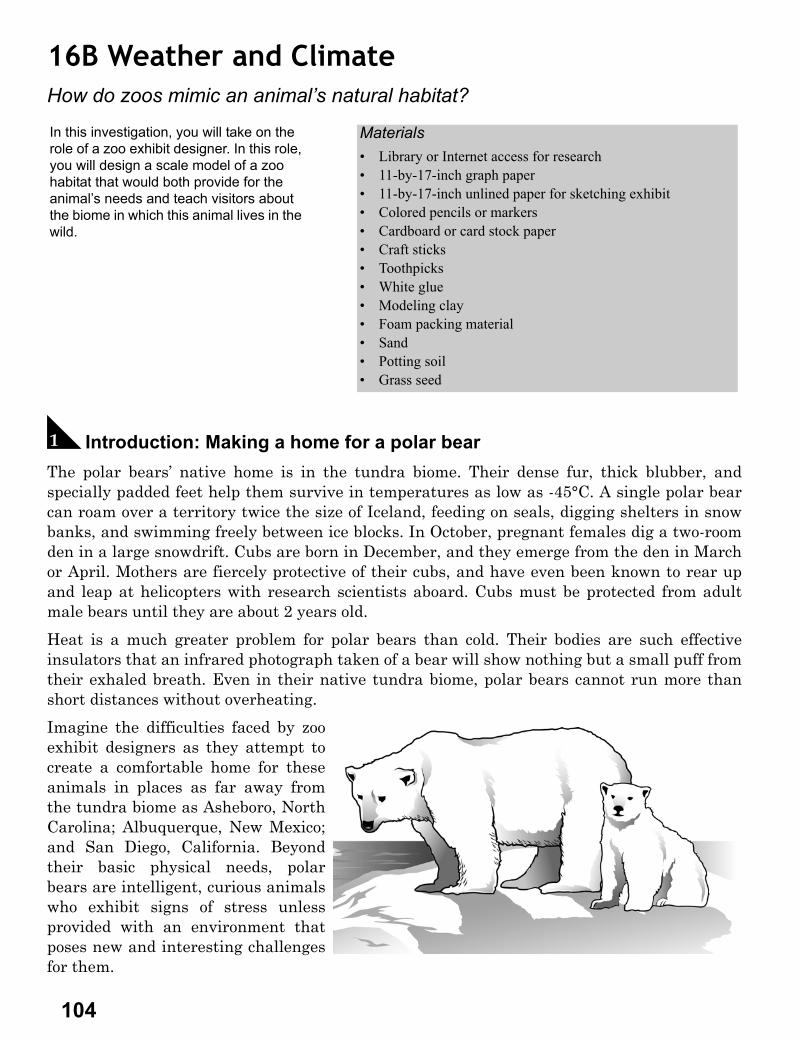
16B Weather and ClimateHow do zoos mimic an animal’s natural habitat?
A Introduction: Making a home for a polar bearThe polar bears’ native home is in the tundra biome. Their dense fur, thick blubber, andspecially padded feet help them survive in temperatures as low as -45°C. A single polar bearcan roam over a territory twice the size of Iceland, feeding on seals, digging shelters in snowbanks, and swimming freely between ice blocks. In October, pregnant females dig a two-roomden in a large snowdrift. Cubs are born in December, and they emerge from the den in Marchor April. Mothers are fiercely protective of their cubs, and have even been known to rear upand leap at helicopters with research scientists aboard. Cubs must be protected from adultmale bears until they are about 2 years old.
Heat is a much greater problem for polar bears than cold. Their bodies are such effectiveinsulators that an infrared photograph taken of a bear will show nothing but a small puff fromtheir exhaled breath. Even in their native tundra biome, polar bears cannot run more thanshort distances without overheating.
Imagine the difficulties faced by zooexhibit designers as they attempt tocreate a comfortable home for theseanimals in places as far away fromthe tundra biome as Asheboro, NorthCarolina; Albuquerque, New Mexico;and San Diego, California. Beyondtheir basic physical needs, polarbears are intelligent, curious animalswho exhibit signs of stress unlessprovided with an environment thatposes new and interesting challengesfor them.
In this investigation, you will take on the role of a zoo exhibit designer. In this role, you will design a scale model of a zoo habitat that would both provide for the animal’s needs and teach visitors about the biome in which this animal lives in the wild.
Materials• Library or Internet access for research• 11-by-17-inch graph paper • 11-by-17-inch unlined paper for sketching exhibit• Colored pencils or markers• Cardboard or card stock paper• Craft sticks• Toothpicks• White glue• Modeling clay• Foam packing material• Sand• Potting soil• Grass seed
104
Investigation 16B Weather and Climate
B Choose an animal a. Your group will be assigned a particular biome to study. Use a library or the Internet to
research the biome’s characteristics. You should be able to identify the temperature range, annual rainfall, special characteristics such as alternating rainy and dry seasons, and the prominent types of vegetation in the biome.
b. Once you have a clear picture of the biome’s physical characteristics, choose an animal unique to this biome that you believe could thrive in a carefully planned zoo habitat. Choose an animal that could be used to teach zoo visitors about its native environment. For example, a wildebeest’s long legs are adapted to enable it to outrun the periodic fires on the savanna grasslands.
C Plan an environmentDiscuss with your group the physical conditions that would be necessary for this animal tosurvive in a zoo in your community. Be sure to consider any differences in temperature,humidity, and rainfall between your animal’s native biome and the one in which you live. Howwill you keep your animal healthy and comfortable? You may wish to use the Internet toexplore zoo exhibit design, or contact a zoo in your area for assistance. Here are some things toconsider:
a. How many animals of this species will you have in the exhibit? Is this animal a solitary creature or does it live in a group?
b. Size of zoo habitat: Be sure to provide for both viewing areas and sheltered areas for the animal. Consider its exercise requirements as well as space for a dens, nests, etc.
c. Landscape: What type of ground surface and vegetation will make this animal most comfortable?
d. Security: How will you provide for both animal and visitor safety? Will you use fencing, a moat, a glass enclosure, or other means?
e. Feeding areas/water needs: How will you provide a clean and sanitary supply of food and water?
f. Heating and/or cooling of the exhibit: How will you meet the temperature and humidity needs of this animal?
g. Well-being of the animal: What additional features are necessary to ensure that the animal not only survives, but thrives in this environment?
h. Visitor education: What means will you use to teach visitors about this animal and the biome in which it originates?
105
D Present your design a. Decide as a group on a method of presenting your design visually. For example, you may
decide to build a scale model of your design or create a visually informative poster. Your design must effectively show how your zoo exhibit would both provide for the welfare of the animal and teach visitors about the animal’s home biome.
b. Zoo exhibit designers must present their ideas to the zoo’s board of directors before plans are finalized and construction begins. Prepare a 10-minute oral presentation that highlights the important features of your design and clearly shows how it meets the goals listed in step 3a.
c. Present your project to your classmates.
106
107
Lab Skills and Equipment Setups
Lab Skills and Equipment Setups
Safety Skills . . . . . . . . . . . . . . . . . . . . . . . . . . . . . . . . . . . . . . . . . . . 110
Writing a Lab Report . . . . . . . . . . . . . . . . . . . . . . . . . . . . . . . . . . . . 11414
Measuring Length . . . . . . . . . . . . . . . . . . . . . . . . . . . . . . . . . . . . . . 119
Measuring Temperature . . . . . . . . . . . . . . . . . . . . . . . . . . . . . . . . . 123
Calculating Volume . . . . . . . . . . . . . . . . . . . . . . . . . . . . . . . . . . . . . 125
Measuring Volume . . . . . . . . . . . . . . . . . . . . . . . . . . . . . . . . . . . . . . 129
Measuring Mass with a Triple Beam Balance . . . . . . . . . . . . . . . . 130
Recording Observations in the Lab. . . . . . . . . . . . . . . . . . . . . . . . . 138
Physics Stand . . . . . . . . . . . . . . . . . . . . . . . . . . . . . . . . . . . . . . . . . . 135
Car and Ramp . . . . . . . . . . . . . . . . . . . . . . . . . . . . . . . . . . . . . . . . . 137
Stream Table . . . . . . . . . . . . . . . . . . . . . . . . . . . . . . . . . . . . . . . . . . 139
Projects and AppendicesResponding to Natural Disasters . . . . . . . . . . . . . . . . . . . . . . . . . . 140
Keeping a Weather Log . . . . . . . . . . . . . . . . . . . . . . . . . . . . . . . . . . 142
Water Quality Testing . . . . . . . . . . . . . . . . . . . . . . . . . . . . . . . . . . . 144
Earth’s Interior . . . . . . . . . . . . . . . . . . . . . . . . . . . . . . . . . . . . . . . . 146
Metric Ruler . . . . . . . . . . . . . . . . . . . . . . . . . . . . . . . . . . . . . . . . . . . 147
Safety SkillsWhat can I do to protect myself and others in the lab?
A Follow these basic safety guidelinesYour teacher will divide the class into groups. Each group should create a poster-sized displayof one of the following guidelines. Hang the posters in the lab. Review these safety guidelinesbefore each Investigation.
1. Prepare for each Investigation.
a. Read the Investigation sheets carefully.
b. Take special note of safety instructions.
2. Listen to your teacher’s instructions before, during, and after the Investigation. Take notes to help you remember what your teacher has said.
3. Get ready to work: Roll long sleeves above the wrist. Tie back long hair. Remove dangling jewelry and any loose, bulky outer layers of clothing. Wear shoes that cover the toes.
4. Gather protective clothing (goggles, apron, gloves) at the beginning of the Investigation.
5. Emphasize teamwork. Help each other. Watch out for one another’s safety.
6. Clean up spills immediately. Clean up all materials and supplies after an Investigation.
B Know what to do when...1. working with heat.
a. Always handle hot items with a hot pad. Never use your bare hands.
b. Move carefully when you are near hot items. Sudden movements could cause burns if you touch or spill something hot.
c. Inform others if they are near hot items or liquids
2. working with electricity.
a. Always keep electric cords away from water.
b. Extension cords must not be placed where they may cause someone to trip or fall.
c. If an electrical appliance isn’t working, feels hot, or smells hot, tell a teacher right away.
Science equipment and supplies are fun to use. However, these materials must always be used with care. Here you will learn how to be safe in a science lab.
Materials• Poster board• Felt-tip markers
108
3. disposing of materials and supplies.
a. Generally, liquid household chemicals can be poured into a sink. Completely wash the chemical down the drain with plenty of water.
b. Generally, solid household chemicals can be placed in a trash can.
c. Any liquids or solids that should not be poured down the sink or placed in the trash have special disposal guidelines. Follow your teacher’s instructions.
d. If glass breaks, do not use your bare hands to pick up the pieces. Use a dustpan and a brush to clean up. “Sharps” trash (trash that has pieces of glass) should be well labeled. The best way to throw away broken glass is to seal it in a labeled cardboard box.
4. you are concerned about your safety or the safety of others.
a. Talk to your teacher immediately. Here are some examples:
• You smell chemical or gas fumes. This might indicate a chemical or gas leak.
• You smell something burning.
• You injure yourself or see someone else who is injured.
• You are having trouble using your equipment.
• You do not understand the instructions for the Investigation.
b. Listen carefully to your teacher’s instructions.
c. Follow your teacher’s instructions exactly.
109
C Safety quiz1. Draw a diagram of your science lab in the space below. Include in your diagram the
following items. Include notes that explain how to use these important safety items.
2. How many fire extinguishers are in your science lab? Explain how to use them.
3. List the steps that your teacher and your class would take to safely exit the science lab and the building in case of a fire or other emergency.
• Exit/entrance ways • Eye wash and shower • Sink• Fire extinguisher(s) • First aid kit • Trash cans• Fire blanket • Location of eye goggles
and lab aprons• Location of
special safety instructions
110
4. Before beginning certain Investigations, why should you first put on protective goggles and clothing?
5. Why is teamwork important when you are working in a science lab?
6. Why should you clean up after every Investigation?
7. List at least three things you should you do if you sense danger or see an emergency in your classroom or lab.
8. Five lab situations are described below. What would you do in each situation? a. You accidentally knock over a glass container and it breaks on the floor.
b. You accidentally spill a large amount of water on the floor.
111
c. You suddenly you begin to smell a “chemical” odor that gives you a headache.
d. You hear the fire alarm while you are working in the lab. You are wearing your goggles and lab apron.
e. While your lab partner has her lab goggles off, she gets some liquid from the experiment in her eye.
f. A fire starts in the lab.
Safety in the science lab is everyone’s responsibility!
112
D Safety contractKeep this contract in your notebook at all times.
By signing it, you agree to follow all the steps necessary to be safe in your science class andlab.
I, ____________________, (Your name)
Have learned about the use and location of the following:• Aprons, gloves• Eye protection• Eyewash fountain• Fire extinguisher and fire blanket• First aid kit• Heat sources (burners, hot plate, etc) and how to use them safely• Waste-disposal containers for glass, chemicals, matches, paper, and wood
Understand the safety information presented.
Will ask questions when I do not understand safety instructions.
Pledge to follow all of the safety guidelines that are presented on the Safety Skill Sheet at all times.
Pledge to follow all of the safety guidelines that are presented on Investigation sheets.
Will always follow the safety instructions that my teacher provides.
Additionally, I pledge to be careful about my own safety and to help others be safe. Iunderstand that I am responsible for helping to create a safe environment in the classroomand lab.
Signed and dated,
______________________________
Parent’s or Guardian’s statement:
I have read the Safety Skills sheet and give my consent for the student who has signed thepreceding statement to engage in laboratory activities using a variety of equipment andmaterials, including those described. I pledge my cooperation in urging that she or he observethe safety regulations prescribed.
____________________________________________________ _________________________________
Signature of Parent or Guardian Date
113
Writing a Lab ReportHow do you share the results of an experiment?
A The parts of a lab reportA lab report follows the steps of the scientific method. Use the checklist below to create yourown lab reports:
B A sample lab reportUse the sample lab report on the next two pages as a guide for writing your own lab reports.Remember that you are telling a story about something you did so that others can repeat yourexperiment.
A lab report is like a story about an experiment. The details in the story help others learn from what you did. A good lab report makes it possible for someone else to repeat your experiment. If their results and conclusions are similar to yours, you have support for your ideas. Through this process we come to understand more about how the world works.
Title: The title makes it easy for readers to quickly identify the topic of your experiment.
Research question: The research question tells the reader exactly what you want to find out through your experiment.
Introduction: This paragraph describes what you already know about the topic, and shows how this information relates to your experiment.
Hypothesis: The hypothesis states the prediction you plan to test in your experiment.
Materials: List all the materials you need to do the experiment.
Procedure: Describe the steps involved in your experiment. Make sure that you provide enough detail so readers can repeat what you did. You may want to provide sketches of the lab setup. Be sure to name the experimental variable and tell which variables you controlled.
Data/Observations: This is where you record what happened, using descriptive words, data tables, and graphs.
Analysis: In this section, describe your data in words. Here’s a good way to start: My data shows that...
Conclusion: This paragraph states whether your hypothesis was correct or incorrect. It may suggest a new research question or a new hypothesis.
114
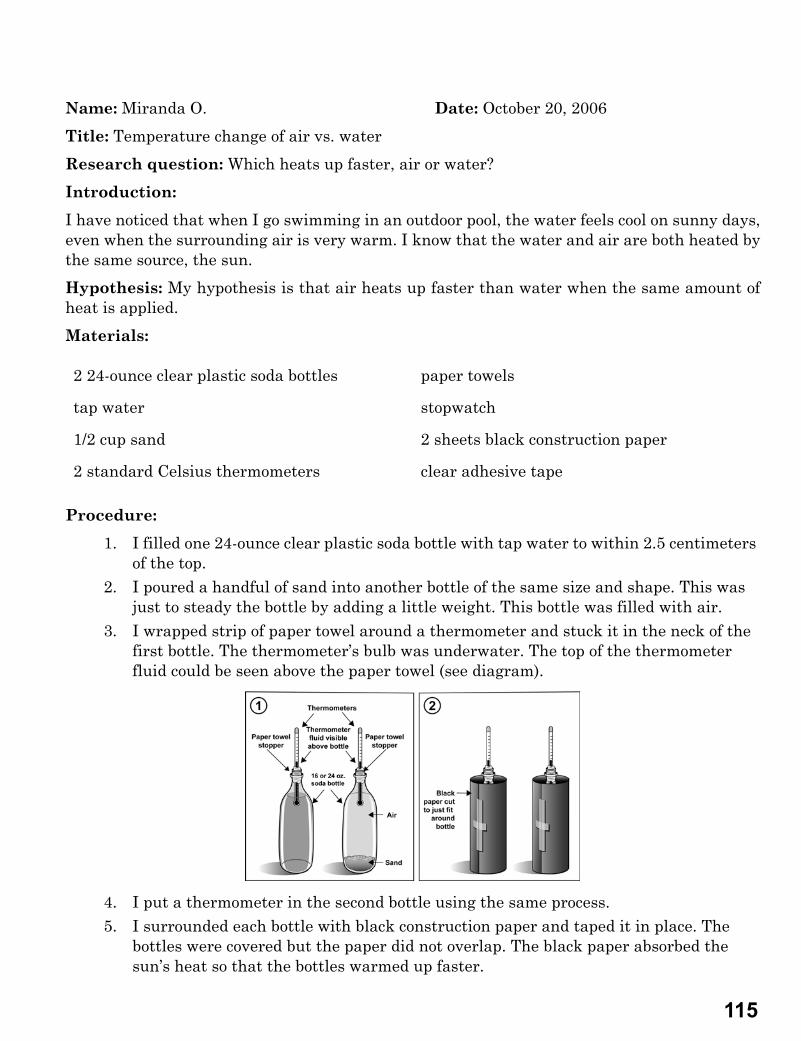
Name: Miranda O. Date: October 20, 2006
Title: Temperature change of air vs. water
Research question: Which heats up faster, air or water?
Introduction:
I have noticed that when I go swimming in an outdoor pool, the water feels cool on sunny days,even when the surrounding air is very warm. I know that the water and air are both heated bythe same source, the sun.
Hypothesis: My hypothesis is that air heats up faster than water when the same amount ofheat is applied.
Materials:
Procedure:
1. I filled one 24-ounce clear plastic soda bottle with tap water to within 2.5 centimeters of the top.
2. I poured a handful of sand into another bottle of the same size and shape. This was just to steady the bottle by adding a little weight. This bottle was filled with air.
3. I wrapped strip of paper towel around a thermometer and stuck it in the neck of the first bottle. The thermometer’s bulb was underwater. The top of the thermometer fluid could be seen above the paper towel (see diagram).
4. I put a thermometer in the second bottle using the same process.5. I surrounded each bottle with black construction paper and taped it in place. The
bottles were covered but the paper did not overlap. The black paper absorbed the sun’s heat so that the bottles warmed up faster.
2 24-ounce clear plastic soda bottles paper towels
tap water stopwatch
1/2 cup sand 2 sheets black construction paper
2 standard Celsius thermometers clear adhesive tape
115
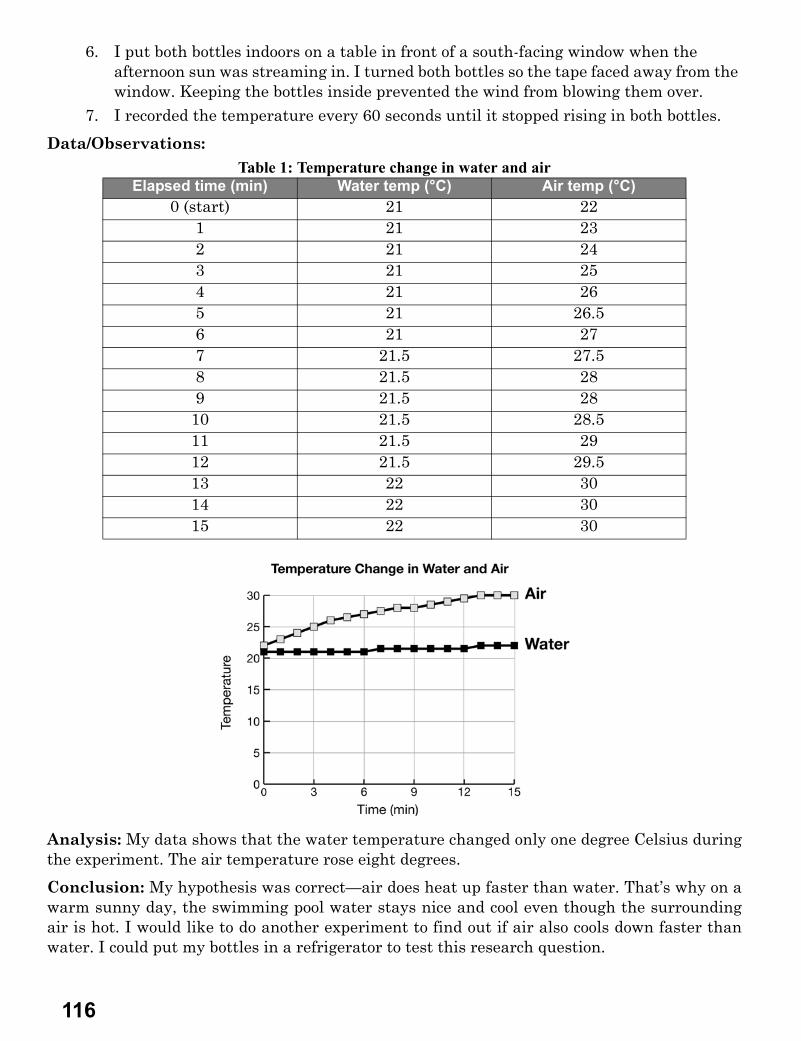
6. I put both bottles indoors on a table in front of a south-facing window when the afternoon sun was streaming in. I turned both bottles so the tape faced away from the window. Keeping the bottles inside prevented the wind from blowing them over.
7. I recorded the temperature every 60 seconds until it stopped rising in both bottles.
Data/Observations:
.
Analysis: My data shows that the water temperature changed only one degree Celsius duringthe experiment. The air temperature rose eight degrees.
Conclusion: My hypothesis was correct—air does heat up faster than water. That’s why on awarm sunny day, the swimming pool water stays nice and cool even though the surroundingair is hot. I would like to do another experiment to find out if air also cools down faster thanwater. I could put my bottles in a refrigerator to test this research question.
Table 1: Temperature change in water and airElapsed time (min) Water temp (°C) Air temp (°C)
0 (start) 21 221 21 232 21 243 21 254 21 265 21 26.56 21 277 21.5 27.58 21.5 289 21.5 28
10 21.5 28.511 21.5 2912 21.5 29.513 22 3014 22 3015 22 30
116
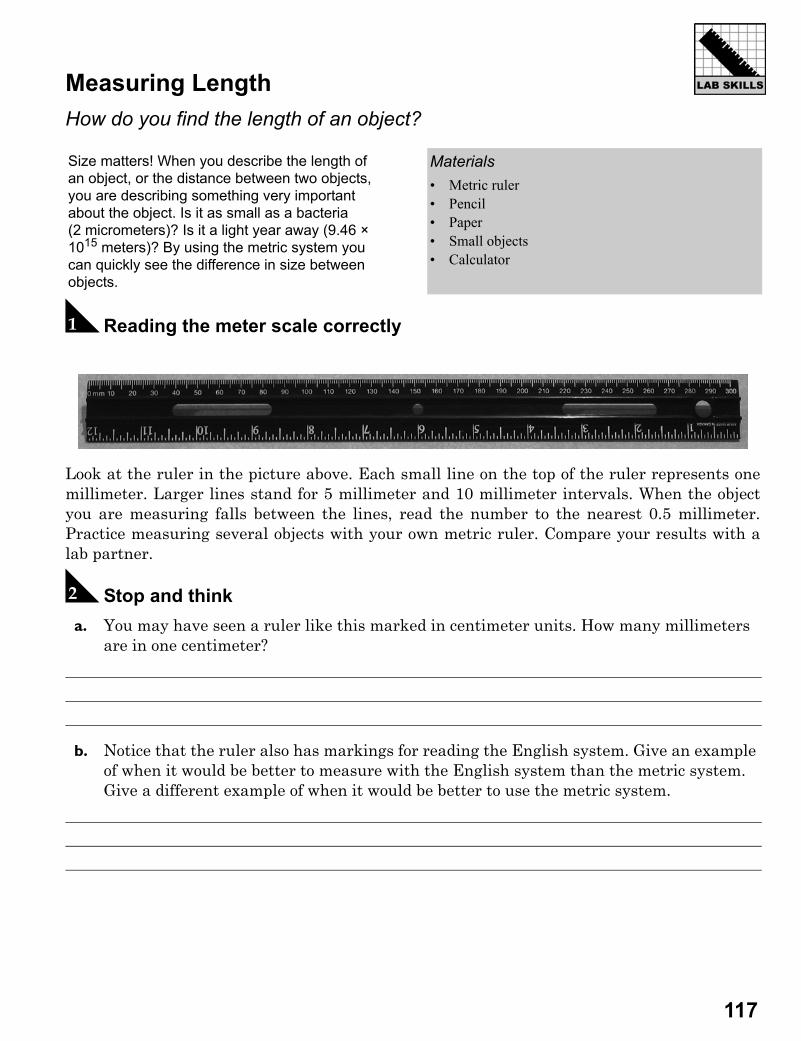
Measuring LengthHow do you find the length of an object?
A Reading the meter scale correctly
Look at the ruler in the picture above. Each small line on the top of the ruler represents onemillimeter. Larger lines stand for 5 millimeter and 10 millimeter intervals. When the objectyou are measuring falls between the lines, read the number to the nearest 0.5 millimeter.Practice measuring several objects with your own metric ruler. Compare your results with alab partner.
B Stop and think a. You may have seen a ruler like this marked in centimeter units. How many millimeters
are in one centimeter?
b. Notice that the ruler also has markings for reading the English system. Give an example of when it would be better to measure with the English system than the metric system. Give a different example of when it would be better to use the metric system.
Size matters! When you describe the length of an object, or the distance between two objects, you are describing something very important about the object. Is it as small as a bacteria (2 micrometers)? Is it a light year away (9.46 × 10¹⁵ meters)? By using the metric system you can quickly see the difference in size between objects.
Materials• Metric ruler• Pencil• Paper• Small objects• Calculator
117
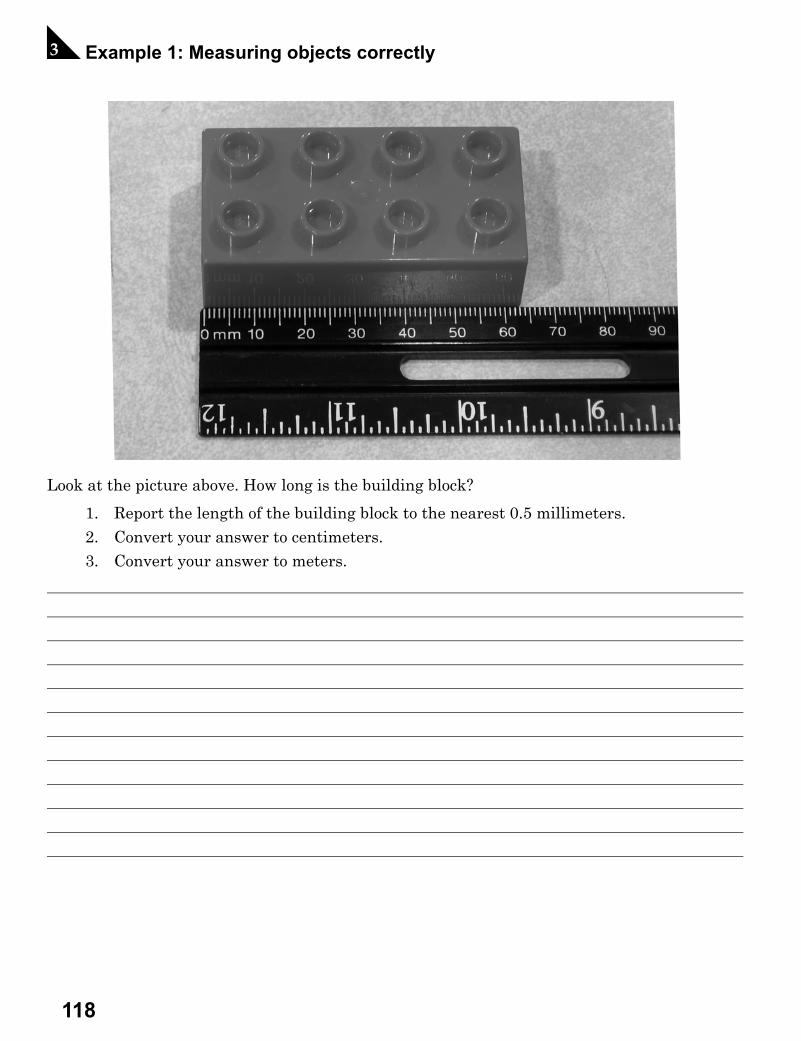
C Example 1: Measuring objects correctly
Look at the picture above. How long is the building block?
1. Report the length of the building block to the nearest 0.5 millimeters.2. Convert your answer to centimeters. 3. Convert your answer to meters.
118
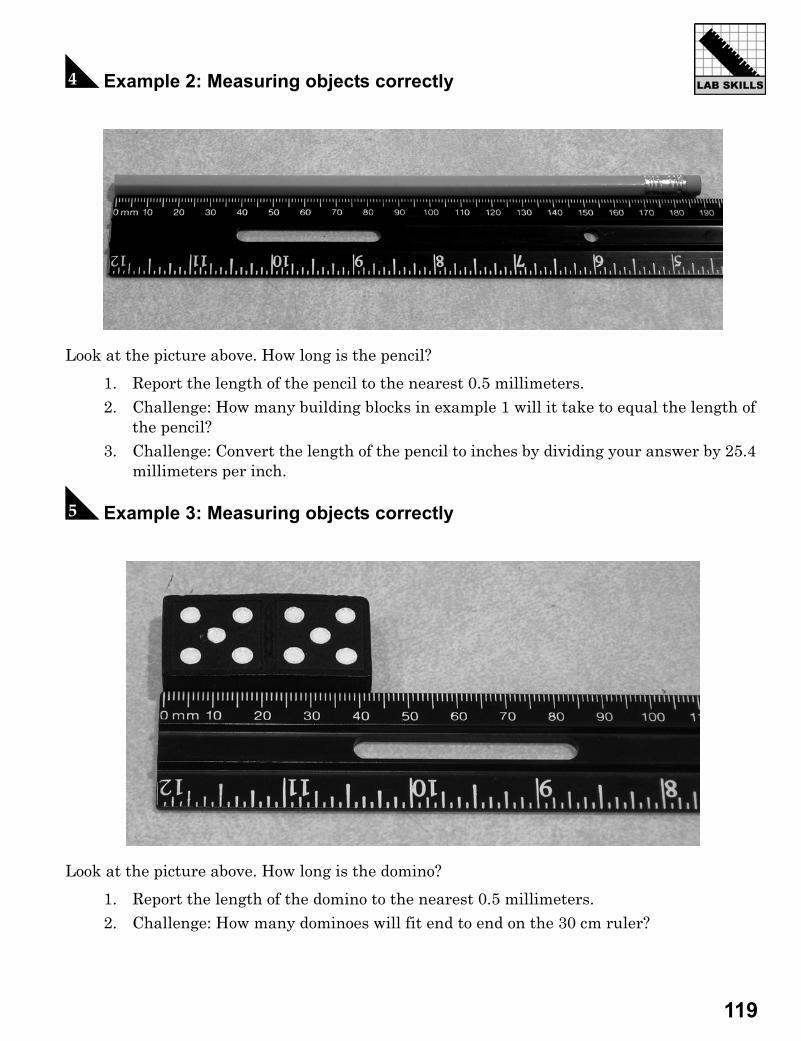
D Example 2: Measuring objects correctly
Look at the picture above. How long is the pencil?
1. Report the length of the pencil to the nearest 0.5 millimeters. 2. Challenge: How many building blocks in example 1 will it take to equal the length of
the pencil?3. Challenge: Convert the length of the pencil to inches by dividing your answer by 25.4
millimeters per inch.
E Example 3: Measuring objects correctly
Look at the picture above. How long is the domino?
1. Report the length of the domino to the nearest 0.5 millimeters. 2. Challenge: How many dominoes will fit end to end on the 30 cm ruler?
119
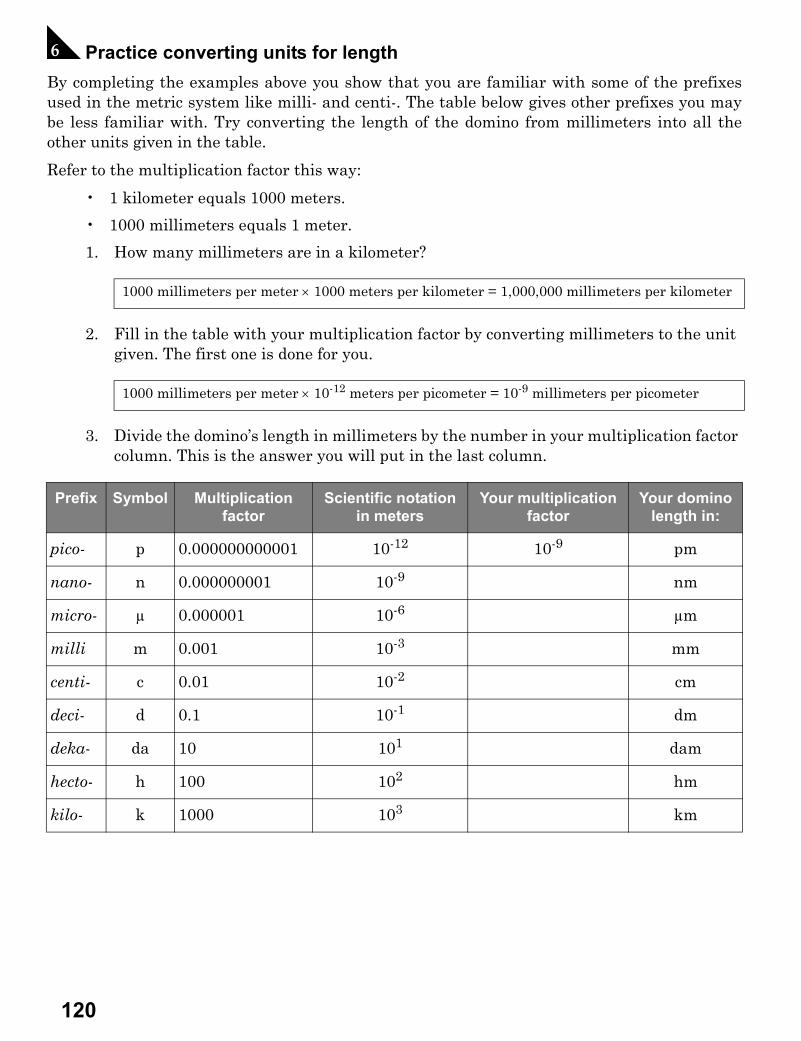
F Practice converting units for lengthBy completing the examples above you show that you are familiar with some of the prefixesused in the metric system like milli- and centi-. The table below gives other prefixes you maybe less familiar with. Try converting the length of the domino from millimeters into all theother units given in the table.
Refer to the multiplication factor this way:
• 1 kilometer equals 1000 meters.
• 1000 millimeters equals 1 meter.
1. How many millimeters are in a kilometer?
2. Fill in the table with your multiplication factor by converting millimeters to the unit given. The first one is done for you.
3. Divide the domino’s length in millimeters by the number in your multiplication factor column. This is the answer you will put in the last column.
1000 millimeters per meter × 1000 meters per kilometer = 1,000,000 millimeters per kilometer
1000 millimeters per meter × 10-12 meters per picometer = 10-9 millimeters per picometer
Prefix Symbol Multiplication factor
Scientific notation in meters
Your multiplication factor
Your domino length in:
pico- p 0.000000000001 10-12 10-9 pm
nano- n 0.000000001 10-9 nm
micro- μ 0.000001 10-6 μm
milli m 0.001 10-3 mm
centi- c 0.01 10-2 cm
deci- d 0.1 10-1 dm
deka- da 10 101 dam
hecto- h 100 102 hm
kilo- k 1000 103 km
120
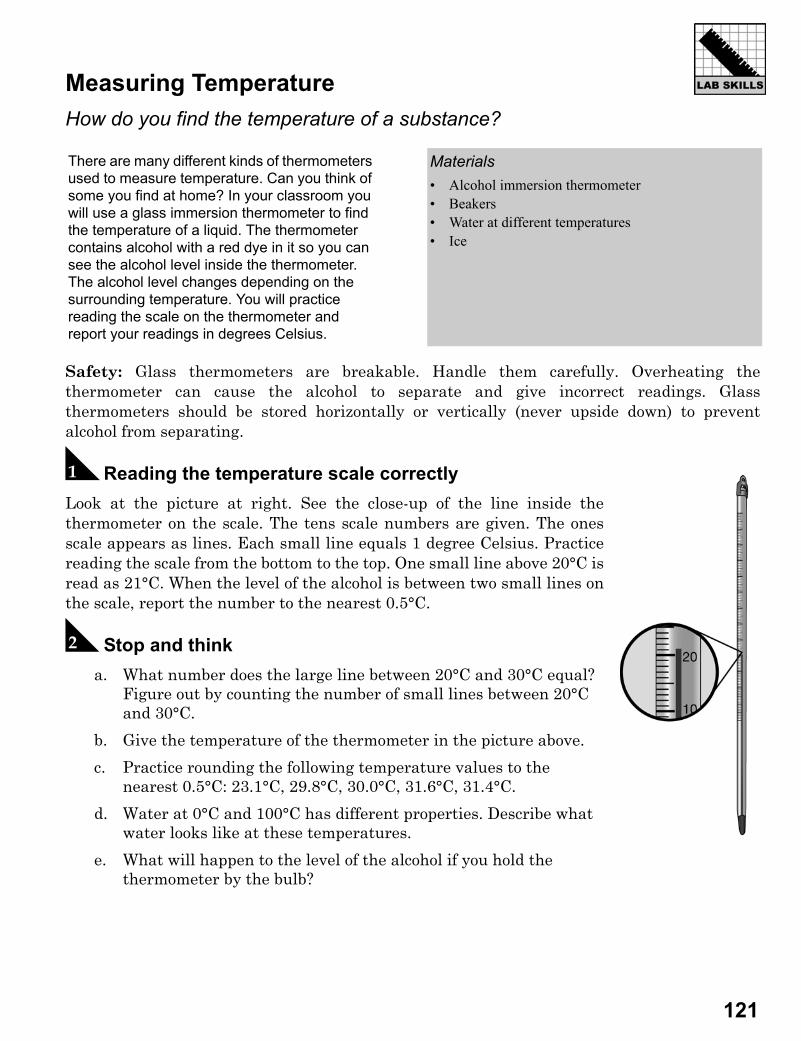
Measuring TemperatureHow do you find the temperature of a substance?
Safety: Glass thermometers are breakable. Handle them carefully. Overheating thethermometer can cause the alcohol to separate and give incorrect readings. Glassthermometers should be stored horizontally or vertically (never upside down) to preventalcohol from separating.
A Reading the temperature scale correctlyLook at the picture at right. See the close-up of the line inside thethermometer on the scale. The tens scale numbers are given. The onesscale appears as lines. Each small line equals 1 degree Celsius. Practicereading the scale from the bottom to the top. One small line above 20°C isread as 21°C. When the level of the alcohol is between two small lines onthe scale, report the number to the nearest 0.5°C.
B Stop and thinka. What number does the large line between 20°C and 30°C equal?
Figure out by counting the number of small lines between 20°C and 30°C.
b. Give the temperature of the thermometer in the picture above.
c. Practice rounding the following temperature values to the nearest 0.5°C: 23.1°C, 29.8°C, 30.0°C, 31.6°C, 31.4°C.
d. Water at 0°C and 100°C has different properties. Describe what water looks like at these temperatures.
e. What will happen to the level of the alcohol if you hold the thermometer by the bulb?
There are many different kinds of thermometers used to measure temperature. Can you think of some you find at home? In your classroom you will use a glass immersion thermometer to find the temperature of a liquid. The thermometer contains alcohol with a red dye in it so you can see the alcohol level inside the thermometer. The alcohol level changes depending on the surrounding temperature. You will practice reading the scale on the thermometer and report your readings in degrees Celsius.
Materials• Alcohol immersion thermometer• Beakers • Water at different temperatures• Ice
121
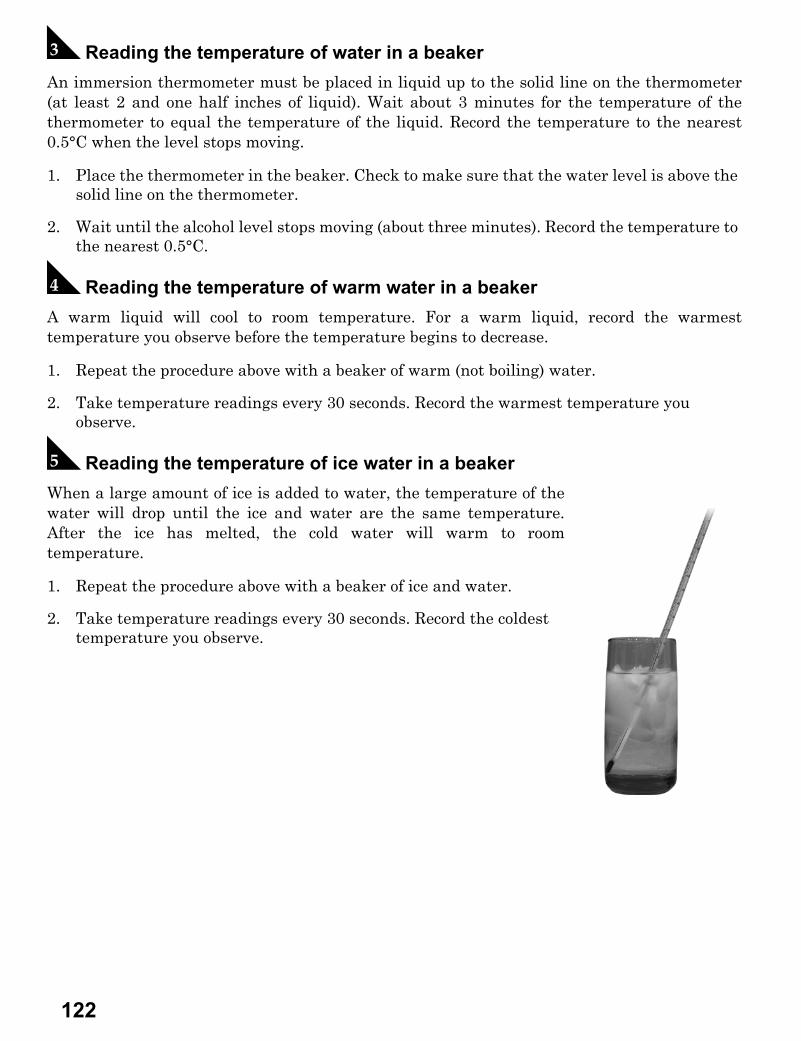
C Reading the temperature of water in a beakerAn immersion thermometer must be placed in liquid up to the solid line on the thermometer(at least 2 and one half inches of liquid). Wait about 3 minutes for the temperature of thethermometer to equal the temperature of the liquid. Record the temperature to the nearest0.5°C when the level stops moving.
1. Place the thermometer in the beaker. Check to make sure that the water level is above the solid line on the thermometer.
2. Wait until the alcohol level stops moving (about three minutes). Record the temperature to the nearest 0.5°C.
D Reading the temperature of warm water in a beakerA warm liquid will cool to room temperature. For a warm liquid, record the warmesttemperature you observe before the temperature begins to decrease.
1. Repeat the procedure above with a beaker of warm (not boiling) water.
2. Take temperature readings every 30 seconds. Record the warmest temperature you observe.
E Reading the temperature of ice water in a beakerWhen a large amount of ice is added to water, the temperature of thewater will drop until the ice and water are the same temperature.After the ice has melted, the cold water will warm to roomtemperature.
1. Repeat the procedure above with a beaker of ice and water.
2. Take temperature readings every 30 seconds. Record the coldest temperature you observe.
122
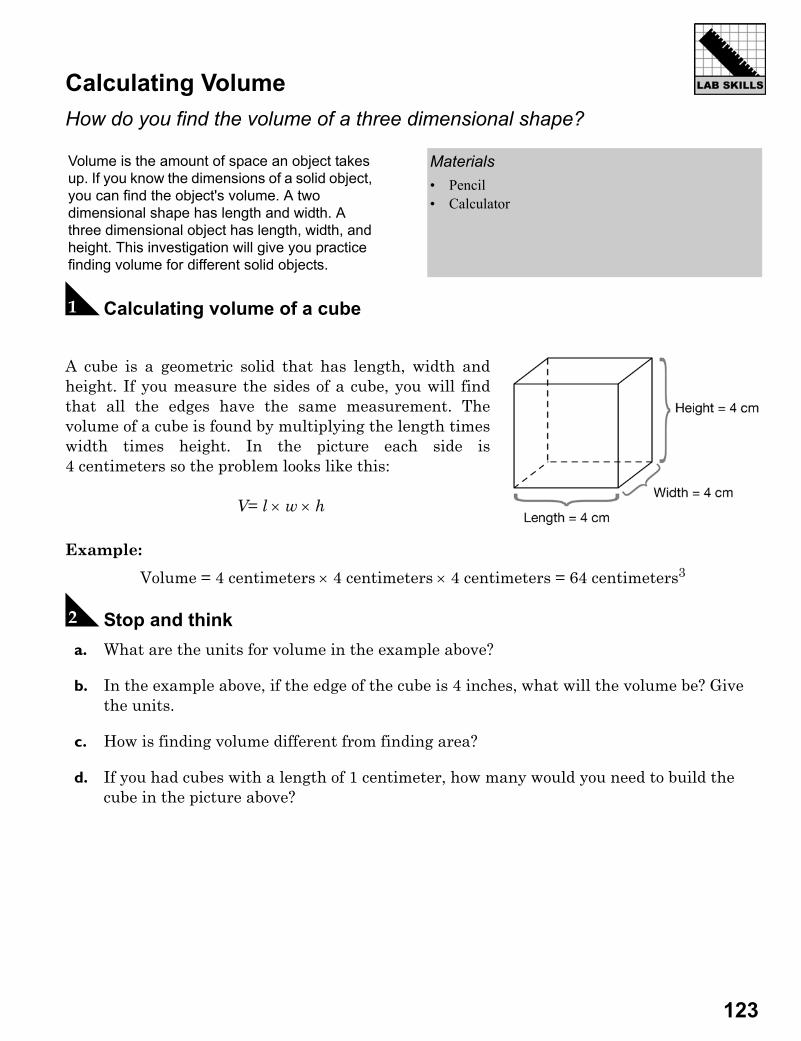
Calculating VolumeHow do you find the volume of a three dimensional shape?
A Calculating volume of a cube
A cube is a geometric solid that has length, width andheight. If you measure the sides of a cube, you will findthat all the edges have the same measurement. Thevolume of a cube is found by multiplying the length timeswidth times height. In the picture each side is4 centimeters so the problem looks like this:
Example:
Volume = 4 centimeters × 4 centimeters × 4 centimeters = 64 centimeters3
B Stop and think a. What are the units for volume in the example above?
b. In the example above, if the edge of the cube is 4 inches, what will the volume be? Give the units.
c. How is finding volume different from finding area?
d. If you had cubes with a length of 1 centimeter, how many would you need to build the cube in the picture above?
Volume is the amount of space an object takes up. If you know the dimensions of a solid object, you can find the object's volume. A two dimensional shape has length and width. A three dimensional object has length, width, and height. This investigation will give you practice finding volume for different solid objects.
Materials• Pencil• Calculator
V= l × w × h
123
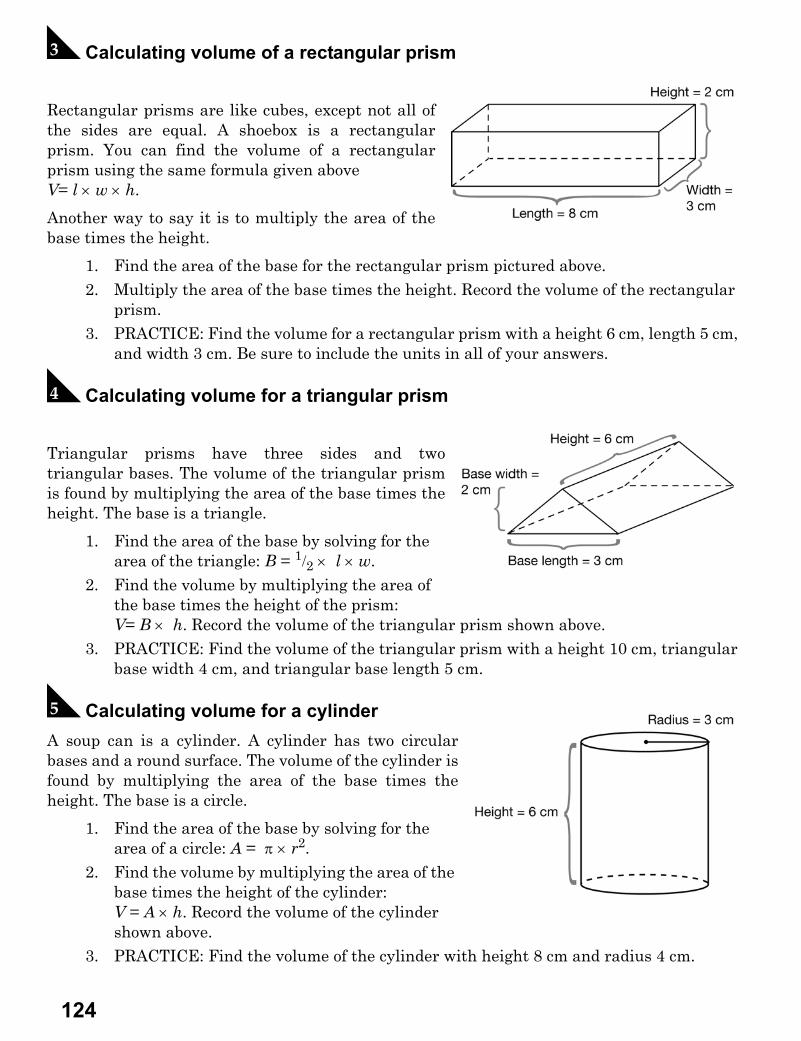
C Calculating volume of a rectangular prism
Rectangular prisms are like cubes, except not all ofthe sides are equal. A shoebox is a rectangularprism. You can find the volume of a rectangularprism using the same formula given above V= l × w × h.
Another way to say it is to multiply the area of thebase times the height.
1. Find the area of the base for the rectangular prism pictured above.2. Multiply the area of the base times the height. Record the volume of the rectangular
prism.3. PRACTICE: Find the volume for a rectangular prism with a height 6 cm, length 5 cm,
and width 3 cm. Be sure to include the units in all of your answers.
D Calculating volume for a triangular prism
Triangular prisms have three sides and twotriangular bases. The volume of the triangular prismis found by multiplying the area of the base times theheight. The base is a triangle.
1. Find the area of the base by solving for the area of the triangle: B = 1/2 × l × w.
2. Find the volume by multiplying the area of the base times the height of the prism: V= B × h. Record the volume of the triangular prism shown above.
3. PRACTICE: Find the volume of the triangular prism with a height 10 cm, triangular base width 4 cm, and triangular base length 5 cm.
E Calculating volume for a cylinderA soup can is a cylinder. A cylinder has two circularbases and a round surface. The volume of the cylinder isfound by multiplying the area of the base times theheight. The base is a circle.
1. Find the area of the base by solving for the area of a circle: A = π × r2.
2. Find the volume by multiplying the area of the base times the height of the cylinder: V = A × h. Record the volume of the cylinder shown above.
3. PRACTICE: Find the volume of the cylinder with height 8 cm and radius 4 cm.
124
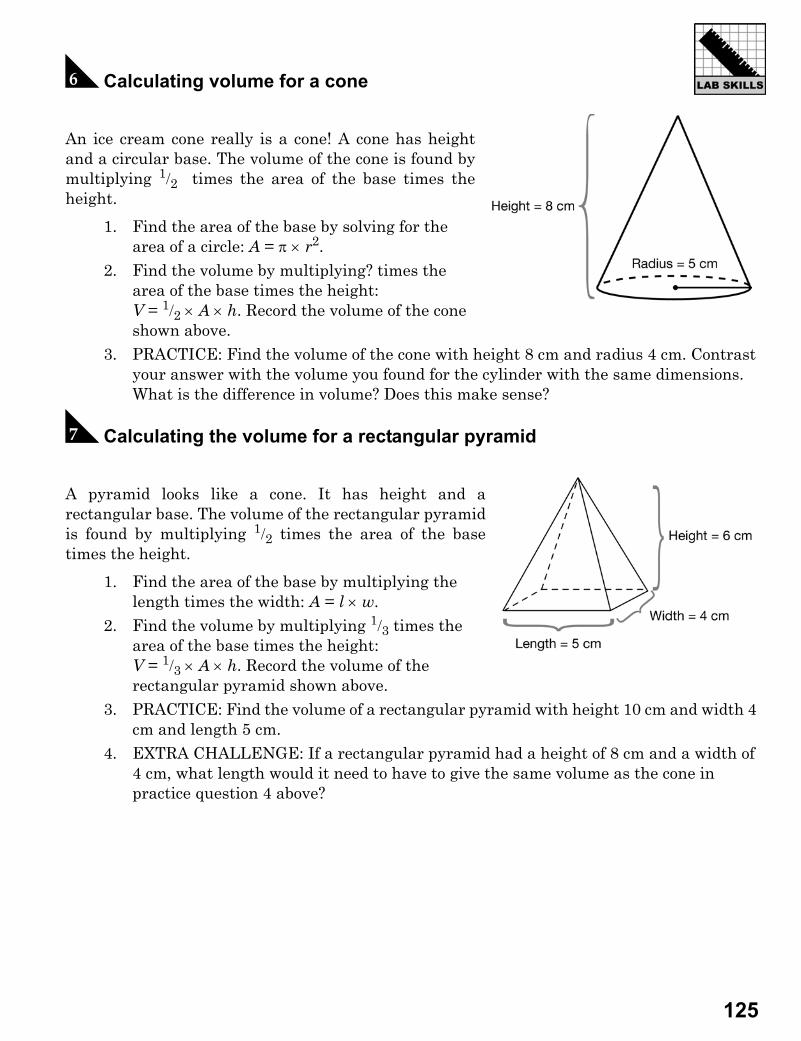
F Calculating volume for a cone
An ice cream cone really is a cone! A cone has heightand a circular base. The volume of the cone is found bymultiplying 1/2 times the area of the base times theheight.
1. Find the area of the base by solving for the area of a circle: A = π × r2.
2. Find the volume by multiplying? times the area of the base times the height: V = 1/2 × A × h. Record the volume of the cone shown above.
3. PRACTICE: Find the volume of the cone with height 8 cm and radius 4 cm. Contrast your answer with the volume you found for the cylinder with the same dimensions. What is the difference in volume? Does this make sense?
G Calculating the volume for a rectangular pyramid
A pyramid looks like a cone. It has height and arectangular base. The volume of the rectangular pyramidis found by multiplying 1/2 times the area of the basetimes the height.
1. Find the area of the base by multiplying the length times the width: A = l × w.
2. Find the volume by multiplying 1/3 times the area of the base times the height: V = 1/3 × A × h. Record the volume of the rectangular pyramid shown above.
3. PRACTICE: Find the volume of a rectangular pyramid with height 10 cm and width 4 cm and length 5 cm.
4. EXTRA CHALLENGE: If a rectangular pyramid had a height of 8 cm and a width of 4 cm, what length would it need to have to give the same volume as the cone in practice question 4 above?
125
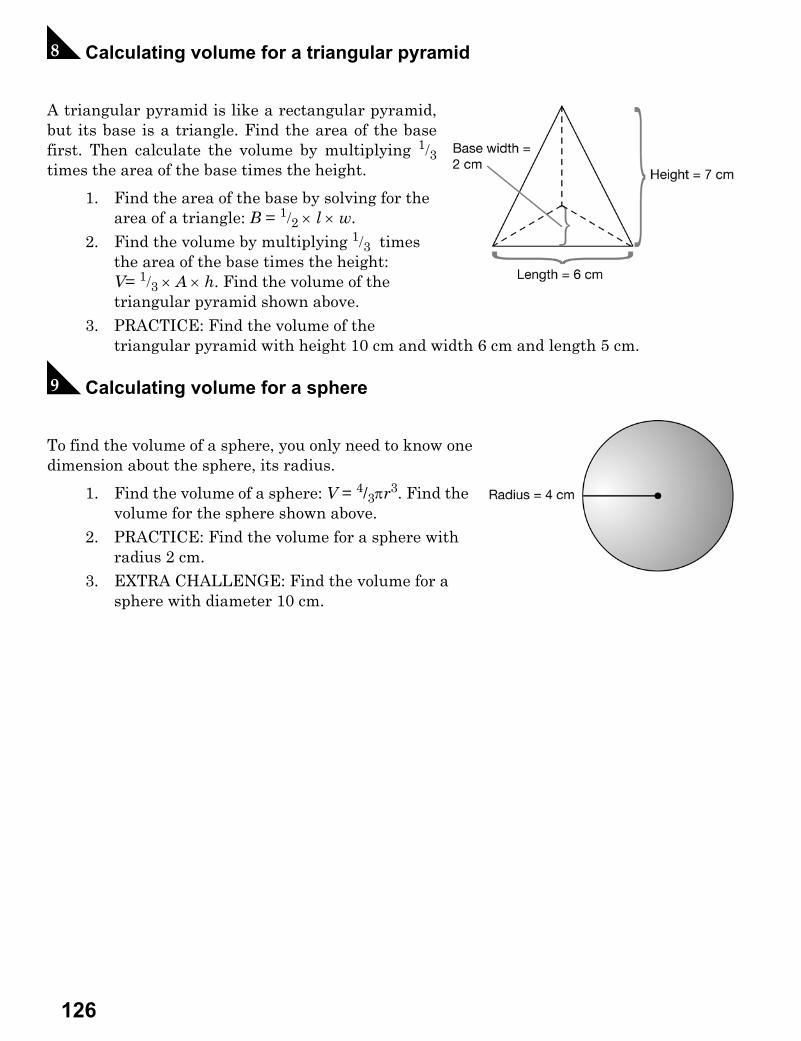
H Calculating volume for a triangular pyramid
A triangular pyramid is like a rectangular pyramid,but its base is a triangle. Find the area of the basefirst. Then calculate the volume by multiplying 1/3times the area of the base times the height.
1. Find the area of the base by solving for the area of a triangle: B = 1/2 × l × w.
2. Find the volume by multiplying 1/3 times the area of the base times the height: V= 1/3 × A × h. Find the volume of the triangular pyramid shown above.
3. PRACTICE: Find the volume of the triangular pyramid with height 10 cm and width 6 cm and length 5 cm.
I Calculating volume for a sphere
To find the volume of a sphere, you only need to know onedimension about the sphere, its radius.
1. Find the volume of a sphere: V = 4/3πr3. Find the volume for the sphere shown above.
2. PRACTICE: Find the volume for a sphere with radius 2 cm.
3. EXTRA CHALLENGE: Find the volume for a sphere with diameter 10 cm.
126
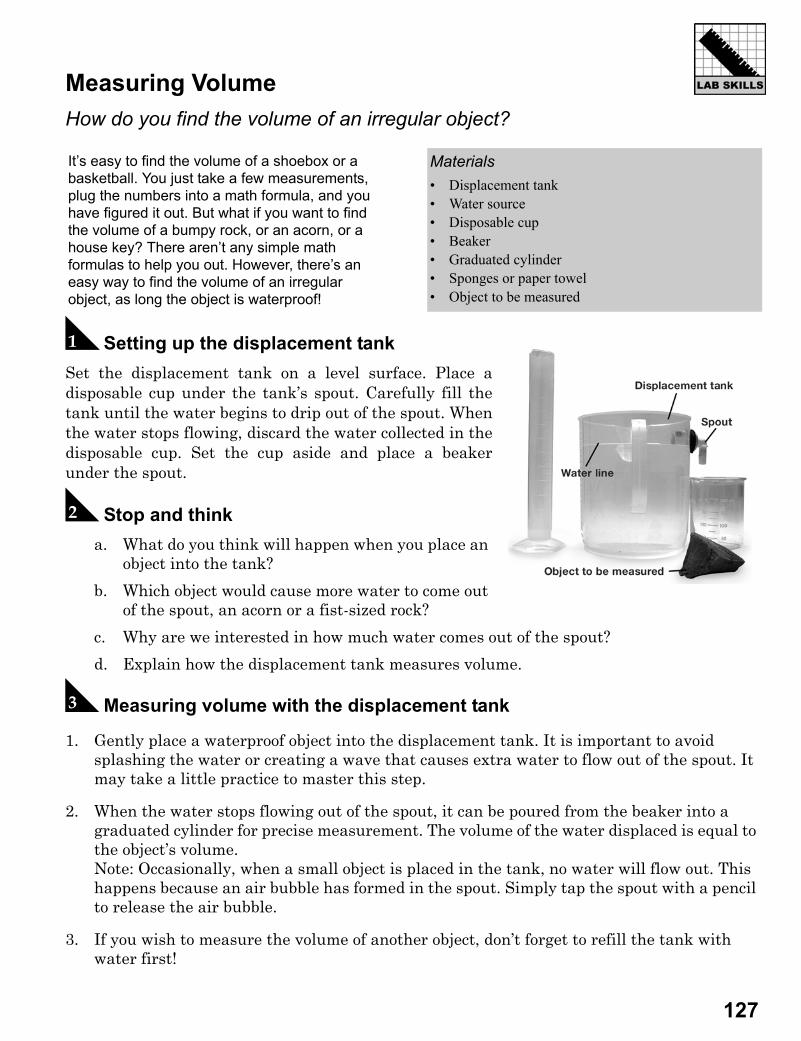
127
Measuring VolumeHow do you find the volume of an irregular object?
A Setting up the displacement tankSet the displacement tank on a level surface. Place adisposable cup under the tank’s spout. Carefully fill thetank until the water begins to drip out of the spout. Whenthe water stops flowing, discard the water collected in thedisposable cup. Set the cup aside and place a beakerunder the spout.
B Stop and thinka. What do you think will happen when you place an
object into the tank?
b. Which object would cause more water to come out of the spout, an acorn or a fist-sized rock?
c. Why are we interested in how much water comes out of the spout?
d. Explain how the displacement tank measures volume.
C Measuring volume with the displacement tank
1. Gently place a waterproof object into the displacement tank. It is important to avoid splashing the water or creating a wave that causes extra water to flow out of the spout. It may take a little practice to master this step.
2. When the water stops flowing out of the spout, it can be poured from the beaker into a graduated cylinder for precise measurement. The volume of the water displaced is equal to the object’s volume. Note: Occasionally, when a small object is placed in the tank, no water will flow out. This happens because an air bubble has formed in the spout. Simply tap the spout with a pencil to release the air bubble.
3. If you wish to measure the volume of another object, don’t forget to refill the tank with water first!
It’s easy to find the volume of a shoebox or a basketball. You just take a few measurements, plug the numbers into a math formula, and you have figured it out. But what if you want to find the volume of a bumpy rock, or an acorn, or a house key? There aren’t any simple math formulas to help you out. However, there’s an easy way to find the volume of an irregular object, as long the object is waterproof!
Materials• Displacement tank• Water source • Disposable cup• Beaker• Graduated cylinder• Sponges or paper towel• Object to be measured
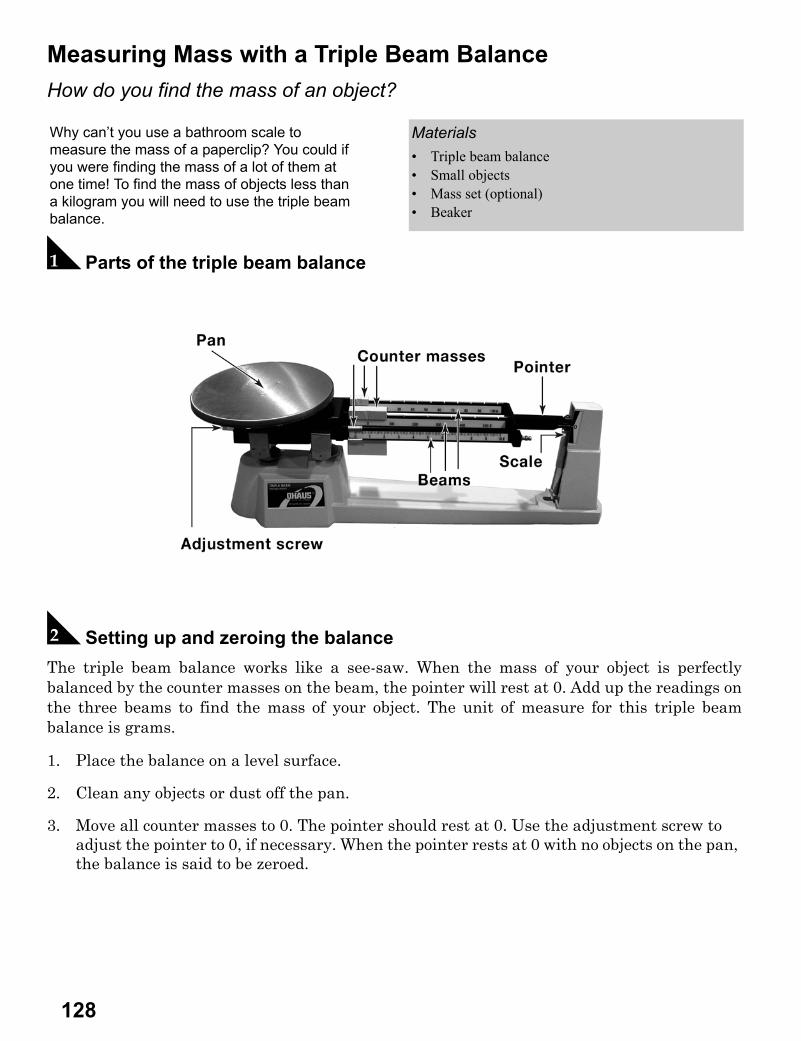
Measuring Mass with a Triple Beam BalanceHow do you find the mass of an object?
A Parts of the triple beam balance
B Setting up and zeroing the balanceThe triple beam balance works like a see-saw. When the mass of your object is perfectlybalanced by the counter masses on the beam, the pointer will rest at 0. Add up the readings onthe three beams to find the mass of your object. The unit of measure for this triple beambalance is grams.
1. Place the balance on a level surface.
2. Clean any objects or dust off the pan.
3. Move all counter masses to 0. The pointer should rest at 0. Use the adjustment screw to adjust the pointer to 0, if necessary. When the pointer rests at 0 with no objects on the pan, the balance is said to be zeroed.
Why can’t you use a bathroom scale to measure the mass of a paperclip? You could if you were finding the mass of a lot of them at one time! To find the mass of objects less than a kilogram you will need to use the triple beam balance.
Materials• Triple beam balance• Small objects• Mass set (optional)• Beaker
128
C Finding a known massYou can check that the triple beam balance is working correctly by using a mass set. Yourteacher will provide the correct mass value for these objects.
1. After zeroing the balance, place an object with a known mass on the pan.
2. Move the counter masses to the right one at a time from largest to smallest. When the pointer is resting at 0 the numbers under the three counter masses should add up to the known mass.
3. If the pointer is above or below 0, recheck the balance set up. Recheck the position of the counter masses. Counter masses must be properly seated in a groove. Check with your teacher to make sure you are getting the correct mass before finding the mass an unknown object.
D Finding the mass of an unknown object
1. After zeroing the balance, place an object with an unknown mass on the pan. Do not place hot objects or chemicals directly on the pan
2. Move the largest counter mass first. Place it in the first notch after zero. Wait until the pointer stops moving. If the pointer is above 0, move the counter mass to the next notch. Continue to move the counter mass to the right, one notch at a time until the pointer is slightly above 0. Go to step 3. If the pointer is below 0, move the counter mass back one notch. When the pointer rests at 0, you do not need to move any more counter masses.
3. Move the next largest counter mass from 0 to the first notch. Watch to see where the pointer rests. If it rests above 0, move the counter mass to the next notch. Repeat until the point rests at 0, or slightly above. If the pointer is slightly above 0, go to step 4.
4. Move the smallest counter mass from 0 to the position on the beam where the pointer rests at 0.
5. Add the masses from the three beams to get the mass of the unknown object. You should be able to record a number for the hundreds place, the tens place, the ones place, and the tenths place and the hundredths place. The hundredths place can be read to 0.00 or 0.05. You may have zeros in your answer.
129
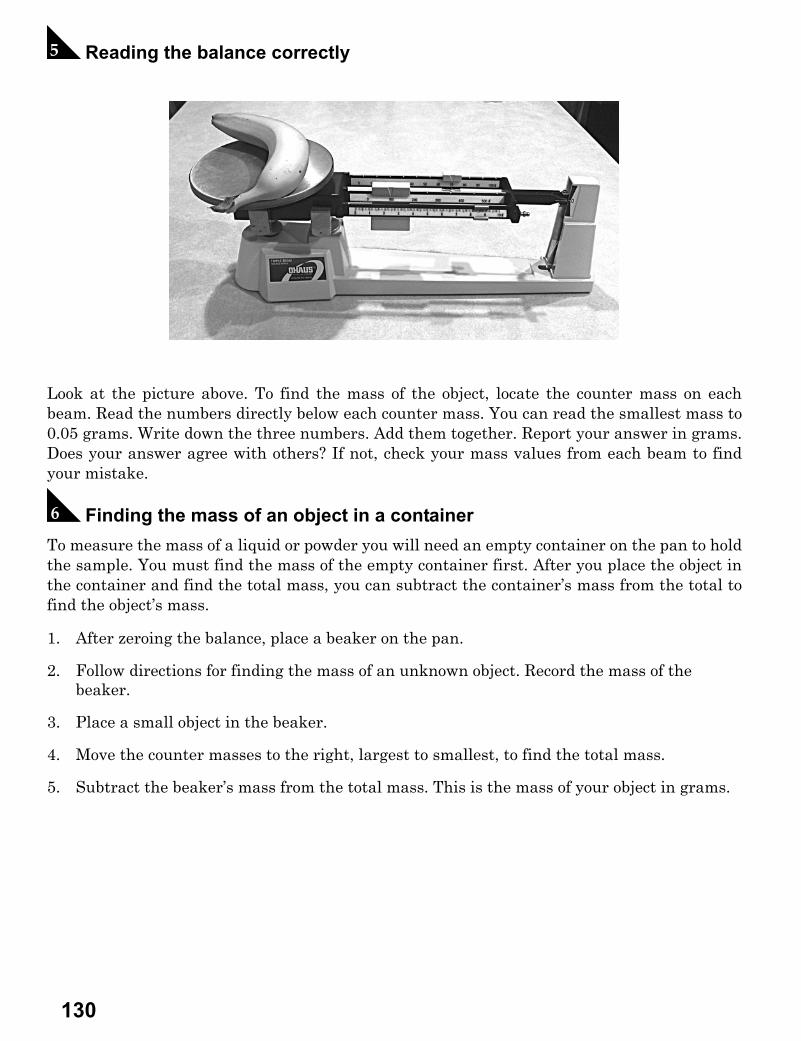
E Reading the balance correctly
Look at the picture above. To find the mass of the object, locate the counter mass on eachbeam. Read the numbers directly below each counter mass. You can read the smallest mass to0.05 grams. Write down the three numbers. Add them together. Report your answer in grams.Does your answer agree with others? If not, check your mass values from each beam to findyour mistake.
F Finding the mass of an object in a containerTo measure the mass of a liquid or powder you will need an empty container on the pan to holdthe sample. You must find the mass of the empty container first. After you place the object inthe container and find the total mass, you can subtract the container’s mass from the total tofind the object’s mass.
1. After zeroing the balance, place a beaker on the pan.
2. Follow directions for finding the mass of an unknown object. Record the mass of the beaker.
3. Place a small object in the beaker.
4. Move the counter masses to the right, largest to smallest, to find the total mass.
5. Subtract the beaker’s mass from the total mass. This is the mass of your object in grams.
130
Recording Observations in the LabHow do you record valid observations for an experiment in the lab?
A Making valid observationsValid scientific observations are objective and repeatable. Scientific observations are limited toone's senses and the equipment used to make these observations. An objective observationmeans that the observer describes only what happened. The observer uses data, words, andpictures to describe the observations as exactly as possible. An experiment is repeatable ifother scientists can see or repeat the same result. The following exercise gives you practiceidentifying good scientific observations.
B Exercise 1
1. Which observation is the most objective? Circle the correct letter.
a. My frog died after 3 days in the aquarium. I miss him. b. The frog died after 3 days in the aquarium. We will test the temperature and
water conditions to find out why. c. Frogs tend to die in captivity. Ours did after three days.
2. Which observation is the most descriptive? Circle the correct letter.
a. After weighing 3.000 grams of sodium bicarbonate into an Erlenmeyer flask, we slowly added 50.0 milliliters of vinegar. The contents of the flask began to bubble.
b. We weighed the powder into a glass container. We added acid. It bubbled a lot. c. We saw a fizzy reaction.
When you perform an experiment you will be making important observations. You and others will use these observations to test a hypothesis. In order for an experiment to be valid, the evidence you collect must be objective and repeatable. This investigation will give you practice making and recording good observations.
Materials• Paper• Pencil• Calculator• Ruler
131
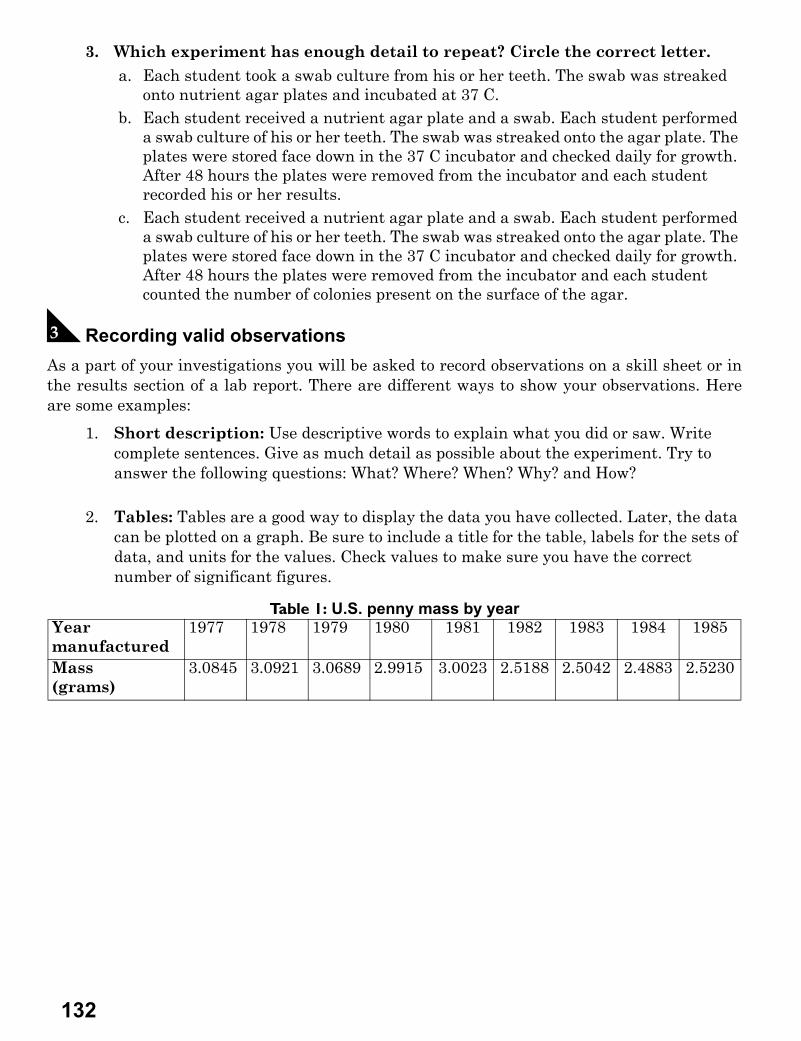
3. Which experiment has enough detail to repeat? Circle the correct letter.
a. Each student took a swab culture from his or her teeth. The swab was streaked onto nutrient agar plates and incubated at 37 C.
b. Each student received a nutrient agar plate and a swab. Each student performed a swab culture of his or her teeth. The swab was streaked onto the agar plate. The plates were stored face down in the 37 C incubator and checked daily for growth. After 48 hours the plates were removed from the incubator and each student recorded his or her results.
c. Each student received a nutrient agar plate and a swab. Each student performed a swab culture of his or her teeth. The swab was streaked onto the agar plate. The plates were stored face down in the 37 C incubator and checked daily for growth. After 48 hours the plates were removed from the incubator and each student counted the number of colonies present on the surface of the agar.
C Recording valid observationsAs a part of your investigations you will be asked to record observations on a skill sheet or inthe results section of a lab report. There are different ways to show your observations. Hereare some examples:
1. Short description: Use descriptive words to explain what you did or saw. Write complete sentences. Give as much detail as possible about the experiment. Try to answer the following questions: What? Where? When? Why? and How?
2. Tables: Tables are a good way to display the data you have collected. Later, the data can be plotted on a graph. Be sure to include a title for the table, labels for the sets of data, and units for the values. Check values to make sure you have the correct number of significant figures.
Table 1: U.S. penny mass by yearYear manufactured
1977 1978 1979 1980 1981 1982 1983 1984 1985
Mass(grams)
3.0845 3.0921 3.0689 2.9915 3.0023 2.5188 2.5042 2.4883 2.5230
132
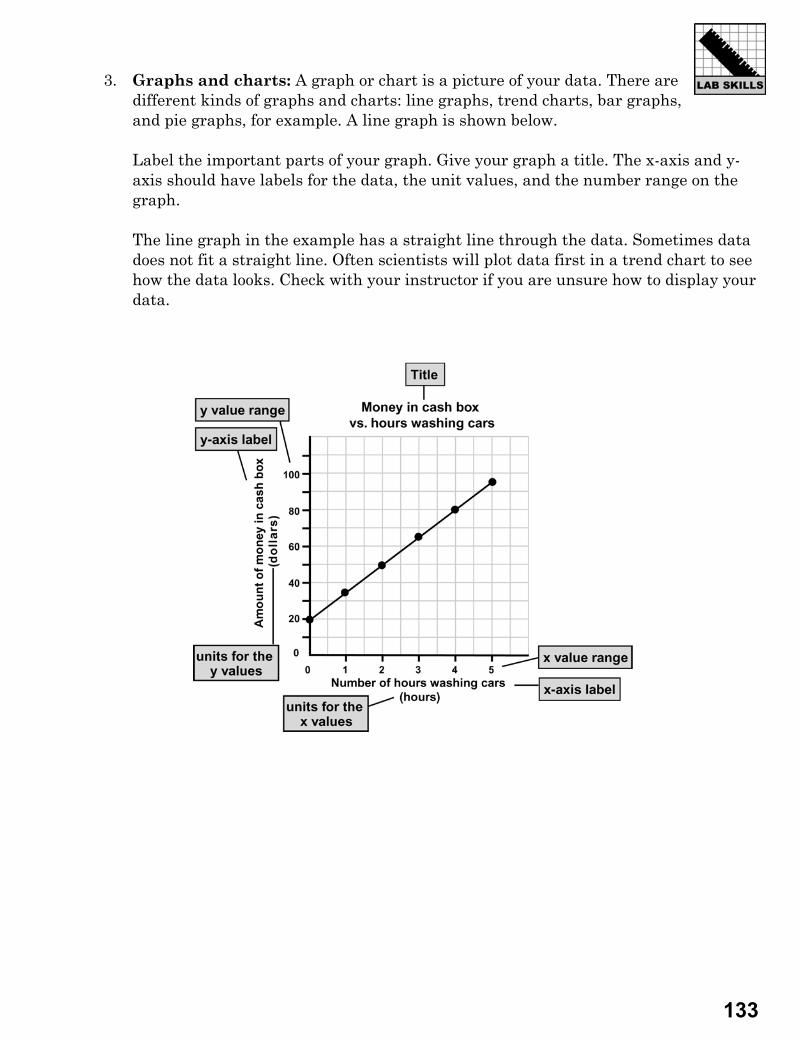
3. Graphs and charts: A graph or chart is a picture of your data. There are different kinds of graphs and charts: line graphs, trend charts, bar graphs, and pie graphs, for example. A line graph is shown below.
Label the important parts of your graph. Give your graph a title. The x-axis and y-axis should have labels for the data, the unit values, and the number range on the graph.
The line graph in the example has a straight line through the data. Sometimes data does not fit a straight line. Often scientists will plot data first in a trend chart to see how the data looks. Check with your instructor if you are unsure how to display your data.
133
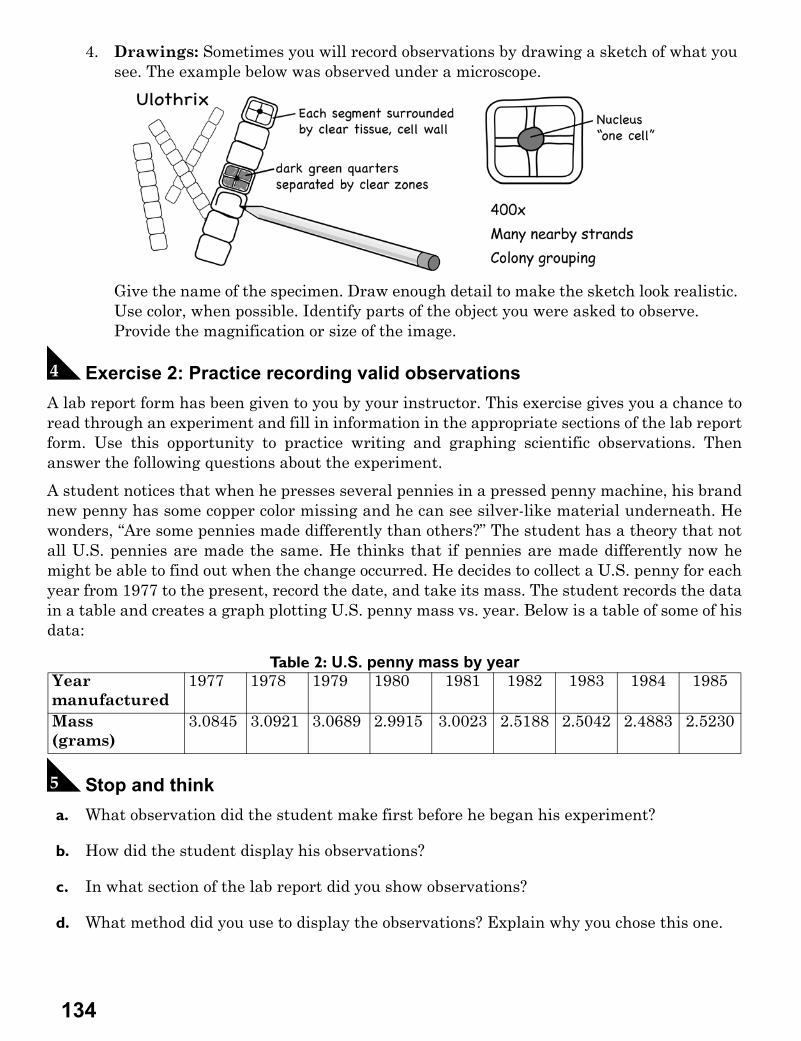
4. Drawings: Sometimes you will record observations by drawing a sketch of what you see. The example below was observed under a microscope.
Give the name of the specimen. Draw enough detail to make the sketch look realistic. Use color, when possible. Identify parts of the object you were asked to observe. Provide the magnification or size of the image.
D Exercise 2: Practice recording valid observationsA lab report form has been given to you by your instructor. This exercise gives you a chance toread through an experiment and fill in information in the appropriate sections of the lab reportform. Use this opportunity to practice writing and graphing scientific observations. Thenanswer the following questions about the experiment.
A student notices that when he presses several pennies in a pressed penny machine, his brandnew penny has some copper color missing and he can see silver-like material underneath. Hewonders, “Are some pennies made differently than others?” The student has a theory that notall U.S. pennies are made the same. He thinks that if pennies are made differently now hemight be able to find out when the change occurred. He decides to collect a U.S. penny for eachyear from 1977 to the present, record the date, and take its mass. The student records the datain a table and creates a graph plotting U.S. penny mass vs. year. Below is a table of some of hisdata:
E Stop and think a. What observation did the student make first before he began his experiment?
b. How did the student display his observations?
c. In what section of the lab report did you show observations?
d. What method did you use to display the observations? Explain why you chose this one.
Table 2: U.S. penny mass by yearYear manufactured
1977 1978 1979 1980 1981 1982 1983 1984 1985
Mass(grams)
3.0845 3.0921 3.0689 2.9915 3.0023 2.5188 2.5042 2.4883 2.5230
134
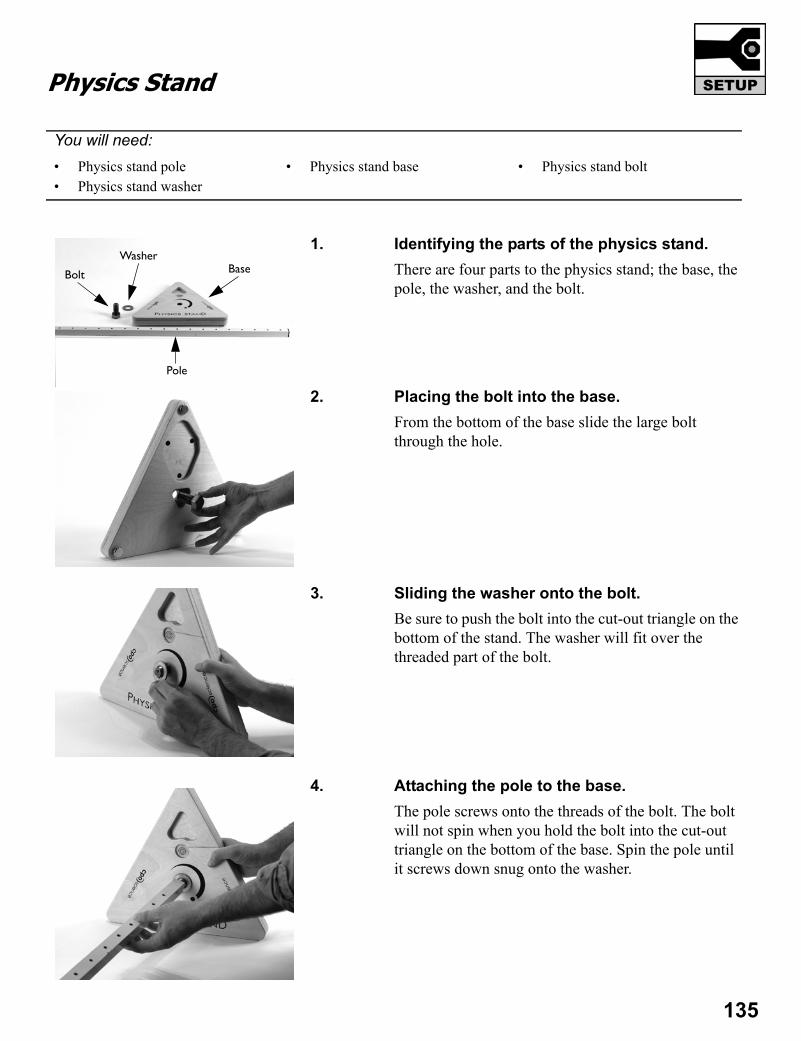
Physics Stand
1. Identifying the parts of the physics stand.There are four parts to the physics stand; the base, the pole, the washer, and the bolt.
2. Placing the bolt into the base.From the bottom of the base slide the large bolt through the hole.
3. Sliding the washer onto the bolt.Be sure to push the bolt into the cut-out triangle on the bottom of the stand. The washer will fit over the threaded part of the bolt.
4. Attaching the pole to the base.The pole screws onto the threads of the bolt. The bolt will not spin when you hold the bolt into the cut-out triangle on the bottom of the base. Spin the pole until it screws down snug onto the washer.
You will need:• Physics stand pole• Physics stand washer
• Physics stand base • Physics stand bolt
Bolt
WasherBase
Pole
135
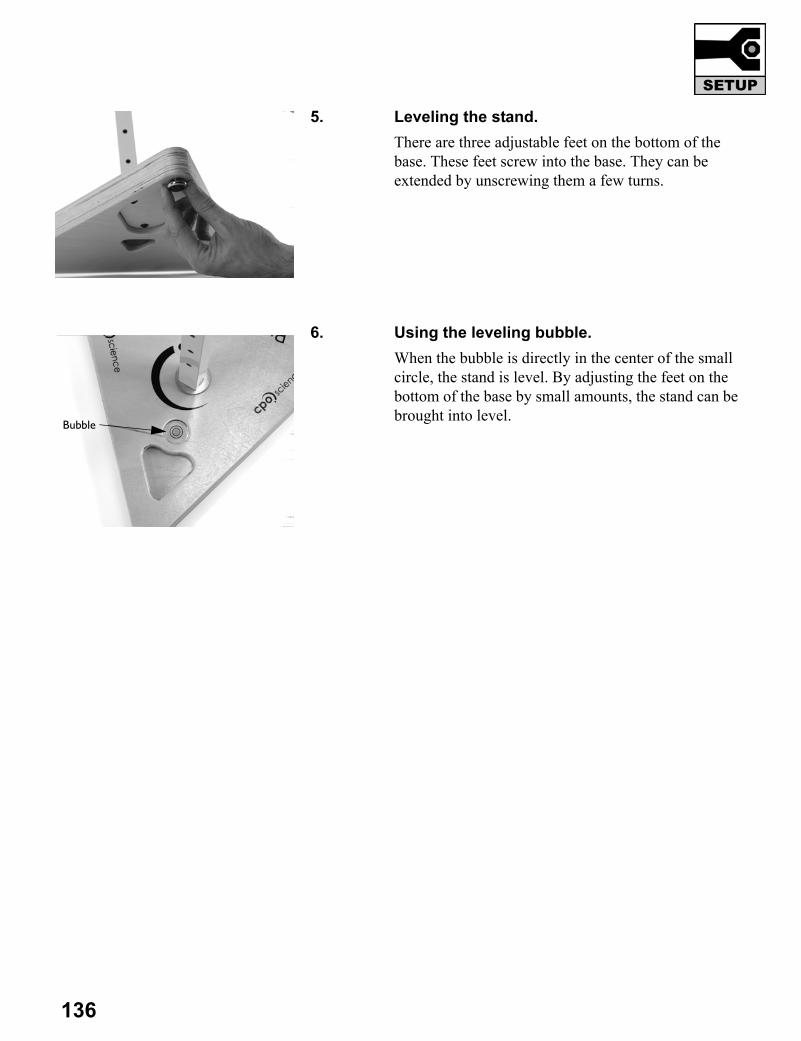
5. Leveling the stand.There are three adjustable feet on the bottom of the base. These feet screw into the base. They can be extended by unscrewing them a few turns.
6. Using the leveling bubble.When the bubble is directly in the center of the small circle, the stand is level. By adjusting the feet on the bottom of the base by small amounts, the stand can be brought into level.
Bubble
136
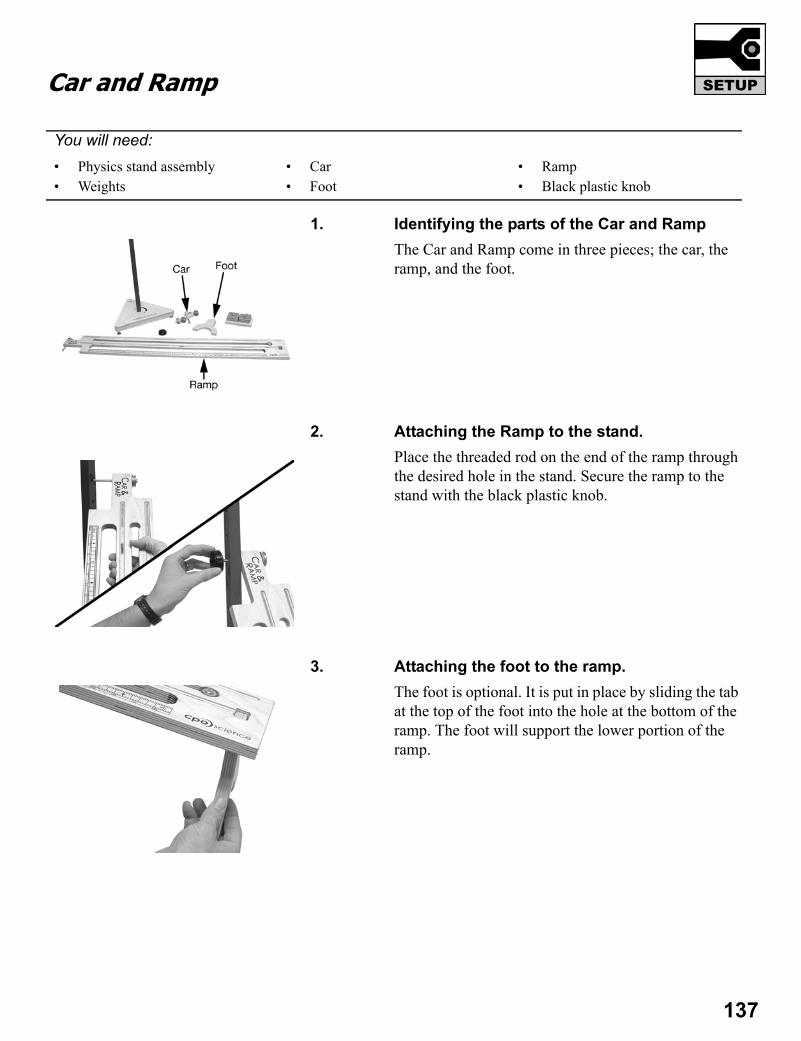
Car and Ramp
1. Identifying the parts of the Car and RampThe Car and Ramp come in three pieces; the car, the ramp, and the foot.
2. Attaching the Ramp to the stand.Place the threaded rod on the end of the ramp through the desired hole in the stand. Secure the ramp to the stand with the black plastic knob.
3. Attaching the foot to the ramp.The foot is optional. It is put in place by sliding the tab at the top of the foot into the hole at the bottom of the ramp. The foot will support the lower portion of the ramp.
You will need:• Physics stand assembly• Weights
• Car• Foot
• Ramp• Black plastic knob
137
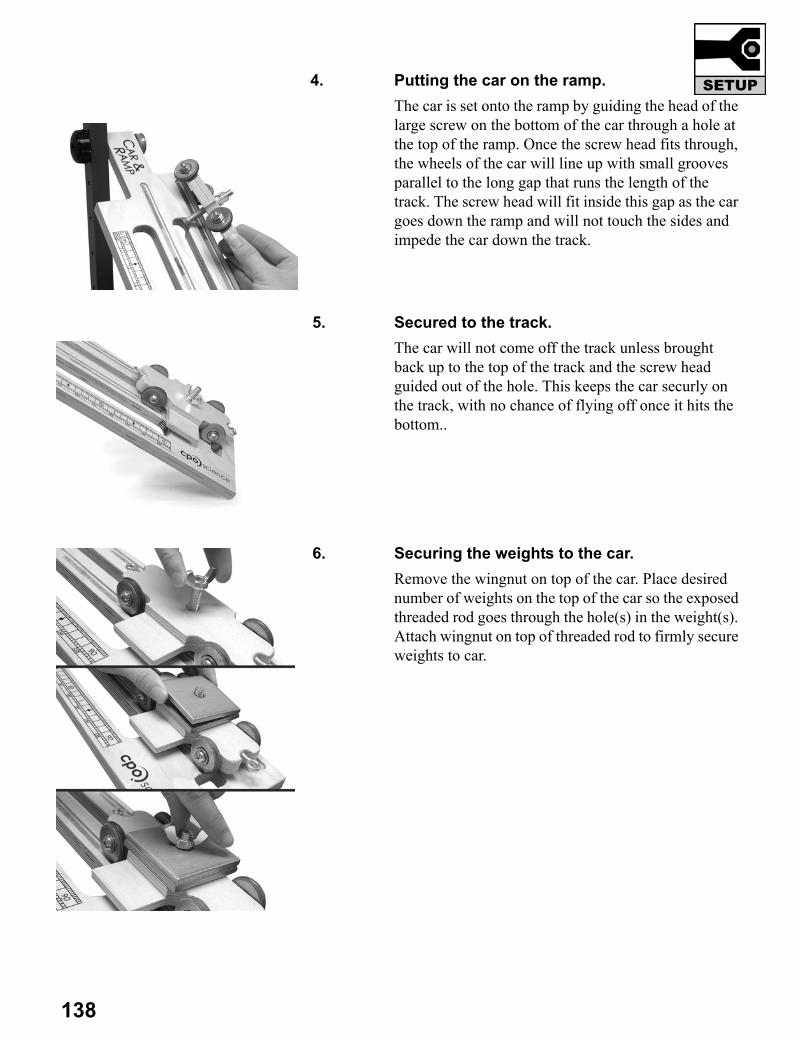
4. Putting the car on the ramp.The car is set onto the ramp by guiding the head of the large screw on the bottom of the car through a hole at the top of the ramp. Once the screw head fits through, the wheels of the car will line up with small grooves parallel to the long gap that runs the length of the track. The screw head will fit inside this gap as the car goes down the ramp and will not touch the sides and impede the car down the track.
5. Secured to the track.The car will not come off the track unless brought back up to the top of the track and the screw head guided out of the hole. This keeps the car securly on the track, with no chance of flying off once it hits the bottom..
6. Securing the weights to the car.Remove the wingnut on top of the car. Place desired number of weights on the top of the car so the exposed threaded rod goes through the hole(s) in the weight(s). Attach wingnut on top of threaded rod to firmly secure weights to car.
138
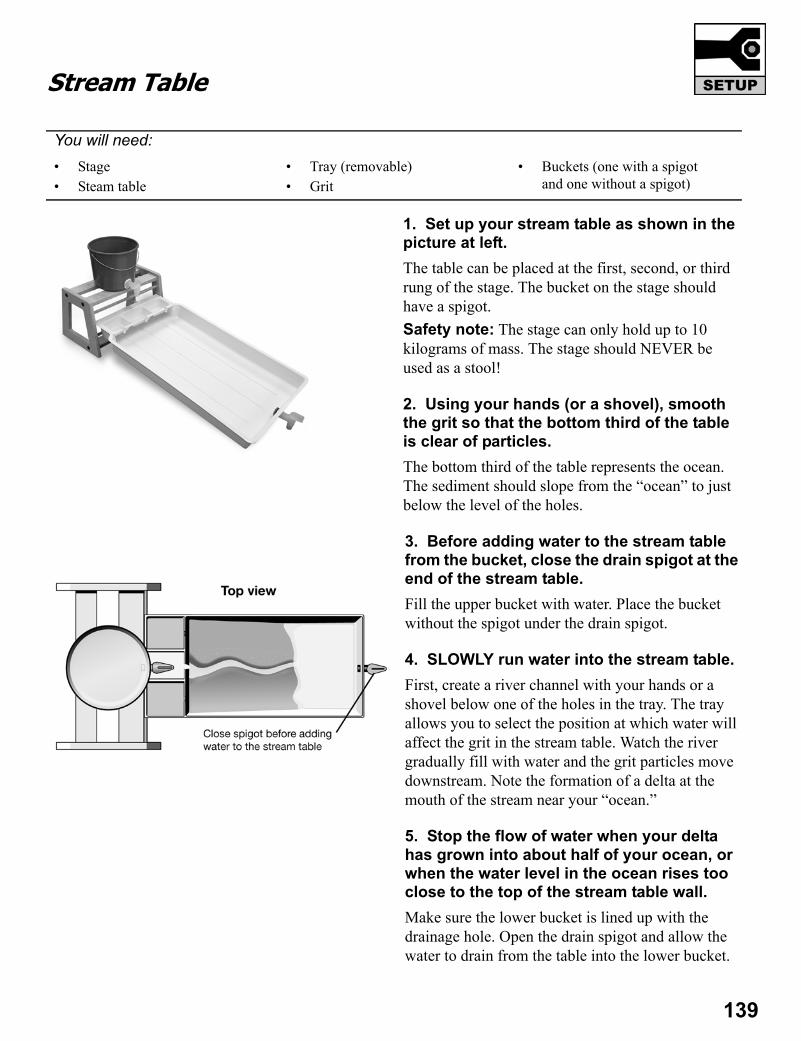
139
Stream Table
1. Set up your stream table as shown in the picture at left.The table can be placed at the first, second, or third rung of the stage. The bucket on the stage should have a spigot.Safety note: The stage can only hold up to 10 kilograms of mass. The stage should NEVER be used as a stool!
2. Using your hands (or a shovel), smooth the grit so that the bottom third of the table is clear of particles.The bottom third of the table represents the ocean. The sediment should slope from the “ocean” to just below the level of the holes.
3. Before adding water to the stream table from the bucket, close the drain spigot at the end of the stream table.Fill the upper bucket with water. Place the bucket without the spigot under the drain spigot.
4. SLOWLY run water into the stream table.First, create a river channel with your hands or a shovel below one of the holes in the tray. The tray allows you to select the position at which water will affect the grit in the stream table. Watch the river gradually fill with water and the grit particles move downstream. Note the formation of a delta at the mouth of the stream near your “ocean.”
5. Stop the flow of water when your delta has grown into about half of your ocean, or when the water level in the ocean rises too close to the top of the stream table wall.Make sure the lower bucket is lined up with the drainage hole. Open the drain spigot and allow the water to drain from the table into the lower bucket.
You will need:• Stage• Steam table
• Tray (removable)• Grit
• Buckets (one with a spigot and one without a spigot)
Responding to Natural DisastersYou have learned that plate tectonics helps explain why certain natural disasters like earthquakes, volcaniceruptions, and tsunamis occur. You have also learned about storms and global warming—two conditions thatcan cause coastal flooding.
In this project, you will:
(1) Review articles about a natural disaster and evaluate the science in these articles,
(2) Discuss how communities and the world at large responds to natural disasters, and
(3) Develop a plan for how your class can respond to this disaster and help the community affected by it.
Note to students: If any of these links do not work, please feel free to contact CPO Science at [email protected].
Part 1: Reviewing articles
1. Obtain copies of local and national papers to learn about recent natural disasters. As a class, select a natural disaster for this project. You may want to chose an event that has occurred close to where you live. Below is a list of disasters that have occurred recently and/or are still in the news:
• Earthquakes in Iran: (1) the 6.6 magnitude quake in Bam, December 2003, or (2) the 6.4 magnitude earthquake in central Iran, February 22, 2005.
Examples of where to find articles and information on the Internet
Web site Description
Any news agency web site
http://www.usgs.gov/http://neic.usgs.gov/
The web site for the United States Geological Survey(USGS), and The Current Worldwide Earthquake List.
http://www.fema.gov/ The web site for the United States Federal Emergency Management Agency (FEMA).
http://www.noaa.gov/http://www.magazine.noaa.gov/
The web site and news magazine for the NationalOceanographic and Atmospheric Agency.
http://ochaonline.un.org/ The web site for the United Nations Office for theCoordination of Human Affairs.
http://www.unicef.org/ The web site for the United Nations Children’s Fund(formerly United Nations International Children'sEmergency Fund).
http://www.redcross.org/http://www.icrc.org/
The web sites for the American Red Cross and theInternational Red Cross.
http://www.reliefweb.int A web link that shows a map of recent natural disasters.
140 Projects
• Tsunami: The Indian Ocean tsunami that resulted from two undersea earthquakes—one at 9.0 magnitude and one at 7.3, December 26, 2004
• Hurricanes in Florida: Five hurricanes hit Florida’s coastline during the hurricane season of 2004.
• Storms and mudslides: Record rains in 2004-05 and storms caused severe mudslides, tornadoes, and avalanches in Los Angeles, California in February, 2005.
2. From a number of different papers, magazines, and news sites on the Internet, collect at least five articles.
a. Read each article carefully and highlight important statements.
b. Create a display for your articles. Either paste them to a poster board or make a portfolio of the articles.
3. Based on these articles, write a brief description of the disaster. In the description include the following information: the date it happened, where it happened, what caused the disaster, and the impact of the disaster on people and communities.
4. Discuss the science presented in the articles you collected. Does it seem correct? Did the reporters writing the articles seem to understand the science that caused the natural disaster? (Your teacher may invite an expert to come to your class to help you with this step of the project.)
5. Based on your reading, research, and discussions, write another paragraph describing why this disaster happened. For example, the 2004 tsunami was caused by movement of tectonic plates. Be as detailed as you can in your paragraph. For more information about the science, you may need to visit government web sites such as www.noaanews.noaa.gov or www.usgs.gov.
Part 2: Discussion
In response to a natural disaster, people tend to work together to help victims, raise money, provide medical aid, and rebuild the disaster area. Research and find out what is being done in response to the natural disaster your class chose to focus on for this project.
1. What is the affected community doing?
2. What is the United States doing?
3. What is the world doing?
Part 3: Taking action
1. With your class brainstorm a list of things you could do to help victims of the natural disaster. List one thing your class could to for each of the following categories. How could your class:
a. Raise awareness about the type of disaster so people are safer in the future?
b. Raise money to help victims of the disaster?
c. Volunteer to help victims of the disaster or organizations that help the disaster victims?
2. With your class, choose one thing to do in response to this natural disaster. Then, create a time line and an action plan for accomplishing this project. The action plan should include a list of tasks that need to happen and who will accomplish those tasks.
141
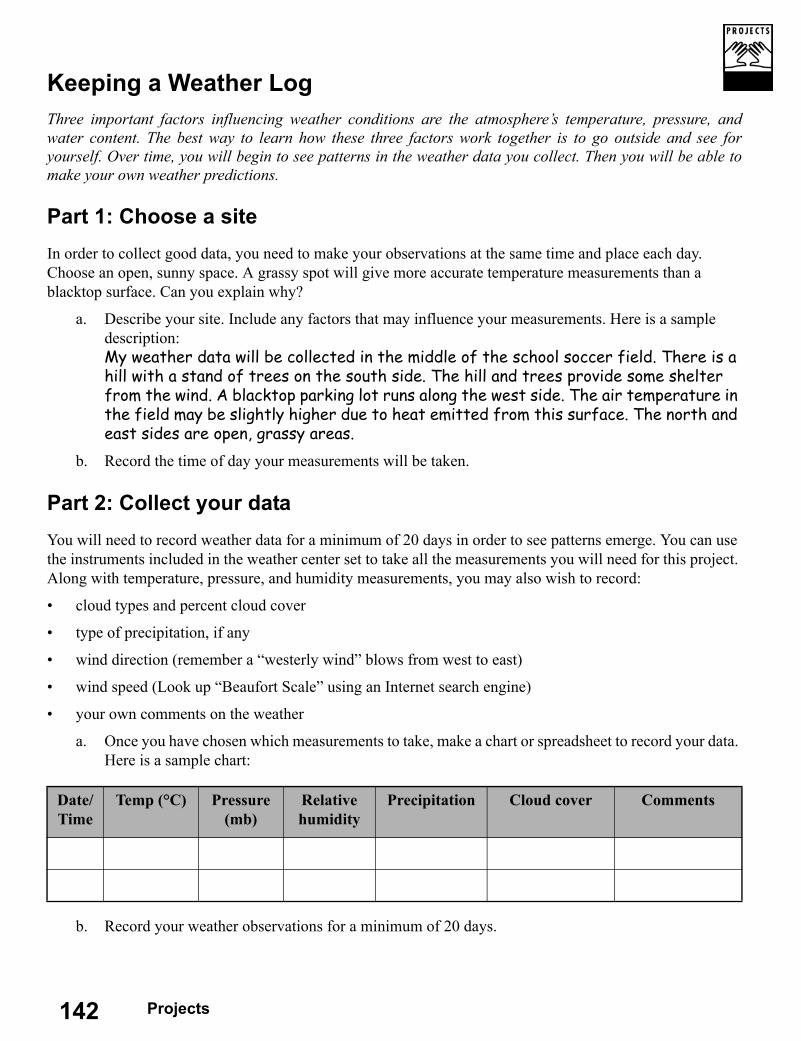
Keeping a Weather LogThree important factors influencing weather conditions are the atmosphere’s temperature, pressure, andwater content. The best way to learn how these three factors work together is to go outside and see foryourself. Over time, you will begin to see patterns in the weather data you collect. Then you will be able tomake your own weather predictions.
Part 1: Choose a siteIn order to collect good data, you need to make your observations at the same time and place each day. Choose an open, sunny space. A grassy spot will give more accurate temperature measurements than a blacktop surface. Can you explain why?
a. Describe your site. Include any factors that may influence your measurements. Here is a sample description:My weather data will be collected in the middle of the school soccer field. There is a hill with a stand of trees on the south side. The hill and trees provide some shelter from the wind. A blacktop parking lot runs along the west side. The air temperature in the field may be slightly higher due to heat emitted from this surface. The north and east sides are open, grassy areas.
b. Record the time of day your measurements will be taken.
Part 2: Collect your dataYou will need to record weather data for a minimum of 20 days in order to see patterns emerge. You can use the instruments included in the weather center set to take all the measurements you will need for this project. Along with temperature, pressure, and humidity measurements, you may also wish to record:
• cloud types and percent cloud cover
• type of precipitation, if any
• wind direction (remember a “westerly wind” blows from west to east)
• wind speed (Look up “Beaufort Scale” using an Internet search engine)
• your own comments on the weather
a. Once you have chosen which measurements to take, make a chart or spreadsheet to record your data. Here is a sample chart:
b. Record your weather observations for a minimum of 20 days.
Date/Time
Temp (°C) Pressure (mb)
Relativehumidity
Precipitation Cloud cover Comments
142 Projects
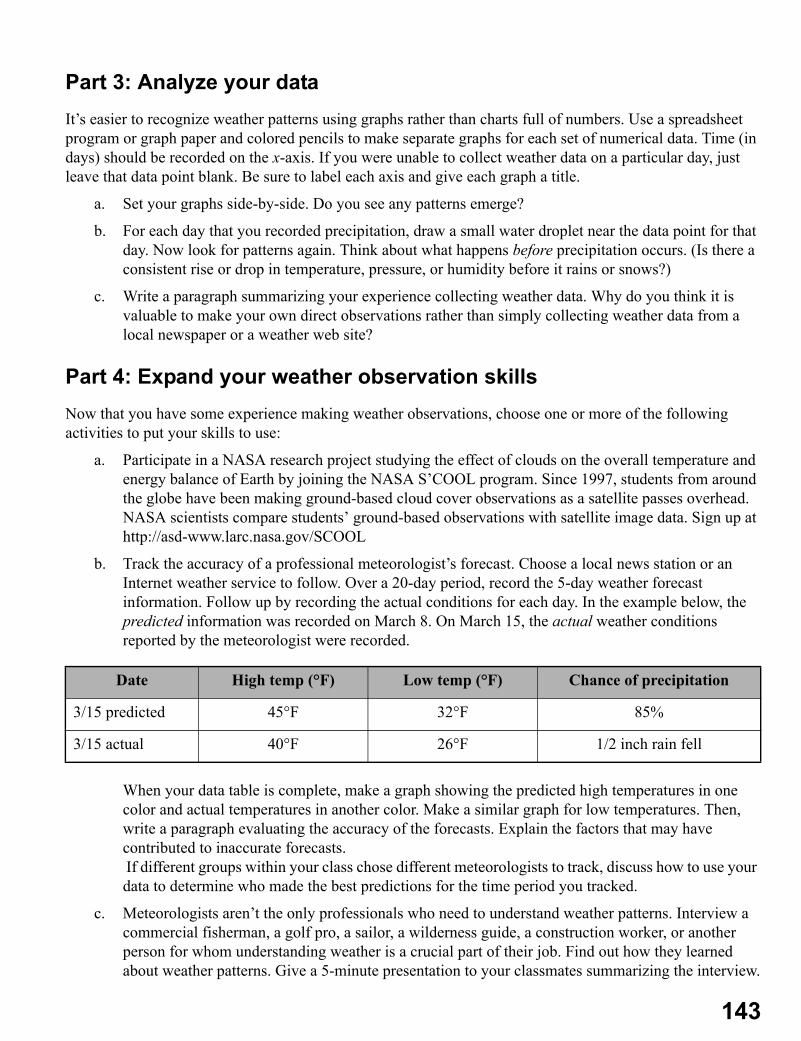
Part 3: Analyze your dataIt’s easier to recognize weather patterns using graphs rather than charts full of numbers. Use a spreadsheet program or graph paper and colored pencils to make separate graphs for each set of numerical data. Time (in days) should be recorded on the x-axis. If you were unable to collect weather data on a particular day, just leave that data point blank. Be sure to label each axis and give each graph a title.
a. Set your graphs side-by-side. Do you see any patterns emerge?
b. For each day that you recorded precipitation, draw a small water droplet near the data point for that day. Now look for patterns again. Think about what happens before precipitation occurs. (Is there a consistent rise or drop in temperature, pressure, or humidity before it rains or snows?)
c. Write a paragraph summarizing your experience collecting weather data. Why do you think it is valuable to make your own direct observations rather than simply collecting weather data from a local newspaper or a weather web site?
Part 4: Expand your weather observation skillsNow that you have some experience making weather observations, choose one or more of the following activities to put your skills to use:
a. Participate in a NASA research project studying the effect of clouds on the overall temperature and energy balance of Earth by joining the NASA S’COOL program. Since 1997, students from around the globe have been making ground-based cloud cover observations as a satellite passes overhead. NASA scientists compare students’ ground-based observations with satellite image data. Sign up at http://asd-www.larc.nasa.gov/SCOOL
b. Track the accuracy of a professional meteorologist’s forecast. Choose a local news station or an Internet weather service to follow. Over a 20-day period, record the 5-day weather forecast information. Follow up by recording the actual conditions for each day. In the example below, the predicted information was recorded on March 8. On March 15, the actual weather conditions reported by the meteorologist were recorded.
When your data table is complete, make a graph showing the predicted high temperatures in one color and actual temperatures in another color. Make a similar graph for low temperatures. Then, write a paragraph evaluating the accuracy of the forecasts. Explain the factors that may have contributed to inaccurate forecasts. If different groups within your class chose different meteorologists to track, discuss how to use your data to determine who made the best predictions for the time period you tracked.
c. Meteorologists aren’t the only professionals who need to understand weather patterns. Interview a commercial fisherman, a golf pro, a sailor, a wilderness guide, a construction worker, or another person for whom understanding weather is a crucial part of their job. Find out how they learned about weather patterns. Give a 5-minute presentation to your classmates summarizing the interview.
Date High temp (°F) Low temp (°F) Chance of precipitation
3/15 predicted 45°F 32°F 85%
3/15 actual 40°F 26°F 1/2 inch rain fell
143
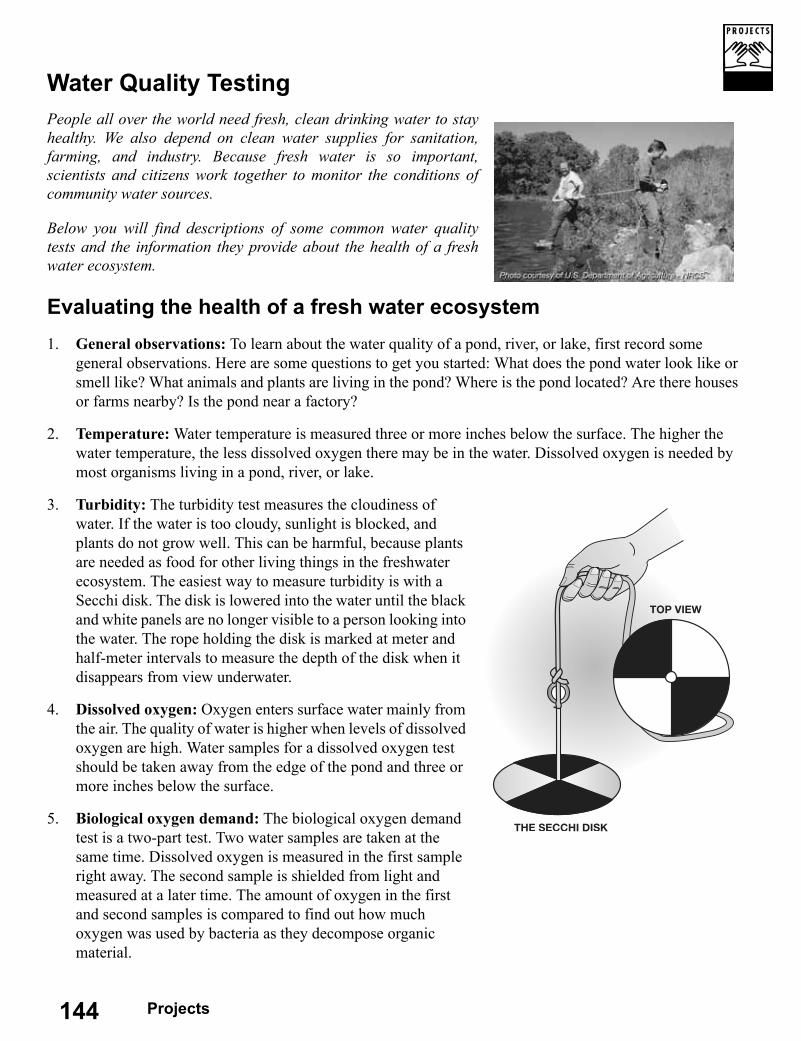
Water Quality TestingPeople all over the world need fresh, clean drinking water to stayhealthy. We also depend on clean water supplies for sanitation,farming, and industry. Because fresh water is so important,scientists and citizens work together to monitor the conditions ofcommunity water sources.
Below you will find descriptions of some common water qualitytests and the information they provide about the health of a freshwater ecosystem.
Evaluating the health of a fresh water ecosystem1. General observations: To learn about the water quality of a pond, river, or lake, first record some
general observations. Here are some questions to get you started: What does the pond water look like or smell like? What animals and plants are living in the pond? Where is the pond located? Are there houses or farms nearby? Is the pond near a factory?
2. Temperature: Water temperature is measured three or more inches below the surface. The higher the water temperature, the less dissolved oxygen there may be in the water. Dissolved oxygen is needed by most organisms living in a pond, river, or lake.
3. Turbidity: The turbidity test measures the cloudiness of water. If the water is too cloudy, sunlight is blocked, and plants do not grow well. This can be harmful, because plants are needed as food for other living things in the freshwater ecosystem. The easiest way to measure turbidity is with a Secchi disk. The disk is lowered into the water until the black and white panels are no longer visible to a person looking into the water. The rope holding the disk is marked at meter and half-meter intervals to measure the depth of the disk when it disappears from view underwater.
4. Dissolved oxygen: Oxygen enters surface water mainly from the air. The quality of water is higher when levels of dissolved oxygen are high. Water samples for a dissolved oxygen test should be taken away from the edge of the pond and three or more inches below the surface.
5. Biological oxygen demand: The biological oxygen demand test is a two-part test. Two water samples are taken at the same time. Dissolved oxygen is measured in the first sample right away. The second sample is shielded from light and measured at a later time. The amount of oxygen in the first and second samples is compared to find out how much oxygen was used by bacteria as they decompose organic material.
144 Projects
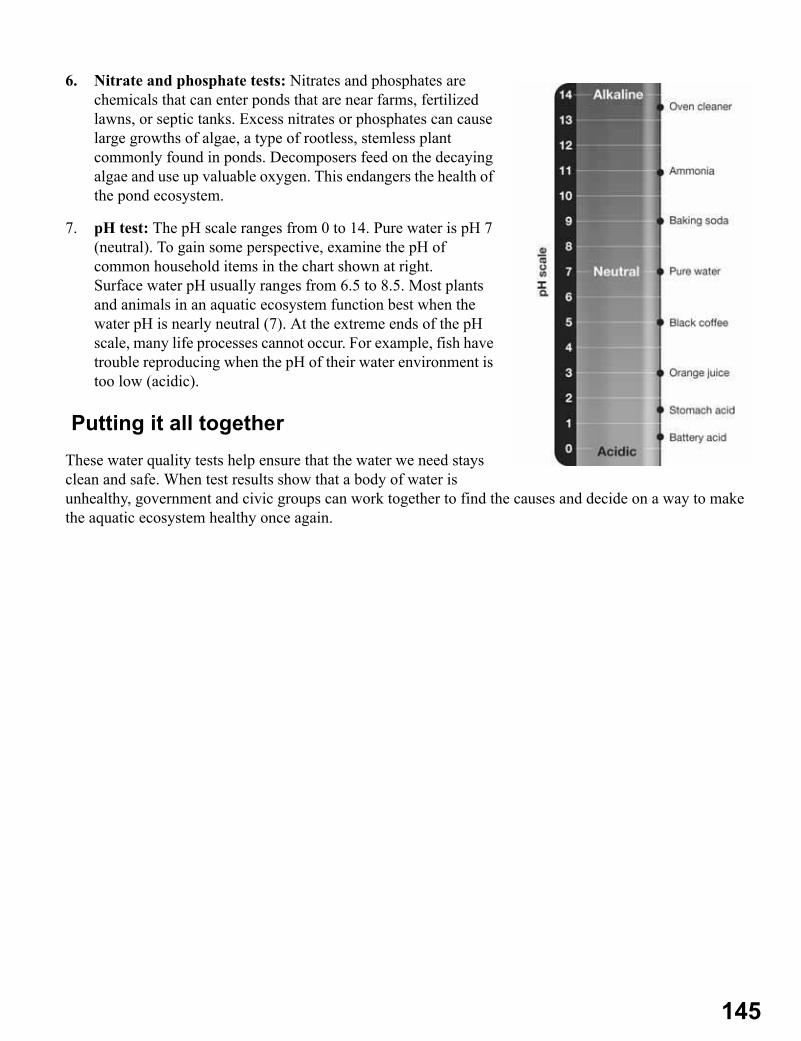
6. Nitrate and phosphate tests: Nitrates and phosphates are chemicals that can enter ponds that are near farms, fertilized lawns, or septic tanks. Excess nitrates or phosphates can cause large growths of algae, a type of rootless, stemless plant commonly found in ponds. Decomposers feed on the decaying algae and use up valuable oxygen. This endangers the health of the pond ecosystem.
7. pH test: The pH scale ranges from 0 to 14. Pure water is pH 7 (neutral). To gain some perspective, examine the pH of common household items in the chart shown at right.Surface water pH usually ranges from 6.5 to 8.5. Most plants and animals in an aquatic ecosystem function best when the water pH is nearly neutral (7). At the extreme ends of the pH scale, many life processes cannot occur. For example, fish have trouble reproducing when the pH of their water environment is too low (acidic).
Putting it all togetherThese water quality tests help ensure that the water we need stays clean and safe. When test results show that a body of water is unhealthy, government and civic groups can work together to find the causes and decide on a way to make the aquatic ecosystem healthy once again.
145
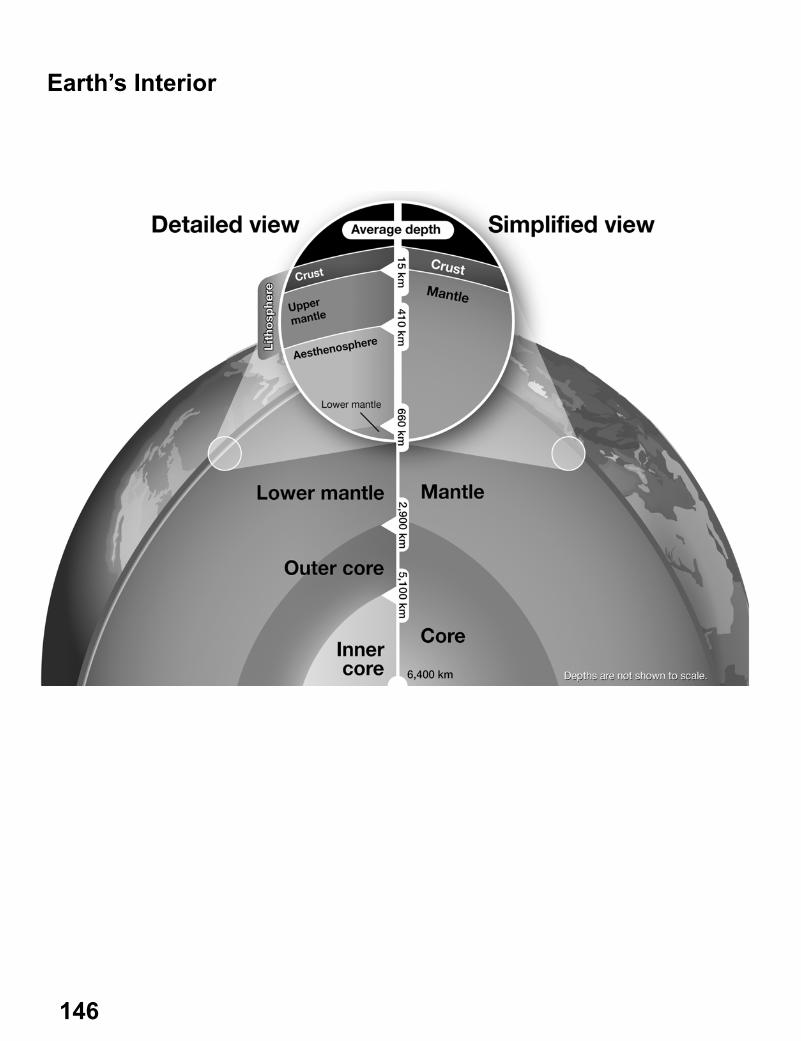
Earth’s Interior
146
Metric Ruler
147