Embed Size (px)
DESCRIPTION
r
Citation preview
12/2/13 Creating Interactive APEX Reports Over OLAP Cubes
www.oracle.com/webfolder/technetwork/tutorials/obe/db/12c/r1/olap/olap_apex/usingapex4olap.htm?cid=4425&ssid=108537019043697 1/35
Creating Interactive APEX Reports Over OLAP Cubes
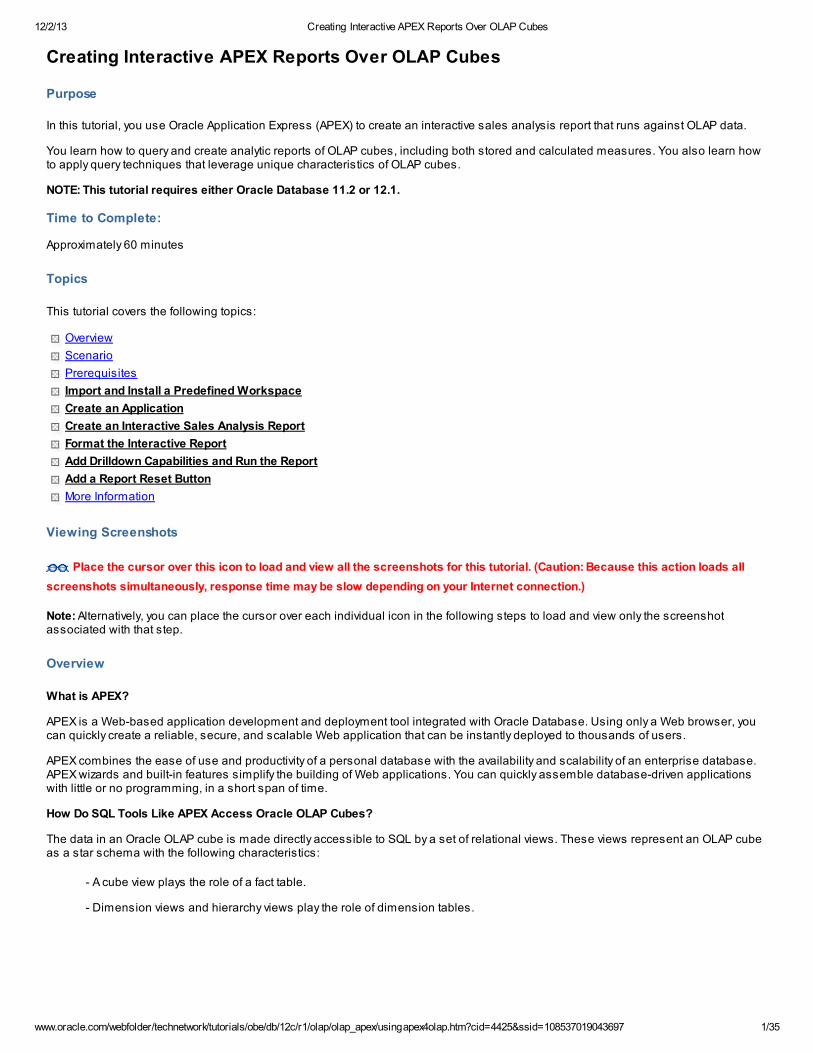
Purpose
In this tutorial, you use Oracle Application Express (APEX) to create an interactive sales analysis report that runs against OLAP data.
You learn how to query and create analytic reports of OLAP cubes, including both stored and calculated measures. You also learn howto apply query techniques that leverage unique characteristics of OLAP cubes.
NOTE: This tutorial requires either Oracle Database 11.2 or 12.1.
Time to Complete:
Approximately 60 minutes
Topics
This tutorial covers the following topics:
Overview
Scenario
Prerequisites
Import and Install a Predefined Workspace
Create an Application
Create an Interactive Sales Analysis Report
Format the Interactive Report
Add Drilldown Capabilities and Run the Report
Add a Report Reset Button
More Information
Viewing Screenshots
Place the cursor over this icon to load and view all the screenshots for this tutorial. (Caution: Because this action loads all
screenshots simultaneously, response time may be slow depending on your Internet connection.)
Note: Alternatively, you can place the cursor over each individual icon in the following steps to load and view only the screenshotassociated with that step.
Overview
What is APEX?
APEX is a Web-based application development and deployment tool integrated with Oracle Database. Using only a Web browser, youcan quickly create a reliable, secure, and scalable Web application that can be instantly deployed to thousands of users.
APEX combines the ease of use and productivity of a personal database with the availability and scalability of an enterprise database.APEX wizards and built-in features simplify the building of Web applications. You can quickly assemble database-driven applicationswith little or no programming, in a short span of time.
How Do SQL Tools Like APEX Access Oracle OLAP Cubes?
The data in an Oracle OLAP cube is made directly accessible to SQL by a set of relational views. These views represent an OLAP cubeas a star schema with the following characteristics:
- A cube view plays the role of a fact table.
- Dimension views and hierarchy views play the role of dimension tables.
12/2/13 Creating Interactive APEX Reports Over OLAP Cubes
www.oracle.com/webfolder/technetwork/tutorials/obe/db/12c/r1/olap/olap_apex/usingapex4olap.htm?cid=4425&ssid=108537019043697 2/35
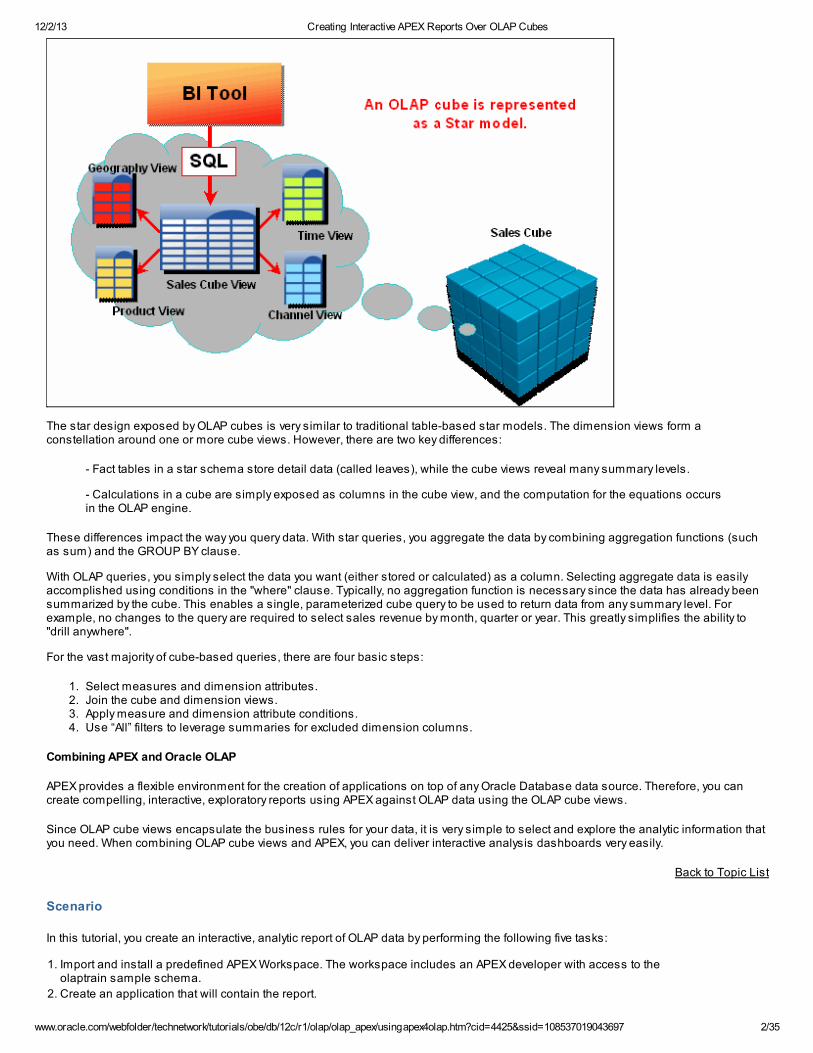
The star design exposed by OLAP cubes is very similar to traditional table-based star models. The dimension views form aconstellation around one or more cube views. However, there are two key differences:
- Fact tables in a star schema store detail data (called leaves), while the cube views reveal many summary levels.
- Calculations in a cube are simply exposed as columns in the cube view, and the computation for the equations occursin the OLAP engine.
These differences impact the way you query data. With star queries, you aggregate the data by combining aggregation functions (suchas sum) and the GROUP BY clause.
With OLAP queries, you simply select the data you want (either stored or calculated) as a column. Selecting aggregate data is easilyaccomplished using conditions in the "where" clause. Typically, no aggregation function is necessary since the data has already beensummarized by the cube. This enables a single, parameterized cube query to be used to return data from any summary level. Forexample, no changes to the query are required to select sales revenue by month, quarter or year. This greatly simplifies the ability to"drill anywhere".
For the vast majority of cube-based queries, there are four basic steps:
1. Select measures and dimension attributes.2. Join the cube and dimension views.3. Apply measure and dimension attribute conditions.4. Use “All” filters to leverage summaries for excluded dimension columns.
Combining APEX and Oracle OLAP
APEX provides a flexible environment for the creation of applications on top of any Oracle Database data source. Therefore, you cancreate compelling, interactive, exploratory reports using APEX against OLAP data using the OLAP cube views.
Since OLAP cube views encapsulate the business rules for your data, it is very simple to select and explore the analytic information thatyou need. When combining OLAP cube views and APEX, you can deliver interactive analysis dashboards very easily.
Back to Topic List
Scenario
In this tutorial, you create an interactive, analytic report of OLAP data by performing the following five tasks:
1. Import and install a predefined APEX Workspace. The workspace includes an APEX developer with access to theolaptrain sample schema.
2. Create an application that will contain the report.
12/2/13 Creating Interactive APEX Reports Over OLAP Cubes
www.oracle.com/webfolder/technetwork/tutorials/obe/db/12c/r1/olap/olap_apex/usingapex4olap.htm?cid=4425&ssid=108537019043697 3/35
3. Create an interactive report that includes highly stylized output.
4. Add formatting to the report.
5. Leverage query parameters to enable data exploration using “drilling” across the dimensions in the report.
Note: OLAP supports the style of drilldown used in this tutorial with any type of hierarchy: level-based, parent-child, skip-level, ragged,and so on.
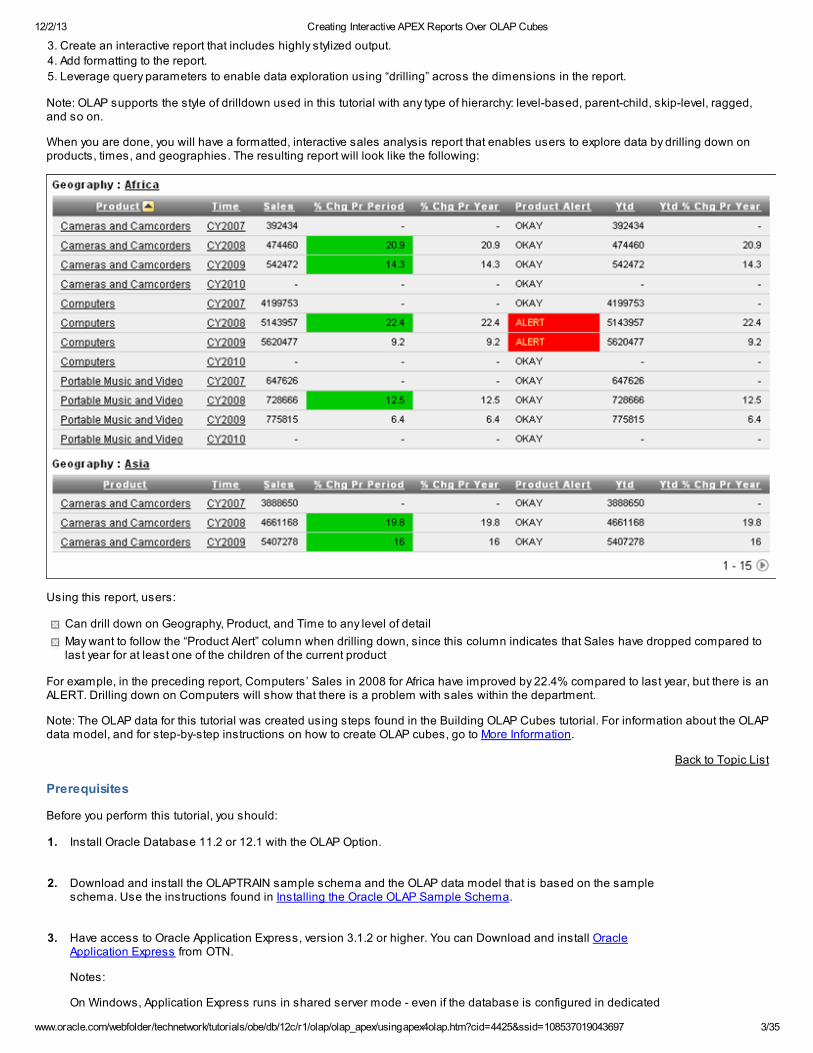
When you are done, you will have a formatted, interactive sales analysis report that enables users to explore data by drilling down onproducts, times, and geographies. The resulting report will look like the following:
Using this report, users:
Can drill down on Geography, Product, and Time to any level of detail
May want to follow the “Product Alert” column when drilling down, since this column indicates that Sales have dropped compared tolast year for at least one of the children of the current product
For example, in the preceding report, Computers’ Sales in 2008 for Africa have improved by 22.4% compared to last year, but there is anALERT. Drilling down on Computers will show that there is a problem with sales within the department.
Note: The OLAP data for this tutorial was created using steps found in the Building OLAP Cubes tutorial. For information about the OLAPdata model, and for step-by-step instructions on how to create OLAP cubes, go to More Information.
Back to Topic List
Prerequisites
Before you perform this tutorial, you should:
1. Install Oracle Database 11.2 or 12.1 with the OLAP Option.
2. Download and install the OLAPTRAIN sample schema and the OLAP data model that is based on the sampleschema. Use the instructions found in Installing the Oracle OLAP Sample Schema.
3. Have access to Oracle Application Express, version 3.1.2 or higher. You can Download and install OracleApplication Express from OTN.
Notes:
On Windows, Application Express runs in shared server mode - even if the database is configured in dedicated
12/2/13 Creating Interactive APEX Reports Over OLAP Cubes
www.oracle.com/webfolder/technetwork/tutorials/obe/db/12c/r1/olap/olap_apex/usingapex4olap.htm?cid=4425&ssid=108537019043697 4/35
mode.
An Oracle configuration parameter needs to set in order to access OLAP cubes when Oracle Database isconfigured in shared server mode. Otherwise, an error will be generated referencing the inability to load an OLAPAPI sharable library.
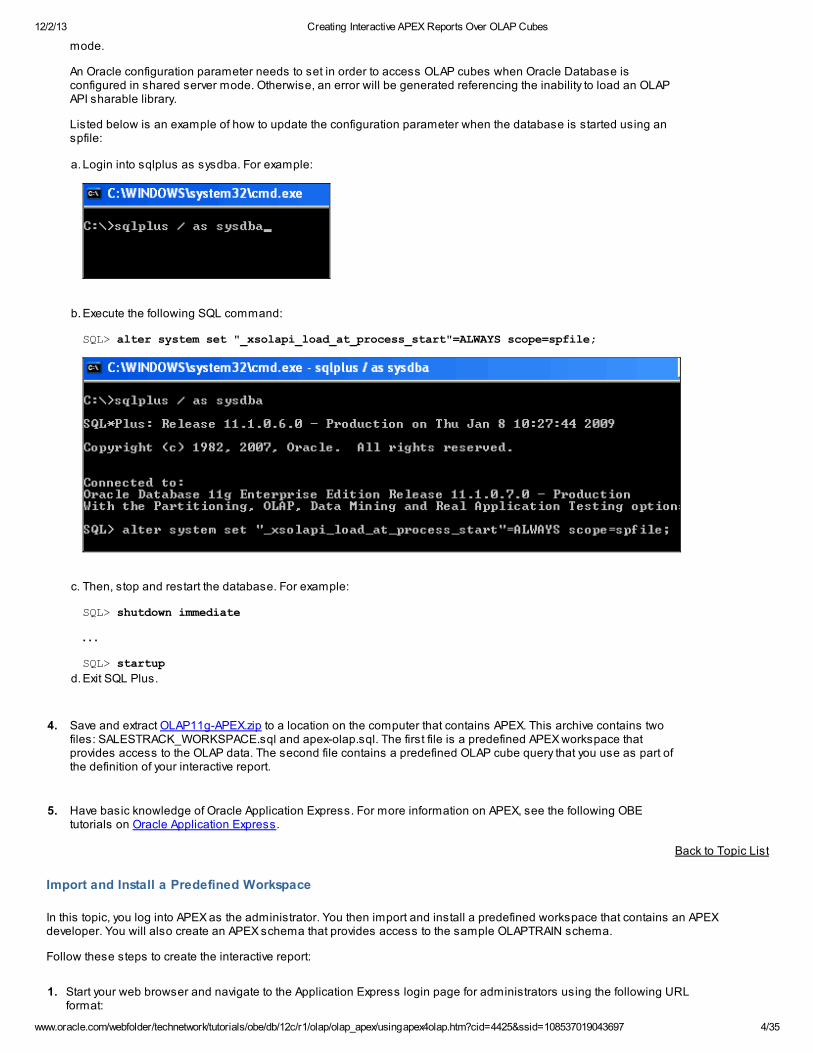
Listed below is an example of how to update the configuration parameter when the database is started using anspfile:
a. Login into sqlplus as sysdba. For example:
b.Execute the following SQL command:
SQL> alter system set "_xsolapi_load_at_process_start"=ALWAYS scope=spfile;
c. Then, stop and restart the database. For example:
SQL> shutdown immediate
. . .
SQL> startup
d.Exit SQL Plus.
4. Save and extract OLAP11g-APEX.zip to a location on the computer that contains APEX. This archive contains two
files: SALESTRACK_WORKSPACE.sql and apex-olap.sql. The first file is a predefined APEX workspace thatprovides access to the OLAP data. The second file contains a predefined OLAP cube query that you use as part ofthe definition of your interactive report.
5. Have basic knowledge of Oracle Application Express. For more information on APEX, see the following OBEtutorials on Oracle Application Express.
Back to Topic List
Import and Install a Predefined Workspace
In this topic, you log into APEX as the administrator. You then import and install a predefined workspace that contains an APEXdeveloper. You will also create an APEX schema that provides access to the sample OLAPTRAIN schema.
Follow these steps to create the interactive report:
1. Start your web browser and navigate to the Application Express login page for administrators using the following URLformat:
12/2/13 Creating Interactive APEX Reports Over OLAP Cubes
www.oracle.com/webfolder/technetwork/tutorials/obe/db/12c/r1/olap/olap_apex/usingapex4olap.htm?cid=4425&ssid=108537019043697 5/35
http://<hostame>:<port#>/apex/apex_admin
Note: The port number is defined by the APEX administrator when APEX is installed.
For example:
http://localhost:8080/apex/apex_admin
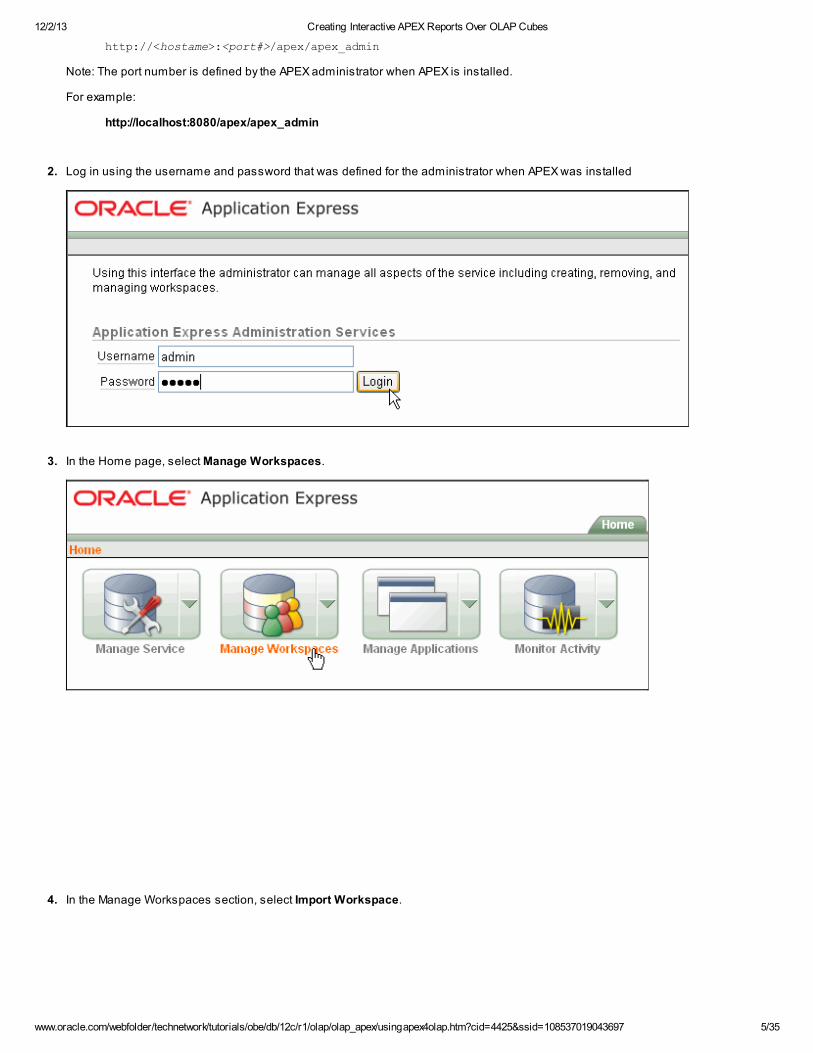
2. Log in using the username and password that was defined for the administrator when APEX was installed
3. In the Home page, select Manage Workspaces.
4. In the Manage Workspaces section, select Import Workspace.
12/2/13 Creating Interactive APEX Reports Over OLAP Cubes
www.oracle.com/webfolder/technetwork/tutorials/obe/db/12c/r1/olap/olap_apex/usingapex4olap.htm?cid=4425&ssid=108537019043697 6/35
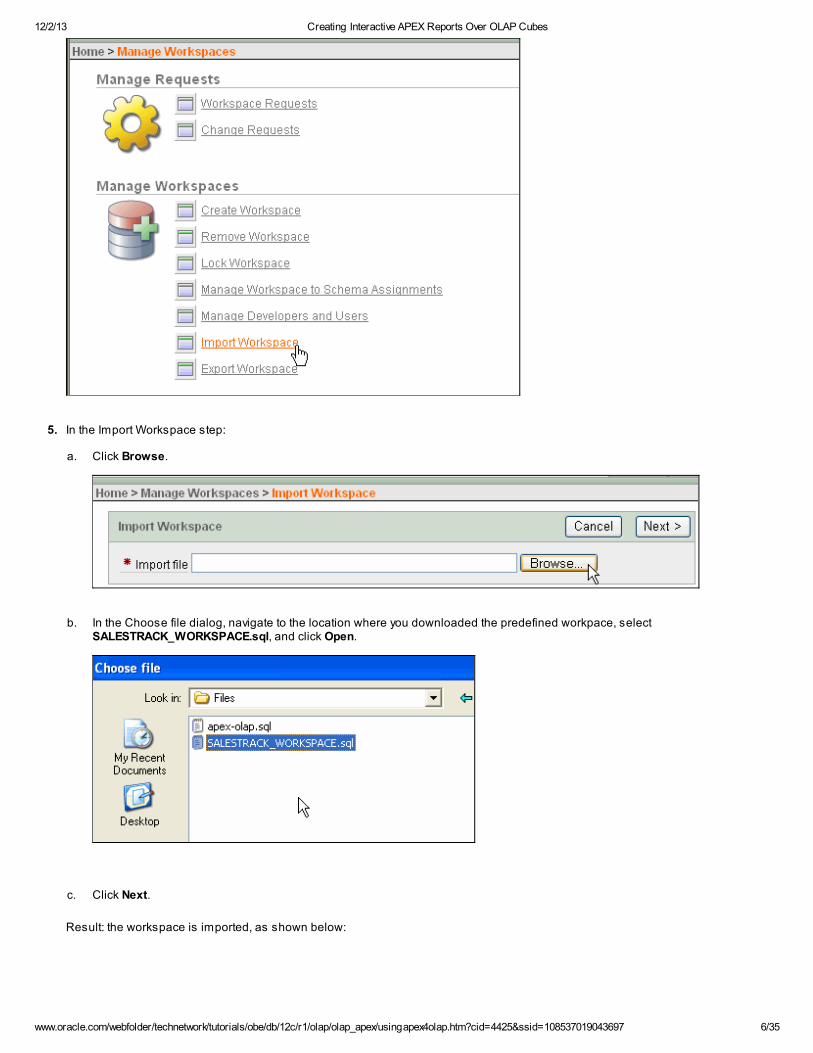
5. In the Import Workspace step:
a. Click Browse.
b. In the Choose file dialog, navigate to the location where you downloaded the predefined workpace, selectSALESTRACK_WORKSPACE.sql, and click Open.
c. Click Next.
Result: the workspace is imported, as shown below:

12/2/13 Creating Interactive APEX Reports Over OLAP Cubes
www.oracle.com/webfolder/technetwork/tutorials/obe/db/12c/r1/olap/olap_apex/usingapex4olap.htm?cid=4425&ssid=108537019043697 7/35
6. Next, click Install.
7. In the Install Workspace step, enter SALESTRACK as the Schema Name, and oracle as the Schema Password.
Then, click Next.
8. In the Schema Assignment Status step, select the check box option at the top (as shown below), and click Next.
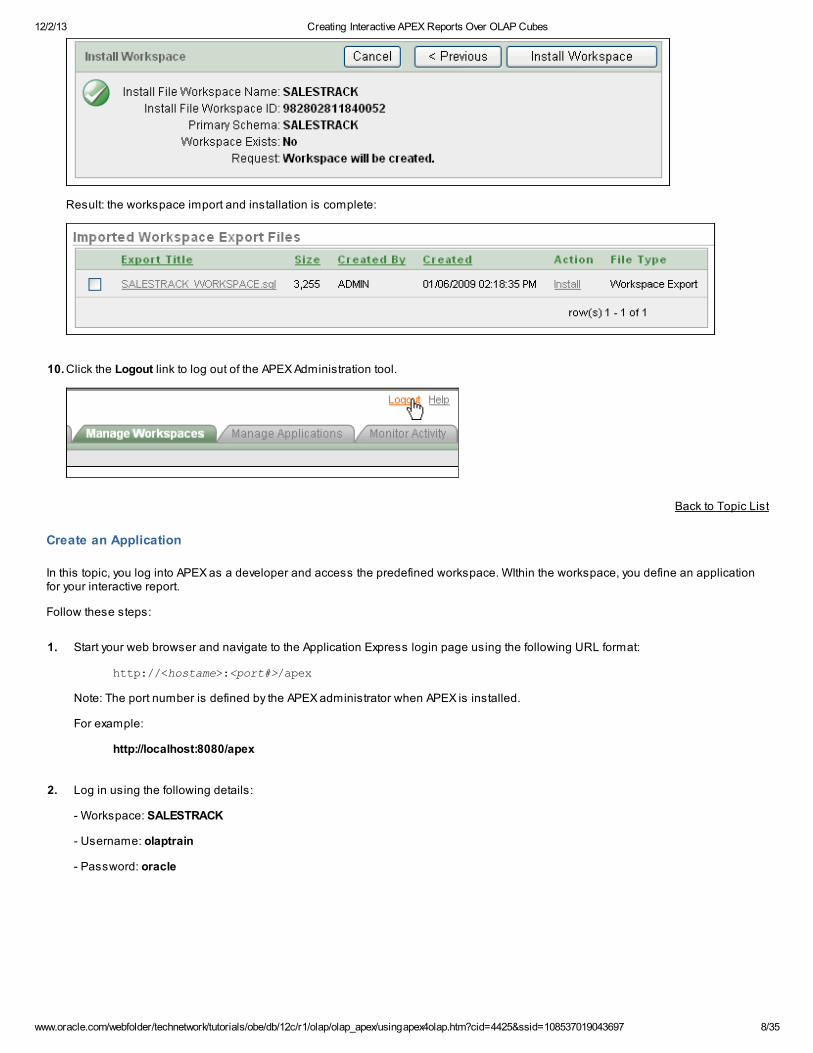
9. In the Install Workspace confirmation window, click Install Workspace.
12/2/13 Creating Interactive APEX Reports Over OLAP Cubes
www.oracle.com/webfolder/technetwork/tutorials/obe/db/12c/r1/olap/olap_apex/usingapex4olap.htm?cid=4425&ssid=108537019043697 8/35
Result: the workspace import and installation is complete:
10.Click the Logout link to log out of the APEX Administration tool.
Back to Topic List
Create an Application
In this topic, you log into APEX as a developer and access the predefined workspace. WIthin the workspace, you define an applicationfor your interactive report.
Follow these steps:
1. Start your web browser and navigate to the Application Express login page using the following URL format:
http://<hostame>:<port#>/apex
Note: The port number is defined by the APEX administrator when APEX is installed.
For example:
http://localhost:8080/apex
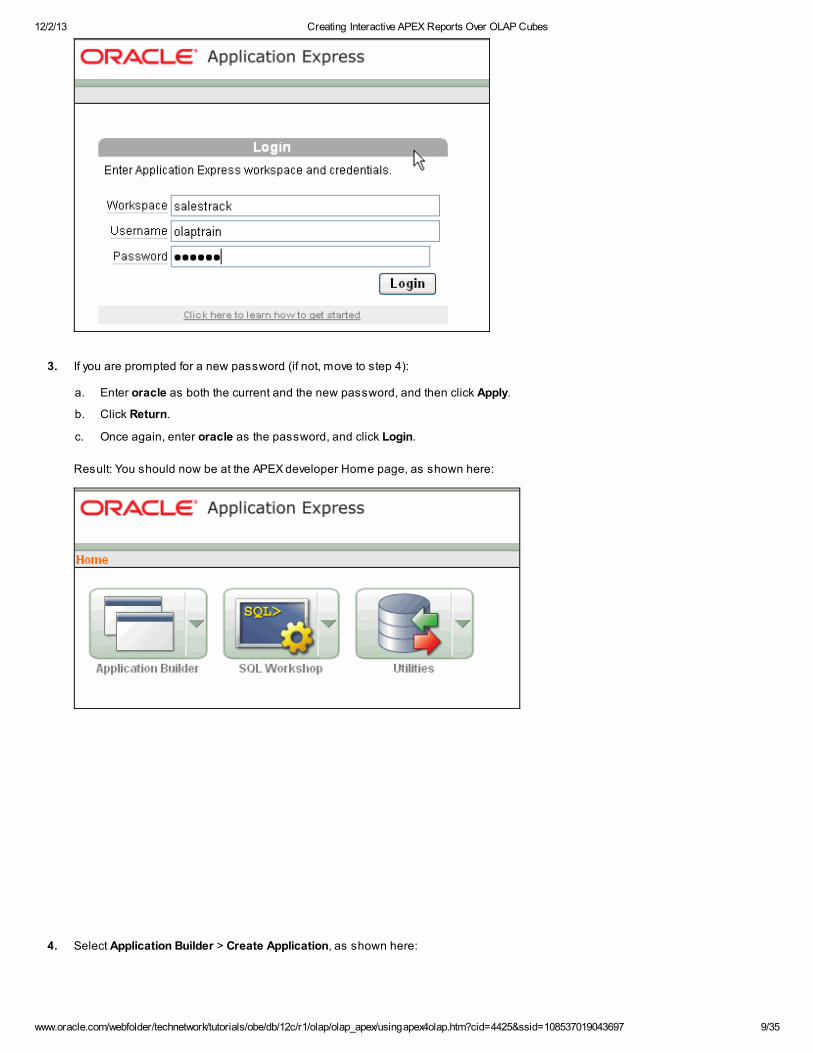
2. Log in using the following details:
- Workspace: SALESTRACK
- Username: olaptrain
- Password: oracle
12/2/13 Creating Interactive APEX Reports Over OLAP Cubes
www.oracle.com/webfolder/technetwork/tutorials/obe/db/12c/r1/olap/olap_apex/usingapex4olap.htm?cid=4425&ssid=108537019043697 9/35
3. If you are prompted for a new password (if not, move to step 4):
a. Enter oracle as both the current and the new password, and then click Apply.
b. Click Return.
c. Once again, enter oracle as the password, and click Login.
Result: You should now be at the APEX developer Home page, as shown here:
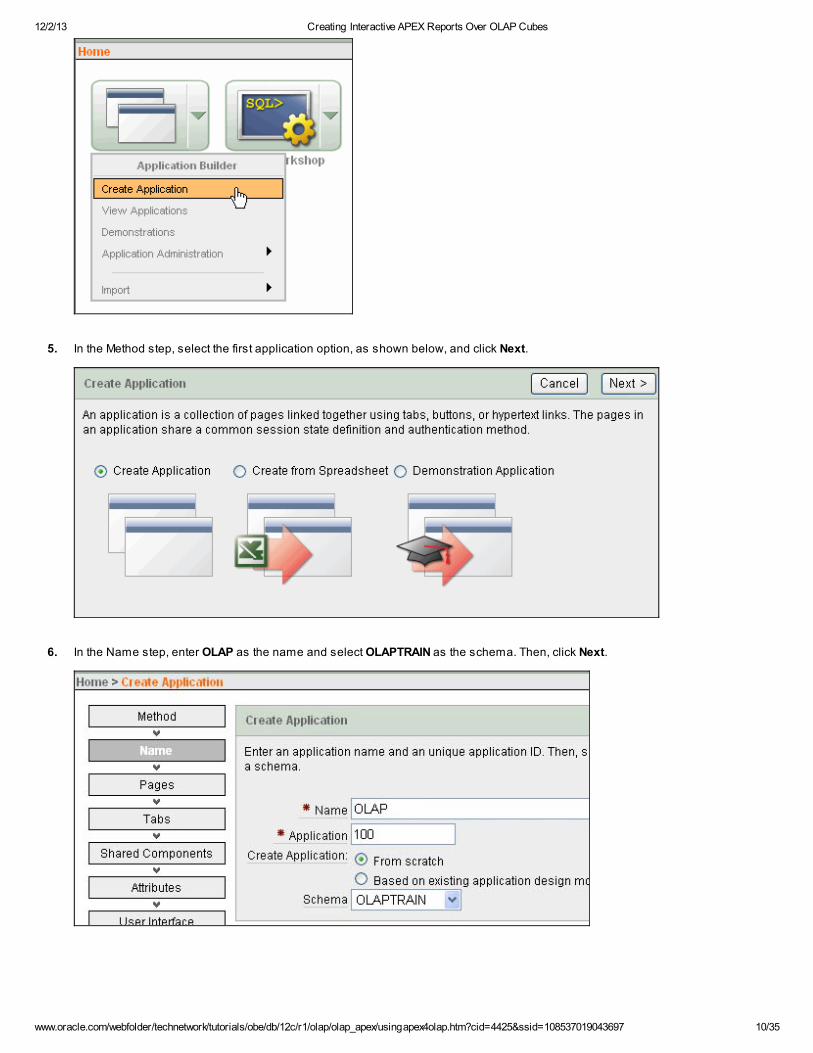
4. Select Application Builder > Create Application, as shown here:
12/2/13 Creating Interactive APEX Reports Over OLAP Cubes
www.oracle.com/webfolder/technetwork/tutorials/obe/db/12c/r1/olap/olap_apex/usingapex4olap.htm?cid=4425&ssid=108537019043697 10/35
5. In the Method step, select the first application option, as shown below, and click Next.
6. In the Name step, enter OLAP as the name and select OLAPTRAIN as the schema. Then, click Next.
12/2/13 Creating Interactive APEX Reports Over OLAP Cubes
www.oracle.com/webfolder/technetwork/tutorials/obe/db/12c/r1/olap/olap_apex/usingapex4olap.htm?cid=4425&ssid=108537019043697 11/35
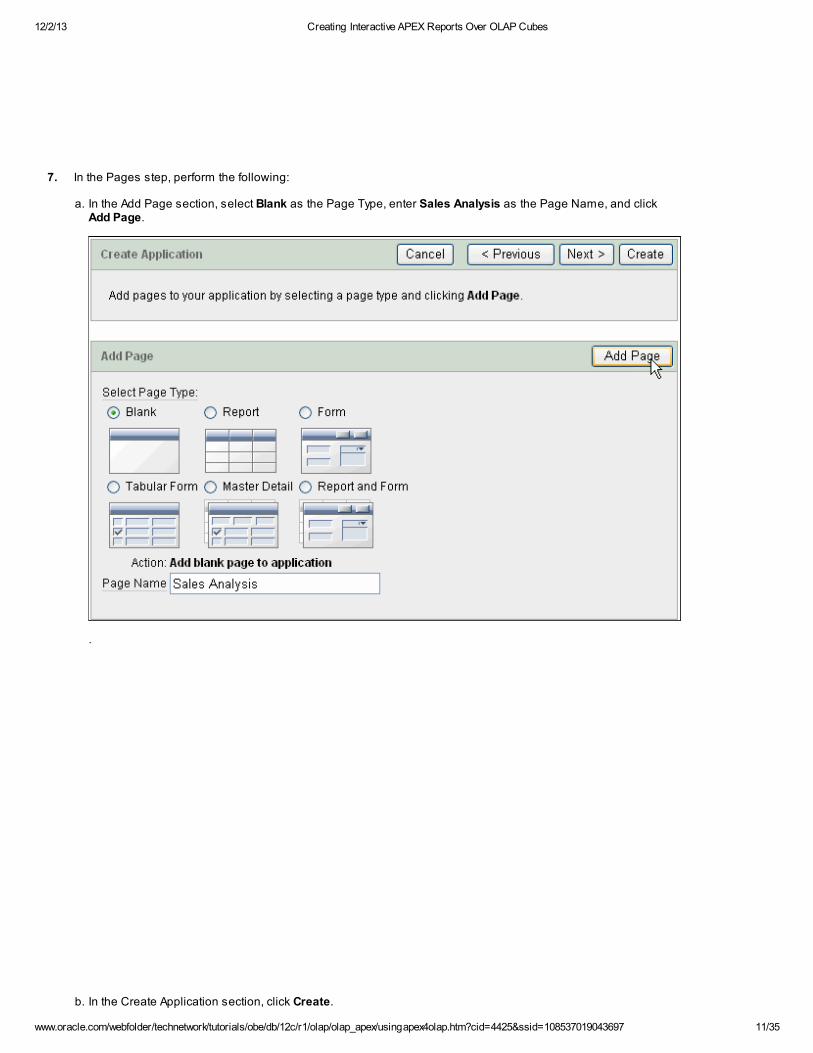
7. In the Pages step, perform the following:
a. In the Add Page section, select Blank as the Page Type, enter Sales Analysis as the Page Name, and clickAdd Page.
.
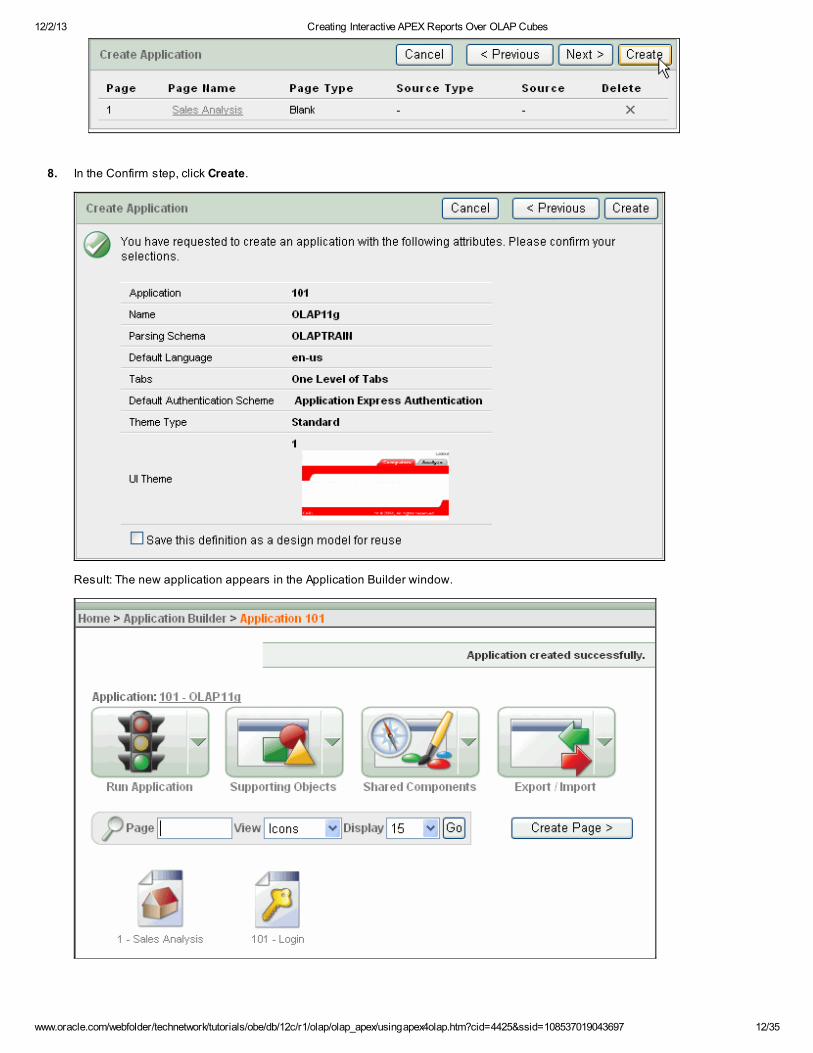
b. In the Create Application section, click Create.
12/2/13 Creating Interactive APEX Reports Over OLAP Cubes
www.oracle.com/webfolder/technetwork/tutorials/obe/db/12c/r1/olap/olap_apex/usingapex4olap.htm?cid=4425&ssid=108537019043697 12/35
8. In the Confirm step, click Create.
Result: The new application appears in the Application Builder window.
12/2/13 Creating Interactive APEX Reports Over OLAP Cubes
www.oracle.com/webfolder/technetwork/tutorials/obe/db/12c/r1/olap/olap_apex/usingapex4olap.htm?cid=4425&ssid=108537019043697 13/35
Back to Topic List
Create an Interactive Sales Analysis Report
Next, you perform two primary tasks to develop the interactive report:
Create three Hidden Items that are used later as part of a parameterized query. The parameters you define will be used for settingup dimension “drilling” in a later topic.
For example, a hidden item named P1_PRODUCT will be used as a parameter for drilling down on the Product dimension in thesales query as follows:
p.parent = nvl(:P1_PRODUCT, 'ALL_PRODUCTS')
Note: This condition selects the children of the product represented by the parameter (and selects “ALL_PRODUCTS” ifP1_PRODUCT is null).
You will create similar hidden items for the Time and Geography dimensions.
Create an interactive report region that:
- Incorporates a predefined OLAP cube SQL query that drives the report
- Shows sales performance by region, product, and time.
Perform the following steps:
1. In the Application Builder window, which is shown at the end of the previous topic, click the Sales Analysis icon.
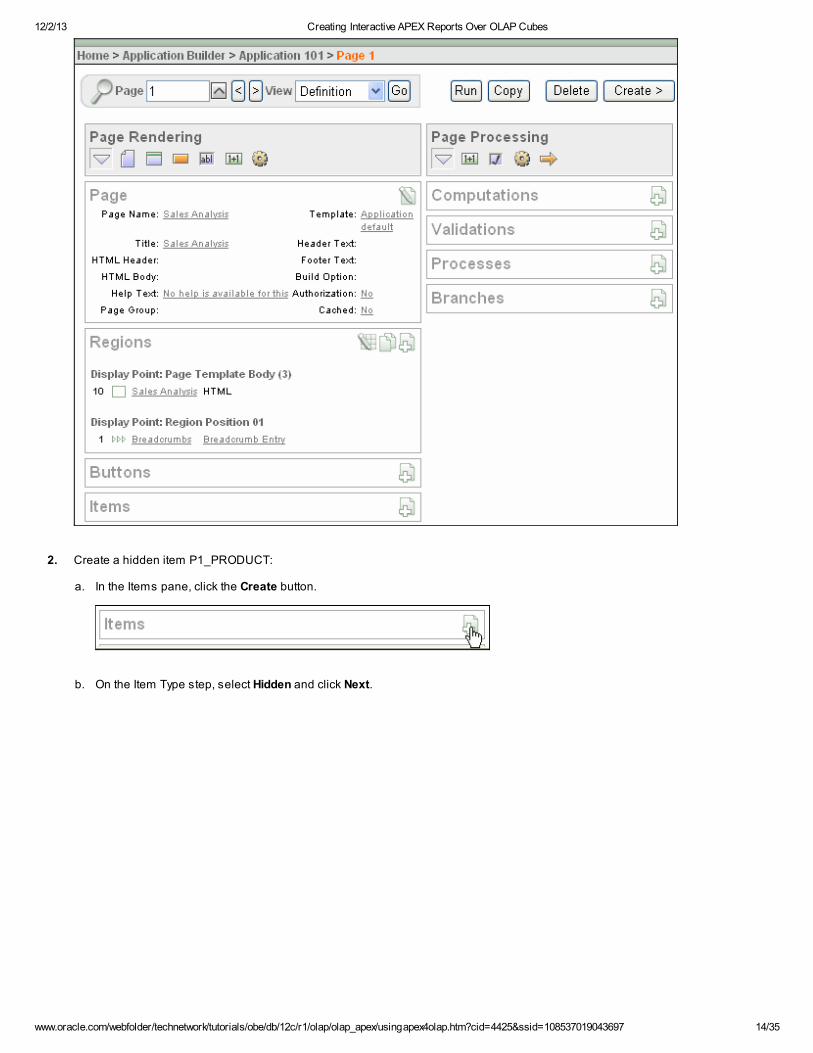
Result: You are now in the Page Editor, as shown here.
12/2/13 Creating Interactive APEX Reports Over OLAP Cubes
www.oracle.com/webfolder/technetwork/tutorials/obe/db/12c/r1/olap/olap_apex/usingapex4olap.htm?cid=4425&ssid=108537019043697 14/35
2. Create a hidden item P1_PRODUCT:
a. In the Items pane, click the Create button.
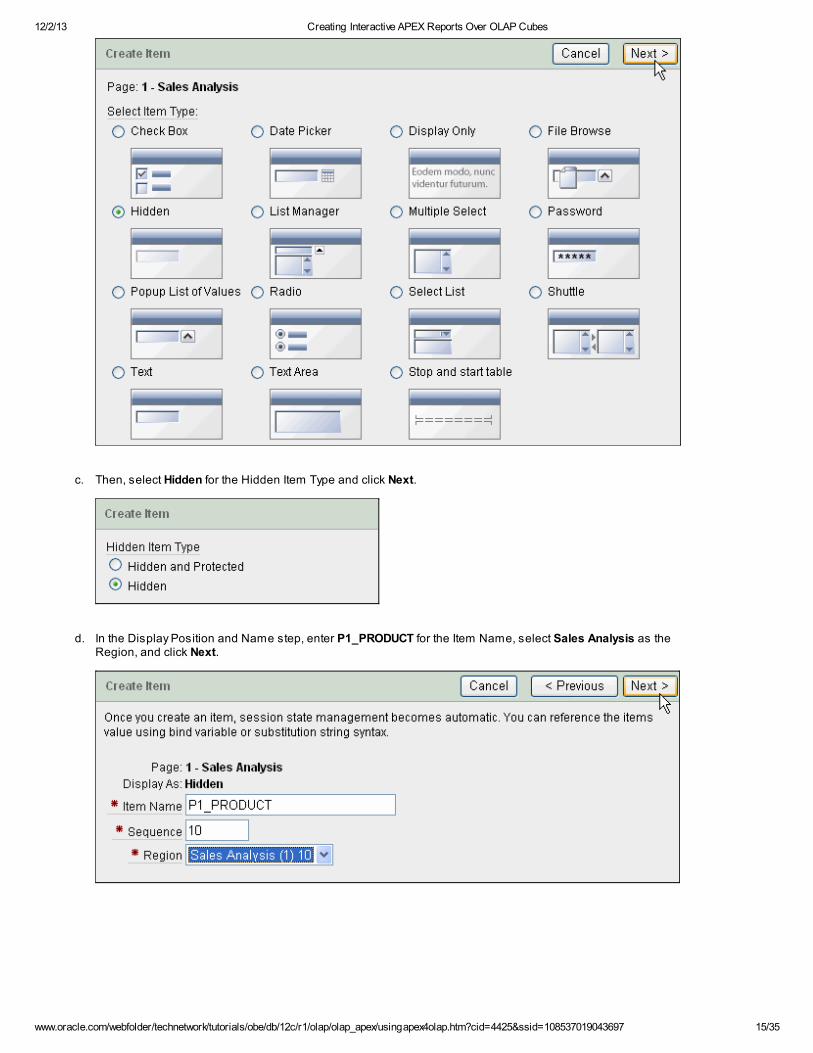
b. On the Item Type step, select Hidden and click Next.
12/2/13 Creating Interactive APEX Reports Over OLAP Cubes
www.oracle.com/webfolder/technetwork/tutorials/obe/db/12c/r1/olap/olap_apex/usingapex4olap.htm?cid=4425&ssid=108537019043697 15/35
c. Then, select Hidden for the Hidden Item Type and click Next.
d. In the Display Position and Name step, enter P1_PRODUCT for the Item Name, select Sales Analysis as theRegion, and click Next.
12/2/13 Creating Interactive APEX Reports Over OLAP Cubes
www.oracle.com/webfolder/technetwork/tutorials/obe/db/12c/r1/olap/olap_apex/usingapex4olap.htm?cid=4425&ssid=108537019043697 16/35
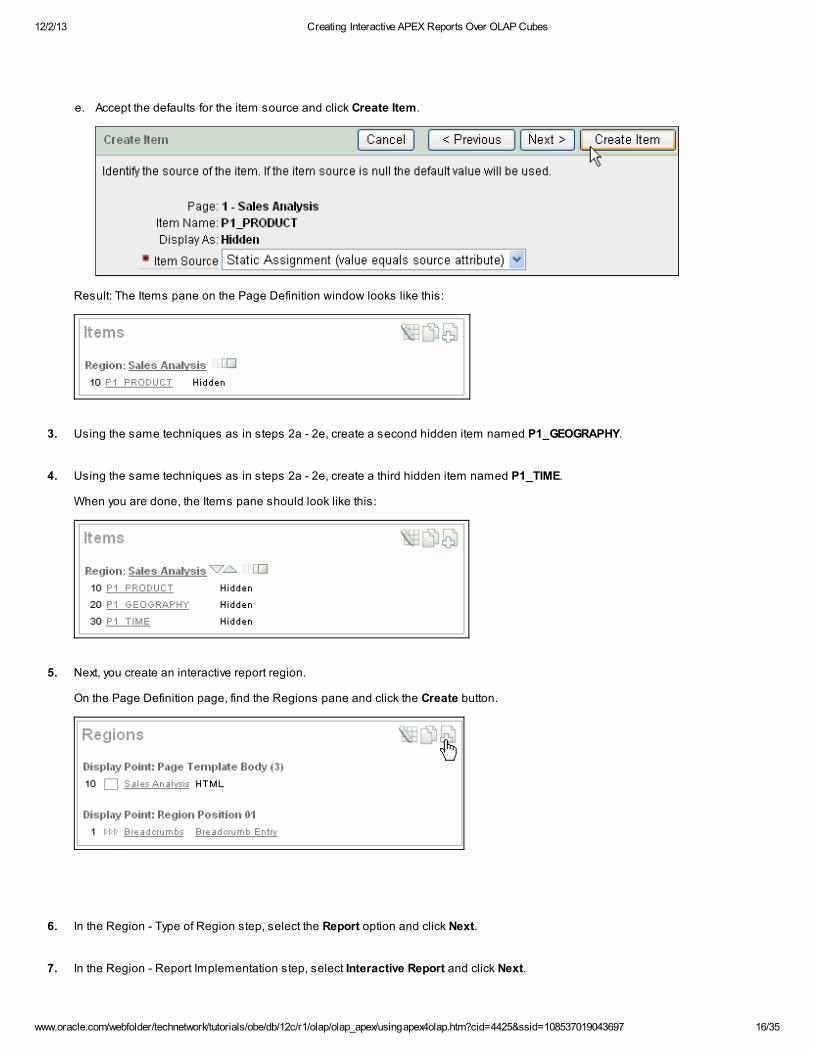
e. Accept the defaults for the item source and click Create Item.
Result: The Items pane on the Page Definition window looks like this:
3. Using the same techniques as in steps 2a - 2e, create a second hidden item named P1_GEOGRAPHY.
4. Using the same techniques as in steps 2a - 2e, create a third hidden item named P1_TIME.
When you are done, the Items pane should look like this:
5. Next, you create an interactive report region.
On the Page Definition page, find the Regions pane and click the Create button.
6. In the Region - Type of Region step, select the Report option and click Next.
7. In the Region - Report Implementation step, select Interactive Report and click Next.
12/2/13 Creating Interactive APEX Reports Over OLAP Cubes
www.oracle.com/webfolder/technetwork/tutorials/obe/db/12c/r1/olap/olap_apex/usingapex4olap.htm?cid=4425&ssid=108537019043697 17/35
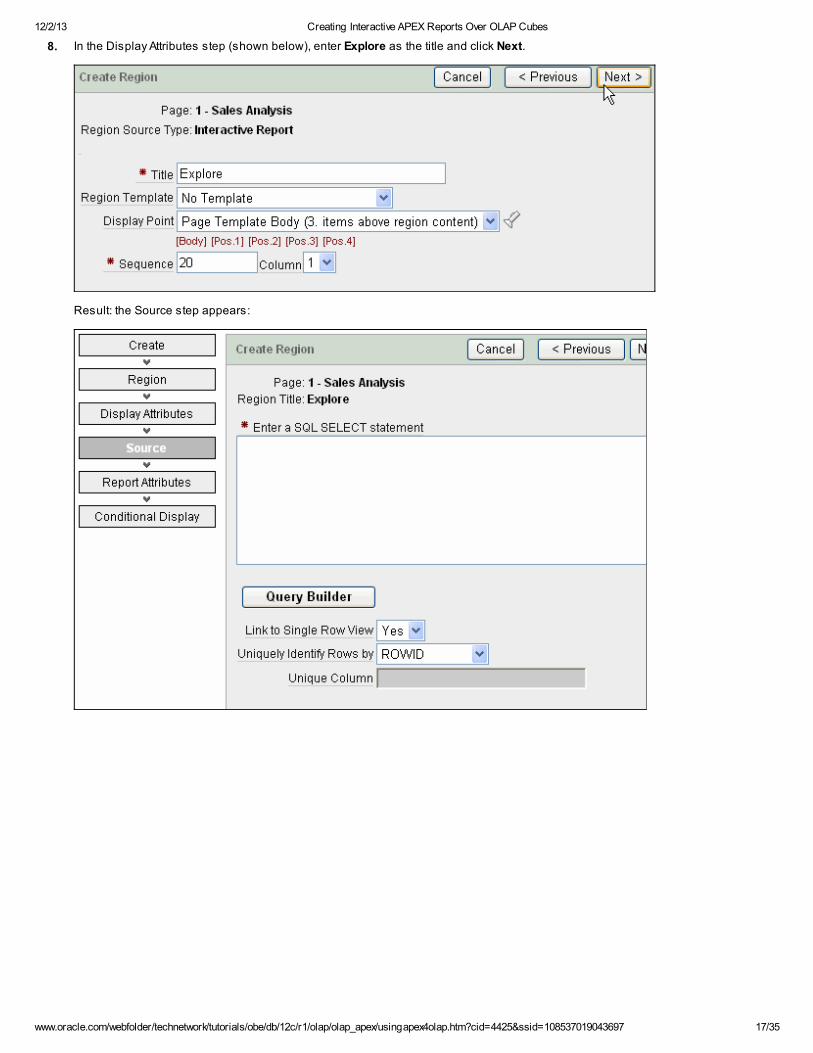
8. In the Display Attributes step (shown below), enter Explore as the title and click Next.
Result: the Source step appears:
12/2/13 Creating Interactive APEX Reports Over OLAP Cubes
www.oracle.com/webfolder/technetwork/tutorials/obe/db/12c/r1/olap/olap_apex/usingapex4olap.htm?cid=4425&ssid=108537019043697 18/35
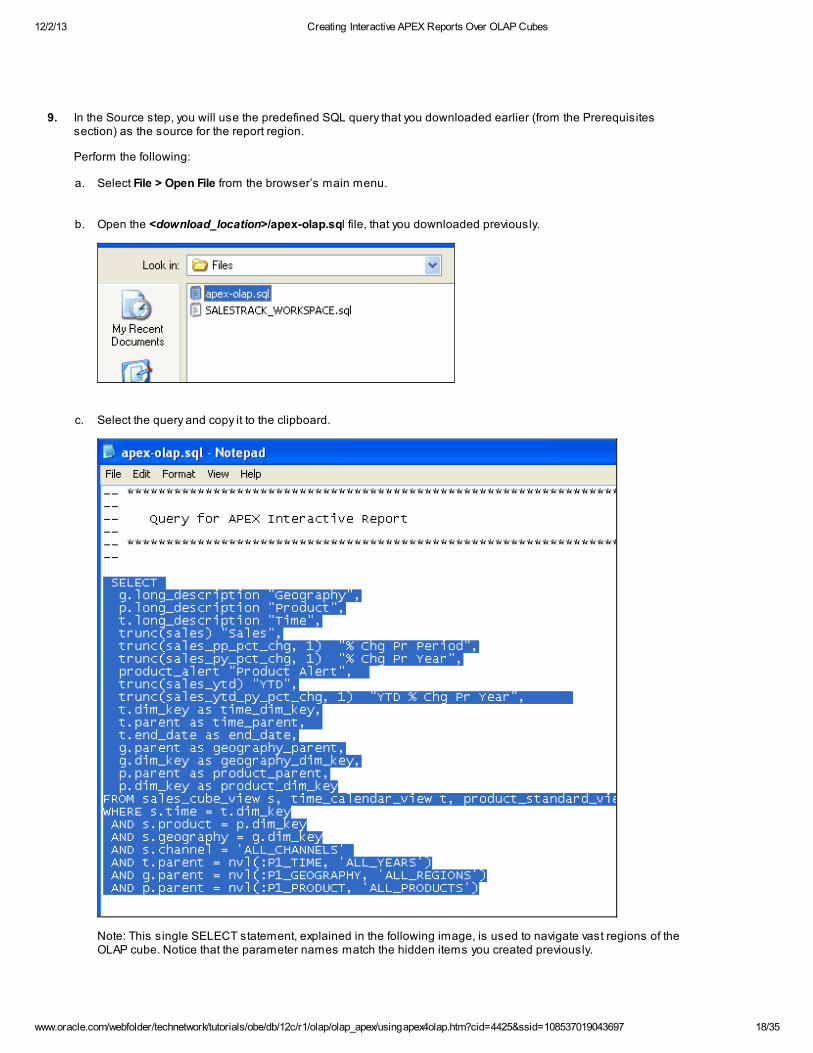
9. In the Source step, you will use the predefined SQL query that you downloaded earlier (from the Prerequisitessection) as the source for the report region.
Perform the following:
a. Select File > Open File from the browser’s main menu.
b. Open the <download_location>/apex-olap.sql file, that you downloaded previously.
c. Select the query and copy it to the clipboard.
Note: This single SELECT statement, explained in the following image, is used to navigate vast regions of theOLAP cube. Notice that the parameter names match the hidden items you created previously.

12/2/13 Creating Interactive APEX Reports Over OLAP Cubes
www.oracle.com/webfolder/technetwork/tutorials/obe/db/12c/r1/olap/olap_apex/usingapex4olap.htm?cid=4425&ssid=108537019043697 19/35
For more information on how to create OLAP Cube queries, see Querying OLAP Cubes. This tutorial uses thesame OLAP data model.
12/2/13 Creating Interactive APEX Reports Over OLAP Cubes
www.oracle.com/webfolder/technetwork/tutorials/obe/db/12c/r1/olap/olap_apex/usingapex4olap.htm?cid=4425&ssid=108537019043697 20/35
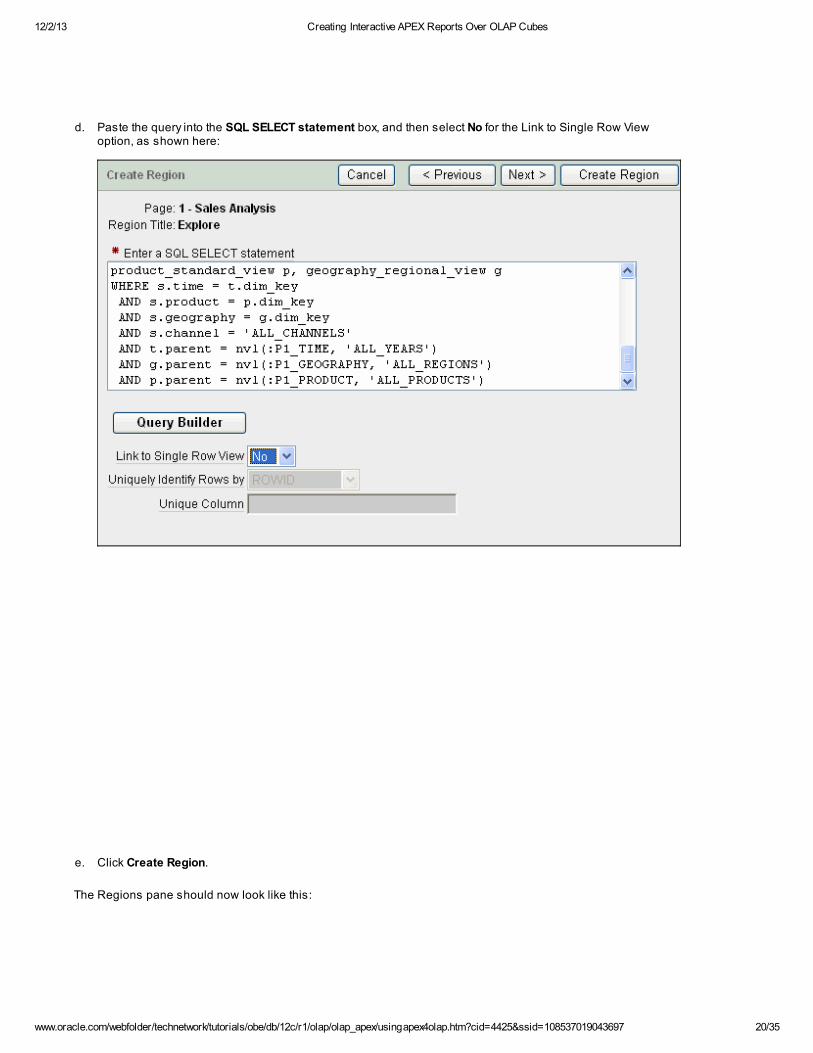
d. Paste the query into the SQL SELECT statement box, and then select No for the Link to Single Row Viewoption, as shown here:
e. Click Create Region.
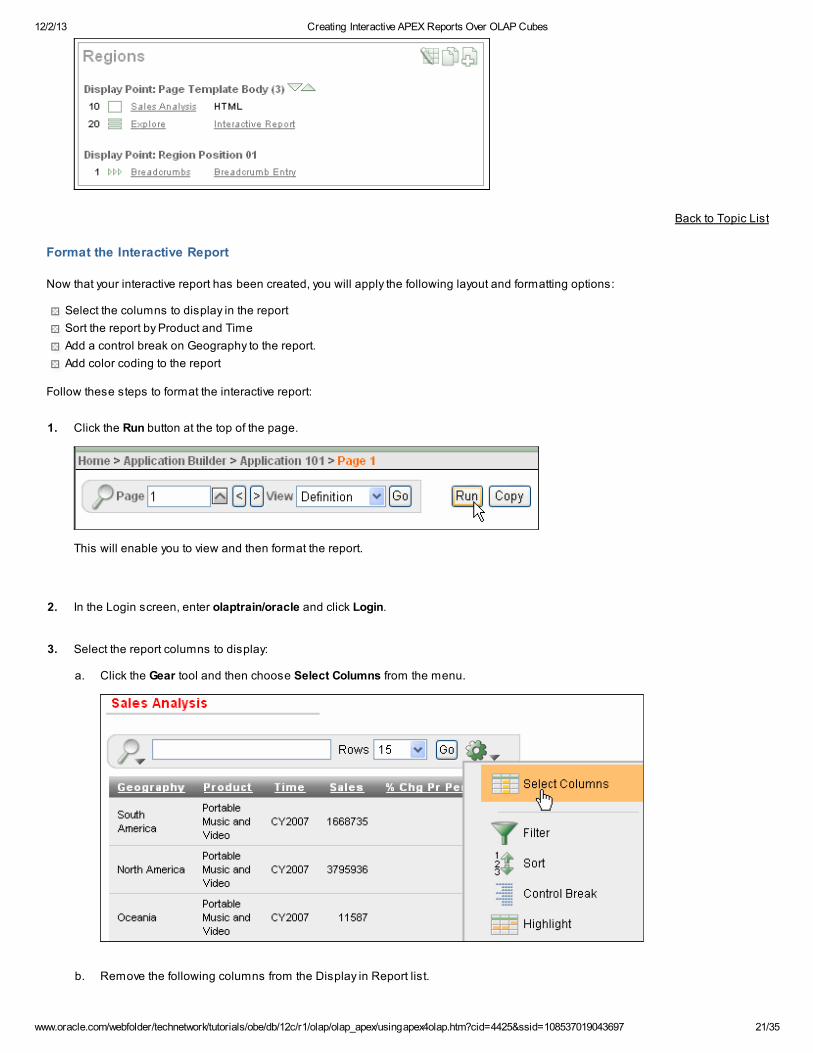
The Regions pane should now look like this:
12/2/13 Creating Interactive APEX Reports Over OLAP Cubes
www.oracle.com/webfolder/technetwork/tutorials/obe/db/12c/r1/olap/olap_apex/usingapex4olap.htm?cid=4425&ssid=108537019043697 21/35
Back to Topic List
Format the Interactive Report
Now that your interactive report has been created, you will apply the following layout and formatting options:
Select the columns to display in the report
Sort the report by Product and Time
Add a control break on Geography to the report.
Add color coding to the report
Follow these steps to format the interactive report:
1. Click the Run button at the top of the page.
This will enable you to view and then format the report.
2. In the Login screen, enter olaptrain/oracle and click Login.
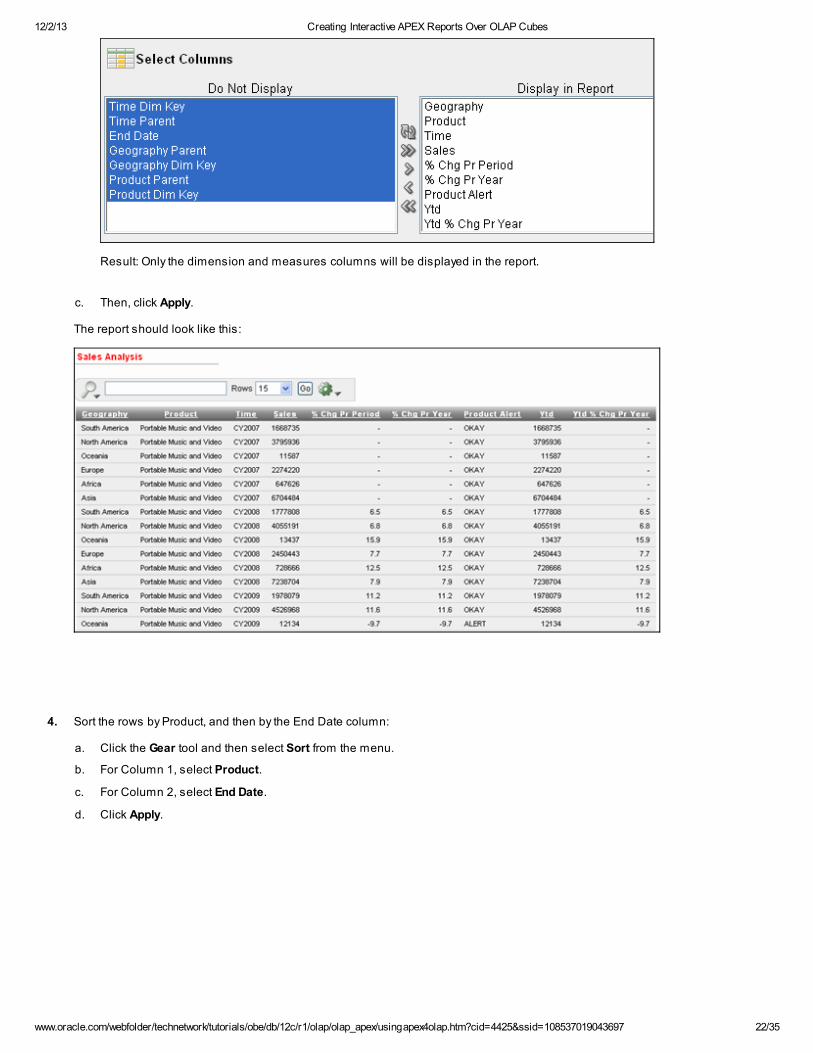
3. Select the report columns to display:
a. Click the Gear tool and then choose Select Columns from the menu.
b. Remove the following columns from the Display in Report list.
12/2/13 Creating Interactive APEX Reports Over OLAP Cubes
www.oracle.com/webfolder/technetwork/tutorials/obe/db/12c/r1/olap/olap_apex/usingapex4olap.htm?cid=4425&ssid=108537019043697 22/35
Result: Only the dimension and measures columns will be displayed in the report.
c. Then, click Apply.
The report should look like this:
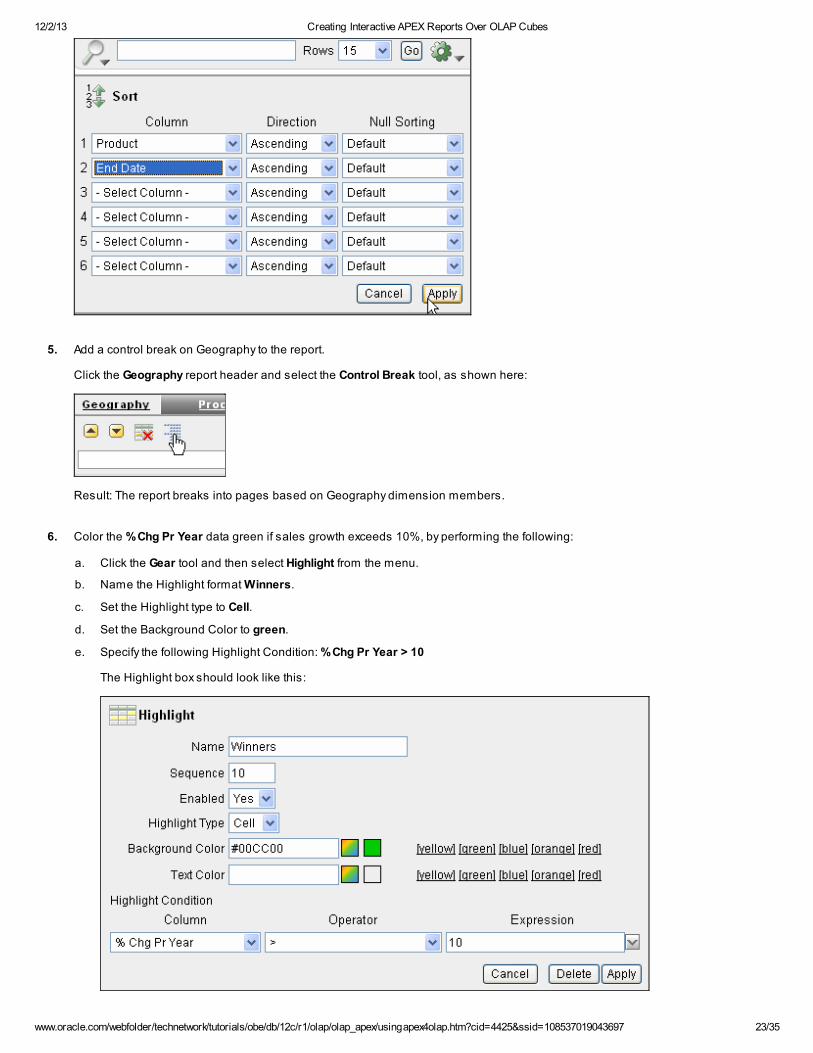
4. Sort the rows by Product, and then by the End Date column:
a. Click the Gear tool and then select Sort from the menu.
b. For Column 1, select Product.
c. For Column 2, select End Date.
d. Click Apply.
12/2/13 Creating Interactive APEX Reports Over OLAP Cubes
www.oracle.com/webfolder/technetwork/tutorials/obe/db/12c/r1/olap/olap_apex/usingapex4olap.htm?cid=4425&ssid=108537019043697 23/35
5. Add a control break on Geography to the report.
Click the Geography report header and select the Control Break tool, as shown here:
Result: The report breaks into pages based on Geography dimension members.
6. Color the % Chg Pr Year data green if sales growth exceeds 10%, by performing the following:
a. Click the Gear tool and then select Highlight from the menu.
b. Name the Highlight format Winners.
c. Set the Highlight type to Cell.
d. Set the Background Color to green.
e. Specify the following Highlight Condition: % Chg Pr Year > 10
The Highlight box should look like this:

12/2/13 Creating Interactive APEX Reports Over OLAP Cubes
www.oracle.com/webfolder/technetwork/tutorials/obe/db/12c/r1/olap/olap_apex/usingapex4olap.htm?cid=4425&ssid=108537019043697 24/35
f. Click Apply.
Result: The report automatically updates with the highlight format.
7. Color the Product Alert data red if there is an ALERT.
a. Click the Gear icon and then select Highlight from the menu.
b. Name the format Product_Alert.
c. Set the Highlight type to Cell.
d. Set the Background Color to red and the Text Color to yellow.
e. Specify the following Highlight Condition: Product Alert = ALERT
The Highlight box should look like this:
f. Click Apply.
Your report should now look something like the following:

12/2/13 Creating Interactive APEX Reports Over OLAP Cubes
www.oracle.com/webfolder/technetwork/tutorials/obe/db/12c/r1/olap/olap_apex/usingapex4olap.htm?cid=4425&ssid=108537019043697 25/35
8. Scroll through the report to view the formatting.
9. Save the report as the default.
a. Click the Gear icon and then select Save Report from the menu.
b. Name the report Default Report Settings.
c. Click Apply.
Back to Topic List
Add Drilldown Capabilities and Run the Report
The next task is to enable drilldown capabilities to the report. When users click a Geography, Product or Time value, the details for theselected item will replace what was selected. For example, clicking CY2009 displays the calendar quarters for that year.
APEX allows you to specify links for columns on the Report Attributes page. In this case, the link will set the relevant dimensionparameter (a.k.a. Hidden Item) to the item the user selected.
Consider the flow for a drilldown on the Time dimension:
User clicks the CY2009 link.
The logic behind the link specifies that the parameter P1_TIME is set to the selected value.
The query is re-executed, whereby the condition:
t.parent = nvl(:P1_TIME, 'ALL_YEARS')
Selects all time values whose parent is ‘CY2009.’ This is the equivalent to selecting the children of ‘CY2009.’
Result: A drilldown has been executed.
Perform the following steps to add drilldown capabilities to the report:
1. Return to the page editor by clicking the Edit Page 1 link at the bottom of the report page.
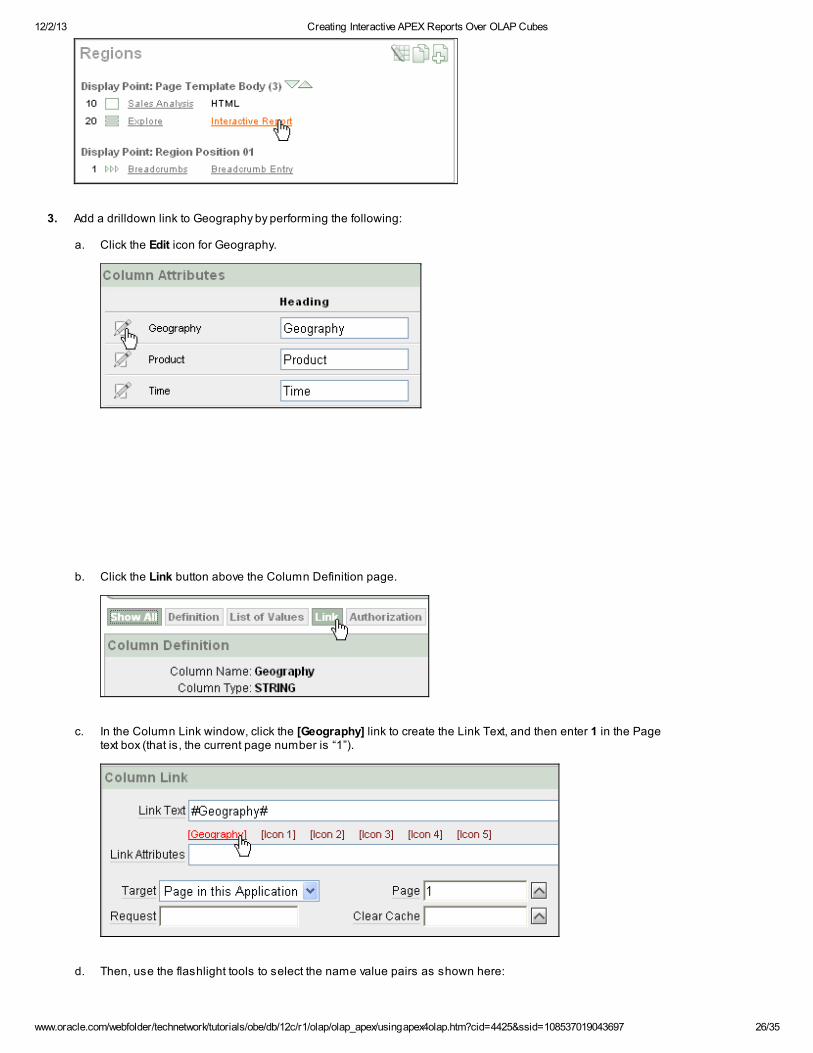
2. Go to the Report Attributes page by clicking the Interactive Report link in the Regions pane.
12/2/13 Creating Interactive APEX Reports Over OLAP Cubes
www.oracle.com/webfolder/technetwork/tutorials/obe/db/12c/r1/olap/olap_apex/usingapex4olap.htm?cid=4425&ssid=108537019043697 26/35
3. Add a drilldown link to Geography by performing the following:
a. Click the Edit icon for Geography.
b. Click the Link button above the Column Definition page.
c. In the Column Link window, click the [Geography] link to create the Link Text, and then enter 1 in the Pagetext box (that is, the current page number is “1”).
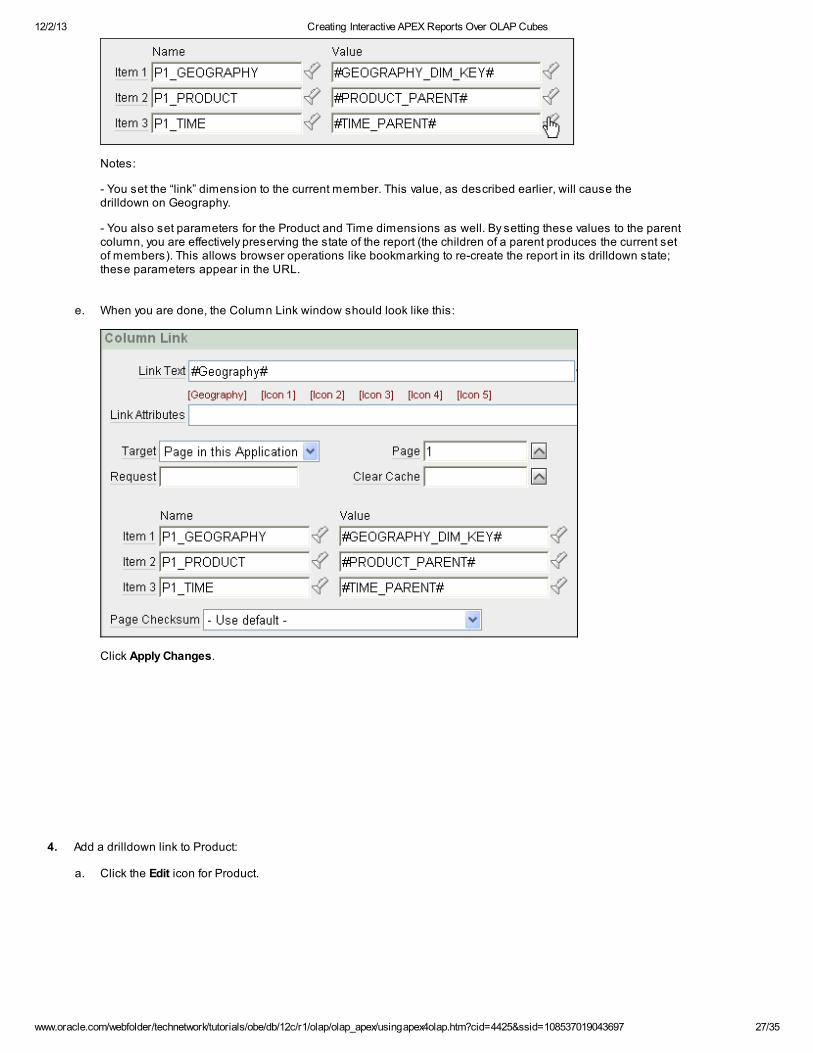
d. Then, use the flashlight tools to select the name value pairs as shown here:
12/2/13 Creating Interactive APEX Reports Over OLAP Cubes
www.oracle.com/webfolder/technetwork/tutorials/obe/db/12c/r1/olap/olap_apex/usingapex4olap.htm?cid=4425&ssid=108537019043697 27/35
Notes:
- You set the “link” dimension to the current member. This value, as described earlier, will cause thedrilldown on Geography.
- You also set parameters for the Product and Time dimensions as well. By setting these values to the parentcolumn, you are effectively preserving the state of the report (the children of a parent produces the current setof members). This allows browser operations like bookmarking to re-create the report in its drilldown state;these parameters appear in the URL.
e. When you are done, the Column Link window should look like this:
Click Apply Changes.
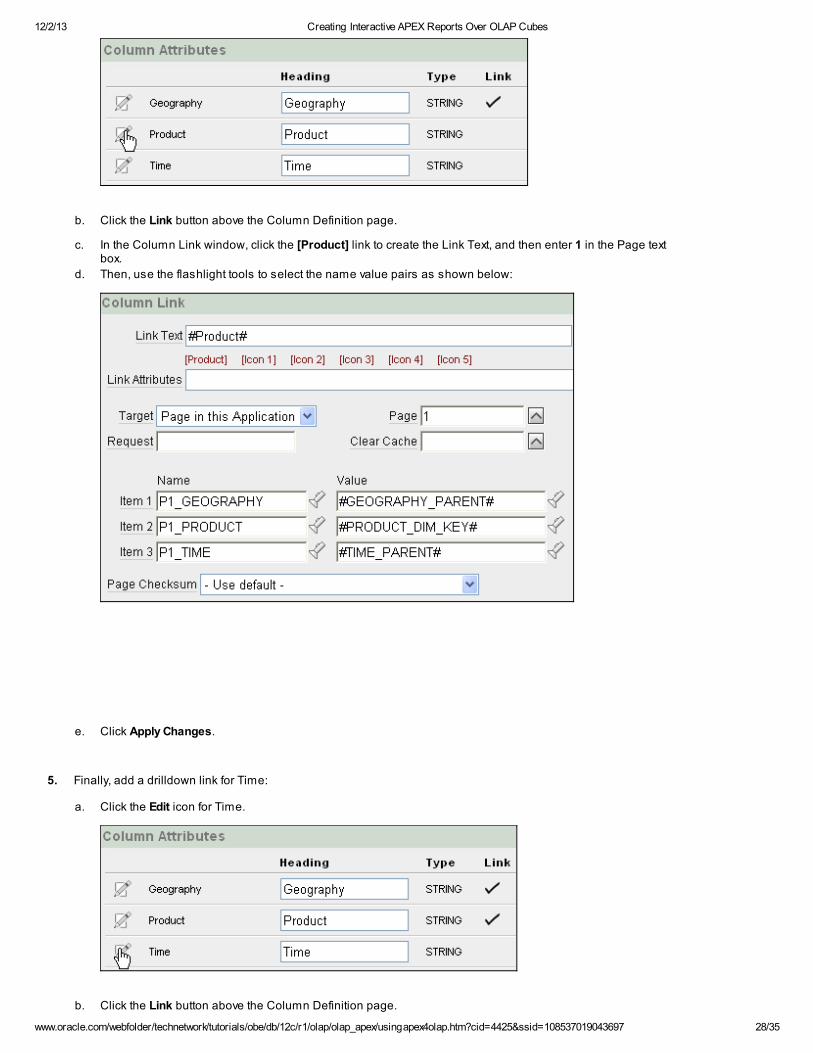
4. Add a drilldown link to Product:
a. Click the Edit icon for Product.
12/2/13 Creating Interactive APEX Reports Over OLAP Cubes
www.oracle.com/webfolder/technetwork/tutorials/obe/db/12c/r1/olap/olap_apex/usingapex4olap.htm?cid=4425&ssid=108537019043697 28/35
b. Click the Link button above the Column Definition page.
c. In the Column Link window, click the [Product] link to create the Link Text, and then enter 1 in the Page textbox.
d. Then, use the flashlight tools to select the name value pairs as shown below:
e. Click Apply Changes.
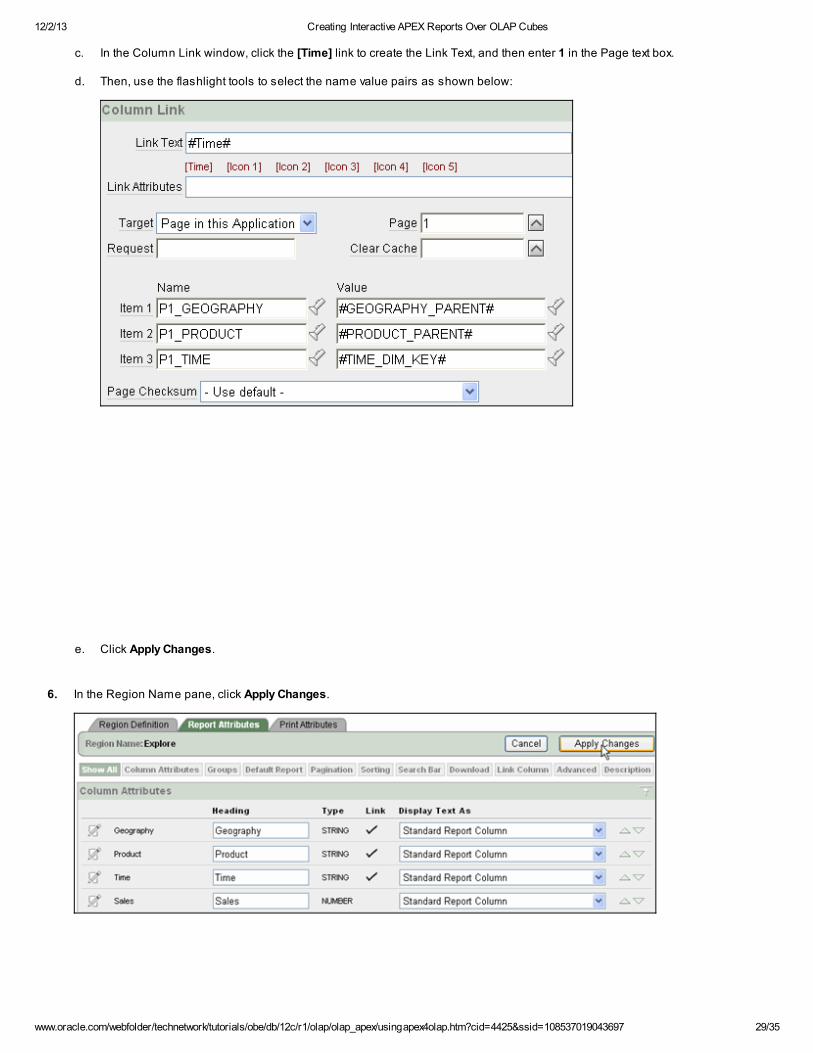
5. Finally, add a drilldown link for Time:
a. Click the Edit icon for Time.
b. Click the Link button above the Column Definition page.
12/2/13 Creating Interactive APEX Reports Over OLAP Cubes
www.oracle.com/webfolder/technetwork/tutorials/obe/db/12c/r1/olap/olap_apex/usingapex4olap.htm?cid=4425&ssid=108537019043697 29/35
c. In the Column Link window, click the [Time] link to create the Link Text, and then enter 1 in the Page text box.
d. Then, use the flashlight tools to select the name value pairs as shown below:
e. Click Apply Changes.
6. In the Region Name pane, click Apply Changes.

12/2/13 Creating Interactive APEX Reports Over OLAP Cubes
www.oracle.com/webfolder/technetwork/tutorials/obe/db/12c/r1/olap/olap_apex/usingapex4olap.htm?cid=4425&ssid=108537019043697 30/35
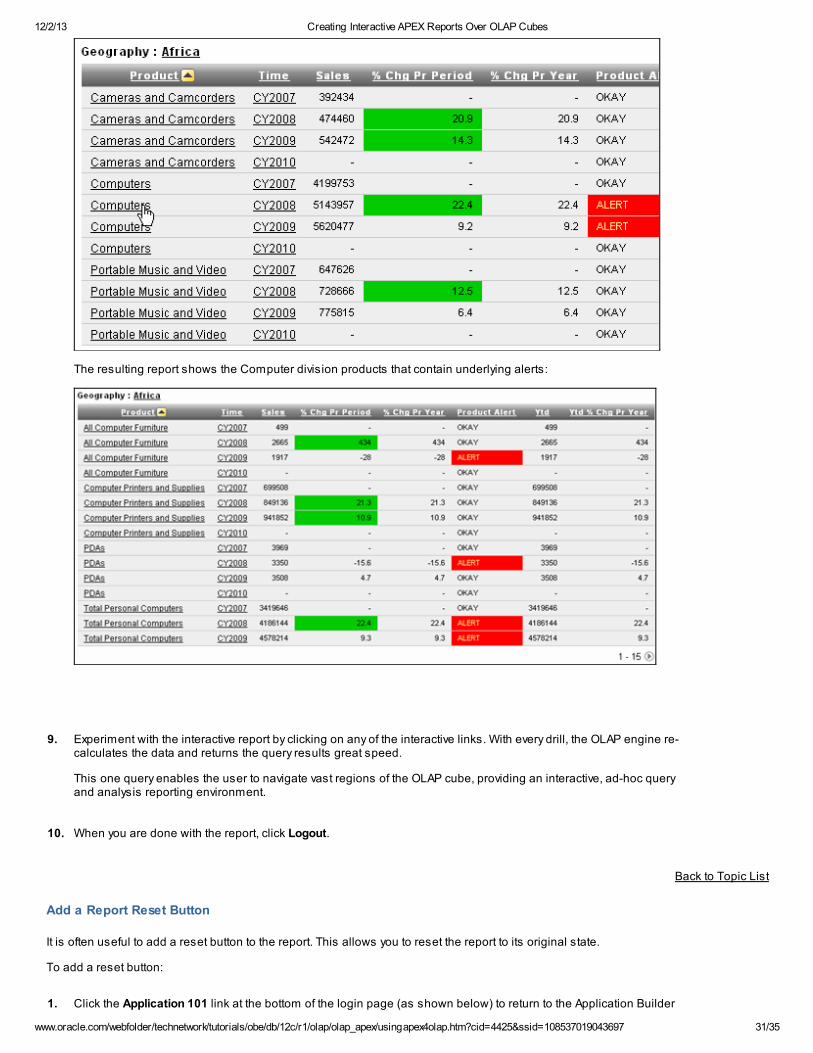
7. Once again, click Run at the top of the Page Definition window. The report should look like this:
8. For Africa, click the Computers link for CY2008 (as shown below). This is the row that had excellent percentgrowth in sales, but showed an Alert in the following data.
12/2/13 Creating Interactive APEX Reports Over OLAP Cubes
www.oracle.com/webfolder/technetwork/tutorials/obe/db/12c/r1/olap/olap_apex/usingapex4olap.htm?cid=4425&ssid=108537019043697 31/35
The resulting report shows the Computer division products that contain underlying alerts:
9. Experiment with the interactive report by clicking on any of the interactive links. With every drill, the OLAP engine re-calculates the data and returns the query results great speed.
This one query enables the user to navigate vast regions of the OLAP cube, providing an interactive, ad-hoc queryand analysis reporting environment.
10. When you are done with the report, click Logout.
Back to Topic List
Add a Report Reset Button
It is often useful to add a reset button to the report. This allows you to reset the report to its original state.
To add a reset button:
1. Click the Application 101 link at the bottom of the login page (as shown below) to return to the Application Builder
12/2/13 Creating Interactive APEX Reports Over OLAP Cubes
www.oracle.com/webfolder/technetwork/tutorials/obe/db/12c/r1/olap/olap_apex/usingapex4olap.htm?cid=4425&ssid=108537019043697 32/35
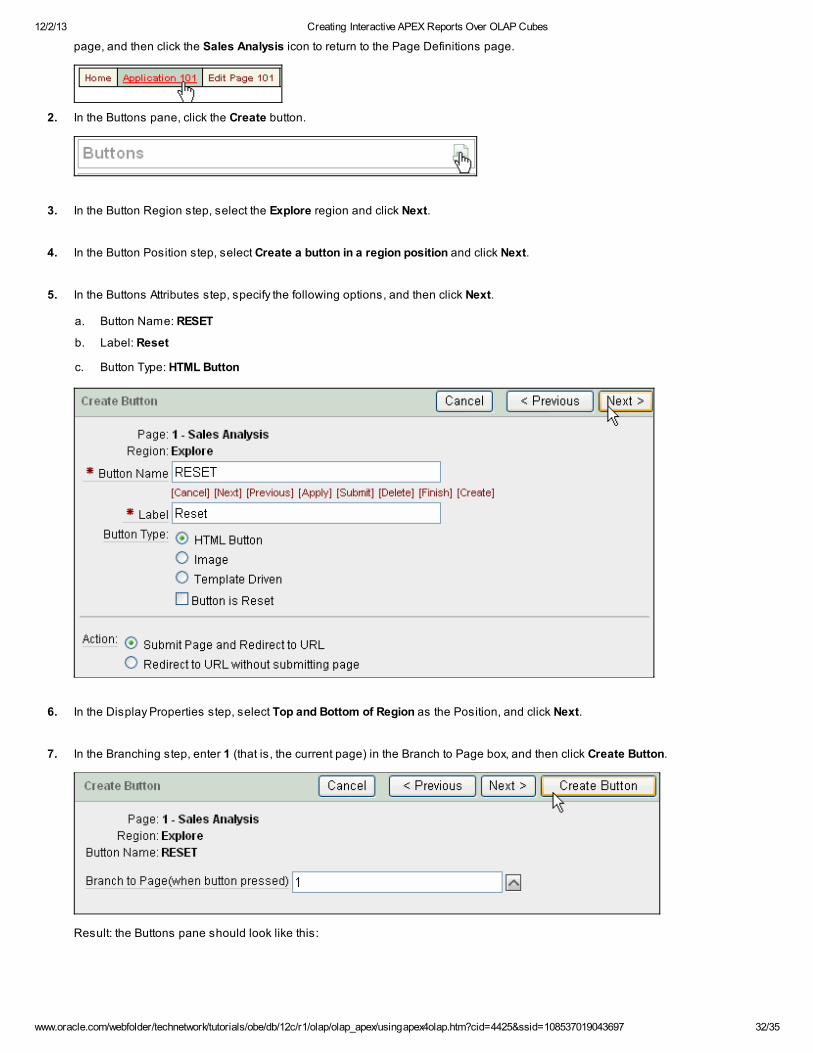
page, and then click the Sales Analysis icon to return to the Page Definitions page.
2. In the Buttons pane, click the Create button.
3. In the Button Region step, select the Explore region and click Next.
4. In the Button Position step, select Create a button in a region position and click Next.
5. In the Buttons Attributes step, specify the following options, and then click Next.
a. Button Name: RESET
b. Label: Reset
c. Button Type: HTML Button
6. In the Display Properties step, select Top and Bottom of Region as the Position, and click Next.
7. In the Branching step, enter 1 (that is, the current page) in the Branch to Page box, and then click Create Button.
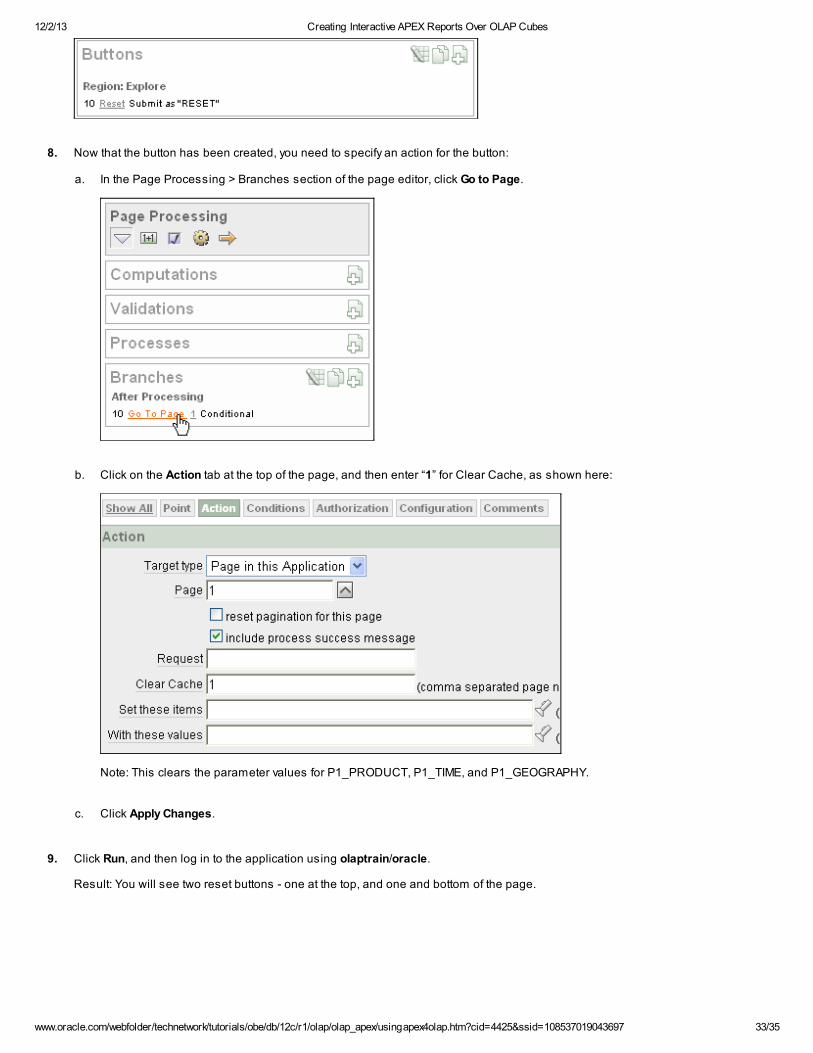
Result: the Buttons pane should look like this:
12/2/13 Creating Interactive APEX Reports Over OLAP Cubes
www.oracle.com/webfolder/technetwork/tutorials/obe/db/12c/r1/olap/olap_apex/usingapex4olap.htm?cid=4425&ssid=108537019043697 33/35
8. Now that the button has been created, you need to specify an action for the button:
a. In the Page Processing > Branches section of the page editor, click Go to Page.
b. Click on the Action tab at the top of the page, and then enter “1” for Clear Cache, as shown here:
Note: This clears the parameter values for P1_PRODUCT, P1_TIME, and P1_GEOGRAPHY.
c. Click Apply Changes.
9. Click Run, and then log in to the application using olaptrain/oracle.
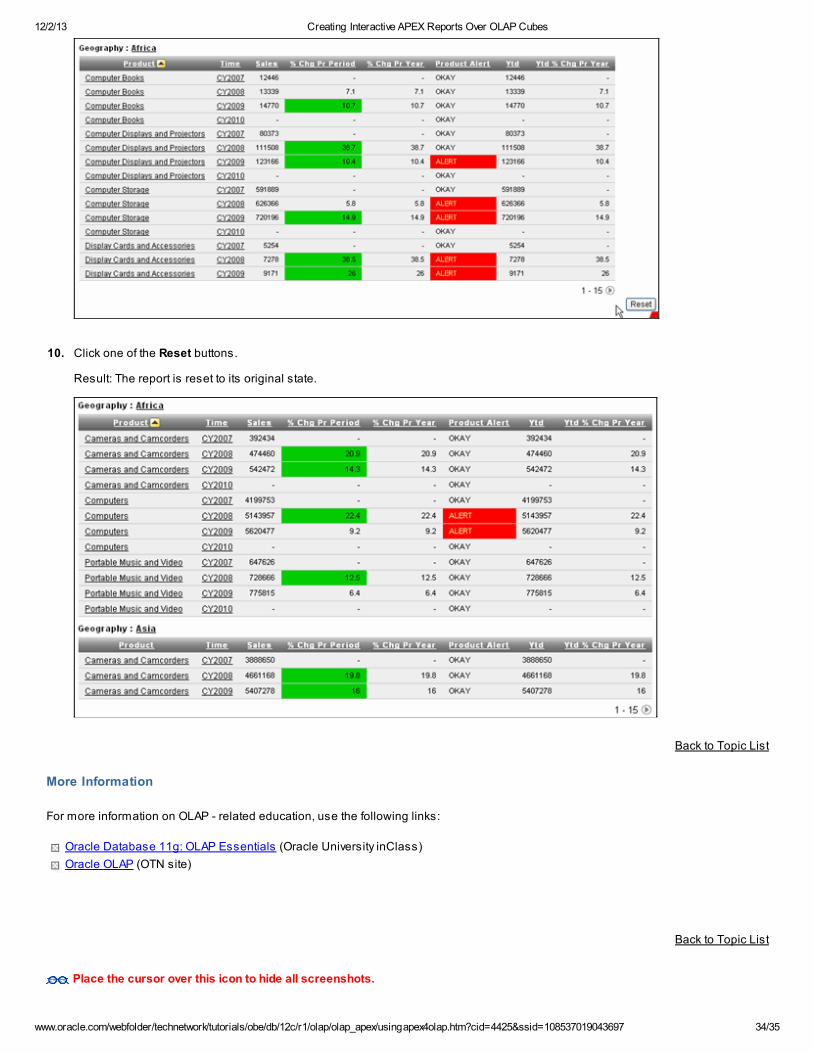
Result: You will see two reset buttons - one at the top, and one and bottom of the page.
12/2/13 Creating Interactive APEX Reports Over OLAP Cubes
www.oracle.com/webfolder/technetwork/tutorials/obe/db/12c/r1/olap/olap_apex/usingapex4olap.htm?cid=4425&ssid=108537019043697 34/35
10. Click one of the Reset buttons.
Result: The report is reset to its original state.
Back to Topic List
More Information
For more information on OLAP - related education, use the following links:
Oracle Database 11g: OLAP Essentials (Oracle University inClass)
Oracle OLAP (OTN site)
Back to Topic List
Place the cursor over this icon to hide all screenshots.

12/2/13 Creating Interactive APEX Reports Over OLAP Cubes
www.oracle.com/webfolder/technetwork/tutorials/obe/db/12c/r1/olap/olap_apex/usingapex4olap.htm?cid=4425&ssid=108537019043697 35/35